Multilingualism, L1 attrition and the concept of 'native speaker'
291
Multilingualism, L1 attrition and the concept of ‘native speaker’ Dissertation zur Erlangung des akademischen Grades eines Doktors der Philosophie (Dr. phil.) durch die Philosophische Fakultät der Heinrich-Heine Universität Düsseldorf vorgelegt von: Susan Claire Dostert Düsseldorf Matrikel-Nr. 946339 April 2009 E-Mail: [email protected] Disputation: 14. Juli 2009
-
Upload
khangminh22 -
Category
Documents
-
view
1 -
download
0
Transcript of Multilingualism, L1 attrition and the concept of 'native speaker'

Multilingualism, L1 attrition and the concept of ‘native speaker’
Dissertation zur Erlangung des akademischen Grades eines Doktors der Philosophie (Dr. phil.)
durch die Philosophische Fakultät der Heinrich-Heine Universität Düsseldorf
vorgelegt von: Susan Claire Dostert
Düsseldorf Matrikel-Nr. 946339
April 2009 E-Mail: [email protected]
Disputation: 14. Juli 2009

1
Acknowledgements
First and foremost, I would like to thank Monika Schmid, Conny Opitz, and all the other members of the L1 attrition graduate network who, over the years I’ve been working on this project, have supported me with their knowledge and friendship and generally motivated and helped me to carry on even when things weren’t running so smoothly. Second, but by no means last, I would like to thank my family, in particular my daughter Lisa and my fiancé Harvey for believing in me, and for leaving me to it when I needed peace and quiet to work but then also for being there when I needed company. Finally, of course, I would like to acknowledge and thank the ‘principal players’, namely all of the 64 individuals who were good enough to take the time to complete the questionnaires and talk to me (as well as Tina, Conny and Leila who persuaded friends and colleagues to volunteer, and often put me up and fed me at the same time), without whom this entire project would not have been feasible. Susan Dostert Düsseldorf, April 2009
D61

2
Contents List of tables and figures 5 1. Introduction 8 2. Theoretical Background / Literature Review 9
2.1. Language attrition in the broader context 10 2.1.1. Multilingualism and ‘multi-competence’ 12 2.1.2. Adult non-pathological L1 attrition 13 2.1.2.1. Features of adult non-pathological L1 attrition 14 2.1.2.2. Predictor variables of adult non-pathological L1 attrition 19 2.1.3. Adult non-pathological attrition of L1 English 24 2.1.3.1. Clyne (1968) 24 2.1.3.2. Olshtain & Barzilay (1991) 25 2.1.3.3. Boyd & Andersson (1991); Boyd (1993) 26 2.1.3.4. Major (1992; 1993) 27 2.1.3.5. Latomaa (1998) 29 2.1.3.6. Porte (1999; 2003) 29 2.1.3.7. Brown (2001) 30 2.1.3.8. Gürel (2007) 32 2.1.3.9. Summary of the studies carried out on adult non-pathological attrition of L1 English 33 2.1.4. Conclusion 34 2.2. Language and the brain 36 2.2.1. Neural plasticity 36 2.2.2. Different types of knowledge / memory 37 2.2.3. Forgetting 39 2.2.4. Conclusion 42 2.3. (Linguistic) theories of attrition 43 2.3.1. Regression theory 43 2.3.2. Chomskyian theory 44 2.3.3. ‘Simplification’ 45 2.3.4. Activation Threshold Hypothesis (ATH) 46 2.3.5. Control 47 2.3.6. Dynamic systems 49 2.3.7. Other theories: Communication Accommodation Theory (CAT) 50 2.3.8. Conclusion 52 2.4. The concept of ‘native speaker’ 53 2.4.1. Folklore theory and the concept of ‘native speaker’ 53 2.4.2. Use of the term ‘native speaker’ 55 2.4.2.1. General, non-linguistic usage of the term 55 2.4.2.2. Usage of the term in linguistics 58 2.4.2.3. Usage of the term with specific relevance for ELT, translating etc. 67 2.4.2.4. The native speaker and the L1 73 2.4.2.5. The native speaker and the L2 74 2.4.2.6. Conclusion 76 2.4.3. The ‘native speaker’ model 80

3
3. Research project 85 3.1. Theoretical framework 85 3.2. Methodology 86 3.2.1. Design features 86 3.2.2. Participants 87 3.2.3. Variables 90 3.2.4. Research questions 91 3.2.5. Hypotheses 91 3.2.5.1. Hypotheses about (adult non-pathological) L1 attrition 91 3.2.5.2. Hypotheses about the ‘native speaker’ 95 3.3. Test battery 96
3.3.1. Questionnaires 97 3.3.1.1. General background questionnaire 98 3.3.1.2. Native speaker questionnaire 99 3.3.2. FiCA 1 and 2 101 3.3.3. C-Test English and German 102 3.3.4. ‘Scrabble’ test 104 3.3.5. Film retelling task (Charlie Chaplin) 105 3.3.6. Picture description (W.H. Robinson) 108 3.4. Results 110
3.4.1. Questionnaires 110 3.4.1.1. General background questionnaire 110 3.4.1.2. Can-dos English 110 3.4.1.3. Can-dos German 113 3.4.1.4. Native speaker questionnaire and rating 116 3.4.1.5. Independent / predictor variables 121
3.4.2. FiCA 1 and 2 123 3.4.3. C-Test English and German 129 3.4.4. ‘Scrabble’ test 136 3.4.5. Total scores excluding free spoken data 138 3.4.6. Film retelling task (Charlie Chaplin) 140 3.4.7. Picture description (W.H. Robinson) 146 3.4.8. Analysis of Film retelling and Picture description combined 152 3.4.9. Summary of between-group differences in the test battery 155 3.4.10. Correlations between variables in the attrition group 155 3.4.11. Correlations between group test scores and can-dos 160
3.4.12. Correlations between test scores for English and native speaker ratings 162 3.4.13. Correlations between test scores and predictor variables 168 3.4.13.1. ‘Age (at testing)’ in the three groups 169 3.4.13.2. ‘Sex’ in the three groups 170 3.4.13.3. ‘Number of L2s spoken’ in the three groups 171 3.4.13.4. ‘Level of education’ in the attrition group and L1 control group 172 3.4.13.5. ‘Native speaker rating’ in the attrition group and L1 control group 172 3.4.13.6. ‘L1 proficiency’ in the attrition group and L1 control group 172 3.4.13.7. ‘L1 use’ in the attrition group and L1 control group 173 3.4.13.8. ‘L1 attitude’ in the attrition group and L1 control group 174 3.4.13.9. ‘Age at emigration’ in the attrition group 174

4
3.4.13.10. ‘LOR’ in the attrition group 175 3.4.13.11. ‘L2 use’ in the attrition group 175 3.4.13.12. ‘L2 proficiency’ in the attrition group 176 3.4.13.13. Summary of the predictor variables and test scores 176 3.4.13.14. Correlations between predictor variables and silent pauses in the Film retelling 181
3.5. Discussion 184 3.5.1. Discussion of L1 attrition 184 3.5.2. Discussion of the ‘native speaker’ 190 3.6. Conclusion 193
4. References 201 5. Appendix 216
5.a. Information about the participants 217 5.b. General background questionnaire for attrition group in English 219 5.c. General background questionnaire for attrition group in German 230 5.d. General background questionnaire for L1 control group 241 5.e. General background questionnaire for German control group 249 5.f. Native speaker questionnaire for attrition group 255 5.g. Native speaker questionnaire for L1 control group 261 5.h. Native speaker questionnaire for German control group 265 5.i. English C-Test 275 5.j. German C-Test 281 5.k. Egg armour plating (by W.H. Robinson) 287 5.l. Example of a CHAT transcript 288
5.m. Versicherung 289 5.n. kurzer Lebenslauf 290

5
List of tables and figures Table 1: Examples of responses given to the question: “Why do you consider
yourself a native speaker of the language(s) named?” Table 2: Those requirements which together form the language requirement Table 3: Those requirements which together form the attitudinal requirement Table 4: Some basic information about the participants Table 5: An overview of the participation criteria for the three groups Table 6: Distribution of the test items among the three groups Table 7: Classification of results for the C-Tests Table 8: The twenty situations or objects analysed for the Film retelling task (in
chronological order) Table 9: The fifteen situations or objects analysed for the Picture description task
(in assumed chronological order) Table 10: The results of the English can-dos for all three groups in % (N=62) Table 11: The results of the German can-dos for the attrition group and German
control group in % (N=41) Table 12: The results of the can-dos for the three groups for their respective
native language in % (N=62) Table 13: Native speaker scores for the attrition group and L1 control group
(N=45) Table 14: Three predictor variables for the attrition group and L1 control group
combined (N=45) Table 15: Three predictor variables for the attrition group and L1 control group
separately (N=45) Table 16: Two predictor variables for the attrition group (N=25) Table 17: Total scores for FiCA 1 in all three groups in descending order (N=64) Table 18: Semantic analysis of animals named in FiCA 1 Table 19: Total scores for FiCA 2 in all three groups in descending order (N=64) Table 20: Semantic analysis of fruit and vegetables named in FiCA 2 Table 21: Cases of interference from German in the two FiCAs Table 22: The results of the English C-Test in descending order (N=64) Table 23: The results of the German C-Test in descending order (N=43) Table 24: English C-Test results for the individual texts Table 25: German C-Test results for the individual texts Table 26: The ‘Scrabble’ results of the three groups (N=64) Table 27: Total individual scores for FiCA 1 and 2, English C-Test and ‘Scrabble’
test (in descending order) (N=64) Table 28: D values for the Film retelling task (N=45) Table 29: CLAN analysis of the Film retelling task (N=45) Table 30: Code-switching in the Film retelling task (N=25) Table 31: Lexical analysis of the Film retelling task (N=45) Table 32: D values for the Picture description task (N=41) Table 33: CLAN analysis of the Picture description task (N=41) Table 34: Code-switching in the Picture description task (N=25) Table 35: Lexical analysis of the Picture description task (N=41) Table 36: D values for the Film retelling and Picture description tasks combined
(N=41) Table 37: CLAN analysis of the Film retelling and Picture description tasks
combined (N=41)

6
Table 38: Summary of between-group differences in the test battery (N=64) Table 39: Correlations between different predictor variables in the attrition group
(N=25) Table 40: Correlations between different test outcomes in the attrition group
(N=25) Table 41: Correlations between features in the two spoken tasks for the attrition
group (N=25) Table 42: Correlations between (relatively) free spoken data and four English
tests for attrition group (N=25) Table 43: Mean scores for the English can-dos and four English tests for all three
groups (N=64) Table 44: Correlation analyses between the English can-dos and four English
tests for all three groups (N=62) Table 45: Mean scores for the German can-dos and German C-Test for the
attrition group and German control group (N=41) Table 46: Correlation analysis between the German can-dos and the German C-
Test for the attrition and German control groups (N=41) Table 47: Correlation analyses between the can-dos and various tests for all three
groups individually (N=62) Table 48: Mean scores for the native speaker rating for the attrition group and L1
control group (N=45) Table 49: Correlation analyses between total native speaker ratings and various
tests in the attrition and L1 control groups (N=45) Table 50: Individual scores for the native speaker rating and all English tests
(excluding free spoken data) for the attrition group (in alphabetical order) (N=25)
Table 51: Individual scores for the native speaker rating and all English tests (excluding free spoken data) for the L1 control group (in alphabetical order) (N=20)
Table 52: Individual native speaker ratings and total scores for all three groups (in descending order of total score) (N=64)
Table 53: Individual scores for the native speaker rating and free spoken data for the two native speaker groups (in descending order of native speaker rating) (N=45)
Table 54: Predictor variables and the three groups (N=64) Table 55: The impact of ‘age (at testing)’ on the test scores of the three groups
(N=64) Table 56: The impact of ‘sex’ on the test scores in the three groups (N=64) Table 57: The impact of ‘number of languages spoken’ on the test scores in the
three groups (N=64) Table 58: The impact of ‘level of education’ on the test scores in the two native
speaker groups (N=45) Table 59: The impact of ‘L1 proficiency’ on the test scores in the two native
speaker groups (N=45) Table 60: The impact of ‘L1 use’ on the test scores of the two native speaker
groups (N=45) Table 61: The impact of ‘L1 attitude’ on the test scores of the two native speaker
groups (N=45) Table 62: The impact of ‘age at emigration’ on the test scores of the attrition group
(N=25)

7
Table 63: The impact of ‘LOR’ on the test scores in the attrition group (N=25) Table 64: The impact of ‘L2 use’ on the test scores in the attrition group (N=25) Table 65: The impact of ‘L2 proficiency’ on the test scores (N=25) Table 66: Key for abbreviations used in the tables below Table 67: Overview of correlations between ten predictor variables and test
scores in the attrition group (N=25) Table 68: Overview of correlations between predictor variables and test scores in
the L1 control group (N=20) Table 69: Overview of correlations between predictor variables and Film retelling
silent pauses in the attrition group (N=25) Table 70: Results for Film retelling silent pauses in two subgroups of the attrition
group (N=14) Table 71: Twelve predictor variables in two subgroups of the attrition group
(N=14) Figure 1: Types of attrition research (van Els, 1986:4) Figure 2: Non-pathological types of attrition Figure 3: Ebbinghaus’ forgetting curve (adapted from Neath & Surprenant,
2003:18) Figure 4: Two possible retention curves (adapted from Weltens, 1989:12) Figure 5: Fox’s diagram of Englishness (2004:410) Figure 6: The two components of the native speaker model Figure 7: The concept of native speaker as a prototype Figure 8: Distribution of English can-do scores for three groups (N=62) Figure 9: Distribution of German can-do scores for two groups (N=41) Figure 10: Total native speaker scores for the attrition group (N=25) Figure 11: Total native speaker scores for the L1 control group (N=20) Figure 12: The two separate native speaker factors for the attrition group (N=25) Figure 13: The two separate native speaker factors for the L1 control group (N=20) Figure 14: Total native speaker ratings for both native speaker groups (N=45) Figure 15: Total FiCA scores (for FiCA 1 and 2) for all three groups (N=64) Figure 16: English C-Test results for three groups (N=64) Figure 17: German C-Test results for two groups (N=43) Figure 18: English and German C-Test results for the attrition group (N=24) Figure 19: English and German C-Test results for the German control group
(N=19) Figure 20: Scores for English and German C-Tests in % (N=63) Figure 21: Total weighted scores for ‘Scrabble’ test for all three groups (N=64) Figure 22: Total individual scores for the two FiCAs, English C-Test and ‘Scrabble’
test combined (N=64)

8
1. Introduction This thesis will discuss two linguistic topics which, to my knowledge, have not been explicitly examined together in the past, despite their being so closely related. These two topics are first language (or L1) attrition in healthy adults (i.e. non-pathological attrition) and the concept of ‘native speaker’. The most immediate connection between the two is that those speakers who typically participate in such L1 attrition studies (and can be called potential attriters) were all native speakers of their L1 before emigrating to a new country and becoming multilingual, where an L2 often gradually threatens to become the dominant language, and their L1 is in danger of suffering in some way, i.e. attriting. The question linking these two strands of research therefore is: Are such individuals still native speakers of their L1 even if they (after many decades in a different country) suffer from L1 attrition? And, developing this a step further: What does it mean to be a native speaker? Is it an attribute one keeps for life once acquired, or is it dynamic, something that can change over time? Can a speaker, for example, become a native speaker of a second language, either instead of or in addition to, the first? Such questions form the basic framework around which this thesis is structured. First, the literature on attrition is reviewed, and the findings from previous studies discussed, to gain a better understanding of attrition as such, and to distinguish adult, non-pathological L1 attrition (which is the focus of this study) from the other types of first and second language attrition and similar phenomena, such as aphasia, language shift and language loss. The main characteristics of this particular type of attrition will be identified, as well as those factors which seem to impact on it. Then, those few studies that have been carried out on the attrition of English as a first language are presented, and methodology and relevant findings are discussed. One could well argue that this is an extreme ‘testing ground’ for L1 attrition, as, assuming attrition has something to do with non-use of language, it must be virtually impossible to find countries in this day and age where a speaker would not have access to English and other speakers (albeit possibly L2 speakers) of English.
Moving on to attempts to describe and explain the observed phenomena adequately within a theoretical framework, information from the mainly psychological and neurological (or neurolinguistic) literature on the brain and its role in language attrition is first introduced and its relevance considered. This includes taking a brief look at some wider topics such as neural plasticity, types of memory and forgetting. After this rather general background has been established, the focus shifts to those more specific linguistic theories and frameworks which have, in previous studies, been applied to attrition data. These are also briefly introduced and their power to explain L1 attrition phenomena discussed. This particular study adopts a rather exploratory and interdisciplinary approach to the topic of (L1) attrition, and does not test a specific theoretical framework. The approach, however, does assume the basic validity of a number of claims from psycho- and neurolinguistics, as outlined in the relevant section.
The next step is to move on to the controversial topic of ‘native speaker’ and what is generally meant by this term. Again the linguistic (and some, more general) literature on the topic is reviewed, before presenting a new definition of ‘native speaker’ and also a model based on the idea of a prototype which enables us to objectively determine how ‘native speaker-like’ a particular speaker is, i.e. it enables us to establish a continuum between a prototypical native speaker on the one hand,

9
and a peripheral native speaker on the other, and to situate each individual speaker on this continuum to allow comparisons.
After this theoretical background, I go on to present my empirical study of British and Irish speakers of L1 English who have lived in Germany for many years (in some cases even many decades), and are potential L1 attriters. The findings from this attrition group1 are compared with two control groups: (1) a group of British and Irish L1 speakers who have never spent much time abroad and are more or less monolingual2, and (2) a group of German L1 speakers who are all highly proficient users of L2 English (i.e. they have a university degree in English and use English professionally)3
2. Theoretical Background / Literature Review
. All participants completed a sociolinguistic questionnaire, thereby providing important background information about themselves, as well as a number of different language tasks (the test battery) which aimed to measure their proficiency in English and German. (Of course the monolingual L1 control group did not take part in any German tests however.) After the methodology has been reviewed, the results of the various tests are presented and discussed.
The principal questions guiding this research project are: To what extent do the speakers in the attrition group show signs of L1 attrition? And, also: Assuming that evidence of L1 attrition is found, which if any of the sociolinguistic variables can help to explain and predict who is likely to succumb and who more likely to resist? Furthermore: Where can all these individuals be situated on the ‘native speaker’ continuum mentioned above? The answers to these two questions can then hopefully help us find an answer to the more fundamental question posed above: What does it mean to be a native speaker? For example, assuming we find L1 attrition in the speakers’ language, can we show that such speakers are also less ‘native speaker-like’? Can we show a correlation between both findings? If we can, then the label ‘native speaker’ can be shown to mean something, i.e. to correlate with a certain language proficiency. If not, the label becomes, to all intents and purposes, largely meaningless.
In this chapter some of the most pertinent literature on the main topics of this thesis will be reviewed: attrition, and the concept of ‘native speaker’. We begin by teasing apart the various terms that crop up in such studies: language attrition, language loss and language shift. Further distinctions are made between pathological and non-pathological language attrition on the one hand, and child and adult attrition on the other. Then the particular type of attrition with which this thesis is concerned will be discussed in some detail: non-pathological L1 attrition, before turning our attention to the more specific case of non-pathological attrition of L1 English. To round off this review of the literature on attrition, some background information from the neighbouring fields of psychology and neurology will be introduced, without which – in my opinion – a discussion of attrition lacks substance and remains relatively abstract, before turning our attention to some of the linguistic frameworks within which work on attrition is often carried out.
1 Please note that the term ‘attrition group’ is used although individual members of the group may not actually display signs of L1 attrition. The name simply denotes that group with the potential for L1 attrition. 2 Later referred to as the L1 control group. 3 Later referred to as the German control group.

10
2.1. Language attrition in the broader context4
In 1982 we saw the first major publication in this field by Lambert & Freed on The Loss of Language Skills, where various types of language problems were treated together. In 1985, de Bot & Weltens (cited in van Els, 1986:4) suggested distinguishing four different types of loss, taking into account which language is affected and in which environment the changes occur. Although some attrition researchers are starting to feel this taxonomy is outdated or rather oversimplified (see for example Weltens, 1989:2; Köpke & Schmid, 2004:9), it, nonetheless, seems to be a good place to start our discussion, as it is widely cited in the literature. The four types are:
1. loss of L1 in an L1-environment, e.g. dialect loss within the dialect community;
2. loss of L1 in an L2-environment, e.g. loss of native languages by migrant workers;
3. loss of L2 in an L1-environment, e.g. foreign-language loss; 4. loss of L2 in an L2-environment, e.g. second-language loss by aging
migrants. Language L1 L2
Environment L1-env. L2-env. L1-env. L2-env. Type 1 2 3 4
Figure 1: Types of attrition research (van Els, 1986:4) Language loss, language attrition, and language shift We can see that de Bot & Weltens refer to all four types as ‘loss’ although they differ in many ways. In fact we find three terms generally being used in the literature: language loss, language attrition and language shift. In her overview article, Hansen offers the following definitions:
Language loss is a general term applied to any instance of the decline of linguistic skills, whether of individuals or speech communities. Language attrition (...) refers to the gradual forgetting of a language by individual attriters, persons who are experiencing attrition. This is distinguished from the longstanding sociolinguistic tradition of research of language shift, where the focus is on groups of speakers (Hansen, 2001:61).
Loss is, therefore, conceived to be the superordinate term, with attrition and shift as the two subordinates. This thesis focuses on loss in individuals, so we are looking at
4 Further information on the various types of attrition, and research carried out in this field, can be obtained from the following recommended overviews: Schmid, 2004a and Hansen, 2001.

11
language attrition. This type is also sometimes referred to as intragenerational attrition to distinguish it from intergenerational loss, or language shift. Turning our attention briefly back to the de Bot & Weltens taxonomy above, we see that two different types of L1 attrition are distinguished, as well as two types of L2 attrition. For this thesis it is type 2 that is of primary interest: L1 attrition in an L2 environment.
Child vs. adult attrition There are two crucial dimensions missing from Figure 1 above, so to a certain extent it does oversimplify the situation as some have suggested. The first of these concerns the difference between attrition in children and that in adults, an age factor which has repeatedly been shown to be of major significance. A number of researchers (for example see Seliger, 1989,1991; Vago, 1991) have reported on cases where children have left their L1 environment and migrated to a country where a different language is spoken, leading to massive attrition in the native L1 within a relatively short period of time. A major problem with child attrition is that it is virtually impossible to know what the child had acquired prior to migration, in order to be able to judge what has been lost since. It is, however, generally assumed that a child up to an age of around 12 (i.e. pre-puberty) has not yet fully acquired an adult-like command of the language, so that such cases are often referred to as ‘incomplete acquisition’ rather than actual attrition. The dramatic consequences found in child attrition have, however, not been observed to date in comparable situations with adults, so the age factor is undoubtedly a crucial one. Köpke & Schmid write (2004:1): “Findings from individual studies seem to indicate that it cannot be said with any certainty whether a first language in which a certain level of proficiency has been reached can ever undergo significant attrition (...).” Reasons generally put forward as explanation(s) involve the fact that the L1 is better rehearsed, more or less fully acquired (a ‘stable system’), and better supported by literacy in adults, thereby making it less vulnerable to attrition, but these will be discussed in more detail later. Pathological vs. non-pathological attrition The second missing dimension involves distinguishing between pathological and non-pathological (or healthy) attrition, in other words between speakers who have suffered some kind of brain damage, or pathology, which has affected their linguistic proficiency, and those who have not. Again this is an important distinction as the precise problems in pathological language attrition will depend on which area(s) of the brain has/have been damaged, leading, for example, to different symptoms, and different types of aphasia. The exact features of pathological language attrition are therefore much more difficult to predict globally than those of non-pathological attrition, and explain the importance of keeping these two sub-types apart. So, to be terminologically precise, in this thesis we are interested in adult, non-pathological L1 attrition in an L2 environment.
Now that we have managed to disentangle the various terms, and know what we mean by first language attrition, I would like to take a closer look at the exceptional circumstances to which our L1 speakers are exposed when living in an L2 environment, and discuss the question of what it means to be ‘multilingual’.

12
2.1.1. Multilingualism and ‘multi-competence’ The type of attrition under discussion here is L1 attrition in an L2 environment, in other words attrition where more than one language is involved, i.e. we have a multilingual setting. Herdina & Jessner define multilingualism as “the command and / or use of two or more languages by the respective speaker” (2002:52). They add (ibid.:117-8) that “multilingualism ranges from monolingual acquisition, that is the learning of an L2 by a native speaker, to balanced bilingualism or even ambilingualism and to the command of three or more language systems (...).” Its most common form, however, is bilingualism, which assumes command of two languages. This is also the minimum requirement for our study of L1 attrition in an L2 environment – we need an L1 and an L2, but not necessarily further Ls. The number of languages known by the individual, as well as their respective degrees of proficiency, may play a role in L1 attrition but that will have to be seen later, and therefore, for the time being, the participants in the attrition group and the German controls (who all have advanced knowledge of L2 English) will be referred to as multilinguals, rather than bi- or trilinguals etc.
‘Multi-competence’ A major shift in thinking has occurred in the past twenty years or so, moving from a view that multilingual speakers tend to be less skilful in one or more of their languages when compared to monolingual native speakers, to the idea that in fact such speakers are more skilful in the sense that they can do what monolingual native speakers cannot. Cook, who, after Grosjean, is one of the forerunners of this change in perspective, sums the idea up very nicely by saying that a “person who is using a second language to whatever extent is not a deficient native speaker functioning at, say, 20% of the monolingual norm but a multi-competent user functioning at 120% of the monolingual” (1993:6). He was, to my knowledge, the first researcher to suggest the term ‘multi-competence’ which is defined as the “knowledge of two or more languages in one mind” (1991, cited in 2003:2). This rather general definition does not assume that a speaker has to be in an L2 environment to be ‘multi-competent’ (just as the definition of multilingualism above also includes L2 acquisition in the native setting), but can just as easily remain in his/her L1 environment. At first view, it may seem rather counter-intuitive to merge these two separate groups into one category, but, in fact, quite a bit of evidence is accumulating, which reveals that even quite rudimentary knowledge of a second language can bring about changes to the overall language system, thereby affecting the first language (see for example Herdina & Jessner, 2002; Cook, 1993, 2002, 2003; Hell & Dijkstra, 2002). Hell & Dijkstra’s paper, in particular, is worth mentioning here as the authors were able to show in an experiment that knowledge of a second language affects the native language, even when carried out in a purely monolingual, native setting, where the second language could have been expected to be dormant. We can probably expect differences regarding the degree to which languages influence each other, whereby higher proficiency and more exposure may well lead to greater interference, but the basic effects can already be seen after very little exposure, and relatively low proficiency. This view has a number of consequences for attrition research, such as switching the focus from searching for non-native-like errors in the data, to trying to find its internal systematicity – similar to the interlanguage approach in second language acquisition. Another problem is that – if knowledge of a second language

13
will affect the native language – then maybe what we call attrition is unavoidable and normal in multilinguals (cp. Köpke, 2004:6). So maybe we should avoid the negatively-connotated term ‘attrition’ altogether, and find something more neutral instead. In the wake of ‘multi-competence’ in fact a number of researchers (see for example Latomaa, 1998) are choosing not to consider their data L1 attrition even if they find evidence of the L1 speakers experiencing problems with their language after an extended period of residence in a foreign country. A further upshot is that it becomes much more difficult to find a suitable group of native speakers to act as controls (even if we should want to compare our multilinguals to native speakers). Ideally, we would need a completely monolingual group, in order to be able to assume that we have ‘pure’, native control data, which has not been influenced by any further languages. In reality, however, this will generally not be possible, as almost all individuals have at least some instruction in foreign languages at school. At best, we can try to find controls with minimal exposure to other languages, and hope the impact on the native language will be nominal.
2.1.2. Adult non-pathological L1 attrition
So far L1 attrition has been defined here as involving loss of L1 in an L2-environment, but at the same time, researchers have been cited as saying that this particular type of adult non-pathological L1 attrition is rather controversial in that little real evidence of attrition has been found in studies so far. So, what has been found in the past? What can be expected to take place under these circumstances? This section offers a review of the literature on the topic of adult, non-pathological L1 attrition and answers to such questions. We begin with a rather general outline, before looking at the features and influencing factors (predictor variables) in more detail. One of the most striking global findings in this particular sub-field is that those speakers who we could call potential L1 attriters very often report self-perceived deterioration in their language skills, which can, however, often not be corroborated experimentally. This means that there seems to be a mismatch between subjectively-experienced problems and objectively-measurable attrition, which studies so far have not been able to reconcile. Boyd & Andersson, for example, write (1991:6):
Many linguists working in the field of language attrition have actually had problems demonstrating that loss of language skills, particularly in L1 have occurred (...). At the same time (...), immigrants notice changes in their L1 which they feel are brought about by their active bilingualism (...).
Are such speakers exaggerating, or is our methodology simply not subtle enough to pick up on the problems? What does the literature on adult non-pathological L1 attrition have to say about the phenomenon? What happens to the language? In the past (and at least partly driven by Chomskyian theory) there was an idea that “the language which has been learned first (...) is in a privileged position to resist interference” (Weinreich, 1974:88) or “that nothing of particular interest happens with an individual’s language once it has been “fully” acquired” (Hyltenstam & Obler, 1989:2). Nowadays, however, researchers are more sceptical and we often find

14
comments such as the following: “The first language appears not to be special in the sense that it is unvulnerable and protected against attrition” (de Bot, 2004:233). So, there does seem to be growing agreement that the phenomenon known as adult non-pathological L1 attrition can exist. But what can a speaker expect to happen and under which circumstances? Attrition, in general (i.e. loss of an L1 or L2), can manifest itself in a wide range of outcomes from “mild access problems (in particular word finding) to partial forgetting and complete loss of a language” (Hyltenstam & Viberg, 1993:28). In adult non-pathological L1 attrition, however, the symptoms are rarely severe, as mentioned above. The ‘mild access problems’ are much more likely than ‘complete loss’, which is more common in child L1 attrition, or cases of L2 attrition. Studies of adult attrition often mention a ‘decrease in proficiency’ as the classic symptom (see for instance Köpke & Schmid, 2004:5; Gardner, 1982:24; Oxford, 1982:119), without always specifying what this rather vague description is supposed to mean in detail. (I will attempt to shed more light on this point in the next section: 2.1.2.1.) When does it happen? So under which circumstances can we expect to find adult non-pathological L1 attrition? Again, there is widespread agreement that this can be a ‘normal’ outcome of a speaker migrating to another country and learning a new language. Levy et al., for example, write: “After immersion in a foreign language, speakers often have difficulty retrieving native-language words – a phenomenon known as first-language attrition” (2007:29). In a more general sense, de Bot & Hulsen say that “L1 attrition typically comes as a by-product of language contact, particularly in migrant settings” (2002:262). Attrition is, however, by no means automatic as a number of researchers point out (see for example Dorian, 1982:44; Sharwood Smith, 1989:186), and as Søndergaard mentions “one can lose one’s first language without learning to master one’s second” (1996:540). So, although it is often the case, that a language switch takes place, where the L2 gradually encroaches on the L1, and, over a long period of time, can become the dominant language, it is also feasible that the L1 attrites without the L2 replacing it, or even that the L1 remains (virtually) unaffected. In this section we have discovered that the phenomenon known as adult non-pathological L1 attrition does actually exist, even if it is often hard to actually detect and measure empirically. It normally manifests itself in minor problems such as mild access problems, or an overall decrease in proficiency, and typically occurs in situations of contact with an L2 after migration to a new country. (Although I tend to concur with the multi-competence view outlined above, here I will continue to follow the tradition in calling such phenomena L1 attrition.) In the next chapter, therefore, we will take a closer look at what exactly can happen to the L1 in attrition.
2.1.2.1. Features of adult non-pathological L1 attrition
In the previous section we found rather vague descriptions of the effects of adult non-pathological attrition on the L1. Here, a number of sources are presented: actual studies as well as more theory-based predictions, in an attempt to pinpoint the symptoms more precisely, and get a better idea of what exactly we are talking about. For ease of reference the various comments have been grouped according to the specific area of language under consideration.

15
The time frame (i.e. how soon can we expect problems to occur?) de Bot & Clyne (1994): “those immigrants who manage to maintain their language
in the first years of their stay in the new environment are likely to remain fluent speakers of their first language.” (p.17)
de Bot & Hulsen (2002): “there may be attrition in the first decade, but (...) the language skills that are still present after this period are fairly stable.” (p.263)
Hutz (2004): “a considerable amount of attrition, especially in the lexicon, seems to occur during the first 10 to 15 years” (p.203).
Accent (phonetics, phonology) van Els (1986): “Language skills in which automated processes play a major part,
are likely to be less subject to loss”. Therefore the phonological level is relatively unaffected. (p.12)
Major (1993): The VOT (voice onset time) of L1 speakers changed towards that of the L2. (p.475)
Latomaa (1998): Native intonation changed, influenced by the L2. de Bot (1999): “In many speakers in a migration context, the phonological skills
show clear signs of interference from the dominant language.” (p.358) Gürel (2004a): “deviation from native pronunciation” is an example of language
attrition. (p.226) Lexicon (accessing vocabulary, idioms, borrowing) Andersen (1982): “considerable amount of lexical borrowing” (p.93); “A person
whose competence in a language is diminishing or has diminished will often find himself at a loss for words, correct phrasing, (...), etc.” (p.105-6).
Berko-Gleason (1982): “routines” such as How do you do? and Oh, my goodness! and “sequences” like days of the week, months and numbers, curses and body parts are “best learned” or “nearly automatized” and therefore most resistant to attrition. (p.21-2)
Olshtain (1986): “Difficulty of retrieval of words” (p.199). Jordens et al. (1986): “idiomatic expressions (...) and so-called social fillers such
as let me see and you know” are “automatism[s]” and therefore “especially resistant” to attrition (p.161).
van Els (1986): “Language skills in which automated processes play a major part, are likely to be less subject to loss”. Therefore the lexicon is in danger. (p.12)
Seliger & Vago (1991): “External influences are (...) evident in the domain of the lexicon” (p.10).
Altenberg (1991): “idiosyncratic lexical information may be more prone to attrition than morphological rules”; “frequency appears to be a factor in the vulnerability of lexical information to attrition” (p.203).
Olshtain & Barzilay (1991): “word retrieval processes seemed to be slightly impaired in the primary language” (p.139-40); “We have noticed vocabulary attrition (...) mostly in the limited area of specificity in meaning. (...) the most susceptible items to suffer from language attrition are infrequent, specific, nouns” (p.140).
Yoshitomi (1992): “the lexicon is affected in L1 loss more so than grammar” (p.296).
Waas (1997): “Evidence of L1 attrition manifested itself in the absence of reflex responses, repartee, onomatopoeia, idiomatic phrases, proverbs, humour, and quips” (p.120).

16
Latomaa (1998): Self-reported word-finding problems in L1 and L2 borrowings. Köpke & Nespoulous (2001): “the lexicon is more vulnerable to attrition than
syntax or morphology” (p.226); subjects have problems with “lexical processing” (p.232).
Laufer (2003): “L1 lexical diversity declined as the contact time with L2 increased. The percentage of non-frequent vocabulary and the total number of words produced in free expression significantly decreased as time passed” (p.29).
Hutz (2004): general expectation “that language attrition will first affect the level of the lexicon” (p.193).
Köpke (2004): “The linguistic domain in which most L2 influence has been reported is doubtlessly the lexicosemantic domain” (p.19).
Gürel (2004a): “inability or difficulty in retrieving items from the lexicon” is a manifestation of language attrition (p.226).
Levy et al. (2007): “speakers often have difficulty retrieving native-language words”. “This phenomenon affects vocabulary most strongly” (p.29).
Köpke (2007): “vocabulary (...) is a good candidate for interference” (p.18). Grammar (morphosyntax) Dorian (1982): “her grammar [was] fairly deviant” (p.51). Andersen (1982): “there have been reported losses in grammatical distinctions
that are not shared by both languages” (p.96); problems with “native morphosyntactic marking” (p.105-6).
Seliger (1989): a “less complex” grammatical rule with a “wider linguistic distribution” will replace a “more complex more narrowly distributed rule” (p.173).
Boyd & Andersson (1991): Greater variation in placement of adverbials found, due to L2 influence.
Altenberg (1991): “morphological rules” are less prone to attrition (p.203). Yoshitomi (1992): Grammar is less affected than the lexicon (p.296). Ammerlaan et al. (2001): “Language attrition is commonly viewed as involving the
loss of structures, moving from synthetic to analytical” (p.9). Köpke & Nespoulous (2001): syntax and morphology are unlikely to suffer in
attrition (p.226); “the sensitivity to what is agrammatical in L1 syntax and morphology also suffers from attrition” (p.232).
Macevichius (2001): “the grammatical system remains intact” in attrition (p.235). Gürel (2004a): “divergence from native syntax” is an example of language attrition
(p.226). Gürel (2004b): “Only the L1 properties that have analogous forms in the L2 (...)
will undergo attrition” (p.60). Hutz (2004): “morphological and syntactic categories” are only affected later in
the attrition process (p.193). Köpke (2007): “as far as grammar is concerned (...) interference is expected to be
more pronounced in early bilinguals. For late bilinguals, the largely declarative L2 grammar is less likely to interfere with the procedural L1 grammar” (p.18).
Discourse (pragmatics) Waas (1997): “Evidence of L1 attrition manifested itself in the absence of reflex
responses, repartee, onomatopoeia, idiomatic phrases, proverbs, humour, and quips” (p.120).
Macevichius (2001): “language attrition begins at a discourse level” i.e. “limitations in language use situations” and “register variation” (p.235).

17
Brown (2001): Changes to reflex responses, repartee and sound symbolism seem to be part of L1 attrition.
Fluency (speed) Dorian (1982): “her spoken Gaelic was halting” (p.51). Andersen (1982): problems in the “quick retrieval of appropriate vocabulary and
idiomatic phrasing in on-going speech production” (p.113). Hiller-Foti (1985): „Erscheinungen des Spontaneitätsverlustes in der
Muttersprache“ (i.e. a general loss of spontaneity in the native language) (p.108). Waas (1997): “The interview tempo was also significantly slower than in the
interviews conducted with the (...) German monolingual control group” (p.121). Latomaa (1998): Self-reported loss of fluency in L1. Hansen (2001): “silent pause is a piece of the language attrition puzzle” (p.65);
“gradual increase in processing time for the retrieval of linguistic information” (p.67).
Gürel (2004a): “lack of fluency” is a manifestation of language attrition (p.226). Köpke (2004): “bilinguals may reach a point where (...) processing of L1 is (...)
slowing down” (p.6). Active vs. passive knowledge (production vs. reception) Hiller-Foti (1985): „ein Auseinanderklaffen von aktivem und passivem Besitz“ der
Muttersprache (i.e. a divergence between active and passive proficiency in the native language) (p.108).
Yoshitomi (1992): “Better performance on recognition tasks than on recall tasks” (p.298).
Waas (1997): “Productive language skills are more susceptible to attrition than receptive ones” (p.120); “attrition becomes particularly noticeable in productive skills, especially speaking” (p.129).
Writing Porte (1999): “Most teachers were conscious of L2 interference in much of their
English writing” (p.30). The role of code-switching and code-mixing Seliger (1989): “Language attrition may be characterized as an example of
language mixing” (p.176). Boyd (1993): Code-switching into L2 is generally restricted to single words,
especially compound nouns. Hamers & Blanc (2000): “Code-mixing might (...) be a precursor of attrition” (p.77). Köpke (2002): “generally, I do not consider code-switching as an error in bilingual
subjects” (p.126, footnote). Porte (2003): code-manipulation can be used for a number of reasons – and does
not necessarily lead to attrition (cp. p.117), although it “could be instrumental in eventually predisposing the L1 to such effects by virtue of the diminished control and monitoring apparently being exercised over the L1 output” (p.117).
Hutz (2004): does not consider all cases of codeswitching to be symptoms of attrition (p.195).
So what are the main characteristics of all these various findings? The lexicon is often mentioned as being the linguistic domain where most attrition is expected to

18
take place, and at a relatively early stage in the process5
Porte also mentions the medium of writing as an area where his informants specifically reported problems. As the majority of studies concentrate on the spoken
. Some researchers call attention to specific areas of the lexicon as being more or less at danger, such as Berko-Gleason who discusses specific ‘routines’ and ‘sequences’ which are expected to be less vulnerable than the rest of the lexicon as they have been rehearsed most often. Altenberg and Laufer suggest that idiosyncratic lexemes with low-frequency are more likely to become inaccessible than other lexical items, and Olshtain & Barzilay identify ‘infrequent, specific nouns’ as the area of the lexicon most endangered. Neisser also points out (1984:34) that “isolated pieces of information (...) are much more vulnerable”, suggesting that those lexical items which are members of large and extensive networks (e.g. lexical fields) are less likely to suffer L1 attrition than those which are not. In a similar vein Meara also warns of simply assuming that the entire lexicon is equally susceptible, and says for example that it “seems quite likely (...) that some words in real lexicons become immune to normal attrition as a result of frequent use” (2004:153). So, although it does seem to be a fact that the lexicon is more open to attack than the rest of the language, we need to avoid treating it as if it were simply one unit which is likely to behave in a uniform way – in fact the picture is much more complicated, and we need to identify carefully what we mean by ‘the lexicon’. Another area in which there appears to be widespread agreement is fluency. A number of researchers report halting, slow speech with more pauses than in the control group(s). This is generally interpreted as representing an increase in processing time, i.e. the speakers are taking longer to plan and prepare what they want to say, or they are having to monitor their speech more carefully in order to avoid making mistakes.
The distinction between active and passive knowledge is also mentioned by a number of papers. Those who discuss this, agree that passive knowledge seems to be less susceptible to attrition than active knowledge. (As we will see later this is also specifically predicted by neurolinguistic theories such as the Activation Threshold Hypothesis.) With regard to accent (phonetics and phonology), we find conflicting accounts. Again, there are a number of sources reporting or predicting that the native accent will in some way be affected by the second language, but, on the other hand, van Els expects few problems here, as the processes in this area are largely automated. Grammar (or morphosyntax) also offers a rather mixed picture – some studies mention problems, others don’t. This disagreement may have to do with the typology of the languages involved, meaning that we can only expect grammatical attrition to occur in cases where the languages are similar enough. Or maybe it is simply a matter of degree: the problems in the lexicon are much more blatant, thereby often overshadowing any possible emerging grammatical difficulties. Discourse or pragmatics is also mentioned as an area where L1 attrition becomes visible. The main reason why this is not referred to more often is probably because it is an area which most studies simply do not take into consideration.
5 In a footnote, Köpke & Schmid (2004:34) make the interesting point that such word finding difficulties are one of the most common symptoms in a whole range of other circumstances such as aphasia, healthy aging, and fatigue, suggesting that this area may simply be one of the most vulnerable aspects of language processing.

19
language this is also not often included, and therefore further accounts are, unfortunately, not available.
And within what time frame can we expect these changes to take place? Here, there is overwhelming agreement amongst those researchers who discuss the question. The basic tenet seems to be that attrition may take place in the initial ten to fifteen years after emigration, but after this period, linguistic proficiency should remain stable.
The final point to be mentioned is the question of code-switching and code-mixing, which are extremely common in interaction between multilinguals, and involve the insertion of one or more lexical or functional items from one language into another. As the review of the literature has shown there is no real agreement on how to view such processes – some researchers consider it a sign or precursor of attrition, whilst others see it as more or less normal multilingual behaviour. Having now looked in some detail at what exactly happens to the language during adult non-pathological L1 attrition, the focus now shifts to trying to identify features which may trigger or help avoid L1 attrition in multilingual individuals.
2.1.2.2. Predictor variables of adult non-pathological L1 attrition As in the previous section, where we looked at the features of adult non-pathological L1 attrition, here both the findings of actual studies and more theoretical predictions will be reviewed to try and comprehend what affects this type of attrition. A number of factors will be discussed which have been reported, or are expected, to either increase – or decrease – the likelihood of attrition in the individual speaker. Level of proficiency This factor is not really valid for adult non-pathological L1 attrition as all speakers are assumed to have acquired full native speaker proficiency before emigration. (Even if, as we will see later, no one is really clear on what this is supposed to mean.) It does, however, seem to play a role in L2 attrition, where higher proficiency is a positive factor in retaining a language, or in distinguishing adult L1 attrition from child L1 attrition, although here it is confounded with age and literacy. Age This factor also does not seem to be valid for adult non-pathological L1 attrition, at least as long as we can assume that our individuals are still healthy, and not beginning to suffer from more general, age-related language problems. It does, however, play a role in distinguishing adult L1 attrition from child L1 attrition, although there it is confounded with other factors such as level of proficiency and literacy, which will normally increase with age. Literacy This factor is again related to the distinction between adult and child attrition. To my knowledge there are, unfortunately, no studies of adult non-pathological L1 attrition comparing literate and illiterate speakers, and therefore it is only possible to assume that “less attrition is to be expected in subjects who have had the opportunity to become literate in the L1, especially if they frequently use that skill” (Köpke, 2007:21).

20
Social environment Berko-Gleason (1982): “the absence of a supportive social environment” makes a
language “surprisingly vulnerable” (p.13-4). Seliger & Vago (1991): “The diminished role of L1 in use and function,
exacerbated by separation from the L1 speaking community in the case of immigrants, is one of the significant sociolinguistic variables in the advent and sustenance of first language attrition” (p.4).
Sharwood Smith & van Buren (1991): “the L1 changes not because of lack of use but because of a lack of confirming evidence that the L1 is the way it is in a community of native speakers” (p.23).
Olshtain & Barzilay (1991): “Primary language attrition in adults is likely to occur when the subjects have been uprooted from their natural mother tongue context and transferred to a new language environment” (p.139).
Herdina & Jessner (2002): “changes in the language environment, and therefore in language needs affect her / his linguistic competence” (p.74).
de Bot & Hulsen (2002): “in most settings in which first language attrition takes place, moving out of the first language setting and into the second language setting has a profound effect” (p.257).
Language contact / Use of L1 and L2 Andersen (1982): “Restriction in language use accompanied by a break with a
previously established linguistic tradition (or norm) leads to reduction in linguistic form and the creation of gaps in the individual’s linguistic repertoire in that language” (p.87).
Jaspaert & Kroon (1989): Contact is not a significant factor. Those speakers with a non-L1-speaking partner performed better in the tests.
Sharwood Smith & van Buren (1991): “The standard kind of situation discussed in the literature (...) involves both lack of continuous exposure to L1 as well as exposure to L2 input” (p.23).
de Bot, Gommans & Rossing (1991): “there is only a linear relation between “time” and attrition where there are few contacts with the first language”. (p.94)
Vago (1991): “the unlearning process is initiated by a lack of access to L1 data and the growing dominance of L2” (p.239).
Huffines (1991): “First language attrition occurs in individuals [who] (...) have little or no opportunity to use their native language, perhaps for most of their adult years” (p.125).
Boyd & Andersson (1991): “Learner-English may well have an effect on English among Americans in Sweden” (p.4); “A minimum amount of use may be adequate for an adult native speaker to maintain a relatively high level skill, provided that the use is “high quality use”” (p.7).
Søndergaard (1996): “the common sense based assumption that the immigrants’ competence in Danish in general depends on (...) the extent of their use of Danish in the new environment, has been disproved” (p.553).
Ammerlaan (1996): “contact between languages does not necessarily result in attrition in one language” (p.6).
Porte (1999): “the resident native-speaker teacher’s L1 is not a stable system, but rather a changeable one that is susceptible (...) to the kind of defective L1 input typically received in language-learning contexts” (p.33).

21
de Bot (1999): “there is (...) probably no direct relation between amount of contact and loss” (p.347); “ultimately, frequency of use, or more precisely frequency of activation is the main factor in the decline of language skills” (p.348).
Herdina & Jessner (2002): “The absence of ... language maintenance resulting from lack of use, that is communication in one specific language, will lead to the deterioration of linguistic competence in the respective language” (p.99).
de Bot & Hulsen (2002): “neither first languages nor second languages are immune to loss. With non-use they fade” (p.253).
Laufer (2003): “L1 lexical diversity declined as the contact time with L2 increased” (p.25).
Sorace (2003): “all grammars, native or non-native, need continued exposure to robust input in order to be not only acquired, but also maintained” (p.145).
de Bot & Makoni (2005): “a lot of exercise is needed” i.e. it is important to practise language skills (p.2); not all contact is positive however – “a restricted register” will cause the speaker to “gradually lose the more advanced aspects of the skills” (p.135).
Köpke & Schmid (2004): “Far more crucial than the length of time appears to be the influence of language use and attitude” (p.12); “The factor amount of contact with the L1 is a complex one (...). [A]ttrition can often be ascribed to lack of contact” (p.14).
Schmid (2007): The following different types of L1 use should be kept separate in studies: monolingual mode L1 use, intermediate mode L1 use, bilingual mode L1 or L2 use, intermediate mode L2 use, and monolingual mode L2 use (p.140-1) as they “may impact on activation levels of L1 and L2 rather differently” (p.141); “the amount of use of the L1 in daily life does not seem to have any predictive power” (p.150).
Levy (2007): frequent use of L2 can make activation of the L1 more difficult (p.33).
Length of residence (LOR) / Time de Bot, Gommans & Rossing (1991): “there is only a linear relation between
“time” and attrition where there are few contacts with the first language”. (p.94) Søndergaard (1996): “the common sense based assumption that the immigrants’
competence in Danish in general depends on (...) the length of their stay in the new country (...) has been disproved” (p.553).
Brown (2001): “L1 attrition was found to be strongly correlated to the subjects’ attitudes towards the L2 environment, but not at all to the length of residence abroad” (p.37).
Köpke & Schmid (2004): “it appears that the role of immigration length for attrition is not as important as generally supposed” (p.12).
Gürel (2004b): “The results (...) revealed no length of stay main effect in any of the tests for the attrition group. This means that ‘time spent in an L2 country’ was not relevant for the level of performance (...)” (p.74).
Level of education Jaspaert & Kroon (1989): Speakers with a higher level of education were more
able to maintain their L1 proficiency than those with a more basic level of education.
Herdina & Jessner (2002): “we can (...) predict that the process of language attrition or erosion of the system underlying language competence is more likely

22
to affect less well-educated and / or less communicatively oriented speakers” (p.104).
de Bot & Makoni (2005): “the higher educated have more ‘in reserve’ and accordingly, overt signs of decline will take longer to become apparent” (p.133).
Attitudes / Motivation Gardner (1982): Positive attitudes and motivation are “expected to play positive
roles in influencing the extent to which language skills are retained” (p.24). Seliger & Vago (1991): “the subordination (...) of L1 to L2 in the affective domains
of language, such as prestige, social status, attitude, and degrees of acculturation” is another feature endangering the L1 (p.4).
Olshtain & Barzilay (1991): “the prestige of the first language in the new environment, the level of social distance between the immigrant community and the host community, and the individual degree of acculturation (...) may all have an impact on the degree of erosion which takes place” (p.139).
Major (1992, 1993): Those subjects who showed most L1 attrition were those who identified most with the L2 and its culture.
Søndergaard (1996): retention or attrition depends on “whether this language has or does not have emotional value (...) to the individual immigrant” and on “whether the informant has or does not have a language awareness which enables him/her to keep the two codes separate” (p.537-8).
Ammerlaan (1996): the Dutch participants in his study “are aware of the limited use of Dutch worldwide and consider shifting away from Dutch as a move up the societal ladder” (p.6).
Waas (1997): “Attitudinal and motivational factors towards the L2 environment strongly influenced intragenerational L1 retention or attrition” (p.129).
Brown (2001): “The extent of language loss appears (...) to be related to the individual’s attitudes towards his/her environment: individuals with more positive attitudes towards the community in which they now live tend to manifest greater language loss in their L1” (p.39).
Schmid (2002): attitudes towards L1 and the degree of persecution experienced were found to be the major factor affecting L1 retention/attrition.
Herdina & Jessner (2002): “individual motivation will show its effects on the amount of effort put into the acquisition and maintenance of a specific language system and therefore on positive or negative growth” (p.138-9).
Köpke & Schmid (2004): “Far more crucial than the length of time appears to be the influence of language use and attitude” (p.12).
Köpke (2007): “Emotion is most likely a key factor in any case of attrition (...). The possible prediction arising from this is that L1 attrition would occur only in cases in which either the L2 is strongly emotionally ‘invested’ (...) or the L1 is strongly rejected” (p.15).
Number of languages spoken Herdina & Jessner (2002): “three or more languages obviously constitute a more
comprehensive or heavy language load for the respective speaker, which has an influence on language stability” (p.132).
To now try and sum up what the literature has to say about those factors that can affect whether or not this specific type of L1 attrition occurs, and/or how serious it is, we should start with what I have called the ‘social environment’ here. All the

23
researchers cited above agree that this is a deciding factor in this type of attrition, i.e. in a healthy, young adult there is no normal reason for the L1 to attrite, if there is no change in the social/linguistic environment. This factor is closely related to the following one: ‘Language contact / Use of L1 and L2’ but the two have been kept separate, because although being in a different speech community will probably mean that the speaker will have less contact to the L1 and use it less often than the L2, the two are not necessarily causally related. The question of ‘contact’ or ‘use’ as it is often simply called in the literature is quite controversial. On the one hand there seems to be an intuitive expectation that the amount of exposure to the L1 (especially in relation to the amount of exposure to L2) should affect the amount of L1 retention or attrition – particularly in the specific situation we have in this type of attrition, where the presence of a second language encroaches on domains of the L1 – and this is confirmed or at least predicted by the majority of researchers quoted above. (That this factor should be relevant is also predicted by a number of psycho- and neurolinguistic theories as we shall see later.) Other sources, however, have found this factor to not correlate with signs of attrition, such as Jaspaert & Kroon’s study, which not only found that those speakers with L1-speaking partners performed worse than those whose partners spoke a different language, but whose results actually contradict their own previous findings. A few studies discuss the situation of EFL (English as a Foreign Language) teachers in non-English-speaking countries, and claim that exposure to the students’ defective English has had a detrimental effect on the teachers’ L1. This also brings us to the point raised by Schmid and others, who remind us that we need to clearly define what we mean by ‘contact’ or ‘use’, and that not just any type of contact, with any variety of the L1 will necessarily be helpful in avoiding L1 attrition. It seems almost common sense to assume that an individual who has lived in a foreign country for 50 years will suffer more L1 attrition than one who has only been there for 5 years, and yet this has not been borne out in research. The simple reason for this is probably that there is no simple relationship between what is generally called ‘length of residence’ (LOR) or ‘time’ and contact or use, as one individual may have very little contact with the L1 where another has a lot, and it is probably use that has a greater influence on the process of attrition. As de Bot, Gommans & Rossing point out, LOR probably only becomes a major influence when there is very little contact to the L1. With regard to the factor ‘level of education’ only three sources are discussed, which all agree that higher levels of education are (or should be) beneficial in avoiding L1 attrition. This is probably because a higher education is linked to literacy as well as a large(r) vocabulary and range of structures, but it also generally means that a speaker is more likely to read in the L1, have money for telephone calls and trips ‘home’, and the like, all of which mean more L1 input and, for that reason, a greater likelihood of maintaining the L1. The factor ‘education’, therefore, seems to have an indirect influence on L1 attrition, rather than an immediate, direct one. Other sociolinguistic factors, which might be surmised to impact on L1 attrition, such as gender (male vs. female) and age (excluding possible cases of senility-related loss), have not been shown to play any significant role in studies carried out so far. One factor on which there is complete agreement is the one called ‘attitudes / motivation’ here, but which includes other things such as prestige, emotions, and degree of acculturation. Although many sources draw attention to the fact that such subjective factors are difficult to measure objectively, they are, nevertheless, often

24
found to be the major – or at least one of the major – predicting factors for retention or attrition of the L1. The reasoning behind this is that a positive attitude towards the L1, and the L1 ‘home’ speech community will motivate the speaker to continue to identify him/herself as a member of a particular speech community, and a (native) speaker of the language, and therefore s/he will seek opportunities to practise the language, thereby preventing (or at least significantly delaying) L1 attrition. Again, therefore, we could say that such factors have an indirect effect on L1 attrition, rather than a direct one. The final factor presented in this section was ‘number of languages spoken’, which only one of the sources explicitly mentioned, predicting that the more languages an individual uses, the more likely each of these languages (including the L1) is to suffer from attrition, simply because resources to maintain them, such as time, are limited. In this last section we have discussed a number of factors which are often cited as influencing adult non-pathological L1 attrition in one way or another. The major ones identified are: contact / use, education, and attitudes / motivation, whereby contact / use seems to have a direct effect, and the others only an indirect one in that they seem to influence the amount of contact or use.
2.1.3. Adult non-pathological attrition of L1 English
In this chapter I will present – chronologically and in some detail – those studies (of which I am aware) that have been carried out on the L1 attrition of English. (For ease of comparison the following information is given on each one: languages involved, participants, methodology, main focus of study, and findings.) But before doing that, it seems fitting to ask ourselves how likely adult non-pathological attrition of L1 English is. We have already seen further above that this type of attrition rarely shows dramatic symptoms, and that contact / use is a major factor in predicting the retention or attrition of a language. If we now take into consideration that there are very few (if any) places in the world today where a speaker would not have any access to English, we would probably have to answer that it seems very unlikely for a healthy adult speaker of L1 English to experience major problems with his/her English, even after an extended period abroad. This is precisely the point made by a number of researchers (see for example Sharwood Smith, 1983b:53; Latomaa, 1988:69; Gürel, 2007:100), but it has not deterred them and others from taking a closer look, as we will see in the various studies presented below.
2.1.3.1. Clyne (1968)
Languages involved This is a study of L1 English in West Germany. Participants The participants in this earliest study were 20 adult native speakers of English aged between 23 and 67 years. 4 had been resident in West Germany for less than 1 year and 15 for less than 10 years. 7 of the participants were Americans, another 7 British nationals and 6 Australians. 11 had settled in Germany permanently, due to having

25
German spouses, and most were students, teachers, journalists or translators. These 20 participants (referred to as “Group E”) were compared with 196 German migrants living in Australia (called “Group G”), who were also over 20 years of age. Methodology The participants were individually interviewed in English for around 15-30 minutes and the conversations taped. During these interviews the participants were required to describe 3 pictures, and talk about their day’s work, impressions of Germany and Germans, and their language habits. In addition, some notes of their speech were made during free conversation or from written correspondence (letters). Main focus of study The main aim of this study was to “categorize types and causes of transference by comparing deviations from the norm in the English of several English native speakers resident in Germany with similar phenomena in the German of some postwar migrants in Australia whose language was German” (p.5). Findings Group E showed a “relatively high rate of semantic and morphological (rather than morphosemantic and morphemic) transference” (p.17). The following are some of the examples classified here as semantic transference, which according to Clyne (p.10) are “[t]he most common type of transference in the Group E corpus (...)”: “fell out (of lectures, were cancelled; Ger. fielen aus)”, “they let them all speak German (Eng. got them all to; Ger. ließen sie)” or “I have not read <Mein Name sei Gangenbein> FROM Frisch but I’ve read everything else FROM him (Ger. von; Eng. by)” (p.10-11). Clyne defines morphological transference as transferring “no actual lexeme or sememe” but rather “the morphological pattern of German” (p.12). In particular he seems to be referring to an overuse of compounding, which is more typical in German than in English, and cites the following examples: “a springtime-street”, “German theology-literature”, and “Middle Age-castles” (ibid.). Clyne concludes that “[a]mong both groups, on the whole, the more a person speaks his first language with others who are in a bilingual situation similar to their own, the more instances of transference occur in his speech” (p.17). The fact that Group E speakers show more semantic and morphological transfer than other types is attributed to the fact that they “will be more likely than Group G to come into contact with monolingual speakers of their first language” (ibid.).
2.1.3.2. Olshtain & Barzilay (1991) Languages involved This is a study of L1 American English in an L2 Hebrew environment (Israel). Participants The participants in the experimental group were 15 native speakers of American English who emigrated to Israel as adults. 13 of these were women and only 2 men. They were between 23 and 55 years old when the study was carried out, and had been living in the L2 environment for a minimum of 8 and a maximum of 25 years. There was also a control group of 6 Americans, aged between 28 and 56, who had

26
always lived in an American English speaking environment and had no knowledge of Hebrew. Methodology The participants were asked to look at 2 picture booklets containing ‘frog stories’ and then to ‘tell the story’. Olshtain & Barzilay say (p.142) that “an object naming task is embedded in the global task of story telling” as it was virtually impossible for the participants to tell the stories without naming the objects in the pictures. All interviews were transcribed and the data from the experimental group was compared with that from the control group. Main focus of study Olshtain & Barzilay describe their main objective as trying to “describe features of language attrition as exhibited by the subjects’ systematic and consciously directed search of their semantic memory for lexical items which prior to the onset of attrition were easily accessible” (p.140-1). Findings “On the whole, the American Israelis had no difficulty telling the frog stories and they acted as fully competent speakers of the language. However, they did have difficulty with the specific words chosen for analysis” (p.142). Those words that created the most problems were: pond and gopher. The most common strategy reported was to semantically reduce pond to water. An even stranger strategy was to produce pond of water, semantically overspecifying the word pond as if it did not already contain the information about a liquid, which is very likely to be water. In other cases lexemes from the same lexical field such as swamp, puddle, riverbed and ocean were given. The word gopher seemed even more difficult for the experimental group to access. The majority of participants offered lexemes denoting other small animals such as mole, skunk and squirrel. Lexemes which created virtually no difficulties for the experimental group, in contrast, were cliff, and jar. Frequently the American Israelis seemed to be aware that there was a more appropriate word for the context, and conducted an intensified (internal) search of their memory, but generally without success (the tip-of-the-tongue phenomenon). The control group, on the other hand, showed much less lexical variation in their storytelling, and either produced the expected lexeme or an acceptable alternative without any problems. Olshtain & Barzilay conclude that they have found evidence of attrition within the lexical domain, and that it seems to lead to (a) a more restricted stock of lexical items, and (b) a loss of specificity with regard to meaning.
2.1.3.3. Boyd & Andersson (1991); Boyd (1993) Languages involved The participants in the experimental group were all L1 American English native speakers in Sweden (with L2 Swedish). (Boyd also looks at L1 Finnish in Sweden but the results of this part of her study will not be reported here.) Participants There were 12 informants in the American group, who had all lived in Sweden for at least 10 years. They had mainly middle class occupations, and many used English

27
professionally e.g. as teachers and translators. The majority were married to Swedes and were well integrated into Swedish life. In Boyd & Andersson (1991:8) a control group of 4 monolingual Americans is also mentioned, but it is not clear what specific role they played in the study. Methodology Interviews (not further specified). Main focus of study In Boyd & Andersson (1991:3) the following are mentioned as questions to be addressed in the project: To what extent is the language shift observed in the 2nd generation of immigrants affecting the language of the 1st generation? Following Milroy’s work in the 1980s, how do the different patterns of social networks influence the degree of retention or attrition of L1? In Boyd (1993:386-7) the following additional points are raised: To what extent can the incorporation of Swedish lexemes into American English (including code-switching) be predicted? How systematic is it? Is there a hierarchy or some other universal principle at work? Findings In Boyd & Andersson (1991:16) it is reported that the Americans in Sweden seem to show greater variation in their placement of adverbials in English than the monolingual control group. This is mainly attributed to interference from the L2 Swedish. Overall the findings show that “their English is actually affected very little” despite the fact that eight of them have lived in Sweden for 10 years and “are highly fluent in Swedish” (1991:19). In Boyd the incorporation of Swedish elements into English is analysed where she reports finding mostly “single, semantically heavy items (especially Swedish compounds).” These “are not phonologically integrated”, and “tend not to be morphologically integrated” (1993:404). An example of such integration is “but there were I think four or five foreign lecturer tjänsts (positions)” (1993:401). Other examples cited are: “bostadsförmedlingen ‘the housing exchange’ and fortbildningsavdelningen ‘the department for further education’” (1993:403). Boyd concludes that the Americans have “a tendency to treat incorporations like (usually single-word) code-switches” (1993:406). The findings with regard to the social networks were that “the ones with relatively many English-speaking contacts, especially in the family, tended to deviate from the American norm of phonological and morphological non-integration of Swedish items” (1993:407-8). In other words, those American speakers with more social contact to fellow Americans than to Swedish speakers behaved differently from those who had equal or more contact to Swedish, providing further evidence for the importance of social networks in language retention or attrition.
2.1.3.4. Major (1992; 1993) Languages involved In this study Major has looked at L1 American English in combination with L2 Brazilian Portuguese.

28
Participants The experimental group consisted of 5 female native speakers of English who had emigrated to Brazil as adults. They were all college educated and had middle class backgrounds. Their ages ranged from 35 to 70 years of age and they had been living in Brazil between 12 and 35 years. They were at least 22 and no more than 36 years old when they emigrated. All of the subjects used English daily as they worked as English teachers and/or administrators in an English language institute. They all had Brazilian spouses and were well integrated into Brazilian society. There were also two control groups: 5 native speakers of Brazilian Portuguese living in Brazil and 3 native American English speakers living in the US. Methodology The five participants from the experimental group were asked to read English and Portuguese word lists designed to elicit voiceless stops in both languages. They were also asked to spontaneously make up sentences using the same words in both languages. In addition they engaged in an informal conversation in English with the author for around 30-45 minutes. The data from the word lists and sentences was considered to be formal (FOR), and that of the conversation to be casual (CAS). Main focus of study Major cites the following as his main hypotheses: (1) L2 influences L1 (2) L2 proficiency is correlated with L1 loss (3) Degree of L1 loss in a casual style is greater than in a formal style (4) L2 proficiency is correlated with a greater relative degree of loss of L1 in a casual
compared to a formal style (1992, 191-2). Findings The 5 participants vary quite considerably in their mastery of L2 Portuguese and their retention of L1 English. Referring back to the 4 hypotheses, it was found that the VOTs (voice onset times) of the English voiceless stops had changed in the direction of native Portuguese, thereby providing evidence for the first hypothesis, namely L2 influences the L1. A further finding was that L2 proficiency correlated with L1 loss, confirming the second hypothesis. However, here Major found a difference between the FOR and CAS styles: L2 proficiency correlates with loss of CAS but not with loss of FOR, suggesting it is possible to remain native-like in the formal style regardless of L2 proficiency. But high L2 proficiency will lead to attrition in more casual styles of English. The third hypothesis was also confirmed as all five participants showed greater attrition in CAS than in FOR. Major assumes this is because speakers are more able to monitor their L1 speech in a more formal style, and thereby suppress the influence of L2 to a greater degree (1992:202). The fourth hypothesis is also supported by the data as the speakers were more likely to lose CAS with increased L2 proficiency than to lose FOR. In his 1993 paper, Major mentions a further finding, namely that those “subjects showing the greatest loss in their native accent in English were those who approached native Portuguese more closely and closely identified with Brazilian culture” (1993:475), thus reinforcing what was said earlier (in 2.1.2.2.) about the importance of attitude for retention or attrition of L1.

29
2.1.3.5. Latomaa (1998) Languages involved In this project Latomaa has studied L1 American English in Finland, i.e. in contact with L2 Finnish. (It is not entirely clear whether this project is related to those of Boyd & Andersson (1991) and Boyd (1993) described above, but it is treated separately here, as the L2 differs in both cases.) Participants The experimental group consisted of a group of 30 American speakers in Helsinki, 15 women and 15 men. Their average age was 42.4 years old. They had been living in Finland for an average of 11.4 years, although nearly half had been there for less than 5 years. 25 of them were married to Finns, and the remaining 5 to other Americans. 76.7% had a university degree and the majority were teachers. Methodology They were interviewed about their social background, language use, social networks, and attitudes towards bilingualism, as well as their children’s social situation and language use. Main focus of study Latomaa cites the purpose of this project called “The Development of Immigrant Languages in the Nordic Region” as being “to document the current status of four linguistic minority groups – Americans, Turks, Vietnamese, and Finns – in the region, and in particular to predict their future prospects” (p.52). Findings The large majority of participants mentioned they had noticed changes in their language, which they themselves considered negative, such as word-finding problems and a loss of fluency. Other symptoms found were: L2 borrowings, especially for high-frequent, everyday terms, or words for which
no good English translation exists; changes to their native intonation, influenced by the L2; changes to their native body language, influenced by the L2. Latomaa concludes that although “a certain amount of L2 influence was detected in most of the informants’ language use” she would not want to classify this as L1 attrition, as “even a limited amount of L1 use seems to be enough to maintain L1 competence and (...) language fluency lost in adulthood is not permanently lost but rather stored away until called back to use” (p.69).
2.1.3.6. Porte (1999; 2003) Languages involved Porte’s study involves L1 English in Spain, i.e. in contact with L2 Spanish. Participants In the 1999 study there was a total of 52 participants. These were all EFL teachers, between 30 and 54 years old, who had been living in Spain for a minimum of 5 and a maximum of 26 years. 3 of these informants (who had been in Spain for between 15

30
and 24 years) also took part in the second study in 2003. These 3 all had Spanish spouses, and were well integrated into Spanish society. Methodology In 1999 the participants completed a questionnaire on aspects of residence, contact with L1 and L2, the evaluation of written work, and specific errors from students’ written work which the informants had adopted. In 2003 the 3 informants met for a total of three group conversations on familiar topics such as EFL teaching, university life, local politics, and a comparison of life in Spain and England. Main focus of study The 1999 study wanted to explore factors affecting L1 attrition and possible countermeasures. The 2003 study was interested in actual cases of performance deviance in the L1 and finding possible reasons for this. Findings In the first study most of the informants reported being aware of L2 interference in their English writing, and of doubts when marking students’ work. Porte comments (1999:31): “it could be suggested that incipient attrition might be affecting their error judgments.” Both the EFL teachers participating in the study and Porte himself suggest that these early symptoms of attrition could be due to the long period of residence abroad, in combination with exposure to deviant input from the students, who are L2 users of the teacher’s L1. Porte concludes by recommending that such EFL teachers should “be particularly alert to the potential consequences of L1 deterioration” (1999:34) and take various steps to help prevent such an outcome. These can include conscious maintenance efforts such as consulting other native speakers, reference books, etc., as well as trying to expose themselves to as much native-like L1 input as possible, for example through trips ‘home’, or using various media to read, listen to and watch English.
In the later study Porte found some evidence of deviance mainly in the lexicon of the participants. This was generally interference from L2 – various types of what Porte calls ‘code-manipulation’ (including code-switching, code-mixing and code-blending) (2003:105), although not as much as he had expected (2003:110). Code-mixing was the most common type of ‘manipulation’ found in the data, and especially nouns from the lexical field of education, e.g. “I have three or four actas (‘result sheets’) to do in a week in June” (2003:109). There were also a few examples of code-blending, where L2 verbs were inserted and blended with an L1 morpheme, e.g. “I was really shocked when I first saw how molested (molestar = ‘to annoy’) some teachers got at my criticising the system” (2003:112). Porte considers such code-manipulation to be (at least) a theoretical danger to the L1, as it can be a sign of diminished control, which could lead to an unconscious acceptance of such deviant forms.
2.1.3.7. Brown (2001) Languages involved This study involves L1 British English in the context of L2 Italian.
31
Participants The experimental group consisted of 5 adult native speakers of British English. All were women, aged from 32 to 50, who had been living in Italy from between 10 to 22 years. All had Italian husbands, and worked (at least part-time) as English teachers. Methodology 3-part interview consisting of a semi-structured interview composed of 40 questions, to collect background
information including perceived attrition and attitudes towards the L2 environment; a vocabulary exercise where the subjects were asked to read and translate 30
Italian words and 30 English words, and then make up sentences using the same words;
a freestyle interview where the subjects were invited to talk about an experience in their youth from the L1 environment, and one from their L2 environment.
Main focus of study The main aim of the study was to “discover if there was a correlation between the subjects’ attitudes towards the L2 environment and the amount of attrition which is present in their L1. A secondary aim was to see if there existed a correlation between the subjects’ L1 attrition and their L2 proficiency” (p.14). The areas analysed were: code-switches into Italian instances of Italian loanwords semantic transfer or calques (Brown calls them “false friends”) morphosyntactic transfer from Italian pauses / hesitations reflex responses, repartee and sound symbolism speed of delivery (p.24) Findings Brown found “considerable variation among the subjects with regard to the amount of attrition present in their L1 and their attitudes towards the L2 environment” (p.35). There were few code-switches into Italian and little evidence of morphosyntactic transfer from Italian. The instances of Italian loanwords varied considerably (between 5 and 31 cases) as did the use of semantic transfer (between 3 and 12 cases). The other three areas analysed were not compared to ‘normal’ unattrited speech (i.e. a control group) and yet the final two points i.e. reflex responses, repartee, and sound symbolism, as well as speed of delivery could be shown to correlate with the overall attrition score. The L2 proficiency of the five subjects did not show much variation with scores ranging from 34 to 50 points. Brown compared the L1 attrition and L2 proficiency scores with the subjects’ attitude towards the L2 environment and their length of residence (LOR) in the L2 community. LOR was shown to be related to L2 proficiency as would be expected, surprisingly though neither of these two factors was related to the degree of L1 attrition. This “was found to be strongly correlated to the subjects’ attitudes towards the L2 environment” (p.37), where a positive attitude corresponded with more attrition, and a negative attitude with higher retention, again highlighting the importance of such personal factors in this type of L1 attrition.
32
2.1.3.8. Gürel (2007) Languages involved Gürel looks at L1 English in the context of L2 Turkish. Participants The experimental group consisted of 15 native English speakers with a mean age of around 48. All had settled in Turkey as adults (between 18 and 32) and had been living there for between 10 and 35 years at the time of testing. None of them had been exposed to Turkish before emigration, and all worked professionally with English, either as lecturers at an English-speaking university, as language teachers, or in international companies. All had daily contact with Turkish, and 11 had Turkish partners. A control group of 15 native English speakers from America and Canada was also included. Methodology Two tests were used: a written interpretation task, where participants were given English sentences with
pronouns and reflexives and asked to select (a) possible antecedent(s) for both from options provided;
a truth-value judgment task, where participants were given 48 short Turkish stories and asked to decide whether a following English sentence could be ‘true’ or ‘false’ in the context given (p.110-1).
As monolingual speakers, the control group were only asked to perform the first task. Main focus of study Gürel is interested in “the issue of selectivity in first language (L1) attrition of syntax by investigating the effects of L2 Turkish binding properties of reflexives and pronouns in the L1 English grammar.” Her aim is to “explore linguistic and psycholinguistic factors that affect interference-dependent syntactic attrition” (p.99). The theoretical framework is based on the distinction between [+interpretable] and [-interpretable] features in the interface between syntax and the conceptual/intentional cognitive systems as proposed in Chomskian theory (p.101). Findings The analysis of both tests “revealed no evidence for L2 Turkish influence in the L1 English grammar” (p.117). Although a previous study from 2002 had “demonstrated L2 English effects in the L1 grammar of Turkish native speakers living in North America, the same L2 effects were not found in the L1 grammar of native English speakers living in Turkey” (ibid.). These studies are particularly interesting in that the same languages have been examined, both as L1 and as L2 (i.e. L1 Turkish with L2 English, and L1 English with L2 Turkish). Gürel interprets the conflicting findings between the two as being related to use – the L1 English speakers had much more opportunity to use their language in Turkey than did the L1 Turkish speakers in North America, and therefore were better able to retain their native-like proficiency.

33
2.1.3.9. Summary of the studies carried out on adult non-pathological attrition of L1 English
Four of the studies cited above involve American English as an L1, one of them looks at British English, and in the other three it is either not explicitly mentioned which regional variety of English is concerned, or a number of different varieties are included in one study. Despite the differences between these varieties, the initial prediction, i.e. that we will not find a great deal of attrition, should presumably hold true for all major varieties of English, and therefore the specific type of L1 English is only expected to have a negligible impact on the results. The designs of these studies are quite diverse, with between 5 and 52 subjects, who had been living in the L2 environment for less than 1 or up to 35 years when tested. They had all left the L1 environment as adults, and were between 23 and 70 years old at the time of testing. Of these studies, three mention a small or medium-sized L1 control group (N=3–15), and five do not seem to have consulted one. The methodology used also varies quite considerably, ranging from questionnaires to tasks involving specific truth-value judgements, via interviews, various vocabulary exercises, and ‘story telling’, which makes a comparison extremely difficult, if not impossible. Clyne reports finding mainly semantic and morphological transfer from the L2 to the L1, which seems to predominantly affect individual lexemes, and is therefore difficult to distinguish from what others might call ‘problems with the lexicon’. He also claims that the findings correlate with exposure to native English, in that those speakers who have most contact with other multilinguals will tend to display more L2 transfer in their speech than those who only (or mainly) interact with monolingual speakers of their L1. Olshtain & Barzilay found a few word-finding problems in their data, particularly when the participants were required to produce very specific lexemes, with certain semantic features, but otherwise no signs of attrition. Boyd & Andersson, and Boyd, found some effects on word order (adverbial placement), assumedly influenced by the L2 grammar, and some code-switching, but again otherwise an intact L1. They also discovered that those speakers with less L1 speakers in their social networks code-switched in a different way to those with more contact to other L1 speakers. Major’s study is the only one to focus on a phonetic aspect (VOT of voiceless stops) and reported that these had converged in L1 and L2, resulting in both languages sounding less native-like. He was also able to show that different registers or styles of language suffer to varying degrees: what he termed FOR (formal style) was less affected by a high L2 proficiency, than the CAS (casual style). He also correlated these findings with attitude, reporting that those speakers who identified most closely with the L2 as a language, and as a speech community/ country, showed most signs of L1 attrition. Latomaa found mainly lexical (word-finding) and phonological problems (intonation), but also changes to body language, all of which were assumed to be influenced by the L2. She, however, did not call her findings ‘attrition’ as she felt they were too mild to seriously affect the language, and would disappear should the speaker return to an L1-speaking environment. Porte’s two studies again found interference from the L2, particularly in the area of the lexicon, and other problems regarding grammaticality judgements, suggesting that the speakers’ native intuitions were being undermined by the L2. He also suggests a number of practical tips to help maintain the L1 in an L2 environment, which are especially relevant for the situation of EFL teachers. Brown’s study is the only one which explicitly mentions British English, and she has the smallest number of participants. She found a number of cases where the L2 had interfered with the L1,
34
mostly involving the lexicon, but also a very few affecting morphosyntax. She was also the only researcher in this group to consider more pragmatic characteristics (as discussed by Waas, 1997) and found these to be influenced by the L2, as well. Like Major, she was able to show that attitude correlated with the degree of L1 attrition measured, i.e. a positive attitude towards the L2 environment corresponded with a higher degree of L1 attrition. Gürel was the only person who was interested in a very specific feature of the L1 syntax, within a specific linguistic (UG) framework. She was also the only person to find no evidence of L2 influence in her data, suggesting that English morphosyntax is an area little affected in this type of L1 attrition.
2.1.4. Conclusion
So what has our review of the literature on attrition, and adult non-pathological L1 attrition in particular, taught us so far? We have learned that such a phenomenon does indeed seem to exist, even if it does not manifest itself in dramatic language problems. In L1 attrition, it seems to be the lexicon which is affected earliest and most severely, although even here the main symptoms are word-finding problems, which again only seem to apply to a certain section of the lexicon in that some lexical items simply appear to be more vulnerable than others. Another aspect of this problem, however, that is not generally discussed in the literature, but should be mentioned here, is the question of lifelong learning. We are all aware of the fact that, even if the grammar of an L1 is largely mastered by (late) puberty, our vocabulary is constantly being expanded, both in the sense of learning new lexemes, but also by extending the range of existing lexemes. So, even if we are very careful to only look at L1 attrition in adults, thereby supposedly avoiding the whole question of incomplete acquisition (as in children), with regard to the lexicon, it is probably nonetheless true to say that part of the lexical problems we are observing could simply be traced back to an adult not having acquired a certain lexeme before emigration. This could lead to the individual exhibiting symptoms which we are classifying as L1 attrition, although this is, in reality, also a type of incomplete acquisition. There seems to be no easy solution to this problem, as we can never be entirely sure which lexemes were part of an adult’s active or passive vocabulary before emigration, and which were not (– even if we carried out extensive longitudinal studies before and after emigration, which are very rare). The best we can probably do is to be aware of such facts, and be a bit more cautious about how we analyse lexical problems. A good example would be cases where women have only experienced pregnancy and birth in the L2 environment, and in the process have become acquainted with all the relevant L2 terms. In my view it is not correct to call it attrition if these women have subsequent problems talking about such topics in the L1, because they have simply never acquired the vocabulary in this language. And, as said earlier, you can only lose what you have already learned. It seems likely that the reported fluency problems are also, at least partly, linked to these word-finding problems, as the speakers are consciously having to try and retrieve certain lexemes from their memory, which is simply taking more time due to a lack of practice. Altogether, active production, in particular, gives the impression of being generally slower and more interrupted by pauses than in native controls. Pragmatic attrition is a feature not often reported, probably because it is simply not often the focus of attention in studies, but also seems to be able to suffer in L1 attrition. (Even body language can suffer attrition as reported by one source.) The

35
areas of phonetics and phonology (e.g. accent) and grammar (morphosyntax) appear to be less affected by L1 attrition, or maybe they only suffer in more ‘extreme’ cases. Comparing these findings to those mentioned most often in the studies of adult non-pathological attrition of L1 English presented above, we find a great deal of agreement. Here, the lexicon is also often reported as showing signs of attrition (especially specific word-finding problems, code-switching, and various transfer phenomena), largely influenced by the L2. Other problem areas reported in the studies above are pragmatics (including reflex responses, repartee and sound symbolism), phonetics (VOT), and phonology (intonation). Grammar was not found to be negatively affected in the very specific study by Gürel, however Porte’s EFL subjects reported feeling less secure in their native intuitions regarding grammaticality, suggesting that this area can also be affected, albeit possibly in a more subtle way. Turning our attention back to what was said earlier about the various predictor variables, we concluded that the major factors which had been identified as correlating with L1 attrition were contact or use, education, and attitudes or motivation. Here, it was also said that the only one of these which seems to have a direct impact is contact or use; the others seem to work more indirectly through this factor on the language. The studies presented above do not always explicitly mention such factors, but those that do, tend to agree with the general findings. Boyd’s discussion of social networks is a different way of viewing contact, and it comes as no surprise that this is shown to have an effect on the L1. Major and Brown, on the other hand, found attitudes to be the decisive factor affecting L1 attrition in their participants. Maybe it would be fair to conclude by saying that, although L1 attrition of English in such healthy adults is especially unlikely to happen, for the simple reason that contact to English is almost globally available, if attrition becomes visible, the symptoms are comparable to those shown by other languages. The following figure attempts to draw these findings together and represent non-pathological types of attrition in adults and children, both in L1 and L2. We can see how proficiency and age affect attrition in a similar way, i.e. both low proficiency and low age tend to coincide with more serious problems, or loss, suggesting that it is proficiency rather than age which is the deciding factor. (In L2 attrition, for example, adults with low proficiency will suffer more problems/‘loss’ than children with a high proficiency.) As proficiency (and, in L1, age) increases, attrition becomes less severe. We can also see how the various factors contact / use, motivation and education affect (non-pathological) adult L1 attrition.

36
L1 / L2:
(very) low proficiency
medium proficiency
high proficiency native(-like) proficiency
L1: (very)
young children
older children (pre-puberty)
adults: language = non-practised (i.e. little contact / use), low(er) motivation, low(er) education level
adults: language = practised (i.e. more contact / use), high(er) motivation, high(er) educational level
(very) serious
problems/ ‘loss’
less serious
problems/ ‘loss’
few problems
(virtually) no
problems
Figure 2: Non-pathological types of attrition
2.2. Language and the brain
As Loraine Obler so succinctly wrote (1982:60): “At base, it is the brain which must acquire, maintain, or forget language.” In my opinion, this simple truth provides sufficient motivation to not ignore psychology and neurology in this account. In the next three sub-chapters the following topics will therefore be briefly discussed and their relevance to the topic of attrition explored: neural plasticity, different types of knowledge/memory, and forgetting.
2.2.1. Neural plasticity
Generative linguistic theory is largely based on adult native speakers and their intuitive knowledge of L1. Within such theories, it is generally assumed that the linguistic competence which the adult has acquired in his/her first language will remain stable for life. Until quite recently such assumptions were largely supported by neurobiologists who “assumed that brain cells and wiring change very little after puberty, when the final form of the adult brain has taken shape” (Bownds, 1999:134).
This is presumably (at least part of) the reason why it became conventional, in the field of Second Language Acquisition, to talk of an ‘end-state’ in language acquisition, suggesting that the process of acquiring a language would simply be complete at some point. (Although it is not suggested that the ‘end-state’ would automatically be native-like proficiency. In fact, due to phenomena such as fossilization, speakers very rarely become as proficient in the L2 as in the L1.) Such assumptions have had to be rethought in recent years, however, as “an enormous amount of evidence uncovered in the past two decades finds that the brain never

37
stops changing and adjusting” (sfn, 2000). As Neath & Surprenant explain (2003:164) this “idea that a neuron can change as a result of experience, either structurally or functionally, in a way that is long lasting” is called plasticity.
Neural plasticity as such, of course, is by no means a new invention. All learning and memorizing involves some kind of change to brain structure, assumes a ‘plastic’ brain. The spectacular finding, therefore, is not that plasticity exists at all, but that it seems to continue to exist in the adult brain – although probably in a diminished form. Bownds (1999:138) discusses the limits of plasticity, and concludes:
The picture that has emerged so far is of critical periods during development when major pathways that regulate sensing and acting are laid down and can be modulated. Then, in adult brains, there is an ability to fine-tune these pathways if sensory or motor demands change.
This idea of a critical period is certainly not new to linguistics (see for example Singleton & Ryan, 2004, for a recent discussion) and would suggest that if someone has learnt a language (the L1) as a child, that person would be able to ‘fine-tune’ the information later in life, for example by adding a further language (L2), or adjusting the L1 to any changes in circumstances. Both of these events tend to occur when a speaker moves to an environment where a new language is spoken, i.e. migrates, which is the typical starting point for (non-pathological) L1 attrition.
Neural plasticity in the adult brain is therefore an important theoretical prerequisite for the discussion of L1 attrition in adults – it gives our argument some much-needed biological support, as well as a credible explanation for the observation that even a language once perfectly mastered can somehow deteriorate if the circumstances change.
2.2.2. Different types of knowledge / memory As Baddeley (1997:3) writes, memory “is not one system but many.” Here, the different types of memory which are assumed to exist will be briefly presented, and we will discuss in what way this information can help our understanding of the phenomenon called language attrition.
Psychologists distinguish a number of different types of memory. Neath & Surprenant (2003:7) for example list the following in a table: sensory memory, immediate memory (also known as short-term memory or STM), generic memory (also known as long-term memory or LTM), autobiographical memory (also known as episodic memory) and generic memory (also known as semantic memory).
For our account of L1 attrition in adults, sensory memory and STM are of little importance, as the linguistic knowledge of such speakers is assumed to have been rehearsed enough that it is (mostly) stored in LTM. Neath & Surprenant (ibid.) describe the LTM as containing “information to be retained indefinitely.” Bahrick (1984:110-11) even goes so far as to introduce the term ‘permastore’ or ‘permastore-content’ to describe information, and defines this as “the portion of knowledge with a life-span in excess of twenty-five years.” It is not entirely clear whether he means this in the sense that all knowledge in the LTM should fall under this heading or only a portion of it, but that need not bother us further here. The salient point for us here though is that it can be assumed that well-rehearsed knowledge (such as the L1 in adults) can be expected to remain in our long-term memory ‘indefinitely’.

38
“[L]ong-term memory can be divided into procedural and declarative memory. Procedural memory is assumed to contain the ‘how’ and declarative memory the ‘what’ (...)” (Pishwa, 2006:6). This distinction is one which has a direct bearing on our account of attrition, and will therefore be expanded upon below. Declarative vs. procedural knowledge / memory Two important terms were introduced above: declarative and procedural memory, which are both examples of long-term memory. Some typical examples of procedural knowledge are: “the ability to play a musical instrument by ear” (Paradis, 2004:9), or “automatized abilities, such as walking, driving, and speaking” (Pishwa, 2006:6). Examples of declarative knowledge are “one’s knowledge of geography and chemistry, but also knowledge of what one had for breakfast in the morning” (Paradis, 2004:9). These two different types of declarative information are called semantic (world knowledge) and episodic (personally experienced events) respectively. Semantic knowledge, as a sub-type of declarative knowledge, is also relevant for linguistics, as “lexical knowledge, including the sounds and meanings of words” (Ullman 2005:148) is assumed to be stored here. Procedural memory, in contrast, is assumed to play a role in morphology, syntax and phonology (cp. Ullman 2005:149).
This declarative/procedural distinction interacts to a certain degree with the explicit/implicit distinction, whereby explicit is assumed to mean knowledge of which individuals are consciously aware and which they can repeat to others, e.g. lexical knowledge (such as the meaning of lexemes), and implicit is knowledge of which individuals are not consciously aware and which cannot be passed on to others, e.g. when which plural allomorph is to be used: [s] or [z]. (The exception here, of course, would be individuals who have undergone some linguistic training and have learned the rule for these allomorphs – this training would, though, by definition be explicit, and lead to explicit knowledge, in addition to the implicit knowledge a native speaker of English would have acquired naturally.)
So, why is this interesting for attrition research? Well, the answer has to do with how well these different types of knowledge (declarative and procedural) are retained. Quite a bit of research suggests “that declarative knowledge is more vulnerable than procedural knowledge, because knowledge in the declarative stage is less well integrated, or has fewer and less connections with other types of knowledge” (de Bot 1999:351). This would mean that the lexicon would be more likely to deteriorate in cases where opportunities for rehearsal are reduced (e.g. when speakers migrate to a different country and have little chance to practise their L1) than for example morphology, syntax or phonology – which, as mentioned above, are assumed to be situated within procedural memory. As already mentioned further above during the discussion of the various features of adult non-pathological L1 attrition (see 2.1.2.1.), the lexicon has indeed been reported to be the single most vulnerable area of language, thereby confirming this prediction from the neurosciences. Another reason why the lexicon, above all, should show most signs of attrition, is explained in more detail below (see 3.1.1.) where two neurolinguistic theories assume that languages will interfere with each other to a larger extent if they contain similar items. We know that, on the whole, second language acquisition becomes increasingly more difficult the older the acquirer is, even if we do not want to assume a critical ‘cut-off’ period (such as that proposed by Lenneberg, 1967). One of the reasons for this is assumed to be that the procedural learning system is no longer as available to an adult as it is to a child, meaning that a second language

39
learned in adulthood has to be largely processed by the declarative system, which is less efficient (leading very often to non-native-like proficiency). If the second language is largely stored and processed by the declarative system, and if similar items can interfere with each other, then we would expect the second language to affect the L1 lexicon, which is also stored in the declarative system, rather than other areas of the language, which are stored in the procedural system. In more highly proficient (near-native) L2 users, however, the L2 grammar is also more likely to be part of the procedural system and maybe it is at this point that the L2 is also increasingly able to interfere with the L1 grammar and phonology, which are also procedural. For a number of reasons, therefore, and on the basis of neurological research, we can predict that the lexicon, as an example of declarative knowledge, is most likely to be vulnerable in early stages of L1 attrition. But, in more advanced stages (and in more advanced L2 users) we could expect an impact on the L1 morphosyntax and phonology as well.
2.2.3. Forgetting “Language attrition is a kind of forgetting” (Ammerlaan, 1996:1). So far we have discussed language as belonging to two different sub-systems of long-term memory, defined as information which is retained ‘indefinitely’ or, as in Bahrick’s ‘permastore’ for at least twenty-five years. The rather obvious question, therefore, seems unavoidable at this point: Why should information in LTM become ‘lost’? Or does it not become lost, and there is some other reason why speakers, after many years in a foreign country, can often no longer find the right words or idioms, use the right tense, or move their articulators in such a way as to produce the right accent, etc., in other words generally seem to ‘forget’ their native language? In a footnote, Paradis claims this “is a general condition of neurocognitive functions that when they are not being used, they become more difficult to access over time and eventually atrophy” (2007:125). He adds: “While this is more apparent for declarative memories, it is also true of skills subserved by procedural memory.” So declarative memory is in fact vulnerable on two fronts: not only is it more likely to suffer interference from the L2 (because this, too, is largely declarative knowledge), but it also seems to require more regular practice. Again looking at our case of an adult L1 speaker living in an L2 environment, we could therefore expect that even knowledge in LTM will deteriorate if not rehearsed. But why should this be? First of all we must acknowledge that “forgetting is actually a very useful attribute of the human memory system” (Baddeley 1997:5). It is the brain’s way of spring-cleaning, if you like, or to put it more technically: “The process of forgetting is one whereby the important features are filtered out and preserved, while irrelevant or predictable detail is either destroyed, or stored in such a way that it is not readily accessible in its original form” (ibid.). Forgetting is therefore a perfectly normal and useful consequence of neural plasticity, where the brain periodically adjusts its contents to the individual’s needs. Of course, this is not much consolation to those L1 speakers living in a foreign country, who want to maintain their language, but are unable to practise it often. So what exactly happens to information in forgetting? A number of researchers from psychology and linguistics (see for example de Bot, Martens & Stoessel, 2004; Neath & Surprenant, 2003; Weltens, 1989) refer to

40
Ebbinghaus as the first person to turn his attention to the question of forgetting, and who in 1885 published a study carried out on the retention and forgetting of nonsense syllables. The ‘forgetting curve’ he found shows that the largest drop in performance, i.e. in remembering, occurs immediately after learning, and within hours large portions of information can be forgotten. After around 2 days, however, the rate of forgetting stabilizes and very little more is lost in the next 30 or so days. We therefore have very fast forgetting initially, which then slows to a thin trickle within a few days.
0
10
20
30
40
50
60
70
1 3 5 7 9 11 13 15 17 19 21 23 25 27 29 31
Time (days)
Perc
ent s
avin
gs
Figure 3: Ebbinghaus’ forgetting curve (adapted from Neath & Surprenant, 2003:18) de Bot, Martens & Stoessel state that “there is a wealth of more recent empirical data to show that Ebbinghaus’s curve describes retention of lexical knowledge correctly” (2004:374). So it is not just a curve showing how well nonsense syllables are remembered but seems to be applicable to lexical (i.e. declarative) knowledge in general. In 1984 Bahrick published the results of a study on the retention of L2 Spanish over a period of 50 years. He was also able to show that “a portion of the knowledge acquired in Spanish classes is lost within a few years after training, but the remainder is immune to further losses for at least a quarter of a century, and much of that content survives for fifty years or longer” (1984:110-11). His forgetting curve resembles that of Ebbinghaus but, after a plateau in the middle, it shows a further decline in retention after around 25 years. He suggested the term ‘permastore’ for such knowledge (see also 2.2.2. above). Neisser criticizes Bahrick’s notion of a ‘permastore’ as suggesting “a kind of mental fallout shelter, a place in the mind set aside for the storage of genuinely invulnerable information”, but also agrees that “some response strengths reach a critical threshold during learning; beyond that threshold, they become immune to interference or decay” (1984:33). Arguably, though, the most intriguing finding from Bahrick’s study is that many of the L2 speakers had retained their knowledge of the language although they had hardly rehearsed it in the meantime. Bahrick concludes: “Our results show that significant

41
portions of semantic knowledge remain perfectly accessible for several decades without being used at all” (1984:114). This again suggests that some areas of the lexicon are more (or less) vulnerable to the effects of L1 attrition than others. Weltens (1989:12) has two graphs showing retention curves, the first resembles Ebbinghaus’ curve and the other is almost a mirror image with an initial plateau followed by more rapid forgetting. time time (a) (b) Figure 4: Two possible retention curves (adapted from Weltens, 1989:12) Weltens (ibid.) suggests that the first curve (a) could fit the pattern of L2 attrition in less proficient L2 users, and the second one (b) could apply to those with a higher level of L2 proficiency. The question, therefore, would be whether both curves show retention of declarative knowledge which simply differs with regard to its level of rehearsal – (a) is less rehearsed than (b) – or whether the two curves might be showing completely different sorts of knowledge, for example declarative in (a) and procedural in (b)? Applying these ideas to L1 attrition, it does not seem too far-fetched to equate our L1 users with the highly-proficient L2 users and predict that curve (b) could also represent lexical L1 attrition. In other words we could expect an initial plateau period where little would happen and then more or less sudden decline. Unfortunately many studies report exactly the opposite in L1 attrition, claiming that language problems start occurring in the first few years after emigration, and then stabilize. (See for example de Bot & Clyne, 1994, de Bot & Hulsen, 2002, Hutz, 2004, as well as the discussion in 2.1.2.1.) So, Ebbinghaus’ forgetting curve does seem to predict the facts in L1 attrition better, even if the initial drop is not as dramatic when compared to L2 attrition (or the attrition of nonsense syllables). The question remains, therefore, what exactly graph (b) could be showing us. The most likely interpretation in my view is that (a) represents the forgetting of declarative knowledge, either the L1 or L2 lexicon, or the L2 grammar in a less proficient user, and (b) procedural knowledge, such as L1 morphosyntax and phonology, which seem to be retained longer. An alternative reading could be that the two graphs are in fact two halves of the same curve, where (a) shows early decline followed by a plateau, and is followed by (b) where we again see the plateau followed by a later decline, as observed by Bahrick. Although a number of individual factors have been identified, psychologists are still working on a global theory of forgetting. Ignoring all consequences of brain damage – whether caused by injury, aging, or other means, and concentrating solely on healthy adults – there seem to be three main candidates to explain how knowledge in long-term memory can be forgotten: trace decay, interference, and retrieval failure.
rete
ntio
n
rete
ntio
n

42
Trace decay The first of these theories: trace decay predicts that “memory traces fade spontaneously” (Baddeley, 1997:178). This would lead to actual loss of information, something that the majority of psychologists seem unwilling to assume, although they do not completely rule it out either. Neath & Surprenant, for example, write: “The question of permanent loss versus temporary lapse is an important one, but it is difficult if not impossible to answer” (2003:136), and Weltens adds (1989:18) “the so-called decay theory or trace-fading theory (...) has been shown to have only very limited explanatory value, if any at all (...).” This uncertainty is also mirrored in the linguistic discussion of whether L1 attrition is a competence phenomenon or only affects performance. Trace decay would seem to assume a change in, or loss of, competence, which would obviously be a much graver problem. Interference theory Interference theory, on the other hand, seems to enjoy greater favour with psychologists today. Originally proposed by John McGeoch in 1932, it suggests that “people forget an event because something else they have learned prevents the event from being remembered” (Loftus & Loftus 1976:74 in Weltens 1989:19). This can either happen when new information interferes with old, or vice versa – in other words, interference can take place in both directions (and psychologists use the terms proactive and retroactive interference for these two possibilities). For example, again looking at our particular case of L1 attrition, L2 linguistic knowledge could interfere with similar knowledge in the L1 (for example because both are stored and being processed in similar areas), causing problems with L1. This theory treats L1 attrition as a pure performance problem, leaving competence intact. Retrieval failure The third theory presented here is retrieval failure, which assumes knowledge is intact but temporarily inaccessible for various reasons, such as competition between similar items in different languages. Loftus & Loftus (1976:78 in Weltens, 1989:19) liken forgetting in this account to “being unable to find something that we have misplaced somewhere.” With “the right retrieval cue, the information we seek could be successfully retrieved” (ibid.). For L1 attrition, this theory would mean that we are again talking about a less serious, and non-permanent problem which only affects performance rather than competence.
2.2.4. Conclusion Summing up the discussion of the previous sections, it has hopefully been shown that taking a look beyond the borders of linguistics (in this case into psychology and neurology) can enhance the discussion in interesting and beneficial ways, and increase our understanding of the phenomenon. So what have we learned about attrition from these fields? Well, relatively recent research showing that the adult brain still exhibits neural plasticity allows us to assume that changes even to mature linguistic systems are possible, a prerequisite for studies into attrition. We have further seen that the lexicon, as an example of declarative knowledge, should be more susceptible in the early stages of L1 attrition than procedural knowledge, as exemplified by morphology, syntax and phonology (which could, however, also be affected later in the process). The findings from research on forgetting and the

43
various ‘forgetting curves’ presented in the literature should offer promising opportunities to predict retention and loss, but the picture seems to be quite complicated, as we find different patterns of retention, possibly applying to different sorts of knowledge (declarative vs. procedural) or to different degrees of language proficiency (within declarative knowledge). This point is also raised by Neisser who states that “the time course of forgetting and the point at which the Bahrick function levels off should differ for different kinds of material, and especially for domains with different structural characteristics. There should not be just one forgetting curve, but many” (1984:34). This suggests that we need to distinguish the types of knowledge we are investigating more carefully, and also need to find out more about how, for example, different lexical items are retained or lost, and which type(s) of grammatical knowledge are more vulnerable than others. Psychological theories of forgetting are, unfortunately, also only helpful to a certain degree, as there is still disagreement on which of at least two competing theories should be the theory of forgetting. Nevertheless, both of the favourite candidates assume that information does not actually disappear once it has been learned, but rather that it simply becomes difficult to access, either because other information interferes with it, or due to other retrieval problems. This means that psychologists would assume attrition to be a performance rather than a competence problem, which could theoretically put an end to a long-lasting debate on the question among attrition researchers.
2.3. (Linguistic) theories of attrition In this section some of those linguistic theories will be briefly presented which are often cited in the literature as ways of describing and explaining (particularly first) language attrition. They range from pure linguistic theories such as GB (Government & Binding), MP (Minimalist Program) and ‘Simplification’ to more psycho- or neurolinguistic accounts such as ATH (Activation Threshold Hypothesis). Such accounts can, however, never be more than part of the whole picture as they offer language-internal explanations only, largely ignoring any external factors which may affect how multilinguals use their languages, such as motivation and attitude as mentioned further above. In addition to these, therefore, a socio-psychological theory: CAT (Communication Accommodation Theory) will be discussed which aims to shed more light on the influence of such language-external factors.
2.3.1. Regression theory The first theory we will be looking at is known as ‘Regression theory’, although it is actually at least two related theories. The main idea behind this view is that language acquisition and attrition are in fact two sides of the same coin, or mirror images of each other. Looking at first language acquisition in a naturalistic setting, we can identify a certain order of acquisition, or predict, to a certain degree, what a child will acquire in which order. By way of illustration, Brown (1973, cited in Clark, 2003:194) presents an order of acquisition for 14 grammatical morphemes (for the L1 acquisition of English), starting with the inflectional verb affix –ing, moving on to the prepositions in and on and the regular noun plural affix –s, before finishing with contractible copula and auxiliary verbs such as –‘s (for is) or –‘re (for are). This

44
means that a child is following a relatively predictable path, enabling him/her to constantly build on and extend already-acquired linguistic knowledge. Attrition, then, in this view, involves going back down the same path, but in the opposite direction; it is a kind of ‘unlearning’ of linguistic knowledge. There are at least two competing versions of regression theory to be found in the literature on attrition. The first, and earliest, version comes from Ribot, who in the 1880s proposed “what has since come to be called “the rule of Ribot”, which holds that language loss is a regression, the most recently acquired features being the most vulnerable” (Berko-Gleason, 1982:17). (This is often shortened to the more colloquial phrase: ‘last in, first out’.) Roughly ten years later a slightly different version of this model was put forward by Pitres “who held that the best-learned forms, whether learned early or late, should be the least vulnerable” (ibid.). Of course, the two will often overlap as those language features acquired first will often also be the best-learned, but the two are at least theoretically separate notions. The third name to be associated with regression is Roman Jakobson, who in 1941, investigated aphasia (pathological language attrition) and claimed “that the developmental sequences in acquisition are the mirror image of sequences in aphasic loss” (Sharwood Smith, 1989:186). Unfortunately, no study to date has found convincing evidence for this theory in non-pathological language attrition, whether for an L1 or an L2, although Keijzer, in her dissertation on L1 attrition of Dutch, reports finding “one of the most consistent regression patterns (...) to date” where “nine of the fifteen linguistic features (...) revealed significant parallels between the language acquirers and attriters” (2007:266). Concluding, it seems fair to say that regression, as an explanation for attrition, remains interesting, mainly because it treats acquisition and attrition as being related phenomena, something which many researchers nowadays seem to assume (cp. Sharwood Smith, 1989:186). Unfortunately, it has, so far, not been able to explain the linguistic data on (first) language attrition in any reliable and global sense.
2.3.2. Chomskyian theory
Under this heading are subsumed Chomskyian syntactic theories (especially GB = Government and Binding, and MP = Minimalist Program), which are not specific theories of attrition (or acquisition), but some researchers working within such frameworks have applied them to attrition data, generally on the assumption that attrition can only benefit from such a solid theoretical background, which it at present lacks. Studies conducted within such theories generally concentrate on one very specific feature of language such as “the domain of grammatical subjects in Greek and Italian. More specifically, (...) on the production and interpretation of null and overt subjects, and of preverbal and postverbal subjects” (Tsimpli et al., 2004:257), or the “binding conditions of overt and null pronouns in pro-drop L1 Turkish under the influence of non-pro-drop L2 English” (Gürel, 2004a:226). Each language combination and each linguistic feature needs to be investigated individually within such a framework as the findings from one study cannot necessarily be applied to any other. Concluding, we can probably say that Chomskyian theories are interesting for attrition in so far as they are well known and quite widely accepted in linguistics, and

45
also enable researchers to make relatively explicit predictions about data. The downside, however, is that they are so specific, and can only be applied to grammatical anomalies (rather than, for example, lexical or phonological deviation) and can, therefore, always only explain a small portion of the symptoms observed in (first) language attrition. It is also a purely linguistic theory in that it ignores external factors or individual variation.
2.3.3. ‘Simplification’ This theoretical framework is closely linked to the more general idea of ‘markedness’ in linguistics, which differentiates between marked and unmarked forms in various areas of language e.g. author (the unmarked form) and authoress (the marked form) in the lexicon. The marked form can differ from the unmarked form in a number of ways, such as (in the case of authoress): it has more restricted reference (only female authors), it has an additional suffix: –ess (i.e. more morphological complexity), and it is less frequent in language use. ‘Simplification’ as a theoretical explanation of language attrition assumes that in multilingual contexts a more unmarked (and less complex) variety of the language under attack may emerge, meaning that we should be able to predict which specific areas of the language will attrite, and what the effects of attrition will be for each language combination. Seliger (1989, 1991) and Vago (1991) are two researchers who have claimed such a mechanism to be effective in attrition. Seliger, for example, formulated the following principle of redundancy reduction (1989:173):
If both languages contain a rule which serves the same semantic function, that version of the rule which is formally less complex and has a wider linguistic distribution (i.e. can be used in a greater variety of linguistic environments) will replace the more complex more narrowly distributed rule. That is, in the case of L1 attrition, simpler, more widely distributed rules from L2 will replace those from L1.
Researchers working within this framework tend to concentrate on grammatical attrition, and in fact Seliger and Vago are both able to show in their studies how the L2 has impacted on the more complex L1 grammatical system, and simplified it in some way. The major problem with these studies, however, is that they are all examples of child attrition (i.e. incomplete acquisition of L1), and the question remains whether such profound changes can be expected in adult non-pathological L1 attrition, too. Those sources which have found evidence of L1 attrition in adult grammar have emphasized the importance of “analogous forms” (Gürel, 2004b:60), or “grammatical distinctions that are (...) shared by both languages” (Andersen, 1982:96), claiming that these are the most vulnerable areas of grammar, and supporting the claims mentioned above. Ammerlaan et al. (2001:9) also write that “language attrition is commonly viewed as involving the loss of structures, moving from synthetic to analytical”, offering further evidence for a ‘simplification’ process. Clyne also has some insightful comments to make on this subject, agreeing that “features of L1 that are more marked (...) tend to be lost in a language contact situation” (1992:19). Later, he expands further on this statement, and adds that “a less complex system is more likely to undergo further simplification than a more complex one” (ibid.:23) which is particularly interesting as it would suggest that in a language contact situation between say English and German, English – as the less

46
complex language – is more likely to be simplified than German (ignoring all other factors which may influence the outcome).
In summary, we can say that findings from adult L1 attrition seem to be consistent with the claims made by Seliger and Vago, suggesting that such a phenomenon may be quite universal in such language contact situations, albeit probably less common in adult L1 attrition than in child L1 attrition. One final uncertainty, however, remains, and that is the question of whether it is possible, in each individual case, to show that systematic rule simplification is behind cases of grammatical attrition, or just a more unpredictable, general L2 influence, especially when the L2 under consideration is very often English, which is typologically analytical, i.e. less complex.
2.3.4. Activation Threshold Hypothesis (ATH) This neurolinguistic theory has been proposed by Paradis (1985, 1993, 2004, 2007) and aims to explain how languages are processed by humans, particularly in multilingual settings. The basic idea is that linguistic items can become more or less available to a speaker depending on how often they are activated (i.e. their frequency), and how recent the last activation was (i.e. their recency). Each linguistic item (i.e. lexical items but also grammatical constructions etc.) has an activation threshold, which Paradis defines (1993:137-8) as “the propensity to be activated”, and which varies “as a consequence of its recency and frequency of use” (2004:29). Activation is achieved through “a sufficient amount of positive neural impulses” (ibid.:28), meaning that an item will be activated if the impulse passed on from other neurons is strong enough, and will not be activated if the impulse is too weak. The activation threshold is constantly changing, being lowered by activation, and then rising again until the next activation, therefore there will be times when it is more or less easy to activate a specific item, again depending on how often and recently it has been activated in the past. A low threshold means that a linguistic item is more accessible (and needs less impulses to be activated) than a high threshold. This pattern is claimed to apply to whole languages, but also to items within one language, such as very infrequent lexical items, which is why these can be more difficult to activate than frequent ones. Activation is required both in active production and passive recognition or recall of language, and Paradis predicts a difference between these two processes. He says (1993:137) that “comprehension and production are subserved in part by the same neural substrate, but that it requires more impulses to voluntarily self-activate a trace (...) than to activate it with external stimuli.” This means that comprehension (involving external activation) will be less affected by a high activation threshold than production (requiring self-activation), and it will, for example, be easier to recognise and understand items in an L2 or L1 which we haven’t used for some time, than to actively produce those same structures. One further mechanism in ATH which should be mentioned at this point, and which is particularly important for our multilingual setting, is that of inhibition. Paradis writes (2004:28):
The selection of a particular item requires that its activation exceed that of any possible alternatives (...). In order to ensure this, its competitors must be

47
inhibited6
2.3.5. Control
, i.e., their activation thresholds must be raised. (...) In other words, the appropriate item comes to be activated by raising the activation thresholds of competing items (...) as much as by actually activating the targeted item.
The competitors in our multilingual scenario, where an L1 speaker lives in an L2-speaking country, will generally come from the L2. In such cases, the L2 will often have a lower activation threshold (through more recent and frequent use) and therefore when speaking (or to a lesser extent writing) will be available faster than the L1, creating L2 interference in the L1 and causing a number of other symptoms often found under the label ‘L1 attrition’: dysfluencies in speech, code-switching, word-finding problems, and so on. Eventually, the activation threshold can become so high that self-activation i.e. production becomes severely impaired, although comprehension is still relatively unaffected. Such serious problems are, however, unlikely in the type of attrition under discussion here: adult non-pathological L1 attrition. If the ATH is correct in its prediction that attrition is at last partly due to a high activation threshold caused by lack of use, then this should be mirrored in data showing that speakers who use their L1 less (often and frequently) than others suffer more attrition than those who use it more (often and frequently). This is one of the factors often measured in attrition studies and called ‘contact’ or ‘use’. As already discussed above, this particular factor, however, has yielded conflicting results: some studies find it to be correlated with attrition, where others do not. This may be due to methodological problems with defining and measuring contact, as discussed by Schmid (2007) and others, or it may simply not be as important as claimed by Paradis – at least not for adult non-pathological L1 attrition. A further prediction which the ATH makes, i.e. that passive knowledge will be maintained better and longer than active knowledge, however, does seem to be confirmed by attrition studies (see for example Hiller-Foti, 1985; Yoshitomi, 1992; Waas, 1997). As a conclusion I would like to say that the ATH is an extremely interesting theory which offers biological (neurological) explanations for a number of phenomena in language attrition, such as the mismatch between active and passive knowledge, or the fact that languages interfere with each other. In particular, the (often only subjective) feeling that multilingual speakers have, i.e. that it simply becomes more difficult to access a certain language, or certain parts of it, is given theoretical support. Unfortunately, however, studies have not been able to clearly show yet that it is in fact contact or use which is having a major effect on the L1, and therefore much work remains to be done in this area.
This is a psycholinguistic theory which aims to explain how multilinguals control, or regulate, the use of two or more languages, and is largely based on work by David Green. It is not a specific theory of first language attrition but can be applied to this phenomenon (see for example Levy et al., 2007). In his 1986 paper, Green introduces a model incorporating what he calls ‘Control, Activation and Resource’, which seeks to provide an explanation for both pathological and non-pathological
6 It is not clear what exactly is meant by inhibition, and how this happens, although concentration, and conscious monitoring, can certainly help to keep the languages separate, i.e. prevent one language interfering too much with the other.

48
language production. The basic idea is that there are limited resources available to the speaker to control the various languages at his/her disposal. These resources are required to both activate and inhibit languages, allowing the speaker to choose to speak in a monolingual mode (i.e. select one language and inhibit all others) or code- switch between languages (i.e. select more than one language). Green uses the term ‘activation’ in a similar way to that discussed above by Paradis, and for example also assumes that “a word must reach a certain threshold of activation in order to become available” (1986:213). Unlike Paradis though, Green does not specifically discuss how the activation threshold of a word or other linguistic item is set, but he does say that the “level of activation is likely to fall” in an unused language (ibid.:215), which is in line with Paradis’ model.
Green states that researchers nowadays tend to agree that those languages which multilingual speakers use regularly will be more or less constantly active, and therefore potentially able to interfere with each other (cp. ibid.:214). To avoid this, and enable the speaker to use a monolingual mode, s/he needs to control language output, by selecting the desired language and inhibiting all competitors. As such control is tiring and consumes resources, it cannot be exercised indefinitely, but at some point, the speaker will experience a “fatigue effect” (ibid.:218) which can lead to slower speech or unintended code-switching. Green also claims that “dysfluencies in L1 will occur whenever there is an L2 expression of a concept which is more available than one in L1” (ibid.:217). This is obviously a situation which is typical of adult non-pathological L1 attrition, where the L1 often ceases to be the dominant language for everyday purposes. Green distinguishes between three different states, i.e. a language can be “selected (and hence controlling speech output), active (i.e., playing a role in ongoing processing), and dormant (i.e., residing in long-term memory but exerting no effects on ongoing processing)” (ibid.:215). The assumption would therefore be that for practising multilinguals all languages would be at least active (if not actually selected) all of the time, but that if no longer used, a language could become ‘dormant’ (confirming the common opinion among psychologists that nothing is permanently lost from LTM), and therefore much more difficult to access. Levy et al. (2007) built upon this idea which they call “inhibitory control” (ibid.:29) and predicted that lexical production problems in the L1 of speakers who regularly use an L2 (as observed in many L1 attrition studies) could be being caused by a high level of phonological inhibition. In other words, L1 phonology is being suppressed to facilitate L2 learning and pronunciation, particularly in immersion situations. An experiment carried out to test this hypothesis was able to show that L1 English speakers who were asked to name pictures in both L1 English and L2 Spanish had subsequent problems producing the corresponding L1 words. The problems increased the more often they were required to use the L2 and the less proficient they were in the L2 (cp. ibid.:33). Another factor which seems to affect the rate of interference is lexical frequency, as Levy et al. write: “Native-language words for ideas used most often in the foreign language are most vulnerable to forgetting. This (...) arises precisely because frequent use engages inhibitory control to achieve the fluency desired by foreign-language speakers” (ibid.). In summary, therefore, this psycholinguistic model, which is compatible with Paradis’ ATH, looks promising and, although it is a rather non-specific attrition theory (compared to something like Chomsky’s MP), it does allow some quite specific predictions, such as slower speech (and inadvertent code-switching) in practising multilinguals, particularly when tired. Levy et al. predict most L1 problems in less proficient L2 speakers, i.e. early on in the immersion process. All of these symptoms

49
have been observed in studies on adult non-pathological L1 as discussed further above.
2.3.6. Dynamic systems This theory is also psycholinguistic in that it aims to describe and explain language processing. Herdina & Jessner published their Dynamic Model of Multilingualism in 2002, where they discuss a specific theory (shortened to DMM). de Bot & Makoni offer a definition of a dynamic system as “a system of interacting variables that is constantly changing due to interaction with its environment and self reorganization” (2005:5). Dynamic systems, such as language, therefore seem to be affected by external factors (the environment) and internal ones (self reorganization). The external factor discussed in both of the above-mentioned publications is exposure to more than one language, as in the case of our potential L1 attriters who have emigrated to an L2-speaking environment. Embracing a multi-competence perspective (see 2.1.1. above), Herdina & Jessner expect “multilinguals to be worse speakers of the respective languages than monolingual speakers with the same educational background and the same LME” (2002:106). LME within this framework denotes ‘language maintenance effort’ and refers to the amount of time and effort someone is willing to invest to avoid ‘forgetting’ a language. Examples of LME are “looking up the spelling of a word or reflecting on the systematicity of certain grammatical aspects of one’s L1, or asking a fellow native speaker about the appropriacy of punctuation and the simple use of one’s verbal and lexical repertoire” (ibid.:98). Although not specifically discussed, the DMM seems to be compatible with Paradis’ ATH and the idea of control as proposed by Green (as well as the psychological literature on forgetting discussed earlier), in that resources seem to be limited, making “maintaining and managing more than one language quite a challenge” (ibid.:60), but also because use is essential to maintain language proficiency. Herdina & Jessner, for example, write (ibid.:106):
Every instance of use of a particular language system constitutes an activation of a particular item or number of items of a language system and thus functions as a memory refresher cycle (...). Language use therefore has an activating or refresher function contributing to the maintenance of a language system.
Within this view, therefore, “the speaker can compensate for a shrinking language system by increased monitoring effort” (ibid.:97-8). In other words, by increasing LME, attrition can be delayed or, ideally, even completely avoided. In this context, individual factors will play a major role, which is also where attitude and motivation (already mentioned above as important factors influencing attrition) come in. Herdina & Jessner assume that “individual motivation will show its effects on the amount of effort put into the acquisition and maintenance of a specific language system” (ibid.:138-9), meaning that motivation will directly affect LME, which itself directly affects the degree of attrition. Attitude and motivation, therefore, have an indirect effect on attrition within this model. A further prediction made by DMM is that, again based on the idea of limited resources (including time and effort for LME), the more languages a speaker is trying to maintain the more difficult this will be, and the more likely it is that one or more of the languages will deteriorate (cp. ibid.:132). de Bot & Makoni mention that the combination of languages may also affect the success of maintenance, in that “[i]t may be easier to maintain a set of related

50
languages like Dutch, German and Danish than a more disparate set” (2005:61). On the other hand, “the risk of interference between related language [sic] is much larger than that between unrelated languages” (ibid.), so it is difficult to predict the precise outcome of any particular combination, although both effects could theoretically cancel each other out. A final point made in both publications is that a higher level of education should have a positive effect on language maintenance. de Bot & Makoni, for example, say “the higher educated have more ‘in reserve’ and accordingly, overt signs of decline will take longer to become apparent” (ibid.:133). Concluding, this particular model seems very promising, offering a psycholinguistic explanation for (first) language attrition which draws on other psychological, psycho- and neurolinguistic theories. It does not make specific predictions about which area(s) of language could be affected, but assumes that attrition is a normal consequence of lack of use, which can, however, be held at bay by an increase in language maintenance effort.
2.3.7. Other theories: Communication Accommodation Theory (CAT) This non-linguistic approach, which to my knowledge has not yet been applied to language attrition data, is one which originates in social psychology, has found application in sociolinguistics and research into language change, and is today known as communication accommodation theory (CAT). The basic tenet of the theory is that speakers accommodate to each other when communicating, reducing any differences in their speech and thereby inducing others to evaluate them more favourably (cp. Giles & Powesland, 1997:233). This type of accommodation is called convergence and “refers to the strategies by which individuals adapt or modify linguistic, paralinguistic and non-verbal features to become more similar to their interaction partner” (Shepard, Giles & Le Poire 2001:35). Convergence can affect “accents, dialects, idioms, and code switching between languages (...)” (ibid.) and is either “driven by a need to gain approval from an interlocutor” or it may “arise out of the pragmatic concern of ensuring that the interaction flows more smoothly, which in turn improves the effectiveness of communication” (ibid.:36). The main driving force behind such behaviour is therefore generally considered to revolve around “the similarity attraction hypothesis (...) – that we try to be more like those to whom we are attracted” (ibid.) A further important aspect is that accommodation can be ‘partial’, involving only slight speech convergence, or ‘full’, where the speakers’ language use matches exactly (cp. ibid.:37). The two alternatives to convergence in such communicative situations are divergence which “consists of strategies that individuals utilize to accentuate differences in speech and non-verbal behaviors between themselves and others” (ibid.:35), or maintenance which involves “continuing one’s own original speech style, despite accommodative attempts of the interaction partner” (ibid.). Maintenance is considered “psychologically equivalent to divergence” (ibid.).
The potential of such a theory to help explain first language attrition seems quite plain: the (voluntary) emigrant to a new country will generally desire and therefore attempt to be accepted in/by the new environment, and, particularly if the L2 (and its speech community) enjoys greater prestige than the L1, the similarity attraction hypothesis predicts that such an individual will consciously or unconsciously accommodate, i.e. adjust his/her speech to resemble that of the L2 speakers more closely. As convergence can affect all areas of language, it seems

51
feasible that such behaviour could also have negative effects on the L1, particularly if this language is used in interacting with L2 speakers. Only then would the emigrant hear his/her L1 being spoken by L2 speakers and be ‘tempted’ to accommodate his/her own L1 use. Of course, an alternative scenario could be that the emigrant mainly uses the L2 in the new environment and attempts to accommodate his/her L2 to that of the L2 speakers, which could lead to accommodation in a positive sense, in that the migrant’s L2 would become gradually more target-like. A negative effect, however, could be that L2 linguistic features ‘spill over’ to the L1, indirectly influencing the L1 and thereby making it more similar to the L2. It seems quite likely that accommodation as described above could at least be part of the explanation why many emigrants experience L1 attrition in contact with a highly prestigious L2 such as English.
It seems counter-intuitive, however, to suppose that L1 English speakers would be affected in the same way by a less prestigious L2, and maybe this is part of the reason why L1 English seems to be less prone to L1 attrition in an emigration situation than most (or all?) other L1s. The real danger for L1 English according to the scenario outlined above could arise in cases where speakers regularly use their L1 to communicate with non-native speakers, which is a common occurrence for English native speakers abroad. EFL teachers, for example, are particularly at risk here and as mentioned above (see for example Porte 2.1.3.6.) do often seem to feel their native language is suffering from massive exposure to learner language. Another problem, which applies to all language combinations, would arise if the speaker accommodates to the new situation by using the L2 dominantly. This could also lead to L1 attrition simply because the L1 is not being practised sufficiently to ensure its survival as a fully-functioning, native-like language. Accommodation theory therefore allows us to make a number of interesting predictions about first language attrition: The first would be that those speakers who use the L1 most with non-native (i.e.
L2) speakers should suffer more L1 attrition than those who either do not use the L1 at all, or only use it with (other) L1 native speakers. EFL teachers and others who use the L1 professionally, regularly interacting with non-native speakers, would be in most danger of accommodating to the L2 speakers, and thereby experiencing attrition in their L1. Partial accommodation to such exposure could become visible in the phenomenon known as dialect levelling, where the L1 (native) speaker loses his/her native regional dialect ‘colouring’. The L1 speaker would not necessarily sound like the L2 speaker but his/her language would have accommodated nevertheless. (Cp. for example Major’s finding that the L1 VOTs converged towards the L2 norms.)
A further prediction would be that attrition, if it is going to happen, will take place relatively soon after emigration. If convergence is a result of the speaker’s desire for approval and acceptance in his/her new linguistic environment, then it seems logical to expect this to become discernible early in the emigration period, whilst the emigrant is still trying to adjust to the experience. It is immediately after emigration that the individual generally struggles most with questions of identity and trying to find a place for him/herself in the new community, and where s/he is most likely to accommodate to the L2 speakers. After a number of years, the individual will normally have found his/her niche and be more at one with his/her languages and identity, no longer needing such positive feedback or approval from the new speech community. Interestingly enough, many studies have shown

52
(see 2.1.2.1. above) that attrition does set in relatively soon after emigration, and that the L1 then stabilises.
Based on the fact that “social approval is assumed to be at the heart of accommodation, it could be hypothesized that people high on a scale of need for social approval would accommodate more than those having a low need in this regard” (Giles & Powesland, 1997:233). This could help explain why the amount of L1 attrition found in people with similar (linguistic and educational) backgrounds can vary considerably, but will likely prove extremely difficult to measure objectively.
Some specific predictions for the language combination under discussion here (i.e. L1 English and L2 German) would be: English presumably has higher prestige than, or at least equal prestige to, German, and many Germans have at least a working knowledge of English, so L1 English speakers are not under too much pressure to accommodate by completely dropping their L1 and switching to predominant use of L2. Similarly, an English accent is not something which requires being totally masked or suppressed in Germany. In fact, it will often make the person appear more interesting and ‘different’ in a positive way, so such speakers are also not too pressured to put a lot of effort into accommodating their L2 to the target variety spoken around them. Again, for the same reasons, they do not need to consciously try and lose any authentic accent in the L1, which would mean accommodating to an L2-‘flavoured’ pronunciation of the L1. Speakers of L1 English often want to be recognised as native speakers of English, as this carries high prestige (and unquestionable career advantages). There is therefore little or no pressure to accommodate in any way to the L2 environment, assuming that they still identify with the ‘home country’, still consider themselves native speakers, and have no problem with being identified by others as such.
Summing up, CAT seems to be an extremely interesting and promising theory which has apparently been sadly neglected in attrition research to date. It offers a strong connection to previous work on attitude and motivation, which has repeatedly been found to influence attrition (see 2.1.2.2. above). Unfortunately, it is probably not a good candidate to help explain L1 attrition of English (which is the main topic of this thesis) as English seems to play a special role among languages with regard to prestige and its status as a global language. In a rather negative sense, though, it may offer further insight into why English seems to suffer less L1 attrition than other languages.
2.3.8. Conclusion In this section a number of linguistic theories have been presented and discussed, which are commonly found in the literature to describe and explain (first) language attrition, as well as one socio-psychological theory which has not yet been applied to such data. What we have seen is that none of them offer a complete explanation of the processes underlying attrition, or at least, not one allowing detailed predictions. The ‘Activation Threshold Hypothesis’, ‘Control’ and ‘Dynamic systems’ approaches seem most promising in that they offer a good explanation of the basic mechanism at work, but they are not specific enough to allow us to pinpoint particularly vulnerable areas of language. ‘Communication Accommodation Theory’ is also rather general but seems promising to the extent that it can shed light on more language-external or

53
personal factors which can affect L1 attrition, and are largely ignored by other theories. Other candidates such as ‘Regression theory’, Chomskian theory and ‘Simplification’ are more specific in their predictions but are generally only able to account for a small portion of the data, e.g. specific areas of grammar. A lot of work therefore remains to be done in this field, either to perfect one of the existing theories, or to come up with something new. In this thesis, none of these theories are explicitly assumed or tested although the relevance of the findings for some of them will be discussed. (See 3.1. for further details on the theoretical framework assumed here.)
2.4. The concept of ‘native speaker’
This section will be concerned with the concept of a ‘native speaker’, starting with a short section on folklore theory and some traditional, everyday ideas of what it means to be a native speaker. Then a review of the more scientific, linguistic literature on the topic will be presented, revealing the idea to be much more elusive and theoretically complex when examined closely. Finally, the native speaker model developed for this thesis will be introduced and discussed in detail.
2.4.1. Folklore theory and the concept of ‘native speaker’ Folklore is a term missing a good definition it seems – the American Folklore Society (AFS) for example say on their website that they don’t have one – and yet the definitions that can be found display common elements. There seems to be a consensus that folklore includes the traditional beliefs, knowledge, customs, tales and practices of a people, largely handed down by word of mouth, and which therefore form part of oral tradition. Some examples of these (from the AFS website: www.afsnet.org/aboutfolklore/aboutFL.cfm) are: “the names we bear from birth, invoking affinities with saints, ancestors or cultural heroes.” But also “the secret languages of children (...), the shaping of everyday experiences in stories swapped around kitchen tables or parables told from pulpits.” Folklore is even “the variety of ways there are to skin a muskrat, preserve string beans, or join two pieces of wood.” Although not specifically discussed in any of the literature reviewed for this thesis, it follows from this that there also must be a folklore tradition or theory regarding what it means to be a native speaker. The reason why this is considered relevant for the discussion here is that such beliefs often formed the starting point for modern science and modern scientific theories, and therefore may persist (even in more ‘serious’ guises) to this day.
In the past, before widespread mobility was common (i.e. before the late 18th century and the beginning Industrial Revolution), the majority of people – certainly in Western Europe, including the UK and Ireland – tended to be born, grow up, work and die in one, small regional area. The mass media also had yet to be invented, which has played an important role in spreading cultures and different linguistic varieties in recent decades. This meant that individuals would learn the language spoken in the family and immediate environment around them from other speakers and thereby become a fluent and competent speaker of the same language (or variety) themselves, what we would call a native speaker. Such a speaker would also as a rule be monolingual, having no contact to other languages, and only limited

54
contact to other dialects/varieties of the same language. (This situation may, of course, have differed in other countries or regions, where multilingualism may have been the traditional norm, or for example in communities near language boundaries or the coast with regular contact to foreigners.) I would like to claim here that it is from such an outdated and idealised social system that the folklore concept of what it means to be a native speaker has derived. In such a community the term native speaker was probably, on the one hand, not particularly relevant as the majority of speakers rarely, if ever, encountered non-native speakers, but at the same time, its meaning was much clearer than today: a native speaker was someone who was monolingual, and had grown up with a certain language from earliest childhood, which s/he was still speaking today. Interestingly enough these two factors (i.e. background and linguistic competence) are the two mentioned most often by linguistically naive individuals (i.e. those without linguistic training) today, but also by linguists, and are also the two points named most frequently in the survey carried out for this thesis and discussed in more detail below (see 2.4.3.).
Problems with the folklore concept In my opinion the term only started to become problematic with the onset of extensive mobility, bringing speakers into closer contact with those of other dialects/languages, and consequently the beginnings of more widespread individual multilingualism. Davies makes the same point (1991b:36) in saying: “Being a native speaker only becomes an issue in situations of high mobility where individuals move from one speech community to another.” Only in such situations can those questions, which create the greatest problems for the term today, become relevant. Examples of such questions are: Is a speaker of language X who has lived among speakers of language Y for decades still a native speaker of X? Can s/he be(come) a native speaker of Y? Can a speaker exposed to X and Y during childhood become a native speaker of both? The folklore meaning of the term incorporates background and linguistic competence, but this competence, whilst sufficient to be a fully functional member of a relatively rural, minimally-educated and isolated community, may not suffice today where the demands made of a native speaker have increased. In my view, this is one of the major reasons rendering the term difficult to define today – the idea of what it means to be a competent speaker of a language (a native speaker) has evolved, largely due to changes in society. Bringing the idea of linguistic competence into the world of today, a native speaker is assumed to be fully competent in the sense of speaking and writing the language well – and possibly even, if we look at the specific case of native English speakers abroad, being able to teach or proofread it. Nowadays, however, competence and background may not necessarily coincide: we can have speakers who are native in the traditional sense of having been born and brought up in a certain speech community, but whose linguistic competence barely suffices to cope with modern society. At the same time we find very competent, native-like L2 speakers, and ‘former native speakers’, or L1 attriters whose competence is no longer native-like. So the question remains: Who/What is a native speaker?
In the following section we will see how the folklore theory about being a native speaker has developed (or not) in the linguistic literature of today, and whether such sources can help to resolve any of the problems discussed above which arise when trying to pin down the meaning of the concept ‘native speaker’ today.

55
2.4.2. Use of the term ‘native speaker’ In the following sections I will present and discuss material from a number of different sources7
2.4.2.1. General, non-linguistic usage of the term
, starting with some non-linguists and their opinions as to what a native speaker is. Then I will present an overview of the linguistic literature, including both attempts at comprehensive definitions and more general comments. As this thesis is primarily interested in the situation of L1 English speakers in Germany, some of the comments will be of a more general nature but others will concentrate on what it means to be a native speaker of English. The assumption is that most of what applies to English will be generally applicable to other languages, although language-specific differences are to be expected. Finally, it will be discussed how researchers from the fields of English language teaching (ELT) and translating use the term, before trying to bring all these strands together and answer some initial questions: What does this mean for the L1 and for the L2? What conclusions can be drawn from all these various opinions and usages?
Here I would like to start by discussing how the term native speaker (of English) is used by non-linguists, concentrating in particular on two sources: an online forum on the topic, and the book Watching the English by Kate Fox (2004), where the author applies her anthropological training to her own people i.e. the English, to try and find “the hidden, unspoken rules of English behaviour, and what these rules tell us about our national identity” (ibid.:2). As language is generally considered a major cornerstone of group (and thereby also national) identity, it does not seem too rash to conclude that Fox is also indirectly talking about what it means to be a native speaker of English.
She starts by assuming that there is such a thing as “‘degrees’ of Englishness” (ibid.:17), which is very much in keeping with the theme of this paper, as I also assume (see 2.4.3.) that the concept of native speaker can best be explained in a prototype model. She also claims that “anyone can – given enough time and effort – ‘learn’ or ‘adopt’ Englishness (...)” (ibid.:20), but modifies this somewhat later to add that “even if you speak the language fluently, you will never feel or appear entirely at home in conversation with the English. Your English may be impeccable, but your behavioural ‘grammar’ will be full of glaring errors” (ibid.:62). If we apply this statement to the concept of native speaker it would seem to confirm what we already know about second language acquisition. In other words, given ‘enough time and effort’ most speakers can become highly proficient at an L2, but they will generally still be distinguishable from the ‘native speakers’ of this language.
After presenting and discussing a large number of characteristics which she considers typical of the English, Fox summarizes her findings in the diagram, reproduced below as Figure 5 This consists of “a ‘core’ and (...) three distinct categories – reflexes, outlooks and values – each with a ‘cluster’ of three characteristics” (ibid.:409). This ‘core’ bears the label ‘social dis-ease’ by which Fox means “all our chronic social inhibitions and handicaps” (ibid.:401). By ‘reflexes’ she means “our deeply ingrained impulses. Our automatic, unthinking ways of being/ways of doing things” (ibid.:402). Here she names ‘humour’ which she 7 Please note that the authors are being discussed to illustrate the range of ways in which the term ‘native speaker’ is treated in (and outside) linguistics. The list is not intended to be exhaustive.
56
considers “probably the most important of our three basic reflexes” and “our most effective built-in antidote to our social dis-ease” (ibid.), ‘moderation’ which she describes as “our avoidance of extremes, excess and intensity of any kind” (ibid.:403), and finally ‘hypocrisy’ which she defines as “an omnipresent trait” which “seems to be mainly a matter of unconscious, collective self-deception (...) rather than a deliberate, cynical, calculated attempt to deceive others” (ibid.:404). The next category ‘outlooks’ covers “our way of looking at, thinking about, structuring and understanding things” (ibid.). These are ‘empiricism’ which Fox considers “the most fundamental of this (...) cluster” and which includes “our down-to-earthness; our matter-of-factness; our pragmatism; our cynical, no-nonsense groundeness; our gritty realism; our distaste for artifice and pretension (...)” (ibid.:405), as well as ‘Eeyorishness’ which she describes as “our incessant moaning (...), our chronic pessimism, our assumption that it is in the nature of things to go wrong and be disappointing, but also our perverse satisfaction at seeing our gloomy predictions fulfilled (...)” (ibid.:405-6), and finally ‘class-consciousness’ which is all-pervading in English society, simultaneously a vital part of everyday life and yet denied and ridiculed (cp. ibid.:406). The third and final category Fox distinguishes as a major characteristic of Englishness is ‘values’, “the moral standards to which we aspire, even if we do not always live up to them” (ibid.:406), where she lists ‘fair play’, ‘courtesy’ and ‘modesty’. ‘Fair play’ is described as a “national quasi-religious obsession” where “everyone should be given a fair chance, providing they observe the rules and don’t cheat or shirk their responsibilities” (ibid.:407), ‘courtesy’ is considered “a powerful norm” (ibid.) which “seems to be almost entirely a matter of form, of obedience to a set of rules rather than expression of genuine concern” (ibid.:408), and finally ‘modesty’ which Fox considers “false – or, to put it more charitably, ironic” (ibid.). She adds that “English displays of modesty (...) are distinctive for the degree of humour involved” and that they “act as a counterbalance to our natural arrogance” (ibid.:409).
Fox suggests that these are “the defining characteristics of Englishness” (ibid.) and that the diagram shows us “how they can be classified, and that the ‘clusters’ are all linked both with each other and with the central ‘core’” (ibid.:410). Continuing with our assumption that ‘Englishness’ can be equated to ‘native speaker of English’, I would like to suggest that these characteristics would also apply to a typical native speaker of English English, and would therefore form part of the definition I am attempting to find in this thesis, i.e. being a native speaker is not just about language, but also about native-like behaviour. Unfortunately, it was not feasible to include questions on these character traits and thereby elicit such information from the participants of my study. Ideally, such characteristics would have to be observed over a reasonably long period of time, which was even less practicable for various reasons. Therefore, these behavioural aspects of being a native speaker have, regrettably, not been taken into consideration in the native speaker model presented and discussed in 2.4.3. below.

57
Figure 5: Fox’s diagram of Englishness (2004:410)
In various online forums there is also discussion of the concept native speaker. The quotes discussed below are examples of those found in the following forum: http://www.englishforums.com/English/WouldDefineNativeSpeakerEnglish/ xwmc/post.htm, as responses to the question: How would you define “native speaker of English”? One respondent writes:
Native reminds me of my Latin studies. The word is related to the Latin nasci, “to be born”. A native speaker of English is, to me anyway, a person of whose parents at least one spoke the language, or who learned English as his first language in an English-speaking environment. One cannot become a native speaker of any language at a later stage in one’s life. Becoming a native speaker is impossible.
This definition is based around the meaning of the word ‘native’ and is similar to the traditional idea discussed under 2.4.1. above. Another user says:
What I think is that the term „native speaker“ is no different from other lexical items, and it can have more than one meaning, depending on context. (...) Attempts at a single consistent definition will result in ridiculous and undesirable implications, or unfair treatment of people.
This second definition shows much greater awareness of the problems involved in trying to pin down the precise meaning of the term, insisting that context will lead to variations in meaning. A third comment is similar, saying “If we try to operationalize the concept of “nativeness”, we will eventually figure out the concept itself can hardly
Reflexes Humour
Moderation Hypocrisy
Values Fair play Courtesy Modesty
Outlooks Empiricism
Eeyorishness Class-
consciousness
Social Dis-ease

58
be narrowed down to a clear-cut set of definitional criteria. In its core the concept is ambiguous.”
Looking at the usage of the term amongst non-linguists has, on the one hand, broadened the concept considerably, to include a number of behavioural criteria, in addition to the better known linguistic ones, and, on the other, shown that even naive speakers can be aware of some of the problems associated with finding a clear definition. In the next section, an overview of the linguistic literature will be presented, encompassing more theoretical, general ideas on the topic of native speaker, as well as how the term is used in a more practical sense, i.e. in linguistic studies.
2.4.2.2. Usage of the term in linguistics Surprisingly, even linguists, who would probably want to consider themselves the experts on the topic, have no commonly-accepted definition of ‘native speaker’. Reading a large number of publications in which the term ‘native speaker’ occurs, one soon notices that they roughly fall into two main categories. In the first, the term is explicitly discussed, often in great detail (see in particular Paikeday,1985, and various publications by Davies), and an attempt is made to find some kind of workable definition (or in Paikeday’s case an appeal to drop the term altogether). The second category includes a wide range of linguistic topics, from discussions of general questions or specific theories to the presentation of findings from linguistic studies. What these all have in common, though, is that the term is treated as a given. There is normally no definition, or even vague description, of what the term is being taken to mean – it is treated as if we had all agreed on a definition already. Linguistic treatments of the term The linguist who has probably published most extensively in this area is Alan Davies, now an emeritus professor at the University of Edinburgh. After many years of grappling with the problem and attempting to find a definition, in 2004 he writes:
The concept of native speaker occupies a curious position in applied linguistics. On the one hand it is widely used as a benchmark for knowledge of a language (...), and as a criterion for employment; on the other hand a definition of the native speaker is elusive (p.431).
And although, one could possibly assume that it is pointless to try and find a definition which has eluded him and others for decades, he still insists that a definition is important “both theoretically and practically” (1995:148).
Despite all the difficulties, he has offered a definition, to which he has adhered over the years and which will be presented and discussed below. Davies has identified six characteristics which he claims can help us identify a ‘native speaker’ of any language. These are (ibid.:154):
1. The native speaker acquires the first language (L1) of which she or he is a native speaker in childhood.
2. The native speaker has intuitions (in terms of acceptability and productiveness) about his or her grammar.
3. The native speaker has intuitions about those features of the grammar of the common (or standard) language which are distinct from his or her idiolectal grammar.

59
4. The native speaker has a unique capacity to produce fluent spontaneous discourse, which is facilitated by a huge memory stock of partly or completely lexicalized items (...).
5. The native speaker has a unique creative capacity which enables him or her to write or speak creatively. This includes, of course, literature at all levels from jokes to epics, metaphor to novels. Speaking creatively probably belongs here too as does linguistic creativity and inventiveness.
6. The native speaker has a unique capacity to interpret and translate into the L1 of which she or he is a native speaker.
He does not mean these to be treated as Aristotelian ‘necessary and sufficient conditions’, but rather sees the whole concept as being on a continuum with its logical antonym, the non-native speaker (cp. ibid.:156). The individual characteristics are largely in keeping with those mentioned above, blending origin (no. 1) with linguistic proficiency (nos. 2-6), and therefore overall not particularly surprising. The only unfamiliar characteristic is no. 6: the “capacity to interpret and translate into the L1”, which is unusual for a number of reasons. One of these is that translating and interpreting is generally considered to be a special skill, one requiring specific training, and not really in the same league as nos. 2-5 which are more common in speakers even without any such training. The other main difficulty with this characteristic is that such skills obviously require the speaker to be highly proficient in at least two languages, and many linguists (as will be seen below) assume the ‘native speaker’ to be monolingual. For Davies the most important criterion, however, is that of self-identity. He writes (1991a:8):
Membership, as I see it, is largely a matter of self ascription not of something being given (...). (...) it must be the case that those who claim native speaker status (...) have responsibilities in terms of confidence and identity. They must be confident as native speakers and identify with other native speakers and be accepted by them.
Two other linguists also offer definitions for the concept which consist of six individual characteristics. The first of these is Lee (2005), who (in an article published online) says he has “isolated six defining features of a native speaker that numerous scholars in the field of Second Language Acquisition and language teaching support and agree with.” These are:
1. The individual acquired the language in early childhood (...) and maintains the use of the language (...),
2. the individual has intuitive knowledge of the language (...), 3. the individual is able to produce fluent, spontaneous discourse (...), 4. the individual is communicatively competent (...), able to communicate
within different settings (...), 5. the individual identifies with or is identified by a language community (...), 6. the individual does not have a foreign accent (...).
For Lee these are “essential features of the native speaker”, of which the first one is considered by far the most important. Again these cover both origin (no. 1) and linguistic (nos. 2-6) characteristics, although they are not identical to those proposed by Davies. The first is virtually the same, although Lee adds the requirement that the speaker needs to be still using the language today. Davies’ characteristics 2 and 3 are collapsed into Lee’s no. 2, and Davies’ no. 4 is equivalent to Lee’s no. 3. Lee’s

60
no. 4 might be interpreted as being similar to Davies’ no. 5, or considered completely different. Nos. 5 and 6 in Lee’s list, however, have no corresponding characteristic in Davies’ list, and Davies’ no. 6 about translating and interpreting is not included here. No. 5 in Lee’s list resembles Davies’ comments about self ascription to the group of native speakers, showing that this feature is probably not as far-fetched as it may have appeared initially. No. 6 is quite problematic in that the lexeme ‘foreign’ is not explained, and the question arises whether Lee is referring to an L2 accent (such as when Germans speak English) or whether this would also include say Nigerian or Singaporean English i.e. non-traditional varieties of English? Where the first interpretation would actually make sense, the second would stigmatise such ‘newer’ Englishes, and therefore not be acceptable, given that English is considered a global language.
The third list of criteria comes from Turner’s website (1997/2004), and again partially overlaps with the previous ones, but also contains some new ideas:
1. He/she was born in a country C where L is the dominant language; 2. He/she acquired L as a child (preferably in C); 3. The inhabitants of C are regarded as speaking the standard form of L; 4. He/she has both grammatical, lexical, phonological and sociolinguistic
competence in the standard spoken form of L; 5. He/she mainly speaks L at home; 6. He/she is not bilingual, or, if bilingual, does not regularly code-switch
between the standard form of L and a dialect of L, or between L and another language.
Turner says that the by now familiar mixture of characteristics are to be treated as “tentative criteria for “prototypical native speaker of language L””. He is, therefore, the only one of the three linguists introduced so far, who explicitly states that the concept should be treated as a prototype. His first two criteria again refer to background or origin, and 4 is a linguistic criterion, similar to those presented above; nos. 3, 5 and 6 are ones we have not seen before in the previous lists. No. 3 requires that the speaker should acquire a standard version of the language, thereby disqualifying all pure dialect speakers from being considered prototypical native speakers. No. 5 reflects usage, and – similar to Lee’s no. 1 – requires the speaker to still use the language today, although it is not entirely clear why this should have to be in the home, rather than elsewhere. (Although I do tend to agree that the language used only in the home will normally have more of an influence on a speaker than that only spoken outside – particularly for younger children who will presumably spend the majority of their time in the home environment.) No. 6 shows that Turner does not insist on the ‘native speaker’ being monolingual, although this is obviously the preferred state.
Medgyes also has a catalogue of criteria to distinguish between native and non-native speakers, except that this one contains 7 characteristics, as listed below (1999:10):
(...) the native speaker of, say, English is someone who: 1. was born in an English-speaking country; and/or 2. acquired English during childhood in an English-speaking family or
environment; 3. speaks English as his/her first language; 4. has a native-like command of English; 5. has the capacity to produce fluent, spontaneous discourse in English;

61
6. uses the English language creatively; 7. has reliable intuitions to distinguish right and wrong forms in English.
Yet again, we have a mix of criteria, including both background (nos. 1-3), and linguistic ones (nos. 4-7). Medgyes’ no. 1 is not included in the lists suggested by Davies and Lee, but does match Turner’s no. 1. This characteristic is actually rather problematic as it rules out the possibility of a speaker becoming a native speaker of say English, if that language is only spoken in the home, for example, but not by the wider community. Medgyes’ no. 2 is a criterion found in the previous three lists as well, and would probably suffice; it is not entirely clear why Medgyes feels the need for no. 1 in addition to this. No. 3 also seems rather redundant, as it could well be seen as a logical consequence of no. 2, i.e. if you acquire a language in childhood, it will be your first language. No. 4 is again not particularly useful as the argument is circular, using the term ‘native-like command’ to define ‘native speaker’; nos. 5-7, however, appear in similar guise in most of the other lists, and in fact could probably be seen as explaining what is meant by no. 4. In his book, Medgyes makes it clear that he does “not wish to challenge the existence of the native speaker or, logically, that of the non-native speaker. Fugitive concepts as they are, they may still be legitimate and in everyday usage the native/non-native division does not normally pose problems” (ibid.:11). He accepts (ibid.:12) that “native speakers are, potentially, more accomplished users of English than non-native speakers” and that “it verges on the impossible for the non-native to outperform the native who spent much of the first five or six years of his/her life acquiring L1” (ibid.:13). These are, however, merely descriptions of proficiency, and not particularly helpful when trying to define the wider concept. Medgyes conclusion is therefore, as already suggested by Davies: “As the native/non-native dilemma is far from being resolved on a theoretical plane, let me suggest, somewhat complacently perhaps, that he be allowed to self-identify” (ibid.:16).
What these four lists all have in common is that background or origin criteria i.e. where a speaker is born and brought up are being blended with individual linguistic (and sometimes other) criteria. None of the linguists actually claim that a speaker needs to satisfy all the criteria listed in order to qualify for the label ‘native speaker’, but Lee and Medgyes seem to be the least inclined to treat the concept as a prototype, Davies slightly more so, and Turner explicitly suggests doing precisely that. Looking at the individual linguistic criteria mentioned, all four lists include intuitive knowledge or competence of the language, three of the four list ‘fluent and spontaneous discourse’, but otherwise the criteria differ in all three lists. We can maybe interpret this as meaning that, where there is a broad consensus about the importance of background or origin, what has been called the “biodevelopmental definition” (Cook, 1999:187), there is much less consensus about what a ‘native speaker’ should be capable of linguistically.
Let us now move on to compare these findings with what some other linguists have to say on the topic, starting with Cook, who writes (ibid.) that a native speaker is “a monolingual person who still speaks the language learnt in childhood.” He also says (cp. ibid.:186-7) that creativity in language is not an essential characteristic, neither is a particularly high language proficiency, the ability to interpret, or self-identification with the L1 speech community. In his opinion “the indisputable element in the definition of native speaker is that a person is a native speaker of the language learnt first; (...)” (ibid.:187), thereby focusing exclusively on the background criterion. Cook’s primary motive in discussing the native speaker is to show that

62
knowing more than one language creates multicompetence, a very different state from ‘monocompetence’, which his typical native speakers have. In 1993 he writes, for instance: “The efficient L2 user is not an ersatz native speaker but a different type of being (...)” (p.6). The neurolinguist Paradis’ definition of a native speaker is “someone who has been speaking a particular sociolect (...) from the crib, i.e., has been exposed to it from birth, has acquired it incidentally and has continued to speak it as an adult” (1998:216). He adds that a “child who acquires two languages simultaneously from the onset becomes a native speaker of two languages” (ibid.:206) and that the proficiency of a native speaker may be virtually indistinguishable from that of a “quasi-native speaker” but that there “are clear neurofunctional distinctions” between the two (ibid.:216). Maher’s definition of the term closely resembles that suggested by Davies above, but without the reference to (self-)identity. Maher writes (2001:292-3):
Thus, the native speaker: spontaneously uses language for communication, acquires the first language in childhood, knows the rules governing the native language, i.e. has intuitions about the language beyond knowledge of his/her own idiolectal grammar, can joke effectively, has the unique capacity to interpret and translate into the L1, detects lexical semantic, syntactical absurdity, senses ambiguity, has an intuitive understanding of the social functions of language in use, has the unique capacity to write creatively, e.g. poetry, has a massive memory stock of lexical items.
Ballmer, in contrast, is more interested in the native speaker as someone required and recruited by linguists for their studies. His definition of “a good native speaker” is as follows (1981:55):
(7) Def3: A native speaker of a creative (spoken) language L is a human being able to produce adequately expressions of L in communication, who is normally socialized and who acquired this ability in the process of primary socialization. A native speaker is old enough to know the language and not so old as to have forgotten it. He is healthy in every relevant respect (...). He is monolingual, he lives in his birthplace, his family, especially his mother speaks (natively) his nature [sic] language L, the place where he lives is strictly monolingual: there is no standard speech/dialect split and there are no other competing languages.
Some pages later he adds the following criterion to this definition (ibid.:57): “The native speaker is educated enough to enter the experiment, but not so educated as to call into question its outcome.” Ballmer therefore agrees with Cook about the importance of being monolingual, but otherwise largely agrees with those definitions presented above. Interestingly, Ballmer does not expect a native speaker to be perfect (cp. ibid.:51) or an expert on the language of which s/he is a native speaker (cp. ibid.:52). The important criteria seem to be that a native speaker should have a “working knowledge of his native language (...) fulfil requirements of performance (...) and be consistent (...)” (ibid.:55). Coulmas’ treatment of the topic is very similar to that of Ballmer, in that he also focuses on the native speaker as “potential informant” or “data supplier” (1981:4) for linguists. Like some of the other linguists already discussed above, Coulmas also acknowledges that the term ‘native speaker’ may be used in different ways by different authors (cp. ibid.:2), but that it is, nonetheless, “of fundamental importance for the field” (ibid.:1). He does not offer us an actual definition but does say that

63
“[o]nly those speakers of a language qualify as potential informants whose first language it is” (ibid.:4) and “[e]very normal human being growing up under normal circumstances with at least minimal exposure to language invariably becomes a native speaker” (ibid.:19). For Coulmas, “[i]t is, possibly, the most significant characteristic of a native speaker that he learns his language without instruction” (ibid.:359). He mainly concentrates on debating which kind of native speaker should be “the linguist’s native speaker” (ibid.:7), and in particular the pros and cons of using a naive vs. a sophisticated informant i.e. people with vs. without formal or informal training in linguistics (cp. ibid.). His conclusion is that the naive informant is the best native speaker for such purposes as “linguistic training (...) spoil[s] your native intuitions” (ibid.:9), although even these speakers “cannot [be] credit[ed] with much reliability” (ibid.:13). Brutt-Griffler & Samimy discuss the concept of native speaker within the context of globalisation and criticise the fact that “national identity plays a crucial – and at times decisive – role in determining who is and who is not a ‘native speaker’ of English” (2001:103), adding that “national identity should not be a basis of classification of speakers of an international language” (ibid.:105). They deplore the fact that the label seems to depend on social factors rather than linguistic ones (cp. ibid.:100-2), in other words “preconceived ideas of what a ‘native speaker’ should look like or sound like” (ibid.:100). They do not have a specific definition but do say “a native speaker is one who learns the language in what is often called its ‘natural environment’” (ibid.:104). They also add that multilingualism could be considered a “marker of nonnativeness (...) as though knowing another language excludes the possibility of being an ‘authentic native speaker’ (...)” (ibid.:102).
Mufwene treats the term as one whose meaning can vary in different contexts, and which he defines in the following way (1998:111):
(...) a person who speaks a language (variety) as a mother tongue, having acquired it before the end of what has been identified in the child language literature as the ‘critical period’. Native speakers need not be proficient in all varieties of their language; nor need they remain proficient during their lifetime in the variety they acquired as a mother, or native, tongue.
He therefore agrees with much of what has been said above, but does not insist on the native speaker being monolingual, nor even that s/he still speaks the language proficiently today.
After Davies, Paikeday is responsible for what is probably the most extensive treatment of the topic ‘native speaker’ and his viewpoint becomes immediately obvious on reading the title: The native speaker is dead! In this publication Paikeday adopts the most radical position of those presented here and argues that ““native speaker” in the linguist’s sense of arbiter of grammaticality and acceptability of language is quite dead” (1985:x) and therefore the term should no longer be used in this way. In his opinion the two senses of native speaker i.e. a person “who has a specified language as the mother tongue or first-learned language” (ibid.:9-10) and “who is a competent speaker of a specified language and who uses it idiomatically” (ibid.:10) do/need not always coincide. In other words, it is possible to satisfy the first requirement but not the second, or vice versa, and, because the term is used “in everyday life, as when someone says, “Only native speakers need apply”” (ibid.:27), discriminating against those who do not meet the first requirement, Paikeday would like to see the term only being used in the second sense, i.e. to denote a ‘competent speaker’, regardless of whether the language is a first or second language for the

64
speaker. He claims towards the end of the publication to have solved the problem of ‘native speaker’ and “that the true meaning of the lexeme (...) is “proficient user of a specified language”” (ibid.:87). The following sources bridge those just mentioned in the previous section and those that follow later, as they have not simply used the term as if its definition were clear, but have offered us at least a minimal description or definition, or some indication that the term is problematic. Some examples of such usage are (in alphabetical order): Ammerlaan (1996:75): “Using a “fully competent native speaker” as the norm
creates the problem of defining this term accurately because, like the term “grammar”, this is a hypothetical concept.”
Chomsky (1965:3): “Linguistic theory is concerned primarily with an ideal speaker-listener, in a completely homogeneous speech-community, who knows its language perfectly and is unaffected by such grammatically irrelevant conditions as memory limitations, distractions, shifts of attention and interest, and errors (random or characteristic) in applying his knowledge of the language in actual performance.”
Escudero & Sharwood Smith (2001:275): “Most researchers rely on the assumption that there is a common understanding of what a native-speaker is.” (ibid.:279): “It seems that a straightforward structural-linguistic definition of native-speaker has to be impossible.” (ibid.:280): “One characteristic of the NS stereotype is having been born and brought up in a relevant language community (...). Another (...) is the possession of a particular accent.”
Hamers & Blanc (2000:374): “native speaker: An individual for whom a particular language is a ‘native language’ (...).”
Medgyes (1999:8): “During my discussion, I have used the terms native speaker and non-native speaker rather freely as though they expressed obvious, universally accepted concepts. In Chapter 2, I shall argue that the native/non-native distinction is, in fact, one of the most hotly debated issues in applied linguistics.” (ibid.:9): “The native/non-native distinction is one of the most complex and elusive areas in applied linguistics. There are a growing number of researchers who claim, in all seriousness, that there is no such creature as the native or non-native speaker.” (ibid.:14): “The acknowledgement that there are non-natives with a native-like command of English – whom I have come to call pseudo-native speakers for want of a better term – does not necessarily imply that they are indistinguishable from natives.”
Preston (1982:65): “There is (...) a weakness in assuming that one can always identify what Anderson calls a “totally competent speaker,” but that has been a traditionally thorny problem in the idealization of linguistic data (...).”
Singh (1998:15): “the political construct called the ‘native speaker’ (...). (...)the theoretical linguist would usually try to get away with an ever-elusive category of ‘ideal speaker-hearer’ (...).”
http://americannationalcorpus.org/native-speaker.html : “The language we want to include in the ANC is produced by native speakers of “American English” (...). Surprisingly, after consulting with the American Dialect Society, we discovered there is no agreed-upon definition of who can be considered a native speaker of English (or any language, for that matter).”

65
Other linguistic occurrences of the term In the following publications, which are either reports of specific studies or general discussions, we find some examples of the term ‘native speaker’ (or NS) being used in linguistics, but without further description or explanation; in other words it is being used as a given. Obviously, such usage is undesirable for a number of reasons, the principal one being that comments and research are simply not comparable if we cannot be sure we are talking about the same thing, and without a precise definition we cannot know what kind of speaker a particular author is subsuming under the headings ‘native speaker’, ‘non-native speaker’, ‘ex-native speaker’ (as used by Sharwood Smith below), or even ‘pseudo native speaker’ (as found in Medgyes). General discussions (presented in alphabetical order): Cohen (1986:144-5): “A nonnative would not be expected to achieve mastery
over even a small portion of the target-language vocabulary. Likewise, natives have gaps in their mastery of words in their receptive and productive vocabulary.”
Ferguson (1982:vii): “Linguists, perhaps especially American linguists, have long given a special place to the “native speaker” as the only truly valid and reliable source of language data (...). In fact, the whole mystique of native speaker and mother tongue should probably be quietly dropped from the linguists’ set of professional myths about language. (...) Of what linguistic significance is X’s native-speaking competence in language A if he has not used it since childhood and is much more at home in his later-acquired language B?” (ibid.:x): “English is less and less regarded as a European language, and its development is less and less determined by the usage of its native speakers. (...) In some sense, the native speakers of a language may be said to “own” it or to “control” it; i.e., to determine its future structure and use by their own usage and their beliefs about the language.” (ibid.:xi): “Native speakers in many situations around the world may have confidence that they “know” the language better than others, but the differences among native speakers from different areas and the growing importance of non-native norms will increasingly affect this confidence.”
Herdina & Jessner (2002:69-70): “even native speakers systematically fail to achieve the level of performance predicted by their assumed language competence. This problem is exemplified by the fact that native speaker grammaticality judgements are not as consistent as we would predict on the basis of (UG-oriented) linguistic theory.”
Kellerman (1989:87): “Fossilization occurs when learners stop learning, having arrived at a point where their language consistently deviates from native speaker norms (...).”
Major (2002:67): “From one perspective, one might be tempted to say that L2 users are NSs of neither L1 nor L2, because their systems are different from monolingual NSs of both languages.”
Pavlenko (2006:12): Language and culture is “a unified ‘package’ that defines ‘the way the native speakers talk’ and thus links language / culture and personality. In this one language–one personality discourse, a ‘true’ command of a second language requires conformity: non-native speakers have ‘to assume certain cultural perspectives’, to ‘act according to the behavioral norms of the corresponding culture’, and to ‘conform to the way the native speakers talk’.”
Seidlhofer (2008): „mein größter Triumph war es, als mich der “Papst” der englischen Grammatik, Sir Randolph Quirk, (...) drei Minuten lang für einen Native Speaker hielt. (...) die Vorstellung, dass jegliche legitime Sprache oder Varietät

66
immer nur die von Muttersprachlern sein kann, ist ganz fest in unseren Köpfen verankert.“
Sharwood Smith (1983a:226): “The native speaker or ex-native speaker may end up with an enriched set of resources by combining the best of both systems. In this case “loss” is hardly the best term to describe changes in the system.”
Yoshitomi (1992:296): “Presumably, native speakers have a complete mastery of L1 grammar.”
Specific studies (presented in alphabetical order): Brown (2001:18) “the subjects were five female native-speakers of British English
who had emigrated to Italy as adults.” (ibid.:38): “a native-speaker of a language who has been resident for a long time in an L2 environment is not necessarily more of an ‘expert’ in the target language than a non-native-speaker (...).”
Coppieters (1987:544): “the data indicate that near-native speakers diverge less from native speakers in formal features, such as those currently covered by studies in Universal Grammar, than in ‘functional’ or ‘cognitive’ aspects of grammar.” (ibid.:548): “NS’s do vary as regards language use and linguistic intuitions, and any study pretending to compare and contrast NS’s and NNS’s will have to face the problem of NS variability.” (ibid.:568): “several of the NNS’s studied did NOT show clearly detectable signs of a foreign accent in French; indeed, many of them routinely pass for NS’s.”
Coveney (1998:181): “the 4th Year non-native speakers (...) outdo the two groups of native speakers.” (ibid.:182): “they pay particular attention to linguistic form, and monitor their own speech and the speech of others, to an extent that native speakers do not need to do (...).”
Lowie (2005:263): “The paradox emerging from the results is that the pattern of the lowest proficiency group most strongly resembles that of the native speakers.” (ibid.:265): “the results of this pilot study seem to corroborate the assumption that the unexpected results of the native speaker group (the mechanics) in the main experiment was because they were a non-academic group of participants.”
Piller (2002:181): “the highly proficient L2 speakers in this study are, on occasion, warranted as native speakers by ‘authentic’ native speakers.” (ibid.:194): “successful L2 users do not necessarily aim to pass for native speakers.” (ibid.:197): “L2 speakers cannot pass for native speakers beyond initial encounters, once their ‘authentic’ identity is known to their audience.”
Porte (1999:29): “This exploratory survey aimed to discover the extent to which L1 attrition was perceived to affect a group of native-speaker EFL teachers who at the time had been living in Spain for a minimum of five and a maximum of 26 years.” (ibid.:33): “This study has presented evidence suggesting that the resident native-speaker teacher’s L1 is not a stable system, but rather a changeable one (...).”
Porte (2003:108): “Three senior lecturers (...) were invited to participate in the study. (...) They were native speakers and currently long-term residents in Spain (15-24 years residence).”
Seliger (1989:174): “the language performance of the attrited speaker is clearly deviant from that of both the fully developed native speaker of that language and the developing monolingual child.”
Sharwood Smith (1989:189-90): “In cases of language loss (...) it is worth asking to what extent the failure of an “ex-native speaker” to show as steady an
67
adherence to the native standard as comparable native-speakers (...) is the result of competence change or a change in the way competence is controlled.”
Sharwood Smith & van Buren (1991:18): “the subject was no longer as fluent in L1 as we would expect a native speaker to be.”
Strieker (2002:1): “Native speakers of English are not the ultimate criterion group for an ESL test, because they vary in formal and informal education in English and in linguistic ability, even with the same English-speaking country (...).” (ibid.:16): “Although the native speakers did well on TOEFL, they did not perform perfectly, and the variation in their test performance, though considerably less than that of ESL speakers, was nontrivial.”
Vanlancker-Sidtis (2003:45): “Both native speaker groups performed significantly better than fluent nonnatives, while ESL students performed at chance.” (ibid.:50): “Native speakers of English achieved the highest scores on both tasks (...).” (ibid.:53): “There was a significant tendency in the present study for native American English speakers with at least one nonnative parent to perform worse on the single sentence task than listeners with native parents.”
In this section where we have looked at the term ‘native speaker’ in linguistics, we have seen the wide range of ways in which it is used – from whole monographs on the topic (see especially Davies and Paikeday) to quite casual mentions in publications on other linguistic topics. What has, hopefully, become clear is that, where an attempt at definition is made, two very different types of criteria are being blended, namely a background or origin criterion, such as Davies’ first characteristic: “The native speaker acquires the first language (L1) of which she or he is a native speaker in childhood” (1995:154), and diverse linguistic criteria, which aim to describe the linguistic proficiency of a native speaker, whereby the focus seems to lie on the ‘educated native speaker’, whatever this may mean, as it is again not defined. A number of other criteria are suggested by researchers to help distinguish the ‘native’ from the ‘non-native speaker’ such as the ability to translate, being monolingual, still living in one’s birthplace and still speaking the language today, or self-identifying as a native speaker, many of which are, however, rejected by others. What we are left with is a long list of potential criteria, some of which seem to be relatively uncontroversial and are found time and time again, and some more ‘exotic’ ones which do not seem to be globally accepted. We are, unfortunately though, still no closer to an unambiguous definition.
We have also seen here many examples where the term has been used with little or no explanation, as if a well-established definition did already exist. A few researchers (especially Paikeday) propose doing away with the terms ‘native’ and ‘non-native speaker’ altogether, as we seem unable to define them adequately. They, however, have no particularly viable alternatives on offer.
2.4.2.3. Usage of the term with specific relevance for ELT, translating etc.
In the next section, we will take a closer look at how the term ‘native speaker’ is used, both in the linguistic literature and more general publications, in the more applied and practical fields such as ELT (English Language Teaching) and translating. The native speaker traditionally plays an important role in ELT as s/he is often considered the (rather abstract) role model or goal towards which all students should aspire. In translating, it is generally considered desirable for the translator to

68
translate into his/her mother tongue or native language, which again begs the question of how to define this language, particularly for speakers with such a high degree of proficiency in at least two languages, as is required for translation. Probably the most comprehensive discussion of the native/non-native distinction in ELT is from Medgyes (1999). In his introduction (ibid.:viii) he claims that this “exist[s] not only in reality but also, and more significantly, in the minds of millions of teachers.” He adds that it is an unfortunate fact that “commercial language schools in Britain and the US have relatively well-defined hiring practices, partly because their customers arrive with fairly predictable expectations” (ibid.:69). This would suggest that the whole question has now become a vicious circle, where some language schools have in the past used the vague assumption that a native speaker is a better teacher as a major selling point to distinguish themselves from competitors and win clients, thereby reinforcing in clients in general the impression that only a native speaker is a good teacher, leading the clients in turn to be ever more insistent about ‘demanding’ native speakers. Medgyes bemoans this development, and comes to the conclusion that a non-native teacher (what he refers to as a non-NEST) can in fact be just as successful in ELT as a native teacher (a NEST), as any potential “linguistic handicap” is offset by their experience as an L2 learner of English, enabling them to better understand and resolve any problems their own L2 students may encounter (cp. ibid.:109).
Cook (1999:200) seems to agree with Medgyes’ conclusion, saying on the one hand that “[o]ften native speakers are assumed to intrinsically make better teachers than nonnatives do (...)” but also that “students may feel overwhelmed by native-speaker teachers who have achieved a perfection that is out of the students’ reach (...)” and therefore “may prefer the fallible nonnative-speaker teacher who presents a more achievable model.” We now, therefore, have two important reasons why non-native speaker teachers could be considered the better option: Firstly, due to their own personal experience as L2 learners of the language in question (here English), and as the more realistic role model.
Phillipson (1992) takes this argument a step further, claiming that “[t]he untrained or unqualified native speaker is in fact potentially a menace because of ignorance of the structure of the mother tongue (...)” (p.14). Such statements, however, are not necessarily new. Phillipson quotes (ibid.:15) “the UNESCO monograph on the use of the vernacular languages in education (UNESCO, 1953:69)” which says: “A teacher is not adequately qualified to teach a language merely because it is his mother tongue (...)”. He also mentions and drives home (ibid.) the point raised above:
It is arguable, as a general principle, that non-native teachers may, in fact, be better qualified than native speakers, if they have gone through the complex process of acquiring English as a second or foreign language, have insight into the linguistic and cultural needs of their learners, a detailed awareness of how mother tongue and target language differ and what is difficult for learners, and first-hand experience of using a second or foreign language.
In addition, Phillipson discusses the historical development of “the notion that the ideal teacher is a native speaker of the language” (p.13), reminding us (ibid.) that this “dates from a time when language teaching was indistinguishable from culture teaching”. Obviously then, speakers who had grown up within a certain ‘English’ culture were considered best qualified to transmit this culture – including its language – to others, which led to a demand for British, American, Australian etc. native

69
teachers of English, and which to a certain extent and in some parts of the world continues unabated to this day. Another reason why the native speaker teacher is often considered superior is “because of greater facility in demonstrating fluent, idiomatically appropriate language (...), in appreciating the cultural connotations of the language, and in assessing whether a given language form is acceptably correct or not” (ibid.:14). However, there is no intrinsic reason why a well-trained non-native could not become (almost) equally proficient here too, effectively removing or at least weakening the linguistic argument in favour of native speakers. Summarising, Phillipson writes (ibid.:16):
(...) it would seem to be a minimal requirement of teachers of English as a second or foreign language that they should have proven experience of and success in learning and using a second/foreign language themselves, and that they should have profound familiarity with the language and culture of the learners they are responsible for. Clearly, such teachers may or may not have English as their mother tongue.
Anchimbe’s online article (2006) continues in this now familiar vein, introducing two new terms, namely that of the “historical (by virtue of origin) native speaker”, by which he means someone born in one of the native English-speaking countries: Britain, USA, Australia, New Zealand and Canada, as compared to the “historical non-native”, by which he means those who have English as a second language, i.e. the postcolonial varieties. Again, he argues that the native speaker should not be automatically favoured over the non-native in the field of ELT, simply because it is traditionally believed that “the native speaker is error-free and since s/he learns the language from infancy, s/he has an unquestionable proficiency and efficiency in it.” Another aspect he touches on is that there are simply not enough “historical native speakers” to meet worldwide demand, so that compromise is inevitable. He points out that “[t]he issue of correctness (...) is so complex that being a native speaker does not automatically qualify one as a competent speaker” and again stresses the importance of appropriate training, writing: “any ELT attempt that is primarily based on native-speaker origins without solid ELT training is not a safe haven for error-free language transmission.” He then sums up his argument by saying that proficiency rather than origin must be(come) the main criterion for ELT positions, concluding: “ELT is not a natural element of native speakers but a profession that requires due training and efficiency.” Graddol claims (2006:115) that in “several Asian countries, the definition of ‘native-speaker teacher’ has been relaxed to include teachers from India and Singapore”, suggesting that the above-mentioned compromise has been accepted in these countries, at least. Paikeday (the author of The native speaker is dead!) also makes a few specific comments on the topic of ‘native speaker’ and job opportunities, saying (1985:88) that “[o]thers who use this biased notion of native speakership in hiring for jobs related to language proficiency are denying the members of disadvantaged groups equal opportunity with those for whom the language in question is their mother tongue or first language.” He later expands on this statement, writing (ibid.): “I wanted to show that “native speaker” in the linguist’s sense is a myth and because it is a myth, native speakership should not be used as a criterion for excluding certain categories of people from language-teaching, dictionary-editing, and similar functions.”

70
Thelen (2005) focuses primarily on the field of translation and the role of native and non-native speakers therein. He quotes (ibid.:242) the “Nairobi UNESCO Declaration of 1976: (...) a translator should, as far as possible, translate into his own mother tongue or into a language of which he or she has a mastery equal to that of his or her mother tongue (...)” and “the Charter of the International Federation of Translators (...): The translator shall possess a sound knowledge of the language from which he/she translates and should, in particular, be a master of that into which he/she translates.” Thelen adds that “[f]rom the time that they were formulated, these guidelines have become known as the so-called ‘mother tongue principle’ for translating (...)” (ibid.), which means, as mentioned above, that a translator should always translate from a given second language into his/her mother or native tongue. Thelen criticises the fact that the notion of ‘native speaker’ is fuzzy and yet it is still being used to decide who can be entrusted with translating what into which language, and therefore this stipulation should be dropped (ibid.:248). The justification for this rule seems – as in ELT – to be based on the clients and their expectations. Thelen writes (ibid.:250): “Very often, translation companies seem to use native speakers as a form of protection against dissatisfied clients; it gives the companies an additional form of authority.” Rampton makes the point (1990:98) that not everyone can be interested in changing this status quo as “the supremacy of the native speaker keeps the UK and the US at the centre of ELT (...).” Turner makes a similar point, writing in his introduction (1997/2004) that “in the language teaching profession, being classed as a native speaker is the key to status, expanded job opportunities and higher pay (...).” So, both in ELT and in translation, job opportunities and whole careers can hinge on whether a particular speaker is labelled a native speaker or not, which certainly benefits the ‘traditional’ native-speaking countries such as the UK and the US. But is this still true today? Two recent articles in quality newspapers suggest that it is. In 2007, an article in the Guardian Weekly claimed:
If your mother tongue is English, it seems you still have access to work abroad in virtually any country of your choice. Armed with the minimum qualification (or possibly none at all), native speakers continue to travel the world and spread their language. (www.guardianweekly.co.uk/?page=editorial&id=426/catID=18)
In the same year, an article appeared in The Telegraph (http://www.telegraph.co.uk/global/main.jhtml?xml=/global/2007/01/19/expatvienna1.xml), looking at the specific situation in Vienna, and opening with the promising sentence: “Being an English native speaker in Vienna offers job opportunities and a chance to earn money that is quite unbelievable.” In addition to jobs teaching English it seems that positions in universities which “come with a nice job title and a pay package” are available “courtesy of the native speaker status”, but also various international organisations such as the UN are keen to employ English native speakers. The article lists a few further reasons why native speakers should not automatically be considered the better teachers, such as the fact that they “are often more costly than trained local teachers and are likely to have little, if any, commitment to the institution where they are employed, as many are only in Vienna short term.” An additional reason is the one already mentioned above, i.e. the disadvantage of being monolingual, which applies to many English native speakers, and the problems which can arise out of this in the classroom.

71
The final five sources differ slightly from those discussed above, in that they consider specific studies and specific cases of English language teachers. Porte’s is the oldest (from 1999), in which he looks at English native speaker EFL teachers in Spain (see also 2.1.3.6.). Unlike Sharwood-Smith above (see 2.4.2.2.), for Porte there is no question that these speakers are still ‘native speakers’ of English although he comes to the conclusion (1999:34) that “[a] certain amount of L1 attrition may be inevitable during long-term residence abroad” and that “native-speaker EFL teachers in this situation may need to be particularly alert to the potential consequences of L1 deterioration, brought about as a direct result of the way their profession requires them to interact with their own native language.” In 2003, Porte carried out a follow-up study where he looked at three EFL teachers in detail. Again these participants are considered native speakers although they had already been living in Spain for between 15 and 24 years (cp. 2003:108), and “were fluent speakers and readers of Spanish” who “had undertaken only occasional trips to English-speaking countries in the last fifteen years, (...)” (ibid.). Most interestingly, Porte disqualified himself from analysing the data gathered during this study (i.e. something a typical native speaker informant would be asked and expected to do) as he considered himself susceptible “to L1 code manipulation as a Spanish resident of more than twenty years” (ibid.:109). Instead, the analysis was carried out “by one visiting British lecturer in English Language at a local university and another who lectures in Spanish language and literature and lives and works at a university in England.” Why should these speakers have been considered better qualified than Porte himself? Is it because their English is ‘purer’, has been less ‘contaminated’ by an L2? If so, what does this mean for our definition of ‘native speaker’ – particularly the type of native speaker from whom linguists hope to receive reliable ‘native’ intuition and grammaticality judgements?
The other three studies under discussion here are all from 2001, beginning with Brown (see also 2.1.3.7.), who interviewed a number of (British) English speakers working as EFL teachers who had been living in Italy for between 10 and 22 years. She is very critical of the common practice of employing such speakers as EFL teachers because “a native-speaker of a language who has been resident for a long time in an L2 environment is not necessarily more of an ‘expert’ in the target language than a non-native-speaker (...) (2001:38)”. Brown also criticises the fact that such teachers often only have minimal, if any, teaching qualifications, adding (ibid.):
(...) as the ability to speak the target language well is only one of the requirements of a good language teacher (...), the native-speaker language-teacher should not presume that s/he is naturally better-equipped to teach the target language than a non-native speaker, however talented and motivated.
Brutt-Griffler & Samimy review a number of cases where individuals with varying biographies have attempted to find work in ELT and enjoyed various degrees of success. They show (2001:100) “that the determination of the identity of international speakers of English as ‘native’ or ‘nonnative speakers’ depends upon social factors – preconceived notions of what a ‘native speaker’ should look like or sound like”, and that linguistic proficiency is very much a secondary consideration. The consequence of such labelling “leave[s] language users on different sides of the native/nonnative divide, despite identical language ability (...)” (ibid.) and can thereby “thwart the ELT careers of many professionals who find themselves on the wrong side of the divide” (ibid.:99).

72
The final study to be presented here is that by Inbar, who, following Davies’ claim that native speakerness is closely associated to questions of (self-)identity, elicited such information from 102 EFL teachers in Israel using self-report questionnaires (cp. 2001:1). Her aim was to try and uncover the variables which “best predict the teachers’ self ascribed identity as native or non-native English speakers” (ibid.:2), and to try and relate this information to the “pedagogical perceptions of teachers of (...) EFL in Israel” (ibid.:1). She found that the two variables which best predicted this self-ascribed identity were: “whether they had spoken English from the age of 0 to 6, and whether others perceived them as native or non-native English speakers” (ibid.:2). In other words, those speakers who had grown up with English since childhood, and whom others considered to be native speakers, were most likely to think of themselves in the same way, again showing the significance of the ‘background’ factor for this question, but also the important role which social interaction can play. Inbar found no correlation between specific “perception categories related to teaching and assessment practices, to defining students’ knowledge in English, the status of the English language and goals for teaching it” (ibid.), which leads her to conclude by recommending that “hiring practices should be conducted on the basis of professional expertise and personal attributes rather than on native speaking background” (ibid.:4), a plea we have now heard a number of times. In this section the concept ‘native speaker’ as used in the applied fields of ELT and translating has been discussed, where it is a label with the power to make or break careers. As we have seen, the major source of inequality derives from the fact that it, on the one hand, carries such weight in these areas, yet on the other is not applied in a uniform way, as we still have no global definition – we cannot assume that what I mean when I say ‘native speaker’ or ‘non-native speaker’ is also what you mean when you use the same terms. In translation, where linguistic proficiency in both languages and background knowledge of the subject matter should be the primary concern, the major stumbling block for many aspirants is that they are supposed to be translating into their native tongue, although again, no one seems entirely clear on how to clarify precisely which of a multilingual’s languages is meant by the term. In ELT it often seems as if, for example, owning a certain passport is the sole essential qualification (or at least the paramount one) to fame and fortune, although, there are signs that this may be changing in some areas. It is true that there may be situations (certain types of English lesson) which benefit from the teacher having inside knowledge of a particular culture (such as British or American) as a result of having grown up in a certain country, and that these may advantage native speakers (or possibly others who have lived in the respective community), and yet this factor will generally not be as important as, for example, the question of didactic competence. This is, in my opinion, the most scandalous result of the “native-speaker fever” as Anchimbe (2006) calls it, and one which should be brought down as soon as possible by insisting on appropriate qualifications, regardless of the potential EFL teacher’s origin.

73
2.4.2.4. The native speaker and the L1 In this sub-chapter and the next (2.4.2.5.) I would like to try and find initial answers based on the literature presented above to two of the questions this thesis aims to address, namely: 1) Can a native speaker lose his/her native speaker status? and 2) Can a speaker become a native speaker of his/her L2? Turning to the first question, and ignoring all pathological problems including aging, which can have a negative effect on various cognitive abilities such as language, the question could be reworded within the scope of this thesis as: Can a speaker who has been living outside of his/her native country for many years (decades) and regularly using an L2 (possibly even experiencing L1 attrition) still be considered a native speaker of his/her L1?
Looking back at the various sources cited and discussed above, we soon notice that very few researchers actually address this specific question, which can be broken down into three more specific questions: 1) Can a speaker who has been living outside of his/her native country for many
years (decades) still be considered a native speaker of his/her L1? 2) Can a speaker who has regularly been using an L2 still be considered a native
speaker of his/her L1? 3) Can a speaker who has possibly even been experiencing L1 attrition still be
considered a native speaker of his/her L1? The pure fact of emigration (see question 1) does not seem particularly problematic, but rather the associated, and probably to a certain degree inevitable, changes in linguistic behaviour (see questions 2 and 3). None of the sources consulted explicitly address the first question, but we do find comments on the others as discussed below.
In the majority of cases, we only find a brief, indirect reference to these questions, such as Lee’s first characteristic of a native speaker: “The individual acquired the language in early childhood (...) and maintains the use of the language (...)” (2005:), whereby the phrase “maintains the use of the language” is of particular interest here. For Paradis (cp. 1998:216) it is also important that the native speaker continues to use the first language. Turner (1997/2004) voices a similar opinion in his native speaker characteristic no. 5: “He/she mainly speaks L at home (...)”, although it is not explained (as mentioned above) why the home should play a more dominant role than other domains. Ballmer adopts a slightly different attitude and, rather than mentioning use of the language, claims that “a good native speaker” still “lives in his birthplace (...)” (1981:55), which would presumably indirectly mean that s/he continues to use the first language. This criterion may or may not be met by the fictitious speaker in our question. The majority will probably continue to use the L1 in the new environment, though overall use is very likely to decrease as the L2 gradually encroaches on domains previously reserved for the first language. If continuing to use the L1 (whether in the home or generally) is one of the decisive criteria of native speakerness, we will need to obtain this information from all our informants. A further characteristic mentioned by a number of sources is that of monolingualism, i.e. the native speaker is said to be monolingual. We find this requirement in Ballmer (1981:55), in Turner (1997/2004), and most vocally in Cook (1999:187 and later publications). Lee (2005) does not explicitly claim to agree with this but only writes: “Some may state that the only bona fide native speaker is a

74
monolingual speaker of a language (...)”, leaving his personal opinion open to interpretation. Porte (cp. 2003:108), in comparison, continues to refer to the participants of his study as native speakers although they are highly functional English-Spanish bilinguals, exhibiting signs of L1 attrition, and Brown does the same with her English-Italian bilinguals (cp. 2001:18). This particular criterion, therefore, seems to be more controversial than the requirement that the native speaker should still use the language today, and is much more vital to our discussion as our fictitious native speaker is definitely not monolingual, but someone who regularly uses their L2. If we consider monolingualism to be an essential criterion, then all multilinguals would have to be denied the label ‘native speaker’, which is precisely what Cook claims when he says that multilinguals are different types of beings from native speakers, and thereby not comparable (cp. for example 1993:6). Both of these factors relate back to question 2 as formulated above: Can a speaker who has regularly been using an L2 still be considered a native speaker of his/her L1? As we have seen, there is no global agreement here – some linguists would say “Yes”, others “No”. A third, related requirement affects linguistic proficiency. Mufwene, for example, has no problem, saying (1998:111) that “[n]ative speakers need not be proficient in all varieties of their language; nor need they remain proficient during their lifetime in the variety they acquired as a mother, or native, tongue.” Davies, after a lengthy discussion of the topic, also comes to the conclusion that “native speakers can cease to possess the language as native speakers after longish periods among non-native speakers” (1999:157), and goes on to list ways in which the language of such speakers could change, including loss of idioms and generative capacity typically subsumed under the heading of L1 attrition. Sharwood Smith, in contrast, uses the term “ex-native speaker” (1989:189-90) to describe those whose L1 is suffering from attrition. This factor relates back to question 3: Can a speaker who has possibly even been experiencing L1 attrition still be considered a native speaker of his/her L1? and so again here we can find no consensus: Mufwene and Davies, for example, would say “Yes”, Sharwood Smith “No”. Unfortunately the existing linguistic literature has not enabled us to come up with a satisfactory answer to our initial question: Can a speaker who has been living outside of his/her native country for many years (decades) and regularly using an L2 (possibly even experiencing L1 attrition) still be considered a native speaker of his/her L1? The main problem here, as so often, seems to lie in the fact that there is no agreement as to the defining characteristics of a native speaker, and without a definition such a question is virtually unanswerable.
2.4.2.5. The native speaker and the L2 In this section I would like to turn my attention to the second question formulated above, namely: Can a speaker become a native speaker of his/her L2? and see in what way the literature can contribute to an answer. The large majority of sources consulted (such as Cook,1999; Davies, 1995; Lee, 2005; Turner, 1997/2004; Medgyes, 1999; Paradis, 1998; Maher, 2001; Ballmer, 1981; Coulmas, 1981; Mufwene, 1998; Anchimbe, 2006; and Annamalai, 1998) agree on the fact that a native speaker has to learn his/her native language from birth

75
(or at least early childhood). Unfortunately it is rarely specifically discussed at which age ‘early childhood’ should be assumed to end, although we do find occasional references (see for example Lee, 2005; Turner 1997/2004) to the Critical Period Hypothesis (CPH), attributed to Lenneberg (1967), who claimed that L2 acquisition becomes impossible after puberty8
8 Nowaday it is more commonly assumed that, if at all, we should assume a ‘sensitive period’ in which L2 acquisition becomes increasingly more difficult, rather than a ‘critical’ one, after which such acquisition would become impossible. (See for example Singleton & Ryan, 2004.)
. The assumption within SLA (Second Language Acquisition) is often that any language learnt during this period, i.e. early childhood will be a native language or L1, and any learnt afterwards an L2. Turning back to our initial question, we can now say that the afore-mentioned authors therefore seem to assume that it is not possible to become a native speaker of a language learnt after early childhood (or presumably the onset of puberty at the latest) i.e. an L2.
Looking at the literature more closely, we find two further minority standpoints with regard to our question: 1) Speakers of more than one language (i.e. multilinguals) are native speakers of none of their languages, and 2) It can be possible for adult L2 speakers to become native speakers of their L2.
The first opinion is held and voiced most emphatically by Cook who, in many publications (for example 1999), claims that L2 users cannot be native speakers of their L2 because the language was not learnt in childhood, and that, in addition, knowledge of an L2 will change the L1 to such an extent, that such speakers can also no longer be considered native speakers of the L1. He writes for example (1999:194): “L2 users are different kinds of people, not just monolingual native speakers who happen to know another language.” Major seems to agree with Cook on this point, and writes (2002:67): “From one perspective, one might be tempted to say that L2 users are NSs of neither L1 nor L2, because their systems are different from monolingual NSs of both languages.” Lee (2005) is more cautious than these two, saying merely: “Some may state that the only bona fide native speaker is a monolingual speaker of a language (...).” Although these three authors form a minority with this rather extreme viewpoint, they would answer our question in the same way as the majority discussed above – for different reasons certainly, but the answer would be the same nevertheless: They would agree that it is not possible for a speaker to become a native speaker of his/her L2.
The final way of thinking to be presented here is one found in only two of the many sources consulted: Davies and Sollid, who both take the position that it is possible for an L2 speaker to become a native speaker of their L2. In her discussion of The significance of mother tongue, Sollid says (2007:2): “I acknowledge that a person can change his or hers [sic] mother tongue during the lifetime. Consequently, mother tongue is a social construct (...).” Davies, probably the most prolific linguist on the topic of ‘native speaker’, seems to almost regret his own conclusion, but does end up claiming (1991:3): “that it is possible but difficult for an adult second language learner to become a native speaker of the target language.” He also indirectly refers to the CPH, adding (ibid.:163)
(...) I have argued that the native speaker may be a native speaker of more than one L1, as long as the acquisition process starts early and necessarily prepuberty. After puberty, as I have shown (...), it becomes difficult – not impossible but very difficult – to become a native speaker.

76
In a recent publication (2008:433), he is still repeating this position, which means that he, together will Sollid, are the only two authors found, who would answer our initial question: Can a speaker become a native speaker of his/her L2? in a positive way, i.e. “Yes, s/he can.” All the others would answer in the negative, i.e. “No, s/he can’t.”
2.4.2.6. Conclusion Having looked in some detail at what various sources have to say on the topic of ‘native speaker’, I would here like to briefly summarise the findings, and then present my own ideas, including a definition of native speaker. As we have seen, there are almost as many ideas about what it means to be a native speaker as there are authors on the subject. Prof. Dorian (in Paikeday, 1985:34) neatly sums up why this topic has proven to be so problematic: “At the extreme, defining a native speaker is obvious. It’s at the low-proficiency end of things, and perhaps also at the deeply fluent bilingual end of things, that the concept becomes tricky.” In the section on folklore theory and the concept of ‘native speaker’ it was claimed that a native speaker of the language L has traditionally been understood as referring to someone who satisfies two main criteria: 1) to have been born and brought up with L as first language in a place where the majority also speak L as their first language, and 2) to have (comparatively) high proficiency in L. Typically, in the native speaker, these two main criteria will coincide, but more and more today, in an increasingly mobile and educated world, they do not – one may apply but not the other. This can happen, for example, when speakers move away from their native community as adults and become highly proficient L2 users, leading us possibly to question their status, both as native speakers of their L1 and their L2 (which is the precise situation of the potential L1 attriters under discussion in this thesis). It is above all for this reason that the label has become problematic in its practical application, and a more modern definition has become indispensable. A further factor which has led to a disconnection between the two criteria is (higher) education, which has contributed to a widening in the range of native language abilities9
9 That we do, in fact, find such a range of abilities within the group of native speakers has been attested in a number of publications such as Herdina & Jessner (2002:69-70), Cook (1999:186), and Strieker (2002:1).
. At the one extreme, we have those with little (or in some areas no) formal education, whose language proficiency will probably be minimal (i.e. only the spoken language and a limited vocabulary), and on the other hand, those who are well educated with a high degree of language proficiency (including the written medium, a large vocabulary and knowledge of many different registers). In my opinion, therefore, the reason the ‘concept becomes tricky’ is because it is composed of both background and linguistic criteria, which will typically co-occur, but do not logically have to – and often don’t. So what should we do? Many authors, the most vocal of whom is probably Paikeday (1985), have advocated dropping the term ‘native speaker’ altogether, but I consider this rather unrealistic, and do not believe that society and/or linguistics is ready to take this step at present. If we did drop it, we would need an alternative as both academia in the form of linguists, and more commercial enterprises seem to have a need for distinguishing a native speaker (whatever their understanding of the term may be) from other types of speaker. In my opinion, there is no getting around the fact that the term is important for many different types of people, in various situations, where it may also be used with

77
numerous meanings e.g. a person born and brought up in a certain country, or a speaker with a certain type of intuitive language proficiency, etc. My suggestion would, therefore, be to have a very basic definition for ‘native speaker’ and then add requirements appropriate to the various particular situations in which such a speaker is needed, e.g. the linguistic informant (who can comment on degrees of grammaticality for example) should be monolingual and an educated native speaker but without specific linguistic training. The proofreader, in contrast, would probably benefit from some linguistic training but otherwise be indistinguishable from the informant. The English teacher, on the other hand, could be a native or non-native speaker, with a high degree of proficiency in the language to be taught, ideally also knowledge of at least one other language (to have first-hand experience of language learning), and appropriate teacher training. The translator will obviously have to be multilingual and will also need a high degree of proficiency in both or all languages involved, but should be allowed to translate into his/her dominant language, no matter which is the first or native language. In other words I propose not dropping the term, but rather giving up the search for that one, comprehensive, ‘one size fits all’ definition which will suit each and every occasion. So much for the practical side of things, but what about a more theoretical, linguistic definition. In my opinion we need to look more closely at both the morphology and etymology of the phrase ‘native speaker’, and in particular the lexeme native. The Oxford Advanced Learner’s Dictionary (2005), for example, offers the following entry for the adjective native: “connected with the place where you were born and lived for the first years of your life (...).” At this point I feel sorely tempted to say that I agree with other linguists (such as Davies, 2008:438, and, in particular Cook in various publications) in saying that someone who is born and grows up in a particular place, thereby naturally learning the language of this community as his/her first or native language, is a native speaker of this language – for life. However, I have serious reservations about doing that, as such a definition would exclude all those who learn a language naturally from their parents but in a community or country where it is not spoken by the majority. Examples of such speakers would be second- or even third-generation Turks in Germany, or any child learning a second language not widely spoken in the local community. In fact such a definition would deny child multilingualism altogether as it is not physically possible to be born and grow up in more than one community. The only solution in such a case would be to assume that the entire community is multilingual, which may actually apply in some cases. Surely, it must be possible to acquire a language in a native-like way, even if the language is not spoken in the wider environment – it is the immediate environment (i.e. generally the family) which is of paramount importance in first language acquisition. Taking all of these factors into consideration, I would like to propose the following definition of ‘native speaker’: My definition of ‘native speaker’ A native speaker of the language L is someone who has learnt L naturally from their environment (normally their parents) from birth or very early childhood i.e. for whom L is the first language (or in the case of child bilingualism, one of two or more first languages) and who was exposed to and brought up with L for the first (roughly 14-1610
10 14-16 years has been chosen as, assuming the existence of some kind of sensitive period for language acquisition and the role of puberty therein, the L1 can be assumed to be relatively stable by this age, and any other language would have to be treated as an L2.
) years of life.

78
For me this criterion is the one essential one a native speaker must satisfy, and in fact a number of the contributors in Paikeday (1985) such as Prof. Gates (ibid.:11), Prof. McDavid (ibid.:35), and Prof. Gimson (ibid.:72) agree with me on this point. All the other characteristics often cited in the literature (such as being monolingual, born in a certain place, still using the language, etc.) will, in my opinion, not affect this status but merely lead to more or less (proto)typical native speakers. With this definition I claim that the immediate linguistic environment is more important than the wider one (i.e. the country or community) in which first language acquisition takes place, although the two will generally match, i.e. first language acquisition of L will – more often than not I would assume – take place in a community where L is spoken by the majority.
This particular criterion, related to a speaker’s linguistic background, is obviously a static one; you either do – or do not – learn a certain language in childhood. This factor does not change over time – unlike language proficiency, for example, and therefore, you cannot lose the status, once acquired. Even if your language proficiency should deteriorate e.g. through emigration and long-term multilingualism, you remain a native speaker of your first language. Equally, you can never become a native speaker of a second language, unless you also learn it from early childhood, which would mean being a child bilingual, with (theoretically) two or more native languages, i.e. the languages would be L1s. (The precise dividing line between simultaneous acquisition of two or more L1s and consecutive acquisition of an L2 (i.e. after the L1) in children may prove impossible to define, although it is often assumed to be related to puberty as claimed in the Critical Period Hypothesis (CPH)). Given enough time, effort, and probably aptitude as well, there is, however, no reason why a late bilingual (i.e. someone learning an L2 after the onset of puberty) cannot become ‘native speaker-like’ in his/her L2, or possibly even completely indistinguishable from the ‘real’ native speaker (although there is psycho- and neurolinguistic evidence that some subtle differences will always endure11
Cook says a native speaker is monolingual, and that all those people who speak more than one language are “a different type of being (...)” (Cook, 1993:6). He calls this multicompetence and claims (1999:191) that “[m]ulticompetent minds that know two languages are qualitatively different from those of the monolingual native
), but, still, the label ‘native speaker’ is one such a speaker can never acquire.
Having said that, I would like to make it very clear that this strict division into ‘native speaker’ and ‘non-native speaker’ wholly on account of origin need not generally matter, for the simple reason that it does completely ignore linguistic proficiency. In virtually all cases where a native speaker is traditionally (according to the folklore concept) considered the ‘perfect’ person to fill a specific vacancy, especially for example in ELT (English Language Teaching) or translating, what the employers in fact require is a highly proficient (and ideally a trained) speaker of a certain language (or in translating, of course, of more than one language). As we have just seen above, though, proficiency is not part of my definition of ‘native speaker’, which may initially seem surprising, and yet a number of studies and other publications (see for example Coveney, 1998; Lowie, 2005; Chambers in Paikeday, 1995:30) claim or have actually shown that native speakers are not necessarily the more proficient users of their (native) language when compared with L2 users, again underscoring the tenuous relationship between being a native speaker and being (highly) proficient in a certain language.
11 As discussed, for example, in Cook (1999:191) or Sorace (2003:132-3).

79
speaker in a number of ways.” I do agree that knowing another language (well) seems to change the representation of the L1 in the brain and that therefore multilingual minds may be subtly different from those of Cook’s monolingual native speaker, but am not willing as a consequence to deny all such speakers the label ‘native speaker’, assuming they were born and grew up with the language as L1. Maybe a compromise would be to simply incorporate such differences within the general category of ‘variation in proficiency’ which, as discussed above, is also found within the group of native speakers. Given such variety, I believe it is necessary to envisage the concept as a prototype, which allows for such gradience, and where those speakers who fulfil all of the required criteria are the prototypical native speakers. The multilinguals who satisfy the background criterion are therefore still native speakers according to this definition, but a less prototypical sub-type12
12 Such a proposal is also supported, for example, by Paradis who writes (1998:210) that “the difference between a unilingual speaker and a bilingual speaker is one of degree rather than kind.”
. Now, having finally come up with a definition, we can tackle those two earlier
questions, which have so far proved elusive: Can a speaker who has been living outside of his/her native country for many years (decades) and regularly using an L2 (possibly even experiencing L1 attrition) still be considered a native speaker of his/her L1? and Can a speaker become a native speaker of his/her L2? With this clear definition, both questions can now be answered simply and unequivocally: “Yes” to the first one, and “No” to the second. “Yes” because once you are a native speaker you remain one for life, regardless of where you live, which other language(s) you may learn later, and the effect all this may have on your first language. “No” because if you are not brought up with your L2 (in which case we would call it an L1 anyway), you are not a native speaker, and it is impossible to become one later. As stated above, this definition is quite strict in separating native from non-native speakers, but I do not consider that problematic, as, simultaneously, I recommend that the label ‘native speaker’ should only have marginal relevance in our daily lives. The main criterion in allocating jobs must be proficiency and general suitability for the position, and this will often have very little to do with the age at which someone started learning a language.
The distinction between native and non-native speakers in such a definition is therefore (relatively) clear-cut, with individuals being placed on the one side or the other of the dividing line depending on their biography. Within the group of native speakers, however, I assume an enormous amount of variation (where proficiency, usage, mono- vs. multilingualism, etc. will vary), and to capture this I suggest treating the internal structure of the term as a prototype, allowing us to identify degrees of native speakerness. The prototype would be that native speaker who, in addition to meeting the background requirement, fulfils all the other criteria listed in the following section. Those speakers who do not satisfy one or more of these latter criteria, such as our potential L1 attriters (who violate at least one criterion: monolingualism) would, therefore, be more peripheral native speakers. In the following section this idea of treating the concept ‘native speaker’ as a prototype will be explored further, and a specific model, developed for this thesis, will be presented and discussed.
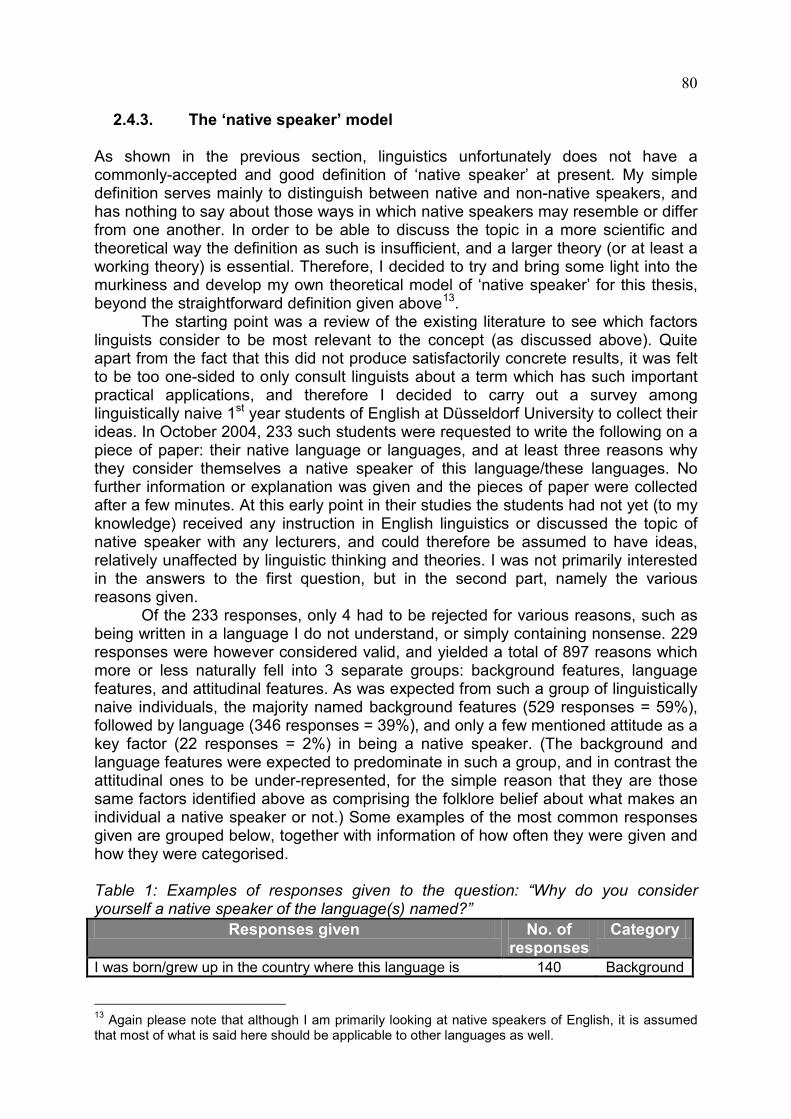
80
2.4.3. The ‘native speaker’ model
As shown in the previous section, linguistics unfortunately does not have a commonly-accepted and good definition of ‘native speaker’ at present. My simple definition serves mainly to distinguish between native and non-native speakers, and has nothing to say about those ways in which native speakers may resemble or differ from one another. In order to be able to discuss the topic in a more scientific and theoretical way the definition as such is insufficient, and a larger theory (or at least a working theory) is essential. Therefore, I decided to try and bring some light into the murkiness and develop my own theoretical model of ‘native speaker’ for this thesis, beyond the straightforward definition given above13
Responses given
. The starting point was a review of the existing literature to see which factors
linguists consider to be most relevant to the concept (as discussed above). Quite apart from the fact that this did not produce satisfactorily concrete results, it was felt to be too one-sided to only consult linguists about a term which has such important practical applications, and therefore I decided to carry out a survey among linguistically naive 1st year students of English at Düsseldorf University to collect their ideas. In October 2004, 233 such students were requested to write the following on a piece of paper: their native language or languages, and at least three reasons why they consider themselves a native speaker of this language/these languages. No further information or explanation was given and the pieces of paper were collected after a few minutes. At this early point in their studies the students had not yet (to my knowledge) received any instruction in English linguistics or discussed the topic of native speaker with any lecturers, and could therefore be assumed to have ideas, relatively unaffected by linguistic thinking and theories. I was not primarily interested in the answers to the first question, but in the second part, namely the various reasons given.
Of the 233 responses, only 4 had to be rejected for various reasons, such as being written in a language I do not understand, or simply containing nonsense. 229 responses were however considered valid, and yielded a total of 897 reasons which more or less naturally fell into 3 separate groups: background features, language features, and attitudinal features. As was expected from such a group of linguistically naive individuals, the majority named background features (529 responses = 59%), followed by language (346 responses = 39%), and only a few mentioned attitude as a key factor (22 responses = 2%) in being a native speaker. (The background and language features were expected to predominate in such a group, and in contrast the attitudinal ones to be under-represented, for the simple reason that they are those same factors identified above as comprising the folklore belief about what makes an individual a native speaker or not.) Some examples of the most common responses given are grouped below, together with information of how often they were given and how they were categorised. Table 1: Examples of responses given to the question: “Why do you consider yourself a native speaker of the language(s) named?”
No. of responses
Category
I was born/grew up in the country where this language is 140 Background
13 Again please note that although I am primarily looking at native speakers of English, it is assumed that most of what is said here should be applicable to other languages as well.

81
spoken My parents/other family members speak this language 76 Background I can understand and use this language/grammar intuitively 61 Language This is the language I have grown up with 60 Background This is the 1st language I learned/to which I was exposed 54 Background I think in this language 50 Language I am able to use this language fluently 36 Language This is my most-used language (on a daily basis) 32 Language This is the language of schooling 29 Background I dream in this language 21 Language This is the language learned from my parents 20 Background This is the language in which I have the largest vocabulary 16 Language I have a feeling for/am involved in the culture of the country where this language is spoken
8 Attitude
This is the language of my home country (“Heimat”) 8 Attitude I have positive feelings towards this language or country 3 Attitude This is the language of emotions (incl. swearing) for me 3 Attitude Although background was named most frequently in the survey, this factor is not included in the model presented below (which is intended to represent the internal structure of the category) as it is essential for distinguishing the ‘native’ from the ‘non-native speaker’ i.e. I treat background as an external rather than an internal factor, and the one which has to be satisfied by all native speakers (as discussed in the definition above).
Combining the responses from the survey and the linguistic literature, a model was developed (loosely based on the basic ideas of prototype theory as proposed by Rosch, 1973) which assumes that the concept of native speaker is fuzzy, and individuals can be better or worse representatives of the category. Within this model, the remaining two types of feature (i.e. language and attitude) are treated as logically separate but presumably related aspects of the concept, which are also both equally important, i.e. the factors have not been weighted. Ideally a third factor would be included, which was largely inspired by Kate Fox’s book Watching the English, and which I have called the social/behavioural factor. This would include the main characteristics she identified as being typical of English speakers (i.e. social dis-ease, humour, moderation, hypocrisy, empiricism, Eeyorishness, class-consciousness, fair play, courtesy and modesty as presented in Figure 5 above). Unfortunately however, it was not possible to gather any such data from the participants of this study, and therefore the model only includes the following two factors at present. Figure 6: The two components of the native speaker model
Attitude features
Language features

82
Figure 7 below takes this idea a step further and shows the interaction of these two factors, converted into requirements for a native speaker. The assumption behind this model is that a prototypical native speaker will meet both the language and the attitudinal requirements, and therefore the area where both intersect is assumed to represent such prototypical native speakers.
Figure 7: The concept of native speaker as a prototype Neither of these two central requirements is to be understood as one, elementary concept but rather a whole cluster of concepts, i.e. both language and attitudinal requirements consist of a number of other sub-requirements, as listed in Tables 2 and 3 below: Table 2: Those requirements which together form the language requirement 1) monolingualism i.e. only speaking/using English 2) English is the dominant language 3) English is the language in which the speaker has the largest vocabulary 4) English is the language in which the speaker has no pronunciation problems 5) English is the language learned first 6) English is the language learned naturally 7) English is the language used intuitively 8) the knowledge of English grammar (‘right’ and ‘wrong’) is intuitive 9) English is the language used most on a daily basis 10) English is the language of the environment 11) English is the language used in the home 12) English is the language used with/by friends 13) English is the language used internally for thought/dreaming 14) English is the language used for counting/maths 15) English is the language in which the speaker is familiar with slang, dialects, etc.
Speakers who meet the attitudinal requirements
Speakers who meet the language requirements
Prototypical native speakers
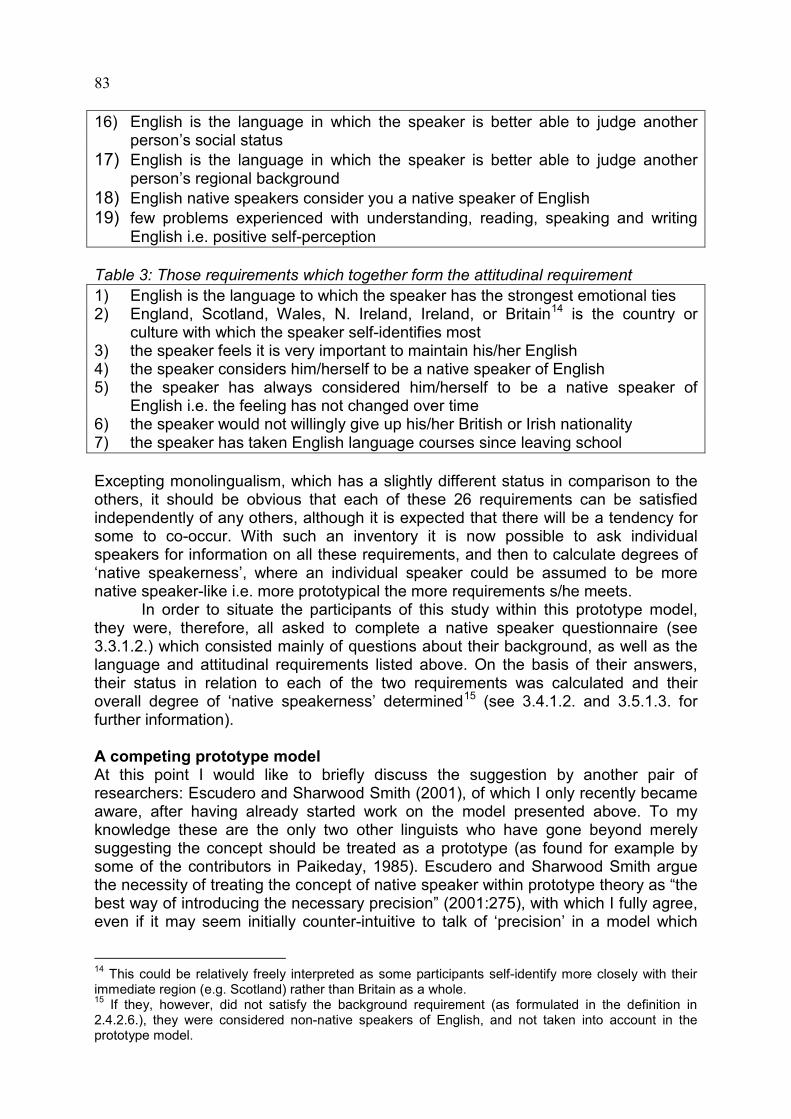
83
16) English is the language in which the speaker is better able to judge another person’s social status
17) English is the language in which the speaker is better able to judge another person’s regional background
18) English native speakers consider you a native speaker of English 19) few problems experienced with understanding, reading, speaking and writing
English i.e. positive self-perception Table 3: Those requirements which together form the attitudinal requirement 1) English is the language to which the speaker has the strongest emotional ties 2) England, Scotland, Wales, N. Ireland, Ireland, or Britain14
In order to situate the participants of this study within this prototype model, they were, therefore, all asked to complete a native speaker questionnaire (see 3.3.1.2.) which consisted mainly of questions about their background, as well as the language and attitudinal requirements listed above. On the basis of their answers, their status in relation to each of the two requirements was calculated and their overall degree of ‘native speakerness’ determined
is the country or culture with which the speaker self-identifies most
3) the speaker feels it is very important to maintain his/her English 4) the speaker considers him/herself to be a native speaker of English 5) the speaker has always considered him/herself to be a native speaker of
English i.e. the feeling has not changed over time 6) the speaker would not willingly give up his/her British or Irish nationality 7) the speaker has taken English language courses since leaving school
Excepting monolingualism, which has a slightly different status in comparison to the others, it should be obvious that each of these 26 requirements can be satisfied independently of any others, although it is expected that there will be a tendency for some to co-occur. With such an inventory it is now possible to ask individual speakers for information on all these requirements, and then to calculate degrees of ‘native speakerness’, where an individual speaker could be assumed to be more native speaker-like i.e. more prototypical the more requirements s/he meets.
15
At this point I would like to briefly discuss the suggestion by another pair of researchers: Escudero and Sharwood Smith (2001), of which I only recently became aware, after having already started work on the model presented above. To my knowledge these are the only two other linguists who have gone beyond merely suggesting the concept should be treated as a prototype (as found for example by some of the contributors in Paikeday, 1985). Escudero and Sharwood Smith argue the necessity of treating the concept of native speaker within prototype theory as “the best way of introducing the necessary precision” (2001:275), with which I fully agree, even if it may seem initially counter-intuitive to talk of ‘precision’ in a model which
(see 3.4.1.2. and 3.5.1.3. for further information). A competing prototype model
14 This could be relatively freely interpreted as some participants self-identify more closely with their immediate region (e.g. Scotland) rather than Britain as a whole. 15 If they, however, did not satisfy the background requirement (as formulated in the definition in 2.4.2.6.), they were considered non-native speakers of English, and not taken into account in the prototype model.

84
assumes ‘fuzziness’. They also cite “the shadowy borderline that divides native from non-native” (ibid.:277), and discuss a number of problematic cases, coming to the conclusion that “a straightforward structural-linguistic definition of native-speaker has to be impossible” (ibid.:279). To a certain extent I also agree that “categories are dynamic and are rarely, if ever, constructed twice by the same cognitive system” (ibid.:281). It is for this very reason that I suggest above (in 2.4.2.6.) that, when applying the term ‘native speaker’ to concrete situations, each employer should think very carefully about the skills his/her new employee is required to have, and fill the position on the basis of these, rather than taking the supposedly easier option of looking for a native speaker, which will mean different things to different people.
In their account, Escudero and Sharwood Smith suggest “the sorts of features of speakers that the layperson on the one hand, and the linguist on the other, might use to make judgments about potential native speakers” (ibid.:281). This is an important distinction of course, and one which was discussed above when comparing folklore concepts of what it means to be a native speaker with those held by linguists. In my model these two, separate ideas have been fused together, whereas Escudero and Sharwood Smith prefer to allow each individual to construct his/her own prototype which may differ regarding the “assumptions as to which features are core, which are peripheral, and which are indeterminate between core and peripheral features” (ibid.:281-2). An example of two core features could be “having been brought up in a community of speakers of the language and having the accent of that community” (ibid.: 282), whereby a speaker who has both of these would be considered more prototypical than someone who only has one. I have two major problems with this particular model, the first of which is that they claim “the prototype profile chosen by linguists and SLA researchers should be expressed purely in intralinguistic terms” (ibid.:283-4), which forces us to “regard an L2 learner who conforms linguistically to the model as unambiguously native” (ibid.:284) and to exclude “people undergoing L1 language attrition or suffering from any kind of language impairment, despite their being perceived as natives by others” (ibid.). Altogether, such suggestions seem too far removed from reality to my mind, as the term native speaker is not one found solely in linguistic articles, but it also plays an important role in life outside linguistics, and this should not be neglected in our considerations, if these are to have any wider relevance outside the immediate scientific community. An additional problem that I have with this approach is that, due to the fact that individuals are assumed to have different prototypes, implementation as a theoretical model would seem to be quite difficult, if not impossible. Which prototype is to be assumed in a study, and how can individuals be compared to it, if the prototype can show such variation? I do think that this account may reflect cognitive reality better than my own, simpler model, and thereby in fact be the better model, but at present it seems too complicated to be applied, and therefore the model presented above will not be amended.
Unfortunately the authors have not followed up on their initial ideas or developed them further (p.c.), but it is to be hoped that others will take up the challenge and pursue them, as I feel they are very promising. Or maybe future models will blend this one with my own and thereby create something better than either of these individual suggestions.

85
3. Research project In the following sections, the research project on L1 attrition and the concept of ‘native speaker’ carried out for this thesis is presented in detail. We start with the design of the project including methodology and more theoretical concerns, then move on to the results and finally a discussion of the findings and how the study has contributed to this field of research.
3.1. Theoretical framework
This research project suspects the limited validity of a number of theoretical ideas discussed above, such as language being a dynamic system (see 2.3.6. above), Paradis’ Activation Threshold Hypothesis (see 2.3.4.) and Communication Accommodation Theory (see 2.3.7.), but does not actually test any of them explicitly. The study consists of two separate, but related, parts: the first is interested in the question whether L1 attrition can be found in the data collected from the attrition group when compared with the L1 control group, and the second part is more interested in investigating how native speaker-like the various individuals in all three groups of participants are, and to what extent (if at all) this rating correlates with language proficiency (as measured in the various language tests). The language attrition part of the study does not aim to test any specific theory but is instead explorative, aiming to describe and find explanations for phenomena which have only been insufficiently investigated in the past. Looking again at the few studies carried out on the non-pathological attrition of L1 English in adults, Clyne’s study (see 2.1.3.1.) is the only one found which has previously focused on the particular language combination of interest here, i.e. L1 English and L2 German, and his study is not really comparable with this one for a number of reasons. For example, he compares the data from his English attrition group with a group of adults with the opposite language combination (i.e. L1 German and L2 English) living in Australia. In other words he has no control group in the sense of a group of non-attrited L1 speakers, unlike this study. The data collected in Clyne’s study is mainly from the interviews which were carried out, partly supplemented by notes made during free conversation or from letters. This study, however, has a larger range of tests, hoping to tap into different types of language proficiency. Another important feature of this study, which is missing in Clyne’s, is the inclusion of a number of sociolinguistic predictor variables, to investigate their role in any possible L1 attrition. Clyne concentrated mainly on interference phenomena in his data analysis, which is not the focus of this study, and therefore it is felt that this particular study does have something new to contribute to the field of L1 attrition, even if a particular theory is not being tested. The native speaker part of the study is based on the theoretical model developed for this thesis and presented above. At this point, and for easy reference later, the definitions of two of the terms used in the title of this thesis, namely multilingualism and native speaker are repeated, and a working definition of the third: (adult non-pathological) L1 attrition is presented.

86
Multilingualism (repeated from 2.1.1.): Multilingualism refers to “the command and / or use of two or more languages by the respective speaker” (Herdina & Jessner, 2002:52). It “ranges from monolingual acquisition, that is the learning of an L2 by a native speaker, to balanced bilingualism or even ambilingualism and to the command of three or more language systems (...)” (ibid.:117-8). (adult non-pathological) L1 attrition: A good, basic description of this type of attrition is offered by Fase, Jaspaert & Kroon as early as 1992:
In its simplest form loss occurs when that minority group member cannot do the things with the minority language he used to be able to do. He used to be able to discuss soccer with his friends, or give a lecture on a scientific subject, or read a newspaper without the aid of a dictionary, and now he encounters difficulty doing these things. Some of the proficiency he used to have is no longer accessible (p.8).
A good theoretical definition on the other hand, was suggested by de Bot during his presentation at the First International Conference on First Language Attrition in Amsterdam in August 2002: “Language attrition is a decline of retrievability of declarative linguistic knowledge and deproceduralization of linguistic knowledge in L1, and an increase of competition by L2 knowledge.”
For this thesis, however, the following working definition will be used: (adult non-pathological) L1 attrition is language behaviour exhibited by the attrition group (i.e. the results and scores from the various tests carried out) which deviates significantly from that of the L1 control group, i.e. is worse. Native speaker (repeated from 2.4.2.6.): A native speaker of the language L is someone who has learnt L naturally from their environment (normally their parents) from birth or very early childhood i.e. for whom L is the first language (or in the case of child bilingualism, one of two or more first languages) and who was exposed to and brought up with L for the first (roughly 14-16) years of life.
3.2. Methodology In this section, the procedures and methods adopted for the study are presented.
3.2.1. Design features The major design features of this study are: quasi-experimental, rather than purely experimental, as neither the selection of
the participants nor their distribution among the three groups were able to be carried out randomly;

87
between-groups, as the main focus is on any significant differences between the three groups of participants16
cross-sectional, rather than longitudinal;
17
partly matched-subjects only, as age, gender, education, etc. do not match perfectly in all three groups.
, as testing took place at one point only rather than over a period of time;
3.2.2. Participants Three different groups of participants have been involved in this project, namely the attrition group, the L1 control group (or reference group, whose data formed a baseline against which the attrition group could be compared for any signs of L1 attrition), and the German control group (consisting of native speakers of German) whose function was largely twofold: one to be a control group for the L2 German of the attrition group (particularly when analysing the German C-Test), but also to enable conclusions about the predictive power of the label ‘native speaker’ to be drawn, by comparing the test scores of the native speakers on the one hand (i.e. the attrition and L1 control groups) and this group of non-native speakers on the other. The recruitment of all participants took place either through personal contacts or with the help of various institutions such as the British Women’s Club in Düsseldorf. All participants received a (first name) pseudonym to retain their anonymity in the study; any names given are therefore not the actual names of any of the participants. The importance of establishing a control group in such studies has often been emphasized in previous publications (see for example Freed, 1982:3; Andersen, 1982:85; Gürel, 2004b:61). Here there is general agreement that the control group should consist of a “group that is similar to the experimental group except for the treatment factor”18
16 However, particularly when discussing the native speaker ratings and the impact of the predictors on any L1 attrition the participants will be viewed not only as members of their respective group but also individually, to allow within-group comparisons. 17 Jaspaert et al. say (1986:39) that “a longitudinal design is not feasible in research on L1 loss” as the process seems to be too slow. 18 The “treatment factor” in this study is the experience of emigration, living abroad, and multilingualism, distinguishing the attrition group from the L1 control group.
(Jaspaert et al. 1986:41), and that it will “contain a selection of speakers still living in the original speech community or a selection of speakers who have very recently emigrated” (ibid.:42). Köpke & Schmid (2004:29) also write that it is generally advisable to have a monolingual control group but add that “very often, choosing a unilingual group of subjects will produce an average level of education that is much lower than that of the group of attriters.” As can be seen in the table below, special care was taken during the recruitment of participants for this study to ensure that the level of education was comparable between the attrition group and the L1 control group (i.e. 64 vs. 65% university education). Assuming multi-competence (as discussed in 2.1.1. above) is fundamentally different from monolingual language competence, it is of course nonetheless problematic to simply compare the two types of speaker, but at present there seems to be no better method, and the monolingual speakers are therefore treated as a baseline for the attrition group, despite some slight misgivings.

88
In Table 4 below, some basic information about the three groups is given; further details on the individual participants can be found in the appendix. Table 4: Some basic information about the participants (N=64) Attrition group L1 control group German control
group N (= 64) 25 20 19 Sex19 17 female / 8 male
68% / 32% 11 female / 9 male
55% / 45% 13 female / 6 male
68% / 32% Level of education
16 x university degree = 64%
13 x university degree = 65%
19 x university degree = 100%
Age at testing
mean: 52 median: 55 SD = 8.05
mean: 43 median: 42 SD = 8.30
mean: 34 median: 32 SD = 6.69
Number of L2s spoken
mean = 3 median = 2 SD = 1.85
mean = 1.7 median = 1.5
SD = 1.42
mean = 3.5 median = 4 SD = 1.26
Age at emigration
mean: 26 median: 27 SD = 6.06
n/a
n/a
LOR (Length of residence in Germany)
mean: 26 median: 28 SD = 8.95
n/a
n/a
As can be seen from the table above, a total of 64 participants took part in the study: 25 in the attrition group, 20 in the L1 control group, and 19 in the German control group. Ideally, the numbers, as well as the distribution of sex, age and level of education should be identical in all three groups, but this was unfortunately not possible. It is, for example, typical for such studies to have a majority of female participants, although this tendency is less pronounced in the L1 control group than the others. Age also varies among the groups as does education, although this latter discrepancy was unavoidable for methodological reasons, i.e. the German control group had to have a high enough proficiency in the L2 English to participate in the study, and therefore it was decided to only include those persons with a university degree in the language. A wide range of English language proficiency was however specifically desired in the attrition and L1 control groups, and so a larger variety of education levels (which is predicted to be at least partly associated with language proficiency)20
The members of the attrition group are all British or Irish natives, who were born and brought up in the United Kingdom or the Republic of Ireland, and had been living in Germany for at least ten years at testing, as is considered the norm in attrition studies (see for example de Bot et al., 1991:88; de Bot & Hulsen, 2002:263; Gürel, 2004a:231)
is to be found in these two.
21
19 Some studies prefer to use the term ‘gender’ (which is a more sociopsychological distinction than ‘sex’) to distinguish between male and female. As the participants were asked to give information about their ‘sex’ in the questionnaires, this term is also used here. 20 cp. hypothesis no. 10) below. 21 There is one exception here, namely ‘Lewis’ who had only been in Germany for six years at the time of testing. As this person’s test scores and other biographical details are, however, comparable to the others in the attrition group, it was decided to keep him as a participant.
. At the time of testing, this group were on average 52 years old,

89
and had emigrated 26 years earlier, at a mean age of 26. An upper age limit of 65 was set, rather randomly but in keeping with earlier studies, to take into account the fact that “even native speakers of a language might experience first language attrition due to old age” (Ammerlaan et al. 2001:11). The factor “age at emigration” was also controlled in that only those participants who were at least 16 at emigration were allowed to take part in the study. This is considered important in attrition studies to avoid comparing genuine L1 attrition with incomplete L1 acquisition (see for example Freed, 1982:5; Andersen, 1982:85; van Els, 1986:9; Ammerlaan et al., 2001:10; Kaufman, 2001:185; de Bot et al., 2001:88; for comments). With one exception (‘Alice’ who claims to speak virtually no German) all of the members of this group are more or less functional bilinguals in German and English, and, on average, also know two further L2s. The majority (i.e. 17 of the 26) have a German partner, with whom they also speak German at least occasionally. 64% of the attrition group have a university degree; the remainder have all at least completed secondary school with academic qualifications such as O-levels. The members of the L1 control group are also British or Irish natives, but, in contrast to the attrition group, these participants have never spent a longer period of time (i.e. more than a few months) in a foreign country. In fact the very large majority of these people have never left their native country for more than a few weeks’ holiday at any one time. They are also largely monolingual, generally having learnt one or more foreign languages at school, but neither do they speak any of these on a regular basis, nor are they particularly proficient in them22
22 Cook (2003:13) says that, assuming “L2 effects on L1 happen only at advanced stages of the L2, it would be safe to count as monolinguals people who had only a smattering of a second language, say as a school subject.”
. (In other words, this group is comparable to the attrition group except for the ‘treatment’ of emigration, living abroad, and multilingualism.) 65% of this group have a university degree, which is comparable to the 64% in the attrition group. (Unfortunately, education is confounded with sex in the attrition group as around 69% of the university-educated participants are women, and only roughly 31% men. In the L1 control group, this is a negligible problem as roughly 46% of these participants are men, and 54% women, i.e. the distribution is fairly even.) The L1 control group is on average somewhat younger than the attrition group, but older than the German control group.
The original plan was only to compare the data from the attrition group with an L1 control group, but as the scope of the study was expanded it was felt useful to also include a German control group, so an additional 19 participants, who are all German native speakers, were recruited and tested. As mentioned earlier, these all have a university degree in English to ensure they would be able to complete the same tasks as the native speakers. They also use English regularly in their professional lives as the majority are university lecturers in English departments or translators/interpreters. This group is somewhat smaller than the other two, and also has the lowest mean age. In the following table, showing the criteria which each group had to meet in order to be accepted to participate in the study, the participation criteria for the three groups are summarised:

90
Table 5: An overview of the participation criteria for the three groups. Participation
criteria Attrition group L1 control group German control
group Age at testing 26-65 25-65 25-65 Age at emigration at least 16 n/a n/a Health situation healthy healthy healthy Level of education not relevant not relevant university degree in
English Languages spoken L1 English, L2
German (level not important), others
not relevant
L1 English, little or no knowledge of
others
L1 German, (very) good L2 English,
others not important
Experience of living abroad
at least 10 years in Germany
none, or very little (max. few months)
not relevant
3.2.3. Variables The dependent variables in this study are the results (scores or outcomes) obtained by the participants in the various tests as described in the “test battery” section below. The independent or predictor variables are all those which may influence these results, namely the (mainly sociolinguistic) information which was collected on each of the 64 participants (from all three groups) using the two questionnaires they were required to complete (see 3.3.1. below). These predictors are: age (at testing) sex level of education23
number of L2s spoken. , and
A further four predictor variables were calculated for the L1 controls and the attriters (i.e. the two native speaker groups) based on the information given in the questionnaires: native speaker rating (self-reported) L1 proficiency L1 use, and L1 attitude. The final four predictors are only of relevance for the attrition group: age at emigration length of residence (LOR) L2 use, and (self-reported) L2 proficiency. This may seem a large number, and results in rather unwieldy statistic analyses but as Oxford, for example, says (1982:133) “[i]t is important to conduct “comprehensive” studies using multiple predictor variables, because LSA24
23 This variable is, however, only relevant for the attrition and L1 control groups as it was controlled in the German control group (where all participants have a university education). 24 LSA refers to “language skill attrition” here.
research has shown that

91
these variables do not act in isolation”. Another reason for including so many variables is that this is designed as an exploratory study, where the effect of the individual variables is not easily predictable. A further variable which may well affect attrition or retention of a once-learned language is aptitude (see for example Dorian, 1982:53), but it has not been included in this study to avoid adding further tests for the participants, which would have lengthened the interview process.
3.2.4. Research questions This study aims to address two main research questions: 1) The attrition group (or treatment group) is compared with the L1 control group to investigate whether, and if so to what degree, the predictor variables listed above affect the outcome variables (dependent variables), i.e. whether any of them individually or in combination are able to predict L1 attrition as measured through the various scores achieved in the language tests (and compared to the baseline provided by the L1 control group). 2) A second research question is, assuming at least some of the test scores do vary significantly between any of the three groups, whether the native speaker status (as measured in the native speaker rating) of the individual participants is able to predict these scores, i.e. whether the label ‘native speaker’ has any predictive power with regard to language proficiency.
3.2.5. Hypotheses
Here I would like to turn the reader’s attention back to what was said earlier in this thesis, very briefly repeat the pertinent findings from studies and various other, more theoretical publications, and turn all this information into predictions or rather hypotheses about the data collected in this study. In addition to these, more specific predictions about the findings of individual tests are made below where the test battery is presented and discussed. For those hypotheses where it is possible to estimate how the predictor variable could affect the dependent variable, directed (one-tailed) hypotheses have been formulated. Where the effect is less clear, open (two-tailed) hypotheses have been preferred. We will start by looking at L1 attrition, and then move on to the ‘native speaker’ concept.
3.2.5.1. Hypotheses about (adult non-pathological) L1 attrition In this section we will be taking a look back at what has been said so far about this type of L1 attrition to see which predictions or hypotheses can be made about the data collected for this study. The individual predictions are numbered for easier reference later in the paper when the results will be presented and discussed, and at which time the decision will be made whether the data allow us to reject the null

92
hypothesis (which is not explicitly formulated) and accept the alternative hypothesis as outlined here, or not25
The speech of the attrition group contains significantly more silent and filled pauses and retracings
. Lexicon This area of language has often shown itself to be the major weak point in this type of L1 attrition (the language’s Achilles heel, so to speak), particularly for certain lexical items such as infrequent, specific nouns. A general decrease in lexical diversity has also been observed in many studies. One reason which was discussed above to explain these findings is that the lexicon is part of declarative knowledge which is in many ways more vulnerable than procedural knowledge (which includes grammar and phonology). HYPOTHESIS 1) The attrition group differs significantly from the L1 control group in that lexical diversity is decreased and significantly more basic level, non-specific lexemes (as a percentage of the total number of lexemes produced in the FiCAs) are used. Fluency Many studies have reported a decrease in overall fluency, exemplified by generally slower, more halting speech and an increase in silent pauses. Here, it will not be feasible to measure all the temporal features of the participants’ speech, but some are investigated. HYPOTHESIS 2)
26
Within healthy adults, age is not generally assumed to have a major impact on language proficiency, and in this study the age range was limited to participants
than that of the L1 control group. Time frame LOR (length of residence) is often only assumed to be an important variable in L1 attrition research when comparing speakers early in the emigration period with those who have been abroad longer. It is, however, not entirely clear whether the LOR range exhibited by the participants will measurably affect attrition, and if so, how. For that reason this hypothesis is formulated as an open one. HYPOTHESIS 3) It is possible that LOR will affect the degree of L1 attrition but how is not clear. Sex It is not certain whether the participants’ sex will measurably affect L1 attrition, and if so, how. For that reason this hypothesis is again formulated as an open one. HYPOTHESIS 4) It is possible that sex will affect the degree of L1 attrition but it is not clear how. Age (at testing)
25 As is standard in research in the social sciences, a significance level (p) of at least 0.05 will be applied when analysing the results. 26 These include repetitions, reformulations and restarts (cp. Hilton, 2007).

93
between 25 and 65 years of age, partly controlling for age. Nonetheless, in such an exploratory study, it is a factor worth considering. HYPOTHESIS 5) It is possible that age (at testing) will affect the degree of L1 attrition but it is not clear how. Age at emigration Again, this factor was partly controlled in the participants, in that all members of the attrition group had to have been at least 16 at emigration. (In fact the youngest was 18.) Nonetheless, the group exhibits quite a large range of ages, and this may possibly impact on L1 attrition. HYPOTHESIS 6) It is possible that age at emigration will affect the degree of L1 attrition within the attrition group, but it is not clear how. Contact / use Studies have yielded conflicting results with respect to this factor. It does however seem common sense to assume that less (native) L1 contact or use will lead to more L1 attrition, as will more (native) L2 contact or use. HYPOTHESIS 7) The amount of L1 use correlates significantly with the degree of L1 attrition, i.e. less use will lead to more attrition and more use to less attrition. HYPOTHESIS 8) The amount of L2 use correlates significantly with the degree of L1 attrition in the attrition group, i.e. more L2 use will lead to more L1 attrition and less L2 use to less attrition. L1 proficiency It seems likely that a higher degree of (self-reported) L1 proficiency will at least partially protect an individual from L1 attrition (cp. one of the major differences between child and adult L1 attrition), but the influence of this factor within a group of adults is not entirely clear. HYPOTHESIS 9) The degree of (self-reported) L1 proficiency correlates significantly with the degree of L1 attrition, in that higher proficiency will lead to less L1 attrition, and lower proficiency to more L1 attrition. Education Higher levels of education have been shown to offer speakers a certain amount of protection from L1 attrition. In this study the participants are divided into two groups, i.e. those with, and those without, a university degree.

94
HYPOTHESIS 10) The level of education correlates significantly with the degree of L1 attrition, i.e. higher education in the form of a university degree correlates with less attrition and lower education with more attrition. Attitude / motivation Many studies have shown this to be a very influential factor affecting L1 attrition. The general assumption is that a positive attitude towards the L1 and its speakers (by the speaker him/herself but also by others, and which Weinreich for example calls “language loyalty” (1974:100)) will tend to shield the speaker from L1 attrition as this will increase motivation to make an effort to maintain the language. A negative attitude will tend to have the opposite effect, i.e. lead to more L1 attrition. Those speakers who most wish to be integrated into the L2 society (i.e. desire social approval) are also predicted to suffer more attrition than others. HYPOTHESIS 11) There is a significant correlation between the speaker’s attitude to his/her L1 and its speakers and the degree of L1 attrition within the attrition group, i.e. a positive L1 attitude will lead to less attrition and a negative one to more attrition. Other languages Some psycholinguistic theories predict that those speakers who speak most languages may find it most difficult to retain their L1 and may therefore be expected to suffer most L1 attrition. In more advanced L2 speakers, the L2 may also be part of procedural knowledge and is therefore more likely to interfere with L1 procedural knowledge such as grammar and phonology. HYPOTHESIS 12) There is a significant correlation between the number of languages a speaker is able to use and the degree of L1 attrition, i.e. the more languages spoken, the worse L1 attrition will be. HYPOTHESIS 13) (Self-reported) L2 proficiency has a significant effect on the degree of L1 attrition in the attrition group, i.e. high L2 proficiency is expected to correlate with more L1 attrition and low L2 proficiency with less L2 attrition. Other factors The following are other findings from the previous sections, but ones which are not being specifically tested here, and for which therefore no hypothesis has been formulated: Phonetics / Phonology There is some disagreement regarding the extent to which changes in the speaker’s phonetic / phonological system is to be expected, but I have not looked carefully at pronunciation in this study and therefore cannot comment on this point in any detail.

95
Morphosyntax / Grammar As morphosyntax is a language domain generally only affected late in the process of adult L1 attrition, if at all, little is expected to have happened here, and therefore this study will not specifically focus on the grammar of the participants. Active vs. passive knowledge In particular neurolinguistic theories such as ATH predict that passive knowledge will be retained better than active knowledge, but the design of this study does not include an explicit analysis of passive knowledge and therefore again no comments will be made on this point. Forgetting curves Earlier, a number of suggested forgetting curves were discussed, but as this study does not have a longitudinal design I cannot say anything about the validity of any of them. English as L1 Those few studies which have focused on L1 English (and more theoretical treatments such as CAT) suggest that English seems to be comparatively immune to L1 attrition – presumably because it is relatively easy to find other L1 speakers with whom to speak the language, and it enjoys relatively high prestige. This study, however, does not compare the L1 attrition of English with other L1s and therefore no specific predictions are made on this point either. Regression theory In order to test this theory it would be necessary to compare the findings of this study with data on L1 child acquisition of English. That has not been done here, though, and therefore no specific comments are made regarding this theory. Chomskian theory Testing this would require a specific question situated within Chomskian theory. That is however not the focus of this study and therefore no predictions are made here.
3.2.5.2. Hypotheses about the ‘native speaker’
On the basis of the earlier discussion of the topic, and adopting a more cautious and traditional standpoint, the following can be predicted about the participants in this study: The native speakers (whether more or less prototypical according to the native speaker ratings) should as a group (and ideally as individuals too) perform better in the tests than the non-native speakers (i.e. the German L1 speakers), and the most prototypical native speakers (according to the ratings) should perform better than the peripheral native speakers. Taking this a step further, we can presumably also predict that the more prototypical native speakers within the attrition group will show less signs of L1 attrition. HYPOTHESIS 14) There is a significant difference in the test scores between the three groups of participants, i.e. the L1 control group and the attrition group (as native speakers) perform better than the German control group (as non-native speakers).

96
HYPOTHESIS 15) The individual participants in the L1 control group and attrition group (as native speakers) perform better than the individuals in the German control group. HYPOTHESIS 16) There is a significant difference in the test scores between the more prototypical and the more peripheral native speakers, i.e. the more prototypical native speakers perform better than the less prototypical ones. HYPOTHESIS 17) There is a significant correlation between the native speaker rating of individuals within the attrition group and the degree of L1 attrition measured in that those individuals with a higher rating (i.e. the more prototypical native speakers) perform better than those with a lower rating.
3.3. Test battery In the following sections, those test items used in this research project will be presented and discussed. Some of them were developed in close collaboration with other researchers as part of the language attrition network test battery (see Schmid 2004b for further details), designed to enable researchers from different regions and using different languages to gather data using similar methodology, thereby facilitating later data comparison. The following tests are taken from this test battery: FiCA 1 and 2, C-Test English and German, and the Film retelling task. The Picture description task is not taken from the test battery, but neither is it as such completely new. The precise picture used (i.e. ‘Egg Armour Plating’ by W.H. Robinson) has, to my knowledge however, not been employed to date in such studies. The ‘Scrabble’ test was specifically developed by me for the purpose of gathering additional data from the participants. The two questionnaires also partly include questions from the network questionnaire, augmented by further questions considered important for this particular research project. The only group which was asked to complete all of the test items was the attrition group. The other two groups only did some of the tasks, as shown in Table 6 below, where X indicates the test was carried out, and 0 indicates it was not. The symbol (X) designates those two tests which were completed by at least some members of the respective group. The test items are listed in the order in which they were administered during the interviews27
Test item
. Table 6: Distribution of the test items among the three groups
Attrition group L1 control group
German control group
Questionnaires X X X FiCA 1 X X X C-Test English X X X Film retelling task X X 0 ‘Scrabble’ test X X X FiCA 2 X X X
27 All interviews were carried out by the author, hereafter simply called the ‘interviewer’.

97
Picture description X (X) 0 C-Test German X 0 X As can be seen from the table above, the L1 control group did not do the German C-Test because – as monolingual speakers of English – they would not have been able to perform the task. The L2 control group were not asked to carry out either of the two spoken tasks, i.e. the Picture description and Film retelling task for a number of reasons, the most important of these being that it was felt necessary to reduce the total testing time for this group, consisting mainly of fellow academics who were difficult to recruit and who would probably not have been willing to take part in a longer testing session. The ordering of the test items was the same for each participant, whereby the questionnaires were always returned before the actual interview, enabling anyone to be excluded from the further study if considered unsuitable. Each interview session was recorded on a laptop computer (and simultaneously on a minidisc as backup) for easier subsequent data analysis. During the actual interview, which took place in an office at Düsseldorf University, the participant’s home/workplace, or occasionally the home of a mutual friend, the participants were only addressed in English, and any code-switching was ignored, thereby presumably encouraging those participants who also speak German to remain in monolingual English mode. The test items were presented in such a way as to hopefully minimise fatigue, by alternating quite long test items requiring high levels of concentration (e.g. C-Tests or to a lesser extent the ‘Scrabble’ test) with others (e.g. the Film retelling or Picture description tasks) which were shorter and assumed to be less wearing. The German C-Test (where administered at all) was kept to the end to avoid consciously activating German too early in the test procedure, and hopefully thereby avoiding too much interference from this language. In the following sections the individual test items and the precise testing procedure for each group are described in detail.
3.3.1. Questionnaires Before actually meeting any of the participants, two questionnaires (which were later condensed into one) were sent out (if possible electronically by e-mail), to gather biographical and language background data on each of the individuals. The L1 control group received a questionnaire in English, the German control group one in German, and the attrition group were sent two versions: one in English and one (with identical questions) in German. All participants but one in this latter group completed and returned the English version of the questionnaire.
As the focus of the study was later expanded to include the native speaker issue, an additional (native speaker) questionnaire was then developed in both languages and also sent to the participants, with the request to complete all of them and return them before the interview. Three members of the German control group did not complete the native speaker questionnaire. In the next two sections, more information is given concerning the questionnaires used in this study; examples of all questionnaires used can be found in the appendix.

98
3.3.1.1. General background questionnaire The general background questionnaire was based on the version made available to the attrition network, with modifications to suit this particular study, and was designed to serve three main functions: to filter out any volunteers who did not meet the necessary criteria for participation
(see 3.2.2. above), and therefore had to be refused28
to collect a range of mainly sociolinguistic information about the individual participants, which was later converted into independent variables for the analysis (see 3.2.3. and 3.4.1.5. below);
;
to collect information about language use (particularly from the attrition group) which was similarly partly used to create predictor variables.
A fourth function which became clear during many of the interviews, although not explicitly foreseen or planned, was that the questionnaires had acted as a kind of ‘warming-up’ exercise, particularly for the members of attrition group, as it raised their awareness of their particular linguistic situation, and started them thinking about the whole topic. In other words, for many participants the questionnaire increased their willingness to take part in the more experimental part of the study, i.e. the interview and test battery. Can-do scales The can-do scales (or simply ‘can-dos’) are a number of statements about self-perceived language ability which an individual is asked to rate originally developed by ALTE29 http://www.alte.org/cando/index.php ( ). Application in previous research The reliability of such self-assessments is of course questionable, and in fact previous studies report conflicting results. Weltens & van Els (1986:216) for example say “that the subjects were rather negative in their self-assessment” but that this “rather grim impression (...) was (...) not confirmed in the test results” (ibid.:217). Other sources suggest that can-do scales can be at least “reasonable indicators of language proficiency in attriters” (Keijzer, 2007:254) or “a fairly reliable way of quickly assessing the global level of language proficiency and fluency” (Ammerlaan, 1996:209). As the predictive power of such can-dos seems, on the whole, to be reasonably reliable it was felt appropriate to include the information in such a mainly exploratory study as this. Administration in this study In the attrition network’s test battery, this consists of a total of 43 questions about listening comprehension, reading proficiency, speaking ability, and writing proficiency. As this list was felt to be unnecessarily long and partly repetitive, it was shortened to a total of 16 for this study. The statements were at the same time converted into questions, yielding the following which were then incorporated into the questionnaire: 4 questions on understanding spoken English (and German)30
28 All in all, only two potential attriters had to be rejected based on the information revealed in the questionnaires as they had been brought up bilingually in the UK. 29 The Association of Language Testers of Europe
e.g. How good are you at understanding the news / current affairs programmes on TV?

99
4 questions on reading English (and German) e.g. How good are you at reading a daily newspaper?
5 questions on speaking English (and German) e.g. How good are you at interacting in a fluent and spontaneous conversation with friends / family?
3 questions on writing English (and German) e.g. How good are you at writing personal letters to e.g. friends / family?
For each of these 16 questions (and for each of the two languages separately, where appropriate) the participants were asked to give one of the following answers: 1 = I can’t do it at all 2 = I can do it, but with great difficulty 3 = I can do it, but with some difficulty 4 = I can do it fairly easily 5 = I can do it without any difficulty The answers (numbers) were then simply added up for each of the participants, so that each individual could achieve anywhere between 0 and 80 points (16 questions x 5) for each language, where 0 would mean that they cannot complete any of the tasks ‘at all’ in that language, and 80 that they are able to complete all of them ‘without any difficulty’. Aim In the light of conflicting findings from previous research, the aim of this tool here is to test how reliable the self-assessments from the participants are, and whether any of the groups over- or underestimate their abilities. In L1 attrition research, we often have anecdotal evidence of attrition, which cannot be confirmed in a study’s findings. It will therefore be interesting to see whether the attrition group in particular sell themselves short by professing themselves to be less proficient than they actually are. The results of the can-dos are reported in 3.4.1.2. for English and 3.4.1.3. for German.
3.3.1.2. Native speaker questionnaire This questionnaire was developed by myself specifically for this study, and consists of between 11-37 questions31
Administration in this study
designed to elicit information on how native speaker-like an individual is. The actual questionnaires can be found in the appendix, but information about the design, administration and analysis will be given here.
Based on the linguistic literature, and a study carried out at Düsseldorf university (see 2.4.3. for more details) where linguistically-naive students were asked to give their opinion on the concept ‘native speaker’, including reasons why they considered 30 All participants were asked about English, but only the two groups with sufficient knowledge of the language (i.e. the German control group and the attrition group) were asked about German as well. 31 This depends on the group and which questions were already part of the general background questionnaire.
100
themselves to be a native speaker of a certain language or languages, a number of native speaker criteria were established. The most frequent statements were converted into questions, and then sorted into a reasonably logical order to form the native speaker questionnaire. Well before meeting with the participants everyone was sent a copy of the native speaker questionnaire (generally by e-mail), and requested to complete and return it before the interview. Often, one of the questions (i.e. about how native speaker-like the participant sees him/herself) was chosen as an ‘ice breaker’ to get the later interview started. In other words, the interviewer asked the other person to explain why s/he saw him/herself as being, for example, very or only a bit native speaker-like, or why the person believed that the concept was an ‘either/or’ one, which could not be seen in such degrees. The first questions from the questionnaire (which asked about place of birth, parents’ place of birth and early linguistic exposure i.e. the factor named ‘background’ above) were used to divide the participants into the two main groups: native speakers and non-native speakers (according to the definition in 2.4.2.6.). This meant that the German control group were classified as non-native speakers and the attrition and L1 control groups as native speakers. The responses to the remaining questions on ‘attitude’ and ‘language’ (see also 2.4.3.) were then used to situate each individual within the native speaker model and to calculate how prototypical s/he was as a native speaker of English. Some of the questions (such as Do you generally feel more comfortable speaking English or German?) were only presented to the members of the two multilingual groups; such questions were, however, then ignored in the later analysis of the questionnaires, i.e. only those questions which were relevant to and answered by all participants were included in the analysis, to ensure the results (and native speaker ratings) remained comparable. The answers to the individual questions were awarded points (generally between 0 and 1) depending on how well they met the criteria, as illustrated in the example below, which is one of the questions referring to ‘language’: How often do you speak English? daily = 1 point weekly = 0.75 points monthly = 0.5 points less often than monthly = 0.25 points In other words, those answers which best fit the prototype as indicated in the literature and the survey (such as being monolingual, having learned English as the first language, having the strongest emotional ties to English, etc.), received more points than those which did not. In this way, all answers were analysed for each of the individuals resulting in a score for ‘language’, one for ‘attitude’ and a total overall score called the ‘native speaker rating’. In addition to the individual scores, group scores for the attrition and L1 control groups were also calculated (see 3.4.1.4. for results).
Aim The aim of this questionnaire was to collect data considered relevant to the concept of native speaker so that an individual rating could be calculated, allowing the

101
participants to be grouped along a continuum from (very) prototypical to more peripheral native speakers. These ratings, presented in 3.4.1.4. below, can subsequently be compared to the test results to see if the native speaker status of an individual correlates in any way with his/her language proficiency.
3.3.2. FiCA 1 and 2
Application in previous research The FiCA (Fluency in Controlled Association) tasks are part of the test battery employed by the attrition network, although they have also been used elsewhere. Ammerlaan, for instance, describes them (1996:92) as “[a] common method for rating lexical fluency”. They are designed to test lexical access or fluency, which is one of the most visibly affected areas of language in L1 attrition, making these, theoretically at least, one of the key tests of the study. Bialystok (2009:4) for example says that “bilinguals have been shown to (...) obtain lower scores on verbal fluency tasks” such as these, and in her own study she reports that “the bilinguals (...) obtained lower scores than their monolingual counterparts.” Administration in this study As recommended in the test battery research manual (Schmid, 2005:14), two separate tasks were carried out in this study (FiCA 1 and 2), at two separate points during testing, using the semantic categories ‘animals’ and ‘fruit and vegetables’ as cues to trigger lexical items. For each of these two categories the participants were given 60 seconds to name as many lexemes as possible in English, i.e. for FiCA 1 they were asked to name as many ‘animals’ as possible, and in FiCA 2 as many items of ‘fruit and vegetables’ as they could think of. The 60 seconds were recorded and later the lexemes named were listed, whereby the participants received one point for each valid item. If the participant named an inappropriate item (such as a German lexeme, a non-existent animal, or a lexeme which did not belong to the correct semantic category), these were rejected and ignored but the participants were not penalised in any way. A semantic (taxonomic) analysis of the same lexemes named was also carried out to test hypothesis no. 1). This involved sorting the lexemes into superordinate, basic and subordinate levels in order to assess whether the distribution was comparable in all three groups or not. Aim As the lexicon is that part of language where adult L1 attrition is generally most visible, it is obviously important to include tests which specifically target this area. This particular task is therefore included in the hope of finding significant differences between the attriters’ and the L1 controls’ lexicon, as manifested by the number and type of lexical items named for the two semantic categories. The results of the two FiCAs are presented in 3.4.2. below.

102
3.3.3. C-Test English and German Application in previous research The so-called C-test was developed from the earlier cloze test by Raatz and Klein-Braley (1981) and is said to be “an integrative written test of general language proficiency based on the concept of reduced redundancy”32
Administration in this study
(Raatz & Klein-Braley, 1982). In the cloze test, whole words were missing in a text and had to be filled in by the person being tested. These could either be at specific intervals (i.e. every nth word) or only target for example nouns or other specific linguistic items, depending on the aims of the test. C-tests, in contrast, are constructed so that (after an initial sentence) the second half of every second word is missing. (For details of how to construct C-tests see Raatz & Klein-Braley 1982.)
These two tests are again part of the attrition network’s test battery, which includes a number of texts in (at present) English, German and Dutch which have all been pre-tested on non-attrited native speakers. The German texts were taken from here without alteration, but the English ones used are a mixture of two separate sets, one of which was considered more suitable for North American and Canadian participants, and the other for British ones. For each language the test consists of five short texts of approx. 70-100 words, in various styles (e.g. ‘relatively normal’ newspaper style, more informal magazine style, and rather formal style), and in which, after the first sentence, (more or less) every second word has had its second half deleted. For this study, two of the texts were taken from the North American English set and the other three from the British English set, whereby the final one was slightly adapted to better suit the anticipated participants. Both the English and the German C-Tests used are to be found in the appendix; an example sentence from one of the English texts is, however, given below: The BBC’s core purpose is broadcasting. Since the lau__________ of the Radio Times in 1923, it h__________ also eng__________ in comme__________ activities. The completed text should read: The BBC’s core purpose is broadcasting. Since the launch of the Radio Times in 1923, it has also engaged in commercial activities. Each of the five English texts presented to the participants had 20 gaps, which means there are a total of 100 gaps (20 gaps x 5 texts) for each language, and each individual can score up to 100 points if all gaps are completed correctly. The five German texts did not have a uniform number of gaps, but again together added up to 100 gaps / points. (Text 1 had 22 gaps, text 2 17, text 3 18, text 4 19 and text 5 24 gaps.)
32 Babaii & Ansary (2001:209) describe “the reduced redundancy principle (RRP)” as “testing examinee’s language ability when linguistic message is distorted by noise or some other kinds of interference.” They then list (ibid.) a number of testing procedures which have tried to operationalize this principle: “dictation, the noise test, partial dictation, cloze test, (...), and the C-test (...).” Babaii & Ansary also explain (ibid.) that “[t]he fact that, under reduced redundancy condition, native speakers often outperform non-natives (...) was the incentive to introduce interference to linguistic messages as a tool for testing language proficiency.”

103
As already explained in 3.3. above, the two tests (i.e. English and German, for those two groups who were asked to complete both) were not administered back-to-back but with other tests in between. When administering the test, the participants were briefly shown the five texts, whereby each one was on a separate piece of paper, stapled together, and the procedure was explained. They were told that some of the words had their ‘ends’ missing, and that they were to try and complete these so that the texts made sense. They were informed that there were often alternative solutions, and warned that the texts were designed to be challenging33
Number
, even for native speakers. So they were not to feel worried or frustrated if they experienced any problems, as these were expected and normal. For each text, they were given a maximum of five minutes, whereby the interviewer made a note of the time if the individual finished earlier, and asked him/her to move on to the next if the time had run out. After completion, the participants’ answers were entered in an Excel sheet and classified according to the suggestions made in the test battery research manual (Schmid, 2005:12), which are reproduced in table 7 below: Table 7: Classification of results for the C-Tests
Key 0 empty 1 incorrect lexical stem and incorrect word class 2 incorrect lexical stem but correct word class 3 correct lexical stem but incorrect word class 4 correct lexical stem, correct word class, agreement error 5 all of above correct, but still slightly wrong 6 acceptable variant with spelling error 7 correct word with spelling error 8 acceptable variant 9 correct word For each gap, each participant was therefore awarded a figure between 0 and 9, depending on how acceptable the answer was. Thinking in terms of ‘right’ and ‘wrong’, the research manual (Schmid, 2005:12) suggests treating 0-5 as incorrect, and 6-9 as correct answers, a procedure which was also adopted here. The score for each gap is then added together to yield the total score for each text and for the entire test. Aim This particular test was chosen as it is claimed to be a good test of “general language proficiency” (Raatz & Klein-Braley, 1982), which has already been used in countless studies. As the other tests in the battery place greater emphasis specifically on the lexicon, it was considered imperative to have one such general test item, which was, in addition, relatively straightforward to administer and mark, and therefore this one was chosen for both English and German. The results of the C-Tests are reported in 3.4.3. below. 33 This is important to avoid the ceiling effect (cp. Grotjahn, 1987).

104
3.3.4. ‘Scrabble’ test Application in this study The ‘Scrabble’ test is one of those tasks developed specifically for this research project, and one which all participants were asked to complete. At the beginning of the test, the interviewer laid twelve Scrabble tiles down on a table in front of the participants. These were presented in such a way that they were facing the participants and formed the word meretricious34
All lexemes formed and named were noted by the interviewer in the test protocol, including any repetitions or self-corrections. Later these were compared with the recording to ensure that nothing had been omitted. Scoring was relatively simple: all the valid
, i.e. the tiles were always presented in the same way to avoid any individual participant having an advantage or disadvantage over any other. The participants were then given their instructions, which involved trying to form as many different words as possible from the twelve letters given, constantly reusing them, whereby they were allowed to physically touch and move them around if desired, but did not have to. They were, however, requested to say each word that occurred to them aloud, so that the words would be recorded. They were told they would have a total of six minutes to try and find words; in the first four minutes they could make words of any size from three letters upwards, and in the final two minutes only longer words would be accepted, i.e. those containing at least six letters. This procedure was adopted based on the expectation that the majority of participants would name shorter words (yielding less points) unless specifically requested to do otherwise. They were also told that it was not permitted to form proper nouns (an example such as Rome or Tim which could be formed from the letters was given), ‘abbreviations’ (e.g. iou = I owe you), or other words extended by simply adding the inflectional suffix –s. (For example, only one of each of the following pairs was possible, but not both: cite or cites, tree or trees.) If it was felt during the task that some of the instructions had been forgotten, or were not clear, for example if the participants were only forming words of four letters or longer, then they were reminded that they were also allowed to form three-letter words. After four minutes they were briefly stopped and informed that, from now on, only longer words were permitted, and that they had a further two minutes to concentrate on these.
35
Aim
words (ignoring any repetitions) were counted to give an initial score. In a second step then, the length (and to a certain extent also, the complexity) of the word was taken into account by multiplying each one by the number of letters it contains, i.e. a three-letter word such as rim was worth three points, and a five-letter word such as crime five points, and so on. This procedure then yielded the final, weighted score for each individual.
The aim of this task was to gather further information on lexical production under time pressure. The FiCAs do this to a certain extent, but, given the suspected significance of the lexicon for this study, it was considered desirable to have an additional lexical test, targeting the written rather than the spoken medium. In contrast to the FiCAs,
34 This word was chosen as it is long enough to contain a number of different letters, but also does not contain a number of other letters commonly found in English words. 35 If in doubt, a good monolingual dictionary was consulted.

105
production here was limited by the availability of letters, rather than a specific semantic context or lexical field. The results of the ‘Scrabble’ test are presented and discussed in 3.4.4. below.
3.3.5. Film retelling task (Charlie Chaplin) Application in previous research This task is one “developed within the ESF (European Science Foundation) network on learner languages” (Schmid, 2004b:360), often employed in SLA studies, and is again part of the attrition network’s test battery. (See Perdue 1993 for details.) Administration in this study This test involves showing the participants a roughly 10-minute clip from Charlie Chaplin’s silent film Modern Times. It begins roughly ½ hour into the film where Charlie Chaplin is released from prison with a letter of recommendation and finds work in a shipyard. For this research project the participants from the attrition and L1 control groups were shown the sequence on a laptop computer. If possible the interviewer actually left the room whilst the participant was watching, but if not (for example if the interview took place at the participant’s home or workplace) the laptop was turned so that only s/he was able to see the screen. All of the participants were told beforehand that they were going to see a 10-minute sequence from this particular film, and very briefly told what had happened before this clip. They were then asked to watch the sequence and simply tell the interviewer afterwards, in their own words, what they could remember of what happened. Occasionally a participant would lose track or be unsure of some detail at some point during the retelling, and then they were briefly prompted and allowed to continue. Otherwise they were not interrupted until they said they were finished. The entire retelling of the sequence was recorded, and, in a number of separate stages, was transcribed and coded using the CHAT format. The first of these stages involved listening to the recording and simply transcribing the text including any filled pauses (such as er or erm). In a second step, then, the transcript was checked against the recording, and silent pauses were added. For a relatively short silent pause, the symbol # was used, and if the pause seemed36 much longer, ## or even ### was employed. Finally, in a third step all other codes (for repetition, correction, etc.) were added. After all transcriptions had been completed, they were printed and rechecked, and any inconsistencies removed. The transcripts were then analysed using the CLAN programme37
types (i.e. number of different words)
. The specific features counted or calculated by CLAN in each of the coded transcripts were:
tokens (i.e. total number of words)
36 The coding of these pauses is impressionistic to the extent that no clock was consulted. However, they were all coded within a short period of time (ensuring some degree of consistency) and later rechecked. Also, if in doubt, the simple symbol # was used. 37 For more information on both CHAT and CLAN (which are part of the CHILDES project = Child Language Data Exchange System) see MacWhinney 2000.

106
D (i.e. a measure of vocabulary diversity) 38
repetition – coded using [/] or [x 2] etc. in CHAT depending on the number of repetitions.
e.g. <I wanted> [/] I wanted to invite Margie39
correction – coded with [//] in CHAT. .
e.g. <I wanted> [//] uh I thought I wanted to invite Margie. reformulation – coded with [///] or [/-] in CHAT.
e.g. all of my friends had [///] uh we had decided to go home for lunch. <I wanted> [/-] uh when is Margie coming?
filled pauses – coded with @fp in CHAT. e.g. and then he ah@fp runs after her
silent pauses – coded using # for short and ## etc. for longer pauses in CHAT. e.g. and they were # looking around for # a wedge of wood
code-switching (only in the attrition group) – coded using @s in CHAT. e.g. or his ja@s stomach problems
According to Hilton (2008:154) such “‘[r]etracings’, repetitions, reformulations, and restarts (...) often accompany silent and filled pauses and are another sign of encoding difficulties during the speech production process.” These various features, therefore, are grouped as ‘hesitation markers’ as they have a negative effect on fluency, which of itself is a characteristic of being a native speaker as “all native speakers can be described as ‘fluent’ in the language they have been processing since birth” (ibid.). Little morphosyntactic deviation was noticeable in either of the two native speaker groups during transcription, and, as this is assumed to only occur at later stages of L1 attrition, and is not the main focus of this project, this area was not explored further. In addition to the features named above, twenty situations or objects (listed in the table below) were chosen from the clip and subjected to closer manual scrutiny, i.e. each finished transcript was carefully examined to see how the individual participant described these situations/objects. The precise language used in each case, including any pauses and hedges, was entered into an Excel sheet. Then pauses and hedges were counted and any major differences between the two groups with regard to the expressions used was noted. The pauses and hedges are of major interest as they are both assumed to be symptoms of linguistic insecurity in the sense that the speaker is unsure about the use of a word. In the ‘Longman Grammar’ (Biber et al., 1999) hedges are called “vagueness markers” (p.115) which “can show the imprecision of word choice” (p.557). Any pauses found immediately before a noun or verb (i.e. clause-internal) are assumed to be serving a similar function (cp. Hilton, 2007 who claims they are for “lexical retrieval”), and therefore equally interesting for the analysis, given the research questions outlined above.
38 TTR (type-token ratio) was not counted as this would have necessitated all participants having the same number of tokens. This would only have been possible if all samples were reduced to the same length as the shortest one, which would have meant wasting a great deal of data. For this reason, D was preferred as a measurement as it can take varying sample sizes into account (cp. MacWhinney, 2000:113). 39 All examples for repetition, correction, and reformulation are from MacWhinney 2000, Part I:72-73.

107
Table 8: The twenty situations or objects analysed for the Film retelling task (in chronological order)
Situation / Object Realised by Example 1) Place where CC40
NP / PP worked briefly at
the beginning of the clip. (at) a shipyard
2) Person giving orders at this workplace.
NP
the foreman
3) Object CC used to remove the wedge.
NP
a hammer
4) Action describing how the wedge was removed.
VP
(he) knocks it out
5) Description of the young girl who stole ‘the bread’.
AdjP / PP
(she’s) barefoot (she’s) in rags
6) Place where ‘the bread’ was stolen from.
NP / PP
the van outside a baker’s shop
7) Object the girl stole. NP a loaf of bread 8) Action describing what she did with ‘the bread’.
VP
stole it
9) Action describing what happened between her and CC after she stole ‘the bread’.
VP
(she) runs into him (they) collide
10) Action describing what the policeman did to CC after the theft.
VP
(he) arrests him
11) Place where CC had the big meal. NP / PP (at) a restaurant 12) Place from where CC got the cigar. NP / PP a newsagent’s 13) Vehicle used to take CC away (to prison).
NP
a police van
14) State of the policeman after the traffic accident.
AdjP
unconscious
15) State of CC and the girl after the traffic accident.
AdjP / VP
(they) recover first
16) Action describing what CC does to the policeman before leaving.
VP
(he) hits him on the head
17) Object CC used to ‘hit’ the policeman.
NP
his truncheon
18) Action describing what the girl and CC do after ‘hitting’ the policeman.
VP
(they) run off
19) Place where CC and the girl sit to rest.
NP / PP
(on) a grass verge
20) Object used to catch the milk in the dream sequence.
NP
a (milk) jug
Aim The aim of this task (together with the following Picture description) was to collect more naturalistic, spoken data, in contrast to the other more formal tests where the participants are not required to produce ‘normal’ speech in the form of longer utterances. It was hoped that this kind of task, where given facts have to be recited
40 CC refers to Charlie Chaplin.

108
and avoidance is therefore difficult, would put (additional) pressure on the attriters, thereby increasing the likelihood of deviant data compared to the other tests. The task was also important as it enabled a comparison of pausing and hedging behaviour between the speech of the two native speaker groups. The findings from this task can be found in 3.4.6. below.
3.3.6. Picture description (W.H. Robinson) Administration in this study For this task the participants from the attrition and L1 control groups, but not the German control group, were shown an illustration by W.H. Robinson (1872-1944) called ‘Egg Armour Plating’ (see the appendix), which shows a rather antiquated factory-like setting in which fresh eggs are armour-plated, presumably to prevent their breaking. This artist was chosen as W.H. Robinson and his work are relatively well known and appreciated in the UK and Ireland, and the drawings are generally interesting for adults, whilst, at the same time, offering enough linguistic complexity when they have to be described. This particular drawing for example shows relatively infrequent objects which could be named: vat or cauldron, furnace, scrap metal, molten metal, pitchfork, coal scuttle, barrow, trolley, lever, cog, pulley, and chisel, as well as some which the artist had invented and which therefore had no pre-existent name to be simply pulled out of memory. Low frequency verbs which could be used to describe the activity were wheel (sthg. over), chisel, squirt, propel, fire or spit, chip, feed (a fire), smelt, etc. All native speaker participants (except for four members of the L1 control group who did not perform this task) were shown the illustration and told that it (and in fact the whole idea of armour plating eggs) was not to be taken too seriously; the title was pointed out to them, and they were shown the general structure of the drawing, i.e. that it seemed to involve a process starting at the top right-hand corner of the page and working its way gradually down to the bottom right-hand corner. They were then given the page with the drawing to hold and look at for a minute or two, until they felt they had worked out for themselves what was happening, when they were asked to try and describe what they could see in as much detail as possible, for example, as if trying to help someone else (who could not see the picture) to visualise it. There was no time limit on the task, and, occasionally, if a participant seemed unwilling to offer sufficient details the interviewer asked follow-up questions in an attempt to elicit further information. The descriptions given were recorded and later transcribed using the CHAT format (as recounted in the Film retelling section above), and these transcripts were then analysed using the CLAN programme (for both see MacWhinney 2000). The features analysed are identical to those detailed above in the Film retelling section, i.e. types, tokens, D, repetition, retracing and reformulation, filled and silent pauses, as well as instances of code-switching were counted for each of the individuals. In addition, fifteen situations or objects were chosen to be analysed more carefully, and (again as described above for the Film retelling) each of the individual transcripts was examined and the precise language (including pauses and hedges) used to describe these situations or objects was noted and compared.

109
Table 9: The fifteen situations or objects analysed for the Picture description task (in assumed chronological order)
Situation / Object Realised by Example 1) Raw materials being brought in at the top of the picture.
NP
scrap (metal)
2) Object into which they are put. NP a vat 3) Action describing how these get into the ‘container’.
VP
(it) is thrown in
4) Action describing what is happening below to the fire.
VP
(it) is being stoked
5) Object through which the molten metal comes out of the ‘container’.
NP
a tube
6) Object in which the molten metal lands.
NP
something like a bag
7) Action describing what a man is doing with this object to make the molten metal come out.
VP
(he) squeezes it
8) Action describing how the molten metal reaches the egg.
VP
(it) is sprayed over them
9) What a man overseeing the process is looking through.
NP
a telescope
10) What a man uses to move the eggs over to the table.
NP
a trolley
11) Action describing what a man does to get the eggs to the table.
VP
(he) wheels them over
12) Action describing what the first man at the table is doing to the eggs.
VP
(he) is chipping off the rough bits
13) Object(s) this man uses to carry out this action.
NP
a hammer and chisel
14) Action describing what happens to the eggs at the end.
VP
(they) are thrown
15) Place where the eggs end up. NP / PP (into) a box Aim As with the Film retelling task, the aim of this test was to attain some relatively free spoken data which could then be examined for significant variation between the two native speaker groups. In analogy to the frog story used by Olshtain & Barzilay in their 1991 study discussed above in 2.1.3.2., it was expected that the attriters would have significantly more problems producing such specific lexical items than the L1 controls. Avoidance seemed even less of an option here, too, given the specific and limited details, so it was reckoned to be even more challenging a task than the Film retelling. The findings from the Picture description are presented in 3.4.7. below.

110
3.4. Results In this section the results of the various tests described above are reported for all three groups. Some of the data collected is normally distributed and interval, allowing the use of parametric statistical measures to test for significance41
3.4.1. Questionnaires
but most is not, necessitating the use of non-parametric tests. In each case, the precise procedure used in SPSS for the calculation has been indicated. In general, only group results will be given and compared, but where this is considered relevant to the discussion the individual results will also occasionally be presented. In addition to the actual findings, there is often also some initial comment, but the main discussion takes place in chapters 3.5. and 3.6..
In the following sections, information is given on the English and German can-dos, the native speaker ratings, and the predictor variables, all of which were calculated on the basis of the participants’ answers in the questionnaires.
3.4.1.1. General background questionnaire
Biographical information on the 64 participants can be found in the appendix.
3.4.1.2. Can-dos English The following table shows the results of the English can-dos for each of the three groups of participants, converted into percentages. Table 10: The results of the English can-dos for all three groups in % (N=62) Attrition
group (N=25)
L1 control group (N=20)
German control group
(N=17) 42
mean (N=62)
mean in % understanding 98.8% 98.3% 87.4% 95.4% reading 94.8% 95.5% 87.9% 93.1% talking 97.4% 96% 85.4% 93.6% writing 97.6% 91.7% 80% 90.8% total 97.2% 95.6% 85.5% 93.4% median in % understanding 100% 100% 85% reading 95% 97.5% 90%
41 As is common practice in linguistics, any results with a p (= probability) level equal to or smaller than .05 will be considered ‘significant’, i.e. to show an effect unlikely to be simply due to chance, and thereby to supply evidence against the null hypothesis (which generally states that there is no treatment effect). 42 Only 17 members of this group (consisting of 19 participants) completed the English and German can-dos.

111
talking 100% 100% 84% writing 100% 96.7% 86.7% total 97.5% 95.6% 83.8% total range 88.8-100% 82.5-100% 72.5-97.5% SD43 2.42 3.85 6.64 5.89 The groups’ scores were compared using a non-parametric Kruskal-Wallis test which yielded a significant between-group difference (H = 23.27, df = 2, p < 0.001). Individual Mann-Whitney U tests then uncovered the fact that the scores of the two native speaker groups do not differ significantly from each other (U = 223, p = 0.530), but that the score of the German control group does, when compared to either the attriters (U = 30.5, p < 0.001) or the L1 controls (U = 52, p < 0.001). For easier comparison, these same mean figures for all three groups are also presented in the figure below (not as a percentage but as an actual score out of 80). As can be seen, the two columns for the attrition and L1 control groups are almost identical, and the column for the German control group is both overall and in each of the four categories slightly smaller.
Distribution of English can-do scores for three groups
0,0
10,0
20,0
30,0
40,0
50,0
60,0
70,0
80,0
attr gp L1 cg Ger cg
Group
Scor
es
WritingTalkingReadingUnderstanding
Figure 8: Distribution of English can-do scores for three groups (N=62) In table 10 above, we can see that both the L1 controls and the attrition group have quite a positive self-perception of their language skills, achieving group means of
43 The abbreviation SD stands for standard deviation, “the most commonly-used measure of the spread or dispersion of a set of data in inferential statistical procedures. (...) The more widely the values are spread out, the larger the standard deviation” (Porte, 2002:244).

112
between 91.7 and 98.8% for the four separate skills: ‘understanding’, ‘reading’, ‘talking’ and ‘writing’, as well as for the totals.
Looking closer at these mean totals for each of the three groups, there are some interesting results. Contrary to expectations, the attrition group report less problems using English (97.2%) than the L1 control group (95.6%), although the latter are the more prototypical, and monolingual, native speakers, and would therefore normally be assumed to be more proficient at English. Not surprisingly, the German controls report more problems than the other two groups and have an overall score of only 85.5%. Turning our attention now to the means for the various skills, we can see that all three groups have a different internal hierarchy of difficulty: the attrition and L1 control groups both agree that ‘understanding’ is least problematic, but then deviate from one another. The attrition group has ‘writing’ in second place, followed by ‘talking’ and then ‘reading’, where the scores only vary by a maximum of 4%. The L1 control group, in contrast, has ‘talking’ second, then ‘reading’, and ‘writing’ is in last place. Why this group should report such difficulties with ‘writing’ (i.e. 5.9% lower than the attriters) is not at all clear. In this group, the internal variation is slightly higher than for the attrition group, i.e. 6.6% between the lowest and highest total score, also indicated by the higher standard deviation. The German control group has ‘reading’ as their best skill, followed by ‘understanding’, ‘talking’ and ‘writing’. Their scores vary internally by 7.9%. That the German group name ‘reading’ as the least problematic of all four skills does not seem particularly surprising when we take into account that the majority of these participants are academics who regularly have to read articles and other publications in English. Comparing the score from the German control group with the lowest one from the two native speaker groups for each of the four skills, we can see quite considerable differences, i.e. ‘understanding’ is 10.9% lower, ‘reading’ 6.9%, ‘talking’ 10.6%, ‘writing’ 11.7%, and the total is 10.1% lower in the German controls.
As discussed further above (see the discussion, for example in 2.1.2.1. and 2.3.4.), passive skills are generally considered to be retained best in attrition situations, and non-native speakers often report greater problems with active use of an L2 than with passive use. Therefore, we might expect to see a difference in these two groups between the two passive skills ‘understanding’ and ‘reading’ on the one hand, and the two active ones ‘talking’ and ‘writing’ on the other. The only group where we do see such a contrast is in the German control group, where ‘understanding’ and ‘reading’ have a mean of 87.4% and 87.9% respectively, and ‘talking’ and ‘writing’ only 85.4% and 80%. In the attrition group, the results are less clear: ‘understanding’ is highest at 98.8% as predicted, but then we have the two active skills ‘writing’ and ‘talking’, at 97.6 and 97.4% respectively, and ‘reading’ is considered weakest at 94.8%. In the L1 control group the picture is also rather confused: ‘understanding’ is again highest at 98.3%, this time we have ‘talking’ and ‘reading’ in the middle with means of 95-6%, and ‘writing’ has the lowest score of 91.7%.
Looking now at the median figures in the table above, the tendencies outlined above are largely confirmed. For the attrition group, ‘reading’ is the only skill which does not have a median of 100%, and this also had the lowest mean. The L1 control group also has a median of 100% for ‘understanding’ and ‘talking’, but only 97.5% for ‘reading’ and 96.7% for ‘writing’. The median scores for the German control group are not totally comparable to the means, where ‘reading’ was highest, followed by ‘understanding’, ‘talking’ and finally ‘writing’. In the medians, ‘reading’ is still highest,

113
but then the order changes: second is ‘writing’, then ‘understanding’ and finally ‘talking’.
Moving our attention finally to the range in total scores, the variation between the three groups is quite striking and interesting. Considering that the L1 control group shows a much greater degree of uniformity with regard to the native speaker factor ‘language’ than the attrition group (as discussed in 3.4.1.4. below), it could be predicted that the former should also show less within-group variation here as well. However, the opposite is the case: the L1 control group in fact exhibits a wider range of results (as represented by the higher standard deviation) than the attrition group. The even larger standard deviation within the German group, on the other hand, is not unusual, as these individuals are L2 speakers of English, and as such, are traditionally assumed to form an internally less homogenous group than L1 speakers. There is, however, a good deal of overlap between the individual scores in the three groups. In other words there are some individuals in the German control group who perceive their English to be better (up to 97.5% of the maximum achievable) than the self-perception of other individuals in the attrition and L1 control groups (who reach only 82.5% of the maximum achievable). A traditional understanding of what it means to be a native speaker (as discussed in 2.4. above) would lead us to expect that the two native speaker groups, but in particular the L1 control group, should ‘understand’, ‘read’, ‘speak’ and ‘write’ English more or less perfectly, without problems (and as such should therefore also award themselves full points for these skills). As the above table shows, however, this is not the case. At this point, it is important, though, not to get too carried away with comparisons and between-group differences. The statistical tests confirm that there is a significant difference between either of the two native speaker groups and the German controls, but not between the attriters and L1 controls. So, even if the tests do reveal L1 attrition in the attrition group, the speakers do not consider themselves less capable in English than do the L1 controls. Later these results will be compared with the group scores from the test battery (see 3.4.11.) to see how reliable the self-assessments are.
3.4.1.3. Can-dos German
Only those two groups with enough knowledge of German (i.e. the German control group and the attrition group) were asked to assess their German. The results are presented in the table below, whereby the lowest outlier in the attrition group (‘Alice’ with an individual total mean of 23.8%) has not been included. Table 11: The results of the German can-dos for the attrition group and German control group in % (N=41) Attrition group
(N=24) German control
group (N=17)
mean (N=41)
mean in % understanding 93.8% 99.4% 96.1% reading 85.3% 98.2% 90.7% talking 89.6% 98.8% 93.4%

114
writing 72.2% 97.5% 82.7% total 86.3% 98.6% 91.4% median in % understanding 97.5% 100% reading 90% 100% talking 92% 100% writing 70% 100% total 87.5% 100% total range 61.3-100% 92.5-100% SD 8.53 1.85 8.20 Using a non-parametric Mann-Whitney U test, the two groups were compared, yielding an expected significant between-group difference (U = 40.5, p < 0.001) for the German can-dos. In this table we can see that the German can-dos show much greater variation than the English results reported above. Looking first at the means, we can see that both groups have the same difficulty hierarchy, with ‘understanding’ perceived as least problematic, followed by ‘talking’, then ‘reading’ and finally ‘writing’. This is partially expected and partially not: ‘understanding’ as the most basic passive skill is generally assumed to be least problematic, although ‘reading’ should then follow, rather than ‘talking’. A possible explanation could be that the spoken medium is generally less complex syntactically than the written one, and could be predicted to cause fewer problems for that reason, especially for the attrition group for whom German is an L2. The fact that ‘writing’ is considered most difficult by far could be related to the problems many of the non-native participants reported experiencing with German grammar, which may be more camouflaged and glossed over when speaking but generally have to be resolved when writing.
Another difference between the English and German can-dos which immediately becomes obvious is the wider range of values for the attrition group’s L2 German than for the German group’s L2 English, as indicated by the standard deviations. This discrepancy is probably at least partly due to the fact that all members of the German group have a university degree in English, but the attriters, in contrast, are extremely mixed with regard to the amount of training they have received in German. The attrition group’s individual total mean of 86.3% is, nonetheless, directly comparable to the German group’s overall mean of 85.5% for their L2: English. The figure below shows these same means from the two groups, but again with the actual scores, rather than the percentages. For all four separate skills the German controls have a higher score than the attriters, leading to a much higher total column overall, reflecting a more positive self-evaluation by the German control group.

115
Distribution of German can-do scores for two groups
0,0
10,0
20,0
30,0
40,0
50,0
60,0
70,0
80,0
attr gp Ger cg
Group
Scor
es
WritingTalkingReadingUnderstanding
Figure 9: Distribution of German can-do scores for two groups (N=41) Now comparing the three groups for their respective L1, as shown in table 12 below, we can see that there are still between-group differences. ‘Understanding’ is the skill on which there is most agreement between the groups, i.e. where the ranges are most similar (with no more than 5% between-group variation), followed by ‘talking’ and ‘reading’ (which both show up to 10% variation). ‘Writing’ is again the skill where the self-assessments differ most i.e. where the between-group ranges are widest (up to 20% variation), but strangely this is particularly obvious in the L1 control group, with a group-internal variation of 40%. The means of the three groups are, however, relatively close together, with only 3% between the lowest score (the L1 controls) and the highest (the German controls). Looking at the figures for standard deviation in the three groups, we can again see that the L1 controls are the least homogenous group, and the German controls the most homogeneous one. Table 12: The results of the can-dos for the three groups for their respective native language in % (N=62)
Under-standing (range)
Reading (range)
Talking (range)
Writing (range)
Individual total
(range)
Mean
attrition group for English
95-100%
85-100%
84-100%
80-100%
88.8-100%
97.2%
SD 2.42 L1 control group for English
90-100%
80-100%
84-100%
60-100%
82.5-100%
95.6%
SD 3.85
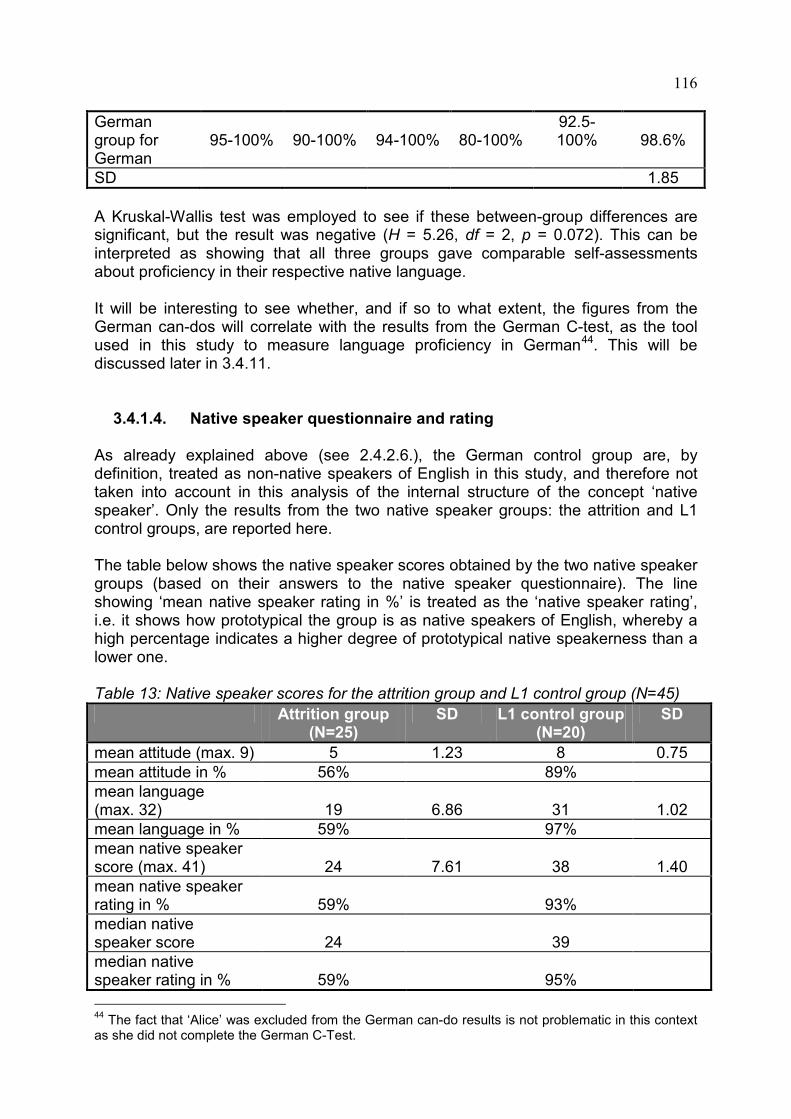
116
German group for German
95-100%
90-100%
94-100%
80-100%
92.5-100%
98.6%
SD 1.85 A Kruskal-Wallis test was employed to see if these between-group differences are significant, but the result was negative (H = 5.26, df = 2, p = 0.072). This can be interpreted as showing that all three groups gave comparable self-assessments about proficiency in their respective native language. It will be interesting to see whether, and if so to what extent, the figures from the German can-dos will correlate with the results from the German C-test, as the tool used in this study to measure language proficiency in German44
3.4.1.4. Native speaker questionnaire and rating
. This will be discussed later in 3.4.11.
As already explained above (see 2.4.2.6.), the German control group are, by definition, treated as non-native speakers of English in this study, and therefore not taken into account in this analysis of the internal structure of the concept ‘native speaker’. Only the results from the two native speaker groups: the attrition and L1 control groups, are reported here.
The table below shows the native speaker scores obtained by the two native speaker groups (based on their answers to the native speaker questionnaire). The line showing ‘mean native speaker rating in %’ is treated as the ‘native speaker rating’, i.e. it shows how prototypical the group is as native speakers of English, whereby a high percentage indicates a higher degree of prototypical native speakerness than a lower one.
Table 13: Native speaker scores for the attrition group and L1 control group (N=45)
Attrition group (N=25)
SD L1 control group (N=20)
SD
mean attitude (max. 9) 5 1.23 8 0.75 mean attitude in % 56% 89% mean language (max. 32)
19
6.86
31
1.02
mean language in % 59% 97% mean native speaker score (max. 41)
24
7.61
38
1.40
mean native speaker rating in %
59%
93%
median native speaker score
24
39
median native speaker rating in %
59%
95%
44 The fact that ‘Alice’ was excluded from the German can-do results is not problematic in this context as she did not complete the German C-Test.

117
range of native speaker scores
12-38
35-40
range of native speaker ratings in %
29-93%
85-98%
A non-parametric Mann-Whitney U test revealed that both of the native speaker factors, i.e. attitude (U = 31.5, p < 0.001), and language (U = 27.5, p < 0.001), as well as the total rating (U = 16, p < 0.001) differ significantly between the two groups. This can be interpreted as meaning that the L1 controls are significantly more native speaker-like than the attriters, or that they, as a group, are the more prototypical native speakers.
Table 13 above shows a high standard deviation for the attriters, indicating a very large range of scores (between 12 and 38) for this group (compared to 35-40 for the L1 controls). As indicated above, this can be interpreted as meaning that the attrition group is quite heterogeneous with regard to how native speaker-like they are. The least prototypical member of this group only receives a rating of 29%, the most prototypical 93%. The range for the L1 controls, however, is much smaller (between 85 and 98%), as shown by the lower standard deviation, implying that they form a much more internally homogeneous group. Comparing the individual factors between the two groups, it can be seen that the scores for the factor ‘attitude’ differ between them quite markedly, i.e. we have a mean of 5 points (or 56%) for the attrition group and 8 points (or 89%) for the L1 control group. However, the scores for the factor ‘language’ vary even more dramatically between the two groups of participants as the attriters have a mean score of 19 points (or 59%) and the L1 controls have 31 points (97%). These differences between the two groups are not particularly surprising though as the L1 control group was consciously chosen to fulfil certain language criteria (see 3.2.2. above) such as having little knowledge of other languages (i.e. being more or less monolingual), and having spent little or no time in other countries. They also all live in an English-speaking country and very rarely (if ever) need to speak another language. This factor was therefore deliberately manipulated in choosing the L1 controls, and so it is to be expected that these individuals form a homogenous group with regard to ‘language’. The situation of the attrition group is obviously very different as they are all multilingual to some degree, and living in a community where English is not spoken as a majority language. Actual language use, however, was not one of the criteria for choosing participants for this group and so a degree of variation is to be expected here. ‘Attitude’, on the other hand, which shows a more similar range of values in both groups, is less predictable, and the participants were not screened to elicit their feelings prior to taking part in the study. It is, therefore, interesting that both groups are more comparable with regard to this factor, although their biographies differ so dramatically in many other ways.
It is probably legitimate at this point to discuss why, if the language scores were predictable, the whole exercise was undertaken? Why collect all this information and calculate native speaker ratings if it is relatively clear beforehand what the results will be? The answer is quite simple and hopefully convincing: It was, of course, largely predictable what the language results of the L1 control group would be, but the other results, i.e. ‘attitude’ in both groups and ‘language’ in the attrition group were unknown. It was therefore necessary to gather all the information on both

118
groups and convert it into ratings in order to have a baseline (i.e. the results from the L1 control group), outlining what individuals who would generally be considered ‘proper’ or ‘real’ native speakers do with their native language, and how they think about language and related topics, i.e. how native speaker-like they are. The attrition group could then be compared to this baseline to see to what extent the individuals (and the groups) resemble or differ from each other in these two points i.e. whether, and if so how, the ‘treatment’ to which the attriters have been exposed has affected their native speaker status. The ratings will also prove useful later in the analysis, as they will be compared to the scores achieved by the participants in the test battery, to see if there is any correlation between how native speaker-like someone is (i.e. their rating), and how proficient they are in that native language (i.e. their score, as formulated in the second research question in 3.2.4. above). The two graphs below show the distribution of native speaker scores (i.e. the same total scores as in table 13 above), in ascending order (i.e. rising from the lowest score on the left to the highest on the right), first for the 25 individual members of the attrition group, and second for the 20 individual members of the L1 control group. As the scale for both is the same, the much wider range of native speaker ratings for the attrition group (29-93%) in comparison to the L1 reference group (with a range of 85-98%) becomes immediately obvious, i.e. the L1 control group is much more homogenous.
Total NS scores for attrition group
25
35
45
55
65
75
85
95
1 2 3 4 5 6 7 8 9 10 11 12 13 14 15 16 17 18 19 20 21 22 23 24 25
Tota
l sco
re in
%
Figure 10: Total native speaker scores for the attrition group (N=25)

119
Total NS scores for L1 control group
25
35
45
55
65
75
85
95
1 2 3 4 5 6 7 8 9 10 11 12 13 14 15 16 17 18 19 20
Tota
l sco
re in
%
Figure 11: Total native speaker scores for the L1 control group (N=20)
Separate NS factors for attrition group
0
5
10
15
20
25
30
35
0 5 10 15 20 25
NS s
core
s
AttitudeLanguage
Figure 12: The two separate native speaker factors for the attrition group (N=25)

120
The immediately preceding and following two graphs (i.e. figures 12 and 13) visualise how the two individual factors (attitude and language) differ between the two groups. (It is not relevant that less points overall were scored for ‘attitude’, i.e. the line is further down in the graph, as less questions were asked about this factor and therefore it was simply not possible to score as many points here as for ‘language’.) As can be seen, the scores for ‘attitude’ do not vary that dramatically between the two groups, but the factor ‘language’, in contrast, shows a much wider range of values in the attrition group than in the L1 control group, i.e. the attrition group shows much greater within-group variation in this respect. Comparing the two, we can clearly see that it is in fact the factor ‘language’ which is mainly responsible for the wider range of values (and the higher standard deviation) in the total scores of the attrition group as concluded above.
Separate NS factors for L1 control group
0
5
10
15
20
25
30
35
0 5 10 15 20
NS s
core
s
AttitudeLanguage
Figure 13: The two separate native speaker factors for the L1 control group (N=20) In this section, we have discussed the results from the native speaker questionnaire, and how and why these were converted into individual (and group) native speaker ratings. In the figure below, a box (and whisker) plot shows the range of total ratings in each group, whereby the upper and lower ‘whiskers’ mark the maximum and minimum respectively. The lower of the two ‘boxes’ in each case marks the lower quartile (25th percentile), and the upper one the upper quartile (75th percentile), whereby the dividing line is the median (50th percentile). The numbers 35 and 43 underneath the ‘box’ of the L1 control group mark outliers, who SPSS has considered

121
too divergent from the rest of the group to be incorporated. This figure shows particularly clearly how heterogeneous the attrition group is when compared to the L1 control group with regard to native speaker ratings.
Figure 14: Total native speaker ratings for both native speaker groups (N=45)
In 3.4.12. below these individual (and group) ratings will be compared with the individual (and group) scores from the various tests to see if they (i.e. the ratings as an indication of how native speaker-like an individual or a group is) correlate with language proficiency in any way.
3.4.1.5. Independent / predictor variables
Again based on the information given in the two questionnaires, a number of independent (or predictor) variables were calculated for the 45 members of the attrition and L1 control groups, namely ‘(self-reported) L1 proficiency’, ‘L1 use’, ‘L1 attitude’, and ‘native speaker rating’ (which was discussed in the previous section). Two additional variables were computed just for the 25 members of the attrition group: ‘L2 use’, and ‘(self-reported) L2 proficiency’. Both ‘L1 proficiency’ and ‘L2 proficiency’ have been calculated on the basis of answers given in the questionnaires, and are independent of the can-dos (although these are expected to

122
correlate as they are both self-reported proficiency)45 and the results of the two C-Tests. The various results46
are reported in the tables below: Table 14: Three predictor variables for the attrition group and L1 control group combined (N=45)
L1 proficiency L1 use L1 attitude mean 0.83 0.70 6.4 median 0.92 0.89 7.0 range 0.33-1.0 .07-1.0 2.0-8.0 SD 0.22 0.33 1.50 Cronbach’s α .774 .914 .656 The following table now shows the between-group differences for these three predictor variables, which are all highly significant as computed by a Mann-Whitney U test: ‘L1 proficiency’ (U = 108, p < 0.001), ‘L1 use’ (U = 4, p < 0.001), and ‘L1 attitude’ (U = 31.5, p < 0.001). Table 15: Three predictor variables for the attrition group and L1 control group separately (N=45) L1 proficiency L1 use L1 attitude attr gp L1 cg attr gp L1 cg attr gp L1 cg mean 0.72 0.96 0.47 0.99 5.44 7.6 median 0.75 1.0 0.39 1.0 5.0 8.0 range 0.33-1.0 0.83-1.0 0.07-0.96 0.96-1.0 2.0-7.0 6.0-8.0 SD 0.25 0.05 0.27 0.015 1.23 0.75 Table 16: Two predictor variables for the attrition group (N=25) L2 use L2 proficiency mean 16.4 7.6 median 16.0 9.0 range 0-33.0 -3.0-19.0 SD 9.22 5.87 Cronbach’s α .654 .715 With regard to the variables measuring use or contact, a high score can be interpreted as meaning that the participant has more contact of this type than those with a lower score. A high score for proficiency represents higher (self-reported) proficiency than a lower score. For the fifth variable: ‘L1 attitude’, a high figure is associated with a more positive attitude than a low one. A factor analysis was
45 In actual fact, though, Spearman’s rho only showed one significant correlation, namely between ‘L2 proficiency’ and the German can-dos for the attrition group (rs = .689, p < 0.001). The English can-dos did not correlate significantly with ‘L1 proficiency’ for either the attrition group (rs = .089, p = 0.673) or the L1 controls (rs = -.066, p = 0.783). 46 As it was not possible to achieve an equal number of points for all variables, they are not directly comparable; only the variance within each variable is, therefore, relevant and of potential interest.

123
conducted on all five variables to test their reliability, yielding Cronbach’s alpha (α)47
3.4.2. FiCA 1 and 2
. These figures are also reported in the tables above. The other four predictor variables applicable to both of the native speaker groups are: ‘age (at testing)’, ‘sex’, ‘level of education’, and ‘number of L2s spoken’. The relevant information on means, median and SD for these variables (where appropriate) was already given in 3.2.2. above and is therefore not repeated here. A calculation of Cronbach’s α is not required for these as they are all single (rather than composite) variables. A Mann-Whitney U test revealed no significant between-group differences for the variables ‘sex’ (U = 217.5, p = 0.377) and ‘education level’ (U = 247.5, p = 0.945). An independent-samples t-test was carried out on ‘age (at testing)’ (t = 3.807, df = 43, p < 0.001) and ‘number of L2s spoken’ (t = 2.688, df = 43, p = 0.01), and showed significant differences between the two native speaker groups for these two predictors. In 3.4.13. below these predictor variables are compared with the test results (dependent variables) to see if any of them can help to explain any variance in the results between the three groups, in particular of course between the attriters and L1 controls, or within the attrition group.
FiCA 1 Below, the figures, i.e. mean, median, range and total number of words named are given for each of the three groups for the first FiCA where the participants were asked to name as many animals as possible in 60 seconds. Table 17: Total scores for FiCA 1 in all three groups in descending order (N=64)
Attrition group (N=25)
L1 control group (N=20)
German control group
(N=19)
mean (N=64)
mean score 24.5 21.7 20.2 22 median score 22 22 20 22 range of scores 17-50 14-28 12-30 12-50 SD 7.82 4.38 4.71 6.23 total no. of words named48
180 / 233 (77%)
117 / 233 (50%)
123 / 233 (52%)
A non-parametric Kruskal-Wallis test revealed no significant between-group differences on this task (H = 3.80, df = 2 p = 0.15), so not only is there no evidence of L1 attrition here, but the non-native German controls performed as well as the two native speaker groups. 47 In the social sciences, it is generally assumed that a reliability coefficient of around .70 or higher is acceptable. 48 This figure represents how many different animals were named altogether by one group e.g. the L1 control group named a total of 117, which equals 50% of the 233 different animals named overall by all three groups.

124
This table shows that the attrition group have the highest mean score, i.e. the members of this group named most animals on average, followed by the L1 control group, and then, close behind, the German control group. The nearly three-point difference between the attriters and L1 controls is rather surprising, as is the fact that the German controls are only 1.5 points behind the L1 controls. But, as mentioned above, with such small samples, it would be unwise to read too much into such slight variation, and the differences are not significant in any case. What is interesting when looking at the figures above, is the range and the total number of words named by a particular group. Here, the attrition group show the widest range and, by far, the largest overall number of lexemes. Again, the other two groups resemble each other quite closely. Why the attrition group should perform in such a strikingly different way is not clear, although it may have to do with the fact that the individuals in this group have had long-term exposure to two different cultures, and therefore a wider variety of animals as such. The other two groups, on the other hand, consist of individuals who have spent most of their lives in one culture (particularly the L1 controls), and – within a speech community – there may well be tacit agreement on what constitutes a ‘(proto)typical animal’. So, when asked (and only given 60 seconds to answer), these individuals name those ‘(proto)typical animals’ first. The attriters, however, are not as limited by such constraints and therefore have a wider range of possible animals to turn to when asked to name some. An alternative possibility is, of course, simply that – because each individual will have a slightly different lexicon – the more people one asks, the more different items are likely to be named. So, as the attrition group is the largest, it is perfectly normal for this group to have named more animals. A semantic analysis of the lexemes named was also carried out, based on their position within a taxonomy created with all 233 animals. The lexemes were divided into basic, superordinate and subordinate level terms for this purpose, whereby ‘basic’ was used to refer to lexemes such as cat, dog, bear, wolf, and beetle, ‘superordinate’ for lexemes such as insect, amphibian, and primate, and ‘subordinate’ for lexemes such as Dalmatian, polar bear, pigeon, and bass, i.e. sub-types of the basic level lexemes. The ‘+’ symbol is combined with these levels to indicate those lexemes which were additionally marked semantically, either for sex such as ewe vs. ram, or mare vs. stallion, or for age such as kitten, lamb, piglet or cub.’ Table 18: Semantic analysis of animals named in FiCA 1 Mean figures for
each level Attrition group
(N=25) L1 control group
(N=20) German control
group (N=19)
superordinate 2 0 0.1 0 superordinate 1 0.2 0.1 0.3 basic 16.0 15.0 12.7 basic + 1.6 0.8 1.1 subordinate 1 6.4 5.8 6.1 subordinate 1+ 0.1 0 0 subordinate 2 0.2 0.1 0.1 basic levels % of total 72.1% 72.6% 68.4%

125
mean 17.7 15.8 13.8 SD 5.51 4.08 2.99 range 11-37 9-22 8-18 median 17 17 14 other levels % of total 27.9% 27.4% 31.6% mean 6.8 6.0 6.4 SD 3.65 2.67 3.13 range 2-20 0-10 2-13 median 6 6 6 This table shows how many lexemes were produced on average by each group for each of the seven semantic levels listed. The seven are then combined to form two composite measures: ‘basic levels’ which incorporates the ‘basic’ and ‘basic +’ lexemes and ‘other levels’ where all five superordinate and subordinate levels are pooled together. It is interesting that there are only minimal differences between the three groups with regard to how many lexemes they produced from the ‘other’ levels, but more striking differences on the ‘basic levels’. A Kruskal-Wallis test showed that the between-group differences are not significant for the ‘other levels’ figures (H = 0.14, df = 2, p = 0.933), but are for the number of ‘basic levels’ lexemes named (H = 6.72, df = 2, p = 0.035). Individual Mann-Whitney U tests were then able to reveal that there is only one significant between-group difference for this outcome, namely that between the German controls and the attriters: (U = 133.0, p = 0.005). Looking again at the actual lexemes named, a number of cultural differences also become apparent. For example, none of the German controls named the following lexemes, although they were mentioned quite often by members of the other two groups: deer, gorilla, koala, mole, puma, seal, stoat and weasel. On the other hand, there were a number of lexemes (often reflecting the American English influence which was more apparent in this group) which were only mentioned by the German control group, such as baboon, cougar, crab, dove, mosquito and owl. FiCA 2 The following table now shows the total scores for FiCA 2 where the participants were asked to name as many items from the semantic category ‘fruit and vegetables’ as they could think of within 60 seconds. Table 19: Total scores for FiCA 2 in all three groups in descending order (N=64)
Attrition group (N=25)
L1 control group (N=20)
German control group
(N=19)
mean (N=64)
mean score 23 22.2 15.6 20.6 median score 21 23.5 14 20 range of scores 12-33 12-29 12-24 12-33 SD 5.90 5.51 3.88 6.10 total no. of words named
117 / 136 (86%)
90 / 136 (66%) 69 / 136 (51%)

126
A non-parametric Kruskal-Wallis procedure revealed a significant between-group difference for this task (H = 18.26, df = 2, p < 0.001). Individual Mann-Whitney U tests subsequently showed that there is no significant difference between the two native speaker groups (U = 235.5, p = 0.374, one-tailed49
Mean figures for each level
), but only between the German controls and the attriters (U = 70, p < 0.001), as well as between the German controls and the L1 controls (U = 68.5, p < 0.001). The scores reported in this table again show a slightly higher mean for the attrition group (as already found for FiCA 1), closely followed by the L1 control group, and then the German control group. The L1 controls, though, have the higher median. Once more, also, the highest individual scores are found in the attrition group (i.e. 33 points), and the range is again widest here, also indicated by the higher standard deviation. Looking at the overall number of words named by all three groups, we see that the figure is lower here than in FiCA 1, i.e. only 136 different examples of ‘fruit and vegetables’ were named overall, compared to 233 examples of ‘animals’. In other words, fewer items were named altogether from the category ‘fruit and vegetables’ than from the category ‘animals’, suggesting that the lexical field as such may be smaller, or at least the participants have not been exposed to as many different items from the former category. Again, the attriters name more of these (86%) than the other participants, whereby both the attrition and the L1 control group name a larger percentage of the overall number in FiCA 2 than in FiCA 1. In the German control group, in contrast, the percentages are virtually unchanged (i.e. 52% of the total in FiCA 1 compared to 51% in FiCA 2). The first explanation offered above for the difference in scores between the three groups makes equal, if not more, sense here in my opinion. The members of the attrition group have been exposed to two cultures in a culinary sense, and it would be quite surprising if this had not affected their knowledge of foodstuffs in a positive way, i.e. by increasing the types of fruit and vegetable with which they are familiar, and which they can name when asked. Once more, a semantic analysis of the lexemes named was carried out, based on the lexeme’s position within a taxonomy created with all 136 fruit and vegetable items. However, here only three different levels were distinguished, namely ‘superordinate 1’ which included lexemes such as capsicum, ‘basic’ which included the majority of lexemes such as apple, blackcurrant, lemon and swede, and ‘subordinate 1’ which included lexemes such as spring onion, black grape and French bean, i.e. sub-types of the items from the basic level. Again there is only minimal variation between the three groups with regard to the ‘other’ levels, but the three groups do vary regarding their production of ‘basic level’ lexemes, as can be seen in the table below: Table 20: Semantic analysis of fruit and vegetables named in FiCA 2
Attrition group (N=25)
L1 control group (N=20)
German control group (N=19)
superordinate 1 0.04 0 0 basic 19.9 20.1 13.5 subordinate 1 3.1 2.1 2.1
49 This calculation is one-tailed as there is a specific directed hypothesis which predicts a certain outcome here. In all other cases, where there is no specific prediction, the calculations are two-tailed.

127
basic level % of total 86.4% 90.7% 86.5% mean 19.9 20.1 13.5 SD 5.18 5.11 2.59 range 11-29 12-28 10-18 median 19 21 13 other levels % of total 13.6% 9.3% 13.5% mean 3.1 2.1 2.1 SD 2.73 2.95 2.13 range 0-9 0-10 0-7 median 2 1 2 A Kruskal-Wallis test showed no significant between-group differences for the two ‘other’ levels combined (H = 3.72, df = 2, p = 0.156), but the number of ‘basic level’ lexemes given does seem to differ significantly between the three groups (H = 21.46, df = 2, p < 0.001). Subsequent individual Mann-Whitney U tests revealed no significant differences between the attriters and L1 controls (U = 232.5, p = 0.358, one-tailed), but there were significant differences between the attriters and German controls (U = 57, p < 0.001), as well as between the L1 controls and German controls (U = 56.5, p < 0.001). Looking at the distribution of actual lexemes amongst the three groups, again a cultural influence seems discernible. The German control group, for example, who have been more influenced by American English, are the only individuals to produce lexemes such as bell pepper (which is simply called a ‘pepper’ in British English) and rutabaga (which is called a ‘swede’ in British English). They also name fruit and vegetable items which are less well known in the UK and Ireland (but are part of German culture) such as gherkin and red cabbage. More typical examples of fruit and vegetable for the English native speakers, which are missing in the German list, are broad bean, courgette, runner bean and satsuma. One final point to be mentioned here is the question of German interference, which was detectable in a number of the lexemes named by the attriters and German controls in both tasks. Table 21: Cases of interference from German in the two FiCAs
FiCA 1 FiCA 2 attr group Ger cg attr group Ger cg
3 1 5 8 In FiCA 1, the following four animals created problems for the participants, in that they were named (and pronounced) as English lexemes, but do not exist in this form in English: amsel (= German lexeme for blackbird), ice bear (= literal translation of the German lexeme Eisbär = polar bear), steinmarder (= beech marten) and uhu (= (eagle) owl). In FiCA 2, two lexemes in particular proved problematic, namely paprika (= German lexeme for pepper) for the attrition group, and salad (= misapplication of the German lexeme Salat = salad and lettuce) which tripped up a number of

128
individuals in the German control group. One of the German controls also suggested ananas, the German word for a pineapple. FiCA 1 and 2 Comparing the scores achieved by the individual participants for each of the two FiCAs with each other, we can state that neither of the two tasks seemed inherently easier than the other. In the attrition group, 13 (out of 25) participants scored higher on FiCA 1 than FiCA 2, 10 scored higher on FiCA 2, and 2 had equal scores for both. In the L1 control group, 9 (out of 20) participants scored higher on FiCA 1, 11 higher on FiCA 2, and no one in this group had the same score for both tests.
Figure 15: Total FiCA scores (for FiCA 1 and 2) for all three groups (N=64) The preceding box plot in figure 15 summarises the information from above, showing the combined scores for the three groups from FiCA 1 and 2. The actual boxes are very similar for the attrition and L1 control groups but the upper ‘whisker’ is much longer for the attrition group, suggesting at least one individual dramatically outperforming the others, in addition to the two outliers who have been excluded. The German control group is overall lower down in the graph, showing that this group, as a group, did less well on these tasks than the other two. The German control group also has quite a long upper ‘whisker’, whereas it is the lower ‘whisker’ which is longest in the L1 control group. The greater homogeneity of the L1 control group is also easily seen in the figure as these ‘whiskers’ cover a smaller range of scores overall than in the other two groups.

129
3.4.3. C-Tests English and German English C-Test Table 22 below reports the results of the English C-Test for all three groups, giving the individual total scores and the time taken by each individual to complete all five texts. The maximum score achievable was 100 points (therefore the score can also be treated as a percentage), and the individuals had up to 25 minutes for the entire task (i.e. five minutes per text). Table 22: The results of the English C-Test in descending order (N=64)
Attrition group (N=25)
L1 control group (N=20)
German control group
(N=19)
mean (N=64)
Mean score 88.8% 89.3% 82.1% 87% Median score 90% 92% 84% 89% Range of scores
73-99%
71-98%
64-96%
64-99%
SD 6.92 8.10 8.56 8.32 Mean total time
14:53 mins. 15:16 mins. 19:01 mins.
Range of total times
08:30-23:21 mins.
08:42-23:11 mins.
14:59-24:02 mins.
Mean time taken for one correct answer50
10:12 secs.
10:33 secs.
14:08 secs.
11:19 secs.
Range of times taken for one correct answer
5:29-18:41
secs.
5:24-17:17
secs.
10:44-22:32
secs.
SD 3.27 4.05 3.12 3.86 A non-parametric Kruskal-Wallis test revealed a between-group difference for the English C-Test (H = 9.10, df = 2, p = 0.011). Subsequent individual Mann-Whitney U tests were again able to show that the differences only lie between the German controls and the attriters (U = 125.5, p < 0.01), and between the German controls and the L1 controls (U = 99.5, p = 0.011). There was no significant difference between the two native speaker groups (U = 221.5, p = 0.514). For the weighted score (i.e. time taken for one correct answer), which was normally distributed, a parametric test was carried out. The one-way ANOVA (F(2,61)= 8,067, p < 0.01) followed by a Games-Howell test again revealed that there is no group difference between the two native speaker groups (p = 0.957), but that the German controls are significantly worse than either the attriters (p = 0.001) or the L1 controls (p = 0.009). In the table above, the almost identical values for both the attrition and L1 control groups for mean, median, range, and mean time are immediately noticeable. The German control group, in contrast, performed less well, with a mean around 7% lower than that of the two native speaker groups. Nonetheless, there are five members in this latter group (≈ 26%) who performed equally well or better than the 50 This is later referred to as the ‘weighted score’ for the C-Test.

130
attrition group mean of 88.8%, and the L1 control group mean of 89.3%, and can therefore be considered native-like speakers of their L2 English. Looking at the time required to complete the task by the three groups, we can see that the attriters were slightly faster on average than the L1 controls (although the range of times is almost identical), and the German controls took around 4 minutes longer. Turning our attention to the final two rows in the table, we can see how long each group needed to find one correct answer, i.e. here the total time the individual required has been divided by the number of correct answers, yielding an average time in seconds for one correct answer. Here again, the attrition group are slightly faster on average and the German control group nearly 4 seconds slower. The individual total scores which form the group figures above are reproduced in the form of a line graph below, where we can see that the individuals in the German control group tend to perform least well, those in the L1 control group best, and the line representing the attriters is generally between these two.
English C-Test results
50
55
60
65
70
75
80
85
90
95
100
1 3 5 7 9 11 13 15 17 19 21 23 25
Participants
Scor
es L1 cgattr gpGer cg
Figure 16: English C-Test results for three groups (N=64) German C-Test The following table now shows the same results for the German C-Test, whereby only the attrition and German control groups are reported, as the L1 control group (being monolingual speakers of English) were not asked to attempt this task:

131
Table 23: The results of the German C-Test in descending order (N=43) Attrition group51 German control
group (N=19)
(N=24)
mean (N=43)
Mean score 70.4% 95.7% 81.6% Median score 73% 96% 92% Range of scores 27-94 92-100 27-100 SD 18.61 2.16 18.78 Mean total time 15:53 mins. 9:32 mins. Range of total times 8:19-22:26 mins. 5:54-13:42 mins. Mean time taken for one correct answer
13:13 secs.
6:00 secs.
10:53 secs.
Range of times taken for one correct answer
6:40-44:16 secs.
3:41-8:53 secs.
SD 7.90 1.38 7.45 A non-parametric Mann-Whitney U test yielded the expected result that the scores of the two groups for the German C-Test differ significantly from each other (U = 6.5, p < 0.001). The weighted scores (i.e. mean time taken for one correct answer) are also significantly different (U = 9, p < 0.001). In this table, the differences between the two groups are much greater than between any of the groups in the previous table, showing that the L2 German proved a much more formidable obstacle for the attrition group than the L2 English did for the German control group. None of the attriters managed to reach the mean of the German controls at 95.7%, although three participants (≈ 13%) come close with scores in the lower 90s. Even ignoring the two lowest outliers in the attrition group (i.e. ‘Alice’ and ‘Howard’ with 0 and 27% respectively), there are still five participants (20%) with scores in the 40s for the L2 German, whereas the German controls all scored at least 64 points for their L2 English. As the members of the German control group, however, all have degrees in English, and many of the participants in the attrition group have no formal education in German, this is not entirely surprising. On the other hand, though, all members of the attrition group have been living in Germany for at least ten years (except for the one participant who had only been in the country for six years at testing who scored 66%). Nonetheless, three members of the attrition group managed to achieve scores within the range of the German control group (i.e. at least 92%). It is also worth mentioning here that the German controls are the only group where two of the individuals managed to score 100% on the test. In contrast, none of the English controls managed more than 98% on their L1, and the mean in the L1 control group (for English) was also 6.4% lower than that of the German controls (for German). Furthermore, when we compare times, we see that the German control group managed to achieve these higher scores in a shorter time period. The L1 control group required on average 10:33 seconds to produce a correct answer, the German controls, on the other hand, only 6 seconds. The slowest
51 One of these participants (‘Alice’) briefly looked through the texts, then said she was not able to complete any of them, and did not attempt to fill in any of the gaps, thereby receiving 0 points. This individual was therefore excluded from the group calculations or figures for the German C-Test (as she already was from the German can-dos where she was an extreme outlier).

132
member of the L1 control group took 17:17 seconds, which is nearly twice as long as the slowest member of the German control group who needed only 8:53 seconds. These same results are also reported in the figure below, where it can be clearly seen that the German controls (who form a very uniform group) easily outperform the attriters in German.
German C-Test results
0
10
20
30
40
50
60
70
80
90
100
1 2 3 4 5 6 7 8 9 10 11 12 13 14 15 16 17 18 19 20 21 22 23 24
Participants
Scor
es attr gpGer cg.
Figure 17: German C-Test results for two groups (N=43) Comparison of English and German C-Test results At this point, it seems worthwhile comparing the results of both tests, to see if there is any kind of correlation between the scores achieved for English and those for German in the two groups which took both tests, or, in other words if the two proficiencies seem to be related in any way. Figure 18 below shows the results of both tests for the attrition group. Whereas the line for the English C-Test scores rises gradually from 73 to 99%, the line for the German C-Test seems totally unpredictable, generally remaining below the English one, but in two cases we have German scores above those for English, and one participant has identical scores for both languages. At first glance these two test results therefore seem to be totally unrelated, however a Spearman’s rho test revealed quite a strong significant correlation between the two (rs = .535, p = 0.007), indicating that the two scores do in fact seem to be connected. The correlation is positive, which can be taken to mean that there is no ‘trade-off’ between proficiencies in the sense that a high proficiency in one language leads to a lower proficiency in the other (or others), but rather that those participants who have a high (or low) score in the one C-Test are very likely to also have a high (or low) score in the other.

133
C-Test results for the attrition group (N=24)
0
10
20
30
40
50
60
70
80
90
100
1 3 5 7 9 11 13 15 17 19 21 23
Participants
Scor
e in
%
English C-TestGerman C-Test
Figure 18: English and German C-Test results for the attrition group (N=24) In figure 19 below, in contrast, the picture for the German controls is much neater. Again taking the group’s L1 as the baseline, we can see that the scores for the German test rise from 92 to 100%, and the L2 (English) scores tend to rise with them. There are, however, a number of exceptions where both scores are almost identical, or the score for English is considerably lower than the German one. Nonetheless, a Spearman’s rho test was able to show a strong correlation between the two (rs = .719, p = 0.001), so the two results are quite obviously connected. Again the correlation is positive, so the effect already observed in the attrition group holds here too, and is in fact even stronger in the German controls.
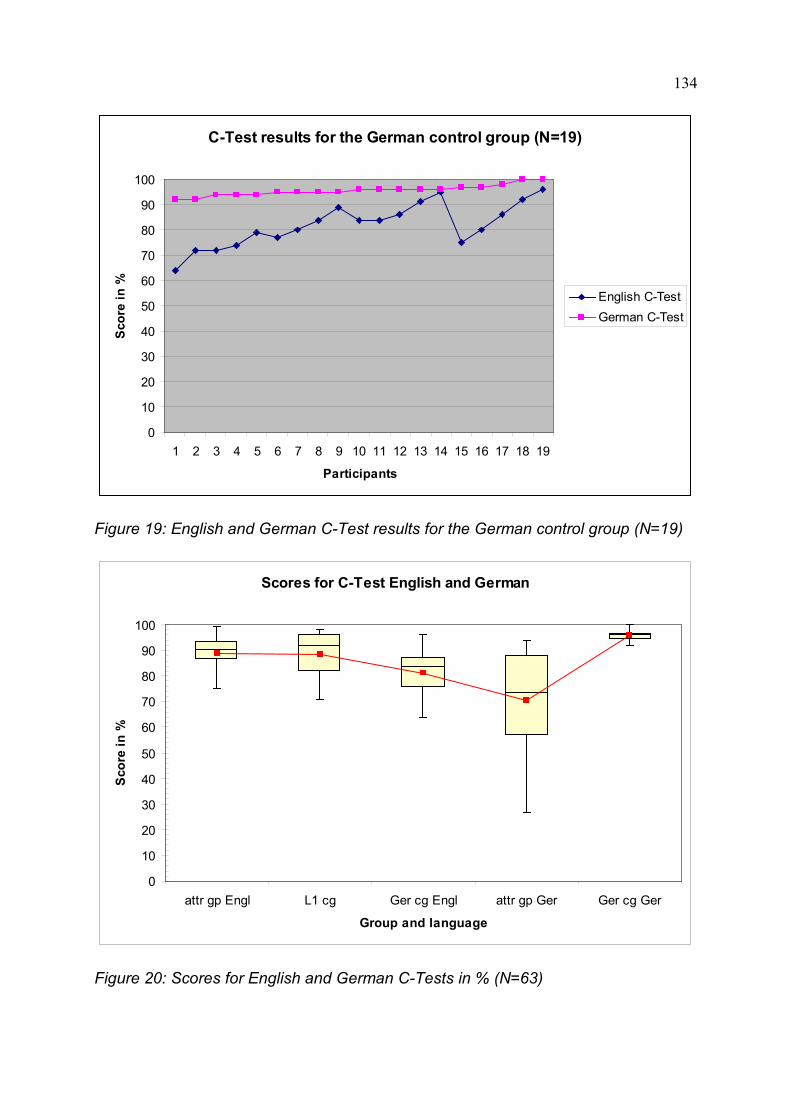
134
C-Test results for the German control group (N=19)
0
10
20
30
40
50
60
70
80
90
100
1 2 3 4 5 6 7 8 9 10 11 12 13 14 15 16 17 18 19
Participants
Scor
e in
%
English C-TestGerman C-Test
Figure 19: English and German C-Test results for the German control group (N=19)
Scores for C-Test English and German
0
10
20
30
40
50
60
70
80
90
100
attr gp Engl L1 cg Ger cg Engl attr gp Ger Ger cg Ger
Group and language
Scor
e in
%
Figure 20: Scores for English and German C-Tests in % (N=63)

135
Finally, the preceding box plot shows the results of both tests (three for English and two for German) in a comparative way. The small red squares in each ‘box’ mark the groups’ means, which are connected by the red line. The groups’ performance in the English test shows less variation than that in the German test as already described above. Also the difference between the two control groups for their respective native language, i.e. the L1 control group for English and the German control group for German is clearly visible. Comparison of results for the individual texts As mentioned above, each of the C-Tests consisted of five short texts with 20 gaps which the participants were asked to complete as well as possible. Below, the results of the individual texts in both languages are reported for each of the three groups, to assess how easy or difficult the participants found them, and whether there are any notable differences between any of the groups. Table 24: English C-Test results for the individual texts Text 1 Text 2 Text 3 Text 4 Text 5 mean L1 control group mean (N=20)
18.6
16.1
18.4
17.5
18.7
17.9
attrition group mean (N=25)
18.4
16.2
18.0
17.2
18.6
17.7
German control group mean (N=19)
18.1
14.2
15.7
16.9
17.2
16.4
Total mean 18.4 15.6 17.5 17.2 18.2 17.3 For each of the five texts, except for text 2, we can see a gradual decline in score from the L1 control group via the attrition group to the German control group, whereby the gap between the attrition and control groups is generally very small (i.e. no more than 0.4 points), but larger to the German control group (i.e. up to 2.7 points). Text 2 created most problems for the two native speaker groups, followed by text 4, text 3, text 1 and finally text 5. The German control group had a markedly different sequence, namely text 2, 3, 4, 5 and finally text 1. As the overall mean score was 17.3 points, we could say that texts 3 and 4 (with a mean of 17.5 and 17.2 respectively) are most, and text 2 (with a mean of 15.6) least, representative of the English C-Test as a whole. Turning our attention now to the German C-Test results in table 25 below, we can again note the more considerable between-group difference52
52 As the German texts did not each consist of 20 gaps, these scores have been converted into percentages to facilitate comparison.
for this test than for the English one, i.e. the groups’ scores resemble each other more closely for English than for German. Looking at the percentages achieved for the individual texts, the German controls have at least 19% (for text 4), and up to 33.6% (for text 2) more than the attriters. The two groups agree on which texts were least challenging as both performed best on text 4 then 5, although there is then some variation between them. For the attrition group the order after these is: texts 3, 1 and 2, whereby 2 was found most difficult, and for the German controls the order is: 2, 1 and 3, whereby 3 created most problems.
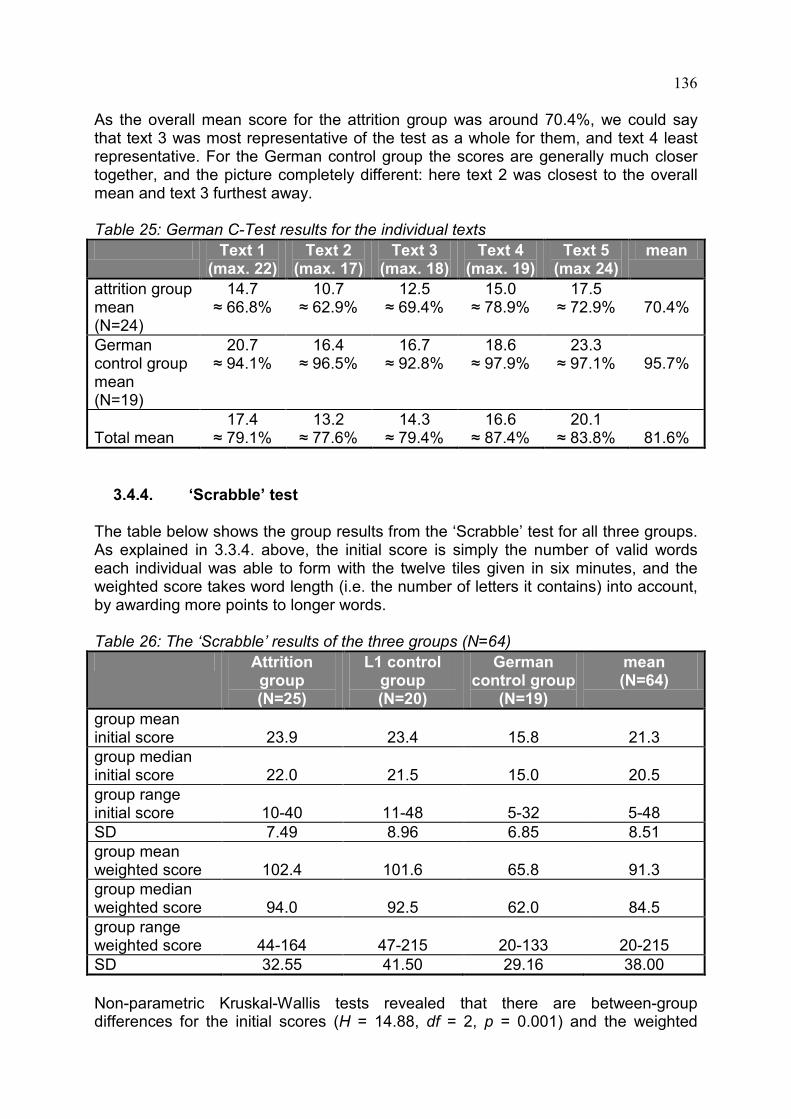
136
As the overall mean score for the attrition group was around 70.4%, we could say that text 3 was most representative of the test as a whole for them, and text 4 least representative. For the German control group the scores are generally much closer together, and the picture completely different: here text 2 was closest to the overall mean and text 3 furthest away. Table 25: German C-Test results for the individual texts Text 1
(max. 22) Text 2
(max. 17) Text 3
(max. 18) Text 4
(max. 19) Text 5
(max 24) mean
attrition group mean (N=24)
14.7 ≈ 66.8%
10.7 ≈ 62.9%
12.5 ≈ 69.4%
15.0 ≈ 78.9%
17.5 ≈ 72.9%
70.4%
German control group mean (N=19)
20.7 ≈ 94.1%
16.4 ≈ 96.5%
16.7 ≈ 92.8%
18.6 ≈ 97.9%
23.3 ≈ 97.1%
95.7%
Total mean
17.4 ≈ 79.1%
13.2 ≈ 77.6%
14.3 ≈ 79.4%
16.6 ≈ 87.4%
20.1 ≈ 83.8%
81.6%
3.4.4. ‘Scrabble’ test The table below shows the group results from the ‘Scrabble’ test for all three groups. As explained in 3.3.4. above, the initial score is simply the number of valid words each individual was able to form with the twelve tiles given in six minutes, and the weighted score takes word length (i.e. the number of letters it contains) into account, by awarding more points to longer words. Table 26: The ‘Scrabble’ results of the three groups (N=64)
Attrition group (N=25)
L1 control group (N=20)
German control group
(N=19)
mean (N=64)
group mean initial score
23.9
23.4
15.8
21.3
group median initial score
22.0
21.5
15.0
20.5
group range initial score
10-40
11-48
5-32
5-48
SD 7.49 8.96 6.85 8.51 group mean weighted score
102.4
101.6
65.8
91.3
group median weighted score
94.0
92.5
62.0
84.5
group range weighted score
44-164
47-215
20-133
20-215
SD 32.55 41.50 29.16 38.00 Non-parametric Kruskal-Wallis tests revealed that there are between-group differences for the initial scores (H = 14.88, df = 2, p = 0.001) and the weighted

137
scores (H = 14.55, df = 2, p = 0.001). Individual Mann-Whitney U procedures disclosed the information that the group differences are again between the attriters and German controls (initial score: U = 83.5, p < 0.001; weighted score: U = 84, p < 0.001), as well as between the L1 controls and German controls (initial score: U = 84, p < 0.01; weighted score: U = 85.5, p < 0.01), but not between the two groups of native speakers (U = 230, p = 0.647). This table contains some interesting, but not necessarily surprising results. Looking at the groups’ weighted means, we can see that both the attriters and the L1 controls have almost exactly the same score of around 102, and that the German controls are quite significantly lower with only around 66 points. This similarity between the L1 controls and the attriters is again reflected in the median scores, but also in the ranges, where, if we ignore the one outlier with 215 points, the highest score in the L1 control group is 178 points, and thereby fairly comparable with the attriters’ highest of 164. The German control group, however, show a much lower median, and range, with both a lower minimum and maximum score. These weighted group scores are also used in the following box plot. All three groups have relatively long ‘whiskers’ indicating a great deal of within-group variation, and the two control groups have outliers outperforming the rest of the group.
Figure 21: Total weighted scores for ‘Scrabble’ test for all three groups (N=64)

138
3.4.5. Total scores excluding free spoken data Adding the individual scores together for the four more formal English tests discussed so far (i.e. the two FiCAs, the English C-Test and the ‘Scrabble’ test) yields the following results, now reported for each of the individual participants separately: Table 27: Total individual scores for FiCA 1 and 2, English C-Test and ‘Scrabble’ test (in descending order) (N=64)
Attrition group L1 control group German control group ‘Caroline’ 333 ‘Martin’ 366 ‘Anke’ 276 ‘Iris’ 332 ‘Wendy’ 327 ‘Birte’ 235 ‘Jeremy’ 300 ‘Esther’ 277 ‘Oliver’ 224 ‘Norma’ 298 ‘Frances’ 268 ‘Natalie’ 209 ‘Amanda’ 264 ‘Ian’ 263 ‘Maria’ 208 ‘Barbara’ 263 ‘Tess’ 241 ‘Stefan’ 199 ‘Linda’ 262 ‘Charles’ 239 ‘Ilona’ 187 ‘Paula’ 252 ‘Nancy’ 236 ‘Julia’ 190 ‘Malcolm’ 240 ‘Anna’ 231 ‘Julian’ 178 ‘Lewis’ 242 ‘Zoe’ 228 ‘Laura’ 177 ‘Harriet’ 237 ‘Larry’ 227 ‘Simone’ 175 ‘Patrick’ 233 ‘Amy’ 227 ‘Franziska’ 169 ‘Alice’ 228 ‘Judith’ 217 ‘Petra’ 170 ‘Claire’ 226 ‘Donna’ 214 ‘Andreas’ 164 ‘Ray’ 221 ‘Jack’ 211 ‘Ingo’ 164 ‘Dawn’ 218 ‘Stuart’ 204 ‘Sabine’ 150 ‘Rita’ 218 ‘Richard’ 189 ‘Renate’ 143 ‘Edward’ 218 ‘Faith’ 182 ‘Rolf’ 143 ‘Alison’ 214 ‘Owen’ 171 ‘Denise’ 113 ‘Janet’ 213 ‘Keith’ 160 ‘Rachel’ 214 ‘Karen’ 206 ‘Howard’ 191 ‘Yvonne’ 181 ‘Donald’ 154 group mean
238.3
233.9
182.8
group median
228
227.5
177
group range
154-333
160-366
113-276
SD 43.05 49.43 37.31 The non-parametric Kruskal-Wallis again uncovered a significant between-group difference here (H = 18.55, df = 2, p < 0.001), and the subsequent individual Mann-Whitney U tests unsurprisingly revealed that this difference is only between the German controls and each of the two native speaker groups (in both cases U = 68, p < .001). There is no significant difference between the attriters and the L1 controls (U

139
= 230, p = 0.655) for the total score. This means that these four more formal tests of English have not been able to find any (significant) evidence for L1 attrition within the attrition group. These results are somewhat surprising on a number of counts. Firstly the attriters, as a group, have (when only marginally) outperformed the L1 controls on these four tests with a mean score of 238.3 compared to only 233.9. Unsurprisingly the German controls, in contrast, only have a mean of 182.8. A further unexpected result is that the L1 control group is the least homogenous of all three with the widest range of scores (i.e. a difference of 206 points between the highest and lowest scores) as well as the highest standard deviation, and the German control group is most uniform in this respect (i.e. a difference of 163 points) and the smallest standard deviation, with the attrition group in between (i.e. a difference of 179 points). Most interesting, however, for the aims of this thesis is the fact that the individuals in the groups can not be clearly distinguished on the basis of their score. It is not the case, for example, that all members of the German control group perform worse than all members of the two native speaker groups. The most proficient member of the German control group is in fact well over the mean of the attrition and L1 control groups with an individual score of 276, and a second individual at least surpasses the mean of the L1 control group with 235 points.
Figure 22: Total individual scores for the two FiCAs, English C-Test and ‘Scrabble’ test combined (N=64)

140
The figure above presents these same results in the form of a box plot, where (except for the two outliers) the L1 controls form the more internally homogeneous group, and the German controls are situated further down in the graph, demonstrating that they as a group performed least well on the four tests.
3.4.6. Film retelling task (Charlie Chaplin) The oral versions of this task (i.e. the recordings) were transcribed using the CHAT format and then analysed using the CLAN programme as described in the methodology section above. The specific features counted or calculated in each of the individual coded transcripts were types (i.e. number of different words), tokens (i.e. total number of words), D (i.e. a measure of vocabulary diversity), cases of repetition, correction, and reformulation, filled and silent pauses53
, and code-switching (only in the attrition group). These results are presented here for this particular task, but they were also pooled together with the results for the Picture description and these combined results are presented in 3.4.8. below. As D represents lexical diversity, a higher figure is indicative of a larger vocabulary, and as can be seen in the table below, rather surprisingly, it is the attrition group who have the slightly higher value here.
Table 28: D values for the Film retelling task (N=45)
Attrition group (N=25)
L1 control group (N=20)
Between-group difference
mean D 64.1 62 2.1 range of D values 39.2-80.8 43.7-70 SD 9.34 7.14 As this data shows a normal distribution, an independent samples t-test was carried out, which showed that the two group means for D are not significantly different from each other (t = .711, df = 43, p = 0.481). As the individuals obviously did not all produce a uniform number of tokens, and to avoid losing material by limiting all transcripts to say 1,000 words, the various features in the table below are presented as a percentage of the tokens. (This means that the individual results can be compared with each other, and none of the utterances had to be discarded.) For example, an individual total of 2% for corrections is to be interpreted as meaning that 2% of this individual’s total data consists of correcting him/herself. A higher figure indicates that more instances of the specific phenomenon (such as corrections) were present in the data, and is therefore associated with a more hesitant, less fluent use of the language.
53 See 3.3.5. for explanations and examples of these features.

141
Table 29: CLAN analysis of the Film retelling task (N=45) Attrition
group (N=25)
L1 control group (N=20)
Between-group
difference attr gp > L1
cg
Between-group
difference L1 cg > attr
gp % of the tokens mean repetitions 1.61% 1.44% 0.17% range of repetitions 0.20-3.86% 0.33-3.24% SD 1.09 0.76 mean corrections 1.35% 1.11% 0.24% range of corrections 0.55-2.76% 0.16-2.08% SD 0.53 0.49 mean reformulations
0.45%
0.55%
0.10%
range of reformulations
0.10-0.91%
0-1.71%54
SD 0.21 0.39 mean filled pauses 4.19% 3.80% 0.39% range of filled pauses
0.59-12.74%
1.31-11.65%
SD 2.88 2.48 mean short silent pauses
7.25%
4.03%
3.22%
range of short silent pauses
1.78-13.88%
1.65-7.09%
SD 3.34 1.46 mean long silent pauses
0.32%
0.12%
0.20%
range of long silent pauses
0-1.36%
0-1.05%
SD 0.38 0.25 mean code-switches
0.06%
n/a
range of code-switches
0-1.05%
n/a
SD 0.21 n/a totals mean total pauses 11.76% 7.95% 3.81% range of total pauses
3.38-23.06%
3.60-15.49%
SD 4.74 3.01 mean retracings55 3.42% 3.10% 0.32% range of retracings 1.22-5.97% 0.82-6.48% SD 1.36 1.39
54 The figure zero here represents the fact that at least one individual did not have any instances of this feature in his/her data. 55 These include repetitions, corrections and reformulations.

142
mean total hesitation features56
15.17%
11.05%
4.12%
range of total hesitation features
6.77-27.45%
4.42-18.95%
SD 5.37 3.59 In the table above, the figures are largely as predicted. In all cases except the reformulations (where the between-group difference is only 0.1%), the attriters have a higher percentage than the L1 controls, revealing that they produced more instances of each of these features, which can be interpreted as a higher rate of hesitation (and thereby less fluency) during this oral task. Apart from the various individual features measured, three composite variables were computed, namely ‘total pauses’, ‘retracings’, and ‘total hesitation features’. As these have a very low Cronbach’s alpha (i.e. well below 0.70), they were not used in any of the statistical calculations though, and are merely reported above to give an idea of the cumulative group differences.
A non-parametric Mann-Whitney U test was carried out on each of the above features to test for between-group differences. The only significant differences found were: ‘short silent pauses’ (U = 91, p < 0.001), and ‘long silent pauses’ (U = 158, p < 0.05). There is also some code-switching in the attriters’ data, but only from 6 of the 25 participants. Details of the types of code-switches found in the attriters’ data are presented in the table below. Table 30: Code-switching in the Film retelling task (N=25) Participant Element code-
switched Utterance
‘Donald’ ah so and in the moment he’d gone in ah so and there was a young lady ...
Kiosk next door was a kiosk. I don’t know what it’s called in English.
‘Linda’ na twice she pushed him na? ‘Rita’ na probably thought a nice young lady why not, na? ‘Barbara’ or but the policeman isn’t terribly interested, is he? or? ‘Edward’ Hausfrau showing how happy she is to be a nice little
hausfrau. ‘Yvonne’ also (x 5) and also actually also eats absolutely everything. ja (x 2) or his ah ja stomach problems. satt and is ah duly satt is duly ah (laughter) ah ah
replenished. Two of these instances seem to have been conscious, i.e. the usage of the two nouns Hausfrau and Kiosk. The final example in the table (i.e. satt) is different from
56 This figure includes all pauses, repetitions, corrections and reformulations, which are assumed to affect fluency.

143
the remainder in that it is also a content word (an adjective) and was noticed by the speaker, who laughed, hesitated somewhat (indicated by the filled pauses ‘ah’) and then corrected herself. The remaining ones though seem to have been genuine slips of the tongue where the German inadvertently interfered with the English during speech production, and where the speaker appeared to be completely unaware of what had happened. In addition to the CLAN analysis, a careful lexical study of the transcripts was also carried out where twenty situations from the 10-minute clip were chosen and the precise language used by each participant to describe these situations was noted. The lexemes produced were entered into an Excel sheet, their frequency noted and then compared between the two native speaker groups who carried out this task. For example, one of the situations involved describing the state of the policeman after the road accident. This yielded adjective (phrase)s such as unconscious (which was used by 25% of the L1 control group and 32% of the attrition group), or knocked out (used by 5% of the L1 control group and 8% of the attrition group). Any pauses produced during these specific utterances or hedges (e.g. some sort of workshop or the shop next door or whatever) were also noted and counted. In the large majority of cases, language use was remarkably similar between the two groups, however, there were also a number of cases where there was notable variation. In the following table, only those results are reported where the dissimilarities in language use seem sufficiently strong to be worth looking at despite the small sample sizes. Table 31: Lexical analysis of the Film retelling task (N=45)
Lemma Usage by the attrition group (N=25)
Usage by the L1 control
group (N=20)
Between-group
difference attr gp > L1
cg
Between-group
difference L1 cg > attr
gp to bump (straight) into
52% 15% 37%
Black Maria 36% 0% 36% truncheon 60% 25% 35% kiosk 32% 0% 32% to steal 76% 50% 26% to run off 48% 25% 23% arrest 12% 35% 23% paddy wagon 0% 20% 20% to run (straight) into
20% 40% 20%
sort of / kind of 40% 25% 15% or something / whatever
20%
5%
15%
mean total hedges 80% 45% 35% mean short silent pauses
6.5 / person
2.8 / person
3.7
mean short filled
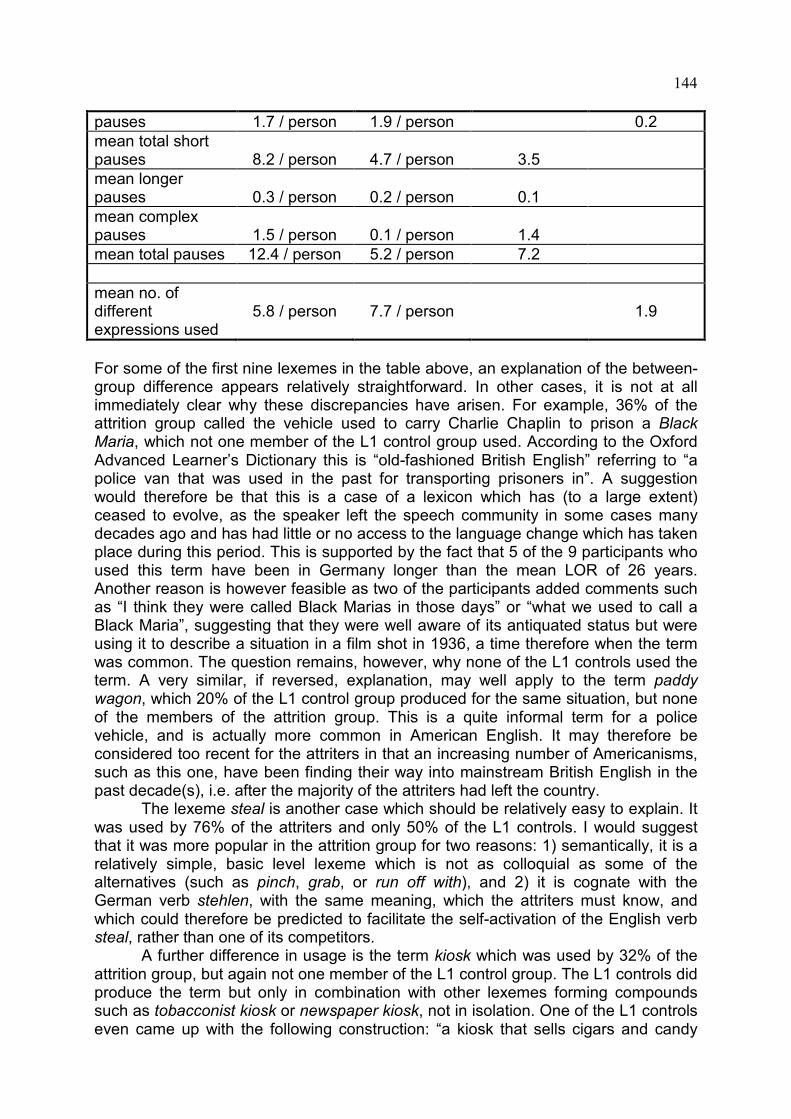
144
pauses 1.7 / person 1.9 / person 0.2 mean total short pauses
8.2 / person
4.7 / person
3.5
mean longer pauses
0.3 / person
0.2 / person
0.1
mean complex pauses
1.5 / person
0.1 / person
1.4
mean total pauses 12.4 / person 5.2 / person 7.2 mean no. of different expressions used
5.8 / person
7.7 / person
1.9
For some of the first nine lexemes in the table above, an explanation of the between-group difference appears relatively straightforward. In other cases, it is not at all immediately clear why these discrepancies have arisen. For example, 36% of the attrition group called the vehicle used to carry Charlie Chaplin to prison a Black Maria, which not one member of the L1 control group used. According to the Oxford Advanced Learner’s Dictionary this is “old-fashioned British English” referring to “a police van that was used in the past for transporting prisoners in”. A suggestion would therefore be that this is a case of a lexicon which has (to a large extent) ceased to evolve, as the speaker left the speech community in some cases many decades ago and has had little or no access to the language change which has taken place during this period. This is supported by the fact that 5 of the 9 participants who used this term have been in Germany longer than the mean LOR of 26 years. Another reason is however feasible as two of the participants added comments such as “I think they were called Black Marias in those days” or “what we used to call a Black Maria”, suggesting that they were well aware of its antiquated status but were using it to describe a situation in a film shot in 1936, a time therefore when the term was common. The question remains, however, why none of the L1 controls used the term. A very similar, if reversed, explanation, may well apply to the term paddy wagon, which 20% of the L1 control group produced for the same situation, but none of the members of the attrition group. This is a quite informal term for a police vehicle, and is actually more common in American English. It may therefore be considered too recent for the attriters in that an increasing number of Americanisms, such as this one, have been finding their way into mainstream British English in the past decade(s), i.e. after the majority of the attriters had left the country.
The lexeme steal is another case which should be relatively easy to explain. It was used by 76% of the attriters and only 50% of the L1 controls. I would suggest that it was more popular in the attrition group for two reasons: 1) semantically, it is a relatively simple, basic level lexeme which is not as colloquial as some of the alternatives (such as pinch, grab, or run off with), and 2) it is cognate with the German verb stehlen, with the same meaning, which the attriters must know, and which could therefore be predicted to facilitate the self-activation of the English verb steal, rather than one of its competitors.
A further difference in usage is the term kiosk which was used by 32% of the attrition group, but again not one member of the L1 control group. The L1 controls did produce the term but only in combination with other lexemes forming compounds such as tobacconist kiosk or newspaper kiosk, not in isolation. One of the L1 controls even came up with the following construction: “a kiosk that sells cigars and candy
145
and sweets and newspapers and everything else”, clearly showing that the members of this group were not happy using the term without further modification. The attriters, however, had no such obvious inhibitions, which is presumably at least partly explicable by the fact that such small retail outlets are regularly simply referred to as Kiosks in German. The between-group difference with regard to truncheon is interesting in that it reveals a completely different approach to the situation where a policeman who was lying on the ground unconscious after a traffic accident is starting to come to his senses, and is again rendered unconscious by Charlie Chaplin. 72% of the attriters produced a verb such as hit on the head or knock out in combination with the instrument (such as truncheon) to describe this action, but only 40% of the L1 controls included the instrument. They largely produced the same verbs but without mentioning the weapon used (35% compared to only 16% of the attriters). In fact 25% of the L1 controls did not mention this scene at all in their retelling, and only 12% of the attriters. For the remaining between-group differences listed above I can unfortunately offer no reasonable explanation. For example I do not know why 48% of the attriters prefer the expression run off, but at the same time prefer bump (straight) into instead of run (straight) into, constructed around the same verb run. Similarly, it is not at all evident why the L1 controls should produce the verb arrest 23% more frequently than the attriters, whose favourite expression to describe this situation was the phrasal verb take off e.g. the policeman took him off. A total of 29 hedges were counted in the 45 transcripts for this task: 20 from the attrition group (i.e. on average, 80% of them produced a hedge) and only 9 (i.e. 45%) from the L1 control group. As a group, therefore, the attriters hedge around 35% more than the L1 controls, although this difference is not significant as computed by a Mann-Whitney U test (U = 217.5, p = 0.420). This finding is particularly interesting as hedges are assumed “to show the imprecision of word choice” (Biber et al., 1999:557), and can therefore be interpreted as indicators of the attriters’ uncertainty about the lexeme chosen in a specific situation.
The four hedges which were produced most often in the data: sort of, kind of, or something and (or) whatever have been grouped into two categories on the basis of similarity between form and function. Of these four most frequent hedges, sort of was particularly popular, occurring 5 times (out of 9 ≈ 56% of the total hedges) in the L1 control group’s transcripts and 10 times (out of 20 = 50%) in those of the attrition group. According to Biber et al. (cp. 1999:867) sort of is the form preferred in British English, and kind of is more common in American English. In this context, it is therefore particularly intriguing that kind of occurs twice in the L1 controls’ data (= 10%) and only once in the attriters’ data (= 4%). The same goes incidentally for the hedge like which, according to Biber et al. (ibid.), is also more typical in American English. Again, the L1 controls have two instances of this, and the attriters only one. These are of course extremely low figures, but nevertheless would seem to support the claim made further above in connection with the paddy wagon that the English of the L1 controls contains more lexemes typically associated with (North) American English than that of the attriters, i.e. their language has evolved but that of the attriters has not been as exposed to such influence and has therefore not developed in a comparable way.

146
The third feature included in the table above is pauses, which have been divided into three different main categories: short pauses, longer pauses, and complex pauses. The term ‘short pause’ has been subdivided into ‘silent’ and ‘filled’ pauses; the ‘longer pauses’ are again silent or filled but last longer. The term ‘complex pause’ is used to denote a mix of consecutive silent and filled pauses (at least one of each, but often more), what Hilton (2007) calls a “hesitation group”. As the table above shows, the attriters produce more pauses on the whole (12.4 vs. 5.2 per person), as well as more of each of the three main pause types than the L1 controls, however, this is minimal for the longer pauses, more pronounced for the complex pauses, and the difference is particularly striking for the short pauses, whereby this large discrepancy is due to the short silent pauses as the L1 controls produce slightly more short filled pauses than the attriters. These data show that the attriters have a comparably less fluent speech style, with frequent (generally short) pauses which could be due to their requiring more time for memory searches before producing a particular lexeme. The final figures listed in the table above show how many different expressions each of the groups used on average for the twenty situations and objects which received special attention57
3.4.7. Picture description (W.H. Robinson)
. For example, to describe the state of the policeman after the traffic accident, each of the two groups used six different adjectival expressions such as unconscious or dazed. As can be seen, on average the L1 controls used more expressions overall than the attriters, suggesting that their lexical repertoire is more extensive (although their D value for the entire task was lower). Reviewing the findings from this task, we can say that they are largely as expected. The only real surprise is that the D value of the attrition group (measuring lexical diversity) is not only not lower than that of the L1 control group, as predicted, but is in actual fact higher, indicating that the lexicon of this group is by no means negatively affected by their experience of emigration and resulting bilingualism. But if we look beneath the surface more closely at the precise language being produced at various points in the Film retelling we can find differences between the two groups which could be attributed to this ‘treatment’ and therefore called attrition. One of these such differences could well be the increased use of hedges and (particularly still) pauses, as manifestations of lexical insecurity, showing that the speaker is experiencing accessibility problems, and often appears not entirely sure whether the lexeme chosen is in fact the most fitting for the specific situation.
The oral descriptions of this picture were recorded, transcribed and coded as described above, and in the same way as was performed for the Film retelling. Using CHAT, the same features were then again counted or calculated, namely types (i.e. number of different words), tokens (i.e. total number of words), D (i.e. a measure of vocabulary diversity), repetition, correction and reformulation, filled and silent pauses, and code-switching (only in the attrition group). The figures for this task are listed in the tables below, where (with the exception of D) they are again shown as a
57 The L1 controls produced a total of 153 different expressions for the twenty situations, and the attriters only 144 although the group is larger. 153 ÷ 20 = 7.65 expressions per person on average, and 144 ÷ 25 = 5.76.

147
percentage of the number of tokens produced. In 3.4.8. below the combined results from both tasks are presented. Table 32: D values for the Picture description task (N=41) 58
Attrition group (N=25)
L1 control group (N=16)
Between-group difference
mean D 65.9 59.6 6.3 range of D values 31-70.6 32.6-68.2 SD 8.51 10.49 This table reflects the earlier results from the Film retelling task where the members of the attrition group also had the higher D value. In fact, the between-group difference is even higher here, again reinforcing the evidence that the attriters seem to be producing the greater variety of lexical items when performing these tasks. The between-group difference for this measure is, however, not significant (as calculated by an independent samples t-test) (t = .861, df = 39, p = 0.395). Table 33: CLAN analysis of the Picture description task (N=41)
Attrition group (N=25)
L1 control group (N=16)
Between-group
difference attr gp > L1
cg
Between-group
difference L1 cg > attr
gp % of the tokens mean repetitions 1.55% 1.37% 0.18% range of repetitions 0.16-3.94% 0-3.63%59 SD 1.08 0.93 mean corrections 1.31% 1.23% 0.08% range of corrections 0-6.22% 0-2.49% SD 1.25 0.75 mean reformulations
0.45%
0.59%
0.14%
range of reformulations
0-1.75%
0-1.40%
SD 0.43 0.34 mean filled pauses 3.50% 3.76% 0.26% range of filled pauses
0-12.60%
0-14.37%
SD 2.72 3.64 mean short silent pauses
5.09%
4.56%
0.53%
range of short silent pauses
0.50-10.05%
1.43-8.14%
SD 2.26 2.09 mean long silent
58 Four of the L1 controls did not carry out this task. 59 Again, zero shows that at least one member of this group had no instances of this particular feature in his/her data.
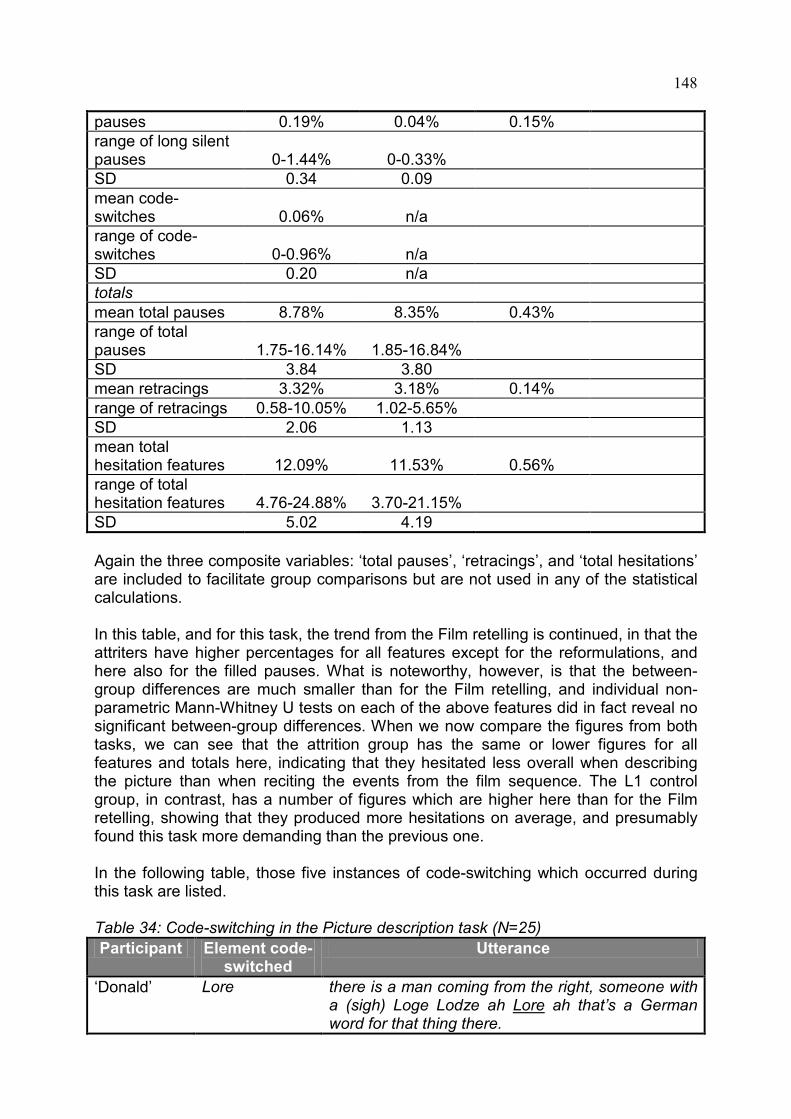
148
pauses 0.19% 0.04% 0.15% range of long silent pauses
0-1.44%
0-0.33%
SD 0.34 0.09 mean code-switches
0.06%
n/a
range of code-switches
0-0.96%
n/a
SD 0.20 n/a totals mean total pauses 8.78% 8.35% 0.43% range of total pauses
1.75-16.14%
1.85-16.84%
SD 3.84 3.80 mean retracings 3.32% 3.18% 0.14% range of retracings 0.58-10.05% 1.02-5.65% SD 2.06 1.13 mean total hesitation features
12.09%
11.53%
0.56%
range of total hesitation features
4.76-24.88%
3.70-21.15%
SD 5.02 4.19 Again the three composite variables: ‘total pauses’, ‘retracings’, and ‘total hesitations’ are included to facilitate group comparisons but are not used in any of the statistical calculations. In this table, and for this task, the trend from the Film retelling is continued, in that the attriters have higher percentages for all features except for the reformulations, and here also for the filled pauses. What is noteworthy, however, is that the between-group differences are much smaller than for the Film retelling, and individual non-parametric Mann-Whitney U tests on each of the above features did in fact reveal no significant between-group differences. When we now compare the figures from both tasks, we can see that the attrition group has the same or lower figures for all features and totals here, indicating that they hesitated less overall when describing the picture than when reciting the events from the film sequence. The L1 control group, in contrast, has a number of figures which are higher here than for the Film retelling, showing that they produced more hesitations on average, and presumably found this task more demanding than the previous one. In the following table, those five instances of code-switching which occurred during this task are listed. Table 34: Code-switching in the Picture description task (N=25) Participant Element code-
switched Utterance
‘Donald’ Lore there is a man coming from the right, someone with a (sigh) Loge Lodze ah Lore ah that’s a German word for that thing there.

149
na ja to the right of the cauldron sitting on a high-backed wooden stool ah is a fairly na ja obese gentleman.
‘Barbara’ ja at the top of the page we see scrap metal being melted down ja?
‘Yvonne’ also also there at the top of the picture there’s a ah a wheelbarrow being pushed by a man.
tja extracted at the bottom by tja can’t understand it. The rate of code-switching (0.06%) was identical in both tasks, although here only three of the participants (who also code-switched in the Film retelling task) produced such utterances. The first is a further case of word-finding difficulties from the same participant who said he didn’t know the translation of Kiosk in English during the previous task. Here the German word is activated after some difficulty but the English equivalent remains inaccessible. The remaining four cases of code-switching again seem to be inadvertent, and go unnoticed by the speaker, or at least are not noticeably commented on or corrected. In addition to these statistics, once more a lexical analysis was carried out, where a total of fifteen different situations and objects were chosen and the language used by the participants in each case was noted and entered into an Excel sheet. The frequency of each of the expressions was then calculated and those instances where the between-group difference is at least 20% are listed in table 35 below. In addition, pauses and various types of hedges were also counted and compared. Table 35: Lexical analysis of the Picture description task (N=41)
Lemma Usage by the attrition group (N=25)
Usage by the L1 control
group (N=16)
Between-group
difference attr gp > L1
cg
Between-group
difference L1 cg > attr
gp to wheel (across/over)
16%
44%
28%
chisel 24% 50% 26% to throw into 56% 31% 25% pipe 36% 13% 23% hammer 16% 38% 22% to chisel 28% 6% 22% scrap (metal/iron) 72% 50% 22% to take (across/over)
40% 19% 21%
(looks) like a 16% 0% 16% sort of / kind of 40% 69% 29% mean total hedges 68% 113% 45% what do we/you call it?
12%
6%
6%
mean short silent pauses
2.1 / person
3.1 / person
1.0
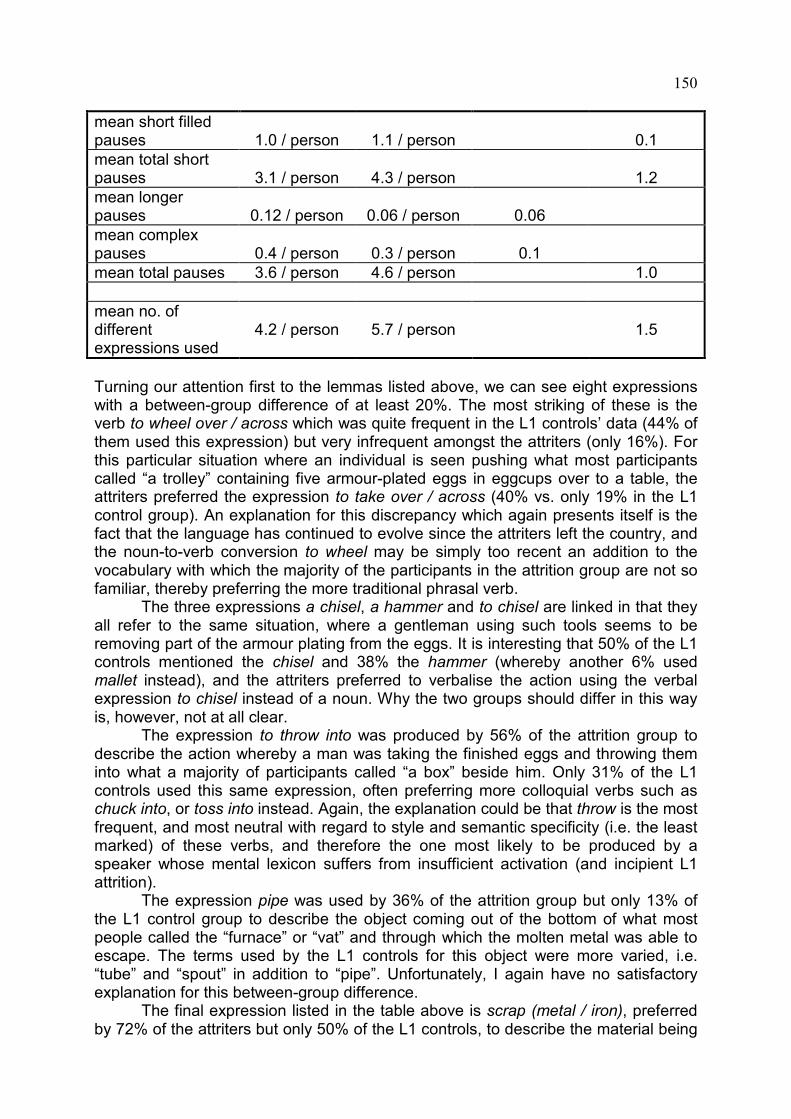
150
mean short filled pauses
1.0 / person
1.1 / person
0.1
mean total short pauses
3.1 / person
4.3 / person
1.2
mean longer pauses
0.12 / person
0.06 / person
0.06
mean complex pauses
0.4 / person
0.3 / person
0.1
mean total pauses 3.6 / person 4.6 / person 1.0 mean no. of different expressions used
4.2 / person
5.7 / person
1.5
Turning our attention first to the lemmas listed above, we can see eight expressions with a between-group difference of at least 20%. The most striking of these is the verb to wheel over / across which was quite frequent in the L1 controls’ data (44% of them used this expression) but very infrequent amongst the attriters (only 16%). For this particular situation where an individual is seen pushing what most participants called “a trolley” containing five armour-plated eggs in eggcups over to a table, the attriters preferred the expression to take over / across (40% vs. only 19% in the L1 control group). An explanation for this discrepancy which again presents itself is the fact that the language has continued to evolve since the attriters left the country, and the noun-to-verb conversion to wheel may be simply too recent an addition to the vocabulary with which the majority of the participants in the attrition group are not so familiar, thereby preferring the more traditional phrasal verb. The three expressions a chisel, a hammer and to chisel are linked in that they all refer to the same situation, where a gentleman using such tools seems to be removing part of the armour plating from the eggs. It is interesting that 50% of the L1 controls mentioned the chisel and 38% the hammer (whereby another 6% used mallet instead), and the attriters preferred to verbalise the action using the verbal expression to chisel instead of a noun. Why the two groups should differ in this way is, however, not at all clear. The expression to throw into was produced by 56% of the attrition group to describe the action whereby a man was taking the finished eggs and throwing them into what a majority of participants called “a box” beside him. Only 31% of the L1 controls used this same expression, often preferring more colloquial verbs such as chuck into, or toss into instead. Again, the explanation could be that throw is the most frequent, and most neutral with regard to style and semantic specificity (i.e. the least marked) of these verbs, and therefore the one most likely to be produced by a speaker whose mental lexicon suffers from insufficient activation (and incipient L1 attrition). The expression pipe was used by 36% of the attrition group but only 13% of the L1 control group to describe the object coming out of the bottom of what most people called the “furnace” or “vat” and through which the molten metal was able to escape. The terms used by the L1 controls for this object were more varied, i.e. “tube” and “spout” in addition to “pipe”. Unfortunately, I again have no satisfactory explanation for this between-group difference. The final expression listed in the table above is scrap (metal / iron), preferred by 72% of the attriters but only 50% of the L1 controls, to describe the material being

151
brought in at the top of the picture which is then being melted. Again, the L1 controls concurred less with each other than the attriters, also producing “junk metal” and “old metal / iron” which were much less frequent in the attriters’ data. I would assume that the explanation for this difference is again to be found in the fact that the attriters’ vocabulary is somewhat old-fashioned, and this term goes back to the days when so-called scrap merchants or dealers drove around to collect scrap metal. The term is presumably less common and therefore less fixed today, allowing the creation of new, synonymous terms in its place. Looking at the figures for hedges in the above table, we see a very different picture from that described above. In the longer oral descriptions for the Film retelling, only 29 hedges were produced overall by both groups, compared to 35 here, although less was said. On average, 68% of the attriters use such expressions here, which is 12% less than in the Film retelling, but in this task the L1 control group used 45% more rather than less. In other words, the hedging rate has dropped in the attrition group (compared to the Film retelling task) but risen dramatically in the L1 control group. The between-group difference is again not significant, however, as revealed by a Mann-Whitney U test (U = 165.5, p = 0.322). This rise is also reflected in the production of the most common hedges in both groups, i.e. sort of and kind of, whereby kind of is again the more popular of the two among the L1 controls, and sort of for the attriters. Here the L1 controls use the two hedges 29% more often than the attriters. The most common hedge found in the attrition group’s data, apart from sort of and kind of, was (looks) like a which did not occur at all in the L1 control group’s data, but was used by 16% of the attrition group. The discrepancy between the results of these two supposedly similar tasks is striking and certainly unexpected. I would have assumed that the findings of both would be comparable, or possibly that the between-group difference would be even more marked here as this task is assumed to be lexically more challenging. However, the attriters seem to have run into slightly less problems; only the L1 controls experienced more difficulties. Looking at the pauses produced whilst completing the Picture description task, it is noticeable that, here, the L1 control group pause more than the attrition group, which is line with the increased hedging rate for this group and confirms that the two phenomena do appear to be linked. Looking at the different types of pause, we see that it is again the short silent pauses which account for most of this between-group variation, although here it is the L1 controls that pause more. The attriters, however, still produce more longer and more complex pauses than the L1 controls, as in the previous Film retelling task, although the difference between the two is minimal. Looking at the final figures in the table above, we can again see that the individual members of the L1 control group produce more different expressions to describe these fifteen situations than the attriters, on average, although the attrition group produces more overall60
60 The attriters produce a total of 104 different expressions (÷ 25 = 4.2 per person) and the L1 controls 91 (÷ 16 = 5.7).
. The numbers are lower than for the Film retelling but here fewer situations were analysed. The between-group difference is 1.5 expressions per person here, compared to 1.9 for the Film retelling, suggesting a reasonably consistent general lexical advantage for the L1 controls.

152
The combination of the L1 controls’ markedly higher rate of hedging here together with the increase in pauses indicates that this task proved quite a major challenge for this group, although an explanation is far from simple. Possibly the attriters are more used to having to search their mental lexicon and produce lexemes with which they are no longer quite so familiar, on an almost daily basis, and for them this task was indistinguishable from the previous one in that respect, leading to similar results. The assumption would then be that the L1 controls, on the other hand, are not as practised at having to search for vocabulary or activate infrequent lexical items, and therefore paused and hedged more whilst doing so.
3.4.8. Analysis of Film retelling and Picture description combined After having discussed the lexical analysis of the transcripts created from these two oral tasks in the previous two sections, as well as the CLAN findings for each of the tasks individually, here the results of the CLAN analysis will be reported for both tasks combined. As mentioned above, the following features were isolated and then counted, or calculated by the programme for both tasks together: total types (i.e. number of different words), total tokens (i.e. total words), D (as a measure of lexical diversity), total numbers of repetitions, corrections and reformulations, total numbers of silent and filled pauses, and (for the attrition group only) the number of code-switches into German. All results (except D) are again shown as a percentage of the total number of tokens produced, to enable comparability, and listed in the tables below: Table 36: D values for the Film retelling and Picture description tasks combined (N=41)
Attrition group (N=25)
L1 control group (N=16)
Between-group difference
mean D 66.1 58.3 7.8 range of D values 41.2-81.2 43.7-69.1 SD 9.14 7.27 The table above shows the D values for both groups for the two spoken tasks combined. As the attrition group had a higher figure for both tasks individually, it comes as no surprise that the figure is again higher here, indicating that the members of this group used a larger variety of lexical items in completing the two tasks than did the L1 control group. Although there is quite a high between-group difference, an independent samples t-test showed this to be not significant (t = 1.418, df = 39, p = 0.164). As these findings were unpredicted, a further analysis was carried out on the data produced in both tasks, to investigate whether there is at least a difference in lexical sophistication between the two native speaker groups. This phenomenon is demonstrated in the two passages below (from Jarvis, 2006):
There was a girl who was alone and hungry. She stole some bread from a bakery and tried to run away, but she ran into a man, and they both fell down. That gave the police enough time to find her and catch her.

153
A destitute and lonely young female stole a loaf of bread from a bakery. She attempted to flee, but she collided with a man who was walking toward her, and both of them fell down. In the meantime, a policeman arrived and detained them.
Both excerpts describe the same scene in the Charlie Chaplin film Modern Times (which was also used for the Film retelling task in this study), they receive the same D value, and are therefore considered equivalent by CLAN. Obviously, however, the lower one demonstrates a considerably more sophisticated use of language than the other. The first step in carrying out such an analysis on the corpus was to count and compare the different types of lexeme used by each of the participants, i.e. how many nouns, verbs, determiners, auxiliaries etc. were produced. This, however, did not yield any significant between-group differences. The next step was to take frequency into account, whereby all lexemes were assigned to one of five levels, based on their frequency within the total corpus. The idea was that, although the attrition group seem to use a wider range of lexemes (as their D value is higher), they may simply be using more common, everyday lexemes than the L1 controls (as in the first excerpt above). For each of the individuals then, and for the two groups, it was computed how many lexemes from each of the five levels were produced, to see how lexically sophisticated their language use is. This analysis again revealed that there is no significant difference between the two native speaker groups. In other words, the variation between the two (with regard to lexical diversity) cannot be explained by saying that the attriters are merely using more highly-frequent, and less sophisticated lexemes, as they in fact show a similar range to that exhibited by the L1 controls. Table 37: CLAN analysis of the Film retelling and Picture description tasks combined (N=41)
Attrition group (N=25)
L1 control group (N=16)
Between-group
difference attr gp > L1
cg
Between-group
difference L1 cg > attr
gp % of the tokens mean repetitions 1.57% 1.39% 0.18% range of repetitions 0.27-3.69% 0.49-2.72% SD 1.05 0.64 mean corrections 1.33% 1.14% 0.19% range of corrections 0.52-3.50% 0.47-1.98% SD 0.60 0.47 mean reformulations
0.46%
0.56%
0.10%
range of reformulations
0.09-1.02%
0-1.10%
SD 0.22 0.28 mean filled pauses 4.01% 3.83% 0.18% range of filled pauses
0.61-12.70%
1.29-11.29%
SD 2.76 2.73

154
mean short silent pauses
6.70%
4.12%
2.58%
range of short silent pauses
1.89-12.82%
1.62-6.77%
SD 2.80 1.64 mean long silent pauses
0.29%
0.10%
0.19%
range of long silent pauses
0-1.00%
0-0.70%
SD 0.31 0.19 mean code-switches
0.06%
n/a
range of code-switches
0-1.03%
n/a
SD 0.21 n/a totals mean total pauses 11.00% 8.03% 2.97% range of total pauses
3.16-21.64%
3.23-15.15%
SD 4.27 3.25 mean retracings 3.37% 3.08% 0.29% range of retracings 1.15-6.59% 1.03-4.90% SD 1.40 1.07 mean total hesitation features
14.37%
11.12%
3.25%
range of total hesitation features
6.36-25.74%
4.27-18.73%
SD 4.97 3.73 The table above pools the findings from the two individual tasks, confirming that the attriters have higher scores for all individual and total hesitation features except for the reformulations, where the L1 controls have a slightly higher figure. All of the individual features have a minimal difference of less then 0.20% except for the short silent pauses, where the between-group difference is 2.58%, indicating that it is particularly in this area where the behaviour of the two groups differs, and that this is the feature which is also largely responsible for the higher overall score (mean total hesitation features). A Mann-Whitney U test showed the following between-group differences to be significant: ‘short silent pauses’ (U = 90, p < 0.01), and ‘long silent pauses’ (U = 110, p < 0.05). As the Picture description task yielded no significant results, these between-group differences are assumed to be largely due to the differences already found in the Film retelling task. Looking at the scores for the ‘total hesitation features’ we see a wide range of values, which is widest in the attrition group where 19.38% lie between the lowest (6.36%) and the highest (25.74%) individual score, compared to 14.47% in the L1 control group, suggesting a great deal of individual variation with regard to the amount of hesitation found in the individual transcripts.

155
3.4.9. Summary of between-group differences in the test battery In this section, all of the significant between-group differences, both from the more formal tests of English, and from the naturalistic, spoken data are repeated in one table. The actual statistical procedure carried out and the precise result for each test or feature measured is reported above, and generally not mentioned again here, where only the p value is given. Table 38: Summary of between-group differences in the test battery (N=64) Attriters vs.
L1 controls Attriters vs.
German controls
L1 controls vs. German controls
basic level lexemes in FiCA 1
n.s.61
**
n.s.
FiCA 2 n.s. ** ** basic level lexemes in FiCA 2
n.s.
**
**
‘Scrabble’ test n.s. ** ** ‘Scrabble’ weighted n.s. ** ** C-Test English n.s. ** * C-Test English weighted n.s. ** ** total score (English tests) n.s. ** ** C-Test German n/a ** n/a C-Test German weighted n/a ** n/a Film retelling short silent pauses ** n/a n/a long silent pauses * n/a n/a * p < 0.05, ** p < 0.01 In the table above, we can see a number of significant between-group differences for the more formal English tests (i.e. the two FiCAs, English C-Test, and ‘Scrabble’ test), but only between the German controls and one or both of the two native speaker groups. There are no such differences between the attriters and L1 controls, which is interpreted as there being no evidence of L1 attrition in the attrition group on the basis of these tests. In the (relatively) free spoken data, we do find between-group differences between the attriters and L1 controls, but only for two of the features measured. The table shows that in the Film retelling task the attriters produce significantly more short silent pauses (U = 91, p < 0.001), and long silent pauses (U = 158, p < 0.05) than the L1 controls. Whether or not this can be considered L1 attrition will be discussed in 3.5. later.
3.4.10. Correlations between variables in the attrition group As the aim of this research project is largely exploratory, this section will take a look at how the predictor (or independent) variables, on the one hand, and also the outcome variables, on the other, correlate with each other within the attrition group.
61 The abbreviation n.s. signifies a non-significant between-group difference.

156
The computations were carried out using Spearman’s rho, again, as not all of the data meet the assumptions necessary for parametric statistical procedures. ‘Level of education’ is missing from the predictors below as it does not appear to correlate with any of the others. (Please note that, as is often done with such correlation tables, only the top half is filled in, as the bottom half would just repeat the same results. Also the perfect correlations between the same variables, e.g. LOR with LOR which would result in 1.0 have been omitted.) Table 39: Correlations between different predictor variables in the attrition group (N=25) LOR L2
use L2
prof.62No. of L2s
NS rating
L1 prof.
L1 use
L1 attitude
LOR n.s. n.s. n.s. -.651** -.505* -.420*63 n.s. L2 use n.s. n.s. n.s. -.685** -.530** -.673** n.s. L2 prof. n.s. n.s. .480* -.484* -.593** n.s. n.s. L1 prof. n.s. n.s. n.s. n.s. .766** .439* n.s. L1 use n.s. n.s. n.s. n.s. .854** n.s. n.s. L1 attitude n.s. n.s. n.s. n.s. .659** .656** .550** sex n.s. n.s. -.460* -.462* n.s. n.s. n.s. n.s. age (at testing)
.553**
n.s.
n.s.
n.s.
n.s.
n.s.
n.s.
n.s.
age at emigration
-.606**
-.486*
-.570**
n.s.
.652**
.648**
.486*
.535**
* p < 0.05, ** p < 0.01 The table above reports findings which are partly expected, such as the fact that the ‘age at testing’ or ‘age at emigration’ correlate with LOR, and partly quite fascinating. Some of these less anticipated results are listed and occasionally commented on below: A longer LOR correlates with lower self-reported L1 proficiency and with less use
of L164
More use of L2 correlates with lower self-reported L1 proficiency, less use of L1, and with a younger age at emigration.
. This could be interpreted as reflecting the fact that many potential attriters perceive their language to have changed in some way, even if this cannot always be detected in actual studies.
Higher L2 proficiency correlates with being female, being younger at emigration, having a higher no. of L2s, and lower L1 proficiency. This can be taken as evidence that there is a perceived ‘trade-off’ between the speakers’ languages, if not an actually measurable one.
Higher self-perceived L1 proficiency correlates with a greater degree of L1 use, but also with a shorter LOR, less use of L2, lower L2 proficiency, a more positive L1 attitude, and a more advanced age at emigration.
62 The abbreviation ‘prof.’ in this table refers to ‘proficiency’. 63 Such a negative correlation (signifying an inverse relationship between the two variables) can be interpreted as meaning that less L1 use correlates with a longer LOR, and more with a shorter one. 64 Please note that this could also be formulated in the opposite way, i.e. a shorter LOR correlates with higher self-reported L1 proficiency and with more use of L1. Generally when discussing the correlations only one of these will be mentioned, but it goes without saying that the alternative is also equally valid in each case.

157
A greater degree of L1 use correlates with a shorter LOR, less use of L2, higher L1 proficiency, a more positive L1 attitude, and a higher age at emigration.
A more positive L1 attitude correlates with higher L1 proficiency, and more L1 use, but also a later age at emigration.
Sex correlates with L2 proficiency and the no. of L2s spoken, in that being female correlates with higher L2 proficiency and more L2s.
A more advanced age at emigration correlates with less L2 use, reduced L2 proficiency, a higher native speaker rating, higher L1 proficiency, more L1 use, and a more positive L1 attitude.
The native speaker rating correlates significantly with many of the other predictors, but this is partly unavoidable as a number of them are calculated on the basis of the same questions from the questionnaire. What was not foreseeable, however, is that a high rating also correlates with a short LOR, and being older at emigration.
The following table now shows similar correlations for the outcome variables from the four more formal tests. Table 40: Correlations between different test outcomes in the attrition group (N=25) C-Test
English weighted
C-Test German
C-Test German weighted
‘Scrabble’ ‘Scrabble’ weighted
FiCA 1 -.473* n.s. n.s. n.s. n.s. FiCA 2 -.432* n.s. n.s. n.s. n.s. C-Test English
-.512**
.535**
n.s.
.500*
.463*
C-Test English weighted
n.s.
n.s.
-.417*
-.445*
C-Test German
n.s.
-.788**
n.s.
n.s.
‘Scrabble’ n.s. n.s. n.s. .954** * p < 0.05, ** p < 0.01 Some of these results could have been predicted such as the correlations between each of the C-Tests and their respective weighted scores, but also between the ‘Scrabble’ test and its weighted score. Others are more unforeseen such as the correlations between the weighted score for the English C-Test and the two FiCAs, or between the two C-Tests (English and German). This latter again reveals the unexpected finding that if an individual performs well (or weakly) on one of the C-Tests, s/he is likely to do so on the other as well. Quite a pleasant surprise is the fact that both scores for the ‘Scrabble’ test (i.e. the initial and the weighted one) show at least a medium-sized correlation with the English C-Test, suggesting that this new test item is also a relatively useful tool for measuring ‘global language proficiency’, or at least that it appears to be measuring whatever the C-Test is. The following table looks at correlations between the various features measured in the two more naturalistic, spoken tasks (i.e. Film retelling and Picture description), and again only those rows and columns required to show all results are included in the table.

158
Table 41: Correlations between features in the two spoken tasks for the attrition group (N=25) F tok F D F co F fp F cs P tok P rep P ref P ## F rep n.s. -.439* n.s. n.s. n.s. n.s. .637** n.s. n.s. F co n.s. -.426* n.s. n.s. n.s. n.s. n.s. n.s. F # n.s. -.434* n.s. n.s. n.s. n.s. n.s. n.s. .413* F fp n.s. -.672** n.s. ++ n.s. n.s. n.s. n.s. F hd .581** n.s. n.s. n.s. n.s. .622** n.s. n.s. n.s. F cs n.s. n.s. n.s. .489* n.s. n.s. n.s. n.s. P tok .521** n.s. n.s. n.s. n.s. n.s. n.s. n.s. P D n.s. n.s. n.s. n.s. n.s. .454* n.s. n.s. n.s. P co n.s. n.s. n.s. .439* n.s. n.s. .499* n.s. n.s. P fp n.s. -.524** n.s. .738** n.s. n.s. n.s. n.s. n.s. P hd n.s. n.s. n.s. n.s. n.s. n.s. n.s. -.597** n.s. P cs n.s. n.s. .564** n.s. . 501* n.s. n.s. n.s. 508**
* p < 0.05, ** p < 0.01 Key for symbols: ++ = This correlation is already given elsewhere (.489*). F = Film retelling; P = Picture description tok = tokens; D = lexical diversity; rep = repetitions; co = corrections; ref = reformulations; # = short silent pauses; ## = long silent pauses; fp = filled pauses; hd = hedges; cs = code-switches A total of 19 medium-sized and stronger correlations appear to exist between these features, the most interesting of which are briefly listed below: Lexical diversity (D) in the Film retelling correlates with five other features, most of
which are in the same task. If lexical diversity is high the numbers of repetitions, corrections, short silent and filled pauses are likely to be low.
The number of hedges produced by the attriters during the Film retelling correlates quite strongly with the number of tokens in the same task, but also with the number of tokens counted for the Picture description. These findings indicate that those who produce more tokens also hedge more.
The number of tokens in both tasks also seems to be related, so the individual differences with regard to the length of the transcripts is consistent between the two tests, suggesting that this is more of an individual characteristic than an indicator of how difficult the two tasks were felt to be.
The number of repetitions produced correlates quite strongly between both tasks, again signalling individual differences in style, i.e. either an individual is likely to repeat him/herself (and then does so in both tasks) or is not (and then does not in either).
This finding is particularly striking in the case of the filled pauses where we have a very strong positive correlation between the feature in both tasks.
The final correspondence of this type affects code-switching which again shows a positive correlation between the two tasks.
The amount of code-switching produced in the Film retelling also correlates positively with the number of filled pauses in the same task, and in the Picture description code-switching co-occurs with the number of long silent pauses in the same task, as well as the number of corrections in the Film retelling.

159
Within the Picture description the numbers of repetitions and corrections also show a correlation, as do the instances of reformulation and the number of hedges. In the first case, the correlation is positive indicating that both either occur frequently or rarely, but in the second the two show an inverse relationship which means that a higher number of reformulations correlates with fewer hedges (or conversely, more hedges with fewer reformulations).
In the final table below all four of the more formal tests of English are compared to the features from the two spoken tests, and as before only significant correlations are reported. Table 42: Correlations between (relatively) free spoken data and four English tests for attrition group (N=25)
FiCA 1
FiCA 2
C-Test English
C-Test English
weighted
‘Scrabble’ test
‘Scrabble’ weighted
Total score
Film retelling D n.s. n.s. n.s. -.400* .435* .411* n.s. filled pauses n.s. -.446* n.s. n.s. -.495* -.453* -.474* long silent pauses
n.s.
n.s.
n.s.
.481*
n.s.
n.s.
n.s.
repetitions n.s. -.431* n.s. n.s. n.s. n.s. n.s. corrections n.s. -.584** n.s. n.s. n.s. n.s. n.s. code-switches n.s. n.s. -.455* .591** n.s. n.s. n.s. Picture description
D n.s. n.s. n.s. n.s. n.s. n.s. n.s. short silent pauses
n.s.
n.s.
n.s.
n.s.
-.557**
-.548**
-.430*
corrections n.s. n.s. n.s. n.s. -.582** -.625** -.613** reformulations n.s. -.432* n.s. n.s. n.s. n.s. n.s. code-switches n.s. -.417* n.s. .407* n.s. n.s. n.s.
* p < 0.05, ** p < 0.01 FiCA 1 does not show any significant correlations with the more naturalistic data. We do, however, find five medium-sized or larger negative correlations with FiCA
2, although there does not seem to be a clear pattern to these as the correlations are not with the same features in both tasks. In all cases, a higher score for FiCA 2 co-occurs with a lower degree of hesitancy as measured in the number of filled pauses, repetitions, corrections and reformulations. Those individuals with a higher score in FiCA 2 also code-switch less than those with a lower score.
The English C-Test only shows one significant, medium-sized negative correlation with the amount of code-switching in the Film retelling.
The weighted score for this C-Test, however, correlates with a number of features from the spoken data, in particular with the figures for code-switching from both tasks. A low score (indicating a faster time to find one correct answer) also co-occurs with a higher D value and fewer long silent pauses in the Film retelling.
A high score for the ‘Scrabble’ test (including the weighted score) also correlates with better performance in the spoken tasks, as indicated by a higher D and fewer

160
filled pauses in the Film retelling, but also fewer short silent pauses and corrections in the Picture description.
Overall, the table shows an utterly consistent picture in that better performance in the more formal tests (i.e. higher scores in the tests, or a lower weighted score for the C-Test) correlates significantly with better performance in the more naturalistic, spoken data (i.e. a higher D value, fewer hesitation markers, and less code-switching). Although, there are only few significant correlations between these two test types, therefore, it does seem that they are targeting the same thing and that high or low proficiency in the one type of test is at least partly transferable to the other.
3.4.11. Correlations between group test scores and can-dos In keeping with the exploratory nature of this thesis, this section will investigate whether there are any significant correlations between the test outcomes and the can-dos for English and German. English can-dos Table 43: Mean scores for the English can-dos and four English tests for all three groups (N=64) Attrition group
(N=25) L1 control
group (N=20)
German control group
(N=19) mean can-dos English 77.7 76.5 68.3 mean FiCA 1 24.5 21.7 20.2 mean FiCA 2 23.0 22.2 15.6 mean C-Test English 88.8 89.3 82.1 mean time for one correct answer (C-Test English weighted)
10:12 secs.
10:33 secs.
14:08 secs.
mean ‘Scrabble’ test 23.9 23.4 15.8 mean ‘Scrabble’ weighted 102.4 101.6 65.8 mean total score 238.3 233.9 182.8 D (for both spoken tasks) 66.1 58.3 n/a All correlations in the three tables below were calculated using Spearman’s rho as not all of the data met parametric assumptions. Table 44: Correlation analyses between the English can-dos and four English tests for all three groups (N=62)
FiCA 1
FiCA 2
C-Test English
C-Test English
weighted
‘Scrabble’ test
‘Scrabble’ weighted
Total score
English can-dos
.253*
.447**
.411**
-.463**
.387**
.374**
.431**
* p < 0.05, ** p < 0.01
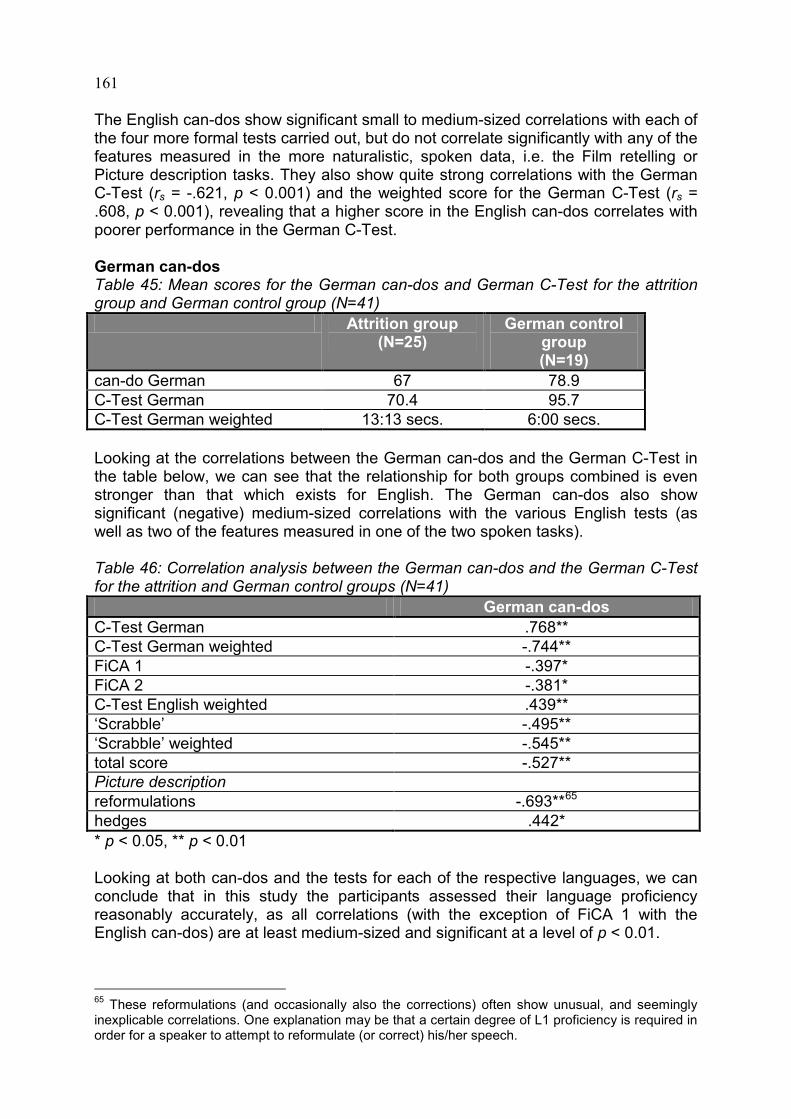
161
The English can-dos show significant small to medium-sized correlations with each of the four more formal tests carried out, but do not correlate significantly with any of the features measured in the more naturalistic, spoken data, i.e. the Film retelling or Picture description tasks. They also show quite strong correlations with the German C-Test (rs = -.621, p < 0.001) and the weighted score for the German C-Test (rs = .608, p < 0.001), revealing that a higher score in the English can-dos correlates with poorer performance in the German C-Test. German can-dos Table 45: Mean scores for the German can-dos and German C-Test for the attrition group and German control group (N=41)
Attrition group (N=25)
German control group (N=19)
can-do German 67 78.9 C-Test German 70.4 95.7 C-Test German weighted 13:13 secs. 6:00 secs. Looking at the correlations between the German can-dos and the German C-Test in the table below, we can see that the relationship for both groups combined is even stronger than that which exists for English. The German can-dos also show significant (negative) medium-sized correlations with the various English tests (as well as two of the features measured in one of the two spoken tasks). Table 46: Correlation analysis between the German can-dos and the German C-Test for the attrition and German control groups (N=41)
German can-dos C-Test German .768** C-Test German weighted -.744** FiCA 1 -.397* FiCA 2 -.381* C-Test English weighted .439** ‘Scrabble’ -.495** ‘Scrabble’ weighted -.545** total score -.527** Picture description reformulations -.693**65
hedges
.442* * p < 0.05, ** p < 0.01 Looking at both can-dos and the tests for each of the respective languages, we can conclude that in this study the participants assessed their language proficiency reasonably accurately, as all correlations (with the exception of FiCA 1 with the English can-dos) are at least medium-sized and significant at a level of p < 0.01.
65 These reformulations (and occasionally also the corrections) often show unusual, and seemingly inexplicable correlations. One explanation may be that a certain degree of L1 proficiency is required in order for a speaker to attempt to reformulate (or correct) his/her speech.

162
Now running similar tests on the three groups individually, we see that there are no significantly high correlations in the German control group, indicating that their self perceptions were the least accurate of the three groups, but that the can-dos of the attriters and L1 controls do correlate with at least some of their test results. The L1 controls show medium-sized correlations between their can-dos, FiCA 2 and the English C-Test, whereby a high score on the can-dos correlates with high scores in the two tests. The correlations between can-dos and test outcomes are stronger in the attrition group, but only for their L2 German, as measured by the German C-Test, and for the reformulations and hedges in the Picture description task. Table 47: Correlation analyses between the can-dos and various tests for all three groups individually (N=62) Items correlated Attrition group
results (N=25)
L1 control group results (N=20)
German control group results
(N=19) English can-dos vs. FiCA 1 n.s. n.s. n.s. FiCA 2 n.s. .514* n.s. C-Test English n.s. .517* n.s. C-Test English weighted
n.s.
n.s.
n.s.
‘Scrabble’ test n.s. n.s. n.s. ‘Scrabble’ weighted n.s. n.s. n.s. total score n.s. n.s. n.s. German can-dos vs.
C-Test German .734** n/a n.s. C-Test German weighted
-.608**
n/a
n.s.
FiCA 1 n.s. n/a n.s. FiCA 2 n.s. n/a n.s. C-Test English weighted
n.s.
n/a
n.s.
‘Scrabble’ n.s. n/a n.s. ‘Scrabble’ weighted n.s. n/a n.s. total score n.s. n/a n.s. Picture description reformulations -.693** n/a n/a hedges .442* n/a n/a * p < 0.05, ** p < 0.01
3.4.12. Correlations between test scores for English and native speaker ratings
This section aims to investigate whether or not the native speaker ratings computed further above are able to help predict the test outcomes for either or both of the native speaker groups.

163
The following table repeats the mean native speaker scores and ratings for the two native speaker groups. Further information such as the standard deviation is not repeated here as it was given in the relevant tables above. Table 48: Mean scores for the native speaker rating for the attrition group and L1 control group (N=45) Attrition group
(N=25) L1 control group
(N=20) mean native speaker score (max. 41)
24
38
mean native speaker rating in % 59% 93% Again using Spearman’s rho, the table below shows those few correlations found to exist between the various test items and the native speaker ratings of the attriters and L1 controls. (As before, all other tests and all features from the naturalistic, spoken data missing below do not correlate significantly with the native speaker ratings and have therefore been omitted.) In the attrition group, both the English weighted C-Test and the German C-Test show a medium-sized negative correlation with the native speaker ratings, which indicates that a high rating is positive for speed in the English C-Test, but negative for a good score in the German C-Test. Within the L1 control group there are no significant correlations between the native speaker ratings and any of the items in the test battery. The native speaker ratings of the two groups together also show a negative correlation with a couple of the features measured in the Film retelling task. These can be interpreted as meaning that a high rating correlates positively with language proficiency, i.e. fewer short and long silent pauses in the Film retelling. Table 49: Correlation analyses between total native speaker ratings and various tests in the attrition and L1 control groups (N=45) Attrition group
(N=25) L1 control group
(N=20) Mean (N=45)
C-Test English weighted
-.432*
n.s.
n.s.
C-Test German -.422* n/a n/a Film retelling short silent pauses n.s. n.s. -.525** long silent pauses n.s. n.s. -.319* * p < 0.05, ** p < 0.01 The following tables list all participants from the two native speaker groups individually with some of their test outcomes, enabling us to investigate any relationship between these and the individual’s native speaker rating. The first two tables show the scores achieved by the attrition group and then the L1 control group for the more formal tests, together with their individual native speaker ratings. This is followed by a table where all 45 native speakers are listed together and where just the total score (for these English tests) is compared to their native speaker ratings. The final two tables then show the same information but for the naturalistic, spoken data from the Film retelling and Picture description tasks.

164
Table 50: Individual scores for the native speaker rating and all English tests (excluding free spoken data) for the attrition group (in alphabetical order) (N=25) Participant
(N = 25) FiCA
1 FiCA
2 C-Test English
C-Test English
weighted
‘Scrabble’ weighted
Total score
NS rating
% ‘Alice’ 20 29 86 9:26 94 228 93 ‘Alison’ 19 22 81 11:05 93 214 39 ‘Amanda’ 25 25 95 6:53 120 264 46 ‘Barbara’ 17 19 93 11:13 134 263 34 ‘Caroline’ 50 29 94 5:47 162 333 76 ‘Claire’ 22 31 91 9:10 83 226 46 ‘Dawn’ 18 22 95 10:59 83 218 54 ‘Donald’ 21 16 73 15:21 44 154 37 ‘Edward’ 25 19 93 11:18 81 218 42 ‘Harriet’ 32 33 93 5:29 78 237 59 ‘Howard’ 24 21 75 18:41 70 191 85 ‘Iris’ 40 33 99 5:32 160 332 93 ‘Janet’ 18 20 87 9:37 88 213 66 ‘Jeremy’ 29 15 96 7:34 162 300 66 ‘Karen’ 20 18 88 11:10 82 206 61 ‘Lewis’ 24 20 99 11:15 99 242 59 ‘Linda’ 33 29 83 12:36 117 262 29 ‘Malcolm’ 25 20 89 7:34 107 240 54 ‘Norma’ 21 25 87 5:52 164 298 76 ‘Patrick’ 26 19 91 11:20 97 233 56 ‘Paula’ 18 30 91 13:09 113 252 44 ‘Rachel’ 30 29 89 7:47 66 214 73 ‘Ray’ 21 12 90 9:31 99 221 90 ‘Rita’ 17 21 87 13:10 93 218 46 ‘Yvonne’ 18 18 76 13:37 70 181 61
The following table shows the same results, but for the L1 controls.
Table 51: Individual scores for the native speaker rating and all English tests (excluding free spoken data) for the L1 control group (in alphabetical order) (N=20) Participant
(N = 20) FiCA
1 FiCA
2 C-Test English
C-Test English
weighted
‘Scrabble’ weighted
Total score
NS rating
% ‘Amy’ 15 24 96 7:16 92 227 94 ‘Anna’ 20 25 81 17:10 106 231 93 ‘Charles’ 22 28 97 9:55 93 239 96 ‘Donna’ 17 23 71 17:17 104 214 95 ‘Esther’ 27 25 96 8:24 131 277 92 ‘Faith’ 28 26 83 13:56 47 182 94 ‘Frances’ 25 28 89 7:33 127 268 87 ‘Ian’ 22 18 97 11:33 126 263 93 ‘Jack’ 27 16 93 9:39 76 211 98 ‘Judith’ 19 24 89 8:05 85 217 93

165
‘Keith’ 17 12 77 16:20 54 160 93 ‘Larry’ 22 29 96 8:31 79 227 96 ‘Martin’ 26 27 98 5:24 215 366 98 ‘Nancy’ 14 21 89 5:52 113 236 95 ‘Owen’ 23 12 78 15:38 61 171 90 ‘Richard’ 16 15 92 9:38 67 189 85 ‘Stuart’ 28 22 92 7:22 63 204 98 ‘Tess’ 23 16 80 16:23 123 241 93 ‘Wendy’ 23 29 97 8:33 178 327 98 ‘Zoe’ 20 23 94 6:38 91 228 95 This next table lists only the total score and the native speaker rating for each individual from all three groups, and is considered quite consequential as it will enable us to estimate the influence of the native speaker rating on the total score. (Unfortunately, statistics programmes such as SPSS (which was used here for the computation) do not allow the comparison of individual scores, and therefore this will by default have to be impressionistic as it is not possible to test these for significant differences or correlations.) As can be clearly seen, the first seven participants (who have the seven highest scores for the four more formal tests) all belong to either the L1 control group or attrition group. In eighth place, though, we have the first member of the German control group, who has managed to outperform the majority of native speakers. Equally, at the bottom of the table where we find the weakest participants, there are four German controls, but then a member from each of the two native speaker groups. Together with the previous two tables, this following one, therefore, clearly demonstrates that there is no obvious, stable relationship between an individual’s native speaker rating and his/her total score. Table 52: Individual native speaker ratings and total scores for all three groups (in descending order of total score) (N=64) Participant
Group Total score
(four English tests) NS rating %
‘Martin’ L1 cg 366 98 ‘Caroline’ attr gp 333 76 ‘Iris’ attr gp 332 93 ‘Wendy’ L1 cg 327 98 ‘Jeremy’ attr gp 300 66 ‘Norma’ attr gp 298 76 ‘Esther’ L1 cg 277 92 ‘Anke’ Ger cg 276 n/a ‘Frances’ L1 cg 268 87 ‘Amanda’ attr gp 264 46 ‘Barbara’ attr gp 263 34 ‘Ian’ L1 cg 263 93 ‘Linda’ attr gp 262 29 ‘Paula’ attr gp 252 44 ‘Lewis’ attr gp 242 59 ‘Tess’ L1 cg 241 93 ‘Malcolm’ attr gp 240 54

166
‘Charles’ L1 cg 239 96 ‘Harriet’ attr gp 237 59 ‘Nancy’ L1 cg 236 95 ‘Birte’ Ger cg 235 n/a ‘Patrick’ attr gp 233 56 ‘Anna’ L1 cg 231 93 ‘Alice’ attr gp 228 93 ‘Zoe’ L1 cg 228 95 ‘Amy’ L1 cg 227 94 ‘Larry’ L1 cg 227 96 ‘Claire’ attr gp 226 46 ‘Oliver’ Ger cg 224 n/a ‘Ray’ attr gp 221 90 ‘Dawn’ attr gp 218 54 ‘Rita’ attr gp 218 46 ‘Edward’ attr gp 218 42 ‘Judith’ L1 cg 217 93 ‘Alison’ attr gp 214 39 ‘Rachel’ attr gp 214 73 ‘Donna’ L1 cg 214 95 ‘Janet’ attr gp 213 66 ‘Jack’ L1 cg 211 98 ‘Natalie’ Ger cg 209 n/a ‘Maria’ Ger cg 208 n/a ‘Karen’ attr gp 206 61 ‘Stuart’ L1 cg 204 98 ‘Stefan’ Ger cg 199 n/a ‘Howard’ attr gp 191 85 ‘Julia’ Ger cg 190 n/a ‘Richard’ L1 cg 189 85 ‘Ilona’ Ger cg 187 n/a ‘Faith’ L1 cg 182 94 ‘Yvonne’ attr gp 181 61 ‘Julian’ Ger cg 178 n/a ‘Laura’ Ger cg 177 n/a ‘Simone’ Ger cg 175 n/a ‘Owen’ L1 cg 171 90 ‘Petra’ Ger cg 170 n/a ‘Franziska’ Ger cg 169 n/a ‘Andreas’ Ger cg 164 n/a ‘Ingo’ Ger cg 164 n/a ‘Keith’ L1 cg 160 93 ‘Donald’ attr gp 154 37 ‘Sabine’ Ger cg 150 n/a ‘Renate’ Ger cg 143 n/a ‘Rolf’ Ger cg 143 n/a ‘Denise’ Ger cg 113 n/a

167
In the following table, the focus is on the naturalistic, spoken data to see if the findings from above also apply to these. Is there a relationship between the individual’s native speaker ratings and their score on the various features measured for the Film retelling and Picture description tasks?66
Participant (N = 25)
The 45 members of the two native speaker groups are represented together in the one table which is sorted according to the native speaker rating. Table 53: Individual scores for the native speaker rating and free spoken data for the two native speaker groups (in descending order of native speaker rating) (N=45)
D Reps Corrs Reforms Hedges NS rating %
‘Jack’ cg 65.74 1.80 1.96 0.88 0 98 ‘Martin’ cg 57.97 1.82 0.65 0.35 0.04 98 ‘Stuart’ cg 69.09 0.66 1.25 0.37 0 98 ‘Wendy’ cg 56.11 1.04 1.25 0.31 0 98 ‘Charles’ cg*
56.16 1.90 1.45 0.30 0 96
‘Larry’ cg 66.04 1.05 0.98 0.84 0.28 96 ‘Donna’ cg* 51.95 0.49 0.49 0.98 0.16 95 ‘Nancy’ cg 62.81 0.52 0.52 0 0 95 ‘Zoe’ cg 61.81 2.33 1.47 1.10 0 95 ‘Amy’ cg 60.10 1.53 0.67 0.38 0.19 94 ‘Faith’ cg 53.69 1.94 1.06 0.53 0.35 94 ‘Alice’ 63.84 1.00 1.06 0.47 0 93 ‘Iris’ 61.06 2.90 1.34 0.16 0.16 93 ‘Anna’ cg* 60.61 0.84 0.91 0.39 0.06 93 ‘Ian’ cg 43.70 2.72 1.39 0.56 0.17 93 ‘Judith’ cg* 57.03 1.22 1.14 0.82 0 93 ‘Keith’ cg 59.02 1.60 0.47 0.38 0 93 ‘Tess’ cg 62.36 0.74 1.07 0.58 0.41 93 ‘Esther’ cg 49.83 2.11 1.71 0.40 0.10 92 ‘Ray’ 57.91 1.43 1.52 0.51 0.08 90 ‘Owen’ cg 47.64 1.54 1.35 0.68 0 90 ‘Frances’ cg 57.06 0.89 0.93 0.54 0.15 87 ‘Howard’ 74.80 1.07 1.61 0.61 0 85 ‘Richard’ cg 67.56 1.00 1.98 0.90 0.36 85 ‘Caroline’ 69.23 1.23 1.08 0.90 0.09 76 ‘Norma’ 69.79 1.02 1.22 1.02 0 76 ‘Rachel’ 50.82 0.63 1.43 0.56 0.08 73 ‘Janet’ 81.22 1.92 0.88 0.52 0.15 66 ‘Jeremy’ 68.35 3.31 1.43 0.83 0.15 66 ‘Karen’ 57.26 3.60 1.65 0.45 0 61 ‘Yvonne’ 56.30 2.68 3.50 0.41 0.10 61 ‘Harriet’ 72.29 0.59 1.03 0.22 0.07 59
66 The following abbreviations are used: ‘Reps’ refers to the number of repetitions measured in both tasks (as a percentage of the total number of tokens produced), ‘Corrs’ to the corrections, and ‘Reforms’ to the reformulations. ‘cg’ behind the participant’s name indicates that the person belongs to the L1 control group. All others are members of the attrition group.

168
‘Lewis’ 41.15 3.69 1.23 0.41 0 59 ‘Patrick’ 60.62 1.44 1.39 0.50 0.10 56 ‘Dawn’ 60.11 0.67 1.79 0.34 0 54 ‘Malcolm’ 66.34 0.27 0.80 0.09 0 54 ‘Amanda’ 70.24 0.34 0.76 0.29 0.17 46 ‘Claire’ 63.15 1.03 0.52 0.52 0.17 46 ‘Rita’ 59.44 2.69 1.35 0.39 0.26 46 ‘Paula’ 51.70 1.61 0.77 0.15 0.31 44 ‘Edward’ 50.72 2.50 1.36 0.25 0.14 42 ‘Alison’ 64.21 0.95 1.28 0.39 0.06 39 ‘Donald’ 53.07 1.38 2.22 0.42 0.08 37 ‘Barbara’ 72.60 1.08 1.52 0.63 0 34 ‘Linda’ 69.49 0.32 0.63 0.44 0 29 * As these four participants only completed the Film retelling (but not the Picture description), their figures are from that one task only. If we now look at the top four participants, who all have a native speaker rating of 98%, and compare their scores for the various features measured in the more naturalistic, spoken data, we can see that there seems to be no straightforward correlation between the two. The D values for these four vary from 56.11 to 69.09, and their scores for repetitions, corrections, reformulations and hedges also show quite a bit of variance. At the bottom of the table, ‘Linda’ who has the lowest native speaker rating has a higher D value than these four (69.49), as well as lower percentages for repetition and correction. The individual with the highest D score (‘Janet’ who has 81.22) only has a native speaker rating of 66% and is therefore in the bottom half of the table. Only five places below ‘Janet’ is ‘Lewis’ with the lowest D score in the group (41.15). The participant who produced the smallest number of repetitions (i.e. 0.27%), the second smallest number of reformulations (0.09%) and who also has a small number of corrections (0.80%) is ‘Malcolm’ whose native speaker rating is only 54%. All of these individual comparisons seem to suggest quite strongly that there is no strong correlation between the native speaker rating of an individual and his/her performance in the two naturalistic, spoken tasks.
3.4.13. Correlations between test scores and predictor variables In this section, possible correlations between the test outcomes, i.e. dependent variables and the predictor variables will be discussed. The aim is to try and identify those predictors which seem to have most impact on the test scores in the three groups, in particular on those of the attrition group. In the following table, all 12 predictor variables being considered in this project are listed, and their applicability to each of the three groups indicated by X (is relevant) or n/a (not applicable).

169
Table 54: Predictor variables and the three groups (N=64) Predictor variable Attrition group
(N=25) L1 control group
(N=20) German control
group (N=19) age (at testing) X X X sex X X X number of L2s spoken X X X level of education X X n/a native speaker rating X X n/a L1 proficiency X X n/a L1 use X X n/a L1 attitude X X n/a age at emigration X n/a n/a LOR (length of residence)
X
n/a
n/a
L2 use X n/a n/a L2 proficiency X n/a n/a In the following sections, each of these predictor variables is considered separately, and its possible impact on the results is discussed. Spearman’s rho was used to calculate all correlations for the tables in the following sections as not all of the data met the assumptions for parametric procedures, and only those tests (or features) are listed where there was at least one significant correlation (in one or more of the groups). If a test is not mentioned, therefore, the variable under discussion does not seem to have any impact on it.
3.4.13.1. ‘Age (at testing)’ in the three groups The impact of this variable on the test outcomes is reported in the following table. Table 55: The impact of ‘age (at testing)’ on the test scores of the three groups (N=64) Attrition
group (N=25)
L1 control group (N=20)
German control group (N=19)
Mean (N=64)
FiCA 1 n.s. n.s. .517* n.s. FiCA 2 n.s. n.s. n.s. .391** C-Test English n.s. n.s. -.458* n.s. C-Test German n.s. n.s. n.s. -.685** C-Test German weighted
n.s.
n.s.
n.s.
.638**
‘Scrabble’ n.s. n.s. n.s. .256* ‘Scrabble’ weighted n.s. n.s. n.s. .252* total score n.s. n.s. n.s. .269* Film retelling short silent pauses n.s. n.s. n/a .377* long silent pauses n.s. n.s. n/a .376*

170
Picture description lexical diversity n.s. n.s. n/a .324* filled pauses n.s. n.s. n/a -.282* reformulations n.s. -.523* n/a n.s. hedges n.s. -.649** n/a n.s. * p < 0.05, ** p < 0.01 Looking at the various correlations in the table above for the individual groups, we can summarise by saying that, where it impacts on the outcome of the tests at all, the variable ‘age (at testing)’ seems to have quite a varied effect. Interestingly, it does not affect any of the results of the attrition group in a significant way, but only those of the two control groups. In the German controls greater age correlates positively with a higher score in FiCA 1 (animals) but negatively with a lower score in the English C-Test. In the L1 controls, in contrast, age has a slightly larger effect but only on the naturalistic, spoken data where a more advanced age correlates with a smaller number of reformulations and hedges in the Picture description. Looking at the entire group (N=64), we see that ‘age’ shows further correlations which do not occur in any of the individual groups, and again here the picture is mixed. A greater ‘age (at testing)’ correlates with a higher score in FiCA 2 (fruit and vegetables), the ‘Scrabble’ test, and overall, but a lower score in the German C-Test. In the spoken data, the effect is also not uniform, as greater age co-occurs with more silent pauses in the Film retelling, but fewer filled pauses and a higher D in the Picture description. The effect of the variable ‘age (at testing)’ on the data appears to be quite complex, as it affects the different tests (and test types) in varied ways. Interestingly, though, it has no significant impact at all on the outcomes in the attrition group.
3.4.13.2. ‘Sex’ in the three groups The impact of this variable was calculated with Spearman’s rho and a number of significant results were identified, as shown in the table below. Table 56: The impact of ‘sex’ on the test scores in the three groups (N=64) Attrition
group (N=25)
L1 control group (N=20)
German control group (N=19)
Mean (N=64)
FiCA 2 -.615** n.s. n.s. -.391** Film retelling filled pauses
n.s.
n.s.
n/a
.314*
Picture description filled pauses
.500*
.542*
n/a
.476**
* p < 0.05, ** p < 0.01 As ‘sex’ was coded 0 for women, and 1 for men, the figures can be interpreted as follows: in the FiCA 2 task (fruit and vegetables), the female attriters outperformed their male counterparts, as there is a strong inverse relationship between the two variables. In the Picture description, the men in the two native speaker groups

171
produced significantly more filled pauses than the women. The mean figures for all three groups combined confirm these findings, but also show a significant positive correlation between the men and the number of filled pauses in the Film retelling.
3.4.13.3. ‘Number of L2s spoken’ in the three groups The problem of course with this variable is that we do not know how well the participants know, or are able to use, each of their L2s, and this is presumably an important question. Cook (cp. 2003:13), for example, assumes that an L2 can only affect an L1 when the speaker is a highly proficient L2 user. But, unfortunately, we do not have this information, and can therefore only compare the number of languages (as reported by the individual participants) to the test results. The effect of this variable on the test outcomes was again calculated on the basis of Spearman’s rho and all significant results are reported in the table below. Table 57: The impact of ‘number of languages spoken’ on the test scores in the three groups (N=64) Attrition
group (N=25)
L1 control group (N=20)
German control group (N=19)
Mean (N=64)
FiCA 2 .451* n.s. n.s. n.s. C-Test German .510* n/a n.s. .313* C-Test German weighted
-.575**
n/a
n.s.
-.397**
‘Scrabble’ test .603** n.s. n.s. n.s. ‘Scrabble’ weighted .494* n.s. n.s. n.s. total score .468* n.s. n.s. Picture description lexical diversity n.s. -.528* n/a n.s. repetitions n.s. .651** n/a n.s. * p < 0.05, ** p < 0.01 The results show that this variable does not seem to impact significantly on the results of the German control group, and has an uneven effect on the two native speaker groups. For the attriters, who show a number of medium-sized or larger correlations with this predictor, but only for the more formal tests, the effect is consistently positive, i.e. an increase in the number of L2s spoken correlates with higher scores in the FiCA 2, ‘Scrabble’ test, and the total score. It also has a positive effect on the German C-Test, correlating with a higher mean and a lower weighted score. For the L1 controls, conversely, the variable only affects the spoken data, and the effect is negative, with a higher number of L2s correlating with reduced lexical diversity, and a higher number of repetitions in the Picture description task. For the attrition group, this predictor seems to have quite a strong impact on the outcomes, and the direction of the effect is quite unexpected (and contrary to the

172
prediction) as a higher number of L2s appears to be beneficial to their English language proficiency.
3.4.13.4. ‘Level of education’ in the attrition group and L1 control group This variable was controlled in the German control group, where all participants have a university degree, and could therefore not have any effect on the group’s results. In the attrition group, ‘level of education’ showed no significant effects, but did impact to a certain degree on test scores in the L1 control group, as shown in the table below. Table 58: The impact of ‘level of education’ on the test scores in the two native speaker groups (N=45) Attrition group
(N=25) L1 control group
(N=20) C-Test English n.s. .612** C-Test English weighted n.s. -.446* total score n.s. .473* Film retelling corrections n.s. .464* Picture description reformulations n.s. .499* * p < 0.05, ** p < 0.01 ‘Level of education’ was coded so that 1 indicates a participant with a university education, and 0 one without. The results can therefore be interpreted as showing that, among the L1 controls only, those group members with a university degree performed better in the English C-Test, and were quicker at finding correct answers. They did, however, also, produce more corrections in the Film retelling task, and reformulate more often in the Picture description.
3.4.13.5. ‘Native speaker rating’ in the attrition group and L1 control group See 3.4.12. above for a discussion of the impact of this predictor variable on the test results.
3.4.13.6. ‘L1 proficiency’ in the attrition group and L1 control group This predictor variable is only applicable to the two native speaker groups and therefore the German controls are not included in the table below. Table 59: The impact of ‘L1 proficiency’ on the test scores in the two native speaker groups (N=45) Attrition group
(N=25) L1 control group
(N=20) Mean (N=45)
FiCA 1 .402* n.s. n.s. FiCA 2 n.s. -.478* n.s. Film retelling short silent pauses n.s. n.s. -.350*

173
hedges -.449* n.s. -.351* code-switches -.414* n/a n/a Picture description hedges n.s. -.580* n.s. * p < 0.05 The above results can be read as showing that higher (self-reported) ‘L1 proficiency’ has a positive effect on all those outcomes with which it correlates except for one, namely FiCA 2 in the L1 control group. In the attrition group, it correlates with a higher score in FiCA 1, and fewer hedges and code-switches in the Film retelling task. In the L1 control group it also correlates with fewer hedges in the Picture description. If we now look at the effect on the entire group (N=45), we see that it only correlates negatively with two features in the Film retelling: short silent pauses and hedges. The variable ‘L1 proficiency’ does not have seem to have that big an impact on the test outcomes of the attrition group, only showing medium-sized correlations with two of the features measured in the spoken data and one of the more formal tests.
3.4.13.7. ‘L1 use’ in the attrition group and L1 control group The effect of this variable on the results of the two native speaker groups is reported in the table below. Table 60: The impact of ‘L1 use’ on the test scores of the two native speaker groups (N=45) Attrition group
(N=25) L1 control group
(N=20) Mean (N=45)
C-Test German -.417* n/a n/a Film retelling short silent pauses n.s. n.s. -.480** long silent pauses n.s. n.s. -.305* Picture description corrections n.s. -.539* n.s. * p < 0.05, ** p < 0.01 As this table shows, the variable ‘L1 use’ was shown to have no effect on the two groups’ results from the four more formal tests of English, but does correlate significantly with the German C-Test, where increased L1 use has a negative effect on the attriters’ score. We also see a relationship between ‘L1 use’ and some of the features from the spoken data. Here there is an inverse relationship, revealing that more L1 use has a positive effect, as it correlates with the production of fewer corrections by the L1 control group in the Picture description. For the group as a whole (N=45) more use also has a positive effect on the number of silent pauses produced during the Film retelling. This predictor does not appear to have much impact on the language produced by the attrition group, only showing a medium-sized effect of increased use on higher

174
scores in the German C-Test, but no significant influence on any of the English tests or features measured.
3.4.13.8. ‘L1 attitude’ in the attrition group and L1 control group Again using Spearman’s rho as the statistical procedure, the impact of the variable ‘L1 attitude’ on the test outcomes of the attriters and L1 controls was examined. The significant findings are reported below. Table 61: The impact of ‘L1 attitude’ on the test scores of the two native speaker groups (N=45) Attrition group
(N=25) L1 control group
(N=20) Mean (N=45)
FiCA 1 .439* n.s. n.s. FiCA 2 .440* n.s. n.s. C-Test English weighted
-.451*
n.s.
n.s.
Film retelling short silent pauses n.s. n.s. -.467** code-switches -.559** n/a n/a Picture description corrections n.s. -.504* n.s. long silent pauses -.471* n.s. -.346* code-switches -.409* n/a n/a * p < 0.05, ** p < 0.01 The figures in the table above show that a more positive ‘L1 attitude’ has a beneficial effect on language proficiency, as indicated by higher FiCA scores, and a lower weighted score in the English C-Test. The variable also shows an inverse relationship with some of the features from the Film retelling and Picture description tasks, which can be interpreted as meaning that a more positive ‘attitude’ is correlated with fewer pauses, corrections, and code-switches when speaking. For the attrition group, this variable has a more profound impact on the test outcomes than many others, showing medium-sized correlations with three of the more formal tests, and three of the features measured in the naturalistic, spoken tasks. The only other predictor which has a similarly strong effect is the ‘number of L2s spoken’ which also showed six significant correlations, albeit only with the more formal tests.
3.4.13.9. ‘Age at emigration’ in the attrition group A Spearman’s rho correlation procedure was again carried out to investigate the possible impact of this variable on the test results of the attrition group, and yielded three medium-sized correlations as reported in the table below.

175
Table 62: The impact of ‘age at emigration’ on the test scores of the attrition group (N=25) Attrition group
(N=25) C-Test German -.495* C-Test German weighted .485* Picture description reformulations .488* * p < 0.05 These results can be interpreted as meaning that a more advanced ‘age at emigration’ has a negative effect on both of the attriters’ two languages, on the one hand correlating with more reformulations during the Picture description task, and on the other with a poorer performance in the German C-Test.
3.4.13.10. ‘LOR’ in the attrition group The impact of this variable, i.e. LOR (length of residence in the L2 community) on the test results of the attrition group was calculated and the results are reported below. Table 63: The impact of ‘LOR’ on the test scores in the attrition group (N=25) Attrition group
(N=25) C-Test English weighted .431* C-Test German weighted -.467* Film retelling short silent pauses .502* long silent pauses .436* code-switches .543** * p < 0.05, ** p < 0.01 As can be seen in the table above, LOR has quite a large impact on the attriters’ results as two of the more formal tests, and three of the features measured in the (relatively) free spoken data show a correlation with this variable. These figures can be taken to mean that LOR does not appear to have a uniform effect on the results as a longer LOR correlates with a higher weighted score for the English C-Test, but a lower one for the German C-Test. If the figure for LOR is high, the effect is also negative on the number of pauses and code-switches produced during the Film retelling as these are then increased.
3.4.13.11. ‘L2 use’ in the attrition group The effect of the predictor variable ‘L2 use’ in the attrition group was assessed using Spearman’s rho correlation procedure. The results are reported in the table below.

176
Table 64: The impact of ‘L2 use’ on the test scores in the attrition group (N=25) Attrition group
(N=25) C-Test German .584** Picture description hedges .490* * p < 0.05, ** p < 0.01 As can be seen, this variable correlates positively with only two of the results. A high degree of such contact therefore is shown to be related to a higher score in the German C-Test, but also to more hedges in the Picture description task.
3.4.13.12. ‘L2 proficiency’ in the attrition group This variable was correlated with the test scores of the attrition group, again using Spearman’s rho, and the significant results are given below. Table 65: The impact of ‘L2 proficiency’ on the test scores (N=25) Attrition group
(N=25) C-Test German .631** C-Test German weighted -.487* Film retelling hedges .550** Picture description reformulations -.433* * p < 0.05, ** p < 0.01 Just like ‘L2 use’, this variable has also impacted on the German C-Test and the time taken to find one correct answer (i.e. the weighted score) in that higher (self-reported) proficiency co-occurs with better results. It also shows a positive correlation with the hedges in the Film retelling, so high ‘L2 proficiency’ can be interpreted as having a negative effect on the English here, but rather surprisingly it shows an inverse relationship with the number of reformulations produced in the Picture description, meaning that increased ‘L2 proficiency’ correlates with fewer such reformulations.
3.4.13.13. Summary of the predictor variables and test scores In this section, there are two further tables summarising the information from the individual tables in the sections above, where the impact of each of the predictor variables on the outcome variables was assessed separately. Table 66: Key for abbreviations used in the tables below67
Predictor variables
Outcome variables Age = age (at testing) Edu = level of education L2s = number of L2s spoken
F 1 = FiCA 1 F 2 = FiCA 2 F1+2 = FiCA 1 and 2 combined
67 Many of these were already employed in table 41.

177
NS = native speaker rating L1 p = L1 proficiency L1 u = L1 use L1 a = L1 attitude Age emi = age at emigration LOR = length of residence L2 u = L2 use L2 p = L2 proficiency
C-T Eng = C-Test English C-T E w = C-Test English weighted C-T Ger = C-Test German C-T G w = C-Test German weighted Scr = ‘Scrabble’ test S w = ‘Scrabble’ weighted t s = total score F co = ‘Film retelling’ corrections F # = ‘Film retelling’ short silent pauses F ## = ‘Film retelling’ long silent pauses F fp = ‘Film retelling’ filled pauses F hd = ‘Film retelling’ hedges F cs = ‘Film retelling’ code-switches P D = ‘Picture description’ lexical diversity P rep = ‘Picture description’ repetitions P co = ‘Picture description’ corrections P ref = ‘Picture description’ reformulations P # = ‘Picture description’ short silent pauses P ## = ‘Picture description’ long silent pauses P fp = ‘Picture description’ filled pauses P hd = ‘Picture description’ hedges P cs = ‘Picture description’ code-switches
In the first table below, the impact of all ten predictor variables on the test outcomes of the attrition group is reported (excluding ‘age (at testing)’ and ‘level of education’ which showed no such relationship). Table 67: Overview of correlations between ten predictor variables and test scores in the attrition group (N=25) Sex L2s NS L1 p L1 u L1 a Age
emi LOR L2 u L2 p
F 1 n.s. n.s. n.s. 402* n.s. .439* n.s. n.s. n.s. n.s. F 2 -.615** 451* n.s. n.s. n.s. .440* n.s. n.s. n.s. n.s. C-T E w
n.s.
n.s.
-.432*
n.s.
n.s.
-.451*
n.s.
.431*
n.s.
n.s.
C-T Ger
n.s.
.510*
-.422*
n.s.
-.417*
n.s.
-.495*
n.s.
.584**
.631**
C-T G w
n.s.
-.575**
n.s.
n.s.
n.s.
n.s.
.485*
-.467*
n.s.
-.487*
Scr n.s. .603** n.s. n.s. n.s. n.s. n.s. n.s. n.s. n.s. S w n.s. .494* n.s. n.s. n.s. n.s. n.s. n.s. n.s. n.s. t s n.s. .468* n.s. n.s. n.s. n.s. n.s. n.s. n.s. n.s. F # n.s. n.s. n.s. n.s. n.s. n.s. n.s. .502* n.s. n.s. F ## n.s. n.s. n.s. n.s. n.s. n.s. n.s. .436* n.s. n.s. F hd n.s. n.s. n.s. -.449* n.s. n.s. n.s. n.s. n.s. .550** F cs n.s. n.s. n.s. -.414* n.s. -.559** n.s. .543** n.s. n.s. P ref n.s. n.s. n.s. n.s. n.s. n.s. .488* n.s. n.s. -.433* P ## n.s. n.s. n.s. n.s. n.s. -.471* n.s. n.s. n.s. n.s. P fp .500* n.s. n.s. n.s. n.s. n.s. n.s. n.s. n.s. n.s.

178
P hd n.s. n.s. n.s. n.s. n.s. n.s. n.s. n.s. .490* n.s. P cs n.s. n.s. n.s. n.s. n.s. -.409* n.s. n.s. n.s. n.s.
* p < 0.05, ** p < 0.01 In the attrition group, the predictor variables ‘number of L2s spoken’ and ‘L1
attitude’ appear to have most impact on the test results, each showing medium-sized or stronger correlations with six of the test outcomes. Both have a consistent influence in that a higher ‘number of L2s spoken’ and a more positive ‘L1 attitude’ correlate with higher scores in some of the more formal tests, and with fewer hesitation features in the naturalistic, spoken data.
LOR is also quite influential as it shows medium correlations with five of the results, including both formal and spoken tasks. A longer LOR has a positive impact on the German C-Test, but is more negative for the English one. Its effect on three of the features measured in the Film retelling is also negative, correlating with more instances of silent pauses, and code-switching.
‘(Self-reported) L2 proficiency’ impacts on four of the dependent variables whereby increased proficiency has an unsurprising positive effect on the results of the German C-Test, and also correlates with more hedges in the Film retelling task. Strangely, higher ‘L2 proficiency’ also shows a negative correlation with the number of reformulations produced during the Picture description.
‘(Self-reported) L1 proficiency’ and ‘age at emigration’ each only show significant correlations with three of the outcome variables, whereby higher ‘L1 proficiency’ has a consistently positive effect, correlating with a higher FiCA 1 score, and fewer instances of hedging and code-switching in the Film retelling. A more advanced ‘age at emigration’ correlates with a weaker performance in the German C-Test, and also with more reformulations in the Picture description.
‘Sex’, ‘native speaker rating’ and ‘L2 use’ all have little impact on the test results, only correlating significantly with two of the outcome variables each. ‘Sex’ has a positive effect for the women showing a strong correlation between being female and having a high score in FiCA 2, but also a medium-sized correlation between being male and producing more filled pauses in the Picture description. The ‘native speaker rating’ only affects the two C-Tests, whereby a higher rating co-occurs with a lower score for the German C-Test and a lower weighted score for the English one. Increased ‘L2 use’, finally, has quite a strong impact on the German C-Test, correlating with higher scores, but also with an increase in the number of hedges in the Picture description.
‘L1 use’ is the predictor variable with least impact on the outcomes, only correlating with one of the results, namely the German C-Test, where an increase in ‘L1 use’ correlates with a lower score.
Summarising these findings we can say that the attriter who is most likely to perform well in the English parts of the test battery will be female, speak many L2s, have a positive L1 attitude, a high native speaker rating, and high self-reported L1 proficiency, but also to have emigrated young, and only have a short LOR. In addition, not using much L2 is advantageous, but the effect of L2 proficiency depends on the precise test or feature under observation. Age (at testing), L1 use and level of education do not seem to have any impact on an individual’s performance here. The attriter likely to perform least well will then be the opposite with regard to each of these variables.

179
Looking at these same figures in the table above, but now from the point of view of the outcome variables we can state the following: Only two of the variables seem to affect FiCA 1, namely higher ‘L1 proficiency’
and a more positive ‘L1 attitude’ both of which correlate with better scores. Three of the predictors show significant correlations with FiCA 2, indicating that
being female, having a higher ‘number of L2s’ and a more positive ‘L1 attitude’ co-occur with a higher score.
None of the variables show correlations with the C-Test, but three do with the weighted score. A lower score (indicating less time required to find a correct answer) correlates significantly with a higher ‘native speaker rating’, a more positive ‘L1 attitude’ and a shorter LOR.
The German C-Test reflects a quite dramatic impact by the predictor variables, as six of them appear to affect the results, more than for any of the other outcome variables. A higher score on this C-Test correlates significantly with a higher ‘number of L2s’, a lower ‘native speaker rating’, less ‘L1 use’, a lower ‘age at emigration’, as well as more ‘L2 use’ and ‘L2 proficiency’.
The weighted score on the German C-Test is influenced by four of the predictors in that a lower score correlates significantly with a higher ‘number of L2s’, a low ‘age at emigration’, a longer LOR and higher ‘L2 proficiency’.
For the ‘Scrabble’ test, both the initial and weighted scores only show one correlation with the predictor variables, namely with the ‘number of L2s’ whereby a higher number correlates with a higher score in the test.
In the Film retelling task, the number of short and long silent pauses seems to be affected by the predictor LOR where a longer LOR correlates with more pauses.
The number of hedges produced during the Film retelling correlates with two of the predictors. Higher ‘L1 proficiency’ and lower ‘L2 proficiency’ both have a positive effect on this outcome variable, co-occurring with fewer instances of hedging.
The number of code-switches produced during the Film retelling is seemingly affected by three of the predictor variables, namely ‘L1 proficiency’ and ‘L1 attitude’, where a higher score correlates with fewer code-switches, but also by LOR, where a shorter period of residence also co-occurs with less switching.
Two of the predictors show correlations with the number of reformulations produced in the Picture description. A younger ‘age at emigration’ and a higher ‘L2 proficiency’ both correlate significantly with fewer instances of reformulation.
The short silent pauses do not show any correlations with the predictors in the Picture description, but the long ones do, as a positive ‘L1 attitude’ correlates significantly with fewer such pauses.
The filled pauses in this task correlate with ‘sex’ in that the men produce significantly more such pauses than do the women.
Again only one of the predictors appears to correlate with the number of hedges produced in the Picture description, and that is ‘L2 use’ whereby more use correlates with more hedges.
The final outcome variable from the table above is code-switching in the Picture description. The only predictor variable to affect this is ‘L1 attitude’ in that a more positive attitude correlates with less switching.
The following table now provides an overview of the correlations between eight of the predictor variables and the outcomes in the L1 control group, again summarising the information already given for the individual predictors further above. Those four

180
variables which do not apply to this group (i.e. ‘age at emigration’, LOR, ‘L2 use’, and ‘L2 proficiency’) have been omitted. Table 68: Overview of correlations between predictor variables and test scores in the L1 control group (N=20) Age Sex Edu L2s NS L1 p L1 u L1 a F 2 n.s. n.s. n.s. n.s. n.s. -.478* n.s. n.s. C-T Eng
n.s.
n.s.
.612**
n.s.
n.s.
n.s.
n.s.
n.s.
C-T E w
n.s.
n.s.
-.446*
n.s.
n.s.
n.s.
n.s.
n.s.
t s n.s. n.s. .473* n.s. n.s. n.s. n.s. n.s. F co n.s. n.s. .464* n.s. n.s. n.s. n.s. n.s. P D n.s. n.s. n.s. -.528* n.s. n.s. n.s. n.s. P rep n.s. n.s. n.s. .651** n.s. n.s. n.s. n.s. P co n.s. n.s. n.s. n.s. n.s. n.s. -.539* -.504* P ref -.523* n.s. .499* n.s. n.s. n.s. n.s. n.s. P fp n.s. .542* n.s. n.s. n.s. n.s. n.s. n.s. P hd -.649** n.s. n.s. n.s. n.s. -.580* n.s. n.s. * p < 0.05, ** p < 0.01 The impact of the predictor variables on the test results within the L1 control group is not at all comparable to that reported above for the attrition group. For the attriters, ‘age (at testing)’ and ‘level of education’ play no role in helping explain the within-group variation, but both co-occur with outcome variables in the L1 controls. Conversely, here ‘native speaker rating’ is not relevant, but shows correlations with two of the outcomes in the attrition group. Even where the same predictors influence test results in both groups, they generally do not affect the same test or measured feature. ‘Level of education’ is the most influential predictor variable for this group,
correlating with four of the outcomes. A higher ‘level of education’ co-occurs with better performance in the English C-Test, but also more corrections in the Film retelling and a higher number of reformulations in the Picture description.
In this group, ‘age (at testing)’, the ‘number of L2s’ and ‘L1 proficiency’ each affect two of the outcome variables. ‘Age (at testing)’ shows an inverse relationship with the number of reformulations and hedges produced in the Picture description, indicating that greater age correlates with fewer instances of these two features. A high ‘number of L2s’, which had a consistently positive effect on results in the attrition group, has a negative effect here, correlating with a lower D value and more repetitions in the Picture description task. ‘L1 proficiency’, finally, has a rather mixed effect on the data, where high proficiency correlates with a lower score for FiCA 2, but with fewer hedges in the Picture description. (Higher ‘L1 proficiency’ in the attrition group, in contrast, had a positive impact on the FiCA 1 score, and correlated with fewer hedges in the Film retelling.)
‘Sex’, ‘L1 use’ and ‘L1 attitude’ all only show one significant correlation with the L1 controls’ outcome variables. ‘Sex’ is the only predictor variable with a similar effect in both native speaker groups as being male correlates significantly with more filled pauses in the Picture descriptions of both. ‘L1 use’ and ‘L1 attitude’

181
both show an inverse relationship with the number of corrections produced during the Picture description of the L1 controls, which can be taken to mean that more use and a more positive attitude correlate with fewer instances of this feature.
The individual most likely to perform well in the test battery from this group is again female, but does not know many L2s, and is older. She will also use a lot of L1 and have a positive L1 attitude. The level of education and self-reported L1 proficiency have a less predictable effect, depending on the type of test being analysed. The weakest members of this group are then young men who speak many L2s, do not use a lot of L1 and have a less positive attitude towards the L1. Many of the predictor variables affect results in different ways in the two native speaker groups. The only similarities between the two are that being female and having a positive L1 attitude correlate with better performance in the English tests. If we now look from the other direction to see how the test outcomes are affected by the predictors we can again say that there is very little overlap between the two groups. Those outcomes that show correlations with at least one of the predictors in one of the two groups are rarely affected in the other, and only in one case does the same predictor (i.e. ‘sex’) affect an outcome (i.e. the filled pauses in the Picture description) in both groups in the same way. FiCA 2 is only affected by one of the predictors, namely ‘L1 proficiency’ whereby,
inexplicably, higher proficiency seems to correlate with a lower score. The English C-Test (including the weighted score) is positively affected by a high
‘level of education’. The number of corrections produced during the Film retelling also benefits from a
higher ‘level of education’. Lexical diversity (D) and the number of repetitions in the Picture description are
both negatively affected by a high ‘number of L2s’. The number of corrections produced during this same task shows an inverse
relationship to the variables ‘L1 use’ and ‘L1 proficiency’, indicating that a high value here correlates with fewer corrections.
The number of reformulations in the Picture description benefits from a more advanced age and, surprisingly, a lower ‘level of education’.
The number of filled pauses, as already mentioned above, only correlates significantly with ‘sex’, in that women produce fewer such pauses than men.
Hedges, finally, correlate with two of the predictor variables, namely ‘age (at testing’ and ‘L1 proficiency’. Greater age and more proficiency both have a positive effect as they correlate with fewer hedges.
3.4.13.14. Correlations between predictor variables and silent pauses in the Film retelling
In 3.4.9. above only two of the tests from the entire test battery were shown to differ significantly between the attrition group and the L1 control group, namely the short and long silent pauses in the Film retelling. The same features in the Picture description do not show a significant between-group difference: short silent pauses (t

182
= .761, df = 39, p = .451), long silent pauses (U = 158, p = .163), neither do any of the other features measured in the two naturalistic, spoken tasks. The following table shows correlations (computed using Spearman’s rho) between these two features and all twelve predictor variables for the attrition group. Table 69: Overview of correlations between predictor variables and Film retelling silent pauses in the attrition group (N=25)
Predictors Film retelling short silent pauses
Film retelling long silent pauses
age (at testing) rs = .274, p = 0.186 rs = .270, p = 0.192 sex rs = .059, p = 0.778 rs = -.030, p = 0.886 number of L2s rs = -.101, p = 0.629 rs = -.189, p = 0.366 level of education rs = -.069, p = 0.742 rs = .029, p = 0.889 native speaker rating rs = -.260, p = 0.209 rs = -.241, p = 0.246 L1 proficiency rs = -.190, p = 0.363 rs = -.108, p = 0.607 L1 use rs = -.083, p = 0.693 rs = -.153, p = 0.466 L1 attitude rs = -.211, p = 0.312 rs = -.114, p = 0.586 age at emigration rs = -.271, p = 0.190 rs = -.156, p = 0.457 LOR rs = .502, p = 0.010 rs = .436, p = 0.030 L2 use rs = .142, p = 0.499 rs = .088, p = 0.675 L2 proficiency rs = .154 p = 0.464 rs = .155, p = 0.458 As can be seen the only correlation which reaches significance (p < 0.05) is the predictor variable LOR, which shows a medium-sized correlation with each of the two outcome variables . None of the others are even close to this significance level. To try and gain further insight about possible variables which may be affecting this outcome, and hopefully magnify any within-group differences, those seven members of the attrition group with least silent pauses in this task (‘subgroup 1’ in the table below), and those seven with most (‘subgroup 2’) were identified and compared. The results are reported in the two tables below. Table 70: Results for Film retelling silent pauses in two subgroups of the attrition group (N=14) Subgroup 1
(N=7) Subgroup 2
(N=7) mean median SD mean median SD F # 3.91 3.92 1.18 11.05 11.57 2.42 F ## .03 0 .06 .50 .33 .46 In the table above, # is again the symbol for short silent pauses, and ## stands for the longer silent pauses. A Mann-Whitney U test was carried out on both features, yielding highly significant between-group differences for the short silent pauses (U = 0, p = 0.001) and the long silent pauses (U = 0.5, p = 0.001) as expected. The following table now aims to see if any of the twelve predictors can help explain the observed differences between these two subgroups.

183
Table 71: Twelve predictor variables in two subgroups of the attrition group (N=14) Subgroup 1
(N=7) Subgroup 2
(N=7) mean median SD mean median SD age (at testing)
48.86
51
10.19
55.71
57
5.19
sex .14 0 .38 .29 0 .49 number of L2s
3.43
3
1.51
3.14
2
2.12
level of education
.71
1
.49
.71
1
.49
native speaker rating
24.71
24
5.12
22.43
18
8.96
L1 proficiency
.70
.83
.26
.65
.58
.25
L1 use .46 .39 .24 .42 .32 .32 L1 attitude 5.57 5 .79 5.29 5 1.11 age at emigration
28.71
29
8.10
25.57
27
2.88
LOR 20.14 24 9.15 30.14 31 6.23 L2 use 16.29 18 9.71 19.29 22 9.03 L2 proficiency
8.14
8
5.43
10.29
12
5.82
Mann-Whitney U statistical procedures were performed on each of these group variables, again yielding only one significant between-group difference, and again for LOR: U = 4.5, p = 0.007, where the subgroup 1, i.e. the group with fewer pauses had the shorter LOR. All other variables were not significant between the two subgroups. Looking at this table, though, we can at least identify some trends, or those variables which seem to co-occur with more or fewer pauses, and summarise the findings as follows: Those individuals with fewer pauses tend to be younger females, who speak more L2s, have a higher native speaker rating, higher self-reported ‘L1 proficiency’, more ‘L1 use’, a more positive ‘L1 attitude’, were older at emigration, and have a shorter LOR. In addition, they claim to use less L2 and have lower proficiency in the L2. It is interesting that the majority of these variables were already identified above (in 3.4.13.13.) where the characteristics of those members of the complete attrition group were listed who were most successful in the entire test battery.

184
3.5. Discussion In this final chapter an attempt will be made to summarise the findings of this study and provide answers to the two research questions posed above (in 3.2.4.), and paraphrased below for easier reference: 1) Are any of the predictor variables, individually, or in combination, able to predict L1 attrition as measured through the various scores achieved in the language tests (and compared to the baseline provided by the L1 control group)? 2) Is the native speaker status (as measured by the native speaker rating) of the individual participants able to predict these scores? Does the label ‘native speaker’ have any predictive power with regard to language proficiency? In the next section, we will start by considering the first of these questions and the whole topic of L1 attrition in the attrition group. In 3.5.2. later the discussion will move on to the second question and the concept of the ‘native speaker’.
3.5.1. Discussion of L1 attrition
The working definition of L1 attrition given in 3.1. above is: (adult non-pathological) L1 attrition is language behaviour exhibited by the attrition group (i.e. the results and scores from the various tests carried out) which deviates significantly from that of the L1 control group, i.e. is worse. Of all the outcomes of the more formal tests as well as the features measured in the naturalistic, spoken data, this study has only managed to uncover two such significant differences between the attriters and L1 controls, namely the number of short and long silent pauses produced during the Film retelling. According to the definition this will therefore be considered evidence of L1 attrition in the attrition group. A number of the hypotheses address the question of whether a particular predictor variable has been shown to affect the degree of the L1 attrition or not. As only the number of short and long silent pauses in the Film retelling is being treated as L1 attrition here, only those variables which impact on these particular features will be considered to have affected L1 attrition. All other predictors may impact on the attrition group’s results in some other way, so they may help to explain any within-group variance, but they are by definition deemed unable to contribute to an explanation of the phenomenon of L1 attrition if they do not impact on these silent pauses. Discussion of the hypotheses One by one the following thirteen hypotheses are repeated from 3.2.5. and now discussed on the basis of the test results reported in 3.4. above. In each case, the relevant findings will be briefly summarised, and if the results support the hypothesis it will be considered accepted. If, on the other hand, the test outcomes do not confirm the hypothesis, it will be rejected in favour of the null hypothesis, which generally predicts no difference between the attrition group and L1 controls.

185
HYPOTHESIS 1) The attrition group differs significantly from the L1 control group in that lexical diversity is decreased and significantly more basic level, non-specific lexemes (as a percentage of the total number of lexemes produced in the FiCAs) are used. FINDINGS Lexical diversity was compared in the two tasks where naturalistic, spoken data was produced (i.e. the Film retelling and the Picture description), and measured using CLAN to calculate D (lexical diversity). For both tasks individually, and the two combined, the attrition group in fact have a higher D value than the L1 control group, indicating that the language used by the attriters exhibits more lexical diversity, rather than less as hypothesized, although these between-group differences are not significant. The two FiCAs formed the source of the data for a semantic (taxonomic) analysis of the lexemes produced by all three groups. In FiCA 1 the members of the attrition group produced more basic level lexemes on average than those of the L1 control group, but in FiCA 2 they produced fewer. In both cases, however, these basic level lexemes form a smaller percentage of the total number of lexemes produced in the attrition group, than in the L1 control group, and none of these differences were large enough to reach significance. CONCLUSION Hypothesis 1) has not been confirmed by the data, and therefore has to be rejected in favour of the null hypothesis that there is no difference between the two groups with regard to the features named. In fact the findings indicate that lexical diversity is increased in the attrition group, in direct contradiction to the hypothesis. HYPOTHESIS 2) The speech of the attrition group contains significantly more silent and filled pauses and retracings than that of the L1 control group. FINDINGS To compare the attriters’ speech with that of the L1 controls, the following relevant features were coded in the transcripts produced during the Film retelling and Picture description tasks, and then counted using CLAN: silent pauses, filled pauses, repetitions, corrections, and reformulations (where the latter three were subsumed under the heading ‘retracings’). In the Film retelling task, the members of the attrition group produced more silent pauses, filled pauses, repetitions, and corrections than the L1 control group, but not more reformulations. The differences between the two groups were significant for both short and long silent pauses, but not for the other features. In the Picture description, the attriters produced more repetitions, corrections and short silent pauses, but the L1 controls produced more reformulations and filled pauses, without any of these differences achieving significance. CONCLUSION The speech of the attrition group does contain significantly more silent pauses, but only in one of the two tasks. It does not contain significantly more filled pauses or retracings in either of the tasks. The data collected, therefore, offers some evidence in favour of this hypothesis, but not enough to consider it confirmed.68
68 On the basis of these findings, as well as the discussion in Hilton (2007) and Schmid (2009), it would probably be advisable to treat these features as separate phenomena in future with individual predictions.

186
HYPOTHESIS 3) It is possible that LOR will affect the degree of L1 attrition but how is not clear. FINDINGS LOR impacts on five of the attriters’ outcome variables (see 3.4.14.10.), showing medium-sized significant correlations with two of the more formal tests, and three of the features measured in the Film retelling: the short and long silent pauses, as well as the number of code-switches. The effect of a long period of residence in Germany is consistently negative for the L1 English, but positive for the L2 German. CONCLUSION LOR has been shown to affect the performance of the attrition group, and in particular to influence the number of short and long silent pauses in the Film retelling, where we have a significant between-group effect between the attriters and L1 controls, allowing us to call the difference L1 attrition. As LOR correlates with these pauses, it can be concluded that the hypothesis has been confirmed. The direction of influence is such that a longer period of residence has a negative effect on the L1, increasing the degree of L1 attrition. HYPOTHESIS 4) It is possible that ‘sex’ will affect the degree of L1 attrition but it is not clear how. FINDINGS Within the attrition group, there are only two significant correlations with this variable (see 3.4.14.2.): a medium-sized one with the filled pauses in the Picture description, and a stronger one in the FiCA 2. In both cases, the women seem to profit as this variable correlates with higher scores in the FiCA 2 and fewer filled pauses. CONCLUSION ‘Sex’ again seems to partly affect the language produced by the attriters, in that the women are at an advantage compared to their male counterparts in some of the tasks. As neither of the within-group differences found are also significant between the attriters and L1 controls, however, we cannot talk of L1 attrition here, and therefore the hypothesis has to be rejected in favour of the null hypothesis that ‘sex’ does not affect the degree of L1 attrition. HYPOTHESIS 5) It is possible that age (at testing) will affect the degree of L1 attrition but it is not clear how. FINDINGS Within the attrition group, this variable did not impact on any of the test outcomes (see 3.4.14.1.). There was an effect of ‘age (at testing)’ on the entire sample (N=64) for the short silent pauses in the Film retelling, but this was not particularly strong, and could not be detected in any of the individual groups. CONCLUSION ‘Age (at testing)’ could not be shown to impact significantly in any way on the test scores of the attrition group, and the hypothesis therefore has to be rejected in favour of the null hypothesis. HYPOTHESIS 6) It is possible that age at emigration will affect the degree of L1 attrition within the attrition group, but it is not clear how.

187
FINDINGS This variable did impact on the results of the attrition group, but not in a dramatic way (see 3.4.14.9.). ‘Age at emigration’ shows medium-sized correlations with three of the outcomes, where a more advanced age correlates with a weaker performance in the German C-Test (including the weighted score), but also with an increase in the number of reformulations produced during the Picture description. As, however, none of these tests show a between-group difference to the L1 controls, the within-group differences cannot be considered evidence for L1 attrition. CONCLUSION No evidence has been found to support the hypothesis that ‘age at emigration’ has an effect on the degree of L1 attrition, and therefore it has to be rejected. HYPOTHESIS 7) The amount of L1 use correlates significantly with the degree of L1 attrition, i.e. less use will lead to more attrition and more use to less attrition. FINDINGS This variable shows only one medium-sized significant correlation with the test results of the attrition group (see 3.4.14.7.), as more use correlates with a lower score in the German C-Test, which is irrelevant for our discussion of L1 attrition of English. If we now look at the whole group of native speakers (in other words the 45 attriters and L1 controls together) we see a significant correlation between the occurrence of short and long silent pauses in the Film retelling and the amount of L1 use, but the correlation does not reach significance within the attrition group alone . CONCLUSION Although ‘L1 use’ does not appear to impact significantly on the number of short silent pauses produced within the attrition group during the Film retelling task, it does have such an effect on the larger group of all 45 native speakers. This, however, is not sufficient evidence to consider the hypothesis confirmed, and therefore it has to be rejected. HYPOTHESIS 8) The amount of L2 use correlates significantly with the degree of L1 attrition in the attrition group, i.e. more L2 use will lead to more L1 attrition and less L2 use to less attrition. FINDINGS This variable has been shown to have impacted on two of the test scores in the attrition group (see 3.4.14.11.), correlating quite strongly with the German C-Test, and less so with the number of hedges produced in the Picture description task. Again, though, this latter outcome does not show a significant difference between the attriters and the L1 controls and therefore cannot be considered L1 attrition. CONCLUSION The amount of ‘L2 use’ does not correlate significantly with the degree of L1 attrition within the attrition group and must, therefore, be rejected. The scant evidence found does, nevertheless, confirm that higher ‘L2 use’ correlates with lower L1 proficiency as measured in the test battery. HYPOTHESIS 9) The degree of (self-reported) L1 proficiency correlates significantly with the degree of L1 attrition, in that higher proficiency will lead to less L1 attrition, and lower proficiency to more L1 attrition.

188
FINDINGS ‘L1 proficiency’ as a predictor variable correlates significantly with two of the features measured in the Film retelling (see 3.4.14.6.), where increased proficiency has a positive effect, corresponding to fewer instances of hedges and code-switching. It also shows a medium-sized correlation with the FiCA 1, in that higher proficiency co-occurs with a higher score. FiCA 1 and the number of hedges, however, do not differ significantly between the attriters and L1 controls (and code-switching only occurs in the attrition group), and can, therefore, not be considered evidence of L1 attrition. This variable also shows a small correlation with the short silent pauses in the Film retelling if we look at the combined performance of both native speaker groups (N=45). CONCLUSION ‘L1 proficiency’ shows a significant correlation with the short silent pauses in the Film retelling, but again only in the larger group (consisting of both native speaker groups). As it does not correlate significantly with this feature in the attrition group, it cannot be said to affect the degree of L1 attrition, and therefore the hypothesis has to be rejected. Nevertheless, higher ‘(self-reported) L1 proficiency’ does appear to correlate with better performance in the tests. HYPOTHESIS 10) The level of education correlates significantly with the degree of L1 attrition, i.e. higher education in the form of a university degree correlates with less attrition and lower education with more attrition. FINDINGS Unlike in the L1 control group, where this variable correlates with a number of the test results, no such effects were discovered in the attrition group (see 3.4.14.4.). CONCLUSION The ‘level of education’ does not seem to impact on any of the attriters’ test outcomes, and therefore cannot correlate significantly with the degree of L1 attrition, forcing us to reject this hypothesis. HYPOTHESIS 11) There is a significant correlation between the speaker’s attitude to his/her L1 and its speakers and the degree of L1 attrition within the attrition group, i.e. a positive L1 attitude will lead to less attrition and a negative one to more attrition. FINDINGS ‘L1 attitude’ appears to affect six of the test outcomes in the attrition group (see 3.4.14.8.), showing a strong correlation with the number of code-switches recorded in the Film retelling, and medium-sized correlations with the two FiCAs, the weighted score in the English C-Test, as well as the number of long silent pauses and code-switches in the Picture description task. The effect is uniformly positive, correlating with better results and fewer hesitation features. Within the attrition group, this variable does not correlate significantly with the short silent pauses in the Film retelling, however we do find a medium-sized correlation with this feature when we look at the results of the two native speaker groups combined. CONCLUSION The predictor variable ‘L1 attitude’ shows a significant correlation with the pooled results of the two native speaker groups for the short silent pauses in the Film retelling. This is, however, considered insufficient evidence for accepting the hypothesis, and so we are again forced to reject it. Despite this fact, the basic

189
assumption of the hypothesis is confirmed in that a more positive ‘L1 attitude’ correlates with higher L1 proficiency as measured by the various test items here. HYPOTHESIS 12) There is a significant correlation between the number of languages a speaker is able to use and the degree of L1 attrition within the attrition group, i.e. the more languages spoken, the worse L1 attrition will be. FINDINGS This predictor variable also correlates significantly with six of the outcomes in the attrition group (see 3.4.14.3.), whereby all show at least a medium-sized relationship, i.e. a higher number of L2s correlates with higher scores in FiCA 2, the ‘Scrabble’ test, the German C-Test, and overall. As was the case for the variables ‘age (at testing)’, ‘L1 proficiency’, ‘L1 use’, and ‘L1 attitude’, this one also does not seem to affect the frequency of short silent pauses produced during the Film retelling task by the members of the attrition group alone, but it does show a small positive correlation with this feature when we look at the larger group (i.e. attriters and L1 controls together). CONCLUSION Again the variable could not be shown to affect the degree of L1 attrition (i.e. the number of short and long silent pauses in the Film retelling) within the attrition group, and the hypothesis can therefore not be confirmed. The findings do, however, suggest that if this variable were to have a significant influence on the outcomes it would be contrary to that predicted as a high number of languages appears to correlate with higher language proficiency (in the attrition group), and thereby presumably with less L1 attrition rather than more as hypothesised. HYPOTHESIS 13) (Self-reported) L2 proficiency has a significant effect on the degree of L1 attrition in the attrition group, i.e. high L2 proficiency is expected to correlate with more L1 attrition and low L2 proficiency with less L2 attrition. FINDINGS The predictor ‘L2 proficiency’ has been shown to have quite a significant impact on the scores for the German C-Test within the attrition group, but a limited effect on the L1 English (see 3.4.14.12.), only correlating significantly with two features measured in the naturalistic, spoken data: the number of hedges in the Film retelling, as well as the reformulations in the Picture description. Neither of these features show significant differences between the attriters and L1 controls, however, and are therefore not considered L1 attrition. CONCLUSION This variable does not seem to have a significant effect on the degree of L1 attrition in the attrition group and therefore the hypothesis is rejected. In addition, it is not at all clear whether the basic assumption of the hypothesis can be upheld, as the findings of this study suggest that this variable has an unpredictable effect on the outcomes. Summary of the hypotheses All of these thirteen hypotheses excepting two have had to be rejected. Number 3) was confirmed, predicting that LOR would have an effect on the degree of L1 attrition found within the attrition group, and number 2) was at least partly confirmed, which hypothesised that the attriters would produce more pauses and retracings than the

190
L1 controls in the naturalistic, spoken data. It is quite remarkable that none of the other predictors were found to impact significantly on the silent pauses (i.e. on L1 attrition), in particular given the fact that contact / use, education and attitudes / motivation were identified above (in 2.1.2.2.) as those variables which have seemed to have most effect on the results of previous studies. Some of these however (i.e. ‘L1 use’, ‘L1 proficiency’, ‘L1 attitude’, ‘number of L2s’, and ‘age (at testing)’) did show significant correlations with the larger group, suggesting that the predictor is having some influence on the outcomes, albeit not strongly enough to reach significance within the group of 25 attriters. In this study, education does not appear to have any impact on the attriters’ results (although it is quite important for the L1 control group). Contact / use, which was considered possibly the most influential variable of the three above, was divided into two variables here, namely ‘L1 use’ and ‘L2 use’. Both mainly show correlations with the German C-Test, so L1 contact / use also cannot be said to affect the English of the attrition group (although L2 contact / use has impacted on one of the spoken features measured). The answer to the first research question is then that LOR is the only predictor variable which was found to correlate with the degree of L1 attrition as measured through the various scores achieved in the language tests (and compared to the baseline provided by the L1 control group), and therefore the only variable able to help predict L1 attrition. The influence of LOR is such that a shorter period of residence (in Germany) co-occurs with less L1 attrition. Looking back at those studies discussed in 2.1.2.2. above, it was stated that only one had found LOR to be a useful predictor (de Bot, Gommans & Rossing, 1991) and only when “there are few contacts with the first language” (ibid.:94). In this study, there is also a medium-sized negative correlation between LOR and ‘L1 use’ (rs = -.420, p < 0.05) indicating that a shorter LOR correlates with more L1 use (and a longer LOR with less), but ‘L1 use’ as such does not appear to impact significantly in any way on the degree of L1 attrition. This research project would, therefore, seem to be the first with which I am familiar to have discovered a correlation between LOR and the outcomes largely independent of L1 contact / use.
3.5.2. Discussion of the ‘native speaker’
In this study, data was collected from two groups defined as ‘native speakers’ (i.e. the attriters and L1 controls) and one non-native group (i.e. the German controls). In this section, we will address the second research question to see whether such distinctions have any bearing on language proficiency as measured in the test battery. Discussion of the hypotheses First the four hypotheses are repeated from 3.2.5. above and considered individually, findings are commented, and then each is accepted or rejected as deemed appropriate. HYPOTHESIS 14) There is a significant difference in the test scores between the three groups of participants, i.e. the L1 control group and the attrition group (as native speakers) perform better than the German control group (as non-native speakers).

191
FINDINGS Looking at the outcomes of the various tests (see 3.4.9.), we can see significant differences between both the German controls and the attriters, as well as between the German controls and the L1 controls for all four of the more formal English tests administered, including the total score, but except for FiCA 1. In all of these cases, it is true that the native speakers achieve better results than the members of the German control group. CONCLUSION The results reveal that there are indeed significant differences between the two native speaker groups, on the one hand, and the German control group, on the other, for nearly all of the tests administered. The native speakers outperform the German controls and therefore this hypothesis is considered largely confirmed. HYPOTHESIS 15) The individual participants in the L1 control group and attrition group (as native speakers) perform better than the individuals in the German control group. FINDINGS Looking at the results of the 64 individual participants (i.e. their total score for the four more formal English tests) in 3.4.12. above, we can see that the seven participants with the highest overall scores all belong to either the attrition or the L1 control group. In eighth position, however, we have the first member of the German control group, the next two being in 21st and 29th position. At the bottom end of the table, where we find those participants with the lowest scores, we have most of the German controls, but also some members from the two native speaker groups, i.e. attriters and L1 controls. This hypothesis would predict that the German controls are all to be found at the bottom of the table, and the L1 controls and attriters all at the top, but this is not the case. CONCLUSION There is certainly a tendency for the individual native speakers to outperform their non-native counterparts, but there are many exceptions where we find native speakers near the lower end of the list, and non-natives near the top. Therefore, this hypothesis has to be rejected. HYPOTHESIS 16) There is a significant difference in the test scores between the more prototypical and the more peripheral native speakers, i.e. the more prototypical native speakers perform better than the less prototypical ones. FINDINGS Again looking at the tables in 3.4.12. above, we can see that within the group of L1 controls the native speaker rating (which distinguishes between more and less prototypical native speakers) does not correlate with any of the test results. Within the attrition group we only have two medium-sized correlations: the first indicates that a high rating correlates with a short time to find one correct answer (i.e. the weighted score) in the English C-Test, and the second that a high rating correlates with a low score in the German C-Test. If we look at the test outcomes of both groups combined, we find two new correlations, where a high rating correlates with fewer short and long silent pauses in the Film retelling.
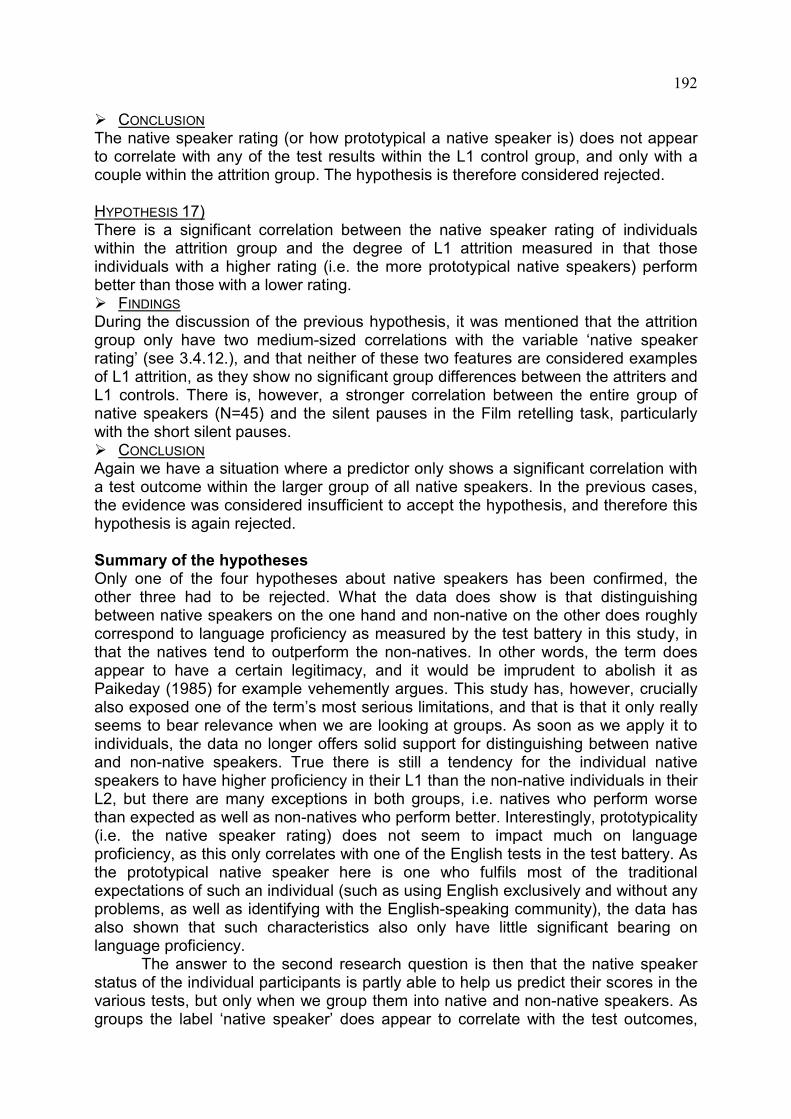
192
CONCLUSION The native speaker rating (or how prototypical a native speaker is) does not appear to correlate with any of the test results within the L1 control group, and only with a couple within the attrition group. The hypothesis is therefore considered rejected. HYPOTHESIS 17) There is a significant correlation between the native speaker rating of individuals within the attrition group and the degree of L1 attrition measured in that those individuals with a higher rating (i.e. the more prototypical native speakers) perform better than those with a lower rating. FINDINGS During the discussion of the previous hypothesis, it was mentioned that the attrition group only have two medium-sized correlations with the variable ‘native speaker rating’ (see 3.4.12.), and that neither of these two features are considered examples of L1 attrition, as they show no significant group differences between the attriters and L1 controls. There is, however, a stronger correlation between the entire group of native speakers (N=45) and the silent pauses in the Film retelling task, particularly with the short silent pauses. CONCLUSION Again we have a situation where a predictor only shows a significant correlation with a test outcome within the larger group of all native speakers. In the previous cases, the evidence was considered insufficient to accept the hypothesis, and therefore this hypothesis is again rejected. Summary of the hypotheses Only one of the four hypotheses about native speakers has been confirmed, the other three had to be rejected. What the data does show is that distinguishing between native speakers on the one hand and non-native on the other does roughly correspond to language proficiency as measured by the test battery in this study, in that the natives tend to outperform the non-natives. In other words, the term does appear to have a certain legitimacy, and it would be imprudent to abolish it as Paikeday (1985) for example vehemently argues. This study has, however, crucially also exposed one of the term’s most serious limitations, and that is that it only really seems to bear relevance when we are looking at groups. As soon as we apply it to individuals, the data no longer offers solid support for distinguishing between native and non-native speakers. True there is still a tendency for the individual native speakers to have higher proficiency in their L1 than the non-native individuals in their L2, but there are many exceptions in both groups, i.e. natives who perform worse than expected as well as non-natives who perform better. Interestingly, prototypicality (i.e. the native speaker rating) does not seem to impact much on language proficiency, as this only correlates with one of the English tests in the test battery. As the prototypical native speaker here is one who fulfils most of the traditional expectations of such an individual (such as using English exclusively and without any problems, as well as identifying with the English-speaking community), the data has also shown that such characteristics also only have little significant bearing on language proficiency. The answer to the second research question is then that the native speaker status of the individual participants is partly able to help us predict their scores in the various tests, but only when we group them into native and non-native speakers. As groups the label ‘native speaker’ does appear to correlate with the test outcomes,

193
and thereby shows predictive power with regard to language proficiency. However, each native speaker is also an individual, and on this level the label has limited predictive power, so that an individual native speaker is likely to outperform a non-native but there are many exceptions, and certainly no guarantees.
3.6. Conclusion The research project presented here has only been able to detect minimal evidence of L1 attrition in the English of the attrition group. This could be attributed to a number of possible causes, one of which is related to the internal composition of the two native speaker groups. As even the L1 control group here displays an unanticipated, wide range of language proficiency, it may be that the presumed changes to the attriters’ L1 are not easily discernible as they still generally remain within this range. Of course this renders the task of finding differences between the two groups all but impossible, as any L1 attrition which may have taken place in the individual members of the attrition group is concealed by the fact that even some of the more prototypical native speakers from the L1 control group perform poorly in the test battery. According to this view then, L1 attrition would remain almost entirely within ‘native speaker range’, and therefore be largely indistinguishable from the performance of the weaker members of the control group.
Equally, the difficulties may be attributable to the study having insufficient ‘power’, which is determined by sample size, the magnitude of the treatment effect and the amount of variability among participants. In this study, the groups (including the attrition group) were comparatively small, and there is quite considerable variance within the attrition group (but also within the group of L1 controls), as indicated for example by the high standard deviations. It is also possible that the treatment effect (i.e. the impact on the L1 of having emigrated and spent decades living in a foreign country) may not be as strong as presupposed. The combination of all these factors results in a lack of ‘power’ which in turn means that fewer significant results will be found.
An equally viable alternative explanation is of course that there simply is no L1 attrition to be discovered within the attrition group as their language has not attrited. On the basis of the eight previous studies on the attrition of L1 English discussed above (see 2.1.3.), however, this seems unlikely as seven of them report finding changes in the L1, which the majority also label ‘L1 attrition’. (The exception is Gürel’s 2007 study of L1 English in combination with L2 Turkish.) Most of these seven studies name symptoms such as lexical and phonetic / phonological interference from the L2, including code-switching. Boyd & Andersson (1991) and Boyd (1993) also identify L2 influence in the syntax (adverbial placement), and Brown (2001) mentions finding evidence of pragmatic changes, but also some hesitation features. Olshtain & Barzilay (1991), finally, discuss how specific semantic features in lexemes appear to have been affected by such long-term emigration. In the data collected during this project there were few instances of code-switching: no more than around 1% of the total tokens produced during the two spoken tasks were in the L2 (which corresponds to a maximum of eight individual lexemes in one transcript). No phonetic or phonological analysis of the naturalistic, spoken data was carried out and therefore no comments can be made on such points. The syntax was also not explicitly investigated, but no systematic differences between the attriters and L1 controls were immediately discernible during transcription and coding. Those

194
lexemes produced during the FiCAs, as well as the transcripts from the Film retelling and Picture description, were subjected to a (morpho-)semantic analysis but this yielded no between-group differences. The only overlap between this study’s findings and previous research, therefore, appears to be in the area of hesitation features. So, was this study unable to uncover further signs of L1 attrition which are assumed to be there, or is there no L1 attrition to be uncovered? This question is almost impossible to answer, but nevertheless this is attempted in the following section. What is L1 attrition? The working definition supplied above simply states that L1 attrition is behaviour which deviates in a negative way from that of the L1 control group. This has sufficed for its express purpose of pinpointing L1 attrition in the data collected here, but is of little practical (or theoretical) use beyond that. The other definition cited in 3.1. above and repeated here seems much more promising, in contrast: “Language attrition is a decline of retrievability of declarative linguistic knowledge and deproceduralization of linguistic knowledge in L1, and an increase of competition by L2 knowledge” (de Bot, 2002). So, does this study offer any evidence in favour of this second definition? The first symptom named is ‘a decline of retrievability of declarative linguistic knowledge’. As stated (in 2.2.2.) above, linguistic declarative knowledge is “lexical knowledge, including the sounds and meanings of words” (Ullman 2005:148). The lexicon was the target of a number of items in the test battery here but neither these scores nor the semantic analyses of the two FiCAs were able to reveal any significant differences between the two native speaker groups. Neither did the two investigations into lexical diversity or lexical sophistication on the data produced during the two spoken tasks provide any evidence of attrition in the attrition group. The only symptom found which could fit this description is the increase in the number of silent pauses, which was interpreted as evidence of retrievability problems, an assumption supported by data discussed by Schmid (2009) where she concludes that
[t]he increase of CDMs69
The second characteristic of L1 attrition named by de Bot is the ‘deproceduralization of linguistic knowledge’. As morphosyntax and phonology are generally considered part of procedural knowledge, this would suggest that an attriter
in the data from the attriters was interpreted as a symptom of the fact that the attritional process can lead to reduced accessibility of lexical and grammatical information. In other words, the higher incidence of disfluency markers was taken as an indication of slower processes of activation of (predominantly lexical) information.
No systematic analysis of the precise location of the silent pauses was performed on the entire corpus of spoken data, but this was carried out for the fifteen specific situations isolated in the Picture description and twenty in the Film retelling. In the Film retelling the attriters used more than twice as many silent pauses on average (i.e. 6.5 per person as compared to 2.8 among the L1 controls) just before content words such as nouns, verbs and adjectives, suggesting that the pauses could be accompanying a lexical search. (In the Picture description, however, the L1 controls produced slightly more such pauses, so the interpretation is somewhat problematic.)
69 This is an abbreviation for ‘cognitive disfluency markers’ which refer to hesitation markers other than filled pauses.

195
would experience problems in such areas, possibly in that the use of grammar would no longer be as intuitively correct (requiring more declarative, meta-knowledge of the rules) and the spoken L1 may display traces of L2 influence through a non-native accent or intonation patterns. Phonetics and phonology were outside the scope of this study, however, and morphosyntax was not systematically investigated as it was not expected to have deteriorated in any significant way. For these reasons, it is not possible to comment on this characteristic on the basis of the data collected in this study. The final characteristic listed is ‘an increase of competition by L2 knowledge’ which could manifest itself in the form of L2 interference in general, but also through features such as code-switching. In this study, there are some instances of code-switching, but only six (out of 25) members of the attrition group produce any L2 in the two spoken tasks, whereby three code-switch in both. Other types of L2 interference did not emerge, but again were not specifically looked into. So what is the conclusion regarding de Bot’s definition? Based on the findings of this study the definition cannot be categorically accepted or rejected at present, as too little L1 attrition has been discovered, and it is therefore not possible to properly assess the various predictions made. Nevertheless, I still find the definition to have a certain appeal, mainly because it focuses on this type of L1 attrition as an online processing problem, rather than as a phenomenon which is likely to have a permanent debilitating effect on the language. If neither of these two definitions is completely appropriate, then how can adult non-pathological L1 attrition be described at the end of this project? Is it more than having missed out on recent language change, possibly mixed with some L2 interference, and therefore sounding a little ‘odd’70? Is it a phenomenon mainly affecting the speaker’s lexicon as claimed by most other studies? Starting with the question regarding the lexicon, this is of course a logical place to find differences between groups, as a healthy brain never seems to lose its ability to learn and store new words, unlike the ability to learn native-like pronunciation or grammar (see 2.4.2.5.) which appears to be subject to a sensitive (if not critical) period. This lifelong capacity to build on the existing lexicon is a hugely useful skill enabling a speaker to adapt to a changing environment as an adult (such as the acquisition of new lexemes required for certain professions). But, because this system is less ‘fixed’ (than phonetics / phonology or morphosyntax) and therefore more able to evolve during adulthood and adapt to the speaker’s requirements, it is particularly vulnerable in emigration situations71
70 This is the adjective an old friend used to describe my English some years ago, when pushed to describe the difference. 71 Another system which presumably continues to develop during a speaker’s lifetime, and which should therefore be equally vulnerable, is pragmatics. But unfortunately, studies rarely focus on such abilities.
. Surprisingly, this study was unable to find any such deterioration in the lexicon of the attriters so this most common symptom of L1 attrition cannot be confirmed here. The participants in Olshtain & Barzilay’s (1991) study had significantly more problems than the control group in producing “infrequent, specific, nouns” (ibid.:140), but no specific evidence of that could be found in this study either. Nevertheless, in the Film retelling and Picture description tasks where a careful lexical analysis was performed on 15-20 particular situations and how the participants described these, there were quantifiable differences between the two groups. For instance it was noticed that the attriters used fewer lexemes originating

196
from the North American (rather than British) English variety than the L1 controls, and also often preferred more semantically neutral options, such as lexemes considered less colloquial. To sum up, therefore, I would say that this study has found subtle differences in the lexicon between the attriters and L1 controls, but none of these were dramatic enough to show significant between-group differences (i.e. L1 attrition) in a statistical analysis. The lexicon does therefore appear to suffer from long-term emigration even in the most optimistic of scenarios. But if the damage to the lexicon only becomes visible to the extent found in this study, I would be extremely reluctant to call this L1 attrition, preferring to consider it mainly the non-acquisition of language change rather than the ‘loss’ of something. In this project, adult non-pathological L1 attrition has only manifested itself in one way, namely by negatively affecting the fluency of the speakers in the attrition group. Many previous studies (see 2.1.2.1.) have found the speech of their treatment group to be more halting, indicating problems in “on-going speech production” (Andersen, 1982:113), often accompanied by a slower rate of speech, and silent pauses which Hansen (2001:65) calls “a piece of the language attrition puzzle”. It is therefore not unexpected that it is precisely these silent pauses which are the only real evidence of L1 attrition here. Another question is of course whether the L1 attrition of English can be compared to the L1 attrition of other native languages? On the one hand it is simply one language among many, but on the other English is in many ways different from most, or possibly all, other languages spoken in the world72
One interesting point arising from this discussion is, if these are the factors which distinguish English from other languages, and if English is different in that it is somehow better protected from L1 attrition, then it must be these very factors which
. Why for example does the lexicon of the attriters in this study show virtually no significant effect from emigration and long-term residence in Germany, although this is the most common symptom in the majority of previous studies? In my opinion, English is distinctive for at least two reasons. The first of these concerns the variable contact / use, and would predict that English is relatively immune to L1 attrition because it is comparatively easy to find opportunities to use English, (almost) anywhere in the world today. Quite apart from other native speakers (often working as teachers or for international companies), there are English-language radio and television programmes broadcast into nearly all corners of the world, and the internet is of course a further valuable source nowadays. Even if contact / use does not appear to have much impact on the outcomes in this study and does not correlate with L1 attrition, many other studies have found it to be an important variable, and many theories predict its influence. It is therefore quite probable that English is at least partly protected from L1 attrition for this reason. A second possible explanation is more socio-psychological, tying in with what was said earlier about CAT (Communication Accommodation Theory, see 2.3.7.) and attitude / motivation (see 2.1.2.2.). This explanation would claim that English benefits from the fact that it enjoys high prestige in many countries in the world, reducing the pressure on any native speakers of English who emigrate there to shake off their old identities and accommodate to the L2 environment, which could include neglecting their native language.
72 To my knowledge, the research into L1 attrition has mainly taken place in Europe, Australia and North America so far, automatically limiting the range of languages investigated. It is to be hoped that future studies will concentrate more on previously neglected languages in Africa, Asia and South America, which will then hopefully shed further light on the role of English, and possibly other lingua francas in these areas, which may be equally ‘immune’ to L1 attrition.
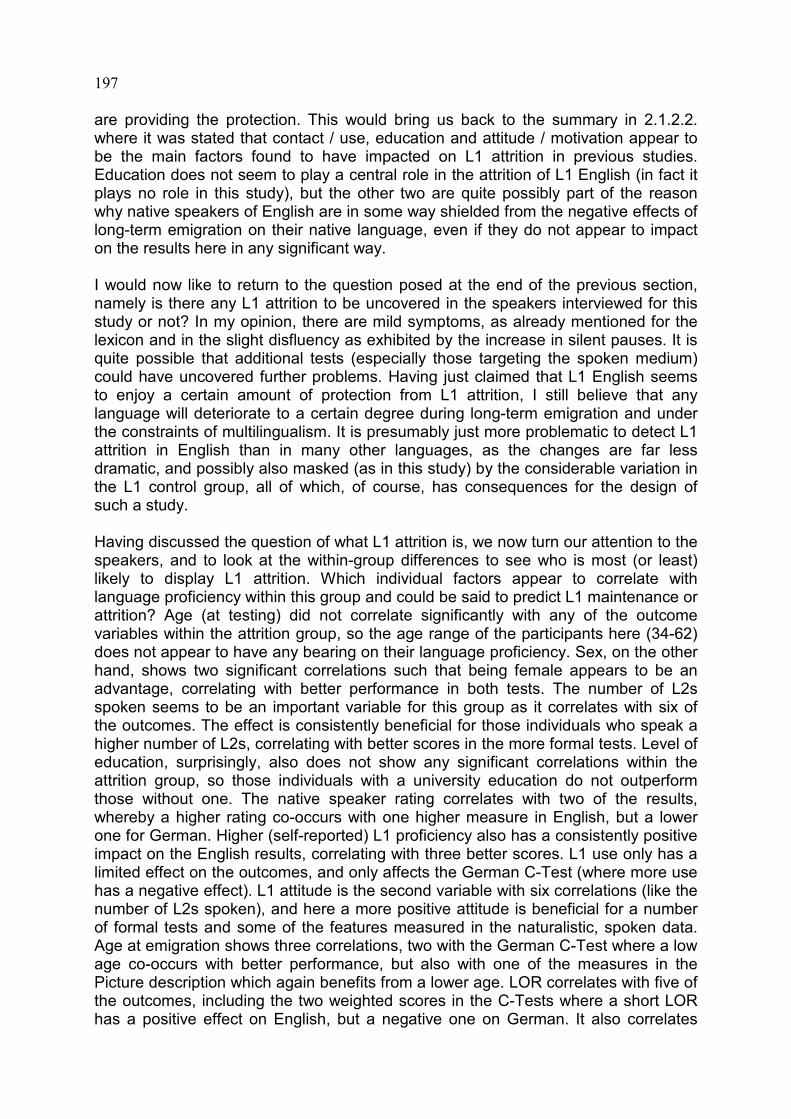
197
are providing the protection. This would bring us back to the summary in 2.1.2.2. where it was stated that contact / use, education and attitude / motivation appear to be the main factors found to have impacted on L1 attrition in previous studies. Education does not seem to play a central role in the attrition of L1 English (in fact it plays no role in this study), but the other two are quite possibly part of the reason why native speakers of English are in some way shielded from the negative effects of long-term emigration on their native language, even if they do not appear to impact on the results here in any significant way. I would now like to return to the question posed at the end of the previous section, namely is there any L1 attrition to be uncovered in the speakers interviewed for this study or not? In my opinion, there are mild symptoms, as already mentioned for the lexicon and in the slight disfluency as exhibited by the increase in silent pauses. It is quite possible that additional tests (especially those targeting the spoken medium) could have uncovered further problems. Having just claimed that L1 English seems to enjoy a certain amount of protection from L1 attrition, I still believe that any language will deteriorate to a certain degree during long-term emigration and under the constraints of multilingualism. It is presumably just more problematic to detect L1 attrition in English than in many other languages, as the changes are far less dramatic, and possibly also masked (as in this study) by the considerable variation in the L1 control group, all of which, of course, has consequences for the design of such a study. Having discussed the question of what L1 attrition is, we now turn our attention to the speakers, and to look at the within-group differences to see who is most (or least) likely to display L1 attrition. Which individual factors appear to correlate with language proficiency within this group and could be said to predict L1 maintenance or attrition? Age (at testing) did not correlate significantly with any of the outcome variables within the attrition group, so the age range of the participants here (34-62) does not appear to have any bearing on their language proficiency. Sex, on the other hand, shows two significant correlations such that being female appears to be an advantage, correlating with better performance in both tests. The number of L2s spoken seems to be an important variable for this group as it correlates with six of the outcomes. The effect is consistently beneficial for those individuals who speak a higher number of L2s, correlating with better scores in the more formal tests. Level of education, surprisingly, also does not show any significant correlations within the attrition group, so those individuals with a university education do not outperform those without one. The native speaker rating correlates with two of the results, whereby a higher rating co-occurs with one higher measure in English, but a lower one for German. Higher (self-reported) L1 proficiency also has a consistently positive impact on the English results, correlating with three better scores. L1 use only has a limited effect on the outcomes, and only affects the German C-Test (where more use has a negative effect). L1 attitude is the second variable with six correlations (like the number of L2s spoken), and here a more positive attitude is beneficial for a number of formal tests and some of the features measured in the naturalistic, spoken data. Age at emigration shows three correlations, two with the German C-Test where a low age co-occurs with better performance, but also with one of the measures in the Picture description which again benefits from a lower age. LOR correlates with five of the outcomes, including the two weighted scores in the C-Tests where a short LOR has a positive effect on English, but a negative one on German. It also correlates

198
with three of the features measured in the Film retelling, including the silent pauses. L2 use correlates significantly with only two of the outcomes: more use co-occurs with a better German C-Test score but also with more hedges in the Picture description. (Self-reported) L2 proficiency, finally as the twelfth variable, also shows four correlations, where higher proficiency has a positive effect on the German C-Test and the number of reformulations in the Picture description, but also correlates with more hedges in the Film retelling.
Summarising all these influences we can therefore say that the person least likely to show symptoms of L1 attrition is female and will know many L2s. Apart from these she will tend to have higher self-reported L1 proficiency, and a more positive L1 attitude. She will also not have such a long LOR in the L2 environment. Other, less influential factors could include: a higher native speaker rating, a lower age at emigration, and less L2 use. Age at testing, level of education and L1 use do not appear to impact on the English of the speakers at all, and L2 proficiency has an unpredictable and inconsistent effect. Looking at those individuals (i.e. the subgroup of seven discussed in 3.4.13.14.) who produced least silent pauses in the Film retelling (i.e. least L1 attrition), we might, however, want to add that being younger could also be beneficial in resisting L1 attrition. What does it mean to be a ‘native speaker’? Now that we have completed our discussion of L1 attrition, we move on to the second key question in this thesis: What does it mean to be a native speaker? The findings have shown that the two native speaker groups have outperformed the non-native speaker group, so the label ‘native speaker’ must signify something. However, they also show that the differences break down to a certain degree when we look at individuals. On the basis of this study, I cannot agree (for example with Paikeday, 1985) that “the native speaker is dead” as those individuals born and brought up with English do generally outperform those born and brought up with a different L1 (such as German in this case). At the end of this project, I would still want to define ‘native speaker’ as was done in 2.4.2.6. above, namely:
A native speaker of the language L is someone who has learnt L naturally from their environment (normally their parents) from birth or very early childhood i.e. for whom L is the first language (or in the case of child bilingualism, one of two or more first languages) and who was exposed to and brought up with L for the first (roughly 14-16) years of life.
What the data has revealed, though, is that such individuals are not necessarily always the more proficient in the language, so that a specific L2 user may in fact have higher proficiency in his/her L2 than a specific native speaker in his/her L1. Therefore, I consider it crucial to show awareness of such facts and exercise great caution in using the term. The still common practice of advertising for a ‘native speaker’ teacher, editor, translator, proofreader and so on, for example, without specifying the exact qualifications such a person should have, appears totally misplaced in the light of these findings, and will, hopefully, end at some point.
Concluding, therefore, in my opinion a native speaker is someone born and brought up in a certain place and learning a certain language naturally (as outlined in the definition above), so that s/he will tend to have relatively high proficiency therein. But, this does not automatically mean that every native speaker will have such high proficiency in his/her L1, and neither does it mean that s/he will necessarily be the most qualified person to perform a particular task or practise a given profession.

199
These things should be decided on the basis of individual ability, and a native speaker is not always the most able person just because s/he is a native speaker. The test battery Finally, I would like to look at the individual items in the test battery and review their possible strengths and weaknesses in the light of this study. As mentioned above in the section on methodology (see 3.3.), the majority of these test items were taken from the language attrition graduate network’s test battery (cp. Schmid 2004b) and have already been employed in previous studies. This applies to the two FiCAs, the German C-Test and the Film retelling task, all of which were administered as recommended.
With hindsight, now, it might have been advisable to add a couple of additional FiCA tests, for example where the participants are asked to name as many words as possible beginning with a certain letter (such as ‘p’) besides those targeting a specific semantic domain (such as ‘animals’). The two FiCAs employed here did not yield any significant between-group differences, and therefore it would have been interesting to see if a slight variation would have produced more interesting results. They are very quick and easy to administer (as well as being relatively simple to analyse) and so two additional tests would not have been too taxing for the interviewer or the participants.
The Film retelling task proved to be the most important one of all, as this is where evidence of L1 attrition was found. Strangely, though, the Picture description, which was assumed to be similar or even more challenging for both native speaker groups, produced results which are at variance with those from the Film retelling as the L1 control group seemed to have greater problems with this task than the attriters. For that reason, it may be better to drop such a Picture description in future. On the other hand, the Film retelling has revealed the importance of eliciting more naturalistic, spoken data in attrition studies and therefore further such tests are indispensable. The English C-Test was taken from the test battery but then slightly adapted to better suit the background of this study’s participants. It was administered and coded as recommended, but in addition a weighted score was computed for each of the individuals, based on how long they required to find one correct answer. Looking at how the various tests correlate with one another in the attrition group, this does seem to be a useful tool as the weighted C-Test score correlates with more of the features measured in the Film retelling and Picture description than the ‘normal’ C-Test. One test presumably employed for the first time in such a study is what is called here the ‘Scrabble’ test, involving the formation of as many words as possible in a limited period of time using twelve Scrabble tiles. Here, again, two scores were computed: the so-called initial score which simply counts the number of words formed, and the weighted score which takes word length into consideration. I was pleased to see that both correlate positively with the (‘normal’ and weighted scores in the) C-Test which, as mentioned above, is commonly assumed to be a useful test of global language proficiency, strongly suggesting that the ‘Scrabble’ test is also worth including in future tests. With hindsight, therefore, I would not omit any of the test items employed but would rather prefer to add a few more, even if that means increasing the time required to interview each of the individuals.

200
One of the shortcomings of this study which has become obvious is that the sample sizes were a little small. It was difficult to find those 64 participants who did take part, but around 30 in each of the three groups may have helped to increase the power of the study, and possibly reveal further significant findings. It would also have been desirable to have further test items focusing on the attriters’ speech, as this was the one area where L1 attrition was found, and the Picture description unfortunately proved to be rather unsuitable. The (sociolinguistic) questionnaires used to elicit background information and filter the participants could also have been improved. As the research topic was expanded to include the native speaker concept only after the first questionnaires had been sent out, further questionnaires had to be designed and distributed. On reflection, it would have been better if the first questionnaires had not been sent until the topic had been fixed, thereby eliminating the necessity to send the participants a number of different questionnaires. One further change I would like to have made to the study as conducted here relates to the native speaker rating and the discussion of Englishness (see 2.4.2.1.) as found in Fox (2004). She discusses behavioural aspects of being a native speaker, which, in my opinion, are too important to be ignored, and should ideally be incorporated into the native speaker model presented in this thesis. This would enable a more realistic native speaker rating, as often it is less attitudes and linguistic performance which distinguish native speakers from non-native ones but behaviour. Particular contribution to the field of research This study is unique in bringing such a large and varied test battery to the investigation of the L1 attrition of English, as previous studies of L1 English have been much more limited in their methodology. It is also only the second one to my knowledge to have combined L1 English with L2 German, and the first to have investigated this language combination in such detail, including the use of two largely monolingual control groups as baselines for comparison. Regarding the findings, this project has furthermore been able to show that even where contact / use and attitudes / motivation are so favourable, L1 attrition can be found. A further key finding from this research project is the importance of not just employing relatively formal tests (which are generally quicker to administer and easier to analyse), but that especially tasks eliciting spoken data are essential to detecting and understanding the phenomenon called L1 attrition and therefore need to be incorporated into the design of future studies. This project is also innovative in having linked the topic of L1 attrition with the concept of ‘native speaker’, facilitating a number of additional discoveries. One of these is the fact that the (potential) attriters in this study appear to be less native-like than the L1 controls in many ways, and yet are virtually indistinguishable linguistically. The final major finding (and the one which is presumably most relevant to the non-academic world) is that this project has been able to show that the epithet ‘native speaker’ has only limited worth as some non-native speakers can outperform native speakers linguistically.

201
4. References Altenberg, E. P. (1991). “Assessing first language vulnerability to attrition.” In: H. W. Seliger & R. M. Vago (eds.). First language attrition. Cambridge: CUP. (p.189-206) Ammerlaan, T. (1996). You get a bit wobbly ... Unpublished Doctoral Dissertation. Nijmegen University. Ammerlaan, T., Hulsen, M., Stratig, H. & Yağmur, K. (2001). “Language maintenance, shift, and loss: Work in progress.” In: T. Ammerlaan, M. Hulsen, H. Strating, & K. Yağmur (eds.). Sociolinguistic and psycholinguistic perspectives on maintenance and loss of minority languages. Münster / New York: Waxmann. (p.1-13) Anchimbe, E. A. (2006). “The native-speaker fever in English language teaching (ELT): Pitting pedagogical competence against historical origin.” In: Linguistik online 26, 1/06, www.linguistik-online.de/26_06/anchimbe.html Andersen, R. W. (1982). “Determining the Linguistic Attributes of Language Attrition.” In: R. D. Lambert & B. F. Freed (eds.). The Loss of Language Skills. Rowley: Newbury House. (p.83-118) Annamalai, E. (1998). “Nativity of Language.” In: R. Singh (ed.). The Native Speaker: Multilingual Perspectives. New Delhi: Sage Publications. (p.148-57) Baddeley, A. (1997). Human Memory. Theory and Practice (Revised Edition). Hove, UK: Psychology Press. Bahrick, H. P. (1984). “Fifty Years of Second Language Attrition: Implications for Programmatic Research.” In: The Modern Language Journal, 68, ii, 105-18. Ballmer, T. T. (1981). “A Typology of Native Speakers.” In: F. Coulmas (ed.). A Festschrift for Native Speaker. The Hague / Paris / N.Y.: Mouton. (p.51-67) Babaii, E. & Ansary, H. (2001). “The C-test: a valid operationalization of reduced redundancy principle?” In: System, 29/2, 209-19. Bell, A. (1997). “Language Style as Audience Design.” In: N. Coupland & A. Jaworski (eds.). Sociolinguistics. A Reader and Coursebook. Basingstoke / New York: Palgrave. (p.232-9) Berko-Gleason, J. (1982). “Insights from Child Language Acquisition for Second Language Loss.” In: R. D. Lambert & B. F. Freed (eds.). The Loss of Language Skills. Rowley: Newbury House. (p.13-23) Bialystok, E. (2009). “Bilingualism: The good, the bad, and the indifferent.” In: Bilingualism: Language and Cognition, 12 (1), 3-11. Biber, D. et. al. (1999). Longman Grammar of Spoken and Written English. Harlow: Longman.

202
Bot, K. de, Gommans, P. & Rossing, C. (1991). “L1 loss in an L2 environment: Dutch immigrants in France.” In: H. W. Seliger & R. M. Vago (eds.). First language attrition. Cambridge: CUP. (p.87-98) Bot, K. de & Weltens, B. (1991). “Recapitulation, regression, and language loss.” In: H. W. Seliger & R. M. Vago (eds.). First language attrition. Cambridge: CUP. (p.31-51) Bot, K. de & Clyne, M. (1994). “A 16-year longitudinal study of language attrition in Dutch immigrants in Australia.” In: Journal of Multilingual and Multicultural Development, 15/1, 17-28. Bot, K. de. (1996). “Language loss.” In: H. Goebl, P. Nelde et al. (eds.). Kontakt-linguistik. Ein internationales Handbuch zeitgenössischer Forschung. Volume I. Berlin: De Gruyter. (p.579-85) Bot, K. de. (1999). “The psycholinguistics of language loss.” In: G. Extra & L. Verhoeven (eds.). Bilingualism and Migration. Berlin / New York: Mouton de Gruyter. (p.345-61) Bot, K. de. (2002). “Language attrition: where are we and where are we going.” (Paper presented at the First International Conference on First Language Attrition, Amsterdam, August 2002). Bot, K. de & Hulsen, M. (2002). “Language Attrition: Tests, Self-assessments and Perceptions.” In: V. Cook (ed.). Portraits of the L2 User. Clevedon: Multilingual Matters. (p.253-74) Bot, K. de. (2004). “Introduction.” In: International Journal of Bilingualism. Special issue on language attrition, 8:3, 233-37. Bot, K. de, Martens, V. & Stoessel, S. (2004). “Finding residual lexical knowledge: The “Savings” approach to testing vocabulary.” In: International Journal of Bilingualism. Special issue on language attrition, 8:3, 373-82. Bot, K. de & Makoni, S. (2005). Language and Aging in Multilingual Contexts. Clevedon: Multilingual Matters Ltd. Bot, K. de. (2007). “Dynamic systems theory, lifespan development and language attrition.” In: B. Köpke, M. S. Schmid, M. Keijzer & S. Dostert (eds.). Language Attrition. Theoretical perspectives. Amsterdam / Philadelphia: John Benjamins. (p.53-68) Bownds, M. D. (1999). The Biology of Mind. Origins and Structures of Mind, Brain, and Consciousness. Hoboken, NJ: John Wiley. Boyd, S. (1986). “Using the Present to Predict the Future in Language Contact: The Case of Immigrant Minority Languages in Sweden.” In: B. Weltens, K. de Bot & T.

203
van Els (eds.). Language Attrition in Progress. Dordrecht: Foris Publications. (p.99-115) Boyd, S. & Andersson, P. (1991). “Linguistic change among bilingual speakers of Finnish and American English in Sweden – Background and some tentative findings.” In: Gothenburg Papers in Theoretical Linguistics 63, 1-22. Boyd, S. (1993). “Attrition or expansion? Changes in the lexicon of Finnish and American adult bilinguals in Sweden.” In: K. Hyltenstam & Å. Viberg (eds.). Progression & regression in language. Sociocultural, neuropsychological & linguistic perspectives. Cambridge: CUP. (p.386-411) Brown. J. (2001). L1 attrition among native-speakers of English resident abroad: a sociolinguistic case-study from Foggia, Italy. Unpublished MA Thesis. Brutt-Griffler, J. & Samimy, K. K. (2001). “Transcending the nativeness paradigm.” In: World Englishes 20/1, 99-106. Chomsky, N. (1965). Aspects of the theory of syntax. Cambridge: MIT Press. Clark, E. V. (2003). First Language Acquisition. Cambridge: CUP. Clyne, M. G. (1968). “Transference patterns among English-German bilinguals – A comparative study.” In: International Journal of Applied Linguistics (ITL) 2, 5-18. Clyne, M. (1992). “Linguistic and Sociolinguistic Aspects of Language Contact, Maintenance and Loss. Towards a Multifacet Theory.” In: W. Fase, K. Jaspaert & S. Kroon (eds.). Maintenance and Loss of Minority Languages. Amsterdam: John Benjamins. (p.17-36) Cohen, A. (1986). “Forgetting Foreign-Language Vocabulary.” In: B. Weltens, K. de Bot & T. van Els (eds.). Language Attrition in Progress. Dordrecht: Foris Publications. (p.143-58) Cook, V. (1993). “Wholistic multi-competence – jeu d’esprit or paradigm shift?” In: B. Kettemann & W. Wieden (eds.). Current Issues in European Second Language Acquisition Research. Tübingen: Gunter Narr. (p.3-8) Cook, V. (1999). “Going Beyond the Native Speaker in Language Teaching.” In: Tesol Quarterly 33/2, 185-209. Cook, V. (2002). “Background to the L2 User.” In: V. Cook (ed.). Portraits of the L2 User. Clevedon: Multilingual Matters. (p.1-27) Cook, V. (2003). “Introduction: The Changing L1 in the L2 User’s Mind.” In: V. Cook (ed.). Effects of the Second Language on the First. Clevedon: Multilingual Matters. (p.1-18) Coppieters, R. (1987). “Competence differences between native and near-native speakers.” In: Language 63/3, 544-73.

204
Coulmas, F. (1981). “Introduction: The Concept of Native Speaker.” In: F. Coulmas (ed.). A Festschrift for Native Speaker. The Hague: Mouton. (p.1-25) Coulmas, F. (1981). “Spies and Native Speakers.” In. F. Coulmas (ed.). A Festschrift for Native Speaker. The Hague: Mouton. (p.355-67) Coveney, A. (1998). “Awareness of linguistic contrains on variable ne omission.” In: French Language Studies 8, 159-87. Davies, A. (1991a). The Native Speaker in Applied Linguistics. Edinburgh: Edinburgh University Press. Davies, A. (1991b). “The notion of the native speaker.” In: Journal of Intercultural Studies 12/2, 35-45. Davies, A. (1995). “Proficiency or the native speaker: what are we trying to achieve in ELT?” In: G. Cook & B. Seidlhofer (eds.). Principle and practice in applied linguistics. Oxford: OUP. (p.145-57) Davies, A. (2003). The Native Speaker: Myth and Reality. Clevedon: Multilingual Matters. Davies, A. (2004). “The Native Speaker in Applied Linguistics.” In: A. Davies & C.Elder (eds.). The Handbook of Applied Linguistics. Malden, Mass.: Blackwell, (p.431-50). Dorian, N. C. (1982). “Language Loss and Maintenance in Language Contact Situations.” In: R. D. Lambert & B. F. Freed (eds.). The Loss of Language Skills. Rowley: Newbury House. (p.44-59) Ecke, P. (2004). “Language attrition and theories of forgetting: A cross-disciplinary review.” In: International Journal of Bilingualism. Special issue on language attrition, 8:3, 321-54. Els, T. van. (1986). “An Overview of European Research on Language Attrition.” In: B. Weltens, K. de Bot & T. van Els (eds.). Language Attrition in Progress. Dordrecht: Foris Publications. (p.3-18) Escudero, P. & Sharwood Smith, M. (2001). “Reinventing the native speaker or ‘What you never wanted to know about the native speaker so never dared to ask’.” In: EUROSLA Yearbook 1, 275-86. Fase, W., Jaspaert, K. & Kroon, S. (1992). “Maintenance and Loss of Minority Languages. Introductory Remarks.” In: W. Fase, K. Jaspaert & S. Kroon (eds.). Maintenance and Loss of Minority Languages. Amsterdam: John Benjamins. (p.3-14) Ferguson, Charles A. (1982). “Foreword.” In: B. B. Kachru (ed.). The Other tongue. English across Cultures. Urbana: University of Illinois Press. (p.vii-xi)

205
Fox, K. (2004). Watching the English. The Hidden Rules of English Behaviour. London: Hodder & Stoughton Ltd. Freed, B. F. (1982). “Language Loss: Current Thoughts and Future Directions.” In: R. D. Lambert & B. F. Freed (eds.). The Loss of Language Skills. Rowley: Newbury House. (p.1-5) Gardner, R. C. (1982). “Social Factors in Language Retention.” In: R. D. Lambert & B. F. Freed (eds.). The Loss of Language Skills. Rowley: Newbury House. (p.24-39) Geest, T. van der. (1981). “How to Become a Native Speaker: One Simple Way.” In: F. Coulmas (ed.). A Festschrift for Native Speaker. The Hague: Mouton. (p.317-53) Giles, H., Taylor, D. M. & Bourhis, R. (1973). “Towards a theory of interpersonal accommodation through language: some Canadian data.” In: Language in Society 2, 177-92. Giles, H. (1973). “Accent Mobility: A model and some data.” In: Anthropological Linguistics, 15, 87-105. Giles, H. (1979). “Sociolinguistics and Social Psychology: an Introductory Essay.” In: H. Giles & R. N. St. Clair (eds.). Language and Social Psychology. Oxford: Blackwell. (p.1-18) Giles, H. & Smith, P. (1979). “Accommodation Theory: Optimal Levels of Convergence.” In: H. Giles & R. N. St. Clair (eds.). Language and Social Psychology. Oxford: Blackwell. (p.45-65) Giles, H. & Powesland, P. (1997). “Accommodation Theory.” In: N. Coupland & A. Jaworski (eds.). Sociolinguistics. A Reader and Coursebook. Basingstoke / New York: Palgrave. (p.232-9) Götz, D. (1999). „25 Jahre Sprachzentrum der Universität Augsburg.“ http://www.presse.uni-augsburg.de/unipress/up199804/artikel_30.shtml Graddol, D. (2006). English Next. Why global English may mean the end of ‘English as a Foreign Language’. British Council. Green, D. W. (1986). “Control, Activation, and Resource: A Framework and a Model for the Control of Speech in Bilinguals.” In: Brain and Language 27, 210-223. Grosjean, F. (1989). “Neurolinguists, Beware! The Bilingual Is Not Two Monolinguals in One Person.” In: Brain and Language 36, 3-15. Gross, S. (2004). “A modest proposal. Explaining language attrition in the context of contact linguistics.” In: M. S. Schmid, B. Köpke, M. Keijzer & L. Weilemar (eds.). First Language Attrition. Interdisciplinary perspectives on methodological issues. Amsterdam / Philadelphia: John Benjamins. (p.281-97)

206
Grotjahn, R. (1987). “How to construct and evaluate a C-Test: A discussion of some problems and some statistical analyses.” In: R. Grotjahn, C. Klein-Braley & D. K. Stevenson (eds.). Taking their measure: The validity and validation of language tests. Bochum: Studienverlag Dr. Brockmeyer. (p.219-53). Gürel, A. (2004a). “Attrition in L1 competence. The case of Turkish.” In: M. S. Schmid, B. Köpke, M. Keijzer & L. Weilemar (eds.). First Language Attrition. Interdisciplinary perspectives on methodological issues. Amsterdam / Philadelphia: John Benjamins. (p.225-42) Gürel, A. (2004b). “Selectivity in L2-induced L1 attrition: a psycholinguistic account.” In: Journal of Neurolinguistics 17, 53-78. Gürel, A. (2007). “(Psycho)linguistic determinants of L1 attrition.” In: B. Köpke, M. S. Schmid, M. Keijzer & S. Dostert (eds.). Language Attrition. Theoretical perspectives. Amsterdam / Philadelphia: John Benjamins. (p.99-119) Hamers, J. F. & Blanc, M. H. A. (20002). Bilinguality and Bilingualism. Cambridge: CUP. Hansen, L. (2001). “Language Attrition: The fate of the start.” In: Annual Review of Applied Linguistics 21, 60-73. Hell, J. G. van & Dijkstra, T. (2002). “Foreign language knowledge can influence native language performance in exclusively native contexts.” In: Psychonomic Bulletin & Review 9 (4), 780-89. Herdina, P. & Jessner, U. (2002). A Dynamic Model of Multilingualism: Perspectives of Change in Psycholinguistics. Clevedon: Multilingual Matters Ltd. Hiller-Foti. I. (1985). “Erhebung über den Verlust der Muttersprache deutscher Immigranten in Sizilien.” In: rassegna italiana di linguistica applicata 17/1, 107-10 Hilton, H. (2007). “The ‘pausological’ interface between language knowledge and production skill.” (Paper presented at EuroSLA 17, Newcastle, England, 11-14 September 2007.) Huffines, M. L. (1991). “Pennsylvania German: convergence and change as strategies of discourse.” In: H. W. Seliger & R. M. Vago (eds.). First language attrition. Cambridge: CUP. (p.125-37) Hutz, M. (2004). “Is there a natural process of decay? A longitudinal study of language attrition. In: M. S. Schmid, B. Köpke, M. Keijzer & L. Weilemar (eds.). First Language Attrition. Interdisciplinary perspectives on methodological issues. Amsterdam / Philadelphia: John Benjamins. (p.189-206) Hyltenstam, K. & Obler, L. K. (1989). “Bilingualism across the lifespan: an introduction.” In: K. Hyltenstam & L. K. Obler (eds.). Bilingualism across the lifespan. Aspects of acquisition, maturity, and loss. Cambridge: CUP. (p.1-12)

207
Hyltenstam, K. & Viberg, Å. (1993). “Linguistic progression and regression: an introduction.” In: K. Hyltenstam & Å. Viberg (eds.). Progression & regression in language. Sociocultural, neuropsychological & linguistic perspectives. Cambridge: CUP. (p.3-36) Inbar, O. (2001). “Native and Non-Native English Teachers: Investigation of the Construct and Perceptions.” http://www.tau.ac.il/education/toar3/etakzir2001-4.doc Jarvis, Scott. (2006). “Examining the Properties of Lexical Diversity through Quantitative and Qualitative Means.” (Paper presented at the 16th Sociolinguistics Symposium, Limerick, Ireland, 6-8 July 2006.) Jaspaert, K., Kroon, S. & Hout, R. van. (1986). “Points of Reference in First-Language Loss Research.” In: B. Weltens, K. de Bot & T. van Els (eds.). Language Attrition in Progress. Dordrecht: Foris Publications. (p.37-49) Jaspaert, K. & Kroon, S. (1989). “Social determinants of language loss.” In: Review of Applied Linguistics 83-84, 75-98. Jordens, P., Bot, K. de, Os, C. van & Schumans, J. (1986). “Regression in German Case Marking.” In: B. Weltens, K. de Bot & T. van Els (eds.). Language Attrition in Progress. Dordrecht: Foris Publications. (p.159-76) Kaufman, D. (2001). “Tales of L1 attrition – Evidence from pre-puberty children.” In: T. Ammerlaan, M. Hulsen, H. Strating, & K. Yağmur (eds.). Sociolinguistic and psycholinguistic perspectives on maintenance and loss of minority languages. Münster / New York: Waxmann. (p.185-202) Keijzer, M. (2007). Last in first out? An investigation of the regression hypothesis in Dutch emigrants in Anglophone Canada. Doctoral Dissertation. Utrecht: LOT. Kellerman, E. (1989). “The imperfect conditional.” In: K. Hyltenstam & L. K. Obler (eds.). Bilingualism across the lifespan. Aspects of acquisition, maturity, and loss. Cambridge: CUP. (p.87-115) Kerswill, P. (2000). “Mobility, meritocracy and dialect levelling: the fading (and phasing) out of Received Pronunciation.” In: P. Rajamäe & K. Vogelberg (eds.). British studies in the new millennium: the challenge of the grassroots. Tartu: University of Tartu. (p.45-58) Kerswill, P. (2003). “Dialect levelling and geographical diffusion in British English.” In: D. Britain & J. Cheshire (eds.). Social dialectology. In honour of Peter Trudgill. Amsterdam: Benjamins. (p.223-43) Köpke, B. & Nespoulous, J-L. (2001). “First language attrition in production skills and metalinguistic abilities in German-English and German-French bilinguals.” In: T. Ammerlaan, M. Hulsen, H. Strating, & K. Yağmur (eds.). Sociolinguistic and psycholinguistic perspectives on maintenance and loss of minority languages. Münster / New York: Waxmann. (p.221-234)

208
Köpke, B. (2002). “Activation thresholds and non-pathological first language attrition.” In: F. Fabbro (ed.). Advances in the Neurolinguistics of Bilingualism. Udine: Forum. (p.119-42) Köpke, B. (2004). “Neurolinguistic aspects of attrition.” In: Journal of Neurolinguistics 17, 3-30. Köpke, B. & Schmid, M. S. (2004). “Language attrition. The next phase.” In: M. S. Schmid, B. Köpke, M. Keijzer & L. Weilemar (eds.). First Language Attrition. Interdisciplinary perspectives on methodological issues. Amsterdam / Philadelphia: John Benjamins. (p.1-43) Köpke, B. (2007). “Language attrition at the crossroads of brain, mind, and society.” In: B. Köpke, M. S. Schmid, M. Keijzer & S. Dostert (eds.). Language Attrition. Theoretical perspectives. Amsterdam / Philadelphia: John Benjamins. (p.9-37) Latomaa, S. (1998). “English in contact with “the most difficult language in the world”: the linguistic situation of Americans living in Finland.” In: International Journal of the Society of Language 133, 51-71. Laufer, B. (2003). “The Influence of L2 on L1 Collocational Knowledge and on L1 Lexical Diversity in Free Written Expression.” In: V. Cook (ed.). Effects of the Second Language on the First. Clevedon: Multilingual Matters. (p.19-31) Lee, J. L. (2005). “The Native Speaker: An Achievable Model?” In: Asian EFL Journal 7/2, article 9. Lenneberg, E. H. (1967). Biological foundations of language. Wiley: New York. Levy, B. J., McVeigh, N. D., Marful, A. & Anderson, M. C. (2007). “Inhibiting Your Native Language. The Role of Retrieval-Induced Forgetting During Second-Language Acquisition.” In: Psychological Science 18 (1), 29-34. Lowie, W. (2005). “Exploring a second language. The discovery of morphological productivity.” In: EUROSLA Yearbook 5, 251-68. Macevichius, J. (2001). “The beginnings of language loss in discourse: A case study of referentiality in American Lithuanian.” In: T. Ammerlaan, M. Hulsen, H. Strating, & K. Yağmur (eds.). Sociolinguistic and psycholinguistic perspectives on maintenance and loss of minority languages. Münster / New York: Waxmann. (p.235-247) MacWhinney, B. (2000). “The CHILDES Project: Tools for Analyzing Talk. Part 1: The CHAT Transcription Format. Part 2: The CLAN Programs. 3rd edition.” Mahwah, N.J.: Lawrence Erlbaum Associates. http://childes.psy.cmu.edu/ Maher, J. C. (2001). “The unbearable lightness of being a native speaker.” In: C. Elder et al. (eds.). Experimenting with uncertainty: language testing essays in honour of Alan Davies. Cambridge: CUP. (p.292-303)

209
Major, R. C. (1992). “Losing English as a First Language.” In: The Modern Language Journal 76, 190-208. Major, R. C. (1993). “Sociolinguistic factors in loss and acquisition of phonology.” In: K. Hyltenstam & Å. Viberg (eds.). Progression & regression in language. Sociocultural, neuropsychological & linguistic perspectives. Cambridge: CUP. (p.463-78) Major, R. (2002). “The Phonology of the L2 User.” In: V. Cook (ed.). Portraits of the L2 User. Clevedon: Multilingual Matters. (p.67-92) Meara, P. (2004). “Modelling Vocabulary Loss.” In: Applied Linguistics 25/2, 137-55. Mechelli, A. et al. (2004). “Structural plasticity in the bilingual brain.” In: Nature 431, 757. Medgyes, P. (1999). The non-native teacher. Ismaning: Hueber Verlag. Mills, J. (2004). “Mothers and Mother Tongue: Perspectives on Self-construction by Mothers of Pakistani Heritage.” In: A. Pavlenko & A. Blackledge (eds.). Negotiation of Identities in Multilingual Contexts. Clevedon: Multilingual Matters. (p.161-91) Mufwene, S. S. (1998). “Native Speaker, Proficient Speaker and Norms.” In: R. Singh (ed.). The Native Speaker: Multilingual Perspectives. New Delhi: Sage Publications. (p.111-23) Neath, I. & Surprenant, A. M. (20032). Human Memory. An Introduction to Research, Data, and Theory. Belmont, USA: Wadsworth / Thomson Learning. Neisser, U. (1984). “Interpreting Harry Bahrick’s Discovery: What Confers Immunity Against Forgetting?” In: Journal of Experimental Psychology: General 113, 32-5. Obler, L. K. (1982). “Neurolinguistic aspects of language loss as they pertain to second language attrition.” In: R. D. Lambert & B. F. Freed (eds.). The Loss of Language Skills. Rowley: Newbury House. (p.60-79) Obler, L. K. & Mahecha, N. R. (1991). “First language loss in bilingual and polyglot aphasics.” In: H. W. Seliger & R. M. Vago (eds.). First language attrition. Cambridge: CUP. (p.53-65) Obler, L. K. (1993). “Neurolinguistic aspects of second language development and attrition.” In: K. Hyltenstam & Å. Viberg (eds.). Progression & regression in language. Sociocultural, neuropsychological & linguistic perspectives. Cambridge: CUP. (p.178-95) Olshtain, E. (1986). “The Attrition of English as a Second Language with Speakers of Hebrew.” In: B. Weltens, K. de Bot & T. van Els (eds.). Language Attrition in Progress. Dordrecht: Foris Publications. (p.187-204)

210
Olshtain, E. & Barzilay, M. (1991). “Lexical retrieval difficulties in adult language attrition.” In: H. W. Seliger & R. M. Vago (eds.). First language attrition. Cambridge: CUP. (p.139-50) Oxford, R. L. (1982). “Technical Issues in Designing and Conducting Research on Language Skill Attrition.” In: R. D. Lambert & B. F. Freed (eds.). The Loss of Language Skills. Rowley: Newbury House. (p.119-137) Paikeday, T. M. (1985). The native speaker is dead! Toronto / New York: Paikeday Publishing. Paradis, M. (1985). “On the Representation of Two Languages in One Brain.” In: Language Sciences 7/2, 1-39. Paradis, M. (1993). “Linguistic, psycholinguistic, and neurolinguistic aspects of “interference” in bilingual speakers: The Activation Threshold Hypothesis.” In: International Journal of Psycholinguistics 9/2, 133-45. Paradis, M. (1998). “Neurolinguistic Aspects of the Native Speaker.” In: R. Singh (ed.). The Native Speaker: Multilingual Perspectives. New Delhi: Sage Publications. (p.205-19) Paradis, M. (2004). A Neurolinguistic Theory of Bilingualism. Amsterdam: John Benjamins. Paradis, M. (2007). “L1 attrition features predicted by a neurolinguistic theory of bilingualism.” In: B. Köpke, M. S. Schmid, M. Keijzer & S. Dostert (eds.). Language Attrition. Theoretical perspectives. Amsterdam / Philadelphia: John Benjamins. (p.121-33) Pavlenko, A. (2006). “Bilingual Selves.” In: A. Pavlenko (ed.). Bilingual Minds. Emotional Experience, Expression and Representation. Clevedon: Multilingual Matters Ltd. (p.1-33) Perdue, C. (1993). Adult Language Acquisition. Vol. 1: Field Methods. Cambridge: CUP. Phillipson, R. (1992). “ELT: the native speaker’s burden?” In: ELT Journal 46/1, 12-18. Piller, I. (2002). “Passing for a native speaker: Identity and success in second language learning.” In: Journal of Sociolinguistics 6/2, 179-206. Pishwa, H. (2006). “Memory and Language: Introduction.” In: H. Pishwa (ed.). Language and Memory. Aspects of Knowledge Representation. Berlin / N.Y.: Mouton de Gruyter. (p.1-34) Porte, G. (1999). “English as a forgotten language.” In: ELT Journal 53/1, 28-35.

211
Porte, G. K. (2002). Appraising Research in Second Language Learning. A practical approach to critical analysis of quantitative research. Amsterdam / Philadelphia: John Benjamins. Porte, G. (2003). “English from a Distance: Code-mixing and Blending in the L1 Output of Long-Term Resident Overseas EFL Teachers.” In: V. Cook (ed.). Effects of the Second Language on the First. Clevedon: Multilingual Matters. (p.103-119) Preston, D. R. (1982). “How to lose a language.” In: The Interlanguage studies bulletin: ISB on naturalistic and guided second language learning 6, 64-87 Raatz, U. & Klein-Braley, C. (1981). “The C-Test – a modification of the cloze procedure.” In: T. Culhane, C. Klein-Braley & D.K. Stevenson (eds.). Practice and problems in language testing. Essex: University of Essex Occasional Papers. (p.113-148). Raatz, U. & Klein-Braley, C. (1982). Introduction to language testing and C-tests. www.uni-duisburg.de/FB3/ANGLING/FORSCHUNG/HOWTODO.HTM Rampton, M. B. H. (1990). “Displacing the ‘native speaker’: expertise, affiliation, and inheritance.” In: ELT Journal 44/2, 97-101. Robinson, W. H. (1978). Inventions. 2nd edition. London: Duckworth. Robinson, W. P. (2003). Language in Social Worlds. Oxford / Malden: Blackwell. Rosch, E. (1973) “Natural categories.” In: Cognitive Psychology 4, 328-350. Rux, J. (2007). „Lektor/innen: Lohnsklaven der Wissenschaft.“ www.gew-bw.de/Lektorinnen_Lohnsklaven_der_Wissenschaft.html Ryan, E. B. (1979). “Why do Low-prestige Language Varieties Persist?” In: H. Giles & R. N. St. Clair (eds.). Language and Social Psychology. Oxford: Blackwell. (p.145-57) Ryle, G. (1973 [1949)]. The Concept of Mind. Harmondsworth: Penguin. Sachdev, I. & Bourhis, R. (1990). “Bilinguality and Multilinguality.” In: H. Giles & W. P. Robinson (eds.). Handbook of Language and Social Psychology. Chichester / New York: John Wiley & Sons. (p.293-308) Sachdev, I. & Bourhis, R. Y. (2001). “Multilingual Communication.” In: W. P. Robinson & H. Giles (eds.). The New Handbook of Language and Social Psychology. Chichester / New York: John Wiley & Sons. (p.407-28) Schmid, M. S. (2001). “Language use and language loss of German-Jewish refugees.” In: T. Ammerlaan, M. Hulsen, H. Strating, & K. Yağmur (eds.). Sociolinguistic and psycholinguistic perspectives on maintenance and loss of minority languages. Münster / New York: Waxmann. (p.267-279)

212
Schmid, M. S. (2002). First Language Attrition, Use and Maintenance: The case of German Jews in Anglophone countries. Amsterdam: John Benjamins. Schmid, M. S. (2004a). “Language attrition research. An annotated bibliography.” In: M. S. Schmid, B. Köpke, M. Keijzer & L. Weilemar (eds.). First Language Attrition. Interdisciplinary perspectives on methodological issues. Amsterdam / Philadelphia: John Benjamins. (p.317-48) Schmid, M. S. (2004b). “A new blueprint for language attrition research.” In: M. S. Schmid, B. Köpke, M. Keijzer & L. Weilemar (eds.). First Language Attrition. Interdisciplinary perspectives on methodological issues. Amsterdam / Philadelphia: John Benjamins. (p.349-63) Schmid, M. S. (2005). The language attrition test battery. A research manual. (Unpublished manuscript) Schmid, M. S. (2007). “The role of L1 use for L1 attrition.” In: B. Köpke, M. S. Schmid, M. Keijzer & S. Dostert (eds.). Language Attrition. Theoretical perspectives. Amsterdam / Philadelphia: John Benjamins. (p.135-53) Schmid, M. S. (2009). “Disfluency markers in L1 attrition.” (submitted) Seliger, H. (1989). “Deterioration and creativity in childhood bilingualism.” In: K. Hyltenstam & L. K. Obler (eds.). Bilingualism across the lifespan. Aspects of acquisition, maturity, and loss. Cambridge: CUP. (p.173-84) Seliger, H. W. (1991). “Language attrition, reduced redundancy, and creativity.” In: H. W. Seliger & R. M. Vago (eds.). First language attrition. Cambridge: CUP. (p.227-40) Seliger, H. W. & Vago, R. M. (1991). “The study of first language attrition: an overview.” In: H. W. Seliger & R. M. Vago (eds.). First language attrition. Cambridge: CUP. (p.3-15) Sharwood Smith, M. (1983a). “On first language loss in the second language acquirer: Problems of transfer.” In: S. M. Gass & L. Selinker (eds.). Language Transfer in Language Learning. Rowley: Newbury House. (p.222-31) Sharwood Smith, M. (1983b). “On explaining language loss.” In. S. W. Felix & H. Wode (eds.). Language development at the crossroads. Tübingen: Narr. (p.49-59) Sharwood Smith, M. A. (1989). “Crosslinguistic influence in language loss.” In: K. Hyltenstam & L. K. Obler (eds.). Bilingualism across the lifespan. Aspects of acquisition, maturity, and loss. Cambridge: CUP. (p.185-201) Sharwood Smith, M. & Buren, P. van (1991). “First language attrition and the parameter setting model.” In: H. W. Seliger & R. M. Vago (eds.). First language attrition. Cambridge: CUP. (p.17-30)

213
Shepard, C. A., Giles, H. & Le Poire, B. (2001). “Communication Accommodation Theory.” In: W. P. Robinson & H. Giles (eds.). The New Handbook of Language and Social Psychology. Chichester / New York: John Wiley & Sons. (p.33-56) Singh, U. N. (1998). “Introduction by the Series Editor.” In: R. Singh (ed.). The Native Speaker: Multilingual Perspectives. New Delhi: Sage Publications. (p.11-25) Singleton, D. M. & Ryan, L. (20042). Language Acquisition: The Age Factor. Clevedon: Multilingual Matters. Sollid, H. (2007). “The significance of mother tongue.” (Paper presented at Northern Encounters, Tromsø, August 2007). http://uit.no/getfile.php?PageId=167&FileId=135 Søndergaard, B. (1996). “Language maintenance, code mixing, and language attrition – some observations.” In: Nowele: North-Western European Language Evolution 28/29, 535-55. Sorace, A. (2000). “Differential Effects of Attrition in the L1 Syntax of Near-native L2 speakers.” In: BUCLD 24 Proceedings, 719-25. Sorace, A. (2003). “Near-Nativeness.” In: C. J. Doughty & M. H. Long (eds.). The Handbook of Second Language Acquisition. Malden / Oxford: Blackwell. (p.130-51) Strieker, L. J. (2002). The Performance of Native Speakers of English and ESL Speakers on the Computer-Based TOEFL and GRE General Test. Princeton, NJ: Educational Testing Service, Research Report 69. Thelen, M. (2005). “Translating into English as a Non-Native Language: The Dutch Connection.” In: G. Anderman & M. Rogers (eds.). In: In and Out of English: For Better, For Worse? Clevedon: Multilingual Matters. (p.242-55) Trudgill, P. (1986). Dialects in contact. Oxford: Blackwell. Tsimpli, I., Sorace, A., Heycock, C. & Filiaci, F. (2004). “First language attrition and syntactic subjects: A study of Greek and Italian near-native speakers of English.” In: International Journal of Bilingualism. Special issue on language attrition, 8:3, 257-77. Tsimpli, I. M. (2007). “First language attrition from a minimalist perspective. Interface vulnerability and processing effects.” In: B. Köpke, M. S. Schmid, M. Keijzer & S. Dostert (eds.). Language Attrition. Theoretical perspectives. Amsterdam / Philadelphia: John Benjamins. (p.83-98) Turner, R. (1997/2004). “Who is a native speaker and what is it they speak?” http://neptune.spaceports.com/~words/native.html Ullman, M. T. (2005). “A Cognitive Neuroscience Perspective on Second Language Acquisition: The Declarative/Procedural Model.” In: C. Sanz (ed.). Mind and Context in Adult Second Language Acquisition: Methods, Theory and Practice. Washington, DC: Georgetown University Press. (p.141-78)

214
Vago, R. M. (1991). “Paradigmatic regularity in first language attrition.” In: H. W. Seliger & R. M. Vago (eds.). First language attrition. Cambridge: CUP. (p.241-51) Vanlancker-Sidtis, D. (2003). “Auditory recognition of idioms by native and nonnative speakers of English: It takes one to know one.” In: Applied Psycholinguistics 24, 45-57. Viberg, Å. (1993). “Crosslinguistic perspectives on lexical organization and lexical progression.” In: K. Hyltenstam & Å. Viberg (eds.). Progression & regression in language. Sociocultural, neuropsychological & linguistic perspectives. Cambridge: CUP. (p.340-85) Waas, M. (1997). “First Language Loss: Reflex Responses, Repartee and Sound Symbolism.” In: Language Problems and Language Planning 21 (2), 119-33. Wehmeier, S., McIntosh, C., Turnbull, J. & Ashby, M. (eds.). (20057). Oxford Advanced Learner’s Dictionary of Current English. Oxford: OUP. Wei, L. (2000). “Dimensions of bilingualism.” In: L. Wei (ed.). The Bilingualism Reader. London / New York: Routledge. (p.3-25) Weinreich, U. (1974) [1953]. Languages in Contact. Findings and Problems. The Hague / Paris: Mouton. Weltens, B. & Els, T. van. (1986). “The Attrition of French as a Foreign Language: Interim Results.” In: In: B. Weltens, K. de Bot & T. van Els (eds.). Language Attrition in Progress. Dordrecht: Foris Publications. (p.205-21) Weltens, B. (1989). The Attrition of French as a Foreign Language. Dordrecht: Foris Publications. Yoshitomi, A. (1992). “Towards a Model of Language attrition: Neurobiological and Psychological Contributions.” In: Issues in Applied Linguistics 3 (2), 293-318. Online sources (with no specific author mentioned): www.sfn.org/index.cfm?pagename=brainBriefings_brainPlasticityLanguageProcessingAndReading (July 2000, accessed March 2008, Society for Neuroscience) www.afsnet.org/aboutfolklore/aboutFL.cfm (accessed April 2008, American Folklore Society) http://clas.cudenver.edu/lasso/swjl/96abstracts.html (accessed April 2008, Southwest Journal of Linguistics) www.spiegel.de/schulspiegel/wissen/0,1518,544335,00.html (April 1, 2008, Spiegel online, interview with the Viennese(?) linguist Barbara Seidlhofer)

215
http://www.englishforums.com/English/WouldDefineNativeSpeakerEnglish/xwmc/post.htm (accessed May 2008, English Forums) www.guardianweekly.co.uk/?page=editorial&id=426/catID=18 (from Dec. 5, 2007, article by John Hughes) http://americannationalcorpus.org/native-speaker.html “Who is a Native Speaker of American English?” American National Corpus (ANC) (accessed 15.4.08) http://www.telegraph.co.uk/global/main.jhtml?xml=/global/2007/01/19/expatvienna1.xml “Austrians pay a premium for native English speakers” (from 19.1.2007) (accessed 15.4.08) http://www.alte.org/cando/index.php (accessed March 2009)

216
5. Appendix

217
5.a. Information about the participants Pseudonym (alphabetical order by gp.)
Group Sex LOR in
years
Age at testing
Age at emigration
Level of education
No. of L2s
spoken
NS rating
Alice attr f 24 57 33 0 2 93 Alison attr f 39 57 18 1 8 39 Amanda attr f 28 51 23 1 6 46 Barbara attr f 36 57 21 1 2 34 Caroline attr f 16 61 45 0 3 76 Claire attr f 29 50 21 0 2 46 Dawn attr f 24 53 29 1 3 54 Donald attr m 34 61 27 0 1 37 Edward attr m 33 55 22 1 3 42 Harriet attr f 31 55 24 1 2 59 Howard attr m 25 62 37 1 1 85 Iris attr f 29 55 26 1 7 93 Janet attr f 11 34 23 1 2 66 Jeremy attr m 11 36 25 0 2 66 Karen attr f 24 46 22 1 2 61 Lewis attr m 6 36 30 1 3 59 Linda attr f 36 55 19 0 4 29 Malcolm attr m 14 42 28 0 1 54 Norma attr f 27 57 30 1 5 76 Patrick attr m 31 58 27 1 2 56 Paula attr f 31 59 28 1 5 44 Rachel attr f 17 45 28 0 2 73 Ray attr m 23 53 30 1 2 90 Rita attr f 37 55 18 0 3 46 Yvonne attr f 31 58 27 1 2 61 Amy L1 cg f n/a 35 n/a 1 3 94 Anna L1 cg f n/a 42 n/a 0 1 93 Charles L1 cg m n/a 42 n/a 1 1 96 Donna L1 cg f n/a 46 n/a 0 3 95 Esther L1 cg f n/a 30 n/a 1 2 92 Faith L1 cg f n/a 34 n/a 0 0 94 Frances L1 cg f n/a 36 n/a 1 2 87 Ian L1 cg m n/a 38 n/a 1 3 93 Jack L1 cg m n/a 50 n/a 1 2 98 Judith L1 cg f n/a 56 n/a 1 6 93 Keith L1 cg m n/a 50 n/a 0 0 93 Larry L1 cg m n/a 45 n/a 0 1 96 Martin L1 cg m n/a 47 n/a 1 2 98 Nancy L1 cg f n/a 59 n/a 0 0 95 Owen L1 cg m n/a 55 n/a 0 2 90 Richard L1 cg m n/a 38 n/a 1 1 85 Stuart L1 cg m n/a 32 n/a 1 0 98 Tess L1 cg f n/a 36 n/a 1 1 93 Wendy L1 cg f n/a 41 n/a 1 2 98

218
Pseudonym (alphabetical order by gp.)
Group Sex LOR in
years
Age at testing
Age at emigration
Level of education
No. of L2s
spoken
NS rating
Zoe L1 cg f n/a 48 n/a 1 1 95 Andreas Ger cg m n/a 27 n/a 1 2 n/a Anke Ger cg f n/a 36 n/a 1 3 n/a Birte Ger cg f n/a 27 n/a 1 5 n/a Denise Ger cg f n/a 32 n/a 1 4 n/a Franziska Ger cg f n/a 34 n/a 1 4 n/a Ilona Ger cg f n/a 30 n/a 1 1 n/a Ingo Ger cg m n/a 28 n/a 1 2 n/a Julia Ger cg f n/a 38 n/a 1 5 n/a Julian Ger cg m n/a 29 n/a 1 3 n/a Laura Ger cg f n/a 39 n/a 1 2 n/a Maria Ger cg f n/a 35 n/a 1 5 n/a Natalie Ger cg f n/a 25 n/a 1 2 n/a Oliver Ger cg m n/a 31 n/a 1 5 n/a Petra Ger cg f n/a 43 n/a 1 3 n/a Renate Ger cg f n/a 32 n/a 1 5 n/a Rolf Ger cg m n/a 44 n/a 1 3 n/a Sabine Ger cg f n/a 28 n/a 1 4 n/a Simone Ger cg f n/a 50 n/a 1 4 n/a Stefan Ger cg m n/a 30 n/a 1 4 n/a

219
5.b. General background questionnaire for attrition group in English Personal background questionnaire
With this questionnaire I would like to get an impression of the personal background of British people in Germany. It consists of 50 items. Some of these simply require putting one (or more) cross(es) (x) in the appropriate box(es), others require you to write something. It is important to note that not all items may apply to you personally. Should you think that a certain item does not apply to you (for example when asked about your children if you don’t have any children), please ignore that particular question and move on to the next. It is important that you answer the questions on your own, because I am interested in your background. If you don’t understand a certain question, please don’t hesitate to contact me. There are no right or wrong answers and you can answer in English or German! You can either complete the questionnaire on your computer, save it (as a word document) and send it back to me as an email attachment (please do not simply include it in the main body of your mail), or print it, complete it by hand and send it back to me by fax / normal (snail) mail. My address is: Susan Dostert Anglistik 3 Heinrich-Heine Universität Universitätsstr. 1 40225 Düsseldorf Tel.: 0211-8113774 Fax: 0211-8115649 Email: [email protected] ALL THE INFORMATION PROVIDED WILL BE TREATED AS STRICTLY CONFIDENTIAL TO ENSURE YOUR PRIVACY. YOUR NAME AND ADDRESS ETC. ARE ONLY REQUIRED SO THAT I CAN CONTACT YOU LATER. Name Address
Tel. no(s). Email
1. What is your date of birth? 19 2. What is your sex? male female 3. Where were you born? Village / Town: County: Country:

220
4. Where do your parents come from? (e.g. Bristol, UK) mother:
father:
5. What nationality (or nationalities) do you have? 6. What is your current marital status? married / living together unmarried separated / divorced widowed single 7. Do you have children? (This includes step-children etc.) no yes, they are (years old):
8. Do you have grandchildren? (Again, this also includes step-grandchildren etc.) no yes, they are (years old):
9. Do any of your children / grandchildren (still) live in your household? yes, permanently (please state their age(s)):
yes, occasionally (please state their age(s) and for what period of time they live with
you):
no 10. Did / do you encourage your child(ren) to speak English? yes, occasionally no, never yes, often

221
11. Which language(s) do you mostly use with your children and grandchildren? (Please state ages)
only English both English and
German, but mostly English
both English and
German, without
preference
both English and
German, but mostly
German
only German
Child no. 1:
Child no. 2:
Child no. 3:
Child no. 4:
Grandchild no. 1:
Grandchild no. 2:
Grandchild no. 3:
Grandchild no. 4:
Grandchild no. 5:
Grandchild no. 6:
Grandchild no. 7:
Grandchild no. 8:
12. What is the highest level of education you completed in the UK? secondary school without formal qualifications i.e. “O”-levels, GCSEs etc. secondary school with formal qualifications university, degree other, namely:
13. Have you pursued further education while living in Germany? (This does not have to be
language-related.) yes, namely:
for the period of:
no

222
14. What language(s) did you acquire before starting school? only English English and (an)other language(s), namely:
15. Would you say that you spoke a standard variety of English while you lived in the UK or a
dialect? standard English a dialect, namely: 16. Did you learn German before coming to Germany? no yes, professionally or at school, for the period of: yes, outside an educational environment (i.e. outside of school or work), for the period of:
17. What other language(s) (if any) have you learnt? professionally or at school:
outside an educational environment (i.e. outside of school or work):
18. What is your current profession? If you are retired or no longer working for other reasons, could
you please indicate your last profession before retirement etc.? 19. If you have had several professions, could you please indicate each of them in chronological
order (beginning with the first and stating roughly how long you worked in each position). 20. When did you emigrate to Germany (year)? 19 21. Apart from Germany, have you ever lived in a country other than the UK for a longer period of
time (i.e. more than 6 months)? no

223
yes, in: for the period of:
22. Have you been back to the UK since leaving (for Germany)? no, never yes, but only occasionally yes, regularly – about time(s) per year
23. If you indicated that you have been back to the UK, could you please give the reason or reasons for such a visit. (You may check more than one box here.)
because of important family matters (such as a wedding or a funeral) to visit friends and relatives for other reasons, namely:
24. Do you ever get homesick in the sense of missing the UK? no yes – what I then miss most is / are:
25. Do you keep in touch with friends and relatives in the UK? all the time quite often regularly sometimes very rarely 26. How do you keep in touch with these people? telephone letters email other, namely:
27. Which language(s) do you mostly use to keep in touch with them? only English both English and German, but mostly English both English and German, without preference

224
both English and German, but mostly German only German 28. Do you generally feel more comfortable speaking English or German? no preference English German 29. Could you elaborate on your answer: why do you feel more comfortable speaking either English
or German or why do you have no preference? 30. How often do you speak English? daily weekly monthly a few times a year other, namely:
31. Do you think you use more or less English since you moved to Germany? no, I don’t think I use more or less English now I think I use less English I think I use more English 32. Do you have more English- or German-speaking friends in Germany? only English-speaking friends both, but more English-speaking friends as many English- as German-speaking friends both, but more German-speaking friends only German-speaking friends 33. In general, how would you rate your German language proficiency before you moved to
Germany? very good good ok fairly poor

225
very poor 34. In general, how would you rate your German now? very poor fairly poor ok good very good
35. Which language(s) did / do you mostly use with your (ex-)partner? when you talk to him / her
when he / she talks to you
only English both English and German, but mostly English both English and German, without preference both English and German, but mostly German only German 36. With which language(s) was your (ex-)partner brought up? German English other, namely: 37. When did your (ex-)partner come to Germany? he / she was born here he / she came here in 19 38. What is the current profession of your (ex-)partner? If he / she is retired, or no longer working
for other reasons, could you please indicate what his / her last profession before retirement was.
39. Have you (in the past) lived or are you now living with a native speaker of either English or
German? (You may check more than one box here as appropriate.) yes, I am now living with a native speaker of English, and have been since:
yes, I have lived with a native speaker of English, and did for (period):
yes, I am now living with a native speaker of German, and have been since:

226
yes, I have lived with a native speaker of German, and did for (period):
I am now living (or have lived) with a native speaker of another language, namely:
since / for (period):
I have always lived alone 40. Do you ever go to church in Germany? no, never yes, occasionally yes, regularly
41. If you said you do go to church, could you please indicate in which language(s) the services are held?
42. Do you ever listen to / watch English radio or TV programmes? no yes I would love to, but can’t get them 43. Do you ever read English newspapers, books or magazines? no yes 44. If you indicated that you never listen to / watch English radio or TV programmes, and / or never
read English newspapers, books or magazines, could you state why you think that is?

227
45. In the following table I would ask you to please give me some information about those (max. 12) people (family, friends, colleagues, etc.) with whom you have most contact. These people can live in the UK, Germany or elsewhere. You don’t have to state the name of the person if you do not wish to. I would ask you, however, to provide the rest of the information. One person has been given as an example.
Name (optional)
Where does this person live?
What language(s) do you use when communicating with each other?
How did you meet this person?
How long have you known this person?
What is your relationship with this person?
Andrew Mönchenglad-bach, Germany
English at school 35 years friends

228
46. Could you, in the following tables, please indicate to what extent you use English (table 1) and German (table 2) in the domains mentioned. You may simply put a cross in the box. If a certain domain is not applicable to you (for example, if you don’t have pets), you may leave the box empty.
I speak English All the time Quite often Regularly Sometimes Very rarely With relatives With friends To pets At work In church In shops At clubs or organisations
Other, namely:
I speak German All the time Quite often Regularly Sometimes Very rarely With relatives With friends To pets At work In church In shops At clubs or organisations
Other, namely:
47. Did / do you need English at work? (If yes, please state what you need(ed) it for.) no yes, namely:

229
48. Which language or languages did / do you mostly use with your colleagues etc. (i.e. at work)? when you talk to them
when they talk to you
only English both English and German, but mostly English both English and German, without preference both English and German, but mostly German only German 49. Do you think your English has changed since you moved to Germany? no yes, I think it has become better yes, I think it has become worse 50. Have you ever been a member of an English club or organisation in Germany? (If yes, please
state the name of the organisation and your period of membership.) no yes, namely:
In the second and most important phase of this project, a number of volunteers will be asked to take part in a formal experiment, involving a series of language tasks and a discussion of some of the issues arising from this questionnaire. This is expected to take around 2 hours. Please indicate whether you would like to be contacted for this purpose. yes, I would like to take part in the actual language experiment no, I would not like to take part in the actual language experiment If you would like to take part in the actual language experiment, would you please indicate how you prefer to be contacted: by phone by email other, namely:
And when do you prefer to be contacted? (i.e. time of the day etc.)

230
5.c. General background questionnaire for attrition group in German Fragebogen zum persönlichen Hintergrund
Mit diesem Fragebogen möchte ich einen Eindruck über den persönlichen Hintergrund von Engländern in Deutschland bekommen. Der Fragebogen besteht aus 50 Fragen. Bei einigen müssen Sie lediglich ein Kreuz (oder mehrere) im entsprechenden Kästchen machen und bei anderen müssen Sie etwas schreiben. Es ist wichtig zu wissen, dass nicht alle Fragen unbedingt für Sie relevant sind, z.B. wenn Sie nach Ihren Kindern gefragt werden, aber keine Kinder haben. In einem solchen Fall können Sie die Frage einfach überspringen und zur Nächsten gehen. Es ist wichtig, dass Sie die Fragen allein beantworten, da ich mich für Ihren Hintergrund interessiere. Wenn Sie eine Frage nicht verstehen sollten, melden Sie sich ruhig und ich werde versuchen Ihnen zu helfen. Es gibt übrigens keine falschen Antworten und Sie können sowohl auf Deutsch als auch auf Englisch antworten! Für die Rückgabe des Fragebogens haben Sie 3 Möglichkeiten: Sie können ihn entweder am Computer ausfüllen, speichern (als Word-Dokument) und als E-Mail-Attachment (bitte nicht in der eigentlichen Mail) zurückschicken. Oder Sie drucken den Fragebogen aus und füllen ihn von Hand aus. Anschließend können Sie ihn entweder an mich zurückfaxen oder mit der normalen Post schicken. Meine Adresse usw. ist wie folgt: Susan Dostert Anglistik 3 Heinrich-Heine Universität Universitätsstr. 1 40225 Düsseldorf Tel.: 0211-8113774 Fax: 0211-8115649 Email: [email protected] SÄMTLICHE INFORMATIONEN WERDEN STRENG VERTRAULICH BEHANDELT. IHR NAME, IHRE ADRESSE USW. BENÖTIGE ICH NUR, DAMIT ICH SIE SPÄTER KONTAKTIEREN KANN. Name Adresse
Telefonnr. E-Mail
1. Ihr Geburtsdatum: 19
2. Ihr Geschlecht: männlich weiblich
3. Ihr Geburtsort: Stadt:

231
Grafschaft: Land:
4. Woher stammen Ihre Eltern? (z.B. Bristol, UK) Mutter: Vater:
5. Welche Nationalität(en) besitzen Sie?
6. Welcher ist Ihr jetziger Familienstand? verheiratet / unverheiratet zusammen lebend getrennt lebend / geschieden verwitwet ledig
7. Haben Sie Kinder (einschließlich Stiefkinder usw.) nein ja, sie sind (Jahre alt):
8. Haben Sie Enkelkinder? (einschließlich Stief-Enkelkinder usw.) nein ja, sie sind (Jahre alt):
9. Wohnen Ihre Kinder / Enkelkinder (noch) in Ihrem Haushalt? ja, ständig (bitte das Alter der Kinder angeben):
ja, gelegentlich (bitte das Alter der Kinder sowie die Zeit angeben, wann sie bei
Ihnen wohnen):
nein
10. Haben Sie Ihre Kinder ermutigt / Ermutigen Sie Ihre Kinder, englisch zu reden? ja, gelegentlich nein, niemals ja, oft

232
11. Welche Sprache(n) benutzen Sie hauptsächlich mit Ihren Kindern und Enkelkindern? (Bitte das jeweilige Alter angeben)
nur englisch englisch und deutsch,
aber meistens englisch
englisch und deutsch,
gleich viel
englisch und deutsch,
aber meistens deutsch
nur deutsch
1. Kind:
2. Kind:
3. Kind:
4. Kind:
1. Enkelkind:
2. Enkelkind:
3. Enkelkind:
4. Enkelkind:
5. Enkelkind:
6. Enkelkind:
7. Enkelkind:
8. Enkelkind:
12. Welcher ist Ihr höchster Schulabschluss aus England? „secondary school” ohne formalen Qualifikationen, d.h. ohne “O”-levels,
GCSEs usw. „secondary school“ mit formalen Qualifikationen Universität (z.B. B.A., B.Sc. usw.) andere, nämlich:
13. Haben Sie eine Fort- oder Weiterbildung in Deutschland gemacht? (Diese muss nicht sprach-bezogen sein.)
ja, nämlich: für den Zeitraum von:
nein

233
14. Welche Sprache(n) haben Sie vor Beginn der Schule erworben? nur englisch englisch und (eine) weitere Sprache(n), nämlich:
15. Während Sie noch in England lebten, haben Sie Standardenglisch gesprochen oder eher ein Dialekt?
Standardenglisch ein Dialekt, nämlich:
16. Haben Sie deutsch gelernt bevor Sie nach Deutschland kamen? nein ja, und zwar in einer Schule oder durch den Beruf, für den Zeitraum von:
ja, und zwar außerhalb der Schule oder des Berufs, für den Zeitraum von:
17. Welche weitere(n) Sprache(n) haben Sie gelernt? in einer Schule oder durch den Beruf:
außerhalb von Schule oder Beruf:
18. Welcher ist Ihr jetztiger Beruf? Wenn Sie pensioniert sind, oder aus anderen Gründen nicht mehr arbeiten, welcher war Ihr letzter Beruf?
19. Wenn Sie mehrere Berufe ausgeübt haben, geben Sie diese bitte in chronologischer Reihenfolge an, beginnen Sie mit dem Ersten und erwähnen Sie wie lange Sie in jedem Beruf gearbeitet haben.
20. Wann sind Sie nach Deutschland ausgewandert (Jahr)? 19

234
21. Außer in England und Deutschland, haben Sie jemals in einem Land längere Zeit gelebt (d.h. länger als 6 Monate)?
nein ja, und zwar in:
für den Zeitraum von:
22. Sind Sie wieder in England gewesen seitdem Sie ausgewandert sind? nein, niemals ja, aber nur gelegentlich ja, regelmäßig – ca. mal im Jahr
23. Wenn Sie angegeben haben, dass Sie wieder in England gewesen sind, geben Sie bitte hier den Grund für den Besuch an. (Sie können auch mehrere Kästchen ankreuzen.)
wegen wichtiger Familienangelegenheiten (z.B. Hochzeit oder Beerdigung)
um Freunde und Verwandte zu besuchen
aus anderen Gründen, nämlich:
24. Haben Sie manchmal Heimweh nach England? nein ja – was ich dann am meisten vermisse, ist / sind:
25. Haben Sie noch Kontakt zu Freunden und Verwandten in England? ständig häufig regelmäßig gelegentlich sehr selten
26. Wie halten Sie den Kontakt zu diesen Personen? Telefon Briefe E-Mail andere, nämlich:

235
27. Welche Sprache(n) benutzen Sie hauptsächlich für diesen Kontakt? nur englisch englisch und deutsch, aber meistens englisch english und deutsch, gleich viel englisch und deutsch, aber meistens deutsch nur deutsch
28. Fühlen Sie sich im Allgemeinen wohler wenn Sie englisch reden oder wenn Sie deutsch reden? egal englisch deutsch
29. Würden Sie bitte Ihre Antwort erläutern, d.h. warum fühlen Sie sich wohler wenn Sie englisch reden oder deutsch oder warum ist es Ihnen egal?
30. Wie oft sprechen Sie englisch? täglich jede Woche jeden Monat einige Male im Jahr andere, nämlich:
31. Benutzen Sie heute in Deutschland mehr englisch als früher oder weniger? ich glaube ich benutze gleich viel englisch ich glaube ich benutze weniger englisch ich glaube ich benutze mehr englisch
32. Haben Sie mehr englisch- oder deutschsprachige Freunde in Deutschland? nur englischsprachige Freunde beides, aber mehr englischsprachige Freunde gleich viele englisch- und deutschsprachige
Freunde beides, aber mehr deutschsprachige Freunde nur deutschsprachige Freunde
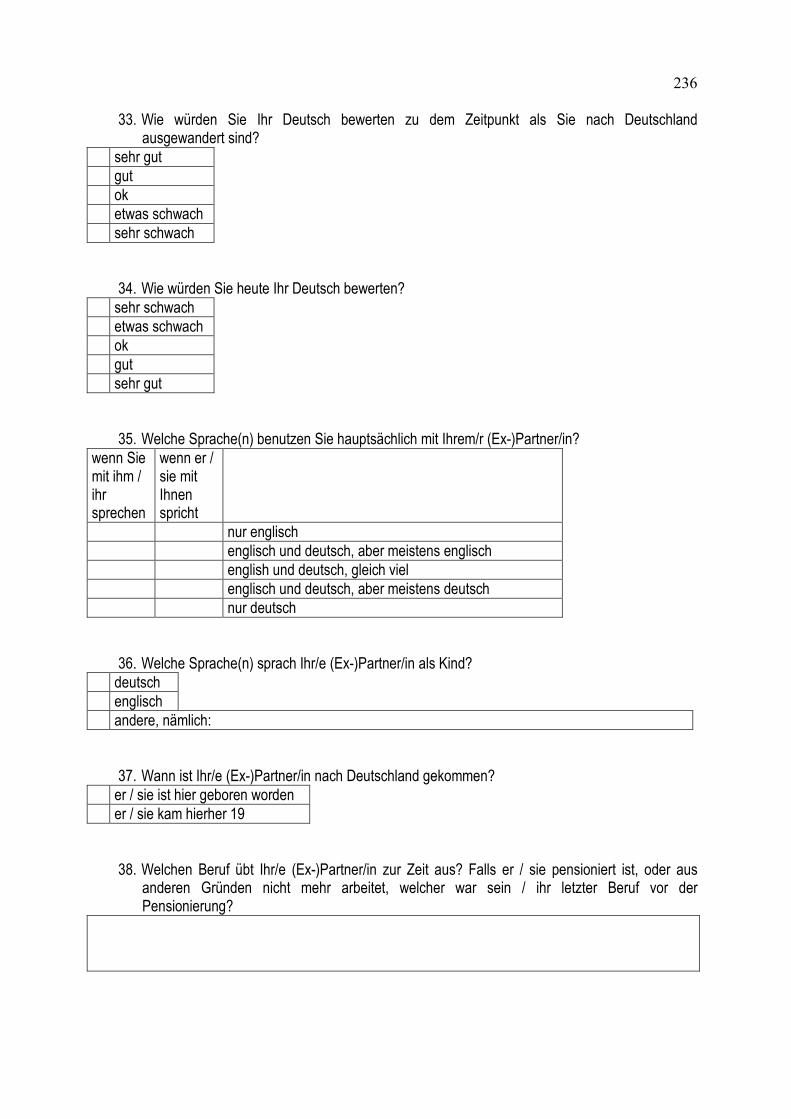
236
33. Wie würden Sie Ihr Deutsch bewerten zu dem Zeitpunkt als Sie nach Deutschland ausgewandert sind?
sehr gut gut ok etwas schwach sehr schwach
34. Wie würden Sie heute Ihr Deutsch bewerten? sehr schwach etwas schwach ok gut sehr gut
35. Welche Sprache(n) benutzen Sie hauptsächlich mit Ihrem/r (Ex-)Partner/in?
wenn Sie mit ihm / ihr sprechen
wenn er / sie mit Ihnen spricht
nur englisch englisch und deutsch, aber meistens englisch english und deutsch, gleich viel englisch und deutsch, aber meistens deutsch nur deutsch
36. Welche Sprache(n) sprach Ihr/e (Ex-)Partner/in als Kind? deutsch englisch andere, nämlich:
37. Wann ist Ihr/e (Ex-)Partner/in nach Deutschland gekommen? er / sie ist hier geboren worden er / sie kam hierher 19
38. Welchen Beruf übt Ihr/e (Ex-)Partner/in zur Zeit aus? Falls er / sie pensioniert ist, oder aus anderen Gründen nicht mehr arbeitet, welcher war sein / ihr letzter Beruf vor der Pensionierung?

237
39. Haben Sie gelebt oder leben Sie heute mit einem/r Muttersprachler/in von englisch oder deutsch zusammen? (Sie können nach Bedarf auch mehr als ein Kästchen ankreuzen.)
ja, ich lebe zur Zeit mit einem/r englischen Muttersprachler/in zusammen, und zwar seit:
ja, ich habe mit einem/r englischen Muttersprachler/in zusammen gelebt, und zwar für den Zeitraum von:
ja, ich lebe zur Zeit mit einem/r deutschen Muttersprachler/in zusammen, und zwar seit:
ja, ich habe mit einem/r deutschen Muttersprachler/in zusammen gelebt, und zwar für den Zeitraum von:
ich lebe jetzt (oder habe gelebt) mit einem/r Muttersprachler/in von einer anderen Sprache zusammen, und zwar: seit / für den Zeitraum von:
ich habe immer allein gelebt
40. Gehen Sie in Deutschland zur Kirche?
nein, niemals ja, gelegentlich ja, regelmäßig
41. Falls Sie zur Kirche gehen, in welcher/n Sprache(n) wird die Messe abgehalten?
42. Hören Sie manchmal englisches Radio oder schauen Sie englisches Fernsehen? nein ja ich würde gern, kann sie aber nicht empfangen
43. Lesen Sie manchmal englische Zeitungen, Bücher oder Zeitschriften? nein ja
44. Falls Sie gesagt haben, dass Sie niemals englisches Radio hören oder englisches Fernsehen schauen, und auch nicht englische Zeitungen, Bücher oder Zeitschriften lesen, warum glauben Sie tun Sie es nicht?

238
45. In der folgenden Tabelle werden Sie gebeten, Angaben über die (max. 12) Personen zu machen mit denen Sie am meisten Kontakt haben. Diese können Familie, Freunde, Arbeitskollegen usw. sein und in England, Deutschland oder auch woanders leben. Sie müssen keine Namen angeben, sollten aber bitte die restlichen Felder ausfüllen. Eine Person ist als Beispiel gegeben.
Name (freiwillig)
Wo wohnt diese Person?
Welche Sprache(n) benutzen Sie mit dieser Person?
Wo haben Sie sich kennen gelernt?
Wie lange kennen Sie diese Person?
Welche Beziehung haben Sie zu dieser Person?
Andrew Mönchen-gladbach, Deutschland
Englisch in der Schule 35 Jahre Freunde

239
46. In den folgenden Tabellen werden Sie gebeten, anzugeben inwieweit Sie in den genannten Domänen englisch (Tabelle 1) und deutsch (Tabelle 2) sprechen. Sie brauchen nur ein Kreuz im Kästchen zu machen. Falls eine bestimmte Domäne für Sie nicht relevant sein soll (z.B. weil Sie keine Haustiere haben), lassen Sie das Kästchen leer.
Ich spreche englisch ständig häufig regelmäßig gelegentlich sehr selten mit Verwandten mit Freunden mit Haustieren im Beruf in der Kirche in Geschäften in Clubs oder anderen Organisationen
andere, nämlich:
Ich spreche deutsch ständig häufig regelmäßig gelegentlich sehr selten mit Verwandten mit Freunden mit Haustieren im Beruf in der Kirche in Geschäften in Clubs oder anderen Organisationen
andere, nämlich:
47. Brauchten Sie oder brauchen Sie heute englisch im Ihrem Beruf? (Falls ja, geben Sie bitte an wofür Sie es benötig(t)en)
nein ja, nämlich:

240
48. Welche Sprache(n) benutzen Sie mit Ihren Kollegen (d.h. im Beruf)? wenn Sie mit den Kollegen sprechen
wenn die Kollegen mit Ihnen sprechen
nur englisch englisch und deutsch, aber meistens englisch english und deutsch, gleich viel englisch und deutsch, aber meistens deutsch nur deutsch
49. Glauben Sie, dass sich Ihr Englisch geändert hat seitdem Sie in Deutschland sind? nein ja, ich glaube es ist besser geworden ja, ich glaube es ist schlechter geworden
50. Waren Sie je oder sind Sie heute Mitglied in einem englischen Club oder einer englischen Organisation in Deutschland? (Falls ja, geben Sie bitte an, wie die Organisation heißt und wie lange Sie Mitglied waren bzw. wie lange Sie schon Mitglied sind.)
nein ja, nämlich:
In der zweiten (und wichtigsten) Phase dieses Projekts werden einige Freiwillige gebeten, an einem Sprachexperiment teilzunehmen, welches aus verschiedenen Aufgaben sowie einem kurzen Interview besteht. Insgesamt sollte das Experiment ca. 2 Stunden dauern. Würden Sie bitte unten angeben, ob Sie daran teilnehmen möchten oder nicht: ja, ich möchte an dem Experiment teilnehmen nein, ich möchte an dem Experiment nicht teilnehmen Wenn Sie teilnehmen möchten, würden Sie bitte unten angeben, wie ich Sie kontaktieren soll: telefonisch per E-Mail anders, nämlich:
Und wann soll ich Sie kontaktieren? (Uhrzeit usw.)

241
5.d. General background questionnaire for L1 control group Personal background questionnaire
Please read this information before starting: The aim of this questionnaire is to get some background information on the volunteers taking part in my research project (as a control group i.e. English speakers who have always lived in an English-speaking country). It consists of a total of 31 items, 4 of which however are optional – these are marked by the letter “a” in addition to a number e.g. 12a) is an optional question. Some of the questions simply require you to put one (or more) cross(es) (x) in the appropriate box(es), others require you to write something. If you don’t understand a certain question, please don’t hesitate to contact me. Please note that some of the questions may seem strange to you – asking you about other languages when you only speak / use English for example. This is because other groups of people involved in the project do speak other languages but I still need to ask you the same questions otherwise I can’t compare anything. You can either complete the questionnaire on your computer, save it (as a word document) and send it back to me as an e-mail attachment (please do not simply include it in the main body of your mail), or print it, complete it by hand and send it back to me by fax / normal (snail) mail. My address is: Susan Dostert Anglistik 3 Heinrich-Heine University Universitaetsstr. 1 40225 Duesseldorf Germany Tel.: 0049-211-8113774 Fax: 0049-211-8115649 Email: [email protected] ALL THE INFORMATION PROVIDED WILL BE TREATED AS STRICTLY CONFIDENTIAL TO ENSURE YOUR PRIVACY. YOUR NAME AND ADDRESS ETC. ARE ONLY REQUIRED SO THAT I CAN CONTACT YOU LATER. Name Address
Tel. no(s). Email
1. What is your date of birth? 19
2. What is your sex? male female

242
3. Where were you born? village / town: county: country:
4. Where do your parents come from? (e.g. Bristol, UK) mother:
father:
5. What nationality (or nationalities) do you have?
6. What is your current marital status? married / living together unmarried separated / divorced / widowed single
7. What is the highest level of education you have completed? secondary school without formal qualifications i.e. “O”-levels, GCSEs etc. secondary school with formal qualifications university, degree other, namely:
8. Are you presently taking any kind of further education course? no yes, namely:
9. What language(s) did you acquire before starting school? only English English and (an)other language(s), namely:
10. Would you say that you spoke a standard variety of English or a dialect? standard English

243
a dialect, namely:
11. What other language(s) (if any) have you learnt? professionally or at school:
outside an institution (i.e. outside of school or work):
12. What is your current profession? If you are retired or no longer working for other reasons, could you please indicate your last profession before retirement etc.?
12a) If you have had several professions, could you please indicate each of them in chronological
order (beginning with the first and stating roughly how long you worked in each position).
13. Have you ever lived in a country other than the UK for a longer period of time (i.e. more than 6 months)?
no yes, in (country):
when:
14. Have you ever lived with someone who is not a native speaker of English? yes no 14a) If you said you have lived (or now live) with someone who is not a native speaker of English,
could you please indicate how long you (have) lived with this person and which language(s) you spoke / speak with them?
Language(s) spoken together? Period? 1st person
Language(s) spoken together? Period? 2nd person

244
3rd person
4th person
5th person
6th person
7th person
8th person
15. Do you have any friends, family members or colleagues with whom you speak a language other than English?
no yes
15a) If you do have friends, family members or colleagues with whom you speak a language other than English, could you please indicate how often you speak which language(s)?
Language(s) spoken together? How often? 1st person
2nd person
3rd person
4th person
5th person
6th person
7th person
8th person
16. Please indicate which language has which characteristics for you (i.e. in your life / situation). (Please check at least one box for each characteristic / line.)
English Other language (please specify)
Characteristics
Language learned first (i.e. from birth / early childhood) Language learned naturally from parents etc. Language spoken (by the majority) in your country of birth

245
Language spoken in the country where you grew up Parents / other family members come from a country where this
language is spoken (by the majority) Language of the environment (i.e. outside the home) Language spoken by / with most friends Language spoken in the home Language of schooling / learning Language used most on a daily basis Language in which you think / dream most often Language to which you have the strongest emotional ties Language / country / culture with which you identity most Dominant language (i.e. language you are “best” at) Language in which you have the largest vocabulary Language in which you have no pronunciation problems Language in which you count / do maths Language which you learned to speak before you learned to write Language which you are able to understand / use intuitively Language in which you are familiar with various dialects, slang
etc. Language in which you have an intuitive feeling for “right” and
“wrong” – including grammar Language learned before puberty (i.e. 11-12 yrs)
17. How at home do you feel with English culture – or Welsh, Scottish, Irish (as appropriate)? very much quite a bit no opinion not much not at all
18. How important is the English language for you? very important important no opinion fairly unimportant very unimportant
19. How good are you at guessing a person’s social position / status when they speak English? very good good no opinion bad very bad

246
20. How good are you at guessing where someone comes from (i.e. region) when they speak English?
very good good no opinion bad very bad
21. How good are you at each of the following tasks? For each one please use the numbers 1 – 5 to indicate how well you (would) cope (in English). Please make sure you leave no gaps, but write a number in every box! 1 = I can’t do it at all 2 = I can do it, but with great difficulty 3 = I can do it, but with some difficulty 4 = I can do it fairly easily 5 = I can do it without any difficulty
In English How good are you at ... Understanding the news / current affairs programmes on TV? Understanding the majority of films on TV or at the cinema? Understanding normal, everyday conversations spoken at normal, native speed? Understanding technical, scientific programmes on TV? Reading most novels? Reading a daily newspaper? Reading and understanding an instruction booklet e.g. for a new digital camera? Reading and understanding official documents as issued e.g. by a court or local
government body? Interacting in a fluent and spontaneous conversation with friends / family? Telling and / or appreciating jokes or amusing stories? Talking and giving opinions on any contemporary topic e.g. from politics, economics? Retelling the story / plot of a film / book etc.? Actively taking part in a discussion without having to search for expressions, words
etc.? Writing personal letters to e.g. friends / family? Writing more official letters e.g. to a school, lawyer, insurance company etc.? Writing various kinds of text, selecting a style and language appropriate to the situation
and reader?
22. Do you consider yourself to be a native speaker of English or any other language(s)? Yes, of English Yes, of (an)other language(s), namely: No
23. With regard to English, has this feeling changed over time? No, I’ve always felt the same
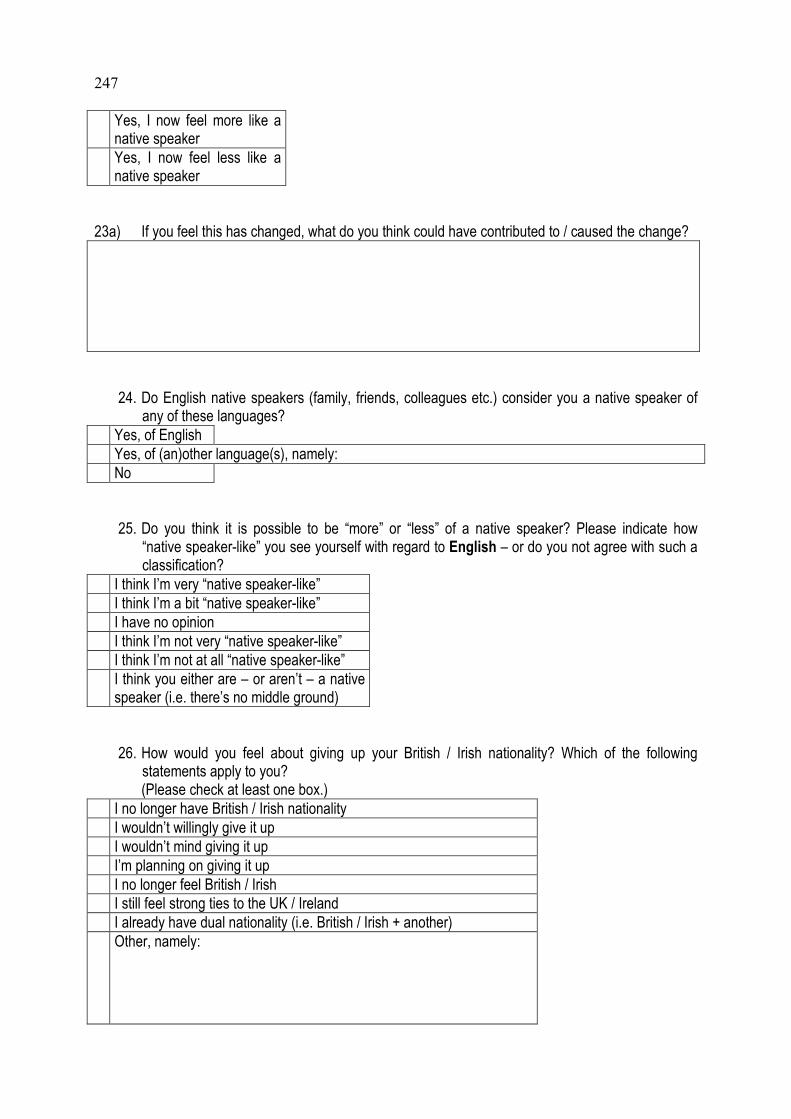
247
Yes, I now feel more like a native speaker
Yes, I now feel less like a native speaker
23a) If you feel this has changed, what do you think could have contributed to / caused the change?
24. Do English native speakers (family, friends, colleagues etc.) consider you a native speaker of any of these languages?
Yes, of English Yes, of (an)other language(s), namely: No
25. Do you think it is possible to be “more” or “less” of a native speaker? Please indicate how “native speaker-like” you see yourself with regard to English – or do you not agree with such a classification?
I think I’m very “native speaker-like” I think I’m a bit “native speaker-like” I have no opinion I think I’m not very “native speaker-like” I think I’m not at all “native speaker-like” I think you either are – or aren’t – a native
speaker (i.e. there’s no middle ground)
26. How would you feel about giving up your British / Irish nationality? Which of the following statements apply to you? (Please check at least one box.)
I no longer have British / Irish nationality I wouldn’t willingly give it up I wouldn’t mind giving it up I’m planning on giving it up I no longer feel British / Irish I still feel strong ties to the UK / Ireland I already have dual nationality (i.e. British / Irish + another) Other, namely:

248
27. You have come to the end of this questionnaire. Is there anything you would like to add? This can be anything from language-related comments to remarks about the questionnaire or research itself. You can also add any details for which there was not enough room in the questionnaire. (If you refer to a particular question above, please give the number for easy reference.)
Thank you very much!

249
5.e. General background questionnaire for German control group Fragebogen zum persönlichen Hintergrund
Mit diesem Fragebogen (bestehend aus 20 Fragen) möchte ich einen Eindruck über Ihren (sprachlichen) Hintergrund bekommen. Bei einigen Fragen müssen Sie lediglich ein Kreuz (oder mehrere) im entsprechenden Kästchen machen, bei anderen müssen Sie etwas schreiben. Wenn Sie eine Frage nicht verstehen sollten, melden Sie sich ruhig und ich werde versuchen, Ihnen zu helfen. Für die Rückgabe des Fragebogens haben Sie mehrere Möglichkeiten: Sie können ihn entweder am Computer ausfüllen, speichern (z.B. als Word-Dokument) und als E-Mail-Attachment (bitte nicht in der eigentlichen Mail) zurückschicken. Oder Sie drucken den Fragebogen aus und füllen ihn von Hand aus. Anschließend können Sie ihn per Fax oder mit der Post an mich zurückschicken. Meine Adresse lautet: Susan Dostert Anglistik 3 Heinrich-Heine Universität Universitätsstr. 1 40225 Düsseldorf Tel.: 0211-8113774 Fax: 0211-8115649 Email: [email protected] SÄMTLICHE INFORMATIONEN WERDEN STRENG VERTRAULICH BEHANDELT! IHREN NAMEN, ADRESSE USW. BENÖTIGE ICH NUR, UM SIE SPÄTER WIEDER KONTAKTIEREN ZU KÖNNEN. Name Adresse
Tel.-Nr. E-Mail
1. Ihr Geburtsdatum: 19
2. Ihr Geschlecht: männlich weiblich
3. Welche Nationalität(en) besitzen Sie?

250
4. Wann haben Sie angefangen, Englisch zu lernen? vor der Schule, und zwar im Alter von: in der Grundschule, und zwar in der Klasse in der weiterführenden Schule (d.h. ab Klasse 5) andere, nämlich:
5. Welche weitere(n) Sprache(n) haben Sie gelernt? in einer Schule oder durch den Beruf:
außerhalb von Schule oder Beruf:
6. Welcher ist Ihr höchster Schulabschluss? Haupt- oder Realschulabschluss Abitur Universität (z.B. M.A., Diplom, Lehramt usw.) Promotion Habilitation andere, nämlich:
7. Welcher ist Ihr jetztiger Beruf? Wenn Sie pensioniert sind, oder aus anderen Gründen nicht mehr arbeiten, welcher war Ihr letzter Beruf?
8. Wenn Sie mehrere Berufe ausgeübt haben, geben Sie diese bitte in chronologischer Reihenfolge an, beginnen Sie mit dem Ersten und erwähnen Sie (ungefähr) wie lang Sie in jedem Beruf gearbeitet haben.

251
9. Brauchten Sie oder brauchen Sie heute Englisch im Ihrem Beruf? (Falls ja, geben Sie bitte an wofür Sie es benötig(t)en)
nein ja, nämlich:
10. Welche Sprache(n) benutzen Sie mit Ihren Kollegen (d.h. im Beruf)? wenn Sie mit den Kollegen sprechen
wenn die Kollegen mit Ihnen sprechen
nur Englisch Englisch und Deutsch, aber meistens Englisch English und Deutsch, gleich viel Englisch und Deutsch, aber meistens Deutsch nur Deutsch andere, namlich:
11. Haben Sie jemals in einem anderen Land längere Zeit gelebt (d.h. länger als 6 Monate)? nein ja, und zwar in:
für den Zeitraum von:
12. Wie oft benutzen Sie Englisch (d.h. Sprechen, Schreiben usw.)? täglich jede Woche jeden Monat einige Male im Jahr andere, nämlich:

252
13. Wie oft benutzen Sie Englisch mit „native speakers“ (z.B. E-Mails)? täglich jede Woche jeden Monat einige Male im Jahr andere, nämlich:
14. Wie oft reden Sie Englisch mit „native speakers“? täglich jede Woche jeden Monat einige Male im Jahr andere, nämlich:
15. Welche Sprache(n) benutzen Sie hauptsächlich mit Ihrem/r (Ex-)Partner/in? (Sie können nach Bedarf auch mehr als ein Kästchen ankreuzen z.B. für verschiedene Partner.)
wenn Sie mit ihm / ihr sprechen
wenn er / sie mit Ihnen spricht
nur Englisch Englisch und Deutsch, aber meistens Englisch English und Deutsch, gleich viel Englisch und Deutsch, aber meistens Deutsch nur Deutsch andere, namlich:
16. Haben Sie gelebt oder leben Sie heute mit einem/r Muttersprachler/in von englisch oder deutsch zusammen? (Sie können nach Bedarf auch mehr als ein Kästchen ankreuzen.)
ja, ich lebe zur Zeit mit einem/r englischen Muttersprachler/in zusammen, und zwar seit:
ja, ich habe mit einem/r englischen Muttersprachler/in zusammen gelebt, und zwar für den Zeitraum von:
ja, ich lebe zur Zeit mit einem/r deutschen Muttersprachler/in zusammen, und zwar seit:
ja, ich habe mit einem/r deutschen Muttersprachler/in zusammen gelebt, und zwar für den Zeitraum von:
ich lebe jetzt (oder habe gelebt) mit einem/r Muttersprachler/in von einer anderen Sprache zusammen, und zwar: seit / für den Zeitraum von:
ich habe immer allein gelebt

253
17. Welche Sprache(n) benutzen Sie hauptsächlich mit Freunden und Bekannten? wenn Sie mit ihm / ihr sprechen
wenn er / sie mit Ihnen spricht
nur Englisch Englisch und Deutsch, aber meistens Englisch English und Deutsch, gleich viel Englisch und Deutsch, aber meistens Deutsch nur Deutsch andere, namlich:
18. Hören Sie manchmal englisches Radio oder schauen Sie englisches Fernsehen? nein ja, oft ja, gelegentlich ich würde gern, kann sie aber nicht empfangen
19. Lesen Sie manchmal englische Zeitungen, Bücher oder Zeitschriften? nein ja, oft ja, gelegentlich
20. In den folgenden Tabellen werden Sie gebeten, anzugeben inwieweit Sie in den genannten Domänen Deutsch (Tabelle 1) und Englisch (Tabelle 2) sprechen. Sie brauchen nur ein Kreuz im Kästchen zu machen. Falls eine bestimmte Domäne für Sie nicht relevant sein soll (z.B. weil Sie keine Haustiere haben), lassen Sie das Kästchen leer.
Ich spreche Deutsch ständig häufig regelmäßig gelegentlich sehr selten mit Verwandten mit Freunden mit Haustieren im Beruf in der Kirche in Geschäften in Clubs oder anderen Organisationen
andere, nämlich:

254
Ich spreche Englisch ständig häufig regelmäßig gelegentlich sehr selten mit Verwandten mit Freunden mit Haustieren im Beruf in der Kirche in Geschäften in Clubs oder anderen Organisationen
andere, nämlich:
Wenn Sie noch etwas zu Ihren obigen Antworten hinzufügen möchten, können Sie es gern hier tun:
Vielen Dank für Ihre Hilfe!

255
5.f. Native speaker questionnaire for attrition group
(Instructions for participants) Name Address
Tel. no(s). Email
1. Please indicate which language has which characteristics for you (i.e. in your life / situation). (Please check at least one box for each characteristic / line.)
English German Other Characteristics Language learned first (i.e. from birth / early childhood) Language learned naturally from parents etc. Language spoken (by the majority) in your country of birth Language spoken in the country where you grew up Parents / other family members come from a country where this
language is spoken (by the majority) Language of schooling / learning Language which you learned to speak before you learned to
write Language learned before puberty (i.e. 11-12 yrs)
2. What language(s) did you acquire before starting school? only English English and (an)other language(s), namely:
3. Would you say that you spoke a standard variety of English while you lived in the UK or a dialect?
standard English a dialect, namely:
4. Are you better at guessing a person’s social position / status when they speak English or when they speak German? (The explanation is again optional.)
English, because:
German, because:
I am equally good / bad at both, because:

256
5. Are you better at guessing where someone comes from (i.e. region) when they speak English or when they speak German? (The explanation is again optional.)
English, because:
German, because:
I am equally good / bad at both, because:
6. Please indicate which language has which characteristics for you (i.e. in your life / situation).
(Please check at least one box for each characteristic / line.) English German Other Characteristics
Language of the environment (i.e. outside the home) Language spoken by / with most friends Language used most on a daily basis Language in which you think / dream most often Dominant language (i.e. language you are “best” at) Language in which you have the largest vocabulary Language in which you have no pronunciation problems Language in which you count / do maths Language which you are able to understand / use intuitively Language in which you are familiar with various dialects, slang
etc. Language in which you have an intuitive feeling for “right” and
“wrong” – including grammar Language into which you are able to translate
7. How good are you at each of the following tasks? For each task please use the numbers 1 – 5
to indicate how well you (would) cope in the two languages (i.e. English and German). (Please make sure you leave no gaps, but write a number in every box.) 1 = I can’t do it at all 2 = I can do it, but with great difficulty 3 = I can do it, but with some difficulty 4 = I can do it fairly easily 5 = I can do it without any difficulty

257
In English In German How good are you at ... Understanding the news / current affairs programmes on TV? Understanding the majority of films on TV or at the cinema? Understanding normal, everyday conversations spoken at normal, native
speed? Understanding technical, scientific programmes on TV? Reading most novels? Reading a daily newspaper? Reading and understanding an instruction booklet e.g. for a new digital
camera? Reading and understanding official documents as issued e.g. by a court or
local government body? Interacting in a fluent and spontaneous conversation with friends / family? Telling and / or appreciating jokes or amusing stories? Talking and giving opinions on any contemporary topic e.g. from politics,
economics? Retelling the story / plot of a film / book etc.? Actively taking part in a discussion without having to search for
expressions, words etc.? Writing personal letters to e.g. friends / family? Writing more official letters e.g. to a school, lawyer, insurance company
etc.? Writing various kinds of text, selecting a style and language appropriate to
the situation and reader?
8. Have you been back to the UK since leaving (for Germany)? no, never yes, but only occasionally yes, regularly – about time(s) per year
9. Do you ever get homesick in the sense of missing the UK? no yes – what I then miss most is / are:
10. Do you keep in touch with friends and relatives in the UK? all the time quite often regularly sometimes very rarely

258
11. Do you generally feel more comfortable speaking English or German? no preference English German
12. In which language(s) do you swear more often? English German Equally often in both I never swear Other
13. Do you ever listen to / watch English radio or TV programmes? no yes I would love to, but can’t get them
14. Do you ever read English newspapers, books or magazines? no yes
15. Have you ever been a member of an English club or organisation in Germany? (If yes, please state the name of the organisation and your period of membership.)
no yes, namely:
16. Do you feel more at home with English or with German culture? With German culture With both, but more with German culture With both cultures, equally With both, but more with English culture With English culture
17. Do you plan to move back to the UK at some point in the future? No, I don’t plan to return I’ve never really given it much thought Yes, I would eventually like to move back Other, namely:

259
18. Do you consider it important to maintain your English? very important important no opinion fairly unimportant very unimportant
19. Please indicate which language has which characteristics for you (i.e. in your life / situation). (Please check at least one box for each characteristic / line.)
English German Other Characteristics Language to which you have the strongest emotional ties Language / country / culture with which you identity most
20. Do you consider yourself to be a native speaker of English, German or any other language(s)? Yes, of English Yes, of German Yes, of (an)other language(s), namely: No
21. With regard to English, has this feeling changed over time? No, I’ve always felt the same Yes, I now feel more like a
native speaker Yes, I now feel less like a
native speaker
22. Do English native speakers (family, friends, colleagues etc.) consider you a native speaker of any of these languages?
Yes, of English Yes, of German Yes, of (an)other language(s), namely: No
23. Do German native speakers (family, friends, colleagues etc.) consider you a native speaker of any of these languages?
Yes, of English Yes, of German Yes, of (an)other language(s), namely: No

260
24. How would you feel about giving up your British / Irish nationality? Which of the following statements apply to you? (Please check at least one box.)
I no longer have British / Irish nationality I wouldn’t willingly give it up I wouldn’t mind giving it up I’m planning on giving it up I no longer feel British / Irish I still feel strong ties to the UK / Ireland I already have dual nationality (i.e. British / Irish + another) Other, namely:

261
5.g Native speaker questionnaire for L1 control group
THE AIM OF THIS QUESTIONNAIRE IS TO GET SOME FURTHER BACKGROUND INFORMATION ON THE VOLUNTEERS TAKING PART IN MY RESEARCH PROJECT (AS A CONTROL GROUP). IT CONSISTS OF A TOTAL OF 12 ITEMS, 1 OF WHICH IS OPTIONAL i.e. 7a) IS AN OPTIONAL QUESTION. SOME OF THE QUESTIONS SIMPLY REQUIRE YOU TO PUT ONE (OR MORE) CROSS(ES) (X) IN THE APPROPRIATE BOX(ES), OTHERS REQUIRE YOU TO WRITE SOMETHING. IF YOU DON’T UNDERSTAND A CERTAIN QUESTION, PLEASE DON’T HESITATE TO CONTACT ME. You can either complete the questionnaire on your computer, save it (as a word document) and send it back to me as an e-mail attachment (please do not simply include it in the main body of your mail), or print it, complete it by hand and send it back to me by fax / normal (snail) mail. My address is: Susan Dostert Anglistik 3 Heinrich-Heine University Universitaetsstr. 1 40225 Duesseldorf Germany Tel.: 0049-211-8113774 Fax: 0049-211-8115649 Email: [email protected] ALL THE INFORMATION PROVIDED WILL BE TREATED AS STRICTLY CONFIDENTIAL TO ENSURE YOUR PRIVACY. YOUR NAME AND ADDRESS ETC. ARE ONLY REQUIRED SO THAT I CAN CONTACT YOU LATER. Name Address
Tel. no(s). Email
1. How at home do you feel with English culture – or Welsh, Scottish, Irish (as appropriate)? very much quite a bit no opinion not much not at all
2. How important is the English language for you? very important important no opinion fairly unimportant very unimportant

262
3. How good are you at guessing a person’s social position / status when they speak English? very good good no opinion bad very bad
4. How good are you at guessing where someone comes from (i.e. region) when they speak English?
very good good no opinion bad very bad
5. How good are you at each of the following tasks? For each one please use the numbers 1 – 5 to indicate how well you (would) cope (in English). Please make sure you leave no gaps, but write a number in every box! 1 = I can’t do it at all 2 = I can do it, but with great difficulty 3 = I can do it, but with some difficulty 4 = I can do it fairly easily 5 = I can do it without any difficulty
In English How good are you at ... Understanding the news / current affairs programmes on TV? Understanding the majority of films on TV or at the cinema? Understanding normal, everyday conversations spoken at normal, native speed? Understanding technical, scientific programmes on TV? Reading most novels? Reading a daily newspaper? Reading and understanding an instruction booklet e.g. for a new digital camera? Reading and understanding official documents as issued e.g. by a court or local
government body? Interacting in a fluent and spontaneous conversation with friends / family? Telling and / or appreciating jokes or amusing stories? Talking and giving opinions on any contemporary topic e.g. from politics, economics? Retelling the story / plot of a film / book etc.? Actively taking part in a discussion without having to search for expressions, words
etc.? Writing personal letters to e.g. friends / family? Writing more official letters e.g. to a school, lawyer, insurance company etc.? Writing various kinds of text, selecting a style and language appropriate to the situation
and reader?

263
6. Do you consider yourself to be a native speaker of English or any other language(s)? Yes, of English Yes, of (an)other language(s), namely: No
7. With regard to English, has this feeling changed over time? No, I’ve always felt the same Yes, I now feel more like a
native speaker Yes, I now feel less like a
native speaker 7a) If you feel this has changed, what do you think could have contributed to / caused the change?
8. Do English native speakers (family, friends, colleagues etc.) consider you a native speaker of any of these languages?
Yes, of English Yes, of (an)other language(s), namely: No
9. Do you think it is possible to be “more” or “less” of a native speaker? Please indicate how “native speaker-like” you see yourself with regard to English – or do you not agree with such a classification?
I think I’m very “native speaker-like” I think I’m a bit “native speaker-like” I have no opinion I think I’m not very “native speaker-like” I think I’m not at all “native speaker-like” I think you either are – or aren’t – a native
speaker (i.e. there’s no middle ground)
10. How would you feel about giving up your British / Irish nationality? Which of the following statements apply to you? (Please check at least one box.)
I no longer have British / Irish nationality I wouldn’t willingly give it up I wouldn’t mind giving it up I’m planning on giving it up

264
I no longer feel British / Irish I still feel strong ties to the UK / Ireland I already have dual nationality (i.e. British / Irish + another) Other, namely:
11. You have come to the end of this questionnaire. Is there anything you would like to add? This can be anything from language-related comments to remarks about the questionnaire or research itself. You can also add any details for which there was not enough room in the questionnaire. (If you refer to a particular question above, please give the number for easy reference.)
Thank you very much!

265
5.h. Native speaker questionnaire for German control group Fragebogen zum persönlichen Hintergrund – Teil 2
Bitte vorher lesen: Mit diesem Fragebogen (bestehend aus 37 Fragen) möchte ich einen weiteren Eindruck über Ihren (sprachlichen) Hintergrund bekommen. Bei einigen Fragen müssen Sie lediglich ein Kreuz (oder mehrere) im entsprechenden Kästchen machen, bei anderen müssen Sie etwas (Kurzes) schreiben. Wenn Sie eine Frage nicht verstehen sollten, melden Sie sich ruhig und ich werde versuchen, Ihnen zu helfen. Bitte beachten Sie dabei, dass die Fragen für verschiedene Gruppen von Menschen konzipiert wurden, und daher Ihnen teilweise komisch oder unpassend vorkommen können. Ich bitte Sie trotzdem alle Fragen zu beantworten, damit ich die Antworten der verschiedenen Gruppen vergleichen kann. Für die Rückgabe des Fragebogens haben Sie mehrere Möglichkeiten: Sie können ihn entweder am Computer ausfüllen, speichern (z.B. als Word-Dokument) und als E-Mail-Attachment (bitte nicht in der eigentlichen Mail) zurückschicken. Oder Sie drucken den Fragebogen aus und füllen ihn von Hand aus. Anschließend können Sie ihn per Fax oder mit der Post an mich zurückschicken. Meine Adresse lautet: Susan Dostert Anglistik 3 Heinrich-Heine Universität Universitätsstr. 1 40225 Düsseldorf Tel.: 0211-8113774 Fax: 0211-8115649 Email: [email protected] SÄMTLICHE INFORMATIONEN WERDEN STRENG VERTRAULICH BEHANDELT! IHREN NAMEN, ADRESSE USW. BENÖTIGE ICH NUR, UM SIE SPÄTER WIEDER KONTAKTIEREN ZU KÖNNEN. Name Adresse
Tel.-Nr. E-Mail
1. Wo wurden Sie geboren? Stadt: Bundesland: Land:
2. Wo kommen Ihre Eltern her? (z.B. Stuttgart, Deutschland) Mutter:

266
Vater:
3. Wie ist Ihr derzeitiger Familienstand? verheiratet / unverheiratet zusammenlebend getrennt / geschieden verwitwet ledig
4. Mit welcher/n Sprache(n) ist Ihr(e) (Ex-)Partner/-in aufgewachsen? (Bei mehreren (Ex-)Partnern sind auch Mehrfachantworten möglich.)
Deutsch Englisch andere, nämlich:
5. Wann kam Ihr(e) (Ex-)Partner/-in nach Deutschland? (Bei mehreren (Ex-)Partnern sind auch Mehrfachantworten möglich.)
Er / Sie wurde hier geboren Er / Sie kam hierher im Jahr:
6. Haben Sie (Stief-)Kinder? nein ja, sie sind (Jahre alt):
7. Haben Sie Enkelkinder (oder Stief-Enkelkinder)? nein ja, sie sind (Jahre alt):
8. Leben irgendwelche der o.g. Kinder / Enkel noch in Ihrem Haushalt? ja, ständig (bitte das Alter angeben):
ja, gelegentlich (bitte das Alter angeben, und für welchen Zeitraum sie bei Ihnen leben):
nein

267
9. Welche Sprache(n) benutzen Sie hauptsächlich mit Ihrem/n Kind(ern) und Enkelkind(ern)? (Bitte das jeweilige Alter angeben)
nur Englisch Englisch und Deutsch,
aber meistens Englisch
Englisch und Deutsch, gleich viel
Englisch und Deutsch,
aber meistens Deutsch
nur Deutsch
1. Kind: 2. Kind: 3. Kind: 1. Enkelkind: 2. Enkelkind: 3. Enkelkind:
10. Haben Sie Ihre Kinder jemals ermutigt, Englisch mit Ihnen zu reden / üben? ja, gelegentlich nein, niemals ja, oft
11. Welche Sprache(n) haben Sie vor der Schule gelernt? nur Deutsch Deutsch und (eine) weitere Sprache(n), nämlich:
12. Wie oft sind Sie in einem englischsprachigen Land, z.B. England, USA, usw.? nur selten regelmäßig, ca. mal im Jahr
13. Wieviel Kontakt haben Sie zu Freunden und Verwandten in englischsprachigen Ländern? ständig oft regelmäßig gelegentlich sehr selten
14. Wie halten Sie Kontakt zu diesen Freunden und Verwandten in englischsprachigen Ländern?
(Es sind auch Mehrfachantworten möglich.) Telefon Briefe E-Mail andere, nämlich:

268
15. Welche Sprache(n) benutzen Sie hauptsächlich für diesen Kontakt? nur Englisch Englisch und Deutsch, aber meistens Englisch Englisch und Deutsch, gleich viel Englisch und Deutsch, aber meistens Deutsch nur Deutsch andere, nämlich:
16. Spricht die Mehrheit Ihrer Freunde in Deutschland eher Englisch oder Deutsch? Sie sprechen alle nur Englisch Die Meisten sprechen Englisch Es ist gemischt – ca. die Hälfte Englisch und die andere Hälfte Deutsch Die Meisten sprechen Deutsch Sie sprechen alle nur Deutsch
17. Fühlen Sie sich im Allgemeinen wohler, wenn Sie Deutsch oder Englisch reden? egal Englisch Deutsch
18. Können Sie besser den sozialen Stand eines Menschen erraten, wenn die Person Englisch spricht oder wenn er / sie Deutsch spricht?
Englisch Deutsch Ich kann es in beiden Sprachen gleich gut / schlecht
19. Können Sie besser erraten, wo ein Mensch herkommt (d.h. die Region), wenn die Person Englisch spricht, oder wenn er / sie Deutsch spricht?
Englisch Deutsch Ich kann es in beiden Sprachen gleich gut / schlecht
20. Gehen Sie manchmal in die Kirche? nein, niemals ja, gelegentlich ja, oft
21. Falls Sie in die Kirche gehen, können Sie bitte angeben, in welcher/n Sprache(n) die Messe abgehalten wird?

269
22. Welche Sprache besitzt welche Merkmale für Sie? Was stimmt für welche Sprache? (Bitte machen Sie mindestens ein Kreuz in jeder Zeile / für jedes Merkmal. Sie können auch 2 oder 3 Kreuze pro Zeile machen, wenn ein Merkmal zu mehr als einer Sprache passt.)
Deutsch Englisch Andere Merkmale Die zuerst erlernte Sprache (d.h. ab Geburt / frühe Kindheit). Die Sprache, die Sie von Ihren Eltern usw. erlernt haben. Die Sprache, die in Ihrem Geburtsland von der Mehrheit
gesprochen wird. Die Sprache, die in dem Land gesprochen wird, wo Sie
aufgewachsen sind. Ihre Eltern / andere Familienmitglieder kommen aus einem Land,
wo diese Sprache (von der Mehrheit) gesprochen wird. Die Sprache Ihrer Umgebung (d.h. außerhalb von Ihrem
Zuhause) Die Sprache, die Sie mit der Mehrheit Ihrer Freunde sprechen. Die Sprache, die bei Ihnen zu Hause gesprochen wird. Die Sprache Ihrer Schulzeit (d.h. die Sprache, die als Basis für
Ihr Lernen gedient hat). Die Sprache, die Sie täglich am meisten benutzen. Die Sprache in der Sie am häufigsten träumen / denken. Die Sprache, die Sie emotional am meisten bewegt. Die Sprache / das Land / die Kultur, mit der Sie sich am ehesten
identifizieren. Ihre dominante Sprache (d.h. die Sprache, die Sie „am besten
können“). Die Sprache, in der Sie den größten Wortschatz haben. Die Sprache, in der Sie keine Probleme mit der Aussprache
haben. Die Sprache, in der Sie zählen / Mathe machen. Die Sprache, die Sie sprechen konnten bevor Sie sie schreiben
konnten. Die Sprache, die Sie intuitiv verstehen / benutzen können. Die Sprache, wo Sie einige Dialekte, Umgangssprache usw.
kennen. Die Sprache, wo Sie intuitiv wissen was „richtig“ und was „falsch”
ist – auch in der Grammatik. Die Sprache, in die Sie hinein übersetzen können (d.h. die
Zielsprache). Die Sprache, die Sie vor der Pubertät (d.h. ca. 11-12 Jahre)
gelernt haben.
23. Waren Sie schon mal Mitglied in einem englischsprachigen Club oder einer englischsprachigen
Organisation in Deutschland? (Falls ja, geben Sie bitte den Namen an, und wie lange Sie dort Mitglied waren / gewesen sind.)
Nein Ja, nämlich:

270
24. In der folgenden Tabelle möchte ich Sie bitten, mir Infos. über die (max. 12) Personen zu geben, mit denen Sie am meisten Kontakt haben. Diese Personen können – aber müssen nicht – in Deutschland leben. Ein Name ist als Beispiel vorgegeben.
Name (optional) Wo wohnt diese Person?
Welche Sprache(n) benutzen Sie mit dieser Person?
Wie lange kennen Sie diese Person?
Andrew Erkrath Englisch ca. 20 Jahre

271
25. Fühlen Sie sich zweisprachig? Mit anderen Worten, glauben Sie, dass Ihr Englisch genauso gut ist wie Ihr Deutsch?
Nein Ja Ich weiß es nicht
26. Wie oft sprechen Sie Englisch?
täglich jede Woche jeden Monat einige Male im Jahr andere, nämlich:
27. Planen Sie / Möchten Sie, irgendwann in ein englischsprachiges Land (zu) ziehen, um dort längere Zeit zu leben?
Nein, das habe ich nicht vor Keine Ahnung – ich habe nie darüber nachgedacht Ja, das würde ich gerne irgendwann machen Anderes, nämlich:
28. In welcher Sprache(n) schimpfen oder fluchen Sie am meisten? Englisch Deutsch Gleich oft in beiden Sprachen Ich fluche nie Anderes, nämlich:
29. Halten Sie sich für einen Muttersprachler / eine Muttersprachlerin von einer (oder mehreren) der nachfolgend genannten Sprachen? (Es sind auch Mehrfachantworten möglich.)
Ja, von Englisch Ja, von Deutsch Ja, von (einer) anderen Sprache(n), nämlich: Nein
30. Halten Muttersprachler von Englisch (Familie, Freunde, Kollegen usw.), Sie für einen Muttersprachler / eine Muttersprachlerin von einer (oder mehreren) der nachfolgend genannten Sprachen? (Es sind auch Mehrfachantworten möglich.)
Ja, von Englisch Ja, von Deutsch Ja, von (einer) anderen Sprache(n), nämlich: Nein

272
31. Halten Muttersprachler von Deutsch (Familie, Freunde, Kollegen usw.), Sie für einen Muttersprachler / eine Muttersprachlerin einer (oder mehrerer) der nachfolgend genannten Sprachen? (Es sind auch Mehrfachantworten möglich.)
Ja, von Englisch Ja, von Deutsch Ja, von (einer) anderen Sprache(n), nämlich: Nein
32. Glauben Sie, dass es möglich ist, „mehr” oder „weniger” Muttersprachler/-in zu sein? Bitte geben Sie an, für wie muttersprachlich Sie sich selbst im Bezug auf Deutsch und auf Englisch halten. Oder halten Sie nichts von einer solchen Unterscheidung? (Es sind auch Mehrfachantworten möglich.)
Deutsch Englisch Ich halte mich für sehr muttersprachlich Ich halte mich für ein wenig muttersprachlich Ich habe dazu keine Meinung Ich halte mich für nicht besonders muttersprachlich Ich halte mich für überhaupt nicht muttersprachlich Ich glaube, dass jemand entweder ein Muttersprachler / eine Mutter-
sprachlerin ist oder nicht – es gibt kein „Zwischending”.
33. Hat sich diese Einschätzung / dieses Gefühl in Bezug auf Englisch im Laufe der Zeit
verändert, oder ist es eher gleich geblieben? Nein, es ist gleich geblieben – ich fühle mich genauso muttersprachlich wie früher Ja, ich fühle mich heute eher muttersprachlich als früher Ja, ich fühle mich heute weniger muttersprachlich als früher
34. Was würden Sie von der Idee halten, Ihre Nationalität aufzugeben? Welche der nachfolgenden Aussagen trifft auf Sie zu? (Bitte mindestens ein Kreuz machen.)
Ich habe keine deutsche Nationalität (mehr). Ich würde sie nicht freiwillig abgeben. Mir würde es nichts ausmachen, sie abzugeben. Ich habe vor, sie abzugeben. Ich fühle mich nicht mehr Deutsch. Ich fühle mich Deutschland noch stark verbunden. Ich besitze bereits zwei Nationalitäten (d.h. Deutsch + eine weitere). Ich würde gerne, die britische / amerikanische Nationalität haben. Anderes, nämlich:

273
35. Fühlen Sie sich mit der deutschen oder der englischen / amerikanischen Kultur wohler? Mit der deutschen Kultur am wohlsten Mit beiden, aber eher mit der deutschen Mit beiden Kulturen gleich wohl Mit beiden, aber eher mit der englischen / amerikanischen Mit der englischen / amerikanischen am wohlsten
36. Finden Sie es wichtig, Ihr Deutsch und Ihr Englisch zu behalten? Deutsch Englisch sehr wichtig wichtig keine Meinung ziemlich unwichtig sehr unwichtig
37. Wie gut können Sie diese unterschiedlichen Aufgaben bewältigen? Für jede der Aufgaben, benutzen Sie bitte die Zahlen 1 – 5, um anzugeben, wie gut Sie sie in den beiden Sprachen (d.h. Englisch und Deutsch) bewältigen können / könnten. (Bitte stellen Sie sicher, dass Sie keine Lücken lassen, sondern in jede Zelle eine Zahl schreiben.) 1 = Ich kann es überhaupt nicht. 2 = Ich kann es – aber mit großen Schwierigkeiten. 3 = Ich kann es – aber mit einigen Schwierigkeiten. 4 = Ich kann es relativ problemlos. 5 = Ich kann es – ohne irgendwelche Probleme.
In Deutsch In Englisch Wie gut können Sie ... die Nachrichten / Dokumentationen zu aktuellen Themen im
Fernsehen verstehen? die Mehrheit der Filme im Fernsehen / Kino verstehen? normale Alltagsgespräche verstehen, wie sie von Muttersprachlern
gehalten werden? technische und wissenschaftliche Programme im Fernsehen
verstehen? die meisten Romane lesen? eine Tageszeitung lesen? eine Bedienungsanleitung, z.B. für eine neue Digitalkamera lesen und
verstehen? offizielle Dokumente, z.B. von einem Gericht oder einem Amt lesen
und verstehen? in einem flüssigen und spontanen Gespräch mit Freunden / Familie
interagieren? Witze oder andere lustige Geschichten erzählen und / oder
verstehen? über aktuelle Themen, z.B. aus Politik oder Wirtschaft reden und Ihre
Meinung abgeben?

274
In Deutsch In Englisch Wie gut können Sie ... die Geschichte eines Buchs / eines Films usw. nacherzählen? sich aktiv an einer Diskussion beteiligen, ohne nach Ausdrücken,
Wörtern usw. suchen zu müssen? persönliche Briefe, z.B. an Freunde / Familie schreiben? etwas offiziellere Briefe, z.B. an eine Schule, einen Anwalt, eine
Versicherungsgesellschaft usw. schreiben? verschiedene Arten von Text schreiben und dabei einen Stil und eine
Sprache wählen, die zur Situation und Empfänger passen? Sie sind am Ende angekommen.Vielen Dank!!

275
5.i. English C-Test
Anglistik III – Englische Sprachwissenschaft
Fill in the gaps (English)
On the next pages you will find 5 short texts. Each one contains gaps where
parts of some words have been left out (no whole words are missing, though).
Please try and fill in the gaps appropriately. In many cases there are several
possibilities, so there are no right or wrong answers. Please also note that
these tests are designed to make it virtually impossible for anyone to get 100%
correct, so don’t worry if you have problems. You will have a maximum of 5
minutes for each text. Thank you very much for your help!

276
Text 1
We all live with other people’s expectations of us. These are a
refle____________________ of th____________________ trying to
under____________________ us; th____________________ are
predic____________________ of wh____________________ they
th____________________ we will think, d____________________ and
feel. Gene____________________ we acc____________________ the
sta____________________ quo, but these
expect____________________ can be ha____________________ to
han____________________ when they co____________________ from
our fam____________________ and can be
diff____________________ to ign____________________ , especially
wh____________________ they come from our
par____________________ .

277
Text 2
The BBC’s core purpose is broadcasting. Since the
lau____________________ of the Radio Times in 1923 it
h____________________ also eng____________________ in
comme____________________ activities. If
pur____________________ properly, su____________________
commercial activities he____________________ to
rea____________________ the va____________________ of
lic____________________ payers’ ass____________________ and
gene____________________ income to be
plou____________________ back in____________________ the public
ser____________________ programming. Th____________________
commercial Policy Guidelines s____________________ out the
fram____________________ which ens____________________ that
the BBC’s commercial activities sup____________________ its public
purpose.

278
Text 3
Two former US navy ships contaminated with chemicals were expected
to arrive in the English Channel last night. The Maritime and Coastguard
Agency sa____________________ the ves____________________ , at
the cen____________________ of an enviro____________________
row, we____________________ being to____________________
through the cha____________________ , before
hea____________________ up the east co____________________ to
Hartlepool. Pl____________________ to dism____________________
them in north-east England have been she____________________ after
being dee____________________ to fl____________________
international ru____________________. Last
we____________________ , the gover____________________ said the
ships could be sto____________________ in Hartlepool before
go____________________ back acr____________________ the
Atlantic.

279
Text 4
Don’t get me wrong. I love magazines. I’ve been addicted to them since
my teenage years. There’s some____________________ about the
superfi____________________ of wom____________________
magazines that I of____________________ enjoy. But oh
b____________________ , they are ju____________________ so, so
frustr____________________ predictable. I
rec____________________ you co____________________ cobble
o____________________ together very eas____________________ in
five min____________________. Take the co____________________
image for exa____________________ : get a
he____________________ and shou____________________ shot of a
smi____________________ , heavily made-up and
airbr____________________ model (or optio____________________ a
fam____________________ person).

280
Text 5 In the last British general election in 2001, only 59.4% of eligible voters
cast a ballot. That’s a frigh____________________ lack of
inte____________________ by the elect____________________ , but
is not____________________ compared to the
fig____________________ for lo____________________ and
Euro____________________ elections, which
s____________________ even lo____________________ turnouts. It’s
diff____________________ to bel____________________ there’s so
lit____________________ interest in elections. In Britain, we’re
fort____________________ to have pol____________________
stations wit____________________ a short wa____________________
or dr____________________ and there are
volun____________________ more th____________________ willing
to pro____________________ rides to someone unable to walk or who
doesn’t have a car.

281
5.j. German C-Test
Anglistik III – Englische Sprachwissenschaft
Fill in the gaps (German)
On the next pages you will find 5 short texts. Each one contains gaps where
parts of some words have been left out (no whole words are missing, though).
Please try and fill in the gaps appropriately. In many cases there are several
possibilities, so there are no right or wrong answers. Please also note that
these tests are designed to make it virtually impossible for anyone to get 100%
correct, so don’t worry if you have problems. You will have a maximum of 5
minutes for each text. Thank you very much for your help!

282
Text 1
Die Geschichte der Kernspaltung reicht zurück in das frühe 19.
Jahrhundert. In d___________________ Folgejahren
leg___________________ Chemiker d___________________
Grundstein f___________________ den mode___________________
Atombegriff. S___________________ erkannten,
da___________________ die chemi___________________ Elemente
a___________________ Teilchen aufg___________________ sind,
d___________________ untereinander völ___________________
gleichartig reag___________________ , sich jed___________________
von and___________________ Elementen
unters___________________ . 1871 erschien d___________________
erste tabell___________________ Aufstellung d___________________
Eigenschaften al___________________ bekannten
Elem___________________ , das Periode___________________ .

283
Text 2
Neben den regulären Teilen der Bibel gibt es, wie die Kenner wissen,
allerlei apokryphe Schriften, darunter auch die etwas andere
Schöpfungsgeschichte, die „Pseudo-Genesis“. Sie
wei___________________ in ein___________________ Details
erhe___________________ von d___________________ gängigen
Ver___________________ ab, insbes___________________ im
ers___________________ Kapitel, d___________________ damit
beg___________________ , dass d___________________ „Chöre“,
al___________________ die En___________________ , beim
Erze___________________ Michael zusamme___________________
und üb___________________ ein rätsel___________________
Phänomen ber___________________ .

284
Text 3
Eine Wünschelrute ist ein gegabelter Zweig, ursprünglich meist vom
Haselnussstrauch, später verwe___________________ man
au___________________ ähnliche Instr___________________ aus
untersch___________________ Materialien. S___________________
dient d___________________ so gena___________________
Rutengänger, ei___________________ Person,
d___________________ für si___________________ eine
beso___________________ Begabung beans___________________ ,
als Hilfs___________________ zum Auff___________________ von
unterir___________________ „Reizzonen“, z___________________
Beispiel Wasse___________________ , Erdölvorkommen
od___________________ Erzlagerstätten.

285
Text 4
Sicherheitshinweise
Bedienungsanleitung bitte vollständig vor Inbetriebnahme des
Bügeleisens durchlesen und aufbewahren.
Reparaturen an Elektro___________________ dürfen
n___________________ von Fachk___________________
durchgeführt wer___________________ Durch
unsach___________________ Reparaturen kön___________________
erhebliche Gefa___________________ für d___________________
Benutzer entst___________________ . Wird d___________________
Gerät zwecken___________________ oder fal___________________
bedient, ka___________________ keine Haf___________________ für
dad___________________ verursachte Sch___________________
übernommen wer___________________ .
Das Ge___________________ wurde v___________________ uns
sicherheitstechnisch geprüft.

286
Text 5
Schon in ältester Zeit haben die Menschen den Himmel beobachtet. Je
stä___________________ frühe Kult___________________ von
d___________________ Natur abhä___________________ waren,
de___________________ näher l___________________ es
f___________________ sie, a___________________ den
o___________________ periodischen Ersche___________________
der Na___________________ und d___________________
Sternenhimmels besti___________________ Faktoren
abzul___________________ , die i___________________ tägliches
Le___________________ beeinflussten. I___________________
Verlauf d___________________ Entwicklung d___________________
mensch___________________ Zivilisation verl___________________
diese natür___________________ Zyklen im___________________
mehr a___________________ Bedeutung.

287
5.k. Egg armour plating (by W.H. Robinson) The illustration (taken from Robinson, W.H., 1978) cannot be reproduced here for copyright reasons.

288
5.l. Example of a CHAT transcript @Begin @Languages: en @Participants: SUB TF Subject, INV Susan_Dostert Investigator @ID: en|picdescr|SUB|||L1cg||Subject|| @Font: Courier New *SUB: right there (i)s <a> [x 2] <a &l> [/] a large raised platform # . *SUB: ah@fp and metal objects are being # wheeled on a trolley into a large vat . *SUB: and being pushed down by a chap with a fork or a # pole of some sort . *SUB: and underneath the big vat <is> [///] ah@fp a furnace is being # stoked by two gentlemen with # what looks like coal <shuttles> [//] # scuttles not shuttles . *SUB: ah@fp # and out of the base of the vat comes a <metal> [//] molten metal # substance that is being used to coat eggs that are hanging on the end of a string . *SUB: ah@fp xxx work it out . *SUB: and the eggs are being placed on a hook # from a box of eggs . *SUB: and when they (ha)ve been coated with metal they (a)re put on a trolley and wheeled across to a table where there (i)s several gentlemen sat painting # the eggs . *SUB: first of all chiselling all the bits off # to make them smooth . *SUB: and then # looks like they (a)re being painted . *SUB: not a particular colour though . *SUB: # and then they (a)re put into <a> [/] # a box when they (a)re complete . @End

289
5.m. Versicherung
Versicherung
Ich erkläre hiermit, dass ich die vorliegende Arbeit ohne Hilfe Dritter und ohne Benutzung anderer als der angegebenen Hilfsmittel angefertigt habe; die aus fremden Quellen (einschließlich des Internets) direkt oder indirekt übernommenen Gedanken sind als solche kenntlich gemacht. Die Arbeit wurde bisher in gleicher oder ähnlicher Form keiner anderen Prüfungsbehörde vorgelegt. ____________________________________ Susan Claire Dostert Düsseldorf, April 2009

290
5.n. kurzer Lebenslauf Name: Dostert, geb. Charlwood Vornamen: Susan Claire Geb.-Datum: 12. Mai 1964 Geb.-Ort: London, England Staatsangehörigkeit: britisch Wohnort: Düsseldorf Familienstand: geschieden, 1 Tochter Schulausbildung: 1968-1982 (9 “O-levels”, 3 “A-levels” in Französisch, Deutsch, Soziologie) Berufliche Laufbahn: 11.84-1.1989 Fremdsprachensekretärin / -kontoristin bei (Auszug) Ramada Hotel Inc., Düsseldorf (International Accounting) seit 9.1990 freiberufliche Übersetzerin seit 1.1992 freiberufliche Sprachlehrerin (Englisch als Fremd- sprache) seit 1.1993 freiberufliches Mitglied von Prüfungskommissionen der IHK Düsseldorf für Englisch als Fremdsprache seit 10.2001 wissenschaftliche Angestellte am Lehrstuhl für Englische Sprachwissenschaft, HHU Düsseldorf Weiterbildung: 9.1990-12.1992 Vorbereitung auf die IHK-Übersetzer-Prüfung (Auszug) Deutsch für Engländer (Prüfung bestanden 3.1992) 4.1991-6.1991 Managementkurs Wirtschaftsdeutsch bei der
IIK, Düsseldorf (Prüfung bestanden 6.1991) 10.1995-9.2001 HHU Düsseldorf (Magisterstudium: Hauptfach Allg. Sprachwissenschaft, Nebenfächer Neuere Anglistik / Amerikanistik, und Ältere Anglistik) seit 10.2001 Promotionsstudentin (Englische Sprachwissen- schaft) 1.2005-1.2006 Lehrgang „Erwachsenenpädagogische Grundqualifikation für Kursleitende der VHS“ (Prüfung bestanden 1.2006) 10.2005-1.2008 Modul I Basismodul im Weiterbildungs- programm „Professionale Lehrkompetenz für die Hoch- schule“ absolviert