Multidecadal Covariability of North Atlantic Sea Surface Temperature, African Dust, Sahel Rainfall,...
12
Multidecadal Covariability of North Atlantic Sea Surface Temperature, African Dust, Sahel Rainfall, and Atlantic Hurricanes CHUNZAI WANG NOAA/Atlantic Oceanographic and Meteorological Laboratory, Miami, Florida SHENFU DONG NOAA/Atlantic Oceanographic and Meteorological Laboratory, and Cooperative Institute for Marine and Atmospheric Studies, University of Miami, Miami, Florida AMATO T. EVAN Department of Environmental Sciences, University of Virginia, Charlottesville, Virginia GREGORY R. FOLTZ NOAA/Atlantic Oceanographic and Meteorological Laboratory, Miami, Florida SANG-KI LEE NOAA/Atlantic Oceanographic and Meteorological Laboratory, and Cooperative Institute for Marine and Atmospheric Studies, University of Miami, Miami, Florida (Manuscript received 29 July 2011, in final form 11 January 2012) ABSTRACT Most studies of African dust and North Atlantic climate have been limited to the short time period since the satellite era (1980 onward), precluding the examination of their relationship on longer time scales. Here a new dust dataset with the record extending back to the 1950s is used to show a multidecadal covariability of North Atlantic SST and aerosol, Sahel rainfall, and Atlantic hurricanes. When the North Atlantic Ocean was cold from the late 1960s to the early 1990s, the Sahel received less rainfall and the tropical North Atlantic expe- rienced a high concentration of dust. The opposite was true when the North Atlantic Ocean was warm before the late 1960s and after the early 1990s. This suggests a novel mechanism for North Atlantic SST variability—a positive feedback between North Atlantic SST, African dust, and Sahel rainfall on multidecadal time scales. That is, a warm (cold) North Atlantic Ocean produces a wet (dry) condition in the Sahel and thus leads to low (high) concentration of dust in the tropical North Atlantic, which in turn warms (cools) the North Atlantic Ocean. An implication of this study is that coupled climate models need to be able to simulate this aerosol- related feedback in order to correctly simulate climate variability in the North Atlantic. Additionally, it is found that dust in the tropical North Atlantic varies inversely with the number of Atlantic hurricanes on multidecadal time scales because of the multidecadal variability of both direct and indirect influences of dust on vertical wind shear in the hurricane main development region. 1. Introduction Sea surface temperature (SST) variability of the North Atlantic Ocean on time scales longer than interannual mainly shows a multidecadal variation and a secular trend (e.g., Trenberth and Shea 2006). There is a debate on what causes these variations—that is, the relative roles of anthropogenic global warming, aerosols, and natural variability in controlling North Atlantic SST variability (e.g., Enfield et al. 2001; Knight et al. 2005; Trenberth and Shea 2006; Mann and Emanuel 2006; Zhang et al. 2007; Ting et al. 2009; Ottera et al. 2010; Wang and Dong 2010; Chang et al. 2011). In this paper, Corresponding author address: Dr. Chunzai Wang, NOAA/ Atlantic Oceanographic and Meteorological Laboratory, 4301 Rickenbacker Causeway, Miami, FL 33149. E-mail: [email protected] 5404 JOURNAL OF CLIMATE VOLUME 25 DOI: 10.1175/JCLI-D-11-00413.1 Ó 2012 American Meteorological Society
Transcript of Multidecadal Covariability of North Atlantic Sea Surface Temperature, African Dust, Sahel Rainfall,...
Multidecadal Covariability of North Atlantic Sea Surface Temperature,African Dust, Sahel Rainfall, and Atlantic Hurricanes
CHUNZAI WANG
NOAA/Atlantic Oceanographic and Meteorological Laboratory, Miami, Florida
SHENFU DONG
NOAA/Atlantic Oceanographic and Meteorological Laboratory, and Cooperative Institute for Marine
and Atmospheric Studies, University of Miami, Miami, Florida
AMATO T. EVAN
Department of Environmental Sciences, University of Virginia, Charlottesville, Virginia
GREGORY R. FOLTZ
NOAA/Atlantic Oceanographic and Meteorological Laboratory, Miami, Florida
SANG-KI LEE
NOAA/Atlantic Oceanographic and Meteorological Laboratory, and Cooperative Institute for Marine
and Atmospheric Studies, University of Miami, Miami, Florida
(Manuscript received 29 July 2011, in final form 11 January 2012)
ABSTRACT
Most studies of African dust and North Atlantic climate have been limited to the short time period since the
satellite era (1980 onward), precluding the examination of their relationship on longer time scales. Here a new
dust dataset with the record extending back to the 1950s is used to show a multidecadal covariability of North
Atlantic SST and aerosol, Sahel rainfall, and Atlantic hurricanes. When the North Atlantic Ocean was cold
from the late 1960s to the early 1990s, the Sahel received less rainfall and the tropical North Atlantic expe-
rienced a high concentration of dust. The opposite was true when the North Atlantic Ocean was warm before
the late 1960s and after the early 1990s. This suggests a novel mechanism for North Atlantic SST variability—a
positive feedback between North Atlantic SST, African dust, and Sahel rainfall on multidecadal time scales.
That is, a warm (cold) North Atlantic Ocean produces a wet (dry) condition in the Sahel and thus leads to low
(high) concentration of dust in the tropical North Atlantic, which in turn warms (cools) the North Atlantic
Ocean. An implication of this study is that coupled climate models need to be able to simulate this aerosol-
related feedback in order to correctly simulate climate variability in the North Atlantic. Additionally, it is
found that dust in the tropical North Atlantic varies inversely with the number of Atlantic hurricanes on
multidecadal time scales because of the multidecadal variability of both direct and indirect influences of dust
on vertical wind shear in the hurricane main development region.
1. Introduction
Sea surface temperature (SST) variability of the North
Atlantic Ocean on time scales longer than interannual
mainly shows a multidecadal variation and a secular
trend (e.g., Trenberth and Shea 2006). There is a debate
on what causes these variations—that is, the relative
roles of anthropogenic global warming, aerosols, and
natural variability in controlling North Atlantic SST
variability (e.g., Enfield et al. 2001; Knight et al. 2005;
Trenberth and Shea 2006; Mann and Emanuel 2006;
Zhang et al. 2007; Ting et al. 2009; Ottera et al. 2010;
Wang and Dong 2010; Chang et al. 2011). In this paper,
Corresponding author address: Dr. Chunzai Wang, NOAA/
Atlantic Oceanographic and Meteorological Laboratory, 4301
Rickenbacker Causeway, Miami, FL 33149.
E-mail: [email protected]
5404 J O U R N A L O F C L I M A T E VOLUME 25
DOI: 10.1175/JCLI-D-11-00413.1
� 2012 American Meteorological Society

we focus on the multidecadal variability of the North
Atlantic SST—the Atlantic multidecadal oscillation
(AMO) (e.g., Delworth and Mann 2000; Enfield et al.
2001). Here the AMO index is defined as the de-
trended North Atlantic SST anomalies over the region of
08–608N and from the east coast of the Americas to
08 longitude (Fig. 1a). The extended reconstructed SST
data (Smith et al. 2008) from 1950 to 2008 show that the
AMO was in the cold phase from the late 1960s to the
early 1990s and in the warm phases before the late 1960s
and after the early 1990s.
The AMO has footprints on many parts of the global
oceans (Fig. 1b; Ottera et al. 2010, and others). In ad-
dition to the basin-wide warming of the North Atlantic
Ocean, the warm phase of the AMO is associated with
warming in the western North and South Pacific Oceans
and the tropical eastern Indian Oceans and cooling
over the global Southern Oceans and in the subtropical
northeastern Pacific Ocean. Opposite-signed SST
anomalies occur for the cold phase of the AMO. The
Atlantic SST regression shows a bipolar seesaw pattern
or an interhemispheric gradient (Stocker 1998), sup-
porting the hypothesis that a driving mechanism of the
AMO may involve fluctuations of the Atlantic merid-
ional overturning circulation (AMOC) (e.g., Delworth
and Mann 2000; Knight et al. 2005; Delworth et al. 2007).
As the AMOC is enhanced, a warming and a cooling will
occur in the North and South Atlantic Oceans, re-
spectively, and vice versa for a reduction of the AMOC.
AMO variability is associated with changes of climate
and extreme events such as drought, flood, and hurri-
cane activity (e.g., Enfield et al. 2001; Goldenberg et al.
2001; McCabe et al. 2004; Bell and Chelliah 2006; Wang
and Lee 2009). Previous studies have shown that it is
mainly the tropical portion of the AMO that is relevant
for climate since the climate response to the North At-
lantic SST anomalies is primarily forced at the low lati-
tudes (e.g., Lu and Delworth 2005; Sutton and Hodson
2007). Accordingly, the influence of the AMO on cli-
mate and hurricane activity may operate via atmospheric
circulation changes induced by the SST anomalies in
the tropical North Atlantic and Caribbean Sea (Vimont
and Kossin 2007; Wang et al. 2008). Recently, Dunstone
et al. (2011) used the third climate configuration of the
Met Office Hadley Centre Coupled Model version 3
(HadCM3) coupled climate model to show that the
North Atlantic subpolar gyre is a potentially important
region for driving the tropical atmosphere by changing
the tropical SST. It is therefore important to explore and
understand the mechanisms that drive multidecadal
variability in the tropical North Atlantic SST.
The present paper focuses on the relationships of
mineral dust concentration in the tropical North At-
lantic with North Atlantic SST variability and Atlantic
hurricanes. Owing to the lack of long-term observations
of dust over the Atlantic, most observational studies
regarding mineral aerosols and North Atlantic climate
have been limited to the short period since the satellite
era (approximately 1980 onward). Although several
modeling studies have explored the relationship be-
tween dust and climate on long-term periods (e.g.,
Mahowald et al. 2010), there is a high degree of dis-
agreement in modeled dust emissions and transport
between such models (Huneeus et al. 2011), under-
scoring the importance of observation-based studies. In
this paper, we use a new dust dataset, which extends
back to the 1950s, to examine dust-related North At-
lantic SST variability on multidecadal time scales and
propose a novel mechanism for North Atlantic SST
variability. The paper is organized as follows. Section 2
briefly describes and introduces the datasets used in this
study. Section 3 shows a multidecadal covariability of
SST and dust in the North Atlantic, rainfall in the Sahel,
and Atlantic hurricanes. Section 4 presents the linkage
between dust in the tropical North Atlantic and African
dust. Section 5 infers a positive feedback between North
Atlantic SST, African dust, and Sahel rainfall on multi-
decadal time scales, and gives a discussion and summary.
FIG. 1. The AMO index and its relationship with global ocean
SST. Shown are (a) the detrended annual SST anomalies (8C) in the
North Atlantic of 08–608N and from the east coast of the Americas
to 08 longitude and (b) regression (8C 8C21) of global annual SST
anomalies onto the AMO index of (a). The regression is calculated
based on the 7-yr running mean data. The shading in (a) represents
the 7-yr running mean time series. Only regression coefficients
exceeding the 95% significant level are plotted in (b).
1 AUGUST 2012 W A N G E T A L . 5405

2. Datasets
Several observational and reanalysis datasets are
used in this study. SST is from the National Oceanic
and Atmospheric Administration (NOAA) extended
reconstructed SST version 3 (Smith et al. 2008). The
atmospheric reanalysis datasets include the National
Centers for Environmental Prediction–National Center
for Atmospheric Research (NCEP–NCAR) reanalysis
(Kalnay et al. 1996), the European Centre for Medium-
Range Weather Forecasts (ECMWF) Re-Analysis
(ERA-40; Uppala et al. 2005), and the newly de-
veloped NOAA Earth System Research Laboratory
(ESRL) Twentieth-Century Reanalysis (20CR)
(Compo et al. 2011). All of these datasets are monthly
and we use them for the period from January 1950
to December 2008 except for the ERA-40. For the
ERA-40 dataset, we use the data from January 1958 to
December 2001 since the original ERA-40 reanalysis
is from September 1957 to August 2002. We also use
the station wind data in the western Sahel from
Mahowald et al. (2007).
The rainfall dataset is from the Global Precipitation
Climatology Centre (GPCC) version 5. The monthly
rainfall data are gridded from the complete GPCC sta-
tion database with more than 70 000 different rain gauge
stations worldwide (Rudolf et al. 1994). The gridded land
precipitation is available for the period 1901–2009 in spa-
tial resolutions of 0.58 3 0.58, 1.08 3 1.08, and 2.58 3 2.58.
The rainfall data are available from ftp://ftp-anon.dwd.de/
pub/data/gpcc/html/fulldata_download.html.
The extended dust aerosol optical depth (DAOD)
over the tropical North Atlantic from 1955 to 2008 was
derived from a simple model using modern and histor-
ical data from meteorological satellites and a proxy re-
cord for atmospheric dust (Evan and Mukhopadhyay
2010). Satellite data include aerosol optical thickness
retrievals from the Advanced Very High Resolution
Radiometer (AVHRR) Pathfinder Extended dataset
(PATMOS-x) for the period 1982–2008 and the Mod-
erate Resolution Imaging Spectroradiometer (MODIS)
on board the Aqua satellite for the period 2002–08. The
proxy record for atmospheric dust is based on mea-
surements of crustal helium-4 (4He) flux from a Porites
coral at a water depth of 5 m near Pedra de Lume on Sal
Island (1684594499N, 2285392399W), part of the Cape Verde
archipelago, for the period of 1955–94 (Mukhopadhyay
and Kreycik 2008). The resultant 54-yr record of DAOD
has a 1.08 3 1.08 spatial resolution and a monthly tem-
poral resolution, and covers the region 08–308N, 108–
658W. Evan et al. (2011) showed that the DAOD time
series is well correlated with the station dust time series
observed on the island of Barbados (138109N, 598309W).
Since the DAOD dataset is longer than the dust station
data in Barbados, we use the DAOD data to study
multidecadal variation in this paper.
Tropical cyclone data are obtained from the National
Hurricane Center (NHC) Hurricane Best Track Files
(HURDAT) (http://www.nhc.noaa.gov/pastall.shtml)
(Jarvinen et al. 1984). Here we examine the numbers
of Atlantic hurricanes, defined as the number of tropi-
cal cyclones with lifetime maximum sustained 1-min
wind speeds of 64 kt or greater (Saffir–Simpson cate-
gories 1–5).
3. Covariability of SST, dust, rainfall, andhurricanes
Variations in Atlantic SST and its interhemispheric
gradient have been recognized to contribute to drought
after the 1970s in the Sahel, which is a region in Africa
between the Saharan Desert and the rain forests of
central Africa and the Guinean coast (e.g., Folland et al.
1986; Giannini et al. 2003). Figures 2a,b show that the
Sahel rainfall anomalies covary with the AMO on mul-
tidecadal time scales. The warm (cold) phases of the
AMO are associated with positive (negative) rainfall
anomalies in the Sahel. Because both the SST and
rainfall data extend back to the beginning of the twen-
tieth century, we can examine the relationship over
a long-term period. Figure 3 shows that the relationship
between the AMO and Sahel rainfall still holds if the
time series are extended for the entire twentieth cen-
tury.
More interestingly, the DAOD in the tropical North
Atlantic, which is proportional to mass concentration
and is a proxy for atmospheric dust content, is out of
phase with the AMO and the Sahel rainfall anomalies
(Fig. 2c). This relationship is consistent with the analysis
of Foltz and McPhaden (2008b), which used the data
from 1980–2006 to show trends of Sahel rainfall and dust
during the most recent upswing of the AMO. The nearly
six-decade data used here show that when the North
Atlantic Ocean was cold during the late 1960s to the
early 1990s, the Sahel received less rainfall and the
tropical North Atlantic had high concentration of dust.
The opposite was true for the warm phases of the AMO
after the early 1990s and before the late 1960s. We
smooth each time series with a 7-yr running mean filter
(the shading in Fig. 2) and calculate the correlations
among these filtered indices. The maximum correlations
of 20.87 and 0.85 occur when the Sahel rainfall leads the
DAOD and AMO indices by 1 and 2 yr, respectively,
which is consistent with the finding of Prospero and
Lamb (2003) in the case of Barbados dust and Sahel
rainfall. The maximum correlation between the AMO
5406 J O U R N A L O F C L I M A T E VOLUME 25

and DAOD indices is 20.67 with 0 lag. We calculate the
effective degree of freedom (Quenouille 1952; Medhaug
and Furevik 2011) as NE 5 N/(1 1 2RX1RY1
1 2RX2RY2
),
where N is the number of data points for the time series
of X and Y, RX1or RY1
is the autocorrelation at lag 1, and
RX2
or RY2
is the autocorrelation at lag 2. All of these
correlations are statistically significant based on Stu-
dent’s t test (above 95% significant levels). Although
a correlation cannot tell us the cause and effect, these high
correlation values suggest that dust in the tropical North
Atlantic is related to Sahel rainfall and the North Atlantic
SST (Prospero and Lamb 2003; Evan et al. 2011).
To emphasize AMO-related variability, we have de-
trended all data (i.e., removed linear trends). We also
plot the data with the linear trends included—that is,
data that include the components of both global warm-
ing and the AMO (Figs. 4 and 5). A comparison of
Fig. 1b and Fig. 4b indicates that the global warming
signal is spread throughout most of the global oceans
(Barnett et al. 2005). With the long-term linear trend
included, the rainfall anomalies in the Sahel show neg-
ative anomalies during the warm phase of the AMO
after the early 1990s (Fig. 5b). If we compare Fig. 5b with
Fig. 2b, it suggests that the impacts of the warming trend
and the AMO on rainfall in the Sahel are opposite in
sign. That is, the warming trend is associated with a re-
duction of rainfall in the Sahel region, whereas the warm
phase of the AMO after the early 1990s tends to increase
Sahel rainfall. This is consistent with modeling results
that show that global warming leads to drought over the
Sahel and a positive AMO phase enhances Sahel rainfall
(e.g., Held et al. 2005; Mohino et al. 2011). The long-
term drying in the Sahel may also be caused by other
factors such as sulfate aerosol forcing that may lead to
the cooling of the northern tropical oceans and then
a decrease in Sahel rainfall (e.g., Rotstayn and Lohmann
2002; Chang et al. 2011). The DAOD anomalies in Fig.
5c are almost identical to those in Fig. 2c, indicating that
the DAOD data used here do not have a significant
long-term linear trend.
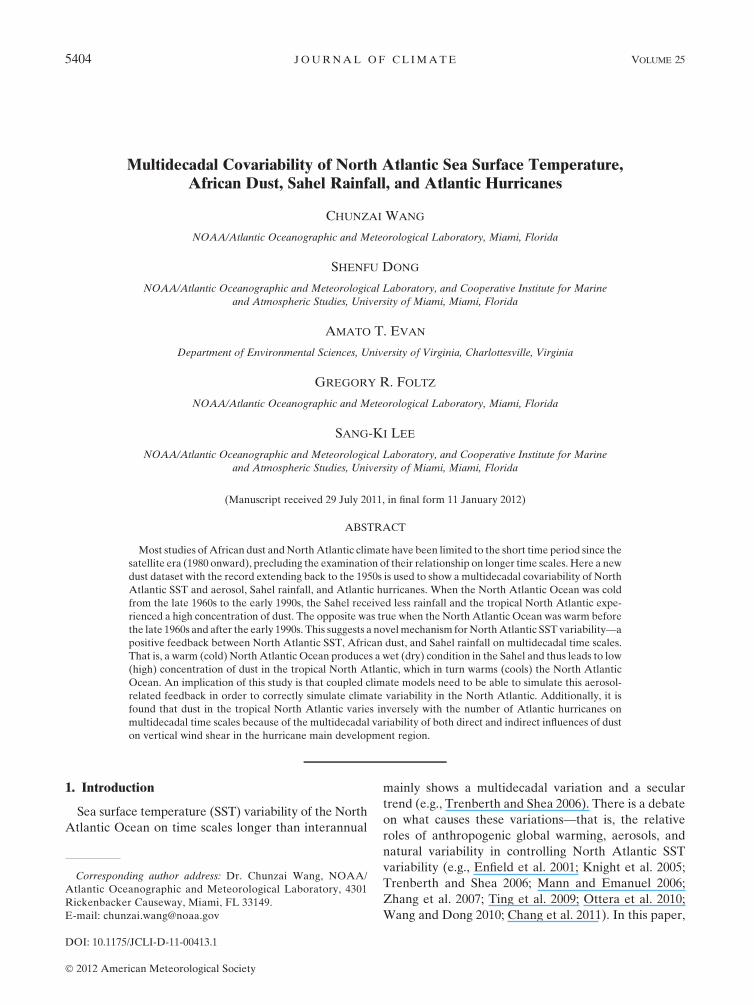
The spatial rainfall patterns related to the AMO and
dust aerosol in the tropical North Atlantic are shown in
Fig. 6. A strong positive AMO–rainfall regression stands
out in the Sahel region (Fig. 6a). This indicates that on
multidecadal time scales the warm (cold) North Atlantic
FIG. 2. The AMO, Sahel rainfall, and dust in the tropical North
Atlantic. Shown are (a) the AMO index (8C), (b) the annual
rainfall anomalies (mm month21) in the Sahel (108–208N, 208W–
408E), and (c) the annual DAOD anomalies in the tropical North
Atlantic (08–308N, 108–658W). The shading represents the time
series of 7-yr running means.
FIG. 3. The AMO index and Sahel rainfall time series for a long-
term record of 1900–2008. Shown are (a) the AMO index (8C) and
(b) the annual rainfall anomalies (mm month21) in the Sahel (108–
208N, 208W–408E). The time series are detrended and the shading
represents the time series of 7-yr running means.
1 AUGUST 2012 W A N G E T A L . 5407

Ocean corresponds to more (less) rainfall in the Sahel
as the positive AMO phase leads to a northward shift
of the intertropical convergence zone (ITCZ) in the
Atlantic (e.g., Zhang and Delworth 2006; Krebs and
Timmermann 2007). Since the northward shift of the
Atlantic ITCZ is associated with the anomalous mois-
ture convergence in the lower troposphere and upward
motion at 500 hPa (Fig. 6c) over the Sahel, Sahel rainfall
is enhanced. Figure 6a also shows the significant rainfall
patterns associated with the AMO from North America
to equatorial South America, consistent with previous
studies (e.g., Enfield et al. 2001; McCabe et al. 2004).
The dust–rainfall regression shows that high (low)
concentration of dust in the tropical North Atlantic is
associated with less (more) rainfall in the Sahel on
multidecadal time scales (Fig. 6b). For the data with the
linear trend included, the positive AMO–rainfall re-
gression in the Sahel region almost disappears (Fig. 7a)
because of the offsetting effect of global warming. The
rainfall pattern from the GPCC product is consistent
with the independent NCEP–NCAR reanalysis that
shows the disappearance of upward motion at 500 hPa
in the Sahel (Fig. 7b). Thus, our analyses here suggest
that global warming decreases rainfall in the Sahel,
whereas the warm phase of the AMO after the early
1990s increases rainfall in the Sahel.
An interesting topic is the relationship between Af-
rican dust and Atlantic hurricane activity. Evan et al.
(2006) have demonstrated a strongly negative relation
between interannual variations in Atlantic tropical cy-
clone days and atmospheric dust measured by satellite
during the years of 1982–2005. Here we focus on the
multidecadal variations by performing the 7-yr running
mean of all indices (the indices are detrended before the
7-yr running mean). Figure 8a shows that dust in the
tropical North Atlantic is highly related to the number
of Atlantic hurricanes. When dust concentration in the
tropical North Atlantic is high (low), the number of
Atlantic hurricanes is smaller (larger). The mechanism
FIG. 4. The time series of the North Atlantic SST anomalies and
its regressed map using the data with the linear trends included.
Shown are (a) the annual SST anomalies (8C) in the North Atlantic
of 08–608N and from the east coast of the Americas to 08 longitude
and (b) regression (8C 8C21) of global annual SST anomalies onto
the North Atlantic SST index of (a). The regression is calculated
based on the 7-yr running mean data. Only regression coefficients
exceeding the 95% significant level are plotted. The shading in (a)
represents the time series of 7-yr running means.
FIG. 5. The time series of the North Atlantic SST, Sahel rainfall,
and dust in the tropical North Atlantic using the data with the
linear trends included. Shown are (a) the annual SST anomalies
(8C) in the North Atlantic of 08–608N and from the east coast of
the Americas to 08 longitude, (b) the annual rainfall anomalies
(mm month21) in the Sahel (108–208N, 208W–408E), and (c) the
annual DAOD anomalies in the tropical North Atlantic (08–308N,
108–658W). The shading represents the time series of 7-yr running
means.
5408 J O U R N A L O F C L I M A T E VOLUME 25
may be due to an increase (decrease) of tropospheric
vertical wind shear (VWS) in the hurricane main de-
velopment region induced by high (low) concentration
of dust in the tropical North Atlantic (Fig. 8b). The
spatial pattern of vertical wind shear related to dust
aerosol in the tropical North Atlantic is shown in Fig. 8c.
The positive wind shear–dust regression appears in the
tropical Atlantic south of 208N and the Sahel region,
indicating that high (low) concentration of dust is asso-
ciated with large (small) vertical wind shear, which is
unfavorable (favorable) for hurricane development.
Dust variability changes the meridional air temperature
gradient via dust–radiation processes (e.g., the dust-
related shortwave and longwave radiative heating), which,
in turn, alters the strength of the zonal winds or the
easterly jet (see next section) through the thermal wind
balance and thus the vertical wind shear. Indeed, Chen
et al. (2010) used a numerical model to show that dust–
radiation processes do change vertical profiles of winds
and temperatures.
The vertical wind shear variability may also be influ-
enced by indirect effect of dust on atmospheric circula-
tion. Dust concentration can affect other atmospheric
and oceanic processes and then vertical wind shear and
hurricanes, such as Sahel rainfall (Landsea and Gray
1992), the Saharan air layer (Dunion and Velden 2004),
and North Atlantic SST (Goldenberg et al. 2001; Evan
et al. 2008). The vertical wind shear during the summer
and fall in the hurricane main development region is
also related to the Atlantic warm pool (Wang et al. 2006)
and the Atlantic meridional mode (Vimont and Kossin
2007). Thus, it is possible that the coupled response of
winds and SST to dust radiative forcing may act to re-
inforce the wind shear anomalies via mechanisms de-
scribed by Evan et al. (2011). All of these processes are
not independent and can contribute to the changes of
vertical wind shear. Further studies in this topic are
needed.
4. African dust and dust in the tropical NorthAtlantic
Previous studies have suggested that Atlantic dust
storm frequency and intensity changes are related to or
FIG. 6. Linkage of the AMO, rainfall, and aerosol. Shown are (a)
regression (mm month21 8C21) of annual rainfall anomalies onto
the AMO index, (b) regression (mm month21 DAOD21) of annual
rainfall anomalies onto the DAOD time series in the tropical North
Atlantic, and (c) regression (Pa s21 8C21) of annual 500-hPa ver-
tical pressure velocity anomalies onto the AMO index. The re-
gressions are calculated based on the 7-yr running mean data. Only
regression coefficients exceeding the 95% significant level are
plotted.
FIG. 7. Linkage of the North Atlantic SST with rainfall using the
data with the linear trends included. Shown are (a) regression
(mm month21 8C21) of annual rainfall anomalies onto the North
Atlantic SST index and (b) regression (Pa s21 8C21) of annual
500-hPa vertical pressure velocity anomalies onto the North At-
lantic SST index. The regressions are calculated based on the 7-yr
running mean data. Only regression coefficients exceeding the
95% significant level are plotted.
1 AUGUST 2012 W A N G E T A L . 5409

are likely to be partially forced by variability in Sahelian
precipitation. For example, Prospero and Lamb (2003)
used the data from 1965 to 1998 to show that dust con-
centration observed on the island of Barbados in the
western tropical North Atlantic was highly and nega-
tively correlated with prior-year summer rainfall in
the Sahel region. Our analyses of Fig. 2 show that the
Sahel rainfall anomalies are inversely related to dust
in the tropical North Atlantic on multidecadal time
scales. The question is: What is the mechanism for the
negative relationship between Sahel rainfall and dust
in the tropical North Atlantic on multidecadal time
scales?
One possibility is that anomalously high precipitation
causes a ‘‘greening’’ of Africa (Nicholson et al. 1998)
and shrinking of dust source regions, increase in soil
moisture, and decrease in surface shear stress acting on
soils where vegetation is present (Marticorena et al.
1997). It is also possible that surface winds play an im-
portant role in dust production in the Sahel region. To
examine the role of surface winds, we identify the high
and low dust years by the top and bottom quartiles of the
DAOD time series, respectively. We then calculate the
composite wind difference between the high and low
dust years. The composite wind map from the NCEP–
NCAR reanalysis shows an increased surface wind
speed across the Sahel, centered near 158N, during pe-
riods of high minus low DAOD in the tropical North
Atlantic (Fig. 9a). An increase in surface wind speed over
dust source regions such as the Bodele Depression—the
lowest point in Chad and the planet’s largest single
source of dust (Washington et al. 2006)—would lead to
increased atmospheric dust loading since deflation is
proportional to surface shear stress (and surface shear
stress is proportional to the cube of the wind speed)
(Marticorena et al. 1997). Given the cubic sensitivity of
dust mobilization to wind speed, a small change of
winds can cause large change in dust output from the
Bodele (Washington et al. 2009) and other source
regions. To confirm the results, we repeat the calcu-
lations by using the ERA-40 reanalysis and the 20CR
reanalysis (Figs. 9b,c). The band of highest wind speed
is shifted about 58 north for the ERA-40 and 20CR,
but overall the patterns are similar: an increased sur-
face wind speed across the Sahel and thus more dust
production in the Bodele Depression.
Previous studies have suggested that reanalysis prod-
uct such as the NCEP–NCAR reanalysis might have
large uncertainty in many variables before the satellite
era (e.g., Trenberth and Guillemot 1998; Mahowald
et al. 2002, 2007). Here we repeat the calculations of
Fig. 9 using only the 1980–2008 period, when satellite
data are available. The wind distribution pattern is
similar to Fig. 9, except that the magnitude of wind
speed is larger (not shown). In addition, we also ana-
lyze the observed station data in the Western Sahel of
138–228N, 208W–158E provided by Mahowald et al.
(2007). Figure 10 shows the time series of the annual
average of the wind speed cube from the station data
in the Western Sahel. The cube of the wind speed also
shows the AMO signal. When the AMO was in the
cold phase from the 1970s to the early 1990s (as shown
earlier, the Sahel received less rainfall and the tropical
North Atlantic experienced high concentration of
dust), the wind speed cube had larger values. The
opposite was true when the AMO was in the warm
phases before the 1960s and after the early 1990s. The
correlation between the yearly time series of the wind
FIG. 8. Relationships of dust with Atlantic hurricanes and VWS.
Shown are (a) the time series of DAOD and the number of Atlantic
hurricanes, (b) the time series of DAOD and VWS, and (c) re-
gression (m s21 DAOD21) of VWS onto the DAOD time series in
the tropical North Atlantic. In (b), the VWS is calculated as the
magnitude of the vector difference between winds at 200- and
850-hPa in the main development region of 108–208N, 858–158W
during the hurricane season of June–November. The correlations
of dust with the number of hurricanes and VWS at 0 lag are 20.79
and 0.69, respectively. The regression is calculated based on the
7-yr running mean data. Only regression coefficients exceeding
the 95% significant level are plotted.
5410 J O U R N A L O F C L I M A T E VOLUME 25

speed cube (Fig. 10) and of dust in the tropical North
Atlantic (Fig. 2c) is 0.51 (above the 95% significance
level). If we choose high and low dust years used in
Fig. 9, Fig. 10 shows that the wind speed cube during
high dust years is 22.98 m3 s23 larger than during low
dust years. All of these results are consistent and suggest
that an increased wind speed can produce more dust in
the dust source region of the Bodele Depression.
The dust in the Bodele Depression can be transported
southwestward at low levels, and then vertical mixing
and vertical motion can allow the easterly flows to
transport it into the Atlantic. Washington et al. (2009)
computed the transport pathways from the Bodele De-
pression using a Lagrangian advection model driven by
the 3D ERA-40 reanalysis winds. They found that the
path of the trajectories in the peak dust-production
months could reach the Atlantic in 5 days. It has been
shown previously that transport of Saharan dust west-
ward from the African coast is most strongly correlated
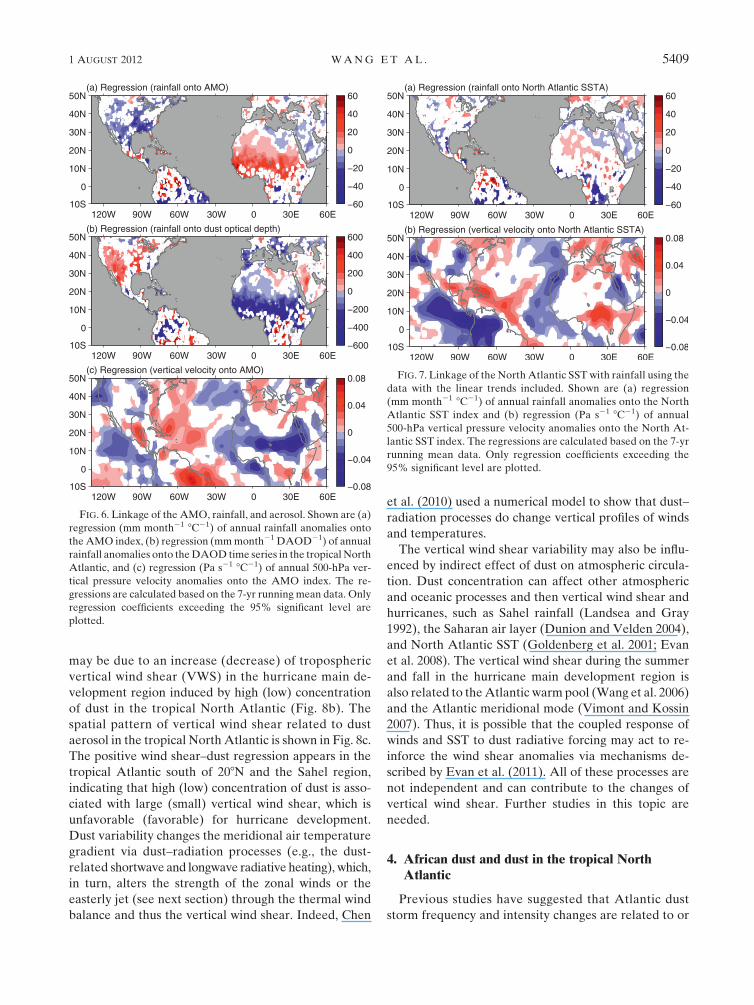
with winds at about 700 hPa (Kaufman et al. 2005b). We
therefore use the NCEP–NCAR reanalysis to calculate
the regression of wind at 700 hPa onto the DAOD time
series (Fig. 11a). The regressed wind at 700 hPa shows
that the maximum easterly wind anomalies are south
of the maximum dust band between 108 and 208N. The
inconsistency in the position of the maximum easterly
wind anomalies and the maximum dust band suggests
that the dust changes in the tropical North Atlantic
could be more due to enhanced dust production in the
Sahel and Saharan regions, as evidenced by the decrease
in precipitation (Fig. 6b) and the increase in surface
wind over these source regions (Figs. 9 and 10). If more
dust production occurs over the Sahel and Saharan re-
gions, then the tropical North Atlantic will experience
higher dust concentration because of transport by the
mean zonal winds. The mean zonal winds in West Africa
feature the African easterly jet (AEJ), which is a maxi-
mum near 600-hPa and 158N (Fig. 11b) and is formed
because of the temperature contrast between the Sahara
and Gulf of Guinea (e.g., Cook 1999). Figure 11c shows
that the strong easterly winds at 700 hPa associated with
the AEJ are across the entire tropical North Atlantic
FIG. 9. Composite surface wind differences between the high and
low dust years. Shown are from (a) the NCEP–NCAR reanalysis,
(b) the ERA-40 reanalysis, and (c) the 20CR reanalysis. The
shading represents the wind speed (m s21). The top and bottom
quartiles of the DAOD time series are identified as the high and
low dust years, respectively. For the NCEP–NCAR and 20CR, the
13 high dust years are 1962, 1973, 1974, 1975, 1979, 1981, 1983, 1984,
1985, 1986, 1987, 1988, and 1991; the 13 low dust years are 1955,
1956, 1957, 1958, 1961, 1964, 1976, 1977, 1996, 2003, 2004, 2005, and
2006. For the ERA-40, the 11 high dust years are 1962, 1973, 1974,
1975, 1979, 1981, 1983, 1984, 1985, 1986, and 1987; the 11 low dust
years are 1958, 1961, 1964, 1965, 1968, 1976, 1977, 1993, 1995, 1996,
and 2001. The green dot in (a) represents the Bodele Depression in
northern Chad—an area of some 40 000 km2 centered on 168N and
188E (Washington and Todd 2005).
FIG. 10. Time series of the annual average of the wind speed cube
(m3 s23) from the observed station data of Mahowald et al. (2007)
in the western Sahel (138–228N, 208W–158E). The time series is
linearly detrended. The black (gray) dots represent high (low) dust
years used in the calculation of Fig. 9.
1 AUGUST 2012 W A N G E T A L . 5411
between 108 and 208N. This distribution of the mean
winds is consistent with the maximum dust band be-
tween 108 and 208N, indicating that if more dust is pro-
duced over the Sahel, the tropical North Atlantic will
experience higher dust concentration due to transport
by the mean zonal winds.
The low levels of the atmosphere north of the Gulf of
Guinea coast are characterized by the summer monsoon
westerly winds (Fig. 11b). Our composite wind differ-
ence between the high and low dust years shows surface
easterly wind anomalies north of the Gulf of Guinea
coast (Fig. 9a). This indicates that a high dust year in the
tropical North Atlantic is associated with a weakening
of the southwesterly monsoon flow, which in turn is
connected to the observed decrease in Sahel pre-
cipitation (Giannini et al. 2003).
5. Discussion and summary
The observed results presented in this paper suggest
that a feedback process between the AMO and dust in
the tropical North Atlantic may operate through Sahel
rainfall variability. An initially warm North Atlantic
Ocean is associated with a northward shift of the At-
lantic ITCZ and southwesterly surface wind anomalies,
resulting in an increase of rainfall in the Sahel. The in-
creased rainfall leads to a decrease in source regions
for mineral aerosols (Mahowald 2007). Associated with
the decrease of aerosols in the semiarid regions of Africa
is a decrease of atmospheric wind-blown dust over the
tropical North Atlantic. This, in turn, is a positive feed-
back onto tropical North Atlantic SST via the aerosol
direct effect by changing the amount of solar radiation
reaching the ocean’s surface in agreement with earlier
studies (Foltz and McPhaden 2008a; Evan et al. 2009,
2011). However, further studies are needed to quantify
the impact of dust forcing on North Atlantic SST and to
determine the processes controlling African dust emis-
sion on multidecadal time scales. In particular, coupled
ocean–atmosphere–land models instead of ocean-only
models are needed to address the issue.
Our analyses suggest that surface processes over
Africa may be more important than changes in the low-
level winds over the tropical North Atlantic for dust
cover in the Atlantic. That is, the dust changes in the
tropical North Atlantic could be more due to increased
dust production in the Sahel and Saharan regions and
subsequent westward transport by the mean winds. Dust
production depends on the surface shear stress, which is
proportional to the cube of the wind speed. If the wind
speed is larger in the dust source region of Africa, more
dust is produced there and thus more dust is transported
to the tropical North Atlantic by the mean easterly
winds.
Almost all coupled climate models have difficulty
in simulating the magnitude and phase of the AMO
(Knight 2009; Medhaug and Furevik 2011), and one
reason may be that they are missing the positive dust–
AMO feedback proposed here. For example, for the few
model experiments included in the Coupled Model In-
tercomparison Project (CMIP) phase 3 database that
include dust, dust concentration is prescribed and does
not vary from one year to the next. Furthermore, model
dust concentrations are strongly dependent upon the
global surface area over which deflation occurs, and
there is considerable model spread in global desert area
in the future warming scenarios (Mahowald 2007).
Lastly, examination of a suite of coupled model exper-
iments show large disagreement in even the long-term
mean dust emissions and transport (Huneeus et al.
FIG. 11. Wind variations with dust and the mean winds. Shown
are (a) regression (m s21 DAOD21) of annual wind anomalies at
700 hPa onto the DAOD time series, (b) vertical–latitude section
of the mean zonal wind at 08 longitude during July–September, and
(c) the mean winds (vector) and the mean zonal winds (shading) at
700 hPa during July–September. Winds are in m s21. The re-
gression is calculated based on the detrended and 7-yr running
mean data. Only regressions exceeding the 95% significant level
are plotted.
5412 J O U R N A L O F C L I M A T E VOLUME 25

2011). We thus propose that one way to examine the
effectiveness of coupled models in the future CMIP
database, of which some will include interactive dust, is
to identify the extent to which the connection between
AMO-like variability and Atlantic dust cover, as ob-
served here, is reproduced in twentieth-century experi-
ments. Coupled climate models need to capture the
aerosol-related feedback for a realistic climate simula-
tion in the Atlantic.
African dust also affects cloudiness by changing con-
densation nuclei, the Saharan air layer, and atmospheric
vertical motion. For example, Kaufman et al. (2005a)
used the MODIS satellite data to show that aerosols
increase the coverage of shallow clouds in the tropical
Atlantic by increasing the number of condensation nuclei
and reducing the cloud droplet size. The aerosol-induced
cloud cover change can in turn affect the tropical North
Atlantic SST by changing the heat fluxes into the ocean.
Thus, the indirect effect of aerosols on cloud acts in the
same sense as the direct effect in terms of its impact on
tropical North Atlantic SST.
In summary, this paper uses a relatively long-term
dust dataset to show a multidecadal covariability of the
AMO, dust in the tropical North Atlantic, rainfall in the
Sahel and Atlantic hurricanes, and to propose a novel
mechanism for North Atlantic SST variability on multi-
decadal time scales. During the cold phase of the AMO
from the late 1960s to the early 1990s, the Sahel received
less rainfall and the tropical North Atlantic experienced
high concentration of dust. The opposite was true when the
AMOs were during the warm phases before the late 1960s
and after the early 1990s. The observed results suggest that
a positive feedback exists between North Atlantic SST,
African dust, and Sahel rainfall on multidecadal time
scales. An implication of this study is that coupled climate
models need to be able to simulate this aerosol-related
feedback in order to correctly simulate climate variability
and change in the North Atlantic. In addition to the re-
lationships with the AMO and Sahel rainfall, dust in the
tropical North Atlantic also varies multidecadally with
vertical wind shear in the hurricane main development
region, helping to explain the inverse relationship between
dust and the number of Atlantic hurricanes.
Acknowledgments. We thank three anonymous re-
viewers for their comments and suggestions that helped
improve the manuscript. We also thank Dr. Natalie
Mahowald for providing us the observed station data in
the Western Sahel. This work was supported by grants
from National Oceanic and Atmospheric Administration
(NOAA) Climate Program Office, the base funding of
NOAA Atlantic Oceanographic and Meteorological
Laboratory (AOML), and a grant from National Science
Foundation. The findings and conclusions in this report
are those of the author(s) and do not necessarily repre-
sent the views of the funding agency.
REFERENCES
Barnett, T. P., D. W. Pierce, K. M. AchutaRao, P. J. Gleckler,
B. D. Santer, J. M. Gregory, and W. M. Washington, 2005:
Penetration of human-induced warming into the world’s
oceans. Science, 309, 284–287.
Bell, G. D., and M. Chelliah, 2006: Leading tropical modes asso-
ciated with interannual and multidecadal fluctuations in North
Atlantic hurricane activity. J. Climate, 19, 590–612.
Chang, C.-Y., J. C. H. Chiang, M. F. Wehner, A. R. Friedman,
and R. Ruedy, 2011: Sulfate aerosol control of tropical At-
lantic climate over the twentieth century. J. Climate, 24, 2540–
2555.
Chen, S.-H., S.-H. Wang, and M. Waylonis, 2010: Modification of
Saharan air layer and environmental shear over the eastern
Atlantic Ocean by dust-radiation effects. J. Geophys. Res.,
115, D21202, doi:10.1029/2010JD014158.
Compo, G. P., and Coauthors, 2011: The Twentieth Century Re-
analysis project. Quart. J. Roy. Meteor. Soc., 137, 1–28.
Cook, K. H., 1999: Generation of the African easterly jet and its
role in determining West African precipitation. J. Climate, 12,
1165–1184.
Delworth, T. L., and M. E. Mann, 2000: Observed and simulated
multidecadal variability in the Northern Hemisphere. Climate
Dyn., 16, 661–676.
——, R. Zhang, and M. E. Mann, 2007: Decadal to centennial
variability of the Atlantic from observations and models.
Ocean Circulation: Mechanisms and Impacts, Geophys.
Monogr., Vol. 173, Amer. Geophys. Union, 131–148.
Dunion, J. P., and C. S. Velden, 2004: The impact of the Saharan
air layer on Atlantic tropical cyclone activity. Bull. Amer.
Meteor. Soc., 85, 353–365.
Dunstone, N. J., D. M. Smith, and R. Eade, 2011: Multi-year pre-
dictability of the tropical Atlantic atmosphere driven by the
high latitude North Atlantic Ocean. Geophys. Res. Lett., 38,
L14701, doi:10.1029/2011GL047949.
Enfield, D. B., A. M. Mestas-Nunez, and P. J. Trimble, 2001: The
Atlantic Multidecadal Oscillation and its relationship to
rainfall and river flows in the continental U.S. Geophys. Res.
Lett., 28, 2077–2080.
Evan, A. T., and S. Mukhopadhyay, 2010: African dust over
the northern tropical Atlantic: 1955–2008. J. Appl. Meteor.
Climatol., 49, 2213–2229.
——, J. Dunion, J. A. Foley, A. K. Heidinger, and C. S. Velden,
2006: New evidence for a relationship between Atlantic
tropical cyclone activity and African dust outbreaks. Geophys.
Res. Lett., 33, L19813, doi:10.1029/2006GL026408.
——, and Coauthors, 2008: Ocean temperature forcing by aero-
sols across the Atlantic tropical cyclone development re-
gion. Geochem. Geophys. Geosyst., 9, Q05V04, doi:10.1029/
2007GC001774.
——, D. J. Vimont, A. K. Heidinger, J. P. Kossin, and R. Bennartz,
2009: The role of aerosols in the evolution of tropical North
Atlantic Ocean temperature anomalies. Science, 324, 778–781,
doi:10.1126/Science.1167404.
——, G. R. Foltz, D. Zhang, and D. J. Vimont, 2011: Influence
of African dust on ocean–atmosphere variability in the trop-
ical Atlantic. Nat. Geosci., 4, 762–765, doi:10.1038/ngeo1276.
1 AUGUST 2012 W A N G E T A L . 5413
Folland, C. K., T. N. Palmer, and D. E. Parker, 1986: Sahel rainfall
and worldwide sea temperatures, 1901-85. Nature, 320, 602–607.
Foltz, G. R., and M. J. McPhaden, 2008a: Impact of Saharan dust
on tropical North Atlantic SST. J. Climate, 21, 5048–5060.
——, and ——, 2008b: Trends in Saharan dust and tropical Atlantic
climate during 1980–2006. Geophys. Res. Lett., 35, L20706,
doi:10.1029/2008GL035042.
Giannini, A., R. Saravanan, and P. Chang, 2003: Oceanic forcing of
Sahel rainfall on interannual to interdecadal time scales. Sci-
ence, 302, 1027–1030.
Goldenberg, S. B., C. W. Landsea, A. M. Mestas-Nunez, and
W. M. Gray, 2001: The recent increase in Atlantic hurricane
activity. Science, 293, 474–479.
Held, I. M., T. L. Delworth, J. Lu, K. L. Findell, and T. R. Knutson,
2005: Simulation of Sahel drought in the 20th and 21st cen-
turies. Proc. Natl. Acad. Sci. USA, 102, 17 891–17 896.
Huneeus, N., and Coauthors, 2011: Global dust model inter-
comparison in AeroCom phase I. Atmos. Chem. Phys., 11,
7781–7816, doi:10.5194/acp-11-7781-2011.
Jarvinen, B. R., C. J. Neumann, and M. A. Davis, 1984: A tropical
cyclone data tape for the North Atlantic Basin, 1886–1983:
Contents, limitations, and uses. NOAA Tech. Memo. NWS
NHC 22, 21 pp.
Kalnay, E., and Coauthors, 1996: The NCEP/NCAR 40-Year Re-
analysis Project. Bull. Amer. Meteor. Soc., 77, 437–471.
Kaufman, Y. J., I. Koren, L. A. Remer, D. Rosenfeld, and
Y. Rudich, 2005a: The effect of smoke, dust, and pollution
aerosol on shallow cloud development over the Atlantic
Ocean. Proc. Natl. Acad. Sci. USA, 102, 11 207–11 212.
——, ——, ——, D. Tanre, P. Ginoux, and S. Fan, 2005b: Dust
transport and deposition observed from the Terra-Moderate
Resolution Imaging Spectroradiometer (MODIS) spacecraft
over the Atlantic Ocean. J. Geophys. Res., 110, D10S12,
doi:10.1029/2003JD004436.
Knight, J. R., 2009: The Atlantic multidecadal oscillation inferred
from the forced climate response in coupled general circula-
tion models. J. Climate, 22, 1610–1625.
——, R. J. Allan, C. K. Folland, M. Vellinga, and M. E. Mann, 2005:
A signature of persistent natural thermohaline circulation
cycles in observed climate. Geophys. Res. Lett., 32, L20708,
doi:10.1029/2005GL024233.
Krebs, U., and A. Timmermann, 2007: Tropical air–sea interac-
tions accelerate the recovery of the Atlantic Meridional
Overturning Circulation after a major shutdown. J. Climate,
20, 4940–4956.
Landsea, C. W., and W. M. Gray, 1992: The strong association
between westen Sahelian monsoon rainfall and intense At-
lantic hurricanes. J. Climate, 5, 435–453.
Lu, J., and T. L. Delworth, 2005: Oceanic forcing of the late 20th
century Sahel drought. Geophys. Res. Lett., 32, L22706,
doi:10.1029/2005GL023316.
Mahowald, N. M., 2007: Anthropocene changes in desert area:
Sensitivity to climate model predictions. Geophys. Res. Lett.,
34, L18817, doi:10.1029/2007GL030472.
——, C. S. Zender, C. Luo, D. Savoie, O. Torres, and J. del Corral,
2002: Understanding the 30-year Barbados desert dust record.
J. Geophys. Res., 107, 4561, doi:10.1029/2002JD002097.
——, J.-A. Ballantine, J. Feddema, and N. Ramankutty, 2007:
Global trends in visibility: Implications for dust sources. At-
mos. Chem. Phys., 7, 3309–3337.
——, and Coauthors, 2010: Observed 20th century desert dust
variability: Impact on climate and biogeochemistry. Atmos.
Chem. Phys., 10, 10 875–10 893.
Mann, M. E., and K. A. Emanuel, 2006: Atlantic hurricane trends
linked to climate change. Eos, Trans. Amer. Geophys. Union,
87, 233–244, doi:10.1029/2006EO240001.
Marticorena, B., G. Bergametti, B. Aumont, Y. Callot, C. N’Doume,
and M. Legrand, 1997: Modeling the atmospheric dust cycle 2.
Simulation of Saharan dust sources. J. Geophys. Res., 102D,
4387–4404.
McCabe, G., M. Palecki, and J. Betancourt, 2004: Pacific and
Atlantic Ocean influences on multidecadal drought fre-
quency in the United States. Proc. Natl. Acad. Sci. USA, 101,
4136–4141.
Medhaug, I., and T. Furevik, 2011: North Atlantic 20th century
multidecadal variability in coupled climate models: Sea sur-
face temperature and ocean overturning circulation. Ocean
Sci., 7, 389–404.
Mohino, E., S. Janicot, and J. Bader, 2011: Sahel rainfall and de-
cadal to multidecadal sea surface temperature variability.
Climate Dyn., 37, 419–440.
Mukhopadhyay, S., and P. Kreycik, 2008: Dust generation and
drought patterns in Africa from helium-4 in a modern Cape
Verde coral. Geophys. Res. Lett., 35, L20820, doi:10.1029/
2008GL035722.
Nicholson, S. E., C. J. Tucker, and M. B. Ba, 1998: Desert-
ification, drought, and surface vegetation: An example from
the West African Sahel. Bull. Amer. Meteor. Soc., 79, 815–
829.
Ottera, O. H., M. Bentsen, H. Drange, and L. Suo, 2010: External
forcing as a metronome for Atlantic multidecadal variability.
Nat. Geosci., 3, 688–694.
Prospero, J. M., and P. J. Lamb, 2003: African droughts and dust
transport to the Caribbean: Climate change implications.
Science, 302, 1024–1027.
Quenouille, M. H., 1952: Associated Measurements. Butterworths
Scientific Publications, 242 pp.
Rotstayn, L. D., and U. Lohmann, 2002: Tropical rainfall trends
and the indirect aerosol effect. J. Climate, 15, 2103–2116.
Rudolf, B., H. Hauschild, W. Ruth, and U. Schneider, 1994: Ter-
restrial precipitation analysis: Operational method and re-
quired density of point measurements. Global Precipitation
and Climate Change, M. Dubois and M. Desalmand, Eds.,
Springer-Verlag, 173–186.
Smith, T. M., R. W. Reynolds, T. C. Peterson, and J. Lawrimore,
2008: Improvements to NOAA’s historical merged land–
ocean surface temperature analysis (1880–2006). J. Climate,
21, 2283–2296.
Stocker, T. F., 1998: The seesaw effect. Science, 282, 61–62.
Sutton, R. T., and D. L. R. Hodson, 2007: Climate response to
basin-scale warming and cooling of the North Atlantic Ocean.
J. Climate, 20, 891–907.
Ting, M., Y. Kushnir, R. Seager, and C. Li, 2009: Forced and in-
ternal twentieth-century SST trends in the North Atlantic.
J. Climate, 22, 1469–1481.
Trenberth, K. E., and C. J. Guillemot, 1998: Evaluation of the at-
mospheric moisture and hydrological cycle in the NCEP/
NCAR reanalysis. Climate Dyn., 14, 213–231.
——, and D. J. Shea, 2006: Atlantic hurricanes and natural vari-
ability in 2005. Geophys. Res. Lett., 33, L12704, doi:10.1029/
2006GL026894.
Uppala, S. M., and Coauthors, 2005: The ERA-40 Re-Analysis.
Quart. J. Roy. Meteor. Soc., 131, 2961–3012.
Vimont, D. J., and J. P. Kossin, 2007: The Atlantic Meridional
Mode and hurricane activity. Geophys. Res. Lett., 34, L07709,
doi:10.1029/2007GL029683.
5414 J O U R N A L O F C L I M A T E VOLUME 25

Wang, C., and S.-K. Lee, 2009: Co-variability of tropical cyclones in the
North Atlantic and the eastern North Pacific. Geophys. Res. Lett.,
36, L24702, doi:10.1029/2009GL041469.
——, and S. Dong, 2010: Is the basin-wide warming in the North
Atlantic Ocean related to atmospheric carbon dioxide and
global warming? Geophys. Res. Lett., 37, L08707, doi:10.1029/
2010GL042743.
——, D. B. Enfield, S.-K. Lee, and C. W. Landsea, 2006: Influences
of the Atlantic warm pool on Western Hemisphere summer
rainfall and Atlantic hurricanes. J. Climate, 19, 3011–3028.
——, S.-K. Lee, and D. B. Enfield, 2008: Atlantic warm pool acting
as a link between Atlantic multidecadal oscillation and At-
lantic tropical cyclone activity. Geochem. Geophys. Geosyst.,
9, Q05V03, doi:10.1029/2007GC001809.
Washington, R., and M. C. Todd, 2005: Atmospheric controls on
mineral dust emission from the Bodele Depression, Chad: The
role of the low level jet. Geophys. Res. Lett., 32, L17701,
doi:10.1029/2005GL023597.
——, and Coauthors, 2006: Links between topography, wind,
deflation, lakes and dust: The case of the Bodele Depres-
sion, Chad. Geophys. Res. Lett., 33, L09401, doi:10.1029/
2006GL025827.
——, and Coauthors, 2009: Dust as a tipping element: The Bodele
depression, Chad. Proc. Natl. Acad. Sci., 106, 20564–20571.
Zhang, R., and T. L. Delworth, 2006: Impact of Atlantic multi-
decadal oscillations on India/Sahel rainfall and Atlantic
hurricanes. Geophys. Res. Lett., 33, L17712, doi:10.1029/
2006GL026267.
——, ——, and I. M. Held, 2007: Can the Atlantic Ocean drive
the observed multidecadal variability in Northern Hemi-
sphere mean temperature? Geophys. Res. Lett., 34, L02709,
doi:10.1029/2006GL028683.
1 AUGUST 2012 W A N G E T A L . 5415