Multi-criteria evaluation to select sites for ecotourism facilities: a case study Miankaleh...
23
This article was downloaded by: [University of Tehran] On: 01 May 2013, At: 12:18 Publisher: Routledge Informa Ltd Registered in England and Wales Registered Number: 1072954 Registered office: Mortimer House, 37-41 Mortimer Street, London W1T 3JH, UK Anatolia: An International Journal of Tourism and Hospitality Research Publication details, including instructions for authors and subscription information: http://www.tandfonline.com/loi/rana20 Multi-criteria evaluation to select sites for ecotourism facilities: a case study Miankaleh Peninsula Manijeh Ghahroudi Tali a , Seyed Hasan Sadough a , Mohammad Ali Nezammahalleh a & Sakineh Khatoon Nezammahalleh a a Department of Geography, Shahid Beheshti University, Tehran, Islamic Republic of Iran Published online: 15 Aug 2012. To cite this article: Manijeh Ghahroudi Tali , Seyed Hasan Sadough , Mohammad Ali Nezammahalleh & Sakineh Khatoon Nezammahalleh (2012): Multi-criteria evaluation to select sites for ecotourism facilities: a case study Miankaleh Peninsula, Anatolia: An International Journal of Tourism and Hospitality Research, 23:3, 373-394 To link to this article: http://dx.doi.org/10.1080/13032917.2012.712872 PLEASE SCROLL DOWN FOR ARTICLE Full terms and conditions of use: http://www.tandfonline.com/page/terms-and-conditions This article may be used for research, teaching, and private study purposes. Any substantial or systematic reproduction, redistribution, reselling, loan, sub-licensing, systematic supply, or distribution in any form to anyone is expressly forbidden. The publisher does not give any warranty express or implied or make any representation that the contents will be complete or accurate or up to date. The accuracy of any instructions, formulae, and drug doses should be independently verified with primary sources. The publisher shall not be liable for any loss, actions, claims, proceedings, demand, or costs or damages whatsoever or howsoever caused arising directly or indirectly in connection with or arising out of the use of this material.
-
Upload
independent -
Category
Documents
-
view
3 -
download
0
Transcript of Multi-criteria evaluation to select sites for ecotourism facilities: a case study Miankaleh...
This article was downloaded by: [University of Tehran]On: 01 May 2013, At: 12:18Publisher: RoutledgeInforma Ltd Registered in England and Wales Registered Number: 1072954 Registeredoffice: Mortimer House, 37-41 Mortimer Street, London W1T 3JH, UK
Anatolia: An International Journal ofTourism and Hospitality ResearchPublication details, including instructions for authors andsubscription information:http://www.tandfonline.com/loi/rana20
Multi-criteria evaluation to select sitesfor ecotourism facilities: a case studyMiankaleh PeninsulaManijeh Ghahroudi Tali a , Seyed Hasan Sadough a , Mohammad AliNezammahalleh a & Sakineh Khatoon Nezammahalleh aa Department of Geography, Shahid Beheshti University, Tehran,Islamic Republic of IranPublished online: 15 Aug 2012.
To cite this article: Manijeh Ghahroudi Tali , Seyed Hasan Sadough , Mohammad Ali Nezammahalleh& Sakineh Khatoon Nezammahalleh (2012): Multi-criteria evaluation to select sites for ecotourismfacilities: a case study Miankaleh Peninsula, Anatolia: An International Journal of Tourism andHospitality Research, 23:3, 373-394
To link to this article: http://dx.doi.org/10.1080/13032917.2012.712872
PLEASE SCROLL DOWN FOR ARTICLE
Full terms and conditions of use: http://www.tandfonline.com/page/terms-and-conditions
This article may be used for research, teaching, and private study purposes. Anysubstantial or systematic reproduction, redistribution, reselling, loan, sub-licensing,systematic supply, or distribution in any form to anyone is expressly forbidden.
The publisher does not give any warranty express or implied or make any representationthat the contents will be complete or accurate or up to date. The accuracy of anyinstructions, formulae, and drug doses should be independently verified with primarysources. The publisher shall not be liable for any loss, actions, claims, proceedings,demand, or costs or damages whatsoever or howsoever caused arising directly orindirectly in connection with or arising out of the use of this material.
Multi-criteria evaluation to select sites for ecotourism facilities:a case study Miankaleh Peninsula
Manijeh Ghahroudi Tali*, Seyed Hasan Sadough, Mohammad Ali Nezammahalleh and
Sakineh Khatoon Nezammahalleh
Department of Geography, Shahid Beheshti University, Tehran, Islamic Republic of Iran
(Received 29 December 2011; final version received 12 July 2012)
To select sites for ecotourism facilities in Miankaleh Peninsula, the study used multi-criteria evaluation (MCE). In the Peninsula, ecotourism is in its incipient stage ofexpansion. It is essential to identify, in advance, suitable sites for the facilities as theobjective of this research. Thus, three sets of environmental, economic, and geodatacriteria were included. MCE helps integrate the conflict goals. We devised some novelmethods, in addition to common methods, for assigning weights to 17 criteria. Theweights were determined by analytic hierarchy process and then combined thanks toArcGIS Spatial Analysis. This combination suggested seven sites as the most suitable.The results indicate that these sites qualify the included conditions.
Keywords: marine protected area; Miankaleh Peninsula; multi-criteria evaluation;ecotourism
Introduction
Human life is dependent on the environment (Wallis, Michelle, & Anneke, 2010) and we
should protect it for our survival and welfare; and for protecting it, the capabilities and
weaknesses of each given point of the earth surface must accurately be detected. Thus, it is
important to provide the human society with development and welfare and to conserve the
environment. The importance of the environment, protection of plant and animal life and
biodiversity are a wise and accepted fact, as at the 2002 World Summit on Sustainable
Development in Johannesburg, it was agreed by 190 countries to achieve a reduction in the
rate of biodiversity loss (Bertzky & Stoll-Kleemann, 2009). Protected areas are well
efficient in achieving the goal. There are more than 170,000 protected areas worldwide till
now that were determined by different authority sources (Bertzky & Stoll-Kleemann,
2009). Until 2010 management effectiveness at least in 35,000 of these areas must be
evaluated. Therefore, in environmental dimension it is necessary that managers of these
areas try to minimize physical and social impacts of human activities, including tourism,
on the environment (Wunder, 2000).
According to the World Tourism Organization (WTO), tourism as the third largest
industry, after oil and automobile industries, will continue to grow in the coming decades. It
is believed that tourism is an industry with fastest growth in the world. Ecotourism is the
most rapidly growing segment of the industry (Campbell, 1999). Ecotourism is a responsible
travel to natural environments which conserves the environment and provides locals with
ISSN 1303-2917 print/ISSN 2156-6909 online
q 2012 Taylor & Francis
http://dx.doi.org/10.1080/13032917.2012.712872
http://www.tandfonline.com
*Corresponding author. Email: [email protected]
Anatolia – An International Journal of Tourism and Hospitality Research
Vol. 23, No. 3, November 2012, 373–394
Dow
nloa
ded
by [
Uni
vers
ity o
f T
ehra
n] a
t 12:
18 0
1 M
ay 2
013
welfare (international ecotourism society). Therefore, it is a travel for sustainable
recreational use of nature and visiting natural manifestations. Fennel (2001) identified 85
definitions for ecotourism and from those, Weaver and Lawton (2007) presented three
criteria for the definition of ecotourism: (1) nature-based attractions, (2) education of visitors
in interaction with attractions, and (3) following human and biological sustainability in
experience and product management. Ecotourists or nature-based tourists are people who
travel to the natural environments for visit and use of nature or sport; their travel is with
education from nature and they are responsible for conserving the environment.
Ecotourism can support human life, bring about materials and energy, and absorb
waste products (Daily, 1997). It is claimed that ecotourism can integrate environmental
responsibility with economic benefits so that it can be considered as both an establishment
for economic development and a motive for environmental protection. To protect the
environment, economic stimulus is necessary particularly in remote regions with weak
government supervision (Wunder, 2000). Estimates reveal that in 1988, there were
between 157 and 236 million international ecotourists with economic impacts of $233
billion (Campbell, 1999). In developing countries, this rapidly growing industry was
proved to be a means for foreign exchanges and it can be described as an essential mean to
provide employment and generate income particularly in underdeveloped areas with
natural richness because it requires low initial investments (Wunder, 2000). Developing
countries are dealing with issues such as rapid population growth, pressure in labour force,
foreign debts, and lack of capital (Gossling, 1999). Thus, ecotourism is capable of
redistributing economic resources, mitigating harsh socio-economic circumstances, and
preserving biodiversity (Boo, 1990; Gossling, 1999).
Therefore, ecotourism with the highly fast rate of growth worldwide generates much
income, helps poor regions develop, and protects the environmental conditions. Iran, as a
developing country, has many different natural attractions with a wide variety of
topographic and climatic situations from very humid to arid climatic conditions and from
very high mountain summits to elevations under the sea level. Due to these natural
conditions and historical heritage, Iran is among the top 10 countries in tourism potentials
and among the top 5 in biodiversity. Despite these potentials, Iran is situated in 68th order
out of 150 members of WTO. To decrease the dependence of the country on the income
from oil industry, it is recommended to assume some other industries and activities; one of
these is ecotourism emphasizing the sustainable use of natural resources and conservation
of the environment. For such an activity some preparations and infrastructures are needed
to help well obtain the real goals with least possible harmful effects. Therefore, ecotourism
development is recommended in this country and the development needs establishment of
some facilities, and the location of these facilities is important for successful planning.
Marine and coastal protected areas can be defined as
any confined area within or adjacent to the marine environment, together with its overlyingwaters and associated flora, fauna, and historical and cultural features, which has beenreserved by legislation or other effective means, including custom, with the effect that itsmarine and/or coastal biodiversity enjoy a higher level of protection than its surroundings.(Yagi, Takagi, Takada, & Kurokura, 2010)
Miankaleh Peninsula, as a marine and coastal protected area, according to the International
Union of the Conservation of Nature (IUCN) categorization (1990), falls into the wildlife
sanctuary category that must be managed for conservation in which tourism can be
allowed (IUCN, 1990). In the study area, ecotourism is in its initial stage of development.
Given the notable natural attractions of Iran and the special location of the area in a
province, Mazandaran, with the highest percentage of ecotourists in the country, it is
374 M. Ghahroudi Tali et al.
Dow
nloa
ded
by [
Uni
vers
ity o
f T
ehra
n] a
t 12:
18 0
1 M
ay 2
013
inevitable that ecotourism activities in the near future will expand more over the study
area. This expansion will be through high demands of ecotourists as well as through
government development plan policies (Alipour & Heydari, 2005).
On the other hand, according to the sustainable development indicators (UNESCO,
2005), the goals of biodiversity, and the high willingness to pay of the region visitors for
the nature (Amirnejad, Khalilian, Assareh, & Ahmadian, 2006), planning for ecotourism
can be recommended for the aims of social and economic development, visitor welfare,
and reduction in biodiversity loss; as Wunder (2000) stated that such “local incomes are
both a goal in itself and an instrument for conservation”. In planning for ecotourism
development in the area, it is necessary to establish some infrastructures for visitors in
natural environments. The location of these facilities is important in order to minimize
human impacts on the environment and, on the other hand, keep visitors satisfied along
their stay. Therefore, it is essential to select, before any expansion, suitable sites for the
purpose of development of ecotourism facilities (e.g. campgrounds, ecolodge, toilets, and
restaurants) in order to prevent the establishment of these facilities in sensitive points
where may have some devastating impacts on the environment or may dissatisfy visitors
(Abdelhamied, 2011). Thus, the objective of this study was to determine suitable sites for
possible establishment and development of ecotourism facilities and infrastructures
including camping sites, toilets, and sport facilities on this study area so that these facilities
have least impacts on the natural environment and most ability to satisfy ecotourists.
Literature review
A proper decision-making can result by the presence of an appropriate evaluation system
that helps well obtain the purposes of conservation and development in protected areas
(Bertzky&Stoll-Kleemann, 2009; Tucker et al., 2005).Multi-criteria evaluation (MCE) is a
method for decision-making with many different and conflict criteria in choosing a suitable
site (Hossain & Nani, 2010; Voogd, 1983; Zucca, Sharifi, & Fabbri, 2008). Accomplishing
the MCE involves creation of consistent alternatives and subsequent ranking of them based
on their importance. There are some disadvantages of MCE, for example, it does not
adequately address the facilitation issue of interaction between analyst and decisionmakers
to elicit and revise preferences as part of the iterative process particularly with multiple
decision makers. So a jury process must be applied. The integration of the analytical
techniques designed to deal withMCE issues with Geographical Information System (GIS)
capabilities results in more functionality. GIS applications are useful in classification,
processing, andmanipulation of spatial databases and, as a result, the integration ofMCE in
GIS environment helps the user improve decision-making processes. Despite the recently
widespread application of MCE in the context of GIS-based decision-making, such an
application in tourism research is slight and GIS was not well utilized in strategic decision
problems (Brown, 2006; Feick &Hall, 1999). In this study, for the first time, we applied the
MCEmethod for selecting the best sites for ecotourism facilities.Many criteria that onemay
find effective in this site selection are incorporated. The appropriate methods to determine
weights are illustrated so concise and applicable that they can be conducted in any other area
with similar circumstances.
Study area
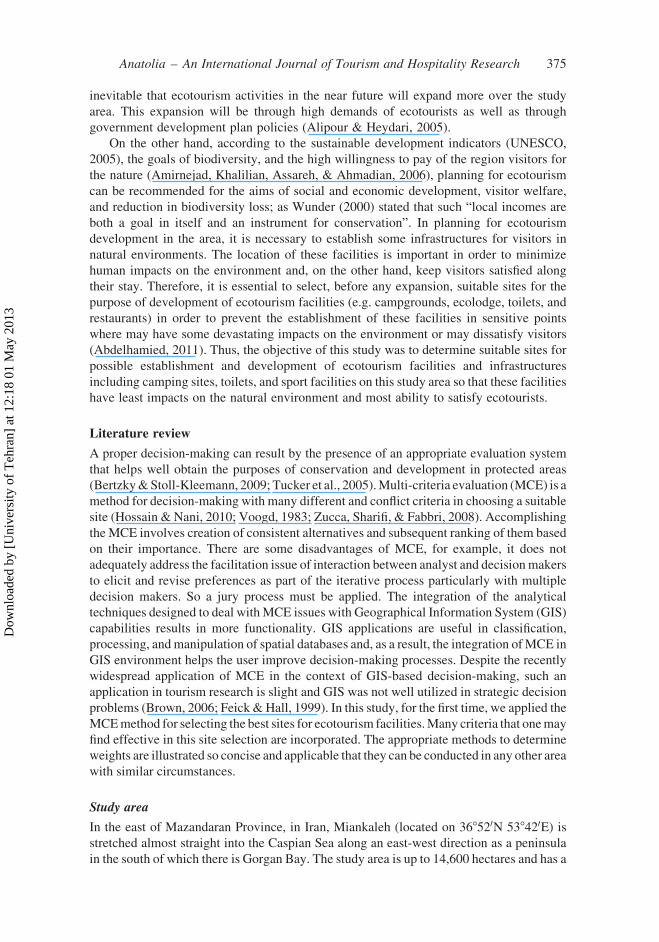
In the east of Mazandaran Province, in Iran, Miankaleh (located on 368520N 538420E) is
stretched almost straight into the Caspian Sea along an east-west direction as a peninsula
in the south of which there is Gorgan Bay. The study area is up to 14,600 hectares and has a
Anatolia – An International Journal of Tourism and Hospitality Research 375
Dow
nloa
ded
by [
Uni
vers
ity o
f T
ehra
n] a
t 12:
18 0
1 M
ay 2
013
flat topography with no considerable reliefs and with gentle slope and composed of mainly
old and recent sand dunes (Iran Geology Map, 2003). The average monthly temperature is
about 178C and the average relative humidity is 82% and the average annual precipitation
is about 560mm (Iran Meteorological Organization). The area is covered approximately
by 73% of Punica granatum, Rhamnus pallasii, and Rabus persicus P. granatum and
overlapping with other species. Annually 144 kinds of birds migrate to the habitat where
there are eight prevalent animal species. Based on Emberger coefficient it has a subhumid
climate. The population in the protected area changes seasonally from nearly 200 to 1000
people who engaged to a large extent in fishing, cattle ranching, and partly in agriculture
(Iran Statistical Center, 2011). Almost all the people who are owners of livestock or are
herders stay temporarily in the region and rarely may stay overnight. They dwell in the
surrounding rural or urban centres. There are 388 corrals for sheep, buffaloes, and horses
and 23% of the whole area is under agricultural. The area has natural wildlife with very
little human intervention. When inside the area we can see a beautiful view to the sea
towards both the north and the south and looking towards the south we can see the Alborz
Mountain Range far away with dense tree coverage. Natural silence prevails over the area.
This silence and wildness next to the sea and mountain is an important attraction of the
area. As Kroonenberg (2007) said, these coastal areas require awareness and accurate
management (Figure 1).
Methodology
In this study, we used two types of questionnaires: the first questionnaire measures 70
ecotourists’ satisfaction about attractions and facilities. The second questionnaire was
designed to ask 35 experts questions about their preferences of all criteria, and alternatives
to six criteria (Figure 2) to determine the appropriate weights for the analytic hierarchy
process (AHP). The experts mainly university professors and Environmental Organization
practitioners have specialties in environmental, tourism planning studies. They were asked
to suggest their own preferences about each pair of criteria as ratio. For reliability and
validity, we used Cronbach’s alpha coefficient and Kaiser-Meyer-Olkin (KMO) index.
The first questionnaire has alpha coefficient of 0.74 and KMO index of 0.63 that is
acceptable for the purpose of the study (Kristof, 1963).
Scanned maps including the geology map at scale of 1:100,000, a sheet of topographic
map, at scale of 1:250,000, and three sheets of topographic maps, at scale of 1:50,000, as
well as eight sheets of digital maps, at scale of 1:25,000, were collected. Images of Landsat
ETM þ 2005 (USGS, 2001) and panchromatic Indian Remote Sensing (IRS) of 2006 with
30 and 5m spatial resolution, respectively, were preprocessed for subsequent analyses.
Statistical data collected from the nearby climatic and meteorological stations helped
interpolate the climate spatially.
The published studies including Miankaleh Comprehensive Project (MCP, 2003) by
Mazandaran Environmental Organization were also used. IUCN presents a method based
on which it is possible to identify the categories of plant and animal species in the red that
are in the near future may be in danger of extinction (Keith, Auld, Ooi, & Mackenzie,
2000). As stated by Rodrigues et al. (2006), in spite of red list limitations, it provides a
strong management tool for conservation of species. Therefore, the eight categories of the
list in a new method are used as a tool to determine weights for both plant and animal
habitats as two environmental criteria for site selection in the study. The conducted survey
had two stages of fieldwork: the first for observing and collecting data and the second to
analyse the produced results and to understand the analysis accuracy. In the first stage,
376 M. Ghahroudi Tali et al.
Dow
nloa
ded
by [
Uni
vers
ity o
f T
ehra
n] a
t 12:
18 0
1 M
ay 2
013
some data were collected to measure dune vulnerability parameters in predesigned sheets
and to collect questionnaire data.
Assigning within subject weights for criteria
In this research, a process was followed to achieve a final suitability map. This map
resulted from combining a set of 17 map layers as criteria. As illustrated in Figure 2, for
creation of the map we followed some procedures. Weights are assigned to spatial units of
a layer (criterion) in an order. In order to identify the trade-offs in the decision-making
process, with the ultimate goal of achieving a compromise, the area of each spatial layer
after getting weights was classified based on a certain objective into 10 classes from the
most suitable with high values to the least suitable with low values. Then after weighting
each layer, all were combined. In this study, for the ordering of each different criterion we
used an appropriate method. After normalization and application of AHP and consistency
calculation, these criteria were combined to reveal the selected sites (Figure 2). In the
Figure 1. Position of the study area.
Anatolia – An International Journal of Tourism and Hospitality Research 377
Dow
nloa
ded
by [
Uni
vers
ity o
f T
ehra
n] a
t 12:
18 0
1 M
ay 2
013
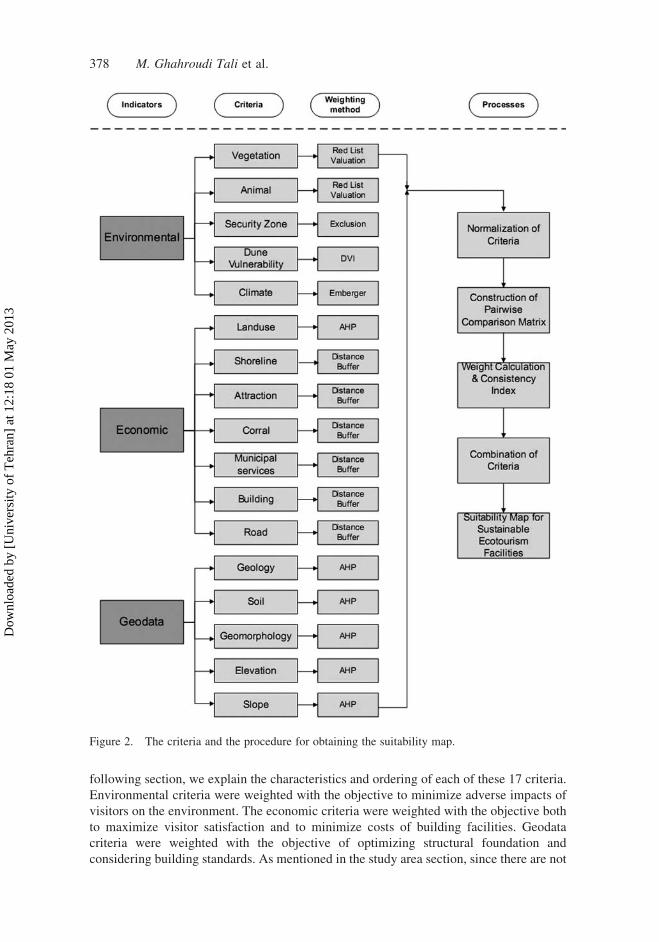
following section, we explain the characteristics and ordering of each of these 17 criteria.
Environmental criteria were weighted with the objective to minimize adverse impacts of
visitors on the environment. The economic criteria were weighted with the objective both
to maximize visitor satisfaction and to minimize costs of building facilities. Geodata
criteria were weighted with the objective of optimizing structural foundation and
considering building standards. As mentioned in the study area section, since there are not
Figure 2. The criteria and the procedure for obtaining the suitability map.
378 M. Ghahroudi Tali et al.
Dow
nloa
ded
by [
Uni
vers
ity o
f T
ehra
n] a
t 12:
18 0
1 M
ay 2
013
many residents inside the area, it was difficult to include some social criteria; but in the
layer of distance from buildings and municipal services, it was tried to take this component
of ecotourism into account.
Plant and animal
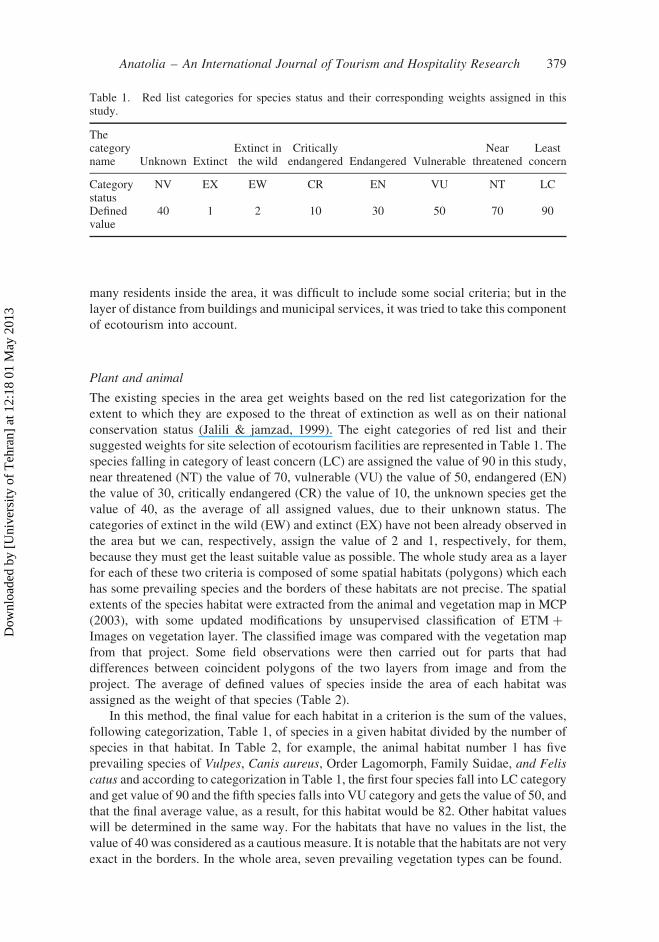
The existing species in the area get weights based on the red list categorization for the
extent to which they are exposed to the threat of extinction as well as on their national
conservation status (Jalili & jamzad, 1999). The eight categories of red list and their
suggested weights for site selection of ecotourism facilities are represented in Table 1. The
species falling in category of least concern (LC) are assigned the value of 90 in this study,
near threatened (NT) the value of 70, vulnerable (VU) the value of 50, endangered (EN)
the value of 30, critically endangered (CR) the value of 10, the unknown species get the
value of 40, as the average of all assigned values, due to their unknown status. The
categories of extinct in the wild (EW) and extinct (EX) have not been already observed in
the area but we can, respectively, assign the value of 2 and 1, respectively, for them,
because they must get the least suitable value as possible. The whole study area as a layer
for each of these two criteria is composed of some spatial habitats (polygons) which each
has some prevailing species and the borders of these habitats are not precise. The spatial
extents of the species habitat were extracted from the animal and vegetation map in MCP
(2003), with some updated modifications by unsupervised classification of ETM þ
Images on vegetation layer. The classified image was compared with the vegetation map
from that project. Some field observations were then carried out for parts that had
differences between coincident polygons of the two layers from image and from the
project. The average of defined values of species inside the area of each habitat was
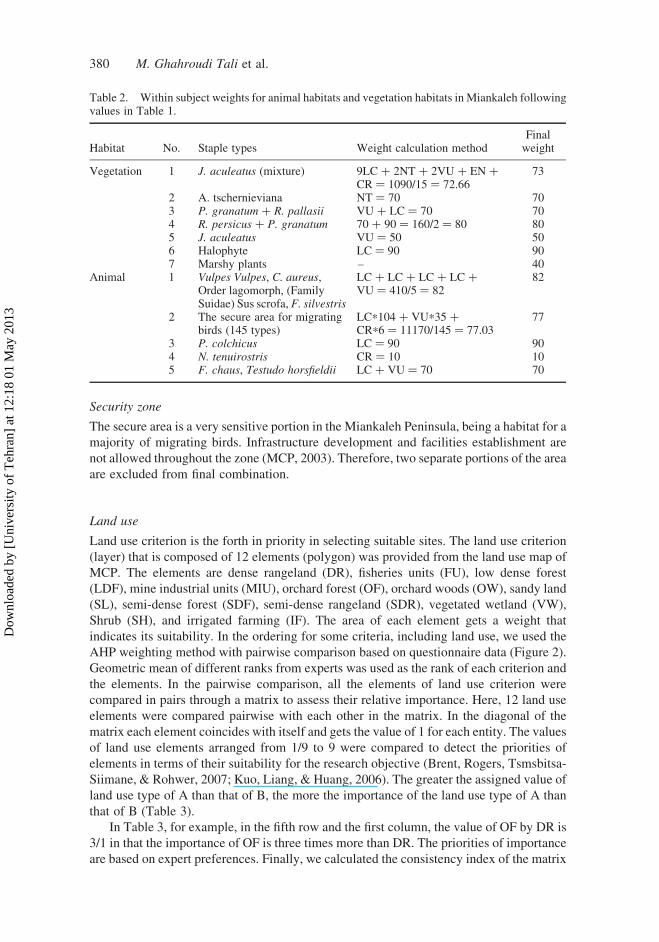
assigned as the weight of that species (Table 2).
In this method, the final value for each habitat in a criterion is the sum of the values,
following categorization, Table 1, of species in a given habitat divided by the number of
species in that habitat. In Table 2, for example, the animal habitat number 1 has five
prevailing species of Vulpes, Canis aureus, Order Lagomorph, Family Suidae, and Felis
catus and according to categorization in Table 1, the first four species fall into LC category
and get value of 90 and the fifth species falls into VU category and gets the value of 50, and
that the final average value, as a result, for this habitat would be 82. Other habitat values
will be determined in the same way. For the habitats that have no values in the list, the
value of 40 was considered as a cautious measure. It is notable that the habitats are not very
exact in the borders. In the whole area, seven prevailing vegetation types can be found.
Table 1. Red list categories for species status and their corresponding weights assigned in thisstudy.
Thecategoryname Unknown Extinct
Extinct inthe wild
Criticallyendangered Endangered Vulnerable
Nearthreatened
Leastconcern
Categorystatus
NV EX EW CR EN VU NT LC
Definedvalue
40 1 2 10 30 50 70 90
Anatolia – An International Journal of Tourism and Hospitality Research 379
Dow
nloa
ded
by [
Uni
vers
ity o
f T
ehra
n] a
t 12:
18 0
1 M
ay 2
013
Security zone
The secure area is a very sensitive portion in the Miankaleh Peninsula, being a habitat for a
majority of migrating birds. Infrastructure development and facilities establishment are
not allowed throughout the zone (MCP, 2003). Therefore, two separate portions of the area
are excluded from final combination.
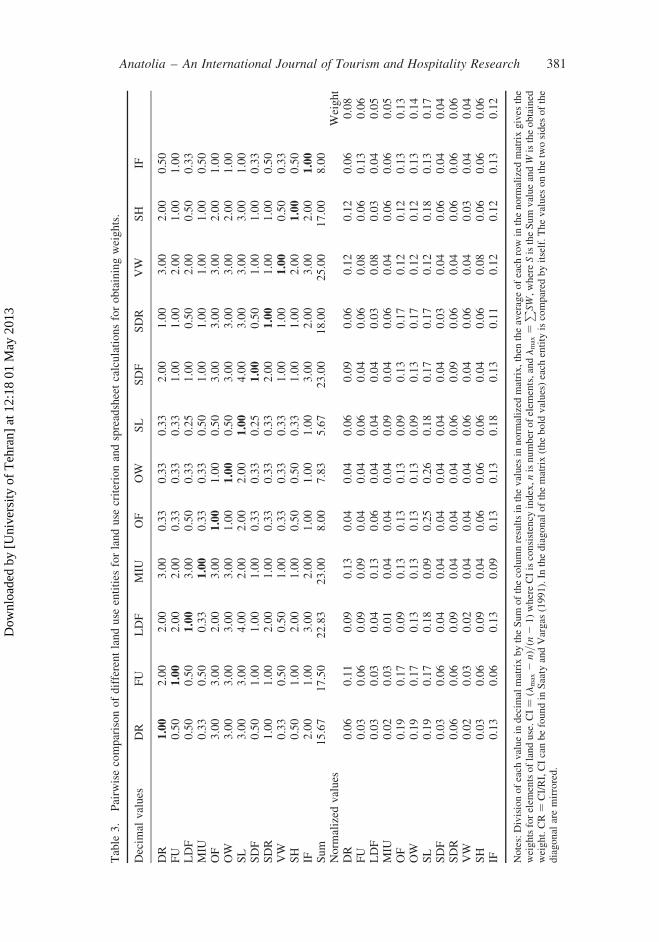
Land use
Land use criterion is the forth in priority in selecting suitable sites. The land use criterion
(layer) that is composed of 12 elements (polygon) was provided from the land use map of
MCP. The elements are dense rangeland (DR), fisheries units (FU), low dense forest
(LDF), mine industrial units (MIU), orchard forest (OF), orchard woods (OW), sandy land
(SL), semi-dense forest (SDF), semi-dense rangeland (SDR), vegetated wetland (VW),
Shrub (SH), and irrigated farming (IF). The area of each element gets a weight that
indicates its suitability. In the ordering for some criteria, including land use, we used the
AHP weighting method with pairwise comparison based on questionnaire data (Figure 2).
Geometric mean of different ranks from experts was used as the rank of each criterion and
the elements. In the pairwise comparison, all the elements of land use criterion were
compared in pairs through a matrix to assess their relative importance. Here, 12 land use
elements were compared pairwise with each other in the matrix. In the diagonal of the
matrix each element coincides with itself and gets the value of 1 for each entity. The values
of land use elements arranged from 1/9 to 9 were compared to detect the priorities of
elements in terms of their suitability for the research objective (Brent, Rogers, Tsmsbitsa-
Siimane, & Rohwer, 2007; Kuo, Liang, & Huang, 2006). The greater the assigned value of
land use type of A than that of B, the more the importance of the land use type of A than
that of B (Table 3).
In Table 3, for example, in the fifth row and the first column, the value of OF by DR is
3/1 in that the importance of OF is three times more than DR. The priorities of importance
are based on expert preferences. Finally, we calculated the consistency index of the matrix
Table 2. Within subject weights for animal habitats and vegetation habitats in Miankaleh followingvalues in Table 1.
Habitat No. Staple types Weight calculation methodFinalweight
Vegetation 1 J. aculeatus (mixture) 9LC þ 2NT þ 2VU þ EN þCR ¼ 1090/15 ¼ 72.66
73
2 A. tschernieviana NT ¼ 70 703 P. granatum þ R. pallasii VU þ LC ¼ 70 704 R. persicus þ P. granatum 70 þ 90 ¼ 160/2 ¼ 80 805 J. aculeatus VU ¼ 50 506 Halophyte LC ¼ 90 907 Marshy plants – 40
Animal 1 Vulpes Vulpes, C. aureus,Order lagomorph, (FamilySuidae) Sus scrofa, F. silvestris
LC þ LC þ LC þ LC þVU ¼ 410/5 ¼ 82
82
2 The secure area for migratingbirds (145 types)
LC*104 þ VU*35 þCR*6 ¼ 11170/145 ¼ 77.03
77
3 P. colchicus LC ¼ 90 904 N. tenuirostris CR ¼ 10 105 F. chaus, Testudo horsfieldii LC þ VU ¼ 70 70
380 M. Ghahroudi Tali et al.
Dow
nloa
ded
by [
Uni
vers
ity o
f T
ehra
n] a
t 12:
18 0
1 M
ay 2
013
Table
3.
Pairw
isecomparisonofdifferentlanduse
entities
forlanduse
criterionandspreadsheetcalculationsforobtainingweights.
Decim
alvalues
DR
FU
LDF
MIU
OF
OW
SL
SDF
SDR
VW
SH
IF
DR
1.00
2.00
2.00
3.00
0.33
0.33
0.33
2.00
1.00
3.00
2.00
0.50
FU
0.50
1.00
2.00
2.00
0.33
0.33
0.33
1.00
1.00
2.00
1.00
1.00
LDF
0.50
0.50
1.00
3.00
0.50
0.33
0.25
1.00
0.50
2.00
0.50
0.33
MIU
0.33
0.50
0.33
1.00
0.33
0.33
0.50
1.00
1.00
1.00
1.00
0.50
OF
3.00
3.00
2.00
3.00
1.00
1.00
0.50
3.00
3.00
3.00
2.00
1.00
OW
3.00
3.00
3.00
3.00
1.00
1.00
0.50
3.00
3.00
3.00
2.00
1.00
SL
3.00
3.00
4.00
2.00
2.00
2.00
1.00
4.00
3.00
3.00
3.00
1.00
SDF
0.50
1.00
1.00
1.00
0.33
0.33
0.25
1.00
0.50
1.00
1.00
0.33
SDR
1.00
1.00
2.00
1.00
0.33
0.33
0.33
2.00
1.00
1.00
1.00
0.50
VW
0.33
0.50
0.50
1.00
0.33
0.33
0.33
1.00
1.00
1.00
0.50
0.33
SH
0.50
1.00
2.00
1.00
0.50
0.50
0.33
1.00
1.00
2.00
1.00
0.50
IF2.00
1.00
3.00
2.00
1.00
1.00
1.00
3.00
2.00
3.00
2.00
1.00
Sum
15.67
17.50
22.83
23.00
8.00
7.83
5.67
23.00
18.00
25.00
17.00
8.00
Norm
alized
values
Weight
DR
0.06
0.11
0.09
0.13
0.04
0.04
0.06
0.09
0.06
0.12
0.12
0.06
0.08
FU
0.03
0.06
0.09
0.09
0.04
0.04
0.06
0.04
0.06
0.08
0.06
0.13
0.06
LDF
0.03
0.03
0.04
0.13
0.06
0.04
0.04
0.04
0.03
0.08
0.03
0.04
0.05
MIU
0.02
0.03
0.01
0.04
0.04
0.04
0.09
0.04
0.06
0.04
0.06
0.06
0.05
OF
0.19
0.17
0.09
0.13
0.13
0.13
0.09
0.13
0.17
0.12
0.12
0.13
0.13
OW
0.19
0.17
0.13
0.13
0.13
0.13
0.09
0.13
0.17
0.12
0.12
0.13
0.14
SL
0.19
0.17
0.18
0.09
0.25
0.26
0.18
0.17
0.17
0.12
0.18
0.13
0.17
SDF
0.03
0.06
0.04
0.04
0.04
0.04
0.04
0.04
0.03
0.04
0.06
0.04
0.04
SDR
0.06
0.06
0.09
0.04
0.04
0.04
0.06
0.09
0.06
0.04
0.06
0.06
0.06
VW
0.02
0.03
0.02
0.04
0.04
0.04
0.06
0.04
0.06
0.04
0.03
0.04
0.04
SH
0.03
0.06
0.09
0.04
0.06
0.06
0.06
0.04
0.06
0.08
0.06
0.06
0.06
IF0.13
0.06
0.13
0.09
0.13
0.13
0.18
0.13
0.11
0.12
0.12
0.13
0.12
Notes:Divisionofeach
valuein
decim
almatrixbytheSum
ofthecolumnresultsin
thevalues
innorm
alized
matrix,then
theaverageofeach
rowin
thenorm
alized
matrixgives
the
weightsforelem
entsoflanduse.CI¼
ðlmax2
nÞ=ðn
21ÞwhereCIisconsistency
index,nisnumber
ofelem
ents,andlmax
¼P
SW,whereSistheSum
valueandW
istheobtained
weight.CR¼
CI/RI,CIcanbefoundin
Saaty
andVargas
(1991).In
thediagonalofthematrix(thebold
values)each
entity
iscompared
byitself.Thevalues
onthetwosides
ofthe
diagonal
aremirrored.
Anatolia – An International Journal of Tourism and Hospitality Research 381
Dow
nloa
ded
by [
Uni
vers
ity o
f T
ehra
n] a
t 12:
18 0
1 M
ay 2
013
of 12 elements (Brent et al., 2007; Contreras, Hanaki, Aramaki, & Connore, 2008; Saaty &
Vargas, 1991) and the index value turned out to be 0.05 in spreadsheet program which
indicates an acceptable consistency for the matrix assigned values. In Table 3, after
comparing elements pairwise, we calculated the weights of elements in the Normalized
values section of the table.
Shoreline
About 94% of the peninsula (148 km) is circumscribed by shoreline. About 82% of
ecotourists who were asked about their goal and about the sport which attracted them to
the destination responded to swimming and visiting the shoreline beauty. Furthermore,
about 69% of visitors stated a demand for coastal sports facilities. The shoreline, thus, is an
attraction that less the distance of the points from the line, the more suitable the points are
for site selection. Distances of all points from the shoreline were analysed by the straight-
line method in Spatial Analyst Extension of ArcGIS. The method was used for analysing
all the criteria with distance buffer.
Dune vulnerability
About 71% of the entire the study area is covered by active and inactive sand dunes with
different conditions and under a variety of human activities. Sand dunes are complex
dynamic systems that respond rapidly to driving forces forming them (Garcia-Mora,
Gallego-Fernandez, Williams, & Garcia-Movo, 2001). These soft landforms are the result
of interactions between climatic pressures, marine processes, vegetation, geomorphology,
and particularly human activities. The vulnerability of sand dunes is an outcome of the
integration of these forces (Garcia-Mora et al., 2001). Following Davies, Williams, and
Curr (1995) and Garcia-Mora et al. (2001), the method based on which we calculate the
dune vulnerability index (DVI), five groups of variables must be measured as
geomorphology condition of dune (GCD), marine influence (MI), aeolian influence (AI),
vegetation condition (VC), and human effect (HE). As Garcia-Mora et al. (2001) noted,
because of the complexity of coastal dunes, the number of parameters for the five groups
will be determined regarding the magnitude of influence by each category and the
purpose of the research. After rating for each parameter records in a checklist on a scale
of 0–4 and after calculating the percentages in columns, the average of the first five
columns gives a value as dune vulnerability (Davies et al., 1995; Williams, Alveirinho-
Dias, Garcia-Movo, & Garcia-Mora, 2001) for a certain segment (Figure 4). The full
explanation for calculation of DVI is available in detail in the studies of Davies et al.
(1995), Garcia-Mora et al. (2001), and Williams et al. (2001), and here we use this index
just as one criterion in site selection. Sand dunes in Miankaleh initially based on
morphological, biological, and human characteristics have been classified into four
different segments that DVI is calculated for. Measurements of the involving parameters
are carried out using different materials. In Figure 4, for example, the computation of
vulnerability index for the five categories of 4th segment and also the results for the four
segments are represented.
For GCD, five parameters were identified: (1) the length of homogeneous active sand
dune system (km), (2) the width of dynamic dune system (km), (3) average height of
secondary dunes (m), (4) slope steepness (8), and (5) particle size (mm). For MI, we just
included three parameters that were found more effective in the area: (1) berm slope (8),
(2) width of internal zone (km), and (3) coastal orientation to wave direction (8).
382 M. Ghahroudi Tali et al.
Dow
nloa
ded
by [
Uni
vers
ity o
f T
ehra
n] a
t 12:
18 0
1 M
ay 2
013
AI includes three parameters: (1) pebble cover as % surface, (2) % seaward dune
vegetated, and (3) % of the system unvegetated. The VC plays an important role in
developing dune systems in Miankaleh. There are three kinds of vegetation in sand dune
systems (Mora et al., 2001): type I is mainly annual plants of very soft leaves that are not
adaptable to such environments. Type II is perennial plants that have advantages of
enduring surrounding pressures. Type III predominantly is plants capable of resisting
against burying by coastal sands and removing by seawater. The parameters for this
category are (1) % cover of type III plants in beach, (2) % cover of type III plants in the
seaside of frontal dune, (3) relative proportion of type II plants in the seaside of frontal
dune, (4) relative proportion of type I plants in the seaside of frontal dune, (5) relative
proportion of type II and type III plants in 100m inland of dune front, and (6) relative
proportion of vigorous or plants with normal vitality in the seaside of frontal dune (%).
The pressure due to HE is varying in different segments and we chose seven parameters
for this category: (1) visitor pressure, (2) access difficulty, (3) path network as % of frontal
dune, (4) relative cover of agriculture in the system (%), (5) grazing on the active system,
(6) number of rabbits, and (7) relative surface forested in the system 200m inland from
fore dune. The less the DVI value is for a segment the lower the vulnerability is for that
and more suitable is for the goal of the study.
Roads
There are 156.85 km of trails and paths in the area. To select a suitable point, access and
proximity to the paths is of special importance. In addition to a reduction in construction
costs for facilities, the proximity to the routes will meet ecotourists satisfaction in visiting
the nature. Thus, the less the distance from the trails and paths, the more suitable the points
are for the purpose of the study.
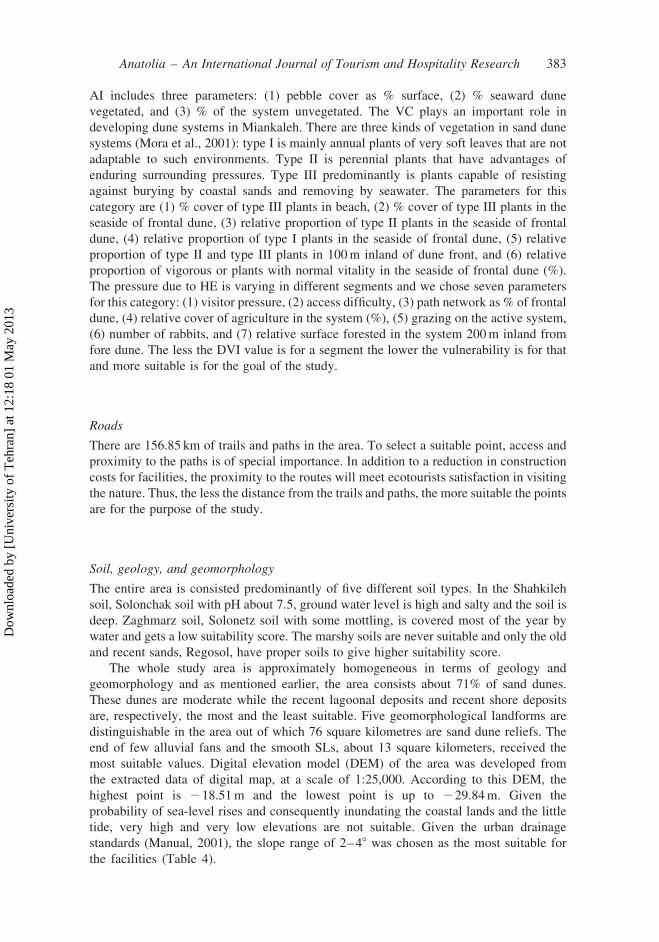
Soil, geology, and geomorphology
The entire area is consisted predominantly of five different soil types. In the Shahkileh
soil, Solonchak soil with pH about 7.5, ground water level is high and salty and the soil is
deep. Zaghmarz soil, Solonetz soil with some mottling, is covered most of the year by
water and gets a low suitability score. The marshy soils are never suitable and only the old
and recent sands, Regosol, have proper soils to give higher suitability score.
The whole study area is approximately homogeneous in terms of geology and
geomorphology and as mentioned earlier, the area consists about 71% of sand dunes.
These dunes are moderate while the recent lagoonal deposits and recent shore deposits
are, respectively, the most and the least suitable. Five geomorphological landforms are
distinguishable in the area out of which 76 square kilometres are sand dune reliefs. The
end of few alluvial fans and the smooth SLs, about 13 square kilometers, received the
most suitable values. Digital elevation model (DEM) of the area was developed from
the extracted data of digital map, at a scale of 1:25,000. According to this DEM, the
highest point is 218.51m and the lowest point is up to 229.84m. Given the
probability of sea-level rises and consequently inundating the coastal lands and the little
tide, very high and very low elevations are not suitable. Given the urban drainage
standards (Manual, 2001), the slope range of 2–48 was chosen as the most suitable for
the facilities (Table 4).
Anatolia – An International Journal of Tourism and Hospitality Research 383
Dow
nloa
ded
by [
Uni
vers
ity o
f T
ehra
n] a
t 12:
18 0
1 M
ay 2
013
Attractions, corals, building, and municipal services
Data for these criteria were extracted from digital map, questionnaire, and national
statistical data. Distance from the points of attractions, corrals, buildings, and municipal
services each in a separate layer file were analysed in GIS Software by Spatial Analyst
Extension. There are 388 corrals in the area which are used by local people to keep cattle.
The establishment of ecotourism facilities near the traditional corrals is never suitable in
terms of both health problems and ecotourism satisfaction. Thus, from the location of each
corral, buffers were defined in distances of 100m, 500m, and 2 and 5 km. A distance
buffer of 100m from these points has the least value. By increasing the distance the
suitability value increases correspondingly for this layer. Since the presence of municipal
services such as electricity and fresh water facilitates the development and reduces the
construction costs, proximity to these services is more desirable. The pixels near some
historical and natural attractions have higher suitability value. The pixels in proximity to
the buildings are more valuable (Santana-Jimenez, Suarez-Vega, & Hernandez, 2011).
Climate
In order to determine the Emberger index (Q2) for each individual pixel in the area, we
used Kringing interpolation method in GIS and statistics from 15 meteorological stations
in nearby regions. In the innovative method, the mean daily maximum temperature
(MaxT) in the hottest month of the year in Kelvin, the mean daily minimum temperature
(MinT) in the coolest month in Kelvin, and the average annual precipitation (P) were
interpolated as separate raster layers. These parameters were determined for each
individual pixel. By plugging these raster layers in the Emberger formula in GIS calculator
the output layer shows the quotient for each pixel.
Q2 ¼2000 £ Ras P
RasMaxT2 RasMin T:
Table 4. The weights of sub-groups in geodata by AHP.
Criterion Sub-group Weight
Geology Recent lagoonal deposit 0.45Sand dune deposits 0.35Recent shore deposit 0.20
Soil Old dunes 0.26Zaghmarz 0.18Marshy 0.17Shahkileh 0.18Embryo dune 0.22
GeoM Swamp 0.15Sand with low slope 0.22Sand with active dune 0.14Sand on the end of fan 0.32Releafs with old inactive dune 0.18
Elevation 30—26m 0.2826–22m 0.3322–18m 0.39
Slope 0–28 0.292–48 0.344–68 0.38
384 M. Ghahroudi Tali et al.
Dow
nloa
ded
by [
Uni
vers
ity o
f T
ehra
n] a
t 12:
18 0
1 M
ay 2
013
The result is a raster layer that each pixel in the layer has a Q2 value and is representative
of a climate. Given the relative vegetation dynamics as a result of climate impacts
(Roerink et al., 2003), the lower values of Q2 are less suitable due to more aridity and
consequent sensitivity. The least pixel value of Q2 is 50.5 and the highest is 61.12 so that
the eastern parts have lower Q2 than the western parts. Although climate of the whole area
is temperate subhumid, the climate of eastern parts is close to temperate semiarid and the
climate of western parts is mainly close to temperate humid. The area has considerably
same climatic parameters. Some other parameters have not considerable spatial variations
throughout the study area but are important in ecotourism camping. The mean annual
values during a period from 1990 to 2005 in Gorgan Synoptic Station for three parameters
including the number of cloudy days, sunshine hours, and wind speed in knots are,
respectively, 116, 2100, and 2.1. The criterion of climate has the least priority following
that of slope in the final suitability map.
Normalization of criteria
All layers that got values in the form of polygon vectors were converted into raster layers
with pixel size of 10m. The values of individual criteria that are in different ranges and
calculated in different units must be normalized into a standard scale to integrate into the
final analysis. In normalization, each given pixel that is assigned a grade of membership
using Fuzzy membership functions and other methods assumes a degree of suitability. The
spatial points where greater membership values were assigned for them are more desirable.
Here, the values range from 0 to 10 and the value 0 means unsuitable and the value 10
represents the most suitable in terms of environment, economics, and geodata. All layers
with different range and units of pixel values were normalized by reclassification of Spatial
Analyst Extension.
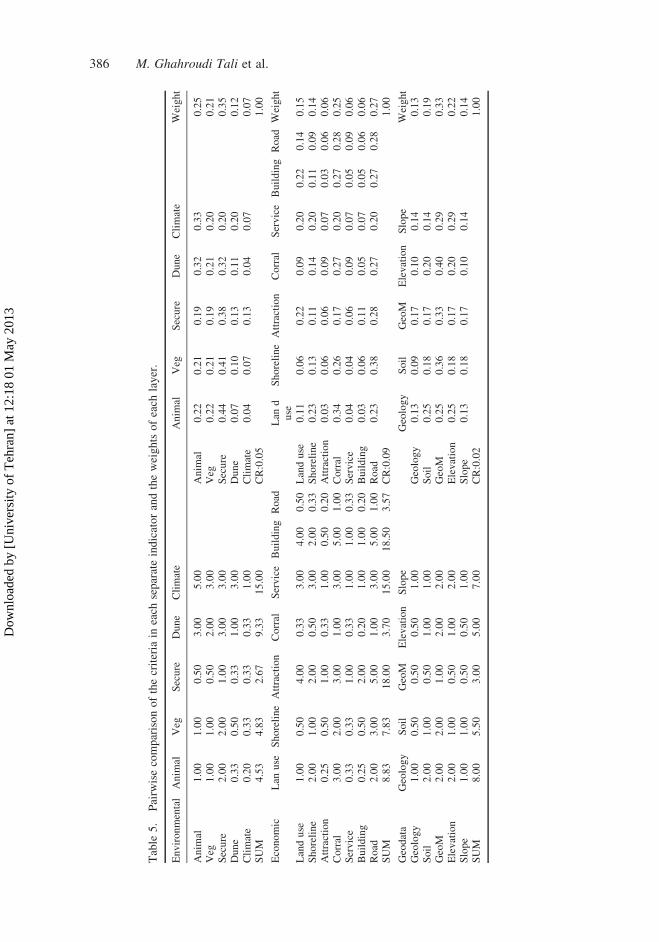
Weights for criteria
The AHP method, readily applicable in spreadsheet program, was used to determine
appropriate weights for layers (Saaty, 1980). In the AHP method, the decision-making
problem is decomposed into a hierarchy of sub-problems and the relative importance
of the elements can be evaluated in a pairwise comparison with respect to the main
goal above that hierarchy. In this method, each goal has some criteria, and
each criterion has some elements; the elements are compared with each other one by
one and take a ratio of preference for each comparison and the same procedure is
continued for the criteria to reach a final decision about the main goal. The pairwise
comparison, as previously explained in land use section, for criteria of the study is
shown in Table 5.
In order to calculate weights, the ratio of each criterion to the other was added to the
column, then each individual value was divided by the sum in the right section of the
table of that indicator. The average of criteria in the row gives the weights for each
criterion. The CR for each group must be (0.1 (Saaty & Vargas, 1991). The authors with
research and execution experiences made little modifications in ratios of some criteria to
achieve an acceptable CR (Saaty & Vargas, 1991). The three groups of criteria are
similarly compared pairwise to obtain the corresponding weights for indicators. The
weights of the three indicators of environmental, economic, and geodata are 0.5, 0.32,
and 0.18, respectively.
Anatolia – An International Journal of Tourism and Hospitality Research 385
Dow
nloa
ded
by [
Uni
vers
ity o
f T
ehra
n] a
t 12:
18 0
1 M
ay 2
013
Table
5.
Pairw
isecomparisonofthecriteria
ineach
separateindicatorandtheweightsofeach
layer.
Environmental
Anim
alVeg
Secure
Dune
Climate
Anim
alVeg
Secure
Dune
Climate
Weight
Anim
al1.00
1.00
0.50
3.00
5.00
Anim
al0.22
0.21
0.19
0.32
0.33
0.25
Veg
1.00
1.00
0.50
2.00
3.00
Veg
0.22
0.21
0.19
0.21
0.20
0.21
Secure
2.00
2.00
1.00
3.00
3.00
Secure
0.44
0.41
0.38
0.32
0.20
0.35
Dune
0.33
0.50
0.33
1.00
3.00
Dune
0.07
0.10
0.13
0.11
0.20
0.12
Climate
0.20
0.33
0.33
0.33
1.00
Climate
0.04
0.07
0.13
0.04
0.07
0.07
SUM
4.53
4.83
2.67
9.33
15.00
CR:0.05
1.00
Economic
Lan
use
Shoreline
Attraction
Corral
Service
Building
Road
Lan
duse
Shoreline
Attraction
Corral
Service
Building
Road
Weight
Landuse
1.00
0.50
4.00
0.33
3.00
4.00
0.50
Landuse
0.11
0.06
0.22
0.09
0.20
0.22
0.14
0.15
Shoreline
2.00
1.00
2.00
0.50
3.00
2.00
0.33
Shoreline
0.23
0.13
0.11
0.14
0.20
0.11
0.09
0.14
Attraction
0.25
0.50
1.00
0.33
1.00
0.50
0.20
Attraction
0.03
0.06
0.06
0.09
0.07
0.03
0.06
0.06
Corral
3.00
2.00
3.00
1.00
3.00
5.00
1.00
Corral
0.34
0.26
0.17
0.27
0.20
0.27
0.28
0.25
Service
0.33
0.33
1.00
0.33
1.00
1.00
0.33
Service
0.04
0.04
0.06
0.09
0.07
0.05
0.09
0.06
Building
0.25
0.50
2.00
0.20
1.00
1.00
0.20
Building
0.03
0.06
0.11
0.05
0.07
0.05
0.06
0.06
Road
2.00
3.00
5.00
1.00
3.00
5.00
1.00
Road
0.23
0.38
0.28
0.27
0.20
0.27
0.28
0.27
SUM
8.83
7.83
18.00
3.70
15.00
18.50
3.57
CR:0.09
1.00
Geodata
Geology
Soil
GeoM
Elevation
Slope
Geology
Soil
GeoM
Elevation
Slope
Weight
Geology
1.00
0.50
0.50
0.50
1.00
Geology
0.13
0.09
0.17
0.10
0.14
0.13
Soil
2.00
1.00
0.50
1.00
1.00
Soil
0.25
0.18
0.17
0.20
0.14
0.19
GeoM
2.00
2.00
1.00
2.00
2.00
GeoM
0.25
0.36
0.33
0.40
0.29
0.33
Elevation
2.00
1.00
0.50
1.00
2.00
Elevation
0.25
0.18
0.17
0.20
0.29
0.22
Slope
1.00
1.00
0.50
0.50
1.00
Slope
0.13
0.18
0.17
0.10
0.14
0.14
SUM
8.00
5.50
3.00
5.00
7.00
CR:0.02
1.00
386 M. Ghahroudi Tali et al.
Dow
nloa
ded
by [
Uni
vers
ity o
f T
ehra
n] a
t 12:
18 0
1 M
ay 2
013
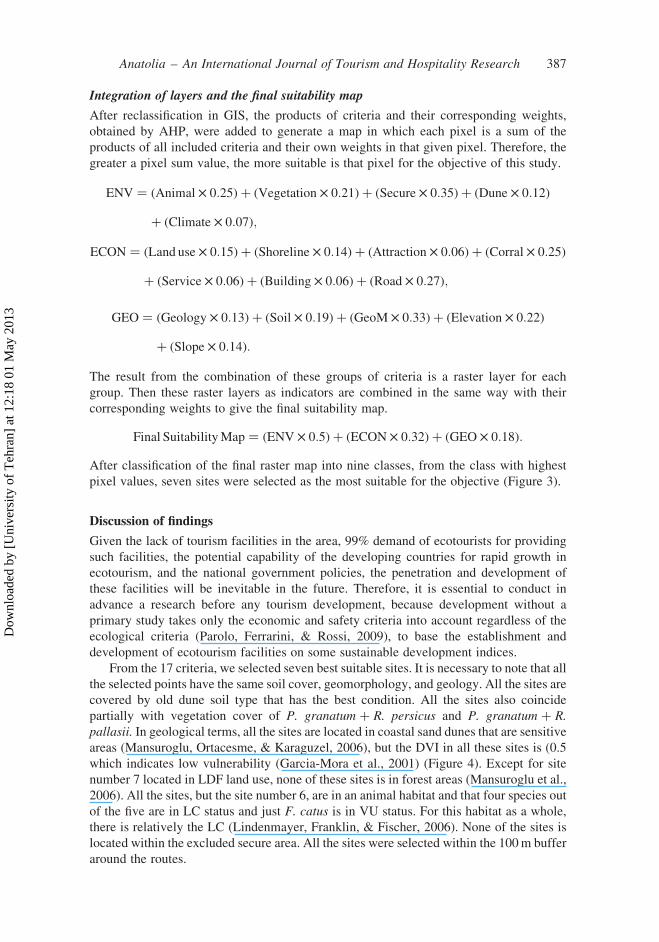
Integration of layers and the final suitability map
After reclassification in GIS, the products of criteria and their corresponding weights,
obtained by AHP, were added to generate a map in which each pixel is a sum of the
products of all included criteria and their own weights in that given pixel. Therefore, the
greater a pixel sum value, the more suitable is that pixel for the objective of this study.
ENV ¼ ðAnimal £ 0:25Þ þ ðVegetation £ 0:21Þ þ ðSecure £ 0:35Þ þ ðDune £ 0:12Þ
þ ðClimate £ 0:07Þ;
ECON ¼ ðLand use £ 0:15Þ þ ðShoreline £ 0:14Þ þ ðAttraction £ 0:06Þ þ ðCorral £ 0:25Þ
þ ðService £ 0:06Þ þ ðBuilding £ 0:06Þ þ ðRoad £ 0:27Þ;
GEO ¼ ðGeology £ 0:13Þ þ ðSoil £ 0:19Þ þ ðGeoM £ 0:33Þ þ ðElevation £ 0:22Þ
þ ðSlope £ 0:14Þ:
The result from the combination of these groups of criteria is a raster layer for each
group. Then these raster layers as indicators are combined in the same way with their
corresponding weights to give the final suitability map.
Final SuitabilityMap ¼ ðENV £ 0:5Þ þ ðECON £ 0:32Þ þ ðGEO £ 0:18Þ:
After classification of the final raster map into nine classes, from the class with highest
pixel values, seven sites were selected as the most suitable for the objective (Figure 3).
Discussion of findings
Given the lack of tourism facilities in the area, 99% demand of ecotourists for providing
such facilities, the potential capability of the developing countries for rapid growth in
ecotourism, and the national government policies, the penetration and development of
these facilities will be inevitable in the future. Therefore, it is essential to conduct in
advance a research before any tourism development, because development without a
primary study takes only the economic and safety criteria into account regardless of the
ecological criteria (Parolo, Ferrarini, & Rossi, 2009), to base the establishment and
development of ecotourism facilities on some sustainable development indices.
From the 17 criteria, we selected seven best suitable sites. It is necessary to note that all
the selected points have the same soil cover, geomorphology, and geology. All the sites are
covered by old dune soil type that has the best condition. All the sites also coincide
partially with vegetation cover of P. granatum þ R. persicus and P. granatum þ R.
pallasii. In geological terms, all the sites are located in coastal sand dunes that are sensitive
areas (Mansuroglu, Ortacesme, & Karaguzel, 2006), but the DVI in all these sites is (0.5
which indicates low vulnerability (Garcia-Mora et al., 2001) (Figure 4). Except for site
number 7 located in LDF land use, none of these sites is in forest areas (Mansuroglu et al.,
2006). All the sites, but the site number 6, are in an animal habitat and that four species out
of the five are in LC status and just F. catus is in VU status. For this habitat as a whole,
there is relatively the LC (Lindenmayer, Franklin, & Fischer, 2006). None of the sites is
located within the excluded secure area. All the sites were selected within the 100m buffer
around the routes.
Anatolia – An International Journal of Tourism and Hospitality Research 387
Dow
nloa
ded
by [
Uni
vers
ity o
f T
ehra
n] a
t 12:
18 0
1 M
ay 2
013
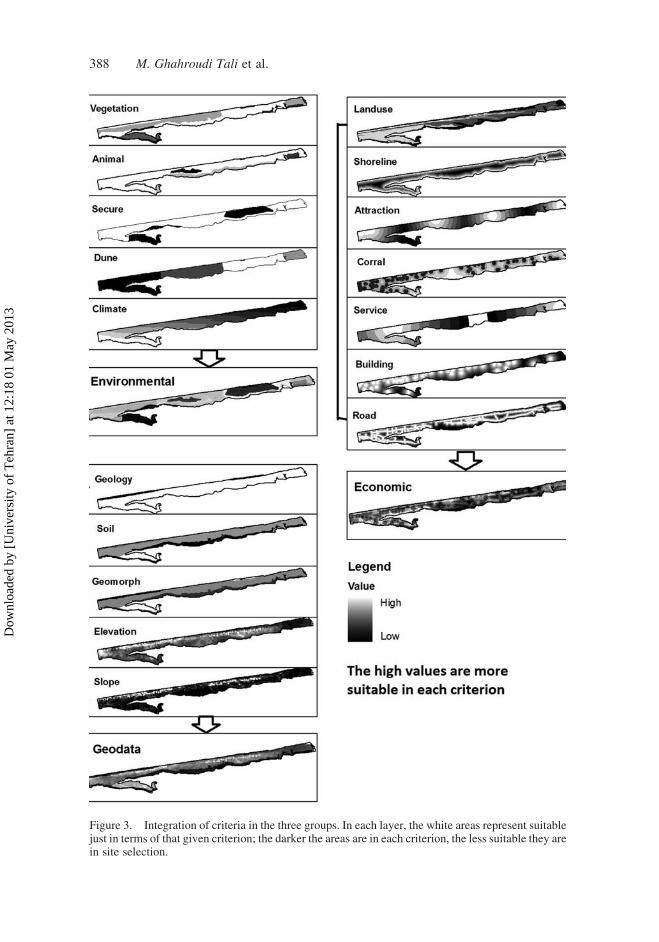
Figure 3. Integration of criteria in the three groups. In each layer, the white areas represent suitablejust in terms of that given criterion; the darker the areas are in each criterion, the less suitable they arein site selection.
388 M. Ghahroudi Tali et al.
Dow
nloa
ded
by [
Uni
vers
ity o
f T
ehra
n] a
t 12:
18 0
1 M
ay 2
013
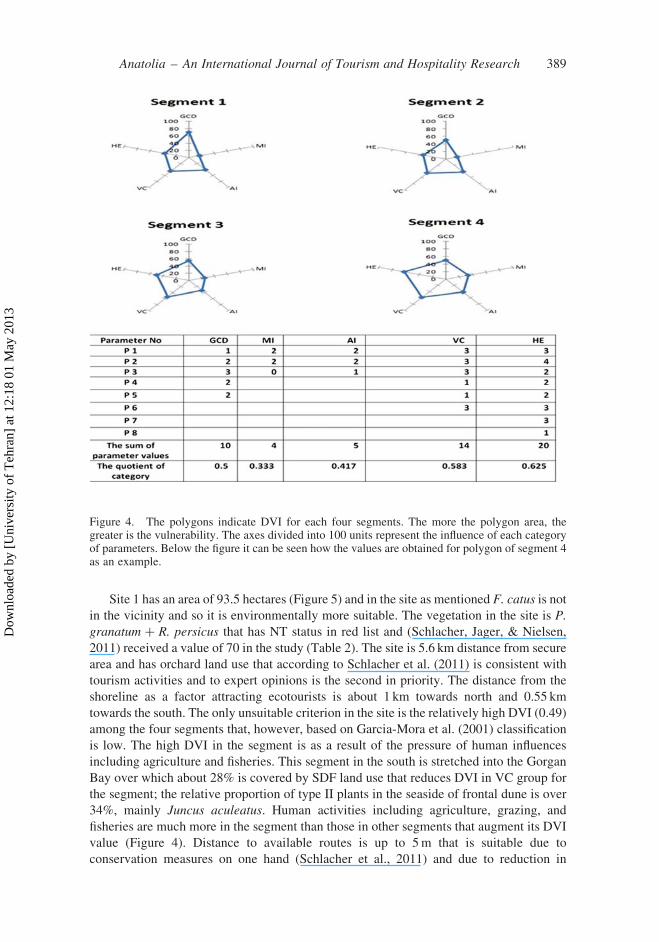
Site 1 has an area of 93.5 hectares (Figure 5) and in the site as mentioned F. catus is not
in the vicinity and so it is environmentally more suitable. The vegetation in the site is P.
granatum þ R. persicus that has NT status in red list and (Schlacher, Jager, & Nielsen,
2011) received a value of 70 in the study (Table 2). The site is 5.6 km distance from secure
area and has orchard land use that according to Schlacher et al. (2011) is consistent with
tourism activities and to expert opinions is the second in priority. The distance from the
shoreline as a factor attracting ecotourists is about 1 km towards north and 0.55 km
towards the south. The only unsuitable criterion in the site is the relatively high DVI (0.49)
among the four segments that, however, based on Garcia-Mora et al. (2001) classification
is low. The high DVI in the segment is as a result of the pressure of human influences
including agriculture and fisheries. This segment in the south is stretched into the Gorgan
Bay over which about 28% is covered by SDF land use that reduces DVI in VC group for
the segment; the relative proportion of type II plants in the seaside of frontal dune is over
34%, mainly Juncus aculeatus. Human activities including agriculture, grazing, and
fisheries are much more in the segment than those in other segments that augment its DVI
value (Figure 4). Distance to available routes is up to 5m that is suitable due to
conservation measures on one hand (Schlacher et al., 2011) and due to reduction in
Figure 4. The polygons indicate DVI for each four segments. The more the polygon area, thegreater is the vulnerability. The axes divided into 100 units represent the influence of each categoryof parameters. Below the figure it can be seen how the values are obtained for polygon of segment 4as an example.
Anatolia – An International Journal of Tourism and Hospitality Research 389
Dow
nloa
ded
by [
Uni
vers
ity o
f T
ehra
n] a
t 12:
18 0
1 M
ay 2
013
construction and transportation costs and in subsequent pollution on the other. Distance
from the corrals and domesticated cattle keeping places is over 1 km and according to
Chaiyarat and Srikosamatara (2009) and the questionnaire data, the distance is suitable
enough to keep the facilities safe from dissatisfaction (Abdelhamied, 2011). The site is
relatively in an acceptable distance from the available municipal services, buildings of
local residents, and attractions in which respondents are interested. This proximity reduces
the costs in providing services such as electricity and fresh water and improves the social
awareness and economic circumstances for local people and subsequently the
environmental conservation (Chaiyarat & Srikosamatara, 2009). The elevation is
223.63 and for sea-level fluctuations in the Caspian (Kroonenberg, 2007), it has more
appropriate settings than other points. The average slope for the site is up to 3.58 and in a
moderate level of suitability.
Site 2, with area of 6 hectares, is covered by P. granatum and R. pallasii that according
to Table 2 based on IUCN gets the value 70. The distance of the site from the secure area is
over 500m. The point on which the site is located has the land use type of orchard and as
site 1 is consistent with the purpose. The shoreline from which the distance of the site is
over 550m is an attraction where about 85% of ecotourists are interested. Although this
site is located at a distance from site 1, both are located on the same segment in DVI and
are weak regarding the criterion. The distance of the site from routes is 33m and from
corrals and cattle keeping places is more than 1 km and enough to keep ecotourists safe
and satisfied. Distance of the site from buildings and available services is 7 and 4.65 km,
respectively. The elevation of 220m is the highest among the selected sites and is also
suitable. Q2 is 53.3 for the pixel in which the site is located.
Site 3 with an area of 9 hectares was selected in the vicinity of site 2, as it can be seen
in Figure 5, and covered predominantly by Artemisia annua and the land use type of the
area the site is located on is SL that is the most preferred by the experts, however, with a
little difference from the orchard land use. Position of the site is about 600 and 46m
distance, respectively, from the shoreline and routes and both are appropriate
economically, the former for an increase in the satisfaction of probably established
facilities and the latter for a decrease in the costs of construction and extra trail
development. Segment 3 on which the site is located has a moderate DVI (0.435). The
relative proportion of type II and type III plants in 100m inland of dune front is nearly 45
Figure 5. Location of the seven sites selected for the purpose of the study.
390 M. Ghahroudi Tali et al.
Dow
nloa
ded
by [
Uni
vers
ity o
f T
ehra
n] a
t 12:
18 0
1 M
ay 2
013
and scored 2, following Garcia-Mora (2001), and consists of P. granatum þ R. pallasii
and J. Aculeatus. The SDF (semi-dense forest) in the northern part of the segment
decreases its vulnerability. In the northern part, there are some vigorous plants and is
densely covered by P. granatum and a great percentage of the portion is under irrigated
agriculture and an integration of orchard and forest so that it diminishes DVI. The site is
the closest to the places keeping domesticated cattle and, thus, least desirable.
Site 4, 24 hectares in area, was selected on an average distance of 4 km to the east of
sites 2 and 3. The plant habitat in which the site is located (Table 2) has the vegetation
cover of P. granatum þ R. pallasii with mixture of LC and VU status that get the value of
70 in the study. Therefore, there are no considerable restrictions in exposing to extinction.
The distance of the site from the shoreline and from the trails is, respectively, 610 and
58.5m. The site was selected in the same segment as site 3 in DVI and the land use of this
site like that of site 3 is SL. The site is 1890m from the services and 1 km from the places
of corrals and both are relatively suitable. It is located at a suitable distance from
attractions and local buildings (respectively, 943 and 724). The site with 5.58 slope is the
greatest amongst the selected sites and it is suitable for construction purposes (Manual,
2001). The site is 223.4m in elevation and 56.27 in Q2. The weak point about the site is
that it is located at a distance of 184m from the boundary of Numenius tenuirostris habitat
with CR status. The site is somewhat disadvantageous because it has some rough
topography.
Site 5, with an area of 16 hectares, is in the same habitat as site 4 (Table 2). The
distance of the site from the security zone is about 3200m, from the shoreline the site is
nearly 700m, from the trails the site is up to 75m, and from corrals the site is about 5 km.
The site located in SDR and according to Mansuroglu et al. (2006) is not well suited. The
site as the two previous sites is on segment 3. It has the least distance of 316m from the
rare traditional local buildings and is also the most suitable of the selected sites in this
criterion. It is acceptable in elevation and slope angle and Q2 is 55.74 for the pixel the site
is inside. Site 4 is in a relative vicinity of 420m from the habitat of N. tenuirostris.
Site number 6, with highest pixel value in the final raster map, has an area of 49
hectares. The site is located in the habitat of Phasianus colchicus with LC status (valued
90) and in vegetation habitat of P. granatum þ R. persicus (valued 70). The only negative
point about the area is its relative proximity to the secure area (154m). Distance of the site
from shoreline is about 400m and the land use type inside which it was determined is SL.
The DVI for the segment on which the site is located is 0.37 and has the least vulnerability
among the other segments. The width of dynamic dune system in segment 2 is 0.48 km and
the width of internal zone and the coastal orientation in wave direction is, respectively,
1.18 km and 168. Although the percentage cover of type III plants in beach is 8.3, with
score of 3, which increases the vulnerability, due to the secure area contained within the
segment, access difficulty, low pressure of visitors, and less agricultural activities, a
considerable decrease can be seen in the total DVI of the segment. Low human activities
and consequent decrease in value of vulnerability in the segment are in exact
accordance with the study of Mora et al. (2001). Distance from paths and from the places
of corrals is, respectively, 84 and 1000m and is suitable. It is located in the approximate
boundary of recent coastal sediments and sand dune deposits. The elevation and
slope of the site is not much suitable relative to those of other sites (226.91 and 0.38). The
site is at an appropriate distance from attractions and buildings to keep ecotourists
coming back and local people changing their attitudes towards the environment
(Amirnejad et al., 2006). Q2 is 53.89 for the pixel containing the site which is at a
moderate suitability level.
Anatolia – An International Journal of Tourism and Hospitality Research 391
Dow
nloa
ded
by [
Uni
vers
ity o
f T
ehra
n] a
t 12:
18 0
1 M
ay 2
013
Site number 7, with 11 hectares in area, has vegetation of P. granatum þ R. persicus.
The site, indeed, is situated in an approximate distance of 316m from the shoreline, i.e. the
nearest distance from the shoreline among the seven sites, and 70m from somewhat paved
routes. The site is located in the same segment as site 6 and with the least DVI and in an
acceptable distance from attractions and buildings and close to municipal services. Both
the elevation and Q2 here are of least values out of the seven sites, i.e. up to228.57m and
51.86, respectively.
Conclusion and implications
The results of the study for the first time indicate that the MCE method, thanks to the
software providing spatial analysis, can be useful in site selection for ecotourism facilities
as requisites for successful ecotourism development planning. From the combination of
criteria, it is possible to accurately evaluate the inputs and obtain the suitable options. The
AHP method also proved to be applicable in ecotourism facilities site selection. In this
study, after assigning within-subject weights to each layer and combining the normalized
criteria, seven sites were selected and the weighting was assessed to demonstrate that the
methodology is well able to take all the criteria and goals of the study into account, and
finally to select the best options in environmental and economic terms. The results of the
red list classification in this study demonstrate that the method of average values of species
in a given habitat based on their exposure to extinction can be used for assigning weights
to elements of each criterion in a site selection analysis. The study also indicated that the
DVI method is applicable in areas with similar situations and that it may be investigated as
a criterion for the MCE method. According to the new procedure carried out for climate
criterion, for the first time, we showed that by using the GIS Kringing interpolation
method, each parameter of the Emberger quotient can be interpolated to determine the Q2
for each pixel of an area as a criterion for site selection. The resulted map identifies the
most suitable sites for the purpose of establishment and development of ecotourism
facilities as well as the most disadvantageous areas in environmental and economical
terms.
Acknowledgements
The financial support of Shahid Beheshti University is greatly acknowledged. The authors would liketo give their sincere thanks to anonymous referees for their helpful comments.
References
Abdelhamied, H. (2011). Customers perceptions of floating restaurants in Egypt. Anatolia, 22(1),1–15.
Alipour, H., & Heydari, R. (2005). Tourism revival and planning in Islamic Republic of Iran:Challenges and prospects. Anatolia, 16(1), 39–61.
Amirnejad, H., Khalilian, S., Assareh, M., & Ahmadian, M. (2006). Estimating the existence valueof north forests of Iran by using a contingent valuation method. Ecological Economics, 58,665–675.
Bertzky, M., & Stoll-Kleemann, S. (2009). Multi-level discrepancies with sharing data in protectedareas: What we have and what we need for the global village. Journal of EnvironmentalManagement, 90, 8–24.
Boo, E. (1990). Ecotourism: The potentials and pitfalls, Vol. 1. Washington, DC: WWF.
392 M. Ghahroudi Tali et al.
Dow
nloa
ded
by [
Uni
vers
ity o
f T
ehra
n] a
t 12:
18 0
1 M
ay 2
013
Brent, A., Rogers, D., Ramabitsa-Siimane, T., & Rohwer, M. (2007). Application of analyticalhierarchy process to establish health care waste management systems that minimise infectionrisks in developing countries. European Journal of Operational Research, 181, 403–424.
Brown, G. (2006). Mapping landscape values and development preferences: A method for tourismand residential development planning. International Journal of Tourism Research, 8, 101–113.
Campbell, L. (1999). Ecotourism in rural developing communities. Annals of Tourism Research,26(3), 534–553.
Chaiyarat, R., & Srikosamatara, S. (2009). Populations of domesticated cattle and buffalo in theWestern Forest Complex of Thailand and their possible impacts on the wildlife community.Journal of Environmental Management, 90, 1448–1453.
Contreras, F., Hanaki, K., Aramaki, T., & Connore, S. (2008). Application of analytical hierarchyprocess to analyse stakeholders preferences for municipal solid waste management plans.Conservation and Recycling, 52, 979–991.
Daily, D. (1997). Natures services. Sosietal dependence on natural ecosystems. Washington, DC:Island press.
Davies, P., Williams, A., & Curr, R. (1995). Decision making in dune management: Theory andpractice. Journal of Coastal Conservation, 1, 87–96.
Feick, R., & Hall, G. (1999). Consensus building multi participant spatial decision support system.URISA Journal, 2, 17–23.
Fennel, D. (2001). A content analysis of ecotourism definitions. Current Issues in Tourism, 4,403–421.
Garcia-Mora, M., Gallego-Fernandez, J., Williams, A., & Garcia-Movo, F. (2001). A coastal dunevulnerability classification. A case study of the SW Iberian Peninsula. Journal of CoastalResearch, 17, 802–811.
Gossling, S. (1999). Ecotourism: A means to safeguard biodiversity and ecosystem functions?Ecological Economics, 29, 303–320.
Hossain, M., & Nani, G. (2010). GIS-based multi criteria evaluation to land suitability modelling forgiant prawn (Macrobrachium rosenbergii) farming in Companigonj Upazila Noakhali,Bangladesh. Computer and Electronics in Agriculture, 70, 172–186.
IUCN (1990). United Nations list of national parks and protected areas. Switzerland: IUCN, Gland.Jalili, A., & jamzad, Z. (1999). Red data book of Iran: A preliminary survey of endemic, rare and
endangered plant species in Iran. Tehran: Research Institute of Forests and Rengelands.Keith, D., Auld, T., Ooi, M., &Mackenzie, B. (2000). Sensitivity analyses of decision rules in World
Conservation Union (IUCN) Red list criteria using Australian plants. Biological Conservation,94, 311–319.
Kristof, W. (1963). The statistical theory of stepped-up reliability coefficients when a test hasdivided into several equivalent parts. Psychometrika, 28, 221–238.
Kroonenberg, S.A. (2007). Solar-forced 2600 BP and Little Ice Age highstands of the Caspian Sea.Quaternary International, 173–174, 137–143.
Kuo, M., Liang, G., & Huang, W. (2006). Extensions of multicriteria analysis with pairwisecomparison under a fuzzy environment. International Journal of Approximate Reasoning, 43,268–285.
Lindenmayer, D., Franklin, J., & Fischer, J. (2006). General management principles and a checklistof strategies to guide forest biodiversiry conservation. Biological Conservation, 131, 433–445.
Mansuroglu, S., Ortacesme, V., & Karaguzel, O. (2006). Biotope mapping in an urban environmentand its implications for urban management in Turkey. Journal of Environmental Management,81, 175–187.
Manual, U.D. (2001). Urban Drainage Design Manual, Hydraulic Engineering Manual No. 22,2nd ed., Publication FHWA-NHI-01-021.
Mazandaran Environmental Organization (2003). Miankaleh Comprehensive Project (in Farsi),Report.
Parolo, G., Ferrarini, A., & Rossi, G. (2009). Optimization of tourism impacts in protected areas bymeans of genetic algorithms. Ecological Modelling, 220, 1138–1147.
Rodrigues, A., Pilgrim, J., Lamoreux, J., Huffmann, M., & Brooks, T. (2006). The value of the IUCNred list for conservation. TRENDS in Ecology and Evolution, 21, 71–76.
Roerink, G., Menenti, M., Soepboer, W., & Su, Z. (2003). Assessment of climate impact onvegetation dynamics by using remote sensing. Physics and Chemistry of the Earth, 28, 103–109.
Saaty, T. (1980). The analytic hierarchy process. New York: McGraw Hill.
Anatolia – An International Journal of Tourism and Hospitality Research 393
Dow
nloa
ded
by [
Uni
vers
ity o
f T
ehra
n] a
t 12:
18 0
1 M
ay 2
013
Saaty, T., & Vargas, L. (1991). Prediction, projection and forecasting. Dordrecht: Kluwer AcademicPublishers.
Santana-Jimenez, Y., Suarez-Vega, R., & Hernandez, J. (2011). Spatial and environmentalcharacteristics of rural tourism lodging units. Anatolia, 22(1), 89–101.
Schlacher, T., Jager, R., & Nielsen, T. (2011). Vegetation and ghost crabs in coastal dunes asindicators of putative stressors from tourism. Ecological Indicators, 11, 284–294.
Tucker, G., Bubb, P., Deheer, M., Miles, L., Lawrence, A., & Bajracharya, S. (2005). Guidelines forbiodiversity assessment and monitoring for protected areas. Kathmandu: KMTNC.
UNESCO (2005). United Nations Decade of Education for Sustainable Development (2005–2014):International implementation scheme. Paris: UNESCO.
USGS (2001). Global Land Survey, Landsat ETM þ , 28.5m scene p163r034_7t20010730 & 308mscene L71163034_03420050420., Retrieved from http://www.glcf.com, 2011.
Voogd, H. (1983). Multi criteria evaluation for urban and regional planning. London: Pion.Wallis, A., Michelle, L., & Anneke, J. (2010). Significance of the environment in the assessment of
the sustainable development: The case for south west Victoria. Ecological Economics, 10,1016–1027.
Weaver, D., & Lawton, L. (2007). Twenty years on: The state of contemporary ecotourism research.Tourism Management, 28, 1168–1179.
Williams, A., Alveirinho-Dias, J., Garcia-Movo, F., & Garcia-Mora, M. (2001). Integrated coastaldune management: Checklists. Continental Shelf Research, 21, 1937–1960.
Wunder, S. (2000). Ecotourism and economic incentives an empirical approach. EcologicalEconomics, 32, 465–472.
Yagi, N., Takagi, A., Takada, Y., & Kurokura, H. (2010). Marine protected areas in Japon:Institutional background and management framework. Marine Policy, 34, 1300–1306.
Zucca, A., Sharifi, A., & Fabbri, A. (2008). Application of spatial multi-criteria analysis to siteselection for a local park: A case study in Bergamo Province, Italy. Journal of EnvironmentalManagement, 88, 752–769.
394 M. Ghahroudi Tali et al.
Dow
nloa
ded
by [
Uni
vers
ity o
f T
ehra
n] a
t 12:
18 0
1 M
ay 2
013