Multi-Body Simulation Modeling of Vehicle Skidding and Roll over for Horizontal Curves on...
23
Multi-Body Simulation Modeling of Vehicle Skidding and Roll over 1 for Horizontal Curves on Longitudinal Grades 2 3 Amirarsalan Mehrara Molan a, * 4 a Researcher, Young Researchers and Elites Club, Science and Research Branch, Islamic Azad 5 University, Tehran, Iran. 6 Email: [email protected], Tel: +98-9126358911, Fax: +98-2188256371 7 * (Corresponding Author) 8 9 Ali Abdi Kordani b 10 b Assistant Professor, Department of Civil Engineering, Imam Khomeini International 11 University, Qazvin, Iran. 12 Email: [email protected], Tel: +98-9126085308 13 14 Submission Date: 27 July, 2013 15 Word Count: 5176 + 8 Table + 2 Figures = 7676 Word Equivalent 16 17 TRB 2014 Annual Meeting Paper revised from original submittal.
Transcript of Multi-Body Simulation Modeling of Vehicle Skidding and Roll over for Horizontal Curves on...
Multi-Body Simulation Modeling of Vehicle Skidding and Roll over 1
for Horizontal Curves on Longitudinal Grades 2
3
Amirarsalan Mehrara Molana, *
4
a Researcher, Young Researchers and Elites Club, Science and Research Branch, Islamic Azad 5
University, Tehran, Iran. 6
Email: [email protected], Tel: +98-9126358911, Fax: +98-2188256371 7
*(Corresponding Author) 8
9
Ali Abdi Kordanib 10
b Assistant Professor, Department of Civil Engineering, Imam Khomeini International 11
University, Qazvin, Iran. 12
Email: [email protected], Tel: +98-9126085308 13
14
Submission Date: 27 July, 2013 15
Word Count: 5176 + 8 Table + 2 Figures = 7676 Word Equivalent 16
17
TRB 2014 Annual Meeting Paper revised from original submittal.
Abstract 18
The impact of combined horizontal curve and longitudinal grade on skidding and roll over of various 19
vehicles is investigated. A series of simulation tests are conducted using CarSim and TruckSim, which are 20
among the most popular multi-body simulation software packages in the vehicle industry. Two types of 21
behavior for the driving system are considered in the simulations: (1) the driver negotiates the curve at 22
constant speed or (2) the driver needs to brake while passing downgrades. Based on the results, a truck is 23
subjected to greater lateral accelerations on downgrades and lower lateral accelerations on upgrades. 24
Greater side friction factors are seen on downgrades for all vehicles when cornering. Braking has a 25
considerable effect on side friction factors, especially for a sedan car. Braking can be an important threat 26
to the safety of passenger cars (in terms of skidding) and trucks (in terms of rollover). 27
Keywords: Roadway safety; Skidding; Roll over; Horizontal curve; Longitudinal grade; Multi-body 28
simulation; Braking. 29
30
31
32
33
34
35
36
37
TRB 2014 Annual Meeting Paper revised from original submittal.
1. Introduction 38
Horizontal curves have long been recognized as a considerable safety problem for vehicles, because 39
of factors such as centrifugal force and driver expectation, and are considered to be even more important 40
in this context than the sight distance issue, particularly on rural two-lane highways (Charlton 2007). 41
Horizontal curves pose two threats to vehicles: (1) skidding and (2) rollover toward the outer direction of 42
the curve (Awadallah 2006). The potential threat from horizontal curves can be more significant when 43
they are located on steep longitudinal grades. The latter, especially downgrades, may shift the center of 44
gravity of the vehicle and change the distribution of forces on its tires. Although road designers try to 45
avoid the combination of horizontal curves with grades, this is a common occurrence in mountainous 46
terrain and two-lane rural highways owing to economic issues and the time-consuming nature of the 47
construction projects in these areas. Moreover, this combination is also common on interchange ramps. 48
The Green Book (AASHTO 2011) considers a point-mass model for the basic curve equation. The 49
point-mass model is one of the simplest vehicle models, but has the following limitations: 50
(1) The effect of longitudinal grade is neglected and the differences in types of horizontal curves are 51
ignored. 52
(2) The distribution of forces acting on different tires is not taken into account in the determination of 53
side friction factors. Friction can vary significantly between tires when the vehicle is cornering 54
(MacAdam 1985). 55
(3) The point-mass model is independent of vehicle configuration and characteristics such as 56
suspension system, and the design criterion is based on an unsprung (rigid) vehicle. 57
Many researchers have pointed out that a more sophisticated model should be used in order to analyze 58
the cornering behavior of vehicles (Psarianos et al. 1998; Kontaratos et al. 1994; Bonneson 1999a). The 59
point-mass model might be suitable for modeling non-articulated vehicles, but it is insufficiently precise 60
TRB 2014 Annual Meeting Paper revised from original submittal.
for trucks (Bonneson 1999a). Varunjikar’s (2011) research showed that the transient bicycle, steady-state 61
bicycle and multi-body simulation models are better than the point-mass model for horizontal curve 62
design. 63
The primary objective of this paper is to investigate the impact of combined horizontal curve with 64
longitudinal grade on safety factors such as the side friction factor and lateral acceleration to determine 65
the stability of various vehicles against skidding and rollover. In addition to the key role of geometric 66
design on horizontal curve safety, adopting roadway design to vehicle characteristics appears to be 67
necessary. Vehicle engineering and roadway design are two main factors involved in attempts to improve 68
highway safety and decrease fatalities, and therefore compatibility between highway design and modern 69
vehicle design is essential (Chang 2001; Stine et al. 2010). 70
Although vehicle braking has been identified as a relevant issue in roadway safety, almost no 71
estimates of its effects on the side friction factor or rollover have been published. From the viewpoint of 72
vehicle dynamics, Gim et al. (2007), among others, have studied the properties of tires under braking 73
conditions, but they did not provide any conclusions specifically with regard to highway engineering. One 74
of the contributions of the present research is to take account of braking in the evaluation of friction 75
factors. The actual tire–pavement friction value during emergency or locked-wheel braking is a major 76
factor in accident analysis, but it is not known for most cases and a range of average friction values is 77
assumed for analysis (Heinrichs et al. 2003). 78
In this study, a total of 112 simulation tests were conducted to estimate vehicle stability on combined 79
horizontal curves with longitudinal grades using CarSim and TruckSim. These are multi-body simulation 80
software packages developed by Mechanical Simulation Corporation (MSC) to predict the performances 81
of various vehicles and analyze the dynamic behavior of vehicles in response to a given road geometry 82
with high accuracy. Several companies, such as Ford, Toyota and Opel, use CarSim for their simulation 83
TRB 2014 Annual Meeting Paper revised from original submittal.
tests. Although vehicle dynamics simulations have long been used for both vehicle design and crash 84
reconstruction, they have rarely been used by highway engineers for roadway design (Stine et al. 2010). 85
2. Review of the Literature 86
Kontaratos et al. (1994) included the effects of many factors such as grade to determine the minimum 87
horizontal curve radius. Their analysis concluded that there is a strong relationship between the radius of 88
the horizontal curve and grade, and that the minimum radius should increase on longitudinal grades at 89
higher vehicle speeds. 90
One of the studies that used simulations to analyze the safety of combined horizontal curves was 91
performed by Easa and Dabbour (2003). They compared the lateral acceleration between minimum flat 92
horizontal curve radii with the minimum radii on vertical alignments using VDM road software, and 93
recommended that the minimum radius of combined horizontal curves with vertical alignments be 94
increased by approximately 3–16% relative to that in a flat horizontal curve scenario. Similar research for 95
compounded horizontal curves by Easa and Dabbour (2005) revealed that the minimum radius should be 96
increased by 20% to achieve the same comfort limit that the driver experiences on a flat horizontal curve 97
with the same radius. Easa and Dabbour (2005) also recommended a further study to revise current values 98
of side friction, since these were determined many years ago and originally only for passenger cars 99
without considering heavy vehicles. Moreover, VDM has some limitations in modeling human factors 100
and driving behavior; for example, as Easa and Dabbour (2005) pointed out, it is not designed to 101
incorporate complex human factors such as braking. 102
Chang (2001) developed new models to determine the minimum radius, considering a sprung vehicle 103
for passenger cars and trucks. This research was important because the center of gravity shifts laterally 104
during cornering, a fact which is ignored in an unsprung vehicle model. Eq. (1) and (2) illustrate the 105
Chang's (2001) recommendation models: 106
Passenger cars: 𝑅 = 𝑣2/ 121(0.5𝑒 + 𝑓) (1) 107
TRB 2014 Annual Meeting Paper revised from original submittal.
Truck: 𝑅 = 𝑣2/122.5(0.75𝑒 + 𝑓) (2) 108
A key study was carried out by Bonneson (2000), who presented a series of friction factors and 109
vehicle dynamic data. Based on his research, a horizontal curve located on a downgrade is of great 110
concern because (1) drivers tend to brake to maintain a safe speed and (2) they also tend to brake an extra 111
amount to reduce speed when they get closer to the beginning of the curve. By considering the effect of 112
roadway grade on friction, Bonneson (2000) mentioned that the Green Book generally underestimates 113
side friction demand for most horizontal curves, particularly those that have steep grades, little 114
superelevation and a large radius. According to research by MacAdam et al. (1985), side friction demand 115
is about 15% more than the predicted value according to the Green Book owing to steering fluctuations 116
along the horizontal curve. 117
You et al. (2012) studied vehicle skidding and rollover as two failure modes and found that rollover 118
does not count as a major concern for passenger cars unless they collide with each other or with another 119
object. However, rollover is the main concern for trucks on horizontal curves. The rollover threshold for 120
passenger cars is significantly higher than for trucks: it is about 1.2 g for cars, whereas trucks might roll 121
over at just 0.34 g (Harwood et al. 1994). When the rollover threshold is more than the available side 122
friction, skidding will occur before rollover (Varunjikar 2011). Since the available side friction is usually 123
less than 0.9, skidding is the main concern for passenger cars. 124
Research was conducted by Eck and French (2002) to analyze the safety of some mountainous 125
horizontal curves. They found that when a sharp horizontal curve is constructed on a steep downgrade, 126
additional superelevation is required. Eck and French (2002) developed two new equations to 127
determinate the superelevation rate for passenger cars (Eq. 1) and articulated vehicles (Eq. 2), although it 128
was mentioned that more study needs to validate these equations. 129
𝑒 + 𝑓 = 𝑣2/ 15𝑅 + 𝐺 𝑠𝑖𝑛𝜃 (1) 130
TRB 2014 Annual Meeting Paper revised from original submittal.
𝑒 + 𝑓 = 𝑣2
15𝑅 + 𝐺𝑊 𝑡𝑟𝑎𝑐𝑡𝑜𝑟 ∗𝑠𝑖𝑛 𝜃𝑓𝑟𝑜𝑛𝑡 𝑤ℎ𝑒𝑒𝑙−𝑡𝑟𝑎𝑐𝑡𝑜𝑟 + 𝑊 𝑡𝑟𝑎𝑖𝑙𝑒𝑟 ∗𝑠𝑖𝑛 (𝜃𝑓𝑟𝑜𝑛𝑡 𝑤ℎ𝑒𝑒𝑙−𝑡𝑟𝑎𝑖𝑙𝑒𝑟 )
𝑊 𝑜𝑣𝑒𝑟𝑎𝑙𝑙
(2)
Where: 131
e = Rate of superelevation 132
f = Side friction factor 133
v = Velocity (mph) 134
R = Radius (ft) 135
ө = Deflection angle between path of vehicle 136
and tires 137
G = Grade (decimal form) 138
W = Weight (Pound) 139
Moreover, the Transportation Research Board (TRB) and AASHTO technical committees on 140
geometric design, at a joint meeting in June 2004, declared the current superelevation issue to be one of 141
the five highest priorities (TRB Website 2010). To fill the gap in current superelevation design policy, 142
they initiated a project entitled ‘Superelevation criteria for sharp horizontal curves on steep grades’ 143
(Project 15-39). This project is still in progress and the results are yet to be published. 144
3. Simulation Process 145
The simulation process was developed on the basis of CarSim and TruckSim software, which are 146
among the most popular dynamics simulation packages in the vehicle industry. Any parameter, from 147
roadway geometric design to inertial properties and characteristics of vehicles, can be defined by software 148
users (Stine et al. 2010). 149
3.1 Vehicles 150
CarSim supports two-axle passenger cars and trucks with one- or two-axle trailers. TruckSim can also 151
simulate the dynamic behavior of heavy vehicles with two, three or four axles on the lead unit, dual tires 152
and various type of loading on trailer trucks. For this study, two different kinds of passenger cars and a 153
TRB 2014 Annual Meeting Paper revised from original submittal.
truck were used in the simulation: an E-class sedan, an E-class SUV and a two-axle conventional loaded 154
truck. 155
3.2 Road Environment (Geometry) 156
The performances of the vehicles were evaluated for different conditions of road geometry at various 157
speeds to study vehicle stability on horizontal curves. Design speeds of 40, 70, 100 and 130 km/h for the 158
passenger cars and 40, 70 and 100 km/h for the truck were considered. The speed of 130 km/h was 159
ignored in the truck simulation: it is not possible for a typical two-axle truck to pass a steep upgrade at a 160
speed of 130 km/h, and since the software is based on the real behavior of vehicles, it was unable to 161
consider this speed in the simulation process. An 8% maximum rate of superelevation was selected and 162
the minimum radii of horizontal curves were calculated from the AASHTO basic formula as 41, 168, 394 163
and 832 m, respectively, for each speed design. Note that the rate of superelevation was taken as 8% for 164
all tests to provide the same condition during the simulation, although sometimes more typically a rate of 165
4% or 6% is used for lower speeds. Also, for each speed design, a tangent-to-curve transition was 166
considered, with respective lengths of superelevation runoff Lr of 41, 52, 65 and 82 m and lengths of 167
tangent runoff Lt of 10.25, 13, 16.25, 20.5 m. Note that the proportion of runoff length placed on the 168
tangent was 0.8, which means that 20% of the runoff length was applied on the curved section. All of the 169
simulated curves turned to the right. Friction between tire and pavement depends on many factors, such as 170
type of tire, weather conditions, and type and age of pavement surface. It is common in studies to 171
consider a coefficient of 0.9 or 0.8 for the maximum road friction. For example, Furtado et al. (2002) used 172
a value of 0.9, while Wang et al. (2012) used 0.8. In this study, the maximum road friction coefficient was 173
assumed to be 0.8. Finally, in order to take account of the vertical alignment, longitudinal grades of −9%, 174
−6%, −3%, 0%, +3%, +6%, +9% for the passenger cars and −6%, −3%, 0%, +3%, +6% for the truck were 175
included in the simulation process. The speeds of heavy vehicles decrease significantly on sharp 176
horizontal curves on upgrades (Mavromatis and Psarianos 2003), resulting in undesirable speed 177
TRB 2014 Annual Meeting Paper revised from original submittal.
fluctuations on steep upgrades and downgrades, which was why the ±9% grades were ignored in the truck 178
simulation. 179
3.3 Driver Behavior 180
Two types of behavior for the driving system have been defined: (1) the driver negotiates the curve at 181
constant speed, or (2) the driver needs to use the brake while passing downgrades. The first type of 182
behavior (no braking) can produce the desired results for upgrades and light downgrades, although this 183
kind of driving is almost impossible on steep downgrades and drivers usually use the brake to decelerate 184
and prevent the vehicle from lateral offsetting. Bonneson (1999b) stated that 87% of drivers reduced 185
speed on the curve. Braking inputs in CarSim are defined by the pressure applied to the brake system. 186
Thus, another driving situation was defined by applying a 5 MPa braking on the curve and releasing the 187
brake 0.5 s after activating it (i.e., a reaction time of 0.5 s). The braking reaction time does not affect the 188
maximum side friction factor, and the most critical friction occurs rapidly after braking. According to 189
Varunjikar’s (2011) research, when a vehicle brakes during cornering the side friction factor increases to 190
a maximum value and then decreases, since the centripetal acceleration decreases as the speed of the 191
vehicle falls. Consequently, it was not essential to consider any greater a braking reaction time for the 192
simulation. 193
Note that the brake systems of the sedan and SUV are anti-braking systems (ABS), whereas the 194
conventional truck uses a 10 kN-m capacity hydraulic brake system. 195
4. Simulation Outcomes 196
When a vehicle negotiates a horizontal curve, two kinds of failure might occur, namely skidding (due 197
to side friction) and rollover (due to lateral acceleration). Thus, in this investigation, friction factor and 198
lateral acceleration were considered the two main criteria for safety. 199
200
TRB 2014 Annual Meeting Paper revised from original submittal.
4.1 Side Friction Factor on Upgrades 201
To calculate the cornering friction factor (demand) of vehicles on different positive grades, the forces 202
acting on the tires were obtained by simulation. The forces for the truck are shown in Table 1. Based on 203
these results and the work by Kontaratos et al. (1994), as a vehicle moves up the grade, it is subjected to 204
greater longitudinal forces, and consequently a greater longitudinal friction factor and a lower side 205
friction factor are expected to arise. It should be noted that all of the curves in the simulation turn to the 206
right, and so, for all of tests, the greatest vertical force acts on the left tire of the front axle and the least 207
vertical force acts on the right tire of the rear axle. Generally, the left side of the vehicle experiences 208
greater lateral and vertical forces than the right side during cornering, while on a straight road (no 209
cornering) the left tire is at a higher elevation than the right tire and is therefore expected to be subjected 210
to a slightly lower reaction. Lateral load transfer can occur during cornering, owing to the lateral 211
acceleration, torque generated by the engine, geometry or a combination of these. Therefore, the vertical 212
forces acting on the inner and outer tires are not the same (Varunjikar 2011). For example, on a flat curve, 213
62% of the lateral forces and 59% of the vertical forces act on the left side of the truck at a design speed 214
of 100 km/h. The lower weight on the inner tires is also a cause of rollover. 215
By dividing the lateral forces by the vertical forces, side friction factors were obtained and are shown 216
in Table 2. According to this table, the side friction factors of the sedan decrease as the grade increases. 217
For the SUV, in all the tests, the side friction factors vary only slightly with grade. However, for the 218
truck, the side friction factors are higher on upgrades than on a flat grade. Based on AASHTO (2011) and 219
Bonneson (2000), the side friction demand is greater on steep upgrades owing to the tractive forces. From 220
Table 2, a greater side friction demand arises only for the truck. Consequently, it seems that the tractive 221
forces appear only for the truck. Also, according to the results of Kontaratos et al. (1994), vehicles are 222
subjected to lower side friction on upgrades. 223
224
TRB 2014 Annual Meeting Paper revised from original submittal.
4.2 Side Friction Factor on Downgrades 225
4.2.1 Without Braking 226
The forces on the truck tires according to TruckSim are shown in Table 3. These results are for 227
vehicles traveling at constant speed without braking. The side friction factors of vehicles cornering on 228
downgrades were obtained by dividing the lateral forces by the vertical forces, and are shown in Table 4, 229
from which it is clear that, in all the tests, the side friction factors increase as the longitudinal grade 230
decreases. From the point of skidding, the sedan experiences the most critical situation compared with the 231
other vehicles (except at a speed of 40 km/h, where the truck is in the most critical situation). As with the 232
results for upgrades, the side friction factors of the SUV vary only slightly with grade. It seems that, at 233
constant speed, the side friction factor of the SUV is independent of longitudinal grade. Also, since 234
AASHTO recommends side friction factors of 0.23, 0.15, 0.12 and 0.08 at design speeds of 40, 70, 100 235
and 130 km/h, respectively, it can be seen that there is compatibility between the simulation results for the 236
SUV and the AASHTO side friction values. 237
4.2.2 With Braking 238
Many key points were seen in the simulation tests with braking. The side friction factor of the 239
vehicles fluctuated during braking, as shown in Fig. 1 for the sedan at a speed of 130 km/h on a −9% 240
grade during the braking reaction time. Therefore, owing to the presence of these fluctuations, the 241
maximum value of the side friction was taken to determine the worst situation with regard to the effect of 242
braking. As Fig. 1 shows, for the sedan at 130 km/h, the maximum value of the side friction factor 243
occurred 0.1 s after commencement of braking, while the minimum value occurred 0.1 s after release of 244
the brake in most of the tests. 245
The results for side friction factors in the braking case are presented in Table 5. As already 246
mentioned, because of the fluctuations of the side friction factor during the braking time (as shown in Fig. 247
1), the maximum values of the factors were considered in this study. From a comparison of the results in 248
TRB 2014 Annual Meeting Paper revised from original submittal.
Tables 4 and 5, the effects of braking on the side friction factor can be seen to be most significant for the 249
sedan. 250
Also, according to Varunjikar (2011), the side friction factors obtained using the transient bicycle 251
model show good agreement with the CarSim results during braking. Thus, the braking results from 252
CarSim can be taken as reliable when designing downgrades. 253
4.3 Lateral Acceleration on Upgrades 254
Another important factor affecting vehicle stability and safety is the lateral acceleration to which it is 255
subjected. Two expressions commonly occur when dealing with the lateral accelerations and lateral forces 256
that arise on cornering: centrifugal force and centripetal acceleration. The centrifugal force is an 257
imaginary force that presents only when a vehicle moves on a circular path and is opposite in direction to 258
the centripetal acceleration (Awadallah 2006). The latter is provided by the acceleration due to 259
superelevation and tire–pavement friction (Bonneson 1999a). 260
In this part of the study, the lateral acceleration of the vehicle’s center of gravity was determined using 261
the simulation software and the centripetal acceleration was calculated from the values already found for 262
the side friction factor (see the previous section). A comparison between the lateral acceleration and the 263
centripetal acceleration is presented in this section. Figure 2 shows a diagram of the lateral acceleration 264
acting on the truck while it is traveling on a flat grade at a speed of 100 km/h. Note that in Fig. 2, the 265
starting point of the curve (PC) is at approximately 6 s of motion and the end point (PT) is at 26
s. As the 266
figure shows, the maximum lateral acceleration acts at the start of the horizontal curve and, after a while, 267
the vehicle undergoes the same lateral acceleration for the entire distance of the curve. The lateral 268
acceleration for most of the curve is 5–10% lower than the maximum value. According to Bonneson 269
(1999a), vehicles tend to shift laterally on entering a sharp horizontal curve owing to the unbalanced 270
lateral accelerations that act on them at this point. Reports of accidents involving vehicles veering off the 271
road at horizontal curves indicate that this generally happens near to the start of the curve, which is 272
TRB 2014 Annual Meeting Paper revised from original submittal.
known to be the most hazardous area of the curve. The value of the lateral acceleration is constant (in a 273
steady state) for the entire distance of the curve after the starting point, which is probably due to the 274
constant steering angle during cornering after the curve has been entered. Finally, the lateral acceleration 275
decreases at the end of the horizontal curve and becomes zero at the straight section of road. Note that the 276
direction of the measured lateral acceleration is on the outward the curve and opposite to the centripetal 277
acceleration. 278
Table 6 gives the lateral and centripetal accelerations of vehicles on upgrades during cornering. It can 279
be seen from this table that the longitudinal grade does not significantly affect the lateral acceleration for 280
either of the passenger cars or for the truck. However, a difference between lateral acceleration and 281
centripetal acceleration is found in some of the tests. The lateral accelerations of the SUV at a speed of 282
130 km/h and the truck at all speeds are slightly higher than the respective centripetal accelerations. This 283
difference between centrifugal and centripetal accelerations provides an acceleration causing a lateral 284
shift that could result in the vehicle encroaching on an adjacent lane or shoulder (Bonneson 1999a). The 285
lateral accelerations acting on the sedan and the SUV are almost the same, but the truck is subjected to a 286
slightly greater lateral acceleration. Because of the higher values of the centripetal acceleration for the 287
sedan, it is more stable against lateral accelerations than the SUV and the truck. Another observation from 288
Table 6 is that the lateral and centripetal accelerations have higher values at low speeds. 289
4.4 Lateral Acceleration on Downgrades 290
As with the friction factors, the lateral accelerations of vehicles have been studied for two different 291
driving behaviors, namely with and without braking. 292
4.4.1 Without Braking 293
Table 7 gives the lateral and centripetal accelerations of vehicles on downgrades. As was the case 294
with the upgrades, the downgrades have only a slight effect on the lateral accelerations of the passenger 295
TRB 2014 Annual Meeting Paper revised from original submittal.
cars. However, slight differences between lateral and centripetal accelerations are seen in some of the 296
tests for the truck. 297
4.4.2 With Braking 298
Table 8 gives the lateral and centripetal accelerations of vehicles on downgrades during cornering 299
with a braking force applied. As in the case of the friction factors (Table 5), because of fluctuations 300
during the braking period, maximum accelerations were considered in this study. 301
The lateral acceleration of the truck is seen to be close to the static stability factor (SSF) in a few of 302
the tests. The SSF of a vehicle is calculated by dividing half of the track width by the height of the center 303
of gravity, and once the vehicle’s lateral acceleration exceeds this ratio, it is likely to roll over (Farmer 304
and Lund 2002). The SSFs of the sedan and the SUV are 1.593 and 1.303, respectively, while that of the 305
truck without any payload is 1.039 and that of the loaded truck is 0.677. This also shows the effect of 306
loading on the stability of heavy vehicles. Many rollover crashes occur because of overloaded cargo that 307
increases the height of the center of gravity (Huang and Fan 2010). The simulation gave the maximum 308
lateral acceleration of the truck, with a speed of 40 km/h on a −6% downgrade during braking, as 309
0.44861, while its SSF, as already mentioned, is 0.677. However, for passenger cars negotiating a 310
downgrade horizontal curve, braking is not a threat from the point of view of acceleration. Passenger cars 311
are resistant to rollover because of their high rollover thresholds, and a passenger car will skid before 312
rollover can occur, whereas the rollover thresholds of trucks are low because of their higher centers of 313
gravity and different suspension systems, and they usually roll over before they are likely to skid 314
(Harwood et al. 2003). 315
5. Conclusions 316
For a vehicle, the most dangerous part of a horizontal curve in a road is at the start of the curve, 317
because of the fluctuations in the steering angle and the more negative lateral acceleration (centrifugal 318
acceleration). At this point, the lateral acceleration to which the vehicle is subjected is 5–10% greater than 319
TRB 2014 Annual Meeting Paper revised from original submittal.
elsewhere along the curve. Since the steering angle is related to the lateral acceleration, it is essential to 320
control this angle during cornering. 321
In the simulations for upgrades, a greater side friction factor (demand) is produced for the truck, 322
although the side friction factor of the sedan is decreased slightly and the SUV had a constant side friction 323
factor. It seems that the tractive forces affect the side friction factors only of heavy vehicles such as 324
trucks, with no effect on those of passenger cars. 325
The side friction factor increases as the downgrade increases at constant speed (no braking), which 326
means that a greater side friction factor is produced on steep downgrades in comparison with a flat grade 327
and mild downgrades. Thus, the margin of safety decreases on steep downgrades. It should also be noted 328
that Bonneson (2000) has pointed out that the AASHTO generally underestimates the side friction factor 329
for most horizontal curves, particularly those that have steep grades. 330
Upgrades and downgrades do not have a significant effect on negative lateral accelerations 331
(centrifugal accelerations) for passenger cars. However, according to the simulations, the lateral 332
accelerations of the truck increase slightly on downgrades and decrease on upgrades. Thus, lateral 333
acceleration cannot be taken to be a threat for passenger cars for any longitudinal grade, although it seems 334
that rollover is a serious problem for trucks because of their high static stability factor. According to the 335
simulations, the maximum lateral acceleration of the truck at a speed of 40 km/h on a −6% downgrade is 336
0.44861 during the braking, while its static stability factor is 0.677. Therefore, this aspect should be 337
considered in the design of rural highways carrying a high percentage of trucks. 338
The effect of braking on the side friction factors of vehicles was found to be significant. Another 339
important finding regarding the braking is the presence of large fluctuations in the side friction factors 340
throughout the braking period. According to Table 8, braking can be a serious problem for the safety of 341
passenger cars (in terms of skidding) and trucks (in terms of rollover). 342
343
TRB 2014 Annual Meeting Paper revised from original submittal.
References 344
A Policy on Geometric Design of Highways and Streets. AASHTO, Washington D.C., 2011. 345
Awadallah, F. Theoretical analysis for horizontal curves based on actual discomfort speed. J. Transp. 346
Eng., 131(11), 2005, pp. 843-850. 347
Bonneson, J.A. NCHRP Rep. No 439: Superelevation distribution methods and transition designs. 348
National Cooperative Highway Research Program, Transportation Research Board, Washington, 349
D.C., 2000. 350
Bonneson, J.A. A kinematic approach to horizontal curve transition design. Transportation Research 351
Board, 1999a, Paper No: 00-0590. 352
Bonneson, J.A. Side Friction and Speed as Controls for Horizontal Curve Design. J. Transp. Eng., 125(6), 353
1999b, pp. 473-480. 354
Chang, T.H. Effect of vehicles suspension on highway horizontal curve design.’’ J. Transp. Eng., 127(1), 355
2001, pp. 89-91. 356
Charlton, S.G. The role of attention in horizontal curves: a comparison of advance warning, delineation, 357
and road marking treatments. J. Accid. Anal Prev., 2007, 39 (5), pp. 873–885. 358
Dabbour, E., Easa, S.M., and Abd El Halim, A.O. Radius requirements for reverse horizontal curves on 359
three-dimensional alignments. J. Transp. Eng., 130(5), 2004, pp. 610-620. 360
Easa, S., and Dabbour, E. Design radius requirements for simple horizontal curves on 3D alignments. 361
Can. J. Civ. Eng., 30(6), 2003, pp. 1022–1033. 362
Easa, S., and Dabbour, E. Establishing design guidelines for compound horizontal curves on three-363
dimensional alignments. Can. J. Civ. Eng., 2005, 32: 615–626. 364
Eck, R.W., and French, L.J. Effective superelevation for large trucks on sharp curves and steep grades. 365
West Virginia University, Report 153. 2002. 366
Farmer, C.M., and Lund, A.K. Rollover risk of cars and light trucks after accounting for driver and 367
environmental factors. J. Accid. Anal Prev., 2002, 34: 163-173. 368
TRB 2014 Annual Meeting Paper revised from original submittal.
Gim , G., Choi, Y., and Kim S. A semi-physical tire model for a vehicle dynamics analysis of handling 369
and braking. Vehicle System Dynamics: International Journal of Vehicle Mechanics and Mobility, 370
45:S1, 2007, pp. 169-190. 371
Harwood, D. W., and Mason, J. M. Horizontal curve design for passenger cars and trucks. J. Transp. Res. 372
Rec., 1994, pp. 22–33. 373
Harwood, D. W., Torbic, D. J., Richard, K. R., and Glauz, W. D. NCHRP Rep. 505: Review of truck 374
characteristics as factors in roadway design. Transportation Research Board, Washington, DC. 2003. 375
Heinrichs, B.E., Allin, B.D., Bowler, J.J., and Siegmund, G.P. Vehicle speed affects both pre-skid braking 376
kinematics and average tire/roadway friction. J. Accid. Anal Prev., 2004, 36: 829-840. 377
Huang, Q., and Fan, H. Optimization modeling of superelevation rates based on operation speed. Tenth 378
International Conference of Chinese Transportation Professionals (ICCTP), Beijing, China, 2010, 379
pp. 548-555. 380
Kontaratos, M.,Psarianos, B., and Yiotis, A. Minimum horizontal curve radius as a function of grade 381
incurred by vehicle motion in driving mode. J. Transp. Res. Rec., 1994, pp. 86-93. 382
MacAdam, C. C., Fancher, P. S., and Segel, L. Report. No. UMTRI-72895: Side friction for 383
superelevation on horizontal curves. Transportation Research Institute, Univ. of Michigan, Ann 384
Arbor, Mich. 1985. 385
Mavromatis, S., and Psarianos, B. Analytical model to determine the influence of horizontal alignment of 386
two-axle heavy vehicles on upgrades. J. Transp. Eng., 129(6), 2003, pp. 583-589. 387
Psarianos, B. Kontaratos, M., and Katsios, D. Influence of Vehicle parameters on Horizontal Curve 388
Design of Rural Highways.’’ Transportation Research Circular E-C003, 22:1-22:10. 1998. 389
Rajamani, R., Piyabongkarn, D., Tsourapas, V., and Lew, J.Y. Parameter and State Estimation in Vehicle 390
Roll Dynamics. IEEE Transportations on Intelligent Transportation System.12(4), 2011, pp. 1558-391
1567. 392
TRB 2014 Annual Meeting Paper revised from original submittal.
Stine, J. S., Hamblin, B.C., Brennan, S.N., and Donnell, E.D. Analyzing the influence of median cross-393
section design on highway safety using vehicle dynamics simulations. J. Accid. Anal Prev.,42(6), 394
2010, pp. 1769-1777. 395
TRB Website (2010): http://www.trid.trb.org/view/2010/P/1232421 396
Varunjikar, T. Design of horizontal curves with downgrades using low-order vehicle dynamics models. 397
Master of science thesis, The Pennsylvania state university, Pennsylvania. 2011. 398
You, K., Sun, L., and Gu, W. Reliability-based risk analysis of roadway horizontal curves. J. Transp. 399
Eng., 138(8), 2012, pp. 1071-1081. 400
401
402
403
404
405
406
407
408
409
410
411
412
413
414
415
416
417
418
TRB 2014 Annual Meeting Paper revised from original submittal.
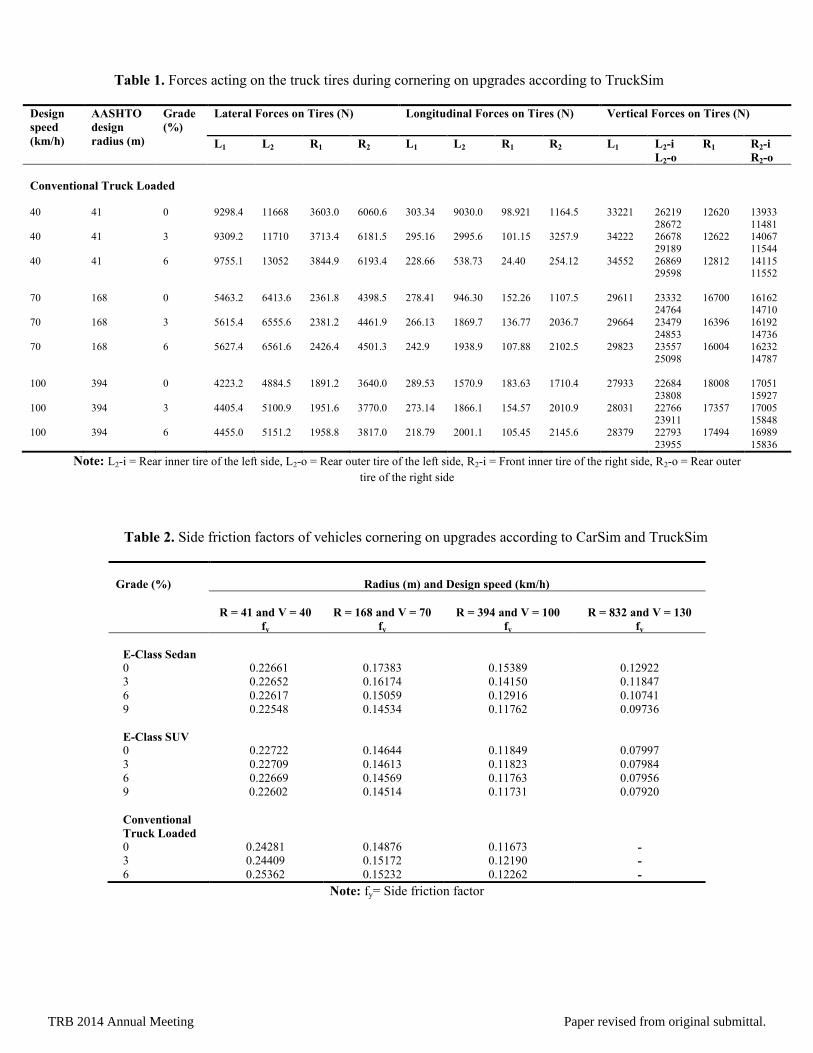
Table 1. Forces acting on the truck tires during cornering on upgrades according to TruckSim
Design
speed
(km/h)
AASHTO
design
radius (m)
Grade
(%)
Lateral Forces on Tires (N) Longitudinal Forces on Tires (N) Vertical Forces on Tires (N)
L1 L2 R1 R2 L1 L2 R1 R2 L1
L2-i
L2-o
R1
R2-i
R2-o
Conventional Truck Loaded
40 41 0 9298.4 11668 3603.0 6060.6 303.34 9030.0 98.921 1164.5 33221
26219
28672
12620
13933
11481 40 41 3 9309.2 11710 3713.4 6181.5 295.16 2995.6 101.15 3257.9 34222 26678
29189
12622 14067
11544
40 41 6 9755.1 13052 3844.9 6193.4 228.66 538.73 24.40 254.12 34552 26869 29598
12812 14115 11552
70 168 0 5463.2 6413.6 2361.8 4398.5 278.41 946.30 152.26 1107.5 29611 23332 24764
16700 16162 14710
70 168 3 5615.4 6555.6 2381.2 4461.9 266.13 1869.7 136.77 2036.7 29664 23479
24853
16396 16192
14736 70 168 6 5627.4 6561.6 2426.4 4501.3 242.9 1938.9 107.88 2102.5 29823 23557
25098
16004 16232
14787
100 394 0 4223.2 4884.5 1891.2 3640.0 289.53 1570.9 183.63 1710.4 27933 22684
23808
18008 17051
15927
100 394 3 4405.4 5100.9 1951.6 3770.0 273.14 1866.1 154.57 2010.9 28031 22766 23911
17357 17005 15848
100 394 6 4455.0 5151.2 1958.8 3817.0 218.79 2001.1 105.45 2145.6 28379 22793
23955
17494 16989
15836
Note: L2-i = Rear inner tire of the left side, L2-o = Rear outer tire of the left side, R2-i = Front inner tire of the right side, R2-o = Rear outer
tire of the right side
Table 2. Side friction factors of vehicles cornering on upgrades according to CarSim and TruckSim
Grade (%)
Radius (m) and Design speed (km/h)
R = 41 and V = 40
fy
R = 168 and V = 70
fy
R = 394 and V = 100
fy
R = 832 and V = 130
fy
E-Class Sedan
0
3
6
9
E-Class SUV
0
3
6
9
Conventional
Truck Loaded
0
3
6
0.22661
0.22652
0.22617
0.22548
0.22722
0.22709
0.22669
0.22602
0.24281
0.24409
0.25362
0.17383
0.16174
0.15059
0.14534
0.14644
0.14613
0.14569
0.14514
0.14876
0.15172
0.15232
0.15389
0.14150
0.12916
0.11762
0.11849
0.11823
0.11763
0.11731
0.11673
0.12190
0.12262
0.12922
0.11847
0.10741
0.09736
0.07997
0.07984
0.07956
0.07920
-
-
-
Note: fy= Side friction factor
TRB 2014 Annual Meeting Paper revised from original submittal.
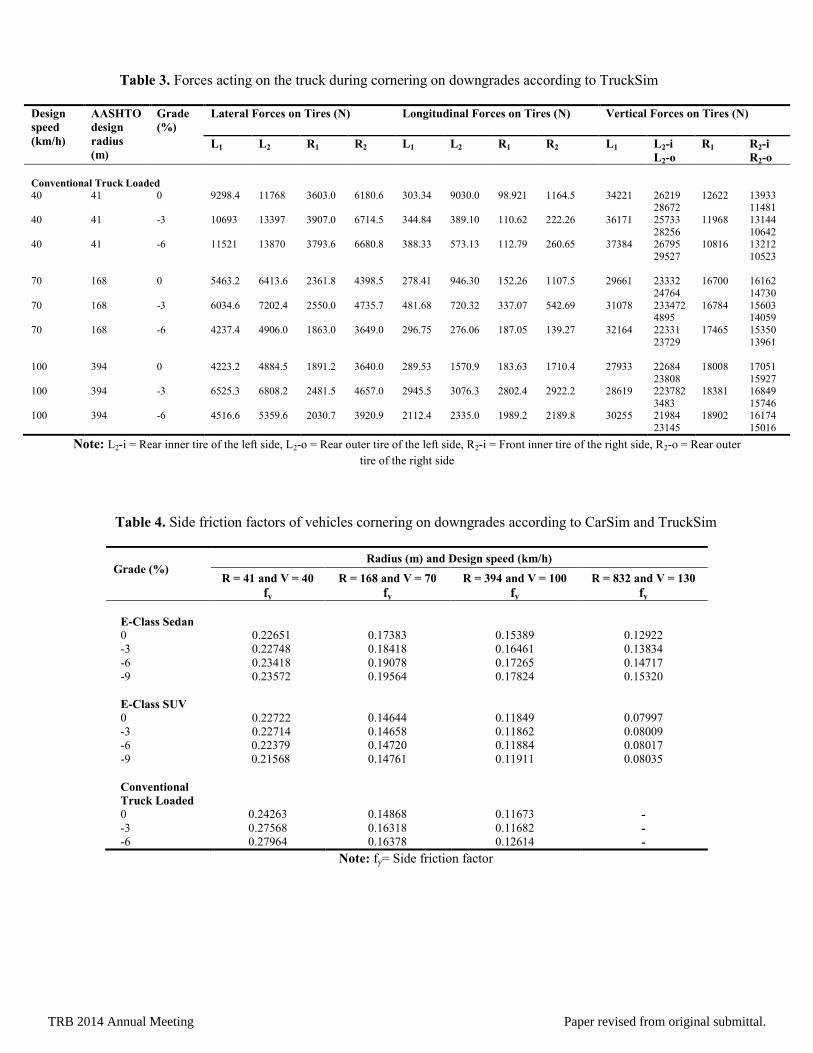
Table 3. Forces acting on the truck during cornering on downgrades according to TruckSim
Design
speed
(km/h)
AASHTO
design
radius
(m)
Grade
(%)
Lateral Forces on Tires (N) Longitudinal Forces on Tires (N) Vertical Forces on Tires (N)
L1 L2 R1 R2 L1 L2 R1 R2 L1
L2-i
L2-o
R1
R2-i
R2-o
Conventional Truck Loaded
40 41 0 9298.4 11768 3603.0 6180.6 303.34 9030.0 98.921 1164.5 34221
26219 28672
12622
13933 11481
40 41 -3 10693 13397 3907.0 6714.5 344.84 389.10 110.62 222.26 36171 25733
28256
11968 13144
10642 40 41 -6 11521 13870 3793.6 6680.8 388.33 573.13 112.79 260.65 37384 26795
29527
10816 13212
10523
70 168 0 5463.2 6413.6 2361.8 4398.5 278.41 946.30 152.26 1107.5 29661 23332
24764
16700 16162
14730
70 168 -3 6034.6 7202.4 2550.0 4735.7 481.68 720.32 337.07 542.69 31078 2334724895
16784 15603 14059
70 168 -6 4237.4 4906.0 1863.0 3649.0 296.75 276.06 187.05 139.27 32164 22331
23729
17465 15350
13961
100 394 0 4223.2 4884.5 1891.2 3640.0 289.53 1570.9 183.63 1710.4 27933 22684
23808
18008 17051
15927 100 394 -3 6525.3 6808.2 2481.5 4657.0 2945.5 3076.3 2802.4 2922.2 28619 223782
3483
18381 16849
15746 100 394 -6 4516.6 5359.6 2030.7 3920.9 2112.4 2335.0 1989.2 2189.8 30255 21984
23145
18902 16174
15016
Note: L2-i = Rear inner tire of the left side, L2-o = Rear outer tire of the left side, R2-i = Front inner tire of the right side, R2-o = Rear outer
tire of the right side
Table 4. Side friction factors of vehicles cornering on downgrades according to CarSim and TruckSim
Grade (%)
Radius (m) and Design speed (km/h)
R = 41 and V = 40
fy
R = 168 and V = 70
fy
R = 394 and V = 100
fy
R = 832 and V = 130
fy
E-Class Sedan
0
-3
-6
-9
E-Class SUV
0
-3
-6
-9
Conventional
Truck Loaded
0
-3
-6
0.22651
0.22748
0.23418
0.23572
0.22722
0.22714
0.22379
0.21568
0.24263
0.27568
0.27964
0.17383
0.18418
0.19078
0.19564
0.14644
0.14658
0.14720
0.14761
0.14868
0.16318
0.16378
0.15389
0.16461
0.17265
0.17824
0.11849
0.11862
0.11884
0.11911
0.11673
0.11682
0.12614
0.12922
0.13834
0.14717
0.15320
0.07997
0.08009
0.08017
0.08035
-
-
-
Note: fy= Side friction factor
TRB 2014 Annual Meeting Paper revised from original submittal.
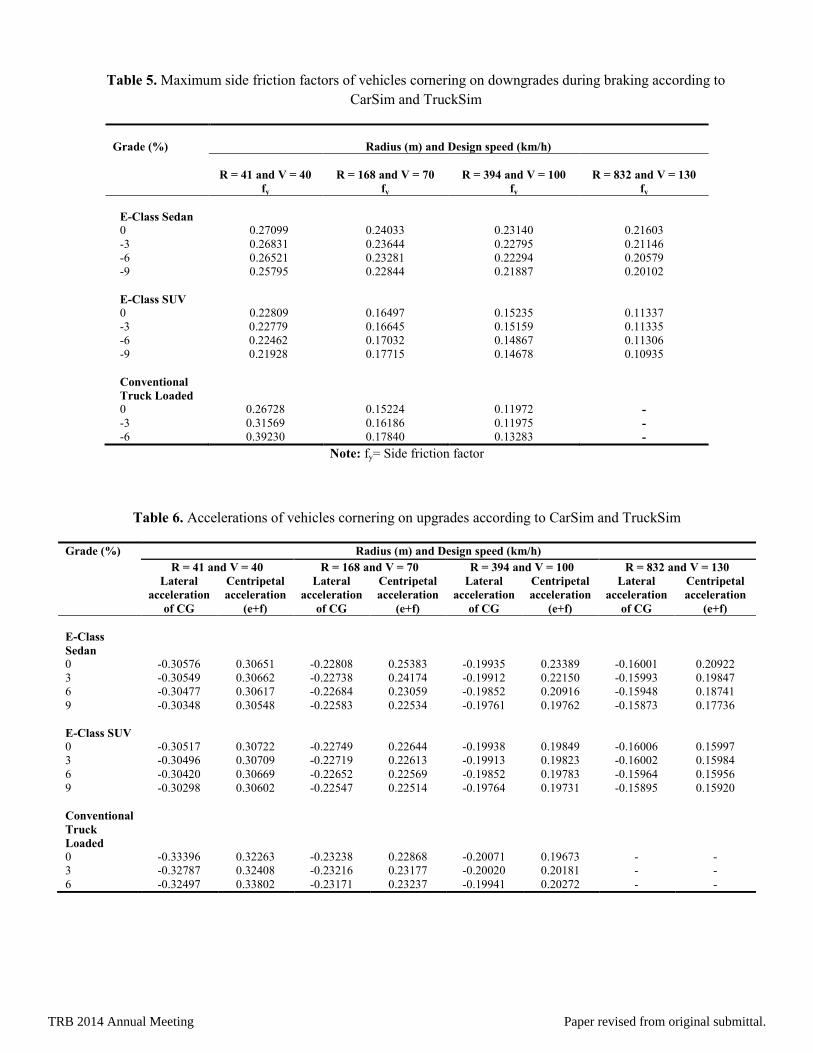
Table 5. Maximum side friction factors of vehicles cornering on downgrades during braking according to
CarSim and TruckSim
Grade (%)
Radius (m) and Design speed (km/h)
R = 41 and V = 40
fy
R = 168 and V = 70
fy
R = 394 and V = 100
fy
R = 832 and V = 130
fy
E-Class Sedan
0
-3
-6
-9
E-Class SUV
0
-3
-6
-9
Conventional
Truck Loaded
0
-3
-6
0.27099
0.26831
0.26521
0.25795
0.22809
0.22779
0.22462
0.21928
0.26728
0.31569
0.39230
0.24033
0.23644
0.23281
0.22844
0.16497
0.16645
0.17032
0.17715
0.15224
0.16186
0.17840
0.23140
0.22795
0.22294
0.21887
0.15235
0.15159
0.14867
0.14678
0.11972
0.11975
0.13283
0.21603
0.21146
0.20579
0.20102
0.11337
0.11335
0.11306
0.10935
-
-
-
Note: fy= Side friction factor
Table 6. Accelerations of vehicles cornering on upgrades according to CarSim and TruckSim
Grade (%) Radius (m) and Design speed (km/h)
R = 41 and V = 40 R = 168 and V = 70 R = 394 and V = 100 R = 832 and V = 130
Lateral
acceleration
of CG
Centripetal
acceleration
(e+f)
Lateral
acceleration
of CG
Centripetal
acceleration
(e+f)
Lateral
acceleration
of CG
Centripetal
acceleration
(e+f)
Lateral
acceleration
of CG
Centripetal
acceleration
(e+f)
E-Class
Sedan
0 -0.30576 0.30651 -0.22808 0.25383 -0.19935 0.23389 -0.16001 0.20922
3 -0.30549 0.30662 -0.22738 0.24174 -0.19912 0.22150 -0.15993 0.19847
6 -0.30477 0.30617 -0.22684 0.23059 -0.19852 0.20916 -0.15948 0.18741
9
-0.30348 0.30548 -0.22583 0.22534 -0.19761 0.19762 -0.15873 0.17736
E-Class SUV
0 -0.30517 0.30722 -0.22749 0.22644 -0.19938 0.19849 -0.16006 0.15997
3 -0.30496 0.30709 -0.22719 0.22613 -0.19913 0.19823 -0.16002 0.15984
6 -0.30420 0.30669 -0.22652 0.22569 -0.19852 0.19783 -0.15964 0.15956
9
Conventional
Truck
Loaded
0
3
6
-0.30298
-0.33396
-0.32787
-0.32497
0.30602
0.32263
0.32408
0.33802
-0.22547
-0.23238
-0.23216
-0.23171
0.22514
0.22868
0.23177
0.23237
-0.19764
-0.20071
-0.20020
-0.19941
0.19731
0.19673
0.20181
0.20272
-0.15895
-
-
-
0.15920
-
-
-
TRB 2014 Annual Meeting Paper revised from original submittal.
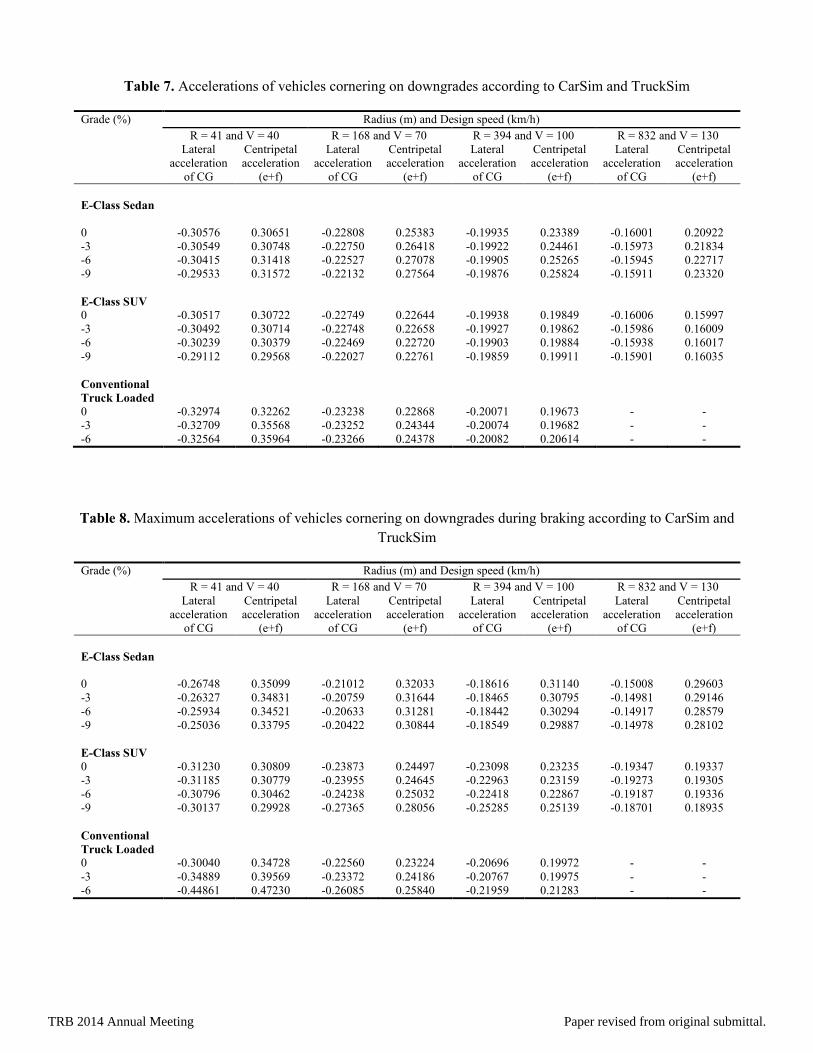
Table 7. Accelerations of vehicles cornering on downgrades according to CarSim and TruckSim
Grade (%) Radius (m) and Design speed (km/h)
R = 41 and V = 40 R = 168 and V = 70 R = 394 and V = 100 R = 832 and V = 130
Lateral
acceleration
of CG
Centripetal
acceleration
(e+f)
Lateral
acceleration
of CG
Centripetal
acceleration
(e+f)
Lateral
acceleration
of CG
Centripetal
acceleration
(e+f)
Lateral
acceleration
of CG
Centripetal
acceleration
(e+f)
E-Class Sedan
0 -0.30576 0.30651 -0.22808 0.25383 -0.19935 0.23389 -0.16001 0.20922
-3 -0.30549 0.30748 -0.22750 0.26418 -0.19922 0.24461 -0.15973 0.21834
-6 -0.30415 0.31418 -0.22527 0.27078 -0.19905 0.25265 -0.15945 0.22717
-9
-0.29533 0.31572 -0.22132 0.27564 -0.19876 0.25824 -0.15911 0.23320
E-Class SUV
0 -0.30517 0.30722 -0.22749 0.22644 -0.19938 0.19849 -0.16006 0.15997
-3 -0.30492 0.30714 -0.22748 0.22658 -0.19927 0.19862 -0.15986 0.16009
-6 -0.30239 0.30379 -0.22469 0.22720 -0.19903 0.19884 -0.15938 0.16017
-9
Conventional
Truck Loaded
0
-3
-6
-0.29112
-0.32974
-0.32709
-0.32564
0.29568
0.32262
0.35568
0.35964
-0.22027
-0.23238
-0.23252
-0.23266
0.22761
0.22868
0.24344
0.24378
-0.19859
-0.20071
-0.20074
-0.20082
0.19911
0.19673
0.19682
0.20614
-0.15901
-
-
-
0.16035
-
-
-
Table 8. Maximum accelerations of vehicles cornering on downgrades during braking according to CarSim and
TruckSim
Grade (%) Radius (m) and Design speed (km/h)
R = 41 and V = 40 R = 168 and V = 70 R = 394 and V = 100 R = 832 and V = 130
Lateral
acceleration
of CG
Centripetal
acceleration
(e+f)
Lateral
acceleration
of CG
Centripetal
acceleration
(e+f)
Lateral
acceleration
of CG
Centripetal
acceleration
(e+f)
Lateral
acceleration
of CG
Centripetal
acceleration
(e+f)
E-Class Sedan
0 -0.26748 0.35099 -0.21012 0.32033 -0.18616 0.31140 -0.15008 0.29603
-3 -0.26327 0.34831 -0.20759 0.31644 -0.18465 0.30795 -0.14981 0.29146
-6 -0.25934 0.34521 -0.20633 0.31281 -0.18442 0.30294 -0.14917 0.28579
-9
-0.25036 0.33795 -0.20422 0.30844 -0.18549
0.29887 -0.14978 0.28102
E-Class SUV
0 -0.31230 0.30809 -0.23873 0.24497 -0.23098 0.23235 -0.19347 0.19337
-3 -0.31185 0.30779 -0.23955 0.24645 -0.22963 0.23159 -0.19273 0.19305
-6 -0.30796 0.30462 -0.24238 0.25032 -0.22418 0.22867 -0.19187 0.19336
-9
Conventional
Truck Loaded
0
-3
-6
-0.30137
-0.30040
-0.34889
-0.44861
0.29928
0.34728
0.39569
0.47230
-0.27365
-0.22560
-0.23372
-0.26085
0.28056
0.23224
0.24186
0.25840
-0.25285
-0.20696
-0.20767
-0.21959
0.25139
0.19972
0.19975
0.21283
-0.18701
-
-
-
0.18935
-
-
-
TRB 2014 Annual Meeting Paper revised from original submittal.
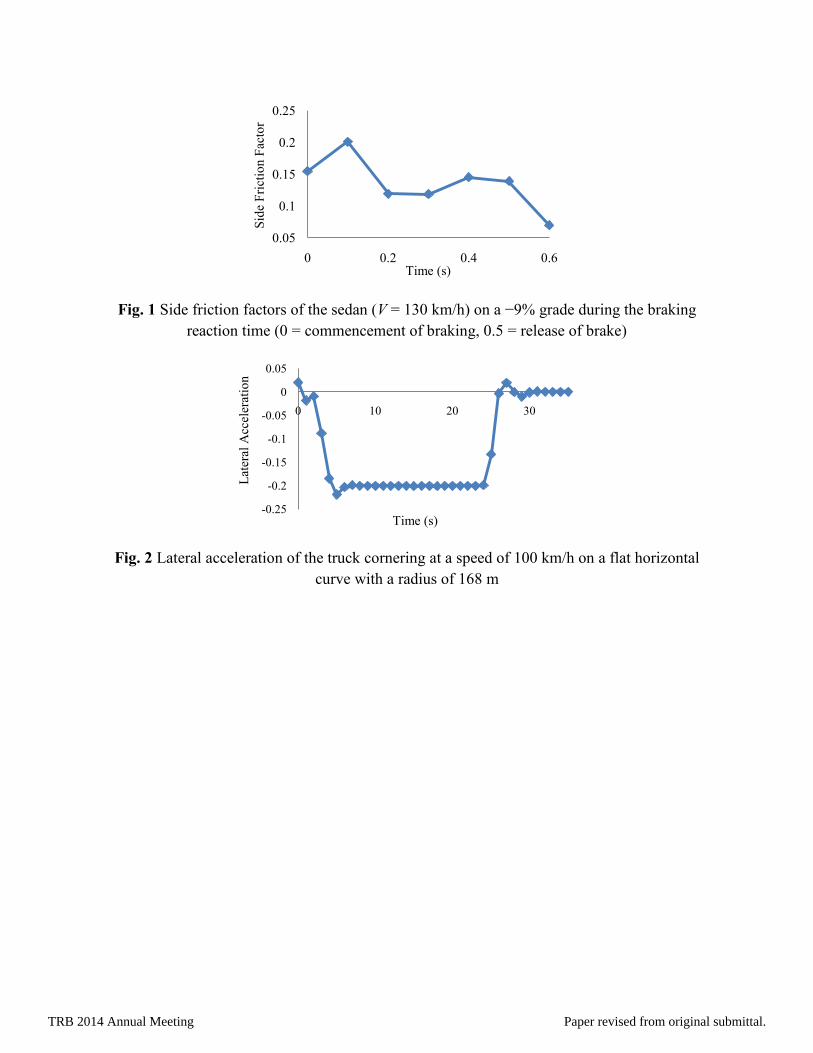
Fig. 1 Side friction factors of the sedan (V = 130 km/h) on a −9% grade during the braking
reaction time (0 = commencement of braking, 0.5 = release of brake)
Fig. 2 Lateral acceleration of the truck cornering at a speed of 100 km/h on a flat horizontal
curve with a radius of 168 m
0.05
0.1
0.15
0.2
0.25
0 0.2 0.4 0.6S
ide
Fri
ctio
n F
acto
rTime (s)
-0.25
-0.2
-0.15
-0.1
-0.05
0
0.05
0 10 20 30
Lat
eral
Acc
eler
atio
n
Time (s)
TRB 2014 Annual Meeting Paper revised from original submittal.