Motivational Pathways to Alcohol Use and Abuse Among Black and White Adolescents
17
Motivational Pathways to Alcohol Use and Abuse Among Black and White Adolescents M. Lynne Cooper and Jennifer L. Krull University of Missouri–Columbia V. Bede Agocha University of Connecticut Mindy E. Flanagan University of Missouri–Columbia Holly K. Orcutt Northern Illinois University Shelly Grabe University of Wisconsin–Madison Kurt H. Dermen Research Institute on Addictions Maudette Jackson DePaul University Community Mental Health Center Using data from a biracial community sample of adolescents, the present study examined trajectories of alcohol use and abuse over a 15-year period, from adolescence into young adulthood, as well as the extent to which these trajectories were differentially predicted by coping and enhancement motives for alcohol use among the 2 groups. Coping and enhancement motivations (M. L. Cooper, 1994) refer to the strategic use of alcohol to regulate negative and positive emotions, respectively. Results showed that Black and White youth follow distinct alcohol trajectories from adolescence into young adulthood and that these trajectories are differentially rooted in the regulation of negative and positive emotions. Among Black drinkers, coping motives assessed in adolescence more strongly forecast differences in alcohol involve- ment into their early 30s, whereas enhancement motives more strongly forecast differences among White drinkers. Results of the present study suggest that different models may be needed to account for drinking behavior among Blacks and Whites and that different approaches may prove maximally effective in reducing heavy or problem drinking among the 2 groups. Keywords: drinking motives, reasons for drinking, racial differences, drinking, trajectory Black adolescents, relative to White adolescents, initiate alcohol use at a later age, increase their use more slowly throughout adoles- cence, and reach peak involvement at an older age (Bachman et al., 1991; Duncan, Duncan, & Strycker, 2006; Warheit, Vega, Khoury, & Gil, 1996). Given these differences, it is not surprising that Black adolescents report consistently lower rates of alcohol use and drinking problems than their White counterparts throughout their teenage years (e.g., Bray, Adams, Getz, & McQueen, 2003; O’Malley, Johnston, & Bachman, 1998; Watt, 2004; see Rodham, Hawton, Evans, & Weath- erall, 2005, for similar findings based on a nationally representative sample of adolescents in England). However, these differences appear to diminish or even reverse themselves by sometime in adulthood. For example, in a nationally representative sample (Herd, 1989), rates of heavy drinking were found to peak among White men in the 18- to 29-years old age category and then decline in successive age groups, whereas the opposite pattern (i.e., lower rates in the under-30 years old than in the over-30 years old age group) was found among Black men. Similarly, White women relative to Black women reported significantly higher rates of heavy drinking between the ages of 18 and 29 years, whereas the two groups reported similar levels beyond age 30 (reviewed in Myers, Kagawa-Singer, Kumanyika, Lex, & Markides, 1995; see also Grant et al., 2004). Moreover, Black adults relative to their White counterparts appear to experience significantly higher levels of alcohol-related problems at comparable levels of use (Caetano & Kaskutas, 1996; Herd, 1990; Oetting & Beauvais, 1990; Wallace, 1999). Thus, although delayed onset of alcohol use typically confers some degree of immunity for later alcohol problems (Grant & Dawson, 1997), Black drinkers as a group do not appear to enjoy this benefit. M. Lynne Cooper, Jennifer L. Krull, and Mindy E. Flanagan, Department of Psychological Sciences, University of Missouri–Columbia; V. Bede Ag- ocha, Department of Psychology, University of Connecticut; Holly K. Orcutt, Department of Psychology, Northern Illinois University; Shelly Grabe, De- partment of Psychology, University of Wisconsin–Madison; Kurt H. Dermen, Research Institute on Addictions, Buffalo, NY; Maudette Jackson, DePaul University Community Mental Health Center, Chicago, IL. Jennifer L. Krull is now at the Department of Psychology, University of California Los Angeles. Shelly Grabe is now at the Department of Psy- chology, University of California Santa Cruz. This research was supported by National Institute on Alcohol Abuse and Alcoholism Grant AA08047 to M. Lynne Cooper. Preparation of this article was supported in part by National Institute on Mental Health midcareer scientist development award K02 MH069118 to M. Lynne Cooper. Thanks to Olga Glinskii and Kayla Bell for assistance in preparing this article. Correspondence concerning this article should be addressed to M. Lynne Cooper, Department of Psychological Sciences, University of Missouri, Columbia, 1200 Dunbar Drive, Columbia, MO 65211. E-mail: CooperM@ Missouri.edu Journal of Abnormal Psychology Copyright 2008 by the American Psychological Association 2008, Vol. 117, No. 3, 485–501 0021-843X/08/$12.00 DOI: 10.1037/a0012592 485
-
Upload
independent -
Category
Documents
-
view
2 -
download
0
Transcript of Motivational Pathways to Alcohol Use and Abuse Among Black and White Adolescents

Motivational Pathways to Alcohol Use and Abuse Among Black andWhite Adolescents
M. Lynne Cooper and Jennifer L. KrullUniversity of Missouri–Columbia
V. Bede AgochaUniversity of Connecticut
Mindy E. FlanaganUniversity of Missouri–Columbia
Holly K. OrcuttNorthern Illinois University
Shelly GrabeUniversity of Wisconsin–Madison
Kurt H. DermenResearch Institute on Addictions
Maudette JacksonDePaul University Community Mental Health Center
Using data from a biracial community sample of adolescents, the present study examined trajectories ofalcohol use and abuse over a 15-year period, from adolescence into young adulthood, as well as the extentto which these trajectories were differentially predicted by coping and enhancement motives for alcoholuse among the 2 groups. Coping and enhancement motivations (M. L. Cooper, 1994) refer to the strategicuse of alcohol to regulate negative and positive emotions, respectively. Results showed that Black andWhite youth follow distinct alcohol trajectories from adolescence into young adulthood and that thesetrajectories are differentially rooted in the regulation of negative and positive emotions. Among Blackdrinkers, coping motives assessed in adolescence more strongly forecast differences in alcohol involve-ment into their early 30s, whereas enhancement motives more strongly forecast differences among Whitedrinkers. Results of the present study suggest that different models may be needed to account for drinkingbehavior among Blacks and Whites and that different approaches may prove maximally effective inreducing heavy or problem drinking among the 2 groups.
Keywords: drinking motives, reasons for drinking, racial differences, drinking, trajectory
Black adolescents, relative to White adolescents, initiate alcoholuse at a later age, increase their use more slowly throughout adoles-cence, and reach peak involvement at an older age (Bachman et al.,1991; Duncan, Duncan, & Strycker, 2006; Warheit, Vega, Khoury, &Gil, 1996). Given these differences, it is not surprising that Black
adolescents report consistently lower rates of alcohol use and drinkingproblems than their White counterparts throughout their teenage years(e.g., Bray, Adams, Getz, & McQueen, 2003; O’Malley, Johnston, &Bachman, 1998; Watt, 2004; see Rodham, Hawton, Evans, & Weath-erall, 2005, for similar findings based on a nationally representativesample of adolescents in England). However, these differences appearto diminish or even reverse themselves by sometime in adulthood. Forexample, in a nationally representative sample (Herd, 1989), rates ofheavy drinking were found to peak among White men in the 18- to29-years old age category and then decline in successive age groups,whereas the opposite pattern (i.e., lower rates in the under-30 yearsold than in the over-30 years old age group) was found among Blackmen. Similarly, White women relative to Black women reportedsignificantly higher rates of heavy drinking between the ages of 18and 29 years, whereas the two groups reported similar levels beyondage 30 (reviewed in Myers, Kagawa-Singer, Kumanyika, Lex, &Markides, 1995; see also Grant et al., 2004). Moreover, Black adultsrelative to their White counterparts appear to experience significantlyhigher levels of alcohol-related problems at comparable levels of use(Caetano & Kaskutas, 1996; Herd, 1990; Oetting & Beauvais, 1990;Wallace, 1999). Thus, although delayed onset of alcohol use typicallyconfers some degree of immunity for later alcohol problems (Grant &Dawson, 1997), Black drinkers as a group do not appear to enjoy thisbenefit.
M. Lynne Cooper, Jennifer L. Krull, and Mindy E. Flanagan, Departmentof Psychological Sciences, University of Missouri–Columbia; V. Bede Ag-ocha, Department of Psychology, University of Connecticut; Holly K. Orcutt,Department of Psychology, Northern Illinois University; Shelly Grabe, De-partment of Psychology, University of Wisconsin–Madison; Kurt H. Dermen,Research Institute on Addictions, Buffalo, NY; Maudette Jackson, DePaulUniversity Community Mental Health Center, Chicago, IL.
Jennifer L. Krull is now at the Department of Psychology, University ofCalifornia Los Angeles. Shelly Grabe is now at the Department of Psy-chology, University of California Santa Cruz.
This research was supported by National Institute on Alcohol Abuse andAlcoholism Grant AA08047 to M. Lynne Cooper. Preparation of this articlewas supported in part by National Institute on Mental Health midcareerscientist development award K02 MH069118 to M. Lynne Cooper. Thanks toOlga Glinskii and Kayla Bell for assistance in preparing this article.
Correspondence concerning this article should be addressed to M. LynneCooper, Department of Psychological Sciences, University of Missouri,Columbia, 1200 Dunbar Drive, Columbia, MO 65211. E-mail: [email protected]
Journal of Abnormal Psychology Copyright 2008 by the American Psychological Association2008, Vol. 117, No. 3, 485–501 0021-843X/08/$12.00 DOI: 10.1037/a0012592
485

Despite general agreement that important differences exist betweenBlack and White drinkers, these differences remain poorly under-stood. Few longitudinal studies have directly compared alcohol in-volvement over time among Blacks and Whites, and of these, nonehas spanned the period from adolescence into young adulthood, whichis when these differences apparently first emerge. The present study,therefore, uses data from a representative community sample of Blackand White adolescents, aged 13 to 19 years at baseline, to examinetrajectories of alcohol use and abuse from adolescence into youngadulthood. During this period, we expect Black adolescents to catchup with and perhaps surpass White adolescents in their levels ofalcohol involvement, and we explore the possibility that these differ-ences arise at least in part because drinking comes to serve differentfunctions for Black and White drinkers. In particular, we hypothesizethat alcohol use is more strongly rooted in efforts to enhance ormaintain positive affective experience among White drinkers,whereas, over time, alcohol use becomes more strongly rooted inefforts to escape, avoid, or minimize negative affective experienceamong Black drinkers.
Coping and Enhancement Motives
A growing body of research suggests that drinking motivated by adesire or need to regulate positive versus negative affect is associatedwith unique patterns of alcohol use and abuse and distinct etiologicprocesses, despite moderate (in the .4 to .6 range) correlations be-tween the two tendencies (see Kuntsche, Knibbe, Gmel, & Engels,2005, 2006, for reviews).1 Drinking to enhance has been conceptu-alized as an appetitive motivational process in which individuals drinkto attain or maintain positive affective states or emotional experience,as exemplified by drinking to get high, to have fun, or because youlike the feeling (Cooper, Frone, Russell, & Mudar, 1995). Accord-ingly, drinking to enhance is thought to be driven by a desire toexperience a particular affective state rather than by a pre-existingemotional state one wishes to change or modify. Consistent with thisview, we have shown that neither positive nor negative mood statesdirectly predict drinking to enhance (Cooper et al., 1995), althoughbeliefs that alcohol enhances positive emotional experience as well astraits that predispose to reward seeking (i.e., sensation seeking) andpositive affect (i.e., extraversion) are predictive (Cooper, Agocha, &Sheldon, 2000; Cooper et al., 1995; see also Kuntsche et al., 2006).Drinking to enhance has also been associated with drinking at barsand with friends, especially same-sex friends (Cooper, 1994; Cooper,Russell, Skinner, & Windle, 1992)––patterns that presumably facili-tate the goals of getting high and having fun. Finally, and not sur-prisingly, drinking to enhance has also been associated with heavydrinking and drinking to intoxication, both cross-sectionally (Cooperet al., 1995; Cooper, Russell, Skinner, & Windle, 1992) and prospec-tively (Read, Wood, Kahler, Maddock, & Palfai, 2003; Schulenberg,Wadsworth, O’Malley, Bachman, & Johnston, 1996; see also Chas-sin, Flora, & King, 2004).
Drinking to cope is defined as a reactive process in which individ-uals drink to escape, avoid, or minimize unpleasant or aversiveemotional experiences (Cooper et al., 1995). Drinking to cope shouldtherefore be precipitated by the experience of negative emotions andmore common among individuals prone to experience high levels ofnegative emotions. Consistent with this view, drinking to cope hasbeen linked to the experience of negative emotions (Cooper et al.,1995) and to traits that predispose to negative emotions, including
neuroticism (Cooper et al., 2000) and (low) agreeableness (Loukas,Krull, Chassin, & Carle, 2000; see also Kuntsche et al., 2006).Individuals who rely on alcohol to cope have also been shown to holdstronger beliefs about alcohol’s capacity to alleviate dysphoric moodand to lack other more adaptive ways to cope with negative emotions(Cooper et al., 1995). In addition, those who drink to cope are morelikely to drink at home, to drink with their partner, and to drink alonerather than with others (Cooper, 1994; Cooper, Russell, Skinner, &Windle, 1992). Similar results were obtained in a recently publisheddiary study (Mohr et al., 2005) in which high coping-motive individ-uals drank more at home (as opposed to locations outside the home)following negative interpersonal interactions and negative moodstates, whereas their low coping-motive counterparts actually reducedtheir drinking under such circumstances.
Consistent with the idea that people who drink to cope becomepsychologically dependent on alcohol to cope with the day-to-dayexigencies of life, coping motives have also been shown to predictdrinking problems both indirectly via increased consumption anddirectly––that is, coping motives predict problems over and above theamount of alcohol consumed (Carpenter & Hasin, 1999; Cooper et al.,1995; Cooper, Russell, & George, 1988). Finally, coping motiveshave been shown to prospectively predict drinking problems amonghigh school students (Mushquash, Stewart, Comeau, Conrod, & Mac-lean, 2006) over the course of a semester, and in both normal (Ho-lahan, Moos, Holahan, Cronkite, & Randall, 2001) and depressed(Holahan, Moos, Holahan, Cronkite, & Randall, 2003) samples overa 10-year period.
Given the distinctive character of drinking associated with copingand enhancement motives, it seems plausible that race differences ineither the strength or predictive utility of these motives could lead tounique patterns of alcohol involvement over time among Black andWhite individuals. In particular, the heavier drinking characteristic ofWhite adolescents appears compatible with a pattern of enhancement-motivated consumption, whereas the higher rates of problem drinkingultimately characteristic of Black individuals appears compatible withdrinking to cope. As the following review will show, these conten-tions are largely supported by existing data, particularly among adultdrinkers.
Race Differences in Drinking Motives DuringAdolescence and Adulthood
Using data from a representative sample of Black and White adults(aged 18 to 82 years), Cooper, Russell, Skinner, and Windle (1992)found that Blacks reported significantly higher levels of coping mo-tives and that coping motives more strongly predicted alcohol use anddrinking problems among Blacks. In contrast, although the two racial
1 Drinking for ceremonial or social reasons (e.g., to celebrate a specialoccasion or relax with friends) represents a third important motivation foralcohol use. Although some studies have shown race differences in thepropensity to drink for social reasons, with Whites more strongly endorsingthese reasons than Blacks have (Smith et al., 1993), we have chosen not tofocus on social motives as they have been consistently associated with apattern of occasional, light to moderate, and largely nonproblematic drink-ing (see Kuntsche et al., 2005, for a review). Thus, differential reliance ondrinking for social reasons by Blacks and Whites seems unlikely to explaindifferential rates and course of either heavy or problem drinking that arethe focus of the present study.
486 COOPER ET AL.
groups did not differ in enhancement motives, enhancement never-theless more strongly predicted alcohol use and drinking problemsamong White drinkers than it did among Black drinkers. Similarly,Smith, Abbey, and Scott (1993) found that Black drinkers morestrongly endorsed drinking to cope, whereas White drinkers morestrongly endorsed drinking for enjoyment, though they did not testRace � Motive interactions.
Indirect evidence also supports the idea that alcohol use is morestrongly rooted among Black adults than among White adults in anetiologic system that involves the experience and regulation of neg-ative emotions. For example, a number of studies have shown thatalcohol use and drinking problems are more strongly associated withdepression (Jones-Webb, Jacobs, Flack, & Liu, 1996; Neff, 1986;Peirce, Frone, Russell, & Cooper, 1994), anxiety (Bell, Keeley, &Buhl, 1977), maladaptive forms of coping with negative emotions(Cooper, Russell, Skinner, Frone, & Mudar, 1992), and the experienceof stressful events (Cooper, Russell, Skinner, Frone, & Mudar, 1992)among Black adult drinkers than among White adult drinkers.
In contrast to the consistent pattern of findings observed amongadult drinkers, studies comparing drinking motives among Black andWhite adolescents have yielded more mixed results. For example,several studies have shown that White adolescents endorse allreasons for drinking more strongly than do Black adolescents (e.g.,Singer & Petchers, 1987; C. Stewart & Power, 2003), a pattern thatis consistent with their heavier usage. Similar main effect differ-ences were also obtained in an earlier study using Wave I datafrom the current sample (Cooper, 1994). In addition, neither cop-ing nor enhancement motives were found to differentially predictalcohol outcomes across racial groups in our sample.
In contrast, other studies report findings that more closely parallelthose observed among adult drinkers. For example, Brannock, Schan-dler, and Oncley (1990) found that Black adolescents were morelikely to drink in response to stress, whereas White adolescents weremore likely to drink to enhance. Using data from a community sampleof Black and White adolescents, Bradizza, Reifman, and Barnes(1999) also found evidence, albeit weak (only 2 of 11 interaction testswere significant), that coping motives more strongly predict alcoholoutcomes among Black adolescents than among White adolescents.Unfortunately, however, their study did not include a measure ofenhancement motives. Finally, indirect evidence also suggests thatdrinking is embedded in distinct etiologic networks among Black andWhite adolescents. For example, Maag and Irvin (2005) found that thelink between depression and alcohol use was stronger among Blackadolescents than among White adolescents, whereas Brown, Miller,and Clayton (2004) found that the link between sensation seeking (anindividual difference linked to greater reward sensitivity) and alcoholuse was stronger among White adolescents.
In summary, although the extant literature is limited and somewhatmixed, the overall pattern of findings suggests that alcohol use amongBlack and White drinkers is differentially rooted in the regulation ofnegative and positive emotions, respectively, and that these differ-ences may emerge or strengthen sometime between adolescence andadulthood.
The Present Study
Using longitudinal data collected over a 15-year period from a largeand representative community sample of Black and White adoles-cents, the present study tests whether race differences in coping and
enhancement motives emerge during the period from adolescence intoyoung adulthood and, if so, whether these differences can help explainthe expected pattern of differential growth in alcohol involvementbetween Blacks and Whites during this developmental period. Thefollowing specific hypotheses were tested.
First, we examined changes over time in alcohol use and drinkingproblems separately among Black and White youth. Based on pastresearch, we expected White youths, relative to Black youths, to startat a higher level and to show steeper increases throughout adoles-cence, to peak somewhat earlier and then decline more steeply in theirmid to late 20s. In contrast, we expected Black youths to start outlower and grow less steeply throughout their teens and into their early20s but then to show smaller decreases, such that alcohol trajectoriesfor the two groups converge or cross-over in the late 20s or early 30sage range.
Second, we compared change over time in coping and enhance-ment motives among Black and White youth. Although White ado-lescents more strongly endorsed coping motives at baseline (Cooper,1994), we expected coping motives to grow more steeply amongBlack adolescents than among White adolescents, such that Blackdrinkers eventually catch up to and perhaps surpass their Whitecounterparts. In contrast, we expected White adolescents, who alsomore strongly endorsed enhancement motives at baseline (Cooper,1994), to grow at a similar or steeper rate than their Black counterpartsthroughout adolescence and into their 20s, such that initial differencesare maintained or possibly even exacerbated over time.
Finally, although we know from prior work (Cooper, 1994; Cooperet al., 1995) that neither coping nor enhancement motives morestrongly predict alcohol involvement during adolescence in thissample, we expected differences to emerge across time. Specifi-cally, we expected that coping motives would predict prospectiveincreases in alcohol involvement over time more strongly amongBlack youth than among White youth, whereas enhancement mo-tives would predict prospective increases in alcohol involvementmore strongly among White youth than among Black youth. Sim-ilarly, we expected that change in coping motives would be morestrongly associated with change in alcohol involvement amongBlacks than among Whites, whereas the reverse would be true forchange in enhancement motives.
The present study builds on the existing literature in several im-portant ways. It is the first to track changes in alcohol involvementduring a crucial developmental period, when drinking among Blackyouth appears to catch up with and possibly surpass that of their Whitecounterparts. By focusing on this period, we are in a position todocument the pattern of differential growth, which heretofore hasbeen inferred based largely on cross-sectional comparisons of differ-ent age groups. More important, we can also examine potential factorsthat underlie and account for expected patterns of differential growth.The focus on drinking motives is an important additional strength ofthe present study. Ours is the first study to examine changes indrinking motives over this developmental period and to do so sepa-rately for Black and White youth. In addition, drinking motives––thought to serve as a final common pathway through which moredistal influences (e.g., personality) on alcohol use and abuse aremediated (Cooper et al., 1995, 2000; Hussong, 2003; Wills, Sandy,Shinar, & Yaeger, 1999)––provide a particularly relevant frameworkfor understanding possible etiologic differences in the developmentalcourse of alcohol use. Moreover, a better understanding of drinkingmotives and the different roles they play in the etiology of problematic
487RACE DIFFERENCES IN DRINKING MOTIVES

alcohol use among Blacks and Whites could provide important in-sights into the types of interventions that would be maximally effec-tive for the two racial groups. Finally, the large and representativebiracial sample not only confers substantial power for examining racedifferences but also promises to provide important evidence on thenormative development of alcohol use and abuse among Black andWhite youth from adolescence into young adulthood.
Method
Sample
Data for the present study were taken from a longitudinal study ofBlack and White adolescents (13 to 19 years old at baseline) whowere interviewed up to five times over a 15-year period. In 1989,2,544 eligible adolescents living in Buffalo, New York, were identi-fied through a random-digit dial procedure that oversampled ex-changes in predominately Black neighborhoods. Interviews werecompleted with 2,051 of these adolescents (81%; Time 1 [T1]); 1,813of the initially interviewed adolescents (88%) were reinterviewed in1994–1995 (Time 2 [T2]), and 1,488 (73% of T1 adolescents) werereinterviewed again, on average, 6 years later (Time 3 [T3]). Incontrast to previous waves, and for reasons unrelated to the presentstudy, only those who were 27 years old or younger at T3 (n � 662)were eligible to participate in the fourth and fifth waves. Of these, 533(81% of T3 eligibles) respondents were interviewed a fourth time (T4)and 440 (67% of T3 eligibles) a fifth time (T5). The final two wavesof interviews were conducted between 2001 and 2004, with eachinterview taking place a minimum of 1 year after the preceding one.
Preliminary analyses were conducted to examine demographicdifferences in participation across waves. A count of the number ofwaves completed (up to 5) was regressed on gender, race, and parentalsocioeconomic status (SES) at T1 (a composite measure of parentaleducation and employment status). Results showed that females (� �.208, p � .001) and Whites (� � .055, p � .01), as well as individualsfrom higher socioeconomic backgrounds (� � .068, p � .01) com-pleted more interviews. Because age and eligibility to participate inthe fourth and fifth waves were confounded by design, separateattrition analyses were run in which the number of interviews com-pleted, using the first three waves only, served as the dependentmeasure. These results showed that younger adolescents completedmore interviews (� � �.067, p � .01).
Analyses for the present study were restricted to the subset ofindividuals who had ever consumed alcohol at T1 (n � 1,357), anecessary restriction because only those who had ever consumedalcohol completed the drinking motives measure. Comparisons ofincluded and excluded individuals revealed no significant differenceson gender, race, or parental SES. However, included respondentswere older (reflecting the fact that older respondents were more likelyto have ever consumed alcohol) and reported higher levels of alcoholinvolvement at T2 through T5, suggesting that the included sampledisproportionately retained those most likely to drink heavily, expe-rience drinking problems, or both.2 In light of these differences, themain effects of gender, age, parental SES, and race were controlled inall analyses. Sample characteristics, broken down by race and wave,are summarized in Table 1.
Interview Procedures
At T1, informed consent was obtained from participants prior to theinterview, as was parental consent for minors. A structured face-to-
face interview was conducted by a professionally trained interviewerwho was always matched on gender and, in 75% of the cases, on raceas well. Alcohol use and drinking motive questions were intervieweradministered; drinking problems were self-administered using a pen-and-paper questionnaire that was sealed in a privacy envelope at theend of the interview. Interviews followed an identical procedure at T2and T3 with two exceptions. First, both the interviewer- and self-administered portions of the interviews were computerized. Becausecomputer administration appears to reduce underreporting of sensitivebehaviors (Rosenfeld, Booth-Kewley, & Edwards, 1993), the T1 toT2 increase in alcohol involvement may have been artifactuallyinflated, though there is no reason to believe that this differentiallyaffected Black and White, or low and high motive, respondents.Second, at T2 and T3, 5% (n � 90) and 24% (n � 373), respec-tively, of participants who had moved out of the area were inter-viewed by phone. Comparison of alcohol items assessed in phoneversus face-to-face interviews revealed no differences after con-trolling for demographic differences between individuals whomoved versus stayed in the local community. Finally, the T4 and T5interviews were conducted exclusively over the telephone following aprotocol that was functionally identical to that used for the phoneinterviews at T2 and T3.
Measures
Table 2 presents descriptive information on the primary studyvariables broken down by wave.3 Measures were assessed identi-cally across waves, except where otherwise noted.
Motives for drinking. Coping and enhancement motives weremeasured at T1 through T3 by two five-item scales from the DrinkingMotives Questionnaire (Cooper, 1994). For each item, respondentsrated how often (on a 1 to 6 scale where 1 � never and 6 � almostalways) they drink to cope (e.g., to forget your worries) or to enhance(e.g., because it gives you a pleasant feeling). The psychometricproperties of this measure are generally excellent and have beendescribed in detail elsewhere (Cooper, 1994; S. H. Stewart, Zeitlin, &Samoluk, 1996). In the present sample, reliabilities for coping motives
2 At the suggestion of a reviewer, we conducted additional attritionanalyses comparing those who were retained in the final two waves withthose who were eligible to participate but not retained. For the purposes ofthis analysis, participants were considered eligible if they were less than 27years old at T3 or, based on T1 age, were projected to have been less than27 years old at T3 had they been retained in the sample (projected age �T1 age � average elapsed time between the T1 and T3 interviews). Usingthis procedure, we compared the 223 individuals who were eligible but notinterviewed at T4 with the 287 who were interviewed at T4. Similar toattrition biases noted for the full sample, T4 participants were significantlyyounger than nonparticipants were (15.1 years vs. 15.6 years, p � .001) atT1; they were more likely to be women (62% vs. 35%, p � .001), and theirparents reported somewhat higher SES (2.1 vs. 1.94, p � .05), though theydid not differ by racial group. Moreover, the two groups did not differ (atp � .05) on any of the T1 alcohol measures or in drinking motives oncedemographic differences were controlled.
3 The distributional properties of all measures were examined and,where necessary to reduce nonnormality, extreme scores were recoded toless extreme values (fewer than 2% of values were recoded in all cases).This procedure maintains the rank order of the highest scoring individualswhile reducing their potential to exert undue influence on the analyses.Values for recoded variables are reported in the table.
488 COOPER ET AL.
ranged from .82 to .91 across waves among Black participants andfrom .84 to .92 among White participants. For enhancement motives,reliabilities ranged from .87 to .90 across waves among Black partic-ipants and from .89 to .92 among White participants. Correlationsbetween the two motives ranged from .40 to .60 across waves andwere similar across the two groups.
Alcohol use. Three measures of alcohol use were included atall five waves. Usual alcohol use (no time frame specified) wasassessed by a composite of two items: usual amount consumed(on a 4-point scale ranging from a very small amount to a verylarge amount) and the frequency of drinking to intoxication (on a6-point scale from never been drunk to get drunk almost everyday).A standard quantity-frequency measure of alcohol use (indexingmean drinks per day) over the past 6 months was calculated usingtwo items: Thinking back over the past 6 months, (a) how often didyou drink any kind of alcoholic beverages, including beer, wine,wine coolers, or liquor? (b) About how many drinks on the averagewould you have on a typical day when you drank? One drink wasdefined as a 4 oz. glass of wine, a 12 oz. wine cooler, a 12 oz. beer,or a shot or drink containing 1 oz. of liquor. Frequency of heavydrinking during the past 6 months was also assessed by a com-posite of two items: frequency of drinking five or more drinks ona single occasion and frequency of drinking to intoxication. Bothwere assessed on a 0 to 8 scale where 0 � never in the past six
months and 8 � 5 or more times a week. Those who had everconsumed alcohol, but not in the past 6 months, were scored 0 onboth 6-month measures. The inclusion of a measure that reflectsconsumption over a longer time frame (viz., usual consumption)along with the two 6-month measures provides more sensitiveassessments of those who drink both less and more frequently.
Drinking problems. Drinking problems were assessed at T1by five items taken from Jessor, Donovan, and Costa (1989) inwhich respondents rated the frequency of problems with par-ents, friends, dating partners, or at school or work due to theiralcohol use. Because the character of drinking problemschanges markedly from adolescence into adulthood (Rachel,Maisto, Guess, & Hubbard, 1982), a different measure––a shortform of the Michigan Alcoholism Screening Test (MAST;Selzer, Vinokur, & Van Rooijen, 1975)––was used at laterwaves. Like the T1 measure, the MAST assesses problems dueto alcohol experienced with one’s relationship partner andfamily and at work, along with symptoms of dependence andtreatment seeking and receipt. Relative to the T1 measure, theMAST indexes more serious forms of abuse, in part becauseadolescent drinking can be censured even when it is not particularlydangerous or problematic. Consequently, the absolute change fromT1 to T2 will be difficult to interpret, though relative change acrossracial groups should nevertheless be meaningful.
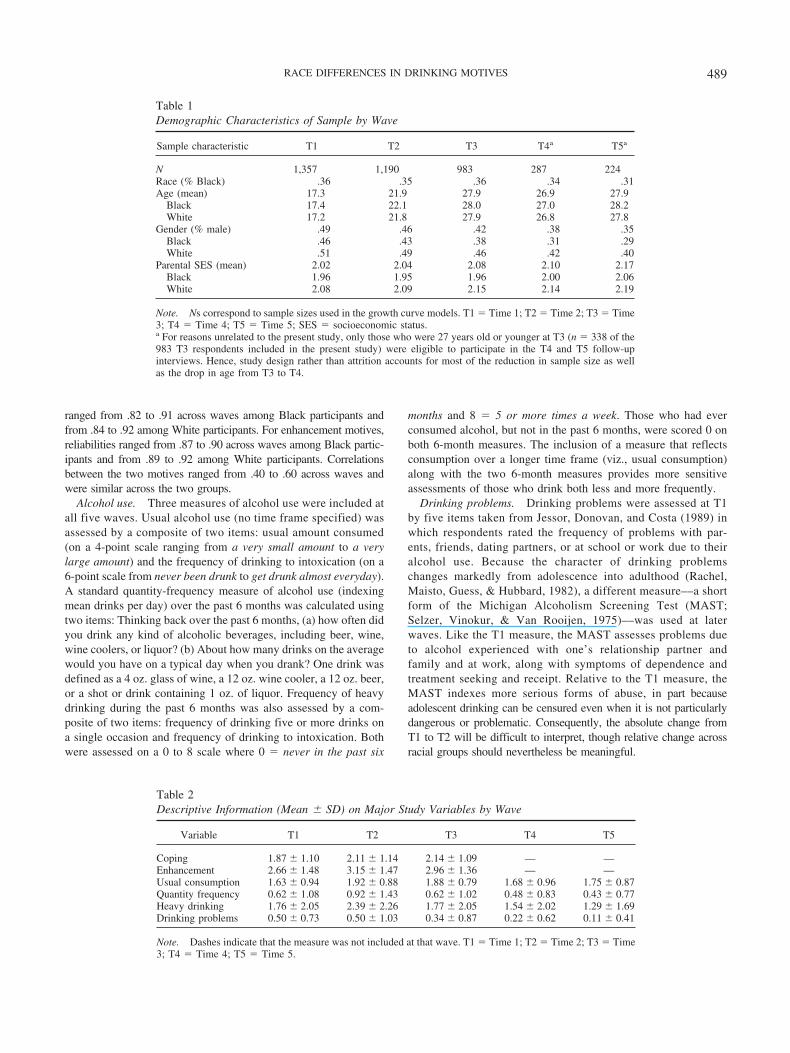
Table 1Demographic Characteristics of Sample by Wave
Sample characteristic T1 T2 T3 T4a T5a
N 1,357 1,190 983 287 224Race (% Black) .36 .35 .36 .34 .31Age (mean) 17.3 21.9 27.9 26.9 27.9
Black 17.4 22.1 28.0 27.0 28.2White 17.2 21.8 27.9 26.8 27.8
Gender (% male) .49 .46 .42 .38 .35Black .46 .43 .38 .31 .29White .51 .49 .46 .42 .40
Parental SES (mean) 2.02 2.04 2.08 2.10 2.17Black 1.96 1.95 1.96 2.00 2.06White 2.08 2.09 2.15 2.14 2.19
Note. Ns correspond to sample sizes used in the growth curve models. T1 � Time 1; T2 � Time 2; T3 � Time3; T4 � Time 4; T5 � Time 5; SES � socioeconomic status.a For reasons unrelated to the present study, only those who were 27 years old or younger at T3 (n � 338 of the983 T3 respondents included in the present study) were eligible to participate in the T4 and T5 follow-upinterviews. Hence, study design rather than attrition accounts for most of the reduction in sample size as wellas the drop in age from T3 to T4.
Table 2Descriptive Information (Mean � SD) on Major Study Variables by Wave
Variable T1 T2 T3 T4 T5
Coping 1.87 � 1.10 2.11 � 1.14 2.14 � 1.09 — —Enhancement 2.66 � 1.48 3.15 � 1.47 2.96 � 1.36 — —Usual consumption 1.63 � 0.94 1.92 � 0.88 1.88 � 0.79 1.68 � 0.96 1.75 � 0.87Quantity frequency 0.62 � 1.08 0.92 � 1.43 0.62 � 1.02 0.48 � 0.83 0.43 � 0.77Heavy drinking 1.76 � 2.05 2.39 � 2.26 1.77 � 2.05 1.54 � 2.02 1.29 � 1.69Drinking problems 0.50 � 0.73 0.50 � 1.03 0.34 � 0.87 0.22 � 0.62 0.11 � 0.41
Note. Dashes indicate that the measure was not included at that wave. T1 � Time 1; T2 � Time 2; T3 � Time3; T4 � Time 4; T5 � Time 5.
489RACE DIFFERENCES IN DRINKING MOTIVES

Overview of Data Analyses
Hypotheses concerning patterns of change in alcohol involvementand drinking motives over time, as well as race differences in thesepatterns, were evaluated in a series of multilevel random coefficient(MRC) models using the hierarchical linear and nonlinear modelingprogram, Version 6 (Raudenbush, Bryk, Cheong, & Congdon, 2004).Hypotheses concerning the effects of motives on changes in alcoholinvolvement over time and race differences in the nature and strengthof these effects were evaluated using both MRC and ordinary leastsquares (OLS) regression.
The MRC and OLS approaches complement one another inimportant ways. The MRC analyses are particularly well-suited tothe complex structure of our data, taking into account age heter-ogeneity at baseline (Mehta & West, 2000) as well as differingtime lags between waves and across individuals. MRC analysisalso optimizes the reliability of parameter estimates by using allavailable data and by differentially weighting parameter estimatesby their reliability (see Raudenbush & Bryk, 2002). The OLSanalyses, on the other hand, provide an explicit test of the rela-tionship between change in motives and both concomitant andprospective change in alcohol outcomes, which cannot be obtainedfrom the MRC models using current data. Because motives wereassessed at only three time points, an MRC model with motives astime-varying predictors would utilize only three (of five) waves ofalcohol outcome data. This fact in turn would greatly limit modelspecification.4 The OLS analyses, which use (in separate analyses)T1 and T2 motives as predictors, also provide an important cross-time replication of motive effects on linear growth in alcohol involve-ment. The MRC models, in contrast, estimate change in alcoholinvolvement from baseline and thus use only T1 predictors.
Perhaps most important, the OLS and MRC analyses addressdifferent questions or processes in the data. Although both ap-proaches estimate change in alcohol involvement over time as afunction of prior motives, the OLS analyses estimate change as afunction of prior motives while controlling for contemporaneouslevels of alcohol involvement, whereas the MRC analyses modelinitial levels of alcohol involvement as part of the growth curve (i.e.,the intercept) and thus do not statistically control for these levels (i.e.,initial levels are treated as dependent rather than independent vari-ables). In short, the MRC models can be seen as providing the bestdescriptions of growth in alcohol involvement both overall and as afunction of race and initial motives, whereas the OLS models arebetter able to isolate the unique effects of prior motives on growth,independent of contemporaneous levels of alcohol involvement.
Results
Patterns of Change in Drinking Motives, Alcohol Use,and Drinking Problems Over Time
Our initial analyses consisted of six unconditional MRC modelsestimating growth in the four alcohol outcome measures and twodrinking motives. MRC models can be conceptualized in two stages:Level 1 (L1; within-subjects model) and Level 2 (L2; between-subjects model). The L1 model describes the pattern of growth foreach individual in the repeated dependent variable as a function ofage. Growth is comprised of three parameters: an intercept (status onthe dependent variable at age 14), a slope (instantaneous linear change
at age 14), and a quadratic term (accelerating or decelerating growth,represented in the equation by age-squared). Respondent age wascentered at 14 years old because we wanted to model growth fromadolescence forward through time, and 14 yielded a more stablesolution than 13 years old did (the youngest age in the sample), forwhich fewer data points were available. Estimates of all growthparameters were specified as random effects (i.e., allowed to varyacross individuals) in the L2 model, except when modeling motives asthe outcome, where quadratic components were necessarily fixed.5
Finally, given that the data consist of observations made on variable(rather than fixed) occasions, with subjects assessed at different agesand at different intervals, complex modeling of the within-personerror structure was not conducted, and only a single homogeneouserror variance was estimated at L1.
All analyses were conducted in the full sample, except fordrinking problems, which were analyzed in the subset who re-ported drinking in the past 6 months at one or more waves (1,190of 1,357 respondents). This restriction served to eliminate individ-uals who had never experienced a drinking problem simply be-cause they never drank during the time frame assessed by theproblem measure. Results are summarized in Table 3.
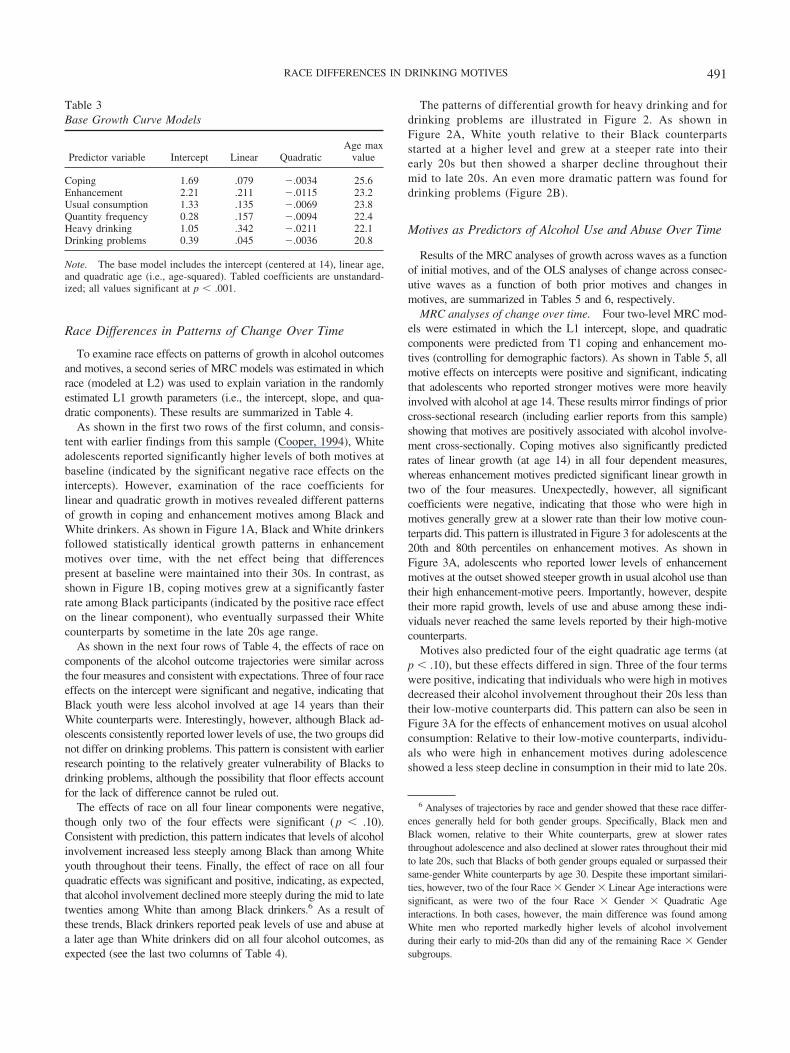
Examination of the base growth curve models revealed strongsimilarities across all six measures. As shown in Table 3, all sixintercepts were positive and significant, indicating that adolescentsreport significant (i.e., nonzero) levels of alcohol involvement byage 14, which would be expected given that lifetime abstainerswere dropped from the sample. Also as expected, all six linear(slope) effects were positive and significant, indicating that sig-nificant increases occurred from age 14 in drinking motives andalcohol involvement. All six quadratic effects were negative andsignificant, again as expected, indicating that as age increased, therate of growth decelerated. Finally, as the last column in Table 3shows, the maximum height of each of the growth curves occurredsomewhere in the early to mid 20s age range, with drinkingproblems reaching its peak at the youngest age and coping motivesat the oldest age. Importantly, however, we suspect that the earlypeak for drinking problems is largely artifactual, reflecting theaforementioned T1–T2 change in measurement.
4 A key limitation concerns the number of random (vs. fixed) effects thatcan be estimated. Specifically, the number of estimable random effects is equalto the maximum number of data points per subject (three, in the case of thedrinking motives variables). Therefore, it would not be possible to simulta-neously estimate random intercept, slope, and quadratic terms at L2 in additionto a random L1 (within-person) error component for the equation.
5 Because of limitations on the number of random effects that can beestimated with only three waves of data (see Footnote 4), we estimated the L2quadratic terms as fixed effects in our motive-as-outcome models, which tendsto produce downward bias in the standard error of the estimate and thus anoverly liberal significance test. However, supplemental analyses in which thequadratic component was freely estimated while the L1 error component wasspecified as a constant equal to its estimated value from the fixed quadraticeffect analysis showed that the results for the quadratic component were highlysimilar to those reported in the text and in no case led to a different conclusionregarding the existence of the quadratic component. These results suggest thatany downward bias introduced into our model by fixing the error componentfor the quadratic effect was small.
490 COOPER ET AL.
Race Differences in Patterns of Change Over Time
To examine race effects on patterns of growth in alcohol outcomesand motives, a second series of MRC models was estimated in whichrace (modeled at L2) was used to explain variation in the randomlyestimated L1 growth parameters (i.e., the intercept, slope, and qua-dratic components). These results are summarized in Table 4.
As shown in the first two rows of the first column, and consis-tent with earlier findings from this sample (Cooper, 1994), Whiteadolescents reported significantly higher levels of both motives atbaseline (indicated by the significant negative race effects on theintercepts). However, examination of the race coefficients forlinear and quadratic growth in motives revealed different patternsof growth in coping and enhancement motives among Black andWhite drinkers. As shown in Figure 1A, Black and White drinkersfollowed statistically identical growth patterns in enhancementmotives over time, with the net effect being that differencespresent at baseline were maintained into their 30s. In contrast, asshown in Figure 1B, coping motives grew at a significantly fasterrate among Black participants (indicated by the positive race effecton the linear component), who eventually surpassed their Whitecounterparts by sometime in the late 20s age range.
As shown in the next four rows of Table 4, the effects of race oncomponents of the alcohol outcome trajectories were similar acrossthe four measures and consistent with expectations. Three of four raceeffects on the intercept were significant and negative, indicating thatBlack youth were less alcohol involved at age 14 years than theirWhite counterparts were. Interestingly, however, although Black ad-olescents consistently reported lower levels of use, the two groups didnot differ on drinking problems. This pattern is consistent with earlierresearch pointing to the relatively greater vulnerability of Blacks todrinking problems, although the possibility that floor effects accountfor the lack of difference cannot be ruled out.
The effects of race on all four linear components were negative,though only two of the four effects were significant ( p � .10).Consistent with prediction, this pattern indicates that levels of alcoholinvolvement increased less steeply among Black than among Whiteyouth throughout their teens. Finally, the effect of race on all fourquadratic effects was significant and positive, indicating, as expected,that alcohol involvement declined more steeply during the mid to latetwenties among White than among Black drinkers.6 As a result ofthese trends, Black drinkers reported peak levels of use and abuse ata later age than White drinkers did on all four alcohol outcomes, asexpected (see the last two columns of Table 4).
The patterns of differential growth for heavy drinking and fordrinking problems are illustrated in Figure 2. As shown inFigure 2A, White youth relative to their Black counterpartsstarted at a higher level and grew at a steeper rate into theirearly 20s but then showed a sharper decline throughout theirmid to late 20s. An even more dramatic pattern was found fordrinking problems (Figure 2B).
Motives as Predictors of Alcohol Use and Abuse Over Time
Results of the MRC analyses of growth across waves as a functionof initial motives, and of the OLS analyses of change across consec-utive waves as a function of both prior motives and changes inmotives, are summarized in Tables 5 and 6, respectively.
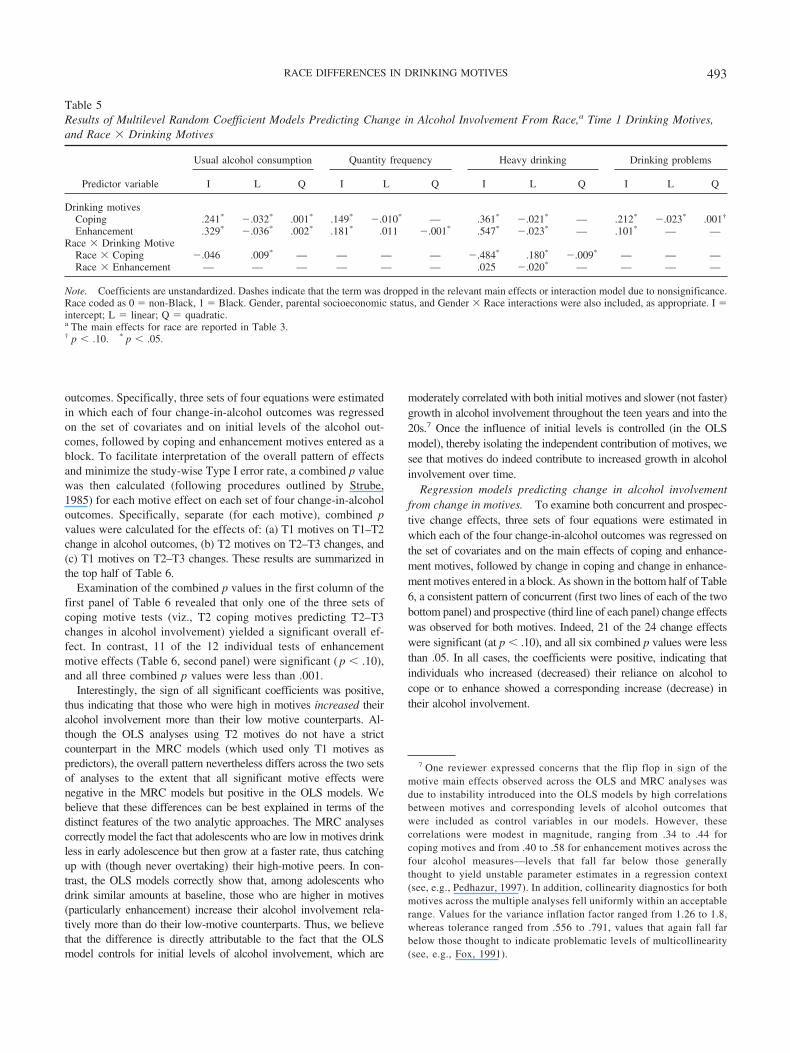
MRC analyses of change over time. Four two-level MRC mod-els were estimated in which the L1 intercept, slope, and quadraticcomponents were predicted from T1 coping and enhancement mo-tives (controlling for demographic factors). As shown in Table 5, allmotive effects on intercepts were positive and significant, indicatingthat adolescents who reported stronger motives were more heavilyinvolved with alcohol at age 14. These results mirror findings of priorcross-sectional research (including earlier reports from this sample)showing that motives are positively associated with alcohol involve-ment cross-sectionally. Coping motives also significantly predictedrates of linear growth (at age 14) in all four dependent measures,whereas enhancement motives predicted significant linear growth intwo of the four measures. Unexpectedly, however, all significantcoefficients were negative, indicating that those who were high inmotives generally grew at a slower rate than their low motive coun-terparts did. This pattern is illustrated in Figure 3 for adolescents at the20th and 80th percentiles on enhancement motives. As shown inFigure 3A, adolescents who reported lower levels of enhancementmotives at the outset showed steeper growth in usual alcohol use thantheir high enhancement-motive peers. Importantly, however, despitetheir more rapid growth, levels of use and abuse among these indi-viduals never reached the same levels reported by their high-motivecounterparts.
Motives also predicted four of the eight quadratic age terms (atp � .10), but these effects differed in sign. Three of the four termswere positive, indicating that individuals who were high in motivesdecreased their alcohol involvement throughout their 20s less thantheir low-motive counterparts did. This pattern can also be seen inFigure 3A for the effects of enhancement motives on usual alcoholconsumption: Relative to their low-motive counterparts, individu-als who were high in enhancement motives during adolescenceshowed a less steep decline in consumption in their mid to late 20s.
6 Analyses of trajectories by race and gender showed that these race differ-ences generally held for both gender groups. Specifically, Black men andBlack women, relative to their White counterparts, grew at slower ratesthroughout adolescence and also declined at slower rates throughout their midto late 20s, such that Blacks of both gender groups equaled or surpassed theirsame-gender White counterparts by age 30. Despite these important similari-ties, however, two of the four Race � Gender � Linear Age interactions weresignificant, as were two of the four Race � Gender � Quadratic Ageinteractions. In both cases, however, the main difference was found amongWhite men who reported markedly higher levels of alcohol involvementduring their early to mid-20s than did any of the remaining Race � Gendersubgroups.
Table 3Base Growth Curve Models
Predictor variable Intercept Linear QuadraticAge max
value
Coping 1.69 .079 �.0034 25.6Enhancement 2.21 .211 �.0115 23.2Usual consumption 1.33 .135 �.0069 23.8Quantity frequency 0.28 .157 �.0094 22.4Heavy drinking 1.05 .342 �.0211 22.1Drinking problems 0.39 .045 �.0036 20.8
Note. The base model includes the intercept (centered at 14), linear age,and quadratic age (i.e., age-squared). Tabled coefficients are unstandard-ized; all values significant at p � .001.
491RACE DIFFERENCES IN DRINKING MOTIVES

The final quadratic interaction term was negative, thus indicatingthat those who were high (80th percentile) in enhancement motivesshowed steeper declines in quantity frequency throughout theirmid to late 20s than did those who were low (20th percentile) inenhancement motives. However, as Figure 3B illustrates, despitethe steeper rate of decline, high enhancement-motive adolescents
nevertheless reported higher levels of alcohol use than did theirlow-motive counterparts at every age represented in the study.
Regression models predicting change in alcohol involvementfrom prior motives. A series of regression equations were esti-mated to test the prospective effects of coping and enhancementmotives on change (across consecutive waves) in the four alcohol
Figure 1. (A) Change in enhancement motives over time among Blackand White drinkers. (B) Change in coping motives over time among Blackand White drinkers. Plotted values were predicted from the final trimmedmodel. Wht � White; Blk � Black.
Figure 2. (A) Change in frequency of heavy drinking over time amongBlack and White drinkers. (B) Change in drinking problems over timeamong Black and White drinkers. Plotted values were predicted from thefinal trimmed model. Wht � White; Blk � Black.
Table 4Summary of Race Effects From Multilevel Random Coefficient Models
Predictor variable
Effects from covariates-only models
Intercept Linear Quadratic
Age max value
Black White
Coping motives �.219** .020* .000 27.8 24.8Enhancement motives �.273* �.003 .001 23.2 23.2Usual consumption �.308*** �.023 .002* 24.6 22.2Quantity frequency �.240** �.077** .006* 24.5 21.5Heavy drinking �.713*** �.041 .006* 23.1 21.8Drinking problems �.023 �.037† .003* 21.7 20.3
Note. Race was coded as 0 � non-Black, 1 � Black. Tabled effects are unstandardized. Gender and parentalsocioeconomic status were controlled in all models where they were at least marginally significant ( p � .10).† p � .10. * p � .05. ** p � .01. *** p � .001.
492 COOPER ET AL.
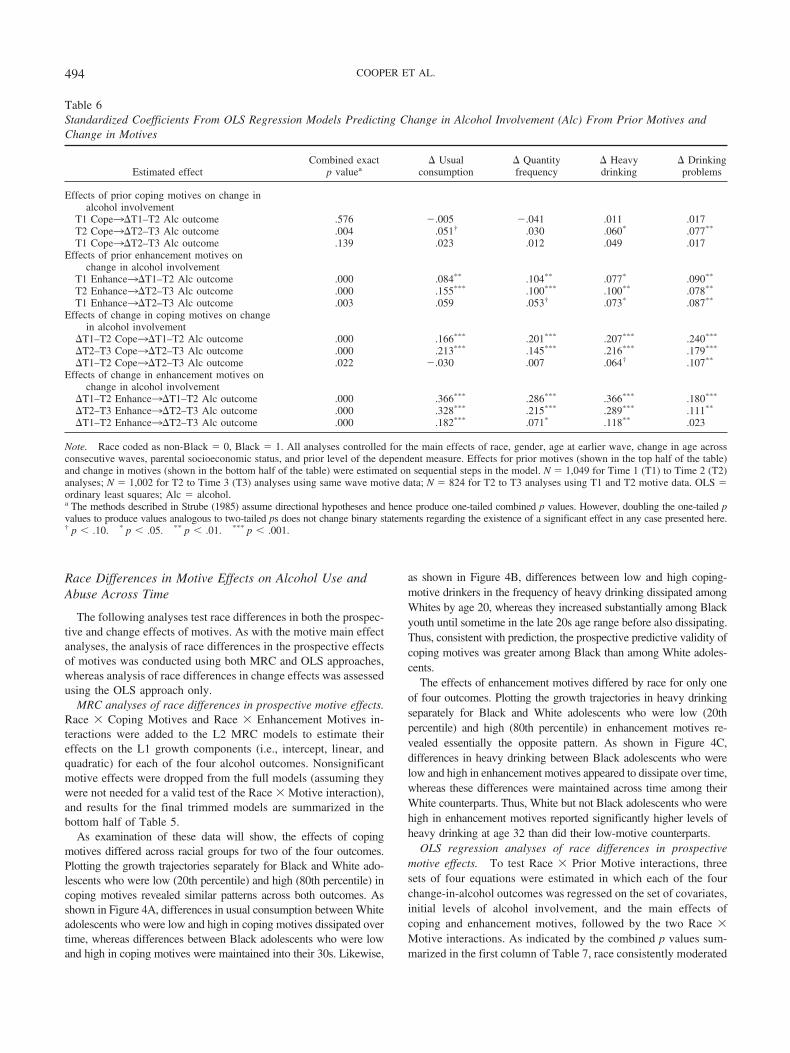
outcomes. Specifically, three sets of four equations were estimatedin which each of four change-in-alcohol outcomes was regressedon the set of covariates and on initial levels of the alcohol out-comes, followed by coping and enhancement motives entered as ablock. To facilitate interpretation of the overall pattern of effectsand minimize the study-wise Type I error rate, a combined p valuewas then calculated (following procedures outlined by Strube,1985) for each motive effect on each set of four change-in-alcoholoutcomes. Specifically, separate (for each motive), combined pvalues were calculated for the effects of: (a) T1 motives on T1–T2change in alcohol outcomes, (b) T2 motives on T2–T3 changes, and(c) T1 motives on T2–T3 changes. These results are summarized inthe top half of Table 6.
Examination of the combined p values in the first column of thefirst panel of Table 6 revealed that only one of the three sets ofcoping motive tests (viz., T2 coping motives predicting T2–T3changes in alcohol involvement) yielded a significant overall ef-fect. In contrast, 11 of the 12 individual tests of enhancementmotive effects (Table 6, second panel) were significant ( p � .10),and all three combined p values were less than .001.
Interestingly, the sign of all significant coefficients was positive,thus indicating that those who were high in motives increased theiralcohol involvement more than their low motive counterparts. Al-though the OLS analyses using T2 motives do not have a strictcounterpart in the MRC models (which used only T1 motives aspredictors), the overall pattern nevertheless differs across the two setsof analyses to the extent that all significant motive effects werenegative in the MRC models but positive in the OLS models. Webelieve that these differences can be best explained in terms of thedistinct features of the two analytic approaches. The MRC analysescorrectly model the fact that adolescents who are low in motives drinkless in early adolescence but then grow at a faster rate, thus catchingup with (though never overtaking) their high-motive peers. In con-trast, the OLS models correctly show that, among adolescents whodrink similar amounts at baseline, those who are higher in motives(particularly enhancement) increase their alcohol involvement rela-tively more than do their low-motive counterparts. Thus, we believethat the difference is directly attributable to the fact that the OLSmodel controls for initial levels of alcohol involvement, which are
moderately correlated with both initial motives and slower (not faster)growth in alcohol involvement throughout the teen years and into the20s.7 Once the influence of initial levels is controlled (in the OLSmodel), thereby isolating the independent contribution of motives, wesee that motives do indeed contribute to increased growth in alcoholinvolvement over time.
Regression models predicting change in alcohol involvementfrom change in motives. To examine both concurrent and prospec-tive change effects, three sets of four equations were estimated inwhich each of the four change-in-alcohol outcomes was regressed onthe set of covariates and on the main effects of coping and enhance-ment motives, followed by change in coping and change in enhance-ment motives entered in a block. As shown in the bottom half of Table6, a consistent pattern of concurrent (first two lines of each of the twobottom panel) and prospective (third line of each panel) change effectswas observed for both motives. Indeed, 21 of the 24 change effectswere significant (at p � .10), and all six combined p values were lessthan .05. In all cases, the coefficients were positive, indicating thatindividuals who increased (decreased) their reliance on alcohol tocope or to enhance showed a corresponding increase (decrease) intheir alcohol involvement.
7 One reviewer expressed concerns that the flip flop in sign of themotive main effects observed across the OLS and MRC analyses wasdue to instability introduced into the OLS models by high correlationsbetween motives and corresponding levels of alcohol outcomes thatwere included as control variables in our models. However, thesecorrelations were modest in magnitude, ranging from .34 to .44 forcoping motives and from .40 to .58 for enhancement motives across thefour alcohol measures––levels that fall far below those generallythought to yield unstable parameter estimates in a regression context(see, e.g., Pedhazur, 1997). In addition, collinearity diagnostics for bothmotives across the multiple analyses fell uniformly within an acceptablerange. Values for the variance inflation factor ranged from 1.26 to 1.8,whereas tolerance ranged from .556 to .791, values that again fall farbelow those thought to indicate problematic levels of multicollinearity(see, e.g., Fox, 1991).
Table 5Results of Multilevel Random Coefficient Models Predicting Change in Alcohol Involvement From Race,a Time 1 Drinking Motives,and Race � Drinking Motives
Predictor variable
Usual alcohol consumption Quantity frequency Heavy drinking Drinking problems
I L Q I L Q I L Q I L Q
Drinking motivesCoping .241* �.032* .001* .149* �.010* — .361* �.021* — .212* �.023* .001†
Enhancement .329* �.036* .002* .181* .011 �.001* .547* �.023* — .101* — —Race � Drinking Motive
Race � Coping �.046 .009* — — — — �.484* .180* �.009* — — —Race � Enhancement — — — — — — .025 �.020* — — — —
Note. Coefficients are unstandardized. Dashes indicate that the term was dropped in the relevant main effects or interaction model due to nonsignificance.Race coded as 0 � non-Black, 1 � Black. Gender, parental socioeconomic status, and Gender � Race interactions were also included, as appropriate. I �intercept; L � linear; Q � quadratic.a The main effects for race are reported in Table 3.† p � .10. * p � .05.
493RACE DIFFERENCES IN DRINKING MOTIVES
Race Differences in Motive Effects on Alcohol Use andAbuse Across Time
The following analyses test race differences in both the prospec-tive and change effects of motives. As with the motive main effectanalyses, the analysis of race differences in the prospective effectsof motives was conducted using both MRC and OLS approaches,whereas analysis of race differences in change effects was assessedusing the OLS approach only.
MRC analyses of race differences in prospective motive effects.Race � Coping Motives and Race � Enhancement Motives in-teractions were added to the L2 MRC models to estimate theireffects on the L1 growth components (i.e., intercept, linear, andquadratic) for each of the four alcohol outcomes. Nonsignificantmotive effects were dropped from the full models (assuming theywere not needed for a valid test of the Race � Motive interaction),and results for the final trimmed models are summarized in thebottom half of Table 5.
As examination of these data will show, the effects of copingmotives differed across racial groups for two of the four outcomes.Plotting the growth trajectories separately for Black and White ado-lescents who were low (20th percentile) and high (80th percentile) incoping motives revealed similar patterns across both outcomes. Asshown in Figure 4A, differences in usual consumption between Whiteadolescents who were low and high in coping motives dissipated overtime, whereas differences between Black adolescents who were lowand high in coping motives were maintained into their 30s. Likewise,
as shown in Figure 4B, differences between low and high coping-motive drinkers in the frequency of heavy drinking dissipated amongWhites by age 20, whereas they increased substantially among Blackyouth until sometime in the late 20s age range before also dissipating.Thus, consistent with prediction, the prospective predictive validity ofcoping motives was greater among Black than among White adoles-cents.
The effects of enhancement motives differed by race for only oneof four outcomes. Plotting the growth trajectories in heavy drinkingseparately for Black and White adolescents who were low (20thpercentile) and high (80th percentile) in enhancement motives re-vealed essentially the opposite pattern. As shown in Figure 4C,differences in heavy drinking between Black adolescents who werelow and high in enhancement motives appeared to dissipate over time,whereas these differences were maintained across time among theirWhite counterparts. Thus, White but not Black adolescents who werehigh in enhancement motives reported significantly higher levels ofheavy drinking at age 32 than did their low-motive counterparts.
OLS regression analyses of race differences in prospectivemotive effects. To test Race � Prior Motive interactions, threesets of four equations were estimated in which each of the fourchange-in-alcohol outcomes was regressed on the set of covariates,initial levels of alcohol involvement, and the main effects ofcoping and enhancement motives, followed by the two Race �Motive interactions. As indicated by the combined p values sum-marized in the first column of Table 7, race consistently moderated
Table 6Standardized Coefficients From OLS Regression Models Predicting Change in Alcohol Involvement (Alc) From Prior Motives andChange in Motives
Estimated effectCombined exact
p valuea� Usual
consumption� Quantityfrequency
� Heavydrinking
� Drinkingproblems
Effects of prior coping motives on change inalcohol involvement
T1 Cope3�T1–T2 Alc outcome .576 �.005 �.041 .011 .017T2 Cope3�T2–T3 Alc outcome .004 .051† .030 .060* .077**
T1 Cope3�T2–T3 Alc outcome .139 .023 .012 .049 .017Effects of prior enhancement motives on
change in alcohol involvementT1 Enhance3�T1–T2 Alc outcome .000 .084** .104** .077* .090**
T2 Enhance3�T2–T3 Alc outcome .000 .155*** .100*** .100** .078**
T1 Enhance3�T2–T3 Alc outcome .003 .059 .053† .073* .087**
Effects of change in coping motives on changein alcohol involvement
�T1–T2 Cope3�T1–T2 Alc outcome .000 .166*** .201*** .207*** .240***
�T2–T3 Cope3�T2–T3 Alc outcome .000 .213*** .145*** .216*** .179***
�T1–T2 Cope3�T2–T3 Alc outcome .022 �.030 .007 .064† .107**
Effects of change in enhancement motives onchange in alcohol involvement
�T1–T2 Enhance3�T1–T2 Alc outcome .000 .366*** .286*** .366*** .180***
�T2–T3 Enhance3�T2–T3 Alc outcome .000 .328*** .215*** .289*** .111**
�T1–T2 Enhance3�T2–T3 Alc outcome .000 .182*** .071* .118** .023
Note. Race coded as non-Black � 0, Black � 1. All analyses controlled for the main effects of race, gender, age at earlier wave, change in age acrossconsecutive waves, parental socioeconomic status, and prior level of the dependent measure. Effects for prior motives (shown in the top half of the table)and change in motives (shown in the bottom half of the table) were estimated on sequential steps in the model. N � 1,049 for Time 1 (T1) to Time 2 (T2)analyses; N � 1,002 for T2 to Time 3 (T3) analyses using same wave motive data; N � 824 for T2 to T3 analyses using T1 and T2 motive data. OLS �ordinary least squares; Alc � alcohol.a The methods described in Strube (1985) assume directional hypotheses and hence produce one-tailed combined p values. However, doubling the one-tailed pvalues to produce values analogous to two-tailed ps does not change binary statements regarding the existence of a significant effect in any case presented here.† p � .10. * p � .05. ** p � .01. *** p � .001.
494 COOPER ET AL.

the prospective effects of coping (top panel) but not enhancement(second panel) motives on change-in-alcohol involvement. Indeed,only one of three sets of prospective Race � Motive interactionsyielded a significant combined p value for enhancement comparedwith three of three for coping.
To examine the form of the interactions, simple slope equa-tions describing the motive change-in-alcohol outcome relation-ships were calculated separately among Black and White drink-ers, following procedures outlined by Aiken and West (1991).Table 7 shows simple slopes for the subset of interactions thatwere individually significant at p � .10 and were also associ-ated with a combined p value of � .10. An examination of thepairs of coping motive slopes shown in the top panel of Table7 reveals a consistent pattern of race differences in which
coping motives were positively and significantly (in all but onecase) related to change in alcohol involvement among Blackdrinkers but were unrelated, or significantly negatively related,to change-in-alcohol involvement among White drinkers. Incontrast, but also as expected, T1 enhancement motives prospectivelypredicted increased alcohol involvement from T1 to T2 among Whitebut not Black drinkers.
OLS regression analyses of race differences in change in motiveeffects. To test the Race � Change-in-Motive interactions, threesets of four equations were estimated in which each of the change-in-alcohol outcomes was regressed on the set of covariates, initiallevels of alcohol involvement, the main effects of coping and en-hancement motives, the Race � Motive interactions, the change-in-motive effects, and finally the two Race � Change-in-Motive inter-actions. As shown in Table 7 (first column of the two bottom panels),only two of the six sets of Race � Change-in-Motive interaction testsyielded a combined p value of � .10. Examining the simple slopesestimated among Black and White drinkers in these two cases re-vealed the expected pattern of effects: T1–T2 change in copingmotives more strongly predicted concurrent change in alcohol in-volvement among Black drinkers than it did among White drinkers,whereas T1–T2 change in enhancement motives more strongly pre-dicted concurrent change in alcohol involvement among White drink-ers than among Black drinkers.
Discussion
Results of the present study indicate that Black and White youthfollow unique trajectories of alcohol use from adolescence into youngadulthood, with Black adolescents starting at lower levels of use,growing at a slower rate, and reaching peak levels of involvementlater than White drinkers do. Once they reach their peak, however,Black drinkers decrease their alcohol involvement more graduallysuch that they ultimately report levels of use and abuse that equal orexceed those reported by White drinkers. Although the confluence ofevidence from prior studies pointed to race differences in trajectoriesof alcohol use and abuse during the adolescent to young adult tran-sition, the present study is the first to demonstrate these differencesusing longitudinal data from a large and representative sample ofBlack and White youth.
Results of the present study also indicate that alcohol use and abuseare differentially rooted in the regulation of negative and positiveemotions, respectively, among Black and White drinkers. WhereasWhite drinkers reported stronger coping motives than their Blackcounterparts did at age 14, Black drinkers showed steeper increases indrinking to cope throughout adolescence and into their early 20s,eventually catching up to and surpassing their White counterparts bythe mid-20s. This pattern of differential change stands in stark contrastto the general pattern of growth, in which Black adolescents showedless (not more) steep increases in alcohol involvement throughout thisdevelopmental period.
Coping motives assessed during adolescence also more stronglyforecast alcohol involvement over time among Black than amongWhite drinkers. Indeed, the MRC models indicated that differencesamong Black drinkers who were high and low in coping motives asadolescents remained significant into the late 20s (heavy drinking) orearly 30s age range (usual consumption), whereas correspondingdifferences between White adolescents low and high in coping mo-tives were no longer significant by age 21. Similarly, results of the
Figure 3. (A) Change in usual consumption over time among low andhigh enhancement-motive drinkers. (B) Change in quantity frequency overtime among low and high enhancement-motive drinkers. Plotted valueswere predicted from the final trimmed model.
495RACE DIFFERENCES IN DRINKING MOTIVES

OLS analyses indicated that, among individuals with similar levels ofinitial alcohol involvement, prior levels of coping motives consis-tently predicted linear increases in alcohol involvement from adoles-cence to the mid-20s (T1 to T2), as well as smaller declines from themid-20s into the early 30s (T2 to T3) among Black drinkers. Incontrast, only one such test was significant and positive among Whitedrinkers (viz., T2 coping motives predicted T2–T3 changes in drink-ing problems). Finally, although changes in coping motives signifi-cantly predicted changes in alcohol involvement among both Blackand White drinkers, several of the concurrent associations (from T1 toT2) were significantly stronger among Black drinkers.
White drinkers, in contrast, reported significantly higher levels ofenhancement motives at baseline than their Black counterparts, adifference that was maintained into the early 30s. Perhaps moreimportant, the MRC analyses showed that White drinkers whowere high in enhancement motives as adolescents continued toreport heavier drinking than their low-motive counterparts did intotheir early 30s, whereas the corresponding differences betweenBlack adolescents low and high in enhancement motives were nolonger significant by the mid-20s. The OLS analyses revealed asimilar pattern of results in which, among individuals with similarinitial levels of alcohol involvement, enhancement more stronglypredicted change-in-alcohol involvement among White drinkersthan it did among Black drinkers––differences which were pri-marily found from adolescence into the mid-20s, when normativealcohol involvement typically increases. Indeed, race differencesin the predictive validity of enhancement motives were, with a
single exception (see Figure 4C),8 all but absent during the periodfrom the mid-20s to the early 30s, when normative alcohol in-volvement typically declines.
In short, distinctive patterns of growth in motives along with astrong and consistent pattern of differential predictive validity for thetwo motives provide converging evidence that drinking is differen-tially rooted in the regulation of negative and positive emotionsamong Black and White drinkers, respectively. This conclusion isbuttressed by findings from prior research that have shown that Blackdrinkers are more likely to drink alone (C. Stewart & Power,2003), to drink at home (Herd & Grube, 1993), and to experiencehigher rates of drinking problems (Jones-Webb, Hsiao, Hannan, &Caetano, 1997), whereas White drinkers are more likely to drink insocial or celebratory settings (Bradizza et al., 1999) and to engagein heavy episodic or binge drinking (Getz & Bray, 2005; Paschall,Bersamin, & Flewelling, 2005), styles of drinking which in turn
8 In this context, it is worth noting that although the combined p valuefor the set of Race � T1 Enhancement Motives interactions predictingT2–T3 changes in alcohol involvement was not significant, the Race � T1Enhancement Motives interaction predicting T2–T3 changes in heavydrinking was significant (� � �.083, p � .05), thus replicating the MRCresult. Consistent with the pattern portrayed in Figure 4, plotting theinteraction showed that T1 enhancement was unrelated to changes in heavydrinking from T2 to T3 among Blacks (b � �.044, ns) but was signifi-cantly positively related to changes among Whites (b � .171, p � .01).
Figure 4. (A) Change in usual consumption over time among Race � Coping Motive subgroups. (B) Changein frequency of heavy drinking over time among Race � Coping Motive subgroups. (C) Change in frequencyof heavy drinking over time among Race � Enhancement Motive subgroups. Plotted values were predicted fromthe final trimmed model. Wht � White; Blk � Black.
496 COOPER ET AL.

have been linked to coping and enhancement motives, respectively(Cooper, 1994; Cooper, Russell, Skinner, & Windle, 1992).
Although the present study documents important race differencesin the growth trajectories of alcohol use and abuse and in the moti-vations that underpin them, we have not explicitly considered whythese differences exist or why they emerge when they do. Althoughdefinitive treatment of these questions is beyond the scope of thepresent study, several issues pertinent to these questions can never-theless be usefully explored.
First, prior research using the present sample showed no racedifferences in cross-sectional analyses of coping and enhancementmotives at T1 (Cooper, 1994). Yet the present study shows that thesesame motives shape distinct patterns of growth in alcohol involve-ment from adolescence into adulthood among Black and White drink-ers. Together, these seemingly contradictory findings suggest thatinitially quiescent differences are first expressed or activated duringthis transition period, an observation that fits well with extant researchon the adolescent-to-adult transition. In particular, research indicatesthat this transition, more than any other single developmental transi-tion, is marked by increased diversity in life paths due to the lifting of
constraints (e.g., parental controls) in place during adolescence and bythe creation of new paths as a function of opportunities andexperiences that arise during the transition (Schulenberg, Sameroff, &Cicchetti, 2004). Thus, we speculate that increased freedom affordedby this transition fosters the expression of latent differences in thepsychological meaning of coping and enhancement motives.
Although the timing of the appearance of these differences may beexplained by normative features of development, understanding thenature of emergent differences between Black and White drinkersrequires a consideration of the unique aspects of the social culturalmilieu in which the two groups are embedded. For example, pastresearch has shown that Black parents are stricter and convey moredisapproval of drinking and drunkenness among youth (Peterson,Hawkins, Abbott, & Catalano, 1994; Ringwalt & Palmer, 1990).Black adolescents also live at home longer (Buck & Scott, 1993), aremore strongly bonded to their families, express more concern aboutdisapproval by parents and other adults (e.g., Ringwalt & Palmer,1990), and are both more religious and more likely to belong toreligions that promote abstemious norms (Herd & Grube, 1996;Wallace, Brown, Bachman, & Laveist, 2003). Thus, the relatively
Table 7Simple Slopes Estimated Separately Within Race Groups for Significant Race � Motive Interactions
Estimated effect
Combined exactp value for
interaction �sa
� Usualconsumption
� Quantityfrequency � Heavy drinking
� Drinkingproblems
Black White Black White Black White Black White
Simple slopes for prospective effects ofcoping motives
T1 Cope3�T1–T2 Alc outcome .000 .089** �.049 .098 �.127* .431*** �.165* .148** �.046T2 Cope3�T2–T3 Alc outcome .002 .083** .004 .132** �.045 .252** .007 — —T1 Cope3�T2–T3 Alc outcome .025 .097** .015 .109* �.029 .250* .024 — —
Simple slopes for prospective effects ofenhancement motives
T1 Enhance3�T1–T2 Alc outcome .012 — — �.008 .159*** �.005 .175** .001 .097**
T2 Enhance3�T2–T3 Alc outcome .450 — — — — — — — —T1 Enhance3�T2–T3 Alc outcome .368 — — — — — — — —
Simple slopes for effects of changes incoping motives
�T1–T2 Cope3�T1–T2 Alcoutcome .066 — — .374*** .196*** .571*** .341*** — —
�T2–T3 Cope3�T2–T3 Alcoutcome .970 — — — — — — —
�T1–T2 Cope3�T2–T3 Alcoutcome .170 — — — — — — — —
Simple slopes for effects of changes inenhancement motives
�T1–T2 Enhance3�T1–T2 Alcoutcome .003 — — .111*** .342*** .406*** .616*** .059 .155***
�T2–T3 Enhance3�T2–T3 Alcoutcome .509 — — — — — — — —
�T1–T2 Enhance3�T2–T3 Alcoutcome .563 — — — — — — — —
Note. Dashes indicate that the p for the interaction beta .10 or that the p for the combined Z .10, and thus simple slopes were not estimated. Tabledcoefficients are unstandardized bs. All analyses controlled for the main effects of race, gender, age at earlier wave, change in age across consecutive waves,parental socioeconomic status, prior level of the dependent measure, and for the appropriate motive main effects (either prior or prior plus change) of bothmotives. N � 1,049 for Time 1 (T1) to Time 2 (T2) analyses; N � 1,002 for T2 to Time 3 (T3) analyses using same wave motive data; N � 824 for T2to T3 analyses using T1 and T2 motive data. Alc � alcohol.a The methods described in Strube (1985) assume directional hypotheses and hence produce one-tailed combined p values. However, doubling the one-tailedp values to produce values analogous to two-tailed ps does not change binary statements regarding the existence of significant effects, except in one case:The one-tailed combined p value for T13T2 change in coping on T13T2 change in alcohol use is .066; thus when doubled, this value no longer meetsthe two-tailed p � .10 cutoff value.* p � .05. ** p � .01. *** p � .001.
497RACE DIFFERENCES IN DRINKING MOTIVES

stronger constraints on alcohol involvement present for Black adoles-cents likely accounts for their initially lower levels of use, whereas thenormative relaxation of constraints that characterizes the transitioninto young adulthood for both groups may account for, or at the leastcontribute to, the diminishing differences observed in alcohol involve-ment over time.
Cultural explanations may also explain the differential importancethat coping and enhancement motives ultimately take on for the tworacial groups. As previously discussed, attitudes toward alcohol arerelatively negative among Blacks (Herd, 1985), and there is lessdrinking in the home (Barnes, Farrell, & Banerjee, 1994). Thus, Blackyouth are exposed to more negative messages about alcohol by adultsin their environment and may lack positive models for integratingalcohol into their daily or social lives (e.g., Caetano & Kaskutas,1996; Herd, 1990; Welte & Barnes, 1987). In contrast, alcohol isviewed in largely benevolent terms among Whites; it is linked tosocializing in general and to celebratory occasions in particular, andexperimentation with alcohol during adolescence is commonly re-garded as a rite of passage (Schulenberg & Maggs, 2002). As aconsequence, alcohol may take on predominantly positive and socialmeanings among Whites, but more negative, even antisocial onesamong Blacks. A second possibility is that Black youth may encoun-ter increasing obstacles to the pursuit of their goals in the post-highschool years, which in turn generate dysphoric moods and feelings ofhopelessness that foster an increased reliance on alcohol to cope––aspeculation that is indirectly supported by existing data (e.g., Griffin,Botvin, Nichols, & Scheier, 2004; Martin, Tuch, & Roman, 2003).Whatever the ultimate explanation, understanding the genesis of thedifferences observed in the present study constitutes an importantdirection for future research.
Finally, we would like to underscore that, despite relative differ-ences in the strength and consistency of the observed relationshipsbetween motives and alcohol involvement, both motives confer atleast some degree of heightened vulnerability over time for heavy orproblematic alcohol use among both Black and White drinkers. Thiswas especially true for enhancement motives, which showed a morereliable pattern of prediction across Black and White drinkers andcorrespondingly fewer race-specific effects, particularly during theearly to mid-20s, when Black youth relative to their White counter-parts theoretically experience a more dramatic lessening of constraintson alcohol use.
Caveats and Conclusions
Although the present study has a number of important strengths,several limitations must be acknowledged. One potential limitationconcerns the validity of the proffered interpretation of differences inthe sign of the coefficients (across the OLS and MRC analyses) for T1motives predicting linear change in alcohol outcomes (cf. motivemain effects reported in Tables 5 and 6). Although we argued thatthese differences reflect differences in the nature of the questionsasked by OLS and MRC (similar to interpretational issues highlightedby Lord’s paradox; Lord, 1973; see also Holland & Rubin, 1983), wecannot unequivocally rule out the possibility of statistical artifact asthe cause of the differing results. In particular, the OLS regressionanalyses are subject to several criticisms that the MRC analyses arenot, thus raising the possibility that the negative effects observed inthe MRC models are more trustworthy than the positive effectsobserved in the OLS analyses are. In particular, it is possible that
controlling for baseline levels of the outcome might result in animproper adjustment due to one or more of the following: (a) unre-liability in the baseline alcohol measure (see, Bollen, 1989, pp. 159–167), (b) the presence of Baseline � Motive interactions (essentiallya violation of the homogeneity of regression slopes assumption; see,e.g., Pedhazur, 1997, p. 630), and (c) mathematical coupling, a phe-nomenon that occurs when one variable is contained in whole or inpart within another and both are analyzed in the same model (Blance,Tu, & Gilthorpe, 2005). Supplemental analyses, however, stronglysuggest that the first two of the three concerns are unlikely to accountfor the differing signs observed across the two analytic procedures.9 Incontrast, the third issue––that of mathematical coupling––cannot bedirectly addressed through empirical means. On logical grounds,however, the fact that the same pattern of results was obtainedwhen predicting T2 to T3 change–in-alcohol outcomes from T1motives, and no part–whole relationship exists among the variablesin these analyses, mitigates this alternative explanation of theobserved change in sign. Nevertheless, it is axiomatic that thevalidity of any inference about the meaning of data cannot beproved and therefore that one should always exercise due cautionin accepting as truth any interpretational claim.
Second, our sample, though large and representative, was drawnfrom a single urban area in the northeastern United States. Thus, wecannot know whether results of the present study broadly characterizedrinking behavior among Black and White youth during this life
9 To address these concerns, we first specified a series of structural equationmodels that were identical to the original OLS models in which the motivemain effects were tested, except that the baseline alcohol measure was cor-rected for measurement error. The results of these analyses showed that themotive effects were identical in sign and significance to those observed in thecorresponding OLS regression models, thus indicating that the flip flop in signobserved in the OLS analyses was not due to the biasing effect of measurementerror. We next tested all possible Coping and Enhancement � Initial Status (onthe alcohol outcome) interactions in the prediction of change (across consec-utive waves) in alcohol outcomes (i.e., a total of 16 interaction tests, 8 for eachmotive). A significant interaction would indicate that the magnitude and/ordirection of the motive effect depended on the individual’s initial status on theoutcome, thus raising a concern that motive main effects reported in Table 6were misleading and inaccurate. Results of the Motive � Initial Status inter-action tests were, however, reassuring. Although 5 of the 16 individualinteraction tests were significant, only 1 of the 5 interactions, upon plotting,yielded simple slopes that differed in sign and significance across the range ofinitial values plotted (from the 10th to the 90th percentile). For example, T1quantity-frequency interacted with T1 coping to predict T1–T2 change inquantity-frequency (interaction � � �.112, p � .01). Plotting the simpleslopes relating coping motives to change in quantity frequency at the 10th,30th, 70th, and 90th percentiles of initial quantity-frequency revealed that noneof the simple slopes was significant, which is consistent with the nonsignifi-cant main effect for T1 coping on quantity-frequency reported in Table 6. Inthe only exception to this pattern, T1 coping motives was found tosignificantly predict changes in heavy drinking (b � .232, p � .05) amongthose who reported no prior heavy drinking (about half the sample),whereas (consistent with the nonsignificant main effect reported in Table6) coping motives were unrelated to changes in heavy drinking across thefull range of individuals reporting any prior heavy drinking experience atT1. Thus, in only one case did we find any evidence that presenting themain effect of motives was misleading or unrepresentative of the motiveeffect across the full range of initial values. The reader should bear in mind,however, this potentially important qualification on the effect of T1 copingmotives on T1–T2 changes in heavy drinking.
498 COOPER ET AL.

stage, though results of past studies conducted in single locales onadolescent alcohol use have generalized well (Oetting & Beauvais,1990).
Third, although results of the attrition analyses revealed only smalldifferences in completion rates across race, SES, and age subgroups,females were substantially more likely to participate across time thanmales were, especially Black males. Moreover, although gender and,where significant, Gender � Race interactions were controlled in ouranalyses, we cannot rule out the possibility that differential attritionacross gender somehow affected our results or that our results aremore generalizable to females than they are to males.
Fourth, the first three waves of measurement were widely spaced,thus imposing limits on our ability to monitor changes across time ina highly refined way. Consequently, important intervening events ordiscontinuities in alcohol use may have gone undetected in the yearsbetween adjacent waves.
Fifth, the present study relied exclusively on the use of self-reportdata. Although every effort was made to increase the validity andreliability of responding, self-report data (even under optimal circum-stances) are subject to a host of both random and systematic errors ofreporting (e.g., forgetting, telescoping; for a review, see Schwarz,1999). These concerns notwithstanding, substantial evidence supportsthe validity and reliability of the key variables examined in thisstudy––drinking motives (see, e.g., Cooper, 1994; Cooper, Russell,Skinner, & Windle, 1992; MacLean & Lecci, 2000; S. H. Stewart etal., 1996) and alcohol use (Darke, 1998; Stacy, Widaman, Hays, &DiMatteo, 1985)––among both Black and White youth (see Oetting &Beauvais, 1990, for a review). Moreover, although relationshipsamong self-report measures are subject to inflation by mono-methodbias, the most important relationships examined in the present studywere prospective relationships between variables assessed on discreteoccasions separated by 5 or more years in time. Thus, momentaryfactors, such as mood––typically a large component of mono-methodbias––could not contribute to these findings.
Sixth, although results were broadly consistent across dependentvariables, coping motives failed to show the unique pattern of pre-diction vis-a-vis drinking problems that we expected. This stands incontrast to results of earlier studies, including results using data fromT1 of the present study (Cooper et al., 1995). Failure to replicate theexpected pattern may reflect differences in study design (past researchwas primarily cross-sectional, whereas the present study is prospec-tive) or the use of a measure (from T2 through T5) that assessedrelatively serious forms of drinking problems and, thus, had low baserates of endorsement. It will therefore be important to replicate ourfindings using a measure of drinking problems that is more sensitiveto low-level problems that are more prevalent in the population.
Finally, motive data were not obtained from nondrinkers in thepresent study. Thus, we were unable to examine motives as predictorsof onset, or to test true prospective effects in the sense that allparticipants in the present study had consumed alcohol at baseline.
Despite these limitations, the present study provides the strongestevidence to date that Black and White youth follow distinct trajecto-ries of alcohol use from adolescence into young adulthood and thatalcohol use is differentially linked to coping and enhancement mo-tives among Black and White drinkers. Together these results suggestthat different models may optimally account for drinking behavioramong Blacks and Whites and that different approaches may provemaximally effective in reducing heavy or problem drinking amongthe two groups. In addition, they highlight the transition from adoles-
cence to young adulthood as a crucial period for future research, aswell as intervention efforts aimed at modifying the course of devel-opment in both groups. Finally, these results contribute to a growingbody of literature indicating that motives provide an important frame-work for understanding the unique constellation of factors that drivedrinking among different individuals and groups.
References
Aiken, L. S., & West, S. G. (1991). Multiple regression: Testing andinterpreting interactions. Newbury Park, CA: Sage.
Bachman, J. G., Wallace, J. M., O’Malley, P. M., Johnston, L. D., Kurth,C. L., & Neighbors, H. W. (1991). Racial/ethnic differences in smoking,drinking, and illicit drug use among American high school seniors,1976–79. American Journal of Public Health, 81, 372–377.
Barnes, G. M., Farrell, M. P., & Banerjee, S. (1994). Family influences onalcohol abuse and other problem behaviors among Black and Whiteadolescents in a general population sample. Journal of Research onAdolescence, 4, 183–201.
Bell, R. A., Keeley, K. A., & Buhl, J. M. (1977). Psychopathology and lifeevents among alcohol users and nonusers. In F. A. Sexias (Ed.), Currentsin alcoholism (pp. 103–126). New York: Grune & Stratton.
Blance, A., Tu, Y.-K., & Gilthorpe, M. S. (2005). A multilevel modelingsolution to mathematical coupling. Statistical Methods in Medical Re-search, 14, 553–565.
Bollen, K. A. (1989). Structural equations with latent variables. NewYork: Wiley.
Bradizza, C. M., Reifman, A., & Barnes, G. M. (1999). Social and copingreasons for drinking: Predicting alcohol misuse in adolescents. Journalof Studies on Alcohol, 60, 491–499.
Brannock, J. C., Schandler, S. L., & Oncley, P. R. (1990). Cross-culturaland cognitive factors examined in groups of adolescent drinkers. Journalof Drug Issues, 20, 427–442.
Bray, J. H., Adams, G. J., Getz, J. G., & McQueen, A. (2003). Individu-ation, peers, and adolescent alcohol use: A latent growth analysis.Journal of Consulting and Clinical Psychology, 71, 553–564.
Brown, T. L., Miller, J. D., & Clayton, R. R. (2004). The generalizabilityof substance use predictors across racial groups. Journal of Early Ado-lescence, 24, 274–302.
Buck, N., & Scott, J. (1993). She’s leaving home: But why? An analysis ofyoung people leaving the parental home. Journal of Marriage and theFamily, 55, 863–874.
Caetano, R., & Kaskutas, L. A. (1996). Changes in drinking problemsamong Whites, Blacks, and Hispanics: 1984–1992. Substance Use &Misuse, 31, 1547–1571.
Carpenter, K. M., & Hasin, D. S. (1999). Drinking to cope with negativeaffect and DSM-IV alcohol use disorders: A test of three alternativeexplanations. Journal of Studies on Alcohol, 60, 694–704.
Chassin, L., Flora, D. B., & King, K. M. (2004). Trajectories of alcohol anddrug use and dependence from adolescence to adulthood: The effects ofparent alcoholism and personality. Journal of Abnormal Psychology,113(4), 483–498.
Cooper, M. L. (1994). Motivations for alcohol use among adolescents:Development and validation of a four-factor model. Psychological As-sessment, 6, 117–128.
Cooper, M. L., Agocha, V. B., & Sheldon, M. (2000). A motivationalperspective on risky behaviors: The role of personality and affect reg-ulation. Journal of Personality, 68, 1059–1088.
Cooper, M. L., Frone, M. R., Russell, M., & Mudar, P. (1995). Drinking toregulate positive and negative emotions: A motivational model of alco-hol use. Journal of Personality and Social Psychology, 69, 990–1005.
Cooper, M. L., Russell, M., & George, W. H. (1988). Coping, expectan-cies, and alcohol abuse: A test of social learning formulations. Journalof Abnormal Psychology, 92, 218–230.
499RACE DIFFERENCES IN DRINKING MOTIVES

Cooper, M. L., Russell, M., Skinner, J. B., Frone, M. R., & Mudar, P.(1992). Stress and alcohol use: Moderating effects of gender, coping,and alcohol expectancies. Journal of Abnormal Psychology, 101,139–152.
Cooper, M. L., Russell, M., Skinner, J. B., & Windle, M. (1992). Devel-opment and validation of a three-dimensional measure of drinkingmotives. Psychological Assessment, 4, 123–132.
Darke, S. (1998). Self-report among injecting drug users: A review. Drugand Alcohol Dependence, 51, 253–263.
Duncan, S. C., Duncan, T. E., & Strycker, L. A. (2006). Alcohol use fromages 9–16: A Cohort-Sequential Latent Growth Model. Drug and Al-cohol Dependence, 81, 71–81.
Fox, J. (1991). Regression diagnostics. London: Sage.Getz, J. G., & Bray, J. H. (2005). Predicting heavy alcohol use among
adolescents. American Journal of Orthopsychiatry, 75, 102–116.Grant, B. F., & Dawson, D. A. (1997). Age at onset of alcohol use and its
association with DSM-IV alcohol abuse and dependence: Results fromthe National Longitudinal Alcohol Epidemiologic Survey. Journal ofSubstance Abuse, 9, 103–110.
Grant, B. F., Dawson, D. A., Stinson, F. S., Chou, S., Dufour, M. C., &Pickering, R. P. (2004). The 12-month prevalence and trends in DSM-IValcohol abuse and dependence: United States, 1991–1992 and 2001–2002. Drug and Alcohol Dependence, 74, 223–234.
Griffin, K. W., Botvin, G. J., Nichols, T. R., & Scheier, L. M. (2004). Lowperceived chances for success in life and binge drinking among inner-city minority youth. Journal of Adolescent Health, 34, 501–507.
Herd, D. (1985). Ambiguity in Black drinking norms: An ethnohistoricalinterpretation. In L. Bennett & G. Ames (Eds.), The American experi-ence with alcohol: Contrasting cultural perspectives (pp. 149–169).New York: Plenum.
Herd, D. (1989). The epidemiology of drinking patterns and alcohol-relatedproblems among US Blacks. In National Institute on Alcohol Abuse andAlcoholism Research, Alcohol use among US ethnic minorities (DHHSPublication No. ADM 89–1435, pp. 3–50). Washington, DC: U.S.Government Printing Office.
Herd, D. (1990). Subgroup differences in drinking patterns among Blackand White men: Results from a national survey. Journal of Studies onAlcohol, 51, 221–232.
Herd, D., & Grube, J. (1993). Drinking contexts and drinking problemsamong Black and White women. Addiction, 88, 1101–1110.
Herd, D., & Grube, J. (1996). Black identity and drinking in the US: Anational study. Addiction, 91, 845–858.
Holahan, C. J., Moos, R. H., Holahan, C. K., Cronkite, R. C., & Randall,P. K. (2001). Drinking to cope, emotional distress and alcohol use andabuse: A ten-year model. Journal of Studies on Alcohol, 62, 190–198.
Holahan, C. J., Moos, R. H., Holahan, C. K., Cronkite, R. C., & Randall,P. K. (2003). Drinking to cope and alcohol use and abuse in unipolardepression: A 10-year model. Journal of Abnormal Psychology, 112,159–165.
Holland, P. W., & Rubin, D. B. (1983). On Lord’s paradox. In H. Wainer& S. Messick (Eds.), Principals of modern psychological measurement:A festschrift for Frederic M. Lord (pp. 3–26). Hillsdale, NJ: Erlbaum.
Hussong, A. M. (2003). Social influences in motivated drinking amongcollege students. Psychology of Addictive Behaviors, 17, 142–145.
Jessor, R., Donovan, J. E., & Costa, F. M. (1989). Health BehaviorQuestionnaire. Boulder, CO: Institute of Behavioral Science, Universityof Colorado.
Jones-Webb, R. J., Hsiao, C. Y., Hannan, P., & Caetano, R. (1997).Predictors of alcohol-related problems: Results from the 1984 and 1992National Alcohol Surveys. American Journal of Alcohol and DrugAbuse, 23, 281–299.
Jones-Webb, R., Jacobs, D. R., Flack, J. M., & Liu, K. (1996). Relation-ships between depressive symptoms, anxiety, alcohol consumption, and
blood pressure: Results from the CARDIA study. Alcoholism, Clinicaland Experimental Research, 20, 420–427.
Kuntsche, E., Knibbe, R., Gmel, G., & Engels, R. (2005). Why do youngpeople drink? A review of drinking motives. Clinical Psychology Re-view, 25, 841–861.
Kuntsche, E., Knibbe, R., Gmel, G., & Engels, R. (2006). Who drinks andwhy? A review of socio-demographic, personality, and contextual issuesbehind the drinking motives in young people. Addictive Behaviors, 31,1844–1857.
Lord, F. M. (1973). Lord’s paradox. In S. B. Anderson, S. Ball, & R. T.Murphy (Eds.), Encyclopedia of educational evaluation (pp. 232–236).San Francisco: Jossey-Bass.
Loukas, A., Krull, J. L., Chassin, L., & Carle, A. C. (2000). The relation ofpersonality to alcohol abuse/dependence in a high risk sample. Journalof Personality, 68, 1153–1175.
Maag, J. W., & Irvin, D. M. (2005). Alcohol use and depression amongBlack and Caucasian adolescents. Adolescence, 40, 87–101.
MacLean, M. G., & Lecci, L. (2000). A comparison of models of drinkingmotives in a university sample. Psychology of Addictive Behaviors, 14,83–87.
Martin, J. K., Tuch, S. A., & Roman, P. M. (2003). Problem drinkingpatterns among African Americans: The impacts of reports of discrim-ination, perceptions of prejudice, and “risky” coping strategies. Journalof Health and Social Behavior, 44, 408–425.
Mehta, P. D., & West, S. G. (2000). Putting the individual back inindividual growth curves. Psychological Methods, 5, 23–43.
Mohr, C. D., Armeli, S., Tennen, H., Temple, M., Todd, M., Clark, J., &Carney, M. A. (2005). Moving beyond the keg party: A daily processstudy of college student drinking motivations. Psychology of AddictiveBehaviors, 19, 392–403.
Mushquash, C. J., Stewart, S. H., Comeau, M. N., Conrod, P. J., &Maclean, A. M. (2006, November). Psychometric evaluation of therevised drinking motives questionnaire in a high school student sample.Poster session presented at the annual meeting of the Association forBehavioral and Cognitive Therapies, Chicago, IL.
Myers H. F., Kagawa-Singer, M., Kumanyika, S. K., Lex, B. W., Markides,K. S. (1995). Behavioral risk factors related to chronic diseases in ethnicminorities. Health Psychology, 14, 613–621.
Neff, J. A. (1986). Alcohol consumption and psychological distress amongU.S. Anglos, Hispanics, and Blacks. Alcohol and Alcoholism, 27,111–119.
Oetting, E. R., & Beauvais, F. (1990). Adolescent drug use: Findings ofnational and local surveys. Journal of Consulting and Clinical Psychol-ogy, 58, 385–394.
O’Malley, P. M., Johnston, L. D., & Bachman, J. G. (1998). Alcohol useamong adolescents. Alcohol Health & Research World, 22, 85–93.
Paschall, M. J., Bersamin, M., & Flewelling, R. L. (2005). Racial/ethnicdifferences in the association between college attendance and heavyalcohol use: A national study. Journal of Studies on Alcohol, 66,266–274.
Pedhazur, E. J. (1997). Multiple regression in behavioral research (3rded.). Orlando, FL: Harcourt Brace.
Peirce, R. S., Frone, M. R., Russell, M., & Cooper, M. L. (1994). Rela-tionship of financial strain and psychosocial resources to alcohol use andabuse: The mediating role of negative affect and drinking motives.Journal of Health and Social Behavior, 35, 291–308.
Peterson, P. L., Hawkins, J. D., Abbott, R. D., & Catalano, R. F. (1994).Disentangling the effects of parental drinking, family management, andparental alcohol norms on current drinking by Black and White adoles-cents. Journal of Research on Adolescence, 4(2), 203–227.
Rachel, J. V., Maisto, S. A., Guess, L. L., & Hubbard, R. L. (1982).Alcohol use among youth. In National Institute on Alcohol and Alco-holism, Alcohol consumption and related problems (DHHS Publication
500 COOPER ET AL.

No. ADM 82–1190, pp. 55–95). Washington, DC: U.S. GovernmentPrinting Office.
Raudenbush, S. W., & Bryk, A. S. (2002). Hierarchical linear models:Applications and data analysis methods (2nd ed.). Newbury Park, CA:Sage.
Raudenbush, S. W., Bryk, A. S., Cheong, Y. F., & Congdon, R. T., Jr.(2004). HLM 6: Hierarchical linear and nonlinear modeling. Lincoln-wood, IL: Scientific Software International.
Read, J. P., Wood, M. D., Kahler, C. W., Maddock, J. E., & Palfai, T. P.(2003). Examining the role of drinking motives in college studentalcohol use and problems. Psychology of Addictive Behaviors, 17,13–23.
Ringwalt, C. L., & Palmer, J. H. (1990). Differences between White andBlack youth who drink heavily. Addictive Behaviors, 15, 455–460.
Rodham, K., Hawton, K., Evans, E., & Weatherall, R. (2005). Ethnic andgender differences in drinking, smoking and drug taking among adoles-cents in England: A self-report school-based survey of 15 and 16 yearolds. Journal of Adolescence, 28, 63–73.
Rosenfeld, P., Booth-Kewley, S., & Edwards, J. E. (1993). Computer-administered surveys in organizational settings: Alternatives, advan-tages, and applications. American Behavioral Scientist, 36, 485–511.
Schulenberg, J. E., & Maggs, J. L. (2002). A developmental perspective onalcohol use and heavy drinking during adolescence and the transition toyoung adulthood. Journal of Studies on Alcohol, 14, 54–70.
Schulenberg, J. E., Sameroff, A. J., & Cichetti, D. (2004). The transition toadulthood as a critical juncture in the course of psychopathology andmental health. Development and Psychopathology, 16, 799–806.
Schulenberg, J., Wadsworth, K. N., O’Malley, P. M., Bachman, J. G., &Johnston, L. D. (1996). Adolescent risk factors for binge drinking duringthe transition to young adulthood: Variable- and pattern-centered ap-proaches to change. Developmental Psychology, 32, 659–674.
Schwarz, N. (1999). Self-reports: How the questions shape the answers.American Psychologist, 54, 93–105.
Selzer, M. L., Vinokur, A., & Van Rooijen, L. (1975). A self-administeredshort version of the Michigan Alcoholism Screening Test (SMAST).Journal of Studies on Alcohol, 43, 117–126.
Singer, M. I., & Petchers, M. K. (1987). A biracial comparison of adoles-cent alcohol use. American Journal of Drug and Alcohol Abuse, 13,461–474.
Smith, M. J., Abbey, A., & Scott, R. O. (1993). Reasons for drinkingalcohol: Their relationship to psychosocial variables and alcohol con-sumption. The International Journal of the Addictions, 28, 881–908.
Stacy, A. W., Widaman, K. F., Hays, R., & DiMatteo, M. R. (1985).Validity of self-reports of alcohol and other drug use. Journal of Per-sonality and Social Psychology, 49, 219–232.
Stewart, C., & Power, T. G. (2003). Ethnic, social class, and genderdifferences in adolescent drinking: Examining multiple aspects of con-sumption. Journal of Adolescent Research, 18, 575–598.
Stewart, S. H., Zeitlin, S. B., & Samoluk, S. B. (1996). Examination of athree-dimensional drinking motives questionnaire in a young adult uni-versity student sample. Behaviour Research and Therapy, 34, 61–71.
Strube, M. J. (1985). Combining and comparing significance levels fromnonindependent hypothesis tests. Psychological Bulletin, 97, 334–341.
Wallace, J. M. (1999). Explaining race differences in adolescent and youngadult drug use: The role of racialized social systems. Drugs and Society,14, 21–36.
Wallace, J. M., Brown, T. N., Bachman, J. G., & Laveist, T. A. (2003). Theinfluence of races and religion on abstinence from alcohol, cigarettes andmarijuana among adolescents. Journal of Studies on Alcohol, 64,843–848.
Warheit, G. J., Vega, W. A., Khoury, E. L., & Gil, A. A. (1996). Acomparative analysis of cigarette and illicit drug use among an ethnicallydiverse sample of Hispanic, African American, and non-Hispanic Whiteadolescents. Journal of Drug Issues, 26(4), 399–418.
Watt, T. T. (2004). Race/ethnic differences in alcohol abuse among youth:An examination of risk-taking attitudes as a mediating factor. Journal ofEthnicity in Substance Abuse, 3(3), 33–47.
Welte, J. W., & Barnes, G. M. (1987). Alcohol use among adolescentminority groups. Journal of Studies on Alcohol, 48, 329–336.
Wills, T. A., Sandy, J. M., Shinar, O., & Yaeger, A. (1999). Contributionsof positive and negative affect to adolescent substance use: Test ofbidimensional model in a longitudinal study. Psychology of AddictiveBehaviors, 13, 327–338.
Received June 30, 2006Revision received March 10, 2008
Accepted March 11, 2008 �
501RACE DIFFERENCES IN DRINKING MOTIVES