Monocular Oral Reading Performance After Amblyopia Treatment in Children
Upload
independentCategory
view
7download
0
Monocular signals in human lateral geniculate nucleusreflect the Craik–Cornsweet–O’Brien effect
Wellcome Trust Centre for Neuroimaging,Institute of Neurology, University College London,
London, UK, &UCL Institute of Cognitive Neuroscience, London, UKElaine J. Anderson
UCL Institute of Ophthalmology, University College London,London, UKSteven C. Dakin
Wellcome Trust Centre for Neuroimaging,Institute ofNeurology,UniversityCollege London, London,UK, &
UCL Institute of Cognitive Neuroscience, London, UKGeraint Rees
The human visual system has a remarkable ability to accurately estimate the relative brightness of adjacent objectsdespite large variations in illumination. However, the lightness of two identical equiluminant gray regions can appear quitedifferent when a light–dark luminance transition falls between them. This illusory brightness “filling-in” phenomenon, theCraik–Cornsweet–O’Brien (CCOB) illusion, exposes fundamental assumptions made by the visual system in estimatinglightness, but its neural basis remains unclear. While the responses of high-level visual cortex can be correlated withperception of the CCOB, simple computational models suggest that the effect may originate from a much lower level,possibly subcortical. Here, we used high spatial resolution functional magnetic resonance imaging to show that the CCOBillusion is strongly correlated with signals recorded from the human lateral geniculate nucleus. Moreover, presenting the lightand dark luminance transitions that induce the CCOB effect separately to each eye abolishes the illusion, suggesting that itdepends on eye-specific signals. Our observations suggest that the CCOB effect arises from signals in populations ofmonocular neurons very early in the human geniculostriate visual pathway.
Keywords: visual illusion, subcortical, lightness, visual awareness, fMRI
Citation: Anderson, E. J., Dakin, S. C., & Rees, G. (2009). Monocular signals in human lateral geniculate nucleus reflect theCraik–Cornsweet–O’Brien effect. Journal of Vision, 9(12):14, 1–18, http://journalofvision.org/9/12/14/, doi:10.1167/9.12.14.
Introduction
A large class of brightness illusions has been catego-rized as “filling-in” phenomena. The Craik–Cornsweet–O’Brien illusion (Cornsweet, 1970; Craik, 1966; O’Brien,1958) is a particularly striking example in which theperceived lightness of a region of uniform luminance canbe profoundly altered by the presence of a luminancegradient along all or part of the border enclosing theregion (Figure 1). In the example shown, central regionsof the forehead and beret are of identical luminance butappear very different. It has been widely assumed thatsuch computations of relative brightness are a high-level mechanism carried out at a cortical level (Boyaci,Fang, Murray, & Kersten, 2007; Huang, MacEvoy, &Paradiso, 2002; Pereverzeva & Murray, 2008; Perna,Tosetti, Montanaro, & Morrone, 2005; Roe, Lu, & Hung,2005; Rossi & Paradiso, 1999; Rossi, Rittenhouse, &Paradiso, 1996), consistent with the observations thathigh-level interpretation of a scene, such as the perceivedcurvature, orientation, and depth of a surface can influence
the magnitude of the effect (Knill & Kersten, 1991;Purves, Shimpi, & Lotto, 1999).Although the context in which the light–dark border is
presented can enhance the CCOB effect, the illusion canbe driven purely by border information in the absence of anycoherent high-level information (Burr & Morrone, 1994;Cohen & Grossberg, 1984; Davidson & Whiteside, 1971;Gerrits & Vendrik, 1970; Grossberg & Todorovic,1988; Maddess, Davey, Srinivasan, & James, 1998;Paradiso & Nakayama, 1991; Rudd & Arrington, 2001;Figure 2A).Several low-level models of this phenomenon (Grossberg,
1994; Pessoa, Mingolla, & Neumann, 1995) share acommon conceptual similarity, using significant imagefeatures to infer a brightness value that is then propagatedacross space (at a cortical level) to “fill in” regions ofhomogenous luminance. However, recent psychophysicalobservations (Dakin & Bex, 2003) challenge this ortho-doxy by showing that phase scrambling lowVbut nothighVspatial frequencies (SFs) in the image destroys theCCOB illusion (see Figures 2B and 2C). This is importantsince it shows that introducing large amounts of
Journal of Vision (2009) 9(12):14, 1–18 http://journalofvision.org/9/12/14/ 1
doi: 10 .1167 /9 .12 .14 Received February 11, 2009; published November 19, 2009 ISSN 1534-7362 * ARVO

luminance fluctuation into previously uniform areas doesnot greatly affect the illusion, even though such amanipulation would be catastrophic for models relyingon “brightness propagation” between boundaries.Sensitivity of the CCOB to the spatial frequency
structure of the image led Dakin and Bex (2003) topropose that the mechanism responsible for the CCOBillusion operates by amplification of the weak low SFstructure of the image (to bring the image statistics intoline with natural scenes, in which low SFs are greatlyover-represented), rather than via propagation of a neuralsignal across space. Specifically, the model works byfiltering an incoming image with a bank of SF-tunedfilters, and then iteratively reweighting and summing thefilter outputs to reconstruct an image with as-close-to-natural statistics as possible. This approach predicts theCCOB and its variants including the missing fundamentalillusion1 (Kingdom & Simmons, 1998), as well otherfilling-in illusions such as White’s effect (White, 1979).Critically, this model works optimally with isotropic (non-orientation-tuned) mechanisms. This led us to hypothesizethat neural signatures of brightness filling-in may be seenat very early, possibly subcortical, stages of visualprocessing.Although single unit electrophysiology has established a
key role for early cortical visual areas (notably V1 andV2) in brightness perception in macaque monkeys (Huanget al., 2002; Kinoshita & Komatsu, 2001; Roe et al., 2005)and cats (MacEvoy, Kim, & Paradiso, 1998; Rossi &
Paradiso, 1999; Rossi et al., 1996), there is considerablyless work on brightness-correlated responses in the LGN(Rossi & Paradiso, 1999; Valberg, Lee, Tigwell, &Creutzfeldt, 1985). Modulating the luminance of the far-surround on neurons centrally stimulated with either auniform luminance patch or drifting bars results insignificant modulation of the responses of more than halfof LGN neurons (Rossi & Paradiso, 1999). Furthermore,changes in steady-state illumination of the surround ofLGN neurons can facilitate or suppress responses in amanner consistent with simultaneous brightness contrast(Valberg et al., 1985). However, such experiments haveessentially characterized the influence of surroundingluminance on LGN response to conventional stimuli,using conditions not designed to produce clear illusoryshifts in brightness. In this sense such approaches may notbe optimal for studying the neural analogues of brightnessperception in humans.In humans, cortical responses correlated with perceived
brightness are seen as early as V1 (Boyaci et al., 2007;Pereverzeva & Murray, 2008), as well as in higher areasof the dorsal visual stream (Boucard, van Es, Maguire,& Cornelissen, 2005; Cornelissen, Wade, Vladusich,Dougherty, & Wandell, 2006; Perna et al., 2005). How-ever, no investigation of the LGN has been undertaken,despite the evidence from animal electrophysiologyreviewed above. Therefore, we set out to investigatewhether responses early in the human retino-striate visualpathway correlate with perceived brightness. In fourlinked experiments we provide converging evidence tosuggest that signals correlated with perceived brightnessarise from populations of monocular neurons in LGN andprimary visual cortex.
Experiment 1: BOLD signalsrecorded from the human LGNcorrelate with perceivedbrightness
All procedures for Experiments 1–3 were approved bythe local ethics committee, and informed consent wasobtained from all participants.
MethodsParticipants and stimuli
Nine healthy volunteers, aged 25 to 39 years, withnormal visual acuity took part.Participants fixated centrally while viewing annular
stimuli that subtended 4–16- of visual angle (i.e., extendingfrom 2 to 8 deg eccentricity from the fovea in eachhemisphere). For the main experiment there were four
Figure 1. Example of the Craik–Cornsweet–O’Brien illusion. In thisexample, (A) a high-contrast black and white image of CheGuevara has been filtered with a center–surround, Laplacian-of-Gaussian (LoG) filter to produce a series of light–dark transitions atthe locations of edges in the original image. In (B) the CCOB image,regions corresponding to the forehead and hair are of identicalluminance (see inset below illustrating the luminance profile for ahorizontal section through the figureVmarked by the dashed whiteline on either side of the image) but continue to induce a strong butclearly illusory sense of relative lightness and darkness.
Journal of Vision (2009) 9(12):14, 1–18 Anderson, Dakin, & Rees 2

stimulus conditions: (1) “CCOB” (Figure 2A), (2) CCOBwith low SFs scrambledV“scramLo” (Figure 2B),(3) CCOB with high SFs scrambledV“scramHi”(Figure 2C), and (4) physical luminance match (Figure 2D).See Figures A1A–A1C for enlarged images. All stimuliwere polarity reversed at 1 Hz. This rate is optimal forinducing maximal modulations in V1 responses corre-lated with illusory changes in perceived brightness (Rossi& Paradiso, 1999).Stimuli were generated by convolving white noise
patterns with a 2D Laplacian-of-Gaussian filter, and thenthresholding (at mean response level) to generate aspatially broad-band black-and-white “blob” image. Thesepatterns had a fundamental frequency of 1.2 blobs/deg(i.e., 0.6 c/deg). Blob images were either contrast-adjusted,to form the physical luminance stimuli (see details below),or were refiltered with a Laplacian-of-Gaussian (yielding apeak SF of 120 c/image, equivalent to 7.5 c/deg for ourstimuli) and contrast-scaled to the maximum range toproduce the CCOB stimuli. Stimuli for the scramLo andscramHi conditions were generated by phase-scramblingeither the low or high SF structure, respectively (seeFigure 2E for the range of SFs scrambled). The SF rangesemployed were selected so that the RMS contrast of bothranges was matched and so that the sum of the two rangesyielded the original signal. Note that we used SF ranges witha shallow roll-off to avoid “ringing” artifacts that arise fromthe use of sharp cut-off filters. Phase-scrambled conditionswere matched in RMS contrast to the CCOB condition andhad indistinguishable power spectra (Figure 2E).
Figure 2. Stimuli and power spectra. Sample stimuli for the fourexperimental conditions in Experiment 1: (A) Craik–Cornsweet–O’Brien illusionV“CCOB,” (B) CCOB with low SFs phasescrambledV“scramLo,” (C) CCOB with high SFs phase scram-bledV“scramHi,” (D) similar pattern with physical change inluminance matched to the perceived change in luminance forCCOBV“physical” match (see Methods section). See alsoFigures A1A–A1C for enlarged images. For (A) the CCOBstimulus, regions adjacent to the dark portion of the contourappear darker than those adjacent to the light portion of thecontour. This illusory percept is abolished when the (B) low SFsare phase scrambled but preserved when only the (C) high SFsare phase scrambled. Luminance profiles (for a horizontal sectionindicated by the dashed black line) found beneath each exampledemonstrate that the mean luminance across regions is constantfor stimuli A–C, whereas physical changes in luminance occur forcondition D. Each stimulus type has been color coded forcorrespondence with the power spectra shown in panel E.(E) The power spectra for conditions A–C were indistinguishableand hadÈ7.5� the energy compared to condition D (varied slightlybetween participants depending on their matching contrast), whereenergy for a signal x is ªF(x)ª2 and F is the Fourier transform. Theshaded regions highlight the range of SFs that were phasescrambled in the scramLo condition (red) and scramHi condition(green).
Journal of Vision (2009) 9(12):14, 1–18 Anderson, Dakin, & Rees 3

For the physical luminance match control condition(condition D), each subject performed a psychophysicalexperiment prior to scanning to determine the physicalchange in luminance that best matched the perceivedchange in luminance for the CCOB illusion. The CCOBstimulus was presented alongside an image of a similarpattern but unfiltered, i.e., defined by physical modulationsin luminance. Participants were asked to adjust the contrastof this latter image until it best matched the perceivedcontrast of the adjacent CCOB image. The initial contrastof the physical match image was reset at the beginning ofevery trial to a value randomly assigned between T14% insteps of 1%. Contrast could be incremented or decremented(using a key press) in steps of 0.1% to achieve the closestmatch. This procedure was repeated 16 times and the meancontrast value then used to generate images for condition D(contrast settings ranged from 4.2% to 5.4% acrossparticipants). The RMS contrast of the physical match wason average 13% of that for stimuli from conditions A–C(note that the power for the physical match varied slightlyaccording to the matching contrast set by each participant).All images used in the fMRI and psychophysics
experiments were presented on a gamma corrected dis-play. To ensure steady central fixation was maintainedthroughout, participants were instructed to monitor andcount how many times the fixation cross changed color,which occurred at irregular intervals. Fixation wasmonitored throughout using an ASL504 LRO infraredvideo-based MRI compatible eye tracker (Applied ScienceLaboratory, Bedford, MA) sampling at 60 Hz, with aspatial resolution of 0.5-.
Paradigm
In a block design paradigm each of the four conditionswere presented twice per experimental run, with eachcondition occurring in the first and second halves of therun in a randomized order. Block order was randomizedbetween runs and between participants. Each block lasted31 s (10 volumes), interleaved with a fixation baseline for18.6 s (6 volumes). An additional 5 volumes were acquiredat the start of each experimental run to achieve steady-state magnetization. Each participant performed 6 runs ofthe main experiment (133 volumes per run) and alsounderwent an “LGN localizer” (Haynes, Deichmann, &Rees, 2005) to functionally locate voxels in the right andleft LGN, as well as standard retinotopic mappingprocedures to localize V1, V2, and V3 (Sereno et al.,1995; see below for details).
Localizing the LGN
We functionally identified the LGN independently ineach of our nine participants by contrasting contralateralwith ipsilateral hemifield stimulation (Haynes et al., 2005;
Figure 3A). Participants fixated centrally while passivelyviewing blocks of flashing black and white checker-boards (8 Hz), which stimulated either the right or lefthemisphere for 27.9 s (9 volumes), interleaved with afixation baseline for 21.7 s (7 volumes). Each partic-ipant performed 2 runs of 133 volumes each (4 repetitionsof each hemifield + 5 initial dummy scans that were
Figure 3. BOLD signals recorded from the LGN. (A) LGNlocalizerVVoxels within an anatomically defined region of theposterior thalamus that responded more strongly to contralateralversus ipsilateral checkerboard stimuli were used to identify theright and left LGN, respectively (see Methods section). (B) BOLDsignal changes measured in bilateral LGN for each of the fourexperimental conditions in Experiment 1. Mean signal change(compared to fixation baseline) across all nine participants isplotted for each of the four conditions. Error barsVSEM for thegroup. Our three experimental conditions (A–C) elicited significantdifferences in LGN activity (F(2,16) = 3.959, p = 0.040). Critically,there was a significant reduction in activity comparing the CCOBcondition with the scramLo condition, for which the CCOB effectdoes not exist (t(8) = 3.092, p = 0.015). However, activity evokedby the scramHi condition, for which the CCOB effect persists, didnot differ significantly from that evoked by the CCOB condition(t(8) = 1.190, p = 0.268). Thus, there was a strong correlationbetween signal strength and perception of the CCOB illusion.These differences cannot be explained by differences in stimuluspower, as both scrambled conditions had power spectra indis-tinguishable from that for the CCOB (Figure 2E). Furthermore, thephysical match condition evoked comparable activity to that forthe CCOB (t(8) = 0.835, p = 0.428), despite a significant reductionin energy (condition D hadÈ13% of the energy in conditions A–C).
Journal of Vision (2009) 9(12):14, 1–18 Anderson, Dakin, & Rees 4

discarded) immediately following the main experiment.Checkerboard wedges extended between 2- and 8- fromfixation and overlapped the visual area stimulated by theannular images used in the main experiment (Figure 2). Acentral fixation task was performed to ensure steadyfixation throughout.
Localizing primary visual areas
Retinotopic areas V1–V3 were also identified for eachindividual in a second scanning session using standardprocedures (Sereno et al., 1995; see Figure A2). Partic-ipants fixated centrally while passively viewing flashing(8 Hz) black and white checkerboards, which stimulatedeither the horizontal or vertical meridian for 19.5 s(15 volumes), interleaved with a fixation baseline of 13 s(10 volumes). Each participant performed 2 runs of255 volumes each (5 repetitions of each meridian + 5initial dummy scans that were discarded). To ensure steadycentral fixation throughout, participants performed acentral fixation task.
fMRI acquisition
A 3T Siemens Allegra scanner, with standard head coil,was used to acquire all functional and structural data. Forthe main experiment and LGN localizer a high-resolutionEPI sequence (matrix 128 � 128, field of view 192 mm,in-plane resolution 1.5 � 1.5 mm, slice thickness 1.5 mm,TE 30 ms, acquisition time per slice 102 ms, TR 3.1 ms)was used to acquire 30 slices, positioned to optimizecoverage of the LGN and occipital pole. A high-resolutionT1-weighted structural image (1 � 1 � 1 mm) was alsoacquired for every participant.For retinotopic mapping a standard EPI sequence
(matrix 64 � 64, in-plane resolution 3 mm2, slicethickness 2 mm with 1-mm gap, TR 1.3 s) was used toacquire 20 slices oriented parallel to the calcarine sulcusand positioned to optimize coverage of the occipitalcortex.
fMRI analysis
Imaging data were analyzed using SPM2 (http://www.fil.ion.ucl.ac.uk/SPM). The first 5 images from eachexperimental run were discarded and the remaining high-resolution images from the main experiment and LGNlocalizer were realigned and coregistered to each partic-ipant’s T1 structural image. For the main experiment, datawere smoothed using a 3-mm isotropic Gaussian smooth-ing kernel. A linear combination of regressors represent-ing the time series for each of our 4 experimentalconditions and fixation baseline was convolved with asynthetic hemodynamic response function and its tempo-ral derivative, creating a box-car function. The general
linear model, as employed by SPM2, was used to generateparameter estimates for each regressor at every voxel.For the LGN localizer, data were smoothed using a
2-mm isotropic Gaussian smoothing kernel. Time seriesrepresenting stimulation of the right hemisphere, lefthemisphere, and rest were modeled. To identify the leftLGN, voxels within an anatomically defined region of theposterior thalamus that showed greater activity for rightfield stimulation compared to left field stimulation (p =0.05, cluster threshold 20 voxels) were inclusively maskedwith those voxels that showed greater activation for rightfield stimulation compared to rest (masking threshold: p =0.01, cluster threshold 920 voxels). Similarly, to identifythe right LGN, voxels that showed greater activity for leftfield stimulation compared to right field stimulation wereinclusively masked with voxels showing greater activationfor left field stimulation compared to rest (Figure 3A).Mask volumes for both LGN were created and theparameter estimates averaged across all voxels withinthe mask, for each condition of interest. The pattern ofresponses for the right and left LGN was indistinguishableso data were averaged bilaterally.To identify V1, V2, and V3, mrGray (http://white.
stanford.edu/~brian/mri) was used to segment white andgray matter and for cortical flattening. fMRI activationelicited by the meridian mapping stimuli was super-imposed on the flat map of visual cortex and theboundaries between V1, V2, and V3 (dorsal, d, andventral, v) defined by the transitions between voxelsrepresenting the horizontal and vertical meridians (seeFigure A2). Mask volume images were created for V1,V2, and V3 for each participant and the fMRI signalassociated with each of our experimental conditions,versus baseline, extracted. A threshold of p G 0.001uncorrected was used to determine significance for eachcondition of interest in accordance with our priorhypotheses.
Control experiment
Two participants from the main experiment alsoperformed a control experiment to ensure that the highSF structure of the images used in the main experimentwas “visible” to the human LGN. Participants viewedannular stimuli with the same spatial configuration as themain experiment but now containing just the high SFstructure of our original CCOB images. Figure 2E showsthe range of spatial frequencies included in this image.This stimulus was not RMS matched to the originalCCOB stimulus. These “Hi-only” images were presentedin 31 second blocks (10 volumes), interleaved with afixation baseline for 18.6 s (6 volumes)Vi.e., the sametimings used in the main experiment. There were fourblocks of “Hi-only” images per experimental run andparticipants performed 2 runs each. Data were analyzed inthe same way as for the main experiment.
Journal of Vision (2009) 9(12):14, 1–18 Anderson, Dakin, & Rees 5

Results and discussion
In Experiment 1, we constructed three abstract annularstimuli whose amplitude and power spectra were physi-cally identical but that varied in their ability to evoke theCCOB effect (Figures 2A–2C). The “CCOB” stimulusinduced a strong perception of filling-in (Figure 2A).Randomizing the phase of the low SF structure in thisstimulus destroyed the CCOB effect (Figure 2B,“scramLo”). However, similar phase randomization ofthe high SF content led to only a slight attenuation in theperceived contrast of the illusion (Figure 2C, “scramHi”;see results for Experiment 2 for psychophysical assess-ment of the degree of filling-in experienced). Wehypothesized that brain areas whose activity reflectedperception of the illusion would show strong reductions inactivity for the “scramLo” stimulus compared to the“CCOB” stimulus (even though their amplitude and powerspectra were identical), but little or no reduction for the“scramHi” stimulus. We also included a control conditionwhere physical changes in luminance were psychophysi-cally matched (on a per-participant basis) to the perceivedchange in luminance induced by the CCOB stimulus. Thiscondition was not matched for RMS contrast but provided afurther control for assessing brightness-correlated responses.First, we functionally identified the LGN in each of the
nine participants using high-field functional MRI at highspatial resolution (Figure 3A). We then measured BloodOxygenation Level Dependent (BOLD) signals evoked byvisual stimuli in the three experimental conditions(Figures 2A–2C). Consistent with our hypothesis, BOLDsignals recorded from the LGN showed a strong correla-tion with perception of the CCOB effect (Figure 3B) withstimuli from our three experimental conditions elicitingsignificant differences in LGN activity (F(2,16) = 3.959,P = 0.040). These differences were accounted for by asignificant reduction in activity comparing the “CCOB”stimulus, where a strong brightness filling-in effect wasperceived, with the “scramLo” stimulus, for which thisperceptual effect was no longer present (t(8) = 3.092, P =0.015). In contrast, the activity evoked by the “CCOB”stimulus did not significantly differ from that evoked bythe “scramHi” stimulus where a comparable brightnessfilling-in effect was perceived (t(8) = 1.190, P = 0.268).As the “CCOB” stimulus and both high and low frequencyscrambled stimuli had almost identical power spectra(Figure 2E), the differences in LGN activity we observedcannot be accounted for by differences in stimulus power.Moreover, the perceptually matched physical-luminancecontrol stimulus evoked activity levels statistically indis-tinguishable from the “CCOB” stimulus (t(8) = 0.835, P =0.428), a finding that is again consistent with activity inthe human LGN correlating with perceived brightness.BOLD signals recorded from retinotopically identified
areas V1–V3 showed a qualitatively similar pattern offindings, although now with additional significant reduc-tions in activity comparing activity evoked by the CCOB
stimulus and the high spatial frequency scrambledstimulus (see Figure A3 for V1–V3 fMRI responses).Thus, activity in the LGN showed the best correlationwith perception of the CCOB effect.The stimuli used in the main experiment were designed
to optimize perception of the CCOB effect. Although thelow SFs in this stimulus were well within the sensitivityrange of LGN neurons, some of the high SF structure layat the limits of receptive field sizes recorded in non-human primates (Kilavik, Silveira, & Kremers, 2007;Kremers, Silveira, & Kilavik, 2001; Levitt, Schumer,Sherman, Spear, & Movshon, 2001). LGN receptive fieldsizes are also known to increase with increasing eccen-tricity (Irvin, Casagrande, & Norton, 1993; Xu, Bonds, &Casagrande, 2002; Xu et al., 2001) and with low contraststimuli (Kilavik et al., 2007; Kremers et al., 2001). There-fore, it is conceivable that the high SFs in our annularstimuli (which extended 2–8 deg from the fovea) were notwithin the sensitivity range of human LGN neurons. If thiswere the case, then our observation that randomizing thephase of the high SFs had no effect on LGN activity mightbe accounted for by an absence of high spatial frequencysensitivity rather than by a correlation of neuronal signalswith perceived brightness. To rule out this possibility, weperformed a control fMRI experiment that examinedwhether human LGN responded to the high spatialfrequencies in the original CCOB stimulus (see above).We compared BOLD responses evoked by the high SF
images with a uniform gray background. The “Hi-only”images evoked significant activity in the LGN (t(1) = 67.196,p G 0.001, one-tailed), as well as V1 (t(1) = 6.266, p = 0.05,one-tailed), V2 (t(1) = 9.275, p = 0.034, one-tailed), and V3(t(1) = 8.972, p = 0.036, one-tailed; Figure A4), confirmingthat the human LGN does indeed respond to stimuli whosespatial frequency spectra are restricted to just the high SFcontent of the original CCOB image.Thus, we can conclude that the observations of a
reduction in signal in the human LGN in association withscrambling low spatial frequencies in our CCOB stimuluswere not confounded by a lack of sensitivity of the humanLGN to the high spatial frequency content of our stimuli.
Experiment 2: Effect of dichopticviewing on CCOB illusion
The LGN contains monocular neurons segregated intoeye-specific layers (Jones, 1985; Shatz, 1996). Theselayers remain segregated on entering striate cortex atlayer IV, and only subsequently does integration of thesemonocular pathways occur. Our fMRI findings thereforesuggest that the CCOB effect reflects activity in mono-cular pathways. However, as BOLD contrast fMRI signalscan also reflect dendritic potentials (Logothetis, Pauls,Augath, Trinath, & Oeltermann, 2001), it remains possible
Journal of Vision (2009) 9(12):14, 1–18 Anderson, Dakin, & Rees 6

that the modulations we observed in LGN reflect afeedback signal from binocular neurons in striate cortex,where processing of surface brightness has been estab-lished (Haynes, Lotto, & Rees, 2004; Huang et al., 2002;Kinoshita & Komatsu, 2001; MacEvoy et al., 1998; Roeet al., 2005; Rossi & Paradiso, 1999; Rossi et al., 1996).To distinguish the possible contribution of binocularneurons in V1 from monocular neurons in either V1 orLGN to the fMRI signals we observed, we conducted asecond psychophysical experiment.
Methods
We constructed novel dichoptically presented CCOBstimuli (Figure 4A) where one eye viewed only the lightportion of the border contour and the other eye viewedonly the dark portion of the border contour. When viewedwith both eyes open, the light and dark portions of theborder were aligned side by side, as in the original CCOBimage.To assess the magnitude of brightness filling-in for each
of our experimental conditions (A–C) and to assesswhether the CCOB persists under dichoptic viewing
conditions, six healthy volunteers performed a contrastnulling experiment while maintaining central fixation andviewing (A) CCOB monocularly, (B) scramLo monocu-larly, (C) scramHi monocularly, or (D) dichoptic CCOB.All participants (24–39 years, with normal VA) gaveinformed consent to take part. Stimuli were presented at120-Hz frame rate on a CRT display viewed through LCDshutter glasses (http://www.nuvision3d.com) that weresynchronized to the frame refresh of the monitor usingan infrared transmitter (giving an effective frame rate of60 Hz per eye). For the monocular conditions (A–C)stimuli were randomly presented to either eye. For thedichoptic condition, only the light section of the CCOBimage was presented to one eye and only the dark sectionto the fellow eye, assigned at random (see Figure 4A).An additional pedestal imageVof identical pattern
defined by physical luminance changeVwas super-imposed onto the binocular percept and participants wereasked to adjust the contrast of this image, using keypresses that incremented/decremented in steps of 4%, 2%,or 1%, until the entire image appeared to have uniformluminance. The initial contrast value for the pedestalimage was reset at the beginning of every trial (within arange of T20% contrast, in steps of 2%) chosen at random.Participants were not informed of which condition theywere viewing at any time. Sixteen trials of each conditionwere presented in a randomized order and the meannulling contrast determined for each condition, for eachparticipant.
Figure 4. Brightness filling-in under dichoptic viewing conditions.(A) Schematic diagram showing dichoptic presentation of theCCOB stimulus in Experiment 2: the light portion of the CCOBstimulus was presented to one eye and the dark portion to theother eye, assigned at random. The light and dark contours werealigned side by side in the binocular percept. A contrast nullingprocedure was used to establish whether the CCOB illusion waspresent under dichoptic viewing conditions (see Methods section).The schematic also illustrates how information from the righthemifield is carried to the left LGN and vice versaVa fact weutilize when localizing the LGN. Monocular information from eacheye remains segregated in this pathway and terminates in distinctlayers of the LGN. (B) Throughout the contrast nulling, a randomdot letter stereogram task was performed at fixation to ensurebinocular fusion (see Methods section). When binocularly fused aletter T appeared to be in front of the background image (outlinedin red for illustrative purposes only). (C) Mean contrast nullingvalues for each of the 6 participants for each condition (redtriangle = group mean value). Error barsVSEM. High nullingcontrasts were required to negate the strong effects of brightnessfilling-in experienced for both the monocular CCOB (5.2%, SD T
0.5%) and scramHi conditions (5.1%, SD T 0.6). However,brightness filling-in was all but abolished for the monocularscramLo condition (1.3%, SD T 0.7). Crucially, a similar reductionin nulling contrast was found for the CCOB viewed dichoptically(2.5%, SD T 0.8), confirming that the CCOB effect is significantlyattenuated when viewed dichoptically.
Journal of Vision (2009) 9(12):14, 1–18 Anderson, Dakin, & Rees 7

To ensure central fixation and steady binocular fusionthroughout, and to rule out the possibility of binocularrivalry during the dichoptic condition, a random dotstereogram was simultaneously presented at fixationduring all conditions (Figure 4B). At the beginning ofevery trial, participants were required to report theorientation of the letter T (tail pointing north, south, east,or west). Participants would not be able to perform thiscentral task if they failed to achieve binocular fusion (allparticipants performed with 100% accuracy on this task).Subjects were asked to stop the trial if this 3D perceptever disappeared. All subjects reported experiencing asteady 3D percept of the central stereo image. Images forconditions A–D were identical in size, angular subtense,and luminance to those used in Experiment 1. The resultsare shown graphically in Figure 4C.
Results and discussion
We reasoned that if the CCOB illusion arises frommonocular signals, then separating the light and darkportions of the border that induce the effect and presentingthem to each eye independently should attenuate, if notabolish, the illusion. However, if the illusion arises frombinocular signals that subsequently feedback onto monoc-ular pathways, then it should be preserved.For the CCOB stimulus, participants set a nulling
contrast of 5.2% (SD = 0.5%), confirming that brightnessfilling-in was present (Figure 4C). A similar nullingcontrast was required for the monocular scramHi con-dition (5.1%, SD = 0.6%), which was not statisticallydifferent from the monocular CCOB condition (t(5) =0.252, p = 0.811). However, under dichoptic viewingconditions, a significantly lower nulling contrast of 2.5%(SD = 0.8%; t(5) = 6.709, P = 0.001) was required tosubjectively achieve equal brightness. Similarly, bright-ness filling-in was all but abolished for the monocularscramLo condition (1.3%, SD = 0.7%), with a significantreduction in nulling contrast compared to the monocularCCOB (t(5) = 9.533, p G 0.001). Crucially, the nullingcontrast required for the monocular scramLo was statisti-cally indistinguishable from the dichoptic CCOB con-dition (t(5) = 2.481, p = 0.056), confirming that the CCOBillusion was greatly attenuated by dichoptic presentation.These findings show that monocular channels are essentialfor generating the CCOB effect.
Experiment 3: The CCOB is astrictly monocular effect
It is conceivable that the fusional demands of thedichoptic CCOB image used in Experiment 2 were greaterthan those required to maintain perception of the central
depth-defined T image. If this were the case, it is possiblethat the two components of the CCOB (separate light anddark portions of the border, presented dichoptically) werenot perfectly fused throughout the entire contrast nullingprocedure, which could have abolished the CCOB percept.To test our hypothesis that the CCOB arises frommonocular signals, we therefore performed a third psycho-physical experiment. Using the same experimental set-upand nulling procedure used in Experiment 2, we presentedthe original CCOB image to one eye and a phase-scrambled version of the stimulus (i.e., noise) to the othereye. Under these conditions, if monocular signals aredriving the CCOB illusion, we hypothesized that therewould be no (or only very little) noise-related degradationof the CCOB effect. Alternatively if the CCOB isprimarily a binocular phenomenon the CCOB effectwould be strongly reduced.
Methods
Using the same experimental set-up as Experiment 2,six participants (five new and one that had participated inExperiment 2) viewed a CCOB stimulus presented to oneeye (top left image, Figure 5) plus a phase-scrambledversion of the CCOB stimulus (i.e., noise) presented to theother eye (top middle image, Figure 5). All participants(aged 27–39 years, healthy and with normal VA) gaveinformed consent to take part. When the noise stimuluswas matched to the CCOB stimulus for RMS contrast(conferring broadly equal visibility), all participantsexperienced complete suppression of the noise stimulus;that is, subjects only perceived the CCOB image.Increasing the contrast of the noise quickly led tobinocular rivalry. To counteract this, we generatedphase-scrambled noise that was confined to the internalregions of the “blobs” in any given CCOB image (seeexample in middle panel of Figure 5) and set the RMScontrast to twice that of the CCOB image. Under theseconditions participants performed a contrast nullingprocedure, making 12 adjustments each to perceptuallyabolish the CCOB effect (see bottom left panel of Figure 5for example where the CCOB is nearly abolished).The same participants also performed a contrast nulling
procedure for the CCOB image presented monocularlywith no noise presented to the other eye (i.e., identical tocondition A in Experiment 2) to ensure that a comparablenulling contrast was obtained for this group but also toprovide a contrast level with which to compare anydegradation of the CCOB effect due to presenting noise tothe fellow eye. This latter condition (CCOB monocularlyonly) gave estimates of the illusion that were almostidentical to our reported findings for condition A inExperiment 2: 4.8% (SD T 0.9%). Importantly, introduc-ing the noise image to the other eye had no effect on thestrength of the CCOB illusionVnulling contrast 5.1%
Journal of Vision (2009) 9(12):14, 1–18 Anderson, Dakin, & Rees 8
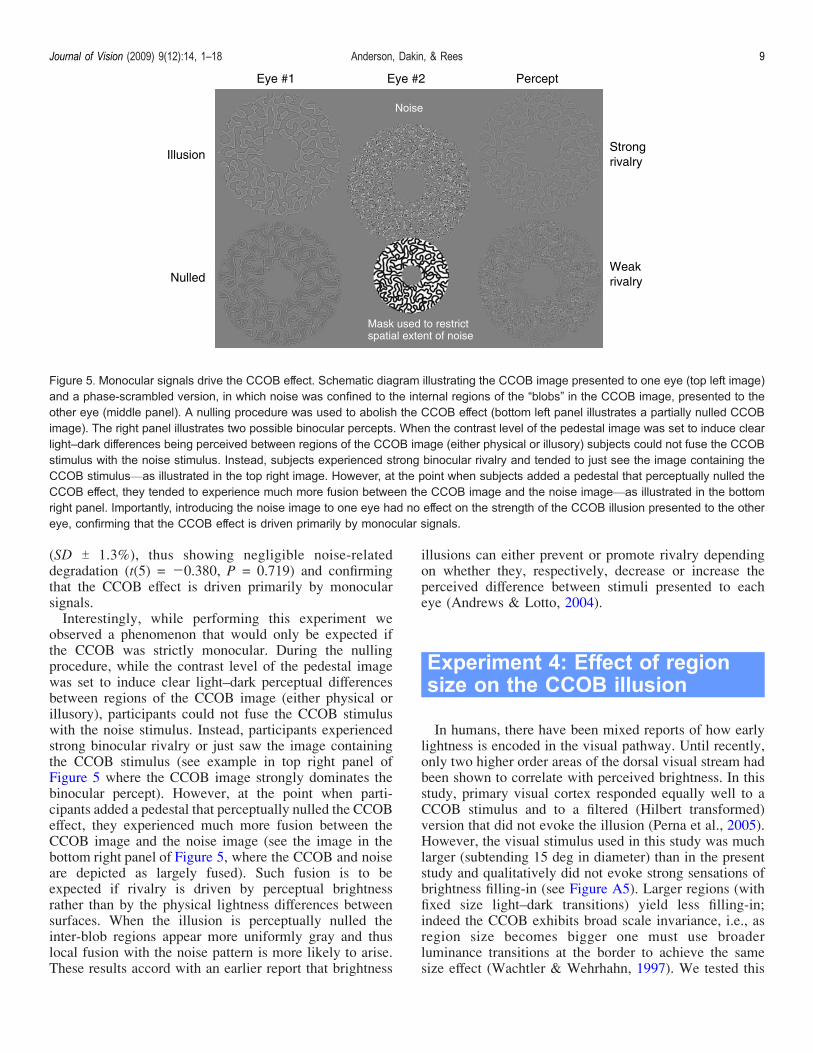
(SD T 1.3%), thus showing negligible noise-relateddegradation (t(5) = j0.380, P = 0.719) and confirmingthat the CCOB effect is driven primarily by monocularsignals.Interestingly, while performing this experiment we
observed a phenomenon that would only be expected ifthe CCOB was strictly monocular. During the nullingprocedure, while the contrast level of the pedestal imagewas set to induce clear light–dark perceptual differencesbetween regions of the CCOB image (either physical orillusory), participants could not fuse the CCOB stimuluswith the noise stimulus. Instead, participants experiencedstrong binocular rivalry or just saw the image containingthe CCOB stimulus (see example in top right panel ofFigure 5 where the CCOB image strongly dominates thebinocular percept). However, at the point when parti-cipants added a pedestal that perceptually nulled the CCOBeffect, they experienced much more fusion between theCCOB image and the noise image (see the image in thebottom right panel of Figure 5, where the CCOB and noiseare depicted as largely fused). Such fusion is to beexpected if rivalry is driven by perceptual brightnessrather than by the physical lightness differences betweensurfaces. When the illusion is perceptually nulled theinter-blob regions appear more uniformly gray and thuslocal fusion with the noise pattern is more likely to arise.These results accord with an earlier report that brightness
illusions can either prevent or promote rivalry dependingon whether they, respectively, decrease or increase theperceived difference between stimuli presented to eacheye (Andrews & Lotto, 2004).
Experiment 4: Effect of regionsize on the CCOB illusion
In humans, there have been mixed reports of how earlylightness is encoded in the visual pathway. Until recently,only two higher order areas of the dorsal visual stream hadbeen shown to correlate with perceived brightness. In thisstudy, primary visual cortex responded equally well to aCCOB stimulus and to a filtered (Hilbert transformed)version that did not evoke the illusion (Perna et al., 2005).However, the visual stimulus used in this study was muchlarger (subtending 15 deg in diameter) than in the presentstudy and qualitatively did not evoke strong sensations ofbrightness filling-in (see Figure A5). Larger regions (withfixed size light–dark transitions) yield less filling-in;indeed the CCOB exhibits broad scale invariance, i.e., asregion size becomes bigger one must use broaderluminance transitions at the border to achieve the samesize effect (Wachtler & Wehrhahn, 1997). We tested this
Figure 5. Monocular signals drive the CCOB effect. Schematic diagram illustrating the CCOB image presented to one eye (top left image)and a phase-scrambled version, in which noise was confined to the internal regions of the “blobs” in the CCOB image, presented to theother eye (middle panel). A nulling procedure was used to abolish the CCOB effect (bottom left panel illustrates a partially nulled CCOBimage). The right panel illustrates two possible binocular percepts. When the contrast level of the pedestal image was set to induce clearlight–dark differences being perceived between regions of the CCOB image (either physical or illusory) subjects could not fuse the CCOBstimulus with the noise stimulus. Instead, subjects experienced strong binocular rivalry and tended to just see the image containing theCCOB stimulusVas illustrated in the top right image. However, at the point when subjects added a pedestal that perceptually nulled theCCOB effect, they tended to experience much more fusion between the CCOB image and the noise imageVas illustrated in the bottomright panel. Importantly, introducing the noise image to one eye had no effect on the strength of the CCOB illusion presented to the othereye, confirming that the CCOB effect is driven primarily by monocular signals.
Journal of Vision (2009) 9(12):14, 1–18 Anderson, Dakin, & Rees 9

finding using our own stimuli in order to determine if thedifferent findings from our study and that of Perna et al.(2005) might be accounted for by differences in the size ofthe “filled-in” regions. To this end, we conducted a fourthpsychophysical experiment where the strength of theillusion was measured using the same contrast nullingprocedure used in Experiment 2 (see above) for varioussizes of regions comprising the CCOB stimulus.
Methods
Qualitatively, it appears that the size of the regionenclosed by the border contour modulates the size of theCCOB effect (Figure A5). To quantify the effect of regionsize on brightness filling-in, we had participants perform acontrast nulling task (similar to Experiment 2) whileviewing CCOB images containing one of 7 possible regionsizes, ranging from 2 regions/deg to 0.088 regions/deg.Three healthy volunteers (25–32 years, with normal VA)
participated. Each participant performed 8 trials for eachregion size, presented in a random order. All other detailsof the experimental set-up were identical to those forExperiment 2.
Results and discussion
Figure 6 illustrates how the magnitude of the CCOBillusion fell as region size increased. CCOB stimulicomprised of relatively small regions, such as those usedin our imaging experiment, required high nulling contrasts(Figure 6) indicating the presence of robust filling-in.However, as region size increased, the nulling contrastfell. At a region size that matched the earlier study (Pernaet al., 2005), no nulling contrast was required. Thus,observers fail to show objectively the presence of anybrightness filling-in for large regions. These data supportour earlier contention that the source of discrepancybetween our own findings and those of Perna et al.(2005) originate from these authors having presented theirstimuli in a manner that did not lead to robust filling-in.More recently, and in line with our findings, neuralactivity in V1 has convincingly been shown to correlatewith perceived brightness for stimuli that demonstraterobust changes in induced brightness (Boyaci et al., 2007;Pereverzeva & Murray, 2008).Note that the model as described by Dakin and Bex is
scale-invariant (treating all SF components equally).Incorporating the visibility of different SF componentswould allow the model to explain the effects of region sizeon the CCOB. Furthermore we anticipate that this wouldalso explain why, e.g., white noise patterns do not appearfractal, simply because the low frequency components ofwhite noise patterns are likely to be invisible.
Discussion
In four linked experiments (plus additional controlexperiments) we have demonstrated that signals arisingin the earliest post-retinal stages of human monocularvisual processing (LGN) correlate with the perceivedbrightness of our CCOB stimuli.Although processing associated with surface brightness
is found in all layers of striate cortex (Huang et al., 2002;Kinoshita & Komatsu, 2001; MacEvoy et al., 1998; Roeet al., 2005; Rossi & Paradiso, 1999; Rossi et al., 1996),including layer IV (which receives monocular inputs fromthe LGN), the LGN itself has rarely been examined andonly a very small subset of LGN neurons show brightness-correlated responses (Rossi & Paradiso, 1999). Theapparent discrepancy between the strong modulation ofpopulation responses measured here (using BOLD con-trast fMRI) in association with changes in perceived
Figure 6. Region size dependence of CCOB effect. The strengthof the CCOB illusion, measured using the contrast nullingtechnique, varies with region size. See Methods section for fulldetails of Experiment 4 and Figure A5 for a schematic illustrationof how CCOB weakens as region size increases. The graph plotsthe contrast nulling values for three subjects (black symbols; redtriangle is group mean; error bars, SEM) plotted as a function ofregion size. For the region size used in the present study, a nullingcontrast of 5.2% was required to counter the effects of brightnessfilling-in, whereas brightness filling-in was abolished well beforethe region size used in a previous study investigating the neuralcorrelates of the CCOB illusion (Perna et al., 2005).
Journal of Vision (2009) 9(12):14, 1–18 Anderson, Dakin, & Rees 10

brightness induced by the CCOB illusion versus single-unit electrophysiology may reflect the stronger correlationof BOLD activity with local field potentials than withspiking activity (Logothetis et al., 2001; Viswanathan &Freeman, 2007).Our findings raise the question of which particular
visual property is reflected in LGN responses. Althoughluminance remains constant across the CCOB as well asour two scrambled conditions (see luminance profiles inFigures 1A–1C), the induced contrast between regions inour CCOB stimulus is strongly modified (approximately5%) and falls well within the contrast sensitivity range ofthe human LGN measured using fMRI (Kastner et al.,2004). Neurons in the geniculostriate pathway primarilyrespond to luminance contrast within their receptive fields(Hubel & Wiesel, 1962) and changes in local contrast, inthe absence of any change to the local luminance,modulate LGN responses (Mante, Frazor, Bonin, Geisler,& Carandini, 2005). Indeed, Cornelissen et al. (2006)raised the possibility that V1 responses correlated tochanges in perceived surface lightness can be explainedby long-range contrast signals at the surface border ratherthan to the perceived surface lightness change. However, arecent fMRI study simultaneously (inversely) modulatedthe influence of border contrast and perceived lightnesswithin the same stimulus and showed that the fMRIBOLD signal in V1 correlates with perceived lightnessand not border contrast (Pereverzeva & Murray, 2008).Given the similar profile of activity we observed inExperiment 1 for the LGN and V1, it is likely that theLGN responses do indeed reflect perceived lightness.However, our findings do not resolve whether this reflectsprocessing within the LGN or arises at even earlier stagesof visual processing.The dependence of the CCOB effect on spatial scale
suggests a mechanism that involves the selective activationand/or deactivation of scale-sensitive neurons. Neurons inthe dorsal, parvocellular (P) layers of the LGN (layers 3–6)have small receptive fields with low contrast gain, whereasthe more ventral magnocellular (M) layers (layers 1–2)have much higher contrast gain and respond to verylow contrast stimuli (Sclar, Maunsell, & Lennie, 1990;Shapley, Kaplan, & Soodak, 1981). The greater contrastsensitivity of M cells has been attributed to their largerreceptive field size. Based on these neurophysiologicalfindings, the BOLD signal changes we recorded from theLGN (which were dependent on the integrity of low SFstructure) may reflect a dominant influence from M cells.This would be consistent with M cells primarily controllingcortical contrast response at low contrasts (e.g., Allison,Melzer, Ding, Bonds, & Casagrande, 2000).Although our behavioral and neuroimaging findings
converge to provide evidence in favor of a monocularorigin for the low-level component of the CCOB, they donot speak against an additional role for high-levelinformation. Such information can modify the magnitude
of the CCOB effect (Purves et al., 1999) and would likelybe mediated by cortical structures. Our novel dichopticversion of the CCOB stimulus demonstrated that present-ing the light and dark portions of the CCOB stimulus toeach eye separately significantly attenuates brightnessfilling-in. These findings establish that eye-specific signalsare necessary for the CCOB illusion but may not besufficient, and indeed, some residual nulling contrast wasrequired to negate the CCOB effect in this condition(Experiment 2).Our findings are consistent with the approach that visual
behavior is optimized for the statistical properties of thenatural environment (Corney & Lotto, 2007) and corrob-orate the predictions of a simple computational model(Dakin & Bex, 2003) suggesting a critical dependence ofthe CCOB effect on the integrity of weak low SFstructure. Interestingly, the magnitude of low SF boostingrequired to account for the effect is consistent with thevisual system effectively renormalizing the SF structure ofthe CCOB to conform to the statistics of natural scenes. Itis proposed that this renormalization results from contrastgain control designed to optimize the response of SF-tuned neurons to natural stimulation. Our present findingssuggest a central role for LGN in such gain control, asuggestion consistent with recent computational andelectrophysiological studies (Mante et al., 2005). Recast-ing the model in terms of neural reweighting (rather thanat the level of the whole image) would allow for modelingof more localized effects.If our results arise from reweighting of SF-tuned filter
responses, what evidence is there that cortical neurons arecapable of changing their tuning properties in response tonatural stimuli? Recently it has been reported that SFtuning properties of most neurons in primary visual cortexadapt very quickly to the spatial frequency structure ofnatural scenes (Sharpee et al., 2006). This can serve tomaximize information transmission by allowing neuronsto optimize their responses; e.g., neurons reduce theirsensitivity to low SF structure when exposed to naturalscenes (that over-represent such scales) so tending tonormalize their responses. It is easy to see how presenta-tion of the CCOB (which under-represents low SFs)would lead to boosting of low SF structure within such ascheme, and this is the shift in responsivity required forthe model outlined by Dakin and Bex (2003). Wetherefore speculate that the underlying mechanism forthe changes in SF tuning observed by Sharpee et al.(2006) is through SF selective changes in response gain ofneurons in the LGN and that it is essentially this gainchange that we see reflected in the fMRI signal.
Appendix A
Figures A1–A5.
Journal of Vision (2009) 9(12):14, 1–18 Anderson, Dakin, & Rees 11

Figure A1. (A) “CCOB.” Sample stimulus for condition A. Original CCOB illusion. Brightness filling-in occurs between adjacent regions.(B) “scramLo.” Sample stimulus for condition B. CCOB with low spatial frequencies phase scrambled, high spatial frequencies preserved.Brightness filling-in is abolished. (C) “scramHi.” Sample stimulus for condition C. CCOB with high spatial frequencies phase scrambled, lowspatial frequencies preserved. Brightness filling-in persists.
Journal of Vision (2009) 9(12):14, 1–18 Anderson, Dakin, & Rees 12

Figure A2. Localizing the primary visual areas. Meridian map for (A) right and (B) left visual cortices of two different participants. Redrepresents greater activity for horizontal meridian, green represents greater activity for vertical meridian. The border of V1 and V2 liesalong the vertical midline, the border of V2 and V3 lies along the horizontal midline. (C, D). Cortical activation produced by the annularstimuli used in the main experiment represented on the same flat maps of right and left visual cortices, for the two different participants(color coding: red represents greatest activity, blue represents lowest activity).
Journal of Vision (2009) 9(12):14, 1–18 Anderson, Dakin, & Rees 13

Figure A3. BOLD signals for V1, V2, and V3. BOLD contrast responses in (A) V1, (B) V2, and (C) V3, averaged across all 9participants, for all conditions compared to fixation baseline. Error bars represent the SEM for the group.
Journal of Vision (2009) 9(12):14, 1–18 Anderson, Dakin, & Rees 14

Figure A4. BOLD signals in response to high spatial frequencies. (A) BOLD signal changes measured in bilateral LGN in response toviewing images comprised of only the high SF component of the original CCOB stimulus, compared to fixation baseline. Mean signal change(TSEM) compared to fixation baseline across two participants is plotted. Viewing the high SFs only elicited significant LGN activity (t(1) =67.196, p G 0.001, one-tailed), confirming that the high SFs were indeed “visible” to LGN neurons. (B) BOLD signal changes were alsosignificant in V1 (t(1) = 6.266, p = 0.05, one-tailed), V2 (t(1) = 9.275, p = 0.034, one-tailed), and V3 (t(1) = 8.972, p = 0.036, one-tailed).Mean signal change (TSEM) compared to fixation baseline across two participants is plotted.
Figure A5. Effect of region size on strength of CCOB illusion. Illustration of the effect of region size on the CCOB illusion. For maximumeffect, the image should be viewed from a distance of approximately 10 cm. It is qualitatively apparent that the strength of brightness filling-in varies from left to right across the image. The illusion is highest for small region sizes (left side of the image) and gradually attenuates asregion size increases. The far right regions in this image are still much smaller than that used in a previous study investigating the neuralcorrelates of the CCOB illusion (Perna et al., 2005), which did not find BOLD signal modulation in V1 (see also Figure 5).
Journal of Vision (2009) 9(12):14, 1–18 Anderson, Dakin, & Rees 15

Acknowledgments
We would like to thank Peter Bex, Petroc Sumner, andBahador Bahrami for valuable advice on this manuscript.This work was supported by the Wellcome Trust.
Commercial relationships: none.Corresponding author: Elaine J. Anderson.Email: [email protected]: Wellcome Trust Centre for Neuroimaging,Institute of Neurology, University College London, 12Queen Square, London WC1N 3BG, UK.
Footnote
1Note that the missing fundamental illusion retainssufficient low SF information to drive the model giveninput filters with biologically plausible SF bandwidths.
References
Allison, J. D., Melzer, P., Ding, Y., Bonds, A. B., &Casagrande, V. A. (2000). Differential contributionsof magnocellular and parvocellular pathways to thecontrast response of neurons in bush baby primaryvisual cortex (V1). Visual Neuroscience, 17, 71–76.[PubMed]
Andrews, T. J., & Lotto, R. B. (2004). Fusion and rivalryare dependent on the perceptual meaning of visualstimuli. Current Biology, 14, 418–423. [PubMed]
Boucard, C. C., van Es, J. J., Maguire, R. P., &Cornelissen, F. W. (2005). Functional magneticresonance imaging of brightness induction in thehuman visual cortex. Neuroreport, 16, 1335–1338.[PubMed]
Boyaci, H., Fang, F., Murray, S. O., & Kersten, D. (2007).Responses to lightness variations in early humanvisual cortex. Current Biology, 17, 989–993.[PubMed] [Article]
Burr, D. C., & Morrone, M. C. (1994). The role of featuresin structuring visual images. Ciba Foundation Sym-posium, 184, 129–141; discussion 141–126, 269–171.[PubMed]
Cohen, M. A., & Grossberg, S. (1984). Neural dynamicsof brightness perception: Features, boundaries, diffu-sion, and resonance. Perception & Psychophysics, 36,428–456. [PubMed]
Cornelissen, F. W., Wade, A. R., Vladusich, T., Dougherty,R. F., & Wandell, B. A. (2006). No functionalmagnetic resonance imaging evidence for brightnessand color filling-in in early human visual cortex.
Journal of Neuroscience, 26, 3634–3641. [PubMed][Article]
Corney, D., & Lotto, R. B. (2007). What are lightnessillusions and why do we see them? PLoS ComputBiol, 3, 1790–1800. [PubMed] [Article]
Cornsweet, T. N. (1970). Visual perception. New York:Academic.
Craik, K. J. W. (1966). The nature of psychology: Aselection of papers, essays and other writings by thelate K. J. W. Craik. Cambridge: Cambridge UniversityPress.
Dakin, S. C., & Bex, P. J. (2003). Natural image statisticsmediate brightness “filling in”. Proceedings of Bio-logical Science, 270, 2341–2348. [PubMed] [Article]
Davidson, M., & Whiteside, J. A. (1971). Human bright-ness perception near sharp contours. Journal of theOptical Society of America, 61, 530–536. [PubMed]
Gerrits, H. J., & Vendrik, A. J. (1970). Simultaneouscontrast, filling-in process and information processingin man’s visual system. Experimental BrainResearch, 11, 411–430. [PubMed]
Grossberg, S. (1994). 3-D vision and figure–groundseparation by visual cortex. Perception & Psycho-physics, 55, 48–121. [PubMed]
Grossberg, S., & Todorovic, D. (1988). Neural dynamicsof 1-D and 2-D brightness perception: A unifiedmodel of classical and recent phenomena. Perception& Psychophysics, 43, 241–277. [PubMed]
Haynes, J. D., Deichmann, R., & Rees, G. (2005). Eye-specific effects of binocular rivalry in the humanlateral geniculate nucleus. Nature, 438, 496–499.[PubMed] [Article]
Haynes, J. D., Lotto, R. B., & Rees, G. (2004). Responsesof human visual cortex to uniform surfaces. Proceed-ings of the National Academy of Sciences of theUnited States of America, 101, 4286–4291. [PubMed][Article]
Huang, X., MacEvoy, S. P., & Paradiso, M. A. (2002).Perception of brightness and brightness illusions inthe macaque monkey. Journal of Neuroscience, 22,9618–9625. [PubMed] [Article]
Hubel, D. H., & Wiesel, T. N. (1962). Receptive fields,binocular interaction and functional architecture inthe cat’s visual cortex. The Journal of Physiology,160, 106–154. [PubMed] [Article]
Irvin, G. E., Casagrande, V. A., & Norton, T. T. (1993).Center/surround relationships of magnocellular, par-vocellular, and koniocellular relay cells in primatelateral geniculate nucleus. Visual Neuroscience, 10,363–373. [PubMed]
Jones, E. G. (1985). The thalamus. New York: Plenum.
Journal of Vision (2009) 9(12):14, 1–18 Anderson, Dakin, & Rees 16

Kastner, S., O’Connor, D. H., Fukui, M. M., Fehd, H. M.,Herwig, U., & Pinsk, M. A. (2004). Functionalimaging of the human lateral geniculate nucleus andpulvinar. Journal of Neurophysiology, 91, 438–448.[PubMed] [Article]
Kilavik, B. E., Silveira, L. C., & Kremers, J. (2007).Spatial receptive field properties of lateral geniculatecells in the owl monkey (Aotus azarae) at differentcontrasts: A comparative study. Europe Journal ofNeuroscience, 26, 992–1006. [PubMed]
Kingdom, F. A., & Simmons, D. R. (1998). The missing-fundamental illusion at isoluminance. Perception, 27,1451–1460. [PubMed]
Kinoshita, M., & Komatsu, H. (2001). Neural representa-tion of the luminance and brightness of a uniformsurface in the macaque primary visual cortex. Journalof Neurophysiology, 86, 2559–2570. [PubMed]
Knill, D. C., & Kersten, D. (1991). Apparent surfacecurvature affects lightness perception. Nature, 351,228–230. [PubMed]
Kremers, J., Silveira, L. C., & Kilavik, B. E. (2001).Influence of contrast on the responses of marmosetlateral geniculate cells to drifting gratings. Journal ofNeurophysiology, 85, 235–246. [PubMed] [Article]
Levitt, J. B., Schumer, R. A., Sherman, S. M., Spear,P. D., & Movshon, J. A. (2001). Visual responseproperties of neurons in the LGN of normally rearedand visually deprived macaque monkeys. Journal ofNeurophysiology, 85, 2111–2129. [PubMed] [Article]
Logothetis, N. K., Pauls, J., Augath, M., Trinath, T., &Oeltermann, A. (2001). Neurophysiological investi-gation of the basis of the fMRI signal. Nature, 412,150–157. [PubMed]
MacEvoy, S. P., Kim, W., & Paradiso, M. A. (1998).Integration of surface information in primary visualcortex. Nature Neuroscience, 1, 616–620. [PubMed]
Maddess, T., Davey, M. P., Srinivasan, M. V., & James,A. C. (1998). The Craik–O’Brien–Cornsweet effectand brightness induction both proceed by the spread-ing of brightness information. Australian and NewZealand Journal of Ophthalmology, 26, S95–S97.[PubMed]
Mante, V., Frazor, R. A., Bonin, V., Geisler, W. S., &Carandini, M. (2005). Independence of luminanceand contrast in natural scenes and in the early visualsystem. Nature Neuroscience, 8, 1690–1697.[PubMed]
O’Brien. (1958). Contour perception, illusion andreality. Journal of the Optical Society of America,48, 112–119.
Paradiso, M. A., & Nakayama, K. (1991). Brightnessperception and filling-in. Vision Research, 31,1221–1236. [PubMed]
Pereverzeva, M., & Murray, S. O. (2008). Neural activityin human V1 correlates with dynamic lightnessinduction. Journal of Vision, 8(15):8, 1–10, http://journalofvision.org/8/15/8/, doi:10.1167/8.15.8.[PubMed] [Article]
Perna, A., Tosetti, M., Montanaro, D., & Morrone, M. C.(2005). Neuronal mechanisms for illusory brightnessperception in humans. Neuron, 47, 645–651.[PubMed]
Pessoa, L., Mingolla, E., & Neumann, H. (1995). Acontrast- and luminance-driven multiscale networkmodel of brightness perception. Vision Research, 35,2201–2223. [PubMed]
Purves, D., Shimpi, A., & Lotto, R. B. (1999). Anempirical explanation of the Cornsweet effect. Jour-nal of Neuroscience, 19, 8542–8551. [PubMed][Article]
Roe, A. W., Lu, H. D., & Hung, C. P. (2005). Corticalprocessing of a brightness illusion. Proceedings of theNational Academy of Sciences of the United States ofAmerica, 102, 3869–3874. [PubMed] [Article]
Rossi, A. F., & Paradiso, M. A. (1999). Neural correlatesof perceived brightness in the retina, lateral genicu-late nucleus, and striate cortex. Journal of Neuro-science, 19, 6145–6156. [PubMed] [Article]
Rossi, A. F., Rittenhouse, C. D., & Paradiso, M. A.(1996). The representation of brightness in primaryvisual cortex. Science, 273, 1104–1107. [PubMed]
Rudd, M. E., & Arrington, K. F. (2001). Darkness filling-in: A neural model of darkness induction. VisionResearch, 41, 3649–3662. [PubMed]
Sclar, G., Maunsell, J. H., & Lennie, P. (1990). Coding ofimage contrast in central visual pathways of themacaque monkey. Vision Research, 30, 1–10.[PubMed]
Sereno, M. I., Dale, A. M., Reppas, J. B., Kwong, K. K.,Belliveau, J. W., Brady, T. J., et al. (1995). Borders ofmultiple visual areas in humans revealed by func-tional magnetic resonance imaging. Science, 268,889–893. [PubMed]
Shapley, R., Kaplan, E., & Soodak, R. (1981). Spatialsummation and contrast sensitivity of X and Y cellsin the lateral geniculate nucleus of the macaque.Nature, 292, 543–545. [PubMed]
Sharpee, T. O., Sugihara, H., Kurgansky, A. V., Rebrik,S. P., Stryker, M. P., & Miller, K. D. (2006). Adaptivefiltering enhances information transmission in visualcortex. Nature, 439, 936–942. [PubMed] [Article]
Shatz, C. J. (1996). Emergence of order in visual systemdevelopment. Proceedings of the National Academyof Sciences of the United States of America, 93,602–608. [PubMed] [Article]
Journal of Vision (2009) 9(12):14, 1–18 Anderson, Dakin, & Rees 17

Valberg, A., Lee, B. B., Tigwell, D. A., & Creutzfeldt,O. D. (1985). A simultaneous contrast effect of steadyremote surrounds on responses of cells in macaquelateral geniculate nucleus. Experimental BrainResearch, 58, 604–608. [PubMed]
Viswanathan, A., & Freeman, R. D. (2007). Neuro-metabolic coupling in cerebral cortex reflects synapticmore than spiking activity. Nature Neuroscience, 10,1308–1312. [PubMed]
Wachtler, T., & Wehrhahn, C. (1997). The Craik–O’Brien–Cornsweet illusion in colour: Quantitativecharacterisation and comparison with luminance.Perception, 26, 1423–1430. [PubMed]
White, M. (1979). A new effect of pattern on perceivedlightness. Perception, 8, 413–416. [PubMed]
Xu, X., Bonds, A. B., & Casagrande, V. A. (2002).Modeling receptive-field structure of koniocellular,magnocellular, and parvocellular LGN cells in theowl monkey (Aotus trivigatus). Visual Neuroscience,19, 703–711. [PubMed]
Xu, X., Ichida, J. M., Allison, J. D., Boyd, J. D., Bonds,A. B., & Casagrande, V. A. (2001). A comparisonof koniocellular, magnocellular and parvocellularreceptive field properties in the lateral geniculatenucleus of the owl monkey (Aotus trivirgatus). TheJournal of Physiology, 531, 203–218. [PubMed][Article]
Journal of Vision (2009) 9(12):14, 1–18 Anderson, Dakin, & Rees 18
Copyright © 2022 FDOKUMEN