Monitoring a high-amplitude delta Scuti star for 152 days: discovery of 12 additional modes and...
10
arXiv:1102.3085v1 [astro-ph.SR] 15 Feb 2011 Astronomy & Astrophysics manuscript no. ms16045 c ESO 2011 February 16, 2011 Monitoring a high–amplitude δ Sct star for 152 days: discovery of 12 additional modes and modulation effects in the light curve of CoRoT 101155310 ⋆, ⋆⋆ E. Poretti 1 , M. Rainer 1 , W.W. Weiss 2 , Zs. Bogn´ ar 3 , A. Moya 4 , E. Niemczura 5 , J.C. Su´ arez 6 , M. Auvergne 7 , A. Baglin 7 , F. Baudin 8 , J.M. Benk˝ o 3 , J. Debosscher 9 , R. Garrido 6 , L. Mantegazza 1 , and M. Papar´ o 3 1 INAF – Osservatorio Astronomico di Brera, Via E. Bianchi 46, 23807 Merate (LC), Italy e-mail: [email protected] 2 Institute of Astronomy, University of Vienna, T¨ urkenschanzstrasse 17, A-1180 Vienna, Austria 3 Konkoly Observatory, PO Box 67, 1525 Budapest, Hungary 4 Departamento de Astrof´ ısica, CAB (INTA-CSIC), PO Box 78, 28691 Villanueva de la Ca˜ nada, Madrid, Spain 5 Instituto de Astrof´ ısica de Andaluc´ ıa, Apartado 3004, 18080 Granada, Spain 6 Astronomical Institute of the Wroclaw University, ul. Kopenika 11, 51-622 Wroclaw, Poland 7 LESIA, Universit´ e Pierre et Marie Curie, Universit´ e Denis Diderot, Observatoire de Paris, 92195 Meudon, France 8 Institut d’Astrophysique Spatiale, CNRS, Universit´ e Paris XI UMR 8617, 91405 Orsay, France 9 Instituut Voor Sterrenkunde, Catholic University of Leuven, Celestijnenlaan 200D, 3001 Leuven, Belgium Received, accepted ABSTRACT Aims. The detection of small–amplitude nonradial modes in high-amplitude δ Sct (HADS) variables has been very elusive until at least five of them were detected in the light curve of V974 Oph obtained from ground–based observations. The combination of radial and nonradial modes has a high asteroseismic potential, thanks to the strong constraints we can put in the modelling. The continuous monitoring of ASAS 192647-0030.0≡CoRoT 101155310 (P=0.1258 d, V =13.4) ensured from space by the CoRoT (Convection, Rotation and planetary Transits) mission constitutes a unique opportunity to exploit such potential. Methods. The 22270 CoRoT measurements were performed in the chromatic mode. They span 152 d and cover 1208 consecutive cycles. After the correction for one jump and the long-term drift, the level of the noise turned out to be 29 μmag. The phase shifts and amplitude ratios of the coloured CoRoT data, the HARPS spectra, and the period-luminosity relation were used to determine a self–consistent physical model. In turn, it allowed us to model the oscillation spectrum, also giving feedback on the internal structure of the star. Results. In addition to the fundamental radial mode f 1 =7.949 d −1 with harmonics up to 10 f 1 , we detected 12 independent terms. Linear combinations were also found and the light curve was solved by means of 61 frequencies (smallest amplitude 0.10 mmag). The newest result is the detection of a periodic modulation of the f 1 mode (triplets at ±0.193 d −1 centred on f 1 and 2 f 1 ), discussed as a rotational effect or as an extension of the Blazhko effect to HADS stars. The physical model suggests that CoRoT 101155310 is an evolved star, with a slight subsolar metallic abundance, close to the terminal age main sequence. All the 12 additional terms are identified with mixed modes in the predicted overstable region. Key words. Stars: variables: δ Sct - stars: oscillations - stars: interiors - stars: individual: CoRoT 101155310 1. Introduction High–amplitude δ Sct (HADS) stars occupy the central part of the lower part of the instability strip between the horizontal branch and the main sequence (McNamara 2000). In the same region of the instability strip, low–amplitude δ Sct stars span a wider range of temperatures and luminosities. The phenomeno- ⋆ The CoRoT space mission was developed and is operated by the French space agency CNES, with the participation of ESA’s RSSD and Science Programmes, Austria, Belgium, Brazil, Germany, and Spain. This work uses ground–based spectroscopic observations made with the HARPS instrument at the 3.6m-ESO telescope (La Silla, Chile) under the ESO Large Programme LP182.D-0356 and complementary photometric measurements made at the Piszk´ estet˝ o Mountain Station of Konkoly Observatory (Hungary). ⋆⋆ Tables 1 and 2 are available in electronic form at the CDS via anonymous ftp to cdsarc.u-strasbg.fr (130.79.128.5) or via http://cdsweb.u-strasbg.fr/cgi-bin/qcat?J/A+A/vol/page logical separation is based on an amplitude limit of 0.20-0.30 mag, but actually it has never been considered as physically sig- nificant. Moreover, HADS stars could not be further considered mono– or double–mode radial pulsators after detecting addi- tional modes (Poretti 2003, and references therein). Their iden- tification as nonradial modes opened the possibility of consider- ing HADS stars as new tools for asteroseismic studies. Indeed, recent theoretical investigations (Su´ arez et al. 2006a, 2007) in- dicate that rotation effects may provide useful additional infor- mation on the mode identification, in particular for the nonra- dial modes rotationally coupled with the fundamental and first- overtone radial modes. That large amplitude modes could be identified radial allowed us to use HADS stars as distance indi- cators (Poretti et al. 2008; Garg et al. 2010). The most luminous HADS stars are just below the horizontal branch, and the debate whether the light curves of HADS stars could show similarities with those of RR Lyr stars is still open (Breger 2010).
-
Upload
independent -
Category
Documents
-
view
1 -
download
0
Transcript of Monitoring a high-amplitude delta Scuti star for 152 days: discovery of 12 additional modes and...

arX
iv:1
102.
3085
v1 [
astr
o-ph
.SR
] 15
Feb
201
1Astronomy & Astrophysicsmanuscript no. ms16045 c© ESO 2011February 16, 2011
Monitoring a high–amplitude δ Sct star for 152 days: discovery of12 additional modes and modulation effects in the light curv e of
CoRoT 101155310⋆, ⋆⋆
E. Poretti1, M. Rainer1, W.W. Weiss2, Zs. Bognar3, A. Moya4, E. Niemczura5, J.C. Suarez6, M. Auvergne7, A. Baglin7,F. Baudin8, J.M. Benko3, J. Debosscher9, R. Garrido6, L. Mantegazza1, and M. Paparo3
1 INAF – Osservatorio Astronomico di Brera, Via E. Bianchi 46,23807 Merate (LC), Italye-mail:[email protected]
2 Institute of Astronomy, University of Vienna, Turkenschanzstrasse 17, A-1180 Vienna, Austria3 Konkoly Observatory, PO Box 67, 1525 Budapest, Hungary4 Departamento de Astrofısica, CAB (INTA-CSIC), PO Box 78, 28691 Villanueva de la Canada, Madrid, Spain5 Instituto de Astrofısica de Andalucıa, Apartado 3004, 18080 Granada, Spain6 Astronomical Institute of the Wroclaw University, ul. Kopenika 11, 51-622 Wroclaw, Poland7 LESIA, Universite Pierre et Marie Curie, Universite Denis Diderot, Observatoire de Paris, 92195 Meudon, France8 Institut d’Astrophysique Spatiale, CNRS, Universite Paris XI UMR 8617, 91405 Orsay, France9 Instituut Voor Sterrenkunde, Catholic University of Leuven, Celestijnenlaan 200D, 3001 Leuven, Belgium
Received, accepted
ABSTRACT
Aims. The detection of small–amplitude nonradial modes in high-amplitudeδ Sct (HADS) variables has been very elusive until atleast five of them were detected in the light curve of V974 Oph obtained from ground–based observations. The combination of radialand nonradial modes has a high asteroseismic potential, thanks to the strong constraints we can put in the modelling. Thecontinuousmonitoring of ASAS 192647-0030.0≡CoRoT 101155310 (P=0.1258 d,V=13.4) ensured from space by the CoRoT (Convection,Rotation and planetary Transits) mission constitutes a unique opportunity to exploit such potential.Methods. The 22270 CoRoT measurements were performed in the chromatic mode. They span 152 d and cover 1208 consecutivecycles. After the correction for one jump and the long-term drift, the level of the noise turned out to be 29µmag. The phase shiftsand amplitude ratios of the coloured CoRoT data, the HARPS spectra, and the period-luminosity relation were used to determine aself–consistent physical model. In turn, it allowed us to model the oscillation spectrum, also giving feedback on the internal structureof the star.Results. In addition to the fundamental radial modef1=7.949 d−1 with harmonics up to 10f1, we detected 12 independent terms.Linear combinations were also found and the light curve was solved by means of 61 frequencies (smallest amplitude 0.10 mmag).The newest result is the detection of a periodic modulation of the f1 mode (triplets at±0.193 d−1 centred onf1 and 2f1), discussedas a rotational effect or as an extension of the Blazhko effect to HADS stars. The physical model suggests that CoRoT 101155310 isan evolved star, with a slight subsolar metallic abundance,close to the terminal age main sequence. All the 12 additional terms areidentified with mixed modes in the predicted overstable region.
Key words. Stars: variables:δ Sct - stars: oscillations - stars: interiors - stars: individual: CoRoT 101155310
1. Introduction
High–amplitudeδ Sct (HADS) stars occupy the central partof the lower part of the instability strip between the horizontalbranch and the main sequence (McNamara 2000). In the sameregion of the instability strip, low–amplitudeδ Sct stars span awider range of temperatures and luminosities. The phenomeno-
⋆ The CoRoT space mission was developed and is operated by theFrench space agency CNES, with the participation of ESA’s RSSD andScience Programmes, Austria, Belgium, Brazil, Germany, and Spain.This work uses ground–based spectroscopic observations made withthe HARPS instrument at the 3.6m-ESO telescope (La Silla, Chile)under the ESO Large Programme LP182.D-0356 and complementaryphotometric measurements made at the Piszkesteto Mountain Stationof Konkoly Observatory (Hungary).⋆⋆ Tables 1 and 2 are available in electronic form at the CDSvia anonymous ftp to cdsarc.u-strasbg.fr (130.79.128.5) or viahttp://cdsweb.u-strasbg.fr/cgi-bin/qcat?J/A+A/vol/page
logical separation is based on an amplitude limit of 0.20-0.30mag, but actually it has never been considered as physicallysig-nificant. Moreover, HADS stars could not be further consideredmono– or double–mode radial pulsators after detecting addi-tional modes (Poretti 2003, and references therein). Theiriden-tification as nonradial modes opened the possibility of consider-ing HADS stars as new tools for asteroseismic studies. Indeed,recent theoretical investigations (Suarez et al. 2006a, 2007) in-dicate that rotation effects may provide useful additional infor-mation on the mode identification, in particular for the nonra-dial modes rotationally coupled with the fundamental and first-overtone radial modes. That large amplitude modes could beidentified radial allowed us to use HADS stars as distance indi-cators (Poretti et al. 2008; Garg et al. 2010). The most luminousHADS stars are just below the horizontal branch, and the debatewhether the light curves of HADS stars could show similaritieswith those of RR Lyr stars is still open (Breger 2010).

2 Poretti et al.: Nonradial modes and modulation effects in CoRoT 101155310
A great improvement in the observational techniques anddata quality was needed to investigate both the pulsationalcon-tent and the behaviour of the predominant radial modes. Thisopportunity could only be offered by a space mission.
2. The CoRoT data
The variability of the 13th–mag star located atα =19h 26m 47.s25, δ = –00◦ 30′ 01.′′44 (J2000) was discovered dur-ing the ASAS survey (All Sky Automated Survey; Pojmanski2000). The star is named 192647-0030.0 and classified asa δ Sct variable withP=0.1258 d in the ASAS catalogue(http://www.astrouw.edu.pl/asas/). This part of sky,i.e., the equatorial plane not far from the galactic centre,is well within one of the “eyes” of the CoRoT space mis-sion (COnvection, ROtation and planetary Transits; Baglinet al.2006; Auvergne et al. 2009). The inclusion of ASAS 192647-0030.0 in the exoplanetary field of the first long run inthe direction of the galactic centre (LRc01) was done aftersearching the catalogue compiled by Benko & Csubry (2007).Therefore, we specifically requested the CoRoT monitoring ofASAS 192647-0030.0 as part of the Additional Programmes(Weiss 2006). In the CoRoT database the star was namedCoRoT 101155310≡USNOA2 0825-15821309 (V=13.43,B −V=+0.60, V − R=0.21; Deleuil et al. 2009). There is norelevant contamination from nearby stars, since the bright-est star included in the CoRoT mask is 2.9 mag fainterthan CoRoT 101155310 inV light (Deleuil et al. 2009). The“CoRoT Variability Classifier” automated supervised method(Debosscher et al. 2009) classified it as an RR Lyr star onlyon the basis of the Fourier parameters. Since some overlap ispresent with the HADS stars in this parameter space (Poretti2001), the classification system has been consequently revisedto better separate RR Lyr from HADS stars.
The LRc01 started on May 15, 2007 and finished 152 dlater, on October 14, 2007. This means that CoRoT 101155310was monitored for 1208 consecutive cycles. The exposure timein the CoRoT exoplanetary channel was 512 s. This value re-mained constant over the long run, since no regular feature sug-gesting planetary transit was noticed. The Heliocentric JulianDates (HJD) were reported to the times at half exposure. Thevery high duty cycle allowed us to collect 25597 datapoints.CoRoT 101155310 was observed in the chromatic mode, bymeans of a bi–prism located in the focal block of the instru-ment, between the dioptric objective and the plane of the de-tectors (Barge et al. 2006). The image is a small, low–resolutionspectrum whose area is about 300 arcsec2 on the sky. The pho-tometry is performed in three different colours, roughly red (rC),green (gC), and blue (bC), to supply a tool able to distinguishbetween planetary transits (colour independent) and stellar ac-tivity (changing with the wavelength). The white light, i.e., thesum of the three contributions, is more suitable for signal detec-tion thanks to its larger number of counts. CoRoT 101155310was also observed with the 1.0 m telescope of the KonkolyObservatory at the the Piszkesteto Mountain Station (Hungary)on two nights in June 2009. CCD photometry with standardBVIfilters was planned to compare the amplitudes in the CoRoTpassbands with those in standard ones. The 88 measurementsin each filter cover one complete pulsational cycle, and we couldalso determine one time of maximum brightness.
The CoRoT measurements are a sort of absolute photometry,since the measured flux is not corrected with respect to any ref-erence source or star. Therefore, instrumental changes anddriftshave a direct influence on it, on both short- and long-term scales.
Different detrending algorithms can be used, based on movingmeans or polynomial fits. After several trials, we were more sat-isfied by an approach based on a preliminary frequency analy-sis. Indeed, the main frequencyf1=7.949 d−1 and other high–amplitude terms were immediately detected in the raw data. Wecalculated the least–squares fit of the raw data by using a prelimi-nary solution based on the terms with the largest amplitudes. Theresiduals in white light (Fig. 1, upper panel) show a long–termdrift and more rapid and apparently irregular changes aroundJD 2454253 and 2454267. Moreover, in the second half of theobservations the distribution of the outliers strongly changedand many points appeared well below the others. This so-called“rain” of points from the middle strip has an instrumental ori-gin because it is observed in other stars belonging to the samepointing. To correct the irregular behaviour of the mean mag-nitude we calculated the least–squares fits on four consecutivecycles. These fits returned the 302 values of the mean magni-tudes (Fig. 1, upper curve in the middle panel), which mimicsthetrend of the residuals. The standard deviations of the 302 solu-tions range from 0.004 to 0.016 mag. To remove the instrumentalvariations, we interpolated the values of the mean magnitudes atthe time of each individual measurement of CoRoT 101155310and then subtracted it.
After that, we recalculated the least–squares fits on the 302bins and obtained very homogeneous values of the mean magni-tudes (Fig. 1, lower curve in the middle panel). By applying thisprocedure we also removed any oscillation around 0.5 d, but aswe see later (Sect. 3.4) this did not have a strong impact on oursolution. At this stage we also removed the outliers. A post–factoanalysis of the raw and the cleaned datasets showed that the fre-quency content of the two timeseries is the same. The bottompanel of Fig. 1 shows an example of the excellent quality of thefinal timeseries and also allows us to appeciate the continuousCoRoT monitoring.
The same technique was applied to the coloured data. Thetrend inrC light is roughly the same as in white light (top panelof Fig. 1), since the total flux in this light (about 182000 adu) ismuch greater than ofgC (about 22600 adu) andbC (about 32300adu). The main difference is in the decline after JD 2454310,which is sharper inrC light than in white light. Actually, thefluxes observed in thegC andbC light increased after this date,and what we measured in white light is the total flux variation.This changeover concerns those days when the “rain” effect ap-peared, and it is very probably a jitter effect through the photo-metric mask of CoRoT 101155310.
3. The frequency content
The frequency analyses were performed on different versions ofthe CoRoT timeseries (raw data, detrended data, coloured data,with and without outliers, etc.) and they supplied very simi-lar results. The main change is in the level of the noise andconsequently in the threshold for the significance of the peaks.Therefore, for the sake of clarity, we discuss here the detectionperformed in white light. The frequency values were firstly ob-tained by means of the iterative sine–wave, least–squares fittingmethod (Vanicek 1971) and then refined by the MTRAP algo-rithm (Carpino et al. 1987), both at intermediate stages andatthe end of the whole analysis.
The level of the noise in the final timeseries (22270 data-points in white light) is 29µmag in the 0-100 d−1 region. Thelong–term drift left a slightly higher noise in the 0-5 d−1 region,namely 41µmag. We accepted 61 peaks as having a stellarorigin, i.e., not counting the orbital frequency of the satellite

Poretti et al.: Nonradial modes and modulation effects in CoRoT 101155310 3
Fig. 1. Top panel:curve of the residuals (a preliminary solution wassubtracted from the original data) showing the long– and short–terminstrumental effects.Middle panel:behaviour of the mean magnitudesbefore (upper curve) and after (lower curve) the removal of the instru-mental effects shown in the upper panel. Each bin spans four pulsationalcycles.Bottom panel:the example extracted from the final timeseriesof CoRoT 101155310 shows the continuous monitoring obtained fromspace by CoRoT.
forb=13.97 d−1, the sidereal frequencyfsid=1.0027 d−1, and theirharmonics and combinations. To do that, we firstly consideredthe peaks with an amplitude greater than 0.12 mmag, i.e., witha signal–to–noise ratio (SNR) above 4.0. Then, we noted thatseveral combination terms (harmonics and coupling terms) werealso detected below this limit. Therefore, we relaxed the min-imum amplitude to 0.10 mmag, i.e., 3.5 times the noise level.Some combination terms (e.g.,f1+ f2+ f3, 4f1- f4, 3f1+ f5) arejust below the acceptance threshold.
Figure 2 shows the steps in the solution of the CoRoT lightcurve of CoRoT 101155310, which led to the detection of fourcategories of frequencies:
1. the predominant termf1 and its harmonics;2. the independent terms, fromf2 to f13;3. the modulation termfm of the termf1;4. the combination terms.
The parameters of the least–squares solution (cosine series)based on the 61 frequencies thus detected are listed in Table1.The residual rms is 0.0027 mag. The values of the har-monics and combination terms were obtained from the val-ues of the independent frequencies and from the modula-tion frequency fm=0.1933 d−1, for which formal errorbars(Montgomery & O’Donoghue 1999) are given between brack-ets. This “locked” solution was calculated by means of theMTRAP algorithm (Carpino et al. 1987). The residual spectrum(Fig. 2, panele) shows some peaks at the values of the linearcombinations offorb=13.97 d−1 and fsid=1.0027 d−1. These spu-rious peaks are due to the passage of the satellite over the SouthAtlantic Anomaly, which occurred twice daily. The environmen-
Fig. 2. Subsequent steps in the detection of frequencies in the ampli-tude spectra of CoRoT 101155310.
tal conditions (e.g., the effects of the eclipses on the electronicsunits, the eclipse durations, the difference in the Earth’s albedoof the overflown regions; Auvergne et al. 2009) are affecting theCoRoT photometry in such a complicated way that, as in the caseof CoRoT 101128793 (Poretti et al. 2010), the usual techniqueof prewhitening was not able to clean the data in a satisfactoryway.
3.1. The f1 term and its harmonics
The peaks atf1=7.949 d−1, 2f1, and 3f1 clearly stand out in theamplitude spectrum of the original data (Fig. 2, panela). Thespectral window is free of any relevant alias structure, thehigh-est peak being at the power level of 0.005 (see the inserted box).We detected harmonics up to 10f1 in the CoRoT light curve, i.e.,about twice those detected in ground–based timeseries. Since theamplitude of harmonics is monotonically decreasing, the lightcurve is smoothed (Fig. 3, upper panel), without the bumps ob-served in RR Lyr stars, both monoperiodic (Poretti 2001) andmultiperiodic (Chadid et al. 2010; Poretti et al. 2010).
The Fourier parameters (φ21 = 4.19 rad, φ31 = 2.04rad, φ41 = −0.27 rad, andR21 = 0.38) are in excellentagreement with those calculated from the OGLE light curvesof HADS stars (Poretti 2001). These parameters suggest thatCoRoT 101155310 is pulsating in the fundamental radial mode.
We calculated the times of the maximum brightness byfitting the measurements of the well–covered cycles witha cubic spline. In such a way we could determine 1090times of maxima (Table 2) and in turn the ephemerisMax = HJD 2454236.7014 +0.12579931· E
±0.0001 ±0.00000011by means of a least–squares line. The O-C values (differencesbetween the observed and calculated times of maxima, alsolisted in Table 2) were determined by using this ephemeris.The CCD BVI measurements performed at the Piszkesteto

4 Poretti et al.: Nonradial modes and modulation effects in CoRoT 101155310
Table 1. Identification, frequencies, Fourier amplitudes, and phases (T0=HJD 2454236.7502) of the terms detected in the data ofCoRoT 101155310 (22270 datapoints).
ID Frequency Amplitude Phase ID Frequency Amplitude Phase f1/ fi[d−1] [mag] [0,2π] [d−1] [mag] [0,2π]
Main frequency and harmonics Additional terms identified asindependent modes
f1 7.949172(1) 0.137632(26) 5.3775(2) f2 10.847014(015) 0.006224(26) 6.0785(0041) 0.7332 f1 15.898343 0.041859 2.3933 f3 10.479540(016) 0.005689(26) 5.8511(0045) 0.7593 f1 23.847515 0.014404 5.6197 f4 10.690302(030) 0.003076(26) 5.8388(0083) 0.7444 f1 31.796687 0.004433 2.4116 f5 9.532648(075) 0.001230(26) 3.1547(0208) 0.8345 f1 39.745859 0.002146 5.4146 f6 13.175878(147) 0.000629(26) 1.1226(0407) 0.6036 f1 47.695030 0.001150 2.2493 f7 9.796144(340) 0.000273(26) 5.7221(0937) 0.8117 f1 55.644203 0.000552 5.3327 f9 10.203291(385) 0.000241(26) 4.1313(1062) 0.7798 f1 63.593373 0.000317 2.3551 f8 8.232572(450) 0.000206(26) 0.2385(1242) 0.9669 f1 71.542544 0.000130 5.3127 f10 12.635143(455) 0.000204(26) 0.0702(1254) 0.62910f1 79.491717 0.000100 2.6673 f11 13.224629(504) 0.000184(26) 3.3973(1391) 0.601
f12 9.325259(549) 0.000169(26) 5.2843(1514) 0.852f13 8.354265(672) 0.000138(26) 1.0701(1854) 0.952
Modulation terms withfm=0.1933 d−1 Linear combinations betweenf1 and f2f1 − fm 7.755895 0.000194 0.1805 f1 + f2 18.796186 0.002261 2.2225f1 + fm 8.142448 0.000145 1.9766 f2 − f1 2.897843 0.001524 3.6718
2 f1 − fm 15.705067 0.000131 2.5886 2f1 + f2 26.745358 0.001323 5.55012 f1 + fm 16.091183 0.000106 4.5329 2f1 − f2 5.051329 0.000814 5.5587
3 f1 + f2 34.694529 0.000687 2.4496Linear combinations betweenf1 and f3 3 f1 − f2 13.000501 0.000219 2.8031
4 f1 + f2 42.643701 0.000344 5.5241f1 + f3 18.428712 0.002247 2.1349 5f1 + f2 50.592873 0.000213 2.6688f3 − f1 2.530368 0.001398 3.4160 5f1 − f2 28.898844 0.000131 4.2861
2 f 1+ f3 26.377884 0.001104 5.3307 6f1 + f2 58.542046 0.000144 5.59072 f 1− f3 5.418803 0.000781 5.80363 f 1+ f3 34.327056 0.000615 2.2546 Linear combinations betweenf1 and f53 f 1− f3 13.367975 0.000169 2.78574 f 1+ f3 42.276226 0.000303 5.3800 f1 + f5 17.481819 0.000322 5.64025 f 1+ f3 50.225399 0.000199 2.2301 f5 − f1 1.583476 0.000145 0.5953
2 f1 + f5 25.430991 0.000139 2.4076
Linear combinations betweenf1 and f4 Linear combinations betweenf1 and f6
2 f4 21.380604 0.000164 2.8776 f1 + f6 21.125050 0.000217 3.6347f 1+ f4 18.639474 0.001137 2.0182 f6 − f1 5.226706 0.000141 4.2040f4 − f1 2.741130 0.000813 3.4594 2f1 + f6 29.074221 0.000153 0.1586
2 f1 + f4 26.588646 0.000620 5.3297 2f1 − f6 2.722466 0.000135 5.23152 f1 − f4 5.208042 0.000479 5.62893 f1 + f4 34.537817 0.000309 2.1560 Linear combinations betweenf2 and f33 f1 − f4 13.157213 0.000127 2.60594 f1 + f4 42.486989 0.000121 5.4129 f2 + f3 21.326554 0.000194 3.31955 f1 + f4 50.436162 0.000105 2.3231
Observatory in 2009 provide an excellent validation. The max-imum in I light was observed at HJD 2455011.4997 whenthe above ephemeris predicts HJD 2455011.4994±0.0007 forE=6159. The light curve of this maximum is flatter than thoseof the B and V curves, whose maxima were observed atHJD 2455011.4933 and HJD 2455011.4910, respectively.
3.2. The independent terms
Twelve independent frequencies were found in the interval 8.23–13.22 d−1, i.e., at periods shorter than that of the fundamentalradial modef1 (Table 1). These additional modes could not bedetected in the ASAS timeseries since the level of the noise ismuch higher (0.020 and 0.025 mag inV andI , respectively) thantheir amplitudes (0.006 mag or less).
A close, but non–equidistant triplet of frequencies( f2=10.48, f3=10.69, and f4=10.85 d−1, Fig. 2, panel b)appears at an amplitude level similar to that of 4f1, i.e., in the3.0-6.2 mmag range. Is CoRoT 101155310 a double–modeHADS star? The frequency ratio between the fundamentaland first overtone modes in HADS stars is well constrainedin the 0.771–0.774 interval (see Table 2 and Fig. 4 inPoretti et al. 2005). In turn, this implies that the first overtone ofCoRoT 101155310 is expected in the interval 10.27–10.31 d−1.None of the terms of the triplet matches this value and so thetriplet is composed of nonradial modes.
The amplitude off4 is half that of f3, and this ratio is alsomaintained for f5, f6 (Fig. 2, panelb), and f7. After f7 (am-plitude 0.27 mmag), the amplitude of the subsequent terms isslightly decreasing and we detected four other modes (f8, f9, f10,

Poretti et al.: Nonradial modes and modulation effects in CoRoT 101155310 5
Fig. 3. Top panel:the CoRoT data folded with the main pulsationalfrequencyf1 (upper curve) and the residuals after prewhitening of the61 frequencies (lower curve).Bottom panel:amplitudes of thef1 termcalculated from measurements spanning four consecutive pulsationalcycles.
and f11) in less than 0.10 mmag (Fig. 2, panelc). Still, no reg-ular separation is observed among these peaks. More generally,we did not find the same separation between two terms fromf1to f13. Regarding the identification of the first radial overtone,the f9 term provides the ratio closest to the expected one, but itappears too discrepant (see also Sect. 6).
3.3. The modulation of the f1 component
The side peaks off1 (7.7559 and 8.1424 d−1; Fig. 2, paneld) and2 f1 (15.7051 and 16.0912 d−1) are the most surprising featuresin the amplitude spectrum of CoRoT 101155310. They form anequidistant triplet with a frequency separationfm=0.193 d−1. Inpractice, this triplet is the signature of a modulation of the maincomponentf1. The amplitudes of the modulation terms are muchsmaller than those of the independent terms discussed above.This hampers any direct detection of the periodicity in the O–Cor the magnitude-at-maximum diagrams, since the effects of theindependent modes mask those of the modulation, also takingthe long (512 s) CoRoT exposures into account. The residualsignal left aroundf1 (noted as “Long term” in Fig. 2, paneld)will be discussed in Sect. 7.2.
The two frequenciesf12=9.325 and f13=8.354 d−1 areclose, but not coincident, to the combination termsf5–fm=9.340 d−1 and f1+2 fm=8.335 d−1. The hypothesis that theyare actually combination terms implies anfm value significantlydifferent from 0.193 d−1 (0.208 and 0.202 d−1, respectively).Therefore, we should admit that the modulation is not the sameor that these two frequencies are independent modes. Since theoccurrence of a combination term such asf5– fm is quite unusualwe prefer the latter explanation.
Fig. 4. Phase shifts and amplitude ratios of the frequencies fromf1 tof6 as obtained from CoRoT coloured timeseries.
3.4. The combination terms
The amplitude spectrum of CoRoT 101155310 is also rich incombination terms (Fig. 2, panelb), as expected from the am-plitude of the independent terms fromf1 to f5, greater than1 mmag. The terms involving differences were also detected, andthe lowest frequency isf5− f1=1.58 d−1. We can argue that thebin on four pulsational cycles (i.e., 0.5 d) did not hamper detec-tion of peaks below 2 d−1, if any. Patterns of combination termswith the harmonics up to 5f1 are detected betweenf1 and f2, f1and f3, f1 and f4, up to 2f1 with f5 and f6. Only four frequencies(3 f1− f2=13.00 d−1, 3f1− f3=13.37 d−1, 3f1− f4=13.16 d−1, andf1+ f5=17.48 d−1) are within the interval 7-18 d−1. We consid-ered them as combination terms rather than independent modes,since they follow the patterns described above closely (seealsoTable 1). We also detected the termf2+ f3, i.e., the one involvingthe additional terms with the largest amplitudes. The modulationdoes not affect the combination terms; i.e., we did not detect anyterm having the formf1± fm± fi .
4. The fit of the light curves in the different CoRoTpassbands
Calculation of the phase differences and amplitude ratios in dif-ferent passbands could allow the mode identification (Garrido2000). Unfortunately, the CoRoT photometric system is not awell–defined one, depending on the star itself (see Sect. 7 inBarge et al. 2006). To perform a comparative procedure, we cal-culated the least–squares fits of the coloured CoRoT andBVIKonkoly timeseries. The full amplitudes of the light variations ofCoRoT 101155310 are 0.432, 0.385, and 0.273 mag in thebC,gC, andrC CoRoT passbands and 0.459, 0.367, and 0.215 mag intheBVI filters, respectively. Therefore, thebC andgC passbandsare not separated well since both are between theB andV ones,while thebC andrC passbands are both a little redshifted withrespect to theB andV ones. We plotted the phase shiftφb−r − φrvs. the amplitude ratioAb−r/Ar . The position of the modef1 isvery far from those of the modesf2− f6, all clustering in a narrowregion (Fig. 4). Positive values of the phase differences suggestℓ = 0 (i.e., radial) modes, negative values are likelyℓ ≥ 1 (i.e.,nonradial) modes (Watson 1988). Moreover, we can see verygood agreement between the observed positions of the modesf2− f6 and the theoretical locus of theℓ=2 modes (see Fig. 18in Watson 1988). The identification of these frequencies withthe ℓ=2 modes must be considered as only preliminary, due tothe uncertainties in the characteristics of the CoRoT photomet-ric system.

6 Poretti et al.: Nonradial modes and modulation effects in CoRoT 101155310
The phase errorbars associated tof6 are already too largeto clearly point out the mode identification, and this becomesimpossible for the frequencies fromf7 to f13. In particular, wecannot obtain clues on the identification off9 as the first radialovertone.
5. The stellar physical parameters
The spectrum of CoRoT 101155310 was obtained with theHARPS instrument mounted at the 3.6-m ESO telescope on thenights of 29-30 June 2009. Due to the star’s faintness and theshort periods, the resulting SNR value was around 30 (R=80000,exposure time 2300 s), and we could use the spectrum to esti-mate the physical parameters only.
The mean line profile was computed with the LSD software(Donati et al. 1997) and the Fourier transform of such profilesuppliedVeqsini=26±1 km s−1. However, this determination isaffected by the broadening owing to the radial pulsation of thef1 mode. Since we do not know the amplitude of the radial ve-locity curve of CoRoT 101155310, we estimated it by using the2K/∆V value. For radial pulsation it is around 100 km s−1 mag−1
(Smith 1982; Poretti & Antonello 1988), the highest value wasprobably measured for V356 Aur (Poretti et al. 1987), i.e.,130 km s−1 mag−1. Since ∆V = 0.37 mag in the case ofCoRoT 101155310, we got 2K=37 km s−1 and 48 km s−1, re-spectively. We also estimated the 2K value in the specific caseof CoRoT 101155310, obtaining 2K=12 km s−1 using the theo-retical approach described by Moya & Rodrıguez-Lopez (2010).The ephemeris determined in Sect. 3.1 allowed us to establishthat the HARPS spectrum started after the maximum light andended around the halfway point of the descending branch. Inthis interval the radial velocity due to pulsation is getting closeto zero after its maximum value. We evaluated the effects ofboth the radial pulsation and the exposure time on the mean lineprofile by using the software package FAMIAS (Zima 2006).Our simulations indicated that the 2K values determined abovecould produce a maximum broadening of 5 km s−1 in the de-termination of theVeqsini value. By combining all these re-sults, we accepted 23± 4 km s−1 as the value of theVeqsiniof CoRoT 101155310.
We computed a grid of synthetic spectra with theR=80000resolution and the observed line broadening by means ofthe ATLAS9 and SYNTHE codes (Kurucz 1993; Heiter et al.2002). The grid covers the ranges 7000< Teff <8000 K, 3.2<logg <4.8, and –0.5<[Fe/H]<1.0. A microturbulent velocity of2 km s−1 (Gray et al. 2001) was considered. We compared theobserved spectra with the synthetic grid in chosen wavelengthregions in order to estimate the physical parameters of the star:the Hα and Hβ wings for Teff and the Mg triplet (5167, 5173,and 5184 Å) for logg. We obtained finallyTeff = 7300−300
+200 Kand logg = 3.75± 0.20 dex. These values were then used fora complete abundance analysis (see Sect. 4.2 in Poretti et al.2009), which revealed a slight metallic solar underabundance,i.e., [Fe/H]=–0.15±0.20 dex ([Fe/H]⊙=7.54 dex; Asplund et al.2009).
Identifying the fundamental radial mode allows us to cal-culate the absolute magnitude. We getMV=1.46±0.10 by us-ing the period–luminosity relation given by Poretti et al. (2008).Other relations give similar results for logP = −0.900 (seeFig. 8, ibidem). The valuesMV=1.46 andTeff = 7300K putsCoRoT 101155310 in the middle of the HADS instability strip(see Fig. 2 in McNamara 2000).
Table 3. Observed and physical parameters ofCoRoT 101155310 determined in this paper.
Parameter Value Parameter Value
< V > 13.37 Teffb 7300−300
+200 K< B > 13.94 logg 3.75±0.20EB−V +0.20 [Fe/H] c –0.15±0.20 dexKa 12.11 Veq sini 23±4 km s−1
(V − K)0 +0.70 L 19.8±1.8L⊙Pfund 0.1258 d R 2.8±0.4R⊙MV 1.46±0.10 Md 1.71±0.02M⊙Mbol 1.49±0.10 Aged 1485±10 Myr
a From Skrutskie et al. (2006)b Pulsational models suggestTeff=7000±50 Kc Pulsational models suggest [Fe/H]=–0.30±0.20 dexd Values from pulsational models
The approach described by Breger & Bregman (1975) sup-plied the relation
logQ = −6.456+ logP+ 0.5 logg+ 0.1Mbol + logTeff . (1)
We know thatP=0.126 d from the CoRoT observations and thatQ=0.033 d from the identification ofP as the fundamental ra-dial mode. Since the bolometric correction is+0.03 mag forTeff = 7300 K (Torres 2010), we obtainMbol=1.49±0.10 andL = 19.8 ± 1.8L⊙ from the MV=1.46 value calculated above.The unknownsg andTeff must therefore satisfy the condition
logg+ 2.0 logTeff = 11.45(±0.01). (2)
This condition holds for the central values of logg andTeff ob-tained from HARPS spectra and proves the self–consistencyof the physical model. We can then calculate the radiusR =2.8± 0.4 R⊙ and the massM = 1.6± 0.7 M⊙ from theL, Teff ,and logg values.
We further checked the consistency of the physical modelby combining ourBV photometry with the 2MASS photom-etry. The meanBV magnitudes are< V >=13.37 and<B >=13.94. These values are in good agreement with thoseprovided by the EXODAT catalogue (V=13.43,B − V=+0.60;Deleuil et al. 2009). Indeed, the epoch of the EXODAT obser-vations corresponds to the phase 0.23 p, i.e., roughly the mid-dle of the descending branch (Fig. 3). We calculated the equiv-alent widths (EWs) of the NaI lines at 5890.0 and 5895.9Åfrom the HARPS spectrum. We could estimate the interstellarreddeningEB−V=+0.20 by means of theEB−V−EW relation-ship (Munari & Zwitter 1997), also noticing that the interstellarlines are characterized by multiple components, one of whichis in emission. In turn, theEV−K=+0.56 value was calculatedusing the relation given by Cardelli et al. (1989), hence (V −K)0=+0.70 from the 2MASS valueK=12.11 (Skrutskie et al.2006). The latter index supplies aTeff value of 7250 K (Eq. 8 inMasana et al. 2006), in perfect agreement with the one providedby spectroscopy. Table 3 lists the physical parameters obtainedfrom space–based photometry and ground–based spectroscopy.
6. Pulsational model and mode identification
The parameters obtained from CoRoT photometry and HARPSspectroscopy were used to calculate a preliminary pulsationalmodel, making certain to match the constraint thatf1 must be
Poretti et al.: Nonradial modes and modulation effects in CoRoT 101155310 7
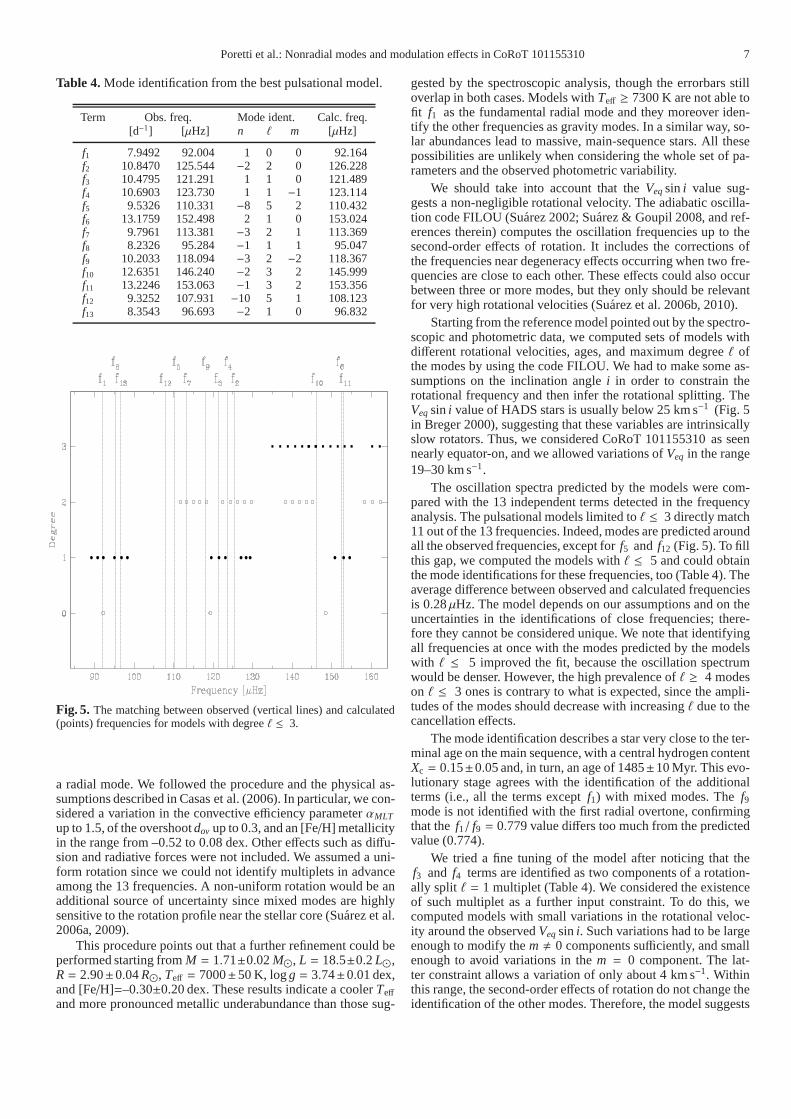
Table 4. Mode identification from the best pulsational model.
Term Obs. freq. Mode ident. Calc. freq.[d−1] [µHz] n ℓ m [µHz]
f1 7.9492 92.004 1 0 0 92.164f2 10.8470 125.544 −2 2 0 126.228f3 10.4795 121.291 1 1 0 121.489f4 10.6903 123.730 1 1 −1 123.114f5 9.5326 110.331 −8 5 2 110.432f6 13.1759 152.498 2 1 0 153.024f7 9.7961 113.381 −3 2 1 113.369f8 8.2326 95.284 −1 1 1 95.047f9 10.2033 118.094 −3 2 −2 118.367f10 12.6351 146.240 −2 3 2 145.999f11 13.2246 153.063 −1 3 2 153.356f12 9.3252 107.931 −10 5 1 108.123f13 8.3543 96.693 −2 1 0 96.832
Fig. 5. The matching between observed (vertical lines) and calculated(points) frequencies for models with degreeℓ ≤ 3.
a radial mode. We followed the procedure and the physical as-sumptions described in Casas et al. (2006). In particular, we con-sidered a variation in the convective efficiency parameterαMLT
up to 1.5, of the overshootdov up to 0.3, and an [Fe/H] metallicityin the range from –0.52 to 0.08 dex. Other effects such as diffu-sion and radiative forces were not included. We assumed a uni-form rotation since we could not identify multiplets in advanceamong the 13 frequencies. A non-uniform rotation would be anadditional source of uncertainty since mixed modes are highlysensitive to the rotation profile near the stellar core (Suarez et al.2006a, 2009).
This procedure points out that a further refinement could beperformed starting fromM = 1.71±0.02M⊙, L = 18.5±0.2L⊙,R= 2.90±0.04R⊙, Teff = 7000±50 K, logg = 3.74±0.01 dex,and [Fe/H]=–0.30±0.20 dex. These results indicate a coolerTeffand more pronounced metallic underabundance than those sug-
gested by the spectroscopic analysis, though the errorbarsstilloverlap in both cases. Models withTeff ≥ 7300 K are not able tofit f1 as the fundamental radial mode and they moreover iden-tify the other frequencies as gravity modes. In a similar way, so-lar abundances lead to massive, main-sequence stars. All thesepossibilities are unlikely when considering the whole set of pa-rameters and the observed photometric variability.
We should take into account that theVeqsini value sug-gests a non-negligible rotational velocity. The adiabaticoscilla-tion code FILOU (Suarez 2002; Suarez & Goupil 2008, and ref-erences therein) computes the oscillation frequencies up to thesecond-order effects of rotation. It includes the corrections ofthe frequencies near degeneracy effects occurring when two fre-quencies are close to each other. These effects could also occurbetween three or more modes, but they only should be relevantfor very high rotational velocities (Suarez et al. 2006b, 2010).
Starting from the reference model pointed out by the spectro-scopic and photometric data, we computed sets of models withdifferent rotational velocities, ages, and maximum degreeℓ ofthe modes by using the code FILOU. We had to make some as-sumptions on the inclination anglei in order to constrain therotational frequency and then infer the rotational splitting. TheVeqsini value of HADS stars is usually below 25 km s−1 (Fig. 5in Breger 2000), suggesting that these variables are intrinsicallyslow rotators. Thus, we considered CoRoT 101155310 as seennearly equator-on, and we allowed variations ofVeq in the range19–30 km s−1.
The oscillation spectra predicted by the models were com-pared with the 13 independent terms detected in the frequencyanalysis. The pulsational models limited toℓ ≤ 3 directly match11 out of the 13 frequencies. Indeed, modes are predicted aroundall the observed frequencies, except forf5 and f12 (Fig. 5). To fillthis gap, we computed the models withℓ ≤ 5 and could obtainthe mode identifications for these frequencies, too (Table 4). Theaverage difference between observed and calculated frequenciesis 0.28µHz. The model depends on our assumptions and on theuncertainties in the identifications of close frequencies;there-fore they cannot be considered unique. We note that identifyingall frequencies at once with the modes predicted by the modelswith ℓ ≤ 5 improved the fit, because the oscillation spectrumwould be denser. However, the high prevalence ofℓ ≥ 4 modeson ℓ ≤ 3 ones is contrary to what is expected, since the ampli-tudes of the modes should decrease with increasingℓ due to thecancellation effects.
The mode identification describes a star very close to the ter-minal age on the main sequence, with a central hydrogen contentXc = 0.15±0.05 and, in turn, an age of 1485±10 Myr. This evo-lutionary stage agrees with the identification of the additionalterms (i.e., all the terms exceptf1) with mixed modes. Thef9mode is not identified with the first radial overtone, confirmingthat thef1/ f9 = 0.779 value differs too much from the predictedvalue (0.774).
We tried a fine tuning of the model after noticing that thef3 and f4 terms are identified as two components of a rotation-ally split ℓ = 1 multiplet (Table 4). We considered the existenceof such multiplet as a further input constraint. To do this, wecomputed models with small variations in the rotational veloc-ity around the observedVeqsini. Such variations had to be largeenough to modify them , 0 components sufficiently, and smallenough to avoid variations in them = 0 component. The lat-ter constraint allows a variation of only about 4 km s−1. Withinthis range, the second-order effects of rotation do not change theidentification of the other modes. Therefore, the model suggests

8 Poretti et al.: Nonradial modes and modulation effects in CoRoT 101155310
-0.9
-0.8
-0.7
-0.6
-0.5
-0.4
-0.3
-0.2
-0.1
0
0.1
0.2
50 100 150 200 250 300 350 400 450
grow
th ra
te
frequency (in µHz)
model
Fig. 6. Energy balance of the modes of the best fitting model. The greenbox represents where the observed modes are located in frequency.
that thef2 mode definitely does not belong to the same multipletas thef3 and f4 modes.
As a last step, the non-adiabatic analysis of the mode energybalance was performed by means of the GraCo code (Moya et al.2004; Moya & Garrido 2008). Figure 6 shows the growth rangeof the model. Overstable modes must have a positive growth rate,and this happens for a region including the observed frequencies.
Improvements in the theoretical treatment of the mixedmodes can lead to a more accurate fitting of the oscillation spec-trum of CoRoT 101155310. In any case the mixed modes canprovide significant constraints on the stellar internal structuresince now. In particular, our model predicts a convective corewith size rc ∼ 0.08R⊙ and a thin outer convective zone lo-cated atr = 0.99R⊙, as well asαMLT=0.5, in agreement withCasas et al. (2006), anddov = 0.1. These two values affect notonly the size of the convective zones, but also the possibility ofestimating the time spent on the main sequence.
7. Discussion
The CoRoT satellite offered the possibility of monitoring a vari-able star belonging to the class of HADS stars in a continu-ous and long way. At the moment, the pulsational behaviourdisclosed by the timeseries of CoRoT 101155310 is the mostadvanced observational fact we have to understand the physi-cal mechanisms at work in the variables of this class. These aresome questions raised by previous ground–based observationson which the CoRoT photometry shed a new light.
7.1. The excitation of independent modes
The excitation of small–amplitude nonradial modes accompany-ing the high–amplitude radial modes inδ Sct variables has beendebated at length. The pulsational content of V974 Oph providedthe decisive clear piece of evidence, since this star pulsates in thefundamental radial mode (f1=5.23 d−1, full amplitude 0.32 magin B) and in at least four other independent modes easily de-tectable also from ground–based timeseries (e.g.,f2=5.35 d−1,full amplitude 0.14 mag inB–light; Poretti 2003). The frequencyratios f1/ fi of these additional modes (0.734, 0.786, 0.807, and0.978) clearly indicate that most of them, if not all, are nonra-dial modes. In the case of CoRoT 101155310 the amplitudes ofthe nonradial modes are much smaller than those of V974 Oph,but the superior quality of the CoRoT timeseries does not leaveany ambiguity in their identification. The ratiosf1/ fi are listed inTable 1. The ratios 0.733, 0.811, and 0.779 are very similar tothe 0.734, 0.807, and 0.786 ones obtained in the case of V974
Oph. However, the corresponding modes have a different rankin amplitude in the two solutions of the light curves of the twostars.
We can also compare the pulsational content ofCoRoT 101155310 with that of HD 50844. In this low–amplitude δ Sct star, we detected an increase in the signalat f < 30 d−1 and hundreds of frequencies were neces-sary to reduce it to the same level of the noise observedat f > 30 d−1 (Poretti et al. 2009). After removing thepeaks related to the 61 terms detected in the CoRoT data ofCoRoT 101155310, the noise level is constant over the full5-100 d−1 spectrum (see inserted box in panele of Fig. 2). Thisnoise level (29µ mag) after subtracting 61 frequencies is muchless than observed in the amplitude spectrum of HD 50844 aftersubtracting 500 frequencies (see Fig. 3 in Poretti et al. 2009).Moreover, the amplitude of 0.10 mmag is reached after detectingof about 250 frequencies in the light curve of HD 50844, againstthe only 61 ones in the case of CoRoT 101155310. We canconclude that the variability of CoRoT 101155310 is muchsimpler than that of HD 50844. New cases will allow us to verifyif the excitation of only one ten of modes is a characteristicofthe HADS stars.
7.2. The modulation of f1
The physical interpretation of thefm term is not an easy task.We could suppose that it is related with the star’s rotation,soP=5.181 d is the rotational period. Under this assumption the ra-dius value listed in Table 3 supplies an equatorial velocityVeq =
27±4 km s−1, supporting the hypothesis that CoRoT 101155310is seen nearly equator-on. This scenario seems coherent, but wehave to explain why the rotation affects the amplitude of the mainpulsation term. A chemical inhomogeneity on the surface coulddo it, but then it should be detected as an independent peak intheamplitude spectrum. Moreover, thefm harmonics should also bedetected, since the equator-on orientation makes the continuousvisibility unlikely. Actually, frequencyfm is not observed in theamplitude spectrum of CoRoT 101155310. This lack could bedue to both its intrinsic, very small amplitude and the instru-mental effects that complicate the spectrum atf < 1 d−1.
A continuous modulation in amplitude and/or in phase su-perposed the main pulsational period is commonly observed inRR Lyr stars, and it defines the Blazhko effect. The onset of theBlazhko modulation is due to something more specific than ro-tation, e.g., the resonance model between nonradial, low–degreemodes and the main radial mode (Dziembowski & Mizerski2004), or the oblique pulsator model in which the rotationalaxisdoes not coincide with the magnetic axis (Shibahashi 2000) orthe action of a turbulent convective dynamo in the lower en-velope of the star (Stothers 2006). Breger (2010) discussesthepossibility of explaining the amplitude and phase modulationsobserved in three low–amplitudeδ Sct stars (FG Vir, BI CMi,and AI CVn) as due to the Blazhko effect. The very rich pulsa-tional content of these pulsators favours the interaction betweenmodes, without invoking the resonance mechanism suggestedbyDziembowski & Mizerski (2004). In the case of HADS stars,a much smaller number of modes are excited, and then it ap-pears more obvious to link CoRoT 101155310 with RR Lyr starsthan with low–amplitudeδ Sct stars, also having the sharp tripletstructure in mind.
It could be useful to investigate the light curves underthe magnification lens provided by the CoRoT timeseries. Thelong–term stability of the Blazhko modulation in RR Lyr stars

Poretti et al.: Nonradial modes and modulation effects in CoRoT 101155310 9
is a new issue opened up by the continuous CoRoT time-series (Poretti et al. 2010). In the case of the HADS variableCoRoT 101155310, there are very low peaks atf1 and harmon-ics after subtracting the 61 terms (Fig. 2, paneld), but the in-strumental effects revealed by the analysis of the chromatic datacan be responsible for this residual signal. The amplitudesof f1in white light calculated in each bin are slightly varying duringthe CoRoT monitoring (bottom panel in Fig. 3), but this effectis very marginal and could still reflect the complicated changesin the trends of thebC, gC, and rC data. The light curves ofBlazhko RR Lyr stars show bumps and larger scatter at well–defined phases (e.g., Fig. 3 in Poretti et al. 2010), probablyinrelation with shock waves. In the case of CoRoT 101155310,the smoothed light curve overf1 (Fig. 3, upper curve in the toppanel) and the residuals folded withf1 (Fig. 3, lower curve in thetop panel) do not show any particularity. Therefore, at the mo-ment we have no further evidence supporting the straight iden-tification of the triplets aroundf1 as due to the Blazhko effectobserved in RR Lyr stars.
In RR Lyr stars, the amplitude of the Blazhko modulation isstronger than that of additional modes. Indeed, CoRoT photom-etry allowed us to study the Blazhko effect in great detail and thediscovery of additional modes was a bonus (Chadid et al. 2010;Poretti et al. 2010). In the case of HADS stars, the opposite caseoccurred; i.e., searching for additional modes we discovered thef1 modulation. This demonstrates once more how rewarding theinvestment in the observation of known phenomena with moreadvanced tools could be.
8. Conclusions
The solution for the CoRoT light curve of CoRoT 101155310allowed us to detect only 12 additional modes; i.e., we did notdetect the huge number of frequencies found in low–amplitudepulsators (Poretti et al. 2009). These modes all have mixed na-ture and, together with the fundamental radial mode, originatesixty-one frequencies able to solve the CoRoT light curve. Wecan speculate that the large amount of energy put in the radialmodes limits the number of excited nonradial modes, but theobservations of new HADS stars could shed new light on thisparticular aspect.
The newest result is the small but very clear modulation ofthe fundamental radial mode, observed for the first time in anHADS star. The observation of other HADS stars by space pho-tometry could tell us whether this is a rotational effect or anextension of the Blazhko effect from RR Lyr to HADS stars.The similarity between these two classes of variables wouldbe anew way of looking at the Hertzsprung-Russell diagram and, ifconfirmed, would be able to put tighter constraints on the phys-ical model of the Blazhko effect, also taking the thin convec-tive layer predicted by the model of CoRoT 101155310 into ac-count. Indeed, it should be able to explain the modulations ob-served both in low–mass stars in a core He–burning phase (RRLyr stars) and in more massive, post-main sequence stars movingto the giant branch (HADS stars). In this context, nonradialres-onant modes close to the radial fundamental mode seem to havethe requisites needed to act in such different evolutionary stages,but the other models are still plausible. We also note that themodulation observed in CoRoT 101155310 (5.181 d) is shorterin time than the shortest ever observed for Blazhko RR Lyr stars(5.309 d in SS Cnc; Jurcsik et al. 2006).
The excitation of mixed modes in stars approaching the ter-minal age on the main sequence is confirmed and they are foundin the predicted overstable region. Further improvements in the
theoretical modelling are necessary, especially when dealingwith close frequencies in the presence of a non–negligible ro-tation.
Acknowledgements.We acknowledge the support from theCentre Nationald’Etudes Spatiales(CNES). The spectroscopic data were obtained as part ofthe ESO Large Programme LP182.D-0356 (PI.: E. Poretti) in the frameworkof the Italian ESS project, contract ASI/INAF I /015/07/0, WP 03170. The au-thors wish to thank the anonymous referee for useful comments. EN acknowl-edges financial support of the NN203 302635 grant from the MNiSW. MP,JMB, and ZsB acknowledge the support of the ESA PECS projectsNo. 98022& 98114. AM acknowledges the funding of AstroMadrid (CAM S2009/ESP-1496). JCS acknowledges support from the Instituto de Astrofısica de Andalucıa(CSIC) by an Excellence Project postdoctoral fellowship financed by the SpanishConjererıa de Innovacion, Ciencia y Empresa de la Junta deAndalucıaunderproject FQM4156-2008. JCS also acknowledges support by theSpanishPlanNacional del Espaciounder project ESP2007-65480-C02-01. We thank J. Viallefor checking the English form of the original manuscript. This publication makesuse of data products from the Two Micron All Sky Survey, whichis a joint projectof the University of Massachusetts and the Infrared Processing and AnalysisCenter/California Institute of Technology, funded by the NationalAeronauticsand Space Administration and the National Science Foundation.
References
Asplund, M., Grevesse, N., Sauval, A.J., & Scott, P. 2009, ARA&A, 47, 481Auvergne, M., Bodin, P., Boisnard, L., et al. 2009, A&A, 506,411Baglin, A., Auvergne, M., Barge, P., et al. 2006, in “The CoRoT Mission, Pre-
Launch Status, Stellar Seismology and Planet Finding”, ed.M. Fridlund,A. Baglin, J. Lochard, & L. Conroy, ESA Publications Division, Nordwijk,Netherlands, ESA SP-1036, 33
Barge, P., Leger, A., Ollivier, M., et al. 2006, in “The CoRoT Mission, Pre-Launch Status, Stellar Seismology and Planet Finding”, ed.M. Fridlund,A. Baglin, J. Lochard, & L. Conroy, ESA Publications Division, Nordwijk,Netherlands, ESA SP-1036, 83
Benko, J.M., & Csubry, Z. 2007, Acta Astron. 57, 73Breger, M., 2000, “Delta Scuti and Related Stars”, ed. M. Breger &
M.H. Montgomery, ASP Conf. Ser., vol. 210, 3Breger, M. 2010, in “Variable Stars, the Galactic Halo and Galaxy Formation”,
ed. C. Sterken, N. Samus & L. Szabados, in press (arXiv:1001.4443)Breger, M., & Bregman, J.N. 1975, ApJ, 200, 343Cardelli, J.A., Clayton, G.C., & Mathis, J.S. 1989, ApJ, 345, 245Carpino, M., Milani, A., & Nobili, A.M. 1987, A&A, 181, 182Casas, R., Suarez, J.C., Moya, A., & Garrido, R. 2006, A&A, 455, 1019Chadid, M., Benko, J.M., Szabo, R., et al. 2010, A&A, 510, A39Debosscher, J., Sarro, L. M., Lopez, et al. 2009, 506, 519Deleuil, M., Meunier, J. C., Moutou, et al. 2009, AJ, 138, 649Donati, J.-F., Semel, M., Carter, B.D., Rees, D.E., & Collier Cameron, A. 1997,
MNRAS, 291, 658Dziembowski, W.A., & Mizierski, T. 2004, Acta Astron., 54, 363Garg, A., Cook, K.H., Nikolaev, S., et al. 2010, AJ, 140, 328Garrido, R. 2000, in “Delta Scuti and Related Stars”, ed. M. Breger &
M.H. Montgomery, ASP Conf. Series, 210, 67Gray, R. O., Graham, P. W., & Hoyt, S. R., AJ, 121, 2159Heiter, U., Kupka, F., van’t Veer-Menneret, C., et al. 2002,A&A, 392, 619Jurcsik, J., Szeidl, B., Sodor,A., et al. 2006, AJ, 132, 61Kurucz, R. 1993, CD-ROM 18Masana, E., Jordi, C., & Ribas, I. 2006, A&A, 450, 735McNamara, D.H. 2000, in “Delta Scuti and Related Stars”, ed.M. Breger &
M.H. Montgomery, ASP Conf. Series, 210, 373Moya, A. & Garrido, R. 2008, Ap&SS, 316, 129Moya, A., Garrido, R., & Dupret, M. A. 2004, A&A, 414, 1081Moya, A., & Rodrıguez-Lopez, C. 2010, ApJ, 710, 7Montgomery, M.H., & O’Donoghue, D. 1999, Delta Scuti Star Newsletter, 13,
28Munari, U., & Zwitter, T. 1997, A&A, 318, 269Pojmanski, G. 2000, Acta Astron., 50, 977Poretti, E. 2001, A&A, 371, 986Poretti, E. 2003, A&A, 409, 1031Poretti, E., & Antonello, E. 1988, A&A, 199, 191Poretti, E., Antonello, E., & Mantegazza, L. 1987, A&A, 181,273Poretti, E., Clementini, G., Held, E., et al. 2008, ApJ, 685,947Poretti, E., Michel, E., Garrido, R., et al. 2009, A&A, 506, 85Poretti, E., Paparo, M., Deleuil, M., et al. 2010, A&A, 520,A108Poretti, E., Suarez, J.C., Niarchos, P.G., et al. 2005, A&A, 440, 1097Shibahashi, H. 2000, in “The Impact of Large-Scale Surveys on Pulsating Star
Research”, eds. L. Szabados & D. Kurtz, ASP Conf. Series, 203, 299

10 Poretti et al.: Nonradial modes and modulation effects in CoRoT 101155310
Skrutskie, M.F., Cutri, R.M., Stiening, R., et al. 2006, AJ,131, 1163Smith, M.A. 1982, ApJ, 254, 242Stothers, R.B. 2006, ApJ, 652, 643Suarez, J. C. 2002, Ph.D. Thesis, ISBN 84-689-3851-3, ID 02/PA07/7178Suarez, J. C., Garrido, R, & Moya, A. 2007, A&A, 474, 961Suarez, J. C., & Goupil, M. J. 2008, Ap&SS, 316, 155Suarez, J. C., Goupil, M. J., & Garrido, R. 2006a, A&A, 447, 649Suarez, J. C., Goupil, M. J., & Morel, P. 2006b, A&A, 449, 673Suarez, J. C., Goupil, M. J., Reese, D. R., et al. 2010, ApJ, 721, 537Suarez, J. C., Moya, A., Amado, P.J., et al. 2009, ApJ, 690, 1401Torres, G. 2010, AJ, 140, 1158Vanicek, P. 1971, Ap&SS, 12, 10Watson, R.D. 1988, Ap&SS, 140, 225Weiss, W. W. 2006, in “The CoRoT Mission, Pre-Launch Status,Stellar
Seismology and Planet Finding”, ed. M. Fridlund, A. Baglin,J. Lochard,& L. Conroy, ESA Publications Division, Nordwijk, Netherlands, ESA SP-1036, 93
Zima, W. 2006, A&A, 455, 227