Systematic Review on Diversity and Distribution of Anopheles ...
Molecular Phylogenetics and Evolution 52 (2009) 588–601
Contents lists available at ScienceDirect
Molecular Phylogenetics and Evolution
journal homepage: www.elsevier .com/locate /ympev
Molecular phylogenetics and biogeography of the Neocellia Series of Anophelesmosquitoes in the Oriental Region
Katy Morgan a, Samantha M. O’Loughlin a,b, Fong Mun-Yik a,c, Yvonne-Marie Linton d
Pradya Somboon e, Sein Min f, Pe Than Htun f, Simone Nambanya g, Indira Weerasinghe h
Tho Sochantha i, Anil Prakash j, Catherine Walton a,*
a Faculty of Life Sciences, University of Manchester, Oxford Road, Manchester M13 9PT, UKb NERC Centre for Population Biology, Imperial College, London, UKc University of Malaya, Kuala Lumpur, Malaysiad Department of Entomology, The Natural History Museum, London, UKe Department of Parasitology, Faculty of Medicine, Chiang Mai University, Chiang Mai, Thailandf Department of Medical Research, Yangon, Myanmarg Centre of Malariology, Parasitology and Entomology, Vientiane, Laosh Institute of Medical Research, Colombo, Sri Lankai National Centre for Malaria Control, Parasitology and Entomology, Phnom Penh, Cambodiaj Regional Medical Research Centre, Dibrugarh, Assam, India
a r t i c l e i n f o a b s t r a c t
Article history:Received 29 July 2008Revised 28 January 2009Accepted 29 January 2009Available online 6 February 2009
Keywords:AnophelesSoutheast AsiaPhylogeographyBiogeographyPleistocene climatic changeAllopatric speciationEcological speciation
1055-7903/$ - see front matter � 2009 Elsevier Inc. Adoi:10.1016/j.ympev.2009.01.022
* Corresponding author. Address: Michael SmitSciences, University of Manchester, Oxford Road, Ma+44 0161 275 5082.
E-mail address: [email protected]
Molecular studies of population divergence and speciation across the Oriental Region are sparse, despitethe region’s high biodiversity and extensive Pliocene and Pleistocene environmental change. A molecularphylogenetic study of the Neocellia Series of Anopheles mosquitoes was undertaken to identify patterns ofdiversification across the Oriental Region and to infer the role of Pleistocene and Pliocene climatic change.A robust phylogeny was constructed using CO2 and ND5 mitochondrial genes and ITS2 and D3 nuclearribosomal markers. Bayesian analysis of mitochondrial genes was used to date divergence events. Therepeated contraction and expansion of forest habitat resulting from Pleistocene climatic fluctuationsappears to have had a substantial impact on intraspecific diversification, but has not driven speciationwithin this group. Primarily early to mid Pliocene speciation was detected within the Annularis Group,whereas speciation within the Maculatus and Jamesii Groups occurred during the mid and late Pliocene.Both allopatric divergence driven by late Pliocene environmental changes and ecological adaptation,involving altitudinal replacement and seasonality, are likely to have influenced speciation in the Macul-atus Group.
� 2009 Elsevier Inc. All rights reserved.
1. Introduction
Southeast Asia is an important region in terms of global biodi-versity, containing four of the 25 global biodiversity hotspots de-scribed by Myers et al. (2000). These are the island regions ofSundaland, Wallacea and the Philippines, and the mainland regionof Indo-Burma. Together these regions contain an estimated 9.7%of the world’s known endemic plant species and 8.3% of the knownendemic vertebrate species, the majority of which are concen-trated within tropical forest habitat (Taylor et al., 1999; Myerset al., 2000; Brook et al., 2003). Sri Lanka and the Western Ghatsof India represent an additional biodiversity hotspot in the Oriental
ll rights reserved.
h Building, Faculty of Lifenchester M13 9PT, UK. Fax:
k (C. Walton).
Region, which shares similar flora and fauna to the Southeast Asianhotspots. Research on Oriental biodiversity has been neglected rel-ative to that of other regions, and consequently little is understoodof the processes underlying the generation of diversity across theregion (Sodhi et al., 2004). The mosquito genus Anopheles is speciesrich within the Oriental Region, containing multiple sibling speciescomplexes that occupy a wide variety of ecological niches (Reid,1968; Collins and Paskewitz, 1996; Foley et al., 2007a). The genusAnopheles is therefore a good model for studying the distribution ofbiodiversity and the factors influencing population divergence andspeciation across the region.
Numerous hypotheses have been put forward to explain thespecies richness of the tropics, a phenomenon that has been dem-onstrated in mosquitoes (Foley et al., 2007a), as well as numerousother taxa (for reviews see Gaston, 2000; Hill and Hill, 2005;Mittlebach et al., 2007). One of the oldest and most debated ofthese hypotheses is the refuge model, originally proposed by Haffer
K. Morgan et al. / Molecular Phylogenetics and Evolution 52 (2009) 588–601 589
(1969). This states that the repeated expansion and contraction oftropical forest in response to climatic fluctuation resulted in allo-patric divergence and eventual speciation. The Pleistocene, withits alternating cool, arid glacial periods and warm, moist intergla-cial periods, might therefore be expected to generate biodiversityaccording to the refuge hypothesis. However, since the majorityof speciation events in a wide range of tropical vertebrate andinvertebrate taxa pre-date the Pleistocene (Moritz et al., 2000;Burns and Naoki, 2004; Bush, 2005; Hill and Hill, 2005; Perez-Eman, 2005), the importance of Pleistocene climatic change in gen-erating tropical diversity remains unclear. Rather than allopatricfragmentation, the importance of environmentally driven adapta-tion in generating tropical biodiversity has been highlighted in sev-eral recent studies across South America, Africa and Australia(Smith et al., 1997, 2005; Schneider et al., 1999; Ogden and Thorpe,2002). Models of ecological speciation that have been proposed in-clude the gradient (reviewed in Moritz et al., 2000) and altitudinalreplacement models (Norman et al., 2007).
The role of Pleistocene climatic change in driving speciation inSouth America and Africa continues to be debated (Moritz et al.,2000; Pennington et al., 2004). It has been suggested that the Pleis-tocene refuge model is a particularly implausible explanation forthe generation of Amazonian biodiversity due to accumulating pal-aeoecological evidence indicating that this region remained largelyforested during glacial periods (Mayle et al., 2004). In contrast,Pleistocene climatic change may have had a particularly strongenvironmental influence in Southeast Asia. Southeast Asia is un-ique among tropical regions with regard to the dramatic effect ofchanges in Pleistocene sea level, which rose and fell during inter-glacial and glacial periods, respectively (Voris, 2000). This causedthe repeated destruction and formation of land bridges betweenthe mainland and island regions, with the large landmass of theSunda Shelf being exposed during periods of lowered sea level
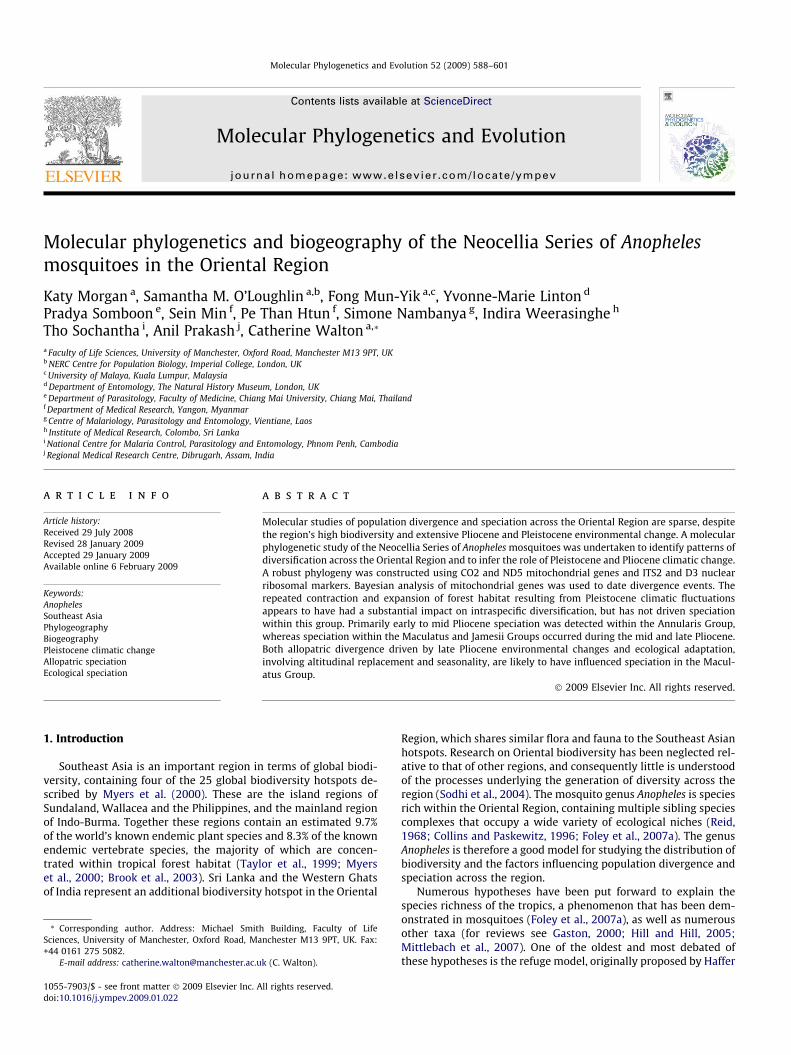
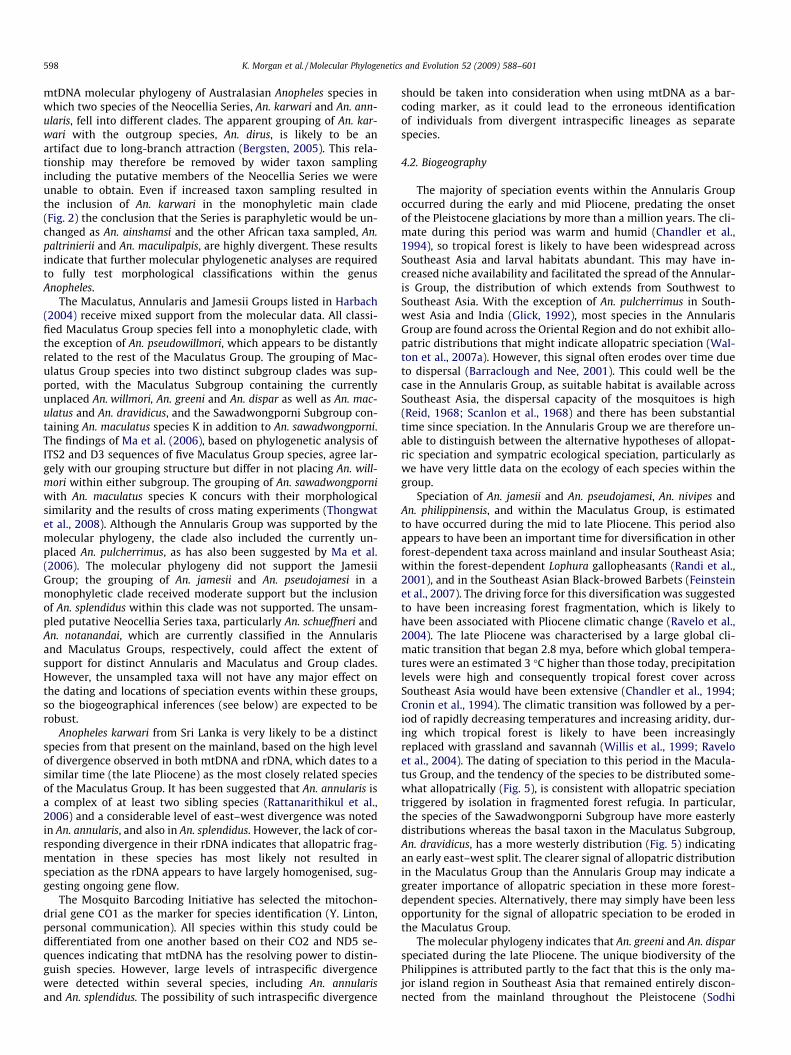
Fig. 1. Relief map of Southeast Asia indicating the locations of sample sites (see Table 1)levels were 120 m below their current level, the lowest levels reached during the Pleist
(see Fig. 1), leading to increased inland aridity (Heaney, 1991).Consequently, whereas Pleistocene tropical forest cover acrossSouth America and Africa was primarily affected by temperatureand precipitation, sea level fluctuations are thought to have hadan equal or even greater impact on tropical forest cover acrossSoutheast Asia (Heaney, 1991). Palaeoenvironmental reconstruc-tions of the last glacial maximum indicate that the dominant trop-ical forest habitat of interglacial periods was largely replaced bygrassland and savannah habitat during glacial periods, particularlyin mainland Southeast Asia (Heaney, 1991; Hope et al., 2004;White et al., 2004).
Molecular studies indicate that forest fragmentation in the Sun-da Shelf region, encompassing insular and mainland SoutheastAsia, led to population fragmentation and divergence in both ro-dent (Gorog et al., 2004) and plant taxa (Cannon and Manos,2003). Within the insular Sundaic region, speciation within theMacaca silensis Group of macaques (Ziegler et al., 2007) and thePteruthius genus of shrike babblers (Reddy, 2008) is thought tohave been triggered by the allopatric fragmentation of populationson different islands, as rising sea levels submerged land bridges be-tween them. On the mainland, the interglacial expansion of tropi-cal forest from refugial regions has been suggested as the cause ofpopulation expansions in Anopheles mosquito species (Waltonet al., 2001; Chen et al., 2004; O’Loughlin et al., 2008) and in Simu-lium blackfly species (Pramual et al., 2005). However, the questionof whether allopatric divergence associated with habitat fragmen-tation has resulted in speciation within forest taxa within themainland Oriental Region is unanswered and is a question we ad-dress here.
The Neocellia Series (Christophers, 1924) of the Anopheles sub-genus Cellia comprises some 31 currently recognised species (Har-bach, 2004; Gad et al., 2006). The majority of species in theNeocellia Series are found within the Oriental Region; however
. The smooth black line indicates the approximate landmass configuration when seaocene (data taken from Voris, 2000).
590 K. Morgan et al. / Molecular Phylogenetics and Evolution 52 (2009) 588–601
the Series also includes African, Middle Eastern and European taxa.Within the Series, three groups have been assigned, based predom-inantly on morphology. These include the Annularis Group (An.annularis, An. nivipes, An. pallidus, An. philippinensis, An. schueffneri),the Jamesii Group (An. jamesii, An. pseudojamesi, An. splendidus) andthe Maculatus Group of eight species. The Maculatus Group has re-cently been subdivided into two further groupings: the MaculatusSubgroup (An. dravidicus and An. maculatus) and the Sawadwongp-orni Subgroup (An. sawadwongporni and An. notanandai) in addi-tion to four unassigned species (An. greeni, An. dispar, An. willmoriand An. pseudowillmori). Several additional species remain un-placed within the Series (Table 1) and, with the exception of theinternal systematics of the Maculatus Group (Ma et al., 2006),the molecular support for this classification has been largely un-tested. A thorough and comprehensive study of the molecular phy-logeny of the Neocellia Series is therefore needed.
The three taxonomic groups within the Neocellia Series differ intheir ecology as well as their morphology. Whereas members ofthe Maculatus Group are mainly associated with tropical forest hab-itat and hilly or mountainous areas, the Annularis Group are muchless dependent on forest, being found in a wide range of habitatsincluding heavily cleared areas such as rice paddies, and at generallylower altitudes (Horsfall, 1955; Reid, 1968; Shrestha et al., 1988;Upatham et al., 1988; Darsie and Pradhan, 1990; Rahman et al.,1993; Bangs et al., 2002). Within the Jamesii Group, both An. jamesiiand An. pseudojamesi have similar habitats to the Annularis Groupspecies, whereas those of An. splendidus are more similar to the Mac-ulatus Group (Reid, 1968; Darsie and Pradhan, 1990; Rattanarithikulet al., 2006). All mosquito species are dependent on water for larvaldevelopment. These species will therefore have been influenced byfluctuating levels of aridity, making the Series a suitable model sys-tem for determining the effect of historical climatic change on diver-sification. However, we would expect changes in tropical forestcover associated with climatic perturbation to have had an espe-cially strong impact on the Maculatus Group taxa due to their closeassociation with tropical forest habitat.
Here we use a molecular phylogenetics approach, using twomitochondrial genes and two ribosomal DNA (rDNA) regions, toinvestigate the pattern and timing of diversification of specieswithin the Neocellia Series. In addition, a larger range of specimensfrom one species within the Neocellia Series, An. annularis, was se-quenced for the CO2 mitochondrial gene to examine intraspecificpopulation structure. The following questions are addressed: Whatare the processes of interspecific and intraspecific diversificationwithin the Neocellia Series? Has the Pleistocene been importantfor speciation events within the Neocellia Series, or do speciationevents pre-date this period? Have the Pleistocene climatic fluctua-tions had a greater impact on diversification within the forest-dependent Maculatus Group relative to other members of the Ser-ies? These questions are aimed at increasing our understanding ofthe processes influencing species richness within Southeast Asia,and of the biogeography of the region in general. An additional tax-onomic question asked is whether the morphologically based clas-sification of the Neocellia Series (Harbach, 2004) is supported bythe molecular phylogeny. Several species within the Series areimportant vectors of malaria within Southeast Asia and knowledgeof the taxonomic relationships of species may help to explain dif-ferences in vectorial capacity between them.
2. Materials and methods
2.1. Sampling techniques
A total of 130 mosquitoes representing 21 of the 31 species inthe Neocellia Series were used in the study (Table 1 and Fig. 1).
Despite our efforts to obtain specimens for the remaining 10 spe-cies this was ultimately not possible and the implications for thisare discussed later. Where possible each species was sampledacross its distribution range, however in some cases availabilitywas limited. Two outgroup species were selected from within thegenus Anopheles (subgenus Cellia); Anopheles gambiae (Pyretopho-rus Series) and Anopheles dirus (Neomyzomyia Series) (in Harbach,2004). For an in-depth analysis of intraspecific population struc-ture, 115 An. annularis individuals were sampled from 14 locationsacross the species’ range. (See Supplementary material for An. ann-ularis specimen information.) The majority of specimens were col-lected as adults. All immature specimens collected in larval surveyswere reared to adulthood prior to identification. Specimens werefirst identified to species level using the keys of Harrison and Scan-lon (1975) and Rattanarithikul and Panthusiri (1994) and then pre-served by desiccation. Identifications were confirmed within theMaculatus and Annularis Groups by comparison of the ITS2 se-quences obtained here to those of reference specimens (Waltonet al., 2007a,b) and those in GenBank (e.g. from Ma et al., 2006).Several specimens, which are indicated in Table 1, were obtainedas morphologically identified, pinned mosquitoes from the collec-tion of the Natural History Museum, London.
2.2. DNA extraction and amplification
DNA extractions from whole adult mosquitoes were carried outusing the phenol–chloroform method (Sambrook et al., 1989). A621 bp fragment of the mitochondrial CO2 gene, 500 bp of the ND5mitochondrial gene, 343 bp of the D3 region of the 28S ribosomalgene and approximately 620 bp of the ITS2 spacer region of the rDNAwere PCR-amplified using the primer pairs leu/lys (Sharpe et al.,2000), ND5/Phe (Krzywinski et al., 2001), D3a/D3b (Sharpe et al.,1999) and 5.8f/28s (Paskewitz and Collins, 1990), respectively. AllPCRs were carried out using a GeneAmp 9700 thermocycler (AppliedBiosystems, USA). Each PCR had a total volume of 50 ll, and con-tained 200 lM dNTP, 1.5 mM MgCl2, and primers at concentrationsof 0.24 lM, 0.8 lM, 0.6 lM and 1.0 lM for the CO2, ND5, D3 and ITS2primers, respectively. For the amplification of all regions, initialdenaturation was carried out for 5 min at 94 �C. For the amplificationof CO2, ND5 and ITS2, 39 cycles consisting of 1 min at 94 �C for dena-turation, 1 min at 51 �C for annealing and 2 min at 72 �C for exten-sion were performed, followed by 3 min at 72 �C for finalextension. For the amplification of the D3 region, 39 cycles consist-ing of 30 s at 94 �C, 30 s at 55 �C and 1 min at 72 �C were carriedout, followed by 4 min at 72 �C for final extension. Purification ofPCR products using Millipore� Montage columns (Billerica, USA)was carried out prior to sequencing (Macrogen Inc., South Korea),which was performed in both directions using the original PCRamplification primers specified above. Sequences were assembledand manually edited in the program SEQUENCHER 4.6 (Gene codes,Ann Arbor, USA). The sequences used in this study were deposited inGenBank with Accession Nos. FJ526394–FJ526741 and EU882061.
2.3. Phylogenetic analysis
The mitochondrial DNA (mtDNA) sequences were translatedwith DnaSP 4.50.3 (Rozas and Rozas, 1999) using the invertebratemitochondrial genetic code to test for the amplification of pseudo-genes. No stop codons were found indicating the sequences weremitochondrial. Nucleotide sequences were aligned using the pro-gram ClustalX 1.81 (Thompson et al., 1997) and the resulting align-ments verified by eye. After experimenting with severalcombinations of gap opening and extension penalties, the ribo-somal dataset was aligned using penalties of 20 and 2, respectively,prior to making appropriate manual adjustments. Due to highinterspecific variation at both ribosomal loci, reliable alignment
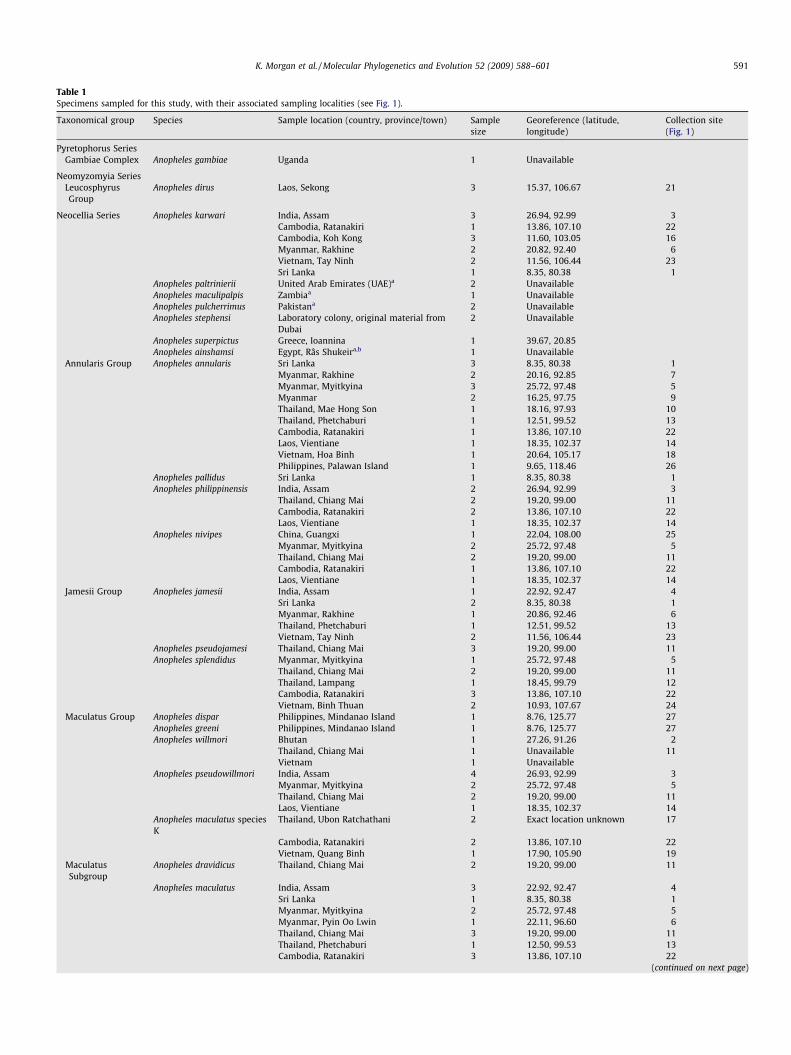
Table 1Specimens sampled for this study, with their associated sampling localities (see Fig. 1).
Taxonomical group Species Sample location (country, province/town) Samplesize
Georeference (latitude,longitude)
Collection site(Fig. 1)
Pyretophorus SeriesGambiae Complex Anopheles gambiae Uganda 1 Unavailable
Neomyzomyia SeriesLeucosphyrusGroup
Anopheles dirus Laos, Sekong 3 15.37, 106.67 21
Neocellia Series Anopheles karwari India, Assam 3 26.94, 92.99 3Cambodia, Ratanakiri 1 13.86, 107.10 22Cambodia, Koh Kong 3 11.60, 103.05 16Myanmar, Rakhine 2 20.82, 92.40 6Vietnam, Tay Ninh 2 11.56, 106.44 23Sri Lanka 1 8.35, 80.38 1
Anopheles paltrinierii United Arab Emirates (UAE)a 2 UnavailableAnopheles maculipalpis Zambiaa 1 UnavailableAnopheles pulcherrimus Pakistana 2 UnavailableAnopheles stephensi Laboratory colony, original material from
Dubai2 Unavailable
Anopheles superpictus Greece, Ioannina 1 39.67, 20.85Anopheles ainshamsi Egypt, Râs Shukeira,b 1 Unavailable
Annularis Group Anopheles annularis Sri Lanka 3 8.35, 80.38 1Myanmar, Rakhine 2 20.16, 92.85 7Myanmar, Myitkyina 3 25.72, 97.48 5Myanmar 2 16.25, 97.75 9Thailand, Mae Hong Son 1 18.16, 97.93 10Thailand, Phetchaburi 1 12.51, 99.52 13Cambodia, Ratanakiri 1 13.86, 107.10 22Laos, Vientiane 1 18.35, 102.37 14Vietnam, Hoa Binh 1 20.64, 105.17 18Philippines, Palawan Island 1 9.65, 118.46 26
Anopheles pallidus Sri Lanka 1 8.35, 80.38 1Anopheles philippinensis India, Assam 2 26.94, 92.99 3
Thailand, Chiang Mai 2 19.20, 99.00 11Cambodia, Ratanakiri 2 13.86, 107.10 22Laos, Vientiane 1 18.35, 102.37 14
Anopheles nivipes China, Guangxi 1 22.04, 108.00 25Myanmar, Myitkyina 2 25.72, 97.48 5Thailand, Chiang Mai 2 19.20, 99.00 11Cambodia, Ratanakiri 1 13.86, 107.10 22Laos, Vientiane 1 18.35, 102.37 14
Jamesii Group Anopheles jamesii India, Assam 1 22.92, 92.47 4Sri Lanka 2 8.35, 80.38 1Myanmar, Rakhine 1 20.86, 92.46 6Thailand, Phetchaburi 1 12.51, 99.52 13Vietnam, Tay Ninh 2 11.56, 106.44 23
Anopheles pseudojamesi Thailand, Chiang Mai 3 19.20, 99.00 11Anopheles splendidus Myanmar, Myitkyina 1 25.72, 97.48 5
Thailand, Chiang Mai 2 19.20, 99.00 11Thailand, Lampang 1 18.45, 99.79 12Cambodia, Ratanakiri 3 13.86, 107.10 22Vietnam, Binh Thuan 2 10.93, 107.67 24
Maculatus Group Anopheles dispar Philippines, Mindanao Island 1 8.76, 125.77 27Anopheles greeni Philippines, Mindanao Island 1 8.76, 125.77 27Anopheles willmori Bhutan 1 27.26, 91.26 2
Thailand, Chiang Mai 1 Unavailable 11Vietnam 1 Unavailable
Anopheles pseudowillmori India, Assam 4 26.93, 92.99 3Myanmar, Myitkyina 2 25.72, 97.48 5Thailand, Chiang Mai 2 19.20, 99.00 11Laos, Vientiane 1 18.35, 102.37 14
Anopheles maculatus speciesK
Thailand, Ubon Ratchathani 2 Exact location unknown 17
Cambodia, Ratanakiri 2 13.86, 107.10 22Vietnam, Quang Binh 1 17.90, 105.90 19
MaculatusSubgroup
Anopheles dravidicus Thailand, Chiang Mai 2 19.20, 99.00 11
Anopheles maculatus India, Assam 3 22.92, 92.47 4Sri Lanka 1 8.35, 80.38 1Myanmar, Myitkyina 2 25.72, 97.48 5Myanmar, Pyin Oo Lwin 1 22.11, 96.60 6Thailand, Chiang Mai 3 19.20, 99.00 11Thailand, Phetchaburi 1 12.50, 99.53 13Cambodia, Ratanakiri 3 13.86, 107.10 22
(continued on next page)
K. Morgan et al. / Molecular Phylogenetics and Evolution 52 (2009) 588–601 591
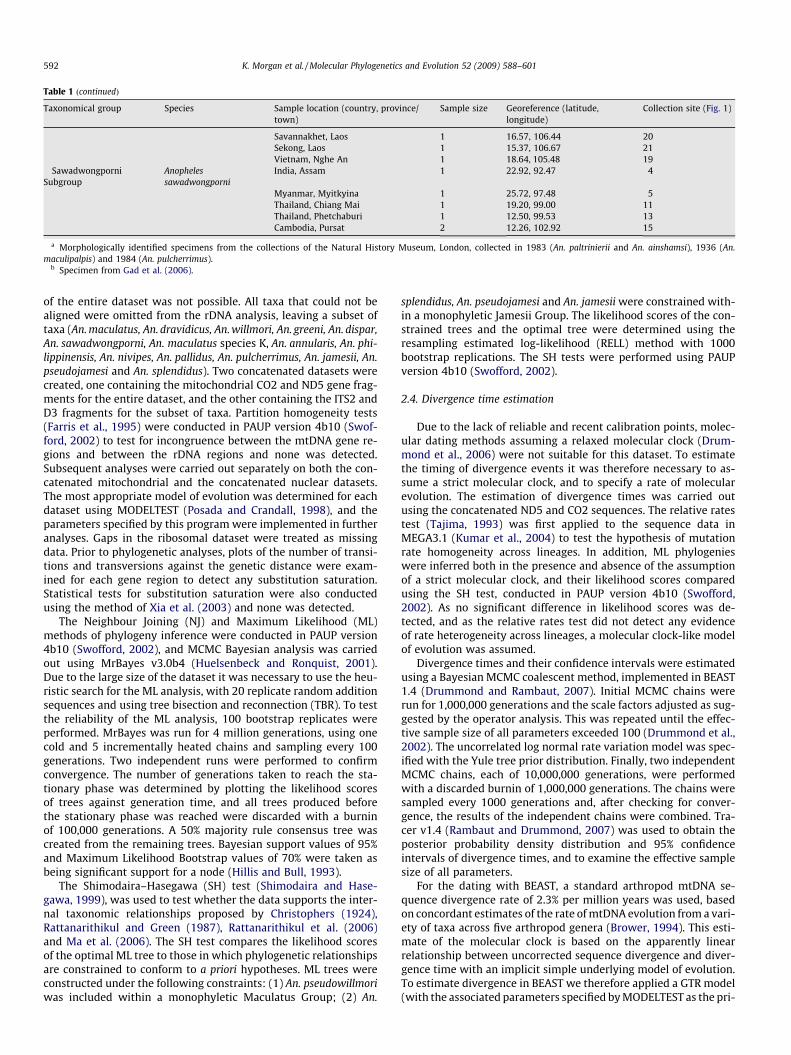
Table 1 (continued)
Taxonomical group Species Sample location (country, province/town)
Sample size Georeference (latitude,longitude)
Collection site (Fig. 1)
Savannakhet, Laos 1 16.57, 106.44 20Sekong, Laos 1 15.37, 106.67 21Vietnam, Nghe An 1 18.64, 105.48 19
SawadwongporniSubgroup
Anophelessawadwongporni
India, Assam 1 22.92, 92.47 4
Myanmar, Myitkyina 1 25.72, 97.48 5Thailand, Chiang Mai 1 19.20, 99.00 11Thailand, Phetchaburi 1 12.50, 99.53 13Cambodia, Pursat 2 12.26, 102.92 15
a Morphologically identified specimens from the collections of the Natural History Museum, London, collected in 1983 (An. paltrinierii and An. ainshamsi), 1936 (An.maculipalpis) and 1984 (An. pulcherrimus).
b Specimen from Gad et al. (2006).
592 K. Morgan et al. / Molecular Phylogenetics and Evolution 52 (2009) 588–601
of the entire dataset was not possible. All taxa that could not bealigned were omitted from the rDNA analysis, leaving a subset oftaxa (An. maculatus, An. dravidicus, An. willmori, An. greeni, An. dispar,An. sawadwongporni, An. maculatus species K, An. annularis, An. phi-lippinensis, An. nivipes, An. pallidus, An. pulcherrimus, An. jamesii, An.pseudojamesi and An. splendidus). Two concatenated datasets werecreated, one containing the mitochondrial CO2 and ND5 gene frag-ments for the entire dataset, and the other containing the ITS2 andD3 fragments for the subset of taxa. Partition homogeneity tests(Farris et al., 1995) were conducted in PAUP version 4b10 (Swof-ford, 2002) to test for incongruence between the mtDNA gene re-gions and between the rDNA regions and none was detected.Subsequent analyses were carried out separately on both the con-catenated mitochondrial and the concatenated nuclear datasets.The most appropriate model of evolution was determined for eachdataset using MODELTEST (Posada and Crandall, 1998), and theparameters specified by this program were implemented in furtheranalyses. Gaps in the ribosomal dataset were treated as missingdata. Prior to phylogenetic analyses, plots of the number of transi-tions and transversions against the genetic distance were exam-ined for each gene region to detect any substitution saturation.Statistical tests for substitution saturation were also conductedusing the method of Xia et al. (2003) and none was detected.
The Neighbour Joining (NJ) and Maximum Likelihood (ML)methods of phylogeny inference were conducted in PAUP version4b10 (Swofford, 2002), and MCMC Bayesian analysis was carriedout using MrBayes v3.0b4 (Huelsenbeck and Ronquist, 2001).Due to the large size of the dataset it was necessary to use the heu-ristic search for the ML analysis, with 20 replicate random additionsequences and using tree bisection and reconnection (TBR). To testthe reliability of the ML analysis, 100 bootstrap replicates wereperformed. MrBayes was run for 4 million generations, using onecold and 5 incrementally heated chains and sampling every 100generations. Two independent runs were performed to confirmconvergence. The number of generations taken to reach the sta-tionary phase was determined by plotting the likelihood scoresof trees against generation time, and all trees produced beforethe stationary phase was reached were discarded with a burninof 100,000 generations. A 50% majority rule consensus tree wascreated from the remaining trees. Bayesian support values of 95%and Maximum Likelihood Bootstrap values of 70% were taken asbeing significant support for a node (Hillis and Bull, 1993).
The Shimodaira–Hasegawa (SH) test (Shimodaira and Hase-gawa, 1999), was used to test whether the data supports the inter-nal taxonomic relationships proposed by Christophers (1924),Rattanarithikul and Green (1987), Rattanarithikul et al. (2006)and Ma et al. (2006). The SH test compares the likelihood scoresof the optimal ML tree to those in which phylogenetic relationshipsare constrained to conform to a priori hypotheses. ML trees wereconstructed under the following constraints: (1) An. pseudowillmoriwas included within a monophyletic Maculatus Group; (2) An.
splendidus, An. pseudojamesi and An. jamesii were constrained with-in a monophyletic Jamesii Group. The likelihood scores of the con-strained trees and the optimal tree were determined using theresampling estimated log-likelihood (RELL) method with 1000bootstrap replications. The SH tests were performed using PAUPversion 4b10 (Swofford, 2002).
2.4. Divergence time estimation
Due to the lack of reliable and recent calibration points, molec-ular dating methods assuming a relaxed molecular clock (Drum-mond et al., 2006) were not suitable for this dataset. To estimatethe timing of divergence events it was therefore necessary to as-sume a strict molecular clock, and to specify a rate of molecularevolution. The estimation of divergence times was carried outusing the concatenated ND5 and CO2 sequences. The relative ratestest (Tajima, 1993) was first applied to the sequence data inMEGA3.1 (Kumar et al., 2004) to test the hypothesis of mutationrate homogeneity across lineages. In addition, ML phylogenieswere inferred both in the presence and absence of the assumptionof a strict molecular clock, and their likelihood scores comparedusing the SH test, conducted in PAUP version 4b10 (Swofford,2002). As no significant difference in likelihood scores was de-tected, and as the relative rates test did not detect any evidenceof rate heterogeneity across lineages, a molecular clock-like modelof evolution was assumed.
Divergence times and their confidence intervals were estimatedusing a Bayesian MCMC coalescent method, implemented in BEAST1.4 (Drummond and Rambaut, 2007). Initial MCMC chains wererun for 1,000,000 generations and the scale factors adjusted as sug-gested by the operator analysis. This was repeated until the effec-tive sample size of all parameters exceeded 100 (Drummond et al.,2002). The uncorrelated log normal rate variation model was spec-ified with the Yule tree prior distribution. Finally, two independentMCMC chains, each of 10,000,000 generations, were performedwith a discarded burnin of 1,000,000 generations. The chains weresampled every 1000 generations and, after checking for conver-gence, the results of the independent chains were combined. Tra-cer v1.4 (Rambaut and Drummond, 2007) was used to obtain theposterior probability density distribution and 95% confidenceintervals of divergence times, and to examine the effective samplesize of all parameters.
For the dating with BEAST, a standard arthropod mtDNA se-quence divergence rate of 2.3% per million years was used, basedon concordant estimates of the rate of mtDNA evolution from a vari-ety of taxa across five arthropod genera (Brower, 1994). This esti-mate of the molecular clock is based on the apparently linearrelationship between uncorrected sequence divergence and diver-gence time with an implicit simple underlying model of evolution.To estimate divergence in BEAST we therefore applied a GTR model(with the associated parameters specified by MODELTEST as the pri-

K. Morgan et al. / Molecular Phylogenetics and Evolution 52 (2009) 588–601 593
ors) without a gamma distribution or proportion of invariant sites.Our estimates should therefore be reliable for the time period forwhich the Brower (1994) molecular clock was determined (at leastthe last 3.25 million years), but since mutation saturation starts tooccur after this time (DeSalle et al., 1987), divergences substantiallyolder than this may be underestimated. The 2.3% divergence pmyrate of mitochondrial evolution has been used to estimate the datesof events in the histories of a wide range of insect taxa (Salvato et al.,2002; Hundsdoerfer et al., 2005; Garrick et al., 2007; Albre et al.,2008), including Anopheles mosquitoes (Foley et al., 2007b). How-ever, there is likely to be a degree of error associated with assumingthis general rate, so some caution should be exercised in the inter-pretation of the estimated speciation dates.
2.5. Phylogeography of An. annularis
Firstly, mitochondrial CO2 sequence data were used to createa median joining haplotype network using NETWORK 4.500(Bandelt et al., 1999). Secondly, CO2 sequence data were ana-lysed using Nested Clade Phylogeographic Analysis (NCPA),which is designed to distinguish between historical and contem-porary processes, such as range expansion, allopatric fragmenta-tion and restricted gene flow, that have shaped thephylogeographic structure of species or populations (Templetonet al., 1995). NCPA was implemented in ANeCA (Panchal, 2007)which includes the software TCS v1.18 (Clement et al., 2000)and GeoDis v2.2 (Posada et al., 2000) and provides a fully auto-mated implementation of NCPA. A haplotype network was con-structed from sequence data using the statistical parsimonyalgorithm (Templeton et al., 1992) and haplotypes were clus-tered hierarchically into a set of nested clades (Templeton,1998). Using this nested design, genetic and geographic dis-tances were compared within and between clades to detect devi-ations from the null hypothesis of no association betweenhaplotype variation and geography (Posada et al., 2000). Finally,the automated published inference key (available at http://dar-win.uvigo.es/software/geodis.html), was used to infer the histor-ical processes that have shaped the phylogeographic structure ofeach of the nested clades. The efficacy of NCPA as a method forinferring gene flow regime and demographic history has beenquestioned, based on a lack of statistical hypothesis testingand high proportions of false inferences recovered in simulationstudies (e.g. Knowles and Maddison, 2002; Panchal and Beau-mont, 2007; Petit, 2008). It has, however, been argued that muchof this criticism is based on misrepresentations and invalidimplementation of NCPA, simulation artefacts and unrealisticsampling assumptions (Templeton, 2004, 2008). Taking bothsides of the argument into consideration, we consider NCPA tobe a credible and useful tool when the results are assessed inconjunction with those from other methods.
3. Results
3.1. Sequence variation
It was not possible to amplify the mitochondrial DNA or ITS2 se-quences for either An. paltrinieri or An. maculipalpis. It is likely thattheir DNA was degraded since both were pinned museum speci-mens that were collected several decades ago (Table 1).
Both mitochondrial gene regions were AT rich, with an overallAT content of 87%. MODELTEST identified the GTR+I+G model asthe most appropriate for both the mitochondrial and ribosomaldatasets. For the rDNA dataset, a total of 198 bp were removeddue to ambiguities in the alignment, leaving a concatenatedrDNA dataset of 644 bp, of which 57% were variable. The concat-
enated mtDNA dataset consisted of 1131 bp, 49% of which werevariable. The mtDNA alignment was unambiguous, with noindels.
3.2. Phylogenetic analysis
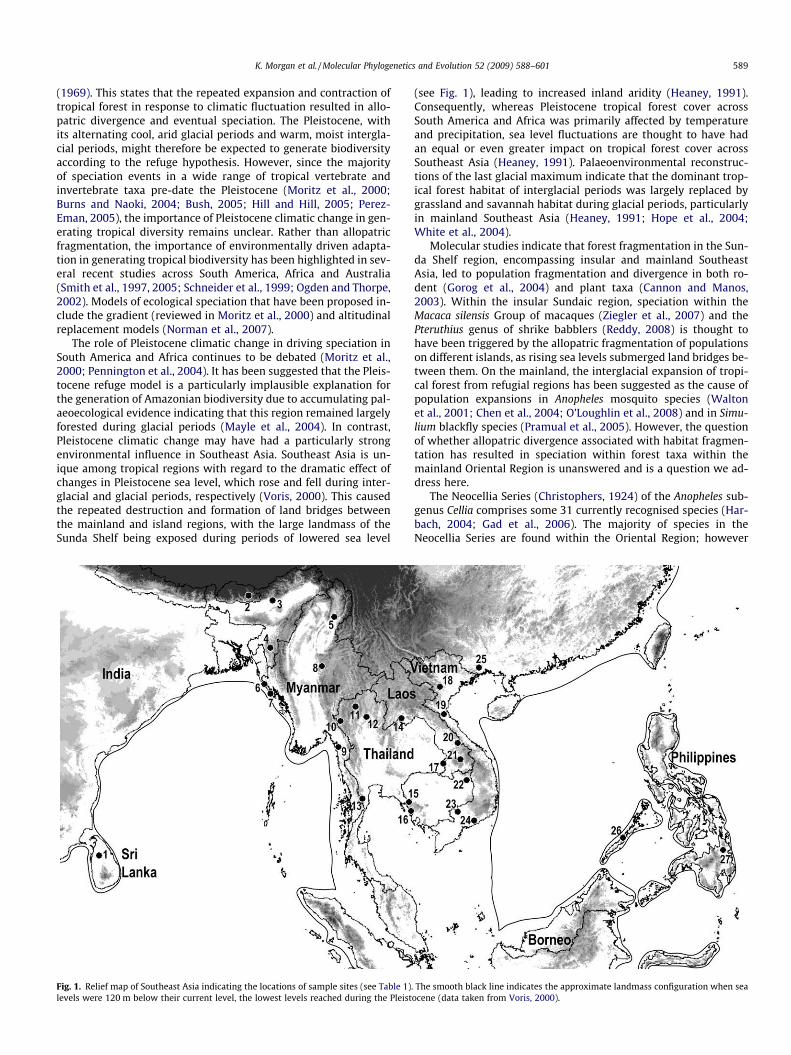
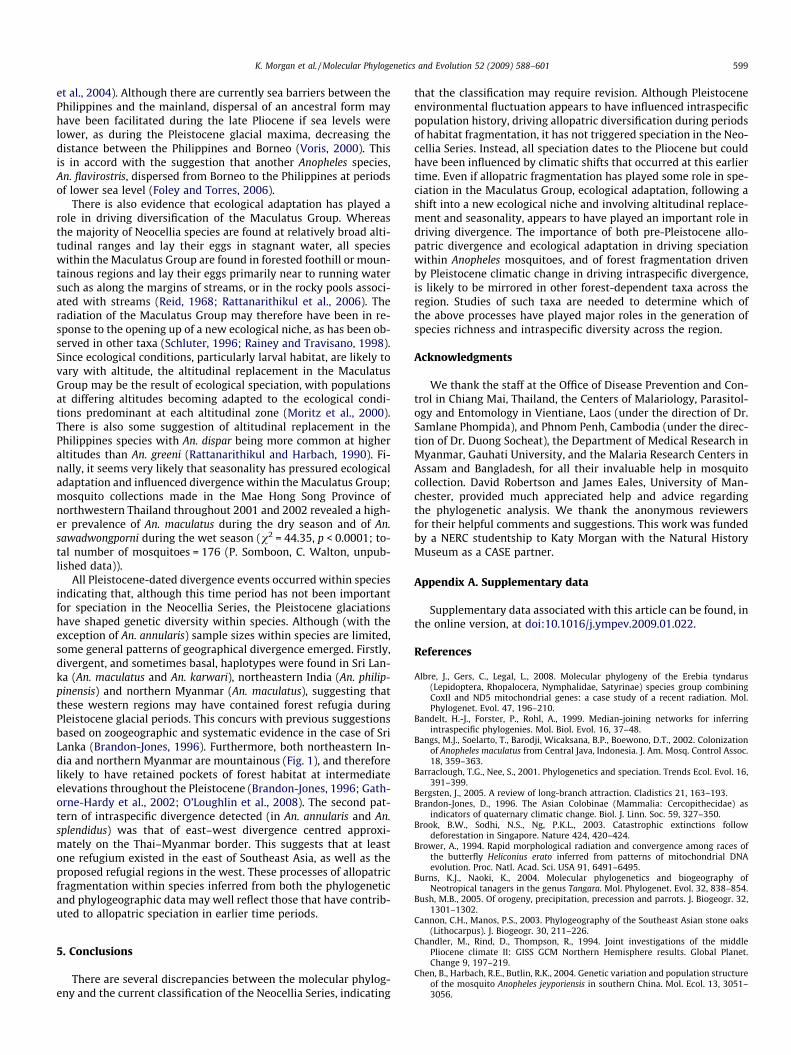
3.2.1. Mitochondrial DNA dataFig. 2 shows the 50% majority rule consensus tree obtained
using Bayesian analysis, the topology of which is in agreementwith the phylogenetic trees obtained using both ML and NJ analy-ses. These show that the Neocellia Series does not form a mono-phyletic group. One main monophyletic clade was recovered(Bayesian Posterior Probability value, PP = 100, ML Bootstrap value,BS = 99), however both Oriental An. karwari and African An. ains-hamsi fell outside of this clade. This main clade is composed ofsix lineages, including two major clades, in an unresolved polyto-my. The first of these clades contains all of the currently classifiedMaculatus Group species (Rattanarithikul and Green, 1987; Har-bach, 2004) with the exception of An. pseudowillmori, which formsa separate lineage in the unresolved polytomy. This well-supportedclade (PP = 100, BS = 99) is therefore referred to here as the Macul-atus Group clade (Fig. 2). The SH test reveals that the likelihoodscore of the ML tree in which An. pseudowillmori was constrainedwithin a monophyletic Maculatus Group clade was significantlylower than that of the optimal ML tree (p = 0.014). The MaculatusGroup clade is divided into two well-supported subclades(PP = 99, BS = 79 and PP = 77, BS = 91), supporting the division ofthe Maculatus Group into the Maculatus and SawadwongporniSubgroups in the current classification (Rattanarithikul et al.,2006).
The second major clade recovered contains species currentlyclassified within the Annularis and Jamesii Groups, with the excep-tion of An. splendidus that is currently placed in the Jamesii Groupbut, like An. pseudowillmori, forms a separate lineage in the unre-solved polytomy. The SH test reveals that the likelihood score ofthe ML tree in which An. splendidus was constrained within amonophyletic Jamesii Group clade was significantly lower thanthat of the optimal ML tree (p = 0.021). This second major cladeis itself poorly supported (PP = 63, BS < 50), and is split into thepoorly supported Annularis Group clade (PP = 85, BS < 50) andthe more strongly supported Jamesii Group clade (PP = 97,BS < 50). The Annularis Group clade (Fig. 2) includes all currentlyclassified Annularis Group species as well as, in a basal position,An. pulcherrimus, which according to the current taxonomy is un-placed within the Neocellia Series (Harbach, 2004). The two mem-bers of the Jamesii Group clade, An. jamesii and An. pseudojamesi,appear to be sister taxa. Anopheles superpictus and An. stephensi,both of which are currently unplaced within the Neocellia Series(Harbach, 2004), form the two final lineages within the unresolvedpolytomy.
3.2.2. Ribosomal DNA dataAnopheles maculipalpis, An. paltrinierii and An. ainshamsi are all
currently classified within the Neocellia Series (Harbach, 2004)but have distributions outside of the Oriental Region, in either Afri-ca or the Middle East. The D3 rDNA region sequence data fromthese species is so divergent from Oriental members of the Seriesthat it is impossible to align them with any confidence, suggestingthat these non-Asian species should not be included within amonophyletic Neocellia Series. In the cases of An. maculipalpisand An. paltrinierii, an alternative possibility is sample contamina-tion due to the problem of DNA degradation in these old speci-mens. However, the fact that unique haplotypes were obtainedfor both of these species suggests contamination is unlikely. Theconcordance of rDNA and mtDNA in An. ainshamsi supports its po-sition outside of the Neocellia Series.
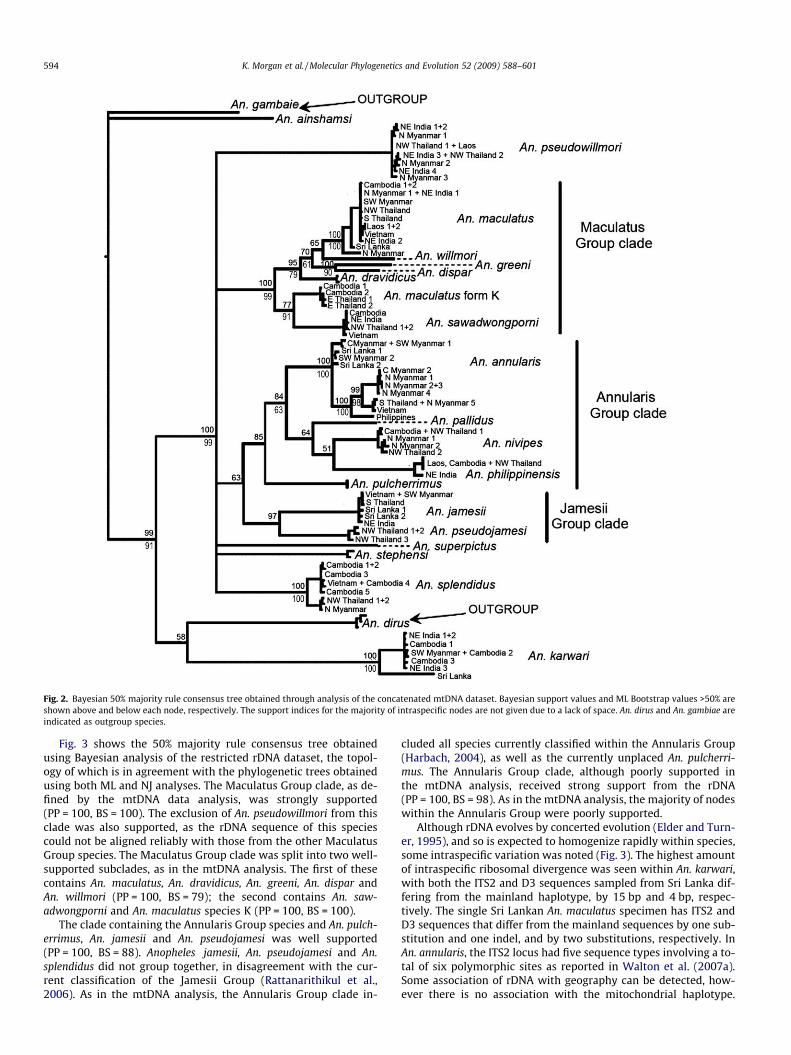
Fig. 2. Bayesian 50% majority rule consensus tree obtained through analysis of the concatenated mtDNA dataset. Bayesian support values and ML Bootstrap values >50% areshown above and below each node, respectively. The support indices for the majority of intraspecific nodes are not given due to a lack of space. An. dirus and An. gambiae areindicated as outgroup species.
594 K. Morgan et al. / Molecular Phylogenetics and Evolution 52 (2009) 588–601
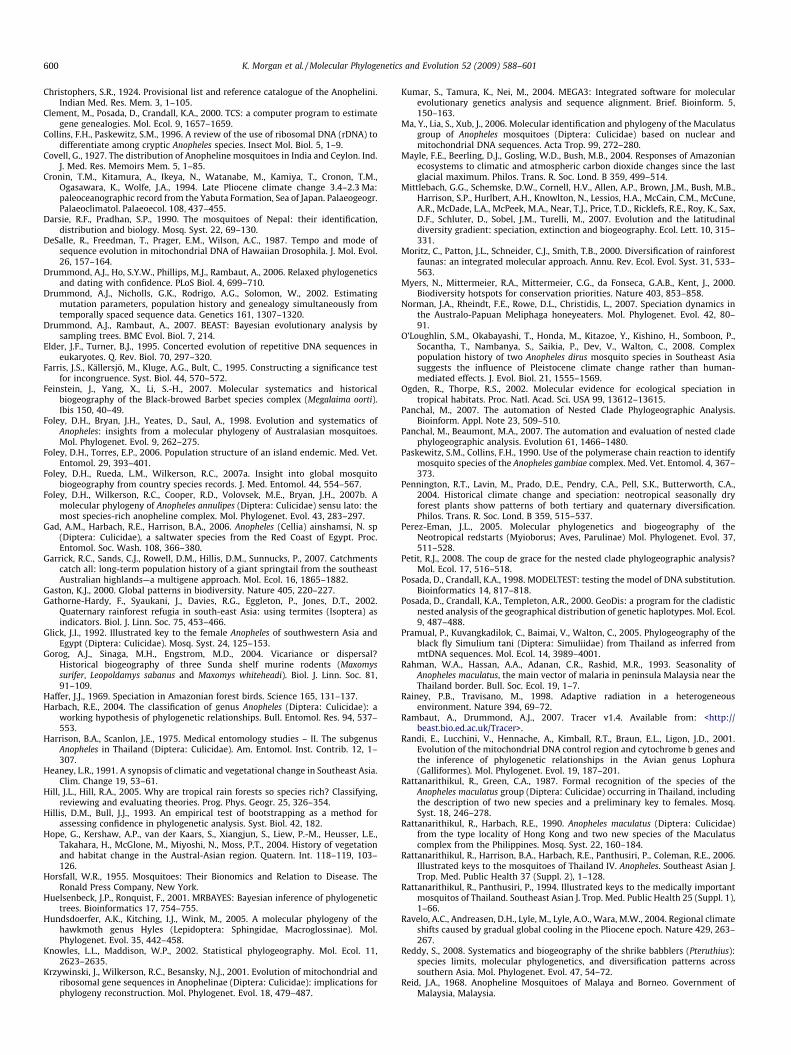
Fig. 3 shows the 50% majority rule consensus tree obtainedusing Bayesian analysis of the restricted rDNA dataset, the topol-ogy of which is in agreement with the phylogenetic trees obtainedusing both ML and NJ analyses. The Maculatus Group clade, as de-fined by the mtDNA data analysis, was strongly supported(PP = 100, BS = 100). The exclusion of An. pseudowillmori from thisclade was also supported, as the rDNA sequence of this speciescould not be aligned reliably with those from the other MaculatusGroup species. The Maculatus Group clade was split into two well-supported subclades, as in the mtDNA analysis. The first of thesecontains An. maculatus, An. dravidicus, An. greeni, An. dispar andAn. willmori (PP = 100, BS = 79); the second contains An. saw-adwongporni and An. maculatus species K (PP = 100, BS = 100).
The clade containing the Annularis Group species and An. pulch-errimus, An. jamesii and An. pseudojamesi was well supported(PP = 100, BS = 88). Anopheles jamesii, An. pseudojamesi and An.splendidus did not group together, in disagreement with the cur-rent classification of the Jamesii Group (Rattanarithikul et al.,2006). As in the mtDNA analysis, the Annularis Group clade in-
cluded all species currently classified within the Annularis Group(Harbach, 2004), as well as the currently unplaced An. pulcherri-mus. The Annularis Group clade, although poorly supported inthe mtDNA analysis, received strong support from the rDNA(PP = 100, BS = 98). As in the mtDNA analysis, the majority of nodeswithin the Annularis Group were poorly supported.
Although rDNA evolves by concerted evolution (Elder and Turn-er, 1995), and so is expected to homogenize rapidly within species,some intraspecific variation was noted (Fig. 3). The highest amountof intraspecific ribosomal divergence was seen within An. karwari,with both the ITS2 and D3 sequences sampled from Sri Lanka dif-fering from the mainland haplotype, by 15 bp and 4 bp, respec-tively. The single Sri Lankan An. maculatus specimen has ITS2 andD3 sequences that differ from the mainland sequences by one sub-stitution and one indel, and by two substitutions, respectively. InAn. annularis, the ITS2 locus had five sequence types involving a to-tal of six polymorphic sites as reported in Walton et al. (2007a).Some association of rDNA with geography can be detected, how-ever there is no association with the mitochondrial haplotype.
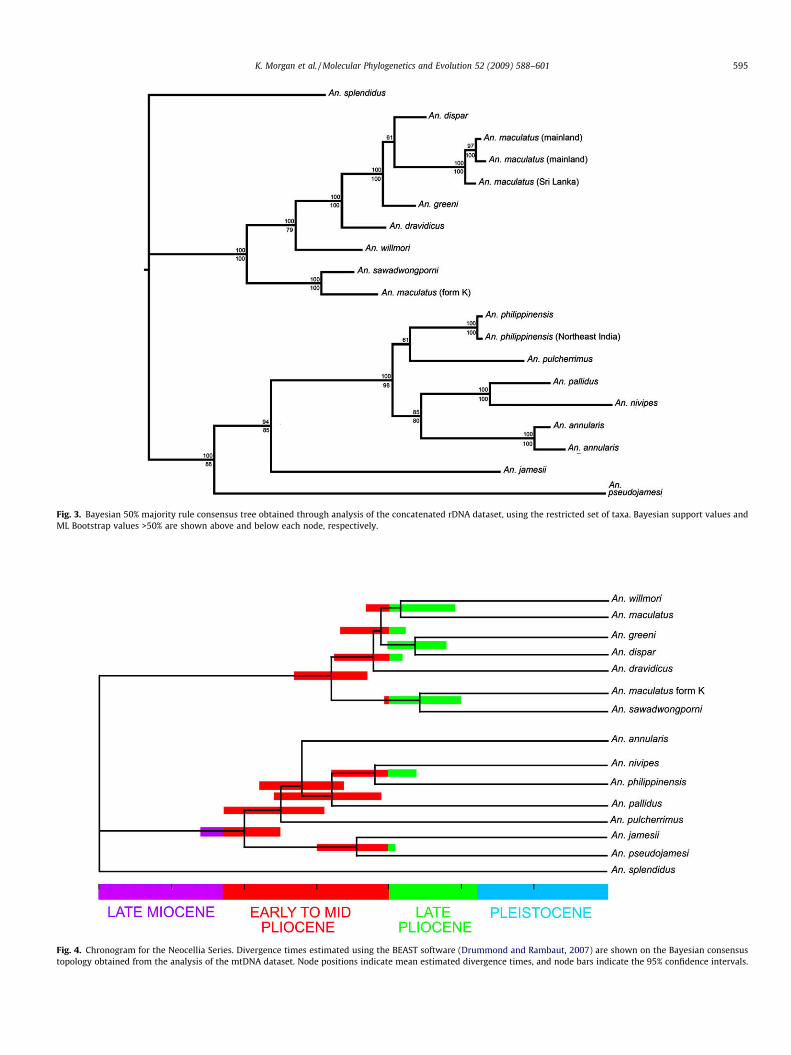
Fig. 3. Bayesian 50% majority rule consensus tree obtained through analysis of the concatenated rDNA dataset, using the restricted set of taxa. Bayesian support values andML Bootstrap values >50% are shown above and below each node, respectively.
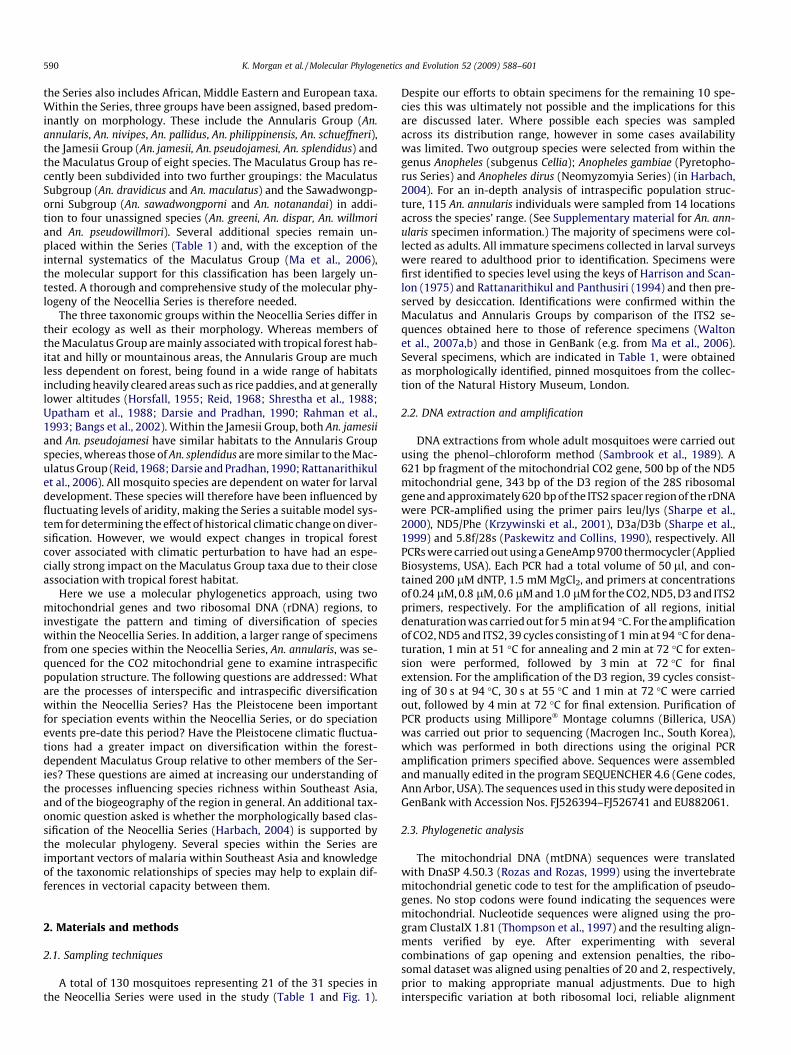
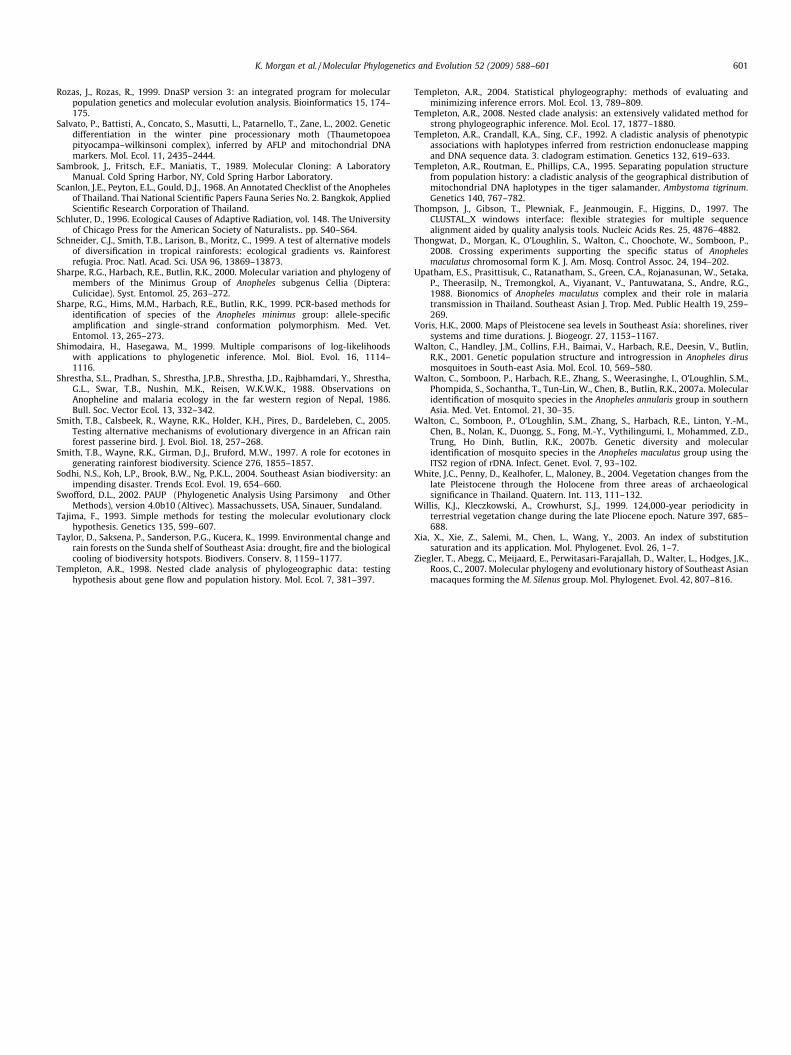
Fig. 4. Chronogram for the Neocellia Series. Divergence times estimated using the BEAST software (Drummond and Rambaut, 2007) are shown on the Bayesian consensustopology obtained from the analysis of the mtDNA dataset. Node positions indicate mean estimated divergence times, and node bars indicate the 95% confidence intervals.
K. Morgan et al. / Molecular Phylogenetics and Evolution 52 (2009) 588–601 595

596 K. Morgan et al. / Molecular Phylogenetics and Evolution 52 (2009) 588–601
Within An. philippinensis, the ITS2 sequence from northeastern In-dia differed by one substitution and an indel from the mainland se-quence. None of the other species where there were specimensfrom two or more geographical locations exhibited intraspecificvariation.
3.3. Divergence times
The estimated divergence times and their associated 95% confi-dence intervals are shown in Fig. 4. Whereas speciation within theAnnularis Group dates mainly to the early to mid Pliocene (3.2–4.5 mya), speciation within the Maculatus Group is inferred tohave occurred more recently, during the late Pliocene, with mostspeciation dated to between 2.6 and 3.2 mya. The divergence ofthe Jamesii Group (An. jamesii and An. pseudojamesi) is estimatedto have occurred slightly earlier than the Maculatus Group, duringthe mid to late Pliocene (3.4 ± 0.5 mya).
The divergence of the Sri Lankan and mainland An. karwarihaplotypes occurred during the late Pliocene (2.4 mya, 95% CI:1.9–2.9 mya). All other intraspecific divergence dates to thePleistocene. The two deep mtDNA clades within An. splendidus,composed of eastern individuals from Vietnam and Cambodia,and western individuals from northwestern Thailand and Myan-mar, differ by 23 fixed differences corresponding to an estimateddivergence time of 1.16 mya (95% CI: 0.79–1.55 mya). Within An.maculatus, the northern Myanmar and Sri Lankan haplotypeswere basal to the mainland haplotypes and diverged 1.27 myaand 0.6 mya, respectively (95% CI: 0.92–1.67 mya and 0.39–0.87 mya, respectively). The most divergent and basal haplotypewithin An. philippinensis also came from the west, from north-eastern India, with an estimated divergence time of 0.62 mya(95% CI: 0.36–0.89 mya). Within An. annularis the divergence be-tween the Philippines and mainland haplotypes occurred1.8 mya (95% CI: 1.49–2.26 mya), whereas eastern and western
Fig. 5. The distribution of each species within the Maculatus Group clade plotted against(foothill, submontane or montane) is also shown next to each species. Distributions and
lineages (see below) diverged slightly later, 1.12 mya (95% CI:0.78–1.75 mya).
3.4. Altitudinal replacement
Members of the Annularis Group are commonly found in low-land regions, whereas species within the Maculatus Group tendto be found at a wider range of altitudes, from the foothills tomountain peaks (Covell, 1927; Reid, 1968; Rattanarithikul et al.,2006). Within the Maculatus Subgroup, the relationship betweenphylogenetic position and approximate altitudinal distribution(Fig. 5) indicates speciation by altitudinal replacement, in whichthe distribution of one species replaces that of the sister speciesalong an altitudinal gradient (Moritz et al., 2000; Norman et al.,2007). Whereas the majority of species within the MaculatusGroup are found in the foothills, both An. dravidicus and An. will-mori replace An. maculatus at submontane and montane altitudes,respectively. The maximum altitudinal distribution of An. dravidi-cus has been reported as 1820 m, in the submontane tracts of theHimalayas (Covell, 1927) but it has also been collected at loweraltitudes; at 950 m in Myanmar, Pyin Oo Lwin District, and 450–500 m in Thailand, Mae Hong Son Province (K. Morgan, P. Somboonand C. Walton, unpublished data). Anopheles willmori generally hasa higher altitudinal distribution having been recorded at 990–1475 m in northern Thailand (Rattanarithikul et al., 2006),2500 m in the Himalayas (Covell, 1927), 3170 m in Nepal (Darsieand Pradhan, 1990) and 1800 m in Bhutan (P. Somboon, unpub-lished data).
3.5. Phylogeography of An. annularis
The mtDNA phylogeny (Fig. 2) shows that intraspecific diver-gence in An. annularis was high relative to other taxa. A separatephylogeographic study of this species was therefore carried out
phylogenetic position. The altitudinal range across which each species can be foundaltitudinal ranges are approximate.

K. Morgan et al. / Molecular Phylogenetics and Evolution 52 (2009) 588–601 597
to determine if there has been allopatric fragmentation, and to in-fer the likelihood of speciation. A total of 115 individuals across thespecies’ distributional range were sequenced for the mitochondrialCO2 gene, and several individuals within each mitochondrialhaplogroup were sequenced for the ribosomal ITS2 region. In boththe median joining haplotype network and the statistical parsi-mony nested cladogram, haplotypes within An. annularis clusterinto two highly divergent lineages separated by 14 mutations(Fig. 6). Both of these lineages (1 and 2) are further divided intotwo divergent clades (a and b). Clade 1a is made up primarily ofhaplotypes derived from the eastern mainland of Southeast Asia,specifically Vietnam, Cambodia and Laos, but also includes haplo-types from northwestern Thailand, and the north and southwestof Myanmar. Clade 1b comprises mainly haplotypes from northernMyanmar, as well as some from northwestern Thailand and centraland westerly Myanmar. Within the second more western distrib-uted lineage, clade 2a contains haplotypes derived from northeast-ern India, Sri Lanka and western and central Myanmar, whereasclade 2b contains only specimens from northeastern India and SriLanka. The An. annularis individual from the Philippines was highlydivergent from all other haplotypes in the network, differing fromthe most closely related haplotype by 17 mutations (Fig. 6). TheNCPA inferred a pattern of contiguous range expansion in the east-ern clade 1a, with restricted gene flow and some long distance dis-persal in the western clade 2b. Allopatric fragmentation wasinferred to have influenced the population history of the westernlineage (clade 2). Due to the high divergence between the easternand western lineages a conclusive outcome could not be reachedfor the total cladogram. However, the considerable divergence be-
Fig. 6. Median joining haplotype network for An. annularis. Circles represent unique haindicated, branch lengths are proportional to the number of mutations separating hahaplotype represents the sampling location, as indicated on the map.
tween all four clades and their distinctive geographical composi-tion clearly indicates allopatric fragmentation, with the deepest,and therefore probably oldest or most persistent, separation beingon the east and west of the mainland. Since individuals sampledfrom the same site frequently have haplotypes from several differ-ent clades it indicates that, on the mainland, populations have re-mixed following allopatric fragmentation.
4. Discussion
4.1. Systematics
The ribosomal DNA dataset had limited use for resolving deeperphylogenetic relationships due to the difficulty of aligning se-quences from more distantly related taxa, and was much moreuseful for resolving relationships within clades. Overall, the treetopologies obtained using a variety of phylogenetic methods andfrom both mitochondrial and nuclear markers were in good agree-ment, indicating that the gene trees presented here are a reliableindication of species relationships.
There are several differences between the implied taxonomicrelationships of the morphological-based classification (Harbach,2004), and the molecular phylogenies presented here. Notably,the Neocellia Series is not monophyletic. Indeed, four of the 21 spe-cies sampled in this study, An. karwari, An. ainshamsi, An. paltrinieriiand An. maculipalpis, were not placed within the ingroup of theNeocellia Series clade based on rDNA and (where available) mtDNAdata. Our results support the suggestion of Foley et al. (1998) thatthe Neocellia Series is paraphyletic, which was based on their
plotypes with the diameter proportional to haplotype frequency. Unless otherwiseplotypes. Unsampled intermediate haplotypes are not shown. The colour of each
598 K. Morgan et al. / Molecular Phylogenetics and Evolution 52 (2009) 588–601
mtDNA molecular phylogeny of Australasian Anopheles species inwhich two species of the Neocellia Series, An. karwari and An. ann-ularis, fell into different clades. The apparent grouping of An. kar-wari with the outgroup species, An. dirus, is likely to be anartifact due to long-branch attraction (Bergsten, 2005). This rela-tionship may therefore be removed by wider taxon samplingincluding the putative members of the Neocellia Series we wereunable to obtain. Even if increased taxon sampling resulted inthe inclusion of An. karwari in the monophyletic main clade(Fig. 2) the conclusion that the Series is paraphyletic would be un-changed as An. ainshamsi and the other African taxa sampled, An.paltrinierii and An. maculipalpis, are highly divergent. These resultsindicate that further molecular phylogenetic analyses are requiredto fully test morphological classifications within the genusAnopheles.
The Maculatus, Annularis and Jamesii Groups listed in Harbach(2004) receive mixed support from the molecular data. All classi-fied Maculatus Group species fell into a monophyletic clade, withthe exception of An. pseudowillmori, which appears to be distantlyrelated to the rest of the Maculatus Group. The grouping of Mac-ulatus Group species into two distinct subgroup clades was sup-ported, with the Maculatus Subgroup containing the currentlyunplaced An. willmori, An. greeni and An. dispar as well as An. mac-ulatus and An. dravidicus, and the Sawadwongporni Subgroup con-taining An. maculatus species K in addition to An. sawadwongporni.The findings of Ma et al. (2006), based on phylogenetic analysis ofITS2 and D3 sequences of five Maculatus Group species, agree lar-gely with our grouping structure but differ in not placing An. will-mori within either subgroup. The grouping of An. sawadwongporniwith An. maculatus species K concurs with their morphologicalsimilarity and the results of cross mating experiments (Thongwatet al., 2008). Although the Annularis Group was supported by themolecular phylogeny, the clade also included the currently un-placed An. pulcherrimus, as has also been suggested by Ma et al.(2006). The molecular phylogeny did not support the JamesiiGroup; the grouping of An. jamesii and An. pseudojamesi in amonophyletic clade received moderate support but the inclusionof An. splendidus within this clade was not supported. The unsam-pled putative Neocellia Series taxa, particularly An. schueffneri andAn. notanandai, which are currently classified in the Annularisand Maculatus Groups, respectively, could affect the extent ofsupport for distinct Annularis and Maculatus and Group clades.However, the unsampled taxa will not have any major effect onthe dating and locations of speciation events within these groups,so the biogeographical inferences (see below) are expected to berobust.
Anopheles karwari from Sri Lanka is very likely to be a distinctspecies from that present on the mainland, based on the high levelof divergence observed in both mtDNA and rDNA, which dates to asimilar time (the late Pliocene) as the most closely related speciesof the Maculatus Group. It has been suggested that An. annularis isa complex of at least two sibling species (Rattanarithikul et al.,2006) and a considerable level of east–west divergence was notedin An. annularis, and also in An. splendidus. However, the lack of cor-responding divergence in their rDNA indicates that allopatric frag-mentation in these species has most likely not resulted inspeciation as the rDNA appears to have largely homogenised, sug-gesting ongoing gene flow.
The Mosquito Barcoding Initiative has selected the mitochon-drial gene CO1 as the marker for species identification (Y. Linton,personal communication). All species within this study could bedifferentiated from one another based on their CO2 and ND5 se-quences indicating that mtDNA has the resolving power to distin-guish species. However, large levels of intraspecific divergencewere detected within several species, including An. annularisand An. splendidus. The possibility of such intraspecific divergence
should be taken into consideration when using mtDNA as a bar-coding marker, as it could lead to the erroneous identificationof individuals from divergent intraspecific lineages as separatespecies.
4.2. Biogeography
The majority of speciation events within the Annularis Groupoccurred during the early and mid Pliocene, predating the onsetof the Pleistocene glaciations by more than a million years. The cli-mate during this period was warm and humid (Chandler et al.,1994), so tropical forest is likely to have been widespread acrossSoutheast Asia and larval habitats abundant. This may have in-creased niche availability and facilitated the spread of the Annular-is Group, the distribution of which extends from Southwest toSoutheast Asia. With the exception of An. pulcherrimus in South-west Asia and India (Glick, 1992), most species in the AnnularisGroup are found across the Oriental Region and do not exhibit allo-patric distributions that might indicate allopatric speciation (Wal-ton et al., 2007a). However, this signal often erodes over time dueto dispersal (Barraclough and Nee, 2001). This could well be thecase in the Annularis Group, as suitable habitat is available acrossSoutheast Asia, the dispersal capacity of the mosquitoes is high(Reid, 1968; Scanlon et al., 1968) and there has been substantialtime since speciation. In the Annularis Group we are therefore un-able to distinguish between the alternative hypotheses of allopat-ric speciation and sympatric ecological speciation, particularly aswe have very little data on the ecology of each species within thegroup.
Speciation of An. jamesii and An. pseudojamesi, An. nivipes andAn. philippinensis, and within the Maculatus Group, is estimatedto have occurred during the mid to late Pliocene. This period alsoappears to have been an important time for diversification in otherforest-dependent taxa across mainland and insular Southeast Asia;within the forest-dependent Lophura gallopheasants (Randi et al.,2001), and in the Southeast Asian Black-browed Barbets (Feinsteinet al., 2007). The driving force for this diversification was suggestedto have been increasing forest fragmentation, which is likely tohave been associated with Pliocene climatic change (Ravelo et al.,2004). The late Pliocene was characterised by a large global cli-matic transition that began 2.8 mya, before which global tempera-tures were an estimated 3 �C higher than those today, precipitationlevels were high and consequently tropical forest cover acrossSoutheast Asia would have been extensive (Chandler et al., 1994;Cronin et al., 1994). The climatic transition was followed by a per-iod of rapidly decreasing temperatures and increasing aridity, dur-ing which tropical forest is likely to have been increasinglyreplaced with grassland and savannah (Willis et al., 1999; Raveloet al., 2004). The dating of speciation to this period in the Macula-tus Group, and the tendency of the species to be distributed some-what allopatrically (Fig. 5), is consistent with allopatric speciationtriggered by isolation in fragmented forest refugia. In particular,the species of the Sawadwongporni Subgroup have more easterlydistributions whereas the basal taxon in the Maculatus Subgroup,An. dravidicus, has a more westerly distribution (Fig. 5) indicatingan early east–west split. The clearer signal of allopatric distributionin the Maculatus Group than the Annularis Group may indicate agreater importance of allopatric speciation in these more forest-dependent species. Alternatively, there may simply have been lessopportunity for the signal of allopatric speciation to be eroded inthe Maculatus Group.
The molecular phylogeny indicates that An. greeni and An. disparspeciated during the late Pliocene. The unique biodiversity of thePhilippines is attributed partly to the fact that this is the only ma-jor island region in Southeast Asia that remained entirely discon-nected from the mainland throughout the Pleistocene (Sodhi
K. Morgan et al. / Molecular Phylogenetics and Evolution 52 (2009) 588–601 599
et al., 2004). Although there are currently sea barriers between thePhilippines and the mainland, dispersal of an ancestral form mayhave been facilitated during the late Pliocene if sea levels werelower, as during the Pleistocene glacial maxima, decreasing thedistance between the Philippines and Borneo (Voris, 2000). Thisis in accord with the suggestion that another Anopheles species,An. flavirostris, dispersed from Borneo to the Philippines at periodsof lower sea level (Foley and Torres, 2006).
There is also evidence that ecological adaptation has played arole in driving diversification of the Maculatus Group. Whereasthe majority of Neocellia species are found at relatively broad alti-tudinal ranges and lay their eggs in stagnant water, all specieswithin the Maculatus Group are found in forested foothill or moun-tainous regions and lay their eggs primarily near to running watersuch as along the margins of streams, or in the rocky pools associ-ated with streams (Reid, 1968; Rattanarithikul et al., 2006). Theradiation of the Maculatus Group may therefore have been in re-sponse to the opening up of a new ecological niche, as has been ob-served in other taxa (Schluter, 1996; Rainey and Travisano, 1998).Since ecological conditions, particularly larval habitat, are likely tovary with altitude, the altitudinal replacement in the MaculatusGroup may be the result of ecological speciation, with populationsat differing altitudes becoming adapted to the ecological condi-tions predominant at each altitudinal zone (Moritz et al., 2000).There is also some suggestion of altitudinal replacement in thePhilippines species with An. dispar being more common at higheraltitudes than An. greeni (Rattanarithikul and Harbach, 1990). Fi-nally, it seems very likely that seasonality has pressured ecologicaladaptation and influenced divergence within the Maculatus Group;mosquito collections made in the Mae Hong Song Province ofnorthwestern Thailand throughout 2001 and 2002 revealed a high-er prevalence of An. maculatus during the dry season and of An.sawadwongporni during the wet season (v2 = 44.35, p < 0.0001; to-tal number of mosquitoes = 176 (P. Somboon, C. Walton, unpub-lished data)).
All Pleistocene-dated divergence events occurred within speciesindicating that, although this time period has not been importantfor speciation in the Neocellia Series, the Pleistocene glaciationshave shaped genetic diversity within species. Although (with theexception of An. annularis) sample sizes within species are limited,some general patterns of geographical divergence emerged. Firstly,divergent, and sometimes basal, haplotypes were found in Sri Lan-ka (An. maculatus and An. karwari), northeastern India (An. philip-pinensis) and northern Myanmar (An. maculatus), suggesting thatthese western regions may have contained forest refugia duringPleistocene glacial periods. This concurs with previous suggestionsbased on zoogeographic and systematic evidence in the case of SriLanka (Brandon-Jones, 1996). Furthermore, both northeastern In-dia and northern Myanmar are mountainous (Fig. 1), and thereforelikely to have retained pockets of forest habitat at intermediateelevations throughout the Pleistocene (Brandon-Jones, 1996; Gath-orne-Hardy et al., 2002; O’Loughlin et al., 2008). The second pat-tern of intraspecific divergence detected (in An. annularis and An.splendidus) was that of east–west divergence centred approxi-mately on the Thai–Myanmar border. This suggests that at leastone refugium existed in the east of Southeast Asia, as well as theproposed refugial regions in the west. These processes of allopatricfragmentation within species inferred from both the phylogeneticand phylogeographic data may well reflect those that have contrib-uted to allopatric speciation in earlier time periods.
5. Conclusions
There are several discrepancies between the molecular phylog-eny and the current classification of the Neocellia Series, indicating
that the classification may require revision. Although Pleistoceneenvironmental fluctuation appears to have influenced intraspecificpopulation history, driving allopatric diversification during periodsof habitat fragmentation, it has not triggered speciation in the Neo-cellia Series. Instead, all speciation dates to the Pliocene but couldhave been influenced by climatic shifts that occurred at this earliertime. Even if allopatric fragmentation has played some role in spe-ciation in the Maculatus Group, ecological adaptation, following ashift into a new ecological niche and involving altitudinal replace-ment and seasonality, appears to have played an important role indriving divergence. The importance of both pre-Pleistocene allo-patric divergence and ecological adaptation in driving speciationwithin Anopheles mosquitoes, and of forest fragmentation drivenby Pleistocene climatic change in driving intraspecific divergence,is likely to be mirrored in other forest-dependent taxa across theregion. Studies of such taxa are needed to determine which ofthe above processes have played major roles in the generation ofspecies richness and intraspecific diversity across the region.
Acknowledgments
We thank the staff at the Office of Disease Prevention and Con-trol in Chiang Mai, Thailand, the Centers of Malariology, Parasitol-ogy and Entomology in Vientiane, Laos (under the direction of Dr.Samlane Phompida), and Phnom Penh, Cambodia (under the direc-tion of Dr. Duong Socheat), the Department of Medical Research inMyanmar, Gauhati University, and the Malaria Research Centers inAssam and Bangladesh, for all their invaluable help in mosquitocollection. David Robertson and James Eales, University of Man-chester, provided much appreciated help and advice regardingthe phylogenetic analysis. We thank the anonymous reviewersfor their helpful comments and suggestions. This work was fundedby a NERC studentship to Katy Morgan with the Natural HistoryMuseum as a CASE partner.
Appendix A. Supplementary data
Supplementary data associated with this article can be found, inthe online version, at doi:10.1016/j.ympev.2009.01.022.
References
Albre, J., Gers, C., Legal, L., 2008. Molecular phylogeny of the Erebia tyndarus(Lepidoptera, Rhopalocera, Nymphalidae, Satyrinae) species group combiningCoxII and ND5 mitochondrial genes: a case study of a recent radiation. Mol.Phylogenet. Evol. 47, 196–210.
Bandelt, H.-J., Forster, P., Rohl, A., 1999. Median-joining networks for inferringintraspecific phylogenies. Mol. Biol. Evol. 16, 37–48.
Bangs, M.J., Soelarto, T., Barodji, Wicaksana, B.P., Boewono, D.T., 2002. Colonizationof Anopheles maculatus from Central Java, Indonesia. J. Am. Mosq. Control Assoc.18, 359–363.
Barraclough, T.G., Nee, S., 2001. Phylogenetics and speciation. Trends Ecol. Evol. 16,391–399.
Bergsten, J., 2005. A review of long-branch attraction. Cladistics 21, 163–193.Brandon-Jones, D., 1996. The Asian Colobinae (Mammalia: Cercopithecidae) as
indicators of quaternary climatic change. Biol. J. Linn. Soc. 59, 327–350.Brook, B.W., Sodhi, N.S., Ng, P.K.L., 2003. Catastrophic extinctions follow
deforestation in Singapore. Nature 424, 420–424.Brower, A., 1994. Rapid morphological radiation and convergence among races of
the butterfly Heliconius erato inferred from patterns of mitochondrial DNAevolution. Proc. Natl. Acad. Sci. USA 91, 6491–6495.
Burns, K.J., Naoki, K., 2004. Molecular phylogenetics and biogeography ofNeotropical tanagers in the genus Tangara. Mol. Phylogenet. Evol. 32, 838–854.
Bush, M.B., 2005. Of orogeny, precipitation, precession and parrots. J. Biogeogr. 32,1301–1302.
Cannon, C.H., Manos, P.S., 2003. Phylogeography of the Southeast Asian stone oaks(Lithocarpus). J. Biogeogr. 30, 211–226.
Chandler, M., Rind, D., Thompson, R., 1994. Joint investigations of the middlePliocene climate II: GISS GCM Northern Hemisphere results. Global Planet.Change 9, 197–219.
Chen, B., Harbach, R.E., Butlin, R.K., 2004. Genetic variation and population structureof the mosquito Anopheles jeyporiensis in southern China. Mol. Ecol. 13, 3051–3056.
600 K. Morgan et al. / Molecular Phylogenetics and Evolution 52 (2009) 588–601
Christophers, S.R., 1924. Provisional list and reference catalogue of the Anophelini.Indian Med. Res. Mem. 3, 1–105.
Clement, M., Posada, D., Crandall, K.A., 2000. TCS: a computer program to estimategene genealogies. Mol. Ecol. 9, 1657–1659.
Collins, F.H., Paskewitz, S.M., 1996. A review of the use of ribosomal DNA (rDNA) todifferentiate among cryptic Anopheles species. Insect Mol. Biol. 5, 1–9.
Covell, G., 1927. The distribution of Anopheline mosquitoes in India and Ceylon. Ind.J. Med. Res. Memoirs Mem. 5, 1–85.
Cronin, T.M., Kitamura, A., Ikeya, N., Watanabe, M., Kamiya, T., Cronon, T.M.,Ogasawara, K., Wolfe, J.A., 1994. Late Pliocene climate change 3.4–2.3 Ma:paleoceanographic record from the Yabuta Formation, Sea of Japan. Palaeogeogr.Palaeoclimatol. Palaeoecol. 108, 437–455.
Darsie, R.F., Pradhan, S.P., 1990. The mosquitoes of Nepal: their identification,distribution and biology. Mosq. Syst. 22, 69–130.
DeSalle, R., Freedman, T., Prager, E.M., Wilson, A.C., 1987. Tempo and mode ofsequence evolution in mitochondrial DNA of Hawaiian Drosophila. J. Mol. Evol.26, 157–164.
Drummond, A.J., Ho, S.Y.W., Phillips, M.J., Rambaut, A., 2006. Relaxed phylogeneticsand dating with confidence. PLoS Biol. 4, 699–710.
Drummond, A.J., Nicholls, G.K., Rodrigo, A.G., Solomon, W., 2002. Estimatingmutation parameters, population history and genealogy simultaneously fromtemporally spaced sequence data. Genetics 161, 1307–1320.
Drummond, A.J., Rambaut, A., 2007. BEAST: Bayesian evolutionary analysis bysampling trees. BMC Evol. Biol. 7, 214.
Elder, J.F., Turner, B.J., 1995. Concerted evolution of repetitive DNA sequences ineukaryotes. Q. Rev. Biol. 70, 297–320.
Farris, J.S., Källersjö, M., Kluge, A.G., Bult, C., 1995. Constructing a significance testfor incongruence. Syst. Biol. 44, 570–572.
Feinstein, J., Yang, X., Li, S.-H., 2007. Molecular systematics and historicalbiogeography of the Black-browed Barbet species complex (Megalaima oorti).Ibis 150, 40–49.
Foley, D.H., Bryan, J.H., Yeates, D., Saul, A., 1998. Evolution and systematics ofAnopheles: insights from a molecular phylogeny of Australasian mosquitoes.Mol. Phylogenet. Evol. 9, 262–275.
Foley, D.H., Torres, E.P., 2006. Population structure of an island endemic. Med. Vet.Entomol. 29, 393–401.
Foley, D.H., Rueda, L.M., Wilkerson, R.C., 2007a. Insight into global mosquitobiogeography from country species records. J. Med. Entomol. 44, 554–567.
Foley, D.H., Wilkerson, R.C., Cooper, R.D., Volovsek, M.E., Bryan, J.H., 2007b. Amolecular phylogeny of Anopheles annulipes (Diptera: Culicidae) sensu lato: themost species-rich anopheline complex. Mol. Phylogenet. Evol. 43, 283–297.
Gad, A.M., Harbach, R.E., Harrison, B.A., 2006. Anopheles (Cellia) ainshamsi, N. sp(Diptera: Culicidae), a saltwater species from the Red Coast of Egypt. Proc.Entomol. Soc. Wash. 108, 366–380.
Garrick, R.C., Sands, C.J., Rowell, D.M., Hillis, D.M., Sunnucks, P., 2007. Catchmentscatch all: long-term population history of a giant springtail from the southeastAustralian highlands—a multigene approach. Mol. Ecol. 16, 1865–1882.
Gaston, K.J., 2000. Global patterns in biodiversity. Nature 405, 220–227.Gathorne-Hardy, F., Syaukani, J., Davies, R.G., Eggleton, P., Jones, D.T., 2002.
Quaternary rainforest refugia in south-east Asia: using termites (Isoptera) asindicators. Biol. J. Linn. Soc. 75, 453–466.
Glick, J.I., 1992. Illustrated key to the female Anopheles of southwestern Asia andEgypt (Diptera: Culicidae). Mosq. Syst. 24, 125–153.
Gorog, A.J., Sinaga, M.H., Engstrom, M.D., 2004. Vicariance or dispersal?Historical biogeography of three Sunda shelf murine rodents (Maxomyssurifer, Leopoldamys sabanus and Maxomys whiteheadi). Biol. J. Linn. Soc. 81,91–109.
Haffer, J.J., 1969. Speciation in Amazonian forest birds. Science 165, 131–137.Harbach, R.E., 2004. The classification of genus Anopheles (Diptera: Culicidae): a
working hypothesis of phylogenetic relationships. Bull. Entomol. Res. 94, 537–553.
Harrison, B.A., Scanlon, J.E., 1975. Medical entomology studies – II. The subgenusAnopheles in Thailand (Diptera: Culicidae). Am. Entomol. Inst. Contrib. 12, 1–307.
Heaney, L.R., 1991. A synopsis of climatic and vegetational change in Southeast Asia.Clim. Change 19, 53–61.
Hill, J.L., Hill, R.A., 2005. Why are tropical rain forests so species rich? Classifying,reviewing and evaluating theories. Prog. Phys. Geogr. 25, 326–354.
Hillis, D.M., Bull, J.J., 1993. An empirical test of bootstrapping as a method forassessing confidence in phylogenetic analysis. Syst. Biol. 42, 182.
Hope, G., Kershaw, A.P., van der Kaars, S., Xiangjun, S., Liew, P.-M., Heusser, L.E.,Takahara, H., McGlone, M., Miyoshi, N., Moss, P.T., 2004. History of vegetationand habitat change in the Austral-Asian region. Quatern. Int. 118–119, 103–126.
Horsfall, W.R., 1955. Mosquitoes: Their Bionomics and Relation to Disease. TheRonald Press Company, New York.
Huelsenbeck, J.P., Ronquist, F., 2001. MRBAYES: Bayesian inference of phylogenetictrees. Bioinformatics 17, 754–755.
Hundsdoerfer, A.K., Kitching, I.J., Wink, M., 2005. A molecular phylogeny of thehawkmoth genus Hyles (Lepidoptera: Sphingidae, Macroglossinae). Mol.Phylogenet. Evol. 35, 442–458.
Knowles, L.L., Maddison, W.P., 2002. Statistical phylogeography. Mol. Ecol. 11,2623–2635.
Krzywinski, J., Wilkerson, R.C., Besansky, N.J., 2001. Evolution of mitochondrial andribosomal gene sequences in Anophelinae (Diptera: Culicidae): implications forphylogeny reconstruction. Mol. Phylogenet. Evol. 18, 479–487.
Kumar, S., Tamura, K., Nei, M., 2004. MEGA3: Integrated software for molecularevolutionary genetics analysis and sequence alignment. Brief. Bioinform. 5,150–163.
Ma, Y., Lia, S., Xub, J., 2006. Molecular identification and phylogeny of the Maculatusgroup of Anopheles mosquitoes (Diptera: Culicidae) based on nuclear andmitochondrial DNA sequences. Acta Trop. 99, 272–280.
Mayle, F.E., Beerling, D.J., Gosling, W.D., Bush, M.B., 2004. Responses of Amazonianecosystems to climatic and atmospheric carbon dioxide changes since the lastglacial maximum. Philos. Trans. R. Soc. Lond. B 359, 499–514.
Mittlebach, G.G., Schemske, D.W., Cornell, H.V., Allen, A.P., Brown, J.M., Bush, M.B.,Harrison, S.P., Hurlbert, A.H., Knowlton, N., Lessios, H.A., McCain, C.M., McCune,A.R., McDade, L.A., McPeek, M.A., Near, T.J., Price, T.D., Ricklefs, R.E., Roy, K., Sax,D.F., Schluter, D., Sobel, J.M., Turelli, M., 2007. Evolution and the latitudinaldiversity gradient: speciation, extinction and biogeography. Ecol. Lett. 10, 315–331.
Moritz, C., Patton, J.L., Schneider, C.J., Smith, T.B., 2000. Diversification of rainforestfaunas: an integrated molecular approach. Annu. Rev. Ecol. Evol. Syst. 31, 533–563.
Myers, N., Mittermeier, R.A., Mittermeier, C.G., da Fonseca, G.A.B., Kent, J., 2000.Biodiversity hotspots for conservation priorities. Nature 403, 853–858.
Norman, J.A., Rheindt, F.E., Rowe, D.L., Christidis, L., 2007. Speciation dynamics inthe Australo-Papuan Meliphaga honeyeaters. Mol. Phylogenet. Evol. 42, 80–91.
O’Loughlin, S.M., Okabayashi, T., Honda, M., Kitazoe, Y., Kishino, H., Somboon, P.,Socantha, T., Nambanya, S., Saikia, P., Dev, V., Walton, C., 2008. Complexpopulation history of two Anopheles dirus mosquito species in Southeast Asiasuggests the influence of Pleistocene climate change rather than human-mediated effects. J. Evol. Biol. 21, 1555–1569.
Ogden, R., Thorpe, R.S., 2002. Molecular evidence for ecological speciation intropical habitats. Proc. Natl. Acad. Sci. USA 99, 13612–13615.
Panchal, M., 2007. The automation of Nested Clade Phylogeographic Analysis.Bioinform. Appl. Note 23, 509–510.
Panchal, M., Beaumont, M.A., 2007. The automation and evaluation of nested cladephylogeographic analysis. Evolution 61, 1466–1480.
Paskewitz, S.M., Collins, F.H., 1990. Use of the polymerase chain reaction to identifymosquito species of the Anopheles gambiae complex. Med. Vet. Entomol. 4, 367–373.
Pennington, R.T., Lavin, M., Prado, D.E., Pendry, C.A., Pell, S.K., Butterworth, C.A.,2004. Historical climate change and speciation: neotropical seasonally dryforest plants show patterns of both tertiary and quaternary diversification.Philos. Trans. R. Soc. Lond. B 359, 515–537.
Perez-Eman, J.L., 2005. Molecular phylogenetics and biogeography of theNeotropical redstarts (Myioborus; Aves, Parulinae) Mol. Phylogenet. Evol. 37,511–528.
Petit, R.J., 2008. The coup de grace for the nested clade phylogeographic analysis?Mol. Ecol. 17, 516–518.
Posada, D., Crandall, K.A., 1998. MODELTEST: testing the model of DNA substitution.Bioinformatics 14, 817–818.
Posada, D., Crandall, K.A., Templeton, A.R., 2000. GeoDis: a program for the cladisticnested analysis of the geographical distribution of genetic haplotypes. Mol. Ecol.9, 487–488.
Pramual, P., Kuvangkadilok, C., Baimai, V., Walton, C., 2005. Phylogeography of theblack fly Simulium tani (Diptera: Simuliidae) from Thailand as inferred frommtDNA sequences. Mol. Ecol. 14, 3989–4001.
Rahman, W.A., Hassan, A.A., Adanan, C.R., Rashid, M.R., 1993. Seasonality ofAnopheles maculatus, the main vector of malaria in peninsula Malaysia near theThailand border. Bull. Soc. Ecol. 19, 1–7.
Rainey, P.B., Travisano, M., 1998. Adaptive radiation in a heterogeneousenvironment. Nature 394, 69–72.
Rambaut, A., Drummond, A.J., 2007. Tracer v1.4. Available from: <http://beast.bio.ed.ac.uk/Tracer>.
Randi, E., Lucchini, V., Hennache, A., Kimball, R.T., Braun, E.L., Ligon, J.D., 2001.Evolution of the mitochondrial DNA control region and cytochrome b genes andthe inference of phylogenetic relationships in the Avian genus Lophura(Galliformes). Mol. Phylogenet. Evol. 19, 187–201.
Rattanarithikul, R., Green, C.A., 1987. Formal recognition of the species of theAnopheles maculatus group (Diptera: Culicidae) occurring in Thailand, includingthe description of two new species and a preliminary key to females. Mosq.Syst. 18, 246–278.
Rattanarithikul, R., Harbach, R.E., 1990. Anopheles maculatus (Diptera: Culicidae)from the type locality of Hong Kong and two new species of the Maculatuscomplex from the Philippines. Mosq. Syst. 22, 160–184.
Rattanarithikul, R., Harrison, B.A., Harbach, R.E., Panthusiri, P., Coleman, R.E., 2006.Illustrated keys to the mosquitoes of Thailand IV. Anopheles. Southeast Asian J.Trop. Med. Public Health 37 (Suppl. 2), 1–128.
Rattanarithikul, R., Panthusiri, P., 1994. Illustrated keys to the medically importantmosquitos of Thailand. Southeast Asian J. Trop. Med. Public Health 25 (Suppl. 1),1–66.
Ravelo, A.C., Andreasen, D.H., Lyle, M., Lyle, A.O., Wara, M.W., 2004. Regional climateshifts caused by gradual global cooling in the Pliocene epoch. Nature 429, 263–267.
Reddy, S., 2008. Systematics and biogeography of the shrike babblers (Pteruthius):species limits, molecular phylogenetics, and diversification patterns acrosssouthern Asia. Mol. Phylogenet. Evol. 47, 54–72.
Reid, J.A., 1968. Anopheline Mosquitoes of Malaya and Borneo. Government ofMalaysia, Malaysia.
K. Morgan et al. / Molecular Phylogenetics and Evolution 52 (2009) 588–601 601
Rozas, J., Rozas, R., 1999. DnaSP version 3: an integrated program for molecularpopulation genetics and molecular evolution analysis. Bioinformatics 15, 174–175.
Salvato, P., Battisti, A., Concato, S., Masutti, L., Patarnello, T., Zane, L., 2002. Geneticdifferentiation in the winter pine processionary moth (Thaumetopoeapityocampa–wilkinsoni complex), inferred by AFLP and mitochondrial DNAmarkers. Mol. Ecol. 11, 2435–2444.
Sambrook, J., Fritsch, E.F., Maniatis, T., 1989. Molecular Cloning: A LaboratoryManual. Cold Spring Harbor, NY, Cold Spring Harbor Laboratory.
Scanlon, J.E., Peyton, E.L., Gould, D.J., 1968. An Annotated Checklist of the Anophelesof Thailand. Thai National Scientific Papers Fauna Series No. 2. Bangkok, AppliedScientific Research Corporation of Thailand.
Schluter, D., 1996. Ecological Causes of Adaptive Radiation, vol. 148. The Universityof Chicago Press for the American Society of Naturalists.. pp. S40–S64.
Schneider, C.J., Smith, T.B., Larison, B., Moritz, C., 1999. A test of alternative modelsof diversification in tropical rainforests: ecological gradients vs. Rainforestrefugia. Proc. Natl. Acad. Sci. USA 96, 13869–13873.
Sharpe, R.G., Harbach, R.E., Butlin, R.K., 2000. Molecular variation and phylogeny ofmembers of the Minimus Group of Anopheles subgenus Cellia (Diptera:Culicidae). Syst. Entomol. 25, 263–272.
Sharpe, R.G., Hims, M.M., Harbach, R.E., Butlin, R.K., 1999. PCR-based methods foridentification of species of the Anopheles minimus group: allele-specificamplification and single-strand conformation polymorphism. Med. Vet.Entomol. 13, 265–273.
Shimodaira, H., Hasegawa, M., 1999. Multiple comparisons of log-likelihoodswith applications to phylogenetic inference. Mol. Biol. Evol. 16, 1114–1116.
Shrestha, S.L., Pradhan, S., Shrestha, J.P.B., Shrestha, J.D., Rajbhamdari, Y., Shrestha,G.L., Swar, T.B., Nushin, M.K., Reisen, W.K.W.K., 1988. Observations onAnopheline and malaria ecology in the far western region of Nepal, 1986.Bull. Soc. Vector Ecol. 13, 332–342.
Smith, T.B., Calsbeek, R., Wayne, R.K., Holder, K.H., Pires, D., Bardeleben, C., 2005.Testing alternative mechanisms of evolutionary divergence in an African rainforest passerine bird. J. Evol. Biol. 18, 257–268.
Smith, T.B., Wayne, R.K., Girman, D.J., Bruford, M.W., 1997. A role for ecotones ingenerating rainforest biodiversity. Science 276, 1855–1857.
Sodhi, N.S., Koh, L.P., Brook, B.W., Ng, P.K.L., 2004. Southeast Asian biodiversity: animpending disaster. Trends Ecol. Evol. 19, 654–660.
Swofford, D.L., 2002. PAUP� (Phylogenetic Analysis Using Parsimony � and OtherMethods), version 4.0b10 (Altivec). Massachussets, USA, Sinauer, Sundaland.
Tajima, F., 1993. Simple methods for testing the molecular evolutionary clockhypothesis. Genetics 135, 599–607.
Taylor, D., Saksena, P., Sanderson, P.G., Kucera, K., 1999. Environmental change andrain forests on the Sunda shelf of Southeast Asia: drought, fire and the biologicalcooling of biodiversity hotspots. Biodivers. Conserv. 8, 1159–1177.
Templeton, A.R., 1998. Nested clade analysis of phylogeographic data: testinghypothesis about gene flow and population history. Mol. Ecol. 7, 381–397.
Templeton, A.R., 2004. Statistical phylogeography: methods of evaluating andminimizing inference errors. Mol. Ecol. 13, 789–809.
Templeton, A.R., 2008. Nested clade analysis: an extensively validated method forstrong phylogeographic inference. Mol. Ecol. 17, 1877–1880.
Templeton, A.R., Crandall, K.A., Sing, C.F., 1992. A cladistic analysis of phenotypicassociations with haplotypes inferred from restriction endonuclease mappingand DNA sequence data. 3. cladogram estimation. Genetics 132, 619–633.
Templeton, A.R., Routman, E., Phillips, C.A., 1995. Separating population structurefrom population history: a cladistic analysis of the geographical distribution ofmitochondrial DNA haplotypes in the tiger salamander, Ambystoma tigrinum.Genetics 140, 767–782.
Thompson, J., Gibson, T., Plewniak, F., Jeanmougin, F., Higgins, D., 1997. TheCLUSTAL_X windows interface: flexible strategies for multiple sequencealignment aided by quality analysis tools. Nucleic Acids Res. 25, 4876–4882.
Thongwat, D., Morgan, K., O’Loughlin, S., Walton, C., Choochote, W., Somboon, P.,2008. Crossing experiments supporting the specific status of Anophelesmaculatus chromosomal form K. J. Am. Mosq. Control Assoc. 24, 194–202.
Upatham, E.S., Prasittisuk, C., Ratanatham, S., Green, C.A., Rojanasunan, W., Setaka,P., Theerasilp, N., Tremongkol, A., Viyanant, V., Pantuwatana, S., Andre, R.G.,1988. Bionomics of Anopheles maculatus complex and their role in malariatransmission in Thailand. Southeast Asian J. Trop. Med. Public Health 19, 259–269.
Voris, H.K., 2000. Maps of Pleistocene sea levels in Southeast Asia: shorelines, riversystems and time durations. J. Biogeogr. 27, 1153–1167.
Walton, C., Handley, J.M., Collins, F.H., Baimai, V., Harbach, R.E., Deesin, V., Butlin,R.K., 2001. Genetic population structure and introgression in Anopheles dirusmosquitoes in South-east Asia. Mol. Ecol. 10, 569–580.
Walton, C., Somboon, P., Harbach, R.E., Zhang, S., Weerasinghe, I., O’Loughlin, S.M.,Phompida, S., Sochantha, T., Tun-Lin, W., Chen, B., Butlin, R.K., 2007a. Molecularidentification of mosquito species in the Anopheles annularis group in southernAsia. Med. Vet. Entomol. 21, 30–35.
Walton, C., Somboon, P., O’Loughlin, S.M., Zhang, S., Harbach, R.E., Linton, Y.-M.,Chen, B., Nolan, K., Duongg, S., Fong, M.-Y., Vythilingumi, I., Mohammed, Z.D.,Trung, Ho Dinh, Butlin, R.K., 2007b. Genetic diversity and molecularidentification of mosquito species in the Anopheles maculatus group using theITS2 region of rDNA. Infect. Genet. Evol. 7, 93–102.
White, J.C., Penny, D., Kealhofer, L., Maloney, B., 2004. Vegetation changes from thelate Pleistocene through the Holocene from three areas of archaeologicalsignificance in Thailand. Quatern. Int. 113, 111–132.
Willis, K.J., Kleczkowski, A., Crowhurst, S.J., 1999. 124,000-year periodicity interrestrial vegetation change during the late Pliocene epoch. Nature 397, 685–688.
Xia, X., Xie, Z., Salemi, M., Chen, L., Wang, Y., 2003. An index of substitutionsaturation and its application. Mol. Phylogenet. Evol. 26, 1–7.
Ziegler, T., Abegg, C., Meijaard, E., Perwitasari-Farajallah, D., Walter, L., Hodges, J.K.,Roos, C., 2007. Molecular phylogeny and evolutionary history of Southeast Asianmacaques forming the M. Silenus group. Mol. Phylogenet. Evol. 42, 807–816.
Copyright © 2022 FDOKUMEN