Molecular Biological Perspectives of Tribes in India
30
Journal of the Anthropological Survey of India, 62(2): (775-804), 2013 Molecular Biological Perspectives of Tribes in India Krithika S. 1 , Suvendu Maji 1 and T.S. Vasulu 1* 1. Biological Anthropological Unit, Indian Statistical Institute, 203 B.T. Road, Kolkata-70018 Abstract: Recent developments in molecular anthropological studies of Indian populations have widened our scope of understanding wide patterns of diversity at the molecular level. This could also aid in obtaining a more clarity of the peopling of India and the past genetic antiquity of Indian tribes. The paper explores some of the biological dimension of the pattern of variation among the regional tribes, their affinity and diversity as revealed from some of the classical genetic markers and what can be obtained from the molecular genetic markers of autosomal and mitochondrial and y-chromosome markers. Key words: Genetics; Linguistics; Diversity; mtDNA; Y-chromosome INTRODUCTION Recent molecular genetic studies on the origin and dispersal of anatomically modern humans from Africa (about 160kya to 150kya), have indicated that Indian subcontinent (south Asia) had played a significant role in the early history of human evolution and served as a ‘major corridor’ for human dispersal (Cann 2001, Endicott et al. 2007). This finding has an important bearing to the peopling of India, vast diversity of the extant populations and affiliation of the Indian populations with other global groups. This also gives possible genetic credence to the presence elusive and ‘invisible’ earlier ancestors (prehistoric man) and their inerasable cultural signature that has been discovered over the abundant Palaeolithic sites across the subcontinent. In this regard, there have been attempts by anthropologists, linguistics, archaeologists and human geneticists to comprehend the vast diversity of the numerous castes and tribes; their past history; pattern of genetic variation among the populations; congruence between linguistic, geographic and ethnic affiliations of the groups. It is certainly tremendous task to be able to review the works concerning the of the peopling of India, nevertheless a brief description concerning the issues related to the peopling of India and the findings of the previous classical and molecular genetic studies of the Indian populations have been described in the following sections of the paper. ___________________________________________ *Address for correspondence: Dr. T.S. Vasulu, Professor, Biological Anthropology Unit, Indian Statistical Institute, 203 B.T. Road, Kolkata-108. [email protected]
Transcript of Molecular Biological Perspectives of Tribes in India

Journal of the Anthropological Survey of India, 62(2): (775-804), 2013
Molecular Biological Perspectives of Tribes in India
Krithika S.1, Suvendu Maji1 and T.S. Vasulu1*
1. Biological Anthropological Unit, Indian Statistical Institute, 203 B.T. Road, Kolkata-70018
Abstract: Recent developments in molecular anthropological studies of Indian populations
have widened our scope of understanding wide patterns of diversity at the molecular level.
This could also aid in obtaining a more clarity of the peopling of India and the past genetic
antiquity of Indian tribes. The paper explores some of the biological dimension of the pattern
of variation among the regional tribes, their affinity and diversity as revealed from some of
the classical genetic markers and what can be obtained from the molecular genetic markers of
autosomal and mitochondrial and y-chromosome markers.
Key words: Genetics; Linguistics; Diversity; mtDNA; Y-chromosome
INTRODUCTION
Recent molecular genetic studies on the origin and dispersal of anatomically modern humans
from Africa (about 160kya to 150kya), have indicated that Indian subcontinent (south Asia)
had played a significant role in the early history of human evolution and served as a ‘major
corridor’ for human dispersal (Cann 2001, Endicott et al. 2007). This finding has an important
bearing to the peopling of India, vast diversity of the extant populations and affiliation of the
Indian populations with other global groups. This also gives possible genetic credence to the
presence elusive and ‘invisible’ earlier ancestors (prehistoric man) and their inerasable cultural
signature that has been discovered over the abundant Palaeolithic sites across the subcontinent.
In this regard, there have been attempts by anthropologists, linguistics, archaeologists
and human geneticists to comprehend the vast diversity of the numerous castes and tribes;
their past history; pattern of genetic variation among the populations; congruence between
linguistic, geographic and ethnic affiliations of the groups. It is certainly tremendous task to be
able to review the works concerning the of the peopling of India, nevertheless a brief
description concerning the issues related to the peopling of India and the findings of the
previous classical and molecular genetic studies of the Indian populations have been described
in the following sections of the paper.
___________________________________________
*Address for correspondence: Dr. T.S. Vasulu, Professor, Biological Anthropology Unit, Indian Statistical Institute, 203 B.T. Road, Kolkata-108. [email protected]
776 Molecular Biological Perspectives of Tribes in India
Journal of the Anthropological Survey of India, 62(2): (775-804), 2013
A. PEOPLE OF INDIA
Contemporary India manifests enormous cultural, linguistic, biological and genetic diversity
which can be primarily attributed to (a) its inimitable position at the trijunction of the African,
the northern Eurasian and the Oriental realm, the crossroads of many historic and pre-historic
human migrations (Beteille 1998, Gadgil et al. 1997, Majumder 1998) and (b) the presence of
large number of (4,635) communities with unique population structure, that have been
maintained over several generations (Singh 1994). The subcontinent is the abode of around
40000 endogamous groups comprising of about 37000 castes (nontribal) and subcastes and
3000 tribal, religious (following different religions like Islam, Christianity, Sikhism,
Buddhism, Jainism and Judaism) and other historical migrant populations (Gadgil and
Malhotra 1983, Malhotra 1984). Among these groups, the non-tribal populations who practice
Hinduism are hierarchically arranged in five caste classes or Varnas, viz., Brahmin (priestly
class), Kshatriya (warrior class), Vaishya (business class), Sudra (menial labor class) and
Pancham (Dalits) (Malhotra 1978).
I) Ethnic and Linguistic diversity:
The ethnic diversity of the Indian subcontinent is represented by four major ethnic groups,
distinguishable by their physical features: Caucasoid (European), Proto-Australoid (Aboriginal
Australian), Mongoloid (East Asian) and Negrito (African) wherein Caucasoid groups are
distributed in most of the regions; Proto-Australoids in West, Central and Southern regions;
Mongoloids in the sub-Himalayan and North-east regions and the Negritos in the Andaman
Islands (Malhotra 1978).
The linguistic diversity of the subcontinent corresponds to the four major language
families, namely, Indo-European, Dravidian, Austro-Asiatic and Tibeto-Burman, spoken by
the Indian populations. Indo-European speakers, comprising mostly of the nontribal groups,
are widespread in North, Central and Western parts while the Dravidian speakers that include
both the tribal and the nontribal groups are confined mainly to the Southern and Central
regions. Austro-Asiatic languages are spoken by the tribes of Central and Eastern India
(except for Khasi tribe of north-east and Nicobarese of Nicobar Islands) and Tibeto-Burman
languages are largely spoken by tribes of North-east India.
These linguistic groups are believed to have migrated to the subcontinent in incessant,
multiple waves at different times (Ratnagar 1995, Thapar 1995), the earliest being the Austric
speakers soon after 65,000ybp followed by the Dravidian speakers from the middle-east (with

Krithika S, Suvendu Maji, T. S. Vasulu 777
Journal of The Anthropological Survey of India, 62(2): (775-804), 2013
Figure 1.1: Map of India showing the distribution of the various linguistic groups
knowledge of wheat cultivation and domestication of animals like cattle, sheep, goats) around
6,000ybp and then the Sino-Tibetan speakers (with knowledge of rice cultivation) after
6,000ybp. The last major migration, comprising of the Indo-European speakers (equipped with
horses and iron technology), is believed to have occurred in several waves around 3,500ybp
(Gadgil et al. 1997). Figure 1.1 shows the distribution of the various linguistic families and its
branches, in the Indian subcontinent.
(Source: http://sun-bin.blogspot.com/2005/11/map-indias-ethno-linguistic-map.html)
B. PEOPLING OF INDIA
Various competing hypotheses have been put forward to explain the evolutionary history of
the Indian tribes as well as castes in order to comprehend the extensive ethnic and linguistic
diversity of the populations and to obtain an insight into their history, viz., the origin,
778 Molecular Biological Perspectives of Tribes in India
Journal of the Anthropological Survey of India, 62(2): (775-804), 2013
migration and settlement. The following sections deal with these hypotheses, pertaining to the
tribal and caste groups, put forth by different archeologists, historians, linguists and
anthropologists in the past.
I) Tribal populations:
Among the different population sects, the tribal populations, generally believed to be the
earlier inhabitants, constitute about 8.20% of the total Indian population (Census of India
2001). The subcontinent harbors large number of tribal communities (about 532) of diverse
ethnic origins (Australian, East Asian and African) belonging to primarily three major
linguistic families (Austro-Asiatic, Dravidian and Tibeto-Burman) and inhabiting different
geographical regions of the country (Singh 1994). Comprehending this vast diversity (cultural
and biological) of the tribes and tracing their evolutionary history is vital to understand the
past genetic history of people of India.
In this regard, there have been several attempts in the past, by researchers of different
disciplines, to understand the diversity among the tribal populations and to investigate their
antiquity. This in turn has led to considerable debate and subsequent emergence of various
competing hypotheses, over the years, to explain the antiquity and settlement history of the
Indian tribes. The proto-Australoid tribes belonging to the Austric linguistic group are
believed to be the basic element in the Indian population (Thapar 1966). And many other
anthropologists, historians and linguists (Fuchs 1983, Kennedy 1984, Pattanayak 1998,
Rapson 1955, Rishley 1915) have also supported the view that the Austro-Asiatic (a subfamily
of the Austric language family) speaking tribals are the earlier inhabitants of the subcontinent.
However, some other scholars (Buxton 1925, Sarkar 1958) have proposed that the Dravidians
are the earlier inhabitants, and that the Austro-Asiatics are later immigrants. Many linguists
(Renfrew 1992, Ruhlen 1991) argue that Elamo-Dravidian languages may have originated in
the Elam province of Southwestern Iran, and that the dispersal of the Dravidian languages into
India took place with the migration of humans from this region who brought with them the
technologies of agriculture and animal domestication. The Tibeto-Burman speaking tribes,
primarily inhabiting the North-eastern regions, are thought to be the latest settlers in India who
arrived from Tibet and Myanmar (Guha 1935). These various hypotheses regarding the
evolutionary history of the Indian tribal populations are summarized in Figure 1.2.

Krithika S, Suvendu Maji, T. S. Vasulu 779
Journal of The Anthropological Survey of India, 62(2): (775-804), 2013
II) Caste populations:
With respect to the caste populations, linguists of the 19th and 20th centuries proposed that the
extant castes are descendants of primarily West Eurasians who migrated from North-west
about 3000–8000 years ago (Poliakov 1974, Renfrew 1989). These nomadic migrants may
have purportedly admixed with or displaced the indigenous Dravidic-speaking proto-Asian
populations and subsequently established the Hindu caste hierarchy (Poliakov 1974, Cavalli-
Sforza et al. 1994) and placed themselves in predominantly castes of higher rank. However,
this was hardly supported by the archaeological evidence (Shaffer 1982).
Peopling of India- Issues:
Figure 1.2: Diagrammatic representation of the various hypotheses regarding the evolutionary history of the Indian tribals

780 Molecular Biological Perspectives of Tribes in India
Journal of the Anthropological Survey of India, 62(2): (775-804), 2013
In spite of these different attempts made, in the past, by various historians, linguists
and anthropologists to understand the population structure of the Indian populations and the
peopling of India, several major issues, viz., a) the inhabitation of the subcontinent by different
tribal communities, whether the earliest settlers were Austro-Asiatic speaking or Dravidian
speaking, b) contribution of the Tibeto-Burman speakers towards the peopling of the North-
east India, c) antiquity of the different tribal communities, d) origin of the Indo-European
speakers, establishment of the caste system, e) genetic relationship (affinity and diversity)
between the different regional groups and f) the role of ethnicity, language and geography in
determining the genetic relatedness between the different populations of India and of India
with those of the other regions of the globe, remained enigmatic. So, later, anthropologists and
population geneticists tried to address some of the afore-mentioned issues by employing
certain anthropological variables as well as classical genetic markers like blood groups, serum
proteins, red cell enzymes and so on.
C. GENETIC PERSPECTIVE OF INDIAN POPULATIONS
I) Genetic affinity and diversity- classical genetic markers:
The studies based on the biological traits (anthropological and classical genetic) depicted
differentiation of Indian populations, based on different geographical regions, ethnicity and
linguistic families. A great amount of genetic diversity among the population groups of India
were reported initially based on the variation in allele frequencies among four genetic loci
(ABO, MN, HP and PGM1), in different regions of Asia (Mourant et al. 1976, Bhasin and
Walter 2001). South Asia (comprising primarily of the Indian subcontinent) displayed the
highest allele frequency variation than West, East or North Asian regions and the level of
diversity among Indian populations (based on the gene frequency data of 29 loci) was found to
be comparable to that existing within the major races (Caucasoid, Mongoloid and Negroid) of
man (based on the data of 44 protein (including enzyme) loci) (Nei and Roychoudhury 1972).
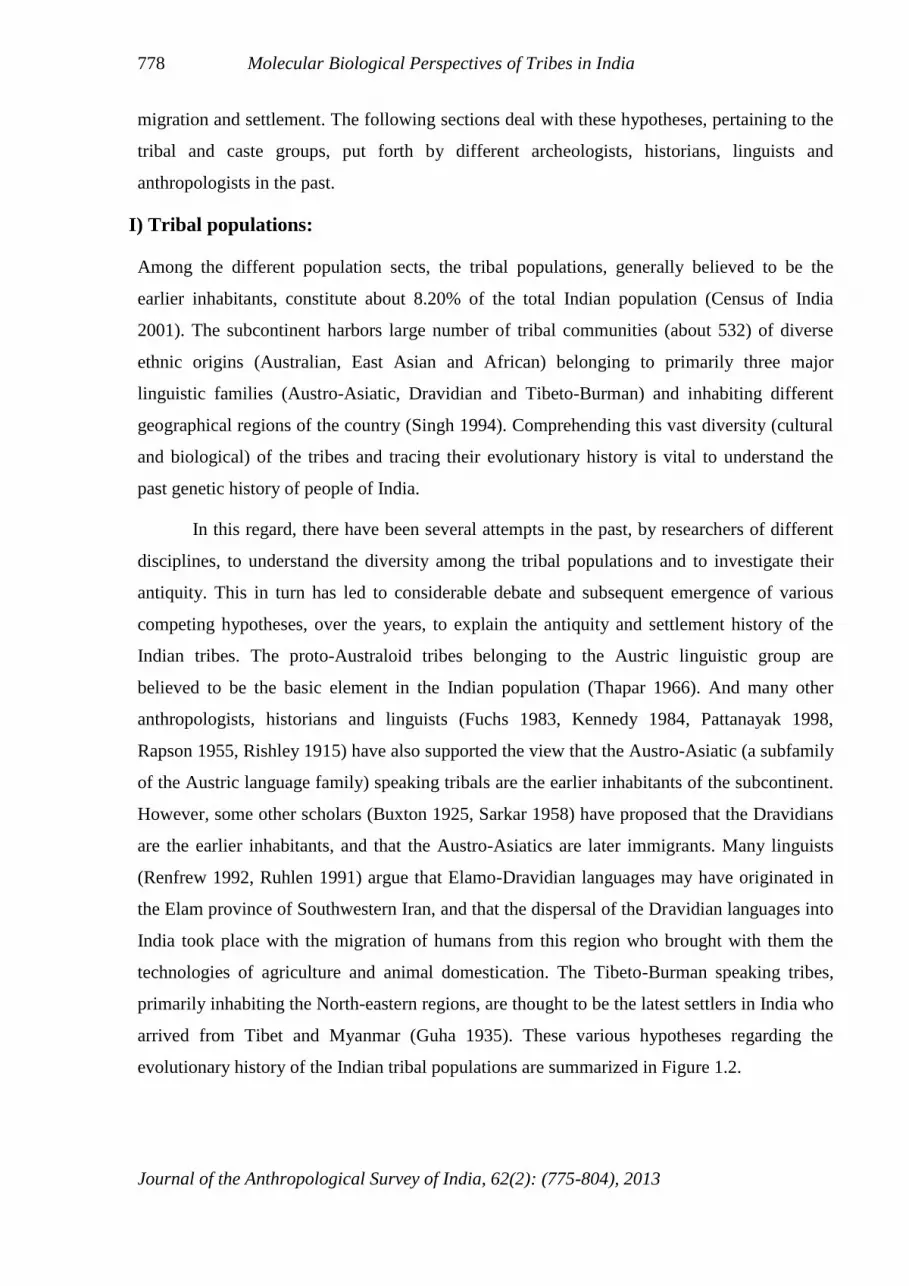
Also, the analysis of 29 loci among worldwide populations (Roychoudhury 1977) revealed
that Indian populations (represented by north Indians, Bengalis from eastern India and a tribal
population – Kadar- from southern India) were closest to the Mongoloids and farthest from the
Negroids; the Caucasoids being at the intermediate level (Figure 1.3).
Krithika S, Suvendu Maji, T. S. Vasulu 781
Journal of The Anthropological Survey of India, 62(2): (775-804), 2013
Figure 1.3: Dendrogram depicting the genetic relationship, based on 29 loci, between the Indian populations
and global morphological groups
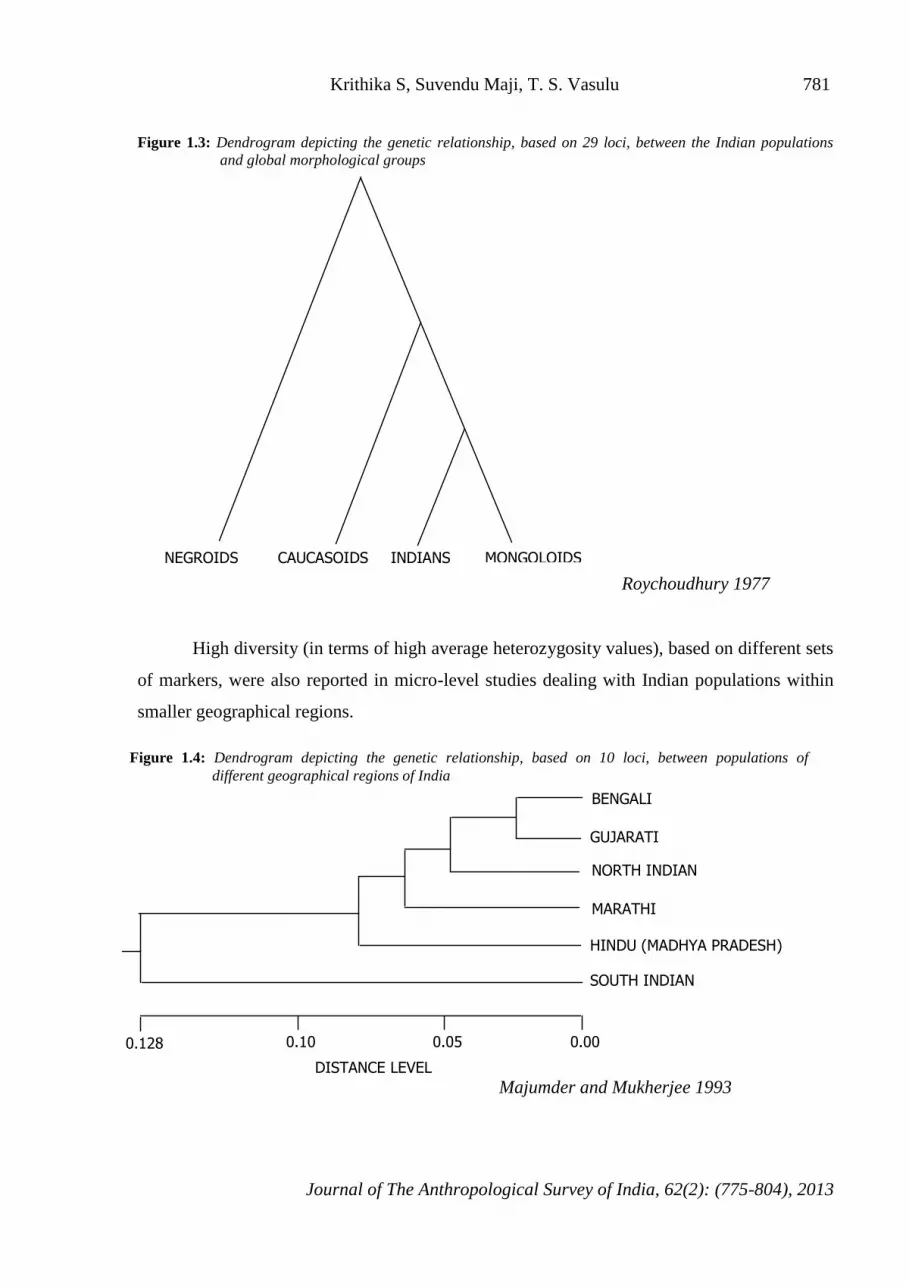
High diversity (in terms of high average heterozygosity values), based on different sets
of markers, were also reported in micro-level studies dealing with Indian populations within
smaller geographical regions.
Roychoudhury 1977
NEGROIDS CAUCASOIDS INDIANS MONGOLOIDS
Majumder and Mukherjee 1993
BENGALI
GUJARATI
NORTH INDIAN
MARATHI
HINDU (MADHYA PRADESH)
SOUTH INDIAN
0.128 0.10 0.05 0.00
DISTANCE LEVEL
Figure 1.4: Dendrogram depicting the genetic relationship, based on 10 loci, between populations of different geographical regions of India

782 Molecular Biological Perspectives of Tribes in India
Journal of the Anthropological Survey of India, 62(2): (775-804), 2013
The pattern of clustering among the population groups of India and the role of various
associated factors, were subsequently explored by employing different sets of markers. The
clustering pattern among 82 populations of India, based on 7 anthropometric characters,
revealed that both the geographical proximity and the socio-cultural background of the
populations are insufficient to determine the anthropometric variation at the all-India level.
The dendrogram (Figure 1.4) constructed using the gene frequency data of ten polymorphic
loci depicted a distinct separation of the populations of southern India from the rest and a
genetically fairly close relationship between populations of north, west, central and east India
(Majumder and Mukherjee 1993).
Figure 1.5: Dendrogram depicting the genetic relationship, based on 5 loci, between population groups of Eastern India
BRAHMIN (MANIPUR)
MEITEI
AHOM
KACHARI
SONOWAL POLIYA
TIYOR DESHI
KARBI
BRAHMIN (BIHAR)
MUSLIM (BIHAR)
CHUTIYA KALITA
RAJBANSHI
KAIBARTA
BRAHMIN (ASSAM)
MUSLIM (ASSAM)
BHUIYA
SANTAL
CHAMAR
VADABALIJA (PENTICOTTA) VADABALIJA (VADAPETA)
JALARI
KEVTO
Majumder 1998

Krithika S, Suvendu Maji, T. S. Vasulu 783
Journal of The Anthropological Survey of India, 62(2): (775-804), 2013
This pattern of clustering was interpreted as the linguistic separation of the Dravidian
speakers of southern India from the remaining populations that speak Indo-European
languages. In agreement with the above observation, the distinctness of the southern tribal
populations (in comparison to central and northeastern tribal populations) was also reported by
Malhotra and Vasulu (1993).
To understand the genetic relationship between populations of a particular geographic
region, region-specific studies were also conducted. In his study based on five loci (ABO, HP,
ACP, ESD and AK), Majumder (1998) observed geography based clustering of the
Figure 1.6: Dendrogram depicting the genetic relationship, based on 5 loci, between population groups of Southern India
Majumder 1998
MUSLIM SIDDI
CHRISTIAN SIDDI
VOKKALIGA
LINGAYAT
VYSYA
PULAYAN
CHETTIER
VAIDIK BRAHMIN
KAMMA
PARIAH
EZHAVA
URALI
NAMBOODIRI BRAHMIN
JENUKURUMBA
KALLAN

784 Molecular Biological Perspectives of Tribes in India
Journal of the Anthropological Survey of India, 62(2): (775-804), 2013
populations from East India (Bihar, Orissa, West Bengal, Assam and Manipur). Also
phylogenetic studies among populations of southern India found no correspondence between
genetic and socio-cultural affinities and indications of association between genetic affinity and
the geographical distance of the populations (i.e.) genetic similarity decreasing with increasing
geographical distance (Majumder 1998).
The dendrograms depicting the genetic relationship among the East Indian and South
Indian populations are shown in Figures 1.5 and 1.6 respectively. Overall, the genetic studies
involving the populations of eastern and southern regions of India revealed that geographic
proximity had a stronger affect than socio-cultural similarities in determining the genetic
affinity. Similar inferences were drawn from studies in northern, western and central India
(Majumder and Mukherjee 1993, Das et al. 1996) and also within smaller geographical
regions (Majumder and Mukherjee 1993, Papiha et al. 1996). In contrast to the afore-
mentioned observations, Majumder and Mukherjee (1993) observed a negative correlation
between geographical distance and the genetic affinity between the populations and inferred
that the geographical proximity does not always associate well with genetic affinity.
In general, the above studies reported significant differences between tribal and caste
populations as they were found to form genetically distinct clusters (Malhotra and Vasulu
1993) and the castes of lower ranks were found to behave differently from that of the higher
ranks. Also the genetic variation within ethno-social categories (e.g. among castes) was not
found to correlate well with the social rank.
Although the above studies based on anthropological traits and classical genetic
markers yielded valuable insight into the biological structure of human populations in India,
there still remained many unanswered questions pertaining to genetic relationships of the
diverse human populations in India and also human evolution in Indian subcontinent. In order
to address these issues and also to further substantiate the contradictory inferences obtained
for the above studies; these classical genetic and anthropological studies on Indian populations
were later followed by molecular genetic studies.
Krithika S, Suvendu Maji, T. S. Vasulu 785
Journal of The Anthropological Survey of India, 62(2): (775-804), 2013
II) Genetic affinity and diversity- molecular genetic markers:
Initially, the molecular genetic studies employed autosomal microsatellite, mitochondrial
DNA (mtDNA) and Y-chromosome polymorphisms to understand the genetic structure and
the demographic history of Indian populations. In general, the findings of these studies were
found to be in agreement with the observations from the previous studies based on classical
genetic markers. In this regard, the initial studies performed to understand the genetic affinity
and diversity among the Indian populations were based especially on mtDNA and Y-
chromosome; the autosomal microsatellite studies being limited to few populations (e.g.,
Bindu et al., 2007).
One of the earlier studies on Indian populations using molecular genetic markers was
performed by Barnabas et al. (1996) where individuals belonging to both Indo-European and
Dravidian linguistic families were analyzed for six restriction-site polymorphisms of the
mtDNA. The study revealed a high level (0.18%) of nucleotide diversity among the studied
populations, in concordance with the previous studies. Similar results based on the sequence
data of the hypervariable regions I and II of the mtDNA, were also reported among the caste
and tribal populations of southern India (Mountain et al. 1995, Bamshad et al. 1996). In fact,
Bamshad et al. (1996), in their study on the mtDNA diversity of the caste populations of
Andhra Pradesh, estimated the mitochondrial genome diversity (mean nucleotide diversity)
among Indian populations (0.014) to be as high as that of Africans (0.019) and higher than that
of Europeans (0.007) and Asians (0.009). Also, the populations from southern India were
found to be fairly distinct from that of northern India, the former being more diverse than the
latter.
These above mtDNA studies were followed by a Y chromosome study on 10 ethnic
groups - 8 castes (Brahmins from north and east, Chamar, Bagdi, Mahishya, Agharia, Rajput
and Tanti) and 2 tribes (Lodha and Santal) – of eastern (West Bengal and Orissa) and northern
(Uttar Pradesh) regions of India (Bhattacharyya et al. 1999). AMOVA results of the study
revealed that there was significant haplotypic variation between castes and tribes, but
nonsignificant variation among ranked caste clusters. Haplotypic variation attributable to
differences in geographical regions of habitat was also found to be nonsignificant. In contrast
to this negligible gene flow reported among ethnic groups, a Y-SNP study by Ramana et al.
(2001), on three castes (Vizag Brahmins, Peruru Brahmins, Kammas), three tribes (Bagata,
Poroja, Valmiki) and an additional group (the Siddis) of Andhra Pradesh of South India,

786 Molecular Biological Perspectives of Tribes in India
Journal of the Anthropological Survey of India, 62(2): (775-804), 2013
showed evidence of haplotype sharing across caste-tribe boundaries thereby suggesting the
possibility of a recent gene flow between the studied castes and tribes.
36
37, 38
1. Balti, 2. Argon, 3. Drokpa, 4. Buddhist, 5. HP Rajput, 6. Tharu, 7. Jaunsari, 8. Bhoksha, 9. Lobanas, 10. Punjab Brahmins, 11. Punjab Scheduled castes, 12. Jat Sikhs, 13. UP Brahmins, 14. Kanyakubj Brahmin, 15. Jaunpur Brahmin, 16. Chamar, 17. UP Rajput, 18. Chaturvedi, 19. Khatri, 20. Kurmi, 21. Thakur, 22. UP Jat, 23. UP Kshatriya, 24. UP Vaishya, 25. UP Sudra, 26. UP Panchama, 27. Tharu, 28. Bhoksha, 29. UP Muslims, 30. Adi / Adi Pasi, 31. Nishi, 32. Apatani, 33. Naga, 34. Manipuri Muslims, 35-.Meitei, 36. Garo, 37. Naga, 38. Hmar, 39. Mara, 40. Hmar, 41. Lai, 42. Lusei, 43. Kuki, 44. Chakma, 45. Jamatia, 46. Mog, 47. Mizo, 48. Tripuri, 49. Riang, 50. Maram, 51. Bhoi, 52. Pnar, 53. Khynriam, 54. WarKhasi, 55. Nepali, 56. Bhutia, 57. Lepcha, 58. Santal, 59. Lodha, 60. Karmali, 61. Maheli, 62. Kora, 63. Rajbhansi, 64. Bagdi, 65. WB Brahmins, 66. WB Kshatriya, 67. Gaud, 68. Bauri, 69. Mahishya, 70. Namasudra, 71. WB Kayasth, 72. Tanti, 73. Agharia, 74. Toto, 75. Bihar Brahmin, 76. Bihar Kayasth, 77. Kurmi, 78. Bihar Rajput, 79. Bihar Yadav, 80. Bhumihar, 81. Baniya, 82. Gope, 83. Karan, 84.Khandayat, 85. Oriya Brahmin, 86. Juang, 87. Saora, 88. Paroja, 89. Kharia, 90. Munda, 91. Santal, 92. Agharia, 93. Tanti, 94. Bhumij, 95. Birhor, 96. Ho, 97. Kharia, 98. Munda, 99. Santal, 100. Oraon, 101. Asur, 102. Gujarat Patel, 103. Chitpavan / Konkanastha Brahmin, 104. Desasth Brahmin, 105. Dhangar, 106. Maratha, 107. Katkari, 108. Mahadeo Koli, 109. Pawara, 110. Madia Gond, 111. Naba-Baudh, 112. Halba, 113. Kamar, 114. Muria, 115. Dheria Gond, 116. Satnami, 117. Teli, 118. Agharia, 119. Oraon, 120. Brahmin/Saryupari Brahmin, 121. Kuruchian, 122. Mullakurunan, 123. Paniyan, 124. Nair, 125. Bhovi, 126. Karnataka Christian, 127. Lingayat, 128. Gowda, 129. Iyengar, 130. Kuruva, 131. Koraga, 132. Yerava, 133. Karnataka Muslims, 134. Kota, 135. Kurumba, 136. Irula, 137. Betta Kurumba, 138. Mullu Kurumba, 139. Jenu Kurumba, 140. Toda, 141. Chakkiliar, 142. Gounder, 143. Kallar, 144. Pallar, 145. Vanniyar, 146. Ambalakarer, 147. Pallan, 148. Iyengar, 149. Iyer, 150. Vellalar, 151. Chenchu, 152. Koya, 153. Naikpod Gond, 154. Andh, 155. Bagata, 156. Lambadi, 157. Valmiki, 158. Poroja, 159. Siddis, 160. Kattunaikan, 161. Koya Dora, 162. Konda Reddy, 163. Yerukula, 164. AP Brahmin, 165. Kamma/Kamma Chaudhary, 166. Kapu/Kappu Naidu, 167. Komati, 168. Raju, 169. Reddy, 170. AP Kshatriya, 171. AP Vaishya, 172. AP Yadav, 173. Relli, 174. Madiga, 175. Mala, 176. Vizag Brahmin, 177. Peruru Brahmin, 178. Golla, 179. Pardhan, 180. Akutota, 181. Panta, 182. Pokanati, 183. Vanne, 184. Sakunupaksollu, 185. Great Andamanese, 186. Onge, 187. Jarwa, 188. Nicobarese, 189. Shompen
Figure 1.7: Map of India showing the location of the populations studied till date for Y chromosomal polymorphisms
1- 4
5- 8
34, 35 4
75-81
36
37, 38

Krithika S, Suvendu Maji, T. S. Vasulu 787
Journal of The Anthropological Survey of India, 62(2): (775-804), 2013
Another molecular genetic study, involving autosomal loci, mtDNA and Y
chromosome, by Bamshad et al. (2001) based on eight different caste populations (Upper
castes - Niyogi and Vydiki Brahmin, Kshatriya, Vysya; middle castes - Telega and Turpu
Kapu, Yadava; lower castes - Relli, Madiga, Mala) of Andhra Pradesh inferred that the upper
castes are more similar to Europeans than to Asians, middle castes are equidistant from the
two groups, and lower castes are most similar to Asians. It was observed that the genetic
distance between caste populations and Africans was progressively larger moving from lower
to middle to upper caste groups. Also, a neighbor-joining network of genetic distances, based
on autosomal Alu elements, between the castes of different ranks showed a clear
differentiation of caste of different ranks into separate clusters.
Thus, overall, the inferences drawn from these molecular genetic studies were found
to be concordant with that of the previous studies. Apart from these issues based on the
genetic relationships between the different population groups of the subcontinent, researchers
also tried to deal with queries, based on molecular genetic markers, pertaining to the peopling
of India by various ethnic groups, the past genetic history of these groups, origin of the
different tribal communities, establishment of caste system and so on. In this regard, mtDNA
and Y chromosome markers, owing to several advantageous properties such as uniparental
inheritance; high polymorphism and absence of recombination, have been used to address the
above mentioned major issues of Indian populations.
Y-chromosome polymorphism among Indian populations: The regions of India studied for
the different Y-chromosome polymorphisms have been depicted in Figure 1.7 and details of
the studied groups are given in Table 1.1. Overall, the Y-chromosome studies attempted on
about 200 populations sampled from different geographic regions support the findings of the
classical genetic and anthropological studies that there exist wide genetic differences between
tribes and upper castes and insignificant differences between the lower castes and tribes and
between closely ranked castes. Studies, in general, are in agreement with the independent
origin model put forward by Cordaux et al. (2004b) according to which castes and tribes have
independent origins. Current distribution of Y haplogroups in India is primarily associated
with geographic rather than linguistic or cultural determinants.
Y-chromosome data analysis suggests a Southeast Asian homeland for the Austro-
Asiatic speakers (Mundari group) of India (based on distribution of haplogroup O) and an
788 Molecular Biological Perspectives of Tribes in India
Journal of the Anthropological Survey of India, 62(2): (775-804), 2013
indigenous Indian origin for the Dravidian speakers (based on the haplogroup L1 frequency
and associated microsatellite variance) (Sengupta et al. 2006). An East/Southeast Asian origin
for the Tibeto-Burman speakers of India was suggested based on the (I) presence of
haplogroup O3e which is typically found in East/Southeast Asia at frequencies up to 25% to
35% and is absent from India and elsewhere and (II) extensive Y-STR haplotype sharing
between northeast India and East/Southeast Asia (Cordaux et al. 2004b). With regard to the
caste populations, a South Asian origin for the Indian caste communities with minimal Central
Asian influence was proposed based on the absence of certain haplogroups in Indian samples
(C3, DE, J*, I, G, N and O) which covers almost half of the Central Asian Y chromosomes
and the presence of some haplogroups in Indian Y chromosomes (C*, F*, H, L and R2) that is
poor in Central Asia (Sahoo et al. 2006)
Mitochondrial DNA polymorphisms among Indian populations: Macrohaplogroup M: The
groups (about 170) studied for the different mitochondrial DNA polymorphisms (pertaining to
macrohaplogroup M) have been shown in Figure 1.8 and further details of these groups are
given in Table 1.2. Though the number of studies (~170 populations) contributed are scanty in
comparison to the numerous endogamous groups in India, these studies do provide us some
glimpse of the Indian mtDNA diversity and help in providing further insights into the past
genetic history of Man in India (Maji et al., 2009).
A majority of the populations (~ 60%) belong to macrohaplogroup M, a higher
frequency is observed among tribes than castes. Several Indian specific haplogroups (~ 22) of
M have been found, there by suggesting their probable in situ origin. The most ancient
haplogroup M2 is reported among the Mundari speaking Austro-Asiatic, Dravidian (southern)
and Indo-European speaking castes and tribes, but is completely absent among the studied
samples of Tibeto-Burman speakers. M3 is predominant among southern Dravidian tribes; M4
is absent in Austro-Asiatic tribes and M5 is more a caste specific haplogroup. Haplogroups
M31 and M32 are mainly found among Andaman tribes, but however, the sub-haplogroup of
M31, M31b shows presence in a Rajbanshi (WB) sample and another sub-haplogroup M31c is
present among the Khasi-Khumic speaking Austro-Asiatic tribes (Palanichamy et al. 2006,
Reddy et al. 2007, Thangaraj et al. 2005a). Some novel haplogroups especially M48, M49,
M50 are observed among Khasi sub-tribes (Reddy et al. 2007)

Krithika S, Suvendu Maji, T. S. Vasulu 789
Journal of The Anthropological Survey of India, 62(2): (775-804), 2013
Figure 1.8: Map of India showing the location of the populations studied for mitochondrial DNA polymorphisms with special reference to macrohaplogroup M
1- Mixed castes, 2- Kanet, 3-Lobana, 4- Jat Sikh, 5- Punjab Brahmins, 6- Scheduled Castes, 7- Mixed Caste, 8-
Khatris, 9- Kori, 10- Tharu, 11- Bhoksha/ Buksa, 12- Mixed Caste, 13- Chamar, 14- Bhargava, 15- Chaturvedi , 16- Rajput, 17- Yadava, 18. UP Brahmins, 19- Adi, 20- Apatani, 21- Nishi, 22- Naga, 23- Meitei, 24- Mizo, 25- Chakma, 26- Jamatia, 27- Mog, 28- Riang, 29- Tipperah / Tripuri, 30- Khasi, 31- Bhoi, 32- Maram, 33- Lyngnam, 34- Nongtrai, 35- War Jaintia, 36- War Khasi, 37- Pnar, 38- Khynriam, 39- Garo, 40- Bagdi, 41- Brahmins, 42- Lodha, 43- Mahishya, 44- Toto, 45- Mixed castes, 46- Kurmi, 47- Maheli, 48- Rajbansi, 49- Santal, 50- Bhumij, 51- Paharia, 52- Kharia, 53- Yadava, 54- Kurmi, 55- Baniya, 56- Oraon, 57- Rajput, 58- Santal, 59- Kharia, 60- Agharia, 61- Gaud, 62- Brahmins, 63- Karan, 64- Khandayat, 65- Gope, 66- Juang, 67- Paroja, 68- Saora, 69- Gadaba, 70- Tanti, 71- Bathudi, 72- Munda, 73- Munda, 74- Ho, 75- Bhumij, 76- Paharia, 77- Kharia, 78- Santal, 79- Oraon, 80- Tadvi, 81- Rathwa, 82- Mixed Caste, 83- Konkan Brahmins, 84- Maratha, 85- Naba-Baudh, 86- Parsi, 87- Katkari, 88- Pawara, 89- Chitpavan Brahmins, 90- Desasth Brahmins, 91- Dhangar, 92- Rajput, 93- Bharia , 94- Maria Gond, 95- Muria, 96- Halba, 97- Saryupari Brahmins, 98- Kamar, 99- Satnami, 100- Kanwar, 101- Nagesia, 102- Havik, 103- Kuruchian, 104- Mullukurunan, 105- Mixed castes (Cochin) , 106- Cochin Jews, 107- Toda, 108- Kadar, 109- Irula, 110- Kota, 111- Kurumba, 112- Paniyan, 113- Kadar, 114 - Brahmins: Havik, 115 - Mukri, 116 - Soligas, 117 - Koragas, 118 - Yerava, 119 - Gowda, 120- Kuruva, 121 - Christian, 122 - Bhovi, 123 - Lyngayat, 124 - Iyengar, 125 - Muslims, 126- Ambalakarar, 127- Iyer, 128- Pallar, 129- Vanniyar, 130- Kadar, 131- Pallan. 132- Vellala, 133- Jennukurumba, 134- Kattunaiken, 135- Mullukurumba, 136- Bettakurumba, 137- Oorali, 138- Baduga, 139-Sakkili, 140- Irula, 141-Kota, 142- Kurumba, 143- Iyengar, 144- Paniyan, 145 - Yerukula, 146 - Lambadi, 147 - Brahmins, 148 - Kshatriya, 149 - Vysya, 150 - Kapu, 151 - Madiga, 152 - Mala, 153 - Relli, 154 - Chenchu, 155 - Koya, 156 - Andh, 157 - Pardhi, 158 - Thoti, 159 - Pardhan, 160 - Naikpod Gond, 161 - Komati, 162 - Reddy, 163 - Thogataveera, 164 - Yanadi, 165 – Yadava, 166- Onge, 167- Great andamanese, 168- Jarawa, 169- Aka-Bea, 170- Nicobarese

790 Molecular Biological Perspectives of Tribes in India
Journal of the Anthropological Survey of India, 62(2): (775-804), 2013
Table 1.1: Number of populations studied, for Y-chromosomal polymorphisms, in different geographical regions of India
Geographic Region
No. of populations studied
References Denotation in Figure 1.7
North Jammu & Kashmir 4 Kashyap et al. 2006b 1 - 4 Himachal Pradesh 1 Kashyap et al. 2006b; Sahoo et al. 2006 5 Uttranchal 3 Kashyap et al. 2006b 6 - 8
Punjab 4 Kivisild et al. 1999; Basu et al. 2003; Kivisild et al. 2003; Cordaux et al. 2004a
9 - 12
Uttar Pradesh 17
Bhattacharya et al. 1999; Kivisild et al. 1999; Basu et al. 2003; Kivisild et al. 2003; Kashyap et al. 2006b; Sahoo et al. 2006; Sengupta et al. 2006; Zerjal et al. 2007
13 - 29
Northeast
Arunachal Pradesh 3 Cordaux et al. 2004b; Sahoo et al. 2006; Kashyap et al. 2006b
30 - 32
Assam 1 Cordaux et al. 2004b 33
Manipur 5 Basu et al. 2003; Sahoo et al. 2006; Kashyap et al. 2006b
34 - 38
Mizoram 5 Kashyap et al. 2006b; Sahoo et al. 2006 39 - 43 Tripura 6 Basu et al. 2003; Sengupta et al. 2006 44 - 49 Meghalaya 5 Kumar et al. 2007 50 - 54 Sikkim 3 Kashyap et al. 2006b; Sahoo et al. 2006 55 - 57
East
West Bengal 17 Bhattacharya et al. 1999; Basu et al. 2003; Kivisild et al. 2003; Cordaux et al. 2004a; Kashyap et al. 2006b; Sahoo et al. 2006; Sengupta et al. 2006
58 - 74
Bihar 7 Sahoo et al. 2006; Kashyap et al. 2006b 75 - 81
Orissa 12 Bhattacharya et al. 1999; Basu et al. 2003; Kashyap et al. 2006b; Kumar et al. 2007; Sahoo et al. 2006; Sengupta et al. 2006
82 - 93
Jharkhand 8 Basu et al. 2003; Kashyap et al. 2006b; Kumar et al. 2006; Sahoo et al. 2006
94 - 101
West
Gujarat 1 Kivisild et al. 2003; Cordaux et al. 2004a; Kashyap et al. 2006b; Sahoo et al. 2006
102
Maharashtra 9 Basu et al. 2003; Kivisild et al. 2003; Cordaux et al. 2004a; Kashyap et al. 2006b; Sahoo et al. 2006; Sengupta et al. 2006
103 - 111
Central Madhya Pradesh 3 Basu et al. 2003; Sengupta et al. 2006 112 - 114 Chattisgarh 6 Basu et al. 2003; Kashyap et al. 2006b 115 - 120 South Kerala 4 Cordaux et al. 2004a; Kashyap et al. 2006b 121 - 124
Karnataka 9 Cordaux et al. 2004a; Kashyap et al. 2006b; Sahoo et al. 2006
125 - 133
Tamil Nadu 18 Basu et al. 2003; Cordaux et al. 2004a; Kashyap et al. 2006b; Sahoo et al. 2006; Sengupta et al. 2006
134 - 150
Andhra Pradesh 34
Bamshad et al. 2001; Ramana et al. 2001; Kivisild et al. 2003; Cordaux et al. 2004a; Kashyap et al. 2006b; Sahoo et al. 2006; Sengupta et al. 2006; Thanseem et al. 2006
151 - 184
A & N Islands 5 Thangaraj et al. 2003; Kashyap et al. 2006b 185 – 189

Krithika S, Suvendu Maji, T. S. Vasulu 791
Journal of The Anthropological Survey of India, 62(2): (775-804), 2013
Table 1.2: Number of populations studied, in different geographical regions of India for mitochondrial DNA polymorphisms, with special reference to macrohaplogroup M
Geographic Region No. of populations
studied References
Denotation in Figure 1.8
North Jammu & Kashmir 1 Kivisild et al. 1999 1
Himachal Pradesh 1 Metspalu et al. 2004 2
Punjab 6 Kivisild et al. 1999; Kivisild et al. 2003; Basu et al. 2003; Metspalu et al. 2004; Thanseem et al. 2006
3 - 8
Uttar Pradesh 10
Kivisild et al. 1999; Roychoudhury et al. 2000; Kivisild et al. 2003; Cordaux et al. 2003; Basu et al. 2003; Metspalu et al. 2004; Sun et al. 2006; Thangaraj et al. 2005b; Kumar et al. 2006; Thanseem et al. 2006
9 - 18
Northeast
Arunachal Pradesh 3 Cordaux et al. 2003; Cordaux et al. 2004b; Thangaraj et al. 2005b
19 - 21
Assam 1 Cordaux et al. 2003; Cordaux et al. 2004b 22
Manipur 1 Basu et al. 2003 23
Mizoram 1 Basu et al. 2003 24
Tripura 5 Roychoudhury et al. 2000; Roychoudhury et al. 2001; Basu et al. 2003; Cordaux et al. 2003; Cordaux et al. 2004b
25 - 29
Meghalaya 10 Sun et al. 2006; Reddy et al. 2007 30 - 39
East
West Bengal 13
Roychoudhury et al. 2000; Roychoudhury et al. 2001; Basu et al. 2003; Cordaux et al. 2003; Metspalu et al. 2004; Thanseem et al. 2006; Sun et al. 2006; Rajkumar et al. 2005; Kumar et al. 2006
40 - 52
Bihar 5 Rajkumar et al. 2005; Thangaraj et al. 2005b; Thangaraj et al. 2006b
53 - 57
Orissa 15
Roychoudhury et al. 2000; Roychoudhury et al. 2001; Basu et al. 2003; Cordaux et al. 2003; Rajkumar et al. 2005; Kumar et al. 2006; Sahoo and Kashyap 2006; Thangaraj et al. 2006b
58 - 72
Jharkhand 7 Thangaraj et al. 2005b; Rajkumar et al. 2005; Kumar et al. 2006; Thangaraj et al. 2006b
73 - 79
West Gujarat 3 Metspalu et al. 2004; Thangaraj et al. 2006b 80 - 82
Maharashtra 9 Basu et al. 2003; Kivisild et al. 2003; Metspalu et al. 2004; Rajkumar et al. 2005; Gaikwad et al. 2005; Thanseem et al. 2006
83 - 91
Rajasthan 1 Metspalu et al. 2004; Thanseem et al. 2006 92
Central Madhya Pradesh
2
Thangaraj et al. 2005b; Watkins et al. 1999
93, 94
Chattisgarh 7
Roychoudhary et al. 2000; Roychoudhary et al. 2001; Basu et al. 2003; Thangaraj et al. 2005b; Kumar et al. 2006 95 - 101
792 Molecular Biological Perspectives of Tribes in India
Journal of the Anthropological Survey of India, 62(2): (775-804), 2013
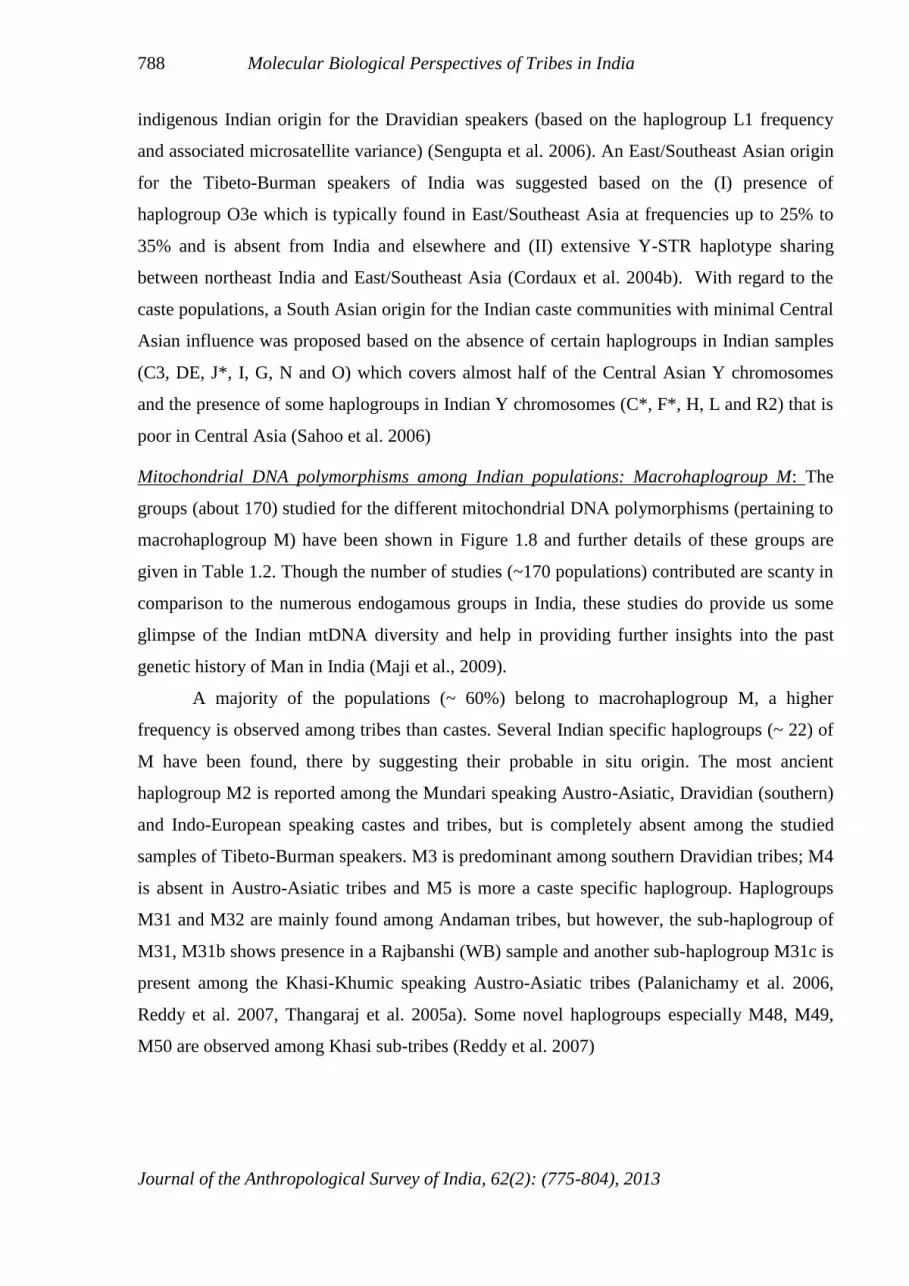
Table 1.2 Contd… South
Kerala 12
Mountain et al. 1995; Edwin et al. 2002; Cordaux et al. 2003; Basu et al. 2003; Metspalu et al. 2004; Thanseem et al. 2006; Thangaraj et al. 2006b
102 - 113
Karnataka 12 Mountain et al. 1995; Cordaux et al. 2003; Rajkumar et al. 2005; Thanseem et al. 2006
114 - 125
Tamil Nadu 19
Watkins et al. 1999; Roychoudhury et al. 2000; Roychoudhury et al. 2001; Edwin et al. 2002; Basu et al. 2003; Cordaux et al. 2003; Thangaraj et al. 2005b; Thanseem et al. 2006; Thangaraj et al. 2006b
126 - 144
Andhra Pradesh 21
Bamshad et al. 1996; Bamshad et al. 1998; Kivisild et al. 1999; Bamshad et al. 2001; Kivisild et al. 2003; Cordaux et al. 2003; Sun et al. 2006; Rajkumar et al. 2005; Thangaraj et al. 2005b; Thanseem et al. 2006; Thangaraj et al. 2006b
145 - 165
A & N Islands 5 Thangaraj et al. 2003; Endicott et al. 2003; Thangaraj et al. 2005a, b; Thangaraj et al. 2006b
166 - 170
The distribution of the sub-haplogroups of M, among the tribes and castes, across the
different regions of India is shown in Figures 1.9a and 1.9b. A majority of mtDNA M sub-
haplogroups pervades among the castes and tribes, though some sub-haplogroups differ
between the two and some more specific to either castes or tribes. For example, few
haplogroups such as M25, M35, M38 and M39 show almost similar frequencies among castes
and tribes, although these are found at low frequencies (less than 5%). The haplogroups M34
and M36 are observed only among castes whereas six haplogroups: M32, M34, M41, M48,
M49 and M50 are found in tribes only. While some haplogroups are more predominant in
castes, some others are prevalent among tribes. For example, five haplogroups: M2, M3, M18,
M31 and M33 show higher frequencies in tribes than castes and five other haplogroups: M4,
M5, M6, M30 and M37 are more prevalent among castes than in tribes. Of the observed
haplogroups, M5 and M31 showed significant differences (at 95% confidence interval) among
castes and tribes. Figure 1.10 also shows the frequency distribution of the M haplogroups
among the studied castes and tribes of India.

Krithika S, Suvendu Maji, T. S. Vasulu 793
Journal of The Anthropological Survey of India, 62(2): (775-804), 2013
Figure 1.9a: Distribution of the sub-haplogroups of M, among the tribes, across the different regions of India [A- Northern; B- North-Eastern; C- Eastern; D- Southern; E- Western; F- Central]
TB
AA
IEU
TB
AA DRV
IEU
IEU DRV
IEU
DRV
IEU
UNCLS
ANDAMANESE 4
M2 M3 M4 M5 M6 M18 M25 M30M31 M32 M33 M34 M35 M36 M37 M38M39 M40 M41 M48 M49 M50 M*/ M
IEU: Indo-European; TB: Tibeto-Burman; AA: Austro-Asiatic; DRV: Dravidian
A
B
C
D
E F
TRIBES

794 Molecular Biological Perspectives of Tribes in India
Journal of the Anthropological Survey of India, 62(2): (775-804), 2013
Figure 1.9b: Distribution of the sub-haplogroups of M, among the castes, across the different regions of India [A- Northern; B- North-Eastern; C- Eastern; D- Southern; E- Western; F- Central]
4
M2 M3 M4 M5 M6 M18 M25 M30M31 M32 M33 M34 M35 M36 M37 M38M39 M40 M41 M48 M49 M50 M*/ M
IEU: Indo-European; TB: Tibeto-Burman; AA: Austro-Asiatic; DRV: Dravidian
A
B
C
D
E
F
CASTES

Krithika S, Suvendu Maji, T. S. Vasulu 795
Journal of The Anthropological Survey of India, 62(2): (775-804), 2013
Figure 1.10: Frequency distribution of the sub-haplogroups of M among castes and tribes of India
Interestingly, the two branches of the Austro-Asiatic linguistic family exhibit
differences in their haplogroup diversity: the Mon-Khmer branch of north-eastern region
showing greater haplogroup diversity than the Mundari branch of the eastern region. Also, the
tribes of the same linguistic family distributed over different geographical regions show
differences in their haplogroup diversity. Dravidian tribes of the southern region were found to
show more number of haplogroups of M than those of the central and the eastern regions. The
tribes of Andaman-and-Nicobar Islands show unique haplogroup composition, different from
the other tribal populations of the subcontinent. Among the castes, the Indo-European
speakers of the northern region and the Dravidian speakers of the southern region show more
haplogroup diversity than the caste populations of other regions.
Overview of the mtDNA studies: Macrohaplogroup M: The Indian picture of M haplogroup
distribution shows wide prevalence of some haplogroups across the regions and ethnicity,
though some show affiliations to regions and ethnicity. The uneven distribution of M sub-
haplogroups across linguistic, ethnic and geographic boundaries could possibly be explained
0.00
5.00
10.00
15.00
20.00
25.00
30.00
M2
M3
M4
M5
M6
M18
M25
M30
M31
M32
M33
M34
M35
M36
M37
M38
M39
M40
M41
M48
M49
M50
M/ M
*
SUB-HAPLOGROUPS
Fre
quen
cy
C T

796 Molecular Biological Perspectives of Tribes in India
Journal of the Anthropological Survey of India, 62(2): (775-804), 2013
by the (a) low molecular resolution: since few general markers are being used to predate the
population subdivisions, every population becomes similar and also, if the population
diversification is relatively recent, there is not enough time to generate and accumulate
mutations; (b) high level of interbreeding and admixture between populations; (c) sub
structuring of populations into small endogamous units, each of which evolves independently
and the genetic drift erases the general genetic signatures of population histories. Possibly a
better picture is expected to emerge in future with the addition of more representative and
adequate samples of the total of 4635 communities.
One of the most important and well appreciated fact is that mtDNA generate an
enormous impact in understanding the past genetic history of man and especially the maternal
migration of the populations that shaped the entire mankind. Among the M haplogroups, M2
is the most ancient (the estimated coalescence time around 60,200 ± 8,600 years) and is found
mostly among the Dravidian castes (except for Chenchu and Koya among tribes) and Mundari
speaking Austro-Asiatic tribes. This estimated coalescence time of M2 corroborates with the
‘Out of Africa’ theory of human evolution. The complex mtDNA tree could be the result of
population expansion. The absence of M2 and the presence of east/southeast Asian specific
mtDNA haplogroups (of macrohaplogroup N) among the Tibeto-Burman speakers of
northeast India suggest their independent origin and relatively recent entry possibly from
east/southeast Asian regions.
There are several limitations in these studies that might influence the inferences drawn.
The implemented sampling strategy is one of the major constraints, as the selected samples do
not always wholly represent the studied populations with reference to their geographical
settlement as well as their size. Furthermore, constraint also prevails in the laboratory
techniques and the lack of quality control in sequencing and identification of mutation sites.
For example, many published sequences on scrutiny were found to be erroneous (Sun et al.
2006 on the study of Rajkumar et al. 2005), that is often misleading. The study based on about
3.6% of the Indian populations so far reveal vast mtDNA diversity and several unique
haplogroups as a result of which the mtDNA phylogenetic tree depicts a very complex
scenario that lead to difficulty in discerning the patterns. And with such increasing studies
including more number of populations will further complicate the mtDNA phylogenetic tree.
This raises the necessity for developing improved methods of classification of the mtDNA
haplogroups to enable to obtain a better clarity of the mtDNA diversity of the Indian
populations.

Krithika S, Suvendu Maji, T. S. Vasulu 797
Journal of The Anthropological Survey of India, 62(2): (775-804), 2013
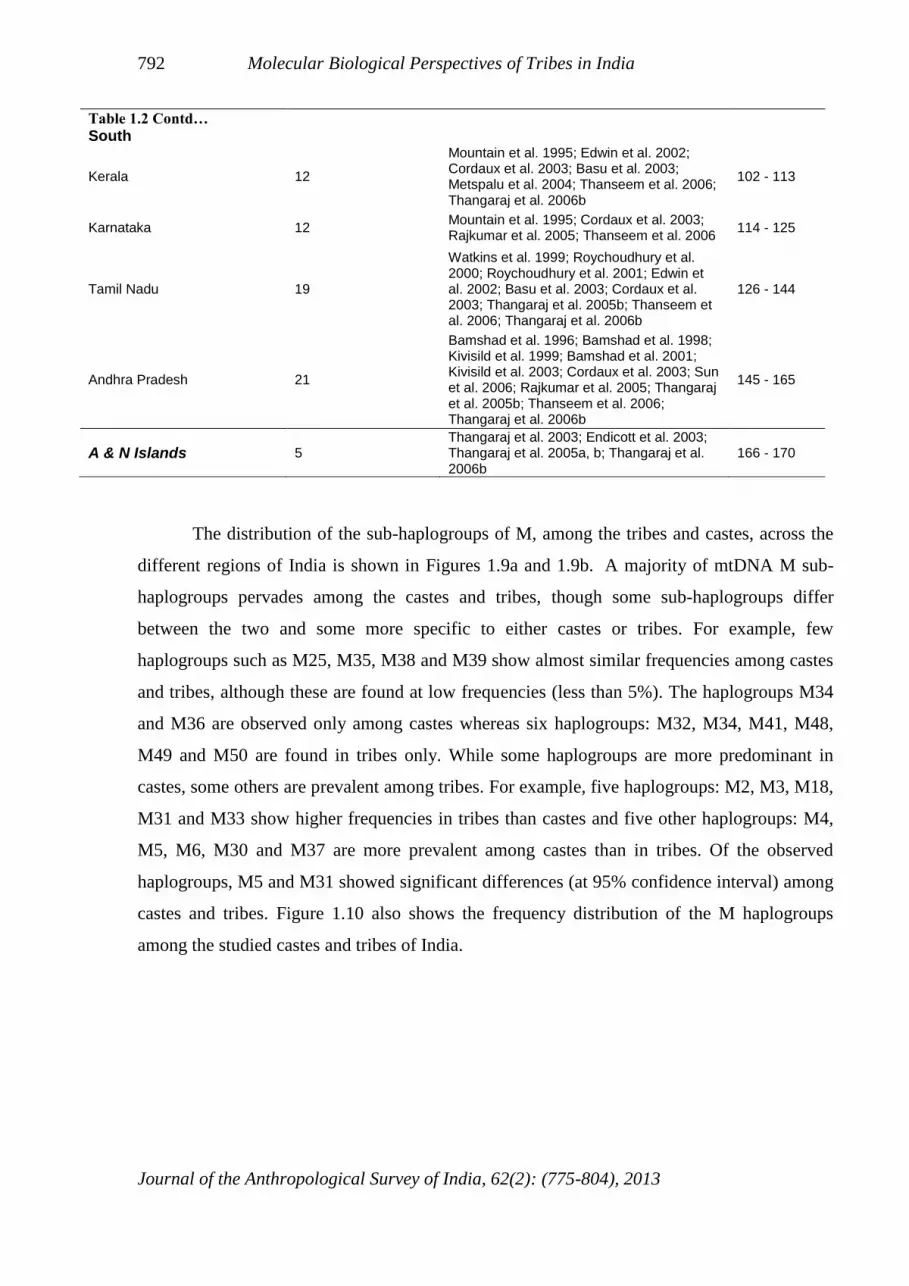
Mitochondrial DNA polymorphisms among Indian populations: Macrohaplogroup N: Figure
1.11 shows the geographical regions where haplogroups and sub-haplogroups of N have been
reported and the region-wise distribution of macrohaplogroup N in India is depicted in Figure
1.12.
Overall, the mtDNA N haplogroup distribution, among about 130 castes and tribes of
different regions show wide diversity (Maji et al, 2008). The number of studied castes and
tribes vary between regions; from few castes and tribes in central region to around 25 castes
and tribes in southern region. Despite the disparity in the number of castes and tribes studied
in different regions certain trends of variation in haplogroup distribution can be observed
especially with respect to sub-haplogroups R and U. For example, the western region exhibits
39 R sub-haplogroups among 12 castes studied where as central region shows only four sub-
haplogroups among the caste populations studied. In case of southern region, the studied caste
populations show 18 different sub-haplogroups of R and among tribes, the southern region
shows as many as 17 R sub-haplogroups. The tribes from island regions show 6 haplogroups
and in the central region, the studied tribes hardly show any R-haplogroup diversity.
In case of U-sub-haplogroup distribution, the western region shows the highest of 18
different haplogroups among 12 castes. 19 haplogroups have been observed among 25 castes
studied in the southern region and the sub-haplogroup was absent among studied castes of the
central region. Among tribes, the northern region (one tribe) exhibit five sub-haplogroups of U
and the northeastern region shows more homogeneity among the groups studied (for example,
13 tribes exhibit only 5 different sub-haplogroups of U). Overall, the southern region shows
higher haplogroup diversity than the other regions, it shows 16 different haplogroups of U
among 24 tribes studied. Possibly more mtDNA diversity studies on diverse ethnic
populations of India will provide a better understanding of the maternal genetic history of
Indian populations besides revealing more patterns that could be related to their geography,
language and ethnicity.

798 Molecular Biological Perspectives of Tribes in India
Journal of the Anthropological Survey of India, 62(2): (775-804), 2013
1
2
3 -7
8 - 20
24
21-23
25 26
27 - 31
32, 33
34 - 43
44 - 57
58 59 - 61
70
62 - 69
71, 72
73 - 77
107 - 126
85 - 90
91 - 106 78 - 84
127 - 129
130, 131
1- Mixed Caste, 2- Kanet, 3- Jat Sikh, 4- Scheduled Caste, 5- Punjab Brahmins, 6- Lobanas, 7- Mixed Caste, 8- Rohidas, 9- UP Brahmins, 10- Chamar, 11- Muslims, 12- Rajput, 13- Khatris, 14- Tharu, 15- Buksa, 16- Bhargava, 17- Chatruvedi, 18- Mixed Caste, 19- Yadava, 20- Tiwari, 21- Adi, 22- Apatani, 23- Nishi, 24- Naga, 25- Meitei, 26- Mizo, 27- Tipperah, 28- Chakma, 29- Jamatia, 30- Mog, 31- Riang, 32- Khasi, 33- Garo, 34- Lodha, 35- Santal, 36- Munda, 37- Bagdi, 38- WB Brahmins, 39- Mahiashya, 40- Toto, 41- Rajbhansi, 42- Mixed Caste , 43- Kurmi, 44- Agharia, 45- Gaud, 46- Juang, 47- Munda, 48- Tanti, 49- Saora, 50- Paroja, 51- Gope, 52- Karan, 53- Bhuiyan, 54- Bathudi, 55- Khandayat, 56- Orissa Brahmins, 57- Gadaba, 58- Ho, 59- Gujrati, 60- Mixed Caste, 61- Kathodi, 62- Desasth Brahmins, 63- Chitpavan Brahmins, 64- Dhangar, 65- Maratha, 66- Konkanastha Brahmins, 67- Naba Baudh, 68- Other Maharashtrian Brahmins, 69- Parsi, 70- Rajput, 71- Gond, 72- Koli, 73- Muria, 74- Kanwar, 75- Kamar, 76- Halba, 77- Saryupari Brahmins, 78- Kadar, 79- Toda, 80- Kuruchian, 81- Mullukurunan, 82- Paniyan, 83- Mixed Caste, 84- Cochin Jews, 85- Havik, 86- Mukri, 87- Soliga, 88- Koraga, 89- Yerava,90- Karnataka Brahmins, 91- Irula, 92- Kota, 93- Kurumba, 94- Ambalakarer, 95- Iyer, 96- Iyengar, 97- Pallan, 98- Vanniyar, 99- Kadar, 100- Paniyan, 101- Vellala, 102- Jennukurumba, 103- Kattunaikan, 104- Mullukurumba, 105- Bettakurumba, 106- Baduga, 107- Niyogi Brahmins, 108- Vydiki Brahmins, 109- Kshtriya, 110- Vyaya, 111- Teliga, 112- Turpu Kapu, 113- Yadava, 114- Relli, 115- Madiga, 116- Mala, 117- Pardhan, 118- Naikpod, 119- Chenchu, 120- Koya, 121- Lambadi, 122- Pardhi, 123- Thoti, 124- AP Brahmins, 125- Reddy, 126- Thogataveera, 127- Jarwa, 128- Onge, 129- Great Andamanese, 130- Nicobarese, 131- Shompen.
Figure 1.11: Map of India showing the location of the populations studied for mitochondrial DNA polymorphisms, with special reference to macrohaplogroup N
62-69
130, 131
127-129
78-84
91-106
85-90
107-126
59 - 61
1
70 8 - 20 21-23
73-77
71, 72 58
27 - 31
26 25
24
44 - 57
34 - 43
32 - 33
3-7 2
Krithika S, Suvendu Maji, T. S. Vasulu 799
Journal of The Anthropological Survey of India, 62(2): (775-804), 2013
Figure 1.12: Region wise distribution of mitochondrial DNA macrohaplogroup N in India
The inferences drawn upon the past genetic history of the Indian populations, based on
the distribution of the Y-chromosome polymorphisms and the mtDNA haplogroups M and N
in different regions of India, is discussed below.
D. Antiquity or past genetic history-molecular genetic studies:
Regarding the Austro-Asiatic speaking tribal populations, the results of the molecular genetic
studies, in general, indicate that these populations are the earliest inhabitants of the Indian
subcontinent. The analysis of mtDNA restriction site polymorphisms (RSPs) and control
region (HV1) showed greater mtDNA haplotype diversity and high HV1 nucleotide diversity
among the Austro-Asiatic speakers thereby indicating their greater antiquity (Roychoudhury et
al. 2001, Basu et al. 2003). Also the mtDNA studies revealed different demographic histories
K K2a U
* U2 U2
a U2c U2
i U5 U
7
R R* R5 R6 R7 R30 H14 HV TJ N1 J2 T X
U1a U2
a U2b U
3 U5a1 U
7 K1a1 K U2
i U*
N1 N N5 N1d H HV J1b J1c1 T1a T2a R5 R30 R31 R* TJ X
U U* U2i U7 A R*
U A N R
U2i
HV pHV R* R/HV R6
U U2a U2b U7 U2i U7a
H R* R/HV R/HV3 R5 R7 T
U3 U2
a U2c U2
b U8 U2
a U2c U
4 K U7 U2
i U* U
8 U5a1a
HV N1 N* N R R5 R6 R* B F H J2 I X
U* U2i U7
U* U2i U7
R R5 R*
R*
U* U2
i U7 U1
a U2e R R*
U* U2
i U7 U2
b U2c
B F H HV TJ N1 R* N* J1 W X
A B F HV TJ N1 X I1 W3 R1 R6 R7 N R30 R31 R* Pre - HV1 HV2 T T1a T2
T2b U U4 U7 U2i
U HV N T
U* U1 U2i U7
B F HV TJ N1 N R* X
F
B5b B6 R8 U2b R
*
A HV TJ N1 X R*
R A F U A F U
A F U
B5a B5a1 F1a1a1 F Fa1a1 R12
13
7 16
20
14
5
5
1
6
2
3
8
1
2
3
O F R R* R6 R9* J W H HV F* F1b U* U2a
U2b U2i
10
R* R R2 R5 R6 R9 R9a R9* R10 R11
T T* T1 T2
5
1
U U2 U2b U5 U7
R R9 W
1
R7 U U
U
U 1 1
5
Caste # Populations
Tribe

800 Molecular Biological Perspectives of Tribes in India
Journal of the Anthropological Survey of India, 62(2): (775-804), 2013
for the maternal lineages of the Mundari and the Mon-Khmer groups of Austro-Asiatic
linguistic family suggestive of multiple origins of the Austro-Asiatic groups of the Indian
subcontinent (Thangaraj et al. 2005b, Kumar et al. 2006, 2008). While the Mundari groups
were found to carry predominantly Indian-specific mtDNA haplogroups, the Mon-Khmer
speakers possessed East Asian specific mtDNA haplogroups. Based on these results, it was
inferred that the ancestors of present-day Mundari groups might have been the first to arrive in
India through the western Indian corridor, subsequently migrating to Southeast Asia. This was
probably followed by the migration of the Khasi and later by the Nicobarese from Southeast
Asia. Hence the results not only suggested distinct genetic origins of the Austro-Asiatic
linguistic subgroups, but also indicated a non-Asian and Asian source of migration of the
Mundari and the Mon-Khmer populations of India, respectively (Kumar et al. 2006). Further,
the autosomal marker study among diverse tribes of India also showed wide divergence
between Khasi and Mundari groups, thus corroborating the study on mtDNA (Krithika et al.,
2009). However, in contrast to the mtDNA studies, the Y-chromosome studies indicated a
common paternal heritage of the Austro-Asiatic populations (Kumar et al. 2007). The
predominance of Y-chromosome haplogroup O2a-M95 in Austro-Asiatic speaking
populations of India and Southeast Asia and its absence/negligible presence in other Asian
populations suggests a common genetic heritage of the people of this linguistic family (Kumar
et al. 2007). Further analyses indicated that that the haplogroup O2a-M95 had originated
(around 65,000 YBP) in the Mundari speaking Austro-Asiatic populations of India, in contrast
to Kayser et al. (2003) who suggested a Southeast Asian origin for O2a-M95. Kayser et al.
(2003) suggested the migration of the Austro-Asiatic populations from Southeast Asia to India
whereas Kumar et al. (2007) argued that the ancestors of the present day Mundari speakers
carried this haplogroup from India further to Southeast Asia through the northeast Indian
corridor. Hence, the study by Kumar et al. (2007) thus inferred that most likely these Mundari
populations have come from Central Asia through the Western Indian corridor and
subsequently colonized Southeast Asia.
Pertaining to Dravidian speakers, a mtDNA study (Quintana-Murci et al. 2004)
supported the earlier proposed proto-Elamite hypothesis of their origin, whereas an indigenous
origin of the Dravidian speakers was put forward in a recent study (Sengupta et al. 2006)
based on Y-chromosome haplogroup distribution and the associated Y-STR variance. Based
on the pattern of genetic variation, the study inferred that Dravidian speakers may have been
more widespread before the Indo-European speakers entered into India and later retreated
Krithika S, Suvendu Maji, T. S. Vasulu 801
Journal of The Anthropological Survey of India, 62(2): (775-804), 2013
southward (their present habitat) to avoid Indo-European dominance [‘Elite Dominance
Model’]. A recent study based on autosomal markers have shown genetic affinity between the
Dravidian tribes and the Austro-Asiatic speaking tribes, suggesting the strong contention, that
the they possibly derived from a common ancestor in remote past and their divergent linguistic
backgrounds could be attributed to their migration to different geographical regions and
consequent isolation has brought significant changes in their language (Krithika et al., 2009)
An overview of the molecular genetic studies of Indian populations reveals that among
the studied populations (~200), TB groups constituted only roughly around 10% of the total
studied populations and hardly represented the vast diversity of the TB groups of India. In this
regard, mtDNA studies on Tibeto-Burman populations suggest a probable East Asian origin as
they harbour low frequency of mtDNA haplogroup M and possess higher frequency of East
Asian specific mtDNA haplogroups (A & F) thereby indicating their close genetic affinity
with East Asian groups (Cordaux et al. 2003). The Y-lineages (high frequency of haplogroup
O-M134) of the TB groups were also found to be more closely related to East/Southeast Asia
than to other Indian Y lineages (Cordaux et al. 2004b) and also extensive sharing of the Y
STR haplotypes between the Indian TB groups and East/Southeast Asians were also reported.
Overall the TB groups of India were found to exhibit high homogeneity among the groups
(both their Y-chromosomes and mtDNA) and are also characterized by reduced Y-
chromosome diversity, in contrast to their extensive mtDNA diversity (Cordaux et al. 2004b).
REFERENCES
Bamshad M, Fraley AE, Crawford MH, Cann RL, Busi BR, Naidu JM, Jorde LB. 1996. mtDNA variation in caste populations of Andhra Pradesh, India. Hum Biol, 68(1):1-28
Barnabas S, Apte RV, Suresh CG. 1996. Ancestry and interrelationships of the Indians and their relationship with other world populations: a study based on mitochondrial DNA polymorphisms. Ann Hum Genet, 60(Pt 5):409-22
Barnabas S, Shouche Y, Suresh CG. 2006. High-Resolution mtDNA studies of the Indian population: Implications for palaeolithic settlement of the Indian subcontinent. Ann Hum Genet, 70: 42-58
Basu A, Mukherjee N, Roy S, Sengupta S, Banerjee S, Chakraborty M, Dey B, Roy M, Roy B, Bhattacharyya NP, Roychoudhury S, Majumder PP. 2003. Ethnic India: a genomic view, with special reference to peopling and structure. Genome Res, 13: 2277-2290
Beteille A. 1998. The Indian heritage—A sociological perspective. In: Balasubramanian D, Appaji Rao N, editors. The Indian human heritage. Hyderabad, India: University Press, pp. 87–94.
Bhasin MK and Walter H. 2001. Genetics of castes and tribes of India. Delhi: Kamla-Raj Enterprises
Bhattacharyya NP, Basu P, Das M, Pramanik S, Banerjee R, Roy B, Roychoudhury S, Majumder PP. 1999. Negligible male gene flow across ethnic boundaries in India, revealed by analysis of Y-chromosomal DNA polymorphisms. Genome Res, 9(8):711-9

802 Molecular Biological Perspectives of Tribes in India
Journal of the Anthropological Survey of India, 62(2): (775-804), 2013
Bindu GH, Trivedi R, Kashyap VK. 2007. Allele frequency distribution based on 17 STR markers in three major Dravidian linguistic populations of Andhra Pradesh, India. Forensic Sci Int, 170: 76-85
Buxton LHD. 1925. The peoples of Asia. London
Cavalli-Sforza LL, Menozzi P, Piazza A. 1994. The history and geography of human genes. Princeton: Princeton University Press
Census of India. 2001. Provisional Population Tables, Paper 1, Series 1. New Delhi: Office of Registrar General, Government of India Publication
Cordaux R, Saha N, Bentley GR, Aunger R, Sirajuddin SM, Stoneking M. 2003. Mitochondrial DNA analysis reveals diverse histories of tribal populations from India. Eur J Hum Genet, 11(3): 253-264
Cordaux R, Aunger R, Bentley G, Nasidze I, Sirajuddin SM, Stoneking M. 2004a. Independent origins of Indian caste and tribal paternal lineages. Curr Biol, 14(3): 231-235
Cordaux R, Weiss G, Saha N, Stoneking M. 2004b. The Northeast Indian Passageway: A Barrier or Corridor for Human Migrations? Mol Biol Evol, 21(8):1525–1533
Das K, Malhotra KC, Mukherjee BN, Walter H, Majumder PP, Papiha SS. 1996. Population structure and genetic differentiation among 16 tribal populations of central India. Hum Biol, 68(5):679-705
Endicott P, Metspalu M, Kivisild T. 2007. Genetic evidence on modern Human dispersals in South Asia: Y chromosome and mitochondrial DNA perspectives: The world through the eyes of two haploid genomes. In: Petraglia MD, Allchin B, editors. The evolution and history of human populations in South Asia. The Netherlands: Springer, pp.229-244
Fuchs S. 1973. The aboriginal tribes of India. London: Macmillan.
Gadgil M and Malhotra KC. 1983. Adaptive significance of the Indian caste system: an ecological perspective. Ann Hum Biol, 10(5): 465-77
Gadgil,M, Joshi NV, Shambu Prasad UV, Manoharan S, Suresh Patil. 1997. Peopling of India. In: Balasubramanian D, Appaji Rao N, editors. The Indian Human Heritage. Hyderabad, India: University Press
Guha BS. 1935. The racial affinities of the people of India. In: Census of India, 1931, III. Ethnographical. Simla: Government of India Press
Kayser M, Brauer S, Weiss G, Schiefenhovel W, Underhill P, Shen P, Oefner P, Tommaseo-Ponzetta M, Stoneking M. 2003. Reduced Y-chromosome, but not mitochondrial DNA, diversity in human populations from West New Guinea. Am J Hum Genet, 72: 281-302
Kennedy KAR. 1984. Biological adaptations and affinities of Mesolithic South Asians. In: Lukas JR, editor. The people of south Asia. The biological anthropology of India, Pakistan and Nepal. London: Plenum Press. pp. 29-57
Krithika, S. Suvendu Maji, T.S. Vasulu. 2009: A microsatellite study to disentangle the ambiguity of linguistic, geographic, ethnic and linguistic influences on tribes of India to get a better clarity of the antiquity and peopling of South Asia. Am J Phy Anthrop, 139(4):533-546. Web On line 13March.DOI.10.1002/ajpa.21018
Kumar S, Padmanabham PB, Ravuri RR, Uttaravalli K, Koneru P, Mukherjee PA, Das B, Kotal M, Xaviour D, Saheb SY, Rao VR. 2008. The earliest settlers' antiquity and evolutionary history of Indian populations: evidence from M2 mtDNA lineage. BMC Evol Biol, 8(1):230
Kumar V, Langsiteh BT, Biswas S, Babu JP, Rao TN, Thangaraj K, Reddy AG, Singh L, Reddy BM. 2006. Asian and Non-Asian Origins of Mon-Khmer and Mundari Speaking Austro-Asiatic Populations of India. Am J Hum Biol, 18: 461-469

Krithika S, Suvendu Maji, T. S. Vasulu 803
Journal of The Anthropological Survey of India, 62(2): (775-804), 2013
Kumar V, Reddy ANS, Babu1 JP, Rao TN, Langstieh BT, Thangaraj K, Reddy AG, Singh L. 2007. Y-chromosome evidence suggests a common paternal heritage of Austro-Asiatic populations. BMC Evol Biol, 7:47
Suvendu Maji, S. Krithika and T.S. Vasulu. 2008. Mitochondrial DNA distribution of Macohaplogroup N and its haplogroup U and subhaplogroup R in Indian populations. In Trends in Molecular Anthropology, (Ed) B. Mohan Reddy, Kamla-Raj Enterprises. 85-96.
Suvendu Maji, Krithika, S, T.S. Vasulu. 2009: Phylogeographic distribution of mitochondrial
DNA macrohalplogroup M in India. Journal of Genetics 48: web on line 13th March 09.88(1):127-139.
Majumder PP and Mukherjee BN. 1993. Genetic diversity and affinities among Indian populations: An
overview. In: Majumder PP, editor. Human population genetics. New York: Plenum. pp. 255-275
Majumder PP. 1998. People of India: Biological diversity and affinities. Evol Anthropol, 6: 100-110
Malhotra KC. 1978. Morphological composition of the people of India. J Hum Evol, 7: 45-63
Malhotra KC. 1984. Population structure among the Dhangar caste-cluster of Maharashtra, India. In: JR, editor. The People of South Asia. New York: Plenum Press
Malhotra KC and Vasulu TS. 1993. Structure of human populations in India. In: Majumder PP, editor. Human population genetics. New York: Plenum. pp 207–233
Mountain JL, Hebert JM, Bhattacharyya S, Underhill PA, Ottolenghi C, Gadgil M, Cavalli-Sforza LL. 1995. Demographic history of India and mtDNA-sequence diversity. Am J Hum Genet, 56(4):979-92
Mourant AE, Kopec AC, Domaniewska-Sobczak K. 1976. The distribution of the human blood groups and other polymorphisms. London: Oxford University Press
Nei M and Roychoudhury AK. 1972. Gene differences between Caucasian, Negro, and Japanese populations. Science, 177(47):434-6
Palanichamy MG, Agrawal S, Yao YG, Kong QP, Sun C, Khan F, Chaudhuri TK, Zhang YP. 2006. Comment on "Reconstructing the origin of Andaman islanders". Science, 311(5760):470
Papiha SS. 1996. Genetic variation in India. Hum Biol, 68(5):607-28
Pattanayak DP. 1998. The Language Heritage of India. In: Balasubramanian D, Rao NA, editors. The Indian human heritage. Hyderabad: University Press. pp. 95-99
Poliakov L. 1974. The Aryan Myth. New York: Basic Books
Quintana-Murci L, Chaix R, Wells RS, Behar DM, Sayar H, Scozzari R. 2004. Where West meets East: the complex mtDNA landscape of the southwest and central Asian corridor. Am J Hum Genet, 74: 827-845
Rajkumar R, Banerjee J, Gunturi HB, Trivedi R, Kashyap VK. 2005. Phylogeny and antiquity of M macrohaplogroup inferred from complete mtDNA sequence of Indian specific lineages. BMC Evol Biol, 5: 26
Rapson EJ. 1955. People and Languages. In: Rapson EJ, editor. Cambridge history of India, Vol 1. Delhi: S. Chand. pp. 33–57
Ratnagar S. 1995. Archaeological perspectives of early Indian societies. In: Thapar R, editor. Recent perspectives of early Indian history. Bombay, India: Popular Prakashan, pp 1–52.
Reddy BM, Langstieh BT, Kumar V, Nagaraja T, Reddy ANS, Meka A, Reddy AG, Thangaraj K, Singh L. 2007. Austro-Asiatic Tribes of Northeast India Provide Hitherto Missing Genetic Link between South and Southeast Asia. PLoS ONE, 2(11): e1141

804 Molecular Biological Perspectives of Tribes in India
Journal of the Anthropological Survey of India, 62(2): (775-804), 2013
Renfrew C. 1989. The origins of Indo-European languages. Sci Am, 261: 82-90
Renfrew C. 1992. Archaeology,genetics and linguistic diversity. Man, 27: 445–478
Rishley HH. 1915. The People of India. Calcutta: Thacker Spink
Roychoudhury AK. 1977. Genetic diversity in Indian populations. Hum Genet, 46: 99-106
Roychoudhury S, Roychoudhury S, Roy S, Dey B, Chakraborty M, Roy M, Roy B, Ramesh A, Prabhakaran N, Usha Rani MV, Vishwanathan H, Mitra M, Sil SK, Majumder PP. 2000. Fundamental genomic unity of ethnic India is revealed by analysis of mitochondrial DNA. Curr Sci, 79: 1182-1192
Ruhlen M. 1991. A guide to the world's languages: Volume 1, Classification. Stanford, California: Stanford University Press
Sahoo S, Singh A, Himabindu G, Banerjee J, Sitalaximi T, Gaikwad S, Trivedi R, Endicott P, Kivisild T, Metspalu M, Villems R, Kashyap VK.2006. A prehistory of Indian Y-chromosomes: evaluating demic diffusion scenarios. Proc Natl Acad Sci USA, 103(4): 843-848
Sarkar SS. 1958. Race and race movements in India. In: Chatterjee SK, editors. The cultural heritage of India. Calcutta: Ramakrishna Mission Institute of Culture. pp. 17-32
Sengupta S, Zhivotovsky LA, King R, Mehdi SQ, Edmonds CA, Chow CE, Lin AA, Mitra M, Sil SK, Ramesh A, Usha Rani MV, Thakur CM, Cavalli-Sforza LL, Majumder PP, Underhill PA. 2006. Polarity and temporality of high-resolution Y-chromosome distributions in India identify both indigenous and exogenous expansions and reveal minor genetic influence of central Asian pastoralists. Am J Hum Genet, 78(2): 202-221
Shaffer JG. 1982. Harappan culture: A reconsideration. In: Possehl G, editor. Harappan civilization: A contemporary perspective. New Delhi, India: American Institute of Indian Studies, Oxford and IBH Publishers, pp. 41-50
Singh KS. 1994. People of India: the scheduled tribes, VolumeIII. Delhi: Oxford University Press
Sun C, Kong QP, Palanichamy MG, Agrawal S, Bandelt HJ, Yao YG, Khan F, Zhu CL, Chaudhuri TK, Zhang YP. 2006. The dazzling array of basal branches in the mtDNA macrohaplogroup M from India as referred from complete genomes. Mol Biol Evol, 23: 683-690
Thangaraj K, Chaubey G, Kivisild T, Reddy AG, Singh VK, Rasalkar A, Singh L. 2005a. Reconstructing the origin of Andaman Islanders. Science, 308 (5724): 996
Thangaraj K, Sridhar V, Kivisild T, Reddy AG, Chaubey G, Singh VK, Kaur S, Agarawal P, Rai A, Gupta J, Mallick CB, Kumar N, Velavan TP, Suganthan R, Udaykumar D, Kumar R, Mishra R, Khan A, Annapurna C, Singh L.2005b. Different population histories of the Mundari- and Mon-Khmer-speaking Austro-Asiatic tribes inferred from the mtDNA 9-bp deletion/insertion polymorphism in Indian populations. Hum Genet, 116: 507-517
Thapar R. 1966. A history of India, Vol 1. Middlesex: Penguin
Thapar R. 1995. The first millennium B.C. in northern India (up to the end of Mauryan period). In: Thapar R, editor. Recent perspectives of early Indian history. Bombay, India: Popular Prakashan, pp. 80–141.