
Module 4: Impacts of Oil and Gas Operations on the ... - USAID
365
COMPENDIUM OF TRAINING MATERIALS FOR IMPROVING MANAGEMENT OF THE IMPACT OF OIL AND GAS ON BIODIVERSITY AND ENVIRONMENT Module 4: Impacts of Oil and Gas Operations on the Environment and Biodiversity SEPTEMBER 2017 This publication was produced for review by the United States Agency for International Development. It was prepared by Tetra Tech. STEVE AMOOTI NSITA
-
Upload
khangminh22 -
Category
Documents
-
view
4 -
download
0
Transcript of Module 4: Impacts of Oil and Gas Operations on the ... - USAID

COMPENDIUM OF TRAINING MATERIALS FOR IMPROVING MANAGEMENT OF THE IMPACT OF OIL AND GAS ON BIODIVERSITY AND ENVIRONMENT
Module 4: Impacts of Oil and Gas Operations on the Environment and Biodiversity
SEPTEMBER 2017
This publication was produced for review by the United States Agency for International Development. It was prepared by Tetra Tech.
STEV
E A
MO
OTI
NSI
TA

This publication was produced for review by the United States Agency for International Development by Tetra Tech, Inc., through the Environmental Management for the Oil Sector Activity. This report was prepared by: Tetra Tech 159 Bank Street, Suite 300 Burlington, VT 05401 USA Telephone: (802) 495-0282 Fax: (802) 658-4247 E-Mail: [email protected] Tetra Tech Contacts: Vaneska Litz, Project Manager 159 Bank Street, Suite 300 P.O. Box 1397 Burlington, VT 05402 USA Telephone: (802) 495-0282 Fax: (802) 495-0282 E-Mail: [email protected]
Jones Ruhombe, Chief of Party [email protected]
Cover Photo Caption: Training local forest owners in Hoima District in inventory of biodiversity in natural forests.

COMPENDIUM OF TRAINING MATERIALS FOR IMPROVING MANAGEMENT OF THE IMPACT OF OIL AND GAS ON BIODIVERSITY AND ENVIRONMENT MODULE 4: IMPACTS OF OIL AND GAS OPERATIONS ON THE ENVIRONMENT AND BIODIVERSITY
SEPTEMBER 2017 DISCLAIMER
The author’s views expressed in this publication do not necessarily reflect the views of the United States Agency for International Development or the United States Government.

TABLE OF CONTENTS
ACRONYMS AND ABBREVIATIONS ..................................................................... iii INTRODUCTION AND CONTEXT ......................................................................... 1
1. BACKGROUND ................................................................................................................. 1 2. PROCESS OF DEVELOPING THE COMPENDIUM ................................................. 2 3. AIMS AND SCOPE OF THE COMPENDIUM ............................................................ 2 4. WHO IS THE COMPENDIUM FOR? ........................................................................... 2 5. ARRANGEMENT OF THE COMPENDIUM ............................................................... 4 6. HOW TO USE THE COMPENDIUM ........................................................................... 5 7. A NOTE ON SOURCES ................................................................................................... 5 8. THE CONTENT OF THIS MODULE ........................................................................... 6
REFERENCES ....................................................................................................................... 6 LECTURE 1: IMPACTS OF OIL AND GAS DEVELOPMENT ON
BIODIVERSITY AND THE ENVIRONMENT ................................................ 7 SYLLABUS ............................................................................................................................. 7 DETAILED NOTES ............................................................................................................ 8 REFERENCES ..................................................................................................................... 68
LECTURE 2: ASSESSING AND TESTING FAUNA, FLORA, WATER, AIR, AND SOIL FOR CONTAMINATION/POLLUTION .......................... 75
2.1 ASSESSING WATER, AIR, AND SOIL RESOURCES ............................................. 76 SYLLABUS ........................................................................................................................... 76 DETAILED NOTES .......................................................................................................... 76 REFERENCES ..................................................................................................................... 99
2.2 POST-MORTEM PROTOCOLS FOR ASSESSING AND TESTING ANIMALS AND BIRDS ...................................................................................................................... 101 SYLLABUS ......................................................................................................................... 101 DETAILED NOTES ........................................................................................................ 102 REFERENCES ................................................................................................................... 141
2.3 MONITORING OF WOODY BIOMASS ................................................................ 142 SYLLABUS ......................................................................................................................... 142 DETAILED NOTES ........................................................................................................ 142 REFERENCES ................................................................................................................... 147
LECTURE 3: ENVIRONMENTAL DISASTERS AND DEGRADATION FROM OIL AND GAS DEVELOPMENT ................................................................ 148
SYLLABUS ......................................................................................................................... 148 DETAILED NOTES ........................................................................................................ 148 REFERENCES ................................................................................................................... 201
LECTURE 4: CLIMATE CHANGE, BIODIVERSITY, ENVIRONMENTAL HEALTH, AND SYNERGIES WITH OIL AND GAS SECTOR DEVELOPMENT ........................................................................................... 208
SYLLABUS ......................................................................................................................... 208 DETAILED NOTES ........................................................................................................ 208 REFERENCES ................................................................................................................... 230
LECTURE 5: ENVIRONMENTAL AND SOCIAL IMPACT ASSESSMENT ...... 232 SYLLABUS ......................................................................................................................... 232 DETAILED NOTES ........................................................................................................ 233 REFERENCES ................................................................................................................... 295
LECTURE 6: ENVIRONMENTAL MONITORING AND MODELING – WATER ......................................................................................................... 298
SYLLABUS ......................................................................................................................... 298 DETAILED NOTES ........................................................................................................ 298 REFERENCES ................................................................................................................... 325
USAID/UGANDA: ENVIRONMENTAL MANAGEMENT FOR THE OIL SECTOR – TRAINING COMPENDIUM: MODULE 4 I

LECTURE 7: ENVIRONMENTAL COST-BENEFIT AND CHANGE ANALYSIS ..................................................................................................... 327
SYLLABUS ......................................................................................................................... 327 DETAILED NOTES ........................................................................................................ 327 REFERENCES ................................................................................................................... 342
LECTURE 8: ENVIRONMENTAL AUDITING ..................................................... 344 SYLLABUS ......................................................................................................................... 344 DETAILED NOTES ........................................................................................................ 344 REFERENCES ................................................................................................................... 356
USAID/UGANDA: ENVIRONMENTAL MANAGEMENT FOR THE OIL SECTOR – TRAINING COMPENDIUM: MODULE 4 II

ACRONYMS AND ABBREVIATIONS
APESCAB Associação dos Pescadores de Cabinda
AMC Audit management committee
AR Assessment report
ARV Albertine Rift Valley
AST Above-ground storage tanks
BCR Ratio of discounted benefits to discounted costs
BOD Biochemical oxygen demand
BTEX Benzene, toluene, ethylbenzene and xylene
CABGOC Cabinda Gulf Oil Company
CBA Cost-benefit analysis
CO2 Carbon dioxide
COD Chemical oxygen demand
CSR Corporate social responsibility
CST Care Strike Team
DCF Discounted cash flow
DNAPL Dense non-aqueous phase liquids
DO Dissolved oxygen
DPR Department of Petroleum Resources
DWRM Directorate of Water Resources Management
E&P Exploration and Production
EA Environmental auditing
EGASPIN Environmental Guidelines and Standards for the Petroleum Industries in Nigeria
EIA Environmental impact assessment
EPA Environmental Protection Agency
EPI Environment pillar institutions
ESIA Environmental and social impact assessment
ESIS Environmental and social impact statement
ESMMP Environmental and social management and monitoring plan
ESMS Environmental and social management system
ETBE Ethyl tertiary butyl ether
EU European Union
USAID/UGANDA: ENVIRONMENTAL MANAGEMENT FOR THE OIL SECTOR – TRAINING COMPENDIUM: MODULE 4 III

FCCU Fluid catalytic cracking unit
GCC Gulf Cooperation Council
GDP Gross domestic product
GHG Greenhouse gases
GIS Geographic information systems
GPS Global positioning system
H2S Hydrogen sulfide
HF Hydroflouric
ICS Incident command system
IDP Internally displaced population
IEG Independent evaluation group
IPCC Intergovernmental Panel on Climate Change
IPIECA International Petroleum Industry Environmental Conservation Association
IRR Internal rate of return
IUCN International Union for Conservation of Nature
LG Local governments
LGA Local government area
LNAPL Light dense non aqueous phase liquids
LNG Liquefied natural gas
LPG Liquefied petroleum gas
LRCC Long residue catalytic cracking
MTBE Methyl tert-butyl ether
NAPL Non aqueous phase liquids
NEA National Environment Act
NEMA National Environment Management Authority
NNPC Nigerian National Petroleum Corporation
NGO Nongovernmental organization
NOAA National Oceanic and Atmospheric Administration
NOSDRA National Oil Spill Detection and Response Agency
NOx Nitrogen oxides
NPV Net present value
NWF National Wildlife Federation
OGJ Oil and Gas Journal
OPEC Organization of Petroleum Exporting Countries
USAID/UGANDA: ENVIRONMENTAL MANAGEMENT FOR THE OIL SECTOR – TRAINING COMPENDIUM: MODULE 4 IV

PAH Polycyclic aromatic hydrocarbons
PB Project brief
PCBs Poly-chlorinated biphenyls
PEPD Petroleum Exploration and Production Department
PPE Personal protective equipment
PST Processing strike team
RCCU Residue catalytic cracking
SOx Sulfur oxides
SRC Shell Refining Company
TAME T-amylmethyl ether
ToR Terms of References
UC Unified command/Incident command
UME Unusual mortality event
UNEP United Nations Environment Program
UNFCCC United Nations Framework Convention on Climate Change
UWA Uganda Wildlife Authority
VOC Volatile organic compounds
WDCS Whale and Dolphin Conservation Society
USAID/UGANDA: ENVIRONMENTAL MANAGEMENT FOR THE OIL SECTOR – TRAINING COMPENDIUM: MODULE 4 V

INTRODUCTION AND CONTEXT
1. BACKGROUND
A wide variety of ecosystems are found in Uganda’s Albertine Graben, including montane forests, tropical moist forests, savannah woodlands, grasslands, wetlands, and open water (lakes and rivers). The rich and varied flora of the region provides habitat for a wide diversity of species (NEMA, 2012a) and the region is a global biodiversity hotspot, forming part of the Afromontane Archipelago that stretches from the Horn of Africa to the tip of southern Africa.
The Albertine Graben also is the site of oil reserves, and over 3.5 billion barrels of stock-tank oil initially in place (STOIIP) had been established.1 As a result, the oil and gas sector is expected to grow with considerable economic benefits for Uganda. Nevertheless, development of oil and gas in the Albertine Graben will inevitably come with negative impacts on the environment and society. Accordingly, the Government of Uganda’s (GOU) National Oil and Gas Policy (2008) states as a matter of principle, the need to balance human development, the environment, and biodiversity in pursuit of sustainable development.
Various studies (NEMA, 2012b; Ministry of Energy and Mineral Development, 2013; Lahm, 2014) have shown that government agencies and civil society organizations (CSOs) currently have inadequate capacity to monitor and manage the impacts of oil and gas development on the environment and biodiversity. Assessment of the training needs of staff of the local governments (LGs) in the Albertine Rift and Environment Pillar Institutions (EPIs) established that the staff were generally well trained in their respective professions, but that they lacked the requisite knowledge and skills to monitor and deal with the impacts of oil and gas activities on the environment and biodiversity. They were not trained for this during formal training at college, since oil and gas is a recent development in Uganda (USAID, 2014). The USAID Capacity Assessment Assistance Report for the Environmental Management of the Oil Sector Activity (2014a) noted that:
Staff (both field and HQ) of the EPIs already possess a solid skill and knowledge base on which to build. As such, the Activity can focus its efforts on ‘topping up’ staff skills with specific knowledge about oil and gas. It was also re-confirmed that the largest needs (biggest capacity gaps) are at the field level …
While a few field staff reported that they had attended awareness-raising sessions on potential environmental and social impacts of oil and gas, no one reported that they had received any technical training of any kind, to date. There is a strong, pent-up demand for such training, and ample opportunity for the Activity to enhance knowledge and skills at these levels where ‘the rubber meets the road’ …
Much of the required training and capacity building involve the practical training in the collection and testing of physical samples—whether water, soil, air, tissue, or blood—or other field data, such as species counts, transects, tree girth, or other parameters.
In pursuit of these capacity gaps, Tetra Tech is implementing the USAID/Uganda Environmental Management for the Oil Sector Activity (hereinafter called the "Activity”) to support Ugandan private, civil society, and public sector institutions at national and sub-national levels to improve their capacity to manage, monitor, and mitigate the impacts of oil and gas development activities on the environment and biodiversity in general, and in the Albertine Graben in particular. As a direct contribution to the knowledge and skills development, the Activity has developed a set of training and resource materials that are crafted to meet the different training needs identified by the Activity. All the training and resource materials have been organized into a compendium, which serves as a
1 STOIIP is the volume of oil in a reservoir prior to production.
USAID/UGANDA: ENVIRONMENTAL MANAGEMENT FOR THE OIL SECTOR – TRAINING COMPENDIUM: MODULE 4 1

one-stop resource center for the development of training, outreach and awareness materials related to oil and gas development and its impacts on the environment and biodiversity in Uganda.
2. PROCESS OF DEVELOPING THE COMPENDIUM
As has been mentioned above, all Activity-sponsored studies on national and local capacity to monitor and manage oil and gas impacts on the environment and biodiversity showed that EPI and LG staff are inadequately equipped with the knowledge, skills, and necessary logistical support to fulfill their mandates (see USAID, 2014a and USAID, 2014b). To this end, the Activity designed short training courses for EPI and LG practitioners who need additional knowledge and technical skills to collect, analyze, and interpret field data for the planning and implementation needed to monitor oil and gas activities effectively, especially in areas where their institutions hold management mandates.
Development of the short courses began with training needs assessment of the EPIs and the LGs. Alongside the training needs studies for EPIs and LGs, the EMOS team undertook similar assessments for the training institutions (universities and technical training institutions in the environment and natural resources sector), in recognition of these institutions’ significant contributions to formal capacity building.
The assessments led to identification of 99 “lectures” on specific topics.2 These lectures were then grouped into nine modules. As the process of identifying the lectures generated more content than had been anticipated for the short courses, it was decided to compile this compendium as a source book for development of targeted curricula.
The Activity then invited a number of experts in a variety of fields to develop outlines for each of the lectures and then re-configured the content. The experts also prepared detailed teaching notes and put together teaching materials for each lecture.
3. AIMS AND SCOPE OF THE COMPENDIUM
This compendium is not designed as a textbook on the impacts of oil and gas on the environment and biodiversity. It is designed along the lines of a curriculum, but not for a specific course. It is designed as a resource document for trainers, instructors, professors, and others who provide knowledge and skills at the interface between the oil and gas development activities and the environment and biodiversity. It provides a generic syllabus and detailed notes that will guide those who will be teaching the subject matter, either through formal curricula or informal training programs. It draws from a wide range of resources that are available in online libraries.
4. WHO IS THE COMPENDIUM FOR?
a) Target Audiences
This compendium was developed with EPI and LG mid-level managers in mind. The content and design are aimed at this cadre of in-service personnel who will apply what they learn immediately upon returning to their duty stations. But this compendium is also a reference document from which curricula targeting other groups will draw content and obtain guidance about teaching methods and materials. The mid-level managers link the senior managers and the frontline staff. Therefore, it is easy to customize training curricula and programs from the compendium to suit the needs of either category of target groups. On the other hand, mid-level managers are the primary products of universities and therefore, the compendium will provide useful material for the design of curricula for undergraduate and post-graduate training.
2 In this compendium, the term “lecture” refers to the units within the module. Each topic within a lecture can be taught in a number of one-hour teaching periods employing a variety of teaching methods, including the lecture method.
USAID/UGANDA: ENVIRONMENTAL MANAGEMENT FOR THE OIL SECTOR – TRAINING COMPENDIUM: MODULE 4 2

During preparation of materials for this compendium, the target audiences for whom curricula and training programs could be developed are shown below:
TABLE 1: CHARACTERISTICS OF TARGET GROUPS
TARGET GROUP CHARACTERISTICS Senior Managers (e.g., directors, national level heads of departments, chief administrative officers, and resident district commissioners)
This group makes policy and strategic management decisions for their organizations. They give directions to staff who implement their decisions, and influence budget allocation and release of actual funds. Many will have progressed along their career paths, and their main motivations will be to make better-informed decisions rather than obtaining additional academic qualifications.
Mid-level Managers (e.g., inventory, land management specialists, project coordinators, NFA Range Managers, Regional Water Officers, Senior Game Wardens, Heads of LG Departments, NFA Sector Managers; UWA Game Wardens, etc.)
These are normally subject matter specialists, some at the sub-national level. Members of this target group translate policy/strategic decisions into actionable plans and design tools, supervise data collection, interpret data generated from the field, and advise senior management. Most hold university degrees, in many cases at the master’s level. Their job descriptions usually require them to train others. Many will be on their way up the career ladder, therefore their motivations will be to enhance their upward mobility in their career or to widen the pool of potential jobs. They will be interested in formal academic qualifications to boost their curricula vitae.
Frontline Staff Operating at Management Unit/Community Level (e.g., NFA Forest Supervisors, UWA Game Rangers, Assistant Fisheries Officers, LG Assistant Forest Officers, Assistant Agriculture Officers, and Sub-County Technical Staff)
This group implements actions at the management unit level, collect data and transmit it to headquarters, are in day-to-day contact with communities, and carry out law enforcement. Some members of this group hold university degrees, diplomas, and/or certificates in the areas of their specialization. Job descriptions usually require them to sensitize and train local communities. The younger members of this target group will be interested in a formal academic qualifications to boost their curricula vitae. In addition, on-the-job practical training will be very useful to standardize data collection methods and improve data quality.
Staff in Universities and Technical Training Institutions – Relevant Colleges at MAK, MUST, KYU, NFC, UWTI, and UPIK
This group educates people entering service in the oil and gas, environment and natural resources sectors at national and sub-national levels. Most of the trainees will have advanced degrees in their areas of specialization. They will be expected to undergo the same training before they can be called upon to train others.
b) Curriculum Developers
USAID/UGANDA: ENVIRONMENTAL MANAGEMENT FOR THE OIL SECTOR – TRAINING COMPENDIUM: MODULE 4 3

The compendium will be useful to trainers, educators, and other curriculum developers at all levels of learning. The modules, topics, and sub-topics are resource materials that can be of value in the areas of applied biodiversity or the oil and gas value chain. The trainer may adopt and/or adapt the outlines in the syllabus according to the target group and emerging knowledge and technology. However, in the process of adopting and adapting, the teacher should be guided primarily by the learning needs of the target group (translated into learning outcomes) rather than the trainer’s convenience in delivering the material.
c) Public Education and Awareness Programs
The compendium will also be useful to those seeking content to develop public information and awareness programming in the relevant field.
d) Researchers, Policy Makers, and Planners
The compendium will be a useful source of technical information to those engaged in research, policy development, and planning about the interface between oil and gas and the environment and biodiversity.
5. ARRANGEMENT OF THE COMPENDIUM
The compendium is structured along a modular approach. There are nine different modules as outlined in Table 2 below. The modules are published as separate standalone documents, but together they make the whole part of the compendium.
USAID/UGANDA: ENVIRONMENTAL MANAGEMENT FOR THE OIL SECTOR – TRAINING COMPENDIUM: MODULE 4 4

TABLE 2: LIST OF MODULES IN THE COMPENDIUM
MODULE TITLE
Module 1 Phases in the Oil and Gas Value Chain Development
Module 2 Applied Biodiversity
Module 3 Ecotoxicology
Module 4 Impacts of Oil and Gas Operations on the Environment and Biodiversity
Module 5 Socioeconomic and Health Impacts
Module 6 Monitoring Oil and Gas Threats and Impacts
Module 7 Environmental Data Acquisition and Use
Module 8 Policy, Legal, and Institutional Framework for Oil and Gas Development
Module 9 Mitigation of the Impacts of the Oil and Gas Industry
Each module consists of a number of lectures. Where the scope of a lecture is quite broad, it has been broken down into “sub-lectures.” Each lecture/sub-lecture made up of two parts:
i) A syllabus that outlines the teaching objectives, learning outcomes, and an outline of lecture content (topic, suggested teaching/learning methods and materials, and estimated time to cover each topic; and
ii) Detailed notes, in most cases arranged following the topics outlined under the relevant syllabus.
Some lectures end with guidance on prolonged field work aimed at building the skills of trainees in accordance with the stated learning outcomes.
6. HOW TO USE THE COMPENDIUM
Each module can be taught as a short course or training program. However, it will often be necessary to bring in topics from other volumes to strengthen the teaching/learning process in a particular volume. For example, a short course based on Module 9 (Mitigation of the Impacts of the Oil and Gas Industry) may need to include some topics from Module 4 (Environmental Impacts Threats and, Risks), or even from all the other volumes.
Because the notes have been compiled by different experts, the style in which they were originally prepared has not altered much during the editing process. Some were prepared as PowerPoint presentations and have been converted into narrative for inclusion in the compendium. Others present high levels of detail, while others are presented in outline format and will require the trainer to do much more reading during lesson preparation.
The lecture syllabus and the detailed notes are interlinked. The user will normally start with the syllabus to determine the outline of a particular course or program. The individual trainer will then proceed to use the detailed teaching notes as a starting point for lesson preparation for a given lecture. References have been given to stimulate further reading.
7. A NOTE ON SOURCES
The Compendium draws on a wide range of sources, most of which are available online for educational use. All efforts have been made to credit the authors of materials that are either directly quoted, or paraphrased as content in the compendium. Quotations are used to identify material within sections that has been directly quoted, and the source is identified parenthetically at the end of the quotation. However, in the case where whole subsections have been drawn wholesale from sources, the source is identified at the top of the subsection and quotations are not
USAID/UGANDA: ENVIRONMENTAL MANAGEMENT FOR THE OIL SECTOR – TRAINING COMPENDIUM: MODULE 4 5

used. Finally, where sources have been paraphrased, the source of the idea is acknowledge parenthetically.
A list of references is included at the end of each section within the compendium to enable compendium users to easily access and credit sources in the development and use of their own materials.
8. THE CONTENT OF THIS MODULE
The lectures for Module 4 (Impacts of Oil and Gas Operations on the Environment and Biodiversity) are outlined in Table 3 below.
TABLE 3: LIST OF LECTURES UNDER MODULE 4
LECTURE TITLE
Introduction Introduction
1 Impacts of oil and gas development on biodiversity and the environment
2 Assessing and testing fauna, flora, water, air, and soil for contamination/pollution
3 Environmental disasters and degradation from oil and gas development
4 Climate change, biodiversity, environmental health, and synergies with oil and gas sector development
5 Environmental and social impact assessment
6 Environmental monitoring and modeling – water
7 Environmental cost-benefit and change analysis
8 Environmental auditing
REFERENCES
Government of Uganda (GOU). (2008). National Oil and Gas Policy.
Lahm, S.A. (2014). Head-Start Institutional Mapping for Gap Identification Final Report, March 2014.
Ministry of Energy and Mineral Development. (2013). Strategic Environmental Assessment (SEA) of Oil and Gas Activities in the Albertine Graben, Uganda. Draft SEA Report, September 2013.
National Environment Management Authority (NEMA). (2012a). The Environmental Monitoring Plan for the Albertine Graben 2012–2017.
NEMA. (2012b). A Capacity Needs Assessment for the Environmental Pillar Institutions in Uganda – Final Report, September 2012.
Petroleum Exploration and Production Department. (2014). Progress of Petroleum Exploration and Development in Uganda. Paper presented in the Dialogue with Civil Society Organizations: “Enhancing Environment Compliance in Uganda’s Oil and Gas Sector, July 2014.
USAID. (2014a). Consultancy for Capacity Assessment Assistance Report. Report for the USAID Environmental Management for the Oil Sector Activity.
USAID. (2014b). Training Needs Assessment for District and Sub-County Level Officials Final Report. Report for the USAID Environmental Management for the Oil Sector Activity.
USAID/UGANDA: ENVIRONMENTAL MANAGEMENT FOR THE OIL SECTOR – TRAINING COMPENDIUM: MODULE 4 6

LECTURE 1: IMPACTS OF OIL AND GAS DEVELOPMENT ON BIODIVERSITY AND THE ENVIRONMENT
SYLLABUS
Teaching Aims
(i) To introduce the students to the potential impacts of oil and gas activities on biodiversity and the environment.
(ii) To underscore the nature of cumulative impacts of oil and gas activities on the environment and biodiversity.
Learning Outcomes
The trainee will be able to:
(i) Classify environmental receptors.
(ii) Analyze the impacts associated with the petroleum industry on individual environmental receptors throughout the entire value chain.
(iii) Discuss the cumulative nature of environmental and socioeconomic impacts within the petroleum industry.
(iv) Participate in the management of cumulative environmental and socioeconomic impacts of oil and gas activities on biodiversity, society, and the environment at large.
Outline of Lecture Content
Topic and Subtopic Suggested Approach, Methods and equipment
1. Overview of the environment Focus groups followed by class discussions; conclude with a schematic representation of the receptors
2. Upstream exploration and development activities as source of impacts
Group discussions based on real-life case studies and video clips
3. Field development activities and the associated impacts
Group discussions based on real-life case studies and video clips
4. Downstream activities and their impacts on environment
Group discussions based on real-life case studies and video clips
5. Oil, gas marketing, and transportation Mini lecture combined with Q&A to build on trainees’ knowledge and experiences
6. Sources of contamination and pollution from oil and gas development: project life-cycle impacts
7. Impacts of petroleum refining
8. Risks and impacts of petroleum refining on environment and biodiversity
9. Cumulative environmental impacts Real-life case studies on the indirect and cumulative impacts and impact interactions; group discussions
10. Field practicals Discussions with trainees and practitioners in the field
USAID/UGANDA: ENVIRONMENTAL MANAGEMENT FOR THE OIL SECTOR – TRAINING COMPENDIUM: MODULE 4 7

DETAILED NOTES
Overview of the Environment
Introduction
Source: Rosenberg, 2017
“The area near the surface of the Earth can be divided up into four interconnected geo-spheres: atmosphere, hydrosphere, lithosphere, and biosphere. Scientists classify life and material on or near the surface of the Earth to be in any of these four spheres.”
• Atmosphere Source: Rosenberg, 2017
“The atmosphere is the body of air that surrounds our planet. Most of our atmosphere is located close to the Earth's surface where it is most dense. The air of our planet is 79 percent nitrogen and just under 21 percent oxygen; the small amount remaining is composed of carbon dioxide and other gases.”
• Hydrosphere Source: Rosenberg, 2017
“The hydrosphere is composed of all of the water on or near the Earth. This includes the oceans, rivers, lakes, and even the moisture in the air. Ninety-seven percent of the Earth's water is in the oceans. The remaining three percent is fresh water; three-quarters of the fresh water is solid and exists in ice sheets.”
• Lithosphere Source: Rosenberg, 2017
“The lithosphere is the solid, rocky crust covering entire planet. This crust is inorganic and is composed of minerals. It covers the entire surface of the Earth from the top of Mount Everest to the bottom of the Mariana Trench.”
• Biosphere Source: Rosenberg, 2017
“The biosphere is composed of all living organisms. Plants, animals, and one-celled organisms are all part of the biosphere. Most of the planet's life is found from 3 meters below the ground to 30 meters above the ground and in the top 200 meters of the oceans and seas.”
“All four spheres can be and often are present in a single location. For example, a piece of soil will have mineral material from the lithosphere. There will be elements of the hydrosphere present as moisture within the soil, the biosphere as insects and plants, and even the atmosphere as pockets of air between soil pieces.”
Important Components/Segments of the Environment
Source: Mondal, 2016
“The environment comprises various segments such as atmosphere, hydrosphere, lithosphere, and biosphere. Before explaining the chemistry taking place in these segments one by one, a brief outline about their importance will be discussed.”
Atmosphere
Source: Mondal, 2016
“These points highlight the vital role played by atmosphere in the survival of life on this planet:
• The atmosphere is the protective blanket of gases surrounding the Earth. It protects the Earth from the hostile environment of outer space.
USAID/UGANDA: ENVIRONMENTAL MANAGEMENT FOR THE OIL SECTOR – TRAINING COMPENDIUM: MODULE 4 8

• The atmosphere absorbs infrared radiations emitted by the sun and reemitted from the Earth and controls the temperature of the Earth.
• The atmosphere allows transmission of significant radiation only in the regions of 300–2500 nm (near UV, Visible, and near infrared) and 0.01–40 meters (radio waves), i.e., it filters tissue-damaging UV radiation below 300 nm.
• The atmosphere acts as a source for C02 for plant photosynthesis and 02 for respiration • The atmosphere acts as a source for nitrogen for nitrogen-fixing bacteria and ammonia-
producing plants. • The atmosphere transports water from ocean to land.”
Hydrosphere
Source: Mondal, 2016
“The hydrosphere is a collective term given to all forms of water. It includes many water resources such as oceans, seas, rivers, lakes, streams, reservoirs, glaciers, and groundwaters.” The distribution of Earth’s water supply is shown in Figure 1.1.
FIGURE 1.1: FRESHWATER RESOURCES
Source: University of Nebraska Lincoln, 2017
“Only 1 percent of the total water supply is available as fresh water in the form of rivers, lakes, streams and groundwater for human consumption and other uses.” The extent of the use of available fresh water for various purposes is shown in Figure 1.2.
FIGURE 1.2: MAJOR USES OF FRESHWATER, CURRENT AND PROJECTED
Source: Johnson, 2012
USAID/UGANDA: ENVIRONMENTAL MANAGEMENT FOR THE OIL SECTOR – TRAINING COMPENDIUM: MODULE 4 9

Lithosphere
Source: Mondal, 2016
The Earth is divided in multiple layers as shown in Figure 1.3
FIGURE 1.3: LAYERS OF EARTH
Source: Kious and Tilling, 1996
“The lithosphere comprises upper mantle and the crust.”
“The crust is the Earth’s outer layer that is accessible to humans. The crust comprises rocks and soil of which the latter is the important part of lithosphere.”
Biosphere
Source: Mondal, 2016
“The biosphere refers to the realm of living organisms and their interactions with the environment (atmosphere, hydrosphere, and lithosphere).”
• “The biosphere is very large and complex and is divided into smaller units called ecosystems. • Plants, animals, and microorganisms that live in a definite zone along with physical factors such as
soil, water, and air constitute an ecosystem. • Within each ecosystem, there are dynamic interrelationships between living forms and their
physical environment. The natural cycles operate in a balanced manner providing a continuous circulation of essential constituents necessary for life, and this stabilizes and sustains the life processes on Earth.
• These interrelationships manifest as natural cycles (hydrologic cycle, oxygen cycle, nitrogen cycle, phosphorous cycle, and sulfur cycle).The shape of the Earth is close to that of an oblate spheroid, a sphere flattened along the axis from pole to pole.”
Definition, and Components of Environment
Meaning and Definition
Source: Mondal, 2016
“Environment refers to those conditions that surround living beings from all sides and affect their lives. It comprises atmosphere, hydrosphere, lithosphere, and biosphere. Its chief components are soil, water, air, organisms, and solar energy.”
USAID/UGANDA: ENVIRONMENTAL MANAGEMENT FOR THE OIL SECTOR – TRAINING COMPENDIUM: MODULE 4 10

Components of Environment
Source: Mondal, 2016
“Environment mainly comprises atmosphere, hydrosphere, lithosphere and biosphere. Environment can be roughly divided into two types such as (i) micro environment and (ii) macro environment. It can also be divided into two other types such as (iii) physical environment and (iv) biotic environment.”
1. “Microenvironment refers to the immediate local surrounding of the organism. 2. Macro environment refers to all the physical and biotic conditions that surround the organism
externally. 3. Physical environment refers to all abiotic factors or conditions like temperature, light, rainfall,
soil, minerals, etc. It comprises atmosphere, lithosphere, and hydrosphere. 4. Biotic environment includes all biotic factors or living forms like plants, animals, and
microorganisms.”
Classification of Environment Receptors
The UK Environmental Agency defines a receptor as: ‘‘Something that can be adversely impacted by a contaminant including people, property, wildlife and water bodies.’’
These include (Nathanail and Bardos, 2005):
• Residents • Property e.g., buildings on-site and off-site • Water sources (ground and surface), e.g., consideration of the proximity of the nearby river is
made • Property crops and other plants within the gardens • Ecological systems
Upstream Exploration and Development Activities as Sources of Impacts
“The exploitation of oil and gas reserves has never been without some ecological side effects. Oil spills have damaged land. Accidents, fires, and incidents of air and water pollution have all been recorded at various times and places. In recent times, the social impact of operations, especially in remote communities, has also attracted attention. The oil and gas industry has worked for a long time to meet the challenge of providing environmental protection. Much has already been achieved, but the industry recognizes that even more can be accomplished” (Qurban et al., No date)
Oil and gas exploration and production operations have the potential to cause many impacts on the environment. These impacts depend upon the stage of the process, the size and the complexity of the project, the nature and sensitivity of the surrounding environment, and the effectiveness of planning. Some impacts of these activities can be carefully avoided, minimized, or mitigated because the industry has been proactive in developing management systems (E&P forum/UNEP 1997).
Oil and gas exploration
Only in a few cases will hydrocarbon migrate to the Earth’s surface as seeps, hence a need to research surface and subsurface terrains to identify potential oil and gas reservoirs. The search for evidence and clues normally involves extensive science and engineering disciplines/expertise in geography (soil, vegetation, topography/physical features).
Seismic operations
Source: UNEP, 1997
“Seismic operations offshore will lead to disturbance to marine organisms. This may require avoidance of sensitive areas. In addition, exploration and onshore site preparation will create serious environmental impacts on land, including vegetation clearing, possible erosion, and changes in surface
USAID/UGANDA: ENVIRONMENTAL MANAGEMENT FOR THE OIL SECTOR – TRAINING COMPENDIUM: MODULE 4 11

hydrology, emissions, vibration, noise from Earth-moving equipment, and disturbance of local population and wildlife.”
“To locate potential traps onshore, seismic surveys are carried out. Dynamites or vibrator trucks send shockwaves underneath the Earth’s surface. Changes in rock density will bounce back the sound waves to the surface. Recording the length of time it takes the shock waves to arrive back at the surface using geophones allows geologists to build a picture of the internal structure of the rocks beneath.”
FIGURE 1.4: SEISMIC SURVEYS
Source: UNEP, 1997
“Seismic activities will in most cases generate terrestrial impacts. Potential impacts to soil arise from three basic sources: physical disturbance resulting from construction, contamination resulting from spillage and leakage or solid waste disposal, and indirect impact resulting from opening access and social change. Potential effects that may arise from poor design and construction include soil erosion due to soil structure, slope, or rainfall. Once vegetation is removed and soil is exposed, alterations to soil conditions may result in widespread secondary impacts such as change in surface hydrology and drainage patterns, increased siltation, and habitat damage, thereby reducing the capacity of the environment to support vegetation and wildlife.”
Drilling (Wildcats, Appraisal, Development)
USAID/UGANDA: ENVIRONMENTAL MANAGEMENT FOR THE OIL SECTOR – TRAINING COMPENDIUM: MODULE 4 12

Source: UNEP, 1997
FIGURE 1.5: DRILLING
Source: UNEP, 1997
“Drilling exploration (“Wildcat”) to discover hydrocarbon generates noise because of continuous use of vibration truck explosions, dynamite, air guns, marine vessels. These activities usually result in disturbance to human/wildlife/marine life. Mammals and crocodiles are sensitive to vibrations, movement of heavy equipment, and the drilling activity. The noise resulting from petroleum activities interferes with breeding patterns of wildlife. The clearing of vegetation during various infrastructure developments reduces the habitats for wildlife, destroys the homes of some animals, and may block the corridors for animals. The oil spills and pollution from other chemicals used during petroleum developments may contaminate water sources for wildlife and may affect the water dwelling animals, e.g., birds and fish species.”
Field Development Activities and the Associated Impacts
Source: UNEP, 1997
“During petroleum development activities, there is drilling of appraisal/production wells, installation of production facilities and gathering systems.”
“Wetland reclamation for infrastructure development leads to alteration of natural, healthy wetlands. Access through wetlands in oil and gas development is likely to be through construction of roads, which usually disrupt the flow of water, causing changes in wetland acreage, vegetation change, biodiversity loss, changes in species composition, and general fragmentation of the ecosystem. The impact of infrastructure development is diverse and will affect the habitat, causing loss of ecosystem functions, mainly water and biodiversity components that need to be monitored using some of the sampling designs discussed above.”
“The discovery of oil in a high biodiversity area, which is a prime tourism area in Uganda, poses a challenge regarding how to balance the two activities. Oil activities may negatively affect tourism through land-taking that reduces habitat for animals, increase in infrastructure, increase in pollution, and visual intrusion. To assess the impacts of oil activities on tourism, the number of tourists, and tourism revenue, quality must be monitored.”
USAID/UGANDA: ENVIRONMENTAL MANAGEMENT FOR THE OIL SECTOR – TRAINING COMPENDIUM: MODULE 4 13

Oil and gas production and the associated impacts on environment
Source: UNEP, 1997
1. “Primary recovery: A natural process whereby oil is forced out of the reservoir by the expansion of gases within the oil. Also, water might displace the oil. This yields roughly 5 percent to 15 percent of the oil beneath the Earth.
2. Secondary recovery (EOR): Reservoir pressure is increased through water flooding or gas injection, which forces oil to the surface. This allows between 30 percent to 50 percent of the oil to be recovered.
3. Tertiary recovery (EOR): This introduces fluids that reduce viscosity, thereby improving flow. This only recovers another 5 percent to 15 percent of the oil.”
Downstream Activities and Their Impacts on the Environment
Offshore impacts
Source: UNEP, 1997
FIGURE 1.6: ATMOSPHERIC IMPACTS
Source: NOAA, 2017
“Atmospheric issues are attracting increasing interest from industry and government authorities worldwide. This has prompted the oil and gas exploration and production industry to focus on procedures and technologies to minimize emissions. To examine the potential impacts arising from exploration and production operations, it is important to understand the source and nature of the emission and their relative contribution to atmospheric impacts, both local and those related to global issues such as stratospheric ozone depletion and climate change. The primary sources of atmospheric emission from oil and gas operation arise from:”
• “Flaring, venting and purging gases • Combustion processes such as diesel engines and gas turbines • Fugitive gases from loading operations and losses from process equipment • Airborne particulates from soil disturbance during construction and from vehicle traffic”
“The principal emission gases include carbon dioxide, carbon monoxide, methane, volatile organic carbons, and nitrogen oxides.”
“Due to intensive activity, increased levels of emissions occur in the immediate vicinity of the operations. Emissions from productions should be viewed in the context of total emissions from all sources, and mostly these fall below 1 percent of regional and global level. Flaring of produce gas is the most significant source of air emissions, particularly where there is no infrastructure or market available for the gas; however, where viable, gas is processed and distributed as an important
USAID/UGANDA: ENVIRONMENTAL MANAGEMENT FOR THE OIL SECTOR – TRAINING COMPENDIUM: MODULE 4 14

commodity. The need for flaring will be greatly reduced. Flaring, venting, and combustion are the primary sources of carbon dioxide emissions from production operations, but other gases should also be considered.”
Refining crude, desalting refining, reforming blending
Source: UNEP, 1997
• “Distillation to separate by boiling point ranges • Water washing to remove impurities • Conversion reactions to alter molecular structures • Mixing to obtain maximum commercial value • Petroleum delivered from oilfield”
Ecosystem impacts
Source: Olajire, 2014
“Plant and animal communities may also be directly affected by changes in their environment through various operational activities, i.e., spillage of fuel, oil, gas, chemicals and hazardous materials, oil and gas well blowout, explosions, fires, unplanned plant upset and shutdown events, and natural disasters and their implications on operations (for example, flood, earthquake, lightning, war, and sabotage).”
Aquatic impacts
Source: Olajire, 2014
“Principal aqueous waste streams resulting from exploration and production operations include produced water, drilling fluids, cuttings, and well treatment chemicals, wash and drainage water, sewage, sanitary and domestic wastes, spillages and leakages, and cooling water.”
“Long-time operations and occupation of site and permanent production facilities lead to long-term potential for increased demand on local infrastructure, water supply, sewage, and solid waste disposal. Increased discharges and emissions from production processes will usually generate high volumes of waste water, sewage and sanitary wastes, drainage issues, noise, vibration, and light, which might have high effects on biota and wildlife; cause disturbance to biodiversity; affect water, soil, and air quality; and further increase risks of soil and water contamination from spillage and leakage.”
Development and production will greatly affect sensitive species and commercially important species, cause resource conflict. Additionally chronic effects of discharges on benthic and pelagic biota may be caused by waste, drill cuttings, mud discharges, water production, drainage, sewage sanitary and kitchen wastes spillages, and leakage emission from power and process plants. Lights and emissions from gas flaring may impact on air quality, noise and light.
Oil, Gas Marketing, and Transportation
Oil and gas can be transported by multiple transportation routes, including road, rail, and pipelines. Pipelines are linear infrastructures which facilitate the movement of liquids or gases (e.g., hydrocarbon) between an origin and a destination. It is a valuable mode to overcome space (friction of distance) for oil and gas resources.
USAID/UGANDA: ENVIRONMENTAL MANAGEMENT FOR THE OIL SECTOR – TRAINING COMPENDIUM: MODULE 4 15

FIGURE 1.7: IMPACTS CREATED BY TRANSPORTATION OF PETROLEUM PRODUCTS
ROAD IMPACTS PIPELINE IMPACT
STORAGE EXPLOSIONS AQUATIC IMPACTS
Source: Top left: Chiasson, 2013; Top right: The Canadian Press, 2012; Bottom Left: Ng, 2015; Bottom right: Coast Guard, 2010
FIGURE 1.8: OIL SPILL ON LAND
Source: Yoo Eun, 2010 (from http://blog.naver.com/wed1204/130026573208)
An oil spill on land may include crude oil or refined products such as gasoline, diesel fuel, etc. Spills take months or even years to clean up.
• Oil is also released into the environment from natural geologic seeps on the sea floor.
USAID/UGANDA: ENVIRONMENTAL MANAGEMENT FOR THE OIL SECTOR – TRAINING COMPENDIUM: MODULE 4 16

• Cleanup methods: − Bioremediation: use of microorganisms to break down or remove oil − Controlled burning: can reduce the oil in water but can cause air pollution − Dispersants: act as detergents, clustering around oil globules and allowing them to be carried
away in the water − Dredging: for oils dispersed with detergents − Skimming: Requires calm waters
• Exxon Valdez accident occurred in Alaska on March 24, 1989. The vessel spilled about 40 million liters of crude oil into the sea, and the oil eventually covered 28,000,000 sq. km of ocean.
FIGURE 1.9: BLOWOUT IN THE SEA
Source: Keim, 2011
Impact to aquatic life
The sensitivity of aquatic resources to petroleum development is associated with high frequency noise from petroleum development activities, oil spills, and pollution from hydrocarbon compounds and chemicals from mud cuttings. These can cause drastic change in aquatic environment, leading to migration or death of aquatic species, some of which could be endemic, rare, or endangered.”(NEMA, 2012).
Impact to water quality
“Surface water sources are very vulnerable to contamination and are therefore categorized as highly sensitive. Sensitivity reduces with distance from the respective sources. For surface water, the sensitivity of each of these sources is highest at the source and reduces away from the source. For groundwater, the shallower the groundwater first strike point, the more susceptible it is to contamination” (NEMA, 2012).
Physical chemical issues
There is significant potential for soil, air, and water contamination from oil and gas development activities. Potential soil pollutants include solvents and metal finishing solutions that may be discharged into the soil if not managed properly and could cause significant soil chemical changes. Shoreline and shallow waters are especially vulnerable to contamination from oil and gas production activities. Spills and contamination in these areas can have a great impact on fish and wildlife who use these areas for breeding and access sites to water. (NEMA, 2012).
Waste disposal
“The oil and gas developments are likely to yield waste, which could be disposed of into wetlands as they occupy lowlands. There are already precedents of waste dumping into wetlands globally, which demonstrates the need to take precaution through this monitoring plan for environmental changes.
USAID/UGANDA: ENVIRONMENTAL MANAGEMENT FOR THE OIL SECTOR – TRAINING COMPENDIUM: MODULE 4 17

Waste disposal has potential negative impacts on wetlands as it leads to changes in water quality, size, and biodiversity. Waste that affects wetlands is liquid or solid in form.”(NEMA, 2012).
Plants
“Plants are affected through clearing of the development site, oil spills, and pollution. For plant species, the issues to consider are how fast an area would recover from disturbance if cleared and which vegetation types are likely to be most affected if an oil spill occurred. Species have a limited distribution on range. For species that take long to recover and those with a limited distribution on range, the areas where they occur will need to be avoided or used with extreme care” (NEMA, 2012).
Wetlands
Source: NEMA, 2012
“Wetland sensitivity is related to difficulty of restoration if affected by oil spills. This would affect breeding areas and habitats of birds, fish, amphibians, and some mammals. It also affects the groundwater recharge. Papyrus and swamp forest wetlands are the most sensitive features.”
“Liquid waste pollutes water in the wetland negatively affecting aquatic life. The pollutants such as heavy metals bio-accumulate in aquatic life and are transferred through the food chain to impact the primary and secondary consumers whose health is affected.”
“Solid waste dumping takes up space by in-filling, and this shrinks the wetland size, reduces the habitat, and leads to biodiversity loss. Therefore, acreage of wetland cover must be monitored. In addition, dumping solid waste converts the wetland from aquatic to terrestrial ecosystem, affecting its hydrology. The effects are manifested as poor water quality, habitat loss, biodiversity loss, and interference with vertical and horizontal movement of water in the ecosystem. Reduction in acreage of wetlands may lead to flooding because of disrupting wetland functioning such as flood control. Acreage change can be monitored using high resolution satellite images that are processed to produce maps and other related information.”
Water abstraction
Source: NEMA, 2012
“The water regime in a wetland ecosystem is important as it is the mainstay of a wetland. Once the water regime is significantly changed, it affects the bio-physical and chemical characteristics of the wetland, which ultimately affects its ecological integrity and ability to provide habitat to important wetland species. Oil and gas development will require substantial water and some of this will be abstracted from wetlands. The wetlands in the area are likely to be alternative water sources in oil and gas development, especially in the settlements that are planned to be established. Although the extent of future development is not known, it is likely that development will increase over time in this area, placing potential stressors on water use in wetlands. If water abstraction is unregulated and performed in excess, the available water for wetlands will decrease, which will negatively affect ecosystem functioning. The water levels/volume of water in wetlands must be assessed and monitored both on the surface and underground.”
Physical Presence
Source: NEMA, 2012
“Physical presence of oil and gas developments can affect wetland, as there will be need to clear an area for placement of infrastructure. There is likely that some infrastructure due to oil and gas developments cannot be placed in higher grounds and low-lying areas are options. The common example is the infrastructure for wastewater treatment due to subsidiary developments resulting from presence of oil and gas industry. These may be growth centers for the settlements of workers or otherwise. The physical presence will affect the wetland ecosystem by either draining or in-filling,
USAID/UGANDA: ENVIRONMENTAL MANAGEMENT FOR THE OIL SECTOR – TRAINING COMPENDIUM: MODULE 4 18

which interferes with the wetland ecosystem. Physical presence would lead to changes in wetland acreage, vegetation cover, habitat loss, biodiversity loss, and water levels.”
Noise/Vibration
Source: NEMA, 2012
“Noise/vibration impacts due to oil and gas development activities are likely to disrupt fragile ecosystem fauna. The fauna that are sensitive to noise are likely to migrate such as birds and mammals. Such fauna which are likely to be disrupted by noise and vibration due to drilling activities or otherwise need to be regularly monitored through population counts.”
Sources of Contamination and Pollution from Oil and Gas Development: Project Life-Cycle Impacts
Overview
Environmental impacts of petroleum production arise primarily from the improper disposal of large volumes of saline water produced with oil and gas, hydrocarbon and produced water releases caused by equipment failures, vandalism, flooding, and accidents (Kharaka and Otton, 2003).
These discussions highlight the various waste generated at the different stages of the oil and gas development project and their impacts.
Social and human impacts
Impacts include:
• Changes to land use • Increased transportation access • Land ownership issues • Local population increases • Uneven distribution of wealth • Availability of goods and services • Development versus conservation conflicts, etc.
Atmospheric impacts
Impacts include:
• Emissions from direct flaring • Venting and purging • Emissions from combustion • Smell • Fugitive gases • Particulates and dust from on-site emissions or off-site waste disposals
Aquatic Impacts
These may arise from:
• Produced water discharges • Drilling fluids • Cuttings and well treatment chemicals • Drainage and wash water • Sewerage, sanitary, and domestic waste • Spills and leaks • Cooling water • Obstruction of water
USAID/UGANDA: ENVIRONMENTAL MANAGEMENT FOR THE OIL SECTOR – TRAINING COMPENDIUM: MODULE 4 19

Terrestrial Impacts
Terrestrial impacts are related to:
• Physical disturbances to land and terrain • Footprint from land required for facilities • Soil erosion • Contamination from spillage or leakages • Waste disposal
Ecosystem Impacts
Ecosystem impacts are due to the atmospheric, aquatic, and terrestrial impacts, and ecological impacts such as:
• Noise: loud and continuous • Illumination/constant lighting • Habitat fragmentation and disturbances • Dwindling wildlife food supplies • Effects on breeding areas and migration routes • Food chains (predator-prey relationships) • Removal of vegetation resulting in soil erosion and siltation of water bodies affecting ecological
integrity, nutrient balance, microbial activity, and the entire ecosystem health
Characteristics of the impacts
All the above impacts are interrelated; therefore, all of the impacts may:
• Be direct or indirect • Have a cumulative or synergistic effect • Occur due to accidental or emergency operations • Have a positive or negative impact
Impacts can occur for the duration of the project, lasting from a few days to the duration of the project or even possibly beyond the project. The impacts discussed herein are potential impacts with the possibility of having a significant effect.
Impacts can be avoided, mitigated, or eliminated but they all require effective management. Proper management and monitoring can reduce the likelihood, and significance of the impacts.
FIGURE 1.10: LIFE CYCLE OF AN OIL AND GAS FIELD
USAID/UGANDA: ENVIRONMENTAL MANAGEMENT FOR THE OIL SECTOR – TRAINING COMPENDIUM: MODULE 4 20

Source: Canadian Association of Petroleum Producers, No date
Exploration activities and their effects
Infrastructure and camps
Camps
These are required for staff housing and material and equipment storage. The size and complexity of the camp depends on the project duration and anticipated future operations.
Impacts
The campsites require good infrastructure to facilitate accessibility, material, and equipment deliveries. Additional roads and airstrips may be required. This necessitates resolving any land ownerships issues.
The camp size depends on the size of operations but often requires taking of land to permit a footprint of over 1,000 square meters.
Prior to establishing the site, vegetation will be cleared and the land will be leveled. This may increase soil erosion and surface hydrology.
Boreholes must be drilled to extract potable water. This will draw water from aquifers accessed by neighboring communities and may affect the area hydrology.
Camp operations may work on 12- or 24-hour shift. The constant noise and light will potentially affect nearby villages and wildlife.
Camp dwellers may intermingle with nearby community members for recreation and social-economic activities or participate in other sporting activities such as hunting.
There will be waste and discharges from the camp activities.
Surveys
Exploration activities involve:
• Desk studies and field analysis • Soil surveys • Seep analysis • Aerial photography
Choice of survey methodologies:
• Gravimetric • Magnetic • Seismic
During seismic surveys, high intensity, low frequency sounds are directed through the Earth's crust and are reflected at the geological boundaries defining different strata.
Effect of surveys
Impact of survey operations differs depending on the extent of and stage of exploration. Magnetic and gravimetric surveys may be performed by plane, truck, or ship, and often have relatively little impact other than the noise from the chosen transportation method.
When terrain is inaccessible by truck, planes may be used and the resultant impact is mainly noise disturbances.
Seismic surveys are varied and often present significant impacts.
USAID/UGANDA: ENVIRONMENTAL MANAGEMENT FOR THE OIL SECTOR – TRAINING COMPENDIUM: MODULE 4 21

Effects of Onshore Seismic Surveys
The duration of seismic surveys ranges from a few weeks to several months. 3D surveys require complex parallel explosive lines and associated listening lines and may have a significant impact.
Access lines must allow vehicles for drill units to bury the dynamite in shock holes or for vibro vehicles to reposition themselves throughout the survey. Therefore, deforestation and or clearing of vegetation is done to create these accesses. Related impacts include soil erosion and silting of water bodies, effect to surface hydrology, habitat destruction, and fragmentation, etc.
Access may allow encroachment on areas that were not previously inaccessible, thus promoting unsustainable resource utilization. Wildlife may infiltrate survey boundaries and be harmed, or the noise and vibrations from detonations may affect them. Wastes from various cables, equipment, tools, and undetonated explosives may be left in the exploration zone.
Impacts of survey summary:
• Access and line cutting • Land-take and exclusion • Noise and vibration • Common wastes include domestic waste, sewage, explosive wastes, lines, cables, vehicles
(including shipping), and maintenance wastes
Effects of Offshore Seismic Operations
Table 1.1 below presents a summary of likely effects of offshore seismic operations.
Besides these effects, wetland vegetation in shallow water may be crushed/cleared, destroying breeding grounds and or habitats for fish and other aquatic organisms.
Note: Marine animals such as whales and dolphins and terrestrial animals such as elephants are sensitive to noise and vibrations and alien noise and vibrations from seismic surveys may have behavioral effects.
A summary of noise sources and activities associated with oil and gas exploration and production is presented in the table below:
TABLE 1.1: NOISE SOURCES AND ACTIVITIES ASSOCIATED WITH OIL AND GAS EXPLORATION
Source: WDCS report
USAID/UGANDA: ENVIRONMENTAL MANAGEMENT FOR THE OIL SECTOR – TRAINING COMPENDIUM: MODULE 4 22

Effects of Drilling
The impact of drilling operations ranges from:
• Site selection and preparation • Access and equipment to • Emissions, discharges and additives
Drilling activities may also have a direct or indirect impact.
Direct impacts:
• Access road required • Extent of site clearance required • Noise • Vibration • Dust • Emissions and discharges • Air pollution • Water abstraction • Lighting
Indirect impacts:
• Population influx • Increased resource extraction • Increased likelihood of future use • Construction materials (source and sink) • Soil erosion • Disturbed hydrology
Access to the drill site may be by road, ship, or plane. Delivery of the drill rig requires building a new road or upgrading existing roads. This results into clearance of vegetation, excavations, earth movement, etc.
These changes may contribute to hydrology changes and soil erosion. Soil erosion results into nutrient loss and loss of microbial organisms affecting plant life, which is the foundation of any ecosystem. In addition, erosion results into silting of water bodies, which destroys breeding grounds for aquatic organisms and reduces the quality and quantity of water.
Construction machinery causes noise, vibrations, and excessive dust disturbing the livelihoods of local communities and wildlife.
New access also encourages population influx/migrations and settlements beyond the carrying capacity of the natural resources and increased waste generation.
They also provide access to previously protected zone increasing encroachment and habitat destruction.
Although new access improves transportation, it may also increase unsustainable resource utilization as local communities now find it easier to over exploit resources to supply new markets outside (e.g., for fishing communities previously extracting less fish due to market constraints, a new road enables fishing trucks to reach the sites, thus encouraging over fishing and leading to fish stock decrease)
Site Preparation/Setup
Although drilling sites are determined by geological makeup, the choice of site location (e.g., in the Albertine Graben, determines the significance of the impact). For instance, the Murchison Falls National Park is an International Union for Conservation of Nature (IUCN) Category II site, (i.e., a site to be managed only for ecosystem protection and recreation). It is one of the top tourist
USAID/UGANDA: ENVIRONMENTAL MANAGEMENT FOR THE OIL SECTOR – TRAINING COMPENDIUM: MODULE 4 23

destination sites in Uganda. Ngasa 1 and 2 sites are wetland areas, increasing the potential for spillages. Therefore, inadequate site preparations may have the following consequences:
• Contribute to soil erosion and surface hydrology • Mud and waste pits can easily cause contamination if not well constructed • Spillages on-site may cause soil contamination and depending on the layout may leak through the
ground contaminating the soil and water sources • Emissions and discharges from the drilling process • Water obstruction to facilitate activities, which may be reduce reserves for communities • Pipes for extracting water from the lake may cause siltation and destroy breeding ground. • Ecosystems and biodiversity sensitivities/disturbances
Drilling: Rig Operations
Drilling operations require a host of supplies and raw materials and also produces various emissions, discharges, and wastes. Drilling operations require a supply of water for mud circulation and to cool equipment. Water is extracted from underground aquifers from the sea or lake.
Land required for the rig site is usually 4,000–15,000 m2, depending on the geology, terrain, and required drilling depth.
Emissions are generated from generators used on-site to power the drill rig and other equipment. Flaring of hydrocarbons is also done for a period to test the flow of oil and release any gases.
Muds are typically reused, but on disposal, they are discharged or allowed to evaporate or any other excess water is disposed in waste water pits. Liquid wastes contain many contaminants that originate from:
• Reservoirs (e.g., heavy metals) • Chemicals or additives used in the mud (e.g., barite) • Substances such as pipe dope and drill pipe connectors, which contain heavy metals
Evaporated wastewater leaves behind sludge contaminated with heavy metals, which concentrate as the wastewater volume is reduced.
Cooling water discharged to surfaces may be at temperatures higher than the ambient water temperatures.
Rock cuttings produced by the penetration of the drilling bit in the formation also require disposal as well as any other waste generated on the site.
Rain and wash water may pick up contamination from any spills on-site prior to runoff or discharge.
Muds and Cuttings
A typical well of 3000 m uses up to 300-600 tons of mud and generates between 1000-15000 tons of cuttings. These are brought up suspended in the mud as cutting fines.
Larger cuttings are separated off at the shale shaker, and the suspended particles settle out in the reserve mud pits next to the rig. When the mud pit fills, the muds are siphoned off from the surface of the pit, combined with additives, and then reused.
When suspended cuttings fill the pit, a new pit is dug and the process continues until drilling is completed. Once each pit is full, any remaining liquid in the pit is evaporated off.
After dewatering, the pit is covered.
Where there is a high water table, the pits are lined to avoid contamination of water. Here, the cutting cannot be buried in-situ since the liner is in place.
USAID/UGANDA: ENVIRONMENTAL MANAGEMENT FOR THE OIL SECTOR – TRAINING COMPENDIUM: MODULE 4 24

The cuttings are treated and spread over low value land (also known as land farming/land spreading). This has the potential to upset the pH balance of the soils due to the high salt content of the cuttings.
Contamination of aquifers can occur if the water table is high.
Note: Tears in the liner may cause leakage and subsequent soil and water contamination.
Drilling: Additives
“Drilling muds can be divided into three broad categories based on the base fluid used, namely oil-based muds, synthetic-based muds, and water-based muds. Oil-based muds and synthetic-based muds are jointly referred to as organic phase fluids (OPF)” (Thatcher et al., 1999).
Oil-based muds are more toxic than water-based muds and are not usually discharged into the environment.
Water-based mud, although less toxic, requires a much higher dilution factor and requires more quantities of water.
Fresh water must be used too, at least in the top section of the haul, to avoid contamination of any shallow aquifer water.
The likelihood and potential for harm/toxicity due to additives depends on the concentrations and volumes used.
Note that some additives in the mud may not be indicated on the material data sheets though the general toxicity may be indicated.
In water-based mud, primary impact may be due to the highly saline nature of the muds requiring disposal.
If the mud is allowed to contact soil, it will accumulate instead of biodegrade, causing salt scars of burned vegetation resulting into high concentrations of soluble salts.
Composition of Muds
Typically, muds are composed of:
• Base fluid, which may be oil, synthetic or water liquid • Weighting agents
− Barite − Viscosifiers
• Hydratable clays: bentonite, • De-flocculation substances: lignite, phosphates • Lost circulation materials such as crushed nut shells, shredded vegetable fibers, mica flakes,
sawdust • pH control • Caustic, sodium hydroxide • Lubricants and detergents: diesel, mineral/vegetable oils, glass or plastic beads, graphite, esters,
or glycerols • Corrosion inhibitors • Biocides • Formation damage control • Potassium chloride
Well Testing
When the drill bit reaches areas with hydrocarbons, well pressure causes them to flow up the well bore.
USAID/UGANDA: ENVIRONMENTAL MANAGEMENT FOR THE OIL SECTOR – TRAINING COMPENDIUM: MODULE 4 25

Flaring is controlled flow of oil or gas, which is ignited for safety reasons and to test the well.
Well test allows for the flow of hydrocarbons for a predetermined period to determine potential well flow rate and reservoir pressure.
The primary emission from combusted hydrocarbons is carbon dioxide. Hydrocarbons not fully combusted cause oil droplets to descend, and soot is dispersed both underneath the flare burner and is carried on the wind.
Flaring is also very noisy due to the high pressure under which hydrocarbons are released from the well.
Testing may require continuous burning both day and night for many days.
Summary of Waste from Drilling Operations
“The primary waste from exploratory drilling operations includes drilling muds and cuttings, cementing wastes, well completion, walkover and stimulation fluids, and production testing wastes. Other wastes include excess drilling chemicals and containers, construction materials (pallets, woods, etc.), process water, fuel storage containers, power unit and transport maintenance wastes, scrap metal and domestic and sewage wastes”(Wokocha, 2014).
Waste related to construction work includes excess construction materials, used lubricating oils, parts, solvents, sewage, and other domestic wastes.
Effects from Offshore Drilling
Studies indicate that effects from oil mud discharges are being detected in organisms 800 m from the point of discharge and 25 m for water-based muds.
In a lake environment with less dispersal effect, the effect of plumes of particulate matter can have a smothering effect on organisms that are dependent on a clean column of water.
Production Processes
The impact from the production phase will last for the duration of the project (i.e. 20 yrs. and beyond) and have:
• Longer time frames • Larger scale and volumes
The selection of the site has long-term implications considering that the operational site activities and processing facilities, camps, and infrastructure are more permanent. For instance:
• The access roads are more established. • Hydrologies are permanently changed and habitats and wildlife displaced. • The scale of consumption of supplies, water, and chemical use is extensive. • Emissions, discharges and wastes: air, liquid, solid, and sludge are prolonged, use of water
continues, and supply of raw materials ongoing. • The likelihood of emergencies and risks increases and so do accidents. Increased venting, spills
and leakages, and contamination. • Transportation for the product export is a pre-requisite, either by barge, pipeline, or tankers. • Socioeconomic conditions will change as more people are attracted to site for work.
Effects from Production
Air Emissions
All produced hydrocarbons have some form of associated gas that comes out of solution when hydrocarbons are brought to the surface and pressures are lowered. Depending on volume of gas produced, the gas can be sold, re-injected or flared, or vented (in that order). Venting is the direct
USAID/UGANDA: ENVIRONMENTAL MANAGEMENT FOR THE OIL SECTOR – TRAINING COMPENDIUM: MODULE 4 26

release of gas without ignition. This may be intentional to release pressure or as fugitive emissions (i.e., slow release of gas from leaking valves).
Produced gas is the significant source of air emissions from exploration and production (E&P). Principle gas include: carbon dioxide, carbon monoxide, methane, volatile organic compounds (VOCs), and nitrogen oxides.
Carbon dioxide from flared hydrocarbons, generators, and heaters are the primary emission.
Major air pollutants associated with the oil and gas production process include:
Source: EarthWorks, No date
1. “Benzene, Toluene, Ethylbenzene and Xylene (BTEX): BTEX compounds can be emitted during various oil and gas operations activities, including flaring, venting, engines, produced water storage tanks, and during the dehydration of natural gas.
2. Carbon Monoxide: Carbon monoxide is emitted during flaring and from the operation of various machinery at oil and gas development sites.
3. Dust: Dust is created whenever there is dirt-moving activity such as construction of well pads, and when there is vehicle traffic on unpaved roads.
4. Hydrogen Sulfide (H2S) may be released when gas is vented, when there is incomplete combustion of flared gas, or via fugitive emissions from equipment.
5. Methane: Natural gas is released during venting operations, or when leaks in equipment are used during oil and gas development. The primary component of natural gas is methane, which is odorless when it comes directly out of the gas well. Besides methane, natural gas typically contains other hydrocarbons such as ethane, propane, butane, and pentanes. Raw natural gas may also contain hazardous air pollutants such as benzene, toluene, ethylbenzene, xylenes and hexanes, hydrogen sulfide (H2S), and carbon dioxide. Other compounds in natural gas typically include water vapor, helium, and nitrogen. Fugitive emissions contain mainly methane.
6. Nitrogen Oxides: NOx are formed during the combustion of fossil fuels, which causes a chemical reaction between nitrogen (which occurs naturally in the atmosphere) and oxygen. During oil and gas production, NOx are formed during flaring operations, and when fuel is burned to provide power to machinery such as compressor engines and other heavy equipment. NOx, in turn, may react with VOCs to form ground-level ozone.
7. Ozone: Ozone itself is not released during oil and gas development. However, some of the main compounds that combine to form ozone (e.g., VOCs and nitrogen oxides) are released from oil and gas operations.
8. Particulate Matter: The most common sources of particulate matter from oil and gas operations are dust or soil entering the air during pad construction, traffic on access roads, and diesel exhaust from vehicles and engines used to power machinery at oil and gas facilities. Particulate matter can also be emitted during venting and flaring operations.
9. Sulfur Dioxide: Sulfur dioxide is formed when fossil fuels containing sulfur are burned. Many oil, natural gas, and coal formations contain traces of sulfur. SO2 may be emitted during flaring of natural gas, or when fossil fuels are burned to provide power to pumpjack or compressor engines or other equipment and vehicles at oil and gas sites. Sour gas processing plants also emit sulfur dioxide. Emissions from sulfur dioxides and hydrogen sulfides depend on the sulfur content of the hydrocarbon and diesel content of the fuels used.
10. VOCs are carbon-containing substances that readily evaporate into the air. They can combine with nitrogen oxides to form ground-level ozone. Examples of VOCs are benzene and toluene.
11. Note: The release of CO2 and methane contributes to the buildup of greenhouse gases in the atmosphere, worsening the global warming phenomena. The global warming potential of a kilogram of methane is estimated to be twenty-one times that of a kilogram of carbon dioxide when the effects are over 100 years.”
One of the challenges involved in addressing environmental aspects of flaring and venting is identifying how much gas is being released.
USAID/UGANDA: ENVIRONMENTAL MANAGEMENT FOR THE OIL SECTOR – TRAINING COMPENDIUM: MODULE 4 27

Case Study: Gas Flaring
Figure 1.14 depicts a coastal area in Nigeria where gas is produced; the red areas indicating flares. This satellite image from the US National Oceanographic and Atmospheric Administration for the World Bank Global survey in 2006 supported findings that oil-producing countries and companies produced up to 168 billion m3 of natural gas worldwide. This equivalent to 27 percent of the annual consumption of United States = $40 billion = 400 million tons of CO2 which is lost into the atmosphere.
FIGURE 1.14: GAS FLARING- NIGERIA
Source: U.S. Air Force Defense Meteorological Satellite Program, 2006
Why is flaring done?
• Culture: Historically seen as a waste product. With energy crisis and global climate change, this needs to change.
• Contracts: Countries have no use for it, so contractor is under no obligation to find a market for it.
• Markets: There are no market incentives for a contractor to find a market since contracts for E&P are often ill defined.
• Governance: No corporate social responsibility (CSR) for companies to maximize and make use of gas or find more sustainable ways to avoid flaring.
Discharges and Liquid Wastes
As oil production rates decrease, the proportion of formation water produced increases to levels up to 80 percent of total flow. In typical offshore oil production wells in UK, there are up to 2500-4000 m3 of produced water generated each day. The chemical composition of produced water (brine) is variable and dependent on the geology of the area.
This water is highly saline and contains salts of sodium, chloride, potassium, or magnesium. It also contains heavy metals such as lead, nickel, zinc, and arsenic (which in high concentrations is toxic).
Naturally occurring organic compounds are all found in produced water. These are BTEX compounds (benzene, toluene, ethylbenzene, and xylene). There may also be naturally occurring radioactive materials (e.g., radium 226/228).
Up to 65 percent of produced water from onshore production in pumped back into the well and used as reinjection water to maintain reservoir pressure.
Excessively saline brines requires reinjection in deep wells for disposal and to avoid contaminating shallow aquifers.
USAID/UGANDA: ENVIRONMENTAL MANAGEMENT FOR THE OIL SECTOR – TRAINING COMPENDIUM: MODULE 4 28

Previously, discharge into surface streams, storage in unlined impoundments or poorly maintained reinjection wells, or simply letting the water run on the ground was the norm. These practices left salt scars, dead vegetation, contaminated soils and waters, and plumes of saline brine that affect surface water supplies.
Even if stored in properly engineered pits, if volumes are not well calculated, excessive rains can cause overflow, causing contamination of landscapes.
TABLE 1.2: SUMMARY OF OILFIELD-PRODUCED WATER PARAMETERS IN WORLD
Source: Tibbetts et al., 1992
Organic content of produced water occurs as:
• Dispersed hydrocarbons (e.g., aliphatic hydrocarbons and polycyclic aromatic hydrocarbons, or PAHs)
• Dissolved hydrocarbons (e.g., BTEX) • Dissolved non-hydrocarbon organic compounds
Chemical Additives
As in drilling, chemicals and additives are used during down-hole or at the surface to assist hydrocarbons with flowing easily and to maintain equipment.
• Corrosion inhibitors lessen the effects of oxygen, hydrogen sulfide, carbon dioxide, seawater on the high-grade steel pipework.
• Oxygen is not only a problem during ingress from production pumping but also during water injection.
• Complex sodium and zinc salts are used. • Scale inhibitors prevent scaling, which blocks up production equipment. Scale is commonly
composed of calcium, strontium, and barium sulphates resulting from precipitation when temperature and pressure lowers. Examples of scale inhibitors are organic phosphate esters of amino-alcohols, phosphates, and acrylic acid polymers.
• Emulsion breakers accelerate the separation of oil and water by allowing oil to collect into larger droplets. Examples include: surfactants, alcohols, and fatty acids.
• Biocides reduce the quantities of bacteria responsible for producing hydrogen sulfide gas, which is highly corrosive in the system. They include aldehydes, quaternary ammonium salts, amine acetate salts, and sodium hypochlorite for seawater.
USAID/UGANDA: ENVIRONMENTAL MANAGEMENT FOR THE OIL SECTOR – TRAINING COMPENDIUM: MODULE 4 29

• Flocculants and coagulants are used to remove small particles following mechanic straining and to help in clogging and removal of suspended solids, e.g., polyamines, polyamine quaternary ammonium salts are used.
• Foam breakers prevent foaming of hydrocarbons in the system. They include silicones, polyglycol esters, and aluminum stearates.
• Paraffin treatments and de-waxers are used to prevent wax forming in production vessel. These include vinyl polymers, sulphonate salts, and mechanical pigs to remove blocked pipes.
• Hydrate inhibitors stop hydrates forming above zero degrees centigrade and blocking pipeline. Methanol and glycol may be used.
• Gas hydrators such as glycol are used to absorb water within a gas stream. They are usually recycled if produced water volumes are not enormous.
• Scavengers are added to remove hydrogen sulfide from produced gas or oxygen from injection water.
Note: Toxicity will depend on volumes and concentrations of fluids to be discharged. Considering the length of the production processes, chemical management is paramount.
Cementing Chemicals
Source: Thatcher et al., 1999
“After the first sections of a well have been drilled, casings are inserted in the well and cemented into place. Excess cement might be forced out of the annular spaces and deposited on the seabed.
“Cementing chemicals can be divided into nine categories:
• Accelerators: Chemicals that reduce the setting time of cement systems • Retarders: Chemicals that extend the setting time of a cement system • Extenders: Materials that lower the density of a cement system, and/or reduce the quantity of
cement per unit of volume of set product • Weighting agents: Materials which increase the density of a cement system • Dispersants: Chemicals that reduce the viscosity of a cement slurry • Fluid loss control agents: Materials which control the loss of the aqueous phase of a cement
system to the formation • Lost circulation control agents: Materials which control the loss of cement slurry to weak
or irregular formations • Anti-gas migration additives: Materials which reduce the cement slurry permeability to gas • Specialty additives: Miscellaneous additives, e.g., antifoam agents, free water control agents”
Completion, Workover, Squeeze, and Hydrotest Chemicals
Source: Thatcher et al., 1999
“Completion operations are carried out after drilling has been completed and before production begins and include cleaning of surface lines, equipment, well cleaning (i.e., cleaning of casing and pipes), displacement of the well fluids, etc.”
“The chemicals used in completion and workover fluids can be divided into 15 categories:
• Acids: Used to dissolve hardened materials and as a breaker in solvent fluids, kill pills and gelled fluids.
• Alkalis: Used together with surfactants and viscosifiers to control pH. • Well cleaning chemicals: Used in cleaning fluid to reduce the surface tension between water
and oil to dispose or dissolve the well fluids or flocculate dirt particles. • Dissolvers: Used to remove scale, asphaltene, or wax deposited in the well tubulars during
production operations. • Viscosifiers: Used in push pills and carrier fluids to increase viscosity of the fluid. • Breakers: Used to reduce the viscosity of a fluid to regain permeability.
USAID/UGANDA: ENVIRONMENTAL MANAGEMENT FOR THE OIL SECTOR – TRAINING COMPENDIUM: MODULE 4 30

• Clay control additives: Used in well fluids to prevent migration of clay particles, which can plug the pore channels in the reservoir.
• Scale inhibitors: Used in brines to inhibit scale formation. • Oxygen scavengers: Used to reduce or eliminate free oxygen in completion fluids as a
corrosion prevention • Fluid loss and diverting additives: Used in kill pills to stop production and also to distribute
treating fluids over a zone with varying permeability. • Defoamers/anti-foamers: Used to remove, or prevent the development of foam. • Clear brines/sea water: Used as base fluid for almost all water miscible completion fluids. • Corrosion inhibitors: Used to help prevent corrosion of the installation. • Surface active agents: Used in fluids to lower surface tension and interfacial tension to break
emulsions, establish favorable wetability characteristics for the reservoir rocks or casing, displace oil from oil contaminated particles and fines, etc.
• Biocides: Used to prevent bacterial growth in well fluids.”
Oil Spills and Leakages
Oil spills and leakages can happen during drilling, production, or transportation operations. An oil spill is a loss of containment indicating a loss of operational control.
Note: (This highlights a weakness in the operational management system)
It causes catastrophic threats to habitats, species, and people.
There is no clear correlation between size of spill and extent of damage. This depends on the oil type, character, and sensitivity of receiving environment, seasonality or migration or breeding cycle, etc.
Containment on land is easier than on water as terrestrial containment involves curtailing source of spill, insolation, cleanup, and proper disposal.
Spillages on water require the same measures but controlling the spread of oil and accessing locations where the oil meets the land pose logistical challenges to the operation.
Initial impacts range from minimal to extensive. Most oils start to biodegrade but may reach onshore before degrading. Transboundary implications may have a bigger impact (e.g., spills on Uganda’s Lake Albert may have impacts on shores in Congo or downstream the Albert Nile).
Note: Oil is a complex mixture of thousands of different compounds, composed of primarily carbon, hydrogen, sulfur, nitrogen, and oxygen. Hydrocarbons (carbon and hydrogen) are the predominant compounds in crude oil.
According to the International Petroleum Industry Environmental Conservation Association (IPIECA) (2000), the extent/degree of ecological damage due to an oil spillage is affected by these factors:
• “Oil type: Light oils cause severe localized effects whereas heavier oils are less toxic but can contaminate large areas due to their greater persistence and smothering effect.
• Oil loading: Thick oils on shores smother plants and animals and may form persistent asphalt pavements.
• Geography: greater damage may be in shallow waters and enclosed waters and sheltered shorelines because these areas have high biodiversity and longer natural cleaning timescales.
• Weather: Wind speed and water temperatures affect the evaporation and viscosity of oil and its dispersion and toxicity.
• Biology: Different species have different sensitivities to oil exposure (e.g., many algae are tolerant to oil, whereas wetlands and birds are highly sensitive). Wetlands have high biodiversity and trap oil in barrows and stems. Using detergents to remove oil in such areas may upset the ecosystem. There natural recovery is recommended yet it may take longer.
USAID/UGANDA: ENVIRONMENTAL MANAGEMENT FOR THE OIL SECTOR – TRAINING COMPENDIUM: MODULE 4 31

• Season: Sensitivity of plants and animals varies seasonally. For example if spill occurred during fish spawning months, then effects on fish stocks will affect communities that depend on fish. Contamination of local foods may occurs affect trade and health of communities (socioeconomic and health well-being).”
Fate and Transport of an Oil Spill
After oil is discharged to the environment, many physical, chemical, and biological processes known as weathering transform the discharged oil.
The oil weathering process occurs as shown in Figure 1.11.
FIGURE 1.11: OIL WEATHERING PROCESS
Source: Arctic Response Technology, 2014
• “Spreading and advection: When spilled, oil spreads out on the surface of the water. This increases the surface area of the oil, thus increasing the potential for exposure by all routes.
• Evaporation: Many components of oil evaporate. This creates a vapor that can lead to inhalation of toxic compounds as they pass from the water surface to the atmosphere.
• Dissolution: Some components of the oil will go into solution in the surrounding water. This increases the chance of exposure through direct contact, ingestion, or absorption for water column resources.
• Natural dispersion: Oil breaks up into droplets in the water beneath the slick and may float away. As a result, water column resources can be exposed through direct contact, ingestion, and absorption.
• Emulsification: Oil and water combine to form a mousse. Exposures can result from direct contact or ingestion.
• Photo-oxidation: Sunlight transforms some oil components into new by-products, which may be more toxic and water-soluble than the original components. Water surface and water column resources can be exposed to the by-products through inhalation, direct contact, absorption, and ingestion.
USAID/UGANDA: ENVIRONMENTAL MANAGEMENT FOR THE OIL SECTOR – TRAINING COMPENDIUM: MODULE 4 32

• Sedimentation and shoreline stranding: Oil washes ashore and also sinks after sticking to particles in the water. Exposure can occur through direct contact and ingestion of stranded or sunken oil.
• Biodegradation: Oil is slowly broken down by resident bacteria into H2O and CO2. Biodegradation is a slow process, with little effect on exposure” (Boyd et al., 2001).
IPIECA modeled a speculative spill scenario on Lake Tanganyika to represent how a spillage may be dispersed on any lake in East Africa. The model assumed a spillage of 30,000 tons of crude from a location indicated.”
FIGURE 1.12: OIL SPILL MODEL (L. TANGANYIKA)
Source: IPIECA, 1991
After 10 days, the spill had moved almost halfway across the lake in the direction of prevailing wind.
After 20 days, the spill had reached the shores.
This indicates how:
• Oil naturally spreads and concentrates toward lakeshore • Natural dispersion and dilution are limited • Numerous lakeside communities will be affected • Ancient lake: unique biological communities
Effects of an Oil Spill
Source: Boyd et al., 2001
“Different resources are at varying risk of exposure to untreated oil and chemically dispersed oil. These resources include:
• Surface-dwelling resources: This typically includes birds, marine mammals, and reptiles. These resources are at high risk of exposure to oil floating on the surface during a spill.
• Water column (pelagic) resources: This group includes fish and plankton. They are typically at lower risk of exposure to oil during a spill. Dispersion can temporarily increase the risk of exposure to these resources.
USAID/UGANDA: ENVIRONMENTAL MANAGEMENT FOR THE OIL SECTOR – TRAINING COMPENDIUM: MODULE 4 33

• Bottom-dwelling (benthic) resources: This includes all resources that live on, or in, the bottom. Typical examples are many species of crabs, bivalves, and plants. They are usually at lower risk of exposure during a crude oil spill and are most affected by sinking oil.
• Intertidal resources: These resources live in the areas that are exposed to air during low tides, but submerged during high tides. They also include many species of crabs, bivalves, and plants. If a spill reaches the shore, these resources are at high risk of exposure, as successive layers of oil can be put down by tides and winds.”
The diagram shows the ecological impact of an oil spill on marine/aquatic organism.
FIGURE 1.13: ECOLOGICAL IMPACT OF AN OIL SPILL ON MARINE/AQUATIC ORGANISMS
Source: Hyland and Schneider, 1979
Refining
The primary processes in refining are:
• Desalting • Distillation • Extraction • Waste management
The processes are energy intensive.
Air emissions resulting from processing of oil or heating include VOC (mainly aromatic hydrocarbons compounds), oxides of sulfur and nitrogen, particulates, and hydrogen sulfide from any sulfide recovery operations. Almost 78 percent by weight of all operation emissions are released to the air.
Liquid discharges include waste water from the desalting, cracking, distillation and reforming processes with high concentrations of ammonia and sulfuric acids.
Refineries also require a large amount of cooling water and thus require adequate water suppliers. About 24 percent of emissions by weight is released as waste water.
USAID/UGANDA: ENVIRONMENTAL MANAGEMENT FOR THE OIL SECTOR – TRAINING COMPENDIUM: MODULE 4 34

Solid wastes includes sludge from the desalter, tank cleanouts, and other parts of the process and spent catalysts.
Summary of Wastes from Production
In addition to the wastes generated from exploration, drilling, construction, and maintenance operations, the main wastes from development and production include:
• Discharged produced water • Flare and vent gas, • Production chemical • Walkover wastes (e.g., brines) • Tank or pit bottoms
Waste associated with maintenance activities include batteries, used lubricants, filters, hoses, tires, paints, solvents, contaminated soil, coolants and antifreeze chemicals, used parts, and scrap metals.
Water Abstraction
FIGURE 1.14: WATER ABSTRACTION
Source: Water and Energy Conservation Systems, 2011
During exploration, production, and refining phases, the operation facilities require access to fresh water. Depending on the stage and complexity of the projects, hundreds of gallons of water may be required each day.
This may be abstracted from nearby:
• Surface waters: rivers, streams, lakes, springs • Groundwater aquifers through wells
If surface water is used, this may affect the water availability for other users such as nearby communities (e.g., during drought or seasonal variations, the volume may be insufficient for the functioning of ecosystem services yet some species rely on water for breeding, washing, feeding, movement, etc.).
USAID/UGANDA: ENVIRONMENTAL MANAGEMENT FOR THE OIL SECTOR – TRAINING COMPENDIUM: MODULE 4 35

Even for underground sources, knowledge of recharge rates, quantities, etc., is required before obstruction.
During production, fracking may stimulate production by using produced water or surface water.
• Up to 50,000-350,000 gallons of fluids may be required. • It is pushed into the reservoir to increase pressure in hydrocarbon formation, causing fracturing.
This allows fissures to form allow hydrocarbons to flow.
Fracking can be repeatedly done over the life span of the project; however, if it is not well managed, it can cause contamination of groundwater as hydrocarbons can now flow where they were originally not intended to flow.
Effects from Decommissioning
At the end of the project lifespan, it is necessary to restore the site back to its original state. Unfortunately, negligent abandonment is often done as is a case with many countries where contractors simply leave.
If not cleaned up:
• Abandoned equipment may continue to be a source of contamination for decades, allowing hazards to persist in the environment for wildlife and other populations.
• Mud and wastewater pits and sludge they contain may overflow or overgrow with vegetation, causing contamination in the soil and water.
• Wildlife may continue to use sites to their detriment (e.g., birds and animals may use them as source of water).
• Campsite utilities such as defunct electrical goods/wastes may be left all over.
Waste from decommissioning activities may include construction materials, insulating materials, plant equipment, sludge, and contaminated soils.
Effects from Transportation
Road tankers: Once crude has been processed, it is transported to other users for further processing or usage. Common transportation methods are:
• Road tank • Ship tank • Pipeline
Road use intensity: The use of the roads could intensify as tankers carrying refined petroleum products to petrol stations use these roadways.
Route choice: Routes for tankers may be through densely populated areas.
Risk of spills and accidents: May cause spillages and other accidents, usually resulting into ignition and death.
Pipelines
Uganda’s anticipated pipeline will carry crude oil almost 1300 km to the coast. Installation of the pipeline is essentially a long, linear process requiring storage facilities and campsites. Construction and access may open up previously pristine areas to migrations and encroachment.
Potential issues related to pipeline development include:
• Land access and compensation • Spill, security, and safety issues. For example, attacks on pipelines, either to steal the oil or due
to riots and strikes or as terror attacks
USAID/UGANDA: ENVIRONMENTAL MANAGEMENT FOR THE OIL SECTOR – TRAINING COMPENDIUM: MODULE 4 36

TABLE 1.3: SUMMARY OF CONTAMINANTS, SOURCE, AND EFFECT
Type Effect Source BTEX
Benzene, Toluene, Ethylbezene and Xylenes
• Benzene is carcinogenic. Toluene may affect the central nervous and reproductive system. Ethylbezene and xylenes have respiratory and neurological effects.
• Venting of natural gas, pits, produced water and dehydration
CH4 Methane • Explosive and global warming effects (greenhouse gas).
• Venting of natural gas and dehydration
Diesel Fuel Complex Mixture of Hydrocarbons
• Both fuel and exhaust fumes contain carcinogenic substances like benzene and PAHs.
• Stimulation fluids, oil-based drilling muds, Engines and Heavy equipment
H2S Hydrogen Sulfide • Aggravates respiratory conditions, affects neurological systems, cardiovascular systems and central nervous system effects.
• Venting and flaring • Migration from
contaminated soils
NOx Nitrogen Oxides • React with VOCs to form ground-level ozone and smog, which trigger respiratory problems.
• React with other chemicals to form particulate pollution that damages lungs, causing respiratory illnesses, heart conditions and premature death.
• React with common organic chemicals to form toxics that cause biological mutations.
• Compressor engines, flaring and diesel and natural gas engine exhausts
PAHs Polcyclic Aromatic Hydrocarbons
• May be carcinogenic and cause reproductive effects in animals.
• Diesel exhaust, flaring and pits
Particulate Matter
Small Particles Suspended in Air
• Can be inhaled and cause health effects like respiratory ailments, aggravation of asthma and allergies, painful breathing, shortness of breath, chronic bronchitis, and premature death. May combine with other air pollutants to aggravate health problems. Some particulates, such as diesel exhaust, are carcinogenic.
• Diesel exhaust • Pits (dust from) • Venting and flaring
SO2 Sulfur Dioxide • Reacts with other chemicals to form particulate pollution, which can damage lungs and cause respiratory illness, heart conditions, and premature death.
• Diesel and • Natural gas engine • Exhaust • Flaring
VOCs Volatile Organic Compounds, include BTEX Formaldehyde and Others
• React with NOx to form ground-level ozone and smog, which can trigger respiratory problems. Can cause health problems such as cancer.
• Venting and flaring of natural gas
• Pits • Oily wastes • Diesel and natural
gas engine • Exhaust • Compressor
Metals E.g., Arsenic, Barium, Cadmium, Chromium, Lead, Mercury, Selenium, Zinc, etc.
• Different potential health effects for each metal. Possible toxic effects include skin problems, hair loss, kidney damage, HBP, increased cancers, neurological disorders.
• Drilling muds, stimulation fluid, pits, produced water, venting and flaring, diesel exhausts
Source: Oil and Gas Accountability Project, www.ogap.org, Environmental Health Perspectives
USAID/UGANDA: ENVIRONMENTAL MANAGEMENT FOR THE OIL SECTOR – TRAINING COMPENDIUM: MODULE 4 37

Contaminant Characteristics: Phases
Contaminants are present in the environment in these phases:
• Solid Phase: Contaminant, such as toxic minerals, are in mine tailings • Sorbed Phase: Contaminants are bonded to mineral surface (adsorbed) or captured within
solids or organic matter in soil (absorbed). This is typically reversible. In sorbed phase, contaminants are still available for transport.
• Gas, Vapor Phase: Contaminants are in gas or vapor form. • Aqueous Phase: Contaminants are dissolved in water or other liquid. • Non-Aqueous-Phase-Liquid: Contaminants are immiscible in water but can still dissolve
slowly. Contaminants such as light non aqueous phase liquids (LNAPL) or dense non aqueous phase liquids (DNAPL) may be: − Mobile continuous, or − Immobile discontinuous (residual).
Contaminant Characteristics: Properties
Different contaminants exhibit different properties:
• Solubility. Soluble contaminants end up in water held in the soil or in the underlying groundwater (by leaching through the soil);
• Volatility (evaporation): Volatile contaminants evaporate into the air, either from non-aqueous phase liquids (NAPL) mixtures or from solutions in water;
• Reactivity. Contaminants react with other substances (e.g., oxidation, precipitation, hydrolysis); • Recalcitrance. This refers to how quickly contaminant will degrade as result of chemical or
biological subsurface chemistry; • Tendency to sorb onto soils. This affects the rate of migration of a contaminant. In some
extreme cases, sorption can effectively immobilize a contaminant; • Viscosity; and • Density
FIGURE 1.15: TRANSPORT OF A NON-AQUEOUS PHASE LIQUID IN SURFACE
Source: Warren T. Piver, 1992
USAID/UGANDA: ENVIRONMENTAL MANAGEMENT FOR THE OIL SECTOR – TRAINING COMPENDIUM: MODULE 4 38

Pathways and Exposure Routes
A pathway is described as the route or means by which a receptor could be exposed to a contaminant.
Pathways may be identified based on scientific knowledge rather than direct observation.
Soluble pollutants such as sulphates, free cyanide, benzene, and toluene may dissolve in water and can percolate through the soil and affect surface or groundwater. The likely pathways for oil and gas pollutants include:
• Outdoor and indoor inhalation of soil and dust • Direct ingestion of soil and soil derived dust • Vapor and dust inhalation indoors and outdoors • Direct ingestion of soil attached to vegetables • Consumption of home-grown vegetables • Dermal contact through outdoor exposure • Saturated zones • Vadose/unsaturated zones
Fate and Effects: Receptors
The UK Environmental Agency defines a receptor as, ‘‘something that can be adversely impacted by a contaminant including people, property, wildlife and water bodies.’’
These include: (Nathanail and Bardos, 2005)
• Residents • Property (e.g., buildings on-site and off-site) • Water sources, ground and surface (e.g., consideration of the proximity of the nearby river is
made) • Property crops and other plants within the gardens • Ecological systems
Conclusion: Fate of Contaminants
“Once contaminants are in soils, water, or air, their migration and fate depends on many factors. Some organic (carbon-based) contaminants can undergo chemical changes or degrade into products that may be more or less toxic than the original compound” (Shayler et al., 2009).
“Toxic effects are a function of both the duration of exposure to the chemical and the concentration of the chemical” (Shayler et al., 2009).
Exposure refers to the amount of contact an organism has with a chemical, physical, or biological agent (API, 1999).
Toxic effects can be produced by acute (short-term) or chronic (long-term) exposure.
For example, in the aquatic environment, the concentration of a chemical, and its transport, transformation, and fate, are controlled by:
• Physical and chemical properties of the compound (such as a compound’s solubility or vapor pressure)
• Physical, chemical, and biological properties of the ecosystem (such as salinity, temperature, or water depth)
• Sources and rate of input of the chemical into the environment
With soil contamination, there are two key criteria for ascertaining whether a specific waste constitutes a hazard in a disposal environment:
USAID/UGANDA: ENVIRONMENTAL MANAGEMENT FOR THE OIL SECTOR – TRAINING COMPENDIUM: MODULE 4 39

• Solubility of toxic constituents in the disposal environment • Mobility of solubilized toxics in the disposal environment
This depends on soil, climatic, and hydrologic characteristics of each disposal site.
“This is because the characteristics of the soil affect the fate of contaminants. Site management and land use (such as gardening practices) can affect soil characteristics. Important soil characteristics that may affect the behavior of contaminants include:
• Soil mineralogy and clay content (soil texture) • pH (acidity) of the soil • Amount of organic matter in the soil • Moisture levels • Temperature; and • Presence of other chemicals” (Shayler et al, 2009)
Oil and gas derivatives play a critical role worldwide as sources of energy and feedstock in various industries. As highlighted in this module, the oil and gas industry has a high potential of polluting and or contaminating the environmental through its various activities. All the stages of the oil and gas development process ranging from exploration to refining generate varying quantities and types of wastes, such as produced water, air emissions, mud and rock cuttings, domestic waste, chemicals etc., that might contaminate and pollute the air, water, or soil (land), thus affecting biota. An integrated approach to management of this resource is paramount to promote sustainable development.
Impacts of Petroleum Refining
Key Processes in Petroleum Refining
General Introduction
Refining is the manufacture of petroleum products from crude oil. Refining involves two major branches:
• The physical separation of the raw material into a range of petroleum fractions • The subsequent chemical conversion of the fractions to alter the product yield and improve
product quality
Physical separation processes include distillation and blending. Chemical processes include cracking, coking, reforming, alkylation, polymerization, isomerization, and hydrogen treatment.
There are many processes available to the refiner and the final processes chosen is determined by the products required (both quantity and quality) and the crude oil available. Over time, changes to either product requirements or available crude oil can cause changes to the refining processes necessary in the refinery.
Refinery Products
Shell Refining Company (SRC) produces the following petroleum products:
• Liquefied Petroleum Gas (LPG) • Propylene • Gasoline, or Petrol • Jet Fuel, or Avtur • Gasoil, or Diesel • Sulfur
USAID/UGANDA: ENVIRONMENTAL MANAGEMENT FOR THE OIL SECTOR – TRAINING COMPENDIUM: MODULE 4 40

SRC also produces several petroleum components that can either be sold or processed in the refinery.
Crude Oil
Source: IRTC, 2016
“Petroleum products are made from crude oil. Many types of crude oil come from many different sources around the world. Selection of the right crude oil is a key part of the refining process. The decision as to what crude oil or combination of crude oil to process depends on many factors, including quality, availability, volume, and price.”
“Shipping costs (or freight) are another important element in crude oil selection and are determined by the size of the cargo and the distance from the supplier to the refinery.”
Distillation
Source: IRTC, 2016
“The first stage of crude processing is distillation, or fractionation, and occurs in a column known as a Distillation Column. In this process, the crude oil, which is a mixture of many types of hydrocarbons, is boiled and recondensed to separate the crude oil into components based on ranges of boiling points. Components which are heavier are harder to boil and will collect in the lower part of the column. Lighter components are easier to boil and will be collected in the upper part of the column.”
“Very heavy components, which cannot boil will leave from the bottom of the column, in a stream known as residue, while light components will leave from the top of the column. This stream is Liquefied Petroleum Gas, or LPG.”
Hydroprocessing
Source: IRTC, 2016
“To meet environmental specifications or to assist in further processing, some components then undergo a process known as hydroprocessing. The objective of this process is to remove sulfur from the component stream. This process will consume hydrogen to assist in the sulfur removal. The sulfur removed from this process is converted into pure liquid sulfur and is sold to local industry for the production or acid and fertilizer.”
Reforming/Platforming
Source: IRTC, 2016
“This process converts a low value component called 'naphtha' into a product known as reformate or platformate. This reformate has a much higher octane number and is used for gasoline blending. This is achieved using a catalyst that contains platinum.”
Catalytic Cracking
Source: IRTC, 2016
“This conversion process involves the breaking up of large hydrocarbon molecules into smaller molecules using a combination of heat and catalytic action. The unit at SRC is a Long Residue Catalytic Cracking (LRCC) unit and takes a heavy hydrocarbon stream called Long Residue and converts it into several more valuable components and products, including LPG, propylene, and some fuel oil components. However, the main product from the SRC LRCC is a gasoline blending component known as Cat Cracked Gasoline.”
“A by-product of this process is Coke (or carbon), which is burned to generate steam and electricity.”
USAID/UGANDA: ENVIRONMENTAL MANAGEMENT FOR THE OIL SECTOR – TRAINING COMPENDIUM: MODULE 4 41

Secondary Treating
Source: IRTC, 2016
“The refinery also has several smaller, so-called secondary processes. These are mainly involved with further polishing of components and products to remove sulfur and other impurities.”
Blending
Source: IRTC, 2016
“The final stage of the refining process is called blending. This is a crucial step where the hydrocarbon components manufactured in the refinery are mixed to make the final products sold by the refinery. The final blend recipes will depend on the quality of the available components and on the customer's requirements, called specifications. All blended products are tested before they are sold to ensure that they meet the customer's specifications.”
Transport
Source: Barclays Bank PLC, 2015
“Distributing crude and refined hydrocarbons requires a significant infrastructure that typically requires transboundary shipments; pipeline, boat, or tanker may transport oil and gas. Pipelines transport natural fuels such as oil and gas and can be located above or below the ground or seabed. They can range in size up to two meters in diameter and range from several to hundreds of kilometers in length over a path known as the pipeline right-of-way. Overland and near-shore pipelines are usually buried while offshore pipelines are generally located on the seabed. Pipelines may transport unrefined oil or gas from a wellhead to transfer or processing facilities, or refined oil and gas to an end user (e.g., a petrochemical or power plant). A pipeline is not confined to the pipe itself rather include ancillary facilities such as receiving dispatch, pump and control stations; access or maintenance roads.”
“Booster stations (required at regular intervals for long distances to cope with internal friction changes in elevation along the line) and compression stations (to maintain pipeline pressure at regular intervals).”
“Liquefied Natural Gas (LNG) is transported by specially designed vessels and stored in specially designed refrigerated tanks.”
“There are many international standards for the design of oil and gas shipping vessels following the well-documented Exxon Valdez oil spills and others from oil tankers at sea.”
Retail and Distribution
Source: Barclays Bank PLC, 2015
“Following processing, oil and gas is distributed to bulk fuel storage facilities typically via pipeline. These dedicated facilities will typically be located at strategic logistical hubs to enable ease of distribution to the customer. These “terminals” will have infrastructures to receive and distribute fuels. Fuel is typically transferred from the terminal to road tanker for delivery to the forecourt. Petrochemicals are typically containerized or tankered to the customer in specialist vessels. LPG is typically distributed in dedicated gas canisters for immediate use. Natural gas may be piped directly to the customer from a bulk storage gasometer. Processed fuel is stored in either above-ground storage tanks (AST) or underground storage tanks. These tanks are now required to have dedicated containment measures to control spills or accidental releases. Most modern tanks are double skinned and fitted with alarms to warn when leaks are occurring. Older tanks, however, are unlikely to incorporate such systems but may have wet stock reconciliation records compiled through manual dip readings of tank contents. Large distribution networks may exist in the oil and gas industry, including significant portfolios of retail petroleum stations. Given the large volume and variety of distribution networks, significant management of environmental impacts may be required.”
USAID/UGANDA: ENVIRONMENTAL MANAGEMENT FOR THE OIL SECTOR – TRAINING COMPENDIUM: MODULE 4 42

Storage/Terminals
“Water- and land-based terminals generally receive refined petroleum products by pipeline, tanker or barge. In more remote areas, terminals may be served by railroad tank cars or truck transport directly from refineries. The main function of terminals in the distribution chain is to provide temporary storage for refined products for eventual redistribution to smaller bulk plants closer to end users and to directly supply large commercial accounts. A terminal facility will usually store a variety of refined products: gasoline, heating oil, kerosene, diesel, etc. Although often lacking in esthetic beauty, terminals are nonetheless a vital part of the petroleum distribution network. They constitute the chief secondary storage for refined products in a given market area. The storage capacities of terminals vary considerably depending on the market and the terminal's distance from the refineries. Terminals are owned and operated by integrated oil companies, refiners, independent terminal operators, and local distributors” (Empire State Energy Association, 2017).
“There is further substantial storage of oil products in a refinery facility in the form of intermediate storage between successive refinery processes and the final storage of finished products. The latter may be at a refinery or at a separate dedicated tank form site. In addition, there is subsequent storage of products at further stages in the distribution cycle” (Department of the Environment, 1995.)
Characteristics of Pollutants
Sources of Waste
Source: IPIECA, 2014
“Petroleum refineries generate four broad categories of solid waste: process waste; maintenance and operational wastes; commercial waste, including food wastes and, if a medical facility is on-site, medical waste. Refineries produce industrial process wastes that are inherent to the activities they carry out in the handling and processing of crude petroleum and petroleum products. In addition, commercial wastes produced are typical of those produced by an office or warehouse, and usually comprise low-density non-hazardous waste materials, primarily packaging materials and waste office supplies. On-site food service operations may produce a food waste stream, while on-site clinics may produce small amounts of medical waste. These broad categories can be broken down more discretely as shown in Table 1.8. Virtually every refinery has a wastewater treatment plant to process hydrocarbon containing wastewater through one or more steps of primary and secondary treatment. Refinery wastewater treatment and the wastes produced from it are covered in the related IPIECA document, petroleum refining water/wastewater use and management.”
“The quantity of each waste stream should be determined either directly in mass terms (e.g., kilograms) or as a volume with the specific gravity or density of the material identified to allow for conversion to mass flow. The period of generation should also be recorded so that planning of recycling, disposal, or treatment can consider the continuous or intermittent nature of the generation of the waste and the overall quantity requiring management.”
TABLE 1.4: TYPICAL PETROLEUM REFINERY WASTE
Waste Type Description Process • Oil handling wastes—oily and non-oily sludge from tanks and process
equipment (often characterized as hazardous) and sludge from wastewater treatments
• Oil processing wastes—spent catalysts, off-specification material, spent chemicals, unsaleable by-products, and waste treatment by-products (often hazardous)
Maintenance and operational waste
• Construction/demolition waste • Residues from exchanger and equipment cleaning • Expired product samples • Spent solvents/paint and associated clothing, rags
USAID/UGANDA: ENVIRONMENTAL MANAGEMENT FOR THE OIL SECTOR – TRAINING COMPENDIUM: MODULE 4 43

Waste Type Description • Spill cleanup materials and contaminated soils • Used batteries, mercury lamps etc.
Commercial
• Packaging materials—uncontaminated • Packaging materials—contaminated • Office waste (e.g., waste paper, waste office supplies, etc.)—non-hazardous • Small quantities of hazardous materials (e.g., batteries, mercury lamps) • fluorescent bulbs, asbestos-containing materials, etc.) • Food scraps • Grease from cooking
Medical • Small amounts of medical waste (if refinery has on-site clinic) Source: World Bank Group, 1999
Waste Characteristics (Solid, Liquid)
“Boilers, process heaters, and other process equipment handle the emission of particulates, carbon monoxide, nitrogen oxides (NOx), sulfur oxides (SOx), and carbon dioxide. Catalyst changeovers and cokers release particulates.”
“VOCs such as benzene, toluene, and xylene are released from storage, product loading, and handling facilities and oil-water separation systems and as fugitive emissions from flanges, valves, seals, and drains. For each ton of crude processed, emissions from refineries may be approximately:”
• “Particulate matter: 0.8 kilograms (kg), ranging from less than 0.1 to 3 kg. • Sulfur oxides: 1.3 kg, ranging 0.2–06 kg; 0.1 kg with the Claus sulfur recovery process. • Nitrogen oxides: 0.3 kg, ranging 0.06–0.5 kg. • Benzene, toluene, and xylene (BTX): 2.5 grams (g), ranging 0.75 to 6 g; 1 g with the Claus sulfur
recovery process. of this, about 0.14 g benzene, 0.55 g toluene, and 1.8 g xylene may be released per ton of crude processed.
• VOC emissions depend on the production techniques, emissions control techniques, equipment maintenance, and climate conditions and may be 1 kg per ton of crude processed (ranging from 0.5 to 6 kg/t of crude).”
“Petroleum refineries use relatively large volumes of water, especially for cooling systems. Surface water runoff and sanitary wastewaters are also generated. The quantity of wastewaters generated and their characteristics depend on the process configuration. As a general guide, approximately 3.5–5 cubic meters (m3) of wastewater per ton of crude are generated when cooling water is recycled.”
“Refineries generate polluted wastewaters, containing biochemical oxygen demand and chemical oxygen demand (COD) levels of approximately 150–250 milligrams per liter (mg/l) and 300–600 mg/l, respectively; phenol levels of 20–200 mg/l; oil levels of 100–300 mg/l in desalter water and up to 5,000 mg/l in tank bottoms; benzene levels of 1–100 mg/l; benzo(a) pyrene levels of less than 1 to 100 mg/l; heavy metals levels of 0.1–100 mg/l for chrome and 0.2–10 mg/l for lead; and other pollutants.”
“Refineries also generate solid wastes and sludge (ranging from 3 to 5 kg per ton of crude processed), 80 percent of which may be hazardous because of the presence of toxic organics and heavy metals.”
“Accidental discharges of large quantities of pollutants can occur because of abnormal operation in a refinery and potentially pose a major local environmental hazard.”
USAID/UGANDA: ENVIRONMENTAL MANAGEMENT FOR THE OIL SECTOR – TRAINING COMPENDIUM: MODULE 4 44

Wastewater
Source: IFC, 2007
“The largest volume effluents in petroleum refining include “sour” process water and non-oily/non-sour but highly alkaline process water. Sour water is generated from desalting, topping, vacuum distillation, pretreating, light and middle distillate hydrodesulphurization, hydrocracking, catalytic cracking, coking, visbreaking/thermal cracking. Sour water may be contaminated with hydrocarbons, hydrogen sulfide, ammonia, organic sulfur compounds, organic acids, and phenol. Process water is treated in the sour water stripper unit to remove hydrocarbons, hydrogen sulfide, ammonia and other compounds, before recycling for internal process uses, or final treatment and disposal through an on-site wastewater treatment unit. Non-oily /non-sour but highly alkaline process water has the potential to cause Waste Water Treatment Plant upsets. Boiler blowdown and demineralization plant reject streams, if incorrectly neutralized, have the potential to extract phenolics from the oil phase into the water phase, and cause emulsions in the waste water treatment plant. Liquid effluent may also result from accidental releases or leaks of small quantities of products from process equipment, machinery, and storage areas/tanks.”
Air Emissions
Overview
Source: Quadrise, 2016
“Petroleum refineries are complex systems of multiple linked operations that convert the refinery crude and other intake into useful products. The specific operations used at a refinery depend on the type of crude refined and the range of refinery products. No two refineries are exactly alike. Depending on the refinery age, location, size, variability of crude and product slates and complexity of operations, a facility can have different operating configurations and different air emission point counts. This will cause relative differences in the quantities of air pollutants emitted and the selection of emission management approaches. For example, refineries that are highly complex with a wide variety of hydrocarbon products are likely to have more product movements and hence a potential for relatively higher fugitive, tank and loading emissions; refineries that process heavier or high sulfur crude and with higher conversion are likely to have relatively higher combustion emissions because of their higher energy demand. Each refinery will have site-specific air pollution management priorities and unique emissions management needs due to all these factors. National or regional variations in fuel quality specifications can also affect refinery emissions, as stricter fuel quality requirements will often require additional processing efforts.”
Emission Types
Source: IPIECA, 2012
“Refinery air emissions can generally be classified as either hydrocarbons, such as fugitive and VOCs, or combustion products such as NOx, SOx, H2S, CO, CO2, PM, and others.”
• “Hydrocarbons: When handling hydrocarbon materials, there is always a potential for emissions through seal leakage or by evaporation from any contact of the material with the outside environment. The primary hydrocarbon emissions come from piping system fugitive leaks, product loading, atmospheric storage tanks, and wastewater collection and treatment.
• Combustion products: A refinery uses large quantities of energy to heat process streams, promote chemical reactions, and provide steam and generate power. This is usually accomplished by combustion of fuels in boilers, furnaces, heaters gas turbines, generators, and the catalytic cracker. This results in the emission of products of combustion. Some sources of combustion products are units operated to safely control hydrocarbon emissions and which rarely supply useful energy for plant operations. Examples of these are flares and incinerators/thermal oxidizers. Besides hydrocarbon losses and core combustion emissions, refineries emit small quantities of a range of specific compounds that may need to be reported if
USAID/UGANDA: ENVIRONMENTAL MANAGEMENT FOR THE OIL SECTOR – TRAINING COMPENDIUM: MODULE 4 45

threshold limits are exceeded. Controls on core emissions may also be effective for these (e.g., dust controls are effective for reducing emissions of heavy metals, VOC controls are effective for specific hydrocarbons such as benzene).”
Fugitive Emissions
Source: IFC, 2007
“Fugitive emissions are the air pollution that escapes through leaks in the equipment. Fugitive emissions in petroleum refining facilities are associated with vents, leaking tubing, valves, connections, flanges, packings, open-ended lines, floating roof storage tanks and pump seals, gas conveyance systems, compressor seals, pressure-relief valves, tanks or open pits/containments, and loading and unloading operations of hydrocarbons. Depending on the refinery process scheme, fugitive emissions may include:”
• “Hydrogen • Methane • VOCs (e.g., ethane, ethylene, propane, propylene, butanes, butylenes, pentanes, pentenes, C6-
C9 alkylate, benzene, toluene, xylenes, phenol, and C9 aromatics); • PAHs and other semivolatile organic compounds • Inorganic gases, including hydrofluoric acid from hydrogen fluoride alkylation, hydrogen sulfide,
ammonia, carbon dioxide, carbon monoxide, sulfur dioxide and sulfur trioxide from sulfuric acid regeneration in the sulfuric acid alkylation process, NOX, methyl tert-butyl ether (MTBE), ethyl tertiary butyl ether (ETBE), t-amylmethyl ether (TAME), methanol, and ethanol”
“The main sources of concern includes VOC emissions from cone roof storage tanks during loading and due to out-breathing; fugitive emissions of hydrocarbons through the floating roof seals of floating roof storage tanks; fugitive emissions from flanges and/or valves and machinery seals; VOC emissions from blending tanks, valves, pumps and mixing operations; and VOC emissions from oily sewage and wastewater treatment systems. Nitrogen from bitumen storage tanks may also be emitted, possibly containing hydrocarbons and sulfur compounds in the form of aerosols. Other potential fugitive emission sources include the Vapor Recovery Unit vents and gas emission from caustic oxidation.”
Sulfur Oxides
Source: IFC, 2007
“SOx and hydrogen sulfide may be emitted from boilers, heaters, and other process equipment based on the sulfur content of the processed crude oil. Sulfur dioxide and sulfur trioxide may be emitted from sulfuric acid regeneration in the sulfuric acid alkylation process. Sulfur dioxide in refinery waste gases may have pre-abatement concentration levels of 1500 -7500 milligrams per cubic meter (mg/m3).”
Particulate Matter
Source: IFC, 2007
“Particulate emissions from refinery units are associated with flue gas from furnaces, catalyst fines emitted from fluidized catalytic cracking regeneration units, and other catalyst based processes; the handling of coke; and fines and ash generated during incineration of sludges. Particulates may contain metals (e.g., vanadium, nickels). Measures to control particulate may also contribute to control of metal emissions from petroleum refining.”
USAID/UGANDA: ENVIRONMENTAL MANAGEMENT FOR THE OIL SECTOR – TRAINING COMPENDIUM: MODULE 4 46

Greenhouse Gases (GHGs)
Source: IFC, 2007
“Carbon dioxide (CO2) may be produced in significant amounts during petroleum refining from combustion processes (e.g., electric power production), flares, and hydrogen plants. Carbon dioxide and other gases (e.g., nitrogen oxides and carbon monoxide) may be discharged to atmosphere during in-situ catalyst regeneration of noble metals.”
Hazardous Wastes
Source: IFC, 2007
“Petroleum refining facilities manufacture, use, and store significant amounts of hazardous materials, including raw materials, intermediate/final products, and by-products.”
Spent Catalysts
Source: IFC, 2007
“Spent catalysts result from several process units in petroleum refining including the pretreating and catalytic reformer; light and middle distillate hydrodesulphurization; the hydrocracker; fluid catalytic cracking (FCCU); residue catalytic cracking (RCCU); MTBE/ETBE and TAME production; butanes isomerization; the dienes hydrogenation and butylenes hydroisomerization unit; sulfuric acid regeneration; selective catalytic hydrodesulphurization; and the sulfur and hydrogen plants. Spent catalysts may contain molybdenum, nickel, cobalt, platinum, palladium, vanadium iron, copper, and silica and/or alumina, as carriers.”
Other Hazardous Wastes
Source: IFC, 2007
“In addition to spent catalysts, industry hazardous waste may include solvents, filters, mineral spirits, used sweetening, spent amines for CO2, hydrogen sulfide (H2S) and carbonyl sulfide (COS) removal, activated carbon filters and oily sludge from oil/water separators, tank bottoms, and spent or used operational and maintenance fluids (e.g., oils and test liquids). Other hazardous wastes, including contaminated sludges, sludge from jet water pump circuit purification, exhausted molecular sieves, and exhausted alumina from hydrofluoric (HF) alkylation, may be generated from crude oil storage tanks, desalting and topping, coking, propane, propylene, butanes streams dryers, and butanes isomerization.”
Non-Hazardous Wastes
Source: IFC, 2007
Hydrofluoric acid alkylation produces neutralization sludges, which may contain calcium fluoride, calcium hydroxide, calcium carbonate, magnesium fluoride, magnesium hydroxide, and magnesium carbonate. After drying and compression, they may be marketed for steel mills use or landfilled.
Common Accidents at Refineries
Source: IPIECA, 2012
“Accidental fires, explosions, and chemical and gas leaks are common at refineries. Such accidents cause higher than usual amounts of pollution, which may cause more acute exposure to pollutants and greater health impacts.”
Fire and Explosions
Source: IFC, 2007
“Fire and explosion hazards generated by process operations include the accidental release of syngas (containing carbon monoxide and hydrogen), oxygen, methanol, and refinery gases. Refinery gas
USAID/UGANDA: ENVIRONMENTAL MANAGEMENT FOR THE OIL SECTOR – TRAINING COMPENDIUM: MODULE 4 47

releases may cause ‘jet fires,’ if ignited in the release section, or give rise to a vapor cloud explosion, fireball or flash fire, depending on the quantity of flammable material involved and the degree of confinement of the cloud. Methane, hydrogen, carbon monoxide, and hydrogen sulfide may ignite even absent ignition sources, if their temperature is higher than their auto ignition temperatures of 580°C, 500°C, 609°C, and 260°C, respectively. Flammable liquid spills present in petroleum refining facilities may cause pool fires. Explosive hazards may also be associated with accumulation of vapors in storage tanks (e.g., sulfuric acid and bitumen).”
Risks and Impacts of Petroleum Refining on Environment and Biodiversity
The document, Summary of Environmental and Social Impacts of Activities Associated with Petroleum Refining and the Storage of Petroleum Products, created by European Bank for Reconstruction and Development (EBRD, No date) should be viewed as resource material for the content of the sections that follow below. This document can be accessed via web at http://www.ebrd.com/downloads/policies/environmental/chemical/petroleum-refineries.pdf
This document presents a summary of the potential environment impacts associated with refining and storage of petroleum and petroleum products within the oil and gas Industry and identifies potential mitigation measures to control and limit the risk of unmitigated environmental and social impacts such that any residual impact can be managed (EBRD, No date).
“Petroleum-derived contaminants constitute one of the most prevalent sources of environmental degradation in the industrialized world. In large concentrations, the hydrocarbon molecules that make up crude oil and petroleum products are highly toxic to many organisms, including humans. Petroleum also contains trace amounts of sulfur and nitrogen compounds, which are dangerous by themselves and can react with the environment to produce secondary poisonous chemicals. The dominance of petroleum products in the United States and the world economy creates the conditions for distributing large amounts of these toxins into populated areas and ecosystems around the globe” (Advameg, 2017).
Pollution Contamination: Overview
Source: Mariano et al., 2007
“The oil industry holds a major potential of hazards for the environment, and may affect it at different levels: air, water, soil, and consequently all living beings in our planet. Within this context, the most widespread and dangerous consequence of oil and gas industry activities is pollution. Pollution is associated with virtually all activities throughout all stages of oil and gas production from exploratory activities to refining. Wastewaters, gas emissions, solid waste and aerosols generated during drilling, production, refining (responsible for the most pollution), and transportation amount to over 800 chemicals, among which oil and petroleum products prevail.”
“Other environmental impacts include intensification of the greenhouse gas effect, acid rain, poor water quality, groundwater contamination, among others. The oil and gas industry also contributes to biodiversity loss and to the destruction of ecosystems that in some cases are unique. Oil refineries are major polluters consuming large amounts of energy and water, producing large quantities of wastewaters, releasing hazardous gases into the atmosphere and generating solid waste that are difficult both to treat and dispose of.”
Entry into the Environment
Source: Speight, 2005
“It is almost impossible to transport, store, and refine crude oil without spills and losses. It is difficult to prevent spills resulting from failures of or damage to pipelines. It is also impossible to install control devices for controlling the ecological properties of water and the soil along the length of all pipelines. The soil suffers the most ecological impact in the damage areas of pipelines. Crude oil spills from pipelines lead to irreversible changes in the soil properties.”
USAID/UGANDA: ENVIRONMENTAL MANAGEMENT FOR THE OIL SECTOR – TRAINING COMPENDIUM: MODULE 4 48

“Principal sources of releases to air from refineries include (i) combustion plants, emitting sulfur dioxide, oxides of nitrogen, and particulate matter; (ii) refining operations, emitting sulfur dioxide, oxides of nitrogen, carbon monoxide, particulate matter, VOCs, hydrogen sulfide and other sulfurus compounds; and (iii) bulk storage operations and handling of VOCs (various hydrocarbons).”
“There is potential for significant soil and groundwater contamination arising from petroleum refineries. Such contamination comprises (i) petroleum hydrocarbons, including lower-boiling, very mobile fractions (paraffins, cyclo-paraffins, and volatile aromatics such as benzene, toluene, ethylbenzene, and xylenes) typically associated with gasoline and similar boiling-range distillates; (ii) middle distillate fractions (paraffins, cycloparaffins, and some polynuclear aromatics) associated with diesel, kerosene, and lower-boiling fuel oil, which are also of significant mobility; (iii) higher-boiling distillates (long-chain paraffins, cycloparaffins, and some polynuclear aromatics) that are associated with lubricating oil and heavy fuel oil; (iv) various organic compounds associated with petroleum hydrocarbons or produced during the refining process; (v) other organic additives [e.g., Antifreeze, alcohols, detergents and various proprietary compounds]; (vi) organic lead, associated with leaded gasoline and other heavy metals.”
“Key sources for such contamination at petroleum refineries are at (i) transfer and distribution points in tankage and process areas and loading and unloading areas; (ii) land farm areas; (iii) tank farms; (iv) individual above-ground storage tanks, particularly individual underground storage tanks; (v) additive compounds and (vi) pipelines, drainage areas and on-site waste treatment facilities, impounding basins, and lagoons, especially if inland.”
“Although contamination may be associated with specific facilities, the contaminants are relatively highly mobile in nature and have the potential to migrate significant distances from the source in soil and groundwater. Petroleum hydrocarbon contamination can take several forms free-phase product, dissolved phase, emulsified phase, or vapor phase. Each form will require different methods of remediation so cleanup may be complex and expensive.”
Migration of Contaminants
Source: Department of the Environment and Department of Transport, 1995
“The migration of contaminants depends upon their physical and/or chemical characteristics and upon the hydrogeological and geological characteristics of the site. Low viscosity liquid and gaseous hydrocarbons are highly mobile and may migrate from point sources to contaminate a wide area. Unless trapped in impermeable strata or in existing infrastructure, the gaseous substances will have evaporated fairly rapidly from their original point of deposition or disposal. Viscous liquids and semi-solid tars are less mobile, but also flow and therefore may also migrate.”
“Liquids released at the surface or leaking from an underground structure will flow down through the ground under the influence of gravity. Some hydrocarbons will be absorbed onto soil particles and retained in soil pores. On encountering groundwater, the liquid will typically spread out on the surface of the water and migrate laterally, preferentially toward the groundwater flow. The volatile components will diffuse into the overlying soil and migrate as a vapor front ahead of the free product. Vapor emissions from contaminated land could accumulate in poorly ventilated spaces and present a health and explosion hazard.”
“Insoluble liquids, which are denser than water, will sink through the groundwater until they encounter an impermeable barrier, where they will spread out and possibly continue to migrate toward the groundwater flow. Soluble components (such as phenols) will dissolve in the groundwater and migrate toward the groundwater flow. Soluble inorganic contaminants deposited on the surface or in the unsaturated zone may be leached by rainwater infiltration and enter underlying groundwater.”
“Metal contamination is likely to be localized. The movement of metals through soil is reduced by organic matter and by solubility limitations. However, low pH conditions caused by mineral acids
USAID/UGANDA: ENVIRONMENTAL MANAGEMENT FOR THE OIL SECTOR – TRAINING COMPENDIUM: MODULE 4 49

could enhance the mobility of some metals. Metals attenuated in soils at, or close to, the surface may be transported by wind action.”
“The higher the organic matter and particularly clay content of the soil, the greater adsorption of organic compounds and hence the lower their mobility. The greatest contaminant migration will occur on coarse-grained sands and gravels with little organic content. Some organic contaminants will biodegrade naturally in soils, although the rate of degradation will depend on the environmental conditions. However, asbestos, metals, and most other inorganic contaminants are not biodegradable.”
“Wind dispersal of contaminated soil may be a further transport mechanism where there is gross surface contamination by some of the less mobile contaminants, particularly metals and asbestos. Poly-chlorinated biphenyls (PCBs) are highly persistent and fat soluble, possibly leading to accumulation in food chains.”
Environmental Impacts
Source: India Ministry of Environment and Forests, 2010.
“The nature of impacts could fall within three broad classifications, i.e., direct, indirect, and cumulative, based on the characteristics of the impacts.”
Direct Impacts
Source: India Ministry of Environment and Forests, 2010.
“Direct impacts occur through direct interaction of an activity within an environmental, social, or economic component. Discharges from petroleum refining industry or effluents from treatment plants into nearby water bodies may lead to decline in water quality.”
Indirect Impacts
Source: India Ministry of Environment and Forests, 2010.
“Indirect impacts on the environment are those which are not direct results of the project, often produced away from or because of a complex impact pathway. The indirect impacts are also known as secondary or even tertiary level impacts. For example, impacts of air emissions such as CO2 on climate change, NOx may lead to acid rains and formation of ground-level ozone, particulates on health effects, SOx may lead to acid rains, VOC may lead to low-level atmospheric ozone when combined with NOx in the presence of sunlight.”
“Another example of indirect impact is the decline in water quality due to contamination of oil products, which increase the oxygen demand of the effluent, discharge of cooling water into nearby water bodies. This may lead to secondary indirect impact on aquatic flora in that water body and may further reduce fish population. Reduction in fishing harvests, affecting the incomes of fishermen is a third level impact. The indirect impacts may also include growth-inducing impacts and other effects related to induced changes to the pattern of land use or additional road network, population density or growth rate. In the process, air, water and other natural systems including the ecosystem may also be affected.”
Cumulative Impacts
Source: India Ministry of Environment and Forests, 2010.
“Cumulative impact is created because of a combination of projects within the same vicinity, causing related impacts. These impacts occur when the incremental impact of the project is combined with the cumulative effects of other past, present and reasonably foreseeable future projects.”
USAID/UGANDA: ENVIRONMENTAL MANAGEMENT FOR THE OIL SECTOR – TRAINING COMPENDIUM: MODULE 4 50

Potential Impacts on the Environment
Source: India Ministry of Environment and Forests, 2010.
“Impacts that represent an oil refinery on the environment are mainly due to emissions of gas, waste water discharges, solid waste, noises and odor nuisance and aesthetic or visual inconvenient it brings. Air emissions are primarily responsible for the effects that the refineries are doing to the environment, particles, hydrocarbons, carbon oxide, oxides of sulfur and nitrogen being the most important. These emissions come from various sources, the catalytic cracking unit, and methods of sulfur recovery, heaters, ventilation equipment, flares, and storage of products or raw materials. Pump seals and valves can be the source of fugitive emissions. The combined emanation can cause repulsive odors disturbing large areas that surrounding the refinery.”
Potential Impacts on Surface and Groundwater
Petroleum refining consumes large quantities of water used to wash the superfluous material caused by the flow of processing, the production of water vapor and cooling and reaction processes. The main pollutants in waste water from oil refineries comprise oils and fats, ammonia, phenol compounds, sulfides, organic acids, chromium and other metals. These pollutants can be expressed in biochemical oxygen demand (BOD5), COD, and total organic carbon. There is also risk that surface water, soil, and groundwater are polluted by leaks, spills of raw materials and various products. Drain cooling water, the flushing washing water, the flow of rainwater entering the farms and rods tank, products, and treatment storage areas can also cause degradation of surface water and groundwater. “The refineries generate abundant amounts of solid waste that mainly comprise catalyst fines, coke fines from crackers unit, iron sulfides, filtering agents and sludge (issued by sewage tanks, separating oil and water and by waste water treatment systems). Because water is used in so many ways during fossil fuel extraction and processing, there are also many ways in which it can become contaminated with a wide variety of pollutants, from sediment to synthetic chemicals. Nearby water bodies and groundwater may become contaminated by solid or liquid wastes created by the extraction process” (Allen et al., 2012).
The water-related impacts of fossil fuel extraction and refining in a region are a function of multiple factors, including the amount and type of fossil fuel produced, the extraction methods used, physical and geological conditions, and regulatory requirements (Mielke et al. 2010). Sometimes social conditions such as political stability also influence the links between water and energy. In Nigeria, political corruption and social tensions have contributed to a high incidence of oil spills because oil companies are often not held accountable for polluting, and because of vandalism of oil pipelines.
“From extraction to end use, petroleum products affect surface water and groundwater, impairing water quality with hydrocarbons, salts, nutrients, a host of organic compounds, and various heavy metals. In many areas around the world, oil spills and storm water runoff containing oil derivatives have degraded ecosystems and human water supply” (Gleick et al., 2014).
“After production, crude oil is refined through water-intensive processes: water is used for steam, as part of the refining process, as wash water, and for cooling. Process water typically becomes contaminated with sulfur and ammonia, requiring treatment. Cooling system water has little direct contact with petroleum products, though trace contaminants may appear in cooling system water. Such cooling water is the largest consumptive water use in refining, at a rate of three to four units of cooling water per unit of crude oil, depending on the type of cooling system. Because of the large volumes of water required for operation, refineries are often located adjacent to water sources. The sheer size of many refineries—often covering square kilometers of land—means that, in some countries, precipitation on the refinery grounds must be captured and treated so as not to contaminate adjacent water bodies” (Gleick et al., 2014).
Refined petroleum products continue to affect water quality, though their impacts typically become more diffuse once the products are refined and distributed. In the United States, the Environmental Protection Agency has recorded over 490,000 confirmed leaks from underground storage tanks,
USAID/UGANDA: ENVIRONMENTAL MANAGEMENT FOR THE OIL SECTOR – TRAINING COMPENDIUM: MODULE 4 51

which are generally used to store petroleum products. Leaking underground storage tanks can contaminate groundwater resources with gasoline, diesel fuel, and related compounds, such as benzene and toluene. The total volumes leaked from underground storage tanks, and the total volume of groundwater affected by such leaks, is not known (Allen et al., 2012).
“The distribution and combustion of refined petroleum products (gasoline, diesel, and jet fuel) also affect surface water and groundwater. Once the refined gasoline and diesel fuels reach motor vehicles, spills and combustion by-products can become nonpoint sources of pollution, washed by storm water runoff into streams or infiltrating into groundwater. Combustion of these fuels discharges nitrogen and other contaminants to the atmosphere, which in turn can be carried back to the Earth in precipitation, increasing pollution loadings to lakes and streams” (Allen et al., 2012).
Effects of Groundwater Contamination
Source: U.S. EPA, 2015
“Contamination of groundwater can cause poor drinking water quality, loss of water supply, degraded surface water systems, high cleanup costs, high costs for alternative water supplies, and/or potential health problems. The consequences of contaminated groundwater or degraded surface water are often serious. Estuaries that have been affected by high nitrogen from groundwater sources have lost critical shellfish habitats. In terms of water supply, sometimes groundwater contamination is so severe that the water supply must be abandoned as a source of drinking water. In other cases, the groundwater can be cleaned up and used again, if the contamination is not too severe and if the municipality is willing to spend a good deal of money. Follow-up water quality monitoring is often required for many years. Because groundwater generally moves slowly, contamination often remains undetected for long periods of time. This makes cleanup of a contaminated water supply difficult, if not impossible. If a cleanup is undertaken, it can cost thousands to millions of dollars. Once the contaminant source has been controlled or removed, the contaminated groundwater can be treated in one of several ways:”
• “Containing the contaminant to prevent migration • Pumping the water, treating it, and returning it to the aquifer • Leaving the groundwater in place and treating either the water or the contaminant • Allowing the contaminant to attenuate (reduce) naturally (with monitoring), following the
implementation of an appropriate source control.”
“Selection of the appropriate remedial technology is based on site-specific factors and often considers cleanup goals based on potential risk that are protective of human health and the environment.”
“The technology selected is one that will achieve those cleanup goals. Different technologies are effective for different types of contaminants, and several technologies are often combined to achieve effective treatment. The effectiveness of treatment depends in part on local hydrogeological conditions, which must be evaluated prior to selecting a treatment option. Given the difficulty and high costs of cleaning up a contaminated aquifer, some communities choose to abandon existing wells and use other water sources, if available. Using alternative supplies is probably more expensive than obtaining drinking water from the original source. A temporary and expensive solution is to purchase bottled water, but it is not a realistic long-term solution for a community’s drinking water supply problem. A community might decide to install new wells in a different area of the aquifer. Here, appropriate siting and monitoring of the new wells are critical to ensure that contaminants do not move into the new water supplies.”
Ecological Impacts
“Plant and animal communities may also be directly affected by changes in their environment through variations in water, air, and soil/sediment quality. Some changes my directly affect the ecology, for example, habitat, food and nutrient supplies, breeding areas, migration routes, vulnerability to
USAID/UGANDA: ENVIRONMENTAL MANAGEMENT FOR THE OIL SECTOR – TRAINING COMPENDIUM: MODULE 4 52

predators or changes in herbivore grazing patterns, which may then have secondary effects on predators. Soil disturbance and removal of vegetation and secondary effects such as erosion and siltation may affect ecological integrity, and may lead to indirect effects by upsetting nutrient balances and microbial activity in the soil. If not properly controlled, a potential long-term effect is loss of habitat which affects both fauna and flora, and may induce changes in species composition and primary production cycles” (E&P Forum/UNEP, 1997).
If controls are not managed effectively, ecological impacts may also arise from other direct anthropogenic influences, such as fires, increased hunting and fishing, and possibly poaching. Besides changing animal habitat, it is important to consider how changes in the biological environment also affect local people and indigenous populations.
“In Nigeria, the Niger Delta is host to three of the country’s four refineries, which generate large quantities of effluents daily. These effluents are discharged into natural water bodies after treatment. Phenol is one of the major pollutants found in refinery effluents” (Otokunefor, 2005). Phenols have been observed to be very toxic to fish and other aquatic organisms and has a nearly unique property of tainting the taste of fish if present in marine environment in concentration ranges of 0.1 to 1.0 mg/l (Cavaseno, 1980, De-Bruin, 1976, Staples et al., 1998, Otokunefor, 2005). “The toxic concentration for fishes may range from <0.1 to >100 mg/l, depending on the chemical nature of the phenol, the fish species and the developmental stage, with embryo-larval stages being often more susceptible than adults. Verbal evidence from local fishermen suggests that the area around the point of discharge of the effluents is devoid of fishes and hence no fishing activity is carried out there anymore. Unpublished data also show a dramatic reduction in the number of viable microorganisms found in both water and sediment at the point of impact. The high oil and grease concentration observed in the effluent receiving water body in the Niger Delta, in combination with other pollutants, is also thought to be responsible for the depletion of the fish and other aquatic life at the point of impact of the effluent” (Otokunefor, 2005).
Atmospheric Impacts
Source: E&P Forum/UNEP, 1997
“The volumes of atmospheric emissions and their potential impact depend on the process under consideration. The potential for emissions from exploration activities to cause atmospheric impacts is generally considered low. However, during production, with more intensive activity, increased levels of emissions occur in the immediate vicinity of the operations. Emissions from production operations should be viewed in the context of total emissions from all sources, and mostly these fall below 1 percent of regional and global levels.”
“Flaring of produced gas is the most significant source of air emissions, particularly where there is no infrastructure or market available for the gas. However, wherever viable, gas is produced and processes as an important commodity. Through integrated development and providing markets for all products, the need for flaring will be greatly reduced.”
“Flaring, venting, and combustion are the primary sources of carbon dioxide emissions from production operations, but other gases should also be considered. For example, methane emissions primarily arise from process vents and, to a lesser extent from leaks, flaring, and combustion.”
Acid Rain
Source: Epstein et al., 2002
“Gaseous emissions from refineries accumulate in the atmosphere and return in the form of acid rain, which causes an array of problems now known to be much more complex and diverse than previously believed. The impacts of acid rain are no longer considered as isolated effects, but are recognized to impact entire ecosystems. The sulfur dioxide (SO2) and nitrogen oxides (NOx) released from the combustion of fossil fuels are the leading contributors to acid rain production. As both SO2 and NOxs enter the atmosphere, they become oxidized into sulfuric acid and nitric acid
USAID/UGANDA: ENVIRONMENTAL MANAGEMENT FOR THE OIL SECTOR – TRAINING COMPENDIUM: MODULE 4 53

respectively. The reactions are enhanced in areas of increased pollution as ammonia and ground-level ozone act as catalysts. These acids dissolve readily into water and help form acidic water droplets, returning to the Earth in the form of acidic rain, snow, or fog. Natural rainwater has an inherent acidic pH of 5.6. Acid rain commonly reaches pH levels as low as 4, about 40 times the acidity of natural rainwater. Once acid rain returns to the surface, it begins a cascade of harmful environmental effects. The consequences of acidic precipitation are complicated by the relationships within ecosystems. From terrestrial to aquatic environments, the individual effects are each detrimental.”
Terrestrial Effects
Source: Epstein et al., 2002
“Upon reaching the ground, acid rain takes immediate effect in soils. Natural rainwater’s slight acidity is normally countered by soil buffering capacity. This buffering capacity plays an integral part in the ecosystem, allowing for tolerance within a range of fluctuating conditions. Acid rain overwhelms soil’s buffering capacity, disrupting carefully established pH balances. One consequence has been the leaching of base cations from soil leading to mineral and nutrient deficiencies in the soil. Beyond changes in soil chemistry, acid rain negatively affects the growth of trees.”
Aquatic Effects
“Once acid precipitation saturates the soil's buffering capacity, runoff and drainage play a large role in the spread of acidification. Aquatic systems such as lakes, streams, and groundwater are all susceptible” (Epstein et al., 2002).
“Soil runoff not only lowers the pH levels of aquatic bodies, but also exposes them to increased levels of aluminum” (Epstein et al., 2002).
“Acidification of bodies of water affects the vast the array of aquatic organisms that live in aquatic systems. Changes in pH, nitrate concentration, and aluminum concentration shifts the natural balances established within an ecological system. While some organisms can flourish under such conditions, others are harmed. The susceptibility of fish in these changing environments has been clearly documented. Studies show both low pH and aluminum are toxic to fish (Baker and Schofield, 1982). Acid-sensitive species are at greatest risk and are the first to be eliminated in aquatic environments. Studies have shown significantly fewer species of fish in lakes with decreased pH (Schindler et al. 1985). Episodic acidification has been particularly associated with larger amounts of fish loss in streams and rivers. Episodic acidification also impacts fish mortality, migration, and reproductive failure, further reducing fish populations (Baker et al., 1996)” (Epstein et al., 2002).
“Although many species suffer the effects of acid rain, some “weedy species” thrive in it. Changes in environmental chemistry and biodiversity have given some organisms a window of opportunity to flourish. Harmful algal blooms have disrupted marine environments such as the Chesapeake Bay, Indian Ocean, and Bay of Bengal. The explosion of algae, the algal "bloom," can have a variety of environmental effects. Overgrowth clouds the water decreasing sunlight penetration, harming aquatic vegetation and animals that need sunlight to survive. Once algae die, they settle to the bottom where they decay, a process that consumes vital oxygen. This causes so-called “dead zones.” Eutrophication contributes to harmful algal blooms that lead to shellfish poisoning and algae and zooplankton can harbor pathogens (Epstein et al., 1993) Eutrophication can also lead to coral reef degradation and collapse of food webs (EPA, 2001)” (Epstein et al., 2002).
Secondary Impacts of Petroleum Refining on the Environment and Biodiversity
Negative Secondary Impacts from Oil and Gas Development
Source: BP, No date
“The content of the sections below refer to secondary impacts that may arise from the various stages of oil and gas development and not necessarily from petroleum refining per se. In this lecture,
USAID/UGANDA: ENVIRONMENTAL MANAGEMENT FOR THE OIL SECTOR – TRAINING COMPENDIUM: MODULE 4 54

the significance of these impacts should therefore be viewed within the framework of the entire oil and gas development value chain. These notes could also serve as supplementary material for other related modules and lectures.”
“Oil and gas exploration and production activities can have a wide range of impacts on biodiversity, both positive and negative. These impacts, which can be defined as changes in the quality and quantity of biodiversity in a physical environment, will vary in scale and significance, depending on the activities and environmental conditions involved. Impacts to biodiversity can be broadly divided into two types: primary and secondary.”
“This lecture will use the terms primary and secondary to describe the different causes and scales of potential impacts to biodiversity from oil and gas development. There are several other terms that can and have been used to describe similar concepts. Primary impacts are often called direct impacts, while secondary impacts are indirect or induced impacts. The term Secondary is not meant to imply secondary importance or secondary significance as an issue for the oil and gas industry. Rather, secondary refers to timing and scope of these impacts. Often the effects on biodiversity from secondary impacts are much more significant than those of primary impacts and represent an important priority for the industry to understand and effectively address.”
Primary Versus Secondary Impacts
Source: BP, No date
“Ultimately, both primary and secondary negative impacts to biodiversity may mean habitat conversion, degradation and fragmentation; wildlife disturbance and loss of species; air, water and soil pollution; deforestation; soil erosion and sedimentation of waterways; soil compaction; contamination from improper waste disposal or oil spills; and loss of productive capacity and degradation of ecosystem functions—both onshore and offshore. Where the two impacts differ is in cause, scope, scale, intensity, and boundaries of responsibilities. This can sometimes make it difficult to definitively label environmental degradation as either primary or secondary.”
“Primary impacts are changes to biodiversity that result specifically from project activities. These impacts, which will be most familiar to project managers, are normally associated with the geographic area relatively near to project activities. Primary impacts usually become apparent within the lifetime of a project, and often their effect is immediate. For example, clearing areas of a dense-canopy forest to build project infrastructure will cause immediate deforestation and loss of habitat, and may lead to soil erosion over the longer-term that will contaminate a waterway.”
“Most primary impacts can be relatively easily predicted with a standard Environmental and Social Impact Assessment (ESIA) process, based on the proposed activity and an understanding of the surrounding ecosystem. Primary impacts can usually be minimized or avoided by incorporating sound biodiversity conservation objectives, impact mitigation and operational management practices into company Environmental Management Systems and project-level assessment, design and execution, from the very start of an operation.”
“Secondary impacts, rather than resulting directly from project activities, are usually triggered by the operations, but may reach outside project or even concession boundaries and may begin before or extend beyond a project’s life cycle. Although secondary impacts may be predicted with a thorough ESIA process that includes biodiversity issues and explicitly links environmental and social issues, sometimes the potential for such impacts may not be identified or realized until much later in the project cycle, or even after the project has been decommissioned.”
“One of the most important distinctions is that, while primary impacts result from operational decisions and the activities of project personnel, secondary impacts result from government decisions and the actions and practices of nearby communities or immigrants, in response to the project. The responsibility for predicting, preventing, and mitigating secondary impacts is not at all clear-cut. While these decisions and activities may occur because of the presence of the project, they are often the actions of organizations and individuals unrelated to the energy company.”
USAID/UGANDA: ENVIRONMENTAL MANAGEMENT FOR THE OIL SECTOR – TRAINING COMPENDIUM: MODULE 4 55

“Although the company will often be held responsible by the public for any negative effects, because of the shared spheres of responsibility involved, secondary impacts are the most controversial and difficult to manage types of impacts from oil and gas development. They may also cause the most problems for a project or company. It is vital that companies seeking to work in areas of high biodiversity value—where secondary impacts have the potential to be extensive—understand the factors that may lead to such impacts, the key challenges in addressing them, and ways to avoid or minimize such impacts.”
Factors That May Lead to Secondary Impacts
Source: BP, No date
“The most common causes of secondary impacts relate to population changes in an area and new or additional economic activities resulting from the large investments in potentially permanent infrastructure, such as roads, ports, and towns that may accompany an energy project, or any other major industrial development.”
Immigration and New Settlements
Source: BP, No date
“Oil and gas operations usually require skilled labor, and are thus magnets for people hoping to find employment with the company or its contractors. New projects also typically stimulate the provision of goods and services both to the project and/or affected local communities, creating additional employment opportunities and attracting more people to the area. Even unfounded rumors that project activities will occur may cause people to migrate to an area in search of employment. Sometimes in-migration is encouraged or even supported by local or national governments, making this a particularly sensitive political issue.”
“For example, in Gabon, Shell’s operations have been the catalyst for the establishment and development of Gamba, a town of about 6,000-7,000 people, many of whom work directly or indirectly for Shell. The presence of these workers, some of whom are second generation, has affected the surrounding biodiversity through limited agricultural activities and hunting of bush meat (recognizing this is allowed within the local law if it is for local consumption and not trade). Shell has no direct control over Gamba, as it is a town with its own governance, but where Shell has direct control, such as the Gamba terminal or the infield Rabi oilfield, it has put strict management controls in place, including controlling development, prohibiting hunting, limiting driving speeds, and times, and managing emissions to minimize its impacts on biodiversity.”
“As the local population increases, the need for housing, food and other goods and services will also grow, often through unplanned and uncontrolled new settlements. This is particularly the case in previously undeveloped areas. This increased demand will put additional pressure on natural resources, including:”
• Deforestation from clearing of land for agriculture, building housing and other infrastructure, and collection of wood for construction, cooking and heating;
• Increased demands on water resources and generation of wastes and other pollution; • Increased demand for public services such as schools, law enforcement and health care, that
reduces the resources available to address biodiversity concerns; • Commercial and illegal logging; • Extraction of non-timber forest products, such as fibers, medicinal plants and wild food sources; • Increased hunting and fishing, for subsistence or trade in bushmeat; and • Poaching for skins, exotic pet trade or other uses, such as folk remedies.”
“People who have settled in an area either for employment with a project or to provide additional services usually remain after their jobs are finished and often well after the operation has ended and moves out of the area. When the economic activity generated by the company disappears, people often depend even more on natural resource extraction, such as increased clearing of land for
USAID/UGANDA: ENVIRONMENTAL MANAGEMENT FOR THE OIL SECTOR – TRAINING COMPENDIUM: MODULE 4 56

agricultural activities, timber, and hunting. At the peak of project labor demand, during the construction phase, thousands of workers may be needed. However, this need for labor will rapidly diminish in the operational phase, leaving many people who have moved to the area without a ready source of income.”
Increased Access to Undeveloped Areas
Besides attracting people looking for work related to the project, an oil and gas operation can also provide access to an undeveloped area for people who are interested in using previously inaccessible land or resources for other purposes. This access is usually facilitated by the building or upgrading of linear infrastructure, such as roads and pipelines, into such environments.
“One of the most dramatic results of a new or improved road or pipeline route is the extensive deforestation that results when the access route penetrates a remote and inaccessible forested area. Sometimes this deforestation is largely for agricultural or ranching activities that generate little long-term employment and are often unsustainable due to poor quality soils. Increased access can also lead to logging, hunting, and other pressures on biodiversity. As forests are cleared, all the plants and animals that live there either move to a new area, if they can, or die. Changes in surface hydrology, declines in forest cover and similar changes in the environment can have associated negative effects on biodiversity. A pipeline and road built through previously undeveloped forest and wetlands in the northern Guatemalan department of Petén in the mid-1990s facilitated access that led to extensive deforestation and agricultural colonization along the route. These impacts can clearly be seen in aerial photos of the forest in the years following the pipeline’s construction” (BP, No date).
Key Challenges in Understanding and Addressing Secondary Impacts
Source: BP, No date
“Because secondary impacts typically arise from complex interactions between social, economic and environmental factors and players, they can be difficult for a company to fully predict and equally difficult or impossible for a company to manage alone. Anticipating and managing secondary impacts is further complicated by the potential of activities not associated with the project to have their own impacts, thus adding to the severity or intensity of secondary impacts.”
“Secondary impacts will sometimes result from company activities that contribute positively to economic development, such as road-building or local employment. There can be significant tension between conservation and development goals in an area, and a company may find itself caught in the middle of that debate. A company’s commitment to contribute to local economic development and skills transfer through training and hiring of local labor and suppliers may encourage immigration to an area, leading to secondary impacts from population growth. Or, a road that local communities or government agencies support because it will increase economic activity in an area may be strongly opposed by conservation organizations concerned that the road will open access to a pristine ecosystem.”
“As with any form of development, when an oil and gas operation enters an area, there will be inevitable trade-offs between long- and short-term costs or benefits and conservation and economic development priorities. It is beyond the ability of a company alone to fully address or prevent secondary impacts or decide about how to balance those trade-offs to achieve the most sustainable development possible for the area.”
“While a company can contribute to protecting biodiversity in the area or preventing some level of secondary impact, the authority and expertise for necessary actions to influence secondary impacts may more appropriately belong with others, notably government representatives and communities themselves. For example, a company may unilaterally reduce or avoid immigration along roads or pipelines through careful planning of routes to avoid critical natural habitats, use of existing infrastructure and access routes, reducing the size of the right-of-way area or burying the pipelines. However, if the company wants to control access along the route, support from government authorities and local communities will be a critical factor in their success.”
USAID/UGANDA: ENVIRONMENTAL MANAGEMENT FOR THE OIL SECTOR – TRAINING COMPENDIUM: MODULE 4 57

“Nevertheless, a company’s critics may argue that the company is fully responsible for any negative impacts that result from secondary economic activities or population increases and will expect the company to do as much as it practicably can to address those impacts. Although it may be difficult or impossible—and ultimately undesirable—for the company on its own to do everything that would be needed to meet stakeholder expectations, failure to manage secondary impacts can have significant negative consequences for the company’s project success and corporate reputation, both locally and internationally. It is also typically very difficult to avoid or even effectively manage secondary impacts once the conditions that cause them have been created.”
“Therefore, it is in a company’s interest to identify, as early as possible, the potential for a project to give rise to secondary impacts during any part of the project life cycle. The key tool for a company to predict potential impacts and determine effective mitigation strategies is a broad-based ESIA that explicitly includes biodiversity considerations and carefully examines the complex interrelationships between social and environmental issues.”
“Early impact assessment will enable a company to have maximum flexibility to alter design and implementation plans, build effective partnerships to address potential challenges, and even decide about whether or not to proceed with a project. Just as the potential for significant and unacceptable primary impacts may stop a project, there may be times that secondary impacts that are difficult or impossible to avoid or mitigate will be so significant, in terms of risks to the project and company investment and risks to biodiversity, that a company will decide not to proceed with the investment. It is best to make this decision before decisions involving the deployment of major resources are made.”
Approaches for Avoiding or Managing Secondary Impacts and Their Causes – Overview
Source: BP, No date
“Just as negative secondary impacts to biodiversity may be caused by a wide range of stakeholders, their solutions will usually require cooperation among many parties, in particular national, regional and local government officials, and also including local communities, national and international conservation organizations, companies and financial institutions that may provide funding for the project. Early and continuous engagement with all stakeholders will be critical for identifying potential conflicts, building trust, defining boundaries of responsibility and promoting cooperation and partnership in addressing secondary impacts. This may be particularly true in some developing countries, where biodiversity conservation might not be a priority or high-profile issue.”
“Where it is determined that responsibilities for addressing negative secondary impacts most appropriately rest with other organizations, the company may want to help facilitate processes or build capacity to enable those organizations to more effectively carry out those responsibilities. Highly creative solutions may be needed, and companies will be expected and challenged to help find them. For example, it may be possible to address access and immigration concerns by working in partnership with government agencies and conservation organizations to establish some form of protected area around or along a road or pipeline. Or, in some areas, it may be possible to find innovative ways of providing resources and supplies to local communities. In 1985, Petroleum Development Oman set up an experimental desert farm near some of its operations in southern Oman to test the agricultural potential of desert farming. The farm was such a technical success that it more than doubled in size two years later and now offers a wide range of high-quality fruits and vegetables to local people, lessening the pressure of the local population on the area’s ecological resources.”
“A stakeholder engagement plan should be an integral part of any new business development process. An effective stakeholder engagement plan will enable a company to identify the most active stakeholders and likely partners for future collaboration, build trust, and increase the chances of public support for their project. While stakeholder engagement does not eliminate the possibility of conflict or guarantee agreement, it vastly increases the chances of success. The engagement plan, which ideally will begin in modified form at the pre-bid stage, should detail a process of information
USAID/UGANDA: ENVIRONMENTAL MANAGEMENT FOR THE OIL SECTOR – TRAINING COMPENDIUM: MODULE 4 58

sharing, soliciting concerns, and listening to the wants and needs of relevant interested parties to guide project design and implementation. Companies should remain transparent and responsive to concerns and demonstrate commitment and leadership from top project managers. Government representatives will be key participants in a process of engagement with local communities and other stakeholders. In addition, conservation organizations and economic and social development organizations may have knowledge, expertise, and experience to help the company anticipate and address the social or economic conditions that might lead to secondary impacts.”
“One of the most important ways that companies can work with stakeholders to resolve conflicts and prevent secondary impacts is by encouraging and participating very early on in regional planning exercises in the areas where they work or plan to work. These exercises, which should be led by governments, will ideally involve all relevant stakeholders. Based on the interests of the authorities, the general public and the private sector, regional plans can help establish priorities and conditions for resource development, other economic activities, community development, and biodiversity conservation.”
“A company may find significant business value in actively participating in regional planning processes, and potentially even in helping governments initiate and/or conduct such efforts. Designing a project in the context of an existing general plan for development on a regional scale will help a company ensure that its field development is managed strategically to promote sustainable development and conservation in the area and to avoid the potential for unforeseen access and immigration issues that might lead to extensive secondary impacts. It is also important to work with local government, nongovernmental organizations (NGOs), and community representatives to promote long-term sustainable economic development within new and existing communities surrounding the operation. Ensuring that new economic activity resulting from an operation will be sustainable or can be adapted for long-term viability once the operation ends can help to prevent collapse of communities or economic problems that might lead to increased pressure on, and exploitation of, natural resources.”
“The importance of government participation in stakeholder engagement, regional planning, and sustainable community development should not be underestimated. It has been shown that the more government officials are interested and involved in regional planning and engagement with stakeholders, the more likely it will be that efforts by the company and other actors to predict, prevent and mitigate secondary impacts will succeed.”
Good Practice in the Prevention and Mitigation of Primary and Secondary Biodiversity Impacts
Source: BP, No date
The entire content of the document, The Energy and Biodiversity Initiative: Good Practice in the Prevention and Mitigation of Primary and Secondary Biodiversity Impacts, is particularly significant for various levels of practitioners in undertaking measures to mitigate the impacts of oil and gas development on biodiversity. The content should be viewed in the context of the entire value chain oil and gas development and not petroleum refining per se. The content of the document could also serve as supplementary material for other related modules and lectures.
Cumulative Environmental Impacts
Introduction
There has been growing industrial development in the areas of petroleum development in Uganda during the last 10 years. The development has included considerable activity in the Albertine Graben and around the country. These activities all affect the natural environment, and the cumulative effects are a growing concern for the many organizations. Understanding and minimizing the cumulative effects is essential to making informed decisions about the management of natural and human resources within the country.
USAID/UGANDA: ENVIRONMENTAL MANAGEMENT FOR THE OIL SECTOR – TRAINING COMPENDIUM: MODULE 4 59

Types of environmental impacts in the oil and gas industry
What is environmental impact?
“Any change to the environment, whether adverse or beneficial, wholly or partially resulting from an organization's activities, products or services; any change due to a project activity that has effect on an environmental receptor which may be observed through the relevant environmental parameter/indicator” (BP, 2013).
Types of environmental impacts
According to U.S. EPA, there are three major types of environmental impacts:
• Direct impacts; • Indirect impacts; and, • Cumulative impacts/synergistic impacts, including:
− Positive and negative impacts − Random and predictable impacts − Local, regional, national, and global impacts − Short, medium, and long term impacts − Reversible and irreversible impacts − Significant and insignificant impacts
Direct impacts
These are a direct result of oil and gas projects (e.g., drilling, installation, hydro-testing, operation, and decommissioning). Indirect impacts are usually not a result of direct oil and gas projects activities but are due to complex pathways (e.g., they occur away from the original source of impact). They are also called secondary or tertiary chain or 2nd or 3rd level impacts.
Cumulative impacts
Cumulative impacts are caused by incremental changes resulting from past, present, and foreseeable future actions, including both direct and indirect impacts of a project action (that includes existing projects) on an environmental receptor such as water, soil, or air. Cumulative impacts may arise from the accumulation of similar impacts (additive), or from multiplicative or synergistic interaction with different impacts over time. Thresholds may be required to determine if the impact of an action or actions will be within acceptable limits.
1. Synergistic impact
This is a type of cumulative impact that occurs when impacts interact to produce an impact greater than the sum of individual impacts.
2. Reversible impact
Reversible or temporary impacts do not last and the affected system is naturally restored to its previous condition (e.g., an offshore seabed could recover from the effects of a localized and discontinuous seismic survey within weeks such that no change from the original condition is observable).
3. Irreversible impacts
These are permanent and the affected system is not restored to its previous state within our lifetime (e.g., drilling pad and associated facilities such as pipelines, access roads, etc.) may cause permanent impacts on wetlands (US Army Corps of Engineers, 2005).
USAID/UGANDA: ENVIRONMENTAL MANAGEMENT FOR THE OIL SECTOR – TRAINING COMPENDIUM: MODULE 4 60

Why care about cumulative effects?
Source: Renewable Resources and Environment, 2007
“Activities such as logging, oil and natural gas development, commercial fishing, mining, hunting, recreation and human settlement all contribute to cumulative effects. Since the early 1990s, there has been considerable growth in some of these activities in the Northwest Territories in Europe. Understanding the cumulative effects of such activities are important for making informed decisions in managing land, water, and other natural resources.”
Are cumulative effects always harmful?
Source: Renewable Resources and Environment, 2007
“No. Cumulative effects can be positive or negative. It is often easy to think of how industrial development harms the environment, but human activities can also produce benefits. For instance, since the establishment of the diamond mines, more residents are finishing and earning higher salaries. There are many people, individuals, groups, businesses, and industries working to find ways to allow development to happen in a way that does not permanently harm the environment.”
How do cumulative effects work?
Source: Renewable Resources and Environment, 2007
“No one activity causes cumulative effects. Cumulative effects are caused by the addition or accumulation of impacts from different activities over time. One impact by itself may not be a cause for concern; it might even seem insignificant. However, the addition of many small impacts over time contributes to cumulative effects and an increase for concern.”
Can all cumulative effects be predicted?
Source: Renewable Resources and Environment, 2007
“Understanding and predicting cumulative effects is a challenging science. By collecting information over long periods of time, we can learn how certain types of activities contribute to cumulative effects. In addition, natural changes occur all the time that must be considered when considering what further impact a human activity will have.”
Socioeconomic impacts
The most significant social change that an oil operation presents in a remote area is hundreds of oil workers and contractors. Contact between oil workers and local people can significantly affect traditional social structures. This impact will differ depending on the sensitivities and perspectives of various social groups and their degree of previous contact. While all groups face health and economic threats, less integrated indigenous groups are at much greater risk of cultural displacement and marginalization than other local residents who have already felt the larger consequences of cultural change and have abandoned their traditional lands and practices.
Socioeconomic, psychological and community impacts
• Resettlement of indigenous people. • Compensation for resource uptake. • Use of natural resources and wealth redistribution. • Changes from traditional lifestyles (e.g., the Nenets of Northern Russia; the peoples of the Niger
Delta; the Inupiat Eskimos of Point Hope, Alaska), which affects community cohesion attitudes and behavior.
• Health: spread of new diseases to indigenous communities and impacts on health of operations personnel.
• Impact of local diseases on workers and the spread of STDs and pandemics such as HIV.
USAID/UGANDA: ENVIRONMENTAL MANAGEMENT FOR THE OIL SECTOR – TRAINING COMPENDIUM: MODULE 4 61

• Social infrastructure: adequacy of health care and education facilities, transport and roads, and power supply.
• Fresh water supply to support project activities, personnel and the community. • Resources: land-taking for facilities and resettlement, new or increased access to rural or
remote areas, use of natural resources. • Psychological and community aspects: changes from traditional lifestyles, community cohesion,
attitudes and behavior, and community perception of risk. • Cultural property: sites and structures with archaeological, historical, religious, cultural, or
aesthetic values that may be changed or have their access limited. • Social equity: identifying who gains and who loses because of the project or operation has
potential to alter traditional balances of power and established community hierarchies. Communities can rapidly lose their ability to sustain their nomadic lifestyles and traditional methods of subsistence economy and face increased dependence on outside aid. Even after only sporadic contact with oil workers, colonists, or Western goods, indigenous people have historically been disinclined to return to their traditional social strategies.
• Access to new areas: building roads or pipelines into areas that have previously been inaccessible for development can facilitate access for settlement, logging, and hunting, increasing pressures on natural resources.
Socioeconomic, economy and labor impacts
Source: Alaska Department of Natural Resources, 2014
• From an economic perspective, activities of the petroleum industry, taxes, and royalties determine derivation formula for indigenous supply chain opportunities.
• Employment and labor issues: Shift from traditional industries to oil and gas, and vice versa at the termination of oil and gas projects.
• Indigenous people may be forced to leave traditional occupations to make way for the oil and gas activities, a situation that may jeopardize community livelihoods.
Employment
Source: Alaska Department of Natural Resources, 2014
• Oil and gas jobs in active areas include maintenance, inspection, and other activities related to oil and gas exploration and production. Residents of the license area would likely benefit through increased job opportunities in the oil and gas industry.
• The exploration license may create additional employment opportunities in the service, transportation, utilities, and retail sectors of the local economy. Short-term job opportunities could arise during the exploration phase. The long-term employment benefits near the license area will depend on the subsequent production of commercial quantities of oil or gas.
• The local labor force may not meet demands for some technical positions. These jobs may be filled by workers from the service support industry active in other regions of the state or outside Uganda.
Access and land use
Source: Alaska Department of Natural Resources, 2014
“Communities and surface estate owners in the area adjacent to exploration activities could be affected by oil and gas exploration. Use of transportation systems could increase, such as air charter services, airstrips, or roads, for transportation of personnel or construction equipment. Roads could be constructed to provide access to more remote areas. Other effects include disturbance due to increased air traffic, machinery noise, and loss of privacy due to project workers. The extent of these effects depends on the size of the exploration projects and the proximity of facilities, and utility, pipeline, and transportation corridors to the affected community. Some portions of the area
USAID/UGANDA: ENVIRONMENTAL MANAGEMENT FOR THE OIL SECTOR – TRAINING COMPENDIUM: MODULE 4 62

could be developed from existing roads or access routes; however, much of the acreage is remote from existing infrastructure. Some use of existing roads and trails may occur during exploration license activities. It is likely that an increase in vessel traffic and mooring activity because of any exploration work in the license area could affect the economy (Klouda, 2012; Armstrong, 2013; Homer, 2013)”.
Immigration
Source: Alaska Department of Natural Resources, 2014
Immigration/new settlements: A high demand for labor, the prospect of new economic opportunities, and new infrastructure often lead to a significant population increase surrounding an oil or gas operation. This will increase the pressure on land, water, wildlife, and other natural resources, and the new settlements may remain after oil or gas extraction has ceased.
The spread of diseases to which indigenous people have no immunity, disruption of traditional hierarchies and social structures, and an increasing dependence on outside aid can destroy long-established and healthy societies. Even in towns and communities already integrated into the local economy, traditional lands and production systems can be deeply affected by an oil operation. Social issues are often beyond the expertise and experience of project developers, who are usually trained as engineers or environmental managers. Gradual changes may have an accumulating effect, which can ultimately be harmful. The people best equipped to discover these subtle potential changes are often the holders of traditional knowledge of the area. When traditional knowledge is used in its original context, and in partnership with other knowledge systems, the combination is often a powerful tool.
What happens to wildlife and the land?
Source: Pembina, 2006
“With more roads, seismic lines and cleared areas, more people can access the land for work and recreation. Areas once too difficult to travel through become accessible by snowmobile, quads, and trucks. This new access means possible collisions with wildlife and an increase in hunting and fishing. Some studies estimate that poachers kill as many fish and wildlife as are taken legally. There is general concern in Canada that unlimited access to recreational fisheries could cause the collapse of some populations. Impacts on wildlife range from loss of habitat to poisoning to a reduction in herd size and home range. Species in decline because of industrial development in Alberta include caribou, lynx, martin, fisher, wolverine, and various bird species.”
The Legacy of Waste
Source: Pembina, 2006
“Cumulative effects are not limited to active operations but also include what is left behind. First Nations in north-eastern British Columbia estimate over 1,800 sites on their territory have not been rehabilitated after oil and gas activity and that 90 percent of these sites remain contaminated and badly in need of cleanup. In Alberta, there are hundreds of abandoned well sites called “orphan wells” that no company is legally responsible to clean up and rehabilitate.”
Land-Based Seismic Surveys
Source: Alaska Department of Natural Resources, 2014
“Clearing operations to prepare seismic lines and explosions that occur during seismic surveys may disturb wildlife. Birds and wildlife are particularly sensitive during nesting and calving periods (Schneider 2002). Repeated disturbances can result in increased movement rates of wildlife and subsequent significant energy losses, which can be particularly problematic during winter when food supplies may be scarce (Schneider, 2002).”
USAID/UGANDA: ENVIRONMENTAL MANAGEMENT FOR THE OIL SECTOR – TRAINING COMPENDIUM: MODULE 4 63

Habitat Fragmentation
Source: Alaska Department of Natural Resources, 2014
“Habitat fragmentation may occur, which may affect biological diversity (Spellerberg and Morrison 1998). Direct loss of habitat, degradation of habitat quality, degradation of water quality, habitat fragmentation, and reduced access to vital wildlife habitats may result with the building and maintenance of roads, trails, highways, and railways. Fish and wildlife may avoid these areas. Fish and wildlife may experience increased exploitation by humans, the splitting and isolation of populations, and disruption in their social structure and the processes that maintain regional populations (ADF&G 2006). Invasive species may also displace native species as roads can act as travel conduits (ADF&G 2006).”
Alteration of the Land Surface
Source: Alaska Department of Natural Resources, 2014
“Land surface disturbances may change and destroy vegetation and alter soil characteristics.”
“Types of land surface disturbances may include vegetation clearing slash disposal, altered soil characteristics, hydraulic erosion, altered surface hydrology, above-ground obstructions and filled areas (Hanley et al.,1983). Construction activities relating to petroleum extraction can cause impacts from off-road transportation; road, pad and airstrip construction; pile foundations; below-ground pipelines; and terrain disturbance (Hanley et al., 1981). Some effects of constructing production pads, roads, and pipelines may include direct loss of habitat acreage due to gravel in-filling and loss of dry tundra habitat due to entrainment and diversion of water. Construction of roads and gravel pads can interrupt surface water sheet flow and stream flows (NRC, 2003).”
“A secondary effect of construction activities includes dust deposition, which may reduce photosynthesis and plant growth (McKendrick, 2000). The effects upon the ecosystems affected by roads include potential chemical input from roads to water bodies and to the airshed and bioaccumulation in soils. Roads can affect fluvial dynamics, sediment transport and floodplain ecology. When roads alter habitats, plant species can be changed or removed, and non-native plants can be introduced. Additional wildlife habitat impacts from roads can change the density, composition of animal species and populations (NRC 2003)Road construction, vehicular passage, and oil spills can alter surface albedo (reflectivity of sunlight off the Earth’s surface) or water drainage patterns, resulting in thaw and subsidence or inundation. Such changes can affect regeneration and vegetation of certain plant species, and species composition may change after disturbance from construction activities (Linkins et al., 1984).”
Impacts to Surface Water
Source: Stevens, 2014
“Unconventional Oil and Gas development brings many socioeconomic benefits such as job creation, royalty payments, and changes in property values; however, it can also pose significant and costly environmental and public health risks associated with water contamination, water overuse, and gas emissions. Specifically, contamination of underground sources of drinking water and surface water resulting from spills, faulty well construction, or by other means; adverse impacts from discharges into surface waters or from disposal into underground injection wells; stress on surface water and groundwater supplies from the withdrawal of large volumes of water used in drilling and hydraulic fracturing; and air pollution resulting from the release of VOCs, hazardous air pollutants, and greenhouse gases.”
Groundwater Effects
Source: Alaska Department of Natural Resources, 2014
“Oil and gas activities may have effects on groundwater in the license area. Water use from groundwater wells may be required for the construction and maintenance of ice roads and pads, for
USAID/UGANDA: ENVIRONMENTAL MANAGEMENT FOR THE OIL SECTOR – TRAINING COMPENDIUM: MODULE 4 64

blending drilling muds in drilling activities, and for potable and domestic water uses at drilling camps (NRC, 2003, Van Dyke, 1997). Industrial use of groundwater could draw down the elevation of the water table near the industrial well or wells and could affect nearby domestic well water depths. These effects are usually insignificant and temporary as other hydraulically connected groundwater sources replace pumped volume.”
Gas Blowouts
Source: Alaska Department of Natural Resources, 2014
“During drilling, shallow gas pockets of natural gas may be encountered. Gas can be trapped in soils, water, and ice in permafrost environments. Sediments in which gas has accumulated are potential hazards for drilling that penetrates them (Hyndman and Dallimore, 2001). Explosions and resultant fires may occur during a natural gas blowout. Gas vapors from an explosion are lighter than air and may migrate downwind where they are readily dispersed. Blowouts occur only if hydrogen sulfide is present and can cause a toxic cloud to accumulate at shallow depths. Condensates, a low-density mixture of hydrocarbon liquids present in raw natural gas, which did not burn in the blowout would be hazardous to any organisms exposed to high concentrations (Kraus, 2011).”
Hazardous Spills
Source: Alaska Department of Natural Resources, 2014
“Hazardous spills can have toxic effects on vegetation, soil, wildlife, birds, and fish. Effects of spills depend on time of year, vegetation, and terrain. Oil spilled on the tundra would migrate both horizontally and vertically, depending characteristics of the soil, such as porosity, permeability, and texture.”
“Water saturation and organic matter content would affect substance movement (Jorgenson and Cater, 1996). If oil penetrates the soil layers and remains in the plant root zone, longer-term effects, such as mortality or reduced regeneration, would occur in following seasons (Linkins et al., 1984). Hydrogen degrading bacteria and fungi can act as decomposers of organic material, and under the right conditions can assist in the breakdown of hydrocarbons in soils. Natural or induced bioremediation using microorganisms can also occur (Linkins et al,. 1984; Jorgenson and Cater 1996). Natural recovery in wet habitats may occur in time durations of 10 years or less, if aided by cleanup activities and additions of fertilizer (McKendrick, 2000).”
“The long-term effects of oil may persist in the sediments for many years. Shifting population structure, species abundance, diversity, and distribution can be long-term effects, especially in areas sheltered from weathering processes (USFWS, 2004). Oil leaks or spills in forests can have a range of potential effects, including killing plants directly, slowing growth of plants, inhibiting seed germination, and creating conditions in which plants cannot receive adequate nutrition. Although a single addition of petroleum hydrocarbons does not appear to limit microbial communities in the long-term, species richness often decreases (Robertson et al., 2007).”
Releases of Drilling Muds, spills and Produced Water
Source: Alaska Department of Natural Resources, 2014
“Common drilling fluids contain water, clay, and chemical foam polymers. Drilling additives may include petroleum or other organic compounds to modify fluid characteristics during drilling. The down-hole injection of drilling muds and cuttings are unimportant if they are not placed into a subsurface drinking water aquifer (NRC, 2003). Waters and drilling muds produced and discharged during oil and gas production activities may contain toxic levels of heavy metals, radioactive particles, and brine and persist for longer periods of time.”
USAID/UGANDA: ENVIRONMENTAL MANAGEMENT FOR THE OIL SECTOR – TRAINING COMPENDIUM: MODULE 4 65

FIGURE 1.16: OIL SPILLS IN GULF OF MEXICO FROM 1942-2005
Source: http://thes.files.wordpress.com/2010/06/gulfmap1.jpg
“When these production waters are discharged to land, they can be more devastating to plants and animals than crude oil. Where they are discharged into marine waters, the toxic components are distributed differently than oil, which floats to the surface (LaRoche and Associates, 2011). They may have acute effects on the sea floor flora and fauna, reducing both their abundance and diversity in the immediate area of discharge (Arctic Council, 2009). The technique of injecting mud and cutting disposal has greatly reduced the potential adverse impacts caused by releases of drilling muds and reserve pit materials (NRC, 2003).”
Potential Activities and Cumulative Effects
Air Quality
Source: Alaska Department of Natural Resources, 2014
“Oil and gas activities may produce emissions that have the potential to affect air quality. Gases may be emitted to the air from power generation, flaring, venting, well testing, leakage of volatile petroleum components, supply activities, shuttle transportation boilers, diesel engines, drilling equipment, flares, glycol dehydrators, natural gas engines and turbines, and fugitive emissions, which are leaks from sealed surfaces associated with process equipment (BOEMRE, 2011, Arctic Council, 2009). On-road and off-road vehicles, heavy construction equipment, and Earth-moving equipment could produce emissions from engine exhaust and dust. Sources of air emissions during drilling operations include rig engines, camp generator engines, steam generators, waste oil burners, hot-air heaters, incinerators, and well test flaring equipment. Emissions could be generated during installation of pipelines and utility lines, excavation and transportation of gravel, mobilization and demobilization of drill rigs, and during construction of gravel pads, roads, and support facilities. Emissions could also be produced by engines, turbines, and heaters used for oil/gas production, processing, and transport. In addition, aircraft, supply boats, personnel carriers, mobile support modules, as well as intermittent operations such as mud degassing and well testing, could produce emissions (BOEMRE, 2011).”
USAID/UGANDA: ENVIRONMENTAL MANAGEMENT FOR THE OIL SECTOR – TRAINING COMPENDIUM: MODULE 4 66

Sport and Commercial Fishing and Sport Hunting
Source: Alaska Department of Natural Resources, 2014
“Besides subsistence, other important uses of fish and wildlife populations in and around the license area include sport and commercial fishing; and sport hunting. Effects from oil and gas development on fish, wildlife, and their habitats could affect recreation and tourism. Oil and gas activities could decrease an area’s visual quality and attraction to tourists. Excess turbidity and sedimentation in an area’s waters can decrease recreation value and fish stocks (USGS, 2014).”
Historic and Cultural Resources
Source: Alaska Department of Natural Resources, 2014
“The license area has documented occurrences of historical and cultural resources. The potential impacts to these resources may be from accidental oil spills, erosion, and vandalism (Dekin et al., 1993). Impacts and disturbances to historic and cultural resources could be associated with installation and operation of oil and gas facilities, including drill pads, roads, airstrips, pipelines, processing facilities, and any other ground disturbing activities. Damage to archaeological sites may include: direct breakage of cultural objects; damage to vegetation and the thermal regime leading to erosion and deterioration of organic sites; shifting or mixing of components in sites resulting in loss of association between objects’ and damage or destruction of archaeological or historic sites by oil spill cleanup crews collecting artifacts (BLM, 2007; USFWS, 1986).”
Cumulative Aesthetic, Cultural, and Spiritual Consequences
Source: Alaska Department of Natural Resources, 2014
“Many activities associated with oil development have compromised wild land and scenic values over large areas. Some Alaska Natives told the committee they violate what they call “the spirit of the land,” a value central to their relationship with the environment. These consequences have increased in proportion to the area affected by development, and they will persist as long as the landscape remains altered.”
Managing Cumulative Effects
“Understanding and minimizing cumulative effects is an important part of the overall environmental management and stewardship of lands and resources. Good environmental management requires putting together all the pieces of an environmental stewardship framework. Each piece provides information that helps regulators and land managers make good decisions about sustainable development” (Alaska Department of Natural Resources, 2014).
Cumulative effects assessments should be done before development occurs. These assessments help communities weigh the cost and benefits of development. Scientific and traditional ecological knowledge should be used to determine should determine how much development an ecosystem can sustain. Monitoring programs are critical to understand the changes on the land resulting from development.
“Prior identification of sensitive areas can support the construction of infrastructure away from sensitive habitats. A study of the impacts to habitats from constructing the Trans-Alaska Pipeline System found that the greatest percentage loss of habitat was from gravel material sites used for construction materials, with the work pad areas and road construction causing the next greatest habitat loss percentages (Pamplin, 1979)” (Alaska Department of Natural Resources, 2014).
“Cumulative effects management involves looking at impacts from the past and present, predicting what impacts may occur from planned future activities, and deciding how to best deal with the negative effects” (Renewable Resources and Environment, 2007).
USAID/UGANDA: ENVIRONMENTAL MANAGEMENT FOR THE OIL SECTOR – TRAINING COMPENDIUM: MODULE 4 67

REFERENCES
ADF&G (Alaska Department of Fish and Game). (2006). Our wealth maintained: A strategy for conserving Alaska's diverse wildlife and fish resources. Alaska Department of Fish and Game, Juneau. Retrieved from http://www.sf.adfg.state.ak.us/statewide/ngplan/files/cover_and_acknowl.pdf
Advameg, Inc. (2017). Pollution Issues. Retrieved from http://www.pollutionissues.com/NaPh/Petroleum.html#ixzz3WLWxOVpM
Alaska Department of Natural Resources. (2014). Southwest Cook Inlet oil and gas exploration license: Written Finding of the Director. Division of Oil and Gas. Retrieved from http://dog.dnr.alaska.gov/Leasing/Documents/BIF/Exploration_Licenses/SW_CookInlet/SWCI_full_document.pdf
Allen, L., Cohen, M. J., Abelson, D., & Miller, B. (2012). Fossil fuels and water quality. In The world’s water (pp. 73-96). Island Press/Center for Resource Economics.
Arctic Council. (2009). Arctic offshore oil and gas guidelines. Protection of the Arctic MarineEnvironment Working Group. Borgir, Nordurslod, Iceland.
Arctic Response Technology. (2014). Environmental Impacts of Arctic Oil Spills and Arctic Spill Response Technologies. Retrieved from http://neba.arcticresponsetechnology.org/assets/files/Environmental%20Impacts%20of%20Arctic%20Oil%20Spills%20-%20report.pdf
Armstrong, M. (2013). Two Cook Inlet drilling rigs parked in English Bay instead of Homer Dock. Alaska Dispatch. Retrieved from http://www.alaskadispatch.com/article/20131012/two-cook-inlet-drilling-rigs-parked-english-bay-instead-homer-dock
Baker, J. P., & Schofield, C. L. (1982). Aluminum toxicity to fish in acidic waters. In Long-Range Transport of Airborne Pollutants (pp. 289-309). Springer Netherlands.
Baker JP, Baker,Van Sickle J, Gagen CJ, Dewalle DR, Sharpe WE, Carline RF, Baldigo BP, Murdoch PS,
Bath DW, Kretser WA, Simonin HA,Wigington PJ Jr. (1996). Episodic acidification of small streams in the northeastern United States: effects on fish populations. Ecological Applications 6: 422-437.
Barclays Bank PLC. (2015). Environmental and Social Risk Briefing Oil and Gas. Retrieved from https://www.home.barclays/content/dam/barclayspublic/docs/Citizenship/oil-and-gas-guidance-note.pdf
BLM (Bureau of Land Management). (2007). Bay proposed resource management plan. Final environmental impact statement. December 2007. Retrieved from http://www.blm.gov/ak/st/en/prog/planning/Bay_Plan/bay_feis_documents.html
BOEMRE (Bureau of Ocean Energy Management Regulation and Enforcement). (2011). Chukchi Sea planning area oil and gas lease sale 193 final supplemental EIS. Volume I. Alaska OCS Region. Retrieved from http://www.boem.gov/About-BOEM/BOEM-Regions/Alaska-Region/Environment/Environmental-Analysis/OCS-EIS/EA-BOEMRE-2011-041.aspx
BP. (No date) The Energy and Biodiversity Initiative. Retrieved from Negative Secondary Impacts from Oil and Gas Development. Retrieved from http://www.theebi.org/pdfs/impacts.pdf
BP. (2013). SCP Expansion Project, Azerbaijan Environmental and Social Impact Assessment FinaL. Retrieved from http://www.bp.com/content/dam/bp-country/en_az/pdf/ESIAs/SCPXESIA/Approach_and_Methodology.pdf
USAID/UGANDA: ENVIRONMENTAL MANAGEMENT FOR THE OIL SECTOR – TRAINING COMPENDIUM: MODULE 4 68

Boyd, J. N., Scholz, D., & Walker, A. H. (2001). Effects of oil and chemically dispersed oil in the environment. In International Oil Spill Conference (Vol. 2001, No. 2, pp. 1213-1216). American Petroleum Institute.
Canadian Association of Petroleum Producers. (No date). Canada’s offshore oil and gas industry: best practices in marine environments. Retrieved from http://www.capp.ca/~/media/capp/customer-portal/documents/290254.pdf?la=en
The Canadian Press. (2012). Another major pipeline spill in Alberta as 93,000 gallons of oil flow into red deer river system. Retrieved from https://dgrnewsservice.org/civilization/ecocide/toxification/another-major-pipeline-spill-in-alberta-as-93000-gallons-of-oil-flow-into-red-deer-river-system/
Canadian Association of Petroleum Producers. (No date). Canada’s offshore oil and gas industry: best practices in marine environments. Retrieved from http://www.capp.ca/~/media/capp/customer-portal/documents/290254.pdf?la=en
Cavaseno, V. & the Staff of Chemical Engineering (1980): Industrial wastewater and solid waste Engineering. McGraw-Hill Publication Co., New York.
Chiasson, P. (2013). Canadian runaway oil train disaster blamed on ‘weak safety culture,’ poor oversight. Retrieved from https://www.washingtonpost.com/world/the_americas/canadian-runaway-train-disaster-blamed-on-weak-safety-culture-poor-oversight/2014/08/19/8ac42280-27b5-11e4-8593-da634b334390_story.html?utm_term=.4492d439ea7d
De-Bruin, (1976): A bacterial bioassay for assessment of waste-water toxicity. In: Kenneth, J. (ed.): Mechanism of toxicity for various compounds. Wat-Res. G. Britain, pp. 383–390.
Dekin, A. A., M. S. Cassell, J. I. Ebert, E. Camilli, J. M. Kerley, M. R. Yarborough, P. A. Stahl and B.L. Turcy. (1993). Exxon Valdez oil spill archaeological damage assessment: Final Report, Contract 53-0109-00325.
Department of the Environment. (1995). Oil Refineries and Bulk Storage of Crude Oil and Petroleum Products. Government of the United Kingdom. Retrieved from http://enfo.agt.bme.hu/drupal/sites/default/files/Oil%20refineries.pdf
E&P Forum/UNEP. (1997). Environmental management in oil and gas exploration and production. Retrieved from http://www.programmeofficers.co.uk/Cuadrilla/CoreDocuments/CD15/CD15.3.PDF
EarthWorks. (No date). Air contaminants. Retrieved from https://www.earthworksaction.org/issues/detail/air_contaminants#.WUBx9mjyuyI
The Empire State Energy Association. (2017).Consumers > Petroleum Story: From Well To End User. Retrieved from http://www.eseany.org/consumers_petroleumstory.php
Epstein P.R., Ford T.E., Colwell R.R., (1993). Marine ecosystems. Lancet 342:1216-1219.
Epstein, P. R., Selber, J., Borasin, S., Foster, S., Jobarteh, K., Link, N., ... & Sodha, S. (2002). A life cycle analysis of its health and environmental impacts. The Center for Health and the Global Environment. Harvard Medial School. EUA.
European Bank for Reconstruction and Development. (No date). Summary of Environment and Social Impacts for Activates Associated with Petroleum Refining and the Storage of Petroleum Products. Retrieved from http://www.ebrd.com/downloads/policies/environmental/chemical/petroleum-refineries.pdf
USAID/UGANDA: ENVIRONMENTAL MANAGEMENT FOR THE OIL SECTOR – TRAINING COMPENDIUM: MODULE 4 69

Gleick, P. H. (2014). The world's water volume 8: The biennial report on freshwater resources (Vol. 8). Island Press.
Hanley, P. T., J. E. Hemming, J. W. Morsell, T. A. Morehouse, L. E. Leask and G. Harrison. (1981). Natural resource protection and petroleum development in Alaska. U.S. Fish and Wildlife Service Office of Biological Services, Department of the Interior.
Hanley, P. T., J. E. Hemming, J. W. Morsell, T. A. Morehouse, L. E. Leask and G. Harrison. (1983). A handbook for management of oil and gas activities on lands in Alaska: Petroleum industry practices environmental impacts and stipulations. U.S. Fish and Wildlife Service Office of Biological Services, Department of the Interior.
Homer (City of Homer). (2013). City of Homer Resolution 12-118 Welcoming Oil and Gas Drilling Rigs and Support Vessels Operated by Buccaneer Energy or other companies to Homer Port. Retrieved from http://www.cityofhomer-ak.gov/resolution/resolution-13-118-welcoming-oil-and-gas-drillin g-rigs-and-support-vessels-operated-buccan
Hyland, J. L., & Schneider, E. D. (1979). Petroleum hydrocarbons and their effects on marine organisms, populations, communities, and ecosystems. Environmental Protection Agency, Environmental Research Laboratory.
Hyndman, R.D., and Dallimore, S.R., (2001). Natural Gas Hydrate Studies in Canada, Canadian Society of Exploration Geophysicists, Recorder, 26, 11-20, 2001.
IFC. (2007). Environmental, Health, and Safety Guidelines for Petroleum Refining. Retrieved from http://www.ifc.org/wps/wcm/connect/f73fca004e7bd2ce97b1bffce4951bf6/2013+Working+Doc_Petroleum+Refining.pdf?MOD=AJPERES
IPIECA. (1991). Guidelines on biological impacts of oil pollution. IPIECA Report Series 1. Retrieved from http://www.commissionoceanindien.org/fileadmin/resources/Autoroute%20maritime%20IPIECA/IPIECA%20Guidelines%20on%20biological%20impacts%20of%20oil%20pollution%20Vol%201%20IPIECA.pdf
IPIECA. (2000). Choosing spill response options to minimize damage: Net environmental benefit analysis. IPIECA Report Series 10. Retrieved from https://crrc.unh.edu/sites/crrc.unh.edu/files/ipieca_vol10_neba_1.pdf
IPIECA. (2012). Refinery air emissions management: Guidance document for the oil and gas industry. Operations good practice series 2012. Retrieved from http://www.ipieca.org/resources/good-practice/refinery-air-emissions-management/
IPIECA. (2014). Petroleum refinery waste management and minimization. Operations good practice series.
Ionian Refining and Trading Company. (2016). Products. Retrieved from http://ionianrefining.com/products/
Johnson, L. (2014). Florida’s Valuable Water Resources and the Importance of Irrigation Efficiency. Retrieved from http://jackson.ifas.ufl.edu/newsletters/2014/11/10/floridas-valuable-water-resources-and-the-importance-of-irrigation-efficiency/
Jorgenson, M. T. and T. C. Cater. (1996). Minimizing ecological damage during cleanup of terrestrial and wetland oil spills. Pages 257-293 [In] P.N. Cheremisinoff, editor. Storage tanks: advances in environmental control technology series. Gulf Publishing Co., Houston, TX.
USAID/UGANDA: ENVIRONMENTAL MANAGEMENT FOR THE OIL SECTOR – TRAINING COMPENDIUM: MODULE 4 70

Keim, B. (2011). June 3, 1979: The first great gulf oil disaster. Retrieved from https://www.wired.com/2011/06/0603itxtoc-oil-blowout-gulf-of-mexico/
Kharaka, Yousif K and. Otton, James K. (2003). Environmental Impacts of Petroleum Production: Initial Results from the Osage-Skiatook Petroleum Environmental Research Sites, Osage County, Oklahoma.
Kious, W. J., & Tilling, R. I. (1996). This dynamic Earth: the story of plate tectonics. DIANE Publishing.
Klouda, N. (2012). Tiff over offshore drilling rig in Homer takes another strange twist. Alaska Dispatch. Retrieved from http://www.alaskadispatch.com/article/tiff-over-offshore-drilling-rig-homer-takes-takes-another-strange-twist
Kraus, R. S. (2011). Exploration, Drilling and Production of Oil and Natural Gas. Encyclopedia of Occupational Health and Safety, Jeanne Mager Stellman, Editor in Chief. International Labor Organization, Geneva.
LaRoche and Associates. (2011). Lake and Peninsula Borough Coastal Management Program: Revised public hearing draft, March 2011. Department of Commerce Lake and Peninsula Borough Planning Commission, ADNR Division of Coastal and Ocean Management. Retrieved from http://alaskacoast.state.ak.us/District/DistrictPlans_Final/LakeandPen/revised_phd/vol1_rphd.pdf
Linkins, A. E., L. A. Johnson, K. R. Everett and R. M. Atlas. (1984). Oil spills: Damage and recovery in tundra and taiga. Pages 135-155 [In] J. Carins, Jr. and A. L. Buikema, Jr., editor. Restoration of habitats impacted by oil spills. Butterworth Publishers, Boston.
Mariano, J. B., & La Rovere, E. L. (2007). Environmental impacts of the oil industry. Petroleum engineering-Downstream, Encyclopedia of Life Support Systems (EOLSS). Retrieved from: http://www. eolss. net/Sample-Chapters C, 8.
McKendrick, J. D. (2000). Vegetative responses to disturbance. Pages 35-56 [In] Joe C. Truett and Stephen R. Johnson, editor. The natural history of an Arctic oil field: Development and the biota. Academic Press, San Diego, CA.
Mielke, E., Anadon, L.D., and Narayanamurti, V. (2010). Water Consumption of Energy Resource Extraction, Processing, and Conversion: A Review of the Literature for Estimates of Water Intensity of Energy-Resource Extraction, Processing to Fuels, and Conversion to Electricity. Energy Technology Innovation Policy Discussion Paper No. 2010-15. Cambridge, Massachusetts.
The Ministry of Environment and Forests. (2010). Technical EIA Guidance Manual for offshore and onshore oil and gas exploration, production, and development. Retrieved from http://envfor.nic.in/sites/default/files/TGM_Offshore%20Onshore_010910_NK.pdf
Mondal, P. (2016). Meaning, Definition and Components of Environment. Retrieved from http://www.yourarticlelibrary.com/environment/meaning-definition-and-components-of-environment/6157/
Mondal, P. (2016). Environment: 13 Most Important Components of Environment – Discussed. Retrieved from http://www.yourarticlelibrary.com/ecology/environment-13-most-important-components-of-environment-discussed/9870/
Nathanail, C. P., & Bardos, R. P. (2005). Reclamation of contaminated land. John Wiley & Sons.
NEMA. (2012). The Environmental Monitoring Plan For The Albertine Graben 2012-2017. Government of Uganda. Retrieved from http://www.nemaug.org/reports/Albertine_graben_monitoring_plan_2012_2017.pdf
USAID/UGANDA: ENVIRONMENTAL MANAGEMENT FOR THE OIL SECTOR – TRAINING COMPENDIUM: MODULE 4 71

Ng, N. (2015). Blast rips through Chinese chemical plant for second time in two years. Retrieved from http://edition.cnn.com/2015/04/07/asia/china-chemical-plant-explosion/index.html
NOAA. (2017). NOAA study shows as US drilling surged, methane emissions didn’t. Retrieved from http://research.noaa.gov/News/NewsArchive/LatestNews/TabId/684/ArtMID/1768/ArticleID/12123/NOAA-study-shows-as-US-drilling-surged-methane-emissions-didn%E2%80%99t.aspx
NRC (National Research Council). (2003). Cumulative environmental effects of oil and gas activities on Alaska's North Slope. The National Academics Press, Washington, D.C.
Oil and Gas Accountability Project. (No date). Oil and Gas at Your Door? A Landowner’s Guide to Oil and Gas Development. Second Edition. Retrieved from https://www.earthworksaction.org/files/publications/LOguide2005book.pdf
Olajire, N.N. (2014). The Petroleum Industry and Environmental Challenges. Jour Pet Environ Biotechnol 5:4.
Otokunefor, T. V., & Obiukwu, C. (2005). Impact of refinery effluent on the physicochemical properties of a water body in the Niger delta. Applied ecology and environmental research, 3(1), 61-72.
Pembina. (2006). Cumulative Effects of Oil and Gas Development. Retrieved from https://www.pembina.org/reports/bc-oilgas02.pdf
Quadrise Fuels Intl PLC. (2016). Emissions from oil refining. Retrieved from http://www.quadrisefuels.com/msar-applications/environmental-qualities
Qurban, M.M, Joydas, K.P., Manikandan, P.K., Krishnakumar, M.W. (No date). Oil-related activities and environmental concerns in the Gulf. Presentation. Retrieved from https://www.jccp.or.jp/international/conference/docs/hpe794a8_dr-mohammad-qurban-kfupm-abstract1.pdf
Renewable Resources & Environment. (2007). A Citizen's Guide to Cumulative Effects. Retrieved from https://www.aadnc-aandc.gc.ca/eng/1100100023719/1100100023763
Robertson, S. J., W. B. McGill, H. B. Massicotte and P. M. Rutherford. (2007). Petroleum hydrocarbon contamination in boreal forest soils: a mycorrhizal ecosystems perspective. Biological Reviews 82:213-240.
Rosenberg, M. (2017). The Four Spheres of the Earth. Retrieved from https://www.thoughtco.com/the-four-spheres-of-the-earth-1435323
Schindler DW, Mills KH, Malley DF, Findlay S, Shearer JA, Davies IJ,Turner MA, Lindsey GA, Cruikshank DR. (1985). Long-term ecosystem stress: effects of years of experimental acidification. Canadian Journal of Fisheries and Aquatic Science 37: 342-354.
Schneider, R. R. (2002). Alternative futures: Alberta's boreal forest at the crossroads. The Federation of Alberta Naturalists and The Alberta Centre for Boreal Research, Edmonton, Alberta.
Shayler, H., McBride, M, Harrison, E. (2009). Sources and impacts of contaminants in soils. Retrieved from http://cwmi.css.cornell.edu/sourcesandimpacts.pdf
Speight, J. (1995). Environmental Analysis and Technology for the Refining Industry. Wiley Publishers.
Spellerberg, I. F. and T. Morrison. (1998). The ecological effects of new roads-a literature review. Science for Conservation: 84, New Zealand Department of Conservation.
USAID/UGANDA: ENVIRONMENTAL MANAGEMENT FOR THE OIL SECTOR – TRAINING COMPENDIUM: MODULE 4 72

Staples, C.A., Dorn, P.B., Klecka, G.M., O’Block, S.T. & Harris, L.R. (1998): A review of the environmental fate, effects and exposures of bisphenol A. Chemosphere 36: 2149–2173.
Stevens, B. (2014). Unconventional oil and gas regulations and policy. Retrieved from http://fuelmarketernews.com/unconventional-oil-gas-regulations-policy-relating-local-environmental-impacts-climate-change/
The Swordpress. (2010). Wildlife Impacts of the Gulf Oil Disaster. Retrieved from https://thes.files.wordpress.com/2010/06/gulfmap1.jpg
Thatcher, M., Robson, M., Henriquez, L. R., Karman, C. C., & Payne, G. (1999). CHARM, Chemical Hazard Assessment and Risk Management. Userguide version, 1.
Tibbetts, P. J. C., Buchanan, I. T., Gawel, L. J., & Large, R. (1992). A comprehensive determination of produced water composition. In Produced Water (pp. 97-112). Springer US.
University of Nebraska-Lincoln. (2017). Nebraska Real-Time Groundwater Monitoring Network. Retrieved from http://snr.unl.edu/data/water/groundwater/realtime/waterdistribution.aspx
U.S. Army Corps of Engineers. (2005). Technical Standards for Water-Table Monitoring of Potential Wetland Sites.
U.S. Air Force Defense Meteorological Satellite Program. (2006). Gas Flaring Disrupts Life in Oil-Producing Niger Delta. Retrieved from http://www.npr.org/templates/story/story.php?storyId=12175714
U.S. Environmental Protection Agency (EPA). (2001). Eutrophication. Retrieved from http://www.epa.gov/maia/html/eutroph.html
U.S. EPA. (2015). Getting up to speed: groundwater contamination. Retrieved from https://www.epa.gov/sites/production/files/2015-08/documents/mgwc-gwc1.pdf
USFWS (U.S. Fish and Wildlife Service). (1986). Final report baseline study of the fish wildlife, and their habitats: Arctic National Wildlife Refuge Coastal Plain Resource Assessment, Section 1002C, Alaska National Interest Lands Conservation Act, Vol I and II.
USFWS (U.S. Fish and Wildlife Service). (2004). Effects of oil spill on wildlife and habitat, Alaska Region. Retrieved from http://okaloosa.ifas.ufl.edu/MS/OilSpillFactSheetAlaska.pdf
USGS. (2013). Cutaway diagram of Earth's internal structure with inset showing detailed breakdown of structure.
USGS (U.S. Geological Survey). (2014). The effects of urbanization on water quality: Erosion and sedimentation. Retrieved from http://ga.water.usgs.gov/edu/urbansed.html
Van Dyke, K. (1997). Fundamentals of petroleum, fourth edition. University of Texas, Petroleum Extension Service, Austin, TX.
Wokocha, G.A. (2014). Impacts of Industrial Wastes Disposal Strategies on Oil Producing Communities in Rivers State, Nigeria. Journal of Natural Sciences Research: 22 (4).
The World Bank Group. (1999). Pollution prevention and abatement handbook 1998. Retrieved from http://documents.worldbank.org/curated/en/758631468314701365/pdf/multi0page.pdf
Yoo Eun, L. (2010). South Korea: Understanding the oil spill from a painful experience. Retrieved from https://globalvoices.org/2010/06/14/south-korea-understanding-the-oil-spill-from-painful-experience/#
USAID/UGANDA: ENVIRONMENTAL MANAGEMENT FOR THE OIL SECTOR – TRAINING COMPENDIUM: MODULE 4 73

Water & Energy Conservation Systems. (2011). Hydraulic Fracturing planning in the Karoo. Retrieved from http://www.watersafe.co.za/2011/02/22/hydraulic-fracturing-planning-in-the-karoo/
USAID/UGANDA: ENVIRONMENTAL MANAGEMENT FOR THE OIL SECTOR – TRAINING COMPENDIUM: MODULE 4 74

LECTURE 2: ASSESSING AND TESTING FAUNA, FLORA, WATER, AIR, AND SOIL FOR CONTAMINATION/POLLUTION
This lecture covers the following sub-lectures:
2.1 Assessing Water, Air, and Soil Resources
2.2 Post-Mortem Protocols for Assessing and Testing Animals and Birds
2.3 Monitoring of Woody Biomass
Teaching Aims
(i) Provide participants with knowledge on obtaining information from an environment and fauna affected by oil pollution and toxicity and other hazardous waste.
(ii) Equip the participants with knowledge and skills for obtaining samples from carcasses of dead mammals and birds.
(iii) Equip participants with knowledge for packaging and shipping samples to laboratories. (iv) Equip participants with knowledge for keeping all records in a postmortem investigation. (v) Enhance awareness of participants to keeping themselves safe from contamination and possible
infection by potential disease causing agents. (vi) Introduce students to the sampling methods commonly used in monitoring of woody biomass. (vii) Equip the students with knowledge and skills so that they can carry out baseline and monitoring
surveys of woody plants.
Learning Outcomes
(i) Demonstrate knowledge of the different parameters/indicators for monitoring health and behavior for mammals and birds impacted by oil and gas.
(ii) Obtain all necessary information in investigation of morbidity and mortality of wildlife. (iii) Take suitable samples, package, label, and ship samples to appropriate laboratories. (iv) Protect themselves from contamination and/or infection by potential pathogens. (v) Describe the SOPs in monitoring animal health and behavior in oil and gas exploration and
development. (vi) Correctly plan for a baseline survey exercise for a forest/woodland ecosystem. (vii) Supervise a baseline survey for woody plants in a forest/woodland ecosystem. (viii) Use computer applications to process and interpret data collected from the baseline surveys’. (ix) Apply correct techniques in assessing plants in monitoring impacts of oil and gas on biodiversity.
USAID/UGANDA: ENVIRONMENTAL MANAGEMENT FOR THE OIL SECTOR – TRAINING COMPENDIUM: MODULE 4 75

2.1 ASSESSING WATER, AIR, AND SOIL RESOURCES
SYLLABUS
Outline of Lecture Content
Topic and Subtopic Suggested Approach, Methods and Equipment
1. Introduction This topic is contained in Module 2 in detail. Here only an overview is necessary if trainees have learned about biodiversity already. Otherwise, material from Module 2 should be brought here also and the time increased correspondingly.
2. Important considerations for design and implementation of data collection
Q&A to build on trainee experience and knowledge
3. Inter-connectedness of soil, air, and water
Lecture, Q&A
4. Soil sampling Q&A to generate class discussions on the subtopics. Use of wall charts, photographs, and handouts. Demonstration and practice of soil sampling at selected sites. Demonstration and practice of water sampling, the area for which need not be an oil site but a surrogate one can be selected around a processing factory, a motor vehicle garage, or a vehicle washing bay, etc.
5. Water sampling Q&A to generate class discussions on the subtopics. Use of wall charts, photographs, and handouts. Demonstration and practice of water sampling at selected water points, the area for which need not be an oil site but a surrogate one can be selected around a processing factory, a motor vehicle garage, or a vehicle washing bay, etc.
6. Air resources
DETAILED NOTES
Introduction
What Is Biodiversity?
“The variety of life on Earth, its biological diversity is commonly referred to as biodiversity. The number of species of plants, animals, and microorganisms, the enormous diversity of genes in these species, the different ecosystems on the planet, such as deserts, rainforests, and coral reefs are all part of a biologically diverse Earth. Conservation and sustainable development strategies attempt to recognize this as being integral to any approach to preserving biodiversity. Almost all cultures have their roots in our biological diversity in some way or form. Declining biodiversity is therefore a concern for many reasons” (Shah, 2014).
Why Is Biodiversity Important?
Source: Shah, 2014
Biodiversity provides several natural services for everyone, including:
• “Ecosystem services
USAID/UGANDA: ENVIRONMENTAL MANAGEMENT FOR THE OIL SECTOR – TRAINING COMPENDIUM: MODULE 4 76

− Protection of water resources − Soils formation and protection − Nutrient storage and recycling − Pollution breakdown and absorption − Contribution to climate stability − Maintenance of ecosystems − Recovery from unpredictable events”
• “Biological resources
− Food − Medicinal resources and pharmaceutical drugs − Wood products − Ornamental plants − Breeding stocks, population reservoirs − Future resources − Diversity in genes, species and ecosystems”
• “Social benefits
− Research, education and monitoring − Recreation and tourism − Cultural values”
Biodiversity provides a number of critical services for no cost. The cost of replacing these services would be expensive. Biodiversity conservation is necessary for the implementation of sustainable development that is economically sound.
Three Levels of Biodiversity
Source: Bernhardt, No date
“Researchers generally accept three levels of biodiversity: genetic, species, and ecosystem. These levels are all interrelated yet distinct enough that they can be studied as three separate components. Most studies, either theoretical or experimental, focus on the species level, as it is the easiest to work on both conceptually and in practice. The following parts will cover all levels of diversity, though examples will generally use the species level.”
Genetic Diversity
Source: Bernhardt, No date
“Genetic diversity is the variety present at the level of genes. Genes, made of DNA, are the building blocks that determine how an organism will develop and what its traits and abilities will be. This level of diversity can differ by alleles (different variants of the same gene, such as blue or brown eyes), by entire genes (which determine traits, such as the ability to metabolize a particular substance), or by units larger than genes such as chromosomal structure. Genetic diversity can be measured at many different levels, including population, species, community, and biome. Which level is used depends upon what is being examined and why, but genetic diversity is important at each of these levels.”
“The amount of diversity at the genetic level is important because it represents the raw material for evolution and adaptation. More genetic diversity in a species or population means a greater ability for some of the individuals in it to adapt to changes in the environment. Less diversity leads to uniformity, which is a problem in the long-term, as it is unlikely that any individual in the population would be able to adapt to changing conditions. As an example, modern agricultural practices use monocultures, which are large cultures of genetically identical plants. This is an advantage when it comes to growing and harvesting crops, but can be a problem when a disease or parasite attacks the
USAID/UGANDA: ENVIRONMENTAL MANAGEMENT FOR THE OIL SECTOR – TRAINING COMPENDIUM: MODULE 4 77

field, as every plant in the field will be susceptible. Monocultures are also unable to deal well with changing conditions.”
“Within species, genetic diversity often increases with environmental variability, which can be expected. If the environment often changes, different genes will have an advantage at different times or places. In this situation, genetic diversity remains high because many genes are in the population at any given time. If the environment did not change, then the small number of genes that had an advantage in that unchanging environment would spread at the cost of the others, causing a drop in genetic diversity.”
“In communities, it can increase with the diversity of species. How much it increases depends on not only the number of species, but also on how closely related the species are. Species that are closely related (e.g., two species of maple) have similar genetic structures and makeup and therefore do not contribute much additional genetic diversity. These closely related species will contribute to genetic diversity in the community less than more remotely related species (e.g., a maple and a pine) would.”
“An increase in species diversity can also affect the genetic diversity, and do so differently at different levels. If there are many species, the genetic diversity at that level will be larger than when there are fewer species. On the other hand, genetic diversity within each species can decrease. This can happen if the large number of species means so much competition that each species must be extremely specialized, such as only eating a single type of food. If they are so specialized, this specialization will lead to little genetic diversity within any of the species.”
Species Diversity
Source: Bernhardt, No date
“Biodiversity studies typically focus on species. They do so not because species diversity is more important than the other two types, but because species diversity is easier to work with. Species are relatively easy to identify by eye in the field, whereas genetic diversity requires laboratories, time, and resources to identify and ecosystem diversity (see below) needs many complex measurements to be taken over a long period of time. Species are also easier to conceptualize and have been the basis of much of the evolutionary and ecological research that biodiversity draws on.”
“Species are well known and are distinct units of diversity. Each species can be considered to have a particular "role" in the ecosystem, so the addition or loss of single species may have consequences for the system as a whole. Conservation efforts often begin with the recognition that a species is endangered in some way, and a change in the number of species in an ecosystem is a readily obtainable and easily comprehensible measure of how healthy the ecosystem is.”
Ecosystem Diversity
Source: The State of Queensland, 2002
“Ecosystems are the combination of communities of living things with the physical environment in which they live. There are many different kinds of ecosystems, from deserts to mountain slopes, the ocean floor to the Antarctic, with coral reefs and rainforests being among the richest of these systems.”
“Each ecosystem provides many different kinds of habitats or living places. The living things and the non-living environment (Earth forms, soil, rocks, and water) interact constantly and in complex ways that change over time, with no two ecosystems being the same.”
“Although ecosystems are ever-changing and complex, some universal principles apply. One of these is that matter constantly cycles and recycles. Another principle is that energy moves through the cycle, being used, absorbed, and stored. For example, forests act as filters for air, absorbing carbon dioxide and releasing oxygen. Seas are the great stabilizers of climates, with warm currents moderating temperatures on the land masses they pass. Mangroves and seagrass beds are the nurseries for marine creatures. While the sun is a constant source of Earth's energy, energy is also
USAID/UGANDA: ENVIRONMENTAL MANAGEMENT FOR THE OIL SECTOR – TRAINING COMPENDIUM: MODULE 4 78

available from geothermal processes. Therefore, while each ecosystem generates its own relationships, the Earth's environments are interrelated — they all rely on the sun and the Earth's oxygen and water to survive.”
“You can begin to appreciate how the elements in each ecosystem are connected to each other and the diversity that exists among Earth's ecosystems. Maintaining this ecological diversity is important for the health of the planet.”
What Threatens Our Biodiversity?
Source: SEOS Project, 2017
• “Habitat loss and fragmentation is considered by conservation biologists to be the primary cause of biodiversity loss. Clearance of native vegetation for agriculture, housing, timber and industry, as well as draining wetlands and flooding valleys to form reservoirs, destroys these habitats and all the organisms in them. In addition, this destruction can cause remaining habitats to become fragmented and so too small for some organisms to persist, or fragments may be too far apart for other organisms to move between.”
• “Invasive alien species are the second greatest threat to biodiversity worldwide. Whether introduced on purpose or accidentally, non-native species can cause severe problems in the ecosystems they invade, from affecting individuals to causing huge changes in ecosystem functioning and the extinction of many species. Virtually all ecosystems worldwide have suffered invasion by the main taxonomic groups. This problem will probably get worse during the next century driven by climate change, and an increase in global trade and tourism. As well as the risks to human health, alien species inflict massive economic costs to agriculture, forestry, fisheries, and other human activities.”
• “Pollution is currently poisoning all forms of life, both on land and in the water, and contributing to climate change (see below). Any chemical in the wrong place or at the wrong concentration can be considered a pollutant. Transport, industry, construction, extraction, power generation, and agroforestry all contribute pollutants to the air, land, and water. These chemicals can directly affect biodiversity or lead to chemical imbalances in the environment that ultimately kill individuals, species, and habitats.”
• “Climate change, brought about by emissions of greenhouse gases when fossil fuels are burned, is making life uncomfortably hot for some species and uncomfortably cold for others. This can lead to a change in the abundance and distribution of individual species around the globe and will affect the crops we grow, cause a rise in sea levels and problems to many coastal ecosystems. In addition, the climate is becoming more unpredictable and extreme devastating events are becoming more frequent.”
• “Over exploitation by humans causes massive destruction to natural ecosystems. Exploitation of biodiversity occurs for food (e.g., fish), construction (e.g., trees), industrial products (e.g., animal blubber, skins), the pet trade (e.g., reptiles, fish, orchids), fashion (e.g., fur, ivory) and traditional medicines (e.g., rhino horn). Selective removal of an individual species can unbalance ecosystems and all other organisms within them. In addition, the physical removal of one species often harms other (e.g., fishing by-catches).”
• “Human populations are growing at an exponential rate, resulting in the problems above. There are more than 7 billion people in the world, and although natural disasters, disease, and famines cause massive human mortality, we are getting better at surviving and the population just keeps growing. Human population numbers tripled in the twentieth century and although growth is slowing, one estimate predicts it will take until the twenty-third century for them to level out at around 11 billion.”
“Human modifications to the living community in an ecosystem as well as to the collective biodiversity of the Earth can therefore alter ecological functions and life support services that are vital to the well-being of human societies. Substantial changes have already occurred, especially local and global losses of biodiversity. The primary cause has been widespread human transformation of once highly diverse natural ecosystems into relatively species-poor managed ecosystems. Recent
USAID/UGANDA: ENVIRONMENTAL MANAGEMENT FOR THE OIL SECTOR – TRAINING COMPENDIUM: MODULE 4 79

studies suggest that such reductions in biodiversity can alter both the magnitude and the stability of ecosystem processes, especially when biodiversity is reduced to the low levels typical of many managed systems” (Naeem et al., 1999).
Naeem et al. (1999) identified the following certainties concerning biodiversity and ecosystem functioning:
• Human impacts on global biodiversity have been dramatic, resulting in unprecedented losses in global biodiversity at all levels, from genes and species to entire ecosystems;
• Local declines in biodiversity are even more dramatic than global declines, and the beneficial effects of many organisms on local processes are lost long before the species become globally extinct;
• Many ecosystem processes are sensitive to declines in biodiversity; • Changes in the identity and abundance of species in an ecosystem can be as important as changes
in biodiversity in influencing ecosystem processes.
Naeem et al. also identified the following impacts on ecosystem functioning that often result from loss of biodiversity:
• Plant production may decline as regional and local diversity declines; • Ecosystem resistance to environmental perturbations, such as drought, may be lessened as
biodiversity is reduced; • Ecosystem processes such as soil nitrogen levels, water use, plant productivity, and pest and
disease cycles may become more variable as diversity declines.
“Given its importance to human welfare, the maintenance of ecosystem functioning should be included as an integral part of national and international policies designed to conserve local and global biodiversity” (Naeem et al., 1999).
How Are Ecosystems Services Relevant to Oil and Gas Operations?
Source: IPIECA, 2011
“The oil and gas industry both depend and impact upon biodiversity and ecosystem services. For example, dependencies include utilizing water and natural materials such as timber and aggregates, and relying on natural waste assimilation and flood protection functions. Potential impacts arise through depleting, displacing, and polluting the organisms and habitats that give rise to the ecosystem services.”
“Ecosystem services are not all mutually compatible; what enhances one service may reduce another, resulting in trade-offs. For example, enhancing food production in an area may reduce existing natural flood control and carbon storage.”
Important Considerations for Design and Implementation of Data Collection
General Aspects
• Site characterization and baseline studies are imperative to provide solid and viable background information on sites and species selected for monitoring purposes, particularly when oil and gas development impacts a given area. In order to compare sites, it is critical to use a standard set of parameters and procedures to be used by data collectors across sites.
• With the exception of clearly recognizable incidents, in the absence of any pre-drilling or pre-construction characterization and baseline data, it is difficult to maintain that oil and gas operations or infrastructure have impacted water, soil, vegetation, or animals.
• Water and soil sampling for baseline data and periodic monitoring should test for a standard set of parameters, depending on sampling questions.
USAID/UGANDA: ENVIRONMENTAL MANAGEMENT FOR THE OIL SECTOR – TRAINING COMPENDIUM: MODULE 4 80

• Baseline surveys, monitoring, and incident sampling of water, soils, vegetation, and animals should be performed by properly trained and equipped personnel.
• Personnel should be familiar with up-to-date data collection, sampling, and analysis and laboratory protocols.
Accuracy and Precision in Data and Sample Collection
Source: Sokal and Rohlf, 1980
• In science, the accuracy of a measurement system is the degree of closeness of measurements of a quantity to its actual (true) value.
• The precision of a measurement system, also called reproducibility or repeatability, is the degree to which repeated measurements under unchanged conditions show the same results.
• Avoidance of bias in sampling is also a concern. Random sampling avoids this source of bias. A random sample is one where every potential sample plot within the study area sample has an exactly equal chance of being chosen for sampling.
• Sampling objectives differ and require appropriate and optimal sample collection and transport media, but collectors should: − Maintain continuity and understanding of the science-based and field-tested methods
required to accomplish data collection objectives; − Support consistency in the implementation of these methods in order to produce data that
are comparable and transferable; − Minimize data bias and apply practices that result in data that are reproducible within
appropriate limits of variability. • Ideally, the identification, management, and monitoring of impacts on biodiversity and ecosystem
services should be applied during all phases of the project cycle, beginning during the risk assessment studies phase.
Oil and Gas Exploration and Production Project Cycle
FIGURE 2.1: OIL AND GAS PROJECT CYCLE
Source: IPIECA, 2011
Water and Soil Data Collection Near Oil and Gas Facilities
• Baseline water and soil testing should be performed: − Within defined and established distances from oil and gas wells and infrastructure (pipelines,
refinery, roads, etc.); and
USAID/UGANDA: ENVIRONMENTAL MANAGEMENT FOR THE OIL SECTOR – TRAINING COMPENDIUM: MODULE 4 81

− At stratified sampling distances from point zero in all cardinal directions, depending on landscape components (e.g., presence of water sources, drainage systems);
• Follow-up sampling and testing should occur: − At established time periods after completion of drilling and infrastructure construction; − During the life time of operations and production (e.g., refinery, pipelines, maintenance and
transit corridors, waste disposal facilities); and − During site decommission and restoration (e.g., well sites, workers’ camps, heavy equipment
parks).
Some Key Aspects of IFC Performance Standard 1: Assessment and Management of Environmental and Social Risks and Impacts
Source: Yuzana Company, 2015
• “Important sections of International Performance Standard 1 regarding early identification of risks and impacts and projects’ “area of influence,” which extend well beyond commonly indicated “project areas” and include both below and aboveground resources in aquatic and soil ecosystems.”
• “The risks and impacts identification process will consider: − The emissions of greenhouse gases; − The relevant risks associated with a changing climate; and − The adaptation opportunities, and potential transboundary effects, such as pollution of air,
or use or pollution of international waterways;” • “Environmental and social risks and impacts will be identified in the context of the project’s area
of influence.” • “This area of influence encompasses, as appropriate, the area likely to be affected by:
− The project (includes the project’s sites, the immediate airshed and watershed, or transport corridors); and
− The client’s activities and facilities directly owned, operated or managed (including by contractors) and that are a component of the project (e.g., power transmission corridors, pipelines, canals, tunnels, relocation and access roads, borrow and disposal areas, construction camps, and contaminated land (e.g., soil, groundwater, surface water, and sediments).
− Associated facilities that are not funded as part of the project; and − Cumulative impacts that result from the incremental impact, on areas or resources used or
directly impacted by the project.”
Project Area of Influence as Defined in IFC Performance Standard 1
Source: Yuzana Company, 2015
The following section provides a description of the extent of “areas of influence” of development projects, and associated facilities and cumulative impacts.
• “The area of influence encompasses, as appropriate, the area likely to be affected by: − The project (includes the project’s sites, the immediate airshed and watershed, or transport
corridors); and − The client’s activities and facilities directly owned, operated or managed (including by
contractors) and that are a component of the project (e.g., power transmission corridors, pipelines, canals, tunnels, relocation and access roads, borrow and disposal areas, construction camps, and contaminated land (e.g., soil, groundwater, surface water, and sediments);
− Associated facilities that are not funded as part of the project;
USAID/UGANDA: ENVIRONMENTAL MANAGEMENT FOR THE OIL SECTOR – TRAINING COMPENDIUM: MODULE 4 82

− Cumulative impacts that result from the incremental impact, on areas or resources used or directly impacted by the project;
− Associated facilities may include railways, roads, captive power plants or transmission lines, pipelines, utilities, warehouses, and logistics terminals;
− Cumulative impacts are limited to those impacts generally recognized as important on the basis of scientific concerns and/or concerns from Affected Communities;
− Examples of cumulative impacts include incremental contribution of gaseous emissions to an airshed; reduction of water flows in a watershed due to multiple withdrawals; and increases in sediment loads to a watershed.”
Some examples of impacts identified from ESIAs at oil exploration sites
Aquatic fauna and habitats
Sedimentation, erosion, or contamination of seasonal and permanent water sources with impacts on fauna and flora Altering local hydrology via erosion, impeded drainage and pollution during road construction Pollution of aquatic ecosystems as a result of contamination of surface water by fuels, oils and waste
Geological resources
Compaction of soil in the area and loss of soil function Contamination of soil due to oil leakage from equipment and machinery
Preliminary measures for preventing and minimizing soil and groundwater contamination during oil and gas activities
Source: U.S. EPA, 1995
• Proper siting of facilities and chemical storage areas. • Secondary containment of potential contaminants (e.g., design water retention pits to contain 30
percent overflow). • Regular inspections and maintenance of tanks and pipelines. • Rigorous application of company/standard/national soil and groundwater monitoring programs. • Proper waste disposal and management practices. • Early contamination source identification and removal or management.
Selected best practices of oil and gas industry
Source: U.S. EPA, 1995
Siting phase
• Locate and construct roads, tank batteries, and other production facilities to minimize impacts to surrounding areas, human populations, wetlands, and sensitive ecosystems.
• Siting considerations to reduce or eliminate potential impacts from wastewater discharges, air emissions at tank batteries, and spills on mammals, birds, fish, and benthic organisms.
Exploration phase
• Schedule site preparation and drilling activities to avoid disturbing plants and animals during crucial seasons in their life cycles.
• Employ directional drilling techniques, particularly near sensitive environmental areas. • Avoid the use of excess muds, additives, and water. • Minimize the volume of disposed mud by using improved solids control technology. • Use alternative drilling fluids and additives to reduce toxicity.
USAID/UGANDA: ENVIRONMENTAL MANAGEMENT FOR THE OIL SECTOR – TRAINING COMPENDIUM: MODULE 4 83

Lease development and production phases
• Reduce erosion by minimizing digging and soil movement and by protecting slopes with covering, sandbags, or plants.
• Install casing-head gas recovery systems at production wells to reduce hydrocarbon emissions and hydrogen sulfide emissions.
• Monitor production water levels during secondary production to identify when injection water or formation water migration occurs.
• Install monitoring systems for underground pipelines to prevent soil and groundwater contamination.
Waste reduction
• Add recirculation pumps to product storage tanks to reduce the settling of heavy hydrocarbons on tank bottoms.
• Use drip pans at treatment vessels, valves, and product pipeline junctions. • Cover and protect insulation material to minimize degradation.
Lubricants
• Buy lubricants in bulk. • Minimize volume of waste lubrication oil by extending its use. • Use a regular inspection and maintenance program to minimize lead or line failures.
Paint related materials and wastes
• Reduce or eliminate non-essential painting. • Purchase less toxic, less volatile paints and solvents (for example, paints with lower metals
content). • Purchase paints that have greater durability. • Train employees to apply paints efficiently and reduce overspray by proper use of spray gun.
Stormwater
• Improve work processes and properly maintain equipment and facilities to reduce leaks, spills, etc.
• Cover facilities to eliminate contamination of stormwater. • Segregate drainage from liquid storage and loading/unloading facilities, and operations areas from
un-impacted areas. • Divert all clean stormwater away from contaminated areas. • Store all wastes where they are not exposed to stormwater.
Pit wastes
• Use rig wash water judiciously. • Examine and eliminate all sources of water leaks. • Use automatic shut-off nozzles on rig floor water hoses. • Design pits/pit systems to minimize waste. • Install catchment pans on top of wellheads to prevent spills. • Use closed-loop mud or drilling fluid systems. • Drilling fluids (mud, water, additives) are circulated through the wellbore. • Fluids and drill cuttings (rock fragments created by the drilling process) are deposited in a
reserve pit dug near the well. • The lined pit is used to hold used drilling fluids and wastes. • Reserve pit replaced with a series of storage tanks that separate liquids and solids.
USAID/UGANDA: ENVIRONMENTAL MANAGEMENT FOR THE OIL SECTOR – TRAINING COMPENDIUM: MODULE 4 84

• Equipment to separate out solids (e.g., screen shakers, centrifuges) and collection equipment (e.g., vacuum trucks, shale barges) minimize the amount of drilling waste muds and cuttings that require disposal.
• Maximizes the amount of drilling fluid recycled and reused in the drilling process. • Wastes are transferred off-site for disposal at injection wells or oilfield waste disposal facilities.
Reduce soil contamination with crude oil, chemicals, produced water, sulfur, and refined oil
• Improve housekeeping and use drip pans, double-walled sumps, and aboveground sumps. • Use pit liner material around and under production facilities. • Use impervious secondary containment. • Use of cathodic protection3, coated pipe, etc., to minimize leaks. • Install high-level alarm systems and/or shut-off devices on tanks.
Spill cleanup waste (crude oil, refined oil, chemicals)
• Strategize and take action to minimize the number of spills. • Provide impervious secondary containment. • Use collection system for drips, leads, hose connections, etc. • Minimize the use of absorbents to collect spilled material.
Inter-Connectedness of Soil, Air, and Water
Source: Alberta Environment, 2009
• Soil is a resource that supports important ecosystem functions. • At sufficient concentrations, soil contamination can impair the ability of soil to support
important ecosystem functions as well as pose risks to human, environmental, and animal health. • Soils are hydrologically linked to groundwater and surface water systems. • Soil contamination interacts with air through volatilization4 (Figure 2.2) and with water through
dissolution and leaching to groundwater or runoff to surface water. • Volatile compounds in groundwater may volatilize at the water table and can migrate through
the soil. • Soluble contaminants in groundwater can be transported laterally with the groundwater flow,
and potentially enter a surface water body (lake, streams, etc.). • Measures must be taken to monitor and prevent soil contamination and, when a toxic substance
release occurs, prompt actions must be taken to remediate or otherwise manage and control the release.
3 Cathodic protection can be, in some cases, an effective method of preventing stress corrosion cracking. Cathodic protection is a technique to control the corrosion of a metal surface by making it work as a cathode of an electrochemical cell. This is achieved by placing in contact with the metal to be protected another more easily corroded metal to act as the anode of the electrochemical cell. Cathodic protection systems are most commonly used to protect steel, water or fuel pipelines and storage tanks, steel pier piles, ships, offshore oil platforms and onshore oil well casings.
4 Volatilization: The conversion of a chemical substance from a liquid or solid state to a gaseous or vapor state through evaporation. Volatile organic compounds (VOCs) are organic chemicals that have a high vapor pressure at ordinary room temperature. Their high vapor pressure results from a low boiling point, which causes large numbers of molecules to evaporate or sublimate from the liquid or solid form of the compound and enter the surrounding air. For example, formaldehyde, which evaporates from paint, has a boiling point of only –19 °C (–2 °F). VOCs are numerous, varied, and ubiquitous. They include both human-made and naturally occurring chemical compounds. Most scents or odors are of VOCs. VOCs play an important role in communication between plants, and messages from plants to animals. Some VOCs are dangerous to human health or cause harm to the environment.
USAID/UGANDA: ENVIRONMENTAL MANAGEMENT FOR THE OIL SECTOR – TRAINING COMPENDIUM: MODULE 4 85
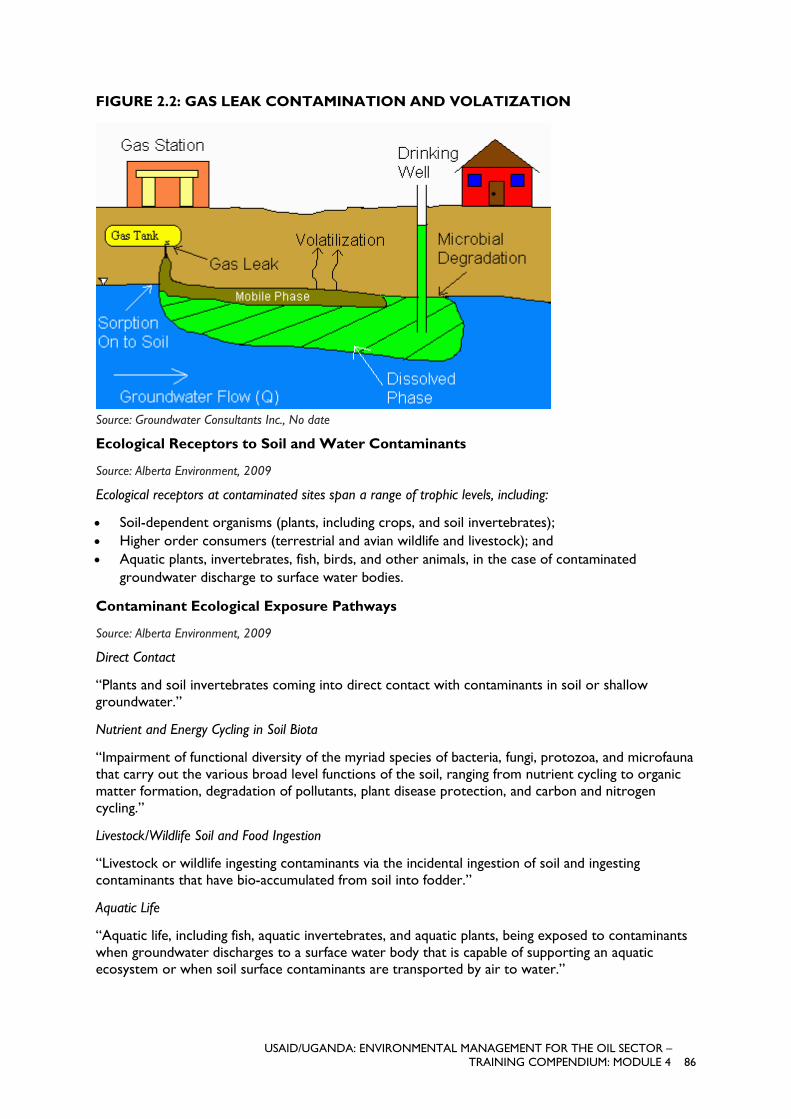
FIGURE 2.2: GAS LEAK CONTAMINATION AND VOLATIZATION
Source: Groundwater Consultants Inc., No date
Ecological Receptors to Soil and Water Contaminants
Source: Alberta Environment, 2009
Ecological receptors at contaminated sites span a range of trophic levels, including:
• Soil-dependent organisms (plants, including crops, and soil invertebrates); • Higher order consumers (terrestrial and avian wildlife and livestock); and • Aquatic plants, invertebrates, fish, birds, and other animals, in the case of contaminated
groundwater discharge to surface water bodies.
Contaminant Ecological Exposure Pathways
Source: Alberta Environment, 2009
Direct Contact
“Plants and soil invertebrates coming into direct contact with contaminants in soil or shallow groundwater.”
Nutrient and Energy Cycling in Soil Biota
“Impairment of functional diversity of the myriad species of bacteria, fungi, protozoa, and microfauna that carry out the various broad level functions of the soil, ranging from nutrient cycling to organic matter formation, degradation of pollutants, plant disease protection, and carbon and nitrogen cycling.”
Livestock/Wildlife Soil and Food Ingestion
“Livestock or wildlife ingesting contaminants via the incidental ingestion of soil and ingesting contaminants that have bio-accumulated from soil into fodder.”
Aquatic Life
“Aquatic life, including fish, aquatic invertebrates, and aquatic plants, being exposed to contaminants when groundwater discharges to a surface water body that is capable of supporting an aquatic ecosystem or when soil surface contaminants are transported by air to water.”
USAID/UGANDA: ENVIRONMENTAL MANAGEMENT FOR THE OIL SECTOR – TRAINING COMPENDIUM: MODULE 4 86

Irrigation
“Crops being exposed to contaminants when groundwater is used for irrigation.”
Livestock/Wildlife Watering
“Livestock or wildlife being exposed to contaminants when groundwater is used for livestock watering, or groundwater discharges to a surface water body where wildlife and livestock may drink.”
Soil Sampling
Source: Virtual Soil Science Learning Resources, 2004
Overview of Factors of Soil Formation
• “Soils develop from geological materials called parent materials at the Earth’s surface through their interaction with climate, biota, topography, and time.”
• “The parent material from which soils form consists of unconsolidated and more or less chemically changed (weathered) mineral or accumulated organic particles.”
• “Climate influences soil development through temperature and precipitation, which control the weathering rate, the movement of substances through the profile, and the type of vegetation that becomes established.”
• “Biota, including plants, animals and microorganisms, contribute to soil formation by adding organic matter and altering biochemical properties of the profile.”
• “Topographic properties (relief, aspect, and slope) influence soil development by controlling the distribution of water in the landscape, the amount of sun received, and the susceptibility to erosion.”
• “Time elapsed since the beginning of soil formation controls how far soil development has progressed and how different the soil has become from the underlying parent material.”
Soil formation and soil profile
Source: NZ Soils, 2011
“Soil horizon: A layer generally parallel to the soil surface, whose physical characteristics differ from the layers above and beneath. Each soil type usually has 3-4 horizons. Horizons are defined in most cases by obvious physical features, chiefly color, and texture.”
USAID/UGANDA: ENVIRONMENTAL MANAGEMENT FOR THE OIL SECTOR – TRAINING COMPENDIUM: MODULE 4 87

FIGURE 2.3: SOIL HORIZONS
Source: Nambiar, 2016
Soil survey and sampling project categories
Source: United States Department of Agriculture, 2009
Soil Reference Projects
• Designed to answer specific questions on mapping or soil classification, provide data for transecting a mapping unit, or collect calibration standards.
• Samples are typically collected from specific horizons in three to five locations, which either relate to the sampling question or are representative of the map unit.
• Typically, a limited number of analyses, specific to the questions asked, are performed on these samples.
Soil Characterization Projects
• Designed to obtain comprehensive soil characterization data for a representative pedon of a map unit or a pedon5 that is included in a research and/or monitoring study;
• Samples collected from each horizon include bulk samples of approximately 3 kg, as well as clods of natural fabric for bulk density and micromorphology;
• A standard suite of laboratory analyses is performed on each horizon.
Geomorphology and Stratigraphy Projects
• Designed to study relationships between soils, landforms, and/or the stratigraphy of their parent materials (e.g., a specific project may be designed to study the relationships among a sequence of types of soil down a hill slope their morphological properties, and the hydrology of the area).
5 Pedon: The smallest unit or volume of soil that contains all the soil horizons of a particular soil type. It usually has a surface area of approximately 1 sq m and extends from the ground surface down to bedrock
USAID/UGANDA: ENVIRONMENTAL MANAGEMENT FOR THE OIL SECTOR – TRAINING COMPENDIUM: MODULE 4 88

Sampling for Determining Contamination in Soils (e.g., petroleum)
• Ideally, duplicate samples should be taken for this inspection. • Actual sampling of the soil should be completed in the minimum possible time, with the least
possible handling before the sample is sealed in the container. • The percentage of material removed should be estimated so that the laboratory result can be
related to site conditions. • Samples for volatile analyses must remain as undisturbed as possible.
Soil Survey Field Sampling Requirements
Source: United States Department of Agriculture, 2009
• A complete description of the sampling site not only provides a context for the various soil properties determined, but is also a useful tool in the evaluation and interpretation of the soil analytical results.
• Documentation of the landscape, landform, and pedon at the sampling sites serve as a link in a continuum of analytical data, sampled horizons, pedon, landscape, and overall soil survey area.
FIGURE 2.4: EXAMPLE OF A PEDON
Source: Government of Canada, 1998
Soil Core Sampling Equipment
Source: USGS, 2005
Soil Measurement and Field Analyses Tools
Source: USGS, 2005
Preparations for Water Sampling
• Field personnel are responsible for determining whether the equipment and methods used could impair sample quality.
USAID/UGANDA: ENVIRONMENTAL MANAGEMENT FOR THE OIL SECTOR – TRAINING COMPENDIUM: MODULE 4 89

• Collect quality control samples (“equipment blanks”6) and analyze the results. • Collect ‘equipment blanks’ before beginning the field effort using laboratory-grade water
samples:
Equipment blanks are processed through clean equipment in the controlled setting of a laboratory. Process an equipment blank at least once a year for each set of sample-contacting equipment.
Do not collect or process environmental samples until the annual equipment blank data have been reviewed.
Examine field and laboratory results as soon as possible, preferably before the next sample collection field trip.
• Results indicating potential bias in the data will alert you to the changes needed in equipment, equipment cleaning procedures, or field methods used.
• Be prepared to collect additional blanks, replicates, or other field quality control samples, based on your judgment of the effects of field conditions on sample collection.
• Field conditions are unpredictable, and adverse or unexpected conditions could necessitate additional steps to document data quality.
• Collect field blanks at the field sites under the same conditions as environmental samples.
Water Sampling
Use of water sampling equipment
Source: USGS, 2003
• “Guidelines for sample collection equipment and related supplies differ, whether samples are collected for surface water or groundwater, and the chemical nature of the target analyte, i.e., the substance or chemical constituent to be analyzed.”
• “Chemical Compatibility: Check that equipment to be used will not affect sample chemistry.” • “Field personnel should wear gloves and use other techniques to minimize potential
contamination and provide protection from contact with pathogens and chemical contaminants and preservatives.”
• “Neither gloved nor ungloved hands should come in contact with samples or with equipment surfaces that the sample could contact.”
• “During field work, routinely check for glove tears, punctures, etc.” • “After putting the gloves on, rinse them with deionized (laboratory-grade) water while gently
rubbing hands together to remove any surface residue before handling sampling equipment.”
On-Site Preparations for Water Sample Collection
Source: USGS, 2003
• “Only clean equipment should be transported to the field.” • “When arriving at the field site, take the appropriate measures to avoid sample contamination,
such as fumes from traffic or other sources, and employ proper handling and care of sampling equipment.”
• “Once fieldwork has begun, and before samples are collected, the sample-wetted portions of most of the collection and processing equipment require a field rinse with native water.”
• “Field rinsing helps to condition, or equilibrate, sampling equipment to the sample environment.”
6 This applies to new equipment to be used for the first time, to equipment that will be cleaned with a new cleaning procedure, and to equipment that has not been tested with an equipment blank for 1 year. Ensure that the equipment blanks either are free of contamination or have concentrations small enough to be insignificant at the current analytical limits
USAID/UGANDA: ENVIRONMENTAL MANAGEMENT FOR THE OIL SECTOR – TRAINING COMPENDIUM: MODULE 4 90

• “Rinsing also serves to ensure that all cleaning-solution residues have been removed.”
Two categories of isokinetic depth-integrating samplers, based on the method of suspension: Cable-and-Reel and Handheld:
“Isokinetic depth-integrating samplers and non-isokinetic samplers are the primary types of surface water samplers in common use. An isokinetic depth-integrating sampler is designed to accumulate a representative water sample continuously and isokinetically (that is, stream water approaching and entering the sampler intake does not change in velocity) from a vertical section of a stream while transiting the vertical at a uniform rate.”
FIGURE 2.5: ISOKINETIC DEPTH INTEGRATING SAMPLER
Source: USGS, 2003
Handheld Water Samplers
Source: USGS, 2003
• “Used to collect water samples where flowing water can be waded or where a bridge is accessible and low enough from which to suspend the sampler.
• Handheld and cable-and-reel samplers can be used to collect inorganic and organic samples. • The rigid-bottle sampler components (cap, nozzle, and bottle) are interchangeable; • The depth limit depends on the nozzle diameter. • All water sampler equipment models have restrictions depending on water flow velocity,
temperature, and minimum and maximum depth.”
USAID/UGANDA: ENVIRONMENTAL MANAGEMENT FOR THE OIL SECTOR – TRAINING COMPENDIUM: MODULE 4 91

FIGURE 2.6: HANDHELD WATER SAMPLERS
Source: USGS, 2003
Open-mouth samplers
Source: USGS, 2003
• “The handheld bottle sampler is dipped to collect a sample where depth and velocity are less than the minimum required for depth-integrating samplers.
• The weighted-bottle sampler is used in water too deep to wade. An open bottle is inserted into a weighted holder that is attached to a hand line for lowering.
• The Biochemical Oxygen Demand (BOD) sampler and the VOC sampler are open-mouth samplers designed to collect non-aerated samples.
• BOD bottles are specifically designed to collect non-aerated samples for dissolved oxygen determination.
• The VOC sampler is specifically designed to collect non-aerated samples in 40-ml glass septum vials for determination of VOCs.”
USAID/UGANDA: ENVIRONMENTAL MANAGEMENT FOR THE OIL SECTOR – TRAINING COMPENDIUM: MODULE 4 92

FIGURE 2.7: EXAMPLES OF OPEN-MOUTH SAMPLERS
Source: USGS, 2003
Single-Stage Samplers
Source: USGS, 2003
“Automatic pumping samplers (autosamplers) with fixed-depth intake(s) can be used to collect samples at remote sites; from ephemeral, small streams; or from urban storm drains where stage rises quickly. These samplers can be programed to collect samples under a combination or variety of conditions such as precipitation, stage, or discharge.”
• “Designed to obtain suspended-sediment samples from streams at remote sites or at streams where rapid changes in stage make it impractical to use a conventional isokinetic, depth-integrating sampler.”
USAID/UGANDA: ENVIRONMENTAL MANAGEMENT FOR THE OIL SECTOR – TRAINING COMPENDIUM: MODULE 4 93

• “Can be mounted above each other to collect samples from various elevations or times as stream flow increases and hydrograph rises.”
Groundwater Sampling
Source: USGS, 2003
The type of sampler or sampling system selected for collecting groundwater samples depends on:
• “The type and location of a well (monitoring/supply) • The depth to water from land surface • Physical characteristics of the well • Groundwater chemistry • The analytes7 targeted for study”
Selecting the appropriate equipment for collecting groundwater samples is important to obtain data that will meet study objectives and data quality requirements.
Groundwater Sampling Equipment
Source: USGS, 2003
• “Sampling equipment must not be a source of contamination or otherwise affect analyte concentration.
• Of specific importance for groundwater sampling is a potential change in groundwater chemistry due to atmospheric exposure.
• Groundwater most commonly is collected using either pumps designed specifically for water sampling from monitoring wells, pumps installed in supply wells, or a bailer or other point or thief-type sampler.
• Thief samplers are used to collect instantaneous discrete samples. Thief samplers have been used primarily to collect samples from lakes, reservoirs, and some areas of estuaries. Smaller versions, designed to collect groundwater samples, also have been used in still and flowing surface water.”
Air Resources
Emissions
In the United States, emissions regulations are highly complex.
Most industry agreements are negotiated at the state and local level.
• Federal codes form guidelines • The specifics represent a balance dictated by environmental considerations, economics,
community
Although the air emission permits have some flexibility:
• The permit is a binding contract • Subject to public review and open comment sessions • Rigorously monitored for compliance • Subject to periodic review
Ambient Air Standards
Ambient air standards are easier to generate than emission standards.
7 An analyte is a substance or chemical constituent that is of interest in an analytical process.
USAID/UGANDA: ENVIRONMENTAL MANAGEMENT FOR THE OIL SECTOR – TRAINING COMPENDIUM: MODULE 4 94

Risk analyses can lead directly to air concentrations that invoke harm.
• Human health • Ecosystem (damage to animals and plants) • Atmosphere (ozone depletion, greenhouse gases, etc.)
Ambient air standards are based on exposure.
• Recognize the transient nature of atmospheric concentrations. • Different standards may exist for different periods of exposure. • Often include recommendations based on statistical distribution of concentrations over time.
TABLE 2.1: THE U.S. AMBIENT STANDARD
Pollutant [links to historical tables of NAAQS
reviews]
Primary/ Secondary
Averaging Time Level Form
Carbon Monoxide (CO)
primary 8 hours 9 ppm Not to be exceeded more than once per year
1 hour 35 ppm
Lead (Pb) primary and secondary
Rolling 3 month average
0.15 μg/m3 (1) Not to be exceeded
Nitrogen Dioxide (NO2)
primary 1 hour 100 ppb 98th percentile of 1-hour daily maximum concentrations, averaged over 3 years
primary and secondary
1 year 53 ppb (2) Annual Mean
Ozone (O3)
primary and secondary
8 hours 0.070 ppm (3) Annual fourth-highest daily maximum 8-hour concentration, averaged over 3 years
Particle Pollution (PM)
PM2.5
primary 1 year 12.0 μg/m3 annual mean, averaged over 3 years
secondary 1 year 15.0 μg/m3 annual mean, averaged over 3 years
primary and secondary
24 hours 35 μg/m3 98th percentile, averaged over 3 years
PM10 primary and secondary
24 hours 150 μg/m3 Not to be exceeded more than once per year on average over 3 years
Sulfur Dioxide (SO2)
primary 1 hour 75 ppb (4) 99th percentile of 1-hour daily maximum concentrations, averaged over 3 years
secondary 3 hours 0.5 ppm Not to be exceeded more than once per year
Source: U.S. EPA, 2016
In the above U.S. Ambient Standard:
• Primary standards provide public health protection, including protecting the health of "sensitive" populations such as asthmatics, children, and the elderly.
USAID/UGANDA: ENVIRONMENTAL MANAGEMENT FOR THE OIL SECTOR – TRAINING COMPENDIUM: MODULE 4 95

• Secondary standards provide public welfare protection, including protection against decreased visibility and damage to animals, crops, vegetation, and buildings.
The World Health Organization (WHO) also has established guidelines:
• Similar to US standards for many pollutants; • WHO values lower than US for several pollutants; • WHO guidelines less complicated; • Neither US nor WHO include VOCs or methane (Considered a deficiency in the standards).
TABLE 2.2: WHO AMBIENT AIR GUIDELINES
Pollutant Level Averaging Time
PM2.5 10 μg/m3 25 μg/m3
Annual mean 24-hour mean
PM10 20 μg/m3 50 μg/m3
Annual mean 24-hour mean
O3 (ozone) 100 μg/m3 8-hour mean
NO2 40 μg/m3 200 μg/m3
Annual mean 1-hour mean
Sulfur dioxide 20 μg/m3 500 μg/m3
Annual mean 10-minute mean
Source: WHO, 2016
Which Pollutant Gases are Important in the Oil and Gas Industry?
Essentially all regulated gases and particulates are potential contaminant emissions in oil and gas industry:
• SO2, NO2, O3, PM2.5, PM10, CO • VOCs and dust also monitored
Air Monitoring
• Air monitoring is required in almost every industry, including oil and gas. • Approach varies in complexity:
− Biological indicator species − Passive systems − Active perimeter monitors − Stack monitors
Biological Indicators
• Lichens − Symbiotic combination of fungi and algae − Common on trees in many parts of the world − The abundance and size of the colonies on a tree trunk inversely related to pollution levels
− "How-to" video using lichens as indicators of air pollution: Lichens and Pollution: Is Our Air Clean?
USAID/UGANDA: ENVIRONMENTAL MANAGEMENT FOR THE OIL SECTOR – TRAINING COMPENDIUM: MODULE 4 96

FIGURE 2.8: LICHENS AS INDICATORS OF POLLUTION
Source: Orru, 2012
TABLE 2.3: OTHER INDICATOR SPECIES
Source: Singal, 2012
Passive Samplers
• Passive samplers are devices that collect air pollution by being left is a given location for some amount of time. − Simple, quiet, small, easy to handle, require on external power − Function through adsorption, adsorption, or condensation
USAID/UGANDA: ENVIRONMENTAL MANAGEMENT FOR THE OIL SECTOR – TRAINING COMPENDIUM: MODULE 4 97

• Absorption samplers − One of the least used approaches − Gas flows near a liquid capable of dissolving the target gases − After collection of the sampler, the gas is removed from the liquid and analyzed:
• Gas sparging • Heat • Head space analysis
Grab Sampling
• Often considered a passive technique • A small sample of air is drawn into a tube
− The tube is sealed − Transported for analysis
Indicator Tubes
• Variation of the grab sample − Air drawn manually or mechanically − A color change is positive for pollutant (may require further analysis)
Mechanical Samplers
• Mechanical samplers are those that rely on power-driven devices to collect samples.
− Some are simple pumps, but most are fairly sophisticated in design and function.
• Advantages:
− Time integration − High volume sampling − Particulate sampling
PM2.5 and PM10
• These sampling devices can be complex.
Larger sizes:
− Accurately distinguish smaller, required sizes − Sample high volumes
• Typical construction:
Commercial units are readily available. Typical components include:
− Shielding “roof” − Pump to draw air − Size discriminator
• Cyclone • Impact/flight • Filters
Gaseous Pollutant Samplers
• The technology of pollution sensing matured rapidly.
USAID/UGANDA: ENVIRONMENTAL MANAGEMENT FOR THE OIL SECTOR – TRAINING COMPENDIUM: MODULE 4 98

Fast, accurate, and compact samplers are affordable and readily available. Sensors are available for essentially all relevant pollutants.
− Dusts, aerosols, gases − Power requirement are low enough to be met by solar panels
• Current monitoring systems can:
− Sample the air intermittently or continuously. − Detect and quantify target gas pollutants. − Store the information along with time stamp. − Transmit the data to a remote access point. − Send alerts when appropriate or desired.
Designing and Implementing Air Quality Monitoring
• Air quality monitoring at industrial sites has been standard practice for decades. • Protocols have nearly become standardized. • Most monitoring programs are a blend of passive, active, and fixed sampling. • Spot sampling and time integrated. • Monitoring systems are normally developed with oversight from the governing regulatory
agency.
Must take into account:
• Contributions to ambient concentrations • Worker health • Impacts on surrounding communities • Ecosystem impacts
• Monitoring for benzene.
− Annual average benzene concentrations do not exceed WHO and European Union (EU) air quality standards.
− Benzene concentrations at terminal locations marginally exceed these standards. − Receptor locations exceed benzene air quality standards in 2009 and 2010, but both years
are skewed by extremely high data values recorded at monitoring station AAQ7 in Sangachal.
REFERENCES
Alberta Environment. (2009). Alberta tier 1 soil and groundwater remediation guidelines. Climate Change, Air, and Land Policy Branch. Retrieved from https://archive.org/stream/albertatier1soil2009albe/albertatier1soil2009albe_djvu.txt
Bernhardt, T. (No date). The Canadian Biodiversity Website. Retrieved from http://canadianbiodiversity.mcgill.ca/english/index.htm
Government of Canada. (1998). Chapter 2: Soil, pedon, control section, and soil horizons. In: The Canadian System of Soil Classification. 3rd edition. Retrieved from http://sis.agr.gc.ca/cansis/taxa/cssc3/chpt02.html
Groundwater Consultants Inc. (No date). Current list of projects and activities. Retrieved from http://www.groundwaterconsultants.net/?p=projects
USAID/UGANDA: ENVIRONMENTAL MANAGEMENT FOR THE OIL SECTOR – TRAINING COMPENDIUM: MODULE 4 99

IPIECA. (2011). Ecosystem services guidance: Biodiversity and ecosystem services guide. Retrieved from http://www.ipieca.org/resources/good-practice/ecosystem-services-guidance-biodiversity-and-ecosystem-services-guide/
Naeem, S., Chapin III, F. S., Costanza, R., Ehrlich, P. R., Golley, F. B., Hooper, D. U., & Symstad, A. J. (1999). Biodiversity and ecosystem functioning: maintaining natural life support processes. Issues in ecology, 4(11).
Nambiar, R.H. (2016). The soil profile with 5 horizons.
NZ Soils. (2011). Introduction to describing soils. Retrieved from http://www.nzsoils.org.nz/Topic-Describing_Soils/Introduction_To_Describing_Soils/
Orru, A.M. (2012). Lichen as a pollution indicator. KTH Biomimicry course. Retrieved from http://biomimicrykth.blogspot.pe/2012/05/lichen-as-pollution-indicator.html
Rohlf, J. F., & Sokal, R. R. (1980). Biometry: the principles and practice of statistics in biological research. WH Freeman and company.
SEOS Project. (2017). Ecosystems. SEOS Tutorials. Retrieved from http://www.seos-project.eu/modules/oceancolour/oceancolour-c02-p01.html
Shah, A. (2014). Why Is Biodiversity Important? Who Cares? Retrieved from http://www.globalissues.org/article/170/why-is-biodiversity-important-who-cares
Singal, S.P. (2012). Air Quality Monitoring and Control Strategy. Alpha Science Intl Ltd.
The State of Queensland. (2002). Eco-online Nova Scotia monitoring biodiversity. Retrieved from http://www.eco-online.eq.edu.au/novascotia/whatsbio/ecosystem.html
United States Department of Agriculture (USDA). (1999). Soil survey field and laboratory methods manual. Retrieved from https://www.nrcs.usda.gov/Internet/FSE_DOCUMENTS/nrcs142p2_052249.pdf
U.S. EPA. (1995). Pollution prevention – Environmental impact reduction checklists for NEPA/309 reviewers. Retrieved from https://www.epa.gov/sites/production/files/2014-08/documents/pollution-prevention-checklist-nepa-pg.pdf
U.S. EPA. (2016). NAAQS Table. Retrieved from https://www.epa.gov/criteria-air-pollutants/naaqs-table
United States Geological Survey (USGS). (2003). Chapter A2.selection of equipment for water sampling. In: National Field Manual for the Collection of Water-Quality Data. Retrieved from http://manualzz.com/doc/18378321/selection-of-equipment-for-water-sampling-chapter-a2.-nat
USGS. (2005). Chapter A1. Preparations for water sampling. In: National Field Manual for the Collection of Water-Quality Data. Retrieved from https://water.usgs.gov/owq/FieldManual/chapter1/pdffiles/Ch1.pdf
Virtual Soil Science Learning Resources. (2004). Soil Formation and Parent Material. Retrieved from http://landscape.soilweb.ca/overview/
World Health Organization. (2016). Ambient (outdoor) air quality and health. Fact sheet. Retrieved from http://www.who.int/mediacentre/factsheets/fs313/en/
Yuzana Company. (2015). Corporate Policies and Procedures: Land Development. Retrieved from http://yuzanagroup.com/land_development.html
USAID/UGANDA: ENVIRONMENTAL MANAGEMENT FOR THE OIL SECTOR – TRAINING COMPENDIUM: MODULE 4 100

2.2 POST-MORTEM PROTOCOLS FOR ASSESSING AND TESTING ANIMALS AND BIRDS
SYLLABUS
Topic and Subtopic Suggested Approach, Methods, and Equipment
1. Introduction to disease investigations
• Classroom lecture with interactive sessions and case studies
• Equipment: LCD projector, flipcharts 2. Equipment for performing necropsy
• Lecture/formal presentation, discussions, question and answer
• Practical exercises • Students will look at and appreciate the various
instruments in a PM kit and their functions. They will also acquaint themselves with sampling materials, transportation equipment, and protective gear. They will learn how to don and remove personal protective equipment (PPE).
• In groups of 2 each, they will open up a carcass (avian and mammalian represented by chicken and goat, respectively).
• Equipment includes PowerPoint equipment, sound system, white board/flip charts, markers, PM kits, protective gear, PPE, sampling materials, and transportation materials. Live chicken and goats for euthanizing and postmortem.
3. Performing the necropsy
• Lecture/formal presentation, discussions • Practical exercises • Small groups of 2-3 people per group are given a
live chicken. They are taken through the different aspects (e.g., handling, physical examination, sample collection, processing, lab testing, and submission to specialized labs for testing of PAHs). Laboratory practical to show changes in blood parameters (hemolytic anemia), and histopathology changes in organs and tissues (observing pre-processed microscope slides). Laboratory practical to show changes in blood parameters (hemolytic anemia), and histopathology (observing microscope slides, with tissues processed earlier).
• Equipment includes PowerPoint equipment, sound system, white board/flip charts, markers, chicken for working with, wild birds and small mammals-if collected from oil drilling sites (frozen), PPE, sampling materials (syringes, capillary tubes, microscope slides, wipes) sampling bottles (plastic and glass, note books, camera), fixatives (formalin, ethanol), cool box, ice packs, Ziploc bags, chain of custody forms and other kinds of forms.
USAID/UGANDA: ENVIRONMENTAL MANAGEMENT FOR THE OIL SECTOR – TRAINING COMPENDIUM: MODULE 4 101

Topic and Subtopic Suggested Approach, Methods, and Equipment
4. Protocols for the processing of oiled wildlife
• Mock (simulation) exercise to take participants through a typical exercise of processing live and dead wildlife during an oil spill incident.
• Equipment includes PowerPoint equipment, sound system, white board/flip charts, markers, discussion groups.
DETAILED NOTES
Introduction to Disease Investigations
Definitions
Disease: a disorder of structure or function in a human, animal, or plant, especially one that produces specific signs or symptoms or that affects a specific location and is not simply a direct result of physical injury.
External examination: This is the examination done on the external surface of the animal before the carcass is opened and includes the skin, mucous membranes (oral cavity, eyes, nose, anus, vaginal mucosa), mammary glands, scrotum, vulva and the penis. You look out for any abnormal changes, discharges, ectoparasites, parasites etc. For the case of oil pollution, look out for discoloration from oil and the degree of the animal that is covered.
Gross examination: Process by which pathology specimens are inspected with the bare eye to obtain diagnostic information, while being processed for further examination (microscopic/histopathological, toxicological, microbiological). Gross examination can be carried out not only by a trained pathologist but also a trained biologist/professional.
History: This is a record of the progression of the disease in an animal or in the entire herd, in a species or other species as well, aspects of the environment in which the carcass has been found or where the animal previously ranged. It should include a record of all information deemed useful for the investigation.
Internal examination: This is the examination of the internal structures (tissues, organs, and organ systems) following opening up of the carcass. All systems should be examined thoroughly and the results clearly captured.
Microscopic examination: This is the examination of processed specimens under a microscope to be able to decipher deviations from the normal that are not visible when a naked eye is used. This is also referred to as histopathological examination.
Pathology: This is a study of disease and the mechanisms that underlie them.
Postmortem: Postmortem (PM) or necropsy or autopsy is the examination of a body after death to determine the actual cause of the death. Autopsies are valuable sources of medical and veterinary information.
Why Necropsy Wild Animals?
Source: Munson, 2005
“Disease is one of many factors affecting the viability of wild populations. In a balanced ecosystem, most populations survive with low levels of disease or with periodic epidemics. However, as wildlife populations become denser from habitat restriction, the risks of a catastrophic epidemic within wildlife populations increase. Transmission of diseases between wild and domestic animals also becomes more likely.” Anthropogenic effects like oil and gas development in the Albertine Graben
USAID/UGANDA: ENVIRONMENTAL MANAGEMENT FOR THE OIL SECTOR – TRAINING COMPENDIUM: MODULE 4 102

pose a threat to the biodiversity-rich ecosystem. “Therefore, a robust monitoring plan for animal health and behavior must be part and parcel of the general monitoring. Monitoring the health of animals entails observing the apparently healthy, the sick (morbidity), and looking at the mortality (carrying out postmortem).”
“To determine the disease risks to a population, the causes of morbidity and mortalities in that population must be identified. Risk assessment also includes an understanding of the natural history of infectious diseases in a given environment, including the history of previous epidemics. Many wildlife disease epidemics affecting valuable wildlife resources or livestock have gone undetected because appropriate samples were not collected for diagnostic testing from animals that died during the epidemic. When appropriate samples and accurate written and photographic records are taken, the cause of an epidemic can be determined in most cases.”
“While it is ideal to transport sick or recently dead animals to a pathology laboratory for necropsy by trained personnel, in most circumstances transport is not possible. However, appropriate tissue samples can be obtained by field personnel if trained in necropsy procedures and sample collection. The purpose of this manual is to provide practical guidelines for performing field necropsies on wild animals and for collecting, storing and shipping samples in the field for diagnostic testing.”
“It is strongly recommend that complete tissue and blood samples be obtained from carcasses. If only selected samples are taken because a particular disease is suspected and the animal does not have that disease, these samples may be inadequate to test for other diseases that might be causing the epidemic. Furthermore, selective sampling limits the information that could be procured from a wild animal necropsy that could aid in future population or ecosystem management.”
Before performing a necropsy on an animal two important points need to be considered:
Source: Munson, 2005
1. “Zoonotic diseases: Could this species have a disease that is transmissible to humans? Diseases such as rabies or echinococcosis (Hydatid disease) in carnivores, anthrax, or rabies in ungulates, or psittacosis in birds can cause serious and fatal diseases in humans. Many primate diseases also can cause human illness. FOR THIS REASON, THE PERSON PERFORMING THE NECROPSY SHOULD WEAR A MASK and PROTECTIVE CLOTHING. Wearing a mask is particularly important when preforming a necropsy on a primate, bird, or a carnivore suspected of rabies or hydatid disease. In addition, all samples should be handled with care and unfixed samples should be placed in LEAK-PROOF containers so that dangerous infectious materials do not leak during transport.” “Reportable and infectious diseases: Could this animal have a disease that is infectious to livestock or other wild animals? Diseases such as anthrax, foot and mouth disease, or tuberculosis can spread to other animals through contamination of the environment during the necropsy procedure. Anyone necropsying wild animals should be aware of the typical lesions of these diseases and take extra precautions when decontaminating a necropsy site. Suspicious carcasses should be deeply buried to prevent scavenger access if anthrax is suspected.”
Equipment for Performing Necropsy
Source: Munson, 2005
The following important diseases have lesions that can be recognized at necropsy and should be handled appropriately. Note that animals with rabies do not have any typical gross lesions.
• “Anthrax: Ruminants have a large, dark “tarry” spleen; Carnivores have a swollen head or neck due to edema in the soft tissues. Blood smears contain large bacterial rods (3-10 μm long by 1 μm wide) with blunt ends surrounded by a capsule. Bacteria occur singly or in short chains. Carcasses with anthrax should not be necropsied.”
USAID/UGANDA: ENVIRONMENTAL MANAGEMENT FOR THE OIL SECTOR – TRAINING COMPENDIUM: MODULE 4 103

• “Echinococcus (“Hydatid Disease”): Clear cysts in the liver of carnivores or rodents” • “Tuberculosis: Nodules in the lungs, enlarged lymph nodes, or thickened intestinal wall.”
Autopsy Site
For small animals, they can be transported to the lab or the postmortem room. For large animals, they can be worked on in the field. A cement floor is appropriate as it facilitates disinfection.
If possible, the site should be remote from other wild animals and domestic animals. The site should be near where it is possible to dig a pit to dispose of the carcass.
Protective clothing
• Rubber boots • Rubber or plastic gloves • Rubber apron • Overalls (boilable) • Face mask including goggles to cover the eyes.
Postmortem equipment
The minimum requirements for conducting postmortems safely and satisfactorily are as follows:
• Curved knife for skinning • A straight pointed knife for dissection • Rat toothed and pointed forceps • A pair of dissecting scissors • A sterile scalpel handle and blades • An enterotome • Bone saw • Bone forceps or bone cutting shears • Axe • Sharpening stone and steel • Spring balance to weigh up to 10 kg • Nylon rope • Small gas or alcohol burner
Specimen containers and sampling equipment
• Sterile disposable 5 ml syringes and sterile needles (20 gauge) • Culture tubes with sterile swabs • Microscope slides in box • Sterile universal bottles • Sterile blood tubes • Plastic bags with closure tops • Heavy duty plastic sealing tape • 300 ml wide mouthed plastic containers • Aluminum foil • Measuring tape or ruler • Rubber or plastic gloves • Labels, waterproof marker pen or pencil • String
USAID/UGANDA: ENVIRONMENTAL MANAGEMENT FOR THE OIL SECTOR – TRAINING COMPENDIUM: MODULE 4 104

Transport equipment
• An insulated plastic cooler box • Leak-proof, screw cap, plastic containers • Absorptive packing material • String and heavy duty plastic sealing tape • Blue ice freezer packs. • Buffered 50 percent glycerine • Easy blood
Fixatives:
• 10 percent buffered formalin • 100 percent acetone for cytology • 70 percent alcohol for parasites
Disinfection material:
• Plastic bucket and brush • Nail brush, soap and towel • Borax • Sodium hypochlorite (0.5 percent) • 70 percent ethyl alcohol for disinfecting instruments • Sodium carbonate (5 percent)
Other equipment:
• Field microscope (with mirror or car battery attachment for light source) for checking for suspected anthrax cases before autopsy
• Portable centrifuge for serum separation • Camera and film or digital film • Note book
Samples usually taken:
• Blood (whole) • Serum • Blood smears • Lymph node and other tissue biopsies • Tissue samples (soft and bone) • Fecal • Hairs • Lesion swabs
Safety precautions
Source: Munson, 2005
“Because some diseases of wildlife can cause serious illness or death in humans, all carcasses should be handled as if they were harboring potentially dangerous diseases and precautions for personal safety should be exercised. Minimal protective clothing includes coveralls, gloves, and a mask that covers the nose and mouth, rubber boots. When necropsying a primate, a full-face shield, coveralls, and double gloves should be worn. A washable rubber apron also is recommended.”
USAID/UGANDA: ENVIRONMENTAL MANAGEMENT FOR THE OIL SECTOR – TRAINING COMPENDIUM: MODULE 4 105

“Besides the biological agents, the persons carrying out the examinations should take caution against any possibility of physical effects of injury from instruments like knives, scalpels, and other sharp objects like sharp sticks. While performing a PM in the field, one should keep an eye of the surroundings, as there may be other dangerous animals like snakes, predators like lions, etc.”
“In investigations involving oiled wildlife, care must be taken since petroleum products are volatile and therefore possibilities of fires. The grounds where oil has spilled also are always slippery and therefore extra care should be taken to avoid follows.”
“PPE should also be worn since the carcasses or the live animals being handled may be harboring infectious or potentially infectious agents.”
Carcass handling and disposal
Source: Munson, 2005
“Diseased wildlife also should be handled to minimize exposure of other wild and domestic animals. If Anthrax is suspected, a blood smear should made by nicking an ear vein or other available vein and checking for Bacillus anthracis by microscopy before the carcass is opened. Carcasses with anthrax or other infectious diseases should be buried (preferably covered with a disinfectant and buried at least 2 m deep to prevent scavenging).”
Shipping samples
Source: Munson, 2005
“Fresh and frozen samples should be packaged so that no leakage occurs.”
“All containers, tubes, slides, and bags should be labeled using a waterproof marker. Placing a second label in a plastic bag that is then attached to the container adds further security. For formalin-fixed tissues, a paper label with the animal identification written in pencil can be submerged in formalin with the tissues.”
The following information should be included on the labels:
• Date • Geographic location (Park name or nearest town, country) • Species • Sex and approximate age • Tissue Identification (this is not necessary for formalin-fixed tissue samples) • Person taking sample
Performing the Necropsy
General considerations
Source: Munson, 2005
• Checking for anthrax • Determine if anthrax is present • Blood smear procedure • Before opening a carcass, blood smears should be obtained from peripheral areas (in ungulates)
or from areas of swelling (in carnivores).
IF ANTHRAX BACTERIA ARE SEEN ON BLOOD SMEARS, THE CARCASS SHOULD NOT BE OPENED.
“Opening a carcass with anthrax will cause the bacteria to sporulate and disperse the spores throughout the environment.”
USAID/UGANDA: ENVIRONMENTAL MANAGEMENT FOR THE OIL SECTOR – TRAINING COMPENDIUM: MODULE 4 106

“To screen for anthrax before a carcass is opened, a small amount of blood should be obtained from an ear vein or coronary band. In carnivores, blood should be obtained from areas on the face and neck that are swollen. When the smears are dry, label one end of the slide (with a solvent resistant pen or pencil) with the date, species, animal ID, and location. Slides can then be transported to a laboratory or stained in the field with New Methylene Blue or a Wright’s stain kit. Anthrax bacteria appear as large (up to 10 μm long) rectangular rods, alone or in chains and surrounded by a capsule. Anthrax bacilli obtained from a recently dead carcass usually do not form spores.”
Handling decomposed carcasses
Source: Munson, 2005
Examining the carcass (external examination) and its environment:
• “Assess the condition of the environment. • Note recent weather conditions that could have caused animal deaths (drought, floods, electrical
storm, etc.). • Note any anthropogenic cause of death, e.g., evidence of deliberate poisoning, oil spill, etc. • Note the ambient temperature. • Note signs of struggle. • Note any bite wounds or other signs of predation. If wounds are present, look for bruising and
bleeding in the tissues near the wounds, which would indicate that they occurred before the animal died. Otherwise, these wound most likely were caused from the carcass being scavenged.
• Look for broken bones, missing hair, broken or missing teeth, or other signs of trauma. • Look for and preserve any external parasites. • Determine nutritional status of the animal. • Take weight (if possible) and/or body length and girth. Assess fat stores under the skin and in
body cavities. • Note the amount of fat around the heart and kidneys. • Note the muscle mass of the animal. • Note the amount of food in the digestive tract. • Note the condition of the teeth. • Most carcasses will have some autolysis8, but diagnostic tests can still be performed if tissues are
properly handled. • Handle autolyzed tissues for histopathology very gently. • Hold tissues at the edges only. • Cut with a sharp knife or scalpel. • Quickly place in formalin. • Freeze or refrigerate samples as soon as possible for infectious disease or toxicology testing. • Autolysis can cause many artifacts in tissues that can be confused with a disease process.
However, it is always best to take a sample from an area that looks abnormal rather than assume that the change was caused by autolysis. Histopathology will be able to distinguish between true lesions and postmortem changes.
• Perform tissue sampling procedures. • Perform histology. • Samples should be taken from all major organs and any abnormal areas. • All samples should be placed in a common container of 10 percent buffered formalin. • Submerge tissues in 10 times the volume of formalin as the volume of tissue.”
8 Autolysis: the destruction of cells or tissues by their own enzymes, especially those released by lysosomes.
USAID/UGANDA: ENVIRONMENTAL MANAGEMENT FOR THE OIL SECTOR – TRAINING COMPENDIUM: MODULE 4 107

“Samples should be no thicker than 1 cm (for good fixation) but long and wide enough to represent the different areas of a tissue as well as any abnormalities. Samples that include abnormal areas and surrounding normal areas are best.”
“Samples should be handled carefully by grasping at the edges. Do not scrape surfaces of tissues or compress them with forceps.”
“Most tissues do not need individual labeling. If a tissue needs special labeling (e.g., a specific lymph node), place it in a different container (or tissue cassette) or attach a piece of paper to the tissue with string or a pin and label the paper or container with pencil or waterproof marking pen.”
Microbiology (bacteriology and virology)
Source: Munson, 2005
“To take samples without contaminating them, the samples need to be taken before tissues are touched and the instruments need to be sterilized. These samples also should be placed in sterile containers. To sterilize instruments: dip the tips in alcohol and then flame them or flame the tips until they are red and then let them cool. Samples also can be taken with a sterile swab, sterile syringe, or by placing a large (3 cm2) section of tissue in a sterile container (the center of the tissue will be uncontaminated).”
“Take samples that contain abnormal areas. Appropriate samples include whole blood, pus, areas with abscesses or nodules, or intestinal contents (within a loop of intestines). When taking samples from infected tissues, select an area near the edge of the affected tissue where live organisms are most likely to be found. If no abnormal areas are present, take standard tissue samples of lung, liver, kidney, spleen, tonsil, and intestines.”
“Keep samples moist with sterile transport media, sealed in a sterile container and cold. If refrigeration is not available, samples can be placed in buffered glycerin.”
“Smears of pus or infected tissues also are useful and can be air-dried and shipped with cultures.”
Serology
Source: Munson, 2005
“Serum should be placed in sterile tubes then stored and shipped frozen.”
Obtaining serum from a carcass
Source: Munson, 2005
“In recently dead animals, the right heart usually contains plasma clots (yellow/tan material), unclotted blood, or clotted blood. Plasma or blood should be removed and left undisturbed for approximately 30 min to encourage clot formation, then centrifuged at approximately 2000 X G for 20 min. The Mobilespin centrifuge from Vulcon Technologies (718 Main, Grandview, MO 640330 USA; 816-966-1212 or fax 816-966-8879) is portable and easily adapted for field use. When a centrifuge is not available, serum can still be obtained by letting the clot or blood cells settle. The serum (clear/yellow fluid or red-tinged fluid if the animal is autolyzed) or plasma should be separated for the blood cells, divided into at least two aliquots, transferred to vials, and then refrigerated or frozen (-20° or -70° C) until transported to a laboratory. Serum vials should be labeled with the species, animal ID, date, and owner (e.g., country and park) using a waterproof marker.”
“If a centrifuge is not available and blood is obtained from a live animal or a dead animal whose blood has not yet clotted, remove whole blood into a blood tube, let the blood clot with the tube inverted (rubber stopper down), then turn the tube right side up and very carefully remove the stopper with the blot clot attached, leaving the serum in the tube.”
USAID/UGANDA: ENVIRONMENTAL MANAGEMENT FOR THE OIL SECTOR – TRAINING COMPENDIUM: MODULE 4 108

Toxicology
Source: Munson, 2005
“Take samples and place half of each sample in aluminum foil and half in plastic bags or containers (aluminum or plastic interfere with the testing of some toxins). Samples should be stored frozen (if possible) until shipped to a laboratory.”
Parasitology
Source: Munson, 2005
“Make at least 3 blood smears on clean glass slides.”
“Fix approximately 2 g feces in 70 percent ethyl alcohol or formalin.”
Making slides for cytology:
• “Make a clean cut with a scalpel blade across the surface of the abnormal area of the tissue you wish to examine.
• Grasp the sample firmly with forceps, placing the cut surface down. • Blot the cut surface of the sample across a paper towel or other absorbent surface until no
blood or fluids are evident. • Then gently touch the blotted surface in several locations on clean slides. • Air dry slides.”
General steps to performing the necropsy
Carcass dissection (carnivore)
Source: Munson, 2005
“The necropsy method outlined provides a simple consistent method to examine a carcass and its body organs. A carnivore has been used to demonstrate carcass dissection and tissue sampling procedures. Procedures for necropsy of ungulates, birds, and reptiles also are demonstrated. Very small animals (less than 100 g) can be fixed whole by opening the body cavity and submerging the entire animal in formalin.”
“All carnivores and ungulates are placed on their left sides so that the right side of the carcass is opened. All birds, reptiles, and primates are placed on their backs.”
“After the body cavities are opened, the general nutritional condition of the animal and location of all organs should be assessed (to determine if any organs are displaced) before organs are removed. At this time, a sterile blood sample for culture can be removed from the heart (the right atrium is the best location), then additional blood can be taken to obtain serum for serological tests. In addition, sterile samples of other organs should be taken for culture before organs are handled.”
“After the general condition of the animal has been recorded, individual organs can be removed, examined, and sampled in a systematic manner. Any abnormal findings (lesions) should be described. Photographs of abnormal findings provide the best documentation for records.”
Describing abnormalities found at necropsy
Source: Munson, 2005
“Any abnormality should be described by the following criteria: • Location • Number and distribution • Color • Size
USAID/UGANDA: ENVIRONMENTAL MANAGEMENT FOR THE OIL SECTOR – TRAINING COMPENDIUM: MODULE 4 109

• Shape • Consistency and texture For example: “The liver contains multiple tan, firm nodules ranging from 1 to 3 cm in diameter that are distributed throughout all liver lobes. The nodules are gritty on cut surface.” Procedure for Dissecting Carnivores
Opening the carnivore carcass
Source: Munson, 2005
• “Examine the carcass for wounds and note the general condition of the fur. • Place the carcass on its left side. • Cut the skin along the ventral midline from the chin to the tail. On females, examine the
mammary glands. On males, examine the prepuce and penis. On neonates, examine the umbilicus.
• On the right side, reflect the skin to the level of the backbone. • Reflect the right limbs by cutting through the muscles and the hip and shoulder joints. • Open all three body cavities (abdomen, chest, heart). • Remove the flap of muscle and other tissues that cover the right side of the abdominal cavity. • Open the right side of the chest cavity by cutting the ribs along the sternum and backbone. • Open the sac surrounding the heart. • Record any abnormal locations or size of organs. • Record the quantity, color, and contents of any fluids in the body cavities. Look for abnormal
attachments of organs to the body cavity and determine if these attachments are easy to break.”
Stomach and Intestines
Source: Munson, 2005
“Remove stomach and intestines first but open them last to prevent contamination of the necropsy site. Find where the esophagus enters the stomach and cut across the esophagus while holding the entry to the stomach closed to keep any food inside. Remove the stomach and intestines as a unit by cutting the mesentery where they attach to the intestines. Sample several lymph nodes along the attachments of the intestines. Leave the pancreas attached to the intestines and the spleen attached to the stomach. Cut across the rectum while holding it closed to prevent feces from escaping. Open the intestines along their length (intestines are best opened at the end of the necropsy to prevent contamination of other organs with food and fecal material). Note the content of the intestines (amount of food, presence of abnormal materials such as poisonous plants). Take stomach contents for toxicology. Take tissue samples from all areas of the GI tract and the pancreas.”
Spleen, Liver, and Pancreas
Source: Munson, 2005
“Remove the spleen from the stomach, examine it for abnormalities by slicing it across in multiple sites and then remove samples for histology. Remove the liver; open the gall bladder. Examine the liver by cutting it across in multiple sites. Take samples for histology and toxicology.”
Kidneys and Adrenals
Source: Munson, 2005
“Remove and examine the adrenal glands and take transverse samples for histology. Remove the kidneys, examine them for abnormalities, and take samples for histology that include the cortex, medulla, and pelvis and take samples for toxicology. Remove the bladder and take a section for histology.”
USAID/UGANDA: ENVIRONMENTAL MANAGEMENT FOR THE OIL SECTOR – TRAINING COMPENDIUM: MODULE 4 110

Reproductive Tract
Source: Munson, 2005
“Remove the reproductive tract (testis if male; uterus and ovaries if female) and make a cut across the gonads and into the uterine lumen before placing in fixative for histopathology.”
Heart and Lungs
Source: Munson, 2005
“Separate the bones of the larynx behind the tongue and dissect out the trachea with esophagus attached. Continue into the chest including the lungs, heart, and large blood vessels. Take a sample from the thymus if present.”
“Open, examine, and sample the trachea and other airways and the esophagus. Take samples from lymph nodes surrounding the airways.”
“Examine the lungs for lumps and areas of firmness. Take samples of any abnormal areas, as well as areas that look normal.”
“Open the chambers of the heart and examine the heart valves between the chambers. Take samples of the heart including valve. Open the great vessels and take a sample.”
Head and Oral Cavity
Source: Munson, 2005
“Examine the eyes, mouth, and nostrils for ulcers and abnormal discharges. Remove an eye for histology by cutting the muscles around the eyeball. Cut between the lower jawbone and tongue and remove the tongue from below. Examine the inside of the mouth, tonsils, and teeth. Remove the other tonsil and several lymph nodes under the skin at the angle of the jaw and above the larynx for histology.”
Brain
Source: Munson, 2005
“To remove the entire brain: Separate the skull from the neck at the junction with the vertebra. Remove the skin from the top of the head then the top of the skull using the illustrated landmarks. Remove the brain and cut it in half. Preserve one-half in formalin and split the other half into containers for virology and toxicology.”
“If rabies is suspected, extra precaution should be used when removing the brain. The person removing the brain should wear a face shield or mask and eye goggles. The safest procedure is to remove the head and insert a drinking straw through the hole at the base of the skull where it attached to the neck. The straw should be inserted in the direction of the eye. Pinch the base of the straw and remove the straw with the brain sample. Then cut the straw (with the brain sample still inside) into 1 cm lengths and drop the sample in either glycerin or formalin. Although this procedure is very safe, it only allows testing for rabies. Therefore, if the samples are negative for rabies, no other brain tissues are available to test for other diseases.”
“The best procedure is to remove the entire brain, then cut it lengthwise down the middle. Send one-half to a laboratory to test for rabies and fix one-half for histology.”
Skeletal Muscles and Nerves
Source: Munson, 2005
• Take samples of the diaphragm and several leg muscles. • Take a sample of the large nerve between the muscle bundles of the back leg.
USAID/UGANDA: ENVIRONMENTAL MANAGEMENT FOR THE OIL SECTOR – TRAINING COMPENDIUM: MODULE 4 111

Bone Marrow
Source: Munson, 2005
“Remove a long bone from the leg and crack it open in the middle. Fix one-half for histology and store half for microbiology.”
Opening the Ungulate Carcass
The procedures for ungulates are the same as for carnivores, except that all forestomach chambers should be opened.
Opening the Bird Carcass
Source: Munson, 2005
• “THE PROSECTOR SHOULD WEAR A MASK because humans can acquire psittacosis, tuberculosis, and fungal diseases from birds.
• Dip the carcass in water containing a disinfectant or spray it to wet the feathers. • Examine the carcass for evidence of trauma and ectoparasites. • Place the bird on its back and open the skin from the beak to the vent. • Retract the skin to expose the keel and breast muscles, ribs, and muscles over the lower
coelomic cavity. Assess the amount of body fat under the skin and in the body cavity. Assess the amount of musculature over the keel.
• Open the coelomic cavity by making a horizontal cut at the bottom edge of the keel extending on each side through the pectoral muscles and then lifting the sternum. Cut the ribs and clavicle near the attachment to the sternum. Open the caudal part of the sternum long the midline.
• Inspect the location and size of all organs. Examine the air sacs for transparency and note any plaques or opaque areas. Note any abnormal fluids.
• Using sterile instruments, take sterile samples of any visible lesions as well as of spleen, lung, and liver.
• Remove the tongue, trachea, esophagus, and heart as a unit. Take the thyroid glands for histology (thyroids are located at the thoracic inlet where the major blood vessels above the heart branch). Open the trachea and heart and take samples for histology.
• Gastrointestinal tract, liver, and spleen: Remove the liver and take samples for histology and toxicology. Remove the proventriculus and ventriculus (gizzard) and intestines, including the cloaca and bursa of Fabricius. Note the spleen at the junction of the proventriculus and ventriculus. Fix what is remaining of the spleen (after taking a sample for culture) for histology. Open the intestinal tract along its length, noting the content and taking samples for toxicology. Leave the pancreas attached to intestines and take samples
• Lungs: Dissect the lungs away from the body wall, examine them for firmness or lumps, and take samples for histology.
• Reproductive tract, adrenal glands, and kidneys: The gonads (testes in the male or left ovary in the female) are located in front of the kidneys along the backbone. The adrenal glands are located just in front of the gonads and are also attached to the body below the spine. The female also should have an oviduct visible. Bluntly dissect the kidneys from the body wall, leaving the gonads and adrenals attached. Fix for histology.
• Brain: Remove a section of skull covering the brain, remove a sterile sample (half of the brain, if possible) for microbiology and then fix the rest in the skull (in small birds) or remove the brain from skull before fixing (in larger birds).
• Bone marrow: Remove a tibiotarsal bone and crack it open before fixing. • Nerves: Take samples from the large nerves between the wing or the leg and the body wall.”
USAID/UGANDA: ENVIRONMENTAL MANAGEMENT FOR THE OIL SECTOR – TRAINING COMPENDIUM: MODULE 4 112

Gastrointestinal Tract, Liver, and Spleen
Source: Munson, 2005
“Remove the liver and take samples for histology and toxicology. Remove the proventriculus and ventriculus (gizzard) and intestines, including the cloaca and bursa of Fabricius. Note the spleen at the junction of the proventriculus and ventriculus. Fix what is remaining of the spleen (after taking a sample for culture) for histology. Open the intestinal tract along its length, noting the content and taking samples for toxicology. Leave the pancreas attached to intestines and take samples.”
Lungs
Dissect the lungs away from the body wall, examine them for firmness or lumps, and take samples for histology.
Opening the Reptile Carcass
Source: Munson, 2005
“The procedure for reptiles is similar to birds. A snake is used as an example. Other reptiles have similar organ anatomy, although the kidneys of lizards are further back in the pelvis.”
• “The animal is placed on its back and examined for evidence of trauma. Open the body along the midline. For turtles, the plastron is removed at the junction with the carapace with a saw. The amount of body fat and condition of the musculature is assessed and any abnormal fluids recorded. Take sterile samples of lungs, liver, and spleen for culture before handling the tissues.”
• “Find the thyroid(s) anterior to the heart (single midline organ in some species and paired in other species) and remove and fix them for histology.”
• “Beginning at the mouth, remove the trachea, heart and lungs. Open the trachea and examine the lungs for firmness or lumps. Open the heart. Take samples of all organs for histology.”
• “Remove the intestinal tract as a unit, beginning in the oral cavity. Open the esophagus, stomach, and intestines along their length and take samples for histology.”
• “Remove the liver, spleen, and pancreas. Examine and sample for histology.” • “Remove the gonads and adrenals (along the midline in front of the gonads). In females, remove
the oviduct with the ovaries. Dissect the kidneys from the body wall. Take samples for histology.”
Post-Necropsy
Disinfecting the Necropsy Site
Source: Munson, 2005
“The carcass and all tissues from the carcass including blood soaked dirt should be buried or incinerated. All contaminated paper or plastic materials should be either thoroughly disinfected or incinerated. All blood and residual tissues should be removed from the instruments and tools with soap and water. Then the instruments should be disinfected. Necropsy boots and apron should be cleaned and any contaminated clothing thoroughly washed. The external surfaces of any containers with samples should also be washed.”
Storage or Submission of Samples
Shipping Samples
Source: Munson, 2005
“Formalin-fixed samples can be kept at a cool room temperature until shipped. Any samples for culture should be kept refrigerated (for parasitology or bacterial cultures) or frozen (for toxicology or virus cultures). Freezing at -70° C is preferable to -20° C (standard freezers).”
USAID/UGANDA: ENVIRONMENTAL MANAGEMENT FOR THE OIL SECTOR – TRAINING COMPENDIUM: MODULE 4 113

• “Contact the laboratory before shipping. • Check regulations for shipping tissue samples. Get proper permits and use the correct
containers. • Frozen samples must be shipped in insulated containers and by express carrier. Pack specimens
in dry ice or with ice blocks. Seal container to prevent leakage. Include proper permits and animal identification.
• Formalin-fixed tissues should be fixed for at least a week in 10 times as much formalin as tissue. Then most of the formalin can be removed and tissues can be wrapped in toweling soaked in formalin for shipping. The tissues soaked in formalin can then be placed in leak-proof containers for shipping.
• IT IS BEST TO SHIP FROZEN and FIXED SAMPLES SEPARATELY. IF THEY MUST BE SHIPPED TOGETHER, then insulate the fixed tissues from freezing by wrapping in newspapers. Ensure that there is no spillage of formalin, because fixation of frozen samples will make culturing for bacteria or viruses impossible and will alter cells on blood smears or cytology slides.
• Contact appropriate local or national governmental personnel. • Collect samples from as many dead or affected animals as possible. • Collect the following information on the epidemic/incident:
− Species and approximate number affected − Signs the animals are showing − Location of affected animals”
Dealing with an Epidemic/Oil Spill Incident
See the appropriate notes in the protocols for the processing of oiled wildlife.
Protocols for the Processing of Oiled Wildlife
The following text has been derived from the “Protocols for the processing of oiled wildlife in the state of California” prepared by the Point Blue Conservation Science and University of California Davis Wildlife Health Center in 2014. This document can be accessed at http://data.prbo.org/cadc2/uploads/Articles/OilSpill/oiled-wildlife-processing-protocols_VERS7.1_mar2014_WITH-APPENDICES.pdf
Introduction to Wildlife Processing
The “Protocols for the processing of oiled wildlife in the state of California” document was created to provide operational guidance to personnel as they receive and process debilitated animals and carcasses at Processing Centers during an oil spill response. Since the oil and gas developments are new in Uganda, and as the country continues to prepare and to learn from other places and experts, there is need to have an Incident Command System (ICS) to help in the collection, handling, and processing of oiled wildlife and carcasses. The team required to carry out these roles will include personnel from EPIs, researchers from institutions of higher learning, personnel from District Local Governments, UWA and Uganda Wildlife Education Center and other volunteer organizations and individuals.
Human Health and Safety
Source: Point Blue Conservation Science and UC Davis Wildlife Health Center, 2014
“The health and safety of the oil spill responders is paramount and is assessed regularly during spill response. All Processing Strike Team members are required to receive health and safety training prior to working at an oil spill facility or handling oiled wildlife. Relevant trainings include; those given during wildlife processing training courses, annual wildlife rehabilitation training conferences, during prior oil spill responses, or when the responder arrives at the center but before engaging in active
USAID/UGANDA: ENVIRONMENTAL MANAGEMENT FOR THE OIL SECTOR – TRAINING COMPENDIUM: MODULE 4 114

response. Even if a responder has received training in the past, refreshers may be required during a given spill response to ensure familiarity with proper health and safety practices.”
“Proper PPE (e.g., safety glasses, gloves, and protective outerwear) must be worn under all circumstances when handling any oiled wildlife (alive or dead).”
Wildlife Handling
Source: Point Blue Conservation Science and UC Davis Wildlife Health Center, 2014
“Wildlife veterinarians and practitioners experienced in handling wildlife will take lead and will train and direct the other members of the PST and CST. Worker and animal safety should be emphasized in these operations. Proper training, experience, or supervision is therefore critical.”
Handling Live Birds
Source: Point Blue Conservation Science and UC Davis Wildlife Health Center, 2014
“A warm, quiet, and dark environment should be created at each center for live birds awaiting processing and/or transportation. All personnel must be trained and have experience using methods that minimize human contact with the animals. Teamwork is essential to minimize stress to oiled birds. Handlers must protect themselves from injury and oil contamination while also protecting the bird from further oil contamination. In addition to appropriate PPE, new gloves must be worn and new towels used for each bird handled, even when birds do not appear oiled.”
“It is essential to keep live birds under control at all times in order to minimize the risk of injury and keep them calm and safely controlled. An effective method for maintaining physical control over a marine bird, depending on the size of the animal, is to wrap the bird in a fresh towel to restrict motion and hold the bird against your abdomen. This can be accomplished with one hand, allowing for freedom of motion with the other. Cover the head and eyes, but be careful not to cover the nares or impede respiration. Most shorebirds can be comfortably held with one hand using the “bander's grip,” which holds the bird’s neck between the middle and forefinger and pins the wings against the bird’s body with the same hand. Personnel unfamiliar with this method should be trained how to do it by experienced handlers. Larger birds and some species with sharp bills should be carried using both hands near the handler's waist with the head controlled at all times. When restraining a bird, it is extremely important to be sure that the wings are folded in their natural position. This ensures that a bird's injuries are not exacerbated and that new injuries are not inflicted during handling. It is essential for responders to remain calm and alert whenever handling wildlife; a bird that appears passive or relaxed at one moment may exhibit explosive energy the next.”
“Since most marine/aquatic birds defend themselves with their bills, it is important to have control of each bird’s head at all times during handling. Protective eyewear should always be used, especially with certain species such as grebes, loons, or egrets. Aggressive birds such as raptors, cormorants, and herons can seriously injure handlers. The most important consideration is to restrain the part of the bird that can cause the most serious injury (i.e., raptors should have their legs and talons secured).”
Handling Dead Animals
Source: Point Blue Conservation Science and UC Davis Wildlife Health Center, 2014
“Each specimen is considered evidence and should be treated as such. Cross-contamination between carcasses should be avoided by replacing gloves and cleaning equipment between carcasses. Minimize direct physical contact with contaminated carcasses, and wear PPE (including safety glasses) for protection from oil or biological contaminants. Carcasses should be thawed prior to processing. Working in a ventilated space helps protect personnel from petroleum fumes.”
USAID/UGANDA: ENVIRONMENTAL MANAGEMENT FOR THE OIL SECTOR – TRAINING COMPENDIUM: MODULE 4 115

Handling Live Mammals and Reptiles
Source: Point Blue Conservation Science and UC Davis Wildlife Health Center, 2014
“Wildlife veterinarians and practitioners experienced in handling wildlife will take lead and will train and direct the other members of the PST and CST.”
An Overview of Wildlife Receiving and Processing
Source: Point Blue Conservation Science and UC Davis Wildlife Health Center, 2014
“All debilitated or dead birds and mammals will be brought to a Processing Center, usually located within or immediately adjacent to the primary rehabilitation facility for the response. For most oil spills or incidents (especially small and moderate events), there will be two stations for each Processing Center: one for live animals and one for dead animals.”
“Each station may be made up of several evaluation teams working on different animals, but there will only be one Data Log for each taxon (bird, mammal, other) at each station in order to prevent repetition of log numbers. All data forms must be labeled with the appropriate facility acronym, taxa and station information. Circle the appropriate species identifier (Bird, Mammal, or Other) on the Data Log, and record the facility acronym and oil spill name on the top of each log page. This will ensure these logs are kept separate from others. There will also be a choice on the Data Logs for new versus re-stranded animals, where re-strands include birds released during an incident and returned, live or dead, during the same incident. In a Level III (i.e., very large and/or extensive spill) response—or one over a large geographic area—the team may have to set up Processing Centers in multiple locations. In these circumstances, separate logs will be kept for each Processing Center.”
Each station (live or dead) is subsequently made up of two basic parts:
• “Receiving – all wildlife are officially “received” by the PST from Transporters working with either the Recovery Group or the Field Stabilization Group; log numbers are assigned and collection and arrival information are recorded.
• Processing – remaining data are recorded on the Data Log and evidence is collected.”
“Receiving for both live and dead wildlife can take place at the same location but data for live and dead animals must be kept on separate logs. Live birds will be kept in crates or cardboard boxes cushioned by towels or blankets to await medical assessment and processing. There should only be one bird per container; those boxes with more than one should be separated upon arrival at the facility until they have been through both processing and intake.”
“Carcasses should always be kept separate from live birds for health considerations. Carcasses and bird body fragments should arrive individually wrapped in aluminum foil or paper bags. As with live birds, there should only be one carcass per container. If more than one are in the same bag, they should be separated in order to prevent cross-contamination. Recovery personnel should not place them in plastic bags, which are made from petroleum products and therefore must not be placed in direct contact with carcasses. Receiving should not be conducted without PPE and gloves must be changed between each individual animal.”
Procedures for Receiving Wildlife at Center
Throughout the course of the response, oiled wildlife will be brought to the center. For each animal delivered, it is important to confirm that there is collection information for each animal. Once animals are turned over to the processing center, they become the legal responsibility of response personnel. From that point forward, response personnel will track, manage, and document all specimens.
USAID/UGANDA: ENVIRONMENTAL MANAGEMENT FOR THE OIL SECTOR – TRAINING COMPENDIUM: MODULE 4 116

Ensuring Collection Information Arrives with the Animal
Source: Point Blue Conservation Science and UC Davis Wildlife Health Center, 2014
“The following information should be provided for every animal (typically written on each carcass bag or accompanying the bird or dictated by the deliverer and recorded directly on the Data Log or transport container):”
• “Collector’s name (and phone number if not part of the Wildlife Recovery Group effort). If the collector is unknown, the deliverer’s name will be recorded here, preceded by “DEL” to distinguish them from the collector
• Collection location: general name and Global Positioning System (GPS) coordinates • The date the animal was recovered from the beach • The time the animal was recovered from the beach • Field ID number, or preprinted label number or band/tag number, if implemented. A field
banding/numbering system that links animals to stabilization documents (i.e., stabilization)”
“Form and Stabilization Census Form may be implemented by recovery personnel. Field bands will be orange. This information will be transferred to the appropriate Data Log. For dead animals, this can be transferred during processing and not necessarily during receiving. If the collector is unknown, the deliverer’s name, preceded by “DEL:”, will be recorded on the Data Log or initially on the bag/box itself. Note, data on species and oiling status collected by field personnel will not be transcribed to the Data Log.”
Starting Data Logs and Assigning Log Numbers
Source: Point Blue Conservation Science and UC Davis Wildlife Health Center, 2014
“Each animal should be recorded onto its appropriate (live or dead) animal Data Log with the facility acronym and spill name written on it and the appropriate options circled. Keep separate data.”
Logs at each primary care facility for:
• “Live versus dead animals • Birds versus mammals (versus “other” for additional taxa) • New birds versus “re-strands” (i.e., birds that were released earlier in the same incident and
return to the center live or dead)”
“Consecutive log numbers will be assigned to each individual animal immediately upon arrival at the Processing Center. This unique identifier will be used to track the animal throughout the entire process from intake to either release or archiving in the morgue. All data/evidence collected and all treatment received by this animal (medical evaluations, care, washing etc.) will be referenced by the log number, so it is critical that each animal is assigned an appropriate number and that it is clearly marked on the box and all relevant forms. Log numbers will have a prefix of “D” for dead animals and “L” for live animals, and will start with D-001 and L-001, respectively.”
“Non-avian taxa should be recorded on separate Data Logs, and are given an added prefix according to their taxa (e.g., mammals would be LM-001 onwards). Receivers will write the log number on the Data Log and on the box/bag/tag the bird came in.”
“In responses that cover a large geographic area, the PST may have to establish Processing Centers at different facilities. In this event, an additional standardized 2-3 character prefix will be added to the log number to identify the facility, thereby ensuring a unique log number for each animal recovered in the spill event. The full log number, inclusive of facility prefix, is in most cases only included in the electronic databases (e.g., L-103 becomes SFB-L-103 in database), and it can be added at data entry or post-hoc in batches, so that the records across facilities can be merged. The facility prefix will typically not be added to the band, the data forms, or the evidence. The exception is if an animal is transferred to another facility, upon which it will retain its original log # with full facility
USAID/UGANDA: ENVIRONMENTAL MANAGEMENT FOR THE OIL SECTOR – TRAINING COMPENDIUM: MODULE 4 117

prefix (including on the band). Prefixes are not in effect in the electronic database if there is only one primary care facility in use, as all data are affiliated with the same facility.”
“The next consecutive appropriate log number will be assigned to each animal as it is received and will be immediately be recorded in the Data Log, along with the date and time the animal arrived at the facility. The log number will also immediately be written on the transport box containing the live animal, on the green recovery tag affixed to the box, or on the paper bag containing the carcass (or on a tag attached to the carcass where a paper bag is not possible). It is crucial that log numbers are clearly visible as live birds will be processed in order of their arrival (i.e., log number sequence). The exceptions to this are priority species (e.g., T&E or sensitive), special cases, and those needing more immediate medical attention, which may be treated out of sequence. All individuals will then be given to the respective processing station.”
“Animals collected live but arriving dead at the Processing Center—even those that may have been treated at stabilization centers—are recorded on the Dead Animal Data Log. For re-stranded birds (ones released during the same spill event and returning live or dead), use original log number.”
“To ensure no data are lost, when large numbers of birds arrive at once and it is not possible to record all receiving-related data on the Data Log during receiving, the animal receivers will write the deliverer’s name, the arrival time and the date on a piece of paper that is attached to each group of birds arriving together (e.g., on a garbage bag the carcasses are in). For live birds this will require more creative organization (e.g., marking on a piece of paper the arrival time, date, and deliverer for birds 110-145 if log numbers are written on the boxes, or marking the beginning and ending of one batch with a piece of paper with these data). Receivers may take whatever approach they determine to be the most efficient in a given situation.”
Specifics on Receiving Live Birds
Source: Point Blue Conservation Science and UC Davis Wildlife Health Center, 2014
“If both live and dead birds are received simultaneously, live birds are given priority to reduce the length of time before the rehabilitation process begins. Receivers are responsible for the following:”
• “Assigning log numbers and acquiring all collection data (see above for instructions). • Determining if the bird is still alive. If it has died in transport—even if it was previously treated at a
stabilization facility—it is given the next consecutive dead bird log number starting with the prefix “D.” In the notes, record that it was alive when recovered and/or transferred. If during a large spill event there are official remote processing centers where birds are actually assigned log numbers, any bird that dies en route from the processing center to the primary care facility will retain its original (live) log number.
• Ensuring that each box contains only one bird. If there is more than one bird in a box, separate them and be sure to note on the Data Log which bird it was with (in case of cross-contamination). Each bird gets its own log number.
• Assessing the condition of the bird (for processing and/or medical care prioritization) • Ensuring that birds are cushioned by towels or other appropriate materials, and are in a large
enough box. • Ensuring that animals are not in cloth bags or pillowcases, and are not covered by their towel as
this can impair respiration. • Checking to see if the bird is actually oiled. Live but unoiled birds should not be added to the
spill Data Logs. Receivers must check each live bird for oil before assigning it a log number. In many cases (check with Care and Processing Group Supervisor) unoiled birds in need of rehabilitation will be sent elsewhere. All unoiled birds should also be checked for leg bands to determine if they are re-strands. It may be more efficient to check for bands on oiled birds during intake and processing, at which point the bird will have to be reassigned back to its original log number if it is a re-strand.”
USAID/UGANDA: ENVIRONMENTAL MANAGEMENT FOR THE OIL SECTOR – TRAINING COMPENDIUM: MODULE 4 118

Prioritize birds for the live processing station according to the following criteria:
Source: Point Blue Conservation Science and UC Davis Wildlife Health Center, 2014
• “Birds of endangered, threatened, or special concern status should be dealt with first. • Current special status lists should be downloaded/accessed at the time of the spill and available
at the processing stations. PST and CST Leaders should be alerted to the presence of special status species.
• Any bird that appears to be in critical condition or distress should be seen by the animal care staff as soon as possible; alert a veterinarian to its condition and move the animal to the front of the line if multiple birds are waiting to be examined. It may be examined prior to the collection of the rest of the processing data.
• Any birds with medical issues documented on their stabilization form, on their orange • Stabilization First Aid tag, or on the green Collection tag should be brought to the attention of
the animal care staff. PST personnel should check the forms/tags that arrive with birds to identify such issues.
• All other birds should be processed in the order of arrival, which should correspond with the order of their log number. The log number must be clearly visible on the transport box and the boxes should be ordered accordingly.”
Specifics on Receiving Dead Birds
Source: Point Blue Conservation Science and UC Davis Wildlife Health Center, 2014
“Processing Strike Team receivers will write the next consecutive dead animal log number in permanent marker on each carcass bag received, and will record this in the Data Log along with the date and time the carcass arrived at the facility. Receivers are responsible for the following:”
• “Assigning log numbers and acquiring all collection data (see above for instructions). • Checking that carcasses are packaged properly. If any arrive loose or plastic, place them in
individual paper bags and transfer any information from the original packaging/tag to the Data Log. Also record into the Data Log notes that it was initially contaminated by plastic. Ask the collector (if present) not to use plastic if they recover any additional specimens.
• Ensuring that each bag contains only one dead bird; if not, place each extra carcass in its own bag with a unique log number. Be sure to record in the Data Log notes that the carcass was contaminated by other dead birds. If it is busy and there is not time to investigate this during receiving, personnel will address this issue during processing and assign the next available log number to the second carcass.
• Carcasses that have been through receiving should be stored in boxes or other containers along with other carcasses collected on the same date until they can be processed. It is not always possible to process dead birds when they arrive at the facility, so if they are not going to be processed until a later date or much later that day, they should be stored in a locked freezer.”
Processing Procedures
Record all information collected during processing on the Live Animal Data Log or the Dead
Animal Data Log (see below).
An Overview of Live Bird Processing
Source: Point Blue Conservation Science and UC Davis Wildlife Health Center, 2014
“If the Processing Center and the Medical Intake area of the Primary Care facility are joined or adjacent to one another (as will generally be the case in Level I and Level II responses) it is in the best interest of the bird to combine the preliminary medical examination with processing. To
USAID/UGANDA: ENVIRONMENTAL MANAGEMENT FOR THE OIL SECTOR – TRAINING COMPENDIUM: MODULE 4 119

minimize stress to debilitated birds, only one person (an experienced animal handler) should handle each bird during this period, unless the species requires two or more handlers for safe restraint.”
“Under circumstances where a spill has occurred at a significant distance from a Primary Care facility and the veterinary stabilization facility/facilities close to the spill site does/do not include Processing Centers, live animals will generally only receive first aid (i.e., fluids, warmth) at stabilization centers but will not be processed at these sites. Separate stabilization forms will be used at these sites to indicate these therapies and capture information critical for ultimate processing (capture and location data) and will accompany animals to the Primary Care facility. Personnel will staple this form behind the Intake Form that will be initiated at the Primary Care facility.”
“Another possible option, should large numbers of live and dead animals be collected at a significant distance from the Care facility, is that temporary Receiving Centers may be established at the remote location and staffed by one or more members of the response team to ensure appropriate data collection. If official processing has begun at one of these remote facilities, Chain of Custody forms are required for their transfer to the Primary Care facility.”
Procedure for receiving and processing live birds:
1. “Begin an Intake Form for each bird, recording the log number (which was assigned during receiving and written then on the box and Data Log) and collection information on it, and attach any stabilization forms that may have arrived with the animal (also writing the log number on top of the stabilization form). These forms are then affixed to the box containing the bird (e.g., inserted through the handle).” “Once all collection information has been transcribed from the Animal Collection Tag to the Data Log, the log number is written on the tag that is then filed in a box or envelope in case they need to be referred to later. If too busy, if a bird needs to be immediate veterinary care, or if the pertinent pages of the Data Log are in use at the live bird processing station (where photograph, banding, and feather sampling occurs), then this information can be transcribed to the Data Log later from the Collection Tag.” “Visually examine each bird in its box, identify it to species (handling it briefly if necessary for this purpose), and write the species on the Intake Form and Data Log.” “Organize batches of birds such that care personnel can grab the next consecutive (or otherwise prioritized) log numbered bird to complete processing and conduct an intake examination. It is imperative that in situations where many birds are waiting for intake and processing, they are done in order.” “Take the next bird out of the box, and brings it to the response staff in charge of the photograph, banding, and feather sampling (often in assembly line format if there are many birds present). The time and date of processing are recorded on the Data Log at this point, and the name of the processor and oiling status are filled out on the Intake Form.” “Any orange field band is removed, recorded on the Intake Form and Data Log, and replaced with a temporary band labeled with the log number. Personnel will use an industrial permanent marker to label a temporary band with the bird’s log number.” “Multiple bands can be prepared in advance. Banders will vary the color of the band used (following the guidelines of the oiled bird color band key), even within a batch of birds, so that it is easier to tell individual birds apart from one another. Bands will generally be prepared at the live bird processing station at the same time as the photo and feather samples are taken. Smaller shorebirds (band size 1 through 3) do not get such a temporary band, but instead will be banded with a unique combination of colored plastic leg bands which will not be marked with their log number (see Temp Band/Tag Color and Number below for details). Personnel will write the band number or color combination both on the Data Log and the Intake Form.” “The evidence (photograph and feather sample) is collected, recorded as such on the Data.” “Log and Intake Form, and labeled and stored as outlined in the processing instructions.”
USAID/UGANDA: ENVIRONMENTAL MANAGEMENT FOR THE OIL SECTOR – TRAINING COMPENDIUM: MODULE 4 120

“The animal handler brings the bird to an intake station.” “Care personnel conduct the intake exam. After completion, care personnel confirm that the processing section on the Intake Form is filled out before advancing the bird to Prewash.” “Care and bring the bird to the processing station if incomplete.” “The bird may now begin the regular rehabilitation process.”
A Note about Long Waiting Periods
Source: Point Blue Conservation Science and UC Davis Wildlife Health Center, 2014
“All live birds will be processed before being moved to stabilization or removed from their boxes and put in pens. Exceptions will be made if birds need to be treated medically. Also, if the wait will be long before intake and processing can be done (e.g., relatively large spills), birds may be individually housed in standard net-bottomed rehabilitation pens. These birds must remain separate from the birds in prewash care, and this should be done only with the careful oversight by care and processing leaders. Additionally, birds waiting long periods before intake and processing can be gavaged with fluids in their boxes. Care and processing leaders must be involved in this process so birds can be tracked and not handled immediately after being gavaged. Extreme care will be taken to make sure the earliest arriving birds go through intake and processing first.”
An Overview of Dead Bird Processing
Source: Point Blue Conservation Science and UC Davis Wildlife Health Center, 2014
“Dead birds will be processed in a designated area (or areas) at the center. If needed, multiple dead bird processing teams can be working simultaneously at one center. Dead bird processing is simpler than live bird processing (above) as all data, except those collected upon arrival, are collected at one time. Before processing dead birds, spread a large, clean sheet of heavy duty aluminum foil on the counter where the response Data Collector is stationed and place the carcass on the foil during processing; upon completion, this foil will be used to wrap the carcass.”
An Overview of Mammal Processing
Source: Point Blue Conservation Science and UC Davis Wildlife Health Center, 2014
“In larger mammal events, the response team will likely oversee the processing of mammals and be responsible for data and evidence management, working closely with the aforementioned groups. In events with few or no live aquatic mammals, reptiles, and amphibians, the PST may be responsible for processing dead mammals, reptiles, and amphibians. In either case, the forms identified in this document should be used for consistency in record keeping, with the pertinent data then transcribed onto the appropriate agency paperwork later. See Feather/Oil Sample section below for more detailed instructions on collecting oil samples from aquatic mammals and reptiles.”
A Note about Birds Arriving with Federal Bands (Includes Re-strands)
Source: Point Blue Conservation Science and UC Davis Wildlife Health Center, 2014
“If a live bird arrives at the facility already banded (which will typically be noted at processing), check to see if they are re-strands (returned birds released during same incident). Re-strands are logged on a special “Re-strand” Live or Dead Bird Data Log (instead of the normal “New” Live or Dead Bird Data Log) with their original log number, and given a new line of data.”
“All re-strands are processed, regardless of oiling status (with “re-strand” written on all evidence), and may be treated at the facility at the discretion of the Care and Processing Group Supervisor.”
“Processing personnel will alert the team leader to the arrival of any re-strand. Any carcasses arriving with bands will also be checked against banding logs from the incident, and those that are re-strands will be logged on the dead bird re-strand log with their original log numbers. Again, processing personnel must notify the team leader of this event. Re-strands will also have their band carefully recorded in the Notes field. Banded birds that are not re-strands will have their bands
USAID/UGANDA: ENVIRONMENTAL MANAGEMENT FOR THE OIL SECTOR – TRAINING COMPENDIUM: MODULE 4 121

carefully recorded (and double-checked) in the Notes field and will later be reported to the Bird Banding Lab by the Care and Processing Group Supervisor or the Processing Strike Team Leader. Both recoveries and re-strands will also be recorded at the time of processing on the Band Recovery Form. In order to be able to immediately identify re-strands during processing, wildlife processing personnel will need a system to cross-reference bands from all birds arriving with bands against bands put on released birds to date during the event. This may involve modifying a list each morning of pre-release bandings and posting this list, or having access to the banding records to cross-reference birds that arrive federally banded.”
Data Collection for the Live and Dead Animal Data Logs
Source: Point Blue Conservation Science and UC Davis Wildlife Health Center, 2014
“A standardized protocol has been developed for all data collection to ensure that techniques and effort involved in information documentation is uniform at all processing centers and among spill events. The order in which items are presented corresponds to either (or both) the Oiled Live Animal Data Log or the Oiled Dead Animal Data Log. Differences between the Live and Dead Logs are due to some oiling information (e.g., location, percent, and depth of oiling) being recorded for live animals on the Intake Form, negating the need to record the information in both places; or to additional information being captured for dead animals (e.g., scavenging information and carcass condition). Remember that proper PPE and safety procedures should be employed at all times to ensure protection from contamination.”
“On top of each Data Log form, record the spill name, facility acronym, the taxon to be logged (i.e., Bird, Mammal or Other), and whether this log is for new animals or re-strands from the same incident (New vs. Re-strand). The codes used to complete the Data Log are detailed herein and are also found simplified in a one-page summary (the Data Log Code Key; see Attachments). Data recorders should make sure all fields are filled in with the appropriate code.”
The following fields are filled out by receivers upon the animal’s arrival (live and dead):
Source: Point Blue Conservation Science and UC Davis Wildlife Health Center, 2014
1. “Log Number: The unique number used to identify each individual animal; prescribed upon receiving the animal. Use a different sequence in numerical order for each station, beginning with L for live birds and D for dead birds. Note: for re-stranded birds (ones released during the same spill event and returning live or dead), use original log number. See instructions for assigning log numbers above. Date Arrived: Enter the date the animal or carcass arrived at the processing station. Time Arrived: Record the time the animal arrived at the facility in 24-hour military format.”
The following fields are recorded by receivers soon after the animal’s arrival for live animals, and are generally filled out during processing for dead animals (transcribed from the Animal Collection Tag or from writing on the carcass bag):
Source: Point Blue Conservation Science and UC Davis Wildlife Health Center, 2014
1. “Date Collected: Record the date the animal was collected from the beach/spill area. Time Collected: Record the time the animal was collected from the beach/spill area in 24-hour military format. If there is no data, put a dash in the space provided. Collector Name: Record the first initial and last name of the person who initially captured the animal, as detailed on the bag or box in which the animal arrived. If the collector is not Wildlife Recovery Group personnel (e.g., if general public), also record phone number. If collector is unknown, record the name of the deliverer, preceded by “DEL:” so it is clear this name does not reflect the collector. Collection Location: Record the beach or other location name where the animal was collected/captured. Further details may be described in the Notes section (see below).
USAID/UGANDA: ENVIRONMENTAL MANAGEMENT FOR THE OIL SECTOR – TRAINING COMPENDIUM: MODULE 4 122

GPS Coordinates (2 fields): Record GPS coordinates, if provided, for where the animal was collected/captured. If datum are provided, include in Notes.”
The following fields are filled out during processing (live and dead):
Source: Point Blue Conservation Science and UC Davis Wildlife Health Center, 2014
1. “Field Band/Tag Color and Number (live log only): Provide the temporary band/tag/Field ID number affixed during initial collection or at a stabilization center, with color as the prefix (e.g., O for orange; O-XXXX). For dead birds, provide this information in the Band/Tag field, leaving room to add the Temp Band number; see Temp Band below for instructions on when to remove these from live birds (do not remove from dead birds).
2. Date Processed: Enter the date of processing (i.e., collection of the rest of the data). This is often different from the date collected.
3. Time Processed: Record the time when processing commences in 24-hr. military format. 4. Processor’s Name: Record the first initial and last name of the Data Collector on this
animal. 5. Species Code: Record the standard four-letter code for the species. See the Avian
Species Codes and Status document below for a list of appropriate codes taken from the standard American Ornithologists’ Union four-letter abbreviations.”
“Aquatic Mammal Species Codes and Status should be availed for the standardized names and status. If the species is not on these lists or you are unable to determine the proper code, assign a code and write the full species name in the Notes section. Great care must be given to the accurate identification of stranded animals. It is best to identify all animals to the species level.”
“However, this task may be extremely difficult as they are often heavily oiled and/or fragmented, and it is not always possible to identify an animal to species. If an animal is not readily identifiable to species, a more general taxonomic code may be used (i.e. GULL or DUCK. Additionally, for individuals where all evidence points to it being of a given species or taxa, but some definitive criteria is missing (because of the condition of the bird) that prevents you from being 100 percent certain, you may record the taxa as the likely 4-letter code followed by a question mark (e.g., “SUSC?”). Put in notes why you thought it was that species and what was missing that prevented a positive identification. If identification is impossible, you may record a BIRD. This is rare and all efforts should be made to identify the specimen to the lowest possible taxonomic level.”
“Threatened or endangered species must be reported and shown immediately to the Team Leader, so that the Care and Processing Group Supervisor may be given this information in a timely matter. Any carcasses that could be from a threatened or endangered species but are in poor condition and difficult to identify should be given extra attention. Documentation of threatened and endangered species carcasses in any condition must be thorough.”
“Species identifications will be rechecked 1) during morguing or 2) during pre-release banding. This is in an effort to correct any errors caused by oiling or to refine the taxon to which an individual is identified (e.g., if it could not be determined which scaup species it was when it was oiled). A system must be established to ensure this information is passed on appropriately.”
“Temporary Band/Tag Color and Number: Band numbers will be used to track birds throughout processing, storage, and rehabilitation, particularly for live birds entering the rehab process.”
“For Live Birds: All live birds will be fitted with temporary leg bands and color codes assigned accordingly. Generally (except for smaller shorebirds; see below), a single tyvek or plastic color band will be used with the bird’s log number written on it using an Industrial Sharpie permanent marker; only the number and not the “L” for “Live” will be written on the band.”
USAID/UGANDA: ENVIRONMENTAL MANAGEMENT FOR THE OIL SECTOR – TRAINING COMPENDIUM: MODULE 4 123

“See Avian Species Codes and Status table in appendices for the appropriate band sizes for most bird species that may be encountered in an Albertine Graben oil spill. A few birds that arrive may already be bearing federal bands; first determine if this bird is a re-strand. Put the band number clearly in the Notes, taking care to proofread the band number after recording it; and record this info in the Band Recovery Form as well. For shorebirds bearing metal bands, this will also serve as their tracking band number; live birds other than shorebirds arriving with a federal band will still be fitted with a temporary band that will be used as the tracking number while the bird is under care at the facility. Care should be taken to select which leg to apply the colored band to on live animals that may have burns or other wounds on their legs.”
“If a bird’s temporary band is lost during the rehabilitation process, efforts must be made to try to determine the identity of the bird (e.g., may be only one of that species, may be implanted with a subcutaneous transponder, or may be only one that has lost a band), and the bird will then be rebanded with the same band color and number. If this is not possible, the bird will be given a new log number, from a different series, which will be used to follow it throughout the rest of the process. This log number will begin with “UL” (for unknown log #), will be logged onto an UL Data Log made for this purpose, and will be banded with a GREEN-colored tyvek band to differentiate it from regular log numbers; the prefix “UL” will be written on the band along with its UL number.”
“For Dead Birds: Write their log number on a PURPLE/VIOLET tyvek band, inclusive of the “D” prefix for Dead (e.g., D001 written on band; record as “V-D001”). If a bird arrives with a field band (often indicating it was collected alive), keep this band on its leg and record it carefully in the band/tag field; in addition give the carcass a temp band with its log number, and record this as well in the same field (for data entry these bands will be entered into separate fields). Bands can be tied with twine or wire to a carcass it does not fit or one that lacks legs. A few birds may arrive already bearing federal bands; put this clearly in the notes, taking care to proofread the band number a second time after initially recording it.”
“For mammals and reptiles: Plastic tags should be fitted on a hind limb of all animals. If such tags are not available for dead animals, tie a bird band to the carcass. Animals will be marked with tags on the hind limbs; live animals could be fitted with GPS harnesses.”
“Condition (dead log only): Indicate the physical condition of the animal at the time of processing according to the following codes.
• 1 = freshly dead with no body parts missing and no scavenging • 2 = freshly dead whole carcass (no body parts missing) that has been scavenged • 3 = decomposing whole carcass • 4 = body parts only – fresh. This includes birds complete except for missing heads. The details of
the fragment should be described in the Notes (e.g., “wing only”) • 5 = body parts only – decomposing (elaborate on which parts are present in • Notes) • 6 = desiccated, mummified carcass • 99 = not evaluated”
“Extent of Scavenging (dead log only): Indicate the degree and presence of scavenging according to the codes below.
• 0 = no scavenging detected • 1 = light scavenging (small areas of tissue removed or impacted) • 2 = moderate scavenging (moderate amount of tissue removed) • 3 = heavy scavenging (large amounts of body with tissue removed) • 99 = not evaluated”
USAID/UGANDA: ENVIRONMENTAL MANAGEMENT FOR THE OIL SECTOR – TRAINING COMPENDIUM: MODULE 4 124

“Oiling Status (dead log only): Indicate whether oil or evidence of oiling was detected during processing (data on live birds may be recorded on Intake Forms and later transferred over). Note that these codes are hierarchical, meaning that you should choose the first (lowest) numbered code that applies.
• 0 = no, the presence of oil not detected • 1 = yes, oil visually detected • 2 = yes, smell oil • 3 = yes, skin burned • 4 = unknown, but skin is wet/not waterproof • 5 = unknown, but plumage is misaligned, parted, or sticky • 99 = not evaluated”
“Percent of Bird Oiled or Sheened (dead log only). Enter code for extent of the body surface covered by oil. • 1 = <2 percent of body • 2 = 2-25 percent of body • 3 = 26-50 percent of body • 4 = 51-75 percent of body covered • 5 = 76-100 percent of body covered • 6 = oil is detected but extent undeterminable due to state of carcass. This is sometimes the case
if the carcass is heavily scavenged (dead bird log only) • 7 = no oil is detected but this may be due to state of carcass. This could be if carcass is heavily
scavenged or excessively wet and sandy (dead bird log only) • 99 = percent oiled not evaluated or applicable (use if not visibly oiled).”
“Depth of Oil (dead log only): Record the physical appearance of the oil on the animal and the depth to which it has penetrated the plumage (data on live birds recorded on Medical Intake Forms).
• 1 = surface (oil has penetrated ¼ of the way or less down the feather shaft) • 2 = moderate (oil has penetrated > ¼ way down the feather shaft but not to the skin (often
penetrating ~½ way) • 3 = deep (oil has penetrated to skin) • 99 = not evaluated or applicable (use this if no external oil is visible)”
“Where Oiled (dead log only): Enter the appropriate code to indicate the location(s) of oil found on the body (data on live birds recorded on Intake Forms).
• 1 = bill/mouth area only (look inside of mouth) • 2 = body (one spot on body, spot not on waterline) • 3 = spotty (more than one spot in multiple areas on body; but not 100 percent oiled) • 4 = waterline (oil from keel downwards) • 5 = entire body (100 percent oiled) • 99 = not evaluated or applicable (use this code if no external oil is visible)”
“Feather/Oil Sample Taken: Record if a feather and oil sample were collected. Oiled feather/pelage samples should be collected on all animals for chemical fingerprinting in order to determine the origin of each sample. Record as:
• Y = yes, a feather/skin/tissue sample was taken • N = no sample was taken”
USAID/UGANDA: ENVIRONMENTAL MANAGEMENT FOR THE OIL SECTOR – TRAINING COMPENDIUM: MODULE 4 125

“For birds, take obviously oiled feathers for analyses. If no apparent oil is found on the specimen, a sample still must be taken, from the region (live) or regions (dead) where oil is commonly found, such as the breasts or the flanks. Be sure to avoid contact with human skin, plastic, or equipment (e.g., gloves) that may have been contaminated by a prior specimen. Always clean equipment with alcohol between specimens and wear clean nitrile or vinyl gloves when collecting samples (no latex). For human safety as well as chemical fingerprinting, nitrile gloves are the best choice as nitrile will show a paraffin peak when analyzed; however, while taking the sample try to avoid touching the feather sample with your gloves. Use scissors, hemostat, or foil instead to prevent contaminating the sample.”
“The Petroleum Chemistry Laboratory requires 5 completely oiled body feathers (~100 mg of oil) to properly analyze the sample. For live birds, the best technique is to pull out several body feathers with clean hemostats (better than tweezers; never use scissors) as body feathers will then be able to grow back. Feathers are removed by grasping the base of each feather with the hemostat and pulling in the direction of feather growth. Never attempt to remove primary or secondary flight feathers from live birds. Pull five of the most heavily oiled feathers for evidence; if the feathers are only oiled at a surface or moderate depth, more feathers must be collected to have enough product for fingerprinting—generally, enough to equal 5 heavily oiled contour feathers. Feathers should be taken from more than one location, and if possible, above the water line, to minimize waterproofing impacts. For dead birds, remove contaminated feathers with scissors, generally from more than one location.”
“Clean the hemostat/scissors with alcohol between specimens, and make sure no oil is left on them. For heavily tarred birds, it may be more efficient to take the feather sample with a disposable scalpel.”
“Wrap the samples in heavy-duty aluminum foil. Carefully fold the foil around the sample; label the sample using a Sharpie pen directly on the foil; place the foil in a small Ziploc bag (for sample protection and to reduce outgassing); and place the bag in a plain letter-sized envelope, sealing the evidence shut with a moist sponge.”
“The Ziploc bag does not need a label, but label the foil with the following information:
• Log number • Species • Date”
“The envelope must be clearly marked with the following information (the basics of which can be preprinted onto the envelopes with an available printer or be on preprinted weatherproof labels for efficiency):
• Log number • Species (four-letter code) • Band or tag number (for dead birds that also have field bands, or for live or dead birds that also
have a federal band, list both here) • Facility acronym • Spill name • Date of processing • Collection location • Collection date”
“Place the samples in a designated container or in freezer bags. These should be clearly marked as feather samples, along with the processing date, station designation (live vs. dead), and range of log numbers. For preservation, samples must be stored in a locked freezer (or refrigerator, if a freezer is not available) and newly acquired samples should regularly be moved there. Note: Chain of
USAID/UGANDA: ENVIRONMENTAL MANAGEMENT FOR THE OIL SECTOR – TRAINING COMPENDIUM: MODULE 4 126

Custody forms must be filled out for all tissue and feather samples leaving the facility for any reason (see section on transferring for more information).”
“For mammals: For visibly oiled animals (especially live): scrape visible oil from fur with wooden spatula (tongue depressor). Insert oil-covered spatula in designated glass jar and break off the remaining unoiled portion allowing the lid to close. Skin can be cut from dead animals with visibly oiled fur where this is possible. For animals with no visible oiling rub potentially affected area(s) with a 4x4 cotton cloth using sterile forceps or hemostats that have been cleaned with isopropyl alcohol, and place the cloth into a designated glass jar.”
“Additionally, a sample of the cloth must be submitted to identify cross-contamination. Place the control sample in an additional evidence jar and label accordingly. As with collecting feather samples, avoid touching the sample with your gloves as this may lead to unintentional contamination.”
“Photo Taken: Record if a photo was taken. All dead and debilitated animals will be photographed using a digital camera (even animals with no apparent oil). If available, a photo scale should be used for each photo.
• Y = yes, photo was taken • N = no photo was taken”
“Position the bird so that the oil on the bird is visible in the frame and so that the species can be identified (if possible). The photograph should be taken as close up as possible without excluding any of the pertinent components. For the live bird station, at least one animal handler will safely hold the bird in place, while PST or CST personnel take the photograph. The standard photo backdrop should clearly show the following information written in heavy black marker:
• Date of processing • Spill name • Facility acronym • Log number • Species code”
Temp Band color and number (for dead birds that also have field bands, or for live or dead birds that also have a federal band, list both here).
“Date, spill name, and facility acronym are on a semi-permanent backdrop; the log number, species code, and band number will be changed for every new individual, and it is the responsibility of one of the PST personnel to prepare this backdrop (e.g., on a dry-erase board) prior to taking the photograph.”
“Before the animal leaves, the photographer will confirm the photograph was taken properly, and that all information is clearly visible on the backdrop. If nothing is clearly visible, the photo should be retaken. Only personnel specifically trained and authorized by the Processing Strike Team Leader are allowed to delete flawed photographs. Otherwise, any incorrect or otherwise flawed photographs must be retained and recorded in the Photographic Corrections Log, which is part of the photographic evidence. Additionally, if a mistake was made in the backdrop but it is not possible to retake the photograph (e.g., the animal has moved on), the details must be recorded in a Photographic Corrections Log.”
“Such mistakes include components in the backdrop that were incorrectly written (i.e., wrong log # or incorrect date). They do not include changes to data associated with this individual post-processing, such as species re-identification or re-banding, as those data will be captured in the Data Log.”
“Using established procedures determined by Team Leader and Care and Processing Group Supervisor, digital photographs will be backed up and organized at least once daily. The PST Leader
USAID/UGANDA: ENVIRONMENTAL MANAGEMENT FOR THE OIL SECTOR – TRAINING COMPENDIUM: MODULE 4 127

will oversee this process. When the memory card in the digital camera is full, it will be placed in an envelope labeled with the spill name, station ID, date range for photos taken, the range of log numbers for specimens it contains photographs of. The envelope and pertinent backup DVDs will be secured under lock and key.”
“Disposition Status (live log only): Record the status of the animal when it leaves the rehabilitation process at the primary care facility. Chain of Command forms are to be filled out if animals leave the primary care facility for another facility.
• R = released • D = died • E = euthanized • T = transferred”
“Disposition Date (live log only): Enter the date the animal left veterinary care of the Care and Processing Group (transferred over from vet forms or Live Bird Mortality Log).”
Disposition Details (live log) and morgue Box (dead log):
“Federal Band Number (live log only). Record the federal band number for all birds that are released (carefully transcribe from the banding log). Note, both live and dead birds that arrived already bearing a federal metal band—considered band recoveries as opposed to re-strands—will have the federal band number recorded in the notes. If that bird is later released, this will also be its release band. All band recoveries will be reported by the Care and Processing Group Supervisor or the PST Leader to the Bird Banding Lab at the conclusion of the spill.”
“Where Transferred (live log only). Record the acronym of the facility to which a bird is transferred (Chain of Command required).”
“Morgue Box (live or dead log). Record the Morgue box number where the specimen was stored. All dead animals should be packaged (after processing) into morgue boxes for storage. This is done in order to easily locate certain individuals (particularly special status or unidentified remains) for response- and post-response-related activities (such as verification of species, sex, age, breeding condition, or cause of death). The Morgue Box number will be recorded in Disposition Details in the live log or in Morgue Box in the dead log. In some cases (such as if small enough boxes are unavailable), morgue bags may be used to separate individuals within the large boxes for easier retrieval, and both the bag number and box number must be recorded on the appropriate Data Log.”
“Animals are sorted based on the following criteria (also see Avian Species Codes and Status), but all are part of a single consecutive series of morgue boxes (i.e., Box A, B, C):
• “Special Status” (Endangered, Threatened, or Special Concern) carcasses that are identified should be placed in morgue boxes that contain only special status species and labeled accordingly. The Morgue Box number is recorded on the Data Log.
• Fragments and carcasses that were not identified to species (often due to degree of oiling or scavenging) should be stored in morgue boxes that contain only these kinds of carcasses, and labeled accordingly. The Morgue Box number is recorded on the Data Log.
• All other carcasses that are identified to species are placed in additional morgue boxes. The Morgue Box number is recorded on the Data Log.
• Birds that arrived dead are to be boxed separately from birds that arrived alive and subsequently died (see Procedures for Handling Animals that Die While in Rehabilitation below). Labeling systems should be non-overlapping between the two groups; for instance, a numeric series for dead arrivals and an alpha series (A, B, C) for live arrivals that died. Each box should be labeled consecutively. Morgue boxes should be labeled with the following information on each side of the box:”
USAID/UGANDA: ENVIRONMENTAL MANAGEMENT FOR THE OIL SECTOR – TRAINING COMPENDIUM: MODULE 4 128

Morgue box number Spill name Facility acronym Dead or Live Station and Birds/Mammals/Other (e.g., “Dead Bird Station”) Date carcasses first placed in Morgue Box (as box can span multiple dates) Special type of Morgue Box (e.g., special status; unidentified)
Chain of Command forms are to be filled out for individual carcasses or morgue boxes leaving the facility for any reason.
“Notes: All additional observations (excluding those listed below for the dead animal Data Log, where there are special fields for those data) are written in the Notes section on the reverse side of the Data Log. Notes may possibly include any of the following: any conspicuous cause of death not related to oil (e.g., gunshot wound); a note if the specimen was known to have been contaminated by other petroleum products (e.g., if it was wrapped in plastic) or other carcasses; any other observations or measurements; the band number if a bird arrived already banded; and on dead birds be sure to always check for and comment if a toe or wing has been clipped.”
“The following data will be collected when possible; this will be done during processing for dead birds, and either at processing (if required for species ID), before release, or postmortem for live birds. Time constraints and animal care needs may prevent processors from collecting these data, at the discretion of the PST or CST Leaders, but measurements should always be taken (and recorded) when required for definitive identification:”
Morphometrics
Source: Point Blue Conservation Science and UC Davis Wildlife Health Center, 2014
These measurements should only be done by properly trained individuals.
“They should only be done on birds where the state of the carcass (if dead) allows it. The protocols are taken from Peter Pyle’s Identification Guide to North American Birds, Part I for passerines and near-passerines (1997, Slate Creek Press) and Part II for seabirds, waterbirds, raptors, and most other species (2008, Slate Creek Press).”
“Wing = unflattened (relaxed) wing chord (mm). Do not put any pressure on the wing that might flatten or extend it, and use a ruler with a perpendicular stop at zero. If wing is too distorted to get an accurate unflattened wing, take two measurements (flattened followed by unflattened; e.g., 194/190).”
“Tarsus = the length between the intertarsal joint and the distal end of the last leg scale before the toes emerge. There is often a crevice marking the intertarsal joint, otherwise you can generally feel it with your nail; and the distal end of the last leg scale before the toes emerge can also be determined by bending the foot in a natural position and resting the calipers on top of that bend.”
“Bill depth = there are numerous species-specific methods for taking bill depth, and for some species multiple methods are useful. The manner in which this measurement is taken for each species should be carefully documented during each spill, and should follow species-specific recommendations in the literature (especially Pyle 2008). One method is the depth perpendicular to the axis of the bill and taken with calipers at the anterior end of the nare (towards the tip of the bill).”
“Place the top jaw of the calipers even with the anterior ends of the nares and the bottom against the lower mandible below that so that the calipers are exactly perpendicular to the axis of the bill. Other methods include at the gonys, at the deepest part of the bill, or at the base of the proximal end of the upper mandible feathering.”
USAID/UGANDA: ENVIRONMENTAL MANAGEMENT FOR THE OIL SECTOR – TRAINING COMPENDIUM: MODULE 4 129

“Culmen (“bill from nares to tip”) = distance between the anterior end of the nares and the tip of the bill, taken with calipers. Only possible for species with external nares, and only useful for certain species.”
“Exposed culmen = the length between the posterior tip of the feathering at the top base of the bill and the tip of the bill, taken with calipers. Taken on most species.
• Age: If determinable indicate the age of the individual (Juv = juvenile, Ad = adult, HY = • Hatching-Year, AHY = After-Hatching-Year, SY=Second Year, etc.). Note that some aging may
take place post-processing based on the morphometrics collected. • Sex: If possible by breeding condition, plumage, or morphometrics, indicate if the individual is a
male (M) or female (F). Note that some sexing may take place post-processing date based on the morphometrics collected.”
Packaging Carcasses after the Completion of Processing
Source: Point Blue Conservation Science and UC Davis Wildlife Health Center, 2014
“Once all data have been collected for a given carcass, it should be wrapped completely in heavy duty aluminum foil so that no part of it is visible, then the foil-wrapped carcass is placed either (1) in the smallest possible paper bag, sealed securely with masking or other freeze-proof tape, and then sealed in a plastic bag such as a large Ziploc, or (2) directly in shrink-wrap plastic using a vacuum-pack system (depending on the protocol being used for the specific spill). This layer of plastic reduces degradation of the foil, which renders the evidence less useful. If using paper bags, the data recorder should prepare this paper bag so that it is ready upon completion of processing. The following information is written on the foil, and duplicated on the outside of the paper bag or plastic shrink-wrapping (the basics which may be preprinted on weatherproof labels for efficiency):”
• Log number • Species code • Band number (for dead birds that also had field bands, or birds that also have another band, list
both here) • Date of packaging • Facility acronym • Spill name
“If the paper bag is going in plastic bags that are not clear, the information will need to instead go on the outside of the plastic bag. Even if the writing on the foil is visible through the plastic shrink-wrapping, you must also label the outside of the plastic as degradation of the foil may occur.”
Procedures for Handling Animals that Die While in Rehabilitation
Source: Point Blue Conservation Science and UC Davis Wildlife Health Center, 2014
“Animals that die after entering rehabilitation will return to the hands of Processing Strike.”
“Team personnel for data, organization, evidentiary and storage purposes. For such animals, the following is recorded on a separate log sheet (the Post-Arrival Mortalities Log), which helps track and organize these data for both processing and rehabilitation purposes:”
• Initials of the person recording the data • Log number • Band number (temp band; if it also has a federal band, list both here) • Species • Date of death • Whether they died or were euthanized • Morgue box number
USAID/UGANDA: ENVIRONMENTAL MANAGEMENT FOR THE OIL SECTOR – TRAINING COMPENDIUM: MODULE 4 130

• Comments (including morphometrics)
“Fill out the Post-Arrivals Mortalities Log before wrapping the carcass. Specifically, check the species identification in case the bird was misidentified or not identified to species due to degree of oiling at time of processing. The band number written on this form should reflect what is on the carcass, and NOT necessarily the bird’s original band. Keeping track of these data is often very helpful to animal care staff, as it allows them to more accurately track the fate of their patients. If time allows and as directed by your supervisor, processors will collect morphometric data at this point to be later transferred to the animal’s Data Log form.”
“These animals are wrapped in foil, placed in paper bags, labeled, and morgued following the same process used for birds that arrive dead (see 2.12.8 Packaging Carcasses After Completion of Processing and Morgue Box above). Be sure to store these carcasses in the “live bird” morgue boxes. These Morgue Box numbers and other pertinent data on this log must then be transferred to the Live Animal Data Log sheet so that an individual specimen can be easily retrieved.”
Transferring Animals or Evidence (Chain of Custody)
Source: Point Blue Conservation Science and UC Davis Wildlife Health Center, 2014
“Chain of Custody forms (a generic form is included) must be used whenever live animals, carcasses, or any evidence (e.g., feather samples) are transferred after having been assigned a log number and been processed. This generally refers to when they are transferred out of the primary wildlife center where processing and animal care occur. Contrary to historical protocol, they do not need to be used prior to that point, nor when initially receiving wildlife from delivery personnel. However, in the event of a large spill where official processing is initiated at a stabilization center, Chain of Custody forms will be used when transferring them to the primary wildlife center.”
Demobilization
Source: Point Blue Conservation Science and UC Davis Wildlife Health Center, 2014
“Processing Strike Team demobilization is initiated when the rate of birds and other oiled wildlife washing ashore approaches zero, search and rescue stops, and the number of mortalities within the CST is low. Demobilization is complete once all the birds and carcasses are processed and morgued. Due to the unpredictable nature of oil spills, the duration of Processing Center operation will vary. Orders to demobilize will come via the chain of command though the Wildlife Care and Processing Group Supervisor.”
Annexes
Source: Point Blue Conservation Science and UC Davis Wildlife Health Center, 2014
1. Checklist for Microbiology and Toxicology
Tissue Microbiology Toxicology Brain X X Fat X Kidney X X Stomach contents X Hair, feathers, skin X
Liver X X Whole blood X X Lymph nodes X X Tonsils X X Spleen X X Abscesses, granulomas X
USAID/UGANDA: ENVIRONMENTAL MANAGEMENT FOR THE OIL SECTOR – TRAINING COMPENDIUM: MODULE 4 131

2. Fixed Tissue Checklist for Histopathology
Source: Point Blue Conservation Science and UC Davis Wildlife Health Center, 2014
“Preserve the following tissues in 10 percent buffered formalin at a ratio of 1 part tissue to 10 parts formalin. Tissues should be no thicker than 1 cm. INCLUDE SECTIONS OF ALL LESIONS and SAMPLES OF ALL TISSUES ON THE TISSUE LIST.”
“Recommended tissue sampling procedures:
• Salivary gland • Oral/pharyngeal mucosa and tonsil -plus any areas with erosions, ulcerations or other lesions • Tongue: cross section near tip including both mucosal surfaces • Lung: sections from several lobes including a major bronchus • Trachea • Thyroid/parathyroids • Lymph nodes: cervical, mediastinal, bronchial, mesenteric and lumbar; cut transversely • Thymus • Heart: sections from both sides including valves • Liver: sections from 3 different areas including gall bladder • Spleen: cross-sections including capsule • GI Tract – 3 cm long sections of: • Esophagus • Stomach: multiple sections from all regions of the lining • Intestines: multiple sections from different areas • Omentum: ~3 cm square • Pancreas: sections from two areas • Adrenal: entire gland with transverse incision • Kidney: cortex and medulla from each kidney • Urinary bladder, ureters, urethra – cross section of bladder and 2 cm sections of ureter and
urethra • Reproductive tract: entire uterus and ovaries with longitudinal cuts into lumens of uterine horns • Both testes (transversely cut) with epididymis: entire prostate, transversely cut. • Eye • Brain: cut longitudinally along midline • Spinal cord (if neurologic disease): sections from cervical, thoracic and lumbar cord • Diaphragm and Skeletal muscle: cross section of thigh muscles • Opened rib or longitudinally sectioned femur: marrow must be exposed for proper fixation • Skin: full thickness of abdominal skin, lip and ear pinna • Neonates: umbilical stump: include surrounding tissues”
3. Specimen Submission Form
Source: Point Blue Conservation Science and UC Davis Wildlife Health Center, 2014
Date
Person submitting samples:
Agency:
Address:
Phone #/Fax
USAID/UGANDA: ENVIRONMENTAL MANAGEMENT FOR THE OIL SECTOR – TRAINING COMPENDIUM: MODULE 4 132

Species: Animal
ID: Sex
Died Killed (circle one)
Number affected:
Location where carcass found:
Evidence of struggling?
Environmental conditions:
Other information/observations:
4. Necropsy Protocol
Source: Point Blue Conservation Science and UC Davis Wildlife Health Center, 2014
Name of prosector
Address of prosector
Location of carcass
SPECIES and number for each species;
ANY ID #, WEIGHT, SEX
DATE OF DEATH_________________________ DATE OF NECROPSY_________________________
HISTORY: (briefly summarize clinical signs, circumstances of death):
SHIPPING TISSUES: PLEASE OBTAIN PROPER CITIES and EXPORT PERMITS BEFORE
SHIPPING TISSUES BETWEEN COUNTRIES. After 72 hours in fixative, ship tissues in a leak-proof container in adequate formalin to keep tissues moist.
5. Gross Examination Worksheet
Source: Point Blue Conservation Science and UC Davis Wildlife Health Center, 2014
PROSECTOR:
GENERAL CONDITION: (Nutritional condition, physical condition)
Neonates: examine for malformations (cleft palate, deformed limbs etc.).
SKIN: (Including pinna, feet)
MUSCULOSKELETAL SYSTEM: (Bones, joints, muscles)
BODY CAVITIES: (Fat stores, abnormal fluids)
Neonates: assess hydration (tissue moistness)
HEMOLYMPHATIC: (Spleen, lymph nodes, thymus)
RESPIRATORY SYSTEM: (Nasal cavity, larynx, trachea, lungs, regional lymph nodes)
Neonates: determine if breathing occurred (do the lungs float in formalin?)
CARDIOVASCULAR SYSTEM: (Heart, pericardium, great vessels)
USAID/UGANDA: ENVIRONMENTAL MANAGEMENT FOR THE OIL SECTOR – TRAINING COMPENDIUM: MODULE 4 133

DIGESTIVE SYSTEM: (Mouth, teeth, esophagus, stomach, intestines, liver, pancreas, mesenteric lymph nodes). Neonates: is milk present in stomach?
URINARY SYSTEM: (Kidneys, ureters, urinary bladder, urethra)
REPRODUCTIVE SYSTEM: (Testis/ovary, uterus, vagina, penis, prepuce, prostate, mammary glands, placenta)
ENDOCRINE SYSTEM: (Adrenals, thyroid, parathyroids, pituitary)
NERVOUS SYSTEM: (Brain, spinal cord, peripheral nerves)
SENSORY ORGANS (Eyes, ears)
PRELIMINARY DIAGNOSES:
LABORATORY STUDIES: (List bacterial and viral cultures submitted and results, if available)
6. Field Report OF Wildlife Death
Source: Point Blue Conservation Science and UC Davis Wildlife Health Center, 2014
Date:
Person reporting:
Affiliation:
Address:
Telephone #/Fax:
Species:
Clinical signs noted before death:
Number affected:
Other species in the region/Number affected:
7. Items Needed at the Processing Center
Source: Point Blue Conservation Science and UC Davis Wildlife Health Center, 2014
1. Alcohol, isopropyl for cleaning hemostats and scissors 2. Aluminum foil rolls: sizes large and medium, heavy duty only 3. Banding Pliers 4. Band size measurement device 5. Bird bands: numbered color bands 6. Bird bands sizes 1–4 (BRD aluminum) 7. Bird carrying boxes, cardboard/plastic pet carriers for live bird storage 8. Boxes, small for storage 9. Calipers 10. Cellular phones or other communication equipment 11. Chain of Custody forms 12. Chairs 13. Cleaning supplies: heavy duty cleaning fluid and sponges 14. Clipboards (8); including at least 6 legal-sized 15. Clocks or wrist-watches (2) 16. Computer, laptop (1) 17. Copies of protocol
USAID/UGANDA: ENVIRONMENTAL MANAGEMENT FOR THE OIL SECTOR – TRAINING COMPENDIUM: MODULE 4 134

18. Copies of Species List 19. Copies of Index to Reference Guides 20. Cotton balls 21. Digital Camera (2+) with 1 GB memory card each 22. Dry-Erase boards for photo backdrop 23. Envelopes, letter-size 24. Evidence Tape 25. File boxes for data forms 26. File boxes for feather samples 27. Forms (multiple copies): Live and Dead Animal Data Logs, Photographic Corrections Log, Post-
arrival 28. Mortalities Log 29. Glass specimen/evidence jars 30. Gloves: disposable nitrile or vinyl, all sizes 31. Garbage bags 32. Hemostats 33. Human First Aid Kit 34. Identification Guides: Beached Bird/Mammal Guide, Sibley Guide, National Geographic, Guide to 35. Gulls, Guide to Shorebirds, Guide to Seabirds, Guide to Waterfowl, Marine Mammals of the 36. Pacific Coast, Pyle Part II, Point Blue identification placards for select species groups 37. Identification badges 38. Labels, preprinted (2 types: for feather sample envelopes and for carcasses) 39. Manila folders (letter-size) 40. Markers: thick black, thick colored and permanent (Industrial Sharpie) 41. Paper: 8.5" x 11" and notepad 42. Paper bags: double-strength lunch-size and grocery size 43. Paper towels 44. Postmortem kits 45. Refrigeration and freezers for corpses and samples 46. Rulers: regular and for photographs 47. Safety glasses 48. Scalpels, disposable 49. Scissors: regular (2 pairs) and surgical (1 pair) 50. Small gauge aluminum wire to secure bands to fragments 51. Tables, waist-high 52. Tape, duct, masking (2") and clear packaging 53. Towels to place in live bird carrying boxes 54. Tweezers (large) 55. Twine/String 56. Tyvek/Kleenguard suits (or other impermeable protective clothing) 57. Water proof pens 58. White garbage bags, medium-sized 59. Wing chord rule: large (300 mm or greater) 60. Ziploc bags (small, for individual feather samples; large, for multiple feather sample envelopes).
USAID/UGANDA: ENVIRONMENTAL MANAGEMENT FOR THE OIL SECTOR – TRAINING COMPENDIUM: MODULE 4 135

8. Code Key for Wildlife Processing Unit
Source: Point Blue Conservation Science and UC Davis Wildlife Health Center, 2014
Live and Dead Oiled Animal Data Logs
Record incident name, location, and page; circle live vs. dead. Please be sure all fields are filled in with the appropriate code.
The following list of fields are filled out by receivers upon the animal’s arrival:
• Intake #: Starting with L for live and D for dead, record the sequential i.d. number which animal was given upon arrival.
• Date and Time Collected (2 fields): Date and time (24-hour format) of collection. • Collector Name: Record first initial and last name of collector (from bag/box); if public, put
phone number as well. • Collection Location: Name of initial collection/capture location. If necessary, use Notes on
back for overflow. • GPS Coordinates (2 fields): Coordinates of collection/capture location. • Field Band Number: Provide # of temporary band affixed during initial collection/capture; for
dead animal this will be only band. • Date and Time Arrived (2 fields): Date and time (24-hour format) animal arrived at
processing station. • The following list of fields are filled out during processing, not during receiving, or are
transferred from other forms: • Date and Time Processed (2 fields): Date and time (24-hour format) the rest of processing
(data fields below) was initiated. • Processor Name: First initial and last name of data collector for the individual animal. • Species: Standard 4-letter abbreviation; if unknown, indicate lowest taxonomic category
determined (e.g., gull; alcid; bird). • Temp Band/Tag #: For birds enter color and number of band (i.e., B198 if Blue band #198)
placed on leg (or elsewhere with string as necessary for incomplete carcasses). This is for live birds other than shorebirds, and dead birds not given a field band.
• Condition: (dead log only) 1=freshly dead whole carcass with no evidence of scavenging; 2=freshly dead and scavenged with no body parts missing; indicate in Notes the location (e.g., breast) of scavenging. 3=decomposing whole carcass; 4=body parts only, fresh (elaborate on which body parts are present in Notes); 5=body parts only, decomposing (elaborate in Notes); 6=desiccated, mummified carcass; 99=not evaluated.
• Extent of Scavenging: (dead log only) 0=none detected; 1=light; 2=moderate; 3=heavy • Oiling Status: In hierarchical order (choosing lowest number to apply), indicate presence of oil
(jet fuel, diesel, gasoline, vegetable oil, fish oil or other) by: 0=no signs of oil detected; 1=yes, oil visually detected; 2=yes, smell oil; 3=yes, skin burned; 4=unknown but skin wet/not waterproof; 5=unknown but plumage misaligned, parted, or sticky; 99=not evaluated.
• Percent of Bird Oiled or Sheened: (dead log; for live, transferred over from medical forms) 1=<2 percent of body; 2=2-25 percent of body; 3=26-50 percent of body; 4=51-75 percent of body; 5=76-100 percent of body; 6=oil detected but extent undeterminable due to state of carcass; 7=no oil detected but this may be due to state of carcass (i.e., partial); 99=not evaluated or applicable (use if not visibly oiled).
• Depth of Oil: (dead log only) 1=surface (oil penetrated <1/4-way down feather shaft); 2=moderate (<1/2 down shaft); 3=deep (penetrated to skin); 99=not evaluated or applicable (use if not visibly oiled).
USAID/UGANDA: ENVIRONMENTAL MANAGEMENT FOR THE OIL SECTOR – TRAINING COMPENDIUM: MODULE 4 136

• Where Oiled: (dead log only) 1=bill/mouth area only; 2=body (1 spot); 3=spotty (spots in multiple areas); 4=waterline (keel downwards); 5=entire body; 99=not evaluated or applicable (use if not visibly oiled).
• Feather/Oil Sample Taken? Take a sample from oiled locations. If no apparent oil, take samples from areas frequently oiled. Y=feather/fur/tissue/swab sample taken; N=no sample taken. Shiny or dull side makes no difference. Record the following on both the envelope and foil in which sample is placed: intake #, species code, band number, processing date, spill event name.
• Photo Taken? Y=yes; N=no. Write the time it was taken on photo (if polaroid); see protocols if not polaroid. In photo itself backdrop should clearly show: intake #, species code, band number, date, facility, and spill name (if designated).
• Disposition Date: (live log only): Record the date of the disposition (transferred over from Post-Mortality Log).
• Disposition Status: (live log only): Manner in which live animals left the care of veterinarians at the facility. R=released; T=transferred for rehabilitation; E=euthanized; D=died (transferred over from Post-Mortality Log).
• Federal Band number: Record here any federal metal bands birds arrived with; federal bands given to shorebirds in lieu of temporary plastic bands; and federal bands given upon release.
• Morphometrics and Age/Sex: If time allows, during processing on dead birds record the unflattened wing, tarsus, bill depth(s), nares to tip, exposed culmen, age, and sex, as appropriate for the species. Proper training is required; refer to the complete protocols for the Wildlife Processing Unit for a thorough description of how to collect each data type.
• Morgue Box #: Box # in which the carcasses is placed. If bags are used, record those numbers also. Live and dead are given different series (alpha vs. numeric); Special Status and unidentified birds placed in unique boxes. Live are transferred over from Post-Mortality Log.
• Notes: Any extra observations, e.g., breeding condition; conspicuous cause of death if not related to oil; contamination by other petroleum products (e.g., wrapped in plastic) or other carcasses; and detection of toe or wing clipping on dead birds.
9. Avian Species Codes and Status
Source: Point Blue Conservation Science and UC Davis Wildlife Health Center, 2014
“Bird species, 4-letter codes, suggested band sizes, likelihood of each to be processed at the wildlife processing centers, and special status (as of Jan 2016; see status at time of spill to verify). Carcasses of special status (endangered, threatened, special concern) are to be placed in morgue boxes designated for special status carcasses, and must be reported promptly to your supervisor. All other identified carcasses are to be placed in morgue boxes with no designation. You may encounter species not occurring here (e.g., landbirds); see the Bird Banding Lab website for appropriate band size and code (http://www.pwrc.usgs.gov/BBL/manual/bandsize.htm). The lowest taxonomic designation that can be made with certainty should be recorded, such as “GULL” or “LOON.” Spell this out if not on the list below. It may be necessary to leave the designation as “BIRD” if the remains are too damaged, or if there is not adequate time to make a positive identification out of a degraded carcass. Additionally, for individuals where all evidence points to it being of a given species or taxa, but some definitive criteria is missing b/c of condition of the bird so you can’t say this with 100 percent certainty, record the taxa as the likely 4-letter code followed by a question mark (e.g., “SUSC?”); if likelihood is not high, simply classify as the next taxonomic level of which you are confident. Birds are listed in alphabetical order.”
Species Code Band Likelihood Status1
1Status at a particular date (check for updates at beginning of each spill)
USAID/UGANDA: ENVIRONMENTAL MANAGEMENT FOR THE OIL SECTOR – TRAINING COMPENDIUM: MODULE 4 137

10. Mammal, Reptiles, and Amphibian Species Codes and Status
Source: Point Blue Conservation Science and UC Davis Wildlife Health Center, 2014
“Most commonly encountered aquatic mammal, reptile and amphibian species, species status, and standardized codes. This table is certainly not exhaustive of all non-avian species encountered during a spill; for other species not listed, please fill out their full name to avoid confusion. You can also add the species to the list and develop a standardized code for use during the spill event, which can be added to a future version of the protocols as appropriate. The lowest taxonomic designation that can be made with certainty should be recorded… Additionally, for individuals where all evidence points to it being of a given species or taxa, but some definitive criteria is missing b/c of condition of the bird so you can’t say this with 100 percent certainty, record the taxa as the likely 4-letter code followed by a question mark (e.g., “Ej?”); if likelihood is not high, simply classify as the next taxonomic level of which you are confident.”
Species name Scientific name Code Status
11. Color Coding Key for Temporary Bands on Oil-affected Birds
Source: Point Blue Conservation Science and UC Davis Wildlife Health Center, 2014
Band color Color abbreviation Use Orange O Field stabilization Violet/purple V Dead on arrival White W Primary care facility Pink P Primary care facility Yellow Y Primary care facility Green G Lost band/re-band Blue B Research Red R Medical condition
USAID/UGANDA: ENVIRONMENTAL MANAGEMENT FOR THE OIL SECTOR – TRAINING COMPENDIUM: MODULE 4 138

12. Evidence Chain of Custody Tracking Form
Source: Point Blue Conservation Science and UC Davis Wildlife Health Center, 2014
Incident Command System
Case Number/ID: ________________________ Offense: __________________________
Submitter: (Name/Institution) _______________________________________________
Victim: ______________________________________________________________________
Suspect: _____________________________________________________________________
Date/Time incident: __________________Location of incident: ___________________
Type of suspect incident (heavy metal poisoning, dispersant chemical intoxication, oil spill) ______________ Oil spill name___________________________
Specimen type (whole carcass, tissue samples, chemical, crude petroleum) ___________________________________________________________________
Description of Evidence Item #
Quantity Description of Item (Condition, Marks, Scratches, oil coverage of the body etc.)
Chain of Custody Item # Date/Time Released by
(Signature and ID#) Received by (Signature and ID#)
Comments/Location
Specimen Record Number: ________________________
USAID/UGANDA: ENVIRONMENTAL MANAGEMENT FOR THE OIL SECTOR – TRAINING COMPENDIUM: MODULE 4 139

Final Disposal Authority
Authorization for Disposal Item(s) #: __________ on this document pertaining to (suspect): ____________________________________________ is(are) no longer needed as evidence and is/are authorized for disposal by (check appropriate disposal method) ☐ Return to Owner ☐ Auction/Destroy/Divert Name and ID# of Authorizing Officer: ____________________________ Signature: ______________________Date: _______________
Witness to Destruction of Evidence
Item(s) #: __________ on this document were destroyed by Evidence Custodian ___________________________ID#:______ in my presence on (date) __________________________.
Name and ID# of Witness to destruction: ________________________ Signature: ______________________Date: _______________
Release to Lawful Owner
Item(s) #: __________ on this document was/were released by Evidence Custodian ________________________ID#:_________ to Name _____________________________________________________________________________ Address: ________________________________________________ City: ____________________State: _______ Zip Code: __________ Telephone Number: (_____) ___________________________________ Under penalty of law, I certify that I am the lawful owner of the above item(s).
Signature: _______________________________________________________ Date: __________________________ Copy of government-issued photo identification is attached. ☐ Yes ☐ No
A copy of this Evidence Chain of Custody form is to be retained as a permanent record by the sending and receiving departments.
USAID/UGANDA: ENVIRONMENTAL MANAGEMENT FOR THE OIL SECTOR – TRAINING COMPENDIUM: MODULE 4 140

REFERENCES
Munson, L. (2005). Necropsy of wild animals. Wildlife Health Center. University of California, Davis. Retrieved from https://www.scribd.com/document/101316558/Wild-Animal-Necropsy
Point Blue Conservation Science and UC Davis Wildlife Health Center. (2014). Protocols For The Processing Of Oiled Wildlife In The State Of California. Version 7.1 Retrieved from http://data.prbo.org/cadc2/uploads/Articles/OilSpill/oiled-wildlife-processing-protocols_VERS7.1_mar2014_WITH-APPENDICES.pdf
USAID/UGANDA: ENVIRONMENTAL MANAGEMENT FOR THE OIL SECTOR – TRAINING COMPENDIUM: MODULE 4 141

2.3 MONITORING OF WOODY BIOMASS
SYLLABUS
Topic and Subtopic Suggested Approach, Methods and Equipment
1. Introduction to monitoring of woody biomass
Lecture interlaced with Q&A to build on students’ knowledge and experiences
2. Sampling techniques Guide the students to learn about the different techniques using group discussions. A handout is given to each group and asked to discuss one of the techniques, and then teach it to the rest of the class in plenary.
3. Sample plot determination: size, shape and marking
Lecture interlaced with Q&A to build on students’ knowledge and experiences; use of case studies which used the different aspects
4. Data collection Give different examples to illustrate the considerations in data collection and processing.
5. Data analysis 6. Applicability of the standard
operating procedures in the oil and gas sector
Through a class discussion, different forest/woodland areas are selected where the practical work will be carried out through group work. The reconnaissance is done on the first day of the field exercise and actual data collection during the subsequent days depending on the size of the area to be covered. On return from the field, each group enters its data and processes and interprets it with the guidance of the teacher.
DETAILED NOTES
Introduction to Monitoring of Woody Biomass
A number of basic measurements are used in describing populations and communities. Among these are density, frequency, coverage, and biomass. From them other important ecological measures are determined, such as population distribution, species diversity, and productivity. This Standard Operating Procedure covers land cover mapping and biomass monitoring.
Land Cover Mapping
Source: NEMA, 2012
“The objective of monitoring flagship floral ecosystem is to establish a baseline and later detect any changes that may be caused by activities related to oil and gas exploration and production. Remote sensing is used to monitor floral ecosystems, by means of land cover mapping using satellite images. The indicators that need to be monitored change in area of land cover classes. In the case of the Albertine Graben, mapping covers the whole Graben since all the parts of the Graben are part of the ecosystem. Although wetlands are aquatic ecosystems, their extent are mapped at this stage along other floral ecosystems. Satellite images are interpreted to produce a land cover/use map based on the National Biomass Study (NBS) methodology and classification.”
“The land cover map is field check to ensure that the interpreted map is accurate. Field checking is done in those areas where land cover change is suspected to have taken place. The land cover map is overlaid with administrative boundaries and protected areas. Therefore, the attribute table of the shape file have names of the administrative unit they fall under and whether they are protected or not. For the protected areas, the type of protection is indicated; namely Central Forest Reserve,
USAID/UGANDA: ENVIRONMENTAL MANAGEMENT FOR THE OIL SECTOR – TRAINING COMPENDIUM: MODULE 4 142

Local Forest Reserve, National Park, Wildlife Reserve or Community Conservation Areas. Area statistics are also produced for each land cover types grouped by the categories of administration and protection.”
“When the second land cover map is produced after about five years, it is overlaid with the first one for change analysis. Before overlay, a field identifying the year of the map is created for each land cover map. After the overlay, the resultant shape file will have two fields showing land cover class of the previous mapping and the new mapping. Analysis can therefore be done to determine whether the class of the polygon remained the same or whether it changed into a new one and if so to what class.”
“The start-up phase in land cover mapping focuses on producing a land cover map that serves as baseline for reference as subsequent maps are produced. It requires acquiring satellite imagery of medium resolution for interpretation. In some cases, high resolution may be required to carry out detailed mapping. ERDAS IMAGINE, an image processing software and its licenses is required.”
“Subsequent phases of mapping produce maps using similar methodology and classification that compare with the baseline to see if any changes have taken place. The tools used in the start-up phase can still be used in this phase. However, satellite imagery has to be obtained for every mapping phase.”
Basis for Monitoring (Justification, Indicators)
Source: NEMA, 2012
“The objective of biomass monitoring is to determine the quantity on flagship elements of the ecosystems including numbers, physical size, and distribution of plant species in wetlands, forests, savannas, woodlands and on agricultural farms. This forms a baseline for monitoring the impact of oil activities. The indicators of change to monitor are:
• Number and coverage of invasive species • Biomass stocking • Plant regeneration • Plant diversity”
Sampling Techniques
There are a number of sampling techniques that can be used for sampling woody plants.
Reconnaissance Visit/Trip
Reconnaissance (Recce) is necessary to determine the vegetation types (strata) in the sample area. This helps in determining the most suitable sampling technique to be used. Reconnaissance can be carried out on the same day as the sampling starts, especially if the sampling area is relatively small. It is important to ensure that sampling is done in each of the vegetation types to include as many of the species as possible.
Random Sampling
This method is based on the assumption that the plants are randomly distributed. The method is best used in more or less homogeneous habitats (e.g., grasslands). However, there are very few homogeneous habitats especially in the tropics as species tend to vary depending on the soil and water conditions and the altitude within the micro-habitats, hence it is highly prone to errors arising from bias. To eliminate arising from bias, it is recommended that at least 30 samples be taken to get representative data. This can be a challenge especially if time and resources are limited.
USAID/UGANDA: ENVIRONMENTAL MANAGEMENT FOR THE OIL SECTOR – TRAINING COMPENDIUM: MODULE 4 143

Systematic Sampling
This divides the sample area into regular sections (e.g. along a main transect/baseline), and samples are taken after regular intervals along the baseline. It can produce fairly accurate results depending on the number of replicate samples are taken. However, this can be very time wasting given that the sample areas are predetermined and have to be enumerated even when the plot falls in a grassland patch yet you are looking for only trees! It is therefore not recommended if time and resources are limited and the habitat is fairly heterogeneous.
Stratified Sampling
This sampling is guided to cover specific strata/ vegetation types, established following a reconnaissance visit (or established on a vegetation type map or Landsat imagery) if such exist and are fairly recent and reliable. The sampling in strata ensures that every visible variation in the vegetation is deliberately targeted during sampling to ensure representativeness of the data collected. By this method, you can easily get representative species of the entire area by sampling a few areas representing all the major vegetation types. You can tell that you have sampled enough if you notice fewer new species being recorded in the new plots (if the stratification was properly done). Stratification can be based on altitude, moisture status of the area (water-logging vs. well drained or dry habitat), and physical appearance of the vegetation.
Hybrid Methods
You can use a combination of the above methods (e.g., determining the strata and then randomizing within the different strata or applying systematic sampling within the different strata).
Sample Plot Determination: Size, Shape, and Marking
There are diverse methods, but in Uganda, most workers have used plots of 20 m width as smaller widths tend not to capture enough trees per plot. In the National Biomass Study Methodology, 50 by 50 meter plots are established systematically on a 5 x 10 km grid. A cluster of three plots is located at each intersection of the grid. In high priority areas, plots are established at each grid intersection. In medium priority areas, plots are located at every other intersection, and in low priority areas, plots are located at every third intersection. Priority depends on the complexity of the floral ecosystem. For example, tropical high forests are high on the priority list while sparse grasslands are low on the list.
For our case plots of 20mx50m were used, each with a nested plot, 2x5m inside the main plot for study of herbaceous vegetation below the threshold diameter at breast height (dbh) and the seedlings of trees, an indication of the future forest. The length of the plot can vary depending on the level of accuracy required, the type of forest and size of strata in the habitat. Rectangular or square plots are easiest to use in woody habitats as circular plots are very difficult to mark in a forest. They (circular plots) can be used in open grasslands. Plot corners are marked with L trenches and the coordinates recorded using a GPS for future reference. This is important as it may be necessary for future monitoring of the ecological changes in the vegetation, species diversity and other changes including human induced changes.
Data Collection
All the trees in the plot whose diameter at breast height (dbh) is 3 centimeters or more are measured. In addition, within the plot, a smaller plot of 5 by 5 meters is demarcated for more detailed study. The plot is also measured originating from the GPS point of the plot, which is the southwestern corner of that plot. In this plot, saplings are counted and recorded and grass species present are recorded. All plots are geo-referenced with a GPS for easy identification during subsequent visits.
Each of the desired plants encountered in the plot (trees for our case) should be identified and a specimen/sample collected for confirmation of identity, preservation in a herbarium, and as evidence
USAID/UGANDA: ENVIRONMENTAL MANAGEMENT FOR THE OIL SECTOR – TRAINING COMPENDIUM: MODULE 4 144

that such a species indeed existed in the area. The specimen should be representative enough, from a mature branch, and where possible, with flowers and/or fruits if available. The minimum diameter at breast height that is to be measured has to be decided at the beginning. For timber inventories, a minimum of 10 cm dbh is usually applied, while for biodiversity inventories, the minimum is often lowered to 5 cm dbh, to include as many woody species as possible though some may be naturally small under-story trees that hardly ever reach 10 cm dbh.
FIGURE 2.9: HERBARIUM PRESS
Source: The University of Connecticut, No date
The specimen should preferably be big enough to cover over 75 percent of a standard herbarium sheet (42x26cm). Each sample should have a standard label, information for which should be compiled at the time of collection. A standard information for a specimen label is given below:
FIGURE 2.10: SPECIMEN LABEL
FLORA OF UGANDA Family: Name: Locality: GPS: Alt.: Floral Region:
District: County: Habitat: Collector: No.: Date (of collection): Determined by: Notes:
Equipment for Specimen Collection
The following minimum equipment should be taken into consideration when planning a plant inventory:
• Distance tapes • Diameter tapes • Calipers • Range finders; hypsometers
USAID/UGANDA: ENVIRONMENTAL MANAGEMENT FOR THE OIL SECTOR – TRAINING COMPENDIUM: MODULE 4 145

• Clinometers • GPS • Camera • Ranging poles • Pangas (machetes) for cutting trails and plot boundaries • Secateurs (for trimming plant specimens) • Pruner (with long handle and flexible blade) • Plant presses and accessories (mounting sheets, flimsy papers or newsprint, blotting papers,
cardboard sheets cut to the size of herbarium sheets, plant press straps) • First aid kit • Field guides for identification of the plants in question • Specimen dryer • Rain gear, gum boots, tree climbing gear • Specimen bags (preferably water proof plastic bags), specimen labels (temporary for use before
final identification and labeling) • Flagging tapes (for marking plots and trails)
Refresher Training
A short phase of refresher training is needed to orient the technicians in biomass monitoring.
Start-up Phase and Subsequent Assessments
The start-up phase involves establishing sample plots and geo-referencing them. Data is collected to establish baseline biomass stocks, species numbers, diversity, size, and distribution.
The subsequent phase involves revisiting the plots after a period of 2-3 years and carry out re-measurements. The procedure is quite the same as in the start-up phase except that this time no new plots are established. Data collected is compared with that collected in the start-up phase. Comparison is done at regional level as well as at plot level.
Data Analysis
Field data is entered in a computer and volumes of trees are calculated. The National Biomass Study allometric system is used. Plot data is extrapolated and results presented on per hectare basis. Analysis is done on species to determine their numbers, diversity, size, regeneration, and distribution.
Applicability of the Standard Operating Procedures in the Oil and Gas Sector
The procedures outlined above can be applied in any sector in that it helps generate the baseline data at the beginning of the project. In our case as we look forward to the commencement of exploitation of oil and gas in the Albertine Graben, it helps us establish the state of affairs of woody plants biodiversity at the beginning of the project.
The plots that are established at the beginning have to be regularly monitored to note any changes that may have occurred. For woody plants, under normal circumstances, monitoring can be carried out every five years. More frequent intervals may not yield much difference as the trees tend to grow relatively slowly and it may not be cost-effective to do monitoring more frequently since the changes would be negligible.
In order to be able to associate or attribute any changes to the oil and gas activities, there would be need to concurrently monitor the occurrences in the oil and gas sector that are likely to negatively impact on Biodiversity such as spillages, waste disposal or gas blaring. Since their impacts are likely to spread very fast, these need to be monitored more frequently (say every six months) than the woody plants biodiversity so that in case of any negative impacts, they are corrected as soon as they
USAID/UGANDA: ENVIRONMENTAL MANAGEMENT FOR THE OIL SECTOR – TRAINING COMPENDIUM: MODULE 4 146

are noticed to minimize the impacts. Monitoring is crucial because in case of any spillage or other accident, it is vital that we can attribute the negative impacts to the Oil spillage for example, to avoid denial by the acors in the oil and gas sector, as restoration activities would reduce on their profits. On the other hand, we want to avoid charging them with changes that may have resulted from natural processes such as succession, or other causes such as climate change.
The following references below are important literature and field guides for plant identification and vegetation studies:
REFERENCES
Agnew, A.D.Q & Agnew, S. (1994). Upland Kenya wild flowers: A flora of the ferns and herbaceous flowering plants of upland Kenya. Oxford University Press, London.
Beentje, H. J. (1994). Kenya trees, shrubs and lianas. Nairobi: National Museums of Kenya.
Blundell, M. (1987). Collins guide to wild flowers of East Africa. London: William Collins and Co. Ltd.
Eggeling, W. J. and Dale, I. R. (1951). The indigenous trees of the Uganda Protectorate (2nd ed.). Glasgow: The University Press.
Haines, R. W and Lye K. A. (1983). The sedges and rushes of East Africa. A flora of the families juncaceae and cyperaceae in East Africa, with a particular reference to Uganda. Nairobi: East African Natural History Society.
Hamilton, A.C. (1991). Uganda forest trees. Kampala: Makerere University Printer.
Heywood, V.H. (Ed.). (1993). Flowering plants of the world. London: B. T. Batsford Ltd.
Katende, A.B. et. al. (1995). Useful trees and shrubs for Uganda: Identification, propagation and management for agricultural and pastoral communities. Nairobi: Regional Soil Conservation Unit.
Mabberley, J.D. (1987). The plant-book: A portable dictionary of the higher plants. Cambridge: Cambridge University Press.
NEMA. (2012). The Environmental Monitoring Plan For The Albertine Graben 2012-2017. Government of Uganda. Retrieved from http://www.nemaug.org/reports/Albertine_graben_monitoring_plan_2012_2017.pdf
University of Connecticutt. (No date). Plant taxonomy. Retrieved from http://bgbaseserver.eeb.uconn.edu/Teacher_website/MakingCollection.html
USAID/UGANDA: ENVIRONMENTAL MANAGEMENT FOR THE OIL SECTOR – TRAINING COMPENDIUM: MODULE 4 147

LECTURE 3: ENVIRONMENTAL DISASTERS AND DEGRADATION FROM OIL AND GAS DEVELOPMENT
SYLLABUS
Teaching Aims
(i) Provide broad understanding of the nature, cause, scope, scale, intensity, and boundaries of responsibilities of major environmental disasters from oil and gas development and the resulting environmental degradation.
(ii) Provide the trainees with an appreciation of approaches for remedial actions to mitigate impacts of environmental disasters.
Learning Objectives
(i) Demonstrate ability to anticipate environmental hazards/emergencies and their possible impacts on the environment and biodiversity
(ii) Communicate appropriate response measures to relevant stakeholders
Outline of Lecture Content
Topic and Subtopic Suggested Approach, Method and Equipment
1. Introduction to major types of environmental disasters/emergencies from oil and gas development
Q&A to guide discussions
2. Causes and contributing factors Link to lectures in Volume 1 which deals with the oil and gas value chain, and elicit an overview by Q&A
3. Resulting environmental degradation and related impacts
Practical lessons: interactive group discussions using written case study material or video footage of actual real-life environmental disasters and resulting degradation of the environment and biodiversity
4. Selected examples of recent major environmental disasters from oil and gas development
Case study of the examples as basis for discussion of the subtopics under this topic
5. Developing a response system Lecture interspersed with Q&A Field Practicals
DETAILED NOTES
Introduction to Major Types of Environmental Disasters/Emergencies from Oil and Gas Development
Definitions and Terms
Source: Sena, 2006
“Disaster: Several definitions are frequently given to disaster. The WHO defines a disaster as “a sudden ecological phenomenon of sufficient magnitude to require external assistance.” It is also defined as any event, typically occurring suddenly, that causes damage, ecological disruption, loss of human life, deterioration of health and health services, and which exceeds the capacity of the affected community on a scale sufficient to require outside assistance (Landesman, 2001). It is an
USAID/UGANDA: ENVIRONMENTAL MANAGEMENT FOR THE OIL SECTOR – TRAINING COMPENDIUM: MODULE 4 148

emergency of such severity and magnitude that the resultant combination of deaths, injuries, illness, and property damage cannot be effectively managed with routine procedures or resources.”
“Emergency: A state in which normal procedures are suspended and extra-ordinary measures are taken in order to avert a disaster. An emergency can be defined in the context of the social, political and epidemiological circumstances in which it occurs.”
“Hazard: A rare or extreme event in the natural or human made environment that adversely affects human life, property, or activity to the extent of causing a disaster. It is essential to make a distinction between hazards and disasters, and to recognize that the effect of the former upon the latter is essentially a measure of the society’s vulnerability.”
“Mitigation: Permanent reduction of the risk of a disaster. Primary mitigation refers to reducing the resistance of the hazard and reducing vulnerability. Secondary mitigation refers to reducing the effects of the hazard (preparedness). Mitigation includes recognizing that disasters will occur; attempts are made to reduce the harmful effects of a disaster, and to limit their impact on human suffering and economic assets.”
“Prevention: Defined as those activities taken to prevent a natural phenomenon or potential hazard from having harmful effects on either people or economic assets. Delayed actions drain the economy and the resources for emergency response within a region. For developing nations, prevention is perhaps the most critical components in managing disasters, however, it is clearly one of the most difficult to promote. Prevention planning is based on two issues: hazard identification (identifying the actual threats facing a community) and vulnerability assessment (evaluating the risk and capacity of a community to handle the consequences of the disaster). Once these issues are put in order of priority, emergency managers can determine the appropriate prevention strategies. Disaster prevention refers to measures taken to eliminate the root causes that make people vulnerable to disaster.”
“Preparedness: Are the measures that ensure the organized mobilization of personnel, funds, equipments, and supplies within a safe environment for effective response. Disaster preparedness is building up of capacities before a disaster situation prevails in order to reduce impacts. Its measures include inter alia, availability of food reserve, emergency reserve fund, seed reserve, health facilities, warning systems, logistical infrastructure, relief manual, and shelves of projects.”
“Reconstruction: The full resumption of socioeconomic activities plus preventive measures.”
“Rehabilitation: The restoration of basic social functions.”
“Response: The set of activities implemented after the impact of a disaster in order to assess the needs, reduce the suffering, limit the spread and the consequences of the disaster, open the way to rehabilitation.”
“Risk: The expected losses (lives lost, persons injured, damage to property, and disruption of economic activity) due to a particular hazard. Risk is the product of hazard and vulnerability. Risk is the probability that a person will experience an event in a specified period of time. Risk is a function of hazard and vulnerability, a relationship that is frequently illustrated with the following formula, although the association is not strictly arithmetic:
Risk = hazard x vulnerability.
Risk is the probability of being affected by the unwanted consequences of a hazard. It combines the level of hazard and degree of vulnerability.”
“Risk assessment: A term used widely for a systematic approach to characterizing the risks posed to individuals and populations by potentially adverse exposures.”
“Susceptibility: Exposure to danger.”
USAID/UGANDA: ENVIRONMENTAL MANAGEMENT FOR THE OIL SECTOR – TRAINING COMPENDIUM: MODULE 4 149

“Vulnerability: The degree of loss resulting from a potentially damaging phenomenon.”
General Types of Disasters
In general, disasters are broadly divided into two types comprising natural and man-made (technological) disasters.
Natural Disasters
Source: Sena, 2006
“Natural disasters occur as the result of action of the natural forces and tend to be accepted as unfortunate, but inevitable. The natural disasters result from forces of climate and geology. Natural disasters are perhaps the most “unexpected” and costly overall in terms of loss of human lives and resources. Natural disasters with acute onsets include events such as earthquake, flood, hurricane, cyclone or typhoon, tornado, fire, tsunami or storm surge, avalanche, volcanic eruption, extreme cold or blizzard, and heat wave. Natural hazards with slow or gradual onset include drought, famine, desertification, deforestation, and pest infestation.”
Human (Technological) Causes
Source: Sena, 2006
“The technological or man-made disasters result from some human activities, such as explosions, fires, the release of toxic chemicals or radioactive materials, crashes, dam or levee failure, nuclear reactor accidents, breaks in water, gas, or sewer lines, deforestation, war, conflicts, etc. Technological disasters tend to involve many more casualties than natural disasters of the same magnitude of energy release.”
“Technological or man-made disasters are unpredictable, can spread across geographical areas, may be unpreventable, and may have limited physical damage but long-term effect. They are also much more difficult for the community to deal with and for victims to accept. In technological disasters, there are issues of blame involved and the community spends much time discussing who was responsible and what mistakes were made. Increasingly, agencies involved in disasters and their management are concerned with the interactions between man and nature, which can be complex and can aggravate disasters. Communities in which industrial sites are located or through which hazardous material pass via high way, rail, or pipeline are at risk for technological disasters.”
“In general terms, Industrial/technological disasters result from a society’s industrial and technological activities that lead to pollution, spillage, explosions, and fires. They may occur because of poor planning and construction of man-made facilities (buildings, factories, etc.) or from neglect of safety procedures. Sudden-onset disasters such as earthquakes, floods, and terrorist acts may trigger secondary disasters such as explosions, fires, or pollution. Industrial events have the potential to cause large-scale loss of life, infrastructural damage, and environmental degradation, especially in developing countries with unregulated industrialization, and inadequate safety standards and disaster response capacity.”
“Wherever there is a man-made facility, there is the potential for an industrial or technological disaster to occur. Reducing the occurrence and effects of industrial disasters requires a multi-sectoral approach.”
Environmental Disasters
For the purpose of this lecture, an environmental disaster is defined as a “specific event caused by human activity those results in a seriously negative effect on the environment” (Evans, 2011). Sometimes a natural disaster can become an environmental disaster. In most cases, environmental disasters are caused by human error, accident, lack of foresight, corner cutting during industrial processes, greed, or by simple incompetence. In other words, without some kind of human intervention they would never have happened.
USAID/UGANDA: ENVIRONMENTAL MANAGEMENT FOR THE OIL SECTOR – TRAINING COMPENDIUM: MODULE 4 150

The consequences of environmental disasters can range from death to a severe disruption of ecological and anthropogenic processes and livelihoods.
The Specificity of Environmental Disasters in the Oil and Gas Industry
Oil and gas industry installations and activities entail the hazard of major accidents with potentially severe consequences to the life and health of workers, pollution of the environment, direct and indirect economic losses, and deterioration of the security of energy supply (Christou and Konstantinidou, 2012). An accidental episode frequently triggers further events that could be considered individual accidents in themselves. For instance, an unexpected oil blowout in a production well might be followed by an explosion, a fire, a spillage, and in the worst-case scenario by the structural failure or collapse of the entire installation, if the response is not fast and adequate. The effects and consequences of individual accidents depend on a combination of circumstances and environmental factors (Gomez and Green, 2013). The sections below outline hazards and major accidents that often lead to environmental disasters.
Oil Spills
Oil spills are one of the most well-known environmental disasters caused by the oil and gas industry. “Accidents with tankers, pipelines, and oil wells release massive quantities of petroleum into land and marine ecosystems in a concentrated form. The ecological impacts of large spills like these have only been studied for a very few cases, and it is not possible to say which have been the most environmentally damaging accidents in history. A large oil spill in the open ocean may do less harm to marine organisms than a small spill near the shore” (Advameg, 2017).
“The 1989 Exxon Valdez disaster in the Prince William Sound in Alaska created a huge ecological disaster not because of the volume of oil spilled (eleven million gallons) but because of the amount of shoreline affected, the sensitivity and abundance of organisms in the area, and the physical characteristics of the Prince William Sound, which helped to amplify the damage. The Exxon Valdez spill sparked the most comprehensive and costly cleanup effort ever attempted, and called more public attention to oil accidents than ever before” (Advameg, 2017).
“Spills from tankers, pipelines, and oil wells are examples of point sources of pollution, where the origin of the contaminants is a single identifiable point. They also represent catastrophic releases of a large volume of pollutants in a short period of time. But the majority of pollution from oil is from nonpoint sources, where small amounts coming from many different places over a long period of time add up to large-scale effects” (Advameg, 2017).
The Deepwater Horizon disaster of April 2010 is the most recent example of spills associated with the oil and gas industry. In this case following a sudden explosion on a drilling rig in the Gulf of Mexico, the safety valve that was designed to prevent an oil spill spectacularly failed. It was months before the leakage was sealed, during which time millions of gallons of oil poured into the sea. The resulting pollution was not just from the oil, but also from the chemicals used to disperse it. Whole ecosystems were destroyed along with the livelihoods of countless people. Many endangered species are not expected to recover.
“Oil spills that occur on land, primarily from pipeline leaks and accidents, can contaminate surrounding soils and groundwater. A large oil spill can make contaminated land uncultivable -- placing subsistence farmers at risk for food insecurity—and eliminate the safe drinking water supply for a community” (Epstein and Selber, 2002).
In West Africa, the Niger Delta covers 20,000 km2 within wetlands of 70,000 km2, formed primarily by sediment deposition. It is home to some 20 million people from 40 different ethnic groups. Its floodplain makes up 7.5 percent of Nigeria's total land mass and is the third-largest drainage basin in Africa. Its ecosystem contains one of the highest concentrations of biodiversity on the planet. In addition to supporting a vast range of flora and fauna, there is arable terrain that can sustain a wide variety of crops, tropical forests and more species of freshwater fish than any other ecosystem in West Africa.
USAID/UGANDA: ENVIRONMENTAL MANAGEMENT FOR THE OIL SECTOR – TRAINING COMPENDIUM: MODULE 4 151

Unfortunately, for the Niger Delta, oil was discovered in the region. Since drilling began in 1976, there has been very limited concern by the Nigerian Government or the oil operators to exert any control of the environmental problems associated with the industry. The Nigerian National Petroleum Corporation (NNPC) admits that every year as a result of around 300 individual spills, nearly 2,300 cubic meters of petroleum are jettisoned into the environment. However, this does not take account of so-called ''minor'' spills and one estimate put the total spillage between 1960 and 1997 as upwards of 100 million barrels (16 million cubic meters).
A major reason for these spills is simply the result of poor maintenance. Pipelines are old and corroded and although they have an estimated lifespan of about 15 years, many have been in use for about 25. Leaking pipes and the use of old and corroded tankers account for 50 percent of all spills. Understandably, there has been a major impact on the ecosystem. Enormous tracts of mangrove forest have been destroyed along with most of the flora and fauna that were once found there.
Land spills can happen on rivers and lakes, but can also be purely terrestrial. In both cases though, the area they affect is more restricted and more predictable: the oil spilled in the river can only go down the current, the oil spilled on lake is limited to the extent of the lake and the oil spilled on the ground is going to seep into the ground. Therefore, because of this, the first wave of consequences is limited: there are fewer animals killed, fewer surfaces damaged and the impact is far less visible.
The origins of leaks on land are easier to spot and easier to access and therefore the spill is also easier to stop. Consequently, land spills are often of less importance compared to marine spills: the 2011 Rainbow Pipeline spill in Alberta reached the 4,200 tons, the Exxon pipe that ruptured near the Yellowstone River the same year dumped up to 140 tons of oil and the SPSEs pipeline spilled 4,700 tons of oil in the South of France. However, despite all this, terrestrial oil spills also can be massive. In 1992, the Mingbulak oil spill in Uzbekistan reached the 280,000 tons. This amount makes it the largest land spill of all time due to the oil industry (and not to a war or a terrorist act).
Flaring and Venting
Source: Bott, 2007
“Flaring—burning natural gas in an open flame—has long been part of the process for producing marketable natural gas and crude oil in the petroleum industry. Flaring is an important safety measure during drilling operations and at natural gas facilities. It safely disposes of gas during equipment failures, power outages and other emergencies or “upsets” in drilling or processing operations. The natural gas might otherwise pose hazards to workers, nearby residents and the surrounding environment. Flare systems are used throughout the petroleum industry around the world.”
“Venting is the release of natural gas directly into the atmosphere without flaring or incineration. Most of the venting occurs during the production of crude oil and oil sands bitumen. Some natural gas is released at the wellhead as the oil or bitumen is brought to the surface, and some is released during treatment and storage. Although the quantities released at any given well are typically small, the total amount is significant if there are many such wells. Venting also may occur during well testing—primarily from shallow, sweet, low-volume natural gas wells—and in the operations of natural gas wells, pipelines, and processing plants.”
Emissions
Source: Bott, 2007
“Flaring and venting waste potentially valuable resources and produce emissions that affect human health, livestock, and the environment. Effects depend on the magnitude, duration, and frequency of exposure, as well as the susceptibility of the individual organism or environment.”
“Unprocessed natural gas usually contains a mixture of hydrocarbons and other substances, which can form a variety of chemical compounds during combustion. For example, incomplete combustion of hydrocarbons can lead to the formation of carbon monoxide (CO). Nitrogen in the air is also
USAID/UGANDA: ENVIRONMENTAL MANAGEMENT FOR THE OIL SECTOR – TRAINING COMPENDIUM: MODULE 4 152

oxidized during combustion to form oxides of nitrogen, known collectively as NOx. The methane (CH4) in vented natural gas and the carbon dioxide (CO2) and nitrous oxide (N20) emitted from flares and incinerators are greenhouse gases that contribute to global warming.”
According to Environment Canada, flaring and venting in the oil and gas industry emitted the equivalent of 15.8 million tons of CO2 in 2003, or about two percent of total Canadian greenhouse gas emissions. Worldwide, this process contributes 35 million tons of carbon dioxide annually as well as 12 million tons of methane, two very potent greenhouse gases (Epstein and Selber, 2002). Seventy-six percent of the natural gas that is a by-product of oil extraction has been flared in Nigeria, covering the surrounding area with black soot. For Saudi Arabia, the figure is 20 percent, Iran 19 percent, Mexico 5 percent, Britain 4.3 percent, Algeria 4 percent, Russian Federation 1.5 percent, U.S. 0.6 percent.
“If vented natural gas contains heavier hydrocarbons or hydrogen sulfide (H2S), these can affect local and regional air quality. In addition to NOx, CO2, and CO, emissions from flaring and incineration can include unburned hydrocarbons, particulate matter, PAH and VOC. Under some circumstances, inefficient combustion of hydrocarbons may also produce VOCs, which include a wide variety of hydrocarbon compounds heavier than ethane. VOCs combine with oxides of nitrogen in the presence of sunlight to create ground-level ozone and smog.”
“However, there is no question that high enough concentrations of petroleum-related emissions could affect the respiratory health, vision, and skin of humans and animals. Exposure to some VOC and PAH substances increases the likelihood of cancers. Sulfur dioxide and oxides of nitrogen can acidify soils and lakes and affect the growth of crops and forests.”
Finally, the oil industry also contributes to larger environmental disasters. The extraction of oil requires a lot of energy that is often produced by petroleum itself or by coal, producing therefore large amounts of carbon dioxide and nitrogen gas. The oil industry is as a consequence participating in two big environmental disasters that are climate change and acid rain. However, it is important to note that indeed, those two environmental disasters are not the sole responsibility of the oil industry and the crisis following them cannot be handled only by the companies in this sector.
Blowouts
Source: Gomez and Green, 2013
“A blowout is an unexpected flow of oil and gas that occurs during drilling wells, when there is a zone of abnormally high pressure. By definition, a blowout is an uncontrolled loss of oil and/or gas under pressure that happens from the reservoir and/or the production line before the oil and gas enters the processing facilities for separation of water and division into its useful components of crude oil and gas. An uncontrolled loss after the oil/gas/water has entered the process facilities is called a process leak and is by definition not a blowout accident.”
“Blowouts are more frequent during the initial phases of well construction, when preventive measures are not in place, but may also occur during production. Low-intensity episodes are controllable by blowout preventers such as safety valves, or by changing the density of the drilling fluid, but intense and prolonged gushing may lead into catastrophic situations. Uncontrollable blowouts can develop into large oil or gas spills. Blowouts occur as consequence of equipment failure, personnel mistakes, or extreme natural impacts like seismic activity or hurricanes.”
Saetren (2007) describes some of the characteristics of blowouts as follows:
• “The potential forces of destruction are present within this bounded technical system and not coming from the outside like for instance a ship colliding into an oil/gas rig/ platform.”
• “Blowouts unlike the other types of accidents with disastrous potential happen at the boundary between natural objects and technical artifacts and human ability to sense and interpret nature are relevant to understanding consequences of actions and thereby relevant for safe operations.”
• “The accident form has potential for destroying the whole facility.”
USAID/UGANDA: ENVIRONMENTAL MANAGEMENT FOR THE OIL SECTOR – TRAINING COMPENDIUM: MODULE 4 153

• “Environmental consequences to the surrounding sea can be substantial.”
Effluent Discharge and Disposal
Produced Water
Source: BOEM, No date
“The bulk of waste materials produced by oil and gas activities are formation water (produced water) and drilling muds and cuttings. Additional waste materials include small quantities of treated domestic and sanitary waste, deck drainage, once-through fire water, non-contact cooling water, bilge water, ballast water, produced sands, waste oil, excess cement, chemical products, and trash and debris.”
“During the drilling of a well, drilling fluids, or "muds" are used to lubricate and cool the drill bit, control reservoir pressure, and transport the drill cuttings back to the surface. Drilling discharges are made up of drilling muds that have not stayed in the borehole and cuttings, the crushed rock from the borehole.”
“Produced water is mainly salty water trapped in the reservoir rock and brought up with oil or gas during production. It can contain minor amounts of chemicals added down-hole during production. These waters, which are under high pressures and temperatures, must be treated, because they usually contain oil and metals. Before being discharged, produced water must meet established limitations on oil content. As with drilling muds, following treatment, produced water must be tested for toxicity, according to EPA requirements. If it fails the toxicity test, it cannot be discharged into the ocean. When discharge into the ocean is permitted, the discharge cannot exceed set discharge rates.”
“Offshore drilling and production discharges and their environmental effects have been studied for over 30 years. In 1973, BOEM (then the Bureau of Land Management) began its Environmental Studies Program to investigate potential effects of oil and gas production activities on the marine environment.”
“Key concerns include the fate of the discharges in the environment, including dispersion, degradation, and deposition resulting in smothering and alteration of the seafloor environment. Also of concern are acute and chronic toxic effects on plant and animal life both in the water column and at the ocean floor.”
“In general, study results indicate that the observable effects are limited to radial distance of 100 to 1,000 meters from the discharge point; the area is greater in deep waters. Assuming that mitigation measures are implemented, acute responses to drilling discharges are unlikely.”
Refineries Process Wastes
Source: The World Bank Group, 1998
“Petroleum refineries produce industrial process wastes that are inherent to the activities they carry out in the handling and processing of crude petroleum and petroleum products. The refineries use relatively large volumes of water, especially for cooling systems. Surface water runoff and sanitary wastewaters are also generated. The quantity of wastewaters generated and their characteristics depend on the process configuration. As a general guide, approximately 3.5–5 cubic meters (m3) of wastewater per ton of crude are generated when cooling water is recycled.”
“Refineries generate polluted wastewaters, containing BOD and chemical oxygen demand (COD) levels of approximately 150–250 milligrams per liter (mg/l) and 300–600 mg/l, respectively; phenol levels of 20–200 mg/l; oil levels of 100–300 mg/l in desalter water and up to 5,000 mg/l in tank bottoms; benzene levels of 1–100 mg/l; benzo(a) pyrene levels of less than 1 to 100 mg/l; heavy metals levels of 0.1–100 mg/l for chrome and 0.2–10 mg/l for lead; and other pollutants.”
USAID/UGANDA: ENVIRONMENTAL MANAGEMENT FOR THE OIL SECTOR – TRAINING COMPENDIUM: MODULE 4 154

“Refineries also generate solid wastes and sludge (ranging from 3 to 5 kg per ton of crude processed), 80 percent of which may be considered hazardous because of the presence toxic organics and heavy metals.”
“Accidental discharges of large quantities of pollutants can occur as a result of abnormal operation in a refinery and potentially pose a major local environmental hazard.”
Explosions and Fires
“The explosion of an oil or gas well is the most dangerous accident, posing risk of catastrophe with human casualties. An explosion may occur directly linked to a blowout or spillage of oil. In the case of partial or complete destruction of the offshore installation, an additional risk exists of a high volume of hydrocarbon spill. In this case the volume of leakage is difficult to quantify, and the well could be spilling for a long period until depletion or until it is brought under control” (Gomez and Green, 2013).
“Oil well fires are oil or gas wells that have caught on fire and burn. Oil well fires can be the result of human actions, such as accidents or arson, acts of war or natural events, such as lightning. They can exist on a small scale, such as an oil field spill catching fire, or on a huge scale, as in geyser-like jets of flames from ignited high pressure wells. A frequent cause of a well fire is a high pressure blowout during drilling operations. Oil well fires are more difficult to extinguish than regular fires due to the enormous fuel supply for the fire” (Gomez and Green, 2013).
“The consequences of major oil and gas industry fires include heavy property damage losses, negative impact on the environment and the economy as well as untold damage to workers and surrounding communities from injuries, death, and morbidity” (Coombs, No date).
“The world's worst offshore disaster claimed 167 lives when an explosion and fire occurred on the Piper Alpha platform in the North Sea in 1988. The fire cost billions of dollars in property damage, and the shutting down of approximately 10 percent of total UK gas production” (Coombs, No date).
“During the Gulf War in 1991, 640 odd wells ignited in Kuwait. Fires raged for more than eight months, consumes 2 billion barrels of oil, and cost Kuwait US $100 billion. During the operation Allied Forces in Yugoslavia in 1999, precision bombing caused widespread damage to oil and petrochemical facilities. The results were oil product releases, pollutant releases, groundwater pollution, soil pollution, chemical emissions, widespread injuries, and death. Between 1970 and 1999 accidents at major hydrocarbon plants and facilities around the world with property damage over US $10 million were 379, and amounted to over $22 billion in property damage at January 2000 dollars” (Coombs, No date).
“At Petrotrin Oil Refinery in Trinidad West Indies, the country experienced an explosion and fire on a Fluid Catalytic Cracking Unit (FCCU) Plant on June 05, 1991, which claimed one life and injured 17 and on October 17, 1985 a fire on #5 berth claimed the lives of 14 workers” (Coombs, No date).
Potential Economic and Energy Security Impacts
Source: Garg and Yadav, 2015
“The consequences of accidents should be clearly distinguished from emissions and pollution during normal operation activities, even if these activities are extended through the whole life cycle of an installation. While the latter (pollution from normal operation) results in relatively small quantities of pollutants ending in the sea during long periods, the accidental events result in release of huge quantities of hydrocarbons and pollutants discharged uncontrolled in the sea during relatively short periods.”
“While consequences of potential accidents to life and health of the workers, pollution of the environment, and direct economic damage are direct effects and can easily be assessed, indirect economic damage and effects of the accident to security of energy supply are more difficult to be assessed. The indirect economic damage may include losses from the fall in the price of the shares of
USAID/UGANDA: ENVIRONMENTAL MANAGEMENT FOR THE OIL SECTOR – TRAINING COMPENDIUM: MODULE 4 155

the company after the accident (BP shares were reported to have fallen up to 50 percent in June 2010 after the Deepwater Horizon accident). The impact on security of energy supply can be understood by considering the ban of certain exploration activities in some countries (USA, Italy, etc.) in the aftermath of the Deepwater Horizon accident. Clearly, the assessment of indirect economic damage and effect of a large-scale accident on energy security is not an easy task.”
Causes and Contributing Factors
Overview
“Serious accidents can and will occur at various phases of the oil and gas exploration, production, and transportation processes. Blowouts of wells (caused by pressure build up in front of the drill head), platform collapses or collisions with ships, pipeline ruptures, leaks and accidents in transferring oil and gas between facilities, spills and fires and explosions all constitute major environmental and public health hazards” (Epstein and Selber, 2002).
Studies and research over the years by governments, industry, and individual experts have shown that the underlying causes of accidents are similar across the major hazard industries. “In the majority of major accidents there is a complex chain of events, including organizational policies and decisions, individual behaviors and mechanical or technological failures that, when combined, resulted in the incident. While the individual behaviors that resulted in accidents are wide and varied, they all relate to human and organizational factors and many are symptomatic of a poor safety culture. Despite attempts to learn lessons, major accidents continue to be a threat. Efforts to map the causes of accidents to the different industry sectors indicate that there is consistency in the dominant failings, and this is true across the major hazard industries and for non-major hazard industry sectors. This may be due to pervasive differences between organizational groups (operators, engineers, and directors) that hinder effective learning and communication” (Bell, 2006). Specific factors contributing to major accidents include:
Source: Belll, 2006
• “Poor management practices (e.g., inadequate supervision) • Pressure to meet production targets • Inadequate safety management systems • Failure to learn lessons from previous incidents • Communication issues (e.g., between shifts, between personnel and management, etc.) • Inadequate reporting systems • Complacency • Violations/ non-compliance behavior • Inadequate training (e.g., emergency response, fire and safety) • Lack of competency • Excessive working hours resulting in mental fatigue • Inadequate procedures • Modification/ updates to equipment without operator knowledge and/or revised risk
assessments • Inadequate/ insufficient maintenance • Maintenance errors”
Causes of and Contributing Factors for Major Accidents
Source: International Labor Organization, 1991
“The causes, scale, and severity of the accidents are extremely variable and depend on a combination of many natural, management, technical, and technological factors. While most of these are derived from studies and investigations of major industrial accidents, they nonetheless, by and large, apply to the oil and gas industry as well.
USAID/UGANDA: ENVIRONMENTAL MANAGEMENT FOR THE OIL SECTOR – TRAINING COMPENDIUM: MODULE 4 156

• Component failure • Deviations from normal operating conditions • Human and organizational errors • Outside accidental interferences • Natural forces • Acts of mischief and sabotage”
Source: International Labor Organization, 1991
The following is an indicative list of possible causes of major accidents:
• “Inappropriate design against internal pressure, external forces, corrosion, material defects, static electricity and temperature
• Mechanical damage to components such as vessels and pipework due to corrosion, rupture, cracks or external impact
• Malfunction of components such as pumps, compressors, blowers and stirrers • Malfunction of control devices and systems (pressure and temperature sensors, level controllers,
flow meters, control units, process computers) • Malfunction of safety devices and systems (safety valves, bursting discs, pressure-relief systems,
neutralization systems, flare towers)”
“During construction of a platform, or more rarely during production, there is risk of structural failure associated with difficult working conditions. Most accidents are due to error in the design or fabrication because the undulating sea-beds where the structures are located make them susceptible to many uncertainties. Failures can also result from material fatigue. If the failure is enough to make the entire structure collapse and sink, there is an obvious and important economic loss. Transport pipelines may malfunction and even break during transport, because of corrosion or global buckling. When the rupture is localized, the pipeline can be repaired or replaced. If the rupture is small or occurs in a remote area it might go unnoticed for some time, leaking oil or gas” (Gomez and Green, 2013).
Deviations from Normal Operating Conditions
Source: International Labor Organization, 1991
The following examples highlight some of the major cause of accidents that can be attributed to deviations from normal operating procedures and conditions:
• Failure in the monitoring of crucial process parameters (pressure, temperature, flow, quantity, mixing ratios) and in the processing of these parameters (e.g., in automatic process control systems)
• Failure in the manual supply of chemical substances • Failure in utilities, such as:
− Insufficient coolant for exothermal reactions − Insufficient steam or heating medium − No electricity − No inert gas − No compressed air (instrument air)
• Failures in shutdown or start-up procedures, which could lead to hazardous conditions within the installation
• Formation or introduction of by-products, residues, water or impurities, which could cause side-reactions (e.g., polymerization)
USAID/UGANDA: ENVIRONMENTAL MANAGEMENT FOR THE OIL SECTOR – TRAINING COMPENDIUM: MODULE 4 157

Human and Organizational Errors
Source: International Labor Organization, 1991
Human factors in the running of major hazard installations are of fundamental importance, both for highly automated plants and for plants requiring a great deal of manual operation. The following are some examples of human and organizational errors that are often the cause of major accidents:
• Operator error (wrong button, wrong valve) • Disconnected safety systems because of frequent false alarms • Mix-up of hazardous substances • Communication errors • Incorrect repair or maintenance work • Unauthorized procedures (e.g., hot work, modifications)
Any examination of each of the above should also consider the reasons for human errors, which may include:
• Workers being unaware of the hazards • Lack of or inadequate working procedures • Workers being inadequately trained • Inappropriate working conditions • Conflicts between safety and production demands • Excessive use of overtime or shift work • Inappropriate work design or arrangements such as single-manned workplaces • Conflicts between production and maintenance work • Drug or alcohol abuse at work
Drilling Accidents
Source: Stanislav, 1999
“Drilling accidents are usually associated with unexpected blowouts of liquid and gaseous hydrocarbons from the well as a result of encountering zones with abnormally high pressure. No other situations but tanker oil spills can compete with drilling accidents in frequency and severity.”
“Broadly speaking, two major categories of drilling accidents should be distinguished. One of them covers catastrophic situations involving intense and prolonged hydrocarbon gushing. These occur when the pressure in the drilling zone is so high that usual technological methods of well muffling do not help. Lean holes have to be drilled to stop the blowout. The abnormally high pressure is most often encountered during exploratory drilling in new fields. The probability of such extreme situations is relatively low. Some oil experts estimate it at 1 incident for 10,000 wells. The need to drill lean holes emerges, on average, in 3 percent of accidental episodes.”
“The other group of accidental situations includes regular, routine episodes of hydrocarbon spills and blowouts during drilling operations. These accidents can be controlled rather effectively (in several hours or days) by shutting in the well with the help of the blowout preventers and by changing the density of the drilling fluid. Accidents of this kind are not so impressive as rare catastrophic blowouts. Usually, they do not attract any special attention. At the same time, their ecological hazard and associated environmental risk can be rather considerable, primarily due to their regularity leading, ultimately, to chronic impacts on the marine environment.”
Storage
Source: Stanislav, 1999
“Underwater reservoirs for storing liquid hydrocarbons (oil, oil-water mixtures, and gas condensate) are a necessary element of many oil and gas developments. They are often used when tankers
USAID/UGANDA: ENVIRONMENTAL MANAGEMENT FOR THE OIL SECTOR – TRAINING COMPENDIUM: MODULE 4 158

instead of pipelines are the main means of hydrocarbon transportation. Underwater storage tanks with capacities of up to 50,000 m3 either are built near the platform foundations or are anchored in the semi-submerged position in the area of developments and near the onshore terminals. Sometimes, the anchored tankers are used for this purpose as well.”
“A risk exists of damaging the underwater storage tanks and releasing their content, especially during tanker loading operations and under severe weather conditions. However, no summarizing quantitative assessments and statistics of such events are available. After the spill of 1,200 tons of crude oil in 1988 from an underwater storage tank during a storm in the North Sea, some countries introduced restrictions on installing such structures near the shore (Cairns, 1992). The most dangerous are the accidents involving underwater storage tanks that contain toxic agents, for example methanol. Such accidents are possible in the area of Shtokmanovskoe field developments in the Barents Sea where over 3,000 tons of methanol products are planned to be stored underwater.”
Transportation
Source: Epstein and Selber, 2002
“The role of and demand for oil in the modern world has created the need for increasingly complex transportation methodologies that allow oil to be carried to all regions of the Earth. Unfortunately, gaps between effectiveness and safety, combined with the potential for human error, have resulted in significant ecological disasters.”
Oil Spills
Source: Epstein and Selber, 2002
“Since most of the Earth’s oil is found under the oceans, robust technology has emerged to transport extracted oil from the seas to refineries and, from there, to the myriad distribution points around the globe. Immense networks of pipelines crisscross the globe carrying oil and natural gas, underwater and above and below-ground, from extraction points to refineries. There are more miles of oil pipeline than railroad tracks in the world (Burger, 1997) and enormous supertankers, laden with oil, circumnavigate the Earth’s seas.”
“From coasts, tank barges trudge along rivers transporting oil to inland destinations. Then tank trucks replete with oil, cruise the world’s highways racing to distribution and storage points all over the globe. Accidents have occurred at each point of transfer and transport, exposing the environment to the various harmful effects of oil contamination. As technology has progressed, the scale of these disasters has increased, though their frequency has declined due to regulations and increased safety measures.”
“Large-scale oil spills, defined as spills of over 10 million gallons, have occurred almost every year since the 1960s. Except for the Kuwaiti oil spill, most large-scale oil spills are the result of grounded supertankers or supertanker collisions.”
“Over the past four decades, supertankers have dramatically increased their carrying capacity. In 1960, a supertanker could carry 150 million gallons of oil; today they can carry over 240 million gallons. Tankers are over 300 meters long and are some of the least maneuverable vessels at sea, making them extremely prone to accidents. In the United States, the Exxon Valdez spill in Prince William Sound, Alaska increased general awareness concerning the danger of oil spills and forced the U.S. government to take new regulatory action. That spill leaked over 11 million gallons of oil into the pristine sound, blackening the frigid waters and coating the coastline with oil (Burger, 1997). Although it was one of the most well publicized oil spills in recent history, the Exxon Valdez spill ranks only 28th in terms of scale.”
“Tanker accidents are among the most harmful accidents in the marine industries, due to the nature of the materials being transported and the effects on the environment. The most frequent causes of tanker accidents are running aground and into shore reefs, collision with other vessels or installations, hull failure, and fires or explosion of the cargo (Musk, 2012). Accidents frequently occur
USAID/UGANDA: ENVIRONMENTAL MANAGEMENT FOR THE OIL SECTOR – TRAINING COMPENDIUM: MODULE 4 159

in proximity to the coast and may lead to shores being affected by large amounts of spilled oil. The spillage might be slow or fast, sometimes lasting for months” (Gomez and Green, 2013).
“Such large-scale oil spills occur against a backdrop of more frequent smaller-scale spills that receive little attention. Smaller spills have also contributed significantly to environmental degradation. The quantity of oil released from the combination of smaller accidents, operational leaks, and pipeline bursts actually greatly surpasses the amount released from the large spills from supertankers. In much of the world, it is these smaller-scale pipeline accidents and leaks, in conjunction with the leaks and discharges from the extraction and refining processes, that contribute most heavily to environmental damage.”
“At every point along this chain, there are leaks and spills of crude oil or petroleum products. The transfer of oil from the wells to storage tankers, from storage tankers to supertanker, from supertankers to storage tankers or tank barges, from storage tankers to truck tankers, etc. can all entail oil spillage. In addition to leaks and spills, pipeline fires and blowouts occur. Pipelines carry oil and gas all over the world, and are able to function 24 hours a day, under any weather conditions. Because of this non-stop capability, pipelines are preferable to supertankers. Unfortunately, there are large initial costs in building safe pipelines and relatively large recurrent costs in maintaining them. Pipelines are therefore very prone to corrosion, leakage and rupture at points that connect the various pipeline components. Pipelines burst relatively frequently due to faulty equipment, causing spills and raising the potential for oil or gas fires and thus pose serious threats to neighboring populations and surrounding environments.”
Natural Forces
Source: Girgin and Krausman, 2014
Depending on the local situation, the following natural forces have been demonstrated to cause major accidents and are routinely incorporated in the design of oil and gas industry installations:
• Wind • Flooding • Earthquakes • Settlement as the result of mining activities • Extreme frost • Extreme sun • Lightning
“Natural events such as earthquakes, floods, and lightning can cause accidents in oil and gas transport pipelines with potentially adverse secondary consequences to the population, the environment, or the industrial activity itself. Such accidents are commonly referred to as Natech accidents.”
“Numerous severe accidents bear testimony to the risk associated with natural hazard impact on pipelines transporting dangerous substances. In the USA in 1994, flooding of the San Jacinto River led to the rupture of 8 and the undermining of 29 pipelines by the floodwaters. Consequently, 5.5 million liters of petroleum and related products were release into the river and subsequently ignited. Overall, 547 people were injured due to inhalation and burns (National Transportation Safety Board, 1996). In the same year in France, a natural gas pipeline was struck by lightning, causing holes in the pipeline wall and releases which ignited. While the accident did not cause any fatalities or injuries it is interesting in that it was found that lightning strikes on underground pipelines may be more frequent than previously thought.”
“In 2013, a pipeline accident occurred in Ecuador where a landslide ruptured the Trans-Ecuador pipeline, spilling 1.6 million liters of crude oil into a tributary of the Amazon River. As a result, the drinking water supply of 60,000 people was contaminated and the river transported the pollution across the border into Peru.”
USAID/UGANDA: ENVIRONMENTAL MANAGEMENT FOR THE OIL SECTOR – TRAINING COMPENDIUM: MODULE 4 160

“To identify the natural hazards that have triggered natechs, natural hazards are divided into 4 main categories based on their natural processes. The main categories are geological, hydrological, meteorological, and climatic hazards. Additional other and unknown categories are defined in case the natural hazard does not fall within a main category or its type cannot be determined from the existing information.”
TABLE 3.1: CATEGORIES AND SUBCATEGORIES OF NATURAL HAZARDS
Category Subcategories
Geological Earthquake, tsunami, landslide, submarine landslide, mudslide, debris flow, rockslide, rock fall, subsidence, frost heave, avalanche, soil erosion/scouring, submarine erosion/scouring, volcanic eruption, other geological, unknown geological
Hydrological Flooding, flash flooding, storm surge, stream erosion/scouring, other hydrological, unknown hydrological
Meteorological High wind, heavy rainfall, hail, storm, winter storm, ice storm, tornado, extratropical cyclone, tropical cyclone, lightning, other meteorological unknown meteorological
Climatic Hot weather, cold weather, frost, drought, wildfire, other climatic, unknown climatic
None Other natural, unknown natural Source: Girgin and Krausman, 2014
“The results of the analysis of the identified data indicate that natural hazards are a non-negligible threat to pipelines transporting hazardous materials. The analysis of the U.S. data set shows that geological hazards triggered 37 percent of the onshore pipeline natechs analyzed. This is followed by meteorological (29 percent), hydrological (14 percent), and climatic (14 percent) hazards. Landslides are the main geological hazard with 46 percent of the geological incidents, whereas earthquakes represent only 9 percent within the category. Among meteorological hazards, lightning is the major hazard with 36 percent of the incidents. 86 percent of the hydrological hazard related natechs are found to be due to floods. Overall, cold weather related hazards (frost, low temperatures) make up 94 percent of the pipeline natechs caused by adverse climatic conditions. The current level of uncertainty in the analyzed data is estimated as 24 percent.”
“In terms of consequences, 55 percent of the U.S. pipeline natechs involved natural gas, while 45 percent concerned pipelines transporting other types of substances (mostly crude oil and other hydrocarbons). For natural gas incidents ignition occurred in about 25 percent of the analyzed cases, compared to about 8 percent for other substances. The likelihood of explosions was much lower, 3 percent for natural gas, and 2 percent for other substances. While this incident was due to multiple pipeline breaks caused by wide-scale flooding, it clearly demonstrates the potential for a major impact on the population of Natech events. More than two-thirds of the releases from ruptured pipelines entered inland water bodies, followed by on-land releases (25 percent). The combined property damage due to onshore pipeline Natech events amounts to 650 million USD (in 2012 USD).”
Acts of Mischief and Sabotage
“Every major hazard installation can be a target for mischief or sabotage. Protection from such actions, including site security, is also routinely taken into consideration in the design of oil and gas industry installations” (ILO, 1991).
War, Conflict, and Sabotage
Source: Epstein and Selber, 2002
In the context of war, oil fields and oil transportation systems are at high risk of sabotage, and large oil fires, induced oil spills, and oil well blowouts occur. The Persian Gulf War is a prime example of deliberate sabotage of oil operations. Approximately 22,000 tons of sulfur dioxide, 18,000 tons of
USAID/UGANDA: ENVIRONMENTAL MANAGEMENT FOR THE OIL SECTOR – TRAINING COMPENDIUM: MODULE 4 161

soot, and thousands of tons of carbon monoxide and oxides of nitrogen were emitted daily by the burning wells in Kuwait (Husain, 1995). In addition, tons of toxic metals and carcinogenic compounds were released into the atmosphere (Kelsey et al., 1994).
THE 1991 GULF WAR According to the Petroleum Economist (1992), just before the conclusion of the Gulf War, the Iraqi military successfully detonated 730 wells with explosive material, causing fiery blowouts. Six hundred and fifty-six of the exploded wells burned for several months and the remaining 74 gushed oil, forming lakes that covered an area of 16 square miles (Husain, 1995), creating an "environmental catastrophe … unparalleled in the history of mankind" (Husain, 1995). Estimates are that approximately 1.5 billion barrels (63 billion gallons) of crude oil (1.5-2 percent of the oil reserve in Kuwait) were lost to fires during this period. This corresponds to millions of tons of pollutants emitted into the atmosphere, and 1.05-1.7 billion gallons of oil deposited on the surface of Kuwait. In addition to the loss of resources, estimated to be over $U.S. 30 billion, the population in the region was exposed to contaminated air for several months (Husain, 1995). The blowouts deposited a coating of oil mist on the leaves of plants, depriving them of sunlight, and the fallout from the plumes on the Arabian Gulf seriously threatened the marine ecosystem. Furthermore, sabotage by the Iraqis spilled an estimated 460 million gallons of crude oil into the Arabian Gulf in the third week of January 1991, causing what is considered to be the largest oil spill in history.
The environmental consequences of the Kuwaiti oil fires were unprecedented, resulting in massive death to fish, bird, and marine organisms. There were profound changes to air and water quality, and the sheer quantity of carbon emissions contributed to global climate change. Unfortunately, the human health impacts of this event have not been rigorously assessed, but there is anecdotal evidence that children experienced respiratory and dermatological diseases and growth retardation; as well as an undefined wasting syndrome not previously experienced in the relatively affluent population. It is possible that these clinical manifestations resulted from the oil fires and spills (Doucet, 1994). Exposure to large volumes of burning oil is also associated with aplastic anemia (Stern et al., 1994).
Resulting Environmental Degradation and Related Impacts
Overview
Source: Corbett Dabbs, 1996
“Most countries depend on oil. States will go to great lengths to acquire an oil production capability or to be assured access to the free flow of oil. History has provided several examples in which states were willing to go to war to obtain oil resources or in defense of an oil-producing region. States have even become involved in conflicts over areas, which may only possibly contain oil resources. This trend is likely to continue in the future until a more economical resource is discovered or until the world's oil wells run dry. One problem associated with this dependence on oil is the extremely damaging effects that production, distribution, and use have on the environment. Furthermore, accidents and conflict can disrupt production or the actual oil resource, which can also result in environmental devastation. One potential solution to this problem is to devise a more environmentally safe resource to fuel the economies of the world.”
“Although much of the world depends on the production or the trade of oil to fuel its economies, these activities can cause severe damage to the environment, either knowingly or unintentionally. Oil production, and/or transportation, can disrupt the human population and the animal and fish life of the region. Oil waste dumping, production pollution, and spills wreak havoc on the surrounding wildlife and habitat. It threatens the extinction of several plants, and has already harmed many land, air, and sea animal and plant species.”
USAID/UGANDA: ENVIRONMENTAL MANAGEMENT FOR THE OIL SECTOR – TRAINING COMPENDIUM: MODULE 4 162

“The effects of oil on marine life are caused by either the physical nature of the oil (physical contamination and smothering) or by its chemical components (toxic effects and accumulation leading to tainting). Marine life may also be affected by cleanup operations or indirectly through physical damage to the habitats in which plants and animals live. The animals and plants most at risk are those that could come into contact with a contaminated sea surface: marine animals and reptiles; birds that feed by diving or form flocks on the sea; marine life on shorelines; and animals and plants in mariculture facilities.”
“Runoffs from petroleum processing and petrochemical plants have dumped tons of toxic wastes into nearby waters. Gas and oil pipelines have stanched many creeks and rivers, swamping prime pastures and cropland. Furthermore, entire bays and lagoons along coasts have been fouled by oil spills and runoff of toxic chemicals.”
“The environmental damage that is a result of oil retraction and production can also directly affect human life in the region. Damage can include pollution of water resources and contamination of the soil. Humans are effected by environmental devastation because it is damaging to vegetation, livestock, and to the health of the human body itself. Oil spills can interfere with the normal working of power stations and desalination plants that require a continuous supply of clean seawater and with the safe operation of coastal industries and ports.”
“Environmental damage can also be a result of conflict over oil-producing regions. Environmental harm associated with oil resources can either be attributed to a side effect of conflict, or, in some cases, it is associated with military aggression that is intended to damage the natural resources of the region.”
Impacts of Groundwater Contamination
Source: U.S. EPA, 2015
The impacts of oil and gas industry pollution in a given region are a function of multiple factors, including the amount and type of fossil fuel produced, the extraction methods used, physical and geological conditions, and regulatory requirements (Mielke et al. 2010). In some cases, social conditions such as political stability also influence the links between water and energy. In Nigeria, for example, political corruption and social tensions have contributed to a high incidence of oil spills because oil companies are often not held accountable for polluting, and because of vandalism of oil pipelines.
“Contamination of groundwater can result in poor drinking water quality, loss of water supply, degraded surface water systems, high cleanup costs, high costs for alternative water supplies, and/or potential health problems. The consequences of contaminated groundwater or degraded surface water are often serious. For example, estuaries that have been impacted by high nitrogen from groundwater sources have lost critical shellfish habitats. In terms of water supply, in some instances, groundwater contamination is so severe that the water supply must be abandoned as a source of drinking water.”
“In other cases, the groundwater can be cleaned up and used again, if the contamination is not too severe and if the jurisdiction is willing to spend a good deal of money. Follow-up water quality monitoring is often required for many years. Because groundwater generally moves slowly, contamination often remains undetected for long periods of time. This makes cleanup of a contaminated water supply difficult, if not impossible. If a cleanup is undertaken, it can cost thousands to millions of dollars. Once the contaminant source has been controlled or removed, the contaminated groundwater can be treated in one of several ways:
• Containing the contaminant to prevent migration • Pumping the water, treating it, and returning it to the aquifer • Leaving the groundwater in place and treating either the water or the contaminant
USAID/UGANDA: ENVIRONMENTAL MANAGEMENT FOR THE OIL SECTOR – TRAINING COMPENDIUM: MODULE 4 163

• Allowing the contaminant to attenuate (reduce) naturally (with monitoring), following the implementation of an appropriate source control
Selection of the appropriate remedial technology is based on site-specific factors and often takes into account cleanup goals based on potential risk that are protective of human health and the environment.”
Ecological Impacts
“Although physical alteration from oil exploration is difficult to quantify, fishermen, and environmentalists alike consider it to have a greater environmental impact than do large oil spills. The effect of drilling structures, discharge cuttings, artificial islands and pipelines all impact coastal habitats. Canalization of land surfaces for pipeline routing and navigation in coastal wetlands are extremely disruptive to ecosystems, often allowing saltwater intrusion into brackish ecosystems” (Epstein and Selber, 2002).
“Media images of dead and dying oil-covered marine wildlife have sparked considerable public concern over the effect of offshore oil development. Massive kill events do occur, but the long-term impacts of leaks and chronic discharges may be of greater significance for animal populations (especially endangered) and migratory sites for birds and marine mammals. Over the past 15 years, studies indicate oil fouling as a cause of mortality in seals, sea otters, several species of whales, and sea turtles (Boesch and Rabalais, 1987). Bioaccumulation of oil and other products in mammals and fish that are consumed by humans is a further concern. Livelihoods can be at risk; the reduction of fishery stocks due to mortality of eggs and larvae as a result of oil leaks and spills creates economic burdens on fishing communities” (Epstein and Selber, 2002).
Plant and animal communities may also be directly affected by changes in their environment through variations in water, air, and soil/sediment quality. Some changes may directly affect the ecology for example, habitat, food and nutrient supplies, breeding areas, migration routes, vulnerability to predators or changes in herbivore grazing patterns, which may then have secondary effects on predators. Soil disturbance and removal of vegetation and secondary effects such as erosion and siltation may have an impact on ecological integrity, and may lead to indirect effects by upsetting nutrient balances and microbial activity in the soil. If not properly controlled, a potential long-term effect is loss of habitat, which affects both fauna and flora, and may induce changes in species composition and primary production cycles (E&P/UNEP, 1997).
“In Nigeria, the Niger Delta is host to three of the country’s four refineries, which generate large quantities of effluents daily. These effluents are discharged into natural water bodies after treatment. Phenol is one of the major pollutants found in refinery effluents. Phenols have been observed to be very toxic to fish and other aquatic organisms and has a nearly unique property of tainting the taste of fish if present in marine environment in concentration ranges of 0.1 to 1.0 mg/l [5, 6, 20]. The toxic concentration for fishes may range from <0.1 to >100 mg/l, depending on the chemical nature of the phenol, the fish species and the developmental stage, with embryo-larval stages being many times more susceptible than adults. Verbal evidence from local fishermen suggests that the area around the point of discharge of the effluents is devoid of fishes and hence no fishing activity is carried out there anymore. Unpublished data also show a dramatic reduction in the number of viable microorganisms found in both water and sediment at the point of impact. The high oil and grease concentration observed in the effluent receiving water body in the Niger Delta, in combination with other pollutants, is also thought to be responsible for the depletion of the fish and other aquatic life at the point of impact of the effluent” (Otokunefor and Obikwu, 2005).
Atmospheric Impacts
Source: E&P/UNEP, 1997
“The potential for emissions from exploration activities to cause atmospheric impacts is generally considered to be low. However, during production, with more intensive activity, increased levels of emissions occur in the immediate vicinity of the operations. Emissions from production operations
USAID/UGANDA: ENVIRONMENTAL MANAGEMENT FOR THE OIL SECTOR – TRAINING COMPENDIUM: MODULE 4 164

should be viewed in the context of total emissions from all sources, and for the most part these fall below 1 percent of regional and global levels.”
“Flaring of produced gas is the most significant source of air emissions, particularly where there is no infrastructure or market available for the gas. However, wherever viable, gas is produced and processes as an important commodity. Thus through integrated development and providing markets for all products, the need for flaring will be greatly reduced.”
“Flaring, venting and combustion are the primary sources of carbon dioxide emissions from production operations, but other gases should also be considered. For example, methane emissions primarily arise from process vents and to a lesser extent from leaks, flaring, and combustion.”
Acid Rain
Source: Epstein and Selber, 2002
“Gaseous emissions from oil and gas activities accumulate in the atmosphere and return in the form of acid rain, which causes an array of problems now known to be much more complex and diverse than previously believed. The impacts of acid rain are no longer considered as isolated effects, but are recognized to impact entire ecosystems.”
“Sulfur dioxide (SO2) and nitrogen oxides (NOx) released from the combustion of fossil fuels have been found to be the leading contributors to acid rain production. As both SO2 and NOxs enter the atmosphere, they become oxidized into sulfuric acid and nitric acid respectively. The reactions are enhanced in areas of increased pollution as ammonia and ground-level ozone act as catalysts. These acids dissolve readily into water and help form acidic water droplets, returning to the Earth in the form of acidic rain, snow, or fog. Natural rainwater has an inherent acidic pH of 5.6. However, acid rain commonly reaches pH levels as low as 4, about 40 times the acidity of natural rainwater.”
“Once acid rain returns to the surface, it begins a cascade of harmful environmental effects. The consequences of acidic precipitation are complicated by the relationships within ecosystems. From terrestrial to aquatic environments, the individual effects are each detrimental.”
Terrestrial Effects
Upon reaching the ground, acid rain begins to take immediate effect in soils. Natural rainwater’s slight acidity is normally countered by soil buffering capacity. This buffering capacity plays an integral part in the ecosystem, allowing for tolerance within a range of fluctuating conditions. Acid rain overwhelms soil’s buffering capacity, disrupting carefully established pH balances. One consequence has been the leaching of base cations from soil leading to mineral and nutrient deficiencies in the soil. Beyond changes in soil chemistry, acid rain negatively impacts the growth of trees.
Aquatic Effects
Once acid precipitation saturates the soil's buffering capacity, runoff and drainage play a large role in the spread of acidification. Aquatic systems such as lakes, streams, and groundwater are all susceptible.
Soil runoff not only lowers the pH levels of aquatic bodies, but also exposes them to increased levels of aluminum.
Acidification of bodies of water affects the vast the array of aquatic organisms that live in aquatic systems. Changes in pH, nitrate concentration, and aluminum concentration shifts the natural balances established within an ecological system. While some organisms are able to flourish under such conditions, others are harmed. The susceptibility of fish in these changing environments has been clearly documented. Studies show both low pH and aluminum are toxic to fish (Baker and Schofield, 1982). Acid-sensitive species are at greatest risk and are the first to be eliminated in aquatic environments. Studies have shown significantly fewer species of fish in lakes with decreased pH (Schindler et al., 1985). Episodic acidification has been particularly associated with larger amounts
USAID/UGANDA: ENVIRONMENTAL MANAGEMENT FOR THE OIL SECTOR – TRAINING COMPENDIUM: MODULE 4 165

of fish loss in streams and rivers. Episodic acidification also impacts fish mortality, migration, and reproductive failure, further reducing fish populations (Baker et al., 1996).
Although many species suffer the effects of acid rain, some “weedy species” thrive in it. Changes in environmental chemistry and biodiversity have given some organisms a window of opportunity to flourish. Harmful algal blooms have disrupted marine environments such as the Chesapeake Bay, Indian Ocean, and Bay of Bengal. The explosion of algae, the algal "bloom," can have a variety of environmental effects. Overgrowth clouds the water decreasing sunlight penetration, harming aquatic vegetation and animals that need sunlight to survive. Once algae die, they settle to the bottom where they decay, a process that consumes vital oxygen. This causes so-called “dead zones.” Eutrophication contributes to harmful algal blooms that lead to shellfish poisoning and algae and zooplankton can harbor pathogens (Epstein et al., 1993) Eutrophication can also lead to coral reef degradation and collapse of food webs.
Environmental Impacts of Oil Spills
Source: Epstein and Selber, 2002
Physical Characteristics of Oil in the Environment
“Oil is less dense than water, causing it to float on the surface of water after a spill. Typically, one ton of oil covers approximately 12 km2 of water. Beyond that, a slick begins to fragment. The size of a spill, the type of oil spilled and the timing of the spill all affect how much ecological damage the spill will incur. The impacts also depend upon the type of ecosystem in which the spill takes place and its vulnerability or resilience to the insult.”
“A large spill can do extensive damage to large areas of ocean (or land), smothering the small microorganisms that comprise the bottom of the food chain. In smaller spills, neighboring organisms often recolonize relatively quickly. However, after a very large spill, recolonization and replenishment of microorganisms from surrounding areas can be greatly delayed. It is important to note that because of the effects of oil spills on vegetation, water, and fish, the impacts of even small spills can send ripples into surrounding ecosystems and affect communities beyond the immediate spill area.”
“The type of oil that comprises a spill also determines the effect it will have upon a given ecosystem. All oil contains both heavy and light chain hydrocarbons. Oil with a high proportion of light chain hydrocarbons will have less of an impact upon an ecosystem, because the molecules are volatile and evaporate more easily than those with heavy chains. Oil composed of more heavy chain hydrocarbons spreads and will cling to plants, rocks, sand, and boulders.”
“After oil enters the environment it undergoes a process called "weathering" or degradation. Weathering consists of the following stages:”
“Spreading: Spilled oil immediately begins to spread over the sea surface initially as a single slick covering extensive areas. The slick later begins to break up forming narrow bands parallel to the direction of the wind. The rate of oil spread depends on the viscosity of the oil and the prevailing conditions, including sea surface temperature, water currents, tidal streams, and wind speeds.”
“Evaporation: Lighter components of the oil evaporate into the atmosphere, with the amount and speed of evaporation depending upon the oil’s volatility. The most toxic components, toluene and benzene, are also the most soluble and flammable, and these evaporate in the first 24-48 hours.”
“Natural dispersion: Waves and turbulence at the sea surface causes all or part of a slick to break up into fragments and droplets of varying sizes. The speed of dispersion depends on the nature of the oil and varies with the weight and volatility of the oil and local conditions. The addition of chemical dispersants accelerates the process of natural dispersion.”
“Emulsification: Emulsification refers to the process in which seawater droplets become suspended in the oil. The emulsion formed can be very viscous and is more persistent than the
USAID/UGANDA: ENVIRONMENTAL MANAGEMENT FOR THE OIL SECTOR – TRAINING COMPENDIUM: MODULE 4 166

original oil spilled. It is referred to as "chocolate mousse" because of its appearance. The emulsion expands the volume of the pollutants three to four fold. If the concentration of asphaltene in the oil is greater than 0.5 percent, the emulsion will be very stable and can persist for months.”
“Dissolution: Water-soluble compounds in oil may dissolve into the surrounding water, especially if the oil is finely dispersed in the water. When light aromatic hydrocarbon compounds like benzene and toluene are the primary components, these are lost through evaporation and dissolution is limited.”
“Oxidation: Oils react slowly with atmospheric oxygen, creating soluble degradation products or forming compounds called tars (with an outer protective coating of heavy compounds that increase the oil’s persistence). This process is promoted by sunlight.”
“Sedimentation/Sinking: Heavy, refined products with densities greater than 1, will sink in fresh or brackish water. Sinking usually occurs due to the addition of sediment particles or organic matter.”
“Biodegradation: Biodegradation is process by which microorganisms in seawater partially or completely degrade oil into water-soluble compounds and eventually to carbon dioxide and water. Microbes that biodegrade oils are specific to the compounds and some compounds—like degraded tars and asphaltene—are highly resistant to attack. The process takes place at the oil-water interface. The creation of oil droplets by natural or chemical dispersion increases the surface area of the oil, and therefore the area accessible to biodegradation. The efficiency of the process depends on the levels of nutrients (nitrogen and phosphorus) in the water, sea surface temperature and the level of oxygen present.”
Effects on Ecosystem
Source: Epstein and Selber, 2002
“Acutely, the main victims of oil spills are the animals and plants that inhabit coastal and oceanic environments. The acute toxicity of oil is such that many animals die as a result of oil ingestion. The viscosity of oil also poses a threat to mammals and avians; oil coats the fur of sea otters and the feathers of birds, preventing these outer layers from insulating against hypothermia. The hydrocarbons that comprise oil are also carcinogenic to fish, birds and mammals, and there is evidence that oil is immunotoxic to sea birds (Briggs et al., 1996). Seals and sea lions suffer cancerous lesions from ingestion of oil, and may drown because of the extra weight of oil on their coats. Evidence also suggests that oil spills and exposure to chronic low levels of oil in the sea decrease the reproductive rate of seals (Jenssen, 1996).”
“Oil spills can cause widespread mortality in fish populations, with cascading impacts for other species—especially birds, marine mammals and human populations that depend highly upon fish for subsistence.”
“The coastal subtidal zone (underwater at all times) and intertidal zone (covered only during high tide) are inhabited by multiple small invertebrates. The fiddler crab, a species that inhabits the intertidal zone, is regarded as the "canary in a coal mine" for oil spills. This invertebrate is present in the estuarine habitats around the world and is therefore a universal indicator for the impact of oil spills on coastal ecosystems. As with other organisms, fiddler crabs exhibit dose-response mortality due to oil toxicity. Thus, the status of the fiddler crab population in an area after an oil spill is a sensitive marker for the severity of the spill.”
“Oil spills can affect plant life in subtle but sometimes profound ways. Each coastal ecosystem has different susceptibilities to contamination. In temperate regions, salt marshes are most vulnerable. Salt marsh plants are relatively short, measuring up to three feet in height. Because they are low, salt marshes can be completely covered by the oil after a spill.”
“In tropical regions mangrove swamps are susceptible to damage from oil spills as their roots are aboveground. An unimpeded interface between roots and air is required in order for the plant to
USAID/UGANDA: ENVIRONMENTAL MANAGEMENT FOR THE OIL SECTOR – TRAINING COMPENDIUM: MODULE 4 167

"breathe" and exchange salt. Thus, oil spills have killed extensive swaths of mangroves. Mangrove swamps are an ecological lynchpin. They protect the shoreline integrity and are the nurseries for many shellfish and finfish, providing nutrition and protection from predation. The death of a large portion of a mangrove system can threaten the organisms dependent upon them for survival.”
“Humans can be affected by oil spills from damage to surrounding plants and animals, and perhaps by direct contamination. Most information on direct effects is anecdotal (Campbell et al., 1993). One Scottish study found an increase in the reporting of nausea, headache, throat irritation, and itchy eyes in local populations following spills. However, long-term effects are unknown. Rigorous clinical studies are needed to assess the direct effects of oil spills on human beings.”
“Oil spills that occur on land, primarily from pipeline leaks and accidents, can contaminate surrounding soils and groundwater. A large oil spill can make contaminated land uncultivable -- placing subsistence farmers at risk for food insecurity—and eliminate the safe drinking water supply for a community.”
Effect on Wildlife
Source: IPIECA, 2004
“Despite the steady reduction in the frequency and volume of oil spills over the past decade, an oiling incident may occur, without warning, anywhere in the world. The problem caused can be acute (e.g., from a damaged oil tanker), or chronic, resulting from an ongoing release and accumulation of oil. Regardless of the source or size of the incident, there is every likelihood that, as a result of a significant release of oil, there will be wildlife casualties. In some instances there may be a warning about the impending threat; in others none at all, the first evidence that something is wrong being the appearance of oiled wildlife casualties on the beaches. Whether the numbers of oiled casualties are few or counted in tens of thousands, the problem needs to be dealt with, both from a humanitarian and a conservation perspective.”
“Accidental oil spills, including oil tanker spills, non-tanker ship spills, pipelines, oil production platforms and tank farms, may cause serious problems for coastal and marine wildlife, especially birds, mammals, and reptiles. On a worldwide scale, oiled wildlife incidents occur less frequently than oil spill incidents, simply because not every oil spill causes a wildlife problem. However, if a wildlife problem does occur as a consequence of the oil spill incident, the success of oiled wildlife rehabilitation and an adequate assessment of environmental impacts will depend on a comprehensive wildlife response plan.”
“When oil spills occur, there is likely to be an immediate impact on the environment and the wildlife present. Birds may be perceived by the media as the highest priority for response attention, but other groups of animals, including invertebrates, fish, reptiles and mammals, can also be affected. Currently, active rescue and rehabilitation efforts are only considered for birds, mammals, and reptiles.”
“Specific effects of oil on wildlife vary depending on species vulnerability, the chemistry of the specific petroleum product or mixture, weather, time of contact, weathering of oil and many other factors. In general, however, effects can be divided into those that are due to the toxicity of the various components of the oil in question and those due to the physical effects resulting from contact with the product.”
“Across species, direct contact with oil may cause burns, and irritation of skin, eyes, and mucous membranes. Ingestion may cause disruption of the gastrointestinal and immune response systems along with damage to organs such as the liver and kidneys. Inhalation may lead to respiratory and neurological damage/disorders. Secondary effects related to captivity should not be overlooked and may include pressure sores, damage to feathers or skin, lack of appetite, and spread of infectious diseases. Every effort should be made to avoid these secondary effects and minimize the time animals spend in captivity.”
USAID/UGANDA: ENVIRONMENTAL MANAGEMENT FOR THE OIL SECTOR – TRAINING COMPENDIUM: MODULE 4 168

Selected Examples of Major Environmental Disasters from Oil and Gas Development
The examples outlined below are a small sample of recent environmental disasters and degradation that are directly attributable to oil and gas development activities or events. They are presented here specifically to provide an appreciation of:
• Scope and magnitude of disaster/emergency • Causes and contributing factors • Scope and magnitude of impacts (human health, environment and biodiversity) • Remediation efforts and impacts • Lessons learned/not learned
Deepwater Horizon Oil Spill
Overview
“The Deepwater Horizon oil spill (also referred to as the BP oil spill, the BP oil disaster, the Gulf of Mexico oil spill, and the Macondo blowout) began on 20 April 2010 in the Gulf of Mexico on the BP-owned Transocean-operated Macondo Prospect. Following the explosion and sinking of the Deepwater Horizon oil rig, a sea floor oil gusher flowed for 87 days, until it was capped on 15 July 2010” (Robertson and Krauss, 2010; The Daily Telegraph, 2010; Jervis and Levin, 2010).
FIGURE 3.1: DEEPWATER HORIZON EXPLOSION
Source: U.S. Coast Guard, 2010
The Deepwater Horizon was a 9-year-old semi-submersible, mobile, floating, dynamically positioned drilling rig that could operate in waters up to 10,000 feet (3,000 m) deep. The rig, which was chartered to BP from March 2008 to September 2013, was drilling a deep exploratory well, 18,360 feet (5,600 m) below sea level, in approximately 5,100 feet (1,600 m) of water (Transocean, no date; PR Newswire, 2001).
The well is situated in the Macondo Prospect in Mississippi Canyon Block 252 (MC252) of the Gulf of Mexico, in the United States' exclusive economic zone. The Macondo well is located roughly 41 miles (66 km) off the Louisiana Coast. BP was the operator and principal developer of the Macondo Prospect with a 65 percent share, while 25 percent was owned by Anadarko Petroleum Corporation, and 10 percent by MOEX Offshore 2007, a unit of Mitsui.
Explosion
“At approximately 9:45 pm, on 20 April 2010, high-pressure methane gas from the well expanded into the drilling riser and rose into the drilling rig, where it ignited and exploded, engulfing the
USAID/UGANDA: ENVIRONMENTAL MANAGEMENT FOR THE OIL SECTOR – TRAINING COMPENDIUM: MODULE 4 169

platform. At the time, 126 crew members were on board: seven BP employees, 79 of Transocean, and employees of various other companies. Eleven workers were never found despite a three-day Coast Guard (USCG) search operation and are believed to have died in the explosion. Ninety-four crew were rescued by lifeboat or helicopter, 17 of whom were treated for injuries. The Deepwater Horizon sank on the morning of 22 April 2010” (Brenner et al., 2010; Pendlebury, 2010).
Volume and Extent of Oil Spill
An oil leak was discovered on the afternoon of 22 April when a large oil slick began to spread at the former rig site. The oil flowed for 87 days. BP originally estimated a flow rate of 1,000 to 5,000 barrels per day (160 to 790 m3/d). The Flow Rate Technical Group estimated the flow rate was 62,000 barrels per day (9,900 m3/d). The total estimated volume of leaked oil approximated 4.9 million barrels (210,000,000 US gal; 780,000 m3) with plus or minus 10 percent uncertainty, including oil that was collected, making it the world’s largest accidental spill. (Krauss, Broder, Calmes, 2010; Henry, 2010; Hoch, 2010)
“According to the satellite images, the spill directly impacted 68,000 square miles (180,000 km2) of ocean. By early June 2010, oil had washed up on 125 miles (201 km) of Louisiana's coast and along the Mississippi, Florida, and Alabama coastlines. Oil sludge appeared in the Intracoastal Waterway and on Pensacola Beach and the Gulf Islands National Seashore. In late June, oil reached Gulf Park Estates, its first appearance in Mississippi. In July, tar balls reached Grand Isle and the shores of Lake Pontchartrain. In September a new wave of oil suddenly coated 16 miles (26 km) of Louisiana coastline and marshes west of the Mississippi River in Plaquemines Parish. In October, weathered oil reached Texas. As of July 2011, about 491 miles (790 km) of coastline in Louisiana, Mississippi, Alabama and Florida were contaminated by oil and a total of 1,074 miles (1,728 km) had been oiled since the spill began. As of December 2012, 339 miles (546 km) of coastline remain subject to evaluation and/or cleanup operations.” (Norse and Amos, 2010)
Concerns were raised about the appearance of underwater, horizontally extended plumes of dissolved oil. Researchers concluded that deep plumes of dissolved oil and gas would likely remain confined to the northern Gulf of Mexico and that the peak impact on dissolved oxygen would be delayed and long-lasting. Two weeks after the wellhead was capped on 15 July 2010, the surface oil appeared to have dissipated, while an unknown amount of subsurface oil remained. Estimates of the residual ranged from a 2010 NOAA report that claimed about half of the oil remained below the surface to independent estimates of up to 75 percent. That means that over 100 million US gallons (2.4 Mbbl) remained in the Gulf (Adcroft et al., 2010; Gills and Campbell, 2010; Oneindia News, 2010; Zaberenko, 2010)
As of January 2011, tar balls, oil sheen trails, fouled wetlands marsh grass and coastal sands were still evident. Subsurface oil remained offshore and in fine silts. In April 2012, oil was still found along as much as 200 miles (320 km) of Louisiana coastline and tar balls continued to wash up on the barrier islands. In 2013, some scientists at the Gulf of Mexico Oil Spill and Ecosystem Science Conference said that as much as one-third of the oil may have mixed with deep ocean sediments, where it risks damage to ecosystems and commercial fisheries (CNN, 2011; Schleifstein, 2012).
In 2013, more than 4.6 million pounds of "oiled material" were removed from the Louisiana Coast. Although only "minute" quantities of oil continued to wash up in 2013, patches of tar balls were still being reported almost every day from Alabama and Florida Panhandle beaches. Regular cleanup patrols were no longer considered justified but cleanup was being conducted on an as-needed basis, in response to public reports. It was first thought that oil had not reached as far as Tampa Bay; however, a study done in 2013 found that that one of the plumes of dispersant-treated oil had reached a shelf 80 miles off the Tampa Bay region. According to researchers, there is some evidence it may have caused lesions in fish caught in that area (Huffington Post, 2013; McCormick, June 2013).
USAID/UGANDA: ENVIRONMENTAL MANAGEMENT FOR THE OIL SECTOR – TRAINING COMPENDIUM: MODULE 4 170

FIGURE 3.2: OIL SPREADING FROM DEEPWATER HORIZON SPILL
Source: Watkins, 2010
Deepwater Horizon Oil Spill Response: Containment, Collection, and Use of Dispersants
The fundamental strategies for addressing the spill were containment, dispersal, and removal. In summer 2010, approximately 47,000 people and 7,000 vessels were involved in the project. By 3 October 2012, federal response costs amounted to $850 million, mostly reimbursed by BP. As of January 2013, 935 personnel were still involved. By that time, cleanup had cost BP over $14 billion (Ramseur and Hagerty, 2013).
It was estimated with plus or minus 10 percent uncertainty that 4.9 million barrels (780,000 m3) of oil was released from the well; 4.1 million barrels (650×103 m3) of oil went into the Gulf. The report led by the Department of the Interior and the NOAA said that "75 percent [of oil] has been cleaned up by Man or Mother Nature", however, only 25 percent of released oil was collected or removed while 75 percent of oil remained in the environment in one form or another (Kerr, 2010).
Containment
FIGURE 3.3: OIL CONTAINMENT BOOM USED IN AN ATTEMPT TO PROTECT BARRIER ISLANDS
Source: Kris Krug, 2010
Containment booms stretching over 4,200,000 feet (1,300 km) were deployed, either to corral the oil or as barriers to protect marshes, mangroves, shrimp/crab/oyster ranches or other ecologically
USAID/UGANDA: ENVIRONMENTAL MANAGEMENT FOR THE OIL SECTOR – TRAINING COMPENDIUM: MODULE 4 171

sensitive areas. Booms extend 18–48 inches (0.46–1.22 m) above and below the water surface and were effective only in relatively calm and slow-moving waters. Including one-time use sorbent booms, a total of 13,300,000 feet (4,100 km) of booms were deployed (Butler, 2011). Booms were criticized for washing up on the shore with the oil, allowing oil to escape above or below the boom, and for ineffectiveness in more than three to four-foot waves.
Use of Corexit Dispersant
The spill was also notable for the volume of Corexit oil dispersant used and for application methods that were "purely experimental.” Although usage of dispersants was described as "the most effective and fast moving tool for minimizing shoreline impact, the approach continues to be investigated (Butler, 2011; Khan, 2010; Newsweek, April 2013).
Underwater injection of Corexit into the leak may have created the oil plumes, which were discovered below the surface. In late 2012, a study from Georgia Tech and Universidad Autonoma de Aguascalientes in Environmental Pollution journal reported that Corexit used during the BP oil spill had increased the toxicity of the oil by 52 times. The scientists concluded that "Mixing oil with dispersant increased toxicity to ecosystems" and made the gulf oil spill worse (Butler, 2011).
Removal
Three approaches were used to remove oil from the water: combustion, offshore filtration, and collection for later processing. USCG said 33 million US gallons (120,000 m3) of tainted water was recovered, including 5 million US gallons (19,000 m3) of oil. BP said 826,800 barrels (131,450 m3) had been recovered or flared (Schoof, 2010). It is calculated that about 5 percent of leaked oil was burned at the surface and 3 percent was skimmed (Kerr, 2010).
From April to mid-July 2010 411 controlled in-situ fires remediated approximately 265,000 barrels (11,100,000 US gallons; 42,100 m3). The fires released small amounts of toxins, including cancer-causing dioxins (Butler, 2011).
Oil was collected from water by using skimmers. In total 2,063 various skimmers were used. For offshore, over 60 open-water skimmers were deployed, including 12 purpose-built vehicles (Butler, 2011).
Two main types of affected coast were sandy beaches and marshes. On beaches, the main techniques were sifting sand, removing tar balls, and digging out tar mats manually or by using mechanical devices. For marshes, techniques such as vacuum and pumping, low-pressure flush, vegetation cutting, and bioremediation were used (Butler, 2011).
Oil-Eating Microbes
Dispersants are said to facilitate the digestion of the oil by microbes. Mixing dispersants with oil at the wellhead would keep oil below the surface and in theory, allow microbes to digest the oil before it reached the surface. Various risks were identified and evaluated, in particular that an increase in microbial activity might reduce subsea oxygen levels, threatening fish and other animals (Kintisch, 2010).
Environmental Impact
The spill area hosts 8,332 species, including over 1,270 fish, 604 polychaetes, 218 birds, 1,456 mollusks, 1,503 crustaceans, 4 sea turtles, and 29 marine mammals (Biello, 2010; Shirley et al., 2010). Between May and June 2010, the spill waters contained 40 times more PAHs than before the spill. PAHs are often linked to oil spills and include carcinogens and chemicals that pose various health risks to humans and marine life. The PAHs were most concentrated near the Louisiana Coast, but levels also jumped 2–3 fold in areas off Alabama, Mississippi, and Florida. PAHs can harm marine species directly and microbes used to consume the oil can reduce marine oxygen levels. The oil contained approximately 40 percent methane by weight, compared to about 5 percent found in
USAID/UGANDA: ENVIRONMENTAL MANAGEMENT FOR THE OIL SECTOR – TRAINING COMPENDIUM: MODULE 4 172

typical oil deposits. Methane might suffocate marine life and create "dead zones" where oxygen is depleted (Schneyer, 2010).
A 2014 study of the effects of the oil spill on bluefin tuna funded by NOAA, Stanford University, and the Monterey Bay Aquarium and published in the journal Science (Hazen et al., 2016;), found that the toxins from oil spills can cause irregular heartbeats leading to cardiac arrest. Calling the vicinity of the spill "one of the most productive ocean ecosystems in the world", the study found that even at low concentrations "PAH cardiotoxicity was potentially a common form of injury among a broad range of species in the vicinity of the oil.”
Fish with oozing sores and lesions were first noted by fishermen in November 2010. Prior to the spill, approximately 0.1 percent of Gulf fish had lesions or sores. A report from the University of Florida (Campagna et al., 2011) said that many locations showed 20 percent of fish with lesions, while later estimates reached 50 percent. In October 2013, Al Jazeera reported that the gulf ecosystem was "in crisis,” citing a decline in seafood catches, and deformities and lesions found in fish.
In March 2012, a definitive link was found between the death of a Gulf coral community and the spill. According to NOAA (November 2011), a cetacean Unusual Mortality Event (UME) has been recognized since before the spill began, NOAA is investigating possible contributing factors to the ongoing UME from the Deepwater Horizon spill, with the possibility of eventual criminal charges being filed if the spill is connected. Some estimates are that only 2 percent of the carcasses of killed mammals have been recovered.
Dolphin births in the region were affected, with a tenfold increased mortality in the first birthing season after the disaster, and a fourfold increase in stranding by 2013. Studies on sea turtles give similar numbers.
Health Consequences
By June 2010, 143 spill-exposure cases had been reported to the Louisiana Department of Health and Hospitals; 108 in the cleanup efforts, while 35 were reported by residents. Chemicals from the oil and dispersant are believed to be the cause; it is believed that adding dispersants made the oil more toxic (Louisiana Department of Health and Hospitals, June 2010).
In July, after testing the blood of BP cleanup workers and residents in Louisiana, Mississippi, Alabama, and Florida for VOCs, environmental scientist Wilma Subra said she was "finding amounts 5 to 10 times in excess of the 95th percentile" and that "the presence of these chemicals in the blood indicates exposure."
A 2012 survey of the health effects of the spill on cleanup workers reported "eye, nose and throat irritation; respiratory problems; blood in urine, vomit and rectal bleeding; seizures; nausea and violent vomiting episodes that last for hours; skin irritation, burning and lesions; short-term memory loss and confusion; liver and kidney damage; central nervous system effects and nervous system damage; hypertension; and miscarriages. Dr. James Diaz, writing for the American Journal of Disaster Medicine (2011), said these ailments appearing in the Gulf reflected those reported after previous oil spills, like the Exxon Valdez. Diaz warned that "chronic adverse health effects, including cancers, liver, and kidney disease, mental health disorders, birth defects and developmental disorders should be anticipated among sensitive populations and those most heavily exposed.” Diaz also believes neurological disorders should be expected.
Economy
The spill had a large economic impact on the Gulf Coast’s economy in the fishing, tourism, and offshore drilling industries, as well as on BP itself. The costs to BP included the spill response, containment, relief well drilling, grants to Gulf states, claims paid, and federal costs, including fines and penalties, estimated to be $61.6 billion (Chemical Safety Board, 2014).
USAID/UGANDA: ENVIRONMENTAL MANAGEMENT FOR THE OIL SECTOR – TRAINING COMPENDIUM: MODULE 4 173

Investigations and Settlements
A number of investigations explored the causes of the explosion and spill. The U.S. government's 2011 report (National Commission on the BP Deepwater Horizon Oil Spill and Offshore Drilling, 2011) pointed to defective cement on the well, faulting mostly BP, but also rig operator Transocean and contractor Halliburton.
In November 2012, BP and the United States Department of Justice settled federal criminal charges with BP pleading guilty to 11 counts of manslaughter, two misdemeanors, and a felony count of lying to Congress. BP also agreed to four years of government monitoring of its safety practices and ethics, and the EPA announced that BP would be temporarily banned from new contracts with the US government.
Lessons Learned
There are a few simple things we should remember which could help us take a significant step forward to prevent issues such as these from occurring in the future:
• The technical near misses are easy to learn from because they can be scientifically analyzed. It is not so easy to learn from the behavioral near misses but we have to get better at routinely doing that analysis. There will be few occasions where equipment failure is the absolute root cause of any incident or near miss, there will almost always be a human element. Do those with the knowledge and skill needed to prevent these incidents have the power to do so?
• In a global industry with horrendous potential for getting things wrong, is it too much to expect that operators will adopt best practice wherever they operate even when there is no obligation to do so? Governments also must be attentive to their responsibilities.
• Are companies more concerned with their image and influencing business analysts than with real integrity? When an incident occurs is the priority to ‘spin’ the story rather than be open and honest? Which way is the moral compass really pointing?
• Accountability for safety and integrity cannot be contracted out. Managers have to be clear about who is responsible for what, especially in a changing or emergency situation.
• How good is the emergency and crisis training for managers and crews? When the squeeze comes on costs often the first thing to suffer is training. Is there confidence offshore that key personnel are ready for an emergency?
• We should be extremely careful of late changes of plan. Rushed, last minute and bad decisions made in the middle of the night are all too familiar to most of us.
• Are we complacent about our safety performance and culture? Remember that Deepwater Horizon held an onboard ceremony on the day of the incident. Such celebrations are lagging indicators; we should take more notice of things we are doing which are leading us toward genuine improvements.
The only way to be sure that there will not be another Piper or Macondo type incident is if people feel that at all times that they have the confidence and authority to do the right thing within their sphere of expertise.
What alternative is there? We already have rules, standards, audit reports, academic papers, and the rest.
These count for nothing if on a remote location in the middle of the night, some hard-pressed manager, engineer, or technician feels under pressure to take a chance.
USAID/UGANDA: ENVIRONMENTAL MANAGEMENT FOR THE OIL SECTOR – TRAINING COMPENDIUM: MODULE 4 174

Petroleum Industry in Nigeria-Niger Delta
The largest petroleum industry in Africa is in Nigeria, concentrated in the Niger Delta. The delta is within 70,000 km² of wetlands, and home to over 30 million people and 40 different ethnic groups. It makes up 7.5 percent of Nigeria's total land mass. The delta's environment can be broken down into four ecological zones: coastal barrier islands, mangrove swamp forests, freshwater swamps, and lowland rainforests. This ecosystem contains one of the highest concentrations of biodiversity in the world, supporting a rich array of flora and fauna, arable terrain for crops and trees, and multiple species of freshwater fish. The carelessness of the oil industry has precipitated this situation, which can perhaps be best encapsulated by a 1983 report issued by the NNPC, long before popular unrest surfaced (Otti, 2016).
Historical Development of Oil and Gas Production
Source: Otiotio, 2013
“Oil and gas exploratory activities in Nigeria began in 1908 when the Colonial Government gave a royal charter to the Nigerian Bitumen Corporation (a German entity) and British Colonial Petroleum (a Colonial chartered corporation), which commenced exploratory activities in Araromi area in Western Nigeria, however the activities were abruptly terminated due to the First World War in 1914. Exploratory activities resumed in 1937 when Shell Petroleum Development Company of Nigeria (formerly Shell D’Arcy, a consortium of Shell and Royal Dutch) was awarded the sole exploratory license covering the whole territory of Nigeria to prospect for oil. This effort was also interrupted by the outbreak of the Second World War, but resumed in 1947. After several years of concerted and rigorous effort in drilling 28 wells and 25 core dry holes, oil was discovered in commercial quantities at Oloibiri in Bayelsa State in 1956, and actual production of 5,100 bbl/d. was recorded in 1958.”
“After Nigeria’s independence in 1960, the indigenous Government opened up the oil industry by giving exploratory rights in onshore and offshore areas of the Niger Delta region to Mobil, Agip, Safrap (now Elf), Tenneco (now Texaco) and Amoseas (now Chevron). This act divested Shell of its monopoly status, though it was and still the largest international oil company operating in Nigeria.”
“As more companies joined in the production, Nigeria’s oil production rose to a peak of 2.4 million bbl/din 1970, thereby making Nigeria to be a major oil-producing nation, ranking seventh in the world.”
“Initially, government interest in the oil industry was limited to the collection of royalties, lease rentals and taxes, but that changed with the United Nations Resolution on Permanent Sovereignty over Natural Resources which spurred the Nigerian Government into taking positive steps to control the oil and gas industry by enacting the Petroleum Act in 1969, which vested the ownership and control of all petroleum resources in the Federal Government.”
“Subsequently Nigeria joined the Organization of Petroleum Exporting Countries (OPEC) in 1971, established the Nigerian National Oil Corporation by a decree in 1971 (which later became Nigeria National Petroleum Corporation [NNPC] in 1977) and acquired controlling interests in the oil companies operating in the country. Presently, the NNPC have Joint Venture Companies with six international oil companies and one indigenous oil company.”
• Shell (SPDC), which accounts for about 40 percent of Nigeria’s total oil production. The joint venture is composed of NNPC (55 percent), Shell (30 percent), Elf (10 percent), and Agip (5 percent).
• Chevron (CNL) composed of NNPC (60 percent) and Chevron (40 percent). • Mobil (MPNU) composed of NNPC (60 percent) and Mobil (40 percent). • Agip (NAOC) composed of NNPC (60 percent), Agip (20 percent) and Phillips Petroleum (20
percent). • Elf (EPNL) composed of NNPC (60 percent) and Elf (40 percent); about 100,000 bpd.
USAID/UGANDA: ENVIRONMENTAL MANAGEMENT FOR THE OIL SECTOR – TRAINING COMPENDIUM: MODULE 4 175

• Texaco Overseas (TOPCON) composed of NNPC (60 percent), Texaco (20 percent) and Chevron (20 percent).
“NNPC has 17 Production Sharing Contracts with Addex, Snepco, StatOil, Esso, Oranto, Ocean Energy, Philips, Conoco, ChevronTexaco, Elf, NAE, PetroBrass; and one service contract with Agip. In the downstream, NNPC has four refineries in Kaduna, Port Harcourt and Warri that were built between 1978 and 1985 with a total installed capacity of 445,000 bpd and these refineries are linked with a network of pipelines and depots.”
Current Situation
Source: U.S. Energy Information Administration, 2015
“Nigeria is the largest oil producer in Africa, holds the largest natural gas reserves on the continent, and is among the world's top five exporters of LNG. Nigeria became a member of the OPEC in 1971, more than a decade after oil production began in the oil-rich Bayelsa State in the 1950s. Although Nigeria is the leading oil producer in Africa, production suffers from supply disruptions, which have resulted in unplanned outages as high as 500,000 barrels per day (bbl/d).”
“Nigeria's oil and natural gas industry is primarily located in the southern Niger Delta area, where it has been a source of conflict. Local groups seeking a share of the wealth often attack the oil infrastructure, forcing companies to declare force majeure on oil shipments (a legal clause that allows a party to not satisfy contractual agreements because of circumstances that are beyond their control). At the same time, oil theft leads to pipeline damage that is often severe, causing loss of production, pollution, and forcing companies to shut-in production.”
“Aging infrastructure and poor maintenance have also resulted in oil spills. Natural gas flaring, the burning of associated natural gas that is produced with oil, has contributed to environmental pollution. Protest from local groups over environmental damage from oil spills and natural gas flaring have exacerbated tensions between some local communities and international oil companies. The industry has been blamed for pollution that has damaged air, soil, and water, leading to losses in arable land and decreases in fish stocks.”
“Nigeria's oil and natural gas resources are the mainstay of the country's economy. The country's oil and natural gas industry typically accounts for 75 percent of government revenue and 95 percent of total export revenue. Nigeria's economy is vulnerable to a drop in crude oil prices as it is very dependent on oil revenue. Nigeria's fiscal buffers, the Excess Crude Account and Sovereign Wealth Fund, include savings generated when oil revenues exceed budgeted revenues. However, those funds declined from US $11 billion at end-2012 to US $3 billion at end-2013.”
“According to the Oil and Gas Journal (OGJ), Nigeria has an estimated 37 billion barrels of proved crude oil reserves as of January 2015—the second-largest amount in Africa after Libya. The majority of reserves are found along the country's Niger River Delta and offshore in the Bight of Benin, the Gulf of Guinea, and the Bight of Bonny. Current exploration activities are mostly focused in the deep and ultra-deep offshore. Exploration activities in the onshore Niger Delta have decreased because of the rising security problems related to oil theft and pipeline sabotage. Several major international oil companies have divested from their onshore assets, which has created opportunity for local Nigerian companies to step in. The investment uncertainties surrounding the long-delayed Petroleum Industry Bill have also contributed to delayed investment in deepwater projects, and the start dates for these projects have continuously been pushed back.”
“Nigeria produces mostly light, sweet (low sulfur) crude oil of which the vast majority is exported to global markets. Crude oil production in Nigeria reached its peak of 2.44 million bbl/d in 2005, but began to decline significantly as violence from militant groups surged, forcing many companies to withdraw staff and shut-in production. The lack of transparency of oil revenues, tensions over revenue distribution, environmental damage from oil spills, and local ethnic and religious tensions created a fragile situation in the oil-rich Niger Delta. By 2009, crude oil production plummeted by more than 25 percent to average 1.8 million bbl/d.”
USAID/UGANDA: ENVIRONMENTAL MANAGEMENT FOR THE OIL SECTOR – TRAINING COMPENDIUM: MODULE 4 176

“The country has four oil refineries (Port Harcourt I and II, Warri, and Kaduna) with a combined crude oil distillation capacity of 445,000 bbl/d, according to OGJ.15 The refineries chronically operate below full capacity because of operational failures, fires, and sabotage mainly on the crude pipelines feeding the refineries. The combined refinery utilization rate was 22 percent in 2013. As a result, the country must import petroleum, although its refinery nameplate capacity exceeds domestic demand. Nigeria imported 164,000 bbl/d of petroleum products in 2013.”
Oil Theft
Source: U.S. Energy Information Administration, 2015
“Since the mid-2000s, Nigeria has experienced increased pipeline vandalism, kidnappings, and militant takeovers of oil facilities in the Niger Delta. In the past, the Movement for the Emancipation of the Niger Delta was one of the main groups attacking or threatening attacks on oil infrastructure for political objectives, claiming to seek a redistribution of oil wealth and greater local control of the oil sector.”
“Security concerns have led some oil services firms to pull out of the country and oil workers' unions to threaten strikes over security issues. The instability in the Niger Delta has also resulted in significant amounts of shut-in production at onshore and shallow offshore fields, forcing companies to frequently declare force majeure on oil shipments. The lack of progress in job creation and economic development has contributed to increased oil theft and other attacks in recent years.”
“Nigeria's oil theft and trade business is based on a complex system of networks composed of domestic, regional, and international actors, involving various people—local youth and communities, professionals such as corrupt bank managers, and high-level elites such as government officials and security force personnel. Oil is stolen at various stages of the production process from upstream to downstream operations—wellheads, manifolds, pipelines, and storage tanks at export terminals. Most oil theft operations typically involve tapping or siphoning oil from a pipeline by a hose and pumping the oil onto barges or small tankers.”
“Some stolen crude oil is taken to illegal refineries along the Niger Delta's swampy bush areas and the refined products are then sold domestically and regionally. However, the bulk of the crude oil makes its way to international markets. Most of that oil is sold to world markets directly from Nigeria's export terminals, which is known as white-collar theft. White-collar theft entails filling tankers (or topping them off) with stolen oil at export terminals or stealing crude from storage tanks and loading it onto trucks. A portion of the global illegally traded oil also involves the transfer of crude oil from small tankers to larger tankers waiting further offshore, also known as ship-to-ship transfers.”
“Estimates of stolen crude oil vary and can reach as high as 400,000 bbl/d, but some believe that estimate is too high and may include the volume lost in oil spills. It is difficult to measure the volume of stolen crude oil because metering systems are usually at export terminals and, therefore, oil stolen between the wellhead and pipelines is not easily detected. Furthermore, IOCs do not collectively report volumes stolen, so there is no authoritative source for total volumes stolen.”
“While the large-scale/commercial bunkering is less immediately damaging to the environment, it has implications for oil spills as it obscures data on pipeline losses. It also fosters an opaque and corrupt political environment, with negative ramifications for development.”
Extent of the Problem
Oil Spills
It has been estimated that between 9 to 13 million barrels have been spilled since oil drilling started in 1958 (Baird, 2010). The government estimates that about 7,000 spills occurred between 1970 and 2000. Causes include corrosion of pipelines and tankers (accounts for 50 percent of all spills), sabotage (28 percent), and oil production operations (21 percent), with 1 percent of the spills being
USAID/UGANDA: ENVIRONMENTAL MANAGEMENT FOR THE OIL SECTOR – TRAINING COMPENDIUM: MODULE 4 177

accounted for by inadequate or non-functional production equipment. The Nigerian National Petroleum Corporation (NNPC) places the quantity of petroleum jettisoned into the environment yearly at 2,300 cubic meters with an average of 300 individual spills annually. However, because this amount does not take into account "minor" spills, the World Bank argues that the true quantity of petroleum spilled into the environment could be as much as 10 times that amount (Moffat and Linden, 1995). In 2010, Baird reported that between 9 million and 13 million barrels have been spilled in the Niger Delta since 1958.
Natural Gas Flaring
Source: U.S. EIA, 2015
“A significant amount of Nigeria's gross natural gas production is flared (burned off) because some of Nigeria's oil fields lack the infrastructure needed to capture the natural gas produced with oil, known as associated gas. In 2013, Nigeria flared 428 billion cubic feet (Bcf) of its associated gas production, or 15 percent of its gross production. According to the U.S. NOAA, natural gas flared in Nigeria accounted for 10 percent of the total amount flared globally in 2011.”
FIGURE 3.4: GAS FLARING IN NIGERIA
Source: Okere, 2016
“The international community, the Nigerian government, and the oil corporations seem in agreement that gas flaring needs to be curtailed. Efforts to do so, however, have been limited although flaring has been declared illegal since 1984 under section 3 of the Associated Gas Reinjection Act of Nigeria.”
“The Nigerian government has been working to end gas flaring for several years, but the deadline to implement the policies and fine oil companies has been repeatedly postponed, with the most recent deadline being December 2012. In 2008, the Nigerian government developed a Gas Master Plan that promoted investment in pipeline infrastructure and new gas-fired power plants to help reduce gas flaring and provide more gas to fuel much-needed electricity generation. However, progress is still limited because security risks in the Niger Delta have made it difficult for IOCs to construct infrastructure that would support gas monetization.”
“Oil production in Nigeria began when gas was regarded only as a waste product, and since then alternatives to flaring have not been implemented in part for economic reasons. Ending flaring and using the gas for local energy needs could provide important health and economic benefits for local communities. With an estimated 30 percent of income in the Niger Delta spent on energy, and lack
USAID/UGANDA: ENVIRONMENTAL MANAGEMENT FOR THE OIL SECTOR – TRAINING COMPENDIUM: MODULE 4 178

of electricity identified as one of the key causes of economic stagnation across Nigeria, there is a strong case to be made for making gas-to-power projects at least at a local level commercially viable and quickly achievable. While there has been some successful local gas-to-power projects, oil companies say that capturing the gas for local use is not commercially viable because of artificial local pricing regimes. However, ending gas flares could affect a significant change in communities’ perceptions of oil companies—and thereby improve the operating environment—as the flares are such visible negative markers of the presence of oil companies.”
Canalization
Source: Uliukhifo et al. 2014
“In the attempt to shorten travel time and improve access to oilfields and production facilities, oil companies have constructed canals that in some cases have caused saltwater to flow into freshwater zones, destroying freshwater ecological systems. Increased access to new areas has also aggravated illegal logging activities. Oil companies constantly dredge river channels to facilitate navigation. The material dredged from the canals is often dumped on the channel banks, which disrupts the hydrology of these essentially flat and low-lying coastlands. The elevated banks restrict the free flow of water and create ponds that can be detrimental to vegetation and the local ecology.”
Environmental Impacts of Oil Spills
“The oil spills have caused land, air, and water pollution, severely affecting surrounding villages by decreasing fish stocks and contaminating water supplies and arable land. In 2011, the United Nations Environment Program (UNEP) released a study on Ogoniland and the extent of environmental damage from more than 50 years of oil production in the region. The study confirmed community concerns regarding oil contamination across land and water resources, stating that the damage is ongoing and estimating that it could take 25 to 30 years to repair with an initial investment of about $30 billion for the first 5 years” (Eurasia Review, 2017).
“The UNEP assessment report further states that even though the oil industry is no longer active in Ogoniland, oil spills continue to occur with alarming regularity. The Ogoni people live with this pollution every day. Specific findings of the assessment include” (UNEP, No date):
Contaminated Soil and Groundwater
Source: UNEP, 2011
• “The report concludes that pollution of soil by petroleum hydrocarbons in Ogoniland is extensive in land areas, sediments, and swampland. Most of the contamination is from crude oil although contamination by refined product was found at three locations.
• The assessment found there is no continuous clay layer across Ogoniland, exposing the groundwater in Ogoniland (and beyond) to hydrocarbons spilled on the surface. In 49 cases, UNEP observed hydrocarbons in soil at depths of at least 5 m. This finding has major implications for the type of remediation required.
• At two-thirds of the contaminated land sites close to oil industry facilities, which were assessed in detail, the soil contamination exceeds Nigerian national standards, as set out in the Environmental Guidelines and Standards for the Petroleum Industries in Nigeria (EGASPIN).
• At 41 sites, the hydrocarbon pollution has reached the groundwater at levels in excess of the Nigerian standards as per the EGASPIN legislation.
• The most serious case of groundwater contamination is at Nisisioken Ogale, in Eleme Local Government Area (LGA), close to a Nigerian National Petroleum Company product pipeline where an 8 cm layer of refined oil was observed floating on the groundwater which serves the community wells.”
USAID/UGANDA: ENVIRONMENTAL MANAGEMENT FOR THE OIL SECTOR – TRAINING COMPENDIUM: MODULE 4 179

Vegetation
Source: UNEP, 2011
• “Oil pollution in many intertidal creeks has left mangroves denuded of leaves and stems, leaving roots coated in a bitumen-like substance sometimes 1 cm or more thick. Mangroves are spawning areas for fish and nurseries for juvenile fish and the extensive pollution of these areas is impacting the fish life cycle.
• Any crops in areas directly impacted by oil spills will be damaged, and root crops, such as cassava, will become unusable. When farming recommences, plants generally show signs of stress and yields are reportedly lower than in non-impacted areas.
• When an oil spill occurs on land, fires often break out, killing vegetation and creating a crust over the land, making remediation or revegetation difficult.
• Channels that have been widened and the resulting dredged material are clearly evident in satellite images, decades after the dredging operation. Without proper rehabilitation, former mangrove areas which have been converted to bare ground are being colonized by invasive species such as nipa palm (which appears to be more resistant to heavy hydrocarbon pollution than native vegetation).
• In Bodo West, in Bonny LGA, an increase in artisanal refining between 2007 and 2011 has been accompanied by a 10 percent loss of healthy mangrove cover, or 307,381 m2. If left unchecked, this may lead to irreversible loss of mangrove habitat in this area.”
Aquatic
Source: UNEP, 2011
• “The UNEP investigation found that the surface water throughout the creeks contains hydrocarbons. Floating layers of oil vary from thick black oil to thin sheets. The highest reading of dissolved hydrocarbon in the water column, of 7,420 μg/l, was detected at Ataba-Otokroma, bordering the Gokana and Andoni LGAs.
• Fish tend to leave polluted areas in search of cleaner water, and fishermen must therefore also move to less contaminated areas in search of fish. When encountered in known polluted areas, fishermen reported that they were going to fishing grounds further upstream or downstream.
• Despite community concerns about the quality of fish, the results show that the accumulation of hydrocarbons in fish is not a serious health issue in Ogoniland but that the fisheries sector is suffering due to the destruction of fish habitat in the mangroves and highly persistent contamination of many of the creeks, making them unsuitable for fishing.
• Where a number of entrepreneurs had set up fish farms in or close to the creeks, their businesses have been ruined by an ever-present layer of floating oil.
• The wetlands around Ogoniland are highly degraded and facing disintegration. The study concludes that while it is technically feasible to restore effective ecosystem functioning of the wetlands, this will only be possible if technical and political initiatives are undertaken.”
“Pollution resulting from oil spills tends to be more difficult to manage in the Niger Delta environment than in others. The Delta is a low-lying area, where oil spills can spread rapidly through the fresh water swamps, mangrove swamps, lagoon marshes and tidal channels and the complex water flows can make controlling and cleaning spills more difficult. The water-saturated soil enables spilt oil to sink into aquifers. As a result, local communities have to deal with polluted drinking water. While arguably more severe than gas flaring in its immediate negative impacts in the Niger Delta context, oil spills are much more difficult to resolve, as the issue is fraught with the politics of scams, sabotage, theft and genuine grievance.”
USAID/UGANDA: ENVIRONMENTAL MANAGEMENT FOR THE OIL SECTOR – TRAINING COMPENDIUM: MODULE 4 180

Public Health
Source: UNEP, 2011
• “The Ogoni community is exposed to petroleum hydrocarbons in outdoor air and drinking water, sometimes at elevated concentrations. They are also exposed through dermal contacts from contaminated soil, sediments, and surface water.
• Since average life expectancy in Nigeria is less than 50 years, it is a fair assumption that most members of the current Ogoniland community have lived with chronic oil pollution throughout their lives.
• Of most immediate concern, community members at Nisisioken Ogale are drinking water from wells that is contaminated with benzene, a known carcinogen, at levels over 900 times above the WHO guideline. The report states that this contamination warrants emergency action ahead of all other remediation efforts.
• Hydrocarbon contamination was found in water taken from 28 wells at 10 communities adjacent to contaminated sites. At seven wells the samples are at least 1,000 times higher than the Nigerian drinking water standard of 3 μg/l. Local communities are aware of the pollution and its dangers but state that they continue to use the water for drinking, bathing, washing and cooking as they have no alternative.
• Benzene was detected in all air samples at concentrations ranging from 0.155 to 48.2 μg/m3. Approximately 10 percent of detected benzene concentrations in Ogoniland were higher than the concentrations WHO and the United States Environmental Protection Agency report as corresponding to a 1 in 10,000 cancer risk. Many of the benzene concentrations detected in Ogoniland were similar to those measured elsewhere in the world, given the prevalence of fuel use and other sources of benzene. However, the findings show that some benzene concentrations in Ogoniland were higher than those being measured in more economically developed regions where benzene concentrations are declining because of efforts to reduce benzene exposure.”
On January 30, 2013, a Dutch court ruled that Shell is liable for the pollution in the Niger Delta.
Environmental and Health Impacts of Natural Gas Flaring
Source: Agochi, 2014
“Gas flaring releases of large amounts of methane, which has a high global warming potential. The methane is accompanied by the other major greenhouse gas, carbon dioxide, of which Nigeria was estimated to have emitted more than 34.38 million metric tons of in 2002, accounting for about 50 percent of all industrial emissions in the country and 30 percent of the total CO2 emissions. While flaring in the west has been minimized, in Nigeria it has grown proportionally with oil production.”
“Gas flares have potentially harmful effects on the health and livelihood of nearby communities, as they release poisonous chemicals including nitrogen dioxide, sulfur dioxide, volatile organic compounds like benzene, toluene, xylene and hydrogen sulfide, as well as carcinogens like benzapyrene and dioxins. Humans exposed to such substances can suffer from respiratory problems. These chemicals can aggravate asthma, cause breathing difficulties and pain, as well as chronic bronchitis. Benzene, known to be emitted from gas flares in undocumented quantities, is well recognized as a cause for leukemia and other blood-related diseases. A study done by Climate Justice estimates that exposure to benzene would result in eight new cases of cancer yearly in Bayelsa State alone.”
“Gas flares are often close to communities and regularly lack fencing or protection for villagers who risk working near their heat. Many communities claim that nearby flares cause acid rain which corrodes their homes and other structures, many of which have zinc-based roofing. Some people resort to using asbestos-based material, which is stronger in repelling acid rain deterioration. Unfortunately, this contributes to their declining health and the health of their environment.
USAID/UGANDA: ENVIRONMENTAL MANAGEMENT FOR THE OIL SECTOR – TRAINING COMPENDIUM: MODULE 4 181

Asbestos exposure increases the risk of forming lung cancer, pleural and peritoneal mesothelioma, and asbestosis.”
“Older flares are rarely relocated away from villages and are known to coat the land and communities with soot and to damage adjacent vegetation. Almost no vegetation can grow in the area directly surrounding the flares due to their heat.”
“In November 2005 a judgment by the Federal High Court of Nigeria ordered that gas flaring must stop in a Niger Delta community as it violates guaranteed constitutional rights to life and dignity. As of May 2011, Shell has not ceased gas flaring in Nigeria.”
Economic Impacts
Source: European Parliament, 2011
“The environmental impacts of the oil industry also have economic ramifications: environmental degradation eliminates sources of income (e.g., fishing and farming), which displaces local populations, which in turn causes the collapse of local economies. According to Clarke (2008), locals argue that in some areas agrarian land will be unusable for 25–30 years in spite of remedial action by oil companies. Oil pollution has rendered much of the delta’s agricultural land infertile, so subsistence farming and fishing communities have been denied their principal food sources (SERAC/CESR 1996). This was also confirmed by the Rivers State survey where comments regarding impacts of spills related mostly to the ruin of agricultural land and fishing waters.”
“The negative impacts on livelihoods are particularly problematic in underdeveloped areas where local communities rely heavily on natural resources for their survival. The Niger Delta region is characterized by few roads, limited access to potable water, an electricity supply that it patchy at best, and poor sanitation and waste management. Given the poor level of development and lack of opportunity in the region, the people of the delta are largely reliant on the environment for subsistence through fishing and farming. Communities that host or are near to oil facilities and pipelines therefore suffer disproportionate economic consequences resulting from oil activity-related pollution.”
Institutional Issues
National Laws, Regulatory and Administrative Responsibilities
Source: European Parliament, 2011
“While some commentators argue that Nigeria’s environmental regulatory framework is insufficiently robust (e.g., Ibaba, 2010), many feel that implementation and enforcement, rather than the regulations themselves, are the main constraints. The complex bureaucracy, a lack of capacity and difficult working conditions in the relevant government departments mean that efficiency and strong oversight remain a challenge. Others also suggest that the system is open to abuse; for example, Environmental Assessment Officers must visit the oil facilities regularly to carry out inspections, but the oil companies are asked to pay for flights, accommodation, and subsistence.”
“Dealing with environmental and health impacts is also marred by the strong position of petroleum ministries vis-à-vis other government departments. The Department of Petroleum Resources (DPR) holds the oil licenses, so the oil companies need to maintain a close and positive relationship, but the DPR itself is interested in production and revenue generation as well as environmental regulation. There is some overlap between the DPR and Ministry of Environment, but the DPR maintains prime responsibility for environmental regulation in the oil and gas industry.”
The 2011 UNEP “Environmental Assessment of Ogoniland” report noted:
• “First issued in 1992, the EGASPIN form the operational basis for environmental regulation of the oil industry in Nigeria. However, this key legislation is internally inconsistent with regard to one of the most important criteria for oil spill and contaminated site management—specifically
USAID/UGANDA: ENVIRONMENTAL MANAGEMENT FOR THE OIL SECTOR – TRAINING COMPENDIUM: MODULE 4 182

the criteria which trigger remediation or indicate its closure (called the ‘intervention’ and ‘target’ values respectively).”
• “The study found that the DPR and the National Oil Spill Detection and Response Agency (NOSDRA) have differing interpretations of EGASPIN. This is enabling the oil industry to close down the remediation process well before contamination has been eliminated and soil quality has been restored to achieve functionality for human, animal and plant life.”
• “The Nigerian Government agencies concerned lack qualified technical experts and resources. In the five years since NOSDRA was established, so few resources have been allocated that the agency has no proactive capacity for oil spill detection. In planning their inspection visits to some oil spill sites, the regulatory authority is wholly reliant on the oil industry for logistical support.”
• “The oilfield in Ogoniland is interwoven with the Ogoni community. The fact that communities have set up houses and farms along rights of way is one indicator of the loss of control on the part of the pipeline operator and the government regulator.”
• “The UNEP project team observed hundreds of industrial packing bags containing 1,0001,500 m3 of waste, believed to be cuttings from oil drilling operations, dumped at a former sand mine in Oken Oyaa in Eleme LGA. The open disposal of such waste in an unlined pit demonstrates that the chain of custody in the region between the waste generator, transporter and disposal facility is not being followed.”
Oil Industry Practices
Source: UNEP, 2011
• “The study concludes that the control, maintenance and decommissioning of oilfield infrastructure in Ogoniland are inadequate. Industry best practices and SPDC’s own procedures have not been applied, creating public safety issues.”
• “Remediation by enhanced natural attenuation (RENA)—so far the only remediation method observed by UNEP in Ogoniland—has not proven to be effective. Currently, SPDC applies this technique on the land surface layer only, based on the assumption that given the nature of the oil, temperature and an underlying layer of clay, hydrocarbons will not move deeper. However, this basic premise is not sustainable as observations made by UNEP show that contamination can often penetrate deeper than 5 m and has reached the groundwater in many locations.”
• “Ten out of the 15 investigated sites which SPDC records show as having completed remediation, still have pollution exceeding the SPDC (and government) remediation closure values. The study found that the contamination at eight of these sites has migrated to the groundwater.”
• “In January 2010, a new Remediation Management System was adopted by all Shell Exploration and Production Companies in Nigeria. The study found that while the new changes are an improvement, they still do not meet the local regulatory requirements or international best practices.”
Lessons Learned
Source: European Parliament, 2011
“Negative environmental and health impacts of the oil industry remain a major concern. Information on oil spills remains sketchy. While larger spill are more likely to be reported (albeit at times with delays), the problems created by smaller, but more common spills are easier to conceal and thus tend to be underestimated. In addition to direct health and environmental effects, impacts on livelihoods pose a particular threat in communities largely depend on natural resources for agriculture and fisheries.”
“Gas flaring also continues, even though the technology is available and widely used in other countries. Cost-effective solutions are required not only to prevent health impacts and greenhouse gas emissions, but also to turn the valuable resource in affordable energy for local communities as a contribution to poverty alleviation.”
USAID/UGANDA: ENVIRONMENTAL MANAGEMENT FOR THE OIL SECTOR – TRAINING COMPENDIUM: MODULE 4 183

“While oil companies are implementing some measures to address these impacts, efforts remain insufficient. CSR activities are piecemeal and short-term, EIAs are insufficiently robust and requirements for accountability and transparency are either not available or not enforced.”
“Community engagement also remains challenging, giving rise to social tensions and even unrest. The Niger Delta case provides useful lessons in this regard and current engagement strategies are worth monitoring to see whether they can also provide a model for other producers.”
“As in other oil-producing countries, the main limitation is often not the absence of regulations, but the lack of political will and capacity to implement and enforce them. Thus, any solution will ultimately have to deal with issues of governance, including increased revenue transparency, more equitable and effective revenue sharing and use, a better balance of power between ministries, and greater citizens’ participation.”
“Current efforts to promote greater revenue transparency are an important step that needs to go hand in hand with a push for revenue management and a greater emphasis on preventing trade in oil sourced illegally or from conflict areas.”
Remediation and Restoration Efforts Going Forward
Source: UNEP, 2011
“The 2011 UNEP study concludes that the environmental restoration of Ogoniland is possible but may take 25 to 30 years. The report contains numerous recommendations (emergency measures, technical, operational, public health, institutional, regulatory, industry operators, and Ogoniland community) that, once implemented, will have an immediate and positive impact on Ogoniland. Further recommendations have longer timelines that will bring lasting improvements for Ogoniland and Nigeria as a whole.”
“The hydraulic connection between contaminated land and creeks has important implications for the sequence of remediation to be carried out. Until the land-based contamination has been dealt with, it will be futile to begin a cleanup of the creeks.”
“Due to the wide extent of contamination in Ogoniland and nearby areas, and the varying degrees of degradation, there will not be one single cleanup technique appropriate for the entire area. A combination of approaches will therefore need to be considered, ranging from active intervention for cleaning the top soil and replanting mangrove to passive monitoring of natural regeneration. Practical action at the regulatory, operational, and monitoring levels is also proposed.”
The 1991 Gulf War: Kuwait oil fields fires
The Issue
The Kuwaiti oil fires were caused by Iraqi military forces setting fire to a reported 605 to 732 oil wells along with an unspecified number of oil filled low-lying areas, such as oil lakes and fire trenches, as part of a scorched earth policy while retreating from Kuwait in 1991 due to the advances of Coalition military forces in the Persian Gulf War. The fires were started in January and February 1991, and the first well fires were extinguished in early April 1991, with the last well capped on November 6, 1991 (Office of the Special Assistant to the Deputy Secretary of Defense for Gulf War Illnesses, 2000).
The Arabian Gulf Environment
Source: Poonian, 2003
“The clear, shallow waters, warm temperatures and an inflow of nutrients from the Tigris and Euphrates Rivers make the Arabian Gulf one of the most productive water bodies in the world. Pelagic productivity is typical for waters of this latitude, and it is the benthic communities of the Gulf, which are responsible for its high productivity values (Sheppard, 1993). Coral reefs, especially on the offshore islands are the most diverse of the subtidal ecosystems, providing a substrate for many
USAID/UGANDA: ENVIRONMENTAL MANAGEMENT FOR THE OIL SECTOR – TRAINING COMPENDIUM: MODULE 4 184

organisms and shelter and feeding ground for numerous fish (Basson et al., 1977). They are highly productive, but cover only a small area and so are of relatively minor importance in a regional sense. Sea-grasses are common in shallow areas, forming the basis of many food chains.”
“The Gulf on the whole is dominated by soft-substrate ecosystems and includes several so-called critical marine habitats (Ray, 1976). Ecological attributes of these include: high biological productivity; provision of nutrients, feeding, breeding or nesting areas for marine and other animals; areas particularly rich in species; and areas important for sustaining populations of species at some or all phases of their life cycle. In the Gulf, critical marine ecosystems are mostly confined to shallow water less than 10-12 m (Price et al., 1993). An important consideration is that this area coincides with areas of greatest human activity.”
“The socioeconomic development of the Gulf region is highly dependent on its marine environmental quality. Most of the population’s freshwater supply is derived from the Gulf and the Red Sea through desalination plants. Fisheries are a multi-million dollar industry and the artisanal fisheries are a resource of great social significance. The major commercial fisheries are for penaeid shrimp, but groupers, jacks, and Spanish mackerel are also significant. The coastal and marine environments are internationally significant for a number of bird species, green and hawksbill turtles and dugongs; many organisms are endemic to the region. Discovery of oil in the Gulf during the 1930s and 1940s led to a massive increase in shipping; and was principally responsible for the immense economic wealth and strategic importance associated with the region today.”
Burning Oil Wells
Source: Poonian, 2003
“Having invaded Kuwait on 2nd August 1990, Saddam Hussein declared that ‘if he had to be evicted from Kuwait by force, then Kuwait would be burned’ (Sadiq and McCain, 1993). Upon evacuation, from 3 February 1991, Iraqi troops set fire to over six hundred oil wells in several Kuwaiti oil fields. Around 500 million barrels of oil were emitted (or ignited) from burning wells during the remainder of 1991 (Readman et al. 1992). Approximately 22 Gg of sulfur dioxide, 18 Gg of soot, and thousands of tons of carbon monoxide and oxides of nitrogen emanated from the wells on a daily basis in the early stages (Husain, 1995).”
“The Kuwait Petroleum Company's estimate as of September 1991 was that there had been 610 fires, out of a total of 749 facilities damaged or on fire along with an unspecified number of oil filled low-lying areas, such as "oil lakes" and "fire trenches".These fires constituted approximately 50 percent of the total number of oil well fires in the history of the petroleum industry, and damaged or destroyed approximately 85 percent of the wells in every major Kuwaiti oil field.”
“Besides this, significant amounts of toxic metals and carcinogenic constituents were also released into the atmosphere for several months (Husain, 1998). These massive emissions caused serious concern in the scientific community over possible catastrophic environmental consequences within and outside the Gulf region (Browning et al., 1991; Sheppard and Price, 1991).”
The Oil Spill
Source: Poonian, 2003
“At the end of January 1991, the Iraqi army discharged around 6 million barrels of oil into the Arabian Gulf (Randolph et al. 1998). As the largest spill in history, international press heralded this event as ‘the world’s worst ecological disaster.’ By comparison, the spill from the Ixtoc 1 was less than 4 million barrels, and from the Amoco Cadiz, Torrey Canyon, Exxon Valdez and Braer less than 2 million barrels in each case. Initially, there were two separate oil slicks. The main emission lasted from 22nd to 26th January and was caused by the deliberate discharge of oil from the Mina Al-Ahmadi Sea Island terminal in Kuwait.”
“The second slick was released from three tankers anchored at Kuwait’s port of Mina Al-Ahmadi. Five other tankers and several other terminals added oil throughout the spring and early summer
USAID/UGANDA: ENVIRONMENTAL MANAGEMENT FOR THE OIL SECTOR – TRAINING COMPENDIUM: MODULE 4 185

(Reynolds, 1993). Approximately half of the oil simply evaporated, and more than a million barrels were confined in large pits carved out of the desert (Randolph 1998). Prevailing winds directed the spill southwards. Between March and May 1991, about 905 thousand barrels of oil washed ashore along much of the coastline from Kuwait south to the Abu Ali peninsula, a hook of land, which halted the southern advance of the spill in Saudi Arabia.”
“The Iraqi military combat engineers also released oil into low-lying areas for defensive purposes against infantry and mechanized units along Kuwait’s southern border, by constructing several "fire trenches" roughly 1 kilometer long, 3 meters wide, and 3 meters deep to impede the advance of Coalition ground forces.”
Other Damaging Impacts
Source: Poonian, 2003
“At least 80 ships were sunk during the war, many of which were carrying oil and munitions. These ships, along with those lost during the Iran-Iraq conflict will remain a chronic source of contamination in the Arabian Gulf for many years (Sadiq and McCain, 1993). The destruction of sewage treatment plants in Kuwait led to the discharge of over 50,000m3d-1 raw sewage into Kuwait Bay, threatening the intertidal ecosystems; polluting public beaches and downgrading the quality of seawater used for desalination (Gerges, 1993).”
“The shelling and bombing in Iraq from air raids and rockets led to the complete destruction of six oil wells as well as refineries and storage depots. Toxic chemicals were emitted into soil and running water from the destruction of chemical industrial plants (UNEP, 1993). The potential fate of G-nerve chemical warfare agents in the area has also caused concern; such chemicals include:”
• “Tabun (GA) – ethyl phosphorodimethylamidocyanidate • Sarin (GB) – isopropyl methyl-phosphonofluoridate • Soman (GD) – pinacolyl methylphosphonofluoridate”
“Accidental or deliberate release of these chemicals into the Gulf would have serious consequences for the power desalination plants located along the Gulf shorelines, contaminating a sole drinking water resource (Khordagui, 1996).”
Environmental Impact
At the beginning of the crisis, little attention was devoted to the potential impact of a sustained, combined arms form of warfare on the regional environment. However, many environmentalists and concerned scientists soon began to discuss the potential ramifications of such activity, given the scale of the oil holdings in Kuwait (Environment and Ecology, 2017).
“Due to the circumstances of war, early scientific response to the fires and oil spills was impossible. However, as soon as was practicable, international scientific teams began to address the situation. There were two main efforts. The first centered around the cruises of the research vessel ‘Mt Mitchell,’ under the auspices of the National Oceanic and Atmospheric Administration of the USA (NOAA), Regional Organization for the Protection of the Marine Environment (ROPME), various UN agencies and the Saudi Arabian authorities. The second, commencing sometime after the spill, was the setting up and continual monitoring of a wildlife sanctuary for the Gulf Region by the EU and the National Commission for Wildlife Conservation and Development of the Saudi Arabian government (NCWCD) (Krupp and Jones, 1993). The sanctuary, which extends northward from the southern limit of the major pollution, is situated in Saudi Arabia, and includes a number of the offshore islands. Monitoring the recovery of the area is to continue indefinitely” (Poonian, 2003).
Oiling and petroleum hydrocarbon contamination was confined mainly to the northwestern parts of the Gulf while air pollution and reduced solar radiation from the burning oil wells was more widespread. The smoke plume widths ranged from 15 to 150 km for distances up to 1,000 km away
USAID/UGANDA: ENVIRONMENTAL MANAGEMENT FOR THE OIL SECTOR – TRAINING COMPENDIUM: MODULE 4 186

from the fires, reducing ground-level sunlight, visibility, and temperature beneath the plume (UNEP, 1993).
The increase in particulate matter and smoke density caused a significant decrease in air and sea surface temperatures. Measurements at Manifa Pier, between Kuwait and Dharan, showed a decline of 2.5°C in the mean sea temperature in 1991 (Husain, 1998). Although local and regional temperatures and solar flux were reduced under the plume, there is no evidence that regional weather patterns were consistently affected (UNEP 1993).
During the initial surveys, highest levels of contamination were found along the heavily impacted coast of Saudi Arabia between Ras Al Khafji and Ras Al Ghar, where concentrations of total petroleum hydrocarbons (expressed as Kuwait crude oil equivalents) ranged from 62–1400μgg-1 dry weight in surface sediments, 570–2600μgg-1 dry weight in clams and 9.6–31μgg-1 dry weight in fish muscle (Price et al., 1994).
Gas chromatographic analysis indicated that much of the spilled oil in at least the surface layer of the intertidal zone had substantially degraded within a few months of the spill. Hydrocarbon contamination originating from the spill was generally restricted to within approximately 400 km from the source. Analysis of biota and physical characteristics demonstrated that a full range of Gulf intertidal habitats was present within the impacted area (Jones and Richmond, 1992). By December 1991, most intertidal oil had been finally deposited on the upper shore between the high water spring and high water neap marks (Watt et al., 1993).
“In August 1992, more than one and a half years after the Gulf War oil spill, relatively high and toxic concentrations of contaminants remained in the near-shore surface waters of Kuwait and Saudi Arabia. Toxicity tests on heart urchin larvae indicated that the subsurface water column was not toxic, but the sea surface micro layer at about half of the sites sampled demonstrated significant toxicity (Price et al. 1994). The surface micro layer represents an important spawning and feeding ground for many fish, shrimps and shellfish and a source of transport and deposition of contaminants onto intertidal beaches” (Poonian, 2003).
“Almost all of the salt marshes along the Saudi coast were impacted by oil in 1991. The zone between the spring and neap high water marks was covered by a continuous band of oil and tar, with devastating effects on fauna and flora. Due to the presence of numerous crab burrows, the oil penetrated up to 60 cm into the fine grained, usually impermeable sediments (Barth, 2001) and became compacted. All benthic fauna as well as most halophytes were decimated after the oil settled along the shores” (Poonian, 2003).
“The complete destruction of the salt marsh biota and some deposition of new sediment created an ideal environment for the growth of algal mats. Barth (2001) noted that even ten years after the spill, liquid oil was still present in the upper sediments; and hydrocarbon concentrations were very similar to those of 1991, with values of up to 50 μgg-1, heavily restricting the recolonization of original biota” (Poonian, 2003).
“In February 1992 a Wall Street Journal article offered data from a scientific study, which noted that the Kuwaiti oil fires significantly impacted the Persian Gulf, and that their scope was not as deleterious to other regions of the world. The study estimated that the fires produced almost 3,400 metric tons of soot per day, which was significantly lower than earlier projections. The researchers found that the smoke never rose more than six kilometers into the atmosphere, even though smoke plumes travelled 1,600 kilometers. However, the Kuwaiti smoke plumes were short-lived in the atmosphere because they were dissipated by clouds and precipitation. The study noted that the rate of sulfur dioxide emissions from the oil fires amounted to 57 percent of that from all U.S. electric utilities. In addition, the dissemination of other gases such as carbon monoxide, ozone, and oxides such as nitrogen and carbon dioxide, were "well below typical urban levels" in the United States” (Ali, 1994).
USAID/UGANDA: ENVIRONMENTAL MANAGEMENT FOR THE OIL SECTOR – TRAINING COMPENDIUM: MODULE 4 187

“By November 1991 the last of the burning oil wells had been capped, but the scale of damage to the Kuwaiti economy and ecological environment was just beginning to be assessed. Hundreds of miles of the Kuwaiti desert were left uninhabitable, due to the accumulation of oil lakes and of soot from the burning wells. The impact of the oil spillage on the biodiversity of the Gulf has yet to be fully assessed. One to two million of migratory birds visit the Gulf each year on their way to northern breeding grounds, and it has been documented that thousands of cormorants, migratory birds indigenous to the Gulf region, died as a result of exposure to oil or from polluted air” (Ali, 1994).
“The fishing industry in the Gulf was deleteriously affected by the oil spillage into the Gulf, which was important due to the fact that it is one of the most vibrant productive activities in the region after the production of oil. As an example of the vibrancy of this industry, prior to the Iraqi invasion of Kuwait the Gulf had yielded harvests of marine life of up to 120,000 tons of fish a year; after the oil spillage, these numbers significantly dropped. In addition to this degradation to an economic activity, many people living on the Gulf Coast depend on fishing as purely a subsistence activity, and the oil spillage has disrupted the spawning of shrimp and fish. Other species effected by the oil spillage included green and hawksbill turtles (already classified as endangered species), leatherback and loggerhead turtles, dugongs, whales, dolphins, migratory birds like cormorants and flamingos, and sea snakes” (Ali, 1994).
“Another concern raised about the spillage of oil into the Gulf stemmed from the overall reliance on water in the region. Seventy to ninety percent of the populace depend on desalination plants for fresh water supplies, and the oil spillage threatened the precious desalination plants, as well as power plants and industrial facilities all along the Gulf Coast. As to the direct impact on human health, health experts noted that the residual effects of hydrocarbons in the air or in peoples' bodies would precipitate a dramatic increase in lung cancer and birth defects across the region in as little as fifteen years. Other scientists predicted that Kuwait's death rate could rise by as much as ten percent within a short time frame. There has been intense speculation in the United States that the mysterious "Gulf War Syndrome,” which currently affects almost 10,000 U.S. troops who served in the Gulf, may have been caused by the release of chemicals from the burning oil wells” (Ali, 1994).
“In 1993 Farouq al-Baz, director of Boston University's Center for Remote Sensing, stated that more than 240 oil lakes had been discovered in the Kuwaiti desert. He added "'Birds, plants and marine life are still suffering from the effects of the war and damage to the desert itself could persist for decades.'" In addition, the mixture of sand and oil residue in the Kuwaiti desert created large areas, which effectively had been reduced to semi-asphalt surfaces” (Ali, 1994).
“By the fall of 1995, disturbing reports were filed from Kuwait claiming that sunken Iraqi warships filled with chemical munitions off the coast of Kuwait posed a serious and urgent threat to the regional environment. While the Kuwaiti government did not directly mention the chemical munitions on the sunken Iraqi ships (due for political reasons, and for a lack of hard data confirming the existence of such munitions), the Kuwaitis dispatched a Dutch salvage team to investigate these allegations. After learning of such reports, environmentalists began to fear the possible pollution of the Gulf from the chemical munitions, and expressed their concern over the potential impact on the Gulf desalinization plants” (Ali, 1994).
“In addition to these concerns, experts also warned that up to 100,000 tons of crude oil could be released from the Amuriyan, a sunken Iraqi tanker in the northern Gulf. The Amuriyan lies half-submerged in about 120 feet of international waters almost 15 miles northeast of Kuwait's Bubiyan Island in the northern Gulf, close the Shatt al-Arab estuary” (Ali, 1994).
“By September 1995, Kuwait filed a $385 million claim against Iraq for compensation for environmental damage due to Iraq's occupation of Kuwait. More specifically, Kuwait submitted five claims to the United Nations for environmental damage covering health, coastal areas, maritime environment, groundwater resources, and desert environmental damage” (Ali, 1994).
USAID/UGANDA: ENVIRONMENTAL MANAGEMENT FOR THE OIL SECTOR – TRAINING COMPENDIUM: MODULE 4 188

Economic Impact
Source: Ali, 1994
“While the environmental impact of the Iraqi scorched earth policy has been well-documented, the economic impact of this Iraqi policy has not been as well investigated. At the most basic level, the Iraqi acts severely deflated the Kuwaiti economy for almost a two-year period from early 1991 to late 1992, as the Kuwaiti oil industry suffered a massive drop in production due to the destruction of many of the oil wells.”
“Kuwait's Gross Domestic Product (GDP) increased from 1993 to 1995 as a result of the resurgence of its oil industry. Oil exports are once again on the rise after they hit an all time low between 1990-1991, and Kuwait expects to produce three million barrels per day by 2005. Kuwait currently produces almost two and one-half million barrels per day. In spite of the current strength of the Kuwaiti oil industry, Kuwait accumulated almost $40 billion in external debt in order to finance the cost of internal reconstruction. Prior to the Gulf War, Kuwait's public debt hovered at a more manageable amount of eight billion dollars.”
Cleanup and Bioremediation Activities
More than one million barrels of oil were collected offshore using skimmer ships contracted or operated by Saudi Aramco while more than half a million barrels were collected on the shoreline by means of booms and skimmers (Alam, 1993). The diversity of ecosystem types around the shoreline of the Gulf meant that a number of different techniques were necessary for effective cleanup, and these are summarized below (Poonian, 2003):
TABLE 2.2: CLEANUP TECHNIQUES EMPLOYED AGAINST THE GULF WAR OIL SPILL
Ecosystem Technique
Mangroves Low-pressure irrigation and a sprinkler system to release oil gently
Salt marsh
Flooding with seawater Inducing agitation by winds generated by helicopters Sprinklers on the upper intertidal zones Release of water from perforated pipes in the higher intertidal zone
Rocky shores Solvent and high pressure jets to wash away the oil Sandy beaches Mechanical tiller to enhance aeration and stimulate biodegradation
Source: Alam, 1993
Lessons
“Kuwait suffered severe economic and environmental damage as a result of Iraq's scorched earth policy during its occupation of Kuwait during the Gulf War. It may be years, if not generations, before the full extent of the damage to the physical integrity of the region and to human, animal, and plant life, is fully assessed. These environmental costs may have repercussions not only for the region, but for other countries in central and south Asia. The conflagration in Kuwait demonstrates the danger in conducting large-scale modern combat in an environmentally fragile area, and shows how vulnerable all oil-producing nations are to this type of environmental and economic disaster in the future” (Ali, 1994).
“At a bare minimum, the Kuwaiti environmental disaster galvanized Gulf policymakers to pay closer attention to the potential economic and environmental ramifications of conflict in their region. Kuwait and the other Gulf Cooperation Council (GCC) member states have sought to tighten existing environmental regulations so as to preclude any similar environmental disasters in the future. In November 1995, the GCC states met to discuss the prospects for unifying their
USAID/UGANDA: ENVIRONMENTAL MANAGEMENT FOR THE OIL SECTOR – TRAINING COMPENDIUM: MODULE 4 189

environmental laws, drafting new uniform standards for environmental protection, and setting up environmental safeguards in the Gulf” (Ali, 1994).
“While the Gulf shows some acclimation to oil pollution, war-related events imposed an additional ecological burden on coastal systems that are naturally stressful and influenced by multiple background human impacts (Price, 1998). Overall, there is evidence of ecological recovery of sandy and rocky shores, although full recovery of marsh and mangrove biota may take longer in some cases. Initial acute impacts on bird populations were overcome fairly rapidly. However, negative effects on fisheries caused substantial economic losses for a number of the Gulf nations, although a full recovery is now evident” (Poonian, 2003).
“The total cost of the cleanup from the 1991 war has been estimated at more than US $700 million (McClain, 2001). Even now, Kuwait is still trying to cope with problems left from un-ignited oil which formed around 300 lakes and pools that are sinking into the sand, contaminating some 40 million tons of soil (McClain, 2001). If the full ecological impact of war damage is difficult to assess, full assessment of ecological costs can be even more problematic, when costs are spread over many people and are diffuse in both space and time (Milner-Gulland, 1999)” (Poonian, 2003).
“Marine renewable resources often contribute significantly to national economies and even geopolitical stability. Indeed, their effective assessment and management is fundamental to sustainable development. Ironically, an oil spill can actually show up as a benefit in national accounts, since ecological damage would be ignored, but cleanup costs would be included as national spending, and hence increase GDP figures (Milner-Gulland, 1999)” (Poonian, 2003).
“A major difficulty in assessing and managing the impacts of the Gulf War is dealing with the highly variable temporal and spatial scales over which marine processes operate. Upholding regional and international agreements is particularly important in seas like the Gulf, whose cross-boundary resources constitute a valuable commons shared by eight countries and utilized by many more” (Poonian, 2003).
“War-related issues have often been viewed in isolation, rather than within a wider coastal zone management context, resulting in an incomplete picture. Adopting a study unit with sufficiently large spatial scale is critical, particularly in the assessment of migratory species such as birds and sea turtles. This approach also allows a better understanding of effects such as El-Niño Southern Oscillations and coral bleaching” (Poonian, 2003).
Developing a Response System
Overview
This text below is extracted directly from the B.C. Guidelines for Industry Emergency Response Plan developed by the Ministry of Environment in the Province of British Columbia, Canada, 2002, which can be accessed at http://www2.gov.bc.ca/assets/gov/environment/air-land-water/spills-and-environmental-emergencies/docs/bc_guidelines_industry_emergency_respone_plans.pdf.
The sections outlined below provide some generic guidance for operators of industrial facilities or operations to develop emergency response plans for timely and effective response to major accidents and emergencies involving the release of hazardous chemicals or dangerous goods to the environment. The generic guidance contained in the text below can be applied to the oil and gas industry as well.
Purpose and Scope
Source: Ministry of Environment, B.C, 2002
Industry facilities that store, manufacture, transport, recycle or handle dangerous goods, hazardous wastes, or hazardous chemicals should prepare a response (contingency) plan to respond to emergencies involving the accidental release of these substances into the environment. Such facilities include, but are not limited to waste landfills, recycling (plastics, tires, paint, pesticide, batteries)
USAID/UGANDA: ENVIRONMENTAL MANAGEMENT FOR THE OIL SECTOR – TRAINING COMPENDIUM: MODULE 4 190

facilities, chemical and petroleum bulk storage, or transportation facilities. The guidelines are intended for application by industry such as chemical, mining, metallurgical, oil and gas, petroleum, food and forest products. Government officials also should refer to the guidelines when reviewing industry response plans.
Contents of a Typical Emergency Response Plan
Source: Ministry of Environment, B.C, 2002
The guidelines identify the principal components of a response plan. Response plans should identify potential hazards, develop systems for preventing accidents, provide appropriate mechanisms for minimizing risk, loss and damage resulting from such incidents (i.e., reduce exposures to communities), and provide an incident management structure to guide response activities.
Policy Statement
Source: Ministry of Environment, B.C, 2002
A company or industry operator should have a policy statement reflecting its commitment to emergency prevention and preparedness. A senior official such as the Chief Executive Officer or the company president usually signs the statement. A policy statement should include:
• Management's commitment to safeguard the health and safety of the employees and the public and to protect the environment.
• A statement of the company's priorities in the event of a spill. Generally priority is in the order of the immediate safety of employees at the site and the members of the surrounding community, followed by protection of the environment.
• A clear indication of the first-line supervisor's authority for emergency action and expenditure. • A statement of authority regarding who will deal with public and media inquiries. • A statement concerning the company's plan to monitor compliance with this policy. • The effective date of the plan. • Schedule for review and for testing/exercising of the plan.
Purpose and Scope of a Response Plan
Source: Ministry of Environment, B.C, 2002
The purpose of formulating a response plan is to develop a state of readiness, which will allow for a prompt and orderly response to an emergency. This section of a response plan should state the intent and scope of the plan. Response plans should be structured around four major objectives:
• Understanding the type and extent of a potential emergency (risk/exposures) • Establishing a high order of preparedness (equipment, personnel) commensurate with the risk • Ensuring an orderly and timely decision-making and response process (notification, standard
operating procedures) • Providing an incident management organization with clear missions and lines of authority (ICS,
field supervision, Unified Command)
Prevention is by far the most effective way of reducing or eliminating the potential for a spill, as well as impact mitigation to reduce community and environmental impacts should a spill occur. Development of spill prevention measures (e.g., product loss control) and mitigation measures (buffer zones, dangerous goods transportation corridors, land use plans) are separate endeavors to a response plan. These approaches are beyond the scope of these guidelines and are not addressed.
The terms of reference for the plan should include such items as:
• Whether the plan is for an individual operation or a part of an industry cooperative in a given area;
• The geographic and physical location(s) covered by the plan;
USAID/UGANDA: ENVIRONMENTAL MANAGEMENT FOR THE OIL SECTOR – TRAINING COMPENDIUM: MODULE 4 191

• Types of emissions or spills that the plan is designed to address including spills to land, water, and air. This should include all dangerous goods and hazardous chemicals being handled along transportation routes and at the particular plant for which the plan is being developed; and
• A list of any other organizations or groups having responsibility under the plan.
Finally, the response plan must be compatible and integrated with the disaster, fire and/or emergency response plans of local, provincial, and national agencies. The latter is largely achieved by using the international and proven Incident Command System of emergency.
Pre-Emergency Planning
Hazard Identification
Source: Ministry of Environment, B.C, 2002
The first step is to identify potential hazards. This section of a response plan should identify all potential on-site and off-site hazards of the operation, and the type of damage that may result. This requires information on toxicological, physical, and chemical properties of the substances being handled. The potential impact on downwind air quality or downstream water quality from an accidental release and danger to human and animal health should be clearly identified. A mitigation plan can be developed to passively reduce exposures to the community or the environment should a spill occur (e.g., buffer-zones, fencing, dykes/barriers, transportation corridors). Man-made perils such as fire, explosion, transportation accidents, pipeline breaks, or equipment failure should be considered in addition to the natural perils such as floods, earthquakes, or landslides.
A Mitigation Plan is a separate aspect to a response plan, but can be used to determine the scope of response preparedness and tactical (operational) decisions.
Risk Analysis
Source: Ministry of Environment, B.C, 2002
The second step of the process is to determine the risk of an incident associated with each hazard. The basic procedure in a risk analysis is as follows:
• Identify potential failures or accidents (including frequency). • Calculate the quantity of material that may be released in each failure, estimate the probability of
such occurrences. • Evaluate the consequences of such occurrences based on scenarios such as most probable and
worst case events.
This combination of consequences and probability will allow the hazards to be ranked in a logical fashion to indicate the zones of important risk. Criteria should then be established by which the quantified level of risk may be considered acceptable to all parties concerned.
To reduce or eliminate risk, consideration should also be given to spill prevention and spill mitigation in conjunction with the preparation of a response plan. For this purpose, workers involved in operating the plant, equipment, or systems should be encouraged to provide information concerning weaknesses in systems or operating procedures, "near misses," and potential problems they have observed, along with recommended measures for prevention/mitigation of such occurrences.
Legislation and Industry Standards
Source: Ministry of Environment, B.C, 2002
The response plan should identify national regulations that apply to the facility and its operation. Where appropriate, regulatory agencies should be contacted for identification of requirements for the environment, pipelines, mining, fire, oil and gas, boiler and pressure vessels, dangerous goods, transportation, health and safety, and other operational considerations.
USAID/UGANDA: ENVIRONMENTAL MANAGEMENT FOR THE OIL SECTOR – TRAINING COMPENDIUM: MODULE 4 192

In certain cases, a particular industry may be bound to follow procedures recommended in Codes of Practice. Codes of Practice reflect an ethic, an attitude, and method of thinking about the way in which member companies do business and their role in society. Industry associations should be contacted in identifying appropriate codes.
Emergency Organization and Responsibilities
Source: Ministry of Environment, B.C, 2002
The response plan should identify the transition from normal operations to emergency operations and the delegation of authority from operations personnel to emergency response personnel. For this purpose, the plan should identify an emergency response organization with appropriate lines of authority and how the response management will escalate. Responsibilities for decision-making should be clearly shown in an emergency organization chart. The plan should identify each responder's position, mission, duties, and reporting relationship (refer to ICS below). Sufficient details should be provided to ensure that all critical activities are covered.
Though not legally required, industries that pose a significant risk that necessitates an Incident Management Team must use the ICS for emergency management (both organization and protocols) to receive response plan approval by the appropriate government/national jurisdiction.
The ICS is an organized approach to effectively control and manage emergency operations where there requires:
• Direct supervision of field personnel (task forces, single resources, strike teams) from an Incident Command Post;
• Development of an Incident Action Plan and delivery of tactical (operational) decisions; • Where unified (shared) command with other jurisdictions (governments) or response functions
(fire, police, ambulance) with the Responsible Party (spiller/polluter).
In the ICS, the emergency response is categorized into functional components such as Command, Operations, Planning, Logistics, Finance/Administration and response is undertaken according to a standard set of protocols (e.g., rules of engagement). As well, there are a establish set of response personnel positions, each with defined missions and duties under the five ICS functions.
Under ICS, the individual(s) in charge of the incident—the Incident Commander(s)—have the final authorities to jointly make the strategic and tactical decisions and have a complete responsibility for the management of the incident. Government (local, provincial, national), via their Incident Commanders and team members, have the authority to monitor the Responsible Party's (spiller/polluter) response efforts and to determine public safety and environmental protection priorities. Government may also augment the company's response efforts by providing government personnel and equipment. The latter could generally be based on a cost-recovery for such services. This monitoring and augmenting functions are jointly done under the ICS application of Unified Command.
Additional response levels above the field and site are recommended to support the company's Incident Management Team. These are the "off-site" Emergency Operations Center located at a company's regional office and headquarters office and their Crisis Management Team. The provincial government equivalent to a Crisis Management Team is the "Agency Executive" or "Policy Group". The latter is composed of their Chief Executive Officer and senior executives.
Resources
Source: Ministry of Environment, B.C, 2002
This section of the response plan will identify sources of local assistance including telephone numbers and names of contacts for:
• Fire departments
USAID/UGANDA: ENVIRONMENTAL MANAGEMENT FOR THE OIL SECTOR – TRAINING COMPENDIUM: MODULE 4 193

• Police • Municipal and provincial agencies • Hospitals • Doctors • Other company facilities • Mutual aid organizations • Cooperatives
Other resources that should be considered to assist in the incident include:
• Helicopter and air transport services • Surface transport services • Safety and monitoring equipment suppliers • Spill response and/or cleanup services
Companies should also determine what resources (equipment, personnel, technology, expertise) can be provided by the federal and provincial government, and under what conditions.
Internal Alerting/Communicating
Source: Ministry of Environment, B.C, 2002
In an emergency, information must be communicated quickly and accurately throughout the affected organization. The purpose of this portion of a plan is to establish an effective emergency communication network and a procedure for the prompt notification of individuals and agencies involved in an emergency response.
The section must identify means for 24-hour notification of first responders and officials who can provide direction and control to the response effort and who can authorize evacuation. A notification guide should also include a list of backup personnel for emergency response and their telephone numbers (cellular, pager, home numbers). To prevent system breakdown, an "alternate" person should be designated for each key position of designated responsibility.
The notification procedure may include flow charts and checklists indicating who should be involved, who has the responsibility to notify these individuals, how the notification is accomplished (e.g., paging systems, cellular or mobile phones) and the use of "fan out" (a call to one person/agency who in turn calls one or more key individuals during major emergencies). These numbers and checklists may be posted in critical areas for ready use or distributed as pocket cards.
External Alerting/Communicating
Source: Ministry of Environment, B.C, 2002
The plan should describe how and when the fire and police departments, emergency measures organizations, national and provincial authorities, news media, and volunteer or off-duty workers will be contacted during working and non-working hours. The responsibility may be designated to senior company personnel. Contacts for reporting purposes should also be included in the contact telephone listing. Roles and responsibilities of all external organizations and agencies involved in the emergency response and/or support function should be clearly defined. Duplication can be eliminated by ensuring coordination among the various agencies that provide similar services.
Electronic Communications
Source: Ministry of Environment, B.C, 2002
During an emergency, effective and reliable electronic communications equipment and procedures are vital. This section of the plan should detail the types of communication equipment to be used by personnel during an emergency response. Since normal means of communication can break down in
USAID/UGANDA: ENVIRONMENTAL MANAGEMENT FOR THE OIL SECTOR – TRAINING COMPENDIUM: MODULE 4 194

an emergency, alternative means must be considered. Cellular telephones, public address systems, two-way radios, and messengers can be used.
Training and arrangements may be necessary to ensure that telephone services are available for official calls during an emergency and that unauthorized calls will not be placed. Within an Incident Command Post, telephone circuits may quickly become jammed with calls. Direct hot lines that are not available to outside lines may be considered for critical communications. Use of 1-800 numbers for public enquires is another option to manage external calls.
Public Affairs
Source: Ministry of Environment, B.C, 2002
A good public relations program is extremely important in an emergency situation. Inquiries will normally be received from the media, government agencies, local organizations, and the general public. This section of the response plan should include a public relations or media plan. It should identify an Information Officer that is well-equipped and trained in media relations.
Initial releases should be restricted to statements of facts such as the name of the installation involved, type and quantity of spill, time of spill, and countermeasure actions being taken. All facts must be stated clearly and consistently to everyone. Discrepancies will raise unnecessary concerns and speculation. To avoid mixed-messages, the government's preferred way of issuance medial releases is through an appropriate information center (Joint Information Center [JIC]) that is separate from the Incident Command Post and that is staffed by Information Officers by both industry and government. Joint media releases are approved under Unified Command.
Plans should also be developed to utilize local media and television stations for periodic announcements during an emergency. This will also assist in reducing rumors and speculation.
Emergency Response
Response Action Decision
Source: Ministry of Environment, B.C, 2002
A response plan should have emergency coding that defines the severity and potential impact of an emergency. The three levels of emergencies may be identified as follows:
• LEVEL 1: Minor spills requiring an on-site worker to respond and take necessary collective actions.
• LEVEL II: Intermediate level spills requiring response by on-site or off-site trained staff but posing no danger to the public.
• LEVEL III: A major incident beyond the resources of a single facility, where there are subsidiary problems to complicate the situation such as fire, explosion, toxic compounds, and threat to life, property and the environment. Assistance will be required from local, regional, and/or provincial organizations. The media will be present and politicians at all levels will be requesting action.
Incident detection, information gathering and action decisions are the first steps in responding to an emergency incident. All these steps may occur over a short or protracted time period, depending on the circumstances and magnitude of the incident. The plan should identify the responsibility of the personnel having on-scene authority to evaluate the situation, assess the magnitude of the problem, and activate the emergency response plan.
A flowchart or decision tree posted in the facility or distributed as a pocket guide will assist in ensuring these first critical decisions are made.
USAID/UGANDA: ENVIRONMENTAL MANAGEMENT FOR THE OIL SECTOR – TRAINING COMPENDIUM: MODULE 4 195

Plan Activation and Response Mobilization
Source: Ministry of Environment, B.C, 2002
Normally, upon receiving initial notification of an incident involving release of a hazardous chemical into the environment, the individual having on-scene authority will assess the magnitude of the problem and potential threat to personnel, equipment, and environment. If the situation warrants, the person having authority to invoke the response plan will activate the plan, notify members of the Incident Management Team (Response) and, as soon as possible, report to the Incident Commander. Situations must be assessed on an ongoing basis to develop an appropriate response strategy.
For each type of emergency, the plan should include a specific Emergency Action Checklist. The action items may include the following:
• Identify the nature of the emergency and ascertain if there are casualties. • Locate the source, the area of immediate risk, and the potential for escalation. • Raise the alarm, alert the local, provincial, and federal emergency services and activate the
appropriate warning system. • Mobilize the appropriate resources to isolate the hazard as far as possible and to implement
"first aid" remedial actions. • Initiate procedures for the protection of personnel, plant, property and the environment.
Consider the need to evacuate non-essential personnel and the need for an emergency shutdown of operations. A detailed procedure for each foreseeable emergency should be included in the plan.
• Implement procedures for the protection of vital resources, continuity of critical services and security of the property and records.
• Arrange to account for personnel and to log events. • Activate emergency communications links. Notify senior personnel, the appropriate agencies and
neighbors, where appropriate. • Liaise with officers of the emergency services and with other senior personnel as they arrive on-
site, and cooperate as required. • Call for further emergency assistance as may be necessary. • Keep abreast of developments and ensure that the means of giving and receiving information,
advice, and assistance are functioning effectively, including that related to public relations. • As appropriate, implement approved procedures for rehabilitation.
Response Action/Containment/Cleanup
Source: Ministry of Environment, B.C, 2002
This section should identify the operational methods to manage an accidental spill or emission, as well as, and the location, capability, and limitations of equipment to be used. The response plan should not provide detailed descriptions, but refer to separate Operational Guidelines (Standard Operation Procedures) or detailed technical documents that apply to spill response operations.
The plan should list available on-site and off-site equipment, how it is to be accessed, and who has the responsibility for it. The plan should also describe how people and equipment will get to the site, how they will be supported during the crisis, and how crews will be supplied for the duration of the incident.
Emergency Operations Center: Incident Command Post
Source: Ministry of Environment, B.C, 2002
During emergencies, response operations should be directed from an Emergency Operations Center called the Incident Command Post. The Incident Command Post is where the Incident Management Team (Response) resides and generally has three characteristics:
• First-line of direct supervision to field personnel (e.g., cleanup crews);
USAID/UGANDA: ENVIRONMENTAL MANAGEMENT FOR THE OIL SECTOR – TRAINING COMPENDIUM: MODULE 4 196

• Response strategy, tactical decisions and incident action plans are formulated; • If a "jurisdictional Unified Command, then command is shared among other jurisdictions such as
local, provincial and national, or if a "functional" Unified Command, then command is shared among responding functions such fire, police, ambulance.
A location for an Incident Command Post should be identified in the plan, as well as alternate locations for backup. Incident Command Post(s) must be located a safe distance away from the incident itself so as not be subject to the threat(s) of a spill.
A supporting Emergency Operations Center should also be established whereby members of the Incident Management Team can seek additional information and support from the company, such as additional personnel, specialized analysis, technology, etc. A supporting Emergency Operations Center can be established in the company's regional office, Headquarters, or both.
At the top of the hierarchy is a Crises Management Team (also referred to in government as an Agency Executive). The Crises Management Team is composed of the companies’ senior executive (e.g., Chief Executive Officer), senior Public Relations Officer, and senior Safety/Emergency Manager. The purpose of the Crises Management Team is to address and resolve issues that arise on-site that can only be addressed at the political/management level.
Evacuation
Source: Ministry of Environment, B.C, 2002
The purpose of this section is to ensure a safe and orderly emergency evacuation of each area or the entire plant. If required, the plan should also include procedures for the notification and evacuation of the surrounding community. The planning for communities is done as a joint effort with local government and industry. The following elements must be considered when developing evacuation plans:
• Need for an alarm system capable of defining different areas and/or degrees of evacuation • Maps showing both the primary and alternate evacuation routes • Designation of primary as well as alternate off-site assembly areas • Designation of employees responsible for checking the evacuation area and for taking personnel
counts at the assembly area to ensure that the area has been safely evacuated • Designation of emergency escape equipment • Providing dispersion estimates for worst and most likely gas/vapor releases to better define the
affected areas • Procedures to increase the degree/extent of areas to be evacuated if the emergency situation
escalates
Evacuation decisions require knowledge by local authorities of the projected path of an airborne chemical cloud, atmospheric dispersion rate, and ground-level concentrations. The ability to warn residents on a rapid and reliable basis is also required. Use of appropriate and agreed on warning systems such as sirens, emergency broadcast systems, mobile public address systems and/or house-by-house contacts should be specified in the plan.
In some instances, it may be safer for citizens to remain inside with doors and windows closed rather than to be evacuated. A plume may move past homes very quickly. In these situations, the plan should include appropriate procedures to warn downwind residents to shut off all circulation systems including heating, air conditioning, vent fans, and fireplaces.
For example, in the province of British Columbia, Canada the ability to give mandatory evacuation orders is limited to the Fire Commissioner under Section 2 of the Fire Services Act. Evacuation plans should reflect this legislative authority.
USAID/UGANDA: ENVIRONMENTAL MANAGEMENT FOR THE OIL SECTOR – TRAINING COMPENDIUM: MODULE 4 197

Disposal of Spilled Contaminants and Debris
Source: Ministry of Environment, B.C, 2002
This section should contain procedures for the removal of recovered spilled material and contaminated soil or absorbents and location of temporary and/or permanent storage facilities for contaminated materials. The various possible treatment and disposal options such as incineration, reprocessing, burying, etc. should be covered in the plan along with procedures for obtaining the required approvals or permits from government agencies. Details on disposal should be provided in as separate Operation Guideline or technical document.
Site Restoration/Remediation
Source: Ministry of Environment, B.C, 2002
This is the action taken to restore the affected environment to the pre-spill conditions. The required degree of restoration will usually be determined through consultation between the party responsible for the spill and the government regulatory agency with primary responsibility in that situation.
Restoration can include physical removal of contaminated surface materials, high pressure washing, chemical cleaning, replacing of contaminated beach materials, restocking of lakes, and bioremediation.
Post-Incident Evaluation
Source: Ministry of Environment, B.C, 2002
The plan should specify that a post-incident evaluation be done on both mock exercises and actual emergency incidents and describe the manner in which the evaluation is to be done. The primary purpose of the post-incident evaluation is to identify from the spill response operation the weaknesses or strengths in the Action Plan and to make appropriate corrections to the plan. Other uses for post-incident evaluation include accounting, legal, and public relations matters.
The post-incident evaluation should include the following:
• Suitability of the organization structure, equipment, communication system, etc. • Adequacy of training, alarm systems, contingency manual, control center, communication plans,
security, spill containment and recovery procedures, monitoring, etc. • Appropriateness of the emergency response action plan, media communications plan, mutual aid
plans, etc.
An emergency response plan should provide for a written report on each incident. The report should include:
• A general description of the incident • Source and cause of the incident • Description of the response effort • Quantity of the spill and percent recovered • Itemized cleanup costs • Recommendations for preventive and mitigative measures • Plans for upgrading emergency preparedness and response plans
Training and Practice Drills
Source: Ministry of Environment, B.C, 2002
Training
Competency in responding to emergency incidents requires a complete understanding of the roles and duties of each person responsible on the team. Comprehensive training in the use of emergency response equipment and personnel protection devices and tactics is necessary to ensure the best
USAID/UGANDA: ENVIRONMENTAL MANAGEMENT FOR THE OIL SECTOR – TRAINING COMPENDIUM: MODULE 4 198

response capability. Provision for training is an integral part of a complete contingency planning and implementation program. Initial training must be followed by periodic updates to maintain familiarity with all aspects of the plan.
This section of the plan should provide details of training programs for the company personnel and mutual aid agencies involved in responding to an emergency. The amount, type, and frequency of training for each member of the team should be clearly spelled out.
Training should be provided at least annually and in the following situations:
• For new employees during their orientation period • For existing employees when there is a change in their duties • When new equipment or materials are introduced • When emergency procedures are revised • When a drill indicates need for improvement
It is wise to extend training as far as possible, even beyond the plant gates. The plan should provide for familiarizing local agencies such as fire, police, and ambulance staff with the potential hazards of the operation.
Practice Drills
Source: Ministry of Environment, B.C, 2002
This section should provide for periodic simulation exercises or practice drills. It is important to develop employee skills and evaluate the adequacy of the contingency plan through the use of mock exercises or drills. The objectives of a drill include evaluation of the following:
• Practicality of the plan (structure and organization) • Adequacy of communications and interactions among parties • Emergency equipment effectiveness • Adequacy of first aid and rescue procedures • Adequacy of emergency personnel response and training • Public relations skills • Evacuation and personnel count procedures
Drills may be conducted in various forms such as desktop, on-site or computer-synthesized. The complexity of the drill may be increased as the response team gains proficiency. Drills must be frequent enough to ensure that the response team maintains proficiency in all aspects of the contingency plan. Drills should be conducted in a variety of situations. It is also desirable to include mutual aid organizations and public emergency response organizations in these drills.
Plan Evaluation
Source: Ministry of Environment, B.C, 2002
This section of the plan should describe step-by-step procedure by which the plan may be evaluated internally. The purpose of evaluation of an emergency plan is to determine the adequacy and thoroughness of the plan. The ease of understanding and using the plan will also be important considerations.
Plan Updates
Source: Ministry of Environment, B.C, 2002
A procedure should be in place to update the contingency plan on a regular basis so that its call-out numbers and procedures are current. When an amendment is made to a plan, the amendment date should be noted on the updated page of the plan. A senior employee of the company should be designated to ensure that all plan-holders are notified of changes as soon as possible. Plan-holders should be requested to verify that they have received the changes.
USAID/UGANDA: ENVIRONMENTAL MANAGEMENT FOR THE OIL SECTOR – TRAINING COMPENDIUM: MODULE 4 199

The most common amendments include telephone listings, response personnel, equipment, chemicals handled, emergency services available, and resource lists.
Plan-holders should be notified immediately of any key changes regardless of review period.
Operational Guidelines
Source: Ministry of Environment, B.C, 2002
In an emergency situation, it is extremely important that response personnel have immediate access to vital information. Therefore, some of the information may be organized in easy-to-follow tables in the appendices.
Types of information that may be included in the appendices:
• Response team and key company personnel call-out list • Provincial, federal and local government agencies, news media and medical services telephone list • Community residents contact list • Facility maps, drawings and product hazard list • Organization, roles and responsibilities • Emergency incident report forms • Emergency shutdown procedures • On-site mobile and emergency equipment list by location • Off-site mobile and emergency equipment list by location • Equipment inspection and maintenance schedules • Air and water quality monitoring procedures • Weather information contacts • Statutes/laws/regulations (e.g., spill reporting regulation) • Emergency evacuation plan and escape routes • Cleanup contractors • Mutual aid contacts • Decontamination procedure • Material safety data sheets • Emergency response manual distribution list
Integrating Biodiversity in Emergency Response Plans
Source: BP, No date
The facility/industry must ensure that biodiversity issues are fully integrated with any planned response to emergency situations and that where project-level plans are required, they are regularly reviewed.
If there are significant potential impacts on biodiversity that could arise during or following significant accidents or emergencies (e.g., oil spills, uncontrolled fires), then the facility/industry may undertake a more detailed risk analysis, identifying vulnerable resources and sites and drawing up plans for emergency preparedness and contingency measures for each potential impact. This is particularly relevant if the oil and gas operation is in, or near to, a sensitive biodiversity area. It is important to note that health and safety concerns may outweigh environmental and biodiversity protection during and after some emergency situations and that the correct balance should be judged on a case-by-case basis.
The following information would be particularly useful in ensuring that biodiversity is adequately addressed in the emergency plan development processes.
• Protected areas and their legal status
USAID/UGANDA: ENVIRONMENTAL MANAGEMENT FOR THE OIL SECTOR – TRAINING COMPENDIUM: MODULE 4 200

• National red-lists on vulnerable species • Biodiversity action plans for areas in question • Biodiversity resources at risk • Conservation organizations with which the organization cooperates • Environmental management guidelines and procedures published by professional and industrial
bodies to which the organization subscribes
REFERENCES
Adcroft, A.; R. Hallberg; J. P. Dunne; B. L. Samuels; J. A. Galt; C. H. Barker & D. Payton (2010). "Simulations of underwater plumes of dissolved oil in the Gulf of Mexico". Geophysical Research Letters. 37: L18605. Bibcode:2010GeoRL..3718605A. doi:10.1029/2010GL04468
Advameg. (2017). Pollution Issues: Petroleum. Retrieved from http://www.pollutionissues.com/Na-Ph/Petroleum.html
Agochi, O. C. (2014). Gas Flaring in the Niger Delta Nigeria: An Act of Inhumanity to Man and His Environment. World Academy of Science, Engineering and Technology, International Journal of Social, Behavioral, Educational, Economic, Business and Industrial Engineering, 8(7), 2346-2349.
Alam, I.A.H. (1993) The 1991 Gulf War Oil Spill – Lessons from the Past and a Warning for the Future. Marine Pollution Bulletin 27: 357-360.
Ali, J. (1994). The economic and environmental impact of the Gulf War on Kuwait and the Persian Gulf: Kuwait Case–No. 162. The Trade & Environment Database (TED), 3(2).
Baird, J. (26 July 2010). Oil’s shame in Africa. Newsweek.
Baker J.P., Schofield C.L. (1982). Aluminum toxicity to fish in acidic waters .Water, Air and Soil Pollution 18: 289-309.
Barth, H.J. (2001) The coastal ecosystems 10 years after the 1991 Gulf War oil spill. Preliminary report (unpublished).
Basson, P.W., Burchard, J.E., Hardy, J.T. and Price, A.R.G. (1977) Biotopes of the western Arabian Gulf: Marine Life and Environments of Saudi Arabia. Aramco, Dhahran.
Bell, J. (2006). The Causes of Major Hazard Incidents and How to Improve Risk Control and Health and Safety Management: A Review of the Existing Literature. Health and Safety Laboratory. Retrieved from http://www.hse.gov.uk/research/hsl_pdf/2006/hsl06117.pdf
Biello, D. (2010). "The BP Spill's Growing Toll on the Sea Life of the Gulf". Yale Environment 360. Yale School of Forestry & Environmental Studies.
Boesch D.F., Rabalais N.N. (1987). Long Term Environmental Effects of Offshore Oil and Gas Development. Elsevier Science Publishing Co: New York
Bott, R.D. (2007). Flaring Questions + Answers. Second Edition. The Canadian Centre for Energy Information. Retrieved from http://siteresources.worldbank.org/EXTGGFR/Resources/578068-1258067586081/FlaringQA.pdf
BP. (No date) The Energy and Biodiversity Initiative. Retrieved from Negative Secondary Impacts from Oil and Gas Development. Retrieved from http://www.theebi.org/pdfs/impacts.pdf
Brenner, Noah; Guegel, Anthony; Hwee Hwee, Tan; Pitt, Anthea (22 April 2010). "Coast Guard confirms Horizon sinks". Upstream Online. NHST Media Group.
Briggs K.T.,Yoshida S.H. and M.E. Gershwin. (1996). The influence of petrochemicals and stress on the immune system of seabirds. Regulatory Toxicology and Pharmacology 23(2):145-55.
USAID/UGANDA: ENVIRONMENTAL MANAGEMENT FOR THE OIL SECTOR – TRAINING COMPENDIUM: MODULE 4 201

Browning, K.A., Allam, R.J., Ballard, S.P., Barnes, R.T.H., Bennetts, D.A., Maryon, R.H., Mason, P.J., McKenna, D., Mitchell, J.F.B., Senior, C.A., Slingo, A., Smith, F.B. (1991) Environmental effects from burning oil wells in Kuwait. Nature 351: 363-367.
Bureau of Ocean Energy Management. (No date). Questions, Answers, and Related Resources. Retrieved from http://www.boem.gov/Environmental-Stewardship/Environmental-Assessment/CWA/Offshore-Discharges-From-Oil-and-Gas-Development-Operations---FAQ.aspx
Burger J. (1997). Oil Spills. Rutgers University Press: New Brunswick, New Jersey.
Butler, J. S.(3 March 2011). BP Macondo Well Incident. U.S. Gulf of Mexico. Pollution Containment and Remediation Efforts (PDF). Lillehammer Energy Claims Conference. BDO Consulting.
Cairns, W.J. (1992). North sea oil and the environment: developing oil and gas resources, environmental impacts and responses. Elsevier Applied Science. New York.
Campbell, D., Cox, D., Crum, J., Foster, K., Christie, P., & Brewster, D. (1993). Initial effects of the grounding of the tanker Braer on health in Shetland. The Shetland Health Study Group. Bmj, 307(6914), 1251-1255.
Chemical Safety Board. (June 2014). Investigation Report: Explosion and fire at the Macondo Well (Deepwater Horizon Rig, Mississippi Canyon Block #252, Gulf of Mexico, April 20, 2010), Volumes 1 and 2. Report No. 2010-10-I-OS.
Christou, M., & Konstantinidou, M. (2012). Safety of offshore oil and gas operations: Lessons from past accident analysis. JRC Scientific and Policy Reports.
Clarke, D. (2008) Crude Continent: The Struggle for Africa's Oil Prize. Profile Books.
CNN. (13 January 2011). Foul waters, hard lessons from BP oil spill. Retrieved from http://edition.cnn.com/2011/OPINION/01/13/beinecke.gulf.oil.commission/
Campagna, C.; Short, F.T.; Polidoro, B.A.; McManus, R.; Collette, B.B.; Pilcher, N.J.; Sadovy de Mitcheson, Y.; Stuart, S.N.; Carpenter, K.E.. (2011). Gulf of Mexico Oil Blowout Increases Risks to Globally Threatened Species. BioScience, 2011; 61 (5): 393 DOI: 10.1525/bio.2011.61.5.8
Coombs, V. (No date). Fires in the oil and gas industry case study – the petrotrin oil refinery. Retrieved from http://www.disaster-info.net/lideres/english/jamaica/presentations/participants/TrinidadandTobago_Victor%20Coombs_FiresintheOilandGas.doc
Corbett Dabbs, W. (1996). Oil production and environmental damage. American University Trade and Environment Database. Retrieved from www.american.edu/projects/mandala/TED/projects/tedcross/xoilpr15. htm.
Diaz, J. (2011). The legacy of the Gulf oil spill: Analyzing acute public health effects and predicting chronic ones in Louisiana. American Journal of Disaster Medicine. Vol 6, No. 1.
Doucet I, (1994). Desert Storm syndrome: sick soldiers and dead children? Medicine and War 10:183-194.
E&P Forum/UNEP. (1997). Environmental management in oil and gas exploration and production. Retrieved from http://www.programmeofficers.co.uk/Cuadrilla/CoreDocuments/CD15/CD15.3.PDF
Epstein PR, Ford TE, Colwell RR. (1993). Marine ecosystems. Lancet 342:1216-1219
Epstein, P., & Selber, J. (2002). Oil: A life cyle analysis of its health and environmental impacts. The Center for Health and the Global Environment Harvard Medical School. United States.
USAID/UGANDA: ENVIRONMENTAL MANAGEMENT FOR THE OIL SECTOR – TRAINING COMPENDIUM: MODULE 4 202

Eurasia Review. (2017). Nigeria Energy Profile: Development Constrained By Instability In Niger Delta – Analysis. Retrieved from http://www.eurasiareview.com/25082011-nigeria-energy-profile-development-constrained-by-instability-in-niger-delta-analysis/
European Parliament (2011). The effects of oil companies’ activities on the environment, health and development in Sub-Saharan Africa. Policy Department, Directorate-General for External Policies of the European Union, Brussels.
Evans, M. (2011). Natural Disasters. Retrieved from http://www.earthtimes.org/encyclopaedia/environmental-issues/natural-disasters/
Garg, A, Yadav, H. (2015). Study of Safety Aspects in Offshore Operations of Oil and Gas Industry. Intl. Jo. of Pet. and Petrochem. Engineering. 1(2): 12-15.
Gerges, M.A. (1993) on the impacts of the 1991 Gulf War on the environment of the region: general observations. Marine Pollution Bulletin 27: 149-156.
Gillis, Justin; Robertson, Campbell (28 July 2010). "Gulf Surface Oil Vanishing Quickly". The New York Times.
Girgin, S; Krausmann, E. (2014). Analysis of pipeline accidents induced by natural hazard: Final Report (EU/JRC Technical Reports)
Gómez, C., & Green, D. R. (2013). The impact of oil and gas drilling accidents on EU fisheries. European Parliament, Directorate General for Internal Policies, Policy Department B: Structural and Cohesion Policies, Brussels, Belgium, Technical Report No. PE, 513.
Hazen, E.L. et al. (2014). Quantifying overlap between the Deepwater Horizon oil spill and predicted bluefin tuna spawning habitat in the Gulf of Mexico. NOAA, Stanford University, Monterey Aquarium. Science.
Henry, R. (15 June 2010). "Scientists up estimate of leaking Gulf oil". MSNBC. Associated Press.
Hoch, Maureen (2 August 2010). "New Estimate Puts Gulf Oil Leak at 205 Million Gallons". PBS NewsHour. MacNeil/Lehrer Productions.
Huffington Post. (16 June 2013). BP pulls out of gulf cleanup, leaving unanswered questions behind. Retrieved from http://www.huffingtonpost.com/2013/06/16/gulf-oil-spill-cleanup_n_3451488.html
Husain, T. (1995). Kuwaiti Oil-Fires: Regional Environmental Perspectives. Elsevier Science: Oxford, NewYork.
Husain, T. (1998) Terrestrial and Atmospheric Environment during and after the Gulf War. Environment International 24: 189-196.
Ibaba, I.S. (2010) ‘Environmental Protection Laws and Sustainable Development in the Niger Delta’, Africana Journal 4(1),
International Labour Organization. (1991). Prevention of major industrial accidents. International Programme on Chemical Safety of UNEP, the ILO and the WHO (IPCS). Retrieved from http://www.ilo.org/wcmsp5/groups/public/---ed_protect/---protrav/---safework/documents/normativeinstrument/wcms_107829.pdf
IPIECA. (2004). A guide to oiled wildlife response planning. Retrieved from http://www.amn.pt/DCPM/Documents/OiledWildlife.pdf
Jenssen B.M. (1996). An overview of exposure to, and effects of, petroleum oil and organochlorine pollution in grey seals (Halichoerus grypus). Science of the Total Environment 186(1-2):109-18.
USAID/UGANDA: ENVIRONMENTAL MANAGEMENT FOR THE OIL SECTOR – TRAINING COMPENDIUM: MODULE 4 203

Jervis, Rick; Levin, Alan (27 May 2010). "Obama, in Gulf, pledges to push on stopping leak". USA Today. Associated Press. Retrieved from http://usatoday30.usatoday.com/news/nation/2010-05-27-oil-spill-news_N.htm?csp=34news
Jones, D.A. and Richmond, M.D. (1992) Intertidal and Subtidal Marine Habitat surveys. In: Krupp, F., Fleming, R. (eds.) Establishment of a marine habitat and wildlife sanctuary for the Gulf region. Final Report for Phase I. Senckenberg, Germany: Forschungsinstitut und Naturmuseum.
Kelsey KT, Fen X, Bodell WJ, Spengler JD, Christiani DC, Dockery DW, Liber HL. (1994). Genetoxicity to human cells induced by air particulates isolated during the Kuwait oil fires. Environmental Research 64:18-25.
Kerr, R. A. (13 August 2010). "A Lot of Oil on the Loose, Not So Much to Be Found". Science. 329 (5993): 734–5. Bibcode:2010Sci...329..734K. PMID 20705818. doi:10.1126/science.329.5993.734
Khan, A. (4 September 2010). Gulf oil spill: Effects of dispersants remain a mystery". Los Angeles Times.
Khordagui, H. (1996) Potential Fate of G-Nerve Chemical Warfare Agents in the Coastal Waters of the Arabian Gulf. Marine Environmental Research 41: 133-143.
Kintisch, Eli (13 August 2010). "An Audacious Decision in Crisis Gets Cautious Praise" Science. 329 (5993): 735–736. Bibcode:2010Sci...329..735K. PMID 20705819. doi:10.1126/science.329.5993.735..
Krauss, Clifford; Broder, John; Calmes, Jackie. (30 May 2010). "White House Struggles as Criticism on Leak Mounts". The New York Times. Retrieved from http://www.nytimes.com/2010/05/31/us/31spill.html
Krupp, F. and Jones, D.A. (1993) The creation of a Marine Sanctuary after the 1991 Gulf War oil spill. Marine Pollution Bulletin 27: 315-323.
Landesman, Y.L., 2001, Public health management of disasters: The practice guide. American Public Health Association. Washington, DC. Retrieved from http://disaster-relief.org/pdf/DisasterBook.pdf
Louisiana Department of Health and Hospitals. (June 2010). Louisiana DHH Releases Oil Spill-Related Exposure Information.
McClain, H.M. (2001). Oil fires and spills leave hazardous legacy. Cable News Network.
McCormick, L. (27 June 2013). 40,000-Pound tar mat reminds us the oil spill is not over. National Wildlife Federation’s Blog. Retrieved from http://blog.nwf.org/2013/06/40000-pound-tar-mat-reminds-us-the-oil-spill-is-not-over/
Mielke, E., Anadon, L.D., and Narayanamurti, V. 2010. Water Consumption of Energy Resource Extraction, Processing, and Conversion: A Review of the Literature for Estimates of Water Intensity of Energy-Resource Extraction, Processing to Fuels, and Conversion to Electricity. Energy Technology Innovation Policy Discussion Paper No. 2010-15. Cambridge, Massachusetts.
Milner-Gulland, E.S. (1999). Ecological economics. In: McGlade (ed.) Advanced ecological theory: Principles and applications. Blackwell Science, Oxford
Ministry of the Environment. (2002). B.C. Guidelines for Industry Emergency Response Plans. British Columbia. Retrieved at http://www2.gov.bc.ca/assets/gov/environment/air-land-water/spills-and-environmental-emergencies/docs/bc_guidelines_industry_emergency_respone_plans.pdf
Moffat, D. and Linden, O. (1995). Perception and reality: Assessing priorities for sustainability in the Niger River Delta. Ambio. Stockholm [Ambio]. Vol. 24, no. 7-8, pp. 527-538.
USAID/UGANDA: ENVIRONMENTAL MANAGEMENT FOR THE OIL SECTOR – TRAINING COMPENDIUM: MODULE 4 204

Musk, S. (2012). Trends in oil spills from tankers and ITOPF non-tanker attended incidents. Arctic and Marine Oilspill Program (AMOP) Technical Seminar, 5-7 June 2012, Vancouver, Canada.
National Commission on the BP Deepwater Horizon Oil Spill and Offshore Drilling. (January 2011). Deep Water: The Gulf oil disaster and the future of offshore drilling. U.S. Government.
Newsweek. (22 April 2013). “Drowning in oil.”
NOAA [National Oceanic and Atmospheric Administration]. (November 2011). 2010–2011 Cetacean Unusual Mortality Event in Northern Gulf of Mexico – Office of Protected Resources – NOAA Fisheries". Nmfs.noaa.gov.
Norse, Elliott A.; Amos, John (November 2010). "Impacts, Perception, and Policy Implications of the BP/Deepwater Horizon Oil and Gas Disaster" Environmental Law Reporter. 40 (11): 11058–11073. ISSN 0046-2284.
Office of the Special Assistant to the Deputy Secretary of Defense for Gulf War Illnesses. (2000). Environmental Exposure Report. Department of Defense.
Okere, R. (2016). Nigeria remains a top gas flaring country, says EIA. Retrieved from https://guardian.ng/business-services/nigeria-remains-a-top-gas-flaring-country-says-eia/
Oneindia News. (August 2010). Scientists call new gulf spill report 'ludicrous.'
Otiotio, D. (No date). An overview of the oil and gas industry in Nigeria. Retrieved from https://www.academia.edu/2654835/AN_OVERVIEW_OF_THE_OIL_AND_GAS_INDUSTRY_IN_NIGERIA_BY_DENNIS_OTIOTIO
Ottil, A. (2016). Saving the future: Agenda for economic development and prosperity. AuthorHouse.
Otokunefor, T. V., & Obiukwu, C. (2005). Impact of refinery effluent on the physicochemical properties of a water body in the Niger delta. Applied ecology and environmental research, 3(1), 61-72.
Pendlebury, Richard (16 June 2010). "SPECIAL INVESTIGATION: Why is BP taking ALL the blame?" Daily Mail. London. Retrieved from http://www.dailymail.co.uk/news/article-1287226/GULF-OIL-SPILL-Whys-BP-taking-blame.html
Poonian, C. (2003). The effects of the 1991 Gulf War on the marine and coastal environment of the Arabian Gulf: Impact, recovery and future prospects. Management, 44.
Price, A.R.G., Sheppard, C.R.C. and Roberts, C.M. (1993) The Gulf: Its Biological Setting. Marine Pollution Bulletin 27: 9-15.
PR Newswire. (29 January 2001). Transocean Sedco Forex to close pending merger with R&B Falcon on January 31, 2001. Retrieved from http://www.highbeam.com/doc/1G1-69685498.htm
Ramseur, J. L.; Hagerty, C. L. (31 January 2013). Deepwater Horizon Oil Spill: Recent Activities and Ongoing Developments . CRS Report for Congress. Congressional Research Service. R42942.
Randolph, R.C., Hardy, J.T., Fowler, S.W., Price, A.R.G., Pearson, W.H. (1998) Toxicity and persistence of nearshore sediment contamination following the 1991 Gulf War. Environment International 24: 33-42.
Ray, G.C. (1976) Critical Marine Habitats. In: International Union for Conservation of Nature.. An international conference on marine parks and reserves. IUCN
Readman, J.W. Fowler, S.W., Villeneuve, J.-P., Cattini, C., Oregioni, B. and Mee, L.D. (1992) Oil and combustion-product contamination of the Gulf marine environment following the war. Nature 358: 662-664.
USAID/UGANDA: ENVIRONMENTAL MANAGEMENT FOR THE OIL SECTOR – TRAINING COMPENDIUM: MODULE 4 205

Reynolds, R.M. (1993) Physical oceanography of the Gulf, Strait of Hormuz, and the Gulf of Oman – Results from the Mt. Mitchell Expedition. Marine Pollution Bulletin 27: 35-59.
Robertson, Campbell; Krauss, Clifford (2 August 2010). "Gulf Spill Is the Largest of Its Kind, Scientists Say". The New York Times. Retrieved from http://www.nytimes.com/2010/08/03/us/03spill.html
Sadiq, M. and McCain, J.C. (1993) The Gulf War Aftermath, an environmental tragedy. Kluwer Academic Publishers, Boston, Massachusetts.
Saetren, T.G. (2007). Offshore Blow-out Accidents- An Analysis of Causes of Vulnerability Exposing Technological Systems to Accidents. Thesis. University of Oslo. Retrieved from https://www.duo.uio.no/bitstream/handle/10852/17849/master_saetren.pdf?sequence=1
Schindler D.W., Mills K.H., Malley D.F., Findlay S, Shearer J.A., Davies I.J., Turner M.A., Lindsey G.A., Cruikshank D.R. (1985). Long-term ecosystem stress: effects of years of experimental acidification. Canadian Journal of Fisheries and Aquatic Science 37: 342-354.
Schleifstein, M. (20 April 2012). "Spilled BP oil lingers on Louisiana coast". The Times-Picayune.
Schneyer, J. (27 September 2010). U.S. oil spill waters contain carcinogens: report. Reuters.
Schoof, Renee (17 July 2010). "Mother Nature left to mop up oily mess". The Sun News.
Sena, L. (2006). Disaster Prevention and Preparedness. Lecture notes for health science students. Ethiopia Public Health Training Initiative. Retrieved from https://www.cartercenter.org/resources/pdfs/health/ephti/library/lecture_notes/health_extension_trainees/disasterpreventionpreparedness.pdf
SERAC/CESR. (1996) Legal communication to the African Commission on Human and Peoples' Rights.Retrieved from www.cesr.orvg/downloads/nigeriapetition.pdf
Sheppard, C. and price, A. (1991) Will marine life survive the Gulf War? New Scientist 1759, 36-40.
Sheppard, C.R.C. (1993) Physical environment of the Gulf relevant to marine pollution: An overview. Marine Pollution Bulletin 27: 3-8.
Shirley, T.; Tunnell Jr., JW; Moretzsohn, F.; Brenner, J. (May 2010). "Biodiversity of the Gulf of Mexico: Applications to the Deep Horizon oil spill" (PDF) (Press release). Harte Research Institute for Gulf of Mexico Studies, Texas A&M University.
Stanislav, P. (1999). Environmental Impact of the Offshore Oil and Gas Industry. Ecomonitor Pub.
Stern M.A, Eckman J, Offermann M.K. (1994). Aplastic anemia after exposure to burning oil [letter]. NEJM 331(1): 58.
The Daily Telegraph. (3 August 2010). "BP leak the world's worst accidental oil spill." Retrieved from http://www.telegraph.co.uk/finance/newsbysector/energy/oilandgas/7924009/BP-leak-the-worlds-worst-accidental-oil-spill.html
Transocean. (no date). Fleet Specifications: Deepwater Horizon.
Uliukhifo, O. C., Onuoma, O. J., & Augustine, I. K. (2014). The Effect of Georesources Exploitation on Fishing and Farming in the Niger Delta Region of Nigeria.
UNEP (1993) Updated scientific report on the environmental effects of the conflict between Iraq and Kuwait. Governing Council of the United Nations Environment Programme, Seventeenth Session, Nairobi 10-21 May 1993.
U.S. Coast Guard. (2010). Deepwater horizon fire.
USAID/UGANDA: ENVIRONMENTAL MANAGEMENT FOR THE OIL SECTOR – TRAINING COMPENDIUM: MODULE 4 206

U.S. Energy Information Administration. (2015). Country profile Nigeria. Retrieved from http://www.connaissancedesenergies.org/sites/default/files/pdf-pt-vue/nigeria.pdf
U.S. EPA. (2015). Getting up to speed: ground water contamination. Retrieved from https://www.epa.gov/sites/production/files/2015-08/documents/mgwc-gwc1.pdf
Watkins, M.B. (2010). Oil from the Deepwater Horizon oil spill approaches the coast of Mobile, Ala.
Watt, I., Woodhouse, T. and Jones, D. (1993) Intertidal clean-up activities and natural regeneration on the Gulf coast of Saudi Arabia from 1991 to 1992 after the 1991 Gulf oil spill. Marine Pollution Bulletin 27: 325-331.
The World Bank Group. (1998). Environmental, Health, and Safety Guidelines. Petroleum Refining. Retrieved from http://www.ifc.org/wps/wcm/connect/b99a2e804886589db69ef66a6515bb18/petroref_PPAH.pdf?MOD=AJPERES
Zabarenko, D. (4 August 2010). "Nearly 3/4 of BP spill oil gone from Gulf". Reuters
USAID/UGANDA: ENVIRONMENTAL MANAGEMENT FOR THE OIL SECTOR – TRAINING COMPENDIUM: MODULE 4 207

LECTURE 4: CLIMATE CHANGE, BIODIVERSITY, ENVIRONMENTAL HEALTH, AND SYNERGIES WITH OIL AND GAS SECTOR DEVELOPMENT
SYLLABUS
Teaching Aims
(i) Provide a basic understanding of concepts related to climatic variability and existing vulnerability of natural resources and human livelihoods.
(ii) Clarify commonly misused or misunderstood terms and concepts. (iii) Highlight importance of considering climate change projections in resource management
planning, monitoring, and research design.
Learning Objectives
(i) Explain the concepts related to climate variability and the linkage to natural resource management.
(ii) Guide stakeholders in environment and natural resources to plan for and mitigate the effects of climate and climate change.
(iii) Assess the risks related to climate and climate change along the oil and gas value chain and prescribe adaptation, mitigation, and monitoring measures.
Outline of Lecture Content
Topic and Subtopic Suggested Approach, Methods and Equipment
1. Introduction
2. Trends in climatic variability and observed climate change in Uganda
Lecture, Q&A. Group Discussion: Uganda national Adaptation programs of Action
3. Climate change, biodiversity, “one health,” and potential synergies with impacts of oil and gas development
4. Climate change risks and the oil and gas industry: assessment, mitigation, adaptation, and monitoring Considerations
5. Conclusions 6. Field trip(s)
DETAILED NOTES
Climate Change and Climate Variability
Introduction
Source: IPCC, 2007
• “‘Climate change’ refers to a change in the state of the climate that can be identified (e.g., using statistical tests) by changes in the mean and/or the variability of its properties, and that persists for an extended period, typically decades or longer.
USAID/UGANDA: ENVIRONMENTAL MANAGEMENT FOR THE OIL SECTOR – TRAINING COMPENDIUM: MODULE 4 208

• Climate change may be due to internal processes and/or external forces. Some external influences, such as changes in solar radiation, the oceans’ conveyor belt, and volcanism, occur naturally and contribute to the total natural variability.
• Other external changes, such as the change in composition of the atmosphere that began with the industrial revolution, are the result of human activity.”
Natural Internal Climate Variability and External Influences
Source: IPCC, 2007
• Internal variability is present on all time scales. • Atmospheric processes that generate internal variability are known to operate on time scales
ranging from virtually instantaneous (e.g., condensation of water vapor in clouds) up to years (e.g., troposphere-stratosphere or inter-hemispheric exchange).
• Other components of the climate system, such as the oceans and the large ice sheets, tend to operate on longer time scales.
• These components produce internal variability of their own accord and integrate variability from the rapidly varying atmosphere.
• Distinguishing between the effects of external influences and internal climate variability requires careful comparison between observed changes and those that are expected to result from external forcing.
The Intergovernmental Panel on Climate Change (IPCC)
• The IPCC was established in 1988 by two United Nations Organizations, the World Meteorological Organization, and the United Nations Environment program to assess “the scientific, technical, and socioeconomic information relevant for the understanding of the risk of human-induced climate change.”
• For its first task, the IPCC was asked to prepare, based on available scientific information, a report on all aspects relevant to climate change and its impacts and to formulate realistic response strategies.
• The first assessment report of the IPCC served as the basis for negotiating the United Nations Framework Convention on Climate Change (UNFCCC).
• Since then, the IPCC has remained the most important source for the Convention’s scientific, technical, and socioeconomic information. Assessment reports were completed in 1990, 1995, 2001, 2007, 2013 & 2014:
− Its reports are policy relevant but not policy prescriptive. − The IPCC emphasizes scientific integrity, objectivity, openness, and transparency. − Reports go through a rigorous review process that involves many experts around the world,
and is open to all member governments.
USAID/UGANDA: ENVIRONMENTAL MANAGEMENT FOR THE OIL SECTOR – TRAINING COMPENDIUM: MODULE 4 209

FIGURE 4.1: OBSERVED CLIMATE CHANGE INDICATORS LISTED IN ASSESSMENT REPORT 4 (AR4) AND MAINTAINED/ANALYZED IN AR5
Source: IPCC AR5, 2013
Figure 4.1 describes the varied aspects of climate change, which are examined and addressed in the Assessment Reports.
Assessing Climate Change Impacts at the Ecosystem Level
Source: Bellard et al., 2012
• The impacts of climate change and their effects on biodiversity should also be assessed at the level of ecosystems and within the context of ecosystems and their distribution within landscapes
• They must also be assessed within the framework of changing regimes of disturbances, climate variability, and extreme events.
• Changes in behavior, reductions in abundance, or losses of species can lead to changes in the structure and functioning of affected ecosystems.
• Ecosystems dominated by long-lived species (e.g., long-lived trees, elephants) will often be slow to show evidence of change and slow to recover from climate-related stresses.
The authors of this publication stresses and recommends that climate change projections for impacts on biodiversity should be assessed at the level of ecosystems and floral and faunal populations, not only at higher levels. Projections should also include combined effects of existing and future climate variability, extreme events, and perturbations over time.
“Freshwater resources are vulnerable and have the potential to be strongly impacted by climate change, with wide-ranging consequences for human societies and ecosystems” (IPCC, 2013)
• Of all ecosystems, freshwater aquatic ecosystems appear to have the highest proportion of species threatened with extinction by climate change (IPPC, 2013b).
• Projected tropical temperatures will lead to strong thermal stratification, causing anoxia in deep layers of lakes and nutrient depletion in shallow lake waters (IPPC, 2013b).
USAID/UGANDA: ENVIRONMENTAL MANAGEMENT FOR THE OIL SECTOR – TRAINING COMPENDIUM: MODULE 4 210

• Reduced oxygen concentrations will generally reduce aquatic species diversity, especially in cases where water quality is impaired by eutrophication (IPPC, 2013b).
• Drying of streambeds and lakes for extended periods could reduce ecosystem productivity due to restriction on aquatic habitat, combined with lowered water quality via increased oxygen deficits and pollutant concentrations (IPPC, 2013b).
• Climate change in Africa will have an overall modest effect on future water scarcity relative to other drivers, such as population growth, urbanization, agricultural growth, and land use change.
FIGURE 4.2: POPULATION AND CLIMATE CHANGE HOTSPOTS IN AFRICA
Source: Mutunga et al., 2012
Trends in Climatic Variability and Observed Climate Change in Uganda
• There is strong evidence that Uganda is experiencing climate change effects. • The frequency of hot days in the country has increased significantly while that of cold days has
decreased. • The glacial recession in the Rwenzori Mountains since 1906 is attributed to higher air
temperatures and less snow accumulation during the 20th century. • The negative impacts associated with climate change are also compounded by many factors,
including widespread poverty, human diseases, and high human and cattle densities, which are estimated to double the demand for food, water, and livestock forage within the next 30 years.
• To be able to better conserve biodiversity in the future, it is imperative to understand how species and ecosystems are likely to change under varying climate change scenarios.
Social Impacts of Climate Change
Source: USAID, 2014
“Several diseases that are currently endemic in Uganda will likely increase in prevalence and distribution due to climate change. These diseases include mosquito-borne diseases such as malaria and lymphatic filariasis; soil-transmitted helminthes; trachoma; and waterborne diseases such as
USAID/UGANDA: ENVIRONMENTAL MANAGEMENT FOR THE OIL SECTOR – TRAINING COMPENDIUM: MODULE 4 211

cholera and typhoid. Other diseases that Ugandans experience in a more localized or epidemic nature include plague, trypanosomiasis (sleeping sickness), and yellow fever. There is also potential for diseases that are not yet established in Uganda (in humans) to be introduced because of climate change, such as dengue fever, chikungungya, and Rift Valley fever. Finally, climate change threatens human health through its effects on food insecurity and malnutrition.”
“Climate change has the potential to substantially affect socioeconomic development in Uganda, as increasing temperatures and precipitation changes are expected to lead to a loss of economic livelihoods resulting from reduced crop yields and increases in pest infestations and crop diseases (Tetra Tech ARD, 2013). Additionally, flooding can damage buildings (e.g., health facilities, schools), roads, bridges, sanitation facilities, and water sources, which will exacerbate socioeconomic conditions directly and indirectly (e.g., through the reduced access to services). Less vulnerable households are inherently better prepared to cope with the effects of climate change, as they have larger land holdings and more livestock, greater adoption of new technology, higher levels of education, and a greater participation in income-generating activities outside farming (Tetra Tech ARD, 2013). More advantaged households will also be better able to cope with the health effects of climate change, through greater access to disease prevention and treatment, lower risk of malnutrition, and better household and environmental conditions.”
Trends in Rainfall and Temperature in Uganda
Source: African Climate Change Resilience Alliance, 2001
• Characteristics of rainfall in Uganda in recent years:
− Erratic onsets and ends to the rainy seasons − Lower, more unreliable and unevenly distributed − Heavier and more violent
• In general, wetter areas are tending to become wetter and droughts more frequent. • The main concern is not the total amount of rain, but instead its distribution, seasonality and
intensity. • These are being followed by long droughts, which are becoming more and more frequent. • El Niño Southern Oscillation events have also been observed to be shorter and more irregular. • On land, El Niño events favor drought in many tropical and subtropical areas, while La Niña
events promote wetter conditions in many places, as has happened in recent years. • These short-term and regional variations are expected to become more extreme in a warming
climate.
USAID/UGANDA: ENVIRONMENTAL MANAGEMENT FOR THE OIL SECTOR – TRAINING COMPENDIUM: MODULE 4 212

FIGURE 4.3: DROUGHT OCCURRENCES IN UGANDA 1911-2000
Source: Government of Uganda, 2007
FIGURE 4.4: VARIATION OF RAINFALL IN THE MAIN DRAINAGE SUB-BASINS IN UGANDA 1940–2009
Source: Nsubuga et al., 2014
USAID/UGANDA: ENVIRONMENTAL MANAGEMENT FOR THE OIL SECTOR – TRAINING COMPENDIUM: MODULE 4 213
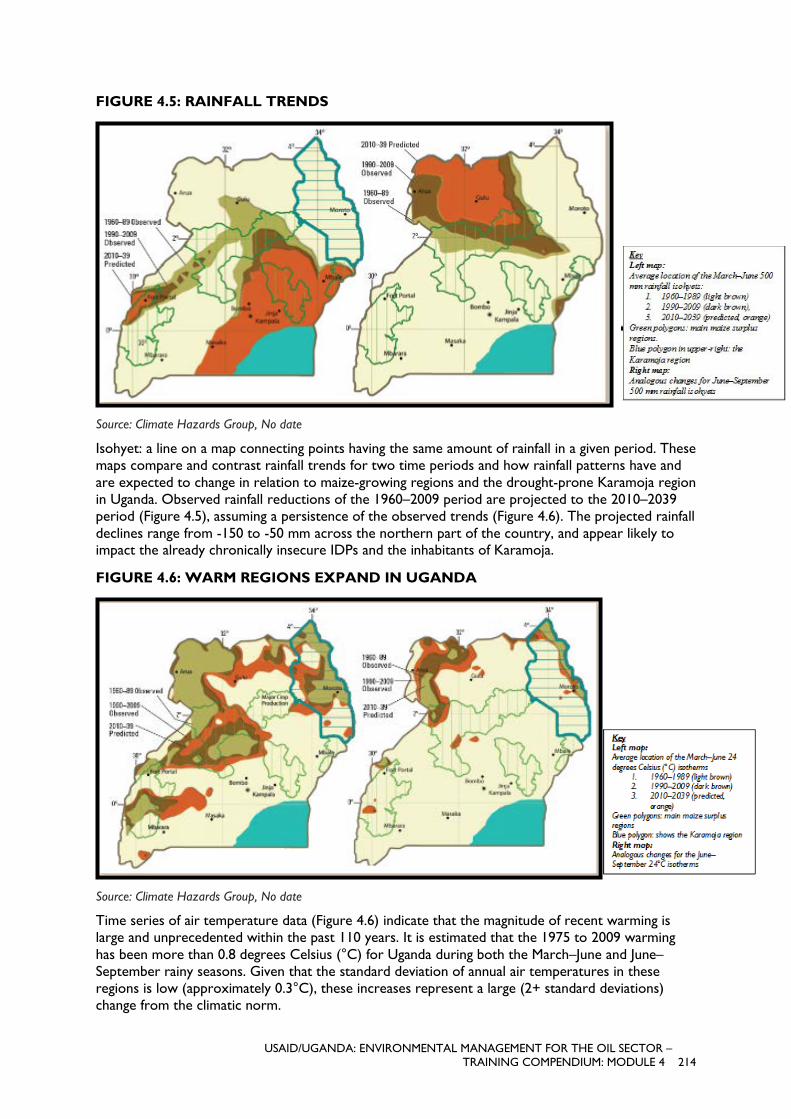
FIGURE 4.5: RAINFALL TRENDS
Source: Climate Hazards Group, No date
Isohyet: a line on a map connecting points having the same amount of rainfall in a given period. These maps compare and contrast rainfall trends for two time periods and how rainfall patterns have and are expected to change in relation to maize-growing regions and the drought-prone Karamoja region in Uganda. Observed rainfall reductions of the 1960–2009 period are projected to the 2010–2039 period (Figure 4.5), assuming a persistence of the observed trends (Figure 4.6). The projected rainfall declines range from -150 to -50 mm across the northern part of the country, and appear likely to impact the already chronically insecure IDPs and the inhabitants of Karamoja.
FIGURE 4.6: WARM REGIONS EXPAND IN UGANDA
Source: Climate Hazards Group, No date
Time series of air temperature data (Figure 4.6) indicate that the magnitude of recent warming is large and unprecedented within the past 110 years. It is estimated that the 1975 to 2009 warming has been more than 0.8 degrees Celsius (°C) for Uganda during both the March–June and June–September rainy seasons. Given that the standard deviation of annual air temperatures in these regions is low (approximately 0.3°C), these increases represent a large (2+ standard deviations) change from the climatic norm.
USAID/UGANDA: ENVIRONMENTAL MANAGEMENT FOR THE OIL SECTOR – TRAINING COMPENDIUM: MODULE 4 214

Projected Changes in Climate Across Uganda: 2015-2045
Source: Netherlands Commission for Environmental Assessment, 2015
• Rainfall: There may be an increase in precipitation during December, January, and February, which have historically been the dry season across the country.
– This increase could have a significant impact on livestock and agriculture—especially on perennial crops and post-harvest activities such as drying and storage.
– There is a potential for an increase in the frequency of extreme events (e.g., heavy rainstorms, flooding, etc.
• Temperature: The warming trend is projected to continue. Some models project an increase of more than 2⁰C by 2030.
− Temperature rise and an increase in the frequency and intensity of extreme droughts and floods can reduce crop yields and cause a loss in livestock, which will have important implications for food security.
• Extreme events: Uganda has experienced an increase in the frequency and intensity of droughts and floods in recent years.
− The percentage of rainfall coming in the form of heavy precipitation events is anticipated to increase, which would escalate the risk of disasters such as floods and landslides.
• Water resources: Water resources are likely to be increasingly strained in Uganda’s future climate.
– While it is projected that precipitation will increase in some parts of East Africa, warmer temperatures will accelerate the rate of evapo-transpiration, reducing the benefits of increased rainfall.
– With more frequent and severe droughts, countries in the region, such as Uganda, will likely experience negative impacts on water supply, biodiversity, and hydropower generation.
• Wetlands and Forests: Climate changes may also affect the health of wetland and forest ecosystems, which provide critical ecosystem and economic services for human communities.
FIGURE 4.7: RESOURCE CONFLICT: DROUGHT-AFFECTED AREAS IN THE CATTLE CORRIDOR OF UGANDA
Source: Stark, 2011
Key Yellow: Drought-affected area Yellow plus Brown: Cattle Corridor
USAID/UGANDA: ENVIRONMENTAL MANAGEMENT FOR THE OIL SECTOR – TRAINING COMPENDIUM: MODULE 4 215

Resource conflict already exists in the Cattle Corridor and it is expected to increase with population growth and corresponding increase in livestock, combined with current and future effects of climate change and natural climatic variability.
Climate Change and Biodiversity in Uganda
Source: Tetra Tech ARD, 2014
• The Albertine Rift Valley (ARV), where oil and gas development is ongoing, contains 7 of 10 national parks, more than 40 of 506 Central Forest Reserves and 8 of 12 Wildlife Reserves.
• Nine biodiverse locations in the ARV are very likely to be adversely affected by climate change:
− Budongo Forest Reserve − Murchison Falls National Park − Mt. Rwenzori National Park − Semuliki National Park − Queen Elizabeth National Park − Kibale National Park − Echuya Central Forest Reserve − Bwindi Impenetrable National Park − Mgahinga Gorilla National Park
Selection of Climate Change-Vulnerable Locations
• The identification of each of these locations considered:
− Biodiversity species richness (levels of biodiversity endemism) − Vulnerable groups represented:
• Keystone species such as the endangered mountain gorillas living in Mgahinga Gorilla National Park and Bwindi Impenetrable National Park
• Indigenous people whose livelihoods highly depend on resources from within these locations, such as Pygmies in Semuliki, Bwindi, and Mgahinga National Parks and Echuya Central Forest Reserve
− The likely effect of shifts in rainfall intensity, distribution, and reliability as well as changes in the severity and duration of dry seasons (e.g., maintained snow cover on Mt. Rwenzori and unreliable precipitation in savanna grasslands and wetlands).
− Areas in which non-climate stressors (e.g., oil exploration and production in Albertine Rift ecosystems and expansion of agricultural production into protected areas) are already putting pressure on biodiversity and ecosystems or are likely to do so in the future.
• For example, agricultural expansion into forested areas is leading to forest fragmentation and disruption of biodiversity corridors (e.g., between Kasyoha-Kitomi and Maramagambo Central Forest Reserves along the escarpment of the Albertine Rift). This trend is reducing species capacity to migrate in response to climate change.
Effects of Climate Change on Uganda’s Biodiversity and Ecosystem Services
Source: Tetra Tech ARD, 2014
• Continued increase in temperatures may affect the hydrological cycle of forested water catchments through weakened water recharge or retention capacity:
– Snow cover on Mt. Rwenzori decreased by 40 percent from 1995-2011 due to an increase in temperatures, causing reduced year-round water flow in the rivers and streams draining from the mountain.
USAID/UGANDA: ENVIRONMENTAL MANAGEMENT FOR THE OIL SECTOR – TRAINING COMPENDIUM: MODULE 4 216

– These conditions will affect biodiversity (e.g., aquatic biodiversity) and human activities that depend on water in the Rwenzori hydrological system, both upstream (e.g., hydropower generation) and downstream (e.g., fisheries, livestock, and water-based tourism activities).
– Mt. Rwenzori also has a climate-driven altitudinal zonation of montane forest that is highly sensitive to temperature and precipitation.
Projected Increases in Temperatures will Continue to Trigger Changes in Flora and Fauna
Source: Tetra Tech ARD, 2014
• Afro-alpine vegetation:
− Vegetation zones will shift progressively to higher cooler altitudes. − This shift will result in a decline in size of afro-alpine vegetation zones and would inevitably
stress associated flora and fauna. − The upward shift in Afro-alpine vegetation zones is likely to take place in most altitudes of
more than 2,500 m above sea level.
• Forest ecosystems:
− Tend to exhibit lower sensitivity to increasing temperatures in comparison to grassland and aquatic ecosystems.
− This tendency is attributed to their high species biodiversity and the complex relationships of species within the forest physical environment.
• Aquatic ecosystems and species:
− Tend to be very sensitive to the effects of decreasing water flow and quality, which can have severe and immediate impacts on aquatic species biodiversity.
Non-Climate Stressors on Biodiversity in Uganda
• Uganda’s biodiversity and its productivity are being adversely affected by:
− Economic development such as infrastructure (e.g., road infrastructure development) − Economic policy strategies (e.g., dependence on natural resources for economic growth) − Extractive industries in biodiversity-rich areas (e.g., mining, oil/gas exploration in the
Albertine Rift) − Commercial and subsistence agricultural expansion into protected areas; and − A rapidly growing human population and resultant growth in demand for ecosystem goods
and services
• These non-climate stressors interact with climate change to affect biodiversity and ecosystem goods and services in complex ways.
Intensification of Current Effects of Climate Change in Uganda
Source: Tetra Tech ARD, 2014
• Shifting flora and fauna are likely to lead to decreased availability of ecosystem resources that provide livelihoods for people: (e.g., changes in bamboo abundance in Echuya Forest).
• Increases in temperature will create ecological conditions that favor colonization by invasive species: (E.g., Lantana camarais — an invasive species that displaces pastures in grassland wildlife areas and is resilient to dry conditions, is highly likely to expand its range under future climate scenarios; it is already a significant problem in Queen Elizabeth National Park.
• Increases in temperature will create conditions that trigger human-wildlife conflicts:
− Extreme dry or wet conditions may trigger wildlife migration outside home ranges or increase entry of people and livestock into protected areas.
USAID/UGANDA: ENVIRONMENTAL MANAGEMENT FOR THE OIL SECTOR – TRAINING COMPENDIUM: MODULE 4 217

− Forests: Human/wildlife conflicts tend to increase during the dry season around Bwindi and Mgahinga National Parks, because the Mountain Gorillas extend their foraging range outside these protected areas.
− Savanna grasslands (e.g., Queen Elizabeth and Murchison Falls National Parks), human/wildlife conflicts increase during the dry season due to the migration of cattle into the parks in search of water and pasture.
Climate Change, Biodiversity, “One Health,” and Potential Synergies with Impacts of Oil and Gas Development
Source: IPCC, 2007
• ‘Climate change’ refers to a change in the state of the climate that can be identified (e.g., using statistical tests) by changes in the mean and/or the variability of its properties, and that persists for an extended period, typically decades or longer.
• Climate change may be due to internal processes and/or external forcings. Some external influences, such as changes in solar radiation, the oceans’ conveyor belt, and volcanism, occur naturally and contribute to the total natural variability.
• Other external changes, such as the change in composition of the atmosphere that began with the industrial revolution, are the result of human activity.
Natural Internal Climate Variability and External Influences
Source: IPCC, 2007
• Internal variability is present on all time scales. • Atmospheric processes that generate internal variability are known to operate on time scales
ranging from virtually instantaneous (e.g., condensation of water vapor in clouds) up to years (e.g., troposphere-stratosphere or inter-hemispheric exchange).
• Other components of the climate system, such as the oceans and the large ice sheets, tend to operate on longer time scales.
• These components produce internal variability of their own accord and integrate variability from the rapidly varying atmosphere.
• Distinguishing between the effects of external influences and internal climate variability requires careful comparison between observed changes and those that are expected to result from external forcing.
Human activities such as burning fossil fuels increase concentrations of “greenhouse gases.” Other contributors include deforestation, livestock, and burning biomass.
USAID/UGANDA: ENVIRONMENTAL MANAGEMENT FOR THE OIL SECTOR – TRAINING COMPENDIUM: MODULE 4 218

FIGURE 4.8: INCREASE IN GREENHOUSE GAS (GHG) CONCENTRATIONS IN THE ATMOSPHERE OVER THE LAST 2,000 YEARS
Source: U.S. EPA, 2017
Greenhouse gases in the atmosphere, including water vapor, carbon dioxide, methane, and nitrous oxide, absorb heat energy and emit it in all directions (including downwards), keeping Earth’s surface and lower atmosphere warm.
Risks and Potential for Adaptation
Source: IPCC, 2013
• Terrestrial and freshwater species face increased risks under projected climate change during and beyond the 21st century, especially as climate change interacts with other stressors, such as habitat modification, over-exploitation, pollution, and invasive species.
• Some species will adapt to new climates. Those that cannot adapt sufficiently fast will decrease in abundance or go extinct in part or all of their ranges.
• Carbon stored in the terrestrial biosphere is susceptible to loss to the atmosphere as a result of climate change, deforestation, and ecosystem degradation.
• Management actions, such as maintenance of genetic diversity, assisted species migration and dispersal, and reduction of other stressors, can reduce, but not eliminate, risks of impacts to due to climate change, as well as increase the inherent capacity of ecosystems and their species to adapt to a changing climate.
USAID/UGANDA: ENVIRONMENTAL MANAGEMENT FOR THE OIL SECTOR – TRAINING COMPENDIUM: MODULE 4 219

FIGURE 4.9: AFRICA’S PROJECTED POPULATION GROWTH, 2010-2050
Source: Mutunga et al., 2012
Population growth is occurring more rapidly in Africa. A large share of Africa’s human populations lives in areas more susceptible to climate variation and extreme weather events.
FIGURE 4.10: RAINFALL AND AIR TEMPERATURE TIME SERIES FOR CROP GROWING REGIONS IN UGANDA
Source: ACCRA, 2011
Temperatures have increased by up to 1.5°C across much of Uganda with typical rates of warming around 0.2°C per decade. This transition to an even warmer climate is likely to amplify the impact of decreasing rainfall and periodic droughts, and will likely reduce crop harvests and pasture availability. Because this area is characterized by repeated conflicts that reduce the overall availability of food, a
USAID/UGANDA: ENVIRONMENTAL MANAGEMENT FOR THE OIL SECTOR – TRAINING COMPENDIUM: MODULE 4 220

decrease in locally produced food because of reduced crop harvests and pastures will have a significant impact on food security.
Key Climate Change Facts
Source: Tetra Tech ARD, 2013
• Changes in sea surface temperatures in the distant tropical Pacific, Indian and, to a lesser extent, Atlantic Oceans strongly influence annual rainfall amounts and timing in Uganda.
• Year-to-year variations in annual rainfall can be considerable. • In comparison of records from 16 different climatic zones over two 30-year periods spanning
1951 to 2010, the data overall indicate no clear changes in rainfall in Uganda. • During these periods, there were modest decreases in rainfall in the northern districts of Gulu,
Kitgum, and Kotido as well as Kasese in the west. • Analyses did identify a statistically significant increase in temperature between the two 30-year
periods, ranging from 0.5-1.2⁰C across the country. • The magnitude of observed warming, especially since the early 1980s is large and unprecedented
within the past 110 years, representing a large change from the climate norm.
Other Climate Change Effects: Floods, Fires, Pests and Diseases
Source: Tetra Tech ARD, 2014
• Increasing frequency of severe floods due to high rainfall intensity is likely to cause social and economic hardship.
• An increased temperature renders natural ecosystems vulnerable to disasters such as forest fires and more susceptible to pest and disease outbreaks:
− Increasing temperatures could lead to dryer conditions and more frequent and destructive fire outbreaks.
− Due to continued high inter-annual variability, warmer temperatures combined with erratic precipitation substantially increase the likelihood of diseases and pests.
− Both multiply more quickly under warmer conditions and are able to migrate to higher altitudes where their presence was previously unknown.
FIGURE 4.11: IMPLICATIONS OF CLIMATE CHANGE PREDICTIONS FOR ENVIRONMENTAL, WILDLIFE, LIVESTOCK AND HUMAN HEALTH
Source: Millennium Ecosystem Assessment, 2005
This shows that human pressure on the environment is already causing impacts to biodiversity, which in turn has multiple impacts on human, animal, and environmental health, impairing the capacity of ecosystems to mediate a variety of impacts and function normally.
USAID/UGANDA: ENVIRONMENTAL MANAGEMENT FOR THE OIL SECTOR – TRAINING COMPENDIUM: MODULE 4 221

Vulnerability and potential impacts of climate change on human health (Source: UNECA, 2011)
• It is challenging to associate climate warming with disease prevalence or severity due to the difficulty in separating directional climate change from short-term natural variation.
• Studies on human, crop, and forest pathogens, for which long-term data exist, have shown sensitivity of some pathogens and vectors to climate factors.
• Potential fundamental impacts on health include the following:
− Extreme air temperatures and air pollution are hazardous to health − Floods, droughts and contaminated water raise disease risk − Climatic effects on agriculture threaten increasing malnutrition − A more extreme and variable climate can destroy communities and lives − Climate change brings new challenges to control of infectious diseases − Increase in vector-borne diseases (malaria, schistosomiasis, and tick-, water- and food-borne
diseases [e.g., diarrheal diseases]) − Not all effects of climate change will be harmful, but damage to health is
projected to outweigh the benefits.
Potential Threats to Agriculture
Source: UNECA, 2011
• In Uganda, agriculture accounts for more than 66 percent of employment, and more than 80 percent of the population resides in the rural areas.
• Major impacts of climate change on food production will come from changes in rainfall, temperature, moisture levels, ultraviolet (UV) radiation, CO2 levels, and pests and diseases.
• Extreme rainfall and subsequent heavy flooding damage will also have serious effects on agriculture including the erosion of topsoil, inundation of previously arid soils, and leaching nutrients from the soil.
• Threats to food security can then lead to widespread migration of human settlements in order to seek better agricultural land, more available water resources, and escape increased exposure to malaria and other diseases.
Climate Change Impacts on Livestock and Wildlife Disease
• Climate warming has altered and will alter disease severity or prevalence in humans and animals. • Rising temperatures will affect vector distribution, parasite development, and transmission rates
resulting in altered abundance and geographic range shifts. • Diseases of livestock, particularly Foot and Mouth Disease, Peste de Petits Ruminants, African
Swine Fever, and Blue-Tongue Virus, have expanded their spatial domains. • Disease outbreaks in wildlife are expected to increase. • Are these expansions due primarily to climate change, other anthropogenic influences such as
migration, trade, land use, habitat alteration, pollution, or drug resistant pathogen strains, or combined factors?
Disease Case Study: Anthrax
Source: World Health Organization, 2008
• Caused by the bacterium Bacillus anthracis, which belongs to a group of bacteria that have the capability of forming spores that enable the microorganism to survive adverse environmental conditions.
• Specific areas known to favor survival of anthrax bacterium spores in the soil and are thus subject to periodic outbreaks.
• Alkaline soils are more favorable to spore survival. Anthrax spores multiply when soil conditions, such as temperature, moisture, and nutrition, are favorable.
USAID/UGANDA: ENVIRONMENTAL MANAGEMENT FOR THE OIL SECTOR – TRAINING COMPENDIUM: MODULE 4 222

• Outbreaks tend to occur in association with particular climatic and weather events (e.g., heavy rainfall, flooding, and drought).
• In anthrax-prone areas, the close grazing of animals on fresh shoots of grass after rainfall often leads to outbreaks due to ingestion of organisms picked from contaminated soils.
Anthrax-affected Animals and Other Modes of Transmission
Source: World Health Organization, 2008
• Animals affected by anthrax:
− Domestic animals: cattle, sheep, goats, horses, donkeys, pigs, and dogs − Wild ruminants: antelopes, gazelles, and impalas − Wild carnivores: lions, hyenas, and jackals − Other wild mammals: elephants, hippopotami, chimpanzees
• Birds seem to be resistant to anthrax. • During severe outbreaks, biting flies may sporadically transmit anthrax among animals. • Non-biting blowflies may contaminate vegetation by depositing vomit droplets after feeding on
infected carcasses. • Humans: skin lesions through contact with infected blood/tissues, fatal form from inhalation of
spores, intestinal form from poorly cooked contaminated meat.
Case Study: Environment, Climate Change, and Disease: Questionnaire Survey of Pastoralists in Kenya
Source: Moenga et al., 2013
• Pastoralists in the Eastern Rift Valley described marked climate changes, which led to changes in their way of life and negative impacts on their livelihoods.
• They noted distinct associations between disease occurrence and climate change and variability pertaining to humidity, wind speed and direction and temperature (e.g., anthrax associated with high mortality and occurrence in the dry season).
• They recognized that climate change affects the incidence of livestock diseases transmitted by direct contact due to changes in the frequency and duration of animal contacts.
• Pastoralists aware that many infections, especially those transmitted by arthropod vectors and helminths, are known to occur under wet conditions and are influenced by climate change.
USAID/UGANDA: ENVIRONMENTAL MANAGEMENT FOR THE OIL SECTOR – TRAINING COMPENDIUM: MODULE 4 223

FIGURE 4.12: CLIMATE CHANGE AND INCIDENCE OF DISEASES IN CATTLE, KENYA
Source: Moenga et al., 2013
• Pastoralists felt that there was less rainfall in recent past years although the climatic data showed non-significant variations in the amount received during the same period (2001-2008) (Note: similar conditions reported for Uganda).
• Reported that migration is practiced by a large proportion in response to drought and disease outbreaks.
• Livestock movement control/quarantine are unpopular methods for disease control--considered punitive, but they consider these methods to be effective in disease transmission prevention.
• Agreed that most effective control measure is vaccination. • Major conclusions of study:
− Livestock densities, trade and movement, land use, farming practices and intensity, and habitat changes combine with increasing climate variability to affect disease incidence.
− Pastoralists continue to depend on an environment that may no longer support them.
Climate Change Risks and the Oil and Gas Industry: Assessment, Mitigation, Adaptation, and Monitoring Considerations
Revised IFC Performance Standards (2012) address climate risk and adaptation
• The International Finance Corporation now requires that development projects address climate change risks and the potential for adaptation.
• Performance Standard 1: Assessment and Management of Environmental and Social Risks and Impacts:
“The client will establish and maintain a process for identifying the environmental and social risks and impacts of the project ”...including... “relevant risks associated with a changing climate and the adaptation opportunities.”
• No infrastructure-oriented industry is immune to climate change vulnerabilities of and impacts on other industries and infrastructures.
USAID/UGANDA: ENVIRONMENTAL MANAGEMENT FOR THE OIL SECTOR – TRAINING COMPENDIUM: MODULE 4 224

FIGURE 4.13: IDENTIFIED CLIMATE CHANGE IMPACTS DURING EXPLORATION AND PRODUCTION PHASES
SOURCE: DELL, 2013
Loss of Surface Water Access
• Physical Impacts: Seasonal precipitation shifts, precipitation decreases, variability due to intense events
• Risk to Operations: Insufficient or variable supply and quality, increased costs (treatment and transport)
• Design Modifications: Low/no water operations, recycling, additional storage capacity • Adaptation assessments must be performed at site level to identify design and operational
actions.
Adaptation is an essential ingredient both in assessment of climate impacts and in development of adaptation policies
Source: Smit et al., 2000
• Mitigation and adaptation are driven by the same problematic. Some adaptations may have implications for mitigations (e.g., energy use).
• Adaptation to climate stimuli includes adaptive responses to extremes, year-to-year variability, changes to long-term mean conditions, and as they relate to each other.
• The sensitivity and vulnerability of social, ecological, and economic systems and their adaptations are not just to climate, nor do these systems occur in discrete states.
• Systems evolve in response to stimuli of all kinds and recognition of this milieu is important for analyses of adaptation.
USAID/UGANDA: ENVIRONMENTAL MANAGEMENT FOR THE OIL SECTOR – TRAINING COMPENDIUM: MODULE 4 225

FIGURE 4.14: GROSS ANATOMY OF ADAPTATION TO CLIMATE CHANGE AND VARIABILITY
Source: Smit et al., 2001
FIGURE 4.15: TERMS TO DESCRIBE CHARACTERISTICS OF SYSTEMS PERTINENT TO CLIMATE CHANGE
Source: Smit et al,. 2001
USAID/UGANDA: ENVIRONMENTAL MANAGEMENT FOR THE OIL SECTOR – TRAINING COMPENDIUM: MODULE 4 226

Vulnerability to Climate Change
The “degree to which a system is susceptible to, or unable to cope with, adverse effects of climate change, including climate variability and extremes.” (IPCC, 2013)
Vulnerability is a central concept to adaptation. Vulnerability to climate change is the “degree to which a system is susceptible to, or unable to cope with, adverse effects of climate change, including climate variability and extremes” (IPCC 2001). Vulnerability is a function of exposure, sensitivity, and adaptive capacity. High exposure or sensitivity and low adaptive capacity causes high vulnerability.
Adaptation and mitigation differ in terms of spatial scales:
• Even though climate change is an international issue, adaptation benefits are local and mitigation benefits are global.
• Adaptation and mitigation also differ in terms of temporal scales and concerned economic sectors (Source: CIFOR, 2011).
The risk of climate-related impacts results from interactions of climate-related hazards (including hazardous events and trends) with the vulnerability and exposure of human and natural systems
FIGURE 4.16: RELATIONSHIP BETWEEN CLIMATE IMPACTS AND SOCIOECONOMIC PROCESSES
Source: IPCC, 2013
Changes in both the climate system (left) and socioeconomic processes including adaptation and mitigation (right) are drivers of hazards, exposure, and vulnerability. Changes in both vulnerability and exposure and changes in weather and extreme climate events can contribute and combine to create disaster risk, hence the need for both disaster risk management and climate change adaptation within development processes.
USAID/UGANDA: ENVIRONMENTAL MANAGEMENT FOR THE OIL SECTOR – TRAINING COMPENDIUM: MODULE 4 227

FIGURE 4.17: KEY RISKS FROM CLIMATE CHANGE AND THE POTENTIAL FOR REDUCING RISKS THROUGH ADAPTATION AND MITIGATION
Source: IPCC, 2013
Each key risk is characterized as very low to very high for three timeframes: the present, near term here, assessed over 2030–2040), and longer term (here, assessed over 2080–2100). In the near term, projected levels of global mean temperature increase do not diverge substantially for different emission scenarios. For the longer term, risk levels are presented for two scenarios of global mean temperature increase (2°C and 4°C above preindustrial levels). These scenarios illustrate the potential for mitigation and adaptation to reduce the risks related to climate change. Climate-related drivers of impacts are indicated by icons.
Case Study: Ecosystem-Based Planning for Climate Change in South Africa
Source: WRI, 2011
• South Africa is likely to face temperature rises of 1-3 degrees C, more droughts, floods, and wildfires, and decreased river flows.
• Incorporated biodiversity and climate change information into land use and development planning.
• Created a national strategy for expanding protected areas to conserve biodiversity and promote resilience of ecosystems.
• Conservation planners determine minimum range requirements for threatened animal species which form the basis for systematic biodiversity plans.
• Plans highlight areas of conservation priority and others of less conservation interest that could be developed more safely.
• Habitat corridors are identified to allow plant and animal movement in response to climate change and to allow human communities to adapt (e.g., vegetation along river banks).
• Biodiversity plans are based on the needs of habitats and ecological processes rather than individual species.
USAID/UGANDA: ENVIRONMENTAL MANAGEMENT FOR THE OIL SECTOR – TRAINING COMPENDIUM: MODULE 4 228

Uganda National Policies and Programs that Address Climate Change Impacts
Source: Tetra Tech ARD, 2014
• Climate Change Policy Coordination: The Climate Change Policy provides policy-level guidance, coordination and integration of climate change policy initiatives programs into national and sectoral plans, strategies, and actions.
• Institutional Strengthening: The Climate Change Policy (approved in 2014) focuses on strengthening institutional frameworks for management and coordination of climate change issues at both the national and district levels and across all sectors in partnership with non-state institutions such as nongovernmental organizations and civil society organizations.
• Mainstreaming Climate Change in Macroeconomic and Sectoral Development Plans: The Uganda Vision 2040 and National Development Plan (2009-2014) prioritize:
− Restoration of and adding value to ecosystems (wetlands, forests, rangelands, and catchments)
− Ensuring environmental sustainability − Mainstreaming issues of climate change into macroeconomic and sectoral development plans
• National REDD+ Process: The Ministry of Water and Environment is coordinating the preparation of the Uganda REDD+ Strategy using formulated guidelines for REDD+ demonstration plots, including within gazetted forest lands.
Uganda’s National Adaptation Plan of Action (NAPA) 2007
• NAPA identifies the following prioritized areas:
− Community Tree Growing Project − Land Degradation Management Project − Strengthening Meteorological Services − Community Water and Sanitation Project − Water for Production Project − Drought Adaptation Project − Vectors, Pests, and Disease Control Project − Indigenous Knowledge and Natural Resource Management − Climate Change and Development Planning Project
USAID/UGANDA: ENVIRONMENTAL MANAGEMENT FOR THE OIL SECTOR – TRAINING COMPENDIUM: MODULE 4 229

Conclusions
FIGURE 4.19: MONITORING FOR IMPACTS OF OIL AND GAS AND INFRASTRUCTURE DEVELOPMENT SHOULD INCORPORATE CLIMATE-RELATED RISKS AND IMPACTS
Source: Smit et al., 2001
This graphic presents an example of the hierarchy of analyses to be performed to address impacts at all levels: Which system may be affected and which attribute(s) of the system? What are the potential or known hazards? What is the temporal aspect or timeframe?
Reduce Overall Project Impacts Through Mitigation and Address Climate-Related Impacts Source: Kozlowski 2012
• Develop mitigation and monitoring measures. • Coordinate with environmental resource agencies. • Require implementation of measures and reporting of outcomes. • Assess effectiveness of measures. • Analyze reported data and test scientifically. • Adjust measures based on analysis of effectiveness. • Incorporate climate-related impacts in monitoring program. • Monitoring may lead to reassessment of mitigation measures and readjustment.
Adaptive Management
• Monitoring within mitigation measures and through related research may lead to reassessment of mitigation and adjustments.
REFERENCES
Africa Climate Change Resilience Alliance. (2011). The national picture: climate trends in Uganda. Retrieved from http://community.accraconsortium.org/.5a3ed4ef/Climate_trends_in_Uganda.pdf
Bellard, C., Bertelsmeier, C., Leadley, P., Thuiller, W., & Courchamp, F. (2012). Impacts of climate change on the future of biodiversity. Ecology letters, 15(4), 365-377.
Climate Hazards Group. (No date). Gallery: Uganda. University of California-Santa Barbara. Retrieved from http://chg.geog.ucsb.edu/gallery/uganda/index.html
USAID/UGANDA: ENVIRONMENTAL MANAGEMENT FOR THE OIL SECTOR – TRAINING COMPENDIUM: MODULE 4 230

Dell, J. (2013). Petroleum Industry: Adaptation to Projected Impacts of Climate Change. Presentation IEA Workshop. https://www.iea.org/media/workshops/2013/egrdutrecht/6.Dell.pdf
Friis-Hansen, E., Bashaasha, B., & Aben, C. (2013). Decentralization and implementation of climate change policy in Uganda (No. 2013: 17). DIIS Working Paper.
IPCC (2007). Climate change 2007: The physical science basis. Agenda, 6(07), 333.
IPCC (2013). The physical science basis. Contribution of working group I to the fifth assessment report of the intergovernmental panel on climate change.
Moenga, B. O., Muchemi, G. M., Kang’ethe, E. K., Kimenju, J. W., Mutiga, E. R., & Matete, G. O. (2013). The impact of climate change on the incidence of cattle diseases in a pastoral area of Kenya. Livest. Res. Rural Dev, 25(4).
Mutunga, C., Zulu, E., & De Souza, R. M. (2012). Population dynamics, climate change, and sustainable development in Africa. Population Action International.
Netherlands Commission for Environmental Assessment. (2015). Climate change profile: Uganda. Retrieved from https://ees.kuleuven.be/klimos/toolkit/documents/686_CC_uganda.pdf
Nsubuga, F. W., Botai, O. J., Olwoch, J. M., Rautenbach, C. D., Bevis, Y., & Adetunji, A. O. (2014). The nature of rainfall in the main drainage sub-basins of Uganda. Hydrological Sciences Journal, 59(2), 278-299.
Smit, B., Burton, I., Klein, R. J., & Wandel, J. (2000). An anatomy of adaptation to climate change and variability. Climatic change, 45(1), 223-251.
Stark, J. (2011). Climate change and conflict in Uganda: The cattle corridor and Karamoja: USAID Office of Conflict Management and Mitigation (No. 3). Discussion paper.
Tetra Tech ARD. (2013). Uganda climate change vulnerability assessment report (pp. 1–78). United States Agency for International Development.
Tetra Tech ARD. (2014). An overview of climate change and health in Uganda. United States Agency for International Development.
U.S. EPA. (2017). Causes of Climate Change. Retrieved from https://19january2017snapshot.epa.gov/climate-change-science/causes-climate-change_.html
WHO. (2008). Anthrax in humans and animals. Fourth Edition. WHO Library Cataloguing-in-Publication Data.
USAID/UGANDA: ENVIRONMENTAL MANAGEMENT FOR THE OIL SECTOR – TRAINING COMPENDIUM: MODULE 4 231

LECTURE 5: ENVIRONMENTAL AND SOCIAL IMPACT ASSESSMENT
SYLLABUS
Teaching Aims
(i) Introduce students to the concepts and practices of environment and social impact assessments (ESIAs).
(ii) Within their professional mandates, provide useful comments on ESIA reports regarding oil and gas and its interface with environment and biodiversity.
(iii) Provide skills that are necessary to carry out a good ESIA for a medium scale project. (iv) Guide students in the use of the right SOPs for monitoring the environment and social impacts
of oil and gas activities on the environment and biodiversity.
Learning Outcomes
(i) Articulate the concepts and practices of ESIAs. (ii) Explain the importance of monitoring environmental a socioeconomic impacts of oil and gas
activities. (iii) Correctly use the right SOPs to assess and monitor the impacts of oil and gas activities within
the resource management mandate of the trainees. (iv) Prepare realistic action plans necessary to implement the recommendations arising out of
monitoring the impacts.
Outline of Lecture Content
Topic and Subtopic Suggested Approach, Method and Equipment
1. Introduction Lecture/formal presentation, brain storming, Q&A, group discussions, demonstrations, case studies, individual practical exercise
A list of different development proposals will be issued to trainees, and using the lessons learned in Session 1, trainees will be required to (i) identify which projects require ESIAs and which ones do not as per the EIA Regulations, as well as (ii) the different levels of assessment required for each project, and provide reasons for their decision.
2. The environmental and social impact assessment process
Lecture/formal presentation, brain storming, case studies, discussions, group work, question and answer, field work, report writing, PowerPoint presentation by trainees
Trainees will be provided with a development proposal for an oil and gas activities to be undertaken at an identified field location. They will then be asked to, based on the specific activities to be implemented to conduct an ESIA (e.g., identify the specialist studies to be undertaken, the potential impacts and mitigation measures, the stakeholders to be consulted, the management and monitoring requirements, etc.), and to document the
USAID/UGANDA: ENVIRONMENTAL MANAGEMENT FOR THE OIL SECTOR – TRAINING COMPENDIUM: MODULE 4 232

Topic and Subtopic Suggested Approach, Method and Equipment
process they followed, which will be presented in a written Group document, with accompanying power point presentation of their ESIA findings.
3. The ESIA process in Uganda 4. Assessment and monitoring of
socioeconomic impacts
5. Managing and monitoring the oil and gas socioeconomic impacts
6. Case studies
DETAILED NOTES
Introduction
According to the International Association for Impact Assessment (1995), ESIA is the process of identifying, predicting, evaluating and mitigating the biological, physical, social, and other relevant effects of project proposals prior to major decisions being taken, and commitments made. During ESIAs, a broad definition of environment is adopted:
• Biological environment (e.g., flora and fauna) • Physical environment (e.g., climate and air quality, noise, soils, geology, geomorphology,
hydrology) • Social environment (e.g., demographic characteristics, economic profile, health status
infrastructure (health, water and sanitation and education services etc.), land tenure and settlement types, resources and livelihoods, cultural heritage and archeology)
Note: The terms ESIA and EIA are often used interchangeably although it is important to note that an ESIA makes explicit reference to the social aspects of the assessment. In Uganda, the regulation and guidelines that guides the ESIA process are referred to as the EIA Regulation and EIA Guidelines respectively. Accordingly, for the purposes of this training, the term ESIA is used when discussing the ESIA process, but the term EIA is used when referencing the EIA Regulation, or when quoting from a source.
Goals and Purpose of ESIA
• Protect the environment by providing information for decision-making on the environmental consequences of proposed actions.
• Identify obstacles that the project may encounter. • Guide rather than impede the project9. • Ensure projects are sustainable and environmentally acceptable by predicting environmental
consequences, mitigating adverse impacts and, integrating these considerations into the earliest stages of project planning.
• Provide for the involvement of the public and authorities. • Assess changes to the environment that arise from projects (e.g., focus on areas of conflict
between the project and the environment).
Objectives of an ESIA
For sustainable development, the “burden” of assessing environmental impacts is necessary.
ESIAs have become of ever increasing importance, as a tool for development decision-making. This role is formally recognized in Principle 17 of the Rio Declaration on Environment and Development
9 For example, through the use of project alternatives.
USAID/UGANDA: ENVIRONMENTAL MANAGEMENT FOR THE OIL SECTOR – TRAINING COMPENDIUM: MODULE 4 233

which states that, “environmental impact assessment, as a national instrument, shall be undertaken for proposed activities that are likely to have a significant adverse impact on the environment and are subject to a decision of a competent national authority” (United Nations, 1992). In practice, ESIA is applied primarily to prevent or minimize the adverse effects of major project proposals, including oil and gas projects.
The aims and objectives of ESIA can be subdivided into two categories: short-term/immediate, and long-term/ultimate.
The short-term/immediate aim of ESIA is to inform the process of decision-making, by identifying the potentially significant environmental and social impacts of project proposals, whereas, the long-term/ultimate aim of ESIA is to, promote sustainable development by ensuring that project proposals do not undermine critical resource and ecological functions, or the wellbeing, lifestyle and livelihoods of the communities and people who depend on them. The objectives associated with each of these aims are listed in Table 5.1 below.
TABLE 5.1: OBJECTIVES OF ESIA
Short-Term/Immediate Objectives Long-Term/Ultimate Objectives Improve the environmental design of project proposals
Protect human health and safety
Ensure that resources are used appropriately and efficiently
Avoid irreversible changes and serious damage to the environment
Identify appropriate measures for mitigating the potential impacts of project proposals
Protect the productivity and capacity of natural systems and the ecological processes which maintain their functions
Facilitate informed decision- making including, setting the environmental and social terms and conditions for implementing project proposals
Safeguard valued resources, natural areas, and ecosystem components
Enhance the social aspects of project proposals
Functions/ Importance of ESIA
The primary function of an ESIA is to avail both the developer and authorities, such as National Environment Management Authority (NEMA) and the town planners, the opportunity to choose projects with the full knowledge of their impact on the environment. It also enables the relevant authorities to decide whether to allow the project to proceed or not. This will save the developer time and costs that would have been incurred and enables him/her to develop plans and policies for mitigation such impacts.
ESIA enables developers and decision-makers to predict and assess the potential impacts of the project on the well-being of the natural environment and helps them identify alternatives through recommending the implementation of appropriate modifications/actions that integrate economic, social, and environmental concerns.
ESIA is designed to enable the environmental effects of a project to be weighed on a common gauge with economic costs and benefits.
It is a legal requirement for any project that is likely to have undesirable effects on the environment to carry out an ESIA. Hence, any developer found to disregard the law will have legal action taken against him or her.
Legal Basis for ESIA in Uganda
ESIA practice was legislated in Uganda for the first time in the 1995 National Environment Statute, now the National Environment Act (NEA, Cap 153 of 1995). This Act was passed in parliament and was assented to by the president in May 1995. Although ESIAs were required from 1995 onward (the Third Schedule of this Law required compulsory ESIA for activities that are out of character
USAID/UGANDA: ENVIRONMENTAL MANAGEMENT FOR THE OIL SECTOR – TRAINING COMPENDIUM: MODULE 4 234

with their surroundings), the Act was not fully implemented until 1998 when the Regulations for ESIA were passed on 1 May, 1998 (EIA Regulations of 1998). These regulations, discussed further below, were prepared in fulfillment of Section 107 (Power to Make Regulations) of the NEA, Cap 153 of 1995 which states that, “the Minister may, on the recommendation of any Minister, the policy committee or the board, make regulations prescribing all matters that are required or permitted by this Act to be prescribed or are necessary or convenient to be prescribed, for giving full effect to the provision of this Act” (Government of Uganda, 1995). The EIA Regulations of 1998 therefore among other requirements, detail the ESIA process and the roles of various stakeholders in the ESIA process.
In addition to the NEMA Cap 153 of 1995 and the EIA Regulations of 1998, on 7 November 2003, the National Environment (Conduct and Certification of Environmental Practitioners) Regulations were enacted to provide a code of conduct for ESIA practice and a system of ESIA experts’ certification. This is further discussed below.
The National Environment Act, Cap 153 of 1995
The following Sections of the NEA, Cap 153 of 1995 are particularly relevant to forming the basis for ESIAs in Uganda:
• Section 2, Part II: Contains principles of environment management (see Annex A) which are important for the oil and gas sector.
• Section 3: Entitles every person to the right to a healthy environment and a duty to maintain and enhance the environment.
• Section 19 (1) (a): Provides for ESIA for any activity out of character with its surroundings. These activities are specified in the Third Schedule of the NEA, Cap 153 of 1995 which provides for projects to be considered for ESIA—including, all activities of exploration for the production of petroleum in any form and the development of associated infrastructure (Annex B).
The National Environmental Impact Assessment Regulations of 1998
The National EIA Regulations of 1 May, 1998 were gazetted in terms of Section 107 of the National Environmental Act, Cap 153 of 1995.
The regulations deal with (among other things): the preparation and review process of the environmental and social impact statement (ESIS) or ESIA report, conditions for approval of a project, post-assessment (e.g., environmental audits, including self auditing and mitigation measures). It also provides schedules for:
• Issues to be considered in developing an ESIS • Certificate of approval of ESIA
The EIA Regulations of 1998 provide for the implementation of the NEA, Cap 153 of 1995 and explicitly require that all projects listed in the Third Schedule of the NEA, Cap 153 of 1995 (Annex B) be subjected to an ESIA before implementation.
National Environment (Conduct and Certification of Environmental Practitioners) Regulations of 2003
According to Section 3 of these regulations, they apply to all persons certified and registered under these regulations as environmental practitioners and corporate persons and partnerships registered under these regulations to coordinate individually registered persons to conduct EIAs or environmental audits.
As outlined in Section 4 of these regulations, their objectives are to:
a) “Establish a system for certification and registration of Environmental Practitioners;
b) Provide a system for competence, knowledge, professional conduct, consistency, integrity, and ethics in the carrying out of environmental impact studies and environmental audits;
USAID/UGANDA: ENVIRONMENTAL MANAGEMENT FOR THE OIL SECTOR – TRAINING COMPENDIUM: MODULE 4 235

c) Ensure that the conduct of E[S]IAs or environmental audits is carried out in an independent, objective, and impartial manner;
d) Provide for the discipline and control of environmental practitioners;
e) Provide a code of conduct for environmental practitioners.”
Section 16 (1) of these Regulations requires that, “no person, shall conduct an environmental impact assessment or carry out any activity relating to the conduct of an environmental impact study, or environmental audit as provided for under the Act, unless that person has been duly certified and registered in accordance with these Regulations.” Section 18(2), however clarifies that, “for the avoidance of doubt, it is not necessary to be a registered or certified Environmental Practitioner in the case of preparation or submission of a project brief to the Authority or to a lead agency” (Government of Uganda, 2003).
These regulations additionally make provisions for certification of environmental practitioners and partnerships and the code of practice and discipline of environmental practitioners.
The Uganda Wildlife Act, Cap 200 of 1996
Section 15 of Uganda Wildlife Act, Cap 200 of 1996 prescribes that any developer desiring to undertake any project which may have a significant effect on any wildlife species or community shall undertake an ESIA in accordance with the NEA, Cap 153 of 1995.
The National Forestry and Tree Planting Act Of 2003
The National Forestry and Tree Planting Act of 2003 makes provisions for the conservation, sustainable management, and development of forests for the benefit of the people of Uganda and also provides for the declaration of forest reserves for the purpose of protection and production of forests and forest produce.
This Act guarantees the sustainable use of forest resources and enhancement of the productive capacity of forests, and provides for the promotion of tree planting.
Section 38 of the Act prescribes that a person intending to undertake a project or activity, which may, or is likely to have a significant impact on a forest, shall undertake an ESIA.
The National Environment (Wetland, River Banks, and Lake Shores Management) Regulations of 2000 Under the National Environment Act, Cap 153 of 1995
Section 12(1) of these regulations states that, “A person shall not carry out any activity in a wetland without a permit issued by the Executive Director of NEMA” (Government of Uganda, 2000).
Section 23 (1) further requires, “A person who intends to use, erect, reconstruct, place, alter, extend, remove or demolish any structure or part of any structure in, under or over the riverbank or lakeshore; to excavate, drill, tunnel or otherwise disturb the riverbank or lakeshore; to introduce or plant any part of a plant whether alien or indigenous on a riverbank or lakeshore; to introduce any animal or microorganism, whether alien or indigenous, in any riverbank or lakeshore; or to deposit any substance on a riverbank or lakeshore if that substance would or is likely to have adverse effects on the environment, shall make an application to the Executive Director of NEMA” (Government of Uganda, 2000).
Section 34 prescribes that a developer desiring to conduct a project which may have a significant impact on a wetland, riverbank or lakeshore is required to carry out an ESIA in accordance with Sections 19, 20 and 21 of the NEA, Cap 153 of 1995.
The Mining Act of 2003
Section 108 of the Mining Act of 2003 requires every holder of an exploration license or a mining lease to carry out an ESIA of his or her proposed operations in accordance with the provisions of the NEA, Cap 153 of 1995.
USAID/UGANDA: ENVIRONMENTAL MANAGEMENT FOR THE OIL SECTOR – TRAINING COMPENDIUM: MODULE 4 236

ESIA Guidelines for the Energy Sector, June, 2004
The EIA Guidelines for the Energy Sector were developed specifically for energy development projects—including oil and gas projects.
These sectoral guidelines facilitate the easy implementation of new developments in the energy sector by providing practical guidance to all key players involved in managing different aspects of the ESIA process for energy development projects.
Not all oil and gas activities may necessarily cause significant adverse effects on the environment due to differences in scale of operation, nature and complexity of the activity, and location. Therefore, different oil and gas activities undergo different levels of environmental assessment, referred to as screening categories. Screening of oil and gas projects is conducted to determine the extent to which a project is likely to affect the environment, and therefore allows for determination of the level of assessment required. Table 5.2 below provides the screening categories for a number of oil and gas activities as per the EIA Guidelines for the Energy Sector.
TABLE 5.2: CATEGORIZATION OF OIL AND GAS ACTIVITIES
Screening Category Definition Types of Oil and Gas activities
I Normally exempt from ESIA None II Adequate mitigation measures
must be determined either directly or through Environment Impact Review (EIR)
Stand-alone generator < 500 kW
III Requiring full ESIA • Petroleum exploration and production (starting with appraisal drilling)
• Petroleum storage facilities (storage tanks)
• Petroleum refinery • Petroleum pipeline • Commercial petroleum transportation • Petrol station construction
Source: Government of Uganda, 2004
Amendments to ESIA Related Legislation in Uganda
The laws of Uganda are continually being refined and developed resulting in frequent changes in legislation. For example, pertinent legislation including but not limited to: the National Environment Act (Cap 153 of 1995), National Environment Management Policy (1994), EIA Regulations (1998) and the Guidelines for EIA in Uganda (July 1997), were at the time of preparation of these course materials all in the process of being updated. Some of the changes to the legislation relevant to ESIAs in Uganda include but are not limited to the following:
The Draft National Environment Act (NEA) Amendment Bill of 2014
In 2014, a draft bill that seeks to introduce new provisions in the NEA, Cap 153 of 1995 was proposed by NEMA.
The Draft Bill seeks to retain many of the existing provisions of the NEA, Cap 153 of 1995 but new provisions relating to aspects such as oil and gas, chemicals management, and climate change and adaptation, among others, are proposed in the Draft Bill. In addition, some of the existing provisions in the NEA, Cap 153 of 1995 have been modified or strengthened while others will be rendered obsolete and therefore omitted. Accordingly, due to the extensive amendments to be made to the NEA, Cap 153 of 1995, it has been considered necessary to repeal and replace the NEA, Cap 153 of 1995 instead of just amending it.
USAID/UGANDA: ENVIRONMENTAL MANAGEMENT FOR THE OIL SECTOR – TRAINING COMPENDIUM: MODULE 4 237

Clause 5 of the Draft Bill seeks to provide for, and safeguard the right of persons living in Uganda to a healthy and clean environment as well as to enforce such a right. Currently, Section 3 of the NEA, Cap 153 of 1995 provides for a right to a decent environment. Section (3) as it is in the NEA, limits the ability of persons in Uganda to enforce the right to a clean environment and human health. This is because currently, the ability to take legal action where the right to a clean environment and human health is abused or threatened is vested in NEMA and the Local Environmental Committees. Furthermore, Section 3 in its current form is inconsistent with Article 50 of the Constitution of the Republic of Uganda of 1995, which provides a right to persons to go to courts of law for redress where a fundamental right or guaranteed freedom is abused or threatened.
The right to a clean and healthy environment is guaranteed under Article 39 of the Constitution of the Republic of Uganda of 1995 and should be enforced without limitation by any other law. Section (3) of the NEA, Cap 153 of 1995 also potentially exposes NEMA to excessive litigation given the likely increase in disputes of an environment nature as a result of increased awareness by the public of the guaranteed rights as well as increased development and exploitation of oil and gas resources.
The Draft Bill therefore, seeks to redefine Section 3 the NEA, Cap 153 of 1995 to allow every person living in Uganda, NEMA, or the local environmental committee to enforce their right to a clean and healthy environment through courts of law without legislative hindrances.
This is intended to ensure consistency with the Constitution of the Republic of Uganda of 1995 and to allow persons seeking to enforce the right to a healthy and clean environment through courts of law to do so freely. It is also intended to limit NEMA’s exposure to excessive litigation.
A Fourth Schedule is also proposed and this seeks to specifically provide for petroleum activities in the list of projects requiring ESIA. Accordingly, the following petroleum activities are listed:
• Petroleum activities under the Petroleum (Exploration, Production and Development) Act of 2013
• Midstream operations under the Petroleum (Refining, Conversion, Transmission and Midstream Storage) Act of 2013
• Petroleum products as defined under the Petroleum Supply Act of 2003 • Petroleum supply operations as defined under the Petroleum Supply Act of 2003
Amendments to the ESIA Regulations Of 1998
The amendments to the EIA Regulations of 1998 as of August 2014 take note of the screening and Project Brief stage, which may be used to identify the need for a full environmental impact study.
The screening and Project Brief will also help in recording purposes for future reference and monitoring in ensuring compliance by the developer whose project may eventually require an environmental impact study.
Previously, there was no format for submission of the Project Brief. This provision is therefore useful to the developer should he wish to undertake the study himself or with the aid of a specialist. It is also useful to the environmental practitioner who may be contracted by the developer to undertake the study.
The amendment makes specific reference to the National Environment (Conduct and Certification of Environment Practitioners) Regulations of 2003. Mention of this regulation in the amended EIA Regulations is for developers to acquaint themselves with the role of environmental practitioners and their conduct.
The amendments to the EIA Regulations additionally specifically introduce more detailed ESIA guidelines termed “the Guidelines for EIA in Uganda” and the application of sector ESIA guidelines.
The amendments also take into account scoping, and focus on the importance of standard Terms of References (ToR) for the environmental impact study. These are to avoid the shortcomings of inadequate ToRs, with the option of additional ToRs applicable to a particular project.
USAID/UGANDA: ENVIRONMENTAL MANAGEMENT FOR THE OIL SECTOR – TRAINING COMPENDIUM: MODULE 4 238

The amended regulations also include a new condition requiring submission of the ESIS/ESIA Report together with the project Environmental Management Plan(s) (EMP) for all project operations and thereafter, every three years.10 The EMPs should be flexible and amendable at the initiative of the developer, or as directed by NEMA working with the relevant lead agency.
It is imperative that any changes/updates to ESIA Legislation, other than those highlighted above, are noted and that one is always cognisant of the changing Laws of Uganda. In general, ESIAs undertaken in the oil and gas sector must reflect and be in line with the most recent Laws of Uganda.
The Environmental and Social Impact Assessment Process
Key Steps of an ESIA Process
Figure 5.1 indicates the key steps to be followed during the conduct of an ESIA and Table 5.3 provides a brief description of each of the key aspects.
FIGURE 5.1: KEY STEPS OF AN ESIA
10 Currently, it is common practice that ESIS/ESIA reports are submitted together with EMPs even though this is not provided for under the current environmental legal framework.
USAID/UGANDA: ENVIRONMENTAL MANAGEMENT FOR THE OIL SECTOR – TRAINING COMPENDIUM: MODULE 4 239

Source: UNEP, 2002
TABLE 5.3: BRIEF DESCRIPTION OF THE KEY STEPS OF AN ESIA
Step Description Questions to Ask/Tasks to Be Undertaken in the Step
Screening Determine whether or not a project proposal should be subject to ESIA and, if so, with what level of detail.
• Does the project require an ESIA? ESIAs are carried out at the pre-project stage.
• If yes, Planning and Organization: - ESIAs must be undertaken by a NEMA
certified/approved practitioner (Team Leader) as provided for in the National Environment (Conduct and Certification of Environmental Practitioners) Regulations of 2003.
Scoping (including ToR)
Identifies the issues and impacts that are likely to be important and establishes ToR for the ESIA.
• Stakeholder Consultation and Scoping • Identifying the potential impacts for
various phases (pre-construction/ mobilization, construction, operations, decommissioning/demobilization)
• Setting the ToR • Assembling the team of specialists
Impact analysis Identifies and predicts the likely environmental, social and other related effects of the project proposal.
• Collecting baseline information • Predicting the significance of impacts
Mitigation and impact management
Mitigation and impact management establishes the measures that are necessary to avoid, minimize or offset predicted adverse impacts and, where appropriate, is used to incorporate these into an environmental and social management plan or system.
• Identify mitigation measures for negative impacts and enhance positive impacts
• Considering alternatives
ESIS or ESIA Report
This is to document clearly and impartially impacts of the project proposal, the proposed measures for mitigation, the significance of effects, and the concerns of the stakeholders including the communities affected by the project proposal.
• Results of study are documented in an ESIS or ESIA Report that has to be submitted to the NEMA for review and approval, in consultation with the relevant lead agencies such as Petroleum Exploration and Production Department (PEPD, Department of Museums and Monuments, Directorate of Water Resources Management (DWRM), Uganda Wildlife Authority (UWA), etc.
Review of the ESIS
This is to determine whether the report meets its ToR, provides a satisfactory assessment of the proposal(s) and contains the information required for decision-making.
Decision-making
Decision-making is to approve or reject the proposal and to establish the terms and conditions for its implementation.
• Upon approval, a certificate with associated Conditions of Approval is granted, and on payment of NEMA fees project activities can commence. Note: Section 37 of the EIA Regulations of 1998 does not specify when NEMA fees should be paid. However, common practice is that payment is made as soon as NEMA communicates to the project proponent (by issuance of an invoice) that the respective project has been approved.
Follow-up/post-ESIA-monitoring
Follow-up is to ensure that the terms and conditions of approval are met; to monitor the impacts of development and
USAID/UGANDA: ENVIRONMENTAL MANAGEMENT FOR THE OIL SECTOR – TRAINING COMPENDIUM: MODULE 4 240

Step Description Questions to Ask/Tasks to Be Undertaken in the Step
the effectiveness of mitigation measures; to strengthen future ESIA applications and mitigation measures; and, where required, to undertake environmental audit and process evaluation to optimize environmental management.
The ESIA Process in Uganda
The ESIA process in Uganda is guided by the EIA Regulations, 1998 made in terms of Section 107 of the National Environment Act (Cap 153 of 1 May 1998).
The EIA Regulations, 1998 set out the procedures and criteria for the submission, processing and consideration of, and decisions on, applications for the approval of projects.
Note: These Guidance Notes discuss the ESIA process with a specific focus on the issues that need to be taken into consideration when undertaking ESIA and related processes in Uganda but with additional guidance obtained from international best practice. Reference is hereby also made to the Environmental Impact Assessment Guidelines for the Energy Sector (2004), which should be referred to in order to obtain details on the general process to be followed when undertaking ESIAs in Uganda (see Figure 5.2).
Phasing of the ESIA in Uganda
It is important to note right from the start that for the oil and gas sector in particular, the ESIA must cover the entire footprint that might be affected by such projects (e.g., if the project includes use of areas outside the core oil and gas exploration and development area). For example, impacts associated with access roads, worker’s camps, sources of materials, waste consolidation and treatment plants must be assessed in the ESIA as well.
In addition to the above, Regulation 16 (1) of the National Environment (Conduct and Certification of Environmental Practitioners) Regulations (2003) requires that, “No person, shall conduct an EIA or carry out any activity relating to the conduct of an EIA or Environmental Audit as provided for under the Act, unless that person has been duly certified and registered in accordance with the Regulations.” Furthermore, according to Regulation 19 (I), “A person desiring to be certified as an Environmental Practitioner shall apply to the Committee in the form prescribed in the First Schedule, accompanied by the non-refundable fee prescribed in the Fourth Schedule” (Government of Uganda, 2004). According to Regulation 22, upon
submission of the application, the Committee may, after carrying out investigations and when satisfied that the applicant meets conditions prescribed by Regulation 20, within 14 days after making the decision, notify the applicant that his or her application has been rejected or approved. The Committee shall issue the applicant with an Environmental Practitioner's Certificate as prescribed in the Second Schedule upon the payment of the fee prescribed in the Fourth Schedule (see Annex 1 for an example of an Environment Practitioner’s Certificate).
The ESIA process in Uganda is made up of three phases: screening, environmental impact study, and decision-making—each of these phases is further discussed in detail in the sections that follow.
USAID/UGANDA: ENVIRONMENTAL MANAGEMENT FOR THE OIL SECTOR – TRAINING COMPENDIUM: MODULE 4 241

FIGURE 5.2: THE ESIA PROCESS IN UGANDA
Source: Government of Uganda, 2004
Phase 1: Screening Phase
Not all oil and gas projects necessarily have the potential to cause adverse effects on the environment owing to the differences in the scale of operation, nature of the proposed project and project location. Therefore, not all proposed projects requiring ESIA shall undergo the entire ESIA process or necessarily, the same level of assessment.
Objectives of the Screening Phase
Environmental and social screening of oil and gas projects is aimed at identifying the extent and the complexity of potential environmental and social impacts associated with proposed projects, in so doing, establishing whether there is need for ESIA. More specifically, screening determines:
• Whether or not an ESIA is required for a project • The extent and complexity of potential environmental and social impacts • If mitigation measures can readily be identified for significant environmental impacts
In light of the above, screening is vital as it limits the application of ESIA to only those projects that require it (i.e., to only those projects that have the potential to generate significant impacts).
USAID/UGANDA: ENVIRONMENTAL MANAGEMENT FOR THE OIL SECTOR – TRAINING COMPENDIUM: MODULE 4 242

Categorization of Projects
Source: United Nations University, RMIT University, and UNEP, 2006
“Project lists are widely used to screen project proposals, and these lists are of two types—most are inclusion lists, which describe the project type and size thresholds that are known or considered to have significant or serious environmental impacts. Usually, listed projects that fall within these pre-determined thresholds will be automatically subject to full and comprehensive ESIA. The inclusion lists used by countries and international organizations differ in content, comprehensiveness, threshold levels and requirements for mandatory application. In certain ESIA systems, scale thresholds are specified for each type of listed project for which an ESIA is mandatory. Other projects that may require an ESIA are screened individually against environmental significance criteria, such as emission levels or proximity to sensitive and protected areas.”
World Bank Project Categorization
Source: United Nations University, RMIT University, and UNEP, 2006
“For the categorization of projects, internationally, reference is often made to Annex E of the World Bank Operational Directive on Environmental Assessment (EA), which is illustrative and provides a framework for screening.”
“Use of these lists is reported by the World Bank to be a reliable aid to the classification of project proposals into one of three categories shown in the below:”
TABLE 5.4: ESIA SCREENING CRITERIA, WORLD BANK, 1993
Category Scope of Impacts Projects or Components
Category A
For projects likely to have significant adverse environmental impacts that are serious (i.e., irreversible, affect vulnerable ethnic minorities, involve involuntary resettlement, or affect cultural heritage sites), diverse, or unprecedented, or that affect an area broader than the sites of facilities subject to physical works. A full ESIA is required.
• Dams and reservoirs forestry and production projects
• Industrial plants (large-scale) • Irrigation, drainage, and flood control (large-
scale) • Land clearance and leveling (large-scale) • Mineral development (including oil and gas) • Port and harbor development • Reclamation and new land development • Resettlement and new land development • River basin development • Thermal and hydropower development • Manufacture, transportation, and use of
pesticides • Other hazardous and/or toxic materials
Category B
For projects likely to have adverse environmental impacts that are less significant than those of Category A projects, meaning that few if any of the impacts are likely to be irreversible, that they are site-specific, and that mitigation measures can be designed more readily than for Category A projects. Normally, a limited ESIA will be undertaken to identify suitable mitigation and management measures, and incorporate them into the project.
• Agro-industries • Electrical transmission • Aquaculture and drainage (small-scale) • Irrigation and drainage (small-scale) • Renewable energy • Rural electrification • Tourism • Rural water supply and sanitation • Watershed projects (management or
rehabilitation) • Rehabilitation, maintenance, and upgrading
projects (small-scale)
USAID/UGANDA: ENVIRONMENTAL MANAGEMENT FOR THE OIL SECTOR – TRAINING COMPENDIUM: MODULE 4 243

Category Scope of Impacts Projects or Components
Category C For projects that are likely to have minimal or no adverse environmental impacts. No ESIA is required.
• None
Source: United Nations University, RMIT University, and UNEP, 2006
Project Categorization in Uganda
The Ugandan EIA Guidelines, 1997 require that the level of EA undertaken for projects reflects the “level of environmental significance of impacts.” Projects are therefore categorized as: Category A, B, or C as indicated in Table 5.5.
The classification of project activities within one of the three categories (Table 5.5) is dependent upon a number of specific site and operational factors and characteristics of the receiving environment that include:
• Potential impacts associated with the project • Resilience of the environment to cope with change • Presence of a planning and policy framework and other decision-making criteria • Confidence in the prediction of impacts based on extent of damage • Degree of public interest
TABLE 5.5: ESIA SCREENING CRITERIA
Category A Category B Category C Project is expected to have insignificant or minimal or no adverse direct, indirect or cumulative environmental and/or social impacts.
• Project does not conflict with key stakeholder interests (i.e., is not controversial).
• Beyond screening, it is clear that the project does not require further analysis or impact assessment.
Project is expected to have limited adverse social and/or environmental impacts that can be readily addressed through the application of appropriate mitigation measures.
• The limited potential adverse impacts associated with the project are site-specific, few if any of them are irreversible, and in most cases, mitigation measures can be designed readily.
• Project does not require full ESIA but will require further consideration of environmental and social concerns, depending on the nature and magnitude of the potential impacts.
• Further analysis is aimed at gathering additional information that is detailed enough to examine effectively, the project’s potential positive and negative impacts and to make recommendations of any measures needed to prevent, minimize, mitigate, or compensate for the limited adverse impacts and improve environmental performance. The scope of analysis may vary from a detailed study of a
Project is expected to have significant adverse social and/or environmental impacts (direct, indirect or cumulative) that are diverse, irreversible or unprecedented.
• Project has the potential to affect an area broader than the site or facilities subject to its activities.
• Projects in this Category may include interventions that:
(a) Result in a change in existing land use
(b) Result in the use of other natural resources
(c) Result in the disturbance of environmentally sensitive ecosystems
(d) Result in the disturbance of biodiversity conservation ecosystems
(e) Promote the use of chemicals
USAID/UGANDA: ENVIRONMENTAL MANAGEMENT FOR THE OIL SECTOR – TRAINING COMPENDIUM: MODULE 4 244

Category A Category B Category C specific component of the project to routine checks to ensure that the project conforms to national requirements.
• A Category B project may be upgraded to a Category C project (which requires further study and a detailed assessment) if:
(a) A project originally identified to belong to Category B is associated with sensitive or fragile ecosystems.
(b) Mitigation measures of impacts cannot be readily identified.
(c) Impacts are unknown; or
(d) Impacts are unacceptable.
(f) Result in land acquisition and resettlement of the local population.
• Analysis for these projects focuses on examining the project’s potential positive and negative impacts, compares them with those of feasible alternatives (including the “without project” scenario), and recommends any measures needed to prevent, minimize, mitigate, or compensate for adverse impacts and to improve environmental performance.
• Category C projects require the undertaking of a full detailed ESIA study.
Source: United Nations University, RMIT University, and UNEP, 2006
The Project Brief
Based on the screening criteria above (Table 5.5), the developer prepares and submits to the Competent Authority the NEMA, a Project Brief (PB) in accordance with Regulations 5 and 6 of the EIA Regulations of 1998 (see Annex 2).
The overall purpose of the PB is to provide the Authority and lead agencies with sufficient information in order to inform the decision as to whether the proposed project should undergo the entire ESIA process.
The PB has to be prepared in accordance with the requirements stipulated in Part II, Regulation 5 (Preparation of Project Brief) of the EIA Regulations (1998) (see Annex 2), as well as Section 3.2.1(Submission of Project Brief) of the Guidelines for Environmental Impact Assessment in Uganda (NEMA, July 1997) which outlines the contents of a PB at a minimum.
NEMA Decision on the Project Brief
Following review of the PB that was submitted to NEMA by the developer, NEMA will:
• Provide conditional/unconditional approval of the project • Reject the project • Require a detailed ESIA, if NEMA determines that, the project (a) may have an impact on the
environment, (b) is likely to have a significant impact on the environment, and (c) will have a significant impact on the environment
Stakeholder Consultation
Source: United Nations University, RMIT University, and UNEP, 2006
The full involvement of key stakeholders in the ESIA process ensures an open and participatory approach to the study. It also ensures that all the impacts are identified and that planning and decision-making are conducted in an informed, transparent and accountable manner.
Therefore, an important part of any ESIA is to define and inform stakeholders (e.g., potentially affected communities, relevant government agencies, representatives of other interested parties, including nongovernmental organizations, the private sector, independent experts, including the
USAID/UGANDA: ENVIRONMENTAL MANAGEMENT FOR THE OIL SECTOR – TRAINING COMPENDIUM: MODULE 4 245

general public) of the proposed project and ESIA process, as well as to identify issues and concerns that need to be addressed in the ESIA.
Please reference Session 3: Stakeholder Engagement, where stakeholder consultation is discussed in detail and will therefore not be repeated here.
Phase 2: Environmental Impact Study
Source: United Nations University, RMIT University, and UNEP, 2006
In accordance with Regulation 9 (1) of the EIA Regulations of 1998, “If the Executive Director finds that the project will have significant impacts on the environment and that the Project Brief discloses no sufficient mitigation measures to cope with the anticipated impacts, he shall require that the developer undertakes an environmental impact study” (Government of Uganda, 1998).
This section therefore describes the steps to be followed when undertaking the detailed environmental impact study which are: Scoping, ToR, Review of ToR, EIStudy and collection of information, and preparation of the Environmental Impact Statement (Guide for the Environmental Impact Assessment Process in Uganda, 1997).
Scoping
Source: United Nations University, RMIT University, and UNEP, 2006
Scoping is an early, open and interactive process that is used to determine the major issues and impacts that need to be addressed in an ESIA and which are therefore important in project decision-making (i.e., scoping is conducted to determine the scope of work to be undertaken in assessing the likely environmental impacts of a proposed project).
More specifically, the purpose and objectives of scoping are to:
• Define the time/space boundaries of the ESIA. • Identify reasonable, feasible, and practical project alternatives. • Provide guidance on the nature and scale of the study through the identification of the main
issues of importance and particularly, the likely significant impacts to be examined during further study.
• Obtain local knowledge on the characteristics of the area, in so doing, determining the likely methods required for data collection and analysis.
• Define essential components of the stakeholder identification and engagement plan. • Eliminate the issues of least concern. • Identify any fatal flaws. • Identify the information required for decision-making in the ESIA. • Establish ToR for the ESIA.
The guiding principles for undertaking the scoping process are to:
Source: United Nations University, RMIT University, and UNEP, 2006
• Recognize that scoping is a process rather than a discrete activity or event. • Design the scoping process for each project, taking into account the environment and people
affected. • Start scoping as soon as one has sufficient information available. • Prepare an information package or circular explaining the project proposal and the process. • Specify the role and contribution of the stakeholders and the public. • Take a systematic approach but implement flexibly. • Document the results to guide preparation of the ESIA. • Respond to new information and further issues raised by stakeholders.
Table 5.6 contains an indicative list of activities to be carried out during scoping.
USAID/UGANDA: ENVIRONMENTAL MANAGEMENT FOR THE OIL SECTOR – TRAINING COMPENDIUM: MODULE 4 246

Scoping is complete when the detailed studies required during the ESI Study have been identified and incorporated into the ToR.
TABLE 5.6: INDICATIVE LIST OF SCOPING ACTIVITIES
Activity Items
(Note: These steps are only indicative, and should be tailored to meet the requirements of the particular situation.)
Getting ready 1. Prepare a preliminary or outline scope with headings such as: • Objectives and description of the project • The policy context and environmental setting • Data and information sources, constraints etc. • Alternatives to the project • Concerns, issues and effects identified to date • Provision for public involvement • Timetable for scoping, ESIA and decision-making.
2. Develop the outline scope by informal consultation and by assembling available information, identifying information gaps, etc.
3. Make the provisional scope and supporting information available to the public.
Undertaking scoping
4. Draw up a long list of the range of issues and concerns.
5. Evaluate their relative importance and significance to derive a short list of key issues.
6. Organize the key issues into the impact categories to be studied.
Completion and continuity
7. Amend the outline scope to progressively incorporate the information from each stage.
8. Establish the ToR for the E[S]IA, including information requirements, study guidelines, methodology, and protocols for revising work.
9. Monitor progress against the ToR, making adjustments as needed and provide feedback to stakeholders and the public.
Source: UNEP, 2002
Terms of Reference
ToR define the scope of the ESIA. ToR are required by Regulation 10 of the EIA Regulations of 1998 which states that, “An environmental impact study shall be conducted in accordance with terms of reference developed by the developer in consultation with the authority and lead agency,” and, “the terms of reference shall include all matters required to be included in the environmental impact statement provided in Regulation 14, and such other matters as the Executive Director may provide in writing” (Government of Uganda, 1998).
According to Regulation 11(1) and (2) of the EIA Regulations of 1998, “The developer shall submit to the Executive Director, the names and qualifications of the persons who shall undertake the study, the Executive Director may approve or reject the name of any person submitted, and require that another name be submitted within the period specified by the Executive Director in writing” (Government of Uganda, 1998),
Common practice is that the ToR are incorporated into the Scoping Report as a separate chapter; however, they can be prepared as a separate stand-alone document and submitted to NEMA for review and approval in consultation with the relevant lead agencies (e.g., DWRM, PEPD, and UWA, among others).
USAID/UGANDA: ENVIRONMENTAL MANAGEMENT FOR THE OIL SECTOR – TRAINING COMPENDIUM: MODULE 4 247

Following review, if determined to be satisfactory, NEMA issues a Scoping and ToR Letter of Approval with conditions specified (see Annex 5).
The Detailed Environmental Impact Study
According to UNEP, 2002, the aim of the detailed environmental impact study is to take account of all of the important environmental/project impacts and interactions, making sure that indirect and cumulative impacts, which may be potentially significant, are not inadvertently omitted.
The ESIA is aimed at undertaking a comprehensive evaluation and study to address all the issues raised in the scoping phase and included in the ToR. The objectives of the detailed environment impact study are therefore to:
• Describe the biophysical and socioeconomic environment that is likely to be affected by the project.
• Undertake specialist studies to address the key biophysical and socioeconomic issues. • Assess the significance of impacts associated with the project. • Assess the alternatives proposed. • Provide details of mitigation measures and management recommendations to reduce the
significance of impacts. • Continue with the stakeholder consultation process.
In light of the above, generally, ESIA studies are accomplished through three stages, which are:
Establishing the Baseline Environment
Specialist studies are undertaken by specialists in their fields of expertise on different environmental components identified in the ToR and any additional studies required by the authorities using applicable methods/techniques, so as to establish a baseline against which to assess impacts and make recommendations on how to mitigate negative impacts and optimize/enhance positive ones.
Table 5.7 provides some examples of common specialist studies undertaken for ESIAs in the oil and gas sector in Uganda (Note: focused on an appraisal drilling project).
USAID/UGANDA: ENVIRONMENTAL MANAGEMENT FOR THE OIL SECTOR – TRAINING COMPENDIUM: MODULE 4 248

TABLE 5.7: EXAMPLES OF COMMON SPECIALIST STUDIES UNDERTAKEN FOR ESIAS IN THE OIL AND GAS SECTOR IN UGANDA
Baseline Category
Specialist Study Examples of ToR11
Physical environment
Hydrology, Hydrogeology and Catchment. This also includes climate aspects.
• Provide baseline descriptions of the hydrological aspects in the area of the project. The descriptions will focus on physio-chemical (hydrological, water quality and climate aspects among others) issues.
• Provide data on the climatic conditions of the area. These should be based on the trend over a long period for temperature, rainfall, sunshine and humidity and these should be projected to gauge potential future implications of climate on the project.
• Provide a basic characterization of the surface and groundwater resources based on existing information.
• Determine whether or not there will be significant net loss of water from the system due to drilling activities, and comment on the implications.
• The assessment should focus on aspects such as groundwater recharge, evapo-transpiration patterns and winds before, during and after project implementation.
• Comment on the risks of polluting ground and surface water resources at the site.
Geology, Geomorphology and Soils
• Review of the soil sensitivity and the National Soil Map legend that differentiates soil units on the basis of geology, color and texture.
• Relation of the National Soil Map to other recognized soil classification systems.
• Development of a map of the spatial extent of the soil types within the proposed project area at an appropriate scale based on the above classification systems.
• Integration of the soil map, landform, and other physical and climatic factors to assess the agricultural potential or land capability of the area.
• Relation of soils and land capability maps to current land use practices.
• Provide a critique on the proposed drilling methods in relation to the geological features in the area.
Air Quality The air quality specialist study will include: • Air quality baseline information collected for the
exploration area, which includes existing concentrations and meteorological data.
• Technical information regarding the following as provided by the O&G Operator: - Flaring system design and operational data, such
as heat rate, gas/ air / steam flow rates, temperature, height, and flaring tip design.
- List of equipment and vehicles to be used during well testing operations, including fuel type and estimated consumption, and number of pieces of equipment per type.
• The estimated area of land to be disturbed for access road construction (where necessary), as well as short-
11 Please note that these examples of ToR are specific for an oil and gas appraisal drilling project.
USAID/UGANDA: ENVIRONMENTAL MANAGEMENT FOR THE OIL SECTOR – TRAINING COMPENDIUM: MODULE 4 249

Baseline Category
Specialist Study Examples of ToR11
term collection of ambient air background measurements and meteorological data will be determined as necessary. Given the historic use of the area (no industries) and existing sources of air pollutant emissions, where project-specific monitoring is deemed necessary, it is likely that only measurements of particulate matter (PM10) and possibly dust deposition need to be carried out, and this will be indicated in the specialist report.
Note: Air quality baseline information is directly related to the kind of air pollutants that are anticipated from the project. In other words, if a particular project will not cause emission of PM10, there would be no need for sampling of this parameter during the baseline study.
Waste management aspects
• Briefly describe the processes giving rise to the waste streams.
• Identify, describe, and, where possible, quantify the various waste streams to be generated by the proposed project and associated activities (storage and logistical support). This will not require the analysis of solid waste samples.
• Classify whether the waste is likely to be hazardous or non-hazardous.
• Identify the current waste management practices in the project area.
Visual related aspects • Establish extent of visibility by mapping the view-sheds and zones of visual influence.
• Establish visual exposure to viewpoint. • Map slope grade landforms, vegetation, special features,
land use, and overlay all the relevant above map layers to assimilate a visual sensitivity map.
• Review relevant legislation, policies, guidelines, and standards.
• Assess visual sensitivity criteria such as extent of visibility, the sites’ inherent sensitivity, visual absorption capacity of the area and visual intrusion on the character and use of the area.
• In close conjunction with the O&G Operator prepare photomontages of the proposed project.
• Assess the proposed project against the visual impact criteria (visibility, visual exposure, sensitivity of the site and receptor capacity and visual intrusion) for the area.
USAID/UGANDA: ENVIRONMENTAL MANAGEMENT FOR THE OIL SECTOR – TRAINING COMPENDIUM: MODULE 4 250

Baseline Category
Specialist Study Examples of ToR11
Biological environment
Terrestrial ecology: Fauna and Flora
A detailed description of the ecological (fauna and flora) environment within and immediately surrounding the proposed project area. Fauna will include all terrestrial mammals, reptiles, amphibians, avifauna, and insects. This aspect of the study will specifically include the identification of: • Areas of high biodiversity especially if the project is to
be undertaken in a nationally designated protected area such as a national park or forest;
• The presence and distribution of species of special/conservation concern, including sensitive, endemic and protected species;
• Habitat associations and conservation status of the identified fauna and flora;
• Identification of areas sensitive to invasion by alien species if any; and
• Identification of sensitive habitats where disturbance should be avoided or minimized.
Freshwater (Aquatic) Ecology
A detailed description of the aquatic (fauna and flora) environment within and immediately surrounding the footprint of the proposed project. This aspect of the study will specifically include the identification of: • Areas of high biodiversity; • The presence and distribution of species of
special/conservation concern, including sensitive, endemic and protected species;
• Habitat associations and conservation status of the identified fauna and flora;
• Identification of areas sensitive to invasion by alien species if any; and
• The presence of conservation areas and sensitive habitats where disturbance should be avoided or minimized.
Socioeconomic environment
This specialist study will include but will not be limited to: • A description of the local social environment with
particular reference to households and/or
communities’ vulnerability to the influences of the proposed activities in the oil and gas sector;
• A description of the livelihood strategies of the local communities;
• A description of the economic context of the proposed project at various levels;
• Identification of the existence of any Archeological and cultural heritage sites (including graves, TOMBS and spiritual sites) affected by the proposed project;
• Obtaining any strategic plans for the project area district and sub-county to place the proposed project area in a regional planning context;
• An assessment of the land ownership, access rights and customary laws relating to land;
• Investigating the institutional capacity and institutional relationships at the local level; and
• An assessment of the social services in the project area such as access to water, education and health care services among others.
USAID/UGANDA: ENVIRONMENTAL MANAGEMENT FOR THE OIL SECTOR – TRAINING COMPENDIUM: MODULE 4 251

Baseline Category
Specialist Study Examples of ToR11
Occupational Health and Safety aspects
• Prepare a review of the legislative and regulatory context for the proposed project activities with respect to occupational health and safety, including the identification of any permit requirements. This summary should cover national legislation and also relevant international agreements and performance standards.
• Undertake noise and vibration measurements for the project area of influence.
• Identify and assess the significance of all health and safety hazards, associated with the proposed project including but not limited to: - A noise and vibration study involving an
identification and assessment of: - Noise and vibration sources; - Impacts on sensitive receptors (e.g., workers); - Danger associated with handling of drilling
equipment and moving vehicles. • Provide standards for various health and safety criteria
that could be used by the project team to guide further detailed design of the project’s various components.
It is important to note that the extent of the specialist studies above, may vary depending on a number of scenarios such as: • The nature of the project to be undertaken – specialist studies for a geophysical survey may be less comprehensive
than specialist studies for an appraisal drilling project; • The timeframe of the project – a project with a longer timeframe such as that involving an oil transportation
pipeline will require more comprehensive studies than a project with a shorter timeframe such as a geotechnical survey;
• The project area location – a project to be located in an already disturbed area may require less comprehensive studies than a project that is to be undertaken in a virgin area such as forest, national park or Ramsar site. However, note that already disturbed areas often have human settlements hence the socioeconomic component of the baseline studies may need to be more comprehensive.
Impact Assessment
Impact assessment is undertaken to forecast the characteristics of the main potential impacts of the project. This stage can be broken down into three overlapping phases:
a) Identification – Specify the impacts associated with each phase of the project and the activities undertaken.
b) Prediction – Foresee the nature, magnitude, extent, and duration of the main impacts.
c) Evaluation – Determine the significance of residual impacts (i.e., after taking into account how mitigation will reduce a predicted impact).
Impact assessment is undertaken against an environmental baseline–baseline information collected/obtained during the screening, scoping, and detailed study stages. It therefore considers the current environmental conditions, current and expected trends, and additional impacts of already implemented and foreseeable projects (i.e., the latter, cumulative impacts).
Impact Identification
An impact can be described as the change in an environmental parameter, which results from a particular activity or intervention. The characteristics of environmental impacts vary. Typical parameters to be taken into account in impact identification are indicated in Table 5.8.
USAID/UGANDA: ENVIRONMENTAL MANAGEMENT FOR THE OIL SECTOR – TRAINING COMPENDIUM: MODULE 4 252

TABLE 5.8: CHARACTERISTICS OF IMPACTS
Impact Characteris
tic Categories of Characteristic Examples of Impacts
Nature Positive Creation of employment opportunities Negative Air pollution Direct – Directly related to the project, and can be connected (in space and time) to the action that caused them.
• Vegetation clearance • Noise pollution
Indirect – Changes that are usually less obvious, occurring later in time or further away from the impact source.
• Spread of malaria as a result of poor drainage
• Bio-accumulation of contaminants because of poor drilling waste disposal
Cumulative – Result from the incremental impact of an action when combined with impacts from projects and actions that have been undertaken recently or will be carried out in the near or foreseeable future. These impacts may be individually minor but collectively significant because of their spatial concentration or frequency in time.
Noise pollution due to operation of a series of noise generating activities in the area, being undertaken concurrently
Magnitude/ Severity/ Significance
High – Where natural and/or social functions and processes are altered to the extent that they will temporarily or permanently cease.
Large-scale oil spill in Lake Albert
Moderate – Where the affected environment is altered but natural, and/or social functions and processes continue although in a modified way.
Vegetation removal in an area of 100m x 100m
Low – Where the impact affects the environment in such a way that natural, and/or social functions and processes are minimally affected.
Temporary (1 week) closure of a community footpath
Extent/ location
Spatial extent or zone of impact influence can be predicted for site-specific versus regional occurrences. What is the area covered or distribution of the impact? Is it local, regional, or global?
• Destruction of habitat (local impact)
• Alterations to range or pattern of species (regional)
• Extinction of species (global)
Timing Impacts arising from all of the stages of the life cycle of the project should be considered (i.e., during construction, operation and decommissioning phases). Some impacts will occur immediately, while others may be delayed, sometimes by many years.
• Vegetation clearance (construction phase)
• Air pollution due to gas flaring (operations phase)
• Soil contamination due to bund lining leakages (decommissioning phase)
Duration Short-term • Noise arising from the operation of equipment during construction
Long-term • Loss of visual aesthetics because of facility construction
Intermittent • Blasting during access road construction
Continuous • Air pollution due to oil refinery operations
Reversibility/ irreversibility
Can the impact be reversed? • Large-scale oil spills in water resources (Irreversible)
• Vegetation clearance (Reversible)
Source: UNEP, 2002
USAID/UGANDA: ENVIRONMENTAL MANAGEMENT FOR THE OIL SECTOR – TRAINING COMPENDIUM: MODULE 4 253

Impact Prediction
The social, biophysical and economic faces of the environment are highly complex and no single technique can identify, measure, interpret and communicate all the information and complexities of the impacts associated with an oil and gas project.
There is no overarching method, and methods have to be selected and combined to ensure that the appropriate suite of methods is used. The final suite of methods must ensure an objective review of the project proposal, be able to evaluate the pros and cons, and most importantly, be able to communicate the results to a range of people.
The choice of methodology for impact prediction is dependent upon a number of factors including:
• Type and size of the project • Type of alternatives being considered • Nature of the likely impacts • Availability of impact identification methods • Experience of the ESIA team with their use • Resources available: cost, information, time, and personnel
Over time, a number of ESIA methodologies and tools have been developed for use in impact prediction. In practice, relatively simple methodologies and tools are applied to impact prediction. Experience indicates these simple methods (discussed below) are of proven value for undertaking a systematic approach to impact identification.
Checklists
Source: UNEP, 2002
“Checklists annotate the environmental features or factors that need to be addressed when identifying the impacts of projects and activities. They can vary in complexity and purpose, from a simple checklist to a structured methodology or system that also assigns significance by scaling and weighting the impacts. Both simple and descriptive checklists can be improved and adapted to suit local conditions as experience with their use is gained.”
“Checklists provide a systematized means of identifying impacts. They are more useful when they are specialized to one particular area of development. However, they (checklists) are not as effective in identifying higher order impacts (e.g., vegetation clearance) or the interrelationships between impacts (e.g., water pollution and subsequent breakout of water-borne diseases), and therefore, when using them, consider whether impacts other than those listed may be important.”
USAID/UGANDA: ENVIRONMENTAL MANAGEMENT FOR THE OIL SECTOR – TRAINING COMPENDIUM: MODULE 4 254

FIGURE 5.3: EXAMPLE OF A CHECKLIST
Source: UNEP, 2002
Networks
“Networks illustrate the cause-effect relationship (Figure 5.4) of project activities and environmental and social characteristics. They are, therefore, particularly useful in identifying and depicting secondary impacts (indirect, e.g., habitat destruction and cumulative, e.g., noise pollution).”
“Simplified networks, used in conjunction with other methods, help to ensure that important second order impacts, e.g., destruction of faunal migratory routes are not omitted from the study. More detailed networks are visually complicated, time consuming, and difficult to generate unless a computer program is used for the task. However, they can be a useful aid for establishing 'impact hypotheses' such as, the attitudes and behaviors of the local stakeholders in regard to the proposed project will affect their perspectives concerning the social, economic, and environmental impacts and other structured science-based approaches to ESIA.”
USAID/UGANDA: ENVIRONMENTAL MANAGEMENT FOR THE OIL SECTOR – TRAINING COMPENDIUM: MODULE 4 255

FIGURE 5.4: EXAMPLE OF A CAUSE-EFFECT RELATIONSHIP
Source: Mall, 2014
Overlays and Geographic Information Systems (GIS)
Source: UNEP, 2002
Overlays (Figure 5.5) can be used to map impacts spatially and display them pictorially.
“This approach is useful for comparing site and planning alternatives, for routing linear developments such as pipelines in the oil and gas sector, to avoid environmentally sensitive areas and for landscape and habitat zoning at the regional level.”
“A modern version of the overlay method is the computer-based GIS. In simple terms, a GIS stores, retrieves, manipulates, and displays environmental data in a spatial format. A set of maps or overlays of a given area provide different types of information and scales of resolution. The main drawbacks are the lack of appropriate data and the expense of creating a usable system. However, the potential application of GIS to ESIA is widely acknowledged and its use is expected to increase in the future, particularly to address cumulative effects.”
USAID/UGANDA: ENVIRONMENTAL MANAGEMENT FOR THE OIL SECTOR – TRAINING COMPENDIUM: MODULE 4 256

FIGURE 5.5: OVERLAYS AND GIS
Source: Innovative GIS, 2004
Expert Systems
Source: UNEP, 2002
“Expert or knowledge-based systems are used to assist diagnosis, problem solving, and decision-making. A number of such computerized systems have been developed for use in ESIA, primarily at the early stages of the process. For example, screening and scoping procedures have been automated using a number of rules and a data system, which encodes expert knowledge and judgement. The user has to answer a series of questions that have been systematically developed to identify impacts and determine their mitigability and significance. Based on the answer given to each question the expert system moves to the next appropriate question.”
“Expert systems are an information-intensive, high- investment method of analysis. As such, they are limited in their current use and application, especially by many developing countries.”
“However, they have the potential to be a powerful aid to systematic ESIA in the future, not least because, they can provide an efficient means of impact identification. Expert systems also can be updated by building in experience gained over time.”
Modeling
Models (from modeling) are simplified representations of reality. In the simplest form, this kind of representation is extremely useful in the first stages of an ESIA, helping to synthesize the widely diverse information reaching the assessor through many specialists.
Evaluation Techniques Source: UNEP, 2002
These techniques determine the incidence of costs and benefits to populations affected by the project. They are important in preparation of specifications and comparisons of the trade-off (costs or effects being balanced) between various alternatives.
USAID/UGANDA: ENVIRONMENTAL MANAGEMENT FOR THE OIL SECTOR – TRAINING COMPENDIUM: MODULE 4 257

Adaptive Techniques
Source: UNEP, 2002
Adaptive techniques usually use interdisciplinary workshops composed of scientists and environmental managers to construct simulation models to predict impacts.
Ad Hoc Approaches
Source: UNEP, 2002
Broad areas of possible impacts such as impacts upon flora and fauna, lakes, forests, etc. are identified in this method. A team of specialists will identify the nature of the impacts such as no effect, short or long-term, reversible or irreversible etc.
Ad hoc methods are used for rough assessment of total impacts giving the broad areas of possible impacts and general nature of these possible impacts.
Professional Judgement
Source: UNEP, 2002
Although not strictly a formal method, professional judgement or expert opinion is widely used in ESIA. Knowledge and expertise gained in ESIA work can be used to systematically develop data banks, technical manuals, and expert systems, thereby assisting in future projects.
The successful application of the formal methods of impact identification described in the sections above rests upon professional experience and judgement. Expert opinion and professional judgement can be focused by the use of interactive methods, such as science workshops.
The advantages and disadvantages of each of the above-mentioned impact prediction techniques are discussed in Table 5.9 below.
TABLE 5.9: ADVANTAGES AND DISADVANTAGES OF THE TECHNIQUES
Method Advantages Disadvantage
Checklist • Easy to understand and use • Good for site selection and
priority setting • Simple ranking and weighting
• Does not distinguish between direct and indirect impacts
• Does not link action and impact • Process of incorporating values
sometimes seen as controversial Network • Link action to impact
• Useful in simplified form when checking for second order impacts
• Handles direct, indirect and cumulative impacts
• Can be very complex if used beyond a very simplified version
Overlays, GIS and Computer Expert Systems
• Easy to understand • Focus and display spatial (space)
impacts • Good siting tool • Excellent for impact identification
and spatial analysis • Good for “experimenting”
• Can be cumbersome • Poorly suited to address impact
duration or probability • Heavy reliance on knowledge and
data • Often complex and expensive
Professional Judgement • Provides an insider’s view based on experience
• Key in scenarios where there is lack of data to support more rigorous analyses
• Susceptible to biases
Modelling • Ability to use large amounts of data
• Good speed of calculations
• As the model becomes more and more complex, it becomes less and less relevant to the ESIA process.
USAID/UGANDA: ENVIRONMENTAL MANAGEMENT FOR THE OIL SECTOR – TRAINING COMPENDIUM: MODULE 4 258

Method Advantages Disadvantage
• Good in cases where there are many complex links between the elements of the ESIA
• May be incapable of validation, relating to management alternatives that have not been and will never be implemented (e.g., when three or four alternative sites for an oil and gas project are considered, validation data will become available only for the alternative that is selected, and then only several years or decades later). The predictions for the other alternatives cannot be verified.
Evaluation Techniques • Important for cost-benefit analysis • Not conclusive. Needs to be complemented by other techniques/methods.
• Biased toward production-related activities
• Lack of clear statement of the objectives
Adaptive Techniques • Aids in the integration of the information provided by people from different fields of expertise and management
• Leads to clear cut problem definition and existing data evaluation
• Allows formulation of some initial predictive assessment schemes and sequences in analysis
• Usually expensive • Time consuming to construct • Used only when there is sufficient
funding and expertise available
Ad hoc Approaches • No particular types of data or resources are required
• Very easy to use
• Does not define specific parameters to be investigated, and so may not provide sufficient guidance for impact assessment
• Does not address secondary impacts
• May not encompass all the relevant impacts
• Because the criteria used to evaluate impacts are not comparable, the relative weights of various impacts cannot be compared
• Inherently inefficient as it requires sizeable effort to identify and assemble an appropriate panel of experts for each assessment
• Provides minimal guidance for impact analysis while suggesting broad areas of possible impacts
Note: No single impact prediction technique is suited for use for all oil and gas projects nor is it necessary to use only one method at a time. Combining the useful aspects of two different techniques may be the best approach to take (e.g., as noted above, ESIA checklists and networks can have added value when applied by experts in an interactive process).
USAID/UGANDA: ENVIRONMENTAL MANAGEMENT FOR THE OIL SECTOR – TRAINING COMPENDIUM: MODULE 4 259

Impact Evaluation/Rating
Source: UNEP, 2002
Once the impacts have been identified, predicted, and analyzed, they are evaluated to determine their significance.
How do you weigh the needs of an endangered animal species versus the needs of an impoverished local community? Or how important is a 100 m stretch of beach, when the entire beach is 500 km in length?
A systematic process should be followed in evaluating impact significance, distinguishing between 'as predicted' and 'residual' impacts.
Step 1 involves evaluating the significance of 'as predicted' impacts to define the requirements for mitigation.
Step 2 involves evaluating the significance of the 'residual' impacts, i.e. after mitigation measures are taken into account. This test is the critical measure of whether or not a project proposal is likely to cause significant impacts. It is determined by the joint consideration of the impact’s characteristics (magnitude, extent, duration etc.) and the importance (or value) that is attached to the resource losses, environmental deterioration, or alternative uses which are foregone (Figure 5.6).
FIGURE 5.6: IMPACT RATING
Source: UNEP, 2002
Table 5.10 below describes the terms used in Figure 5.6 above.
TABLE 5.10 DESCRIPTION OF THE TERMS USED IN IMPACT RATING
Criteria Rating Scale Intensity (the expected magnitude or size of the impact)
Very low – Where the impact affects the environment in such a way that natural, and/ or cultural and social functions and processes are negligibly affected and valued, important, sensitive or vulnerable systems or communities are negligibly affected (e.g., temporary [1 day] closure of a community footpath). Low – Where the impact affects the environment in such a way that natural, and/ or social functions and processes are minimally affected and valued, important, sensitive or vulnerable system or communities are minimally affected. No obvious changes prevail on the natural and/or social functions/ processes as a
result of the project activities (e.g., vegetation clearance by the roadside).
USAID/UGANDA: ENVIRONMENTAL MANAGEMENT FOR THE OIL SECTOR – TRAINING COMPENDIUM: MODULE 4 260

Criteria Rating Scale Medium – Where the affected environment is altered but natural, and/or social functions and processes continue although in a modified way, and valued, important, sensitive or vulnerable systems or communities are moderately affected (e.g., increase of traffic in the project area). High – Where natural and/or social functions and processes are altered to the extent that they will temporarily or permanently cease, and valued, important, sensitive or vulnerable systems or communities are substantially affected. The changes to natural and/or socioeconomic processes and functions are drastic and commonly irreversible (e.g., oil spillage in a community water source).
Sensitivity Very low – Where the perception/quality of being sensitive is negligible (e.g., vegetation clearance on already degraded land). Low – Where the perception/quality of being sensitive is minimal (e.g., vegetation clearance on idle land). Medium – Where the perception/quality of being sensitive is moderate (e.g., vegetation clearance on grazing land). High – Where the perception/quality of being sensitive is high (e.g., vegetation clearance in a section of a national park).
Source: UNEP, 2002
Impact Mitigation
Following the evaluation of project-related impacts, enhancement measures to increase the significance of positive impacts/benefits and mitigation measures to reduce the significance of negative impacts, have to be identified based on the framework in Figure 5.7 below.
FIGURE 5.7: IMPACT MITIGATION FRAMEWORK
Source: UNEP, 2002
In accordance with the impact mitigation framework above (Figure 5.7):
• Avoidance is the most desirable option for impact mitigation (i.e., avoid adverse impacts as far as possible through the use of preventative measures that include structural measures, such as design or location changes. For example, diverting a pipeline from a national park to a less sensitive area, engineering modifications, construction of stacked chimneys to avoid air pollution and landscape or site treatment, site leveling to avoid soil erosion).
• Minimize or reduce adverse impacts to 'as low as practicable' levels as possible by using non-structural measures, such as economic incentives, legal, institutional and policy instruments, provision of community services and training and capacity building.
USAID/UGANDA: ENVIRONMENTAL MANAGEMENT FOR THE OIL SECTOR – TRAINING COMPENDIUM: MODULE 4 261

• Remedy or compensate for adverse residual impacts, which are unavoidable and cannot be reduced further (e.g., compensate for large-scale clearing by planting trees in another area).
Example of Impact Mitigation
Impact: Noise will be generated by project activities in the immediate vicinity of the site which is located within the national park, a wildlife protected area where the major land use type is tourism, as well as at greater distances, on a species-specific basis. This noise could interfere with animal communication and auditory capacity potentially resulting in decreased reproduction, increased or decreased hunting success of predators, altered behavior, and consequential injury or mortality of wildlife. Fauna most likely to be affected include; fauna living below the soil surface, burrowing mammals, birds, and of most importance, elephants. Elephants are particularly sensitive to noise and vibrations even of the subsonic type.
Impact significance: The intensity of this impact is medium and the sensitivity of the receptor is high, resulting in a major impact severity before mitigations.
Mitigation measures:
• Ensure adherence to national noise regulations as stipulated in the National Environment (Noise Standards and Control) Regulations of 2003.
• Acoustic insulation (e.g., screens or bunds) will be deployed when necessary, especially portable generators and compressors, when possible. Equipment will be operated with all noise-reducing components (hoods, screens) in the correct position.
• Noisy equipment (e.g., generators) will be sited with regard to the presence of sensitive receptors whenever possible.
Impact significance: With implementation of the above mitigation measures, the residual severity will be reduced to moderate
Environmental and Social Management and Monitoring Plan
The Environmental and Social Management and Monitoring Plan (ESMMP) is an environmental management tool used to ensure that undue or reasonably avoidable adverse impacts of a project are prevented; and that the positive benefits of the project are enhanced (Lochner, 2005).
The ESMMP is drawn up after the ESIA and can be developed as a stand-alone document or as part of the ESIA Report/ESIS.
Uganda’s EIA Regulations of 1998 do not specify the need for an ESMMP. However, best international practice such as the International Finance Corporation Performance Standard (IFC PS) 1 requires the establishment of an Environmental and Social Management System that incorporates management programs which will establish Environment and Social Action Plans/Management Plans.
Despite, the omission in the EIA Regulations of 1998 regarding the need for an ESMMP, Section 15 of the Draft EIA Regulations (August 2014) states that, “The developer shall submit to NEMA an environmental management plan on approval of the ESIA”common practice in Uganda is for the ESIA Report/ESIS to contain an ESMMP (as a separate stand-alone chapter), as required by the authorities.
The ESMMP is developed for all phases of the project (e.g., mobilization/construction, operations, and decommissioning/demobilization).
USAID/UGANDA: ENVIRONMENTAL MANAGEMENT FOR THE OIL SECTOR – TRAINING COMPENDIUM: MODULE 4 262
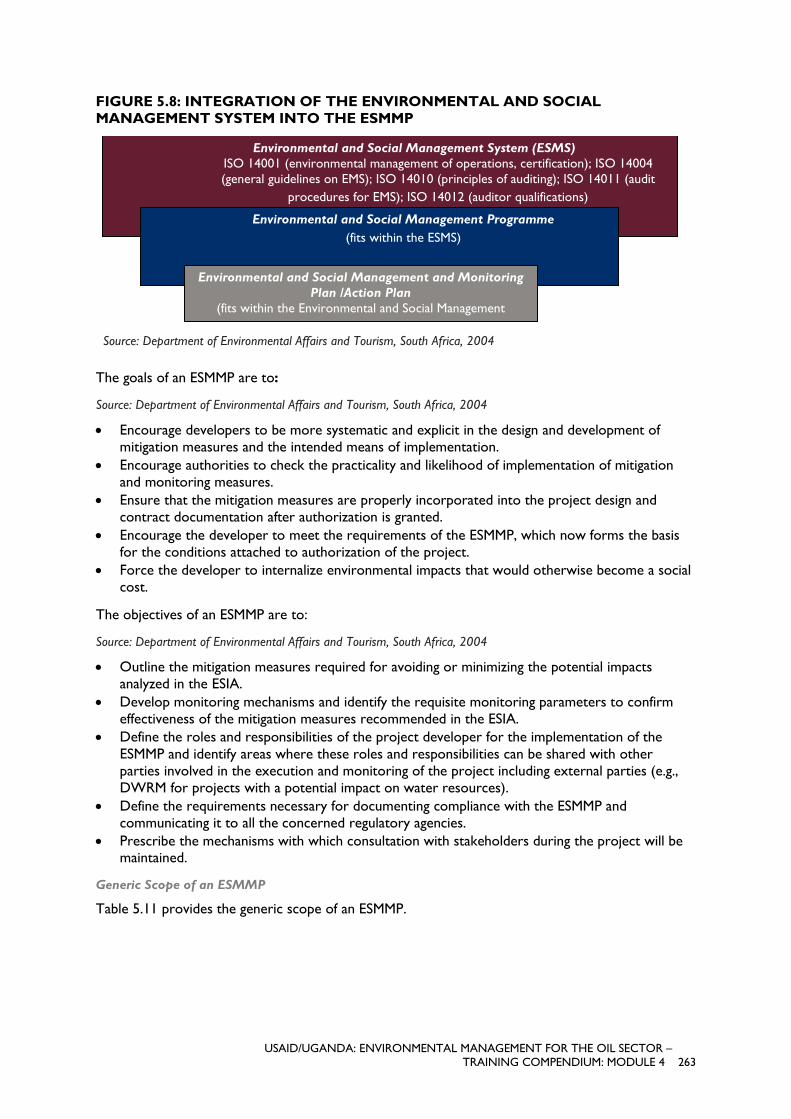
FIGURE 5.8: INTEGRATION OF THE ENVIRONMENTAL AND SOCIAL MANAGEMENT SYSTEM INTO THE ESMMP
Source: Department of Environmental Affairs and Tourism, South Africa, 2004
The goals of an ESMMP are to:
Source: Department of Environmental Affairs and Tourism, South Africa, 2004
• Encourage developers to be more systematic and explicit in the design and development of mitigation measures and the intended means of implementation.
• Encourage authorities to check the practicality and likelihood of implementation of mitigation and monitoring measures.
• Ensure that the mitigation measures are properly incorporated into the project design and contract documentation after authorization is granted.
• Encourage the developer to meet the requirements of the ESMMP, which now forms the basis for the conditions attached to authorization of the project.
• Force the developer to internalize environmental impacts that would otherwise become a social cost.
The objectives of an ESMMP are to:
Source: Department of Environmental Affairs and Tourism, South Africa, 2004
• Outline the mitigation measures required for avoiding or minimizing the potential impacts analyzed in the ESIA.
• Develop monitoring mechanisms and identify the requisite monitoring parameters to confirm effectiveness of the mitigation measures recommended in the ESIA.
• Define the roles and responsibilities of the project developer for the implementation of the ESMMP and identify areas where these roles and responsibilities can be shared with other parties involved in the execution and monitoring of the project including external parties (e.g., DWRM for projects with a potential impact on water resources).
• Define the requirements necessary for documenting compliance with the ESMMP and communicating it to all the concerned regulatory agencies.
• Prescribe the mechanisms with which consultation with stakeholders during the project will be maintained.
Generic Scope of an ESMMP
Table 5.11 provides the generic scope of an ESMMP.
Environmental and Social Management System (ESMS) ISO 14001 (environmental management of operations, certification); ISO 14004 (general guidelines on EMS); ISO 14010 (principles of auditing); ISO 14011 (audit
procedures for EMS); ISO 14012 (auditor qualifications)
Environmental and Social Management Programme (fits within the ESMS)
Environmental and Social Management and Monitoring Plan /Action Plan
(fits within the Environmental and Social Management
USAID/UGANDA: ENVIRONMENTAL MANAGEMENT FOR THE OIL SECTOR – TRAINING COMPENDIUM: MODULE 4 263

TABLE 5.11: GENERIC SCOPE OF AN ESMMP
Scope Example Definition of the environmental management objectives to be realized
Maintain the water quality of the nearby Lake Albert.
Description of the detailed actions needed to achieve these objectives
Treat all wastewater generated from project operations to the set standard in line with the requirements of the National Environment (Standards for Discharge of Effluent into Water or on Land) Regulations, 1999 before discharge into the environment.
Clarification of roles and responsibilities Environment Site Officer to monitor wastewater discharge into the environment.
Description of the link between the ESMMP and associated legislative requirements
The National Environment (Waste Management) Regulations of 1999 require that wastes are disposed of in such a way that they do not contaminate water, soil, and air or impact public health.
Requirements for record keeping, reporting, reviewing, auditing and updating of the ESMMP
Record keeping: Maintain daily records of the quality of wastewater generated (for the parameters included in the wastewater management and monitoring plan) specifically the quality of wastewater discharged from the facility. Reporting: Submit an annual wastewater discharge report to the DWRM detailing, the quality of effluent discharged, when discharge occurred, and the Lake Albert water monitoring results. Reviewing: Review the effluent characteristics. Auditing: Undertake annual audits against the requirements of the facility’s wastewater discharge permit. Updating the ESMMP: Update the ESMMP in line with the changes in the relevant applicable legislation.
Preparation of an ESMMP
There is no standard format for ESMMPs, the format of an ESMMP needs to fit the circumstances in which the ESMMP is being developed and the requirements that it is designed to meet.
The level of detail in the ESMMP may vary from a few pages for a project with low project-related environmental risks; to a substantial document for a large-scale complex project with potentially high environmental risks. Small projects of low environmental risks (e.g., well testing) require a once off ESMMP which focuses on the activities, whereas large projects with high environmental risks (e.g., exploration drilling) require three distinct ESMMPs: mobilization/construction, operations, and decommissioning/demobilization. Large projects that involve numerous sub-contractors can have a number of separate management plans for different areas (waste, stormwater among others).
Format of an ESMMP
This section provides an overview of information that should be included in an ESMMP.
A. Overview of the proposed project and the local context
In order to place the ESMMP in context, a brief summary of the proposed project and associated processes involved in project implementation should be provided. This should cover project location, layout plans, project phases, construction activities, operational processes and activities, employment and labor, directly associated infrastructure, and project schedule.
A brief description of the affected environment should also be provided, particularly those elements of the environment that may be impacted by the project and which should therefore be included in the monitoring program.
USAID/UGANDA: ENVIRONMENTAL MANAGEMENT FOR THE OIL SECTOR – TRAINING COMPENDIUM: MODULE 4 264

B. Summary of impacts associated with the proposed project
A summary should be provided of the predicted positive and negative impacts associated with the proposed project that require management actions. The necessary information should be obtainable from the ESIA process. Although the ESIA may cover the construction, operation and decommissioning phases of the proposed project, separate ESMMPs are prepared for each of the three phases.
C. Project Developer’s environmental management policies and commitments
Summarize the project developer’s existing policies, guidelines, and commitments relating to health, safety, and environment.
Provide an overview of:
• Corporate governance structure of the project developer, to convey the hierarchy of responsibilities within the organization for matters related to health, safety and the environment;
• Organization guidelines or policies relating to health, safety and the environment; and • Environmental commitments of the parent company/organization for that particular project.
D. Institutional arrangements: roles and responsibilities
The roles and responsibilities of the key parties involved in the implementation of the ESMMP must be clearly defined.
A flow diagram should be included showing responsibilities and communication channels.
Where specific ESMMP responsibilities are assigned to Contractors or Sub-contractors, these must be clearly stipulated and included in the contract documentation (e.g., the Contractor shall be bound by all the environmental legislation bound by the client).
The ESMMP must specify responsibilities for the range of actions specified in the ESMMP. It is recommended that the roles and responsibilities of key members of the project developer and Contractor’s team involved in implementing the ESMMP be written up as ToR for each job function. Having ToR is also important in facilitating continuity when there is a change in personnel. Examples of ToR for a job function such as a site Health and Safety Officer include but are not limited to:
• To promote project occupational health and safety and develop safer and healthier ways of working;
• To inspect workplaces and workplace equipment, such as scaffolding, to ensure they meet safety regulations and to identify hazards and risks;
• To ensure that workplaces conform with organizational procedures and safety standards; • To work with engineers and other professionals to ensure the safety of worksites and work
practices; • To ensure personal protective equipment (such as hearing protection, dust masks, safety glasses,
footwear and safety helmets), is being used in workplaces according to regulations; • To ensure that dangerous materials are correctly stored; • To identify and test work areas for potential accident and health hazards, such as toxic fumes
and explosive gas-air mixtures, and implement appropriate control measures; • To ensure an organization is aware of, and complies with, all legislation relating to its duty of
care, workplace activities and the use of its facilities, equipment and substances; • To record and report hazards, accidents, injuries and health issues within the workplace; • To assist with the investigation of accidents and unsafe working conditions, study possible causes
and recommend remedial action; • To conduct training sessions for management, supervisors and workers on health and safety
practices and legislation; • To assist with the rehabilitation of workers after accidents or injuries and make sure they
experience a satisfactory return to work;
USAID/UGANDA: ENVIRONMENTAL MANAGEMENT FOR THE OIL SECTOR – TRAINING COMPENDIUM: MODULE 4 265

• To coordinate emergency procedures, firefighting and first aid crews; • To communicate frequently with management to report on the status of occupational health and
safety programs; and • To develop occupational health and safety systems, including policies, procedures and manuals.
E. Legal requirements
The authorization to undertake the implementation of the project may be subject to compliance with other environmental legislation, such as legislation related to: water; air quality; hazardous substances; storage, transport and disposal of waste; occupational health and safety; traffic and transportation; cultural and heritage resources; and noise.
Compliance with environmental legal requirements is an essential project consideration and therefore needs attention in the ESMMP. Failure to meet legal environmental requirements could result in the environmental authorization for the project being withdrawn and effectively result in operations having to cease until such non-compliances are addressed.
The relevant legal requirements could stem from the requirements of national or local government. International compliance requirements could also apply. For example, if the World Bank is a lender to a proposed project, the Bank’s various guidelines would apply, which include:
• The World Bank Operational Policy 4.36, Forests, 2002; • The World Bank Operational Policy 4.01 Environmental Assessment (EA), 1999; • The World Bank Operational Policy 4.12, Involuntary Resettlement, 2001; and • The World Bank Operational Policy 4.11, Physical Cultural Resources, 2006.
F. Implementation Program
This presents the objectives to be achieved through the ESMMP and the management actions that need to be implemented in order to mitigate the negative impacts and enhance the benefits of the project. Associated responsibilities, monitoring, criteria/targets and timeframes are clearly specified.
The implementation program (Annex 6) provides the core of the ESMMP and should include a description of the following:
• Objectives; • Management actions; • Responsibilities for the identified actions; • Monitoring; • Performance specifications; and • Implementation schedule.
The ESMMP should provide objectives to be achieved through the management of project activities and risk sources. These objectives are based on managing the environmental impacts identified inter alia through the ESIA process; and specify the desired outcomes from effectively minimizing the negative impacts and enhancing the positive impacts.
Management actions (e.g., undertake daily tool box talks specific to the construction activity that will be undertaken on that particular day) are actions that are feasible, practical and cost effective, and need to be implemented in order to achieve the objectives described above. These actions are based on the mitigation and enhancement actions identified in the ESIA, together with additional information that may become available subsequent to completing the ESIA.
The ESMMP must also specify a program for implementing (Annex 6) the management actions, including: who, when and how; as well as what resources should be allocated.
USAID/UGANDA: ENVIRONMENTAL MANAGEMENT FOR THE OIL SECTOR – TRAINING COMPENDIUM: MODULE 4 266

G. Cost estimates and financial resources
For the project developer to understand the implications of the mitigation and enhancement measures, cost estimates should be specified for both the initial investment and recurring expenses for implementing the mitigation and enhancement measures contained in the ESMMP.
The costs of initial and recurring expenses for implementing an ESMMP should be included in the overall project costs. Recurring expenses include all costs associated with meeting specific project criteria.
For certain projects (especially large-scale, long-term and high environmental risk oil and gas projects such as oil processing and production projects that have infrastructure such as Central Processing Facilities, refineries and pipelines) the budget should include environmental management contingency funds, which would be available for the implementation of remedial actions when mitigation measures are not sufficiently effective or when unanticipated impacts occur.
The World Bank advocates that, where feasible decisions regarding the most appropriate mitigation measures should be justified by an economic evaluation of the potential environmental impacts and mitigation options. This evaluation would probably only apply to projects with high environmental risk and should:
• Evaluate the costs and benefits of the potential environmental impacts. • Compare the cost-effectiveness of the different mitigation options. • Determine the appropriate level of mitigation where there is scope for a trade-off between
environmental quality and the costs and benefits of achieving it. • Internalize the economic value of residual impacts or intended environmental improvements into
the final economic appraisal of the project.
The costing should be undertaken with input from appropriate technical members of the project team. These technical advisors should possess knowledge of the management actions being recommended as well as practical experience in implementing similar measures and techniques.
Annex 6 provides an illustration of an ESMMP for the construction, operational and decommissioning phases of an oil and gas project.
Contents of the ESIS/ESIA Report
According to UNEP (2002), the ESIA report or impact statement is a keystone document which assembles the information that assists:
• The project developer in managing the impacts of the proposed project; • The responsible/compentent authority in decision-making and condition setting; and • The public in understanding the likely impacts of the proposed project.
The purpose of the ESIA report is therefore to provide a coherent statement of the potential impacts of the proposed project and the measures that can be taken to reduce and remedy them. A successful ESIA report will be:
• Actionable: a document that can be applied by the project developer to achieve environmentally sound planning and design;
• Decision-relevant: a document that organizes and presents the information necessary for project
authorization and, if applicable, permitting and licensing; and • User-friendly: a document that communicates the technical issues to all parties in a clear and
comprehensible way.
Typically, the content of an ESIA report will be prepared in accordance with specific ToR established during the scoping process. It may also include additional issues and other matters that have emerged
USAID/UGANDA: ENVIRONMENTAL MANAGEMENT FOR THE OIL SECTOR – TRAINING COMPENDIUM: MODULE 4 267

as a result of the ESIA studies and which therefore need to be taken into account in decision-making. An ESIA report typically includes many or all of the following headings and items (UNEP, 2002):
• Executive or non-technical summary (which may be used as a public communication document); • Statement of the need for, and objectives of, the proposed project; • Reference to applicable legislative, regulatory and policy frameworks; • Description of the proposed project and how it will be implemented (construction, operation
and decommissioning); • Comparison of the proposed project and the alternatives to it (including the no action
alternative); • Description of the project setting, including the relationship to other project proposals, current
land-uses and relevant policies and plans for the area; • Description of baseline conditions and trends (biophysical, socio- economic etc.), identifying any
changes anticipated prior to project implementation; • Review of the public consultation process, the views and concerns expressed by stakeholders and
the way these have been taken into account; • Consideration of the main impacts (positive and adverse) that are identified as likely to result
from the proposed project, their predicted characteristics (e.g., magnitude, occurrence, timing
etc.) proposed mitigation measures, the residual effects and any uncertainties and limitations of data and analysis;
• Evaluation of the significance of the residual impacts, preferably for each alternative, with an identification of the best practicable environmental option;
• An EMP that identifies how proposed mitigation and monitoring measures will be translated into specific actions as part of impact management; and
• Appendices containing supporting technical information, description of methods used to collect and analyse data, list of references, etc.
For the Ugandan context, the required contents of the ESIS/ESIA Report are as stipulated in Regulation 14 of the EIA Regulations of 1998 (refer to Annex 4).
Phase 3: Decision Making
Review (Part V of EIA Regulations of 1998)
The ESIS/ESIA Report is submitted to the Competent Authority (NEMA) for review. NEMA
forwards copies of the ESIS to other key lead agency(s) such as PEPD, DWRM, and the Department of Museums and Monuments etc. for review and comment as well, where applicable.
The purpose of the review process is to establish if the information in the ESIS is sufficient for decision-making. The key objectives are therefore to:
• Review the quality of the ESIS. • Take account of stakeholder comments. • Determine if the information provided is sufficient. • Identify any deficiencies that may need correction.
The aspects to consider during ESIS review include:
• Compliance with the NEMA approved ToR; • Information is accurate and technically sound; • Consideration of stakeholder comments; • Complete and satisfactory statement of key findings; • Clear and understandable information; and • Sufficient information for decision-making.
USAID/UGANDA: ENVIRONMENTAL MANAGEMENT FOR THE OIL SECTOR – TRAINING COMPENDIUM: MODULE 4 268

ESIA Review Criteria
The following considertaions/criteria (Table 5.12) can guide ESIA review and based on the answers to the criteria in Table 5.12, the ESIS is rated according to the rating scale as provided in Table 5.13.
TABLE 5.12: ESIA REVIEW CRITERIA AND RATING SCALE
Principles of a Good ESIA
There are 15 basic principles which apply to all stages of ESIA, and should be applied as a whole package:
1. Is the ESIA purposive? 2. Did the ESIA inform decision-making? 3. Rigorous – Did the process employ ‘best practicable’ methods, given the time, budget and scope
limitations? 4. Efficient –The ESIA should impose minimum cost burdens in time and finance on developers,
provided it meets accepted ESIA requirements. Did it take too long or cost too much?
Considerations/Criteria Rating Scale Excellent Good Satisfactory Poor Very poor No opinion
Does the report address the ToR? Is the necessary information provided for each major component of the ESIS?
Is the information correct and technically sound?
Has the public and stakeholder involvement been adequate?
Has the scoping phase been adequate? Have the views and concerns of interested and affected parties been taken into account?
Has an adequate comparison of alternatives been undertaken?
Is the impact prediction adequate? Are the criteria used to evaluate the significance of impacts adequate?
Is the statement of the key findings complete and satisfactory (e.g., for significant impacts)?
Are the proposed mitigation measures practical and will they be effective?
Are the requirements for monitoring and impact management clearly outlined?
Is the information clearly presented and understandable by decision makers and the public?
Is the information relevant and sufficient for the purpose of decision-making and condition setting?
Key: • Excellent (thoroughly and competently performed); • Good (minor omissions and deficiencies); • Satisfactory (some omissions and deficiencies); • Poor (significant omissions and deficiencies); • Very Poor (fundamental flaws and weaknesses); and • No opinion (insufficient basis/experience on which to make a judgement).
USAID/UGANDA: ENVIRONMENTAL MANAGEMENT FOR THE OIL SECTOR – TRAINING COMPENDIUM: MODULE 4 269

5. Practical – Did the ESIA process result in outputs that can be implemented? Were the recommendations in the ESMMP practical?
6. Cost Effective – Did the study achieve the objectives of ESIA within the limits of available time, resources and methodology?
7. Focused – Did the ESIA concentrate on significant environmental effects and key issues? 8. Adaptive – Did the ESIA process adapt to the realities, issues and circumstances of the project
proposal under review without compromising the integrity of the process? Did it recommend or generate other alternatives, accommodate stakeholder concerns or deal with critical issues proactively?
9. Participative – Did the process provide appropriate opportunities to inform and involve stakeholders, and were their inputs and concerns addressed explicitly in the documentation and decision-making?
10. Interdisciplinary – Did the ESIA use experts from various fields to deal with issues raised by stakeholders? This should include traditional knowledge sources.
11. Credible – Was the process carried out with professionalism, rigor, fairness, objectivity, impartiality and balance, and was it subject to independent checks that allow this to be determined?
12. Integrated – Did the ESIA address the interrelationships of social, economic and biophysical aspects, or did it focus on a few selected disciplines? (too much focus on social or biological aspects)
13. Transparent – Did the ESIA ensure that public access to information was possible, and in so doing, identify factors that were taken into account in decision-making. Did it acknowledge limitations and difficulties? Was it an issues driven assessment?
14. Systematic – Did the ESIA fully consider all relevant information on the affected environment, of proposed alternatives and their impacts and of the measures necessary to monitor and investigate residual effects?
15. Independent – Was the ESIA process as unbiased as possible?
The five operating principles, which explain how the above-mentioned basic principles should be applied to the main steps of the ESIA process, are, that the ESIA process should be applied:
1. As early as possible in decision-making and throughout the lifecycle of the proposed activity; 2. To all project proposals that may cause potentially significant effects; 3. To biophysical impacts and relevant socioeconomic factors, including health, culture, gender,
lifestyle, age and cumulative effects consistent with the concepts of sustainable development; 4. In a manner that provides for the involvement and input of communities and industries affected
by a proposal as well as the public; and 5. In accordance with internationally agreed measures and activities.
Application of the above principles should be able to answer the objectives of IFC Performance Standard One (IFC PS 1- Assessment and Management of Environmental and Social Risks and Impacts) whose objectives are:
• To identify and evaluate environmental and social risks and impacts of the project; • To adopt a mitigation hierarchy to anticipate and avoid, or where avoidance is not possible,
minimize, and, where residual impacts remain, compensate/offset for risks and impacts to workers, affected communities, and the environment;
• To promote improved environmental and social performance of clients through the effective use of management systems;
• To ensure that grievances from affected communities and external communications from other stakeholders are responded to and managed appropriately; and
• To promote and provide means for adequate engagement with affected communities throughout the project cycle on issues that could potentially affect them and to ensure that relevant environmental and social information is disclosed and disseminated.
USAID/UGANDA: ENVIRONMENTAL MANAGEMENT FOR THE OIL SECTOR – TRAINING COMPENDIUM: MODULE 4 270

Decision (Part VI of the EIA Regulations of 1998)
Following NEMA (and where applicable, additional relevant lead agency) review of the ESIA report/ESIS, NEMA may decide to:
• Require that the project be re-designed; • Refer back the project or part thereof to the developer where there is insufficient information
for further study; • Reject the project; or • Approve the project or part thereof – grant authorization in respect of all or part of the activity
with conditions attached (called the Certificate of Approval – Annex 7 ).
Contents of a Project Brief (Section 5 of EIA Regulations, 1998)
Preparation of project brief
1) A developer shall prepare a project brief stating, in a concise manner: a. The name, purpose, and nature of the project in accordance with the categories identified in
the Third Schedule of the Act and the First Schedule to the Regulations; b. The proposed location of the project including the projected area of land and air that may
be affected by the project’s activities, or if it is: i. A linear activity, a description of the route of the activity, or ii. A water-based activity, the coordinates within which the activity is to be undertaken;
c. The activities that shall be undertaken during the construction, operation, and decommissioning phases of the project;
d. The design of the project; e. The materials that the project shall use, including both construction materials and process
inputs; f. The possible products and by-products, include waste generated by the project and the
methods of their disposal; g. The manner in which the proposed project and its location conform to existing laws and
policies governing such projects; h. The alternative which are being considered; i. The number of people that the project will employ and the economic and social benefits to
the local community and the nation in general; j. The environmental effects of the materials, methods, products, and by-products of the
project, and how they will be eliminated or mitigated during and after the implementation of the project;
k. An Environmental Management Plan, which addresses all possible impacts of the project in that particular location and the neighboring communities;
l. The project budget; m. Proof of stakeholder consultations; n. Any other matter which may be required by the Authority.
2) In preparing the project brief, the developer shall pay particular attention to the issues specified in the Second Schedule to the regulations.
Submission of project brief
1) The developer shall submit ten copies of the project brief to the Executive Director. 2) If the Executive Director deems the project brief to be complete, he may transmit a copy of the
project brief to the lead agency for comments within seven working days of receiving the project brief.
USAID/UGANDA: ENVIRONMENTAL MANAGEMENT FOR THE OIL SECTOR – TRAINING COMPENDIUM: MODULE 4 271

Amended Contents of a Project Brief (Amended EIA Regulations)
Source: Government of Uganda, 1998
USAID/UGANDA: ENVIRONMENTAL MANAGEMENT FOR THE OIL SECTOR – TRAINING COMPENDIUM: MODULE 4 272

USAID/UGANDA: ENVIRONMENTAL MANAGEMENT FOR THE OIL SECTOR – TRAINING COMPENDIUM: MODULE 4 273

USAID/UGANDA: ENVIRONMENTAL MANAGEMENT FOR THE OIL SECTOR – TRAINING COMPENDIUM: MODULE 4 274

USAID/UGANDA: ENVIRONMENTAL MANAGEMENT FOR THE OIL SECTOR – TRAINING COMPENDIUM: MODULE 4 275

USAID/UGANDA: ENVIRONMENTAL MANAGEMENT FOR THE OIL SECTOR – TRAINING COMPENDIUM: MODULE 4 276

USAID/UGANDA: ENVIRONMENTAL MANAGEMENT FOR THE OIL SECTOR – TRAINING COMPENDIUM: MODULE 4 277

USAID/UGANDA: ENVIRONMENTAL MANAGEMENT FOR THE OIL SECTOR – TRAINING COMPENDIUM: MODULE 4 278

Contents of an ESIS (Section 14 of EIA Regulations, 1998)
USAID/UGANDA: ENVIRONMENTAL MANAGEMENT FOR THE OIL SECTOR – TRAINING COMPENDIUM: MODULE 4 279

Examples of ESMMP
USAID/UGANDA: ENVIRONMENTAL MANAGEMENT FOR THE OIL SECTOR – TRAINING COMPENDIUM: MODULE 4 280

Assessment and Monitoring of Socioeconomic Impacts
FIGURE 5.9: FARMLAND IMPACTED BY SHELL OIL SPILLAGE, NIGER DELTA, NIGERIA
Source: Premium Times, 2015
USAID/UGANDA: ENVIRONMENTAL MANAGEMENT FOR THE OIL SECTOR – TRAINING COMPENDIUM: MODULE 4 281

FIGURE 5.10: DRINKING WATER AFFECTED BY OIL SPILLAGE, NIGER DELTA, NIGERIA
Source: Ajakaiye, 2008
What Is a Social Impact Assessment?
Source: IPIECA, 2004
“SIAs are appraisals of the likely impact that oil and gas operations might have on the societies of host countries, regions, and communities. These impacts can be direct and indirect, intended and unintended, positive and negative. Ideally, every SIA is a participative study with local, national, and international stakeholders, as appropriate. An SIA can be used at any stage of the industry life cycle: a new country entry, an exploration phase, a new development activity, change to an existing activity or the decommissioning or closure of an existing operation. An SIA identifies ways to mitigate any adverse social impacts and enhance positive ones.”
“An effective SIA optimizes the design of oil and gas operations to account for potential social impacts. It also ensures that stakeholder views are incorporated and addressed throughout the project lifecycle. Typically, SIAs address issues such as:”
• “Demographics: Changes in size and make-up of population due to migration of people in search of work, emigration from an area as the result of safety or security issues or any other reasons.
• Socioeconomic:
− Taxes and royalties; expected payments to different levels of government (national, regional, local); time profile of payments
− Supply chain impacts; local sourcing opportunities; potential inflationary impacts on local markets for goods and services; impact on non-oil and gas sector (Dutch Disease)
− Employment; labor practices; changes in existing industries as workers shift from traditional industries to oil and gas activities; movement of other necessary workers (e.g., teachers and police) into the oil and gas industry as translators or security personnel; return of construction workers to lower end jobs
− Time profile of projects; construction boom; operation phase; decommissioning; potential oil and gas dependency
USAID/UGANDA: ENVIRONMENTAL MANAGEMENT FOR THE OIL SECTOR – TRAINING COMPENDIUM: MODULE 4 282

• Health: Spread of new diseases to indigenous communities, impacts on health of operations personnel, impact of local diseases on workers and the spread of pandemics such as HIV and STDs.
• Social infrastructure: Adequacy of health care and education facilities, transport and roads, power supply, fresh water supply to support project activities and personnel as well as the community.
• Resources: Land-take for facilities and resettlement, new or increased access to rural or remote areas, use of natural resources.
• Psychological and community aspects: Changes from traditional lifestyles, community cohesion, attitudes and behavior, perception of risk.
• Cultural property: Sites and structures with Archeological, historical, religious, cultural, or aesthetic values that may be change or have their access limited.
• Social equity: Identifying who gains and who loses as a result of the project or operation.”
When to Carry Out the SIA
Source: IPIECA, 2004
“Ideally, the decision to do an SIA should be taken at a project’s conception. Existing operations that did not involve SIA at the project stage can be screened at any stage. Such screening should identify any legal or contractual requirements to carry out an SIA and the scope and complexity of potential social issues that need to be considered by more detailed study. Some form of SIA should be carried out on all major projects whether legislated or not.”
“A number of different impact assessments can be needed for the same activity. Therefore, it makes sense to integrate the studies. In many cases, there is some synergy among different assessments in methodology and scope. In all instances, the results of such impact assessments need to be integrated to optimize project operations planning.”
“The decision to integrate the SIA process with other impact assessments is not straightforward and consideration needs to be given to such factors as:
• The scope and complexity of social issues identified at the initial activity screening. A greater scope and complexity may lend itself to a separate SIA.
• Any legal, licensing, contractual, or financing requirements. Where more than one set of requirements exist these may not be consistent. In such circumstances, it may be necessary to negotiate a consistent requirement with all relevant stakeholders.
• The availability of resources to provide integrated or separate impact assessment teams and the resources to manage integrated or separate teams.
• The ability to integrate these activities with other project activities such as socioeconomic baseline and resettlement baseline surveys with initial project land acquisition surveys.
• The needs of the project or activity schedule. In particular, time scales for stakeholder engagement with respect to social issues may be significant compared to the time scales required for other impact assessments.”
“Differing opinions exist as to whether it is best to integrate an SIA with other forms of impact assessment. However, within the oil and gas industry, there is a trend towards integrating SIAs, EIAs, and HIAs. Ultimately, the decision to integrate an SIA with other impact assessments will be specific to the company and the project.”
Functions/Importance of ESIA
Source: IPIECA, 2004
“The primary function of an EIA is to avail both the developer and authorities such as NEMA and the Town Planners, the opportunity to choose projects with the full knowledge of their impact on the environment. It also enables the relevant authorities to decide whether to al ow the project to
USAID/UGANDA: ENVIRONMENTAL MANAGEMENT FOR THE OIL SECTOR – TRAINING COMPENDIUM: MODULE 4 283

proceed or not. This will save the developer time and costs that would have been incurred and enables him/her to develop plans and policies for mitigation such impacts.”
“EIA enables developers and decision makers to predict and assess the potential impacts of the project on the well-being of the natural environment and also helps them identify alternatives through recommending the implementation of appropriate modifications/actions that integrate economic, social, and environmental concerns.”
“EIA is designed to enable the environmental effects of a project to be weighed on a common gauge with economic costs and benefits.”
“It is a legal requirement for any project that is likely to have undesirable effects on the environment to carry out an EIA. Hence, any developer found to disregard the law will have legal action taken against him or her.”
Impact of Oil and Gas Exploration
Source: IPIECA, 2004
“There both positive impacts and negative impacts on people and environment
The potential impacts of oil and natural gas exploration activities all originate from:
• Plants • Animals • Soil, air quality • Water quality • Social-economic impacts
Environmental Monitoring under the National Environment Act is defined as the continuous determination of actual and potential effects of any activity on the environment whether short or long-term.”
Impact on Animals and Plants
Source: Atukunda et al., 2001
“Animal and plant communities may be directly affected by changes in their environment through variations in water, during the construction or air and building of the drill site, grass and soil quality trees are cleared and cut. This and through disturbance by noise, light usually results into loss of and changes in vegetation cover, vegetation, important plants like herbs and grazing pastures.”
“Such changes may directly affect the surrounding environment of the plants and animals for example the area where these plants and animals live, their food and nutrient supplies, the area where they breed, mitigation routes, or changes in grazing patterns which may have secondary effect on predators.”
Impact on the Animals
Source: Atukunda et al., 2001
Animals that live within the community can be directly affected by changes in their environment. The construction or building phase experiences vibrations from the drilling rig and movement of heavy trucks. The noise and air pollution may disturb the birds.
Impacts on Agriculture
Source: Atukunda et al., 2001
Most rural areas in Uganda practice small-scale agriculture as their main source of livelihood. The main crops grown in the area where oil exploitation is occurring include cassava, maize, tomatoes, beans, sweet potatoes, groundnuts and cash crops such as tobacco and sisal. There is also the rearing of cattle, goats, sheep, poultry, and pigs. Large-scale agriculture is also carried out on large commercial
USAID/UGANDA: ENVIRONMENTAL MANAGEMENT FOR THE OIL SECTOR – TRAINING COMPENDIUM: MODULE 4 284

farms e.g., tea, tobacco and sugarcane. If there is no proper planning in place, oil exploration could have negative impacts on agricultural activities in the community.
Impacts on Soil
Source: Atukunda et al., 2001
• There will be impacts on soil during the construction or building and operation of the oil drilling site. The removal of soil during grading activities for the building of the access roads and the drilling pad will be a negative direct effect; that will lead to loss of vegetation, loss of grazing land for wildlife and will also lead to increase in dust.
• During the building of the drilling pad, heavy vehicle movements will impact on topsoil by compacting it and by removal of the vegetation exposing the soil to erosion by wind and surface water flow.
• Grading and removing of soil has the potential of altering drainage patterns, which could result in increased soil erosion and in silting of wetlands and streams.
• Fuel spillage and leakage may also occur due to human error or faulty equipment. • Maintenance chemicals such as oil and lubricants may also spill onto the ground. Any spillage or
leakage will lead to soil contamination leading to loss of vegetation, loss of grazing land and can also lead to surface water and ground contamination thereby impacting on water sources for wildlife.
Impact on Air Quality (Atmospheric Impacts)
Source: Atukunda et al., 2001
In order to examine the likely impacts arising from oil and gas exploration activities, it is important to understand the sources and nature of the fumes coming from the oil exploration activities and their relative contribution to the surrounding air.
The primary sources of contamination of the surrounding air from oil and gas exploration activities arise from:
Flaring
Source: Atukunda et al., 2001
This means to burn with a bright flame for a short time. During oil exploration activities, there may be flaring (a sudden light or flame).
Atmospheric impacts several times continuously it has an impact on the will affect the air surrounding air in the environment.
USAID/UGANDA: ENVIRONMENTAL MANAGEMENT FOR THE OIL SECTOR – TRAINING COMPENDIUM: MODULE 4 285

FIGURE 5.11: GAS FLARING IN NIGERIA
Source: Okere, 2016
Venting
Source: Atukunda et al., 2001
The controlled release of gases into the atmosphere during oil and gas operations. The gases may be natural or other hydrocarbon vapors, water vapor, and other gases such as carbon dioxide separated during the processing or natural gas. Natural gases produced during venting are released directly into the atmosphere and not burned.
Combustion Process
Source: Atukunda et al., 2001
This is the act of catching fire and burning. During oil drilling activities, there are several machines that are used to drill into the ground and to carry out other activities related to oil drilling and oil exploration, used up fumes from internal combustion engines. These include carbon monoxide and other gases. Machines such as generators for electricity, drill rig power transmission system to generate either direct power or electricity to power the rotary drive and the draw works use diesel engines and gas turbines. When they are used, they give off fumes and smoke that pollute the surrounding air.
Soil particles (dust) in the air from soil disorder during the construction of the oil exploration site and generated by wind and vehicle traffic, dust from other burning sources such as well testing, cement dust, dust from chemical additives to the mud system.
Impacts on Water Resources and Aquatic Life
This may be in two ways on surface water and ground water. Surface water is largely made up of lakes, rivers, streams, wells and ponds. Ground water on the other hand is water below the rocks (soil structure).
Potential impacts to surface water and groundwater may include direct contamination due to spills and leakages, and indirect contamination through contact with contaminated soil and ground\water.
Positive Impacts
Source: Atukunda et al., 2001
• Economic Empowerment: oil drilling and exploration activities will result into more money being spent within the area thereby improving the general income levels of the population.
USAID/UGANDA: ENVIRONMENTAL MANAGEMENT FOR THE OIL SECTOR – TRAINING COMPENDIUM: MODULE 4 286

There will be an increase in business opportunities for local traders to provide goods and services.
• Employment opportunities: the oil drilling and exploration activities will require both skilled and non-skilled labor for local personnel. The number of local jobs is likely to increase during the course of the activities.
• Infrastructure development: the corporate social responsibility of the oil and gas exploration companies (the developer) to the communities will be to respond to the provision, education, health facilities, among others.
Negative Impacts
Source: Atukunda et al., 2001
• The local labor force to be hired will be exposed to work related hazards. • Safety and health of the community and workers: if workers are not adequately trained or given
appropriate personal protection equipment, there is a potential risk exposure. • The population living along the mobilization route will be exposed to the risk of accidents from
moving vehicles.
Socio-Cultural Impacts
Source: Atukunda et al., 2001
• Socio-cultural fabric impact on the communities where it is exploited. During oil exploration activities, vegetation and top soil may be removed for instance during construction of access roads, and the drilling site. This may destruct some cultural sites. Consultations with communities about the local beliefs have to be undertaken to establish what beliefs or sacred places are in the area to be developed. This is because some of the removed vegetation and “holy” or sacred features like trees, rocks may serve as shrines. Some of these “holy” or sacred features such as rocks, hills, and trees may serve as homes to gods to whom the local people seek counsel for different reasons for instance, to be freed from diseases, bring rains good harvests among others. It is therefore important to consult the locals about traditional beliefs before such areas or features are destroyed.
• Population and demographics In-migration, out-migration, workers’ camps, social inclusion, growth or decline of towns, conflict and tensions between social groups Social infrastructure and services Demands on and investment in housing, skills (shortages and staff retention), childcare, health, education, and training
• Crime and social order; corruption, domestic violence, sexual violence, substance abuse and trafficking, prostitution, change in social norms, pace of change for vulnerable communities
• Culture and customs change in traditional family roles, changing production and employment base, effect of cash economy, reduced participation in civil society, community cohesion, sense of place, community leadership, cultural heritage
• Community health and safety disease, vehicle accidents, spills, alcohol and substance abuse, pollution, interruption to traditional food supply, awareness and treatment programs
• Labor Health and safety, working conditions, remuneration, right to assemble, representation in unions, labor force participation for women
• Gender and vulnerable groups disproportionate experience of impact and marginalization of vulnerable groups (e.g., women, disabled, aged, ethnic minorities, indigenous, and young), equity in participation and employment
• Human rights and security; Abuses by security personnel (government, Contractor, company), social disorder in camps, suppression of demonstrations, targeting of activists, rights awareness programs
Economic Change
• Distribution of benefits employment • Flow of profits, royalties, and taxes
USAID/UGANDA: ENVIRONMENTAL MANAGEMENT FOR THE OIL SECTOR – TRAINING COMPENDIUM: MODULE 4 287

• Training • Local business spending • Community development and social programs • Compensation • Managing expectations • Equitable distribution across state/regional/local/ethnic/family groups • Cash economy • Inflation/deflation housing (ownership and rents) • Food • Access to social services • Demands on infrastructure • Investment in, roads, rail, ports, sewerage, telecommunications, power and water supplies
Socio-Environmental Change
Source: Darling, 2011
• Pollution and Amenity. Air (e.g., dust), water (e.g., acid and metalliferous drainage, cyanide, submarine waste disposal), noise, scenic amenity, vibration, radiation, traffic, government capacity to monitor and regulate
• Resources (Access/Competition) Land. Mobility, water (groundwater, river, ocean), mineral resources (artisanal and small-scale mining), cultural heritage, forest resources, human, post-mining land use
• Resettlement Consent and Consultation for Resettlement. compensation, ties to land, adequacy of resettlement housing and facilities, equity, post-settlement conditions, livelihoods
• Disturbance. Disruption to economic and social activities (including by exploration), consultation for land access, frequency and timing, compensation
Analysis of Social-Economic Impact in Uganda
Source: Chindo, 2011
• Provision and Improvement of Infrastructure and Social Amenities. The availability of basic amenities and infrastructure in a community would add value and increase the aesthetic look of the communities; and support the community’s need for social interaction, as well as contribute to the physical well‐being and material comfort of local people. The major infrastructure facilities in this regard are roads, electricity, education, health, pipe‐borne water, and recreation facilities.
• Enhancement and Prosperity of Businesses. The communities believe that all the phases of oil mining can boost economic activity and create opportunities. Business enterprises, such as banks and mining equipment sellers’ opened‐up offices.
• Job Opportunities. Rush from traditional economic ways of living that are based on agriculture to rush in to the industry’s direct and induced jobs. Men and women, both young and old, are engaged in direct farming using local/primitive tools. In nearly all the communities, a large number of people are engaged in farming as their means of livelihood and source of food and petty income.
• Poverty Alleviation and Increased Personal Income. An investigation using the focus groups to determine the income characteristics was particularly difficult, as participants have no full understanding of their earnings from farm products.
Negative Social Impacts
Source: Chindo, 2011
• Loss of Communal Land. Loss of communal land for farming due to oil extraction involves the appropriation of huge swathes of indigenous lands, and displacement of communities within the oil license area, when in fact, local people depend on the land as a major source of food and
USAID/UGANDA: ENVIRONMENTAL MANAGEMENT FOR THE OIL SECTOR – TRAINING COMPENDIUM: MODULE 4 288

income. In reality some communities are still surviving, despite that oil is limiting, and in the extreme, preventing farming activities.
• Possible Displacement, Resettlement, and Compensation. In principle, oil extraction, like any other mining activity, requires a given area of land to excavate, which causes a significant change to the landscape and affects agricultural soils, and the related intense activity leads to the displacement of land and people.
• Proliferation of Social Vices, Crime, and Violence. Local communities are able to stay safe from armed bandits and robbers on the grounds that vigilante groups (voluntary local law enforcers, made up of mainly hunters) and deities safeguard life and property. The fear for the proliferation of crime as migrants from various social backgrounds arrive to participate in oil sands operations was a source of worry. In such instances there is little the vigilante can do to maintain law and order, hence the need for local police. Remote communities use their traditional justice system to decide about civil cases and deliver appropriate punishment based on customs for minor offences; serious cases such as murder are referred to the police and local authority by the committee of elders.
• Sexually Transmitted Diseases and HIV/AIDS. “Every industry has a spread of activities that, on a risk basis, may be ranked as being of greater or lesser significance in terms of HIV/AIDS transmission. With respect to the oil and gas industry, HIV/AIDS transmission risk is commonly linked to activities that are associated with a sudden increase in economic activity and employment, particularly in areas of high unemployment or where income of expatriates is high compared to that of local workers (e.g. construction activity in remote areas or developing countries); activities that increase the migration of a workforce, or otherwise permanently alter the population dynamics of the area (e.g. operation of a new production facility or refinery); activities that involve the regular transport of goods or material across distances (e.g. road distribution of petroleum products); and activities that separate employees from their partners for extended periods of time” (IPIECA/OGP, 2005).
Other areas of concern to the communities are about the effects of the destruction of protected areas, particularly places of worship and ancestral homes of their deities. Accordingly, such ancestral homes not only serve as places of worship but bring about social cohesion and serve as recreational spots for yearly events such as the yam festival—an annual celebration to mark the end of a farming season, which socially and spiritually unite the communities.
Managing and Monitoring the Oil and Gas Socioeconomic Impacts
Source: Kakuru et al., 2001
Environmental Monitoring and Impact Assessment
Develop an Environment Monitoring and Impact Assessment for every development project.
This part defines and sets out the role and usually has environmental procedures of the ESIA process for all activities impacts of the activity likely to harm or have an adverse impact.
Under the Environment Impact Assessment Guidelines, two systems of monitoring are specified; these are:
• Self-monitoring whereby the developers themselves are encouraged to monitor the impacts of their activities; and
• Enforcement monitoring done by government agencies such as NEMA through environment inspectors.
If the ESIA is written for the public, it must be brief and in simple language. If the ESIA is meant to inform it must be brief and in a simple and fully representative format. If meant for the developer, it must be written in such a way that difficult scientific and other technical information is easy to digest.
USAID/UGANDA: ENVIRONMENTAL MANAGEMENT FOR THE OIL SECTOR – TRAINING COMPENDIUM: MODULE 4 289

Public Participation
Source: Atukunda et al., 2011
Public participation is the involvement of citizens in decision-making processes of the government. Public participation is an open, responsible process through which individuals and groups within selected communities can express their views and influence decision-making.
Public participation is a right that is enshrined in the Constitution of Uganda. Under Article 38, the Constitution provides for citizen participation in the affairs of government, individually or through representatives in accordance with the law. Article 38 (2) states that, every Ugandan has a right to participate in peaceful activities to influence the policies of government through civic organization.
Public participation is a democratic process of engaging people in thinking, deciding, planning, and playing an active part in the development and operation of services that affect their lives.
The NEA and the National Environment (Environment Impact Assessment) Regulations under Regulation 12 provides for public input in the ESIA, and environment audits through the rights to participate, to information and the general right to bring actions to prevent or stop an activity or project with effects that are harmful to the environment. It also empowers local environmental committees to take action to redress local environmental concerns. The Act creates a duty on the developer to take all measures necessary to seek the views of the people in the communities which may be affected by the project during the process of conducting the study.
Environmental Restoration Orders
Source: Atukunda et al, 2011
“Restoration orders are issued under Section 67 of the NEA requiring a person to restore the environment, or to prevent a person from harming the environment. They may award compensation for harm done to the environment or and levy a charge for restoration undertaken. Restoration Orders are issued by NEMA or court giving the person a minimum of 21 days to restore what he has destroyed.”
“Section 70(i) of NEA states that, “where a person on whom an environmental restoration order has been served fails, neglects or refuses to take action required by the order, the Authority (NEMA) may with all necessary workers and other offices, enter or authorize any other person to enter any land under the control of the person on whom that order has been served and take all the necessary action in respect of the activity to which that order relates and otherwise to enforce that order as may deem fit””
Access to Information
Source: Atukunda et al., 2011
“Effective access to meaningful information is the first step in empowering community members to exercise a degree of control over resources so that they can be able to monitor and manage the environmental impacts. The right to know is the basis for stakeholder involvement in environmental decision-making processes that affect the lives of the people living in the community. The right to information gives the public a practical tool to oversee government decision-making and conduct. Article 41 of the Constitution of the Republic of Uganda provides for access to information. It states:”
“Every citizen has a right of access to information in the possession of the state or any other organ or agency of the state, except where the release of the information is likely to prejudice the security or sovereignty of the state or interfere with the right to the privacy of another person.”
USAID/UGANDA: ENVIRONMENTAL MANAGEMENT FOR THE OIL SECTOR – TRAINING COMPENDIUM: MODULE 4 290

Mitigation
Source: Atukunda et al., 2011
Mitigating Impacts on animals, clearing of land can be limited to removing grass from the drill pad and access road, except where it is absolutely necessary to remove a few trees and shrubs. No significant bird habitats should be cleared or destroyed. Mitigating impacts on mammals should mainly take the form of limiting habitat destruction through the following means:
• Restoring the drilling site following the conclusion of the work; • Restoring habitats to the state they were in before construction; • Limiting the width of the access road and site foot print to the required operational, health and
safety requirements; • Constructing a fence around the drilling pad and keeping waste pit in the fence area; • Restricting the movement of heavy trucks and equipment to the road access; and • Keeping the noise levels low and in accordance with established national noise level standards.
Waste Management
Source: Atukunda et al., 2011
“Waste management is the collection, processing, transportation, recycling or disposal and monitoring of waste material. Waste management usually relates to materials produced by human activity. Oil and gas exploration activities explained above such as construction of a drilling site, exploration drilling and the actual drilling process produce waste which must be properly managed. Waste management is generally undertaken to reduce the effect of such waste on the environment.”
Restoring Sites
Source: Atukunda et al., 2011
At the end of the exploratory drilling and testing process at the site, the possible outcome is that the well:
• “Contains commercial quantities of hydrocarbons: a discovery and potential oil producing well, or
• Does not contain money making quantities of hydrocarbons; a dry well. In the event of the discovery of oil when drilling operations are producing well, a well head should be put up completed and the well is closed above the cased borehole.”
“The wellhead and deserted or suspended, they should be protected by constructing a drill site must be restored to its concrete cellar or steel cover over the original state as much as possible wellhead. The cellar walls should be raised above existing level. Bars for strengthening must be tied in with the existing walls. The cellar should be filled with compacted sand, which must surround the well head and ensure there is no empty space within the cellar. Suitable natural aeration to allow any likely gas build up within the cellar to escape naturally must be included.”
“In the event of a dry hole, the open borehole formations should be sealed with a cement cap to prevent upward movement of formation fluids and with the added benefit of preventing downward movement of poisonous substances.”
“The site should be geo-marked and handed back to government. In either event, all remaining waste must be removed from the drilling pad and disposed of at the site. When the site is clear of all waste and equipment, the lining should be removed and the topsoil must be spread on the drilling pad.”
“The restoration involves removal of all infrastructure including buildings, equipment except at the area of the suspended well. The top soil that was removed from the site during construction should be put back and grass/trees re-planted; the species used should be indigenous species and not unknown.”
USAID/UGANDA: ENVIRONMENTAL MANAGEMENT FOR THE OIL SECTOR – TRAINING COMPENDIUM: MODULE 4 291

“Murrum should be removed, transported, and put in the pit at the temporary storage site, to fill the site. In case of contaminated soil, the soil should be scooped and transported to the temporary storage site for wastewater and drill cuttings. The contaminated soil should be left to decay by biological means under the control of microorganisms.”
Stakeholder Involvement, Recommendation and Conclusion
Source: Kityo, 2011
• “The legal instruments available in Uganda to regulate and manage the access to oil. These legal instruments provide vital yardsticks upon which the key players in the enterprise can and should be caused to account. This could form the primary focus of advocacy action.
• Assessment to determine if mitigation actions are sufficient and successful in reducing the impacts.
• Awareness campaigns of the oil exploration issue through public outreach and education as well as coalition building.
• Lobbying the natural resources committee of Parliament to push for openness for disclosure of oil exploration agreements and operations.
• Local community sensitization on the various legal instruments governing oil in Uganda to enable them to build a forum that can demand/push for accountability from the various players.
• Work up mechanisms to ensure that District authorities responsible for environmental protection are not undermined by “top-down” management of oil industry, eroding public confidence in administrative system.
• Because oil will be mined for anyway, it will be essential to keep the infrastructure with PAs to the absolute minimum (the drill pad and absolutely necessary access routes). Camps—both support and residential—should be located outside the boundaries of the PA.
• Opening up new access routes should be discouraged and the firms encouraged to using existing tracks and routes. The areas traversed by any tracks that are no longer needed should be restored as quickly as possible to avoid spread of invasive or illegal access for non-permitted activities.
• Any open drill pits need to be protected to avoid wildlife falling and getting entrapped in them. • Drill waste will need to be carefully and thoroughly treated under supervision of NEMA and
District environment managers in the areas affected to ensure that no toxic waste are introduced into the PAs.”
Environmental Measure
• Preservation of ecosystem (i.e., intact, not at risk) • Recognition and inclusion of traditional knowledge • Minimization of pollution • Identification and mitigation of cumulative effects (i.e., environmental, social, cultural)
Social and Cultural Measures
• Retention of l traditions, culture, language and way of life • Meaningful community participation (i.e., in all stages of a project’s exploration, development
and implementation) • Capacity building communities to address health and social problems
Control over Natural Resources
• Clearly defined system of governance that respects the rights of all people in oil producing areas especially people’s land claim settlements and control over natural resources social systems are complex and change often. It is therefore important to be adaptive in order that approaches can be adjusted and repeated measurements can be carried out.
USAID/UGANDA: ENVIRONMENTAL MANAGEMENT FOR THE OIL SECTOR – TRAINING COMPENDIUM: MODULE 4 292

• Adaptive management is a systematic process for continually improving management policies and practices based on recurrent forecasting and continually keeping affected publics informed so they can modify their own strategies.
Monitoring and Evaluation Tools for the Impact Assessment
Source: Green Energy Associates, 2015
The trainees can best handle the monitoring and evaluation role by setting up a monitoring and evaluation unit that will measure out come and impacts of the oil and gas activities. A strategy similar to one below should be adopted:
• “Development of a Logic Model and Indicators: After finalizing logic model for planning and management purposes, associated indicators should be created in consultation with stakeholders to monitor achievement at every step, from inputs and activities to outputs and outcomes. Indicators should be Specific, Measurable, Achievable, Relevant and Timely.
• Validate Indicators with Stakeholders: Developing indicators is a key opportunity for stake holders’ participation. By providing input on the indicators, stakeholders are not only made aware of, but more importantly provide input. This process of vetting indicators helps build ownership and transparency.
• Conduct Baseline Study: An assessment of current conditions is necessary in order to create a baseline against which to measure progress over time.
• Set Targets and Scale: After finalizing the list of indicators that will be measured to monitor progress, targets should be set for each indicator. Targets are the goals that you are aiming to achieve by a certain point in time.
• Monitor Inputs, Outputs, and Outcomes: A project’s specific data collection cycle will depend on the timeline for its targets, though periodic data collection in line with the organizations or community (responsible unit) quarterly reporting. Data collection should ideally be participatory. By involving the community in monitoring.
• Consult Stakeholders on Monitoring Results: By reporting performance data gathered through monitoring, parties can meet community expectations for transparency and continue the dialogue about project design, management and performance.
• Make Project Adjustments: Engaging stakeholders through data collection and reporting will help project managers gain information on how projects should be adjusted to better ensure that goals are consistently being met. Once this information is brought to light, adjustments in the policy should be made to improve performance.
• Evaluate Project Impacts: Evaluation of every project should be done at the end. It is an analysis that helps to explain why the project did, or did not, produce particular results. Unlike monitoring, it is not used for ongoing management, but focuses on final outcomes.
• Report and Engage Stakeholders: A final step in M&E is to share information on project impacts with stakeholders through multiple channels. The parties can use M&E to inform the public of the progress made, as well as to invite feedback on the company’s wider community development efforts.”
Case Studies
Impacts of the Oil Industry on Cabindan Fisheries
Source: Baumuller et al., 2011
“Most fishing in Angola’s Northern Province Cabinda is artisanal and has been going on for three generations or more, without any commercial value chains attached. According to the President of the Associação dos Pescadores de Cabinda (APESCAB – Association of Cabindan Fishermen representing over 1,200 members in the northern province of Cabinda), the whole of the sea space around Cabinda province is negatively affected by oil production. There is little physical space for fishing already and oil production further constrains this. The fishermen complain that the bay of Cabinda no longer yields fish. Whereas in the 1950s up until the 1990s a nightly trip using about
USAID/UGANDA: ENVIRONMENTAL MANAGEMENT FOR THE OIL SECTOR – TRAINING COMPENDIUM: MODULE 4 293

500m of nets would have filled a fishing boat, now trips of up to five nights’ duration and much more netting are required to fill the same boat. The fishing excursions take the boats as far afield as Soyo—the mouth of the Congo River and further south (up to latitude of 7°, which is 2° south of Cabinda)—and up to Gabon towards the equator. Moving permanently to Soyo to avoid the long transit is not an option because it would mean leaving behind support networks of fellow fishermen and extended family. These trips represent distances of around 160 km each way. In order to undertake such fishing expeditions, fishermen have to carry up to 350 liters of petrol on board their vessels, and even then not all can go owing to increased cost and risks, and the need for reliable motors. Further afield, Cabindan artisanal fishermen also face competition from Luanda-based commercial fishing trawlers. According to some fishermen, this situation has already resulted in overfishing in the areas around Soyo and further south.”
“The fishermen blame oil production for the lack of fish closer to Cabinda. They point to the destruction of underwater habitats and spawning grounds as one of the main reasons. They claim that these underwater reefs and rock structures, which are essential for breeding fish, are destroyed by the use of dispersants that make (spilled) oil that floats on the surface of the sea sink to the sea floor. Fishermen also claim that seismic surveys have a negative impact on fish stocks and are pushing them away. Apart from impacting underwater habitats, oil spills, which they say occur at least once and up to four times a year, also affect fishermen by destroying their nets.”
“Opportunities for legal recourse are limited. In 2005, for instance, APESCAB launched a court case against the Cabinda Gulf Oil Company (CABGOC) following a major oil spill that prevented fishing in the bay of Cabinda, affecting 1,226 fishermen, all of them members of APESCAB. The court case was initiated after extra-judicial negotiations with CABGOC failed. APESCAB was represented by Inglês Pinto and Associados, a Luanda-based law firm. After six years, the case is still pending with no ruling expected in the foreseeable future, and there have been more spills since. According to the President of APESCAB there is “injustice in justice.”
The Chad-Cameroon Pipeline Project
Source: Baumuller et al., 2011
“The ExxonMobil-led development of the Doba field in the South of Chad brought an influx of new wealth to a politically fragmented and fractious state. The impacts on local communities of the 2003-inaugurated project and the associated World Bank-financed pipeline continue to be hotly contested—despite a comprehensive cost-benefit analysis, extensive plans to ensure a social license to operate and 165 consultation meetings with Pygmy communities along the pipeline route.”
“Several impact assessments highlight in more detail what went wrong. A June 2010 report by Group Chad (2010) critically assesses the World Bank’s Independent Evaluation Group (IEG) report, cataloguing the project’s failures. It claims that ‘women and children suffer the most when the subsistence economy on which they depend is disrupted. Widely documented problems such as polluted water wells, poor quality goods given as compensation for the loss of land and the smaller fish catch, contribute to further impoverishment.’”
“Failures raised by these reports include inadequate compensation to farming and fishing communities in Cameroon’s Coast and non-development of a promised indigenous people’s plan with the participation of Cameroon’s Bagyeli and Bakola Pymgy communities. Pygmy populations’ ability to gather and hunt in the forests traversed by the pipeline has been severely affected by the pipeline (ibid.). The Group Chad report also refers to evidence that the “infrastructure built with oil revenue has contributed little to social development.” School construction costs were excessive and health clinics often lacked the equipment to function.”
“While the IEG report admits the failure of many of the measures put in place, it justifies World Bank involvement and financing for a project that would have been built anyway (World Bank, 2009). This is disputed by several NGOs and the Group Chad report claims that the WB misjudged the political situation in which harsh repression, extra-judicial killings, widespread corruption, and the
USAID/UGANDA: ENVIRONMENTAL MANAGEMENT FOR THE OIL SECTOR – TRAINING COMPENDIUM: MODULE 4 294

lack of evidence of government commitment to addressing the plight of the poor were the hallmarks of Chadian realities.”
Shell’s Engagement in the Niger Delta
Source: Baumuller et al., 2011
“Shell’s governance contributions remain contentious. Feil et al. (2008) argue that Shell has engaged in direct security governance in the Niger Delta to a limited extent by signing up to the Voluntary Principles on Security and Human Rights and exploring possibilities for their implementation. Shell also contributes to governance in the ‘political order’ and ‘socioeconomic’ dimension by support for EITI and the investment of large sums into health care, education, youth development and economic empowerment, and community development programs. Critics contend that Shell and other MNOCs fail to compensate communities sufficiently for the negative externalities of oil production and do not involve communities sufficiently in decision-making processes. Some go further, arguing that certain qualitative costs of oil production—such as water pollution, light pollution and polluted agriculture—cannot be redeemed by CSR activities or compensation (Feil et al., 2008; Ite, 2007). At times, even sincere CSR efforts can be counterproductive. Cash payments created incentives for hostage-taking and fueled conflict among and between local communities for access to monies in the Niger Delta. Additionally, a 2003 internal Shell report found that its development efforts could incite conflict, as communities that were not targets of CSR projects became hostile to communities that were. As militancy and production losses due to insecurity mounted, and public pressure increased, leading to a more negative international image, Shell and other IOCs operating in the region were forced to rethink their community engagement strategies. The success and sustainability of these new strategies have yet to be determined.”
REFERENCES
Ajakaiye, B.A. (2008). “Combating Oil Spill in Nigeria: Primary role and responsibility of the National Oil Spill Detection and Response Agency (NOSDRA)” Stakeholders’ Consultative Workshop. August 4–6, 2008, Calabar, Nigeria.
Atukunda, S., Ndyakira, A., Bibangambah, H.K., Ssekyana, I.K. (2011). A community based guide for monitoring impacts of oil and gas activities on the environment. Greenwatch. Retrieved from http://www.greenwatch.or.ug/files/downloads/COMMUNITY%20BASED%20GUIDE%20BOOK.pdf
Baumüller, H., Donnelly, E., Vines, A., & Weimer, M. (2011). The effects of oil companies’ activities on the environment, health and development in Sub-Saharan Africa. Policy Department, Directorate-General for External Policies of the European Union, Brussels.
Chindo, M. I. (2011). Communities Perceived Socio-economic Impacts of Oil Sands Extraction in Nigeria. Human Geographies, 5(2), 69.
Darling, P. (2011). SME Mining and Engineering Handbook. Third Edition. Society for Mining, Metallurgy, and Exploration.
DEAT (2004) Environmental Management Plans, Integrated Environmental Management, Information Series 12, Department of Environmental Affairs and Tourism (DEAT), Pretoria.
Green Energy Associates. (2015). Monitoring and Evaluation. Retrieved from http://www.gea.com.pk/our-services/2015-04-29-06-49-31/monitering-evolution
Government of Uganda. (1995). The National Environment Act. Cap.153.
Government of Uganda. (1996). Uganda Wildlife Act, 1996. Cap. 2000.
Government of Uganda. (1997). Guidelines for Environmental Impact Assessment in Uganda
USAID/UGANDA: ENVIRONMENTAL MANAGEMENT FOR THE OIL SECTOR – TRAINING COMPENDIUM: MODULE 4 295

Government of Uganda. (1998). Amendment of Regulations In Terms Of Chapter 5 of the National Environmental Management Act, 1998.
Government of Uganda. (1998). The Environmental Impact Assessment Regulations, 1998.
Government of Uganda. (2000). The National Environment (Wetlands, River Banks and Lake Shores Management) Regulations, No. 3/2000.
Government of Uganda. (2003). The National Forestry and Tree Planting Act, 2003.
Government of Uganda. (2003). National Environment (Conduct and Certification of Environmental Practitioners) Regulations, 2003. S.I. No. 85 of 2003.
Government of Uganda. (2003). The Mining Act, 2003
Government of Uganda. (2004). Environmental Impact Assessment Guidelines for the Energy Sector. National Environmental Management Authority.
Government of Uganda. (2004). The Environmental Management Act, 2004 Regulations. No 20. of 2004.
Innovative GIS. (2004). Use Map-ematical Framework for GIS Modeling. Retrieved from http://www.innovativegis.com/basis/mapanalysis/topic22/topic22.htm
IPIECA. (2004). A Guide to Social Impact Assessment in the Oil and Gas Industry.
IPIECA/OGP. (2005). HIV/AIDS Management in the oil and gas industry.
Kakuru, K., Odio Musoke, R., Kyakuwaire, I. (2001). A guide to the environment impact assessment process in Uganda. Sustainable Development Series No. 1. Greenwatch.
Kityo, M. R. (2011). The effects of oil and gas exploration in the Albertine Rift Region on Biodiversity: A case of protected areas (Murchison Falls National Park). Nature Uganda. Retrieved from http://www. natureuganda. org/downloads/Oil% 20and% 20Gas, 20, 20.
Lochner, P. (2005). Guideline for environmental management plans. Provincial Government of the Western Cape. Department of Environmental Affairs and Development Planning.
Mall, I.D. (2014). Environmental impact assessment and life cycle assessment and their role in sustainable development. Presentation. Retrieved from https://www.slideshare.net/arvindbjo/environmental-impact-assessment-and-life-cycle-assessment-and-their-role-in-sustainable-development
Okere, R. (2016). Nigeria remains a top gas flaring country, says EIA. Retrieved from https://guardian.ng/business-services/nigeria-remains-a-top-gas-flaring-country-says-eia/
Premium Times. (2015). How Shell’s oil spill destroys our livelihood – Nigerian farmers. Retrieved from http://www.premiumtimesng.com/news/headlines/182373-how-shells-oil-spill-destroys-our-livelihood-nigerian-farmers.html
United Nations. (1992). Rio declaration on environment and development. Report of the United Nations Conference on Environment and Development. Rio de Janeiro.
UNEP. (2002). Environmental Impact Assessment Training Resource Manual. Second edition. Retrieved from http://unep.ch/etb/Publication/EIAman/IntroManual.pdf
United Nations University, RMIT University, and the United Nations Environment Programme (UNEP). (2006). Environmental Impact Assessment Course Module. Retrieved from http://sustainability-research.mcgill.ca/documents/EIA%20readings/eia-local/page173.htm
The World Bank. (1999). Operational Manual. OP 4.01- Environmental Assessment. Retrieved from https://policies.worldbank.org/sites/ppf3/PPFDocuments/090224b0822f7384.pdf
USAID/UGANDA: ENVIRONMENTAL MANAGEMENT FOR THE OIL SECTOR – TRAINING COMPENDIUM: MODULE 4 296

The World Bank. (2001). Operational Manual. OP 4.12: Involuntary Resettlement. Retrieved from https://policies.worldbank.org/sites/ppf3/PPFDocuments/090224b0822f89db.pdf
The World Bank. (2002). Operational Manual. OP 4.36: Forests. Retrieved from https://policies.worldbank.org/sites/ppf3/PPFDocuments/090224b0822f8a50.pdf
The World Bank. (2006). Operational Manual. BP 4.11: Physical Cultural Resources. Retrieved from https://policies.worldbank.org/sites/ppf3/PPFDocuments/090224b082301a67.pdf
USAID/UGANDA: ENVIRONMENTAL MANAGEMENT FOR THE OIL SECTOR – TRAINING COMPENDIUM: MODULE 4 297

LECTURE 6: ENVIRONMENTAL MONITORING AND MODELING – WATER
SYLLABUS
Teaching Aims
(i) Introduce students to the concepts involved in monitoring water pollution. (ii) Enable students to use a variety of models based on Biochemical (or Biological) Oxygen Demand
(BOD) and Dissolved Oxygen (DO) to monitor water pollution.
Learning Outcomes
(i) Explain the concepts of Biochemical (or Biological) Oxygen Demand (BOD) and Dissolved Oxygen (DO) with respect to monitoring water pollution.
(ii) Describe the common types of models used to monitor water pollution. (iii) Demonstrate how the models are used to monitor water pollution.
Outline of Lecture Content
Topic and Subtopic Suggested Approach, Method and Equipment
1. Definitions and importance of dissolved oxygen and biochemical oxygen demand
Lecture mixed with Q&A to build on trainees’ knowledge and experiences
2. Types of models available balancing processes
Demonstrate how the models work and then guide trainees in to practice with the models
3. Performance evaluation 4. DO and BOD models in the public
domain Demonstration
5. Water quality, the Nile, and oil and gas development
Demonstrate how the models work and then guide trainees in to practice with the models
6. The basics of water quality modelling
7. Mathematically representing transport 8. Analytical solution of the differential
equations
9. Model calibration and verification
DETAILED NOTES
Definitions and Importance of Dissolved Oxygen and Biochemical Oxygen Demand
Definitions
• Dissolved oxygen (DO)
− The amount of gaseous oxygen (O2) dissolved in an aqueous solution − Oxygen gets into water by:
• Diffusion from the surrounding air • Aeration (rapid movement)
USAID/UGANDA: ENVIRONMENTAL MANAGEMENT FOR THE OIL SECTOR – TRAINING COMPENDIUM: MODULE 4 298

• As a product of photosynthesis
FIGURE 6.1: OXYGEN SOLUBILITY CHART
Source: Shipco Pumps, 2012
• Biochemical oxygen demand (BOD)
− The rate of uptake of dissolved oxygen by the organisms in a body of water. − BOD measures the oxygen uptake by bacteria in a water sample at a temperature of 20°C
over a period of 5 days in the dark.
• Oxygen sag
− Oxygen levels decline downstream from a pollution source as decomposers metabolize waste materials.
How Is DO Measured?
Sampling
• Samples collected using a special bottle:
− Glass bottle with a "turtleneck" and a ground glass stopper − Direct filling of the bottle from the water − Submersion of the bottle in deeper water − Care is take to avoid disturbance of the surface of the water or the sediment
• Two approaches to measurement:
− Classical wet chemistry − Winkler Method
• Series of chemicals to react with O2, “fix” the oxidized chemicals, and then titrate to a visible endpoint
− Potentiometric method
• Oxygen probe
USAID/UGANDA: ENVIRONMENTAL MANAGEMENT FOR THE OIL SECTOR – TRAINING COMPENDIUM: MODULE 4 299

FIGURE 6.2: MODIFIED WINKLER METHOD
Source: Fondriest Environmental Inc., 2016
How Is BOD Measured?
• Sampling and quantification
− Protocols in sampling similar to that for DO, but a second sample is taken.
• The first sample is used for DO measurement (initial O2 content). • The second sample is used for incubation followed by another DO measurement (final
O2 content).
Why Model DO and BOD?
• The normal function of surface water is dependent upon oxygen.
− Aquatic life is dependent upon O2. − Depletion of O2 degraded the aquatic ecosystem.
• Dissolved O2 changes in water due to:
− Stagnation/lack of flow − Inputs of reactive carbon
• Plant debris (stagnant water) • Pollution, such as from raw sewage
− Re-aeration
• Dissolved O2 changes in response to inputs in a predictable manner.
− Mathematical modeling of changes in BOD began in 1925 and has been evolving.
Types of Models Available Balancing Processes
The Two Processes
• Oxygen consumption by:
− Biological breakdown of organic C − Chemical demands
• Reaeration
USAID/UGANDA: ENVIRONMENTAL MANAGEMENT FOR THE OIL SECTOR – TRAINING COMPENDIUM: MODULE 4 300

− Molecular diffusion − Turbulence
Streeter and Phelps (1925)
• Pioneers in BOD modeling
− Mathematical representation of the counteracting processes in BOD modeling − Dozens of other approaches published in subsequent years − Key modeling parameters:
• Decay kinetics of organic matter • Non-point load • Benthic oxygen demand • Photosynthesis • Respiration • Settling of organic matter • Longitudinal variation of mass flux
FIGURE 6.3: STREETER AND PHELPS MODELING PARAMETERS
Source: n Calculators, 2017
Later Developments
• Theriault (1927) and Fair (1939)
− Methods for estimating parameters
• Thomas (1948) settlable BOD in DO sag equation • Analytical solutions for simple initial and boundary conditions provided by many authors • Expanded BOD and DO model by Camp (1963)
− BOD decay and reaeration − sedimentation of biodegradable organic matter − benthic oxygen demand − internal oxygen source represented by the photosynthesis and respiration activity of aquatic
plants
• Starting in the 1970s, water quality models became common
− QUAL-1 (1971) from Texas Water Development Board − Van Genuchten and Alves (1982) present 44 solutions to the Streeter and Phelps model − Bhargava (1983) includes bio-flocculation and settling of organic matter
USAID/UGANDA: ENVIRONMENTAL MANAGEMENT FOR THE OIL SECTOR – TRAINING COMPENDIUM: MODULE 4 301

− Adrian et al. (1994) analytical solution for sinusoidal variation in waste discharge concentration
Chronology of BOD/DO Modeling
• Primary stage: 1925-1965
− Mostly addressed water bodies − Interactions of natural and industrial − Early models were simple, 1D models − As the modeling progressed, included more complexity: different BOD removal pathways;
considering both C and N pathways; sediment release and surface runoff; photosynthesis and respiration
• Improving Stage: 1965-1970
− Rapid progress based on multi-dimensional coefficient estimation of BOD-DO models − Water quality of lakes and gulfs − N and P cycling system, phytoplankton and zooplankton system − Relationships between biological growing rate and nutrients, sunlight and temperature, and
phytoplankton and the growing rate of zooplankton
• After 1975
− The number of state variables in the models increased greatly
• 3D models • Hydrodynamic mode • Sediments
− Water quality models began to expand to watershed-level − New models: QUAL, MIKE11, WASP
• Deepening (post-1995)
− Increased computing power enabled greater complexity and more variables − Expanded to watershed-level for nearly all models − Addition of air pollutants − Accessing inputs from large databases
TABLE 6.1: REPRESENTATIVE HYDROLOGIC MODELS THAT INCLUDE BOD AND DO
MODEL VERSION CHARACTERISTICS
Streeter-Phelps
ca. 1925-1963 Focus on oxygen balance and one-order decay of BOD and they are one-dimensional steady-state models.
QUAL I, II, 2E, 2E UNCAS, 2K
Developed by USEPA 1970. Dendritic river/ non-point source pollution: 1-D or steady-state dynamic models.
WASP 1 through 7 From USEPA 1983. Water quality in rivers, lakes, estuaries, coastal wetlands, and reservoirs, including 1D, 2D, 3D models.
QUASAR
Whitehead 1997. DO simulation in larger rivers; 1D dynamic model: PC-QUASAR, HERMES, and QUESTOR modes.
MIKE 11, 21, 31 Denmark Hydrology Institute. Water quality in rivers, estuaries, tidal wetlands, including 1D, 2D, 3D models.
USAID/UGANDA: ENVIRONMENTAL MANAGEMENT FOR THE OIL SECTOR – TRAINING COMPENDIUM: MODULE 4 302

• In terms of dissolved oxygen only:
− Kannel et al. (2011) concluded that public domain software would be most suitable for rivers and streams
• QUAL3EU, WASP7, QUASAR
Standardization of Models
• Models are used for many purposes: predictive, scientific research, providing the basis for regulation:
− Models need to be accurate and consistent − Newly developed models must be held to high standards that allow innovation but demand a
level of validation
• Measures of standardization:
− Assessment of existing models − Development of a data bank for controlled studies, case studies, and monitoring − Comparison of validated models to determine acceptable range of results − Contrasting existing models with regard to equations and model structure − Parameter calibration and validation
Case Study: River Kali in Western Uttar Pradesh, India
Problem Definition
Source: Jha et al., 2007
• River Kali is an important left-bank tributary of the River Hindon. • Municipal and industrial wastes, including sugar mills, are important pollution sources of the river
water. • River quality continuously degrading due to lack of knowledge in control and management of
water quality aspects. • Sampling from 22 locations:
− 16 river points − 6 effluent points − 732 data sets for the river water BOD and dissolved oxygen (DO) were measured for one
annual cycle: March 1999–February 2000
USAID/UGANDA: ENVIRONMENTAL MANAGEMENT FOR THE OIL SECTOR – TRAINING COMPENDIUM: MODULE 4 303

FIGURE 6.4: BOD CONCENTRATIONS OVER TIME
Source: Jha et al., 2011
FIGURE 6.5: DO CONCENTRATIONS OVER TIME
Source: Jha et al., 2007
Modeling
Source: Jha et al., 2007
• Other variables monitored/analyzed:
− Hydraulic parameters
• Depth of flow • Flow velocity
USAID/UGANDA: ENVIRONMENTAL MANAGEMENT FOR THE OIL SECTOR – TRAINING COMPENDIUM: MODULE 4 304

• Cross-sectional area
− Physical parameters
• pH • Temperature
− Land use of the study area, using IRS-LISS III and PAN satellite data
• Deoxygenation rate constant, K1 (L d-1), determined from BOD5 and estimated travel time within stream reaches:
− BOD5 obtained for different reaches of River Kali plotted on a log scale (y-axis). − Travel time plotted on a normal scale (x‐axis). − The slope of the line provides the values of the deoxygenation coefficient (K1).
𝑲𝑲𝟐𝟐 = 𝟎𝟎.𝟔𝟔𝟎𝟎𝟔𝟔𝟔𝟔𝑽𝑽𝟎𝟎.𝟒𝟒𝑺𝑺−𝟏𝟏.𝟎𝟎𝑯𝑯𝟎𝟎.𝟏𝟏𝟏𝟏𝟒𝟒 Fr≤1
𝑲𝑲𝟐𝟐 = 𝟖𝟖𝟔𝟔𝟔𝟔.𝟔𝟔𝑽𝑽𝟏𝟏.𝟔𝟔𝟑𝟑𝟔𝟔𝑺𝑺−𝟎𝟎.𝟏𝟏𝟏𝟏𝟔𝟔𝑯𝑯𝟎𝟎.𝟖𝟖 Fr>1
Where V is velocity of flow (m s-1), H is depth of flow (m), S is bed slope (m m
-1), and Fr is
Froude number:
𝐹𝐹𝐹𝐹 =𝑉𝑉
�𝑔𝑔𝑔𝑔
− Jha et al. evaluated four models for their ability to predict the behavior of BOD: Camp model, Bhargava model, Thomann and Muller model, and Jolanki mode.
− Each differed from the others in significant ways.
Performance Evaluation
• Performance of each model
− Evaluated using statistics standard error, mean multiplicative error and coefficient of determination (r2).
𝑺𝑺𝑺𝑺 = ��(𝑲𝑲𝑷𝑷 − 𝑲𝑲𝑴𝑴)𝒊𝒊𝟐𝟐
𝑵𝑵
𝑵𝑵
𝒊𝒊=𝟏𝟏
�
𝟏𝟏/𝟐𝟐
𝑴𝑴𝑴𝑴𝑺𝑺 = 𝒆𝒆𝒆𝒆𝒆𝒆
⎣⎢⎢⎡∑ �𝐥𝐥𝐥𝐥 �
𝑲𝑲𝒆𝒆𝑲𝑲𝑴𝑴
�𝒊𝒊�𝑵𝑵
𝒊𝒊=𝟏𝟏
𝑵𝑵⎦⎥⎥⎤
• Model comparisons
− Each model computed BOD and DO. − The comparison between measured and computed for each model. − r2 calculated for each model.
USAID/UGANDA: ENVIRONMENTAL MANAGEMENT FOR THE OIL SECTOR – TRAINING COMPENDIUM: MODULE 4 305

FIGURE 6.6: COMPARISON BETWEEN OBSERVED AND COMPUTED BOD AND DO VALUES OBTAINED USING THE VARIOUS MODELS
Source: Jha et al., 2007
USAID/UGANDA: ENVIRONMENTAL MANAGEMENT FOR THE OIL SECTOR – TRAINING COMPENDIUM: MODULE 4 306

• Jha et al. conclude:
− Camp model provided better results for the River Kali compared to Streeter-Phelps, Bhargava, Thomann and Müller, and Jolankai models.
• River Kali follows steady-state conditions, first order decay processes, benthic BOD and sedimentation.
• Camp model includes these and shows close agreement with observed values.
Dissolved Oxygen and Biochemical Oxygen Demand Models in the Public Domain
• Many models have been developed for surface waters:
− Most deal with broadly with water quality. − Most have BOD and DO as components. − The majority have been developed for research-specific purposes. − Commercially available models are common.
• Public domain software has appeal:
− Usually provided for no charge at all − Subject to wide scrutiny − Heavily critiqued − Frequently updated − Often are “open source” allowing users to modify the code to fit their own needs
• Kannel et al 2010 review six major models (only four were totally independent):
− SIMCAT, TOM-CAT − QUAL2Kw, QUAL2EU − WASP7 − QUASAR
SIMCAT
• Stochastic, one-dimensional (1D), steady-state deterministic model. • Developed by Anglian Water. • Determinants treated either conservatively or first-order decay.
− Model includes chloride (conservative), BOD; first order), ammonium (first order). − Flow, quality data entered at top of main river. − All tributaries, effluent discharges and abstraction assigned to appropriate reaches. − As the model is a stochastic and uses the Monte Carlo method, the inputs are not single
values, but descriptions of the statistical distribution for that determinant. − Modeling approach is overly simplistic but quick. − Limited by:
• No allowance for temporal variability • No accounting of photosynthesis, respiration, sediment oxygen demand • No variation of reaeration rate with flow
• Unlikely that the DO model will produce satisfactory results for productive rivers.
QUAL2EU
• Latest in the series QUAL1→QUAL2 →QUAL2E →QUAL2EU:
− QUAL1: extension of Streeter-Phelps with temperature and solute concentrations
USAID/UGANDA: ENVIRONMENTAL MANAGEMENT FOR THE OIL SECTOR – TRAINING COMPENDIUM: MODULE 4 307

− QUAL2 added phosphorus and nitrogen cycling; algae; other variables − QUAL2E was advanced to correct for algal-nutrient-light interactions − QUAL2EU adds uncertainty analysis
• 1D steady-state or dynamic model:
− Identify the magnitude and quality characteristics of non-point waste loads − Allows users to perform uncertainty analysis: sensitivity analysis − First-order error analysis − Monte Carlo simulation
• Basic equation to describe behavior of a pollutant in the river:
− 1-D conservative advection-dispersion equation
• Assumptions:
− Solutes completely mixed over cross section − Advective transport within the mean flow − Dispersive transport proportional to concentration gradient − Most determinants are first-order decays
• DO, nitrate, phosphate and algae are represented in more detail
− Includes sediment processes, only as a sink for substances or source of oxygen demand − Coliforms are modeled as nonconservative constituent − Simple first-order decay function used
• Only take into account coliform die-off
• Complexity of the QUAL2EU model:
− The QUAL2EU model is a leap forward in complexity.
• More variables have been added, and each variable can have several associated parameters.
• Ultimate carbonaceous biochemical oxygen demand, CBODu (BOD depending upon only degradation of organics):
𝒅𝒅𝒅𝒅𝒅𝒅𝒅𝒅
= −𝑲𝑲𝟏𝟏𝒅𝒅 − 𝑲𝑲𝟔𝟔𝒅𝒅
Where L is the concentration of the CBODu, K1 is the rate of oxidation of the CBOD and K3 is the rate of CBOD loss due to settling.
• CBODu can be determined from CDOB5:
𝑪𝑪𝑪𝑪𝑪𝑪𝑫𝑫𝒖𝒖 =𝑪𝑪𝑪𝑪𝑪𝑪𝑫𝑫𝟏𝟏
(𝟏𝟏 − 𝒆𝒆(𝟏𝟏𝑲𝑲𝑪𝑪𝑪𝑪𝑪𝑪𝑫𝑫))
• DO modeling is equally complex:
𝒅𝒅𝑪𝑪𝒅𝒅𝒅𝒅
= (𝑪𝑪𝒔𝒔 − 𝑪𝑪)𝑲𝑲𝟐𝟐 − (𝜶𝜶𝟔𝟔𝝁𝝁 − 𝜶𝜶𝟒𝟒𝝆𝝆)𝑨𝑨 −𝑲𝑲𝟏𝟏𝒅𝒅 −𝑲𝑲𝟒𝟒
𝑫𝑫− 𝜶𝜶𝟏𝟏𝜷𝜷𝟏𝟏[𝑵𝑵𝑯𝑯𝟒𝟒] − 𝜶𝜶𝟔𝟔𝜷𝜷𝟐𝟐[𝑵𝑵𝑪𝑪𝟐𝟐]
Where:
C is concentration of dissolved oxygen.
Cs is saturation concentration.
USAID/UGANDA: ENVIRONMENTAL MANAGEMENT FOR THE OIL SECTOR – TRAINING COMPENDIUM: MODULE 4 308

K2 is reaeration rate.
α3 is rate of photosynthetic oxygen production per unit algal growth.
μ is growth rate of algal biomass (affected by nutrient availability, light, temperature, self-shading).
A is algal biomass (directly proportional to chlorophyll-a).
α4 is rate of respiratory oxygen uptake per unit algal respiration.
K4 is the rate of the sediment oxygen demand.
α5 is rate of oxygen utilization per unit ammonium oxidized during nitrification.
α6 is rate of oxygen uptake per unit nitrite oxidized, [NO2] is concentration of nitrite nitrogen.
β2 is rate coefficient for oxidation of nitrite nitrogen, [NH4] is concentration of ammonium.
β1 is rate coefficient for nitrification.
- This level of complexity applies to all system variables, including nitrite, ammonium, nitrate, and phosphorus, all of which are affected by temperature.
𝒌𝒌(𝑻𝑻) = 𝒌𝒌(𝟐𝟐𝟎𝟎)𝜽𝜽𝑻𝑻−𝟐𝟐𝟎𝟎
Where:
k(t) is the reaction rate (per day) at temperature T (C) and
θ is temperature coefficient for the reaction
• Limitations to QUAL2EU:
− Cannot adequately simulate large river systems − Cannot convert algal death to CBOD
• Strengths of QUAL2EU:
− Ease of use − Widespread use and availability of materials − Can be downloaded here
• Other models are available and widely used, but their complexity and breadth places them in the realm of general water quality models, and will be reviewed in the next section.
Water Quality, the Nile, and Oil and Gas Development
• In the near future, oil and gas development will begin in Uganda. • Many of the targeted areas are fragile ecosystems, water being one of them. • Petroleum development creates tremendous quantities of wastewater. • We must appreciate the fate of the water.
Water quality parameters associated with development:
• Temperature • pH • Dissolved Oxygen • Turbidity • Conductivity • Total Organic Carbon (TOC)
USAID/UGANDA: ENVIRONMENTAL MANAGEMENT FOR THE OIL SECTOR – TRAINING COMPENDIUM: MODULE 4 309
• Bacteria • Viruses • Chemical oxygen demand • BOD • Metals and non-metals (Cr. Cd, Ni, As, Hg, Na, Br) • Phosphates • Nitrogen compounds • Organic compounds • Suspended solids • Salts (Total Dissolved salts)
Why Modeling?
• We know the potential impacts of oil and gas development on water.
− The magnitude and extent of the problem is unknown. − We need to know as much as possible about the changes to the river quality:
• Cannot measure it directly without contaminating the river • Therefore, modeling is key
• The mathematical model:
− A tool that promises enormous power to address water quality problems − Provides direction for rational solutions − Simultaneously accounts for the many variables in dynamic water systems − Models represent reality and handle problems without directly interfering with the water
• Three types of models are currently used to solve water-related problems:
− Hydraulic − Analogical − Mathematical
Hydraulic Models
• An actual physical model (laboratory):
− A portion of a river is reproduced.
• A duct of reduced size but having the same geometrical and morphological characteristics as the original.
• Flows are physically represented. • Components represented as well.
Analogical Models
• Based on mathematical expressions:
− Each interprets different phenomena.
• For example, ground water:
− Flow expressed by Darcy’s Law. − Identical in initial formulation as Ohm’s Law. − The behavior of the aquifer can be understood by the behavior of an electrical network with
appropriate resistances and capacities.
USAID/UGANDA: ENVIRONMENTAL MANAGEMENT FOR THE OIL SECTOR – TRAINING COMPENDIUM: MODULE 4 310

Mathematical Models
• Interpret reality through quantifying various phenomena and their components into numerical values.
− Hydraulic and analogical models have been progressively abandoned over time for mathematical models.
− Some feel that the purely mathematical model is merely an academic exercise, but these models can be powerful and accurate.
Water Exploitation and Quality
• Common uses of water:
− Agriculture, hydro power, processing (e.g., food), cooling, washing, domestic. − Oil and gas production is, by far, the most contaminating of all the water uses.
• Contaminants are often toxic. • Resulting salinity renders the water unusable.
Stream Self-Purification
• The concept of self-purification of rivers and streams is simple:
− Through the actions of dilution, microbial activity, chemical reactions, pollutants are removed from flowing water.
− Degree of purification is a function of distance of water flow. − This has been known since at least 1890.
• Consider the following excerpt:
It is well known that the purifying action of river water polluted with sewage is very considerable, as a few miles below the outfall or point of pollution a river may show little or no sign of pollution at all. Purification is effected by sedimentation of the suspended solids, and oxidation of the soluble material. The processes of oxidation give rise to deoxygenation of the river water, and the extent of deoxygenation depends on the strength of the sewage, the degree of dilution afforded by admixture with the river water, and the velocity of the river.
If the concentration of oxidizable material be excessive, the river water will suffer considerable or complete deoxygenation, and a nuisance will result owing to the septic condition caused by the anaerobic decomposition of the organic matter.
On the other hand, if there be sufficient dilution, the organic matter can be oxidized and thus destroyed without depriving the river water of oxygen to any appreciable degree. The suspended matter will also be sedimented in the form of a thin film distributed over a considerable area of river-bed, and no nuisance will thus result through the formation of foul mud-banks.
Ordinarily towns situated on the same river are sufficiently separated to give time for the river to recover from the effects of the upper pollution before it is subjected to the next. On the other hand, if towns be close together, a nuisance may result, and the river may become unfit to receive a further volume of sewage lower down, until a considerable length of time and dilution from tributaries enable purification to be effected.
--- Cooper, Cooper, and Heyward, Biochem. J. 1919
USAID/UGANDA: ENVIRONMENTAL MANAGEMENT FOR THE OIL SECTOR – TRAINING COMPENDIUM: MODULE 4 311

FIGURE 6.7: SELF PURIFICATION OF NATURAL STREAM
Source: Japan Water Guard, No date
Therefore, in considering the quality of flowing water, self-purification must be considered.
The Most Frequent Pollutants in a River
• BOD
− Any pollutant that requires oxygen as part of its natural decay cycle:
• Dissolve organic matter • Some forms of nitrogen
− The time variation of oxygen in a river can be expressed as:
• Algal Activity
− Many algal species have been identified in river systems: cyanobacteria, diatoms, green algae, macroalgae spp.
− Their presence and concentrations depend upon various water quality parameters: temperature, sunlight, nutrient concentrations.
− They are important because of their cycling of nutrients, blocking sunlight, dissipation of O2. − Very often the quantification of chlorophyll-a is used as a surrogate for algae.
• Ammonia
− Ammonia acts as a pollutant in two ways:
• Nutrient elevation, encouraging algal growth • Oxygen demand
• Nitrite
USAID/UGANDA: ENVIRONMENTAL MANAGEMENT FOR THE OIL SECTOR – TRAINING COMPENDIUM: MODULE 4 312

− Nitrite (NO2¯) is the active form of N that causes methemoglobinemia. − Also consumes oxygen as it is oxidized to NO3.
• Organic nitrogen
− Organic nitrogen is a precursor to ammonium. − Also, as an organic constituent, consumes oxygen upon oxidation.
• Phosphorus
Derived from mineral matter in soils and sediments; inorganic fertilizers; P-rich organics (e.g., manure); sewage.
• Coliforms
− Coliforms are readily determined bacteria and are surrogates or bellwethers for pathogen contamination.
− The source is nearly always sewage or animal waste. − Coliforms die off with distance travelled in the river, but they can be potent when water is
consumed close to the source of contamination.
• Metals/Metalloids
− The content and concentrations are dependent upon the source and types of inputs. − Possible contaminants include Fe(II), Cu, Cr(VI), As(III), As(V), Mn(II), Cd(II), and many
others.
• Organic Contaminants
− Rivers can be receptors for a vast array of potentially toxic, organic pollutants. − The source can be agriculture or industry, and the composition of river contaminants will
reflect the environment. − Pesticides are often considered a rural problem, but urban environments have their own
suite of pesticides. − PCBs, halogenated aliphatics, and phthalates are generally urban problems. − Polycyclic aromatics (PAHs) are associated with petroleum contamination.
The Basics of Water Quality Modelling
Challenges
• Water control and protection:
− What is the source of the pollutant? − How does the pollutant vary over time and space?
• Answering these questions requires extensive analytical data:
− Representative of the entire body − Replicated
• Modeling approach:
− Concentrations of pollutants need to be known as a function of space and time:
C = C(x,y,z;t)
− Physical functions (heat transfer, density):
τ = τ(x,y,z;t)
USAID/UGANDA: ENVIRONMENTAL MANAGEMENT FOR THE OIL SECTOR – TRAINING COMPENDIUM: MODULE 4 313

− We need to determine how these parameters vary
• Sophisticated models have been under development for decades in many countries:
− We will discuss the approach taken for some of these models. − Some appreciation is needed for the range of models available, as given in the table in the
following slide.
TABLE 6.2: PRINCIPAL WATER QUALITY MODELS FOR RIVERS AND STREAMS
Country Year Model Name Purpose
USA 1982 CE-QUAL Transport/transformation
Netherlands 1985 DELWAQ Transport
USA 1987 QUAL2E Transport
France/UK 1991 TELEMAC Water flow/transport
Switzerland 1994 AQUASIM Transport/transformation
UK 1997 PC-QUASAR Water flow/transport
Denmark 1991 MIKE 11 Water quality/sediment transport
UK 2008 TOPCAT-NP Water flow/nutrient transport
Germany 2009 MONERIS Nutrient emissions into a river system
UK 2010 SIMCAT Fate and transport
Modeling Nomenclature
• Constants
− Maintain the same value for the entire application. − Determined independently of the model.
• Variables
− Numerical value that can be changed during model execution.
• Parameters
− Numerical values that are assigned a value during some steps of model execution.
• Deterministic Models
− Mathematical formulation of the model such that the relationship between the variables means only one output value corresponding to a given input value.
• Probabilistic or Stochastic Models
− The relationship among variables is based upon statistical probabilities, and different output values can result from a given input value.
The Need for Data
• Models are useful only if:
USAID/UGANDA: ENVIRONMENTAL MANAGEMENT FOR THE OIL SECTOR – TRAINING COMPENDIUM: MODULE 4 314

− Variables and constants are determined experimentally. − Data are available for calibrating and testing the model.
• Data Collection: Gathering information for model input • Data Screening: Evaluating the soundness of the data—physically or statistically • Data Saving: Establishing the data base • Data Retrieval: Accessing the information during model execution
Mathematically Representing Transport
Source: Benedini, 2011
Water Pollution: Transport
• The purpose of water quality modeling is to predict the fate of pollutants:
− Suspended pollutants with a solid status − Dissolved pollutants found in solution (gases, liquids, solids) − Emulsions of immiscible liquids − Microorganisms
• Conservative vs. nonconservative:
− Some pollutants are not altered over time and are considered conservative. − Other pollutants are altered with time or degrade—nonconservative pollutants.
• All pollutants quantified by their concentration, mass per unit volume
𝐶𝐶 =𝑀𝑀𝛷𝛷
Where C is concentration, M is mass of pollutant per unit volume, Φ
• Due to various phenomena associated with flowing water, human intervention, natural variability, concentration varies in space/time:
𝑐𝑐=𝑐𝑐(𝑥𝑥,𝑦𝑦,𝑧𝑧;𝑡𝑡)
• Then, the basis of modeling:
− Consider the transport of a pollutant from point A to point B. Assuming no other transport of the pollutant, the pollutant mass increases at point B and decreases at A.
At any point P:
Volume = ΔxΔyΔz
USAID/UGANDA: ENVIRONMENTAL MANAGEMENT FOR THE OIL SECTOR – TRAINING COMPENDIUM: MODULE 4 315

Mass = CtΔxΔyΔz
The change in mass at P over time (t+Δt) as a result of transport:
(Ct+Δt – Ct).Δx.Δy.Δz
Transport by Advection
Source: Benedini, 2011
• When dissolved or suspended contaminants are transported by flowing water, the process is called advection.
• Rate of transport by advection is dependent upon velocity of the water:
v=v(x,y,z:t)
• And the pollutant mass crossing a cross-sectional area per unit time:
C.Δy.Δz.vx.Δt
Transport by Dispersion: Fick’s Law
Source: Benedini, 2011
• Dissolved substances in still water will move in response to concentration gradients:
− From areas of high concentration to low. − The tendency is to eliminate the concentration gradient by equalizing the concentrations in
both locations. − This is illustrated below.
FIGURE 6.8: TRANSPORT BY DISPERSION
Source: Brainchemist. 2011
− Solute molecules migrated across the barrier until concentrations on both sides were equal. − This action is called flux, represented mathematically as J. − Fick’s Law describes diffusion/dispersion, derived in 1855.
𝐽𝐽 = −𝐷𝐷𝜕𝜕𝜕𝜕𝛿𝛿𝑥𝑥
USAID/UGANDA: ENVIRONMENTAL MANAGEMENT FOR THE OIL SECTOR – TRAINING COMPENDIUM: MODULE 4 316

Where J is the flux (mol m-2 s-1), D is the diffusion coefficient (m2 s-1), φ is the concentration (mol m3), and x distance (m).
• At this point, the models become more complicated.
− How they handle that various aspects of fate and transport defines them, but the underlying principles are similar.
− Some key equations:
- Mass flow:
−�𝜕𝜕𝐶𝐶𝜕𝜕𝑡𝑡�𝑎𝑎𝑎𝑎𝑎𝑎
=𝜕𝜕(𝑣𝑣𝑥𝑥𝐶𝐶)𝜕𝜕𝑥𝑥
- Diffusion/dispersion (Fick’s Second Law):
�𝜕𝜕𝐶𝐶𝜕𝜕𝑡𝑡�𝑎𝑎𝑑𝑑𝑑𝑑𝑑𝑑
= 𝐷𝐷𝜕𝜕2𝐶𝐶𝜕𝜕𝑥𝑥2
- And, in the case in which a concentration of pollutant (S) is injected or removed:
�𝜕𝜕𝐶𝐶𝜕𝜕𝑡𝑡�𝑐𝑐𝑐𝑐𝑐𝑐𝑐𝑐
= 𝑆𝑆
- Combining:
�𝜕𝜕𝐶𝐶𝜕𝜕𝑡𝑡�𝑎𝑎𝑑𝑑𝑑𝑑𝑑𝑑
= −𝜕𝜕(𝑣𝑣𝑥𝑥𝐶𝐶)𝜕𝜕𝑥𝑥
+ 𝐷𝐷𝜕𝜕2𝐶𝐶𝜕𝜕𝑥𝑥2
+ 𝑆𝑆
− This equation is for the case of one-dimensional flow, but it can be easily expanded to three-dimensional cases.
Nonconservative Pollutants
Source: Benedini, 2011
• For those pollutants that degrade or are lost to the system, nth order kinetics are assumed:
−𝜕𝜕𝐶𝐶𝜕𝜕𝑡𝑡
= 𝑘𝑘(𝐶𝐶 − 𝐶𝐶0)𝑐𝑐
k is the kinetic constant, n is the order of the kinetic expression, and C0 is the initial (or reference) concentration.
• Thus, the combined expression all reactions:
𝜕𝜕𝐶𝐶𝜕𝜕𝑡𝑡
+ �𝜕𝜕𝑣𝑣𝑥𝑥𝐶𝐶𝜕𝜕𝑥𝑥
+𝜕𝜕𝑣𝑣𝑦𝑦𝐶𝐶𝜕𝜕𝑦𝑦
+𝜕𝜕𝑣𝑣𝑧𝑧𝐶𝐶𝜕𝜕𝑧𝑧 � = 𝐷𝐷�
𝜕𝜕2𝐶𝐶𝜕𝜕𝑥𝑥2
+𝜕𝜕2𝐶𝐶𝜕𝜕𝑥𝑥2
+𝜕𝜕2𝐶𝐶𝜕𝜕𝑥𝑥2�
+ 𝑆𝑆 − 𝑘𝑘𝐶𝐶
Biochemical Oxygen Demand (BOD)
Source: Benedini, 2011
• Biochemical oxygen demand was discussed in detail in a previous lecture. • Any process that consumed oxygen during the decomposition of a substance has biochemical
oxygen demand. • Oxygen deficits can have a negative impact on the aquatic ecosystem. • Thus, knowledge of BOD and dissolved oxygen (DO) are important.
− If σ is the DO and c is BOD
USAID/UGANDA: ENVIRONMENTAL MANAGEMENT FOR THE OIL SECTOR – TRAINING COMPENDIUM: MODULE 4 317

𝜕𝜕𝜕𝜕𝜕𝜕𝑡𝑡
= −𝐾𝐾𝑎𝑎𝜕𝜕 + 𝐾𝐾𝑐𝑐
where Ka is the reaeration coefficient and K is deoxygenation coefficient
• n the body of water, the oxygen transformations are readily added to the existing processes:
𝜕𝜕𝑐𝑐𝜕𝜕𝑡𝑡
+ �𝜕𝜕𝑣𝑣𝑥𝑥𝑐𝑐𝜕𝜕𝑥𝑥
+𝜕𝜕𝑣𝑣𝑦𝑦𝑐𝑐𝜕𝜕𝑦𝑦
+𝜕𝜕𝑣𝑣𝑧𝑧𝑐𝑐𝜕𝜕𝑧𝑧 � = 𝐷𝐷 �
𝜕𝜕2𝑐𝑐𝜕𝜕𝑥𝑥2
+𝜕𝜕2𝑐𝑐𝜕𝜕𝑥𝑥2
+𝜕𝜕2𝑐𝑐𝜕𝜕𝑥𝑥2�
+ 𝑆𝑆𝐵𝐵𝐵𝐵𝐵𝐵 − 𝐾𝐾𝑐𝑐
𝜕𝜕𝜕𝜕𝜕𝜕𝑡𝑡
+ �𝜕𝜕𝑣𝑣𝑥𝑥𝜕𝜕𝜕𝜕𝑥𝑥
+𝜕𝜕𝑣𝑣𝑦𝑦𝜕𝜕𝜕𝜕𝑦𝑦
+𝜕𝜕𝑣𝑣𝑧𝑧𝜕𝜕𝜕𝜕𝑧𝑧 � = 𝐷𝐷�
𝜕𝜕2𝜕𝜕𝜕𝜕𝑥𝑥2
+𝜕𝜕2𝜕𝜕𝜕𝜕𝑥𝑥2
+𝜕𝜕2𝜕𝜕𝜕𝜕𝑥𝑥2�
+ 𝑆𝑆𝐵𝐵𝐵𝐵 − 𝐾𝐾𝑎𝑎𝜕𝜕 + 𝐾𝐾𝑐𝑐
− For multicomponent systems in one dimension:
• p is component p, q is component q • Cp and Cq are the respective concentrations:
𝜕𝜕𝐶𝐶𝑑𝑑𝜕𝜕𝑡𝑡
+𝜕𝜕𝑣𝑣𝑥𝑥𝐶𝐶𝜕𝜕𝑥𝑥
= 𝐷𝐷𝜕𝜕2𝐶𝐶𝜕𝜕𝑥𝑥2
± 𝑆𝑆𝑑𝑑 ± 𝑘𝑘𝑑𝑑𝐶𝐶𝑑𝑑 ± 𝑘𝑘𝑞𝑞𝐶𝐶𝑞𝑞
where kxCx are the decay terms for the components.
• These are typical for pollutants such as nitrogen-containing compounds (nitrate, nitrite, ammonium).
Hydrodynamic Aspects
Source: Benedini, 2011
• Fluid flow drives the entire system and cannot be overlooked. • Mass conservation:
• Momentum conservation:
USAID/UGANDA: ENVIRONMENTAL MANAGEMENT FOR THE OIL SECTOR – TRAINING COMPENDIUM: MODULE 4 318

• Simplifying assumptions can be made to reduce the problem to 2-D or 1-D:
− Water is incompressible. − Water is homogeneous. − Velocity components in one or more directions are negligible. − Pressure distributions is hydrostatic in one or more directions. − Bottom slope is small. − No discontinuities in the flow field. − Friction terms can be modeled. − No source terms (e.g., overland flow, rain).
• From here, the equations become more complex.
− The appearance and execution of the model depend upon further assumptions and the method(s) used to solve the system of equations.
Analytical Solution of the Differential Equations
Source: Benedini, 2011
The previously developed equations are an interpretation of the transport of pollutants at a small-scale (the nature of differential equations).
• For large scales:
− The differential equations must be solved. − Appropriate boundary and initial conditions. − Other parameters must be defined: water velocity, depth, etc.
• Better approach: simplify the problem to 1-D flow
− A major simplifying assumption is that all characteristics are constant across the cross section.
FIGURE 6.9: SCHEMATIC DIAGRAM OF STREAMFLOW MEASUREMENTS AT A SPECIFIC LOCATION
Source: Earthsoft, 2015
Under the 1-D conditions, the defining differential equation becomes:
USAID/UGANDA: ENVIRONMENTAL MANAGEMENT FOR THE OIL SECTOR – TRAINING COMPENDIUM: MODULE 4 319

− This relatively simple equations allows the evaluation of a pollutant to be evaluated downstream.
The challenge, therefore, is to determine the concentration [C(x,t)] in the stream cross section as location x and time t.
Continuous Source with Endless Duration
Source: Benedini, 2011
• This is the case of source of contaminant that emits constantly at a fixed concentration. • This could be an industry flushing a fixed waste out a pipe that dumps into the stream. • Model output:
− Examine concentrations at a single point downstream over time. − Model concentrations over time at a fixed point and test the impact of modeling parameters.
FIGURE 6.10: CONTINUOUS SOURCE OF INFINITE DURATION (4 HOURS)
Source: Benedini, 2011
− In the previous Figure, k=0.00000 is for a conservative pollutant.
Because the pollutant never disappears, a maximum concentration of 100 percent observed.
− Ask values increase, rate of dissipation increases.
For k=0.0050, a maximum concentration of approximately 10 percent is observed.
• Effect of dispersion coefficient:
− When the dispersion coefficient is very low, dispersion is negligible and advective transport (with flow) dominates.
− When the dispersion coefficient is high, dispersion occurs rapidly.
USAID/UGANDA: ENVIRONMENTAL MANAGEMENT FOR THE OIL SECTOR – TRAINING COMPENDIUM: MODULE 4 320

FIGURE 6.11: CONTINUOUS SOURCE OF INFINITE DURATION (1 HOUR)
Source: Benedini, 2011
Source with a Finite Duration
Source: Benedini, 2011
• In this case, all the flow parameters were as before
− The contaminant, however, is introduced at C=C0 at time 0 for τ seconds. − Thus, boundary conditions are:
− Once again, the concentration is dependent on time, position, and modeling parameters:
FIGURE 6.12: CONTINUOUS SOURCE OF FINITE DURATION (2 HOURS)
Source: Benedini, 2011
USAID/UGANDA: ENVIRONMENTAL MANAGEMENT FOR THE OIL SECTOR – TRAINING COMPENDIUM: MODULE 4 321

Steady-State
Source: Benedini, 2011
• The steady-state assumption is a modification of the previous approach:
− Pollutant injection does not depend upon time.
Example: injection of urban sewage
− Concentrations will depend upon only mechanisms of dissipation, such as degradation.
Using BOD as an example, the resulting equations for BOD concentration, C, and DO (σ):
U is the average velocity, Ka is the reaeration constant. The graph below is such a simulation, the classic Streeter-Phelps BOD simulation.
FIGURE 6.13: STEADY-STATE
Source: Benedini, 2011
Finite Difference Method
Source: Benedini, 2011
• This approach uses the same differential equations as previous approaches.
− However, the equations are not integrate. − Equations replaced by an expression of finite terms with intervals of finite size.
Δx, Δy, Δz, and Δt
− The next step is to expand from the finite but small increments to the full stream/river system.
USAID/UGANDA: ENVIRONMENTAL MANAGEMENT FOR THE OIL SECTOR – TRAINING COMPENDIUM: MODULE 4 322

− From here, the steps are far too complex to outline in detail. In general:
• A grid depicting the x, t plane is conceived. • Each x point is actually a cross section. • t points represent time steps. • At velocity, U, and concentration, C, are assigned to each x point. • Equations are derived for change in concentration with time, the advection process,
dispersion, and the reactive process. • Numerical schemes are devised to move the calculations forward, usually in an iterative
manner. • Boundary conditions are assigned. • Multiple approaches are possible.
FIGURE 6.14: CALCULATED POLLUTION CONCENTRATION IN THE STREAM BY MEANS OF THE BTCS APPROACH
Source: Benedini, 2011
USAID/UGANDA: ENVIRONMENTAL MANAGEMENT FOR THE OIL SECTOR – TRAINING COMPENDIUM: MODULE 4 323

FIGURE 6.15: CONCENTRATION OF CONSERVATIVE POLLUTANT AT SELECTED TIME HORIZONS
Source: Benedini, 2011
FIGURE 6.16: CONCENTRATION OF NONCONSERVATIVE POLLUTANT AT SELECTED TIME HORIZONS
Source: Benedini, 2011
Model Calibration and Verification
• A model that is incapable of correctly reproducing reality is of little utility.
− The user must be certain that the model is reproducing reality for the given system. − Some basic data is required for this step. − Familiarity of the user with both the model and the modeled with increase the chances of
producing a usable model.
USAID/UGANDA: ENVIRONMENTAL MANAGEMENT FOR THE OIL SECTOR – TRAINING COMPENDIUM: MODULE 4 324

FIGURE 6.17: MODEL CALIBRATION FLOWCHART
Source: Benedini, 2011
Calibration
Source: Benedini, 2011
• The response of the model is correct if, given a certain input, the resulting output is confirmed by the actual values obtained by direct measurement with acceptable error.
• After the model has been constructed, the model must be tested with the whole set of available data, proceeding to its calibration.
• Falling within acceptable limits of error will dictate if the model is properly calibrated.
Verification and Validation
• Verification is the process of ensuring that the model approaches the entire reality. • Validation is the combination of calibration and verification, and often is an extensively iterative
process. • In some ways, validation is philosophical, paying attention to key points:
− How and to what extent the available data can represent the phenomena in question − How and to what extent the adopted model can fit to such an interpretation − How the available data can respond to the correct application of the adopted model
• The user must establish quantitative criteria for all these steps before beginning the validation process.
REFERENCES
Benedini, M. & Tsakiris. G. (2013). Water quality modeling for rivers and streams. Dordrecht, Netherlands: Springer Scientific.
Brainchemist. (2011). Diffusion. Retrieved from https://brainchemist.files.wordpress.com/2011/01/diffusion.gif
Cooper, A. E., Cooper, E. A., & Heward, J. A. (1919). On the self-purification of rivers and streams. Biochemical Journal, 13(4), 345.
USAID/UGANDA: ENVIRONMENTAL MANAGEMENT FOR THE OIL SECTOR – TRAINING COMPENDIUM: MODULE 4 325

Earthsoft. (2015). SOP–EDP and EDGE: Flow Calculations. Retrieved from https://help.earthsoft.com/default.asp?W3035
Fondriest Environmental Inc. (2016). Measuring Dissolved Oxygen. Retrieved from http://www.fondriest.com/environmental-measurements/equipment/measuring-water-quality/dissolved-oxygen-sensors-and-methods/
Japan Water Guard. (No date). Natural purification function in river. Retrieved from http://ngojwg.org/study3-2-e.html
Jha, R., Ojha, C. S. P., & Bhatia, K. K. S. (2007). Critical appraisal of BOD and DO models applied to a highly polluted river in India. Hydrological sciences journal, 52(2), 362-375.
McGraw-Hill Companies. (No date). Oxygen depletion cycle. Retrieved from https://www.unc.edu/courses/2005fall/envr/051/001/05watpol05.jpg
N Calculators. (2017). Water Quality Modelling (Streeter-Phelps) Equation & Calculator. Retrieved from http://ncalculators.com/environmental/dissolved-oxygen-concentration-calculator.htm
Shipco Pumps. (2012). Oxygen Solubility. Retrieved from https://www.shipcopumps.com/articles/index.php?category=technical-articles&id=oxygen-solubility
USAID/UGANDA: ENVIRONMENTAL MANAGEMENT FOR THE OIL SECTOR – TRAINING COMPENDIUM: MODULE 4 326

LECTURE 7: ENVIRONMENTAL COST-BENEFIT AND CHANGE ANALYSIS
SYLLABUS
Teaching Aims
(i) Introduce students to the concepts and practices of environmental cost-benefit and change analysis.
(ii) Enable students to carry out environmental cost-benefit and change analysis on a medium scale project within their professional mandates.
Learning Outcomes
(i) Discuss the values of cost-benefit analysis (CBA) in the oil and gas industry. (ii) Use the cost-benefit analysis approach to project the short and long terms economic benefits of
natural resources in their areas of operation. (iii) Apply the CBA approach in project appraisal.
Outline of Lecture Content
Topic and Subtopic Suggested Approach, Method and Equipment
1. Introduction to cost-benefit analysis Guide the class to discuss the principles 2. Valuing oil and gas costs and benefits Used a case study to guide trainee discussion
of the values of CBA for the oil and gas development
3. Discounting and present values Guide students to practice discounting with figures (real life or hypothetical)
4. Techniques of project appraisal Use real life case studies to guide trainees in critiquing cost-benefit analyses of projects (not necessarily oil and gas, but from a natural resources context)
5. Assessing risk and uncertainty Use the same case studies above to guide students in assessing risk
6. Sensitivity analysis Use the same case studies above to guide students in carrying out sensitivity analysis
7. Case studies 8. Practical work
DETAILED NOTES
Introduction to Cost-Benefit Analyses
Source: Central Expenditure Evaluation Unit, No date.
The following material is sourced from the document “Guide to economic appraisal: Carrying out a cost benefit analysis” created by the Central Expenditure Evaluation Unit of the Republic of Ireland. This document can be accessed online at http://publicspendingcode.per.gov.ie/wp-content/uploads/2012/08/D03-Guide-to-economic-appraisal-CBA-16-July.pdf
“The allocation of scarce economic resources to competing policy objectives is a challenge inherent to public and private sector investments. Any allocative decision will necessarily involve making choices between alternative approaches to the achievement of a specific policy objective and the
USAID/UGANDA: ENVIRONMENTAL MANAGEMENT FOR THE OIL SECTOR – TRAINING COMPENDIUM: MODULE 4 327

ranking of priorities. CBA is an economic appraisal tool for the comparison of costs and benefits associated with alternative approaches. CBA provides a useful basis for decision-making and assists in the systematic appraisal and management of current and future projects.”
“CBA is concerned with economic choice and endeavors to assist decision makers in making choices concerning scarce resources. In the private sector, the goal of the organization is purely financial—to maximize profits. In its investment decisions, the organization is only concerned with private costs and benefits, which are decided by the market mechanism. The organization will make those choices, which contribute most to profit. The difficulty for the public sector is that it must consider the wider implications for society—the social costs and benefits. For the most part the public sector does not operate within the market mechanism for its goods and services and therefore the valuation of social costs and benefits is more difficult.”
“CBA is concerned with economic choice and endeavors to assist decision makers in making choices concerning scarce resources. By reducing the positive and negative impacts of a project to their equivalent money value CBA determines whether on balance the project is worthwhile. The equivalent money value are based upon information derived from consumer and producer market choices; i.e., the demand and supply schedules for the goods and services affected by the project. Care must be taken to properly allow for such things as inflation. When all this has been considered a worthwhile project is one for which the discounted value of the benefits exceeds the discounted value of the costs; i.e., the net benefits are positive. This is equivalent to the benefit/cost ratio being greater than one and the IRR being greater than the cost of capital.”
Rationale for CBA
Source: Central Expenditure Evaluation Unit, No date
No policy program or project should be adopted without first having to answer the following questions:
• What are the specific objectives and outcomes sought? • Are there better ways to achieve these outcomes? • Are there better uses for these resources? • Does the project create value/wealth for society or owners?
CBA is a useful evaluation tool which takes a long-term and wide view of the consequences of a program or project and has been developed to help answer the above questions. CBA is flexible and can be adopted to include all the costs and benefits—private and social, direct and indirect, tangible and intangible.
Steps in Carrying Out a CBA
Source: Central Expenditure Evaluation Unit, No date
The CBA is one part of the overall appraisal process for a program, project or scheme. The standard appraisal steps for a project or program include:
• Define the objective. • Explore options taking account of constraints. • Quantify the costs of viable options and specify sources of funding. • Analyze the main options. • Identify the risks associated with each viable option. • Decide on a preferred option. • Make a recommendation to the project implementing agency or authority.
USAID/UGANDA: ENVIRONMENTAL MANAGEMENT FOR THE OIL SECTOR – TRAINING COMPENDIUM: MODULE 4 328

Valuing Oil and Gas Costs and Benefits
Source: Central Expenditure Evaluation Unit, No date
“While the procedure for conducting a CBA can be set out in relatively succinct steps, there are some difficulties in the application of CBA. This section offers a guide to the main practical and technical considerations in conducting a CBA, including why we appraise oil and gas projects, and identifying and valuing costs and benefits.”
Why Conduct Cost-benefit Assessments of Oil and Gas Projects?
Source: Central Expenditure Evaluation Unit, No date
Some features:
• Petroleum projects are usually capital intensive–large investments. • Involve a high level of risk, with uncertainty about discovery, recoverability and viability. • Long time span before return on investment. • Usually lack of correlation between magnitude of expenditure and resulting asset. • Oil and Gas Projects involve high regulation and peculiar fiscal regimes. • Petroleum projects can result into large negative externalities to society e.g., environment
damage, health risks, etc.
Identifying Oil and Gas Project Costs and Benefits
Source: Central Expenditure Evaluation Unit, No date
“A common mistake in CBA is failure to identify all the relevant costs and benefits. A comprehensive approach should be taken to ensure all relevant costs and benefits are included. The analyst should consider tangible and intangible flows. Some of the costs and benefits may be easily quantified and others are more difficult to quantify. It can be useful to consider the different costs and benefits arising by considering the impacts on different stakeholders affected by the project being appraised.”
Identifying Project Costs
Source: Central Expenditure Evaluation Unit, No date
“The costs of a project should reflect the best alternative uses to which resources can be put or opportunity costs. Opportunity costs should usually be reflected in market prices. It can be useful to categorize the various types of incremental costs that arise in a project. One approach to identifying costs involves the distinction between fixed, variable and semi variable costs:
• Fixed costs remain static over a given level of activity or output e.g., rent • Variable costs change in line with changes to the volume of activity or output e.g., operating
costs • Semi variable costs can include a fixed and a variable component e.g., maintenance costs”
“Categorizing costs is important because it gives an insight into cost behavior and the drivers of individual costs. Cost can also be categorized as direct, indirect, or attributable overheads. When attributable overheads are included, these should be calculated on an incremental basis only i.e. the change in overhead costs resulting from the project. It is also important that costs are calculated on a marginal instead of an average basis i.e. the costs which apply specifically to the incremental project outputs. For example, the marginal cost for road maintenance on a particular stretch of road included in a project proposal may be lower than the average costs applying to an entire route. Capital and operating costs should be included in the analysis. Capital costs will tend to arise in the earlier time periods whereas operating costs arise on an ongoing basis throughout the project. Cost estimates should always ensure that all lifecycle costs are included.”
• Typical costs arising in projects include: • Staff
USAID/UGANDA: ENVIRONMENTAL MANAGEMENT FOR THE OIL SECTOR – TRAINING COMPENDIUM: MODULE 4 329

• Investment costs e.g., construction costs, materials etc.
− IT costs − Fixed assets − Equipment − Overheads − Operating costs − Maintenance costs − Negative externalities (e.g., water/noise pollution, environmental damage)
In oil and gas operations, CBA is concerned with the identification of operating and capital expenditures (operational and capital costs) during the life cycle of the project.
“Operating expenditures: Costs which arise on routine basis and are incurred to carry out day-to-day operations: These include: production costs, transportation costs, general and administrative costs, maintenance, insurance, etc.”
“Capital Expenditures: Cost of setting up facilities to enable operations to take place. These costs are not incurred on a day-to-day basis, e.g., Capital Expenditure includes all costs and expenditure, which are incurred in carrying out: Exploration, Appraisal, Development, Abandonment activities. Examples include: Geological and Geophysical Costs, Drilling Costs for all wells (producers, injectors, subsea templates), development costs, abandonment costs.”
Identifying Oil and Gas Project Benefits
Source: Central Expenditure Evaluation Unit, No date
“The benefits of a project can be more difficult to identify because these are often not obvious cash flows but are outcomes relating to the objectives of the CBA. In identifying benefits, the analyst should have due regard to the direct and indirect effects of the interventions.”
Typical benefits may include among others:
• Reduction in loss of life • Reduction in health care costs • Accident savings • Travel time savings • Reduced environmental emissions • Lower operating and maintenance costs • Job creation • Increased water quality • Scenic benefits
Valuing Costs
Source: Central Expenditure Evaluation Unit, No date
“Market prices normally reflect the best alternative uses to which the goods or services could be put or the opportunity cost. Cost estimation is a vital task and requires professional input. A key pitfall to avoid in cost estimation is related to the scope of the project and the related planning/design specifications.”
“Benefits should always be valued based on willingness to pay. Where market values are not available (e.g., scenic benefits, value of life, value of time), other techniques can be used. These include stated preference techniques such as contingent valuation as well as revealed preference techniques such as hedonic pricing and travel cost analysis. Ideally, revealed preference techniques should be used because this reflects real behavior whereas stated preference techniques reflect hypothetical choices in response to questionnaires and surveys. These techniques are summarized below.”
USAID/UGANDA: ENVIRONMENTAL MANAGEMENT FOR THE OIL SECTOR – TRAINING COMPENDIUM: MODULE 4 330

TABLE 7.1: VALUATION TECHNIQUES FOR BENEFITS
Revealed Preference Inferring a price from observing consumer behavior
Hedonic pricing
Using the different characteristics of a traded good to establish the value of a non-traded good, e.g., value of a seafront by comparing prices of houses with and without the seafront
Travel cost analysis
Using the value of traded goods and services to estimate the value of non-traded goods and services, e.g., value of an amenity using travel costs and time
Stated Preference
Estimated by asking people what they would be willing to pay for a particular benefit: can be willingness to pay or willingness to accept
Contingent valuation
Asking consumers about value they would place on outputs/benefits through interviews or questionnaires
The principle of proportionality should always be adopted i.e. if the amount of efforts and resources required to quantify a particular benefit outweighs the advantages of including it, it should not be quantified but a qualitative assessment should be clearly made.
Case Studies: Lost Opportunities: Oil and Gas in Nigeria and Chad
Source: UNEP, 2006
“The oil industry is another high-profile issue in which interlinkages between the environment and social and economic development are important. The benefits and costs associated with the industry are often contested. Although the oil industry has been linked to high levels of growth through increasing national income and employment, it can also be a cost on the environment, impacting negatively on coastal and marine environments and tourism, leading to long-term loss of jobs and thus slowing economic growth.”
“In the Niger Delta region of Nigeria, SSA’s largest oil producer, oil extraction has caused severe environmental degradation due to oil spills and lax environmental regulations (Energy Information Administration 2003). Inadequate investment, social and governance policies have meant that growth has not benefited poor people. For many, oil refineries, wells, and transportation activities are opportunities to increase and diversify trade relationships with other nations and to participate in the global economy.”
“An interlinkages approach is critical for this would consider the loss of energy in the oil production process that could be used to produce electricity. This lost opportunity is the result of a poorly developed natural gas industry. An interlinkages approach, such as through an EIA, would have helped identify these costs and benefits at an early stage and is, therefore, fundamental to identifying opportunities for development. There is often controversy around oil extraction activities. For example, the Chad-Cameroon Pipeline Project, which was approved by the World Bank in June 2000, has been the target of protests from environmental and human rights groups. They argue that the project would dislocate inhabitants along the pipeline route and harm wildlife in the rainforests through which the pipeline would pass. Oil pollution is a major issue in Africa with the chronic release of oil in ports through ship leakage, ship maintenance, or mishandling (Energy Information Administration 2003). According to the US Energy Information Administration, the problem of oil discharge in ports is often ignored, even though cumulatively the oil may negatively impact the surrounding ecosystem, including seabeds, wetlands, and mudlands, which are environmental resources of economic significance (Energy Information Administration 2003).”
“The Chad Oil and Pipeline Project is a $3.7 billion development project comprising some 300 oil wells, which are expected to extract approximately one billion barrels of oil over twenty-five years. Located in Chad's southwestern region, it is one of Africa's largest public/private development projects. Once extracted, the oil will be transported by a 640-mile underground pipeline, through neighboring Cameroon, to an offshore export loading facility. Construction began in October 2000 and the oil began to flow in 2004. Project ownership is composed of a three-company oil consortium (Exxon/Mobil 40 percent, Petronas Malaysia 35 percent and Chevron 25 percent) and
USAID/UGANDA: ENVIRONMENTAL MANAGEMENT FOR THE OIL SECTOR – TRAINING COMPENDIUM: MODULE 4 331

the governments of Chad and Cameroon, which hold a combined 3 percent stake in the pipeline portion of the project. The funds used to secure the investment share of the two countries were provided in the form of a loan by the World Bank. Exxon/Mobil, operating under the name EssoChad, is the project's construction and operations manager.”
FIGURE 7.1: CHAD-CAMEROON OIL PIPELINE PROJECT
Source: MSNBC, No date
Gas Flaring in Niger Delta of Nigeria: Lost Opportunities
Source: UNEP, 2006
“In Nigeria, Angola, Cameroon and Gabon, due to limited gas infrastructure, natural gas which is released during oil production is often burned off, or “flared,” rather than captured for use. Flaring in Africa alone could produce 200 Terawatt hours (TWh) of electricity annually, which is about 50 percent of the current consumption of the region. This is also equivalent to more than 10 percent of committed emission reductions by developed countries under the Kyoto Protocol for the period 2008-2012.”
“Flaring also has environmental impacts. It has been described as “a significant source of carbon emissions” in Africa. Nigeria is the world’s highest natural gas flaring country with 42.6 percent of its total annual natural gas production being flared. In December 2004, the government announced that the country had reduced its natural gas flaring by 30 percent. It has been estimated that Africa every day flares gas equivalent to 12 times the energy that the region uses.”
“Flaring in Africa is, therefore, not only a major economic loss and a missed opportunity for development, but also a contributor to greenhouse gas emissions. The opportunity cost of gas flaring is the amount of power that could have been generated had the gas been channelled to the power sector. The gas to power potential is enormous and is estimated at 27,612 Gwh. This would effectively double Nigeria’s current electricity target for 2014 and could provide 40 percent of Nigeria’s total electricity requirements based on a current needs assessment,” she said. The system is located at the National Oil Spill Detection and Response Agency and was funded by the UK through its Department for International Development.”
USAID/UGANDA: ENVIRONMENTAL MANAGEMENT FOR THE OIL SECTOR – TRAINING COMPENDIUM: MODULE 4 332

FIGURE 7.2: AN UNIDENTIFIED WOMAN CARRIES HER TAPIOCA AFTER DRYING IT NEAR A GAS FLARE BELONGING TO THE SHELL OIL COMPANY IN UTOROGUN, NIGERIA
Source: Murdock, 2012
Addressing Lost Opportunities
Source: UNEP, 2006
“Environmental impact assessments (EIAs) are important tools that employ an integrated and interlinked approach to evaluating relative costs and benefits in diverse spheres -demonstrating the interlinkages between environmental, social, and economic issues—and creating opportunities for deciding on appropriate development opportunities. They seek to produce early and adequate information about the likely environmental consequences of certain plans and projects, to propose alternatives and to establish measures to mitigate harm. Additionally, EIAs potentially bring a multiplicity of government agencies and institutions, organizations, experts and members of the public into the decision-making process.”
“An interlinkages approach that considers the loss of energy in the oil production process that could be used to produce electricity is necessary. This lost opportunity is the result of a poorly developed natural gas industry. An interlinkages approach, such as through an EIA, would have helped identify these costs and benefits at an early stage and is, therefore, fundamental to identifying opportunities for development.”
“National oil industry practices, such EIAs may have a bearing on the implementation of several policy instruments, including MEAs such as the Convention on Biological Diversity, the Ramsar Convention on Wetlands (Ramsar) and the United Nations Framework Convention on Climate Change (UNFCCC), global targets such as the MDGs, and regional plans and programs such as the NEPAD-Environmental Action Plan.”
USAID/UGANDA: ENVIRONMENTAL MANAGEMENT FOR THE OIL SECTOR – TRAINING COMPENDIUM: MODULE 4 333

FIGURE 7.3: AN URHOBO WOMAN BAKES KROKPO-GARRI, OR TAPIOCA, IN THE HEAT OF A GAS FLARE IN AFIESERE
Source: Kashi, 2010
Limitations of EIAs
Source: UNEP, 2006
“EIA is an important tool for development planning and decision-making. Their use ensures that potential environmental impacts are identified, assessed, and taken into account at the project design phase and thus unnecessary costs are avoided.”
“Despite the undoubted importance of EIA as a planning tool, there are many issues and constraints related to its application in SSA. The major constraint to implementation is that there are few institutions equipped to conduct EIAs. Some countries lack established EIA systems and the resources required to train managers in EIA. The vast majority of countries with existing EIA systems have problems in implementing them due to insufficient human, technical and financial resources.”
Externalities
Source: Central Expenditure Evaluation Unit, 2012
“All economic activity has both positive and negative effects. An externality is a side effect to an economic action that affects a third party. Externalities can be benefits or costs, which affect third parties who are not charged for the benefit or compensated for the cost. External benefits include public good effects and beneficial spillover effects for third parties (e.g., new tourist facilities may benefit local businesses). External costs include congestion effects and air and water pollution, population influx etc. Only those externalities which represent a significant project outcome and which can be valued on the basis of a reliable, well-established methodology should be included in the actual CBA. Examples of externalities for a rail project include noise pollution (negative) and reduced carbon emissions (positive). A CBA model may include externalities in both the cost and benefit sections of the CBA analysis.”
“It can prove difficult to price externalities. Studies and national guidelines can provide useful reference values. International data may also be available but it is always advisable to critically assess whether such externality values are suitable. Due regard should be had to national and sectoral guidelines.”
“Significant externalities which cannot be given a monetary value should be excluded from the cost-benefit calculation but nonetheless fully assessed in the cost-benefit report in such a way as to ensure their full consideration in the decision-making process.”
USAID/UGANDA: ENVIRONMENTAL MANAGEMENT FOR THE OIL SECTOR – TRAINING COMPENDIUM: MODULE 4 334

Discounting and Present Values
Time Value of Money
Source: Central Expenditure Evaluation Unit, 2012
“People generally prefer to receive benefits as early as possible while paying costs as late as possible. Costs and benefits occur at different points in the life of the project so the valuation of costs and benefits must take into account the time at which they occur. This concept of time preference is fundamental to CBA and so it is necessary to calculate the present values of all costs and benefits.”
Why Discounting?
Source: Central Expenditure Evaluation Unit, 2012
“Money you have now is worth more today, than an identical amount you would receive in the future. There are at least three reasons for discounting:”
“Opportunity: The money you have now could (in principle) be invested now, and gain return or earn interest between now and future time. Money you will not have until a future time cannot be used now.”
“Risk: Money you have now is not at risk. However, money predicted to arrive in the future is less certain.”
“Inflation: A sum you have today will very likely buy more than an equal sum you will not have until years in future. Inflation over time reduces the buying power of money.”
“Selection of appropriate discount rate is an integral part of the discounted cash flow (DCF) method of project evaluation, which has become the standard means companies/investors use to decide on whether to invest in oil and gas project and the means used to calculate damage in arbitration. Other considerations for the discount rate include:”
• “In valuing a company or project, or determining an award, the discount rate is probably the single most important variable. The longer the time period, the more important it becomes.
• For lawyers, a basic understanding of the DCF and of the factors that go into the determination of an appropriate discount rate is essential:
• Companies/Corporations: Need to understand client objectives, motivations, and the impact of changes in contract terms.
• Litigation/Arbitration: Most lawyers and tribunals are not comfortable with economic or technical issues and tend to focus more on legal issues. However, the former can overshadow the latter in importance.”
TABLE 7.2: ARBITRAL DECISIONS: DISCOUNT RATES IN THE OIL AND GAS INDUSTRY
Case Year Discount Rate
Phillips Petroleum Company Iran vs. The National Iranian Oil Company 1989 20 percent
Himpurna California Energy Ltd. Vs. PT (Persero) Perusahaan Listriuk Negara (Indonesia)
1999 19 percent
Patuha Power Ltd. Bermuda) vs. PT (Persero) Perusahaan Listriuk Negara (Indonesia)
1999 21 percent
Joseph Charles Lemire vs. Ukraine 2011 21.4 percent
USAID/UGANDA: ENVIRONMENTAL MANAGEMENT FOR THE OIL SECTOR – TRAINING COMPENDIUM: MODULE 4 335

Arbitral Decisions Settled by Discount Rates
Source: Central Expenditure Evaluation Unit, 2012
“The discount rate is important because if affects the outcome of the NPV. A high discount rate tends to reduce the NPV because the benefits of capital projects tend to materialize in later time periods whereas costs are incurred in earlier time periods. There is a significant body of literature around the calculation of the discount rate and there are several methods to estimate the rate. It is recommended that appraisers use discount rates of varying magnitudes to test the robustness of CBA’s against an increased discount rate i.e. flexing the discount rate using higher rates. For commercial public projects the cost of capital or a project-specific rate should be used.”
Inflation and Interest Rates
Source: Central Expenditure Evaluation Unit, 2012
“The monetary value of costs and benefits should be expressed in real terms so that the effects of inflation do not distort future cost and benefit streams. This is consistent with the use of a constant (real) test discount rate. Interest payments are reflected in the discounting process and so should not be included in the analysis. It may be necessary to deflate future cash flows, which reflect expected inflation by using a deflator based on forecast inflation levels.”
Application of the Discount Rate
A common application is usually to relate estimated future values to the present i.e., what amount (PV) would you receive today that would be equivalent to a given future amount (FV) in (n) years if interest rate is i percent?
From the formula of future value, FV:
FV = PV(1+i)n then,
PV = 𝑭𝑭𝑽𝑽(𝟏𝟏+𝒊𝒊)𝒏𝒏
The process of converting future cash flows into present value is referred to as “discounting.”
Project cash flows are either cash inflows or cash outflows. Examples of cash inflows are:
• Revenue from selling goods and services), i.e., Gross Revenue=Price x Quantity • Proceeds from sale of assets • Disposal or salvage value at the end of the investment • Oil and Gas Fiscal elements e.g., royalties, state participation, taxes, etc.
Cash outflows include the sum of operating and capital expenditures during the life cycle of the project.
There is an increase in capital expenditures (CAPEX) during the initial stages of project implementation. This is due increase in capital investments. Once the structures are in place, CAPEX decreases, but the company/investor has to incur some operating expenses.
The decrease in net cash inflows (Total benefits-Total Costs) increases the project net benefit (revenues) during the lifecycle of the production after which revenues decline. This corresponds to decrease in oil and gas production at some point when the wells reach depletion stage.
Techniques of Project Appraisal
Source: Department of Transport, Tourism and Sport 2016
Having identified and quantified the costs and benefits there are a number of methods/performance metrics which can be used to differentiate between options. These include:
USAID/UGANDA: ENVIRONMENTAL MANAGEMENT FOR THE OIL SECTOR – TRAINING COMPENDIUM: MODULE 4 336

• Net Present Value Method (NPV method) • Cost-benefit Ratio (B/C) • Internal Rate of Return (IRR) • Payback Period (Payback) • Profitability Index
The Net Present Value
Source: Department of Transport, Tourism and Sport 2016
NPV is the difference between the market value of the project and its cost. This criterion is simply based on whether the sum of discounted benefits exceeds the sum of discounted costs. Similarly, the difference between discounted cash inflows and discounted cash outflows is the NPV. NPV is also known as the Value Additivity Principle: It shows how much value is created from undertaking an investment.
If project costs (capital expenditure and operating costs etc.) vary across the life cycle of the project, they should be discounted.
NPV is computed as the difference between discounted benefits/cash inflows and discounted costs (cash outflows) as follows:
NPV = Sum of Discounted Project Benefits (Revenues)- sum of Discounted costs over the lifecycle of the project.
OR
r is the interest/discount rate for capital. i is time in years.
If NPV> 0, project is viable and should be accepted.
If NPV< 0, project is not viable and should be rejected.
• A positive NPV means that the project is expected to add value to the firm and will therefore increase the wealth of the owners.
• Since our goal is to increase owner wealth, NPV is a direct measure of how well this project will meet our goal.
• NPV is one of the most commonly used project appraisal technique in the oil and gas industry.
Cost-benefit Ratio
Source: Department of Transport, Tourism, and Sport 2016
This is the ratio of discounted benefits to discounted costs.
BCR = sum of present values of benefits/sum of present values of costs
If BCR>1, the project should be accepted.
If BCR<1, the project is not viable. It should be rejected.
If the cost-benefit ratio is greater than one the project may be accepted as there are more benefits than costs. Unfortunately, however this method does not take the size of the project into account so the results can be misleading. Generally, a BCR of greater than 1:1 is an indicator that the proposal can go ahead as a BCR greater than zero implies a positive NPV but there will be projects with a greater BCR. As with the other performance indicators, a positive BCR does not automatically mean a proposal is accepted as other issues are relevant such as affordability constraints and qualitative factors.
( ) ( )∑= +
−∑= +
=n
i irCostsn
i irBenefitsNPV
1 11 1
USAID/UGANDA: ENVIRONMENTAL MANAGEMENT FOR THE OIL SECTOR – TRAINING COMPENDIUM: MODULE 4 337

Worked Example:
You are looking at new oil and gas project and you have estimated the following cash flows:
Year 0: CF = -165,000
Year 1: CF = 63,120
Year 2: CF = 70,800
Year 3: CF = 91,080
Your required return for assets of this risk is 12 percent.
Compute the NPV of the Project and comment on its viability.
Answer:
Year Cash Flows Discount Factor
Discounted Costs (Cash Outflows)
Discounted Cash Inflows (Benefits)
0 -£165,000 1.00 -£165,000
1 £63,120 0.89
56,357 2 £70,800 0.80
56,441
3 £91,080 0.71
64,829
-£165,000 177,627
NPV 12,627.41
NPV>0, the project should be accepted.
The BCR = 177,627/165000 = 1.1. BCR>1, the project should be accepted.
The BCR is also a useful measure because it allows a large number of projects to be ranked.
Internal Rate of Return (IRR)
Source: Department of Transport, Tourism and Sport 2016
The internal rate of return is the maximum rate of interest that a project can afford to pay for the resources used which allows the project to cover the initial capital outlay and ongoing costs and still break even. It can also be described as the discount rate that equates the present value of benefits and costs.
It is the rate at which the NPV=0 (i.e., it equates the total discounted monetary benefits/income with the total discounted costs over the project life). It is the discount rate at which all discounted cash inflows equal discounted cash outflows.
The IRR rule is very important. Management and individuals in general, often have a much better feel for percent returns and the value that is created, than they do for dollar increases. A dollar increase does not seem to provide as much information if we do not know what the initial expenditure was. It is often used in practice and is intuitively appealing. It is required for government approval of projects.
USAID/UGANDA: ENVIRONMENTAL MANAGEMENT FOR THE OIL SECTOR – TRAINING COMPENDIUM: MODULE 4 338

TABLE 7.3: EXPECTED IRRS OF LARGEST OIL PROJECTS IN THE WORLD (PERCENT P.A.)
Minimum 7 percent 25 percent (first quartile) 10 percent 50 percent (median) 18 percent 75 percent ( third quartile) 31 percent Maximum 71 percent
Source: Goldman Sachs, 2011
It should also be noted that the IRR does not distinguish between projects of different sizes.
Assessing Risk and Uncertainty
Source: Department of Transport, Tourism and Sport 2016
Project appraisal involves forecasting the values of costs and benefits using the best information available. An inherent problem with the CBA approach is the difficulty in predicting these values. The estimated values of costs and benefits may not materialize as expected due to uncertainty and risk. There may also be biases in the analysis. The risks of adverse conditions and the potential uncertainty associated with each option should be identified and factored in to the decision-making process. Realistic assumptions should be made which reduce the element of uncertainty and risk minimization strategies should be put in place.
It is important that steps are taken to manage risk and uncertainty as part of the appraisal process. The assessment of risk and uncertainty is one the most important components of a CBA and should be given significant attention. There are a number of key steps which should be taken:
• Ensuring the data and assumptions underlying the estimation of costs and benefits are reliable and realistic.
• Identifying risks e.g., examining each variable to assess the level of uncertainty involved. • Using risk assessment techniques to assess the level of risk and the impact of risk on project
performance including such techniques as:
− Sensitivity analysis − Scenario analysis − Expected values − Monte Carlo analysis
• Devising a risk management strategy including measures to contain, avoid and mitigate risks, as appropriate.
• Communicating the risk management strategy to relevant stakeholders.
Sensitivity Analysis
Source: Department of Transport, Tourism and Sport 2016
Sensitivity analysis should always be carried out as part of a CBA. Sensitivity analysis describes the process of establishing the extent to which the outcome of the CBA is sensitive to changes in the values of the input variables. It generally involves recalculating the NPV based on changes to the values of variables and assumptions.
The approach involves recalculating the NPV based on changes of the values of variables and assumptions. A comprehensive approach to sensitivity analysis allows the analyst to determine those variables and assumptions to which the NPV is most sensitive. Therefore, it is not sufficient to simply test what are assumed to be the critical variables for the analysis. Instead, the sensitivity analysis should be carried out for all project variables. In addition, the analyst should test the NPV for
USAID/UGANDA: ENVIRONMENTAL MANAGEMENT FOR THE OIL SECTOR – TRAINING COMPENDIUM: MODULE 4 339

significant adjustments to variables (e.g., 5, 10, or 20 percent increase or decrease in the value of variables such as costs, prices, etc. in order to adequately assess the robustness of the CBA.
The results of the sensitivity analysis should also be used during the implementation phase of the project as the project manager should be made aware of the key variables and assumptions that will affect project performance. Particular attention should be devoted to implementing risk avoidance, containment, or mitigation measures for these variables and to monitoring out-turn for these variables as the project is implemented.
Scenario Analysis
Source: Department of Transport, Tourism and Sport 2016
It should be noted that sensitivity analysis is the same as scenario analysis. A number of scenarios are formulated—best case, worst case, etc.—and for each scenario identified, a range of potential values is assigned for each cost and benefit variable.
Monte Carlo Analysis
Source: Department of Transport, Tourism and Sport 2016
Monte Carlo analysis is a risk modeling technique that uses statistical sampling and probability distributions to simulate the effects of uncertain variables on model outcomes. It can be used to model the effects of key variables on the NPV of a given proposal. The approach provides a systematic assessment of the combined effects of multiple sources of risk in key variables and can also allow for known correlations between these variables. The analysis can generate a probability distribution for the NPV. Although it is a useful technique, it requires expertise to apply and interpret the analysis. If the project analyst is inexperienced in the technique, it is satisfactory to focus on sensitivity and scenario analysis for risk assessment purposes.
Concluding Remarks
Source: Department of Transport, Tourism and Sport 2016
The final outcome of the CBA analysis is a recommendation as to whether there is a preferred option and whether the project should proceed or not. Given the importance of appraisal decisions for projects and programs, it is vital that the results of the CBA are presented and reported clearly, transparently and comprehensively. Since the readers of appraisal documents are often decision makers who may not have detailed technical knowledge of economic appraisal methods, non-technical language should be used wherever possible to ensure clear communication.
Summary tables should be used to highlight the performance indicator results of the CBA for all the options. There should also be a clear presentation of the main costs and benefits that influence the outcome of the analysis for each option. There should be a summary of the main performance criteria for all realistic options including the NPV values, IRR values (where appropriate) and BCR ratios.
The range of potential outcomes based on the risk assessment should be described. In addition, any relevant decision criteria for the performance indicators should be outlined, e.g., the IRR should exceed the official discount rate, the NPV should exceed 0 and the BCR should exceed at least 1:1.
Case Studies
Case Study 1: Application of Integrated Project Appraisal using Cost-Benefit Assessment Technique: The Manila South Water Distribution Project
Source: Jenkins, 2008
Projected Project Outcomes:
• Estimated total cost: 1,369.5 million 1990 Philippine Pesos.
USAID/UGANDA: ENVIRONMENTAL MANAGEMENT FOR THE OIL SECTOR – TRAINING COMPENDIUM: MODULE 4 340

• Financial analysis results: marginally negative NPV of -77.76 million pesos using a real discount rate of 9 percent.
• Economic analysis results: positive economic NPV of 2117.87 million pesos using a real discount rate of 10.3 percent.
• The break-even price for new expansions is about Ps. 5.2/m3. • Project potentially economically attractive but financially weak. Risk for failure unless possibility
of poor financial outcome mitigated.
Actual Outcome:
• Project has failed to deliver the service it promised due to inadequate financial operating revenues.
Case Study 2: Hypothetical Oil Production Project-City of Hermosa Beach, Los Angeles, California: Cost-Benefit Analysis
Source: City of Hermosa Beach, No date
What Types of Costs Will Be Evaluated?
• Direct costs to the City per the Settlement Agreement; relating to impacts on City resources, services, and relocation of the Public Works Facility, project entitlement administration, etc.
• Payment options and costs to carry out the Settlement Agreement. • Impacts to the residents and economy, on the City’s image or “brand,” real estate and property
issues, insurance considerations, impact on City facilities, costs to the City of acquiring debt, etc.
What Types of Benefits and Revenues Will Be Evaluated?
• Revenue based on stated oil and gas production rates • Revenue based on whether oil and gas comes from the tidelands or the uplands • Property taxes received by the City from the value of oil and gas reserves • Revenues to Hermosa Beach City School District • Economic impacts of jobs generated and earnings
Will the Community Have a Say in the Cost/Benefit Analysis?
Yes. The City will retain a qualified consultant with economic, fiscal and real estate analyses, public finance, land use, oil and gas development, and other relevant experience. The public may provide input on the issues to be evaluated in the CBA.
Case Study 3: Drilling for Natural Gas in the U.S.
Source: Considine et al., 2011
Directional drilling and hydraulic fracturing have unlocked vast new reserves of natural gas in the United States. Development of these resources is now well under way in Pennsylvania and West Virginia. Unlike their neighbors to the south, however, New York residents are not directly benefiting from natural gas development as the result of a government-imposed moratorium, itself a response to environmental concerns surrounding hydraulic fracturing. The table below shows the net benefits (economic and social) that would be attained if the moratorium was removed. The findings suggest the net economic benefits are significantly positive.
USAID/UGANDA: ENVIRONMENTAL MANAGEMENT FOR THE OIL SECTOR – TRAINING COMPENDIUM: MODULE 4 341

TABLE 7.4: SUMMARY OF ECONOMIC COST-BENEFIT ANALYSIS
Source: Considine et al., 2011
REFERENCES
Benedini, M. & Tsakiris. G. (2013). Water quality modeling for rivers and streams. Dordrecht, Netherlands: Springer Scientific.
Brainchemist. (2011). Diffusion. Retrieved from https://brainchemist.files.wordpress.com/2011/01/diffusion.gif
Central Expenditure Evaluation Unit. (2012). Guide to economic appraisal: Carrying out a cost benefit analysis. The Public Spending Code. Standard Analytical Procedures. Republic of Ireland
City of Hermosa Beach. (No date). City of Hermosa Beach Oil Production Project – Cost/Benefit Analysis. Retrieved from http://www.hermosabch.org/modules/showdocument.aspx?documentid=3244
Commonwealth of Australia. (2006). Handbook of cost-benefit analysis. Retrieved from https://www.finance.gov.au/sites/default/files/Handbook_of_CB_analysis.pdf
Considine, T. J., Watson, R. W., & Considine, N. B. (2011). The economic opportunities of shale energy development. The Manhattan Institute, June, 28.
Cooper, A. E., Cooper, E. A., & Heward, J. A. (1919). On the self-purification of rivers and streams. Biochemical Journal, 13(4), 345.
Department of Transport, Tourism and Sport. (2016). Common appraisal framework for transport projects and programmes. Republic of Ireland. Retrieved from http://www.dttas.ie/sites/default/files/publications/corporate/english/common-appraisal-framework-2016-complete-document/common-appraisal-framework.pdf
USAID/UGANDA: ENVIRONMENTAL MANAGEMENT FOR THE OIL SECTOR – TRAINING COMPENDIUM: MODULE 4 342

Earthsoft. (2015). SOP–EDP and EDGE: Flow Calculations. Retrieved from https://help.earthsoft.com/default.asp?W3035
Eshun, P.A. & Mireku-Gyimah, D. (2012). Economic evaluation of mineral projects: A socio-environmental and economic model for gold projects. Lambert Academic Publishing.
European Union Commission. (2008). Guide to cost-benefit analysis of investment projects. Directorate General Regional Policy. Retrieved from http://ec.europa.eu/regional_policy/sources/docgener/guides/cost/guide2008_en.pdf
Fondriest Environmental Inc. (2016). Measuring Dissolved Oxygen. Retrieved from http://www.fondriest.com/environmental-measurements/equipment/measuring-water-quality/dissolved-oxygen-sensors-and-methods/
Irish Government Economic and Evaluation Unit. (n.d.) The public spending code: D. standard analytical procedures overview of appraisal methods and techniques. Central Expenditure Evaluation Unit. Retrieved from http://docplayer.net/12774201-The-public-spending-code-d-standard-analytical-procedures.html
Japan Water Guard. (No date). Natural purification function in river. Retrieved from http://ngojwg.org/study3-2-e.html
Jha, R., Ojha, C. S. P., & Bhatia, K. K. S. (2007). Critical appraisal of BOD and DO models applied to a highly polluted river in India. Hydrological sciences journal, 52(2), 362-375.
Jenkins, G.P. (2008). Project Appraisal and Public Sector Investment Decision Making. Presentation. Retrieved from http://www.powershow.com/view/14ee66-MWY2M/Project_Appraisal_and_Public_Sector_Investment_Decision_Making_powerpoint_ppt_presentation
Johnston, D. (2002). Economic and risk analysis of oil and gas projects. Scotland: University of Dundee.
Kashi, E. (2010). Curse of the Black Gold: 50 Years of Oil in the Niger Delta. Retrieved from https://www.theguardian.com/environment/gallery/2010/mar/05/curse-black-gold-nigeria
McGraw-Hill Companies. (No date). Oxygen depletion cycle. Retrieved from https://www.unc.edu/courses/2005fall/envr/051/001/05watpol05.jpg
Mishan, E.J. & Quah, E. (2007). Cost-benefit analysis. Fifth edition. Routledge. Abingdon, U.K.
Morgenroth, E. (2011). How can we improve evaluation methods for public infrastructure? Renewal Seris, paper 2. Dublin, Ireland: Economic & Social Research Institute. Retrieved from https://www.esri.ie/pubs/EC002.pdf
MSNBC. (No date). Chad Cameroon oil pipeline project: A study tool and case study. Retrieved from http://www.columbia.edu/itc/sipa/martin/chad-cam/overview.html
Murdock, H. (2012). Nigeria Mulls Gas Flare Crackdown. Retrieved from https://www.voanews.com/a/nigeria-mulls-gas-flare-crackdown/1360704.html
N Calculators. (2017). Water Quality Modelling (Streeter-Phelps) Equation & Calculator. Retrieved from http://ncalculators.com/environmental/dissolved-oxygen-concentration-calculator.htm
Shipco Pumps. (2012). Oxygen Solubility. Retrieved from https://www.shipcopumps.com/articles/index.php?category=technical-articles&id=oxygen-solubility
Sinden, J.A. & Thampapillai, D.J. (1995). Introduction to cost-benefit analysis. Australia: Longman.
UNEP. (2006). Africa environment outlook 2: Our environment, our wealth. Division of Early Warning Assessment.
USAID/UGANDA: ENVIRONMENTAL MANAGEMENT FOR THE OIL SECTOR – TRAINING COMPENDIUM: MODULE 4 343

LECTURE 8: ENVIRONMENTAL AUDITING
SYLLABUS
Teaching Aims
(i) Introduce students to the concepts and practices of environmental auditing. (ii) Provide filed skills to enable the students carry out environmental audits on medium scale
projects within their professional mandates.
Learning Outcomes
(i) Describe the general principles and concepts applied in environmental auditing and monitoring. (ii) Carry out oil and gas-related environmental audits with the objective of minimizing
environmental risk and improving environmental performance within their fields of specialization.
Outline of Lecture Content
Topic and Subtopic Suggested Approach, Method and Equipment
1. Introduction Q&A guided by questions aimed at covering all the sub-topics
2. General principles of environmental auditing
3. Types of environmental audits in Uganda
Q&A guided by questions aimed at covering all the sub-topics
4. Environment auditing process • The topic could be introduced through case studies of real life audit reports
• Guide trainees to plan for audits in groups. The activities to be audited need not be an oil business. As much as possible the entities to be audited should be that which may exhibit impacts which are similar to those from oil and gas
• Brainstorming to build of trainees knowledge and experiences
5. Provide a practical on how and environmental audit can be done
Guide students on how to develop an audit checklist and have them use the checklists to carry out an actual audit
DETAILED NOTES
Introduction
Source: Rai et al., 2015
“Conducting an environmental audit is no longer an option but a sound precaution and a proactive measure in today’s heavily regulated environment. Environmental auditing has a valuable role to play, encouraging systematic incorporation of environmental perspectives into many aspects of an organization’s overall operation, helping to trigger new awareness and new priorities in policies and practices.”
“Environmental auditing (EA) is a systematic, documented, periodic and objective evaluation of how well an organization’s management and equipment are performing in conserving the environment and its resources. It is the technical and institutional activity aimed at measuring, evaluating and tracking potential socioeconomic, physical, chemical and biological changes to the environment caused by operative activities or external factors.”
USAID/UGANDA: ENVIRONMENTAL MANAGEMENT FOR THE OIL SECTOR – TRAINING COMPENDIUM: MODULE 4 344

“Environmental monitoring is the technical and institutional activity aimed at measuring, evaluating and tracking potential socioeconomic, physical, chemical and biological changes to the environment caused by operative activities or external factors. It is also the continuous determination of actual and potential effects of any activity or phenomenon on the environment, whether short-term or long-term.”
“Environmental auditing is one of the environment management tools used to guide and monitor compliance with the environmental regulatory requirements among the regulated community. An effective environment audit process can help to promote sound environment management practices thereby achieving environmental compliance and improving efficiencies for facilities, projects and activities.”
Purpose of Environmental Auditing and Monitoring
Source: International Standard Organization, 1996
“Environmental auditing has established itself as a valuable instrument to verify and help improve environmental performance. Monitoring and auditing is are key environmental management tools as they are used to determine whether the mitigation measures suggested in the ESIA are being implemented and determine the extent of their effectiveness. Additionally, they also check whether an EMS is well implemented and maintained.”
“Through monitoring and auditing, the oil company can take the appropriate corrective measures to create a monitoring plan related to oil and gas activities. Baseline information on pristine conditions and conditions before an oil and gas activity begins is compared against exploration drilling, development and post-development effects. An assessment of the efficiency of mitigation and restoration measures is carried out through the monitoring and auditing activities.”
“Auditing is a mechanism for feedback, learning from experience and adaptive management. Without it, and if it is not done on time, the usefulness of the ESIA and environmental outcomes is lost.”
Terms Used in Environmental Auditing
Source: International Standard Organization, 1996
“Audit conclusion is a professional judgement or opinion expressed by an auditor about the subject matter of the audit, based on and limited to reasoning the auditor has applied to audit findings. “Audit criteria are policies, practices, procedures or requirements against which the auditor compares collected audit evidence about the subject matter. These requirements may include but are not limited to standards, guidelines, 'specified organizational requirements and legislative or regulatory requirements.”
“Audit evidence is verifiable information, records or statements of fact. Audit evidence can be qualitative or quantitative and this is used by the auditor to determine whether audit criteria are met. Audit evidence is typically based on interviews, examination of documents, observation of activities and conditions, existing results of measurements and tests or other means within the scope of the audit.”
“Audit findings are results of the evaluation of the collected audit evidence compared with the agreed audit criteria. The audit findings provide the basis for the Audit Report.”
“Checklists are lists of all the activities, processes and discharges to be addressed during the audit including a list of elements to be audited and the type of observations to be made to assess compliance.”
“Environmental auditor is a person qualified to perform environmental audits. Qualification criteria for environmental auditors are given, for example, in IS0 14012 and in Uganda these are called practitioners and they must be registered and certified by the National Environment Management Authority (NEMA).”
USAID/UGANDA: ENVIRONMENTAL MANAGEMENT FOR THE OIL SECTOR – TRAINING COMPENDIUM: MODULE 4 345

Timing of an Environmental Audit
Source: International Standard Organization, 1996
“According to the National Environment (Audit Regulations) 2006, an EA is carried out between 12-36 months from the time a project commences and then annually after that. However, an audit can be carried out at any stage of the project once it has commenced.”
“An environmental audit should focus on clearly defined and documented subject matter. The party (or parties) responsible for this subject matter should also be clearly identified and documented.”
Linkage between the Environment Impact Assessment (EIA) and Environmental Audit
Source: International Standard Organization, 1996
“Generally, EIA and EA are two different processes but are interlinked. An EIA is carried out before a project commences and yet an EA is carried out during the project operation phase. In other words, an EA is a continuation of an EIA. EIAs assess future impacts whereas EA assess actual impacts of a given projects. Take for instance, an EIA may predict soil erosion as a result of stripping top soil for camp construction an EA will ascertain if this has actually happened. If soil erosion has occurred then the EA will determine the intensity and also check if the suggested mitigation measures have been effective or not.”
“EIAs usually act as baselines that EAs benchmark on. For example, an EIA will record the vegetation status of an area where a proposed project would take place in terms of quality and quantity. An EA will on the other hand compare the vegetation status during the operational phase of a project with what was earlier collected by the EIA.”
General Principles of Environmental Auditing
Objectives and Scope
Source: International Standard Organization, 1996
“The audit should be based on objectives defined by the client. The scope is determined by the lead auditor, in consultation with the client, to meet these objectives. The scope describes the extent and boundaries of the audit.”
“The objectives and scope should be communicated to the auditee prior to the audit.”
Objectivity, Independence and Competence
Source: International Standard Organization, 1996
“In order to ensure the objectivity of the audit process and its findings and any conclusions, the members of the audit team should be independent of the activities they audit. They should be objective, and free from bias and conflict of interest throughout the process. The audit team members should possess an appropriate combination of knowledge, skills, and experience to carry out audit responsibilities.”
Due Professional Care
Source: International Standard Organization, 1996
“In the conduct of an environmental audit, auditors should use the care, diligence, skill and judgement expected of any auditor in similar circumstances. The relationship between the audit team members and the client should be one of confidentiality and discretion.”
“Unless required by law, the audit team members should not disclose information or documents obtained during the audit, or the final report, to any third party, without the express approval of the client and, where appropriate, the approval of the auditee. The auditor should follow procedures that provide for quality assurance. The environmental audit should be conducted in accordance with
USAID/UGANDA: ENVIRONMENTAL MANAGEMENT FOR THE OIL SECTOR – TRAINING COMPENDIUM: MODULE 4 346

these general principles and any guidelines developed for the appropriate type of environmental audit.”
“As each audit site will have its own unique characteristics, it is essential that the auditors to assess the applicability of the checklists and protocols and make amendments where necessary. It will also be the responsibility of the auditors to update the legislative compliance audit protocols to reflect the latest developments in legislation.”
Types of Environmental Audits in Uganda
Environmental Compliance Audits
Environmental compliance audits are performed to determine the compliance status of a project with environmental and health regulatory requirements and all relevant permits, licenses and approval conditions. All environmental compliance audits are carried out by auditors who have been duly certified and registered as an environmental auditor in accordance with the National Environment (Conduct and Certification of Environmental Practitioners) Regulations, 2003.
Environmental Enforcement Audits
Environmental enforcement audit means a compulsory environmental audit required by National Environment Audit Regulations. The NEMA shall at any time, following a petition or at the instance of the Executive Director, the environmental inspector or any other person authorized in writing by the Executive Director, carry out an environmental enforcement audit for projects that have or may have significant adverse impacts on the environment.
Environmental Internal/Voluntary Audits
Environmental Internal/Voluntary Audits are audits carried out by the operator without the demand or direction of NEMA, a lead agency, a third party or an order of a court of law.
Environment Auditing Process
Planning an Environmental Audit
Source: Environmental Protection Department, 2015
Any entity that wishes to conduct an environmental audit must have a clear idea of the objectives of the exercise and the steps required to achieve it. Before commencing an environmental audit, the following requirements must be fulfilled.
Commitment
• Ensure that commitment is obtained at the managerial level; and • Communicate commitment to personnel at all levels.
Define Audit Scope and Audit Site(s)
Source: Environmental Protection Department, 2015
• Audit site and boundary • Audit objective(s) • Areas of audit
Audit objectives usually entail verification of legislative and regulatory compliance, assessment of internal policy and procedural conformance, establishment of current practice status and identification of improvement opportunities.
Areas of audit normally encompass material management, savings and alternatives, energy management and savings, water management and economy of use, waste generation, management and disposal, noise reduction, evaluation and control (internal and external), air emissions and
USAID/UGANDA: ENVIRONMENTAL MANAGEMENT FOR THE OIL SECTOR – TRAINING COMPENDIUM: MODULE 4 347

indoor air quality, environmental emergency prevention and preparedness, transportation and travelling practices, staff awareness, participation and training in environmental issues, environmental information publicity, public enquiry and complaints response, environmental management system set up, suitability and performance.
Assemble an Audit Team
Source: Environmental Protection Department, 2015
An Audit Management Committee (AMC) established by management of an institution is responsible for overseeing the audit process, appointing an audit team leader to be in charge of the audit, securing the necessary resources and funding and reviewing the Audit Report and reporting to the organization management. The AMC in conjunction with the audit team leader will appoint audit team members, assess requirement for external assistance to ensure thoroughness and objectivity of audit, secure financial resources if external assistance is required and confirm availability of audit team members. At each audit site, site facilitator(s) is/are selected to provide local support to the audit team in gathering the necessary information and assistance during the audit.
Conducting an Environmental Audit
Source: Environmental Protection Department, 2015
An environmental audit is typically undertaken in three phases, namely pre-audit, on-site audit and post-audit. Each of these phases comprises of a number of clearly defined objectives, with each objective to be achieved through specific actions, and these actions yielding results in the form of outputs at the end of each phase.
Pre-Audit Phase
Objectives of the Pre-Audit Phase
• Develop an audit plan for the on-site activities. • Make the necessary preparation and arrangements for the on-site audit.
Actions of the Pre-Audit Phase
• Develop an audit plan.
The audit plan should address the following:
− Where the audit site is found and define clear boundaries − Determine the scope and objectives of the audit − How the audit will be delivered for example; through site personnel interview, site
inspection, audit protocols, site logistics, and administrative arrangement − Who will be on an audit team and site facilitation arrangement − Establish an audit schedule and milestones
• Prepare pre-audit questionnaire and checklists.
The audit team needs to prepare are questionnaire and document checklists that will be used during the audit. These covers issues such as:
− Overall environmental management − Procurement policy − Energy management − Materials management − Water and wastewater management − Waste management
USAID/UGANDA: ENVIRONMENTAL MANAGEMENT FOR THE OIL SECTOR – TRAINING COMPENDIUM: MODULE 4 348

− Noise monitoring and control − Air quality monitoring and control − Emergency response procedures − Transportation and travelling − Staff awareness and training − Social issues including gender and cultural − Publicity of environmental information − Response to public enquiries and complaints
The questionnaire and checklists are to be forwarded to the relevant site personnel for completion.
• Review background information.
This aimed at gaining familiarity with audit site through review of various things such as:
− Previous ESIAs and audits − Site layout plan(s) − Site history, use and activities − Blue prints/as built drawings − Organizational structure at audit site(s) − Internal environmental policies, procedures, and guidelines
• Review operational information.
The main purpose of reviewing operational information is to gain appreciation of site activities and operational practices on-site through review of the following:
− Operational activities and process descriptions − Management system policies, procedures and program documentation − Relevant records (compliance, monitoring, training, maintenance, calibration) − Other relevant information pertaining to environmental management practices
• Conduct initial site visit.
The audit team has to arrange with the site facilitator(s) for an initial visit during normal operation of the audit site to:
− Meet with officer-in-charge to explain purpose of audit. − Assess whether background information gathered is up to date and accurate. − Follow-up on the list of preliminary audit impressions. − Identify and request additional site information as necessary. − Confirm thoroughness of audit scope. − Establish adequacy of resources for audit.
• Develop on-site questionnaire and audit protocols.
While on-site, the audit team should develop a series of step-by-step questions and evaluation criteria to assess the following:
− Compliance with pertinent legislative and regulatory requirements − Conformance with internal environmental policies, procedures and guidelines − Status of current environmental practices − Staff awareness of internal environmental policies, procedures, and guidelines
USAID/UGANDA: ENVIRONMENTAL MANAGEMENT FOR THE OIL SECTOR – TRAINING COMPENDIUM: MODULE 4 349

• Review audit plan and resource allocations.
After the initial site visit, all documents and resource allocations should be updated or revised to reflect current knowledge and conditions. Key points to review include:
− Audit scope − Audit schedule − Audit protocols − Allocated resources
• Outputs of the pre-audit phase.
− Audit plan − Package of background information − Completed operational information questionnaire and audit checklists − On-site questionnaire and audit protocols
On-Site Audit Phase
Source: Environmental Protection Department, 2015
Objectives
The on-site audit objectives should reflect those of the environmental audit, which are:
• Verification of legislative and regulatory compliance • Assessment of internal policy and procedural conformance • Establishment of current practice status • Identification of improvement opportunities
Actions of the On-Site Audit Phase
Source: Environmental Protection Department, 2015
Unfortunately, audits are often perceived as part of a scheme to dig up ‘dirt’ or find faults with personnel. Therefore, during the on-site audit exercise one should dispel this misconception by stressing that the audit is a systems performance assessment and that every staff can take part in contributing towards an overall performance improvement.
Opening Meeting
Source: Environmental Protection Department, 2015
Conduct on-site audit opening meeting with the office manager and site personnel to:
• Introduce audit team members • Present audit scope and objectives • Outline the audit approach and methodology • Address questions or concerns of site personnel • Rally staff support and assistance
Document Review
Source: Environmental Protection Department, 2015
An audit team member undertakes a review of relevant document such as:
• Management policy • Management system documentation
USAID/UGANDA: ENVIRONMENTAL MANAGEMENT FOR THE OIL SECTOR – TRAINING COMPENDIUM: MODULE 4 350

• Operational procedures • Records (utility, inventory, monitoring, calibration, transportation, training) • Previous audit reports
In particular, to evaluate whether the records are:
• Current • Properly completed • Signed and dated • Consistent • Meet relevant requirements
Detailed Site Inspection
Source: Environmental Protection Department, 2015
The audit team then conducts a detailed site inspections with aid of on-site audit protocols to look for evidence on:
• Compliance with legislative and regulatory requirements • Conformance with internal policies, procedures and guidelines • Status of operational practice • Staff participation in management system implementation
Staff Interview
Source: Environmental Protection Department, 2015
This is done to obtain information on:
• Actual practices (current and past) • Compliance with/or deviation from statutory and departmental requirements • Awareness of requirements and expectations • Ideas to improve • Comments and suggestions
Review Audit Evidence
Source: Environmental Protection Department, 2015
All audit evidence collected should be reviewed to ensure its adequacy before conclusions are made by:
• Reviewing information gathered • Collecting additional information as needed • Substantiating audit findings • Summarizing and documenting all findings and observations • Identifying issues requiring immediate attention/mitigation • Noting outstanding issues requiring follow-up • Preparing debriefing material for the closing meeting
Closing Meeting
Source: Environmental Protection Department, 2015
The closing meeting provides an opportunity at the conclusion of on-site audit to:
• Debrief the senior site management
USAID/UGANDA: ENVIRONMENTAL MANAGEMENT FOR THE OIL SECTOR – TRAINING COMPENDIUM: MODULE 4 351

• Summarize the audit activities and findings • Highlight system strengths and weaknesses • Discuss preliminary findings and recommended • Corrective actions • Bring up findings requiring immediate attention • Clarify any outstanding issues • Address staff questions or concerns • Agree on reporting schedule and chain of communication
Outputs of the On-Site Audit Phase
Source: Environmental Protection Department, 2015
• Documented audit findings and supporting evidence • Basis for evaluating conformance status in relation to statutory and internal requirements • Basis for assessing performance status and improvement recommendations
Post-Audit Phase
Source: Environmental Protection Department, 2015
Objectives
• Produce an audit report with audit findings and recommendations. • Contribute towards formulation of an action plan for continual performance improvement.
Actions of the Post-Audit Phase
• Collate information and follow-up on outstanding issues.
This information should include:
− Completed pre-audit questionnaires, operational document checklists − Completed on-site survey questionnaires, on-site audit protocols − All relevant correspondence, memoranda, reports, diagrams and drawings − Copies of records, photographs, and other information collected during the site visit − Detailed inspection and interview notes and summaries
• Prepare the Audit Report.
The audit report should have the following contents:
− Executive summary − Introduction and background to the audit − Audit scope and objectives − Description of audit approach and methodology − Summary of audit findings and recommendations − Conclusions
In particular, the findings summary should at least cover areas such as status of compliance with environmental legislative requirements, status of conformity with internal environmental policies, procedures and guidelines, status of good environmental practices implementation, level of staff awareness of operational issues relating to environmental performance, overall status of environmental performance and recommendations for environmental performance improvement.
• Circulate draft Audit Report for comments
USAID/UGANDA: ENVIRONMENTAL MANAGEMENT FOR THE OIL SECTOR – TRAINING COMPENDIUM: MODULE 4 352

The following parties need to be provided with a draft report for comments.
− Audit management committee − Senior audit site management − Site facilitator(s) − Site personnel with responsibilities for implementing the major recommendations − Other parties as may be deemed necessary but not regulatory agencies
• Final reporting
At this stage, incorporate or resolve all comments received before producing the final report then issue the report to the AMC and site senior management for endorsement. It is at the stage that the final report is submitted to the relevant regulatory agencies.
• Output of the post-audit phase
The final audit report which addresses issues such as environmental legislation compliance status, departmental environmental policies, procedures and guidelines conformity status, status of current environmental performance and recommendations for performance improvement.
Following Up an Environmental Audit
Source: Environmental Protection Department, 2015
An action plan with the appropriate targets and objectives for environmental improvement may be developed in consultation with audit site senior management. An action plan should cover action objectives, specific actions required, responsible party(ies), budget allotted and an implementation program.
After an action plan is put in place, then responsible party(ies) undertake actions according to the allotted budget, and the agreed timescale for completion. Regular monitoring of the progress of implementing the action plan should be done. A status report should be carried out and should include information such as progress of action(s) undertaken, problem(s) encountered when action(s) taken and proposed solution(s) and revised timescale for completion.
Contents of an Environmental Audit Report
Source: Environmental Protection Department, 2015
An environmental audit report has the following contents at a minimum.
Environment audit team and report authors:
• Non-technical summary • Introduction
− Objectives − Scope − Methodology − Description of the audited facility
• Policy, legal, regulatory, and institutional framework • Audit findings and corrective measures
− Gaps and limitations − Summary of the audited facility − Conclusion
• References
USAID/UGANDA: ENVIRONMENTAL MANAGEMENT FOR THE OIL SECTOR – TRAINING COMPENDIUM: MODULE 4 353

Environmental Monitoring in Uganda’s Oil and Gas Sector
The main goal of monitoring oil and gas development in the Albertine Graben is to provide basis for public confidence about the safety and environmental responsiveness of the oil exploration and development activities. In addition, monitoring will support fulfillment of objective 9 of the National Oil and Gas Policy which is “to ensure that oil and gas activities are undertaken in a manner that conserves the environment and biodiversity” and ensure compliance with legal requirements that relate to oil development and environmental sustainability.
Environmental monitoring of the oil and gas sector is done by both government and oil companies. In 2012, the Government of Uganda developed the Environmental Monitoring Plan for the Albertine Graben 2012-2017 to ensure that sustainable exploitation and utilization of petroleum resources is done.
The Environmental Monitoring Plan for the Albertine Graben identified key valued ecosystems components together with indicators to be monitored based on physical, biological, social and cultural characters.
A valued ecosystem component is a resource or environmental feature that is important not only economically to a local human population, or has a national or international importance or if altered from its existing status, will be important for the evaluation of environmental impacts of industrial developments, and focusing on administrative efforts. Below is a table indicating the Valued Ecosystem Components for each theme and the measurable indicators.
TABLE 8.1: VALUED ECOSYSTEM COMPONENTS
Category (VEC) Measurable Indicator Name (What): Aquatic ecosystem Wetlands Key water quality indicators(DO, Chl-a, P, N pH etc.), Plant species richness
and composition Vegetation cover, flow, Key water quality indicators(DO,Chl-a, P,N pH etc), Plant species richness and composition
Fish Water quality (DO, P, N, Chl-a, PHCs, transparency, conductivity) Water quality (BOD, COD, pH, PHCs, etc.)
Terrestrial ecosystem Flagship mammals (e.g., elephants, lions, Uganda Kob, etc.)
Mammal numbers and diversity, mammal ranges (area), infrastructure density, gene diversity, stress hormone levels Number of spill incidences, heavy metal levels in the food chain, presence and level of heavy metals in water and soils Number of snares, poached animals, apprehended poachers, number of public awareness meetings Human and animal demography, number of snares, number of animals poached, poachers apprehended, number of human-wildlife conflicts reported Number of kills or injuries, vehicles
Flagship birds (e.g., African fish eagle, vultures, forest birds, etc.)
Birds numbers and diversity, ranges (area), infrastructure density, gene diversity, stress hormone levels Number of spill incidences, heavy metal levels in the food chain, presence and level of heavy metals in water and soils Birds demography, disease among birds communities Noise levels, light intensity, bird diversity and demography, migratory patterns
Flagship wetland species (e.g., frogs, butterflies, dragonflies, water fowls, etc.)
Wetland species numbers and diversity, ranges (area) and infrastructure density
Flagship floral ecosystem components (e.g., wetlands, forests, savannas, woodlands, agriculture)
Number and coverage of invasive species, areas that have changed from one cover type to another, number of conflicts reported Area of land cover types, biomass stocking including regeneration, biodiversity, trade in timber and non-timber forest products Number and quantity of spills, spatial coverage of spill, response time to spills
USAID/UGANDA: ENVIRONMENTAL MANAGEMENT FOR THE OIL SECTOR – TRAINING COMPENDIUM: MODULE 4 354

Category (VEC) Measurable Indicator Name (What): Below ground biodiversity (macro and microorganisms, etc.)
Counts of soil BGBD e.g., earthworm and beetles Counts of soil BGBD at representative waste disposal or oil spill sites
Physical/chemical Water Site samples analyzed for heavy metals
River discharge, lake levels, groundwater levels and rainfall Wastewater, biological indicators, leachate parameters, heavy metals, PHCs and nutrient loads.
Air Noise levels, vibrations, concentrates of gases and particulate matter. Soil Area covered by the spill, Magnitude, and extent of oil traces, results from
laboratory tests for hydrocarbons and heavy metals. Micro climate Changes in; rainfall, wind, temperature, pressure, evapo-transpiration and solar
radiation. Society Settlements Number of people; Number of settlements; Size of settlements.
Size and composition of labor force. Number of people employed by sector and occupation.
Food Acreage of land under food production; Food price index Food availability in the region; Household incomes Number of food storage facilities. Acreage of land under food production; Total food production in the country; Household incomes
Water and sanitation Portable water coverage; Latrine coverage; Number of waste disposal facilities; Distance to nearest safe water source Time taken to collect water from nearest water source Number of cases due to water-borne diseases
Health Number of health facilities; Prevalence of diseases; Mortality rate; Number of deaths by cause.
Energy Types of energy sources. Number of people using energy source by type and quantity.
Infrastructure Quantity of mineral resources; Location of mineral resources; Available infrastructure.
Education Number of education facilities; Number of school-going age children; Literacy rate.
Culture Number of cultural sites; Number of ethnic groups and languages Archeological sites Number of the archeological sites; Location of archeological sites;
Available infrastructure Management and business Tourism Number of species in a restricted area (e.g., Delta area MFNP)
Number of tourists in Protected Areas Habitat attributes Number of species in a restricted area (e.g., Delta area MFNP)
Fisheries Species richness and distribution in Lake Albert, George, Edward Water quality Agriculture Sources and levels of income for households Transport Traffic volumes and loads on selected priority roads. Forestry Forest cover, prices and number of loggers within and surrounding areas of the
Albertine Graben Construction materials Forest cover, prices and number of loggers within and surrounding areas of the
Albertine Graben
Today, environmental auditing has been done and the Environmental Monitoring Plan for the Albertine Graben 2012-2017 is being implemented.
USAID/UGANDA: ENVIRONMENTAL MANAGEMENT FOR THE OIL SECTOR – TRAINING COMPENDIUM: MODULE 4 355

REFERENCES
Environmental Protection Departmnet. (2015). Environmental Audit-A simple guide. The Government of the Hong Kong Speciald Administrative Region. Retrieved from http://www.epd.gov.hk/epd/english/how_help/tools_ea/audit_13.html
International Standard Organization. (1996). Guidelines for environmental auditing - General principles. International Organization for Standardization. Switzerland.
National Environmental Management Authority (NEMA). (2009). Environmental sensitivity atlas for the Albertine Graben. Retrieved from http://www.nemaug.org/atlas/Sensitivity_Atlas_2009_May.pdf
NEMA. (2012a). The Albertine Graben monitoring plan 2012–2017. Kampala, Uganda. Government of Uganda.
Rai, V.K., Raman, N.S., Choudhary, S.K., and Rai, S. (2015). Environmental Audit in Indian Coal Industry. IJSRSET: 1(1).
Uganda Wildlife Authority. (2012). Draft operational guidelines for the oil and gas exploration and production in wildlife protected areas. Government of Uganda.
USAID/UGANDA: ENVIRONMENTAL MANAGEMENT FOR THE OIL SECTOR – TRAINING COMPENDIUM: MODULE 4 356

U.S. Agency for International Development 1300 Pennsylvania Avenue, NW
Washington, DC 20523 Tel: (202) 712-0000 Fax: (202) 216-3524
www.usaid.gov