modeling intonation in non-western musical cultures - PSU
93
THE PENNSYLVANIA STATE UNIVERSITY SCHREYER HONORS COLLEGE DEPARTMENT OF ENGINEERING SCIENCE AND MECHANICS AND SCHOOL OF MUSIC MODELING INTONATION IN NON-WESTERN MUSICAL CULTURES SAMUEL LAPP SPRING 2017 A thesis submitted in partial fulfillment of the requirements for a baccalaureate degree in Engineering Science with interdisciplinary honors in Engineering Science and Music Reviewed and approved* by the following: Matthew B. Parkinson Associate Professor of Engineering Design and Mechanical Engineering Thesis Supervisor Mark Ballora Associate Professor of Music Technology Honors Adviser Gary Gray Associate Professor of Engineering Science and Mechanics Honors Adviser Judith A. Todd Department Head P. B. Breneman Chair and Professor of Engineering Science and Mechanics *Signatures are on file in the Schreyer Honors College and Engineering Science and Mechanics Office.
-
Upload
khangminh22 -
Category
Documents
-
view
0 -
download
0
Transcript of modeling intonation in non-western musical cultures - PSU

THE PENNSYLVANIA STATE UNIVERSITYSCHREYER HONORS COLLEGE
DEPARTMENT OF ENGINEERING SCIENCE AND MECHANICSAND SCHOOL OF MUSIC
MODELING INTONATION IN NON-WESTERN MUSICAL CULTURES
SAMUEL LAPPSPRING 2017
A thesissubmitted in partial fulfillment
of the requirementsfor a baccalaureate degreein Engineering Science
with interdisciplinary honors in Engineering Science and Music
Reviewed and approved* by the following:
Matthew B. ParkinsonAssociate Professor of Engineering Design and Mechanical Engineering
Thesis Supervisor
Mark BalloraAssociate Professor of Music Technology
Honors Adviser
Gary GrayAssociate Professor of Engineering Science and Mechanics
Honors Adviser
Judith A. ToddDepartment Head
P. B. Breneman Chair and Professor of Engineering Science and Mechanics
*Signatures are on file in the Schreyer Honors College and Engineering Science andMechanics Office.

i
Abstract
Musical cultures around the world use tuning systems very different from the tuningsystem used in Western music. Comparing and contrasting intonation from various culturescould give insight into the question of learned versus innate preferences in the perceptionof music, and into the cultural development of musical traditions. However, methods foranalyzing intonation in Western music have not been generalized to non-Western contexts.Flexible and non-discrete tuning used in cultures such as Arabic maqam music pose a chal-lenge for analyzing intonation. This paper attempts to generalize Stolzenburg’s “Periodicity”method and Gill and Purves’ “Similarity” method for microtonal music, and finds that theyare ill-suited for the analysis of Arabic music. An alternative approach is developed, whichanalyzes the relative intonation of a series of consecutive notes. This approach reveals thatArabic intonation is fundamentally different from Western and Chinese intonation. WhileChinese and Western intonation are based on intervals from a fixed scale, Arabic intonationis based on a continuous spectrum of small intervals.
ii
Table of Contents
List of Figures v
List of Tables vii
Acknowledgements viii
I Background 3
1 Intonation in Western, Arabic, and Chinese Cultures 41.1 Three Perspectives of Intonation . . . . . . . . . . . . . . . . . . . . . . . . 41.2 Western Music . . . . . . . . . . . . . . . . . . . . . . . . . . . . . . . . . . 5
1.2.1 scales . . . . . . . . . . . . . . . . . . . . . . . . . . . . . . . . . . . 51.2.2 chords and harmony . . . . . . . . . . . . . . . . . . . . . . . . . . . 6
1.3 Arabic Music . . . . . . . . . . . . . . . . . . . . . . . . . . . . . . . . . . . 71.3.1 instruments used in Arabic music . . . . . . . . . . . . . . . . . . . . 9
1.4 Chinese Music . . . . . . . . . . . . . . . . . . . . . . . . . . . . . . . . . . . 9
2 Harmony: Studies of Consonance and Dissonance 112.1 Computational Methods for Harmony Analysis . . . . . . . . . . . . . . . . 122.2 History of Consonance and Dissonance Analysis in Western Music . . . . . . 122.3 Perception of Intervals of Simple and Complex Tones . . . . . . . . . . . . . 13
2.3.1 simple and complex tones . . . . . . . . . . . . . . . . . . . . . . . . 132.3.2 dissonance of dyads . . . . . . . . . . . . . . . . . . . . . . . . . . . . 14
2.4 Factors Influencing Consonance and Dissonance . . . . . . . . . . . . . . . . 152.4.1 pleasantness versus consonance . . . . . . . . . . . . . . . . . . . . . 172.4.2 multiple dimensions of harmony . . . . . . . . . . . . . . . . . . . . . 17
3 Two Models for Predicting Common Scales 183.1 Periodicity Model for Dissonance . . . . . . . . . . . . . . . . . . . . . . . . 18
3.1.1 method, claims and results . . . . . . . . . . . . . . . . . . . . . . . . 203.1.2 generalizing to microtonal . . . . . . . . . . . . . . . . . . . . . . . . 233.1.3 analysis . . . . . . . . . . . . . . . . . . . . . . . . . . . . . . . . . . 23
3.2 Similarity Model for Dissonance . . . . . . . . . . . . . . . . . . . . . . . . . 233.2.1 methods, claims and results . . . . . . . . . . . . . . . . . . . . . . . 233.2.2 recreating the similarity algorithm . . . . . . . . . . . . . . . . . . . 263.2.3 analysis . . . . . . . . . . . . . . . . . . . . . . . . . . . . . . . . . . 27

iii
II Methods 28
4 Developing a Model to Analyze Intonation 294.1 An Algorithm for Analyzing Music . . . . . . . . . . . . . . . . . . . . . . . 29
4.1.1 finding the fundamental frequency . . . . . . . . . . . . . . . . . . . 294.1.2 subdivision of notes . . . . . . . . . . . . . . . . . . . . . . . . . . . 304.1.3 sample length and frequency resolution . . . . . . . . . . . . . . . . . 324.1.4 parameters and optimization . . . . . . . . . . . . . . . . . . . . . . 32
4.2 Testing the Model . . . . . . . . . . . . . . . . . . . . . . . . . . . . . . . . 324.2.1 monophonic and polyphonic music . . . . . . . . . . . . . . . . . . . 334.2.2 from pitches back to music . . . . . . . . . . . . . . . . . . . . . . . . 34
5 Applying the Tools to Periodicity and Similarity 375.1 Extracting Scales . . . . . . . . . . . . . . . . . . . . . . . . . . . . . . . . . 375.2 Characterizing Maqamat . . . . . . . . . . . . . . . . . . . . . . . . . . . . . 385.3 Periodicity and Similarity of Maqamat . . . . . . . . . . . . . . . . . . . . . 40
6 Non-Discretized Intonation 436.1 Pitch Distribution and Scatter . . . . . . . . . . . . . . . . . . . . . . . . . . 43
6.1.1 case study: the neutral third . . . . . . . . . . . . . . . . . . . . . . 436.1.2 case study: the leading tone in Western music . . . . . . . . . . . . . 446.1.3 issues with fixed pitch set . . . . . . . . . . . . . . . . . . . . . . . . 46
6.2 Shape Grammars: Words and Vocabularies . . . . . . . . . . . . . . . . . . . 466.2.1 finding words . . . . . . . . . . . . . . . . . . . . . . . . . . . . . . . 466.2.2 vocabulary . . . . . . . . . . . . . . . . . . . . . . . . . . . . . . . . 47
III Results, Analysis, and Conclusions 48
7 Accuracy of Vocabulary Extraction 497.1 Tempo and Polyphony . . . . . . . . . . . . . . . . . . . . . . . . . . . . . . 49
7.1.1 slow, monophonic music . . . . . . . . . . . . . . . . . . . . . . . . . 497.1.2 fast, polyphonic music . . . . . . . . . . . . . . . . . . . . . . . . . . 517.1.3 file formats . . . . . . . . . . . . . . . . . . . . . . . . . . . . . . . . 52
7.2 Symmetry of Three-Syllable Words . . . . . . . . . . . . . . . . . . . . . . . 54
8 Comparing Vocabularies 568.1 Vocabulary of Composers . . . . . . . . . . . . . . . . . . . . . . . . . . . . 568.2 Vocabulary of a Genre . . . . . . . . . . . . . . . . . . . . . . . . . . . . . . 56
9 Vocabularies Across Cultures 609.1 Intervals and Words . . . . . . . . . . . . . . . . . . . . . . . . . . . . . . . 609.2 Vocabulary of Three Genres . . . . . . . . . . . . . . . . . . . . . . . . . . . 609.3 Returning to Periodicity . . . . . . . . . . . . . . . . . . . . . . . . . . . . . 62

iv
10 Conclusions 6610.1 Words as Building Blocks . . . . . . . . . . . . . . . . . . . . . . . . . . . . 6610.2 Discrete Versus Continuous Measurement Systems . . . . . . . . . . . . . . . 67
10.2.1 aural versus written traditions . . . . . . . . . . . . . . . . . . . . . . 6710.2.2 uncertainty: a quantum physics analogy . . . . . . . . . . . . . . . . 68
10.3 The Origins of Scales . . . . . . . . . . . . . . . . . . . . . . . . . . . . . . . 6810.3.1 Music Is More Than Pitch . . . . . . . . . . . . . . . . . . . . . . . . 68
10.4 Further Research . . . . . . . . . . . . . . . . . . . . . . . . . . . . . . . . . 69
Appendix A Human Hearing: From Pressure Waves to Neural Signals 72
Appendix B Whole Number Ratio Algorithm 77
Appendix C Works Cited: Music Recordings 78
Appendix D Listening Tracks 79
Bibliography 80

v
List of Figures
1.1 C Major Scale . . . . . . . . . . . . . . . . . . . . . . . . . . . . . . . . . . . 61.2 Western Modes . . . . . . . . . . . . . . . . . . . . . . . . . . . . . . . . . . 71.3 Three Maqamat in Western Notation . . . . . . . . . . . . . . . . . . . . . . 81.4 Maqam Bayati . . . . . . . . . . . . . . . . . . . . . . . . . . . . . . . . . . 81.5 Chinese Pentatonic Scales . . . . . . . . . . . . . . . . . . . . . . . . . . . . 91.6 Chinese Twelve Tone Tuning . . . . . . . . . . . . . . . . . . . . . . . . . . . 10
2.1 Illustration of Beating . . . . . . . . . . . . . . . . . . . . . . . . . . . . . . 132.2 Frequency Response of a Violin . . . . . . . . . . . . . . . . . . . . . . . . . 142.3 Dissonance of Simple Dyads . . . . . . . . . . . . . . . . . . . . . . . . . . . 152.4 Dissonance of Complex Dyads . . . . . . . . . . . . . . . . . . . . . . . . . . 16
3.1 Illustration of the Periodicity Method . . . . . . . . . . . . . . . . . . . . . . 193.2 Illustration of the Similarity Method . . . . . . . . . . . . . . . . . . . . . . 25
4.1 Root-Finding Algorithm: False-Positive . . . . . . . . . . . . . . . . . . . . . 304.2 Transient Frequency Response . . . . . . . . . . . . . . . . . . . . . . . . . . 314.3 Monophony and Polyphony . . . . . . . . . . . . . . . . . . . . . . . . . . . 334.4 Transcribing a Slow, Monophonic Piece . . . . . . . . . . . . . . . . . . . . . 344.5 Transcribing a Fast, Polyphonic Piece . . . . . . . . . . . . . . . . . . . . . . 35
5.1 Histogram of Frequencies in Beethoven . . . . . . . . . . . . . . . . . . . . . 385.2 Notation of Maqam Nahawand . . . . . . . . . . . . . . . . . . . . . . . . . 395.3 Pitch Histogram of an Arabic Piece . . . . . . . . . . . . . . . . . . . . . . . 395.4 Comparision of Tunings for Maqam Rast . . . . . . . . . . . . . . . . . . . . 40
7.1 Common Words in Bach’s Music . . . . . . . . . . . . . . . . . . . . . . . . 507.2 Vocabulary Extraction in a Short Monophonic Selection . . . . . . . . . . . 517.3 Vocabulary Extraction in a Short Polyphonic Selection . . . . . . . . . . . . 527.4 Vocabulary in Two Recordings of Beethoven . . . . . . . . . . . . . . . . . . 537.5 Vocabulary Extraction and File Format . . . . . . . . . . . . . . . . . . . . . 54
8.1 Vocabulary in Bach’s Music . . . . . . . . . . . . . . . . . . . . . . . . . . . 578.2 Vocabulary in Bach and Beethoven . . . . . . . . . . . . . . . . . . . . . . . 578.3 Vocabulary in Brahms and Beethoven . . . . . . . . . . . . . . . . . . . . . . 588.4 Intervals in Western Music . . . . . . . . . . . . . . . . . . . . . . . . . . . . 59
9.1 Common Western and Arabic Words . . . . . . . . . . . . . . . . . . . . . . 619.2 Comparing Vocabularies of Three Genres . . . . . . . . . . . . . . . . . . . . 639.3 Similarity and Periodicity of Common Words . . . . . . . . . . . . . . . . . 65

vi
A.1 Hearing Streams of Audio . . . . . . . . . . . . . . . . . . . . . . . . . . . . 73A.2 Parts of the Ear . . . . . . . . . . . . . . . . . . . . . . . . . . . . . . . . . . 73A.3 Sound as Pressure Waves . . . . . . . . . . . . . . . . . . . . . . . . . . . . . 74A.4 Basilar Membrane . . . . . . . . . . . . . . . . . . . . . . . . . . . . . . . . 75
vii
List of Tables
1.1 Western Intervals . . . . . . . . . . . . . . . . . . . . . . . . . . . . . . . . . 5
2.1 Consonant and Dissonant Intervals . . . . . . . . . . . . . . . . . . . . . . . 12
3.1 Periodicity of Triads . . . . . . . . . . . . . . . . . . . . . . . . . . . . . . . 213.2 Ranking Heptatonic Scales with Periodicity . . . . . . . . . . . . . . . . . . 223.3 Ranking Heptatonic Scales with Microtonal Periodicity . . . . . . . . . . . . 243.4 Ranking Heptatonic Scales with Similarity . . . . . . . . . . . . . . . . . . . 26
5.1 Maqam Periodicity Rankings . . . . . . . . . . . . . . . . . . . . . . . . . . 415.2 Periodicity and Similarity of Maqamat . . . . . . . . . . . . . . . . . . . . . 42
6.1 Failure of Periodicity Method with Small Tolerance . . . . . . . . . . . . . . 446.2 Most Common Frequencies in Bach’s Music . . . . . . . . . . . . . . . . . . 45
9.1 Ranking Words with Periodicity and Similarity . . . . . . . . . . . . . . . . 64
viii
Acknowledgements
There are many people to thank for their generous support throughout this research.First, my thesis Supervisor Matt Parkinson for endless guidance and support, and believingin my crazy ideas. Thank you to my honors advisers, Gary Gray and Mark Ballora; scholarsin the field who gave their input and thoughts, including Frieder Stolzenburg, David Huron,and Keith Mashinter; the Penn State professors and faculty who supported me, includingAmanda Maple, Curtis Craig, and Paul Barsom; members of the Arabic music community,including Simon Shaheen, Neil van der Linden, Sami abu Shumays and Laila Mokhiber;friends who gave new perspectives and insight, including Joe Cosgrove, Matt Pennock andSmall-Hand Luke; Zena for revising my writing; and everyone else who helped guide, advise,and revise my work.

1
Introduction
Throughout history, music and mathematics have been fundamentally linked. In thesixth century BC, Pythagoras was fascinated by whole number ratios, which described manyphysical phenomena. Pythagoras also found that simple ratios of frequencies sound pleasanttogether, and built a musical scale from simple ratios of 2:3 [1]. A fascination with mathe-matical relationships for musical tuning developed in many parts of the world. In AncientChina, standardized sets of brass bells were used to normalize tuning. The bells were madewith such precision that they were also used for standard measurements of volume and weight[2].
Throughout modern history, the relationship between mathematics and music continuedto fascinate scientists and musicians alike. Advances in the understanding of acousticalphenomena, the human auditory system, and psychoacoustic processes gave new insights intothe connections between math and music. As a result, the histories of mathematics and musicare closely linked and interdependent. For example, the adoption of equal temperament (atuning system discussed in Chapter 1) was intertwined with the development of the logarithm[3].
In the last hundred and fifty years, scientists have delved deeper into the questions of whyhumans perceive certain combinations of frequencies in distinct ways. Pythagoras’s ideal ofsimple ratio relationships between notes is insufficient for explaining the complex sets oftones used to create harmony and melody in Western music. Many studies have attemptedto explain the mathematical relationships between the notes in Western musical traditions[4, 5, 6, 7, 8]. In some cases, these studies have produced successful models for describing thenotes that are frequently used together. On the other hand, this research will demonstratethat these models generally fail to apply to non-Western musical cultures such as Arabicmaqam music (introduced in Section 1.3).
Comparison of intonation across cultures provides a way to test the universality of theorieson music perception. These theories have primarily been tested for Western music, and mayor may not apply beyond Western music. In order to evaluate the importance of learnedcultural norms versus innate preference for music perception, it is necessary to compareintonation systems across cultures.
Also, studying the differences between intonation systems can provide insight into theways musical cultures develop, and are passed down. For example, Arabic music is tradition-ally taught aurally, in contrast to the Western practice of learning through notated music[9]. The vastly different styles of passing down music may lead to differences in the twocultures’ intonation.
Finally, studying the intonation of other cultures gives insight into the potential implica-tions of mapping a Western system of measurement onto artifacts of other cultures. In thecase of Arabic music, Western notation and note names fail to capture the details of Arabicintonation.

2
This research begins with an investigation of contemporary computational models forpredicting sets of tones that will be used together to make music. Two recent models,Stolzenburg’s Periodicity model [4] and Gill and Purves’ Similarity model [8], claim thattheir methods apply beyond Western music to cultures with other tuning systems. Thesemethods are recreated and tested for Arabic music. Neither method adequately capturesdetails in intonation that are essential to Arabic music performance.
To more accurately capture the features of intonation in Arabic music, this researchdevelops a new method of analysis which retains continuous and contextual relationshipsbetween pitches. This method, described in Part Two, does not require intonation to adhereto a discrete set of pitch ratios. The method analyzes the frequency relationships of a seriesof consecutive notes. Instead of sorting frequencies into discrete note-bins, the method findsthe decimal ratios between a series of frequencies extracted from the music. This ensuresthat resolution is high and context is not ignored. A sequence of two or more frequencyratios creates a musical “word”. The method compiles the prevalence of all words used in amusical selection.
As a result, completely different patterns emerge for intonation in Western and Arabicmusic. Without this new approach for analyzing intonation, Arabic music performanceswould be forced into a measurement system that makes their intonation appear similar toWestern music. By avoiding discretization of pitch relationships (such as major second, orminor third), the huge differences between intonation in Arabic and Western music becomeapparent. This form of analysis also reveals that even Western music is not tuned in a per-fectly discretized way. Variation from “perfect” intonation adds to the emotional characterof the music, and is an important tool for Western performers [10].
This research bring into question the validity of mapping foreign cultures’ artifacts onto afamiliar measurement system. While discrete measurement systems with limited resolutionmay be sufficient for one scenario, a higher resolution or continuous system of measurementmay be necessary in other situations.
Part I of this document provides a background in music theory and the models for into-nation that will be discussed, tested and reworked throughout the paper. Chapter 1 providesa brief introduction to musical theory and intonation for Western, Arabic, and Chinese cul-tures. Chapter 2 discusses the development of models for consonance and dissonance inWestern music. Two preexisting methods for modeling intonation of scales are discussed inChapter 3. Part II describes the development of a new model for intonation which is bettersuited for analysis of non-Western musical cultures. This includes an analysis of the twoexisting methods and a discussion of the issues arising from their approach to intonation.Finally, Part III details the results of the new method developed in this paper, and analyzesthe implications for music analysis and modeling in general.
A set of audio clips is provided to accompany this paper. The Listening Tracks arereferenced throughout text and listed in Appendix D.

3
Part I
Background

4
Chapter 1
Intonation in Western, Arabic, andChinese Cultures
Sound is the brain’s interpretation of periodic fluctuations of pressure in the world. Hu-mans can hear acoustic vibrations with frequencies from around 20 to 20,000 Hertz (Hz,or cycles per second). The frequency of oscillations is perceived as pitch on a logarithmicscale. (Appendix A gives a more complete introduction to auditory perception.) The lowestfrequency produced by a specific event is usually the strongest, and is called the “fundamen-tal frequency. Musical notes are named by their fundamental frequency.” For instance, thenote ‘A4’ on a piano has a fundamental frequency of 440 Hz. Notes with different pitches(frequencies) are used simultaneously (harmony) and in sequence (melody) to create music.
“Intonation” refers to the relationships of the fundamental frequencies (referred to simplyas “frequencies”) of notes used in music. In general, the relationship between two notes isdescribed by the ratio of their frequencies, which is called an “interval.” Because humansperceive pitch on a logarithmic scale, the ratio (rather than the difference) of two frequenciesdescribes the distance between pitches [11]. For example, the ratio 2:1 is the interval of oneoctave. The note ‘A’ with frequency 440 Hz and ‘A’ with frequency 220 Hz are an intervalof one octave apart, because the ratio of the frequencies is 2:1. The notes ‘A’ at 880 Hzand ‘A’ at 440 Hz are also one octave apart with frequency ratio 2:1. Another example of acommon interval is a fifth, which has a ratio of 3:2. The ratio from ‘C’ up to ‘G’ is a fifth(Listening Track 01). Table 1.1 shows the intervals used in Western music with their namesand sizes.
1.1 Three Perspectives of IntonationThere are three perspectives for analyzing intonation in music. (1) Vertical analysis fo-
cuses on harmonies created by multiple notes sounding at the same time. (2) Horizontalanalysis examines melodies, the lines created by the pitch changing in time. (3) Modal anal-ysis describes the scale or mode, the set of frequencies that form the bases of an intonationsystem. All three forms of analysis are discussed in this paper. In general, the music ofmany non-Western musical cultures is primarily melodic (horizontal), while Western musicrelies heavily on harmony (vertical) as well as melody. Western studies often focus on ver-tical analysis [e.g. 12, 13, 5]. However, the lack of harmony in Arabic and Chinese cultures

5
Table 1.1: The intervals used in Western music are shown with their frequency ratios intwelve-tone equal temperament (12TET). The last column shows the approximate wholenumber ratio of frequencies with a maximum error of 1% from the exact decimal value.
Semitone Name Symbol Example 12TET Ratio Fraction0 Perfect Unison P1 C — C 1.000 1/11 Minor Second m2 C — Db 1.059 16/152 Major Second M2 C — D 1.122 9/83 Minor Third m3 C — Eb 1.189 6/54 Major Third M3 C — E 1.260 5/45 Perfect Fourth P4 C — F 1.335 4/36 Tritone T C — F# 1.414 17/127 Perfect Fifth P5 C — G 1.498 3/28 Minor Sixth m6 C — Ab 1.587 8/59 Major Sixth M6 C — A 1.682 5/310 Minor Seventh m7 C — Bb 1.782 16/911 Major Seventh M7 C — B 1.888 15/812 Perfect Octave P8 C — C 2.000 2/1
(discussed below) prohibit analysis of these cultures in the vertical dimension. In order toapply generally to cultures that may not use harmony, the method of analysis developed inthis paper uses the horizontal perspective.
1.2 Western MusicThis section briefly describes the construction of scales and chords in Western music the-
ory. In this paper, Western music refers broadly to the classical musical traditions in Westernculture from the Renaissance (thirteenth century) to the present. While this period containsmany distinct musical periods and styles, some broad generalizations can characterize most(though not all) of this music.
1.2.1 scalesWestern music theory is based on two diatonic scales, called “major” and “minor.” Both
are seven note scales spanning one octave. The notes of all scales are taken from the twelve-note chromatic scale (all twelve notes in an octave on a piano). The seven note scale is builtfrom two tetrachords of four notes each (Figure 1.1). The first note of the scale is the calledthe “tonic” and the first note of the second tetrachord is called the “dominant.”
A set of seven consecutive white keys on a piano can form seven distinct scales, calledmodes, depending on the starting note. Figure 1.2 shows all seven modes in the order ofsharps and flats. Of these, the major and minor scale are the most commonly used. Figure1.1 shows the major scale on the piano (Listening Track 02). The white keys from ‘C’ to ‘C’an octave higher on a piano form a major scale. In the key of C major, ‘C’ is the tonic and‘G’ is the dominant. The white notes from ‘A’ to ‘A’ form a minor scale. In A minor, A is

6
C Major Scale
whole step half step
C Major Scale on a Piano
C Tetrachord G Tetrachord
Figure 1.1: The C major scale uses the white notes on a piano, colored blue here. It isbuilt from two tetrachords, {C D E F} and {G A B C}.
the tonic and E is the dominant. The major scale generally has a happy, euphonious, andbright sound, while the minor scale has a sad, dark and angry sound.
The most pleasant-sounding intervals have frequencies that are simple integer ratios,like 3:2 and 2:1 [14]. However, tuning strictly to perfect intervals (which is called “justintonation”) means an instrument will sound in tune in one key, but out out of tune in otherkeys. A hallmark of Western music is frequent modulation, or changes of key [15]. In orderto be able to play keyboard instruments in all twelve keys, the twelve notes of the octaveare tuned at equal intervals (called “equal temperament”). In equal temperament, none ofthe ratios between notes form perfect intervals like 3/2, but all keys are close enough to justintonation to sound in tune. Twelve tone equal temperament (12TET) has been commonpractice in Western music since the Baroque period [16]. Twelve tone equal temperamentmeans that the pitches are tuned at equal distances one twelfth the size of an octave, on alogarithmic scale. Thus, the ratio of each note to its neighbor is always 21/12. This meansthat the distance from C to D (skips over C ), called a whole step, is twice the distance fromE to F, called a half step (See Figure 1.1). Table 1.1 shows the intervals used in Westernmusic, with their frequency ratios in twelve-tone equal temperament.
1.2.2 chords and harmonyHarmony refers to the sonority created by multiple notes sounded together. Any set of
notes can be considered a harmony. The lowest note is called the root, or tonic. Chordsare sets of notes separated by specific intervals that form a specific harmony when playedtogether. For example, the major chord is formed by starting with the lowest frequencycalled the root, adding a tone an interval of a major third above the root, then adding atone an interval of a fifth above the root.
Western music from the Baroque period (17th century) through at least the Romanticperiod (19th century) is based on triadic harmony. Triads are chords with three notesseparated by intervals of a third. The major triad (spelled, for instance, C E G) is the

7
Western Musical Modes, in C
Locrian Phrygian Aeolian (Minor)
Dorian Mixolydian Ionian (Major)
Lydian
Figure 1.2: Western music uses seven diatonic modes, shown here in C, in order of increasingsharps.
most consonant, pleasant and euphonious. The minor triad (C E G) is the second mostconsonant triad [15, p.64]. The concepts of consonance and dissonance are discussed inChapter 2. Harmony is the foundational basis of Western music theory, and the major andminor chords account for a remarkably high portion of the harmony used in Western music.
1.3 Arabic MusicArabic music is based on the melody form called the maqam (plural: maqamat, pro-
nounced: mah-KAHM) and the the rhythmic meter called iqa. Listening Tracks 11-14provide selections of Arabic music recordings.
A maqam, like a scale, describes the pitches used in a piece of music. However, the maqamcontains much more information than just a scale. Maqamworld.com defines a maqam as “aset of notes with traditions that define relationships between them, habitual patterns, andtheir melodic development.” [17] There are dozens of maqamat, each with its own character,rules for melodic development, and tonic and dominant notes. The three most commonmaqamat are Rast, Sikah and Bayati. (Listening Tracks 06, 07 and 08 provide recordingsof these three maqamat.) Their approximate pitch values in Western notation are shown inFigure 1.3.
Unlike Western music, Arabic music rarely uses harmony [18]. Shifts in character occurthrough the melodic development of the maqam, and modulation between maqamat [18].The lack of harmony makes Arabic music fundamentally different from Western music, andmeans that the vertical perspective of intonation is rarely useful in Arabic music.
Like Western scales, maqamat usually contain seven notes spanning an octave, builtfrom two tetrachords called “ajnas” (singular: jins). However, ajnas sometimes have threeor five notes, instead of four. Figure 1.4 shows how maqam Bayati is built from jins Bayati

8
indicates ‘half-�at’
Common Maqamat in Western notation
Rast
Bayati
Sikah
Figure 1.3: The three most common maqamat are Rast, Sikah and Bayati. Their approxi-mate pitches in Western notation are shown here. A “half flat” lies between the natural andflat notes.
Maqam Bayati
Jins Bayati on D
Jins Nahawand on G
Figure 1.4: Like Western scales, Arabic maqamat are built from two smaller sets of (usuallyfour) tones called jins. Maqam Bayati is built from two tetrachords, called jins Bayati andjins Nahawand.
tetrachord and jins Nahawand tetrachord.The tuning of Arabic maqamat is not based on an equal temperament system. Each
maqam has a unique interval structure, with intervals approximately the size of Westernhalf steps, whole steps, and minor thirds. However, intervals in between the notes in thechromatic scale can be used. In order to approximate these tones with Western notation andnames, these notes are often called “quarter tones” and are named with “half-flats” denotedwith the symbol and “half-sharps” denoted with . For example, the second note of Bayatiis “E half flat” (Figure 1.4). However, the quarter tone is not simply half way between itsneighboring tones. The tuning of quarter tones and of maqamat in general is not equaltempered, and is learned by ear [17]. For instance, the E half flat occurring in Rast is tunedhigher than the E half flat in Bayati (Rast and Bayati are shown in Figure 1.3) [9]. Thetuning and variance of maqamat are discussed in detail in Chapter 6.

9
Chinese Pentatonic Scales
Gong Shang Jiao Zhi Yu
Figure 1.5: The five inversions of the pentatonic scale are shown on a Western staff, withtheir Chinese names.
1.3.1 instruments used in Arabic musicThe most traditional Middle Eastern music ensemble is called the takht. The takht
includes four melodic instruments and one percussive instrument. The melodic instrumentsare oud (a stringed instrument resembling a lute), nay (end-blown flute), qanun (pluckedstring instrument resembling a zither) and violin. Melodic instruments are classified assahb (pulling, like violin and nay) or naqr (plucked, like oud and qanun). The percussioninstrument can be riq (tambourine) or tabla (hand drum) [17].
1.4 Chinese MusicThis paper primarily analyses Western and Arabic music, but also investigates the in-
tonation of Chinese music in order to explore another non-Western system of intonation.Chinese music is based primarily on pentatonic (five note) scales similar to the Western ma-jor pentatonic scale (C D E G A). As with the western modes, variations of the pentatonicscale can be created by permuting it, or starting on a different note. Figure 1.5 shows thefive permutations of the pentatonic scale used in Chinese music. Over time, Chinese musiceventually also developed seven notes scales with “passing tones” filling in the gaps of thepentatonic scale (eg, C D E F G A B) [19, p.165-167]. On rare occasions, a scale couldeven contain nine notes with an additional passing tone between two notes a half step apart(C D E E2 F G A B ) [19, p.165]. In general, however, the pentatonic scale is the basis ofChinese intonation.
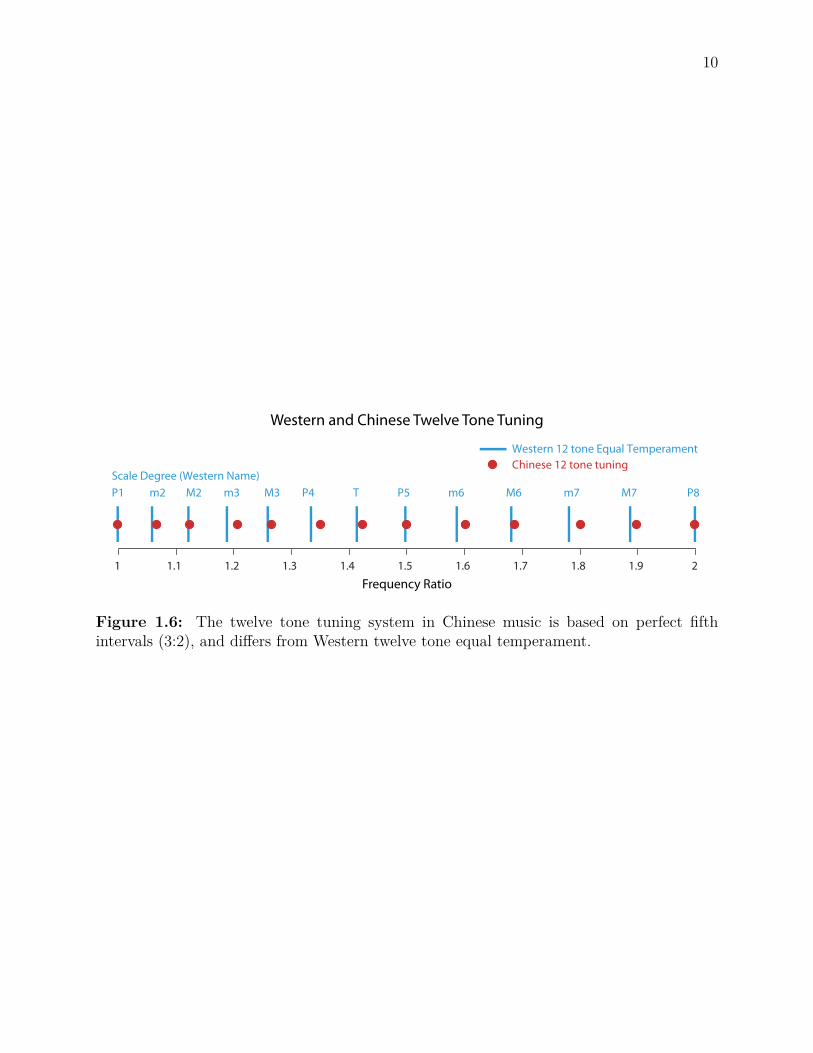
As in Western music, Chinese music uses twelve distinct, approximately equally spacedtones in the octave. However, Chinese music does not use equal temperament. Instead, thescale is built on perfect fifth intervals [19, p.175]. For example, the fifth is 3/2, the majorsecond is (3/2)2/2 = 9/8, the major sixth is (3/2)3/2 = 27/16 and so on. Because the scaleis not equal-tempered, transposition (starting the same scale on a different note) changesthe sound of the scale. Figure 1.6 compares the twelve tone tuning systems of Western equaltemperament and Chinese temperament.
10
1 1.1 1.2 1.3 1.4 1.5 1.6 1.7 1.8 1.9 2
Frequency Ratio
Chinese 12 tone tuningWestern 12 tone Equal Temperament
Western and Chinese Twelve Tone Tuning
P1 m2 M2 m3 m6 M6 m7 M7 P8M3 P4 T P5Scale Degree (Western Name)
Figure 1.6: The twelve tone tuning system in Chinese music is based on perfect fifthintervals (3:2), and differs from Western twelve tone equal temperament.
11
Chapter 2
Harmony: Studies of Consonance andDissonance
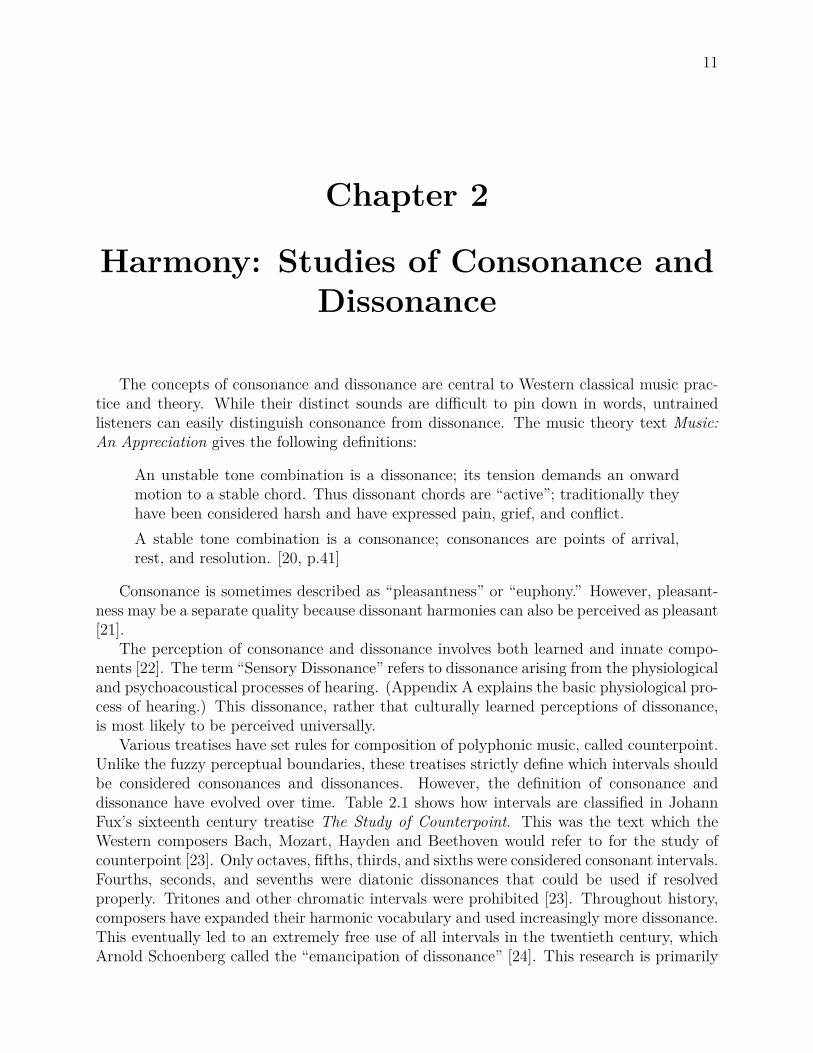
The concepts of consonance and dissonance are central to Western classical music prac-tice and theory. While their distinct sounds are difficult to pin down in words, untrainedlisteners can easily distinguish consonance from dissonance. The music theory text Music:An Appreciation gives the following definitions:
An unstable tone combination is a dissonance; its tension demands an onwardmotion to a stable chord. Thus dissonant chords are “active”; traditionally theyhave been considered harsh and have expressed pain, grief, and conflict.A stable tone combination is a consonance; consonances are points of arrival,rest, and resolution. [20, p.41]
Consonance is sometimes described as “pleasantness” or “euphony.” However, pleasant-ness may be a separate quality because dissonant harmonies can also be perceived as pleasant[21].
The perception of consonance and dissonance involves both learned and innate compo-nents [22]. The term “Sensory Dissonance” refers to dissonance arising from the physiologicaland psychoacoustical processes of hearing. (Appendix A explains the basic physiological pro-cess of hearing.) This dissonance, rather that culturally learned perceptions of dissonance,is most likely to be perceived universally.
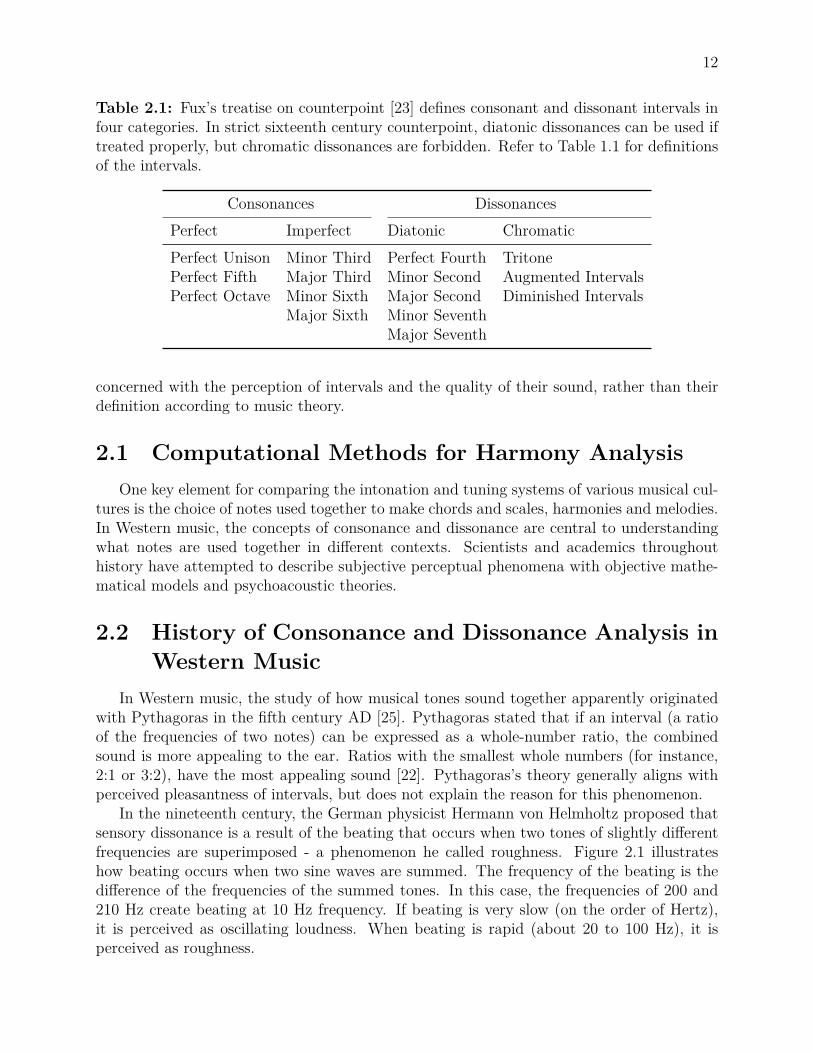
Various treatises have set rules for composition of polyphonic music, called counterpoint.Unlike the fuzzy perceptual boundaries, these treatises strictly define which intervals shouldbe considered consonances and dissonances. However, the definition of consonance anddissonance have evolved over time. Table 2.1 shows how intervals are classified in JohannFux’s sixteenth century treatise The Study of Counterpoint. This was the text which theWestern composers Bach, Mozart, Hayden and Beethoven would refer to for the study ofcounterpoint [23]. Only octaves, fifths, thirds, and sixths were considered consonant intervals.Fourths, seconds, and sevenths were diatonic dissonances that could be used if resolvedproperly. Tritones and other chromatic intervals were prohibited [23]. Throughout history,composers have expanded their harmonic vocabulary and used increasingly more dissonance.This eventually led to an extremely free use of all intervals in the twentieth century, whichArnold Schoenberg called the “emancipation of dissonance” [24]. This research is primarily
12
Table 2.1: Fux’s treatise on counterpoint [23] defines consonant and dissonant intervals infour categories. In strict sixteenth century counterpoint, diatonic dissonances can be used iftreated properly, but chromatic dissonances are forbidden. Refer to Table 1.1 for definitionsof the intervals.
Consonances DissonancesPerfect Imperfect Diatonic ChromaticPerfect Unison Minor Third Perfect Fourth TritonePerfect Fifth Major Third Minor Second Augmented IntervalsPerfect Octave Minor Sixth Major Second Diminished Intervals
Major Sixth Minor SeventhMajor Seventh
concerned with the perception of intervals and the quality of their sound, rather than theirdefinition according to music theory.
2.1 Computational Methods for Harmony AnalysisOne key element for comparing the intonation and tuning systems of various musical cul-
tures is the choice of notes used together to make chords and scales, harmonies and melodies.In Western music, the concepts of consonance and dissonance are central to understandingwhat notes are used together in different contexts. Scientists and academics throughouthistory have attempted to describe subjective perceptual phenomena with objective mathe-matical models and psychoacoustic theories.
2.2 History of Consonance and Dissonance Analysis inWestern Music
In Western music, the study of how musical tones sound together apparently originatedwith Pythagoras in the fifth century AD [25]. Pythagoras stated that if an interval (a ratioof the frequencies of two notes) can be expressed as a whole-number ratio, the combinedsound is more appealing to the ear. Ratios with the smallest whole numbers (for instance,2:1 or 3:2), have the most appealing sound [22]. Pythagoras’s theory generally aligns withperceived pleasantness of intervals, but does not explain the reason for this phenomenon.
In the nineteenth century, the German physicist Hermann von Helmholtz proposed thatsensory dissonance is a result of the beating that occurs when two tones of slightly differentfrequencies are superimposed - a phenomenon he called roughness. Figure 2.1 illustrateshow beating occurs when two sine waves are summed. The frequency of the beating is thedifference of the frequencies of the summed tones. In this case, the frequencies of 200 and210 Hz create beating at 10 Hz frequency. If beating is very slow (on the order of Hertz),it is perceived as oscillating loudness. When beating is rapid (about 20 to 100 Hz), it isperceived as roughness.

13
fBeating = Δf
f1 = 200 Hz
f2 = 210 Hz
TBeating = 1/fBeating = 0.1 s
Illustration of Beating
210-200 = 10 Hz
Figure 2.1: When two sinusoids with slightly different frequencies are superimposed, beat-ing occurs at a frequency the difference between the two original frequencies.
Roughness arises from not only the fundamental frequencies, but also the upper partialsof complex tones [12]. Helmholtz connected the idea of roughness with the physiologicalmechanism of hearing in the cochlea. Two pitches that stimulate the cochlea within a smallregion, called the critical band, cause an overlapping stimulation that leads to perceiveddissonance [26].
Many more recent models are based on the fundamental idea of Helmholtz’s roughness[26, 7, 6]. Later in the nineteenth century, Carl Stumpf claimed that tonal fusion (thetendency for two notes to sound like one) leads to perceived consonance [14]. However, laterresearch showed that tonal fusion is a separate phenomenon from sensory dissonance [14, 27].Instead, more recent research by Plomp and Levelt [26], Hutchinson and Knopoff [6] andothers builds off of Helmholtz’s idea that stimulation of the cochlea at frequencies separatedby less than the critical bandwidth creates sensory dissonance.
2.3 Perception of Intervals of Simple and Complex Tones2.3.1 simple and complex tones
A single sinusoidal pressure wave creates a “simple tone” with a pitch determined bythe frequency of the wave (Listening Track 04). In the real world sounds are nearly always“complex tones.” Complex tones are comprised of a fundamental frequency (the lowest andusually strongest frequency), and other frequencies at integer multiples of the fundamentalfrequency (Listening Track 05). These upper frequencies are called harmonics. The setof frequencies including the fundamental frequency and all integer multiples (harmonics) iscalled the harmonic series. The terms “partials” or “overtones” refer to frequencies present inthe tone that may or may not be integer multiples of the fundamental frequency [28]. Figure

14
Frequency Response of Violin
0 1000 2000 3000 4000
Frequency (Hz)
Fast Fourier Transform
Figure 2.2: Peaks in the frequency response occur at integer multiples of the fundamentalfrequency. The relative strengths of these frequencies, called harmonics, help to define thesound of the violin.
2.2 shows the frequency-domain plot of a solo violin playing a ‘D’ at 291 Hz. The lowestfrequency peak is the fundamental frequency. The other peaks are harmonics, and occur atinteger multiples of the fundamental frequency. The relative strengths of the harmonics helpto define the violin’s tone quality, called “timbre.”
2.3.2 dissonance of dyadsThe study of dissonance and consonance starts with the most basic harmony possible,
two notes played together. A harmony of two notes is called a dyad, and the distancebetween them is an interval. In the twentieth century, various studies explored empiricalrankings of the consonance and dissonance of dyads. The distinction between simple andcomplex tones is critical for these experiments. An investigation by Plomp and Levelt [26]showed that perceived dissonance of dyads of simple tones follows a smooth curve, showingthat people do not prefer simple ratios of pure tones. For complex tones, simple ratios arepreferred because they minimize the beating (called roughness by Helmholtz) of interactingharmonics. Building off of this, Hutchinson and Knopoff [6] empirically derived a curve forcritical bandwidth. The critical bandwidth describes the frequency band in the cochlea whereroughness will occur between two tones. According to the study, the maximum dissonanceoccurs when two tones are separated by a distance 25% of the size of the critical bandwidth.
Building off this empirical research, Kameoka and Kuriyagawa [7, 29] showed that theperceived dissonance of two pure sine tones follows a v-shaped curve as the distance betweenthe tones increases logarithmically (see Figure 2.3). This means that the perceived dissonanceof an interval of two sine tones begins at zero when they are the same frequency, increases toa maximum dissonance, then decreases back to zero at the interval of an octave. When theexperimental rankings for dissonance are plotted with the frequency ratio on a logarithmic

15
80
100
120
140
160
0.01 0.1 1
Absolute Dissonance
Frequency Ratio (f2-f1)/f1
60
7040 1760 440 110f1 (Hz):
Dissonance of Dyads for Simple Tones
Figure 2.3: The dissonance of simple-tone dyads follows a v-shaped curve on a logarithmicratio scale. Dissonance increases in the downward direction. The highest dissonance occursaround a frequency ratio of 0.1. Adapted from Mashinter [22], Figure 1. Original figure fromKameoka and Kuriyagawa [7], Figure 4.
horizontal axis and increasing dissonance in the downward direction, the V-curves in Figure2.3 emerge.
For a dyad of two complex tones (with several harmonics as well as the root), sharp dipsperceived dissonance arise at the simple ratios used in just intonation, such as 3:2 and 4:3.The paper demonstrates a model that closely agrees with the empirical ranking of dissonancefor complex dyads (Figure 2.4). The premise of the model is that the interaction of all pairsof frequencies present in the two complex tones adds to the total dissonance. The dissonanceof each frequency pair is determined primarily by the v-shaped curve of dyad dissonances,but also accounts for the effects of pitch register and sound pressure level.
2.4 Factors Influencing Consonance and DissonanceHarmony perception involves learned and innate components. In reality, this complex
perceived quality of harmony cannot be fully characterized by a model based only on fre-quency ratios, because there are many factors that influence the perception of dissonance.Even for sensory dissonance, perceived dissonance depends not only on frequency ratio but

16
AbsoluteDissonance
0 1 2 3 4 5 6 7 8 9 10 11 12
Interval width (semitones)
260
240
220
200
180
160Model Prediction
Experimental Value
Kameoka and Kuriyagawa’s model for diad dissonance
1:1
2:3
1:2
4:3
Figure 2.4: When the tones contain six harmonics in addition to the fundamental frequency,intervals at simple integer ratios are ranked as less dissonant. The peaks from the modelof Kameoka and Kuriyagawa [29] (solid line) agree well with empirical rankings (plottedpoints). Adapted from [29], Figure 7.

17
on the pitch register (high or low) and sound pressure level (perceived as volume) of theharmony [7]. While these variables could be accounted for in a model (as in [29]), otherfactors in a holistic picture of dissonance are much more complex. Sensory dissonance doesnot account for culturally learned preferences, which play an important part in perception.As Plomp states, “our consonance perception is indeed profoundly influenced by the de-velopment of Western music and musical training.” [26] Also, the perception of harmonydepends on context. In two different chord sequences or musical settings, the perception ofa harmony can change completely [13].
2.4.1 pleasantness versus consonancePleasantness is often used interchangeably for consonance in describing an appealing
aspect of harmony. A study by Plomp and Levelt [26] showed that Western listeners rankthe pleasantness and consonance of harmonies similarly. Studies have also shown that allpeople perceive the fast beating of close tones called “roughness” by Helmholtz [13]. However,the pleasantness of consonant harmonies may not be universal across all listeners [30, 31].
2.4.2 multiple dimensions of harmonyThe perception of reality is very complex, yet models attempt to project the entire
perception of harmony onto a single dimension of consonance to dissonance. In reality, thereare many features of harmony which are distinct and contribute to the holistic perceptionof its sound. For instance, the quality of roughness can be distinguished from, or be seenas one attribute of the general phenomenon of dissonance [32]. Similarly, Stumpf’s tonalfusion—the degree to which different tones sound like one tone—can be perceived separatelyfrom consonance and dissonance [14, 27]. In general, there are many different qualities ofharmony beyond their consonance or dissonance, and attempting to characterize harmonywith a single dimension can only capture a piece of true human perception. This view ofharmony perception may explain the non-additive phenomenon of dissonance. Some chords,for example, a C major seventh chord (spelled C, E, G, B), are perceived as more consonantthan intervals they contain (C, B) [25]. None of the models above allow for decreaseddissonance when tones are added to a chord. A multidimensional perspective of dissonancecould allow the interaction of multiple dimensions of harmony, creating a more flexible andholistic picture of perception. However, the concept is beyond the scope of this paper.

18
Chapter 3
Two Models for Predicting CommonScales
Though a single dimensional view of consonance and dissonance struggles to describe har-monic preference in Western Music, modeling innate preferences for sets of frequencies is stillpossible. Recent studies by Stolzenburg [33] and Gill and Purves [8] provide computationalmethods for predicting the harmonies and modes commonly used in Western music. (Othermodels exist [e.g. 34], but are beyond the scope of this paper.) These approaches predict themost prominent harmonic and modal construct s of Western music (the major and minortriads and diatonic scales) without involving music theory or concepts of harmony.
The fact that harmony is not present Arabic music [17] suggests that a universal orwidely applicable model of intonation should focus on melodic or scalar (“horizontal”) con-structs rather than harmonic (“vertical”) analysis. The following methods predict not onlycommonly used, “consonant” harmonies, but also commonly used scales in Western music.
3.1 Periodicity Model for DissonanceStolzenburg’s model for ranking the “harmoniousness” of an arbitrary number of simple
tones is remarkably straight forward. The input is a set of frequencies representing simplesine tones. The output is a scalar “periodicity” value which ranks the relative harmoniousnessof the set of tones.
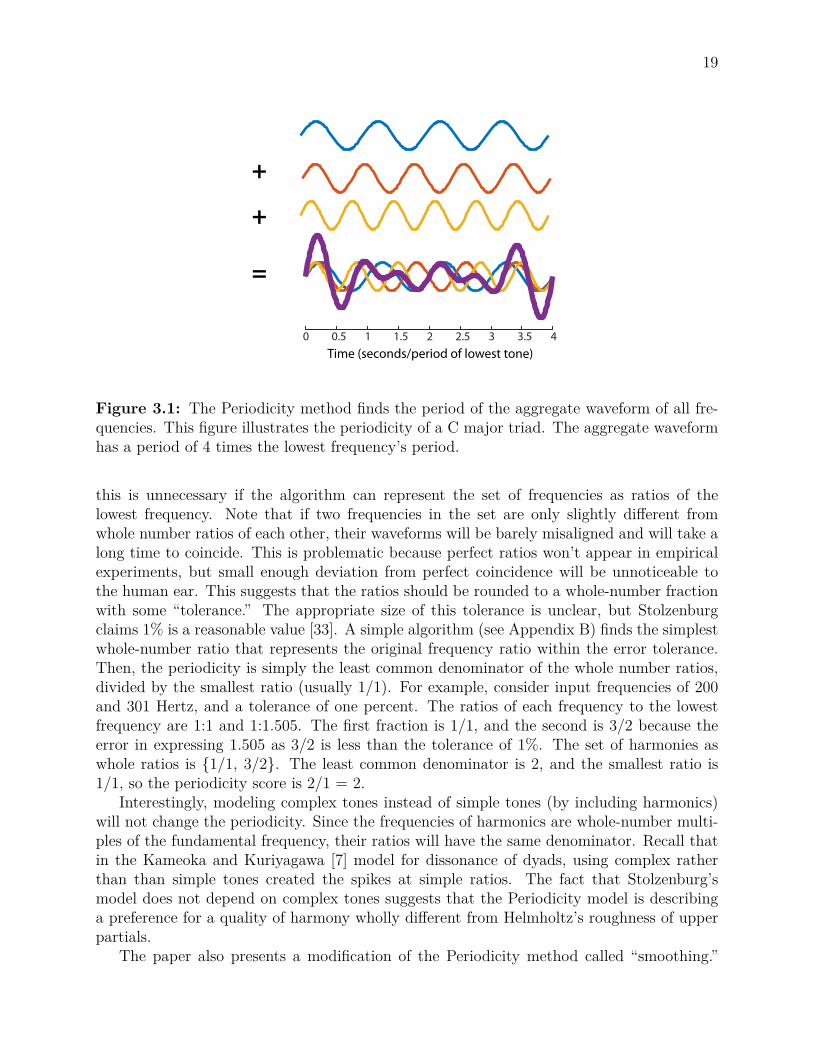
The algorithm is as follows. First, superimpose the sinusoidal waveforms of all frequenciesin the set. Call the period of this aggregate waveform the “total period.” The periodicityis the total period divided by the longest individual sinusoid’s period. Figure 3.1 illustratesthe process visually for the C major triad, containing the notes C, E and G. The ratio ofthe frequencies of E to C (a major third) is 5/4, and the ratio of G to C (a perfect fifth) is3/2. The individual sinusoids of C (blue), E (middle) and G (bottom) are shown, as well astheir superimposed waveform. The time axis is normalized so that the period of C is one.The periodicity is defined as the period of the aggregate waveform on this normalized scale.The C major triad has periodicity of four, because the aggregate waveform has a period fourtimes the period of the lowest frequency. The periodicity can also be found by computingthe least common denominator of the frequency ratios, which is also four.
An auto-correlation function can find the period of the aggregate waveform. However,
19
0 0.5 1 1.5 2 2.5 3 3.5 4Time (seconds/period of lowest tone)
+
+
=
Figure 3.1: The Periodicity method finds the period of the aggregate waveform of all fre-quencies. This figure illustrates the periodicity of a C major triad. The aggregate waveformhas a period of 4 times the lowest frequency’s period.
this is unnecessary if the algorithm can represent the set of frequencies as ratios of thelowest frequency. Note that if two frequencies in the set are only slightly different fromwhole number ratios of each other, their waveforms will be barely misaligned and will take along time to coincide. This is problematic because perfect ratios won’t appear in empiricalexperiments, but small enough deviation from perfect coincidence will be unnoticeable tothe human ear. This suggests that the ratios should be rounded to a whole-number fractionwith some “tolerance.” The appropriate size of this tolerance is unclear, but Stolzenburgclaims 1% is a reasonable value [33]. A simple algorithm (see Appendix B) finds the simplestwhole-number ratio that represents the original frequency ratio within the error tolerance.Then, the periodicity is simply the least common denominator of the whole number ratios,divided by the smallest ratio (usually 1/1). For example, consider input frequencies of 200and 301 Hertz, and a tolerance of one percent. The ratios of each frequency to the lowestfrequency are 1:1 and 1:1.505. The first fraction is 1/1, and the second is 3/2 because theerror in expressing 1.505 as 3/2 is less than the tolerance of 1%. The set of harmonies aswhole ratios is {1/1, 3/2}. The least common denominator is 2, and the smallest ratio is1/1, so the periodicity score is 2/1 = 2.
Interestingly, modeling complex tones instead of simple tones (by including harmonics)will not change the periodicity. Since the frequencies of harmonics are whole-number multi-ples of the fundamental frequency, their ratios will have the same denominator. Recall thatin the Kameoka and Kuriyagawa [7] model for dissonance of dyads, using complex ratherthan than simple tones created the spikes at simple ratios. The fact that Stolzenburg’smodel does not depend on complex tones suggests that the Periodicity model is describinga preference for a quality of harmony wholly different from Helmholtz’s roughness of upperpartials.
The paper also presents a modification of the Periodicity method called “smoothing.”

20
Smoothing recalculates the periodicity of the set of frequencies using each frequency as theroot of the tuning system. The Smoothed Periodicity is the arithmetic average of theseshifted periodicities. Finally, the Smoothed Logarithmic Periodicity is the average value oflog2(periodicity). Stolzenburg justifies the use of logarithmically scaled periodicity based onFechner’s law, the principle that human perception scales logarithmically with the intensityof the stimulus [28].
3.1.1 method, claims and resultsUsing these ranking methods, Stolzenburg [33] analyzes combinations of two, three, four
and more tones taken from a twelve-tone equal temperament scale (the Western chromaticscale). These rankings can be compared to experimental data on the perceived consonanceand dissonance of various three and four tone harmonies. The experimental data is fromJohnson-Laird et al. [13], which reports perceived rankings of consonance and dissonance forharmonies.
For this research, the Periodicity method was recreated in Matlab. A script analyzed theSmoothed Periodicity and Smoothed Logarithmic Periodicity of all 220 possible combinationsof three tones from the chromatic scale. The top twenty ranked triads are shown in Table 3.1.In the Periodicity model, the best-ranked sets of three tones coincide very well with empiricalrankings. The three inversions of the major triad, the most important three-note chord inWestern music, are ranked as the top three triads. The minor triad and its inversions alsoappear in the top twenty of 220 total combinations analyzed.
The predictive power of the Periodicity model is not limited to harmonies. Table 3.2shows the twenty top ranked heptatonic scales out of 792 possible combinations of sevennotes from the chromatic scale. The best-ranking sets of seven tones coincide perfectly withthe most used heptatonic scales in Western music. The major scale, the most commonlyused scale in Western practice, is ranked highest. The top seven scales are the seven diatonicmodes. Several scales are variations of the eight-note bebop scale (spelled C D E F G ABb B C, common in jazz) with one note missing. The remarkable success of this method inranking the most used heptatonic scales suggests that Stolzenburg’s Periodicity method is auseful method for predicting likable sets of tones. Whether the success applies outside thecontext of Western music will be examined in Chapter 5.
The success of this method in predicting the most commonly used scales and chords inWestern music is remarkable because it uses no music theory to aid in the ranking process,unlike other methods such as the dual process theory [13]. This suggests that somethingin the method emulates an innate biological preference for certain combinations of tones.Indeed, Stolzenburg points out that the auditory cortex has the ability to detect the periodof a signal [4, 35]. Periodicity may be a natural way of describing human perception ofharmony. If this measure of harmoniousness does reflect innate preference, it should performwell in non-Western musical cultures. However, Chapter refchapter:applyToModels will showthat the method does not generalize to Arabic music.

21
Table 3.1: The Periodicity method ranks the three inversions of the major triad as the topcombinations of three tones chosen from the chromatic scale, out of 220 possible combina-tions.
Semitones Spelling SP SLP Chord0 5 9 C F A 3.0 1.58 Major, 2nd Inversion0 4 7 C E G 4.0 2.00 Major0 3 8 C Eb Ab 5.0 2.32 Major, 1st Inversion0 5 7 C F G 6.0 2.58 Sus40 2 7 C D G 8.0 3.00 Sus20 2 11 C D B 8.0 3.000 4 11 C E B 8.0 3.00 Major 70 7 11 C G B 8.0 3.000 5 10 C F Bb 9.0 3.17 Sus2, 2nd Inversion0 9 10 C A Bb 9.0 3.170 3 7 C Eb G 10.0 3.32 Minor0 7 8 C G Ab 10.0 3.320 4 5 C E F 12.0 3.58 Major 7, 2nd inversion0 4 9 C E A 12.0 3.58 Minor, 1st inversion0 7 9 C G A 16.3 3.780 1 3 C Db Eb 15.0 3.910 1 5 C Db F 15.0 3.910 1 8 C Db Ab 15.0 3.910 5 8 C F Ab 15.0 3.91 Minor, 2nd inversion0 2 9 C D A 16.3 3.92

22
Table 3.2: The twenty top-ranking heptatonic (seven-note) scales are shown, out of all 462unique seven-note combinations possible from the chromatic scale. The last two columnsshow the smoothed periodicity and smoothed logarithmic periodicity. The major scale, themost commonly used scale in Western practice, is ranked highest.
Rank Spelling Name Smoothed Smoothed Log1 C D E F G A B Major (Ionian) 129.7142857 6.4530790152 C D E F# G A B Lydian 139.2857143 6.5841558493 C D E F G A Bb Mixolydian 135.2857143 6.6069098144 C D Eb F G A Bb C Dorian 145.2857143 6.6153231985 C D Eb F G Ab Bb C Minor (Aolian) 151.5714286 6.7665937256 C Db Eb F G Ab Bb Phrygian 162.8571429 6.7775673827 C Db Eb F Gb Ab Bb Locrian 163.4285714 6.7900620748 C D F F# G A B 135.4285714 6.8189924479 C D E F G Bb B Bebop Dominant -6 136.4285714 6.83077275610 C D Eb F Ab A Bb Bebop Minor -5 142.1428571 6.85015979711 C D E G Ab A B Bebop Major -4 148.2857143 6.85248748412 C D F G A Bb B Bebop Dominant -3 163.5714286 6.85504775613 C D Eb F G Bb B Bebop Harm. Minor -6 148.1428571 6.88517586814 C D F F# A Bb B 148.2857143 6.88925717515 C E F G A Bb B Bebop Dominant -2 161.5714286 6.892624116 C Eb E G Ab Bb B 175 6.90689059617 C Db Eb F G# A Bb 155.5714286 6.90712318118 C D E F A Bb B Bebop Dominant -5 166.1428571 6.95191517119 C Eb E F# G Ab B 166.1428571 6.95440135820 C Eb E F G A Bb Bebop Dorian -2 151.8571429 6.984603556

23
3.1.2 generalizing to microtonalSome cultures’ musical modes are not derived from an equal-temperament division of the
octave. For example, in Arabic music, the maqam is constructed using cumulative frequencyratios built on the previous tone, rather than by selecting tones from a some equal divisionof the octave [17]. The smoothed periodicity method must be modified in order to analyzethe periodicity of these tuning systems. The original model assumes each frequency canbe shifted to the first pitch of the tuning system, which doesn’t work without an equaltemperament system. Stolzenburg suggested the an alteration to the smoothed periodicityalgorithm to generalize the method: instead of shifting each frequency to the root of a fixedtuning system, recalculate the frequency ratios for each frequency as the denominator.
For example, the frequencies of 100 Hz and 150 Hz will have two ratio sets, {1/1 3/2}and {2/3 1/1}. The periodicities of the sets are 2 and 3, respectively. Taking the average,the new smoothed periodicity is 2.5.
For western triads and heptatonic scales, the new version of the algorithm should producesimilar rankings to the original. Table 3.3 shows that the rankings of this method do notcorrelate as well with empirical studies as the original methods. The modified methodstill predicts the commonly used triads and scales in Western music, but does not predicitcommon scales.
3.1.3 analysisIn general, the Periodicity model is very successful in ranking Western chords and scales
taken from the twelve-tone equal temperament scale. However, there are limitations with themodel, especially concerning its generalization to microtonal tunings. First, the ranking ofheptatonic scales only finds three of the seven modes and does not rank the major or minorscales well (see Table 3.3). Second, the paper claims that the method can be generalized toTurkish and Central African music. In 2010, Stolzenburg [11] claims that average values formaqam periodicities were similar to the scores of Western modes, but provides little evidence.The application of the method to maqammelody types will be investigated further in Chapter5.
3.2 Similarity Model for DissonanceGill and Purves [8] propose another method, called “Similarity,” for numerically ranking
scales or modes. This method is designed for arbitrary microtonal tunings. The premise issimilar to Stumpf’s tonal fusion. The score, called “percent similarity” or simply “similarity,”measures the overlap of the harmonics of each tone.
3.2.1 methods, claims and resultsThe premise of the Similarity scoring algorithm is that the scales used to make music use
tones with similar harmonic series. The harmonic series of a tone is the set of frequenciesat all integers of the fundamental. Taking a dyad of any two frequencies, their “missingfundamental” or virtual pitch is the highest pitch of which both pitches could be a har-

24
Table 3.3: When the microtonal implementation of the Periodicity method is used to rankseven-note scales (SLP Micro), only three of the diatonic modes occur in the first twentyscales. The rank (SLP Rank) and score (SLP Score) from the original implementation ofSmoothed Logarithmic Periodicity are shows for reference.
Rank Spelling Name SLP Micro SLP Rank SLP Score1 C Eb E F G A Bb 6.238350443 28 6.9846035562 C D E F G A Bb Mixolydian 7.32017517 4 6.6069098143 C Db Eb F Gb Ab B 7.565372494 40 7.0272263594 C D Eb E G A Bb 7.807069309 274 7.4941807835 C D E F# G A B Lydian 7.823191745 2 6.5841558496 C Db F Gb Ab Bb B 7.883239144 45 7.0890777037 C Db E F G A Bb 7.936724218 282 7.5043477888 C D Eb F G A Bb C Dorian 7.943017448 6 6.6153231989 C Eb F G Ab A Bb 7.963227795 37 7.0172919410 C D Eb E F Ab Bb 7.973733576 604 7.89614952511 C Db Eb F G# A Bb 7.984806342 23 6.90712318112 C Db Eb E Ab Bb B 8.002357306 410 7.65642496713 C Db Eb Gb A Bb B 8.013381286 389 7.62292993114 C Db D E Bb G B 8.033591633 175 7.35284467515 C Db Eb F Ab Bb B 8.082141633 311 7.53784282416 C Eb E F Ab A Bb 8.102938323 84 7.21944015417 C Db D E F Ab Bb 8.128717704 590 7.88284818118 C D E Gb G Bb B 8.144111444 228 7.43641074719 C Db D F Gb Ab Bb 8.146650687 302 7.52606251620 C Db E F G A Bb 8.173604426 130 7.303006226

25
Frequency (Hz) Frequency (Hz)
400 800 1200 1600 2000
500 1000 1500 2000 100Virtual Pitch
Illustration of the Similarity Scoring Method
Low Note (400 Hz)
High Note (500 Hz)
Major Third Dyad (400 + 500 Hz)
Harmonic Series of Virtual Pitch
Figure 3.2: Each figure shows the harmonic series of a note or dyad. The Percent Similarityof a dyad is the percentage of the virtual pitch’s harmonic series that is included in thecombined harmonic series of the two dyad frequencies. The percent similarity score is 40.This figure was adapted from Gill and Purves [8], Figure 2.
monic frequency. Mathematically, the virtual pitch is the greatest common divisor of thefrequencies, because this will make them integer multiples (harmonics) of the virtual pitch.
Figure 3.2 illustrates the method with an example. The virtual pitch of frequencies 400Hz and 500 Hz is 100 Hz, because 100 is the greatest common divisor of 400 and 500. Themethod defines the measure called Percent Similarity as the percentage of the virtual pitch’sharmonics which are included in the combined harmonic series of the dyad. In this case,the frequencies 400 Hz (Figure 3.2, upper left) and 500 Hz (lower left) have virtual pitch(greatest common divisor) of 100 Hz. In this case, the combined harmonic series of 400 and500 Hz (Figure 3.2, upper right) make up 40% of the harmonic series of the virtual pitch(lower right). The similarity score of a scale is the average percent similarity of all possibledyad pairings within the octave.
One advantage of this approach is that it is built for microtonal pitch sets, rather thanequal tempered or justly tuned scales. It is possible to analyze the similarity of any set ofset of pitches in relation to a tonic, or root frequency. The only limit to the resolution ofmicrotonal scales that can be examined is computational expense. Instead of just the twelveintervals of the chromatic scale, the 60 rational intervals with the best percent similarity

26
Table 3.4: The top scoring scales in Similarity method include Western modes and non-Western scales.
Rank Name MPS Gill MPS Stolzenburg MPS Lapp1 phrygian 40.39 28.6750 40.34842 dorian 39.99 34.9425 39.65873 major 39.61 34.8485 39.61314 husayi 39.39 33.1595 37.43575 minor 39.34 30.5486 38.36036 lydian 38.95 31.8755 38.56037 38.83 27.9981 38.65938 kardaniya 38.76 30.0143 38.76449 38.69 29.0528 38.693310 mixolydian 38.59 36.9664 38.5931
are selected as candidates for creating scales. Then, the paper analyzes the similarity scoresof scales that can be made with these intervals. In particular, five note (pentatonic) andseven note (heptatonic) scales are analyzed. Table 3.4 shows the top scoring scales given bythe method. The results are impressive, but not as convincing as those from Stolzenburg’sPeriodicity method. The top ten scales contain all of the diatonic modes except the Locrianmode, and two non-western scales are also identified. The authors name the fourth resultHusayni (also Husseini). According to maqamworld.com [17] and other sources [36], thisscale is called Bayati and is common maqam built from the jins Bayati and Nahawand. Itcould also be seen as the descending form of maqam Husayni, but the ascending form ofHusayni is built from the jins Bayati and Rast. This results (approximately) in the sixthscale degree being half-flat, rather than flat [17, 36].
The paper also claims the eight ranked collection is an Arabic scale called called Kar-daniya, though this is not a maqam mentioned in any of the resources found in this research.
3.2.2 recreating the similarity algorithmRecreating the results of the Similarity method was more difficult than the Periodicity
study. In the actual implementation, the authors allowed a tolerance of 22 cents in choosingthe best ratio for each dyad (see [8] for a full explanation). Matlab scripts implementedthe model as described in the paper, but achieved slightly different similarity scores forsome scales. The authors of the similarity method paper did not respond to an emailinquiring about these discrepancies. It is likely that one of the tolerance parameters wasimplemented slightly differently than reported, or that some aspect of the algorithm was notfully described. Table 3.4 shows the results of the similarity method for heptatonic scalesfrom the original study, from Stolzenburg’s implementation, and from the implementationin this study.

27
3.2.3 analysisWhile the similarity method gave high rankings to diatonic Western modes and found
one common maqam, other common maqamat (or scales from other cultures) do not appearin the top results. Also, unlike in Stolzenburg’s Periodicity results, the order of the modesdoes not reflect how common they are. For instance, the major scale is ranked third andthe much less used Phrygian scale is ranked first. Still, Stolzenburg’s method shows that atleast Western diatonic modes posses tones with high degrees of similarities in their harmonicspectrum.

28
Part II
Methods

29
Chapter 4
Developing a Model to AnalyzeIntonation
This chapter describes the development of a method to extract information about into-nation in musical recordings. The method takes audio recordings of music and extracts thefrequencies at small time steps. This yields a frequency versus time representation of themusic. Testing the model reveals that it is accurate for some types of music but innaccuratefor other types of music.
4.1 An Algorithm for Analyzing MusicThe general approach consists of breaking an audio file into short segments, finding the
fundamental frequency of each segment, and compiling the results into a frequency versustime representation of the music. For each short segment of audio, Fourier analysis trans-forms the signal from the time domain into the frequency domain. This means that giventhe original signal indicating the sound pressure level over time, the Fourier transform givesthe prevalence of each frequency of pressure oscillations during the time interval. Figure 2.2shows how Matlab’s Fast Fourier Transform function extracts the relative prevalence of eachfrequency from the time-domain signal of the audio file.
4.1.1 finding the fundamental frequencyOnce the signal is represented in the frequency domain, the program must decide what
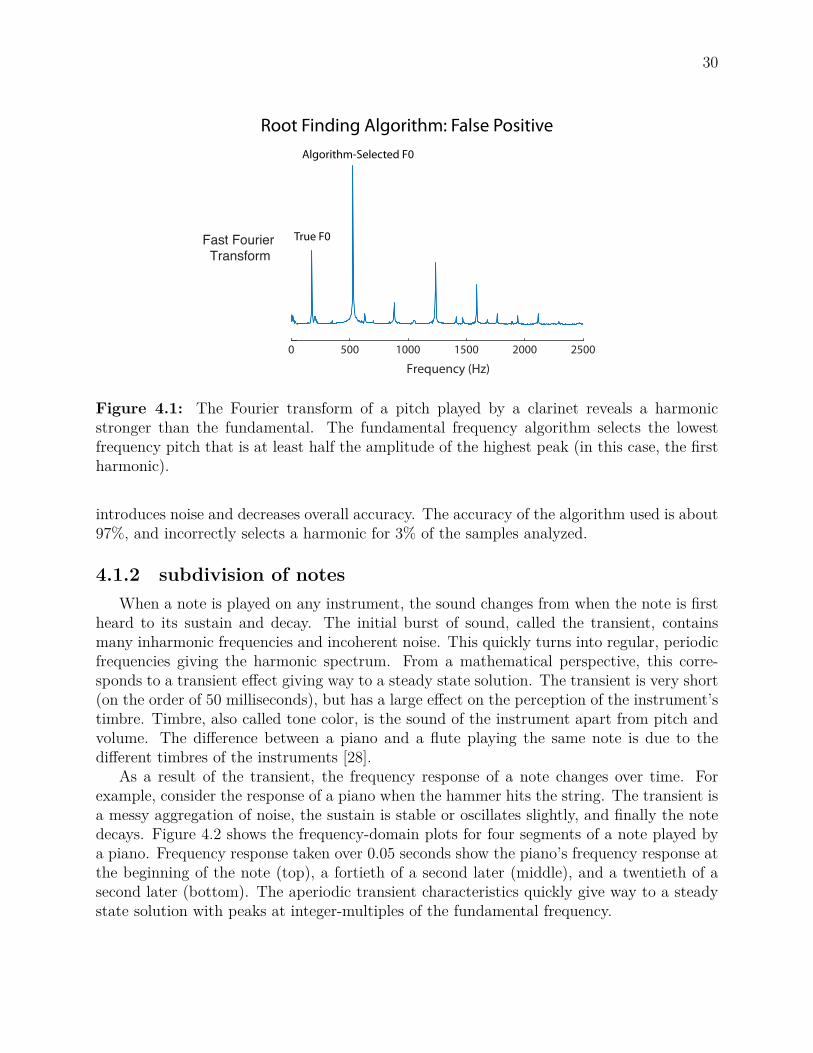
the fundamental frequency of the current note is. Notice that the frequency-domain signal(Figure 4.1) has many peaks (harmonics) at integer-multiples of the fundamental (lowest)frequency. It is possible for the amplitude of a harmonic to be higher than the amplitudeof the fundamental. The program chooses the fundamental frequency to be the lowestfrequency peak who’s amplitude is at least half the amplitude of the highest peak. Thismethod is generally accurate, but sometimes chooses the first or second harmonic instead ofthe true fundamental frequency. In the example shown in Figure 4.1, the true fundamentalfrequency has an amplitude of less than half of a harmonic frequency. This means that thealgorithm will incorrectly select the harmonic frequency instead of the true fundamental.However, allowing the algorithm to choose peaks less than half of the maximum amplitude
30
0 500 1000 1500 2000 2500
Frequency (Hz)
Root Finding Algorithm: False Positive
Fast Fourier Transform
True F0
Algorithm-Selected F0
Figure 4.1: The Fourier transform of a pitch played by a clarinet reveals a harmonicstronger than the fundamental. The fundamental frequency algorithm selects the lowestfrequency pitch that is at least half the amplitude of the highest peak (in this case, the firstharmonic).
introduces noise and decreases overall accuracy. The accuracy of the algorithm used is about97%, and incorrectly selects a harmonic for 3% of the samples analyzed.
4.1.2 subdivision of notesWhen a note is played on any instrument, the sound changes from when the note is first
heard to its sustain and decay. The initial burst of sound, called the transient, containsmany inharmonic frequencies and incoherent noise. This quickly turns into regular, periodicfrequencies giving the harmonic spectrum. From a mathematical perspective, this corre-sponds to a transient effect giving way to a steady state solution. The transient is very short(on the order of 50 milliseconds), but has a large effect on the perception of the instrument’stimbre. Timbre, also called tone color, is the sound of the instrument apart from pitch andvolume. The difference between a piano and a flute playing the same note is due to thedifferent timbres of the instruments [28].
As a result of the transient, the frequency response of a note changes over time. Forexample, consider the response of a piano when the hammer hits the string. The transient isa messy aggregation of noise, the sustain is stable or oscillates slightly, and finally the notedecays. Figure 4.2 shows the frequency-domain plots for four segments of a note played bya piano. Frequency response taken over 0.05 seconds show the piano’s frequency response atthe beginning of the note (top), a fortieth of a second later (middle), and a twentieth of asecond later (bottom). The aperiodic transient characteristics quickly give way to a steadystate solution with peaks at integer-multiples of the fundamental frequency.

31
t = 0.00 s
t = 0.025 s
t = 0.050 s
200 400 600 800 1000 1200 1400 1600 1800 2000
Frequency (Hertz)
Frequency Response of a Piano’s Transient
0
Figure 4.2: The transient characteristics quickly give way to a steady state solution withpeaks at integer-multiples of the fundamental frequency.

32
4.1.3 sample length and frequency resolutionChoosing the time duration of the audio segment constitutes a trade-off between fre-
quency resolution and time resolution. For a sample of length 1/n seconds, the frequencyresolution of the Fourier transform is n Hertz. For example, breaking the file into one secondclips gives high resolution in the frequency domain (1 Hz) but low resolution in the timedomain (1 note per second). Music usually changes pitches much faster than one note persecond. However, if the audio file is divided into 10 samples per second, frequency resolutiondegrades to 10 Hz. This trade-off sets a fundamental limitation in the accuracy of audiotranscription. Note that a 10 Hz resolution in frequency may work well for pitches above1000 Hz (less than 1% error), but will cause large error for pitches in the range of 100 Hz(about 10% error). This implies that transcription will be more accurate at higher frequen-cies than at low frequencies. The extraction method was tested with sample lengths fromone second to one twentieth of a second. Transcription was the most accurate using a thirdof a second (three samples per second). This value is used throughout the paper.
4.1.4 parameters and optimizationSeveral parameters can be modified in order to optimize the model’s pitch extraction
accuracy. One way to increase the time resolution of transcription without losing frequencyresolution is to overlap the audio segments, effectively creating a “moving average.” A fivesecond audio file with one second samples can be divided into 5 second clips starting oneach second, or 9 clips starting on each half second. Transcription accuracy was tested foroverlap from a half to a tenth of a sample. The 1/3 sample overlap performed the best.Combined with the third of a second sample length, this means the method takes 1/3 secondclips starting every 1/9 of a second.
Additionally, the program must separate a series of extracted root frequencies into distinctnotes. The exact frequency of a held-out note can change slightly as it is played. Theprogram registers a new note when the frequency changes by more than some set tolerance.This tolerance is expressed as a percent difference between the fundamental frequencies ofthe current and previous samples. In other words, it is a “backwards difference” method. Inexperimentation with tolerances from 0.1% to 5%, the model performed best with a toleranceof 3%. This allows continuous notes to be kept together while separating distinct tones. Forexample, given the series of frequencies (in Hertz) {100 102 150 151 150}, the programconsolidates them into two distinct notes, {100 150}.
4.2 Testing the ModelA test of the model’s accuracy is its ability to transcribe music—that is, reproduce
the sequence of notes played by the performer. If the model is able to transcribe musicaccurately, this indicates that it is consistently extracting the correct fundamental frequenciesfrom the recording. Then the extracted frequency versus time information can be usedto analyze intonation. In Western music, it is easy to test the accuracy of transcriptionbecause performances generally adhere exactly to the written score. Arabic music is largelyimprovised, so it is not possible to calculate the accuracy of Arabic music transcription by

33
Monophonic and Polyphonic Textures
Monophonic Polyphonic
Figure 4.3: Monophonic music has only a single line while polyphonic music has multiplelines occurring at once. The three colors in the polyphonic example represent three musicallines.
comparing to a score.The accuracy of transcription depends on the musical texture, which can be “mono-
phonic” or “polyphonic.” Music is described as being monophonic if only a single musicalline is present. That is, only one note is heard at a time. By contrast, polyphonic musichas multiple independent musical lines occurring at once. This means multiple notes canbe played together or overlap. Figure 4.3 shows an example of monophonic and polyphonicmusic. The three different colors in the polyphonic music represent three independent musi-cal lines that occur at the same time. These could be played by the same instrument or bydifferent instruments (or voices).
The model assumes that the input is monophonic music. While most music is not mono-phonic, transcribing polyphonic music is beyond the scope of this paper. Section 7.1 explainswhy the model can still be an effective tool for analyzing polyphonic music. All models wereimplemented in Matlab.
Extracting a single series of frequencies from a polyphonic piece of music can, at best,capture the musical line with the highest volume. In reality, if three instruments are playing,the model will extract the pitches from different instruments at different times. Because ofthis, for polyphonic music, the extracted frequencies will jump around instead of followinga single musical line.
4.2.1 monophonic and polyphonic musicFigure 4.4 shows a snapshot of the Matlab algorithm analyzing the Prelude from J.S.
Bach’s Cello Suite Number 1 in G minor. The piece is slow and monophonic (a singlemelody without accompaniment), and the method transcribes the piece with greater than90% accuracy. This means that the notes extracted agree with the notes written in the scoreof the piece. In the top graph, the live Fourier transform of the signal shows the cello’sobvious root with three strong harmonics. The algorithm consistently picks out the rootfrequency from this data. As a result, the lower plot shows the smooth contour of the cello’smelodic line.
Polyphonic music is not as easy to capture. Figure 4.5 shows the analysis of the firstmovement from Antonio Vivaldi’s masterpiece “The Four Seasons.” The piece fast andpolyphonic, with many different instruments playing interlocking melodies and harmonies.

34
0 100 200 300 400 500 600 700 800 900 1000
Frequency (Hz)
34 34.5 35 35.5 36 36.5 37 37.5 38102
103
Transcribing a Slow, Monophonic Piece
Time (seconds)
Frequency(Hz)
Fourier Transform (0.33 s sample
starting at 38.0 s)
Figure 4.4: Transcribing a slow, monophonic piece results in an accurate curve with smoothtransitions between notes.
The Fourier transform at the top of the figure shows that there is no clear fundamentalfrequency for the melodic line, which is not surprising since several notes are being played atonce. As a result, the frequencies extracted over time (bottom graph) jump around betweenthe different musical lines and do not follow any single melodic idea. It does not make muchsense to measure the transcription accuracy of a polyphonic piece where a monophonic seriesof frequencies is extracted. The ideal case would be that the model picks out the primarymelodic line and transcribes it, but the model fails to do this. Instead, notes are takenfrom different parts at different times. In general, the model accurately transcribes slow,monophonic music but fails to transcribe polyphonic music. Section 7.1 will show thatdespite inaccurate transcription, the model can extract useful information from polyphonicmusic.
4.2.2 from pitches back to musicAnother way to test the accuracy of the extraction process is to use the extracted fre-
quency versus time information to recreate an audio file. Matlab can write an audio file withsine tones at the frequencies indicated by the extracted information. If the recreated audio isplayed back along with the original recording, it should closely coincide with the performer.Subjectively, the recreated audio does match well and seem to be co-performing the piece.However, by itself the Matlab-produced audio sounds nothing like music. The pure sinetones, lack of dynamics or phrasing, and overall mathematical sound did not constitute an

35
0 100 200 300 400 500 600 700 800 900 1000
Frequency (Hz)
88.5 89 89.5 90 90.5 91 91.5 92 92.5102
103
Transcribing a Fast, Polyphonic Piece
Time (seconds)
Frequency(Hz)
Fourier Transform (0.33 s sample
starting at 92.0 s)
Figure 4.5: Transcribing a fast, polyphonic piece results in an inaccurate curve that jumpsbetween different lines in the music.

36
electronic performance of the piece. This serves as a reminder that music is much more thana time-series of frequencies. Keeping frequency information while discarding timbre, dynam-ics, articulation, harmony, polyphony, acoustic space and other factors reflects one aspect ofthe complex sound that is music. Section 10.3.1 discusses the limitations of analyzing onlythe frequency aspect of music.

37
Chapter 5
Applying the Tools to Periodicity andSimilarity
The models of Periodicity and Similarity were successful in predicting the diatonic modesused in Western music. Both the Periodicity [4] and Similarity [8] papers claim that theirmethods apply beyond Western music to microtonal tuning systems. To test these claims,this section characterizes maqamat with discrete sets of intervals, then finds the Periodicityand Similarity scores of the maqamat. Characterizing maqamat as a set of intervals isdifficult because the tuning of maqamat is not based on a fixed interval system like Westernscales. For a variety of tunings analyzed, Arabic maqamat do not score favorably in eitherthe Similarity or Periodicity method. Neither method is successful in generalizing to Arabicintonation.
5.1 Extracting ScalesA histogram of the fundamental frequencies occurring in an audio file should reveal the
most prominent notes used. The histogram has discrete “bins” into which frequencies aresorted. Alternatively, a probability density function could analyze a continuous frequencyspectrum. If a musical scale describes a collection of discrete frequencies used in a piece ofmusic, then sharp peaks should arise in the histogram or probability density function at thefrequencies in the theoretical scale of the piece.
Using the extraction method developed, histograms of frequencies extracted from bothWestern and Arabic music showed the emergence of scales. For Western music, the peaks inthe histogram are sharp and located at the intervals in the equal temperament scale. Figure5.1 shows a histogram of frequencies extracted from Beethoven’s 9th Symphony, recordedby the London Symphony Orchestra. The symphony is in the key of D minor. The solidgreen bars in the figure show the theoretical placement of the intervals in the D minor scale,according to equal temperament. The outlined bars show the other notes in the chromaticscale, which do not belong to the key of D minor. The peaks in the histogram (blue)represent the frequencies extracted most often. As expected, these peaks align closely withthe theoretical tuning of the D minor and chromatic scale.
Figure 5.3 shows a histogram of the pitches extracted from an Arabic piece by SimonShaheen on the album “Turath” [37]. The piece is in maqam Nahawand. The arabic maqa-

38
300 400 500 6000
100
200
300
400
500
P1 m2 M2 m3 M3 P4 T P5 m6 M6 m7 M7 P8
D minor scale Chromatic scale
Frequency (Hz)
Numberof
Occurrences
Histogram of Frequencies from Beethoven’s 9th Symphony
Interval of D minor scale
Extracted Frequencies
Figure 5.1: The most common frequencies extracted from a recording of Beethoven’s 9thsymphony in D minor (blue) align well with the theoretical equal-temperament tuning ofthe D minor scale (green).
mat do not have a definite, exact theoretical tuning. The approximate intonation of maqamNahawand in Western notation is shown in Figure 5.2. In this case, only the histogramof the actual performance can show the exact intonation of maqam Nahawand. Peaks inthe histogram match the theoretical tuning, but there are also smaller peaks and troughsat other frequencies. A large peak also occurrs at the minor second (m2) interval. Notesfrom outside the theoretical maqam tuning occur because the performer may temporarilymodulate (change) to a different maqam [9], or tune the same note differently on differentoccasions. These variations in tuning make it difficult to define a maqam by an exact set ofintervals. Any fixed interval set would be an incomplete description of the maqam.
5.2 Characterizing MaqamatThe tuning of a single maqam can vary significantly based on geography, the performer
and even within a performance. The website maqamworld.com has multiple recordings ofvarious maqamat played ascending and descending by oud (Arabic lute), nay (flute) andbuzuq (fretted lute). The pitch relationships played in these recordings can be comparedto theoretical and experimental models in literature. Figure 5.4 shows the intonation ofthe notes in maqam Rast for three recordings from maqamworld, as well as other tuningsreported in literature. Each row shows the placement of notes in the Rast maqam. Forexample, the first row shows the tuning of Rast extracted from a recording of maqam Rastfrom maqamworld.com played on buzuq.
The seventh scale degree, which is theoretically a “neutral third” (between a minor and

39
Maqam Nahawand in Western notation
Ascending
Decending
Figure 5.2: The approximate notation of maqam Nahawand in ascending form is the sameas the Western harmonic minor scale. In descending form, the seventh degree (‘B’) is flat,transforming it into the Western aeolian mode [17].
100 150 200 250 300 350 4000
20
40
60
80
100
Frequency (Hz)
Occurences
Histogram of Frequencies from Maqam Nahawand Performance
P1 M2 m3 P4 P5 m6 m7 M7 P8 Theoretical tuning ofmaqam Nahawand
Frequencies extracted from Nahawand recording
Interval
Figure 5.3: The most common frequencies extracted from the piece “Samai Nahawand” bySimon Shaheen [37] align with the theoretical tuning of maqam Nahawand.

40
1 1.2 1.4 1.6 1.8 2
Theoretical (Yarman)
Theoretical (Stolzenburg)
Experimental (Bozkurt)
Oud from Maqamworld
Violin from Maqamworld
Buzuq from Maqamworld
Pitch ratio (f/f0)
C D E ♭ F G A B C♭
Various Tunings of Maqam Rast
Figure 5.4: Three recordings of maqam Rast from Maqamworld [17] played on buzuq,violin, and oud were analyzed to find the exact ratios between the frequencies played. Anexperimental result from music analysis by Bozkurt [38] and two theoretical models [4, 39]are shown for comparison.
major third) above the fifth has the most variation between the various tunings. The thirddegree, a neutral third above the tonic (first scale degree), also has considerable variation. Ingeneral, the variation in tuning shows that a single maqam cannot accurately be characterizedby a set of interval ratios.
5.3 Periodicity and Similarity of MaqamatNow that the method can extract the tuning of maqamat as performed in a recording,
these extracted scales can now be ranked in the Periodicity method (Stolzenburg) and Sim-ilarity method (Gill and Purves). Both authors claim that their methods predict commonlyused scales beyond Western music [4, 8]. However, the results do not show favorable rank-ings for maqamat in either the Periodicity or Similarity methods. Table 5.1 shows how thetunings of the five Turkish maqam tunings used by Stolzenburg are scored by the micro-tonal implementation of Smoothed Periodicity (SP) and Smoothed Logarithmic Periodicity(SLP), as well as Similarity (SIM). The scores for the Western major and minor scale (inequal temperament) are shown for comparison. A 1% tolerance was used in all the methods.

41
Table 5.1: Tunings of six maqamat according to values provided by Stolzenburg [11] arescored in the Smoothed Logarithmic Periodicity model (SLP) and Similarity model (SIM).
1 2 3 4 5 6 7 8 SP SLP SIMRast 1 1.125 1.248 1.333 1.500 1.688 1.873 2 1411 9.684 0.393Nihavend 1 1.125 1.185 1.333 1.500 1.580 1.778 2 14652 13.085 0.346Ussak 1 1.110 1.185 1.333 1.500 1.580 1.778 2 9696 11.521 0.340Huseyni 1 1.110 1.185 1.333 1.500 1.664 1.778 2 1331 9.423 0.367Hicaz 1 1.053 1.248 1.333 1.500 1.664 1.778 2 1890 9.616 0.397Huzzam 1 1.068 1.202 1.283 1.500 1.602 1.803 2 736 9.367 0.333Western Major 1 1.122 1.260 1.335 1.498 1.682 1.888 2 142 6.362 0.425Western Minor 1 1.122 1.189 1.335 1.498 1.587 1.782 2 184 6.850 0.391
All of the maqamat score much less favorably than the Western major and minor scale (lowerperiodicity is favored, while higher similarity is favored). In fact, the scores are similar tothe worst ranking scales created with the chromatic scale. In other words, the methodswould choose almost any combination of notes in the chromatic scale (even combinationsthat would very rarely occur in music) before choosing the most common maqamat tunings.This shows that the methods are not successful in predicting the theoretical intonation ofthe maqamat which were provided by Stolzenburg.
The tunings extracted from Arabic maqamat recordings on maqamworld.com [17] showsimilar results. Table 5.2 shows the extracted tuning ratios for five common maqamat, againcompared to the Western major and minor scale. Maqam Rast, maqam Suznak and maqamAjam have Similarity scores that are not far from the minor scale, but none of the maqamatscore low in the Periodicity method. For comparison, the Western chromatic scale has aSmoothed Periodicity score of 360, lower than all of the maqamat examined. This impliesthat the Periodicity method would not choose any of the common maqamat before even themost unlikely combination of seven notes from the chromatic scale. Evidently, the methodswhich so accurately predict the preferred scales in Western music fail to extend to Arabicmusic.
There are many possible reasons that maqamat do not score well in the models of Peri-odicity and Similarity. It is possible that classical Arabic music has fundamentally differentpreferences for combinations of tones. Also, the fact that Arabic music rarely uses harmony[18] may explain why these methods, which developed out of methods for consonant harmony[e.g. 7, 26, 6], fail to predict Arabic music’s modal intonation systems.
In reality, though, the models are fundamentally ill-suited for analysis of microtonalmusic. Both methods rely on approximating frequency relationships as whole-number ratios,and assume that the tuning system will use a fixed set of ratios as the basis for all intonationin the music. This is not an accurate picture of the maqam. The pitch extraction methodsshow that maqam intonation is flexible, and depends on context and placement. The ideaof a fixed pitch set goes against the nature of aurally-learned, improvisation-based music.The following section explores the features in both Arabic and Western music that cannotbe accurately depicted by fixed pitch sets.
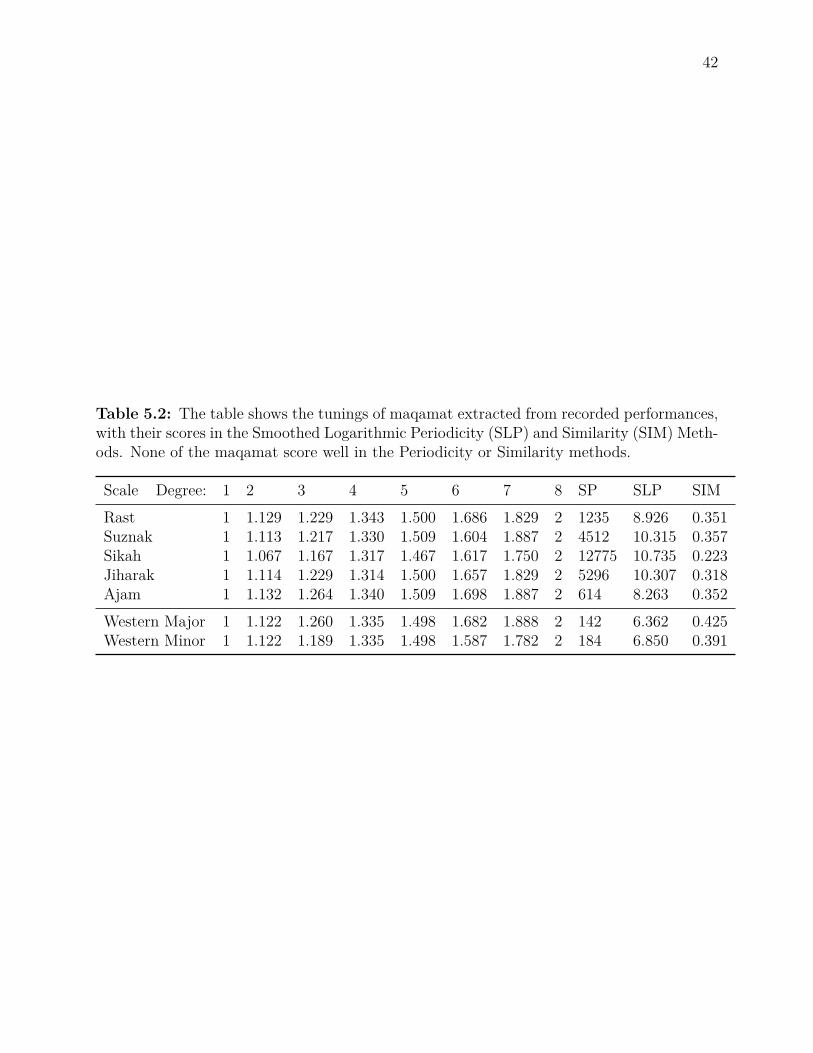
42
Table 5.2: The table shows the tunings of maqamat extracted from recorded performances,with their scores in the Smoothed Logarithmic Periodicity (SLP) and Similarity (SIM) Meth-ods. None of the maqamat score well in the Periodicity or Similarity methods.
Scale Degree: 1 2 3 4 5 6 7 8 SP SLP SIMRast 1 1.129 1.229 1.343 1.500 1.686 1.829 2 1235 8.926 0.351Suznak 1 1.113 1.217 1.330 1.509 1.604 1.887 2 4512 10.315 0.357Sikah 1 1.067 1.167 1.317 1.467 1.617 1.750 2 12775 10.735 0.223Jiharak 1 1.114 1.229 1.314 1.500 1.657 1.829 2 5296 10.307 0.318Ajam 1 1.132 1.264 1.340 1.509 1.698 1.887 2 614 8.263 0.352Western Major 1 1.122 1.260 1.335 1.498 1.682 1.888 2 142 6.362 0.425Western Minor 1 1.122 1.189 1.335 1.498 1.587 1.782 2 184 6.850 0.391

43
Chapter 6
Non-Discretized Intonation
In reality, music rarely uses a set of discrete frequencies. Some instruments with fixedtuning, like the piano, result in very narrow frequency bands in which each note is tuned.However in many instruments, such as the human voice or a fretless string instrument, tuningis flexible. Cohen [40] use the term “scatter” to describe the width of the distribution ina note or interval’s tuning. Western performers tune relatively consistently, but still havemeasurable scatter. Arabic performers have a much larger scatter. This means that a singlenote or interval may be tuned in significantly different ways, even by the same performerand in a single performance [40].
6.1 Pitch Distribution and ScatterAny interval will have a distribution of the exact frequency ratios at which it is played.
In Arabic music, this distribution tends to be very wide. Cohen and Katz [41] call the widthof this distribution “scatter.” Their study found that Arabic musicians use large scatter,especially in intervals of seconds and thirds. In contrast, Western musicians generally tunewith less scatter.
6.1.1 case study: the neutral thirdThe large scatter of intonation in Arabic music does not imply that musicians are impre-
cise in their tuning. Conversely, Arabic musicians distinguish between slight variations intuning that might go unnoticed in a Western context [9]. For example, Arabic violinist andcomposer Sami Abu Shumays demonstrates in an instructional recording that in the contextof twelve different maqamat, the E (or E flat or E half flat) is tuned in twelve distinct ways[9]. The differences in the tunings of these notes result from the structure of the maqam inwhich they occur. Therefore, in order to appreciate the differences in the intonation of thesemaqamat, the frequency resolution should capture twelve distinct notes between E and Eb.
In the Periodicity method, the intonation is allowed 1% error. By taking the frequen-cies of these twelve notes and mapping them to whole number ratios (to a fixed note C)with tolerance of 1%, several of these frequencies are mapped to the ratio 11/9. However,the differences in the intonation of these E’s are exactly what give each maqam a uniquecharacter. For example, Shumays explains that in maqam Jiharak, “the third scale degree

44
Table 6.1: When the tolerance for tuning ratios is decreased from 1% to 0.66% (the tol-erance necessary to differentiate between various maqam thirds), the periodicity method nolonger finds the common Western scales. Each Western mode is ranked and scored withthe Smoothed Logarithmic Periodicity (SLP) method, using 1% tolerance and then 0.66%tolerance.
Scale SLP 1% Rank SLP 1% Score SLP 0.66% Rank SLP 0.66% ScoreMajor (Ionian) 1 6.453079015 346 11.23089366Lydian 2 6.584155849 331 11.21911335Mixolydian 3 6.606909814 352 11.24267396Dorian 4 6.615323198 356 11.25639209Minor (Aolian) 5 6.766593725 376 11.27068192Phrygian 6 6.777567382 382 11.28317661Locrian 7 6.790062074 384 11.29567131
is just barely higher than Rast, but not quite high enough to be Ajam” [42]. In Shumays’demonstration of Jiharak on violin, the third is played at a frequency 1.228 times the root.In maqam Rast, he plays the third at a ratio of 1.220. In Stolzenburg’s algorithm, using atolerance of 1%, both of these ratios are mapped to 11/9. This indicates that the methoddoes not capture the nuances in intonation that distinguish one maqam from another.
The tolerance required to distinguish between these notes is about 0.66%. However,if Stolzenburg’s Periodicity method is implemented with only 0.66% tolerance for findingtuning ratios, the method is no longer effective. Table 6.1 shows that when the tuningtolerance is only 0.66%, the Periodicity method does not give good scores to any of theWestern diatonic modes. This implies that the method is unable to accommodate the smalltolerances necessary to describe the intonation of maqamat.
6.1.2 case study: the leading tone in Western musicTable 6.2 shows the most prevalent frequencies in a Bach Cello Suite performance, along
with the theoretical tuning of each note in equal temperament. While most of the notesconform well with the expected equal temperament tuning, the F# is tuned with a largeamount of variance. In fact, the distribution of frequency for F# seems to be bimodal.Sometimes it is at the expected tuning of the major seventh, and other times it is tuned verysharp (at a higher frequency than the standard tuning of the note). The context of the F#explains this bimodal behavior. When the F# is followed by the neighboring G, the firstnote creates tension before resolving upward to the tonic. In this case, the F# is functioningas the “leading tone.” A leading tone is a note that creates tension, then resolves up by ahalf step to a place of rest [15]. When a note functions as the leading tone, it is commonpractice for the note to be played sharp.
The same phenomenon occurs less prominently with the third scale degree leading tothe fourth (B to C in this case), which explains the occurrence of a sharp third in row 9 ofTable 6.2. The variable and contextual tuning of notes in Western music is an importantreminder that fixed pitch systems and equal temperament do not truly describe musical

45
Table 6.2: The most common frequencies extracted from the Sarabande movement ofJ.S. Bach’s Cello Suite number 1 in G are shown with their number of occurrences (Num),frequency ratio with the root (Ratio), scale degree, the just intonation ratio (Just Ratio),and the perecent difference from the just ratio (% Dif).
Num Frequency Ratio Scale Degree Just Ratio % Dif46 167.566 0.8400 Major 6 0.8333 0.79236 199.493 1.0000 Root 1.0000 0.00034 297.862 1.4931 Perfect Fifth 1.5000 0.46131 165.840 0.8313 Major 6 0.8333 0.24328 188.275 0.9438 Major 7 0.9375 0.66722 170.155 0.8529 Major 6 (Sharp) 0.8333 2.32518 223.654 1.1211 M2 1.1250 0.34617 296.136 1.4844 Perfect Fifth (flat) 1.5000 1.04215 252.129 1.2638 Major 3 (sharp) 1.2500 1.10213 112.341 0.5631 Major 2 0.5625 0.11313 147.720 0.7405 Perfect 5 (flat) 0.7500 1.27813 265.935 1.3331 Perfect 4 1.3333 0.02111 197.767 0.9913 Root 1.0000 0.86911 247.815 1.2422 Major 3 1.2500 0.62411 379.836 1.9040 Major 7 (leading tone) 1.8750 1.53510 299.588 1.5017 Perfect 5 1.5000 0.116

46
performance. It also suggests that tuning may depend heavily on context, and that therelationships between notes and their musical contexts are indispensable (as with the leadingtone). It is possible that, even without any absolute tuning system, links in intonationbetween cultures could emerge through the contextual tuning of consecutive notes.
6.1.3 issues with fixed pitch setNo fixed set of pitch ratios can capture the intonation of a maqam. Regional variation
in tuning, scatter in performance, non-equal temperament, and the importance of contextin intonation all render the idea of a fixed ratio set for a maqam essentially inadequate.The maqam forms the melodic structure of Arabic music, but it may be counterproductiveto label it as a “scale” in the western sense of a set of pitch ratios. The examples abovehave shown that describing the maqam using western measurement systems often discardsessential information about intonation, not to mention other aspects of the maqam such asmelodic phrases, large scale form, and character that go beyond intonation. Even in westernmusic, expressing intonation as a fixed set of pitch ratios is an incomplete picture of truemusical practice. In reality, musicians with the ability to produce continuous or flexiblepitch on their instruments instruments use musical context to mold intonation beyond afixed equal temperament tuning.
6.2 Shape Grammars: Words and VocabulariesIn order to understand intonation in the context of music, rather than as isolated occur-
rences of various notes, it is necessary to examine a series of frequencies in time. The seriesof frequencies may contain two, three, or more distinct pitches. In this method, the ratiosbetween a set of consecutive frequencies from a piece of music is called a “word.” Each ratioin the word is called a “syllable.” These musical words are conceptually similar to the idea ofa shape grammar. They describe a feature in a musical piece that may reoccur frequently,and may be related to the style, composer, function or cultural background of the piece. Aword describes the relative intonation of a series of frequencies, and is described by the ratioof each frequency to the first frequency. For example, the series of frequencies {100 Hz, 200Hz, 150 Hz} becomes the three-syllable word {1/1, 2/1, 3/2}. In frequency-time space, thislooks like . Since only the ratio relationships between the pitches are considered,words are equivalent through transposition. That is, making all of the frequencies higher orlower by a common factor does not change the word. For example, the frequencies {300 Hz,600 Hz, 450 Hz} also form the word {1/1, 2/1, 3/2}. Two syllable words simply describe aninterval, while words with more than two syllables describe a melody or melody fragment.
6.2.1 finding wordsFinding series of frequency ratios follows naturally from the methods used to extract the
frequencies from an audio segment. The program simply takes a series of distinct ratios anddivides by the first frequency to create the ratios of the word. A word is created startingon each extracted frequency. When the amplitude of the audio signal drops below a fixedthreshold, the program interprets a “rest” (the musical term for the absence of a note) and

47
no frequency is taken. When the same note occurs before and after a rest, the programmerges them into one note so that the same ratio will not occur twice in a row in any word.
6.2.2 vocabularyThe set of all words used in a selection of music is called the ‘vocabulary’. Each word in the
vocabulary is ranked by its frequency of occurrences in the selection. Vocabularies indicatehow certain pitch relationships, intervals, and melodic ideas reoccur in a selection of music.Because the frequencies extracted from the original audio samples are not discretized (forexample, to a twelve-tone equal temperament scale), the words provide detailed informationabout intonation in a temporal context. For example, a Western string player’s sharp leadingtone will appear in the context of its upward resolution, and will not be “auto-tuned” to theequal temperament value of the note. This continuous resolution is critical for retaining theintonation of Arabic music, which does not adhere to discrete intervals.

48
Part III
Results, Analysis, and Conclusions

49
Chapter 7
Accuracy of Vocabulary Extraction
The method of extracting words and vocabularies provides interesting insight into theintonation of Western, Arabic and Chinese music. In Part III, the method of vocabulariesis used to analyze intonation of various recordings of Western, Arabic and Chinese music.(Appendix C provides a list of citations for all musical recordings analyzed in this research.)The following chapters analyze the reliability of the vocabulary method, and then explorehow it can be used to learn about intonation in different cultures.
The compiled vocabulary of a selection of music can be represented as a histogram ofwords. This type of vocabulary histogram will be used to compare the common words foundin various composers, styles and genres. Figure 7.1 shows an example of the vocabularyextracted from J. S. Bach’s Brandenburg Concerto Number 1. The horizontal dimensionrepresents the relative prevalence of the word compared to all words occurring in the piece.
Analyzing two recordings of the same piece gives insight into the accuracy of the vocabu-lary extraction. If the method is reliable, it should extract the same (or similar) vocabularyfrom two recordings of the same piece (assuming the piece is played from a written score, andnot improvised). For two recordings of a piece played according to a score, any differences inthe extracted vocabulary are due to error in the model. Various factors including the modelparameters (samples per second, tolerances), the style of music (Western, Arabic, Chinese),the tempo (fast or slow) and the musical texture (monophonic or polyphonic) can affect theaccuracy of the vocabulary extraction process.
7.1 Tempo and PolyphonyThe tempo (speed) and polyphony (one note at a time or many notes at once) affect the
accuracy of transcription and extraction of individual notes and words in the method. Thissection examines the impact of these factors on the overall vocabulary found by the model.
7.1.1 slow, monophonic musicAs discussed in Section 4.2, the model accurately transcribes slow, monophonic music
such as Stravinsky’s “Three pieces for Clarinet Solo.” As expected, the vocabularies extractedfrom two recordings of this piece are very similar (Figure 7.2). This suggests that the methodaccurately captures the vocabulary. The vocabulary extraction is accurate for short segments

50
0 0.005 0.01 0.015 0.02 0.025
1:0.89:1
1:0.84:1
1:2:1
1:0.94:1
1:0.5:1
1:1.12:1
1:0.67:1
1:0.75:1
1:0.9:1
1:0.66:1
1:0.95:1
1:1.27:1
1:0.88:1
1:1.05:1
1:0.79:1
1:0.76:1
1:0.42:1
1:1.51:1
1:0.51:1
1:1.19:1
Common Words in Bach Brandenburg Concerto
Word
Normalized Number of Occurences
Figure 7.1: The most common three-note words in Bach’s Brandenburg Concerto Number1.
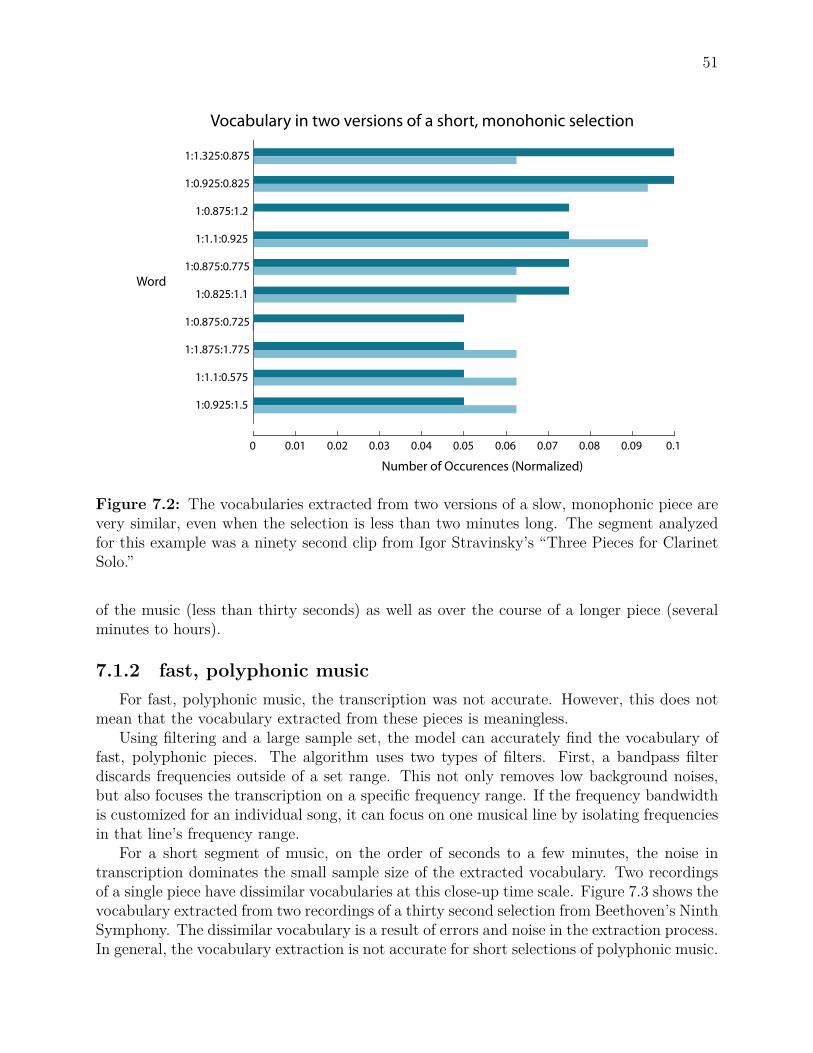
51
0 0.01 0.02 0.03 0.04 0.05 0.06 0.07 0.08 0.09 0.1
1:1.325:0.875
1:0.925:0.825
1:0.875:1.2
1:1.1:0.925
1:0.875:0.775
1:0.825:1.1
1:0.875:0.725
1:1.875:1.775
1:1.1:0.575
1:0.925:1.5
Word
Number of Occurences (Normalized)
Vocabulary in two versions of a short, monohonic selection
Figure 7.2: The vocabularies extracted from two versions of a slow, monophonic piece arevery similar, even when the selection is less than two minutes long. The segment analyzedfor this example was a ninety second clip from Igor Stravinsky’s “Three Pieces for ClarinetSolo.”
of the music (less than thirty seconds) as well as over the course of a longer piece (severalminutes to hours).
7.1.2 fast, polyphonic musicFor fast, polyphonic music, the transcription was not accurate. However, this does not
mean that the vocabulary extracted from these pieces is meaningless.Using filtering and a large sample set, the model can accurately find the vocabulary of
fast, polyphonic pieces. The algorithm uses two types of filters. First, a bandpass filterdiscards frequencies outside of a set range. This not only removes low background noises,but also focuses the transcription on a specific frequency range. If the frequency bandwidthis customized for an individual song, it can focus on one musical line by isolating frequenciesin that line’s frequency range.
For a short segment of music, on the order of seconds to a few minutes, the noise intranscription dominates the small sample size of the extracted vocabulary. Two recordingsof a single piece have dissimilar vocabularies at this close-up time scale. Figure 7.3 shows thevocabulary extracted from two recordings of a thirty second selection from Beethoven’s NinthSymphony. The dissimilar vocabulary is a result of errors and noise in the extraction process.In general, the vocabulary extraction is not accurate for short selections of polyphonic music.

52
Word
Number of Occurences (Normalized)
London PhilharmonicNDR Orchestra
Vocabulary in Two Beethoven Recordings: 30 Second Selection
0 0.02 0.04 0.06 0.08 0.1 0.12 0.14 0.16 0.18 0.2
1:1.5:11:0.65:1
1:0.65:0.651:0.675:11:1.475:11:0.975:1
1:0.975:1.51:1.975:1
1:1.5:0.9751:1.5:0.951:0.825:1
1:0.65:0.9751:1:2
1:1.525:11:0.5:0.75
1:1:11:1.675:1.5
1:0.65:0.61:0.675:1.1
1:0.875:0.5751:1.975:1.5
1:1.175:11:0.975:0.9
1:1.3:0.651:0.5:4
Beethoven’s 9th Symphony, 3rd Movement
Figure 7.3: Vocabulary was extracted from a thirty second selection of Beethoven’s NinthSymphony recorded by two different orchestras. The sharp differences in vocabulary showthat, for short segments of polyphonic music, the vocabulary extraction method is inaccurate.
However, over a long piece of polyphonic music, the vocabulary can converge and theinfluence of noise is reduced. For example, for an hour-long piece like Beethoven’s NinthSymphony, two recordings converge to similar vocabularies (Figure 7.4). Using a toleranceof 0.025 for distinct ratios shifted the focus from exact intonation to towards the generalnotes played. In general, using a tolerance of 0.01 will give more detailed insight into theintonation, but using 0.025 in this case shows that the extraction method over a largepolyphonic sample can converge.
Still, for some long selections the vocabulary does not converge. For example, the methodextracted dissimilar vocabularies from two recordings of a set of twenty-four Chopin preludes.This likely occurs because of the chordal texture where many lines occur at once. Still, inthe music analyzed, the vocabulary converged for over 90% of long selections of Westernmusic. Because Arabic music is improvised rather than played note-for-note from a score, itis not possible to do the same type of comparison for Arabic music.
7.1.3 file formatsWave files store much higher resolution audio information than a compressed, lossy mp3
format. Figure 7.5 shows that converting a wav file to mp3 and m4a formats did notsignificantly affect the vocabulary extracted. However, the mp3 files were processed muchfaster than the much larger wav files. Choosing to use the smaller mp3 format increased

53
0 0.005 0.01 0.015
1:0.5:11:0.925:1
1:2:11:1.05:11:0.75:1
1:0.675:11:1.075:11:0.475:11:0.825:1
1:0.95:11:0.65:11:1.45:1
1:1.5:11:0.9:1
1:1.25:11:1.3:1
1:1.175:11:0.875:11:1.025:11:0.775:1
1:0.8:11:0.625:1
Word
Number of Occurences (Normalized)
London PhilharmonicNDR Orchestra
Vocabulary in Two Recordings of Beethoven’s 9th Symphony
Figure 7.4: Theoretically, the vocabulary should be nearly identical in two recordings ofthe same piece. In this case, the method finds predominantly similar vocabularies in tworecordings. The recordings are by the North German Radio (NDR) Symphony Orchestraand the London Philharmonic.

54
0
0.01
0.02
0.03
0.04
0.05
0.06
Common Words
WAVMP3M4A
Comparison of Vocabulary Extraction for Three File Formats
WordFrequency
(Normalized)
Legend
Figure 7.5: The vocabulary extracted from the piece “Spring on a Moonlit River” [43] isvery similar when the original .wav files are compressed into .mp3 or .m4a formats.
efficiency without compromising the vocabulary extraction. For this reason, mp3 files wereused for all analysis.
7.2 Symmetry of Three-Syllable WordsIrrespective of genre, almost all of the most common three-syllable words found by the
method return to the note they started on. That is, they are of the form {1:R:1} whereR is the interval moving to some other pitch, before returning back to the same note. Thepattern is so pervasive that it is necessary to ask whether this phenomenon an accuraterepresentation of the patterns in music, or an error resulting from the methodology.
There are at least two possible ways that the method could falsely over-report thesesymmetrical words of the form {1:R:1}. First, consider two simultaneous frequencies withsimilar amplitudes. They might be from two separate notes or from the harmonic series ofthe same note. It is possible that as their amplitudes and harmonic spectra change withthe duration of the notes, the program chooses first one, then the other frequency, and backto the first. This “flip-flopping” between two choices for the fundamental frequency wouldresult in these alternating-note patterns.
Second, a similar error could occur even with a monophonic piece. When notes are playedlegato (connected) or have a long reverberation time, two frequencies may be present at once,which again could cause an alternating choice of root frequency. However, after manually

55
analyzing the transcription from monophonic and polyphonic pieces, neither of these errorswere common. This suggests that the prevalence of the {1:R:1} word form is an accuraterepresentation of common three-note phrases in music.
Though vocabulary extraction for polyphonic music is inaccurate on a small time scale,it converges to the true vocabulary with a larger sample size. This makes it useful foranalyzing large selections of music, such as the works from an entire album, a compilationof a composer’s work, or music from an entire genre.

56
Chapter 8
Comparing Vocabularies
The power of the vocabulary is in the ability to compare and contrast the words and typesof words used in different musical selections. This chapter first compares the vocabulary oftwo selections from a single composer, then compares two different composers’ vocabulary,and finally looks at the vocabulary of all of Western music. In the following chapter, thevocabulary of Western music is compared to Chinese and Arabic music.
8.1 Vocabulary of ComposersFigure 8.1 shows the top twenty words in the vocabulary from two album’s of J.S. Bach’s
music. The first sample is a recording of Brandenburg Concerto No. 1, and the second isan album of various selected masterpieces [43, 44]. Many of the most prevalent words inthe Brandenburg Concerto are also common in the other works contained in the Master-pieces album. This indicates that for a single composer, vocabulary can be consistent acrossmultiple works.
Next, it is necessary to compare Bach’s vocabulary, of the Baroque era, to that of com-posers in different eras of Western music. Figure 8.2 shows that the vocabularies in Bach’sand Beethoven’s music are very different. This is not entirely surprising because the BaroqueEra (Bach) and late Classical Era (Beethoven) are stylistically very different. When com-paring the more stylistically similar works of Beethoven and Brahms (Romantic period),the vocabularies are much more similar (Figure 8.3). This suggests that the vocabulariescan characterize stylistic genres. More in depth analysis of vocabulary comparisons acrossstylistic periods would be necessary to confirm this hypothesis.
8.2 Vocabulary of a GenreCompiling vocabulary from a wide selection of Western music gives a picture of the into-
nation for the entire Western musical culture. Figure 8.4 shows the overall interval makeupfrom a compilation of Western music. The the equal-tempered major (solid green) and chro-matic (outlined green) scales are shown for reference. The fact that peaks in intonationmatch closely with the theoretical values from equal temperament adds confidence that themodel is performing well. In Section 5.1, histograms of frequency showed that the frequenciesused in a Western piece align with the theoretical equal temperament scale. In Figure 8.4,

57
0 0.005 0.01 0.015 0.02
1:0.89:11:0.84:1
1:2:11:0.94:1
1:0.5:11:0.67:11:1.12:1
1:0.9:11:0.75:11:0.66:11:0.95:11:0.88:11:1.27:11:1.05:11:0.76:11:0.79:11:0.42:11:1.51:11:0.51:11:1.19:1
Vocabulary in Bach’s MusicBrandenburg Concerto 1Masterpieces Album
Word
Number of Occurences (Normalized)
Figure 8.1: Most common words in two albums of Bach’s music
0 0.005 0.01 0.015 0.02
1:0.89:11:0.84:1
1:2:11:0.94:1
1:0.5:11:0.67:11:1.12:1
1:0.9:11:0.75:11:0.66:11:0.95:11:0.88:11:1.27:11:1.05:11:0.76:11:0.79:11:0.42:11:1.51:11:0.51:11:1.19:11:1.06:11:1.14:1
1:0.84:0.891:1.32:11:1.18:11:0.63:1
1:0.89:0.791:0.85:1
1:0.8:11:1.35:1
Vocabulary in Bach and BeethovenBach Brandenburg Concerto 1Beethoven 9th Symphony
Word
Number of Occurences (Normalized)
Figure 8.2: Most common words in pieces by Bach and Beethoven

58
0 0.005 0.01 0.015 0.02 0.025
1:0.5:11:2:1
1:1.25:11:1.05:11:0.65:1
1:0.8:11:0.925:1
1:1.5:11:0.825:1
1:0.95:11:0.475:11:0.775:1
1:1.45:11:0.675:1
1:0.75:11:1.175:11:1.025:1
1:0.6:11:0.725:1
1:1.3:11:1.325:11:1.525:1
1:1.2:11:0.575:11:0.65:0.51:0.5:0.75
1:0.475:0.51:2.025:11:0.875:11:0.625:1
Vocabulary in Brahms and Beethoven
Brahms Symphony No. 1Beethoven Symphony No. 9
Word
Number of Occurences (Normalized)
Figure 8.3: Most common words in pieces by Brahms and Beethoven
the alignment of peaks with the theoretical scale reveals that the intervals between notes arealso discretized at intervals in the theoretical scale.

59
0
200
400
600
800
1000
1200
0.5 1.0 1.5 2.0
Frequency Ratio
Occurrences
Most common intervals in Western music12 Tone Equal TemperamentMajor Scale
Figure 8.4: A histogram of the most common intervals in Western music (blue) aligns wellwith the theoretical equal temperament tuning of the major (solid green) and chromatic(outlined green) scales.

60
Chapter 9
Vocabularies Across Cultures
Finally, the vocabulary method can be used to compare works across musical cultures.This comparison reveals similarities and differences between the intonation used in Western,Chinese and Arabic music.
9.1 Intervals and WordsFigure 9.1 shows the ten most common words from a selection of Western and Arabic
music. The tables list the words ranked by their frequencies in the music, and how farthey are from the nearest interval in twelve tone equal temperament. Below the tables, thewords are notated on a staff. Western words, as well as Arabic, have some variance fromthe theoretical tunings. This shows that both Western and Arabic musicians use intonationthat does not always follow the exact intervals in the equal temperament tuning system.
9.2 Vocabulary of Three GenresFigure 9.2 shows the vocabulary for large selections of work from Western, Arabic and
Chinese culture individually. (Appendix C lists the recordings used for analysis.) The gap inintervals around 1.0 occurs because the program assumes intervals within a small tolerance ofthe current note are continuations of the note. The vocabularies for the three musical culturesare very distinct, and give insight into the differences between each culture’s intonation.
In Western music (Figure 9.2, top), the most common intervals occur at ratios in the ma-jor scale and chromatic scale. This is expected because Western music generally moves in in-tervals defined by twelve-tone equal temperament. The figure shows the equal-temperamentratios in the major scale (solid green bars) and chromatic scale (outlined green bars). Thepeaks in the observed vocabulary align well with this theoretical framework, yet there is sig-nificant variance in intonation where intervals do not fall directly on an equal temperamentratio. For example, the sharp leading-tone phenomenon discussed earlier is also apparenthere. This is seen in the prevalence of intervals between 1.89 and 2.0. When the music movesby a major seventh, musicians tend to play the higher note sharp, for instance at a ratio of1.95 instead of 1.89. This creates extra tension before the note resolves to the octave at aratio of 2.0, a place of rest and resolution.
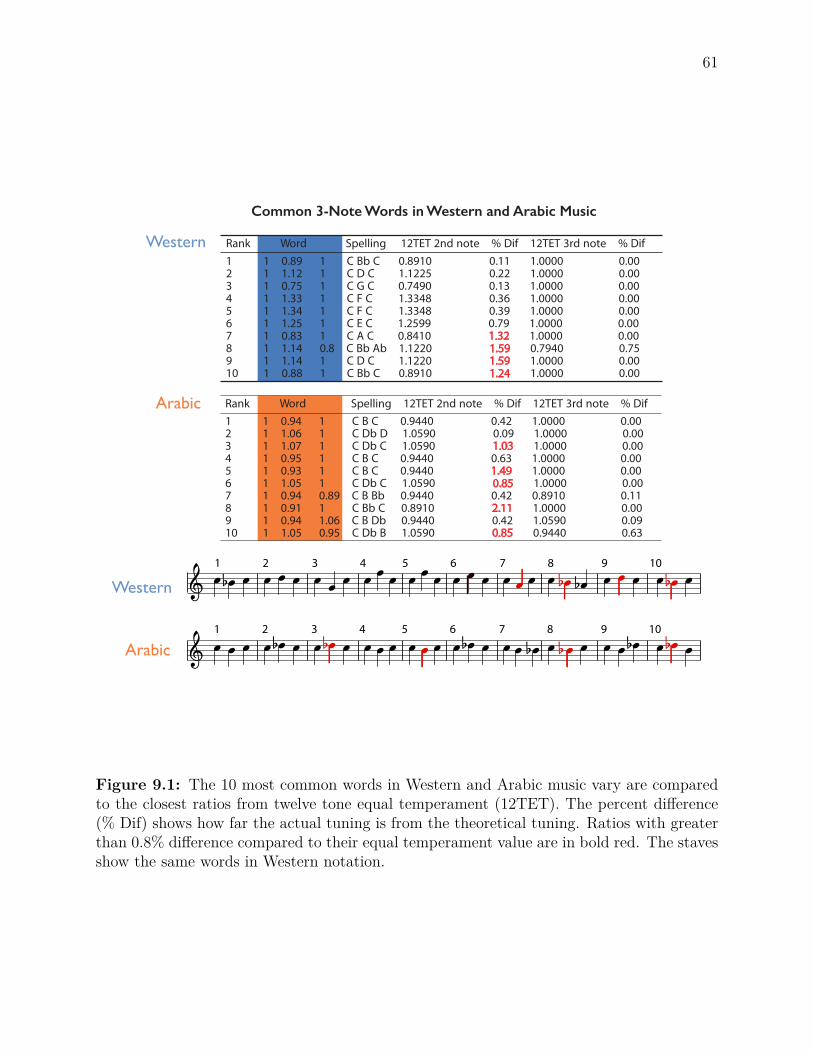
61
Rank Word Spelling 12TET 2nd note % Dif 12TET 3rd note % Dif1 1 0.94 1 C B C 0.9440 0.42 1.0000 0.002 1 1.06 1 C Db D 1.0590 0.09 1.0000 0.003 1 1.07 1 C Db C 1.0590 1.03 1.0000 0.004 1 0.95 1 C B C 0.9440 0.63 1.0000 0.005 1 0.93 1 C B C 0.9440 1.49 1.0000 0.006 1 1.05 1 C Db C 1.0590 0.85 1.0000 0.007 1 0.94 0.89 C B Bb 0.9440 0.42 0.8910 0.118 1 0.91 1 C Bb C 0.8910 2.11 1.0000 0.009 1 0.94 1.06 C B Db 0.9440 0.42 1.0590 0.0910 1 1.05 0.95 C Db B 1.0590 0.85 0.9440 0.63
1 2 3 4 5 6 7 8 9 10
1 2 3 4 5 6 7 8 9 10
Western
Arabic
Rank Word Spelling 12TET 2nd note % Dif 12TET 3rd note % Dif1 1 0.89 1 C Bb C 0.8910 0.11 1.0000 0.002 1 1.12 1 C D C 1.1225 0.22 1.0000 0.003 1 0.75 1 C G C 0.7490 0.13 1.0000 0.004 1 1.33 1 C F C 1.3348 0.36 1.0000 0.005 1 1.34 1 C F C 1.3348 0.39 1.0000 0.006 1 1.25 1 C E C 1.2599 0.79 1.0000 0.007 1 0.83 1 C A C 0.8410 1.32 1.0000 0.008 1 1.14 0.8 C Bb Ab 1.1220 1.59 0.7940 0.759 1 1.14 1 C D C 1.1220 1.59 1.0000 0.0010 1 0.88 1 C Bb C 0.8910 1.24 1.0000 0.00
Common 3-Note Words in Western and Arabic Music
Western
Arabic
Figure 9.1: The 10 most common words in Western and Arabic music vary are comparedto the closest ratios from twelve tone equal temperament (12TET). The percent difference(% Dif) shows how far the actual tuning is from the theoretical tuning. Ratios with greaterthan 0.8% difference compared to their equal temperament value are in bold red. The stavesshow the same words in Western notation.

62
In general the intonation is spread out over the entire range of intervals rather than attwelve discrete ratios. This suggests that intonation in Western music is a dynamic andflexible element of performance, not a strict set of mathematical ratios.
In Chinese music (Figure 9.2, middle), which is based primarily on pentatonic scales, theobserved vocabulary also agrees with theory. The various inversions of the pentatonic scaleemerge as peaks in the common frequency ratios. The figure shows the theoretical Chinesetwelve-tone scale built from perfect fifths (outlined bars) and one common inversion of thepentatonic scale (solid bars). The pitch relationships extracted from Chinese music primarilyalign with the theoretical scales. There are some less-common ratios at other intervals, butthe intonation is primarily focused at discrete intervals. This results in sharp peaks at thepentatonic intervals in the histogram.
In Arabic music (Figure 9.2, bottom), the results are entirely different. Rather thanhaving peaks emerge to reveal a scale, the intervals are concentrated around 1.0. Most ofthe intervals used are between 0.8 and 1.2. This implies that Arabic music moves primarilyin small intervals rather than larger intervals, or “leaps.” There is a small peak at 1.5 (theperfect fifth), but there is no “scale” or set of peaks like in the Western or Chinese cases.It is evident that Arabic musicians use many different ratios between 0.8 and 1.2. In fact,there is a continuum rather than a discrete set of intervals. Categorizing the intervals as onlyminor and major seconds would discard most of the interesting variation in intonation. InArabic music, the intonation is dominated by a continuous spectrum of pitch relationshipsinside a ratio of 1.2.
Another difference between the vocabularies is the use of the leading tone. The leadingtone is used frequently in Western and Arabic music to create tension, but infrequently inChinese music. Both the Western and Arabic histograms have very common intervals justbelow 1.0 (around 0.95), while Chinese music usually moves down by a larger interval of awhole step (around 0.89).
9.3 Returning to PeriodicityIt is now possible to examine how the most common words of each genre are ranked
in the methods of Periodicity and Similarity discussed earlier. These measures could bea useful way to quantify the differences between the words used in Western, Chinese andArabic cultures. Table 9.1 shows Stolzenburg’s Smoothed Logarithmic Periodicity (SLP)score and Gill’s Similarity (SIM) score for the most common intervals in Western, Arabicand Chinese music. Recall that in the Periodicity method, low scores are preferred, whilein the similarity method, high scores are preferred. Chinese intervals score better in bothmethods. This is not surprising, because Chinese music uses larger leaps to intervals inthe pentatonic scale, which is built from whole number ratios. The Arabic and Westernintervals, which are predominantly small, do not score well in the Periodicity or Similaritymethods. This suggests that horizontal motion in music (melody) is not governed by thesame interval preferences as vertical combinations of tones (harmony). This result agreeswith music theory [15] and will be obvious to a musician. Harmony tends to spread outnotes rather than cluster them. Melody tends to move in small steps, mostly avoiding largerleaps. This creates continuity in the melodic line and makes it easier to sing [15].

63
0
200
400
600
800
1000
1200
1400
0
200
400
600
800
1000
1200
Occurrences
Most Common Intervals in Music
12 Tone Equal TemperamentMajor Scale
12 Tone Chinese TemperamentZhi Pentatonic Scale
0
200
400
600
800
1000
0.5 1.0 1.5 2.0Frequency Ratio
Intervals in Chinese Music
Intervals in Arabic Music
Intervals in Western Music
0.5 1.0 1.5 2.0
0.5 1.0 1.5 2.0
Figure 9.2: The figure shows the relative prevalence of intervals in Western, Arabic andChinese music.

64
Table 9.1: The Smoothed Logarithmic Periodicity (SLP) and Similarity (SIM) are calcu-lated for the ten most common intervals for Western, Arabic and Chinese music. In bothmethods, the common Chinese intervals score better than Western and Arabic intervals.
Western Arabic ChineseRank Interval SLP SIM Interval SLP SIM Interval SLP SIM1 1.05 13 0.095 0.94 10.5 0.118 0.89 8.5 0.2222 0.94 10.5 0.118 1.06 11.5 0.111 0.75 2.5 0.5003 0.95 12 0.100 0.95 12 0.100 0.67 2.5 0.6674 0.96 15 0.080 1.07 10 0.133 1.13 8.5 0.2225 1.03 19 0.059 0.93 9 0.143 1.12 6.5 0.2226 0.93 9 0.143 1.05 13 0.095 1.5 2.5 0.6677 0.84 5 0.333 0.92 8.5 0.154 1.33 2.5 0.5008 1.04 15.5 0.077 0.94 10.5 0.118 0.84 5 0.3339 0.48 7.5 0.120 1.08 9 0.154 1.19 4 0.08610 0.75 3 0.500 0.91 7.5 0.182 0.9 7 0.200Average 10.95 0.162 10.15 0.131 4.95 0.362
Figure 9.3 plots the Similarity Score versus Periodicity Score for the common intervalsof the three genres. Arabic and Chinese music show some separation with Chinese intervalshaving the more favorable scores (high Similarity, low Periodicity). The common Westernintervals are more spread out. This helps demonstrate the differences in intonation betweenthe three cultures. Chinese music uses the pentatonic scale with consonant, mathemati-cally favorable whole-number pitch ratios. Arabic music, on the other hand, uses small,harmonically-dissonant intervals like leading tones that create tension and form a smoothmelodic line. Western music incorporates both types of intervals, using larger leaps at simpleratios to create consonance, as well as small ratios to create tension and smooth melodiclines.

65
2 4 6 8 10 12 14 16 18 20
0
0.1
0.2
0.3
0.4
0.5
0.6
0.7
Chinese IntervalsWestern IntervalsArabic Intervals
Periodicity Score
Similarity Score
Similarity vs. Periodicity of Common Intervals
Intervals perferred by methods
Figure 9.3: Similarity and Periodicity of common words in Western, Arabic and Chinesemusic. The upper left of the plot represents “favorable” scores while the lower right representsless favorable scores.

66
Chapter 10
Conclusions
The method of analyzing the contextual intonation in music as words and vocabularies hasyielded interesting insights into the intonation of Western, Arabic and Chinese music. BothWestern and Arabic musicians use flexible intonation that is based on musical context, notpurely on theoretical values of an interval. Still, intonation in Arabic music is fundamentallydifferent from Western and Chinese traditions. While Western and Chinese intonation arebased on discrete sets of frequency intervals taken from a theoretical scale, Arabic intonationemploys a continuous range of small intervals. Chinese and (to a lesser extent) Western musicuse large leaps at intervals with favorable harmonic relationships. In Arabic music, theseinterval motions are replaced by small melodic movements between a flexible collection ofpitches. The fundamental differences in intonation between cultures suggest that intonationis not based on universal principles, contrary to the claims of models such as Stolzenburg[4] and Gill and Purves [8]. Some interesting results and implications of this research arediscussed below.
10.1 Words as Building BlocksThe building blocks of music are described differently depending on the perspective of
analysis (Section 1.1). From the vertical perspective, chords form the building blocks ofmusic. From the modal perspective, scales or discrete pitch sets describe the musician’s colorpalate. The method developed in this research takes the horizontal perspective, analyzingfrequency ratios within melodic fragments. From this perspective, short melodic phrases, or“words,” form the building blocks of the musical language.
This is certainly not a new or original view of musical analysis. Arabic musicians learnkey melodic fragments aurally rather than reading notated music [9]. Arabic musician Samiabu Shumays explains, “I do not spontaneously generate those shorter phrases from a set ofrules about how notes go together in the maqam system—I have learned them over years ofimitating and repeating, in the same way that I learned the words of spoken language, andeach one has its own identity.” [9]
An important feature of the method developed in this research is that it retains truefrequency ratios from a musician’s performance, rather than mapping pitches or ratios to afixed tuning system. Avoiding discrete measurement systems is necessary and natural forArabic and other microtonal music. It also provides valuable insight into Western music,

67
where intonation is not as discrete as a pianist might imagine.
10.2 Discrete Versus Continuous Measurement SystemsWestern measurement systems may not be appropriate for describing artifacts and tra-
ditions from other cultures. In the case of Arabic music, the twelve-tone equal temperamentsystem is inadequate for describing the intonation of the Arabic maqam. Arabic music isan oral tradition in which pitch relationships are arbitrary intervals learned by ear ratherthan exact mathematical relationships [9]. Even the added convention of “half-sharps” and“half-flats” does not fully describe the microtonal intonation of Arabic music. By mappingmaqamat onto the Western system of notation (the staff) and intonation (equal tempera-ment), distinguishing features of the maqamat are lost. For example, the ratio of E to theC is distinct for maqam Rast and maqam Bayati. In Western notation, both intervals weremapped to a “neutral third” of E to C, with no distinction.
The discretized nature of Western music notation is an issue for Western music, as wellas non-Western music. Western musicians are expected to shape intonation away from equaltemperament when appropriate. For example, the leading tone may be played sharp, orthirds may be tuned in just intonation [10]. Despite this expectation, the score does notprovide instructions for intonation beyond equal temperament.
Using discrete, named notes used to describe intonation certainly has its advantages.Discrete tuning systems are extremely useful because they allow a scale or musical idea tobe standardized and easily expressed as a series of notes. There is a fundamental trade-offbetween the resolution of the measurement system and its simplicity. Sometimes, it makessense to use a low-resolution discrete sizing system for the sake of simplicity. For instance,drinks at a fast food restaurant come in small, medium and large rather than a continuousspectrum of sizes. Other times, however, a continuous sizing system is necessary. Theamount of a chemical fluid needed for a precise experiment is not simply small, medium orlarge. In this case, a graduated cylinder may be appropriate. In order to obtain the correctresults, a high degree of precision—on a continuous measurement scale—is required.
In the case of music, sharps and flats add to the complexity (and resolution) of the basicmeasurement system containing only the notes A, B, C, D, E, F and G. For Arabic music,the resolution can be extended to quarter-tones with half-sharps and half-flats. However,this is still an inadequate system for describing the maqam. To fully capture the nature ofArabic music, a continuous perspective of intonation is necessary. Even then, intonation willhave a temporal dependence on the musical context.
10.2.1 aural versus written traditionsWhile Western musicians learn music by reading notes from a score, Arabic musicians
learn by ear. From this perspective, it is not surprising that Western music performance tendsto use discrete and fixed intervals while Arabic music uses much more flexible and continuousintonation. Whether the learning style leads to the tuning style, or the other way around,is hard to guess. The use of instruments with discrete pitches in Western music, like thepiano, certainly forces performance in the direction of discrete intonation. The adoptionof keyboard instruments and Western notation into Arabic music may threaten the flexible

68
and continuous style of intonation that give maqam music a unique and extremely expressivesound.
10.2.2 uncertainty: a quantum physics analogyBecause it is convenient (for transposition and analysis) to have an equal-temperament
system, some theories for maqam music use equal temperament of a large number of toneswhich give resolution better than even quarter tones (24 tone equal temperament). Thesemodels may use 54 (or more) tones in an equal tempered scale [9]. At this point, it seemsthat the central problem is not truly being addressed. The intonation of a single note in amaqam fluctuates by much more than 1/54 of an octave, and precisely for this reason the54 tone equal temperament cannot describe a maqam. The maqam is simply more than adiscrete set of intervals.
Given the concept of scatter (the statistical variance of each note’s tuning), a maqammight be described as a discrete set of intervals with a probability distribution around eachinterval. However, this suggests that the intonation of the note is performed randomly tocreate a probability distribution. In fact, the variance in intonation is not random at all. Itis very intentional and depends on musical context.
Therefore, there seems to be an uncertainty principle in the intonation of Arabic music.Attempting to pin down a note’s exact tuning with more and more precision distancesthe model from the melodic line, the before and after, the musical phrase where the noteactually occurs. By focusing completely on finding the frequency (position) of a singleevent, the bigger picture of the musical direction (momentum) is completely lost. It is moreinformative to retain an idea of the melodic line as well as a looser description of the positionof a single note. Essentially, the approach in this paper was to retain some musical contextin the analysis of intonation by taking a sequence of notes as the elementary building blockof music.
10.3 The Origins of ScalesOne finding of this study was that Chinese intonation is primarily based on intervals with
high degrees of tonal consonance, while Arabic intonation relies on small intervals with lessconsonance. Western intonation uses a combination of both types of intervals. This raisesthe question of how scales and intonation patterns are developed Huron [34] suggests thatWestern scales originated from the desire to maximize tonal consonance, but their continueduse throughout history is a result of their familiarity and “cultural inertia” [34]. Many factorscan influence the development of musical cultures and traditions. It seems unlikely that anyperceptual or mathematical model can predict universal principles of intonation across allmusical cultures.
10.3.1 Music Is More Than PitchMusic is much more than a series of frequencies in time. In Section 4.2.2, a Matlab script
created an audio file using the extracted frequency versus time information. The computer-recreation accurately recreated the pitches in the piece, but did not sound like the original

69
piece or even like music at all. Pitch is just one element of music. Without rhythm, tonecolor, dynamics, articulation and phrasing, the pitch does not really sound like music. Thus,studying intonation only gives us a glimpse at one aspect of how radically distinct the musicof other cultures can be. Analysis of rhythm, form, or any number of other aspects of musiccould provide new insights into the differences between musical traditions.
Even within the realm of pitch, this research suggests that intonation is a rich and com-plex feature of music. Recreation of the equal temperament notes indicated on a score isjust the beginning of intonation in Western music, and hardly even a beginning for Arabicmusic. A computer program “performing” music from an electronic score would most likelyplay notes according to their equal temperament values. In advanced notation programs likeSibelius, the specific tuning of a note can be adjusted manually. However, for the computerto make informed choices about intonation would require an understanding of the manyfactors a musician automatically considers while performing. These include musical context,stylistic conventions for the composer, an understanding of the intonation’s aesthetic andmost importantly an emotional intention for the musical phrase. A human musical perfor-mance is influenced by many factors and shaped by the performer’s own personality. Whilecomputers may eventually be able to model many of the factors that influence intonation,it is the complex and spontaneous emotional aspect of musical performance that is difficultto recreate, but ever present in live music.
10.4 Further ResearchIn many ways, this research has only touched the surface of the problem of modeling
intonation in non-Western (and Western) musical cultures. The concept of avoiding discreteintonation and focusing on contextual, relative intonation in the form of musical words maybe useful in applications beyond this paper. This research used a limited data set for analysis,and could benefit from analysis of a larger body of music. Additionally, certain aspects ofthe analysis such as the root finding algorithm were built from scratch for simplicity, butmore advanced algorithms could be more accurate and efficient. For example, the YIN rootfinding algorithm [45] may be more accurate than the algorithm used in this research forfinding fundamental frequencies in an audio recording. Increased accuracy or increased timeresolution could lead to better transcription, finding more words and words longer than threesyllables.
This research only analyzed words with three syllables, because the number of extractedreoccurring words with four or more syllables was small, even for large samples of music.However, given large enough sample sizes, analysis of words with more than three syllablescould give new insight into the intonation and melodic shapes used in different cultures.
Only Arabic music and some Chinese music were analyzed in this study. There are manymusical cultures whose intonation systems are radically different from anything in Westernand Arabic music, and which may require new forms of analysis. Also, once vocabularies areextracted, there are many possible ways to analyze and compare them. Creating histogramsof words was just one approach for trying to understand the characteristics of intonationin each genre. Principal Component Analysis of the vocabularies was used to graph thevocabularies of pieces from the three cultures examined, but did not show any separation

70
between the cultures. Other approaches to visualizing and comparing vocabularies may yieldinteresting results.

71
Appendices

72
Appendix A
Human Hearing: From PressureWaves to Neural Signals
This appendix provides an introduction to the way humans hear physical events as sound.It is intended for readers who are not familiar with the process of hearing. The summaryhighlights the aspects of hearing that are important to understand in the context of harmonyperception.
IntroductionSound is a construct of the mind. Outside of the brain, what we refer to as “sound”
is simply energy propagating as a pressure wave. The ears transform the energy into asignal that the brain interprets as sound. The mind pays attention to many attributes ofthe signal—such as the frequency (oscillations per second of the pressure wave), amplitude(magnitude or strength of the pressure wave), and envelope (how the sound’s volume beginsand decays over time).
There are constantly many sources of sound around us, and we hear them as distinctentities. The music playing in the background, the voice of a person, the buzz of an air con-ditioner, and the chirping of birds sound as separated and unrelated to us as they are in reallife. Incredibly, everything we hear is actually captured as a single waveform superimposingall of the signals from around us (Figure A.1). The mind must take this single stream ofinformation and separate it into the distinct sources from the world. This decoupling andparsing of an audio stream is a fascinating ability which present day computers can onlymimic at a rudimentary level [e.g. 46].
Physical waves are transformed into neural signals in six stages:1. Sound moves through air as pressure waves2. The pinna collects sound waves3. The tympanic membrane is vibrated by pressure changes4. Mechanical motion is amplified and transmitted through the inner ear5. The cochlear membrane is stimulated according to specific frequencies6. Hair cells in the cochlea send a neural signal to the brain
This document will describe each of these stages. Figure A.2 shows the parts of the outer,middle and inner ear. The six stages progress through the diagram from left to right.

73
Figure A.1: The brain recreates real-world sources of sound from a single stream of infor-mation.
Parts of the Ear
Pinna
Outer Ear Inner EarMiddle Ear
Figure A.2: Parts of the outer, middle and inner ear. Adapted from [47].

74
PressureAir particles
Sound Propogates as a Pressure Wave
IncreasingPressure
Figure A.3: In the real world, sound exists as pressure waves. The dots represent particlesmoving closer together (high pressure) and further apart (low pressure).
Sound in the WorldStage 1: Sound moves through air as pressure waves
In the world, ‘sound’ exists as longitudinal pressure waves propagating through a phys-ical medium. Humans interpret the frequency of the wave as pitch, and the amplitude asloudness. Figure A.3 shows how particles move as a sound wave propagates.
Sound in the Outer EarStage 2: The pinna collects sound waves
The part of the ear you can see, the outer ear, is called the pinna. The pinna is essentiallya cone that captures sound waves and sends them into the middle ear. The shape of the pinnahelps to capture sounds from all around us, but also helps us distinguish which direction asound came from. People can hear pitches from 20 Hz to 20kHz, but the pinna is especiallyeffective for sounds in the frequency range of the human voice.
Sound in the Middle earIn the middle ear, pressure waves in air are transformed into mechanical motion. Use
Figure A.2 as a visual reference for the parts of the middle ear.
Stage 3: The tympanic membrane is vibrated by pressure wavesPressure fluctuations in the external auditory canal reach the tympanic membrane (the
eardrum). The eardrum is a membrane in the middle ear which vibrates in response topressure waves.

75
Figure A.4: On the basilar membrane, frequency scales logarithmically with distance.
Stage 4: Mechanical motion is amplified and transmittedOn the inner side of the eardrum are the three smallest bones in the human body:
the malleus, incus and stapes. These bones act as levers, mechanically transmitting thevibrations of the eardrum to the end of the stapes. The stapes is attached to anothermembrane called the oval window. The mechanical advantage of the three-bone lever systemcomes from their tiny size: the cross-sectional area of the stapes is much smaller than thearea of the eardrum, and transmits twenty-two times the pressure. Thus, the middle eartransmits and amplifies the mechanical vibrations picked up from the environment.
Sound in the Inner EarIn the inner ear, the mechanical oscillations of the stapes are parsed into specific frequen-
cies and sent to the brain as electrical signals.
Stage 5: The cochlear membrane is stimulated according to specificfrequencies
When the stapes pushes on the oval window, fluid inside a spiral-shaped cavity called thecochlea is compressed. The cochlea takes the time-domain signal and transforms it into thefrequency domain, creating an amplitude versus frequency signal. This may sound exactlylike a Fourier transform, because it is. The mechanism is easier to understand if you take thecochlea (usually rolled up in a spiral) and unroll it. The frequency-sensitive strip is calledthe basilar membrane. Each position along the length of the basilar membrane has a specificresonant frequency. The resonant frequency is logarithmically proportional to position, sothat moving a constant distance along the basilar membrane will multiply the resonantfrequency by a constant factor. For example, in Figure A.4 the distance ‘d’ corresponds toa doubling of the resonant frequency on the basilar membrane. The ability of the ear toanalyze sound in the frequency domain is essential to understanding human perception ofmusic.
76
Stage 6: Hair cells in the cochlea send a neural signal to the brainWhen fluid in the cochlea resonates, the part of the cochlear membrane with the correct
resonant frequency will resonate sympathetically. The vibrations stimulate nearby special-ized cells on the cochlea called “hair cells,” which send an electrical signal to the brain. Theamplitude of the vibrations will determine the strength of the neural signal. Hair cells invarious locations on the cochlea are constantly firing, creating a flow of information to thebrain. After this, the brain interprets these signals as sounds.
OverviewThe process of hearing is fascinating and useful to study. For every noise humans hear,
pressure waves from the surroundings are captured, transformed into mechanical vibrations,then transformed into frequency-dependent electrical signals. The mechanisms by which thebrain interprets these signals are complex and not well understood, and are beyond the scopeof this report. However, understanding the physical and physiological nature of hearing givesinsights into human perception of sound. For example, the logarithmic organization of basilarmembrane explains the logarithmic perception of pitch, and the exact characteristics of itsstimulation can be useful for studying the quality of harmony Helmholtz calls roughness.The mechanical solutions life has developed for accurately translating and transforming awide range of frequencies are some of the most incredible biological systems. Understandingthe process of hearing is invaluable for studying music perception.

77
Appendix B
Whole Number Ratio Algorithm
The following algorithm presented by Stolzenburg [33] approximates a rational numberx as a ratio of integers a/b, with maximum relative deviation (error) d. It is written inpseudocode.
xmin = (1− d)x;xmax = (1 + d)x;al/bl = floor(x)/1;ar/br = (floor(x) + 1)/1;loopam/bm = (al + ar)/(bl + br);if xmin�am/bm�xmax then
return am/bm;else if xmax < am/bm thenk = floor((ar − xmaxbr)/(xmaxbl − al));am/bm = (ar + kar + kbl);
ar/br = am/bmelse if am/bm < xmin then
k = floor((xminbl − al)/(ar − xminbr));am/bm = (al + kar)/(bl + kbr);al/bl = am/bm
end ifend loop

78
Appendix C
Works Cited: Music Recordings
Aal, Bashir Abdel, perf. SAUDI ARABIA Bashir Abdel Al: The Art of the Arabian Flute -The Nay. Naxos Digital Services US Inc., 1998. CD.
Anthology of World Music: China. Rounder, 1998. CD.“Arabic Maqam World.” Arabic Maqam World. N.p., n.d. Web. 2 Feb. 2017.Bach, Jo Sebastian. The 6 Unaccompanied Cello Suites Complete. Perf. Yo-Yo Ma. Yo-Yo
Ma. Masterworks, 2010. CD.Bach, Johann Sebastian. Bach: Cello Suites. Perf. Mstislav Rostropovich. Mstislav Ros-
tropovich. EMI Classics, 1955. CD.Bach, Johann Sebastian. Bach, J.S.: Cello Suites Nos. 1-6 (Maisky). Perf. Mischa Maisky.
Naxos Digital Services US Inc., 1994. CD.Bach, Johann Sebastian. Brandenburg Concertos. Perf. Max Pommer. New Bach Collegium
Musicum Leipzig. Naxos Digital Services US Inc., n.d. CD.Bach, Johann Sebastian. Hilary Hahn Plays Bach. Perf. Hilary Hahn. Sony, 1997. CD.Bach, Johann Sebastian. The World’s Greatest Masterpieces: Johann Sebastian Bach. Perf.
Marga Scheurich-Henschel. Southwest-Studio Orchestra. Madacy, 1999. CD.Beethoven, Ludwig Van, Ann Murray, René Pape, Lucia Popp, Anthony Rolfe Johnson, and
Klaus Tennstedt. BEETHOVEN, L. Van: Symphony No. 9, “Choral” (Popp, Murray,Rolfe-Johnson, Pape, London Philharmonic Choir and Orchestra, Tennstedt). NaxosDigital Services Ltd., 2009. CD.
Beethoven, Ludwig Van. BEETHOVEN, L. Van: Piano Concerto No. 1. Naxos DigitalServices US Inc., 2014. CD.
Beethoven, Ludwig Van. BEETHOVEN: Symphony No. 5 and 6. Naxos Digital ServicesUS Inc., 2002. CD.
Brahms, Johannes. SYMPHONIE N °I EN UT MINEUR OP

79
Appendix D
Listening Tracks
The tracks listed below are included as multimedia content to accomapny this paper.Tracks 00-05 were created by the author. All other audio files are from Maqamworld [17].
Tones, Intervals and Scales[00] Minor Second Interval (piano)[01] Perfect Fifth Interval (piano)[02] C Major Scale (piano)[03] C Minor Scale (piano)[04] Pure (sine) tone, 440 Hz[05] Violin ‘A,’ 440 Hz[06] Maqam Rast on C (oud)[07] Maqam Bayati on C (buzuq)[08] Maqam Sikah on E half flat (violin)
Arabic Music Selections[10] Shaheen, Simon. Maqam Nahawand. “Taqsim on oud.”[11] Bey, Sami. Maqam Ajam. “Samai Ajam.”[12] Maqam Bayati: Fairuz. “Ya Rayt Minhoun.” Fairuz Sings Philemon. Voix De L’Orient,1993. CD.[13] Makam Sikah: Abraham Salman. Taqsim Qanun on Rast. NADA Records, 1997. CD.[14] Maqam Rast: Darwish, Sayyed. “Muwashah ya Eudhaib.” Orientalia collection: muwashah& songs. Usek, 1993. CD.

80
Bibliography
[1] Inbal Shapira Lots and Lewi Stone. Perception of musical consonance and dissonance:an outcome of neural synchronization. Journal of The Royal Society Interface, 5(29):1429–1434, 2008. ISSN 1742-5689. doi: 10.1098/rsif.2008.0143. URL http://rsif.royalsocietypublishing.org/cgi/doi/10.1098/rsif.2008.0143.
[2] Lienhard. Ancient Chinese Bells, 2002. URL http://www.uh.edu/engines/epi1676.htm.
[3] Rudolf Rasch. Tuning and temperament. In The Cambridge History of Western MusicTheory, chapter 7. Cambridge University Press, 2006.
[4] Frieder Stolzenburg. Harmony perception by periodicity and granularity detection. InProceedings of 12th International Conference on Music Perception and Cognition and8th Triennial Conference of the European Society for the Cognitive Sciences of Music,volume 29, pages 958–959, 2012.
[5] Norman D Cook and Takashi X Fujisawa. The Psychophysics of Harmony Perception:Harmony is a Three-Tone Phenomenon. Empirical Musicology Review, 1(2):106–126,2006.
[6] William Hutchinson and Leon Knopoff. The acoustic component of western consonance.Swets & Zeitlinger, Amsterdam, 1978.
[7] Akio Kameoka and Mamoru Kuriyagawa. Consonance Theory Part II : Consonance ofComplex Tones. Journal of the Acoustical Society of America, 1969.
[8] Kamraan Z Gill and Dale Purves. A Biological Rationale for Musical Scales. PLoSONE, 4(12), 2009. doi: 10.1371/journal.pone.0008144.
[9] Sami Abu Shumays. The Fuzzy Boundaries of Intonation in Maqam: Cognitive andLinguistic Approaches. 2009.
[10] Ross W. Duffin. How equal temperament ruined harmony (and why you should care).2007. ISBN 0393075648.
[11] Frieder Stolzenburg. A PERIODICITY-BASED APPROACH ON HARMONY PER-CEPTION INCLUDING NON-WESTERN SCALES. 2010.
[12] Hermann von Helmholtz and A. J. Ellis. On the sensations of tone as a physiologicalbasis for the theory of music. New York: Dover Publications, 1954.
81
[13] Phil N. Johnson-Laird, Olivia E. Kang, and Yuan Chang Leong. On Musical Dissonance.Music Perception: An Interdisciplinary Journal, 30(1):19–35, 2012. ISSN 07307829. doi:10.1525/mp.2012.30.1.19.
[14] David Huron. Tonal Consonance versus Tonal Fusion in Polyphonic Sonorities. Source:Music Perception An Interdisciplinary Journal, 9(2):135–154, 1991.
[15] Steven G. (Steven Geoffrey) Laitz. The complete musician : an integrated approach totonal theory, analysis, and listening. Oxford University Press, 2012. ISBN 0199742782.
[16] David Huron. Interval-Class Content in Equally Tempered Pitch-Class Sets: CommonScales Exhibit Optimum Tonal Consonance. Music Perception, 11(3):289–305, 1994.
[17] Maqam World, 2007. URL maqamworld.com.
[18] Saed Muhssin. Some Notes on harmony, 2007. URL http://www.saedmuhssin.com/harmony.html.
[19] Joseph Needheam, Wang Ling, and Lu Gwei-Djen. Science and civilisation in China.Physics and physical technology, 4:563, 1971. ISSN 0717-6163. doi: 10.1007/s13398-014-0173-7.2.
[20] Roger Kamien. Music: An Appreciation. McGraw Hill, New York, 2008. ISBN 978-0-07-340134-8.
[21] Richard Parncutt and Graham Hair. Consonance and dissonance in music theory andpsychology: Disentangling dissonant dichotomies. Journal of Interdisciplinary MusicStudies, 5(2):119–166, 2011. doi: 10.4407/jims.2011.11.002.
[22] Keith Mashinter. Calculating Sensory Dissonance: Some Discrepancies Arising from theModels of Kameoka & Kuriyagawa, and Hutchinson & Knopoff. Empirical MusicologyReview, 2006.
[23] Johann Joseph Fux and Alfred Mann. The study of counterpoint : from Johann JosephFux’s Gradus ad parnassum. W.W. Norton, 1971. ISBN 0393002772.
[24] Christopher Hasty. Segmentation and Process in Post-Tonal Music. Music TheorySpectrum, 3(Spring):54–73, 1981.
[25] Richard Parncutt. Commentary on ”Calculating Sensory Dissonance: Some Discrepan-cies Arising from the Models of Kameoka & Kuriyagawa, and Hutchinson & Knopoff”.Empirical Musicology Review, 1(2):65–84, 2006. ISSN 1559-5749.
[26] R. Plomp and W. J. M. Levelt. Tonal Consonance and Critical Bandwidth. TheJournal of the Acoustical Society of America, 38(4):548–560, 1965. ISSN 00014966. doi:http://dx.doi.org/10.1121/1.1909741.
[27] James K. Wright and Albert S. Bregman. Auditory stream segregation and the controlof dissonance in polyphonic music. Contemporary Music Review, 2(1):63–92, 1987.

82
[28] Mark Ballora. The Science of Music. Cognella Academic Publishing, 2003.
[29] Akio Kameoka and Mamoru Kuriyagawa. Consonance Theory, Part I. Journal of theAcoustical Society of America, 1969.
[30] Josh H McDermott and Andrew J Oxenham. Music perception, pitch, and the auditorysystem. Current opinion in neurobiology, 18(4):452–63, aug 2008. ISSN 0959-4388. doi:10.1016/j.conb.2008.09.005.
[31] Josh H McDermott, Alan F Schultz, Eduardo A Undurraga, and Ricardo A Godoy.Indifference to dissonance in native Amazonians reveals cultural variation in music per-ception. Nature Publishing Group, 535(7613):547–550, 2016. ISSN 0028-0836. doi:10.1038/nature18635.
[32] Marion Cousineau, Josh H McDermott, and Isabelle Peretz. The basis of musical con-sonance as revealed by congenital amusia. Proceedings of the National Academy ofSciences of the United States of America, 109(48):19858–63, nov 2012. ISSN 1091-6490.doi: 10.1073/pnas.1207989109.
[33] Frieder Stolzenburg. Harmony Perception by Periodicity Detection. Journal of Mathe-matics and Music, 9(March 2013):37–41, 2015. doi: 10.1080/17459737.2015.1033024.
[34] David Brian Huron. Sweet Anticipation: Music and the Psychology of Expectation- David Brian Huron - Google Books. MIT Press, Cambridge, MA, 2006. ISBN0262083450.
[35] G Langner, M Sams, P Heil, and H Schulze. Frequency and periodicity are represented inorthogonal maps in the human auditory cortex: evidence from magnetoecephalography.J. Comp. Physiol. A., 181(6):665–676, 1997.
[36] Greg Hunter. Arabic Tone System. URL https://dubsahara.wordpress.com/maqam/overview/.
[37] Simon Shaheen. Turath. CMP Records, 1992.
[38] Barış Bozkurt, Ozan Yarman, M. Kemal Karaosmanoğlu, and Can Akkoç.Weighing Diverse Theoretical Models on Turkish Maqam Music Against PitchMeasurements: A Comparison of Peaks Automatically Derived from Fre-quency Histograms with Proposed Scale Tones. Journal of New Music Re-search, 38(1):45–70, 2009. doi: 10.1080/09298210903147673. URL http://www.tandfonline.com/action/journalInformation?journalCode=nnmr20http://dx.doi.org/10.1080/09298210903147673.
[39] Ozan Yarman, Edilen Ortak, and Bir Izgara. A Comparative Evaluation of Pitch Nota-tions in Turkish Makam Music. Journal of Interdisciplinary Music Studies, 1(2):43–61,2007.
[40] Albert Cohen. A History of Consonance and Disonance. Music & Letters, 71(2):226–228,1990. URL http://www.jstor.org/stable/736439.

83
[41] Dalia Cohen and Ruth Katz. Palestinian Arab Music: A Maqam Tradition in Practice.University of Chicago Press, 2004. ISBN 9780226112992.
[42] Sami Abu Shumays. Maqamlessons.com, 2013. URL http://maqamlessons.com/.
[43] Zhang Tasen. Spring On A Moonlit River. In Phases Of The Moon: Traditional ChineseMusic. CBS Records, 1981.
[44] Johann Sebastian Bach, Christiane Jaccottet, Dubravka Tomsic, Georg Egger, GunterHoller, and Marga Scheurich-Henschel. The World’s Greatest Masterpieces: JohannSebastian Bach. Madacy, 1999.
[45] Alain De, Cheveignéhideki Kawahara, Alain De Cheveigné, and Hideki Kawahara. YIN,a fundamental frequency estimator for speech and music. The Journal of the AcousticalSociety of America, 111(43), 2002. doi: 10.1121/1.1458024�.
[46] Erich Schroger, Alexandra Bendixen, Susan L Denham, Robert W Mill, @bullet Tamás,Ohm @bullet, and István Winkler. Predictive Regularity Representations in Vio-lation Detection and Auditory Stream Segregation: From Conceptual to Computa-tional Models. Brain Topography, (Special issue: Mismatch Negativity), 2013. doi:10.1007/s10548-013-0334-6.
[47] Brockmann Chittka. A diagram of the anatomy of the human ear, feb 2009. URLhttps://en.wikipedia.org/wiki/File:Anatomy_of_the_Human_Ear_en.svg.

Academic Vita Sam Lapp
[email protected] samlapp.com
Objective Seeking a job where I can use my technical skills and hands-on project experience to help push the boundaries of human innovation and exploration
Education B.S. in Engineering Science May 2017 The Pennsylvania State University, Schreyer Honors College
Experience
Front-end Developer Summer 2016 Human Computer Interaction Department Carnegie Mellon University
Explored computational analogies for research papers Built user interfaces to explore research analogies
Internet of Things Programmer Summer 2015 Wipro Technologies Bangalore, India
Developed a flexible, generic parser for processing data Built a graphical interface to control the parser
Virtual Reality Remote Driving Researcher Summer 2015 OPEN Design Lab Penn State University
Explored possibility of virtual reality for driving vehicles Integrated Oculus Rift virtual reality with remote driving systems
Projects Thesis in Engineering Science and Music Spring 2016-present Examining tuning systems of non-Western culture Evaluating computational models for predicting perception of dissonance
Helping Hand: Biomechanics Design Project Spring 2014 Designed a glove to restore function to customer’s injured hand Optimized mechanical and aesthetic properties for real-world use
Chosen as best design by the customer
LightMood: Smart-home Design Project Spring 2014 Smart-home lighting system to treat Seasonal Affective Disorder Awarded “Most Innovative Design” at Design Showcase
Leadership
Founder, Vice-President Music Therapy Club 2014-2015 President Jazz Club 2014-2015
Honors Matthew George Workman Scholarship in ESM Vernon H. Neubert Dynamics Award in ESM The Evan Pugh Scholar Junior Award The Provost Award for Academic Excellence
Courses Fluid Mechanics Skills C++ Thermodynamics & Heat Transfer Java Mechanics: Statics, Dynamics & SOM MatLab Electronic Properties of Materials HTML Wave, Quantum & Particle Physics JavaScript