
Modeling infection spread and behavioral change using spatial games
13
AUTHOR COPY ORIGINAL ARTICLE Modeling infection spread and behavioral change using spatial games Songnian Zhao 1 , John Wu 1 and David Ben-Arieh 1 1 Department of Industrial and Manufacturing Systems Engineering, Kansas State University, Manhattan, U.S.A. Correspondence: David Ben-Arieh, Department of Industrial and Manufacturing Systems Engineering, Kansas State University, 2016 Durland Hall, Manhattan, KS 66506, U.S.A. Tel.: +785-532-3724; Fax: +785 532-3738; E mail: [email protected] Received: 20 December 2012 Revised: 8 December 2013 2nd Revision: 16 June 2014 3rd Revision: 10 July 2014 4th Revision: 15 August 2014 Accepted: 18 August 2014 Abstract This paper presents a methodology that combines information transmission, contact networks, and changes of human behaviors in modeling the dynamics of infectious diseases. The methodology presented is based on a spatial evolutionary game with additional information representing human behavior. This approach is used to model the transmission process of infectious disease, which emphasizes the human response and information transmission in a social context. It combines the advantages of evolutionary game theory with modeling the spontaneous changes of human behaviors based on the balance of benefits and costs. The model assumes rational participants who use information acquired to make individual decisions. This novel modeling approach shows the global spread of infection considering an individual human behavior. Health Systems advance online publication, 3 October 2014; doi:10.1057/hs.2014.22 Keywords: spatial game; infectious disease; human behavior; SIR model Introduction When an infectious disease spreads out into communities, individuals may alter their behavior to protect themselves from becoming infected. Such changes include improvement of personal hygiene, taking antiviral medi- cine, voluntary social distancing, voluntary vaccination, and other protec- tive measures. As an example, the outbreak of the SARS epidemic in 2003 caused many people to change their behaviors by taking several preventative measures (Lau et al, 2003; Tan et al, 2004). Several studies have been conducted in order to understand how these spontaneous behavioral changes help mitigate the spread of infection. Funk et al (2010) reviewed the recent work on the influence of human behavior on the spread of infectious diseases, including using game theory to study the human response to epidemics. Reluga (2010) constructed a differential game to study the benefit of social distancing behaviors. Another differential model showing that changes to human behaviors significantly impact the spread of epidemics was proposed by Poletti et al (2011). To model the spontaneous changes of human behavior, the susceptible individuals were assumed to adopt two mutually exclusive behaviors, normal and altered, based on the perceived risk of infection. Reluga et al (2006), in an epidemiological game examining voluntary vaccination, claimed that dis- ease eradication is hard to achieve by voluntary vaccination in a homo- geneous population. All three models considered only the case of a well- mixed population and failed to indicate the importance of contact structure. However, a heterogeneous and spatially structured population can be more successful when a social contact network is incorporated into the model (Perisic & Bauch, 2009; Van Segbroeck et al, 2010; Sahneh & Scoglio, 2011). Health Systems (2014), 1–13 © 2014 Operational Research Society Ltd. All rights reserved 2047-6965/14 www.palgrave-journals.com/hs/
Transcript of Modeling infection spread and behavioral change using spatial games
A
UTHOR COPY
ORIGINAL ARTICLE
Modeling infection spread and behavioralchange using spatial games
Songnian Zhao1, John Wu1
and David Ben-Arieh1
1Department of Industrial and ManufacturingSystems Engineering, Kansas State University,Manhattan, U.S.A.
Correspondence: David Ben-Arieh,Department of Industrial and ManufacturingSystems Engineering, Kansas State University,2016 Durland Hall, Manhattan, KS 66506,U.S.A.Tel.: +785-532-3724;Fax: +785 532-3738;E mail: [email protected]
Received: 20 December 2012Revised: 8 December 20132nd Revision: 16 June 20143rd Revision: 10 July 20144th Revision: 15 August 2014Accepted: 18 August 2014
AbstractThis paper presents a methodology that combines information transmission,contact networks, and changes of human behaviors in modeling the dynamicsof infectious diseases. The methodology presented is based on a spatialevolutionary game with additional information representing human behavior.This approach is used to model the transmission process of infectious disease,which emphasizes the human response and information transmission in a socialcontext. It combines the advantages of evolutionary game theory with modelingthe spontaneous changes of human behaviors based on the balance of benefitsand costs. The model assumes rational participants who use informationacquired to make individual decisions. This novel modeling approach showsthe global spread of infection considering an individual human behavior.Health Systems advance online publication, 3 October 2014;doi:10.1057/hs.2014.22
Keywords: spatial game; infectious disease; human behavior; SIR model
IntroductionWhen an infectious disease spreads out into communities, individuals mayalter their behavior to protect themselves from becoming infected. Suchchanges include improvement of personal hygiene, taking antiviral medi-cine, voluntary social distancing, voluntary vaccination, and other protec-tive measures. As an example, the outbreak of the SARS epidemic in 2003causedmany people to change their behaviors by taking several preventativemeasures (Lau et al, 2003; Tan et al, 2004).Several studies have been conducted in order to understand how these
spontaneous behavioral changes help mitigate the spread of infection. Funket al (2010) reviewed the recent work on the influence of human behavior onthe spread of infectious diseases, including using game theory to study thehuman response to epidemics. Reluga (2010) constructed a differential gameto study the benefit of social distancing behaviors. Another differentialmodel showing that changes to human behaviors significantly impact thespread of epidemics was proposed by Poletti et al (2011). To model thespontaneous changes of human behavior, the susceptible individuals wereassumed to adopt two mutually exclusive behaviors, normal and altered,based on the perceived risk of infection. Reluga et al (2006), in anepidemiological game examining voluntary vaccination, claimed that dis-ease eradication is hard to achieve by voluntary vaccination in a homo-geneous population. All three models considered only the case of a well-mixed population and failed to indicate the importance of contact structure.However, a heterogeneous and spatially structured population can be moresuccessful when a social contact network is incorporated into the model(Perisic & Bauch, 2009; Van Segbroeck et al, 2010; Sahneh & Scoglio, 2011).
Health Systems (2014), 1–13© 2014 Operational Research Society Ltd. All rights reserved 2047-6965/14
www.palgrave-journals.com/hs/
A
UTHOR COPY
Hence, the combination of a spatially contact structurewith spontaneous behavior changes is believed to be anappropriate way to improve the existing models.These works related to spontaneous changes of human
behaviors emphasize a key concept – the balance ofbenefits and costs from such changes. Assuming rational-ity and self-interest, people make decisions based on theinformation they receive about a disease. Hence, informa-tion transmission and individuals’ perception about theprevalence of infectious disease play crucial roles in thetradeoff between benefits and costs. To evaluate indivi-duals’ assessments of the prevalence of infectious diseasesbased on the information acquired, Chen (2009) intro-duced a social sampling method. This method allowsparticipants to make assessments based on partial informa-tion, instead of full information assumed by other models.However, this method also assumes that there is nocentralized dissemination of information regarding theprevalence of the disease. Funk et al (2009) studied theeffect of local information transmission in a social networkon epidemic outbreaks. The model was based on theauthor’s hypothesis that changes of human behavioraffected by the information transmission network canrestrict the spread of infectious diseases. Kiss et al (2010)developed a model that analyzed sexually transmittedinfections based on the information transmission. Thismodel illustrated how an active host population and thetransmission of information triggered by the disease caneradicate or minimize infection levels.Over the course of an epidemic, the spread patterns of a
disease could vary widely between the rural and metropo-litan areas due to population density and contact structurevariations between different areas. In addition, humanbehavior changes within a largely heterogeneous popula-tion group during the course of an epidemic could swaythe disease’s reproduction ratio (R0) over time, instead ofthe commonly assumed constant R0 for the underlyingdisease suggested in the majority the existing literature.The changes in human behavior or self-mitigation activ-ities are often driven by the current information availablethrough the media, propaganda, or from other individualswithin their community. The model presented in thisarticle includes these significant factors using a straightfor-ward spatial game structure. We assume that the un-infected population can make free will behavior changes,such as social distancing, self-quarantining, vaccination,taking preventive medicine, self-protection devices, and soon to reduce his or her chances to get infected. However,these behavior changes come with associated ‘costs’,including expenses, loss of income opportunities, costs ofinconveniences, and so on. Each individual also possessesdifferent perceptions of the information related to theongoing epidemic and decide to either do nothing or toengage in various actions to reduce his or her chances ofacquiring the disease.In this paper, we demonstrate a methodology that
combines the information transmission, contact net-works, and changes in human behavior with the dynamics
of an epidemic. The methodology uses a spatial evolution-ary game to model human behavior change and its impacton the transmission process of infectious disease. Thespatial game takes the location information into consid-eration when individuals balance their costs and benefits,that is, individuals in different locations may choosedifferent strategies based on their local and global situa-tions. Another advantage of adopting a spatial evolutionarygame is the convenience for studying the impact of local andglobal information. We assume that the impact of localinformation transmission is different from that of globalinformation transmission. Hence, it is beneficial to collectlocal as well as global information on which individuals basetheir decisions in a spatially structured population.The spatial evolutionary game is a combination of
classic game theory and cellular automaton, representingthe strategies, players, payoff function, structure of popu-lation, and an updating rule. This methodology can beused to analyze various structures of populations using aregular lattice (Nowak & May, 1992), scale-free networks(Santos et al, 2006), and real social networks (Lozano et al,2008). This concept requires an updating policy based onthe payoff function with different updating schemes suchas synchronous or asynchronous updates. Several com-mon updating schemes are reviewed by Newthi andCornforth (2007) and update rules are summarized byRoca et al (2009).The next section of this paper discusses a conceptual
model which relates the spatial game using informationtransmission to the spread of epidemics. Then a mathema-tical model is constructed in the following section, and asmall example and sensitivity analysis are shown in thesection after that. The penultimate section delineates thecalculations of the reproductive ratio (R0). A brief summaryis presented in the final section.
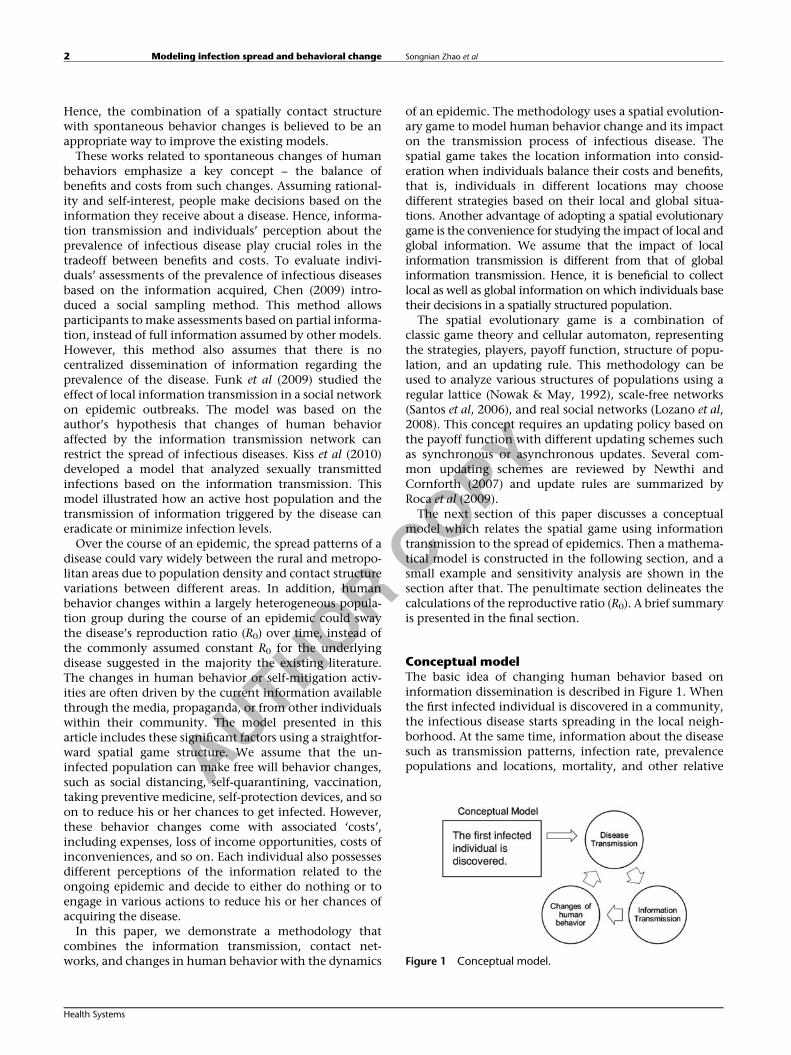
Conceptual modelThe basic idea of changing human behavior based oninformation dissemination is described in Figure 1. Whenthe first infected individual is discovered in a community,the infectious disease starts spreading in the local neigh-borhood. At the same time, information about the diseasesuch as transmission patterns, infection rate, prevalencepopulations and locations, mortality, and other relative
Figure 1 Conceptual model.
Modeling infection spread and behavioral change Songnian Zhao et al2
Health Systems
A
UTHOR COPY
information is spread through word-of-mouth or informalnetworks, reports in newspaper, on the radio, and TV, oronline. People start making decisions based on this infor-mation and some might take protective measures toprevent infection. Therefore, these behavior changesimpact the spread of underlying infectious diseases.To model the process of changes in human behaviors, a
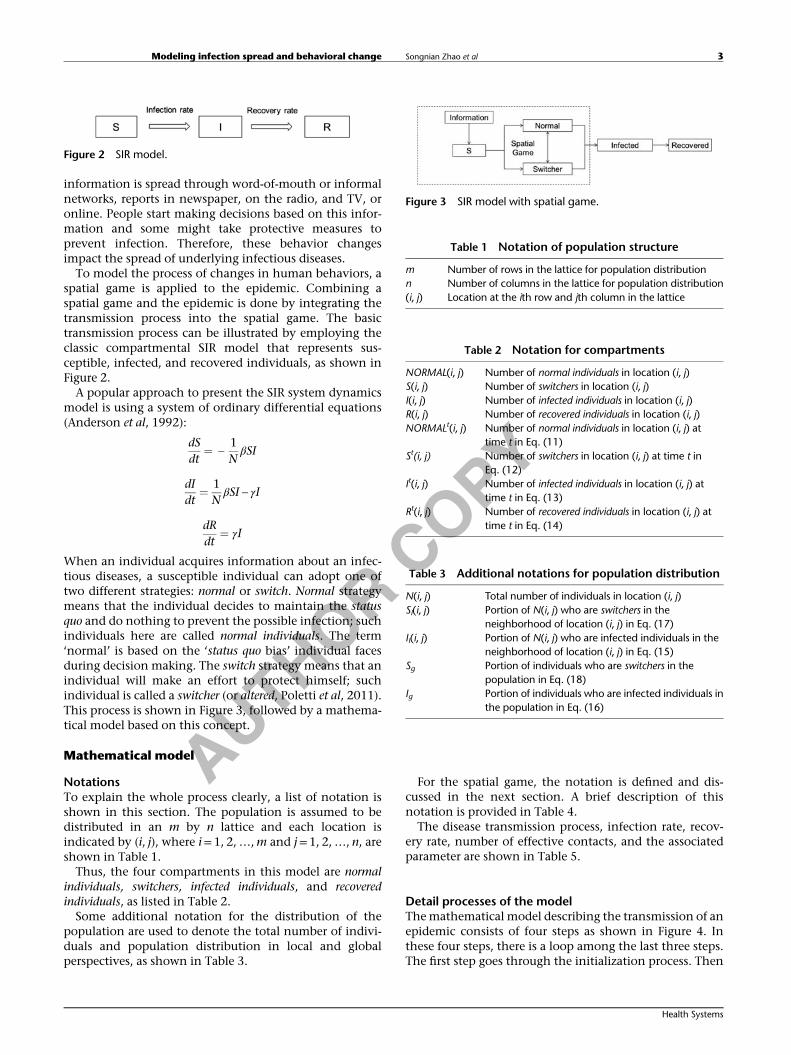
spatial game is applied to the epidemic. Combining aspatial game and the epidemic is done by integrating thetransmission process into the spatial game. The basictransmission process can be illustrated by employing theclassic compartmental SIR model that represents sus-ceptible, infected, and recovered individuals, as shown inFigure 2.A popular approach to present the SIR system dynamics
model is using a system of ordinary differential equations(Anderson et al, 1992):
dSdt
¼ -1NβSI
dIdt
¼ 1NβSI - γI
dRdt
¼ γI
When an individual acquires information about an infec-tious diseases, a susceptible individual can adopt one oftwo different strategies: normal or switch. Normal strategymeans that the individual decides to maintain the statusquo and do nothing to prevent the possible infection; suchindividuals here are called normal individuals. The term‘normal’ is based on the ‘status quo bias’ individual facesduring decision making. The switch strategy means that anindividual will make an effort to protect himself; suchindividual is called a switcher (or altered, Poletti et al, 2011).This process is shown in Figure 3, followed by a mathema-tical model based on this concept.
Mathematical model
NotationsTo explain the whole process clearly, a list of notation isshown in this section. The population is assumed to bedistributed in an m by n lattice and each location isindicated by (i, j), where i=1, 2,…,m and j=1, 2,…, n, areshown in Table 1.Thus, the four compartments in this model are normal
individuals, switchers, infected individuals, and recoveredindividuals, as listed in Table 2.Some additional notation for the distribution of the
population are used to denote the total number of indivi-duals and population distribution in local and globalperspectives, as shown in Table 3.
For the spatial game, the notation is defined and dis-cussed in the next section. A brief description of thisnotation is provided in Table 4.The disease transmission process, infection rate, recov-
ery rate, number of effective contacts, and the associatedparameter are shown in Table 5.
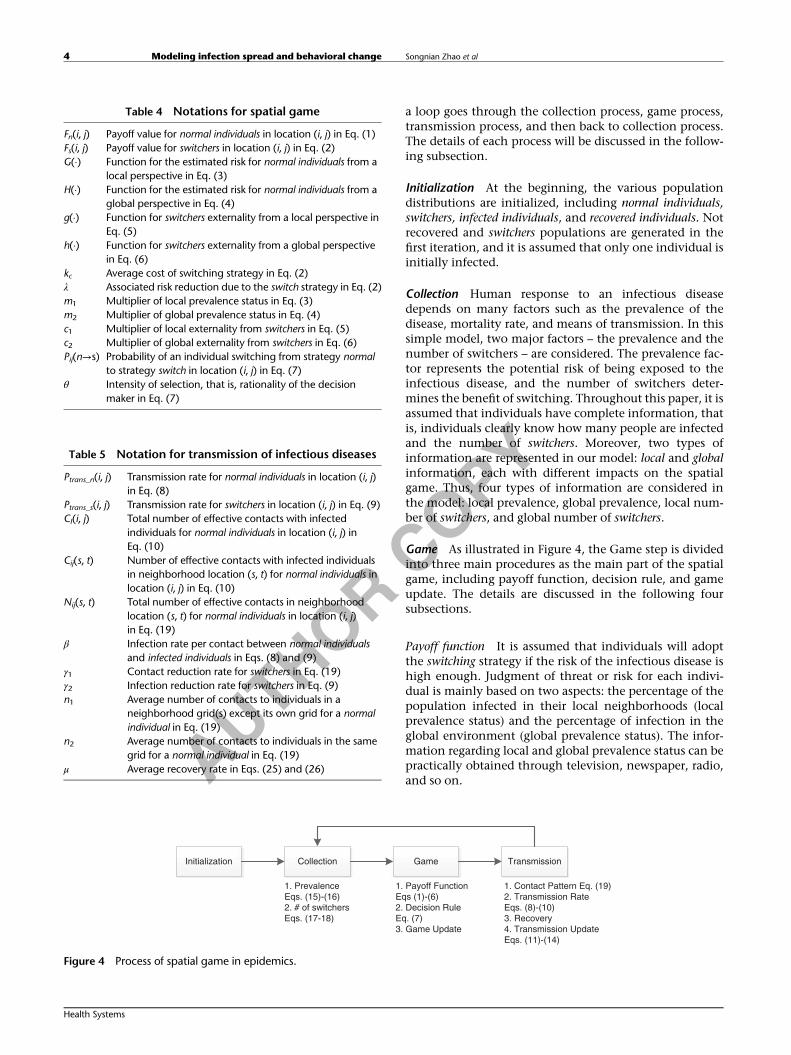
Detail processes of the modelThemathematical model describing the transmission of anepidemic consists of four steps as shown in Figure 4. Inthese four steps, there is a loop among the last three steps.The first step goes through the initialization process. Then
Figure 2 SIR model.
Figure 3 SIR model with spatial game.
Table 1 Notation of population structure
m Number of rows in the lattice for population distributionn Number of columns in the lattice for population distribution(i, j) Location at the ith row and jth column in the lattice
Table 2 Notation for compartments
NORMAL(i, j) Number of normal individuals in location (i, j)S(i, j) Number of switchers in location (i, j)I(i, j) Number of infected individuals in location (i, j)R(i, j) Number of recovered individuals in location (i, j)NORMALt(i, j) Number of normal individuals in location (i, j) at
time t in Eq. (11)St(i, j) Number of switchers in location (i, j) at time t in
Eq. (12)It(i, j) Number of infected individuals in location (i, j) at
time t in Eq. (13)Rt(i, j) Number of recovered individuals in location (i, j) at
time t in Eq. (14)
Table 3 Additional notations for population distribution
N(i, j) Total number of individuals in location (i, j)Sl(i, j) Portion of N(i, j) who are switchers in the
neighborhood of location (i, j) in Eq. (17)Il(i, j) Portion of N(i, j) who are infected individuals in the
neighborhood of location (i, j) in Eq. (15)Sg Portion of individuals who are switchers in the
population in Eq. (18)Ig Portion of individuals who are infected individuals in
the population in Eq. (16)
Modeling infection spread and behavioral change Songnian Zhao et al 3
Health Systems
A
UTHOR COPY
a loop goes through the collection process, game process,transmission process, and then back to collection process.The details of each process will be discussed in the follow-ing subsection.
Initialization At the beginning, the various populationdistributions are initialized, including normal individuals,switchers, infected individuals, and recovered individuals. Notrecovered and switchers populations are generated in thefirst iteration, and it is assumed that only one individual isinitially infected.
Collection Human response to an infectious diseasedepends on many factors such as the prevalence of thedisease, mortality rate, and means of transmission. In thissimple model, two major factors – the prevalence and thenumber of switchers – are considered. The prevalence fac-tor represents the potential risk of being exposed to theinfectious disease, and the number of switchers deter-mines the benefit of switching. Throughout this paper, it isassumed that individuals have complete information, thatis, individuals clearly know how many people are infectedand the number of switchers. Moreover, two types ofinformation are represented in our model: local and globalinformation, each with different impacts on the spatialgame. Thus, four types of information are considered inthe model: local prevalence, global prevalence, local num-ber of switchers, and global number of switchers.
Game As illustrated in Figure 4, the Game step is dividedinto three main procedures as the main part of the spatialgame, including payoff function, decision rule, and gameupdate. The details are discussed in the following foursubsections.
Payoff function It is assumed that individuals will adoptthe switching strategy if the risk of the infectious disease ishigh enough. Judgment of threat or risk for each indivi-dual is mainly based on two aspects: the percentage of thepopulation infected in their local neighborhoods (localprevalence status) and the percentage of infection in theglobal environment (global prevalence status). The infor-mation regarding local and global prevalence status can bepractically obtained through television, newspaper, radio,and so on.
Table 4 Notations for spatial game
Fn(i, j) Payoff value for normal individuals in location (i, j) in Eq. (1)Fs(i, j) Payoff value for switchers in location (i, j) in Eq. (2)G(·) Function for the estimated risk for normal individuals from a
local perspective in Eq. (3)H(·) Function for the estimated risk for normal individuals from a
global perspective in Eq. (4)g(·) Function for switchers externality from a local perspective in
Eq. (5)h(·) Function for switchers externality from a global perspective
in Eq. (6)kc Average cost of switching strategy in Eq. (2)λ Associated risk reduction due to the switch strategy in Eq. (2)m1 Multiplier of local prevalence status in Eq. (3)m2 Multiplier of global prevalence status in Eq. (4)c1 Multiplier of local externality from switchers in Eq. (5)c2 Multiplier of global externality from switchers in Eq. (6)Pij(n→s) Probability of an individual switching from strategy normal
to strategy switch in location (i, j) in Eq. (7)θ Intensity of selection, that is, rationality of the decision
maker in Eq. (7)
Table 5 Notation for transmission of infectious diseases
Ptrans_n(i, j) Transmission rate for normal individuals in location (i, j)in Eq. (8)
Ptrans_s(i, j) Transmission rate for switchers in location (i, j) in Eq. (9)CI(i, j) Total number of effective contacts with infected
individuals for normal individuals in location (i, j) inEq. (10)
Cij(s, t) Number of effective contacts with infected individualsin neighborhood location (s, t) for normal individuals inlocation (i, j) in Eq. (10)
Nij(s, t) Total number of effective contacts in neighborhoodlocation (s, t) for normal individuals in location (i, j)in Eq. (19)
β Infection rate per contact between normal individualsand infected individuals in Eqs. (8) and (9)
γ1 Contact reduction rate for switchers in Eq. (19)γ2 Infection reduction rate for switchers in Eq. (9)n1 Average number of contacts to individuals in a
neighborhood grid(s) except its own grid for a normalindividual in Eq. (19)
n2 Average number of contacts to individuals in the samegrid for a normal individual in Eq. (19)
μ Average recovery rate in Eqs. (25) and (26)
Initialization Collection Game Transmission
1. PrevalenceEqs. (15)-(16)2. # of switchersEqs. (17-18)
1. Payoff FunctionEqs (1)-(6)2. Decision RuleEq. (7)3. Game Update
1. Contact Pattern Eq. (19)2. Transmission RateEqs. (8)-(10)3. Recovery4. Transmission UpdateEqs. (11)-(14)
Figure 4 Process of spatial game in epidemics.
Modeling infection spread and behavioral change Songnian Zhao et al4
Health Systems
A
UTHOR COPY
With the current information, individuals could decideto change their strategies spontaneously based on thebenefit and cost. The cost and benefit include judgmentabout potential risk and the cost associated with theprotective behaviors, which are modeled as the payofffunction. In addition, switchers could create externality,which means that normal individuals could also benefitfrom switchers’ efforts, since the aggregate effects of switch-ing creates a protective outcome that reduces the overalltransmission or the spread of the disease (Reluga, 2010).From this point of view, payoff functions for normal
individuals or switchers are defined as follows:
Fn i; jð Þ ¼ -G Il i; jð Þð Þg Sl i; jð Þð Þ -H Ig� �
h Sg� �
(1)
Fs i; jð Þ ¼ - kc + λFn i; jð Þ (2)
where
G Il i; jð Þð Þ ¼ m1Il i; jð Þ (3)
H Ig� � ¼ m2Ig (4)
g Sl i; jð Þð Þ ¼ 11 + c1Sl i; jð Þ (5)
h Sg� � ¼ 1
1 + c2Sg(6)
Given a contact network, Il(i, j) represents the portion ofN(i, j) who are infected individuals in the neighborhood oflocation (i, j), Ig represents the portion of individuals whoare infected in the entire population, Sl(i, j) represents theportion of N(i, j) who are switchers in the neighborhood oflocation (i, j), and Sg represents the portion of individualswho are switchers in the whole population.Eqs. (1) and (2) define payoff functions for normal
individuals, Fn(i, j), and switchers, Fs(i, j), in location (i, j),respectively. Normal individuals do not pay for protectivebehavior since they do not spend any additional efforts forprotection. Switchers, however, pay a cost for preventiveefforts. In Eq. (2), the parameter kc denotes the cost of thisswitching strategy. Parameter λ is the associated risk reduc-tion due to the switch strategy.Functions G(·) and H(·) in Eq. (1), which are defined in
Eqs. (3) and (4), denote the estimated risk for normalindividuals, and are calculated by local and global preva-lence status as discussed above. It is hard to require normalindividuals to make accurate estimates of the risk; however,the prevalence status (e.g., knowledge of the percentage ofpopulation that became infected based on public informa-tion) could be an important reference for them. In thispaper, the estimate for the risk and the conversion fromthe risk to the payoff value, based on the real prevalencestatus, is modeled by a simple linear relationship. Specifi-cally, m1 denotes a multiplier of local prevalence status(local information) and m2 denotes a multiplier of globalprevalence status (global information). These two para-meters are defined to help translate the prevalence statusto the payoff value.
Functions g(·) and h(·) in Eq. (1), which are defined inEqs. (5) and (6), denote the externality of switchers for localand global environments. As discussed above, switcherscreate local and global externality (blanket protection) forthe entire population, and not just for themselves. There-fore, the more switchers are in a location, the safer the placebecomes. In Eqs. (5) and (6), c1 denotes the multiplier of‘switch strategy’ for local externality and c2 denotes themultiplier of ‘switch strategy’ for global externality.
Decision rule In every iteration of the game, each suscep-tible individual makes a decision to be a normal individualor a switcher through balancing the benefits and costs.Individuals will change their strategies with probabilitybased on the payoff. The probability function of switchingin location (i, j) is:
Pij nð Þ ¼ 11 + e - θ Fs i; jð Þ - Fn i; jð Þð Þ (7)
This update rule is also referred to as the Fermi rule, whichis used widely in the literature (Szabó & Tőke, 1998;Traulsen et al, 2006), based on the Fermi distributionfunction. In Eq. (7), Pij(n→s) denotes the probability of anindividual switching from the normal strategy to the switchstrategy in location (i, j) when comparing the differencesin payoffs between Fs(i, j) and Fn(i, j). The parameter θrepresents the intensity of selection on the differencesbetween both payoff functions, Fs(i, j) and Fn(i, j), whichmodels the rationality of the decision maker. If payoffs ofthe different strategies are the same, that is, Fs(i, j)−Fn(i, j)→0, individuals would choose either strategy withequal chance. If the parameter θ itself equals 0, individualswill also choose either strategy with the probability of50%, and in this case, the individual is making randomchoices with equal chance. When parameter θ approachesinfinity, players will definitely choose the strategy with thehigher payoff.Similarly, we could also define the probability function
of switching from switchers to normal individuals in loca-tion (i, j) as Pij(s→n). Hence, the transmission matrix inspatial game between switchers and normal individuals isshown below:
Normal SNormal
S1 -Pij n ! sð Þ Pij n ! sð ÞPij s ! nð Þ 1 -Pij s ! nð Þ
� �
In general, the switching processes for normal individualsand switchers are independent. However, this modelassumes that:
Pij s ! nð Þ ¼ 11 + e - θ Fn i; jð Þ - Fs i; jð Þð Þ
so that Pij(n→s)+Pij(s→n)=1. The transmission matrix canbe written as
Normal SNormal
S1 -Pij n ! sð Þ Pij n ! sð Þ1 -Pij n ! sð Þ Pij n ! sð Þ
� �
Modeling infection spread and behavioral change Songnian Zhao et al 5
Health Systems
A
UTHOR COPY
Game update After evaluating the payoffs, each suscepti-ble individual at each spatial location updates their strate-gies according to probability defined in Eq. (7). Eachupdate period is referred to as one turn, whose lengthcan be predefined by the users. In our test model presentedin the section ‘Test bed’, the update period is assumed tobe 1 day.The number of normal individuals and switchers in the
susceptible population is recalculated at each spatial loca-tion as individuals update their strategies. Hence, initialvalues of the matrices, and the normal and switchers’distributions, are updated after each iteration.
Transmission In this article, transmission of the diseasefollows conventional transmission processes defined inthe standard SIR model (Figure 2). The details are givenbelow.
Contact pattern The contact pattern is an important factorthat affects the dynamics of an epidemic. Most researchersrely on a presumed contact pattern with little or noempirical basis. In Mossong et al (2008), the authorsprovide the first large-scale quantitative approach to con-tact patterns relevant to how infectious diseases are trans-mitted. Theoretically, any type of contact pattern can beapplied to the model (Balcan et al, 2009). In this paper, avery simple contact pattern based on the Poisson Count-ing Process is assumed as described in the section ‘Testbed’. This contact pattern is used to analyze the character-istics of the model and the sensitivity of each parameter inthe model. In the future, a more comprehensive andrealistic contact pattern will be considered to extend thismodel.
Transmission rate The transmission process in this paperis based on a simple SIR model. Different transmissionrates and contact rates are defined for normal individualsand for switchers, respectively. For switchers, there is areduction in transmission rate due to the change inbehaviors, such as social distancing. The probability func-tion for transmission of an underlying disease in onespecific location, say (i, j) is defined as follows:
Ptrans n i; jð Þ ¼ 1 - 1 - βð ÞCI i; jð Þ (8)
Ptrans s i; jð Þ ¼ 1 - 1 - γ2βð ÞCI i; jð Þ (9)
CI i; jð Þ ¼X
s; tð Þ2neighborhoodCij s; tð Þ (10)
where γ2 is the infection rate reduction for switchers, CI(i, j)denotes the total number of contacts with infected indivi-duals in its own location and in its neighborhood for anindividual in that location (i, j), and Cij(s, t) denotes thenumber of contacts with infected individuals in its neigh-borhood location (s, t) for an individual in a location (i, j),and β denotes the transition rate between infected andsusceptible individuals.
Recovery Infected individuals usually stay infected over aperiod of time depending on the underlining disease, andrecover from the disease on a certain day with a specificprobability. The recovery probability distribution can bedefined according to a specific disease.
Transmission update Define NORMALt(i, j) to be the num-ber of normal individuals in location (i ,j) at time t, St(i, j) tobe the number of switchers in location (i ,j) at time t, It(i, j)to be the number of infected individuals in location (i, j) attime t, and Rt(i, j) to be the number of recovered indivi-duals in location (i, j) at time t. After the transmissionprocess, each location updates its properties as follows:
NORMALt + 1 i; jð Þ ¼ NORMALt i; jð Þ�+ St i; jð Þ�* 1 -P n ! sð Þð Þ-Δ NORMALt i; jð Þ� � ð11Þ
St + 1 i; jð Þ ¼ NORMALt i; jð Þ�+ St i; jð Þ�*P n ! sð Þ -Δ St i; jð Þ� � ð12Þ
It +1 i; jð Þ ¼ It i; jð Þ +Δ NORMALt i; jð Þ� �+Δ St i; jð Þ� �
-Ω It i; jð Þ� � ð13Þ
Rt + 1 i; jð Þ ¼ Rt i; jð Þ +Ω It i; jð Þ� �(14)
where Δ(NORMALt(i, j)) and Δ(St(i, j)) denote the numberof individuals infected at time t, by normal individuals andswitchers, respectively. Ω(It(i, j)) denotes the number ofinfected individuals recovered at time t. It(i, j) in (13)represents, at time t, the infected population in location(i, j) and Rt(i, j) in (14) represents, at time t, the recoveredpopulation in location (i, j).
Test bedIn this section, a small example is constructed to analyzethe characteristics of this model. Consider a small regionwith m by n locations in a regular lattice where m=5 andn=5, and 100 individuals who live in each location.Initialize the population as follows: N(i, j) denotes thenumber of individuals in location (i, j), I(i, j) denotes thenumber of infected individuals in the location (i, j), S(i, j)denotes the number of switchers in the location (i, j),NORMAL(i, j) denotes the number of normal individuals inlocation (i, j), and R(i ,j)denotes the number of recoveredindividuals in the location (i, j). On the first day, there isone infected person in the focal site and all other indivi-duals are normal individuals.The contact pattern is based on the Moore neighborhood
(Nowak & May, 1992), which means that individuals willcontact others only in the adjacent eight locations and intheir own location. Hence the number of Il(i, j), Ig, Sl(i, j),
Modeling infection spread and behavioral change Songnian Zhao et al6
Health Systems
A
UTHOR COPY
and Sg in Eq. (1) can be calculated in Eqs. (15–18).
Il i; jð Þ ¼Pmin i +1;mð Þ
k¼max i -1;1ð ÞPmin j +1; nð Þ
l¼max j -1;1ð Þ I k; lð ÞPmin i +1;mð Þk¼max i - 1;1ð Þ
Pmin j +1; nð Þl¼max j -1;1ð Þ N k; lð Þ
(15)
Ig ¼Pm
k¼1Pn
l¼1 I k; lð ÞPmk¼1
Pnl¼1 N k; lð Þ (16)
Sl i; jð Þ ¼Pmin i+ 1;mð Þ
k¼max i -1;1ð ÞPmin j + 1; nð Þ
l¼max j -1; 1ð Þ S k; lð ÞPmin i + 1;mð Þk¼max i -1; 1ð Þ
Pmin j +1;nð Þl¼max j - 1; 1ð Þ N k; lð Þ
(17)
Sg ¼Pm
k¼1Pn
l¼1 S k; lð ÞPmk¼1
Pnl¼1 N k; lð Þ (18)
In this model, assume that the number of interactions foreach individual follows the Poisson distribution and mostcontacts happen for individuals at the same site. Threeparameters are defined to determine the interaction pat-terns, which are γ1, n1, and n2. Parameter γ1 denotes thedecreasing rate of interactions, which means that switcherswill contact fewer individuals than the normal individualswill; n1 and n2 denote the average number of contacts toindividuals in a neighborhood grid and to those in thesame grid for a normal individual, respectively. Nij(s, t)denotes the number of contacts in a location (s, t) for anindividual in location (i, j). Hence, the probabilities that anindividual has k contacts within his neighborhood andhome are modeled using Poisson distributions. Theirdefinitions are given in Eq. (19), respectively:
P Nij s; tð Þ ¼ k� � ¼
e- γ1n1 γ1n1ð Þkk ! ;
k ¼ 0; 1; 2 ¼ s ¼ i -1; i; i +1t ¼ j -1; j; j +1 s; tð Þ≠ i; jð Þ
e- γ1n2 γ1n2ð Þkk ! ; k ¼ 0; 1; 2 ¼ s; tð Þ ¼ i; jð Þ
8<:
(19)
where 0⩽γ1⩽1 represents switchers and γ1=1 representsnormal individuals. Eq. (19) denotes the two cases in whichcontacts happen in the neighborhood and at the homelocality. Hence, the number of individuals in the neigh-borhood who create contacts has a Poisson distribution withan average n1 for normal individuals and an average of γ1n1for switchers. Similarly, the number of individuals in thesame cell subpopulation has a Poisson distribution with anaverage of n2 for normal individuals and γ1n2 for switchers.The parameters for Scenario 1 with switchers are initi-
alized as follows: kc=3. λ=0.5, m1=100, m2=10, c1=1,c2=1, θ=1, γ1=0.5, and γ2=0.5. The transmission rate pereffective contact with an infected person is defined asβ=0.2. The recovery probability distribution is fixed anddefined as [0.3, 0.4, 0.2, 0.1]. Infected individuals willrecover from the disease at the end of the first infectedday with the probability 0.3, at the end of the secondinfected day with probability 0.4, at the end of the thirdinfected day with probability 0.2, and at the end of thefourth infected day with probability 0.1. The contactpattern is defined as n1=0.5, and n2=8 (on average anindividual contacts half of an individuals in its neighbor-hoods and eight individuals in his home location per day).The model is simulated for a period of 60 days with 100
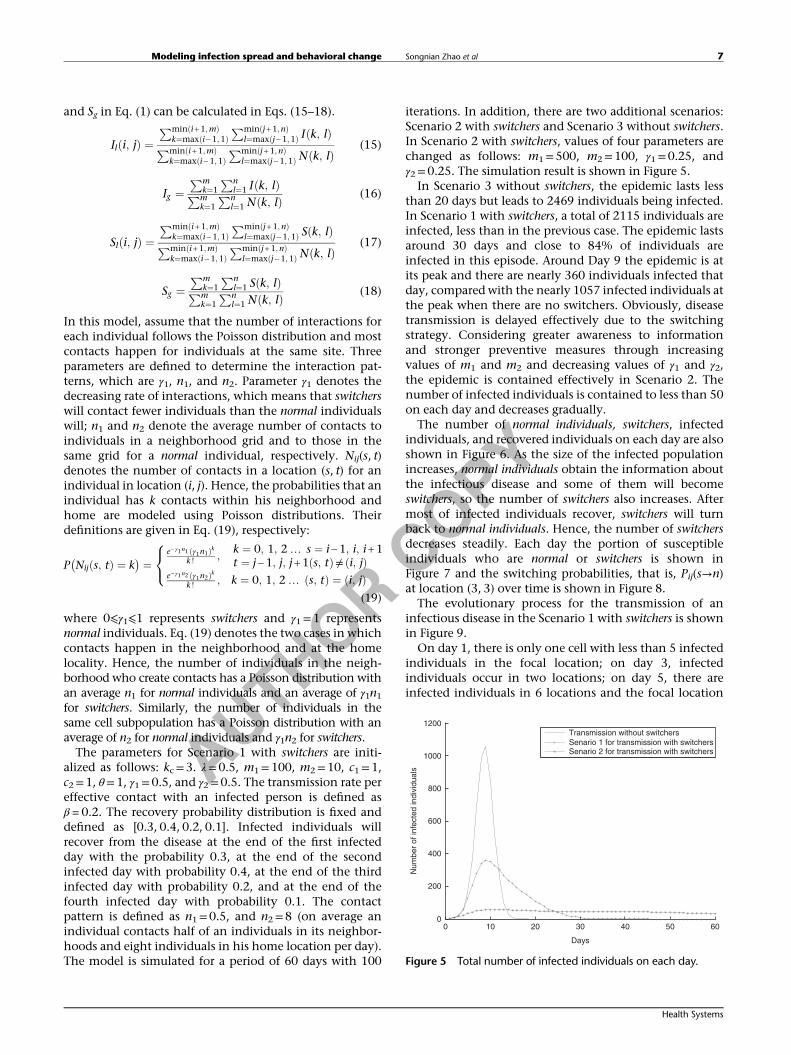
iterations. In addition, there are two additional scenarios:Scenario 2 with switchers and Scenario 3 without switchers.In Scenario 2 with switchers, values of four parameters arechanged as follows: m1=500, m2=100, γ1=0.25, andγ2=0.25. The simulation result is shown in Figure 5.In Scenario 3 without switchers, the epidemic lasts less
than 20 days but leads to 2469 individuals being infected.In Scenario 1 with switchers, a total of 2115 individuals areinfected, less than in the previous case. The epidemic lastsaround 30 days and close to 84% of individuals areinfected in this episode. Around Day 9 the epidemic is atits peak and there are nearly 360 individuals infected thatday, compared with the nearly 1057 infected individuals atthe peak when there are no switchers. Obviously, diseasetransmission is delayed effectively due to the switchingstrategy. Considering greater awareness to informationand stronger preventive measures through increasingvalues of m1 and m2 and decreasing values of γ1 and γ2,the epidemic is contained effectively in Scenario 2. Thenumber of infected individuals is contained to less than 50on each day and decreases gradually.The number of normal individuals, switchers, infected
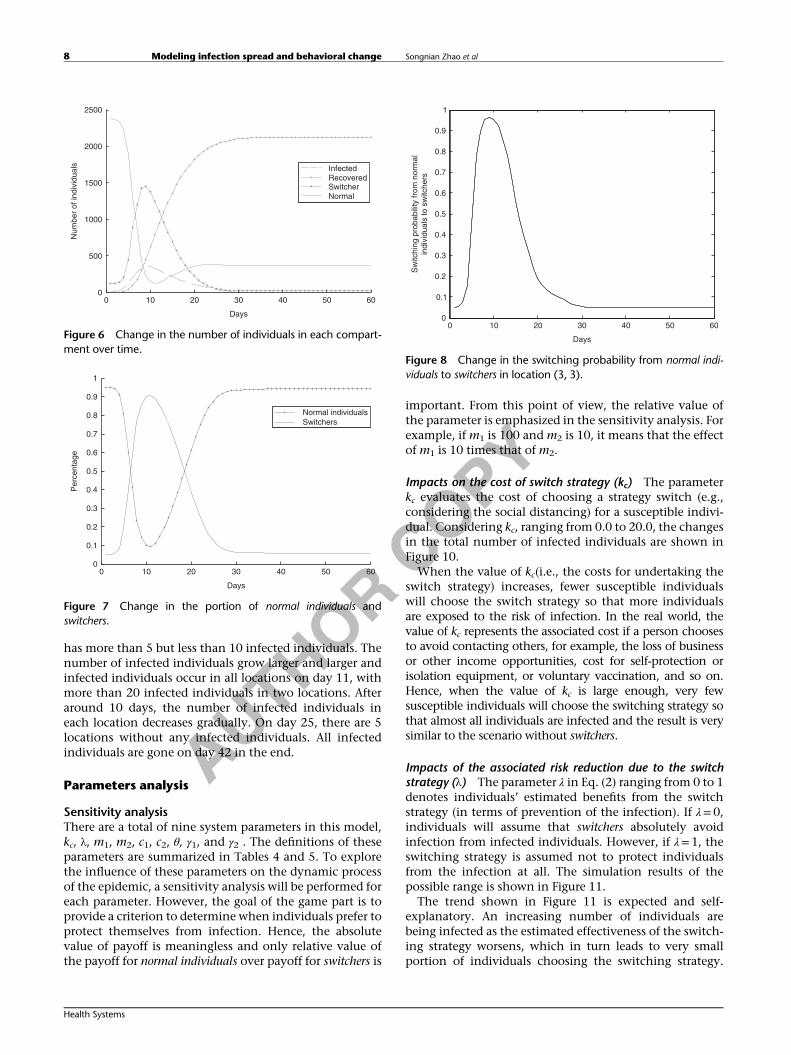
individuals, and recovered individuals on each day are alsoshown in Figure 6. As the size of the infected populationincreases, normal individuals obtain the information aboutthe infectious disease and some of them will becomeswitchers, so the number of switchers also increases. Aftermost of infected individuals recover, switchers will turnback to normal individuals. Hence, the number of switchersdecreases steadily. Each day the portion of susceptibleindividuals who are normal or switchers is shown inFigure 7 and the switching probabilities, that is, Pij(s→n)at location (3, 3) over time is shown in Figure 8.The evolutionary process for the transmission of an
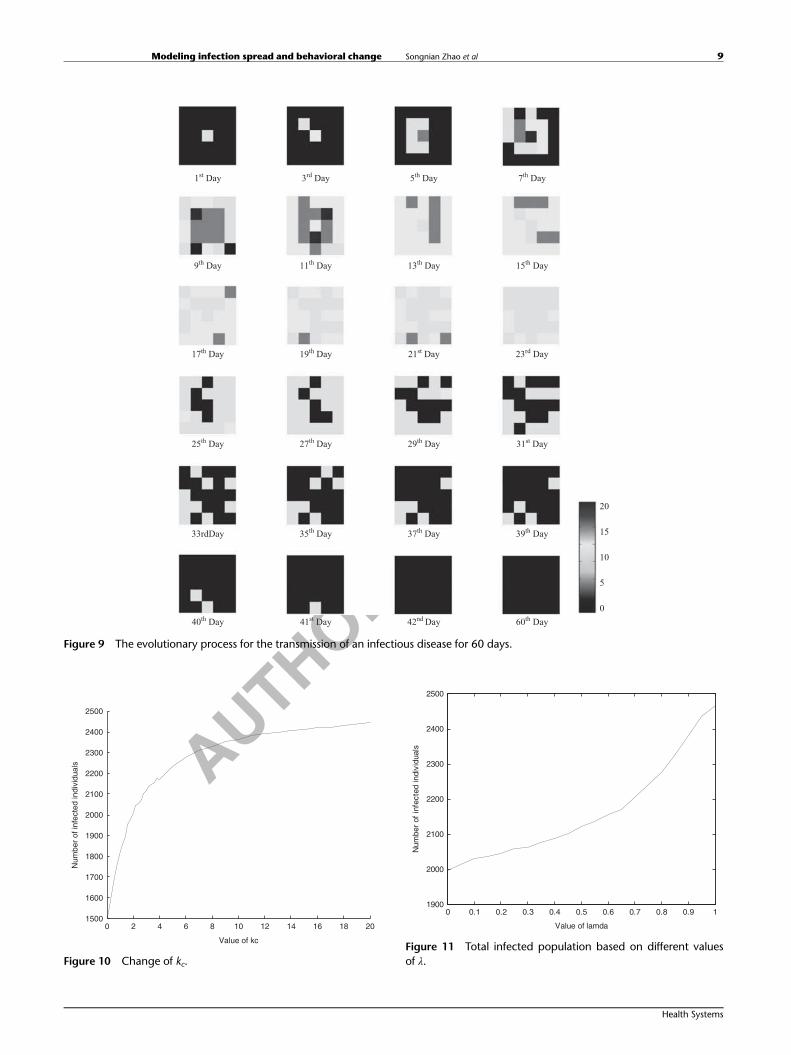
infectious disease in the Scenario 1 with switchers is shownin Figure 9.On day 1, there is only one cell with less than 5 infected
individuals in the focal location; on day 3, infectedindividuals occur in two locations; on day 5, there areinfected individuals in 6 locations and the focal location
0 10 20 30 40 50 60
200
400
600
800
1000
1200
Days
Num
ber
of in
fect
ed in
divi
dual
s
Transmission without switchersSenario 1 for transmission with switchersSenario 2 for transmission with switchers
0
Figure 5 Total number of infected individuals on each day.
Modeling infection spread and behavioral change Songnian Zhao et al 7
Health Systems
A
UTHOR COPY
has more than 5 but less than 10 infected individuals. Thenumber of infected individuals grow larger and larger andinfected individuals occur in all locations on day 11, withmore than 20 infected individuals in two locations. Afteraround 10 days, the number of infected individuals ineach location decreases gradually. On day 25, there are 5locations without any infected individuals. All infectedindividuals are gone on day 42 in the end.
Parameters analysis
Sensitivity analysisThere are a total of nine system parameters in this model,kc, λ, m1, m2, c1, c2, θ, γ1, and γ2 . The definitions of theseparameters are summarized in Tables 4 and 5. To explorethe influence of these parameters on the dynamic processof the epidemic, a sensitivity analysis will be performed foreach parameter. However, the goal of the game part is toprovide a criterion to determine when individuals prefer toprotect themselves from infection. Hence, the absolutevalue of payoff is meaningless and only relative value ofthe payoff for normal individuals over payoff for switchers is
important. From this point of view, the relative value ofthe parameter is emphasized in the sensitivity analysis. Forexample, if m1 is 100 and m2 is 10, it means that the effectof m1 is 10 times that of m2.
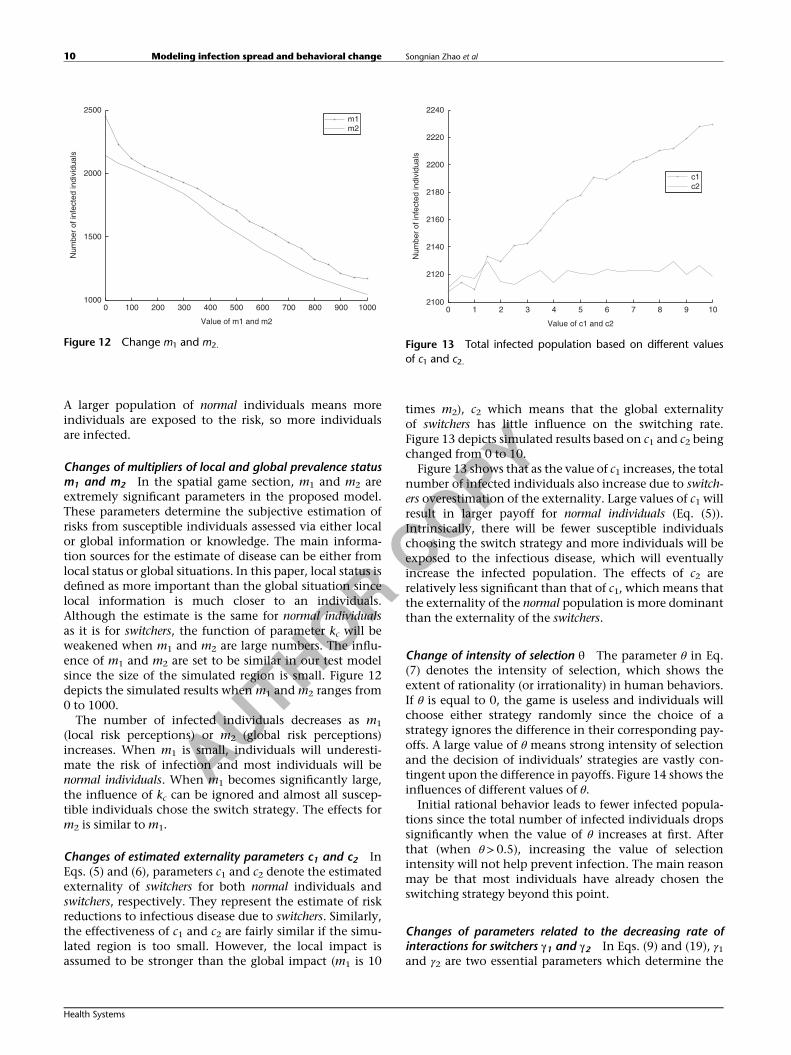
Impacts on the cost of switch strategy (kc) The parameterkc evaluates the cost of choosing a strategy switch (e.g.,considering the social distancing) for a susceptible indivi-dual. Considering kc, ranging from 0.0 to 20.0, the changesin the total number of infected individuals are shown inFigure 10.When the value of kc(i.e., the costs for undertaking the
switch strategy) increases, fewer susceptible individualswill choose the switch strategy so that more individualsare exposed to the risk of infection. In the real world, thevalue of kc represents the associated cost if a person choosesto avoid contacting others, for example, the loss of businessor other income opportunities, cost for self-protection orisolation equipment, or voluntary vaccination, and so on.Hence, when the value of kc is large enough, very fewsusceptible individuals will choose the switching strategy sothat almost all individuals are infected and the result is verysimilar to the scenario without switchers.
Impacts of the associated risk reduction due to the switchstrategy (λ) The parameter λ in Eq. (2) ranging from 0 to 1denotes individuals’ estimated benefits from the switchstrategy (in terms of prevention of the infection). If λ=0,individuals will assume that switchers absolutely avoidinfection from infected individuals. However, if λ=1, theswitching strategy is assumed not to protect individualsfrom the infection at all. The simulation results of thepossible range is shown in Figure 11.The trend shown in Figure 11 is expected and self-
explanatory. An increasing number of individuals arebeing infected as the estimated effectiveness of the switch-ing strategy worsens, which in turn leads to very smallportion of individuals choosing the switching strategy.
0 10 20 30 40 50 600
500
1000
1500
2000
2500
Days
Num
ber
of in
divi
dual
s InfectedRecoveredSwitcherNormal
Figure 6 Change in the number of individuals in each compart-ment over time.
0 10 20 30 40 50 600
0.1
0.2
0.3
0.4
0.5
0.6
0.7
0.8
0.9
1
Days
Per
cent
age
Normal individualsSwitchers
Figure 7 Change in the portion of normal individuals andswitchers.
00
0.1
0.2
0.3
0.4
0.5
0.6
0.7
0.8
0.9
1
Sw
itchi
ng p
roba
bilit
y fr
om n
orm
alin
divi
dual
s to
sw
itche
rs
10 20 30
Days
40 50 60
Figure 8 Change in the switching probability from normal indi-viduals to switchers in location (3, 3).
Modeling infection spread and behavioral change Songnian Zhao et al8
Health Systems
A
UTHOR COPY
1st Day 3rd Day 5th Day 7th Day
9th Day 11th Day 13th Day 15th Day
17th Day 19th Day 21st Day 23rd Day
25th Day 27th Day 29th Day 31st Day
33rdDay 35th Day 37th Day 39th Day
40th Day 41st Day 42nd Day 60th Day
20
15
10
5
0
Figure 9 The evolutionary process for the transmission of an infectious disease for 60 days.
0 2 4 6 8 10 12 14 16 18 201500
1600
1700
1800
1900
2000
2100
2200
2300
2400
2500
Value of kc
Num
ber
of in
fect
ed in
divi
dual
s
Figure 10 Change of kc.
0 0.1 0.2 0.3 0.4 0.5 0.6 0.7 0.8 0.9 11900
2000
2100
2200
2300
2400
2500
Value of lamda
Num
ber
of in
fect
ed in
divi
dual
s
Figure 11 Total infected population based on different valuesof λ.
Modeling infection spread and behavioral change Songnian Zhao et al 9
Health Systems
A
UTHOR COPY
A larger population of normal individuals means moreindividuals are exposed to the risk, so more individualsare infected.
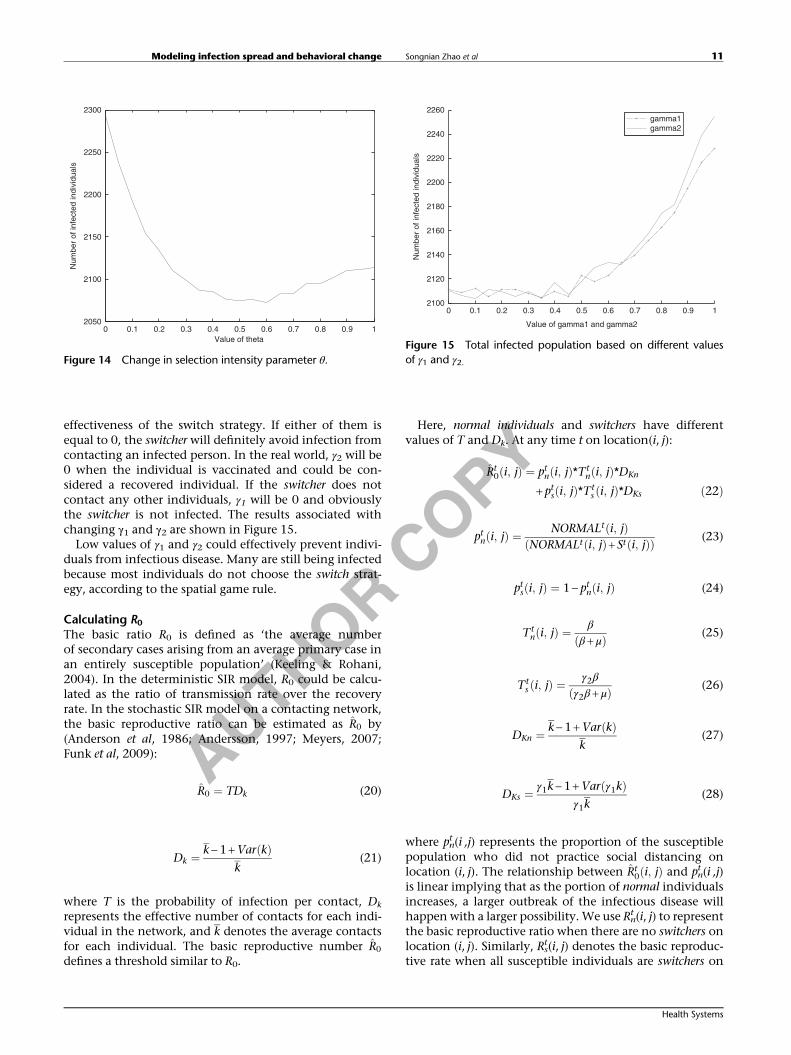
Changes of multipliers of local and global prevalence statusm1 and m2 In the spatial game section, m1 and m2 areextremely significant parameters in the proposed model.These parameters determine the subjective estimation ofrisks from susceptible individuals assessed via either localor global information or knowledge. The main informa-tion sources for the estimate of disease can be either fromlocal status or global situations. In this paper, local status isdefined as more important than the global situation sincelocal information is much closer to an individuals.Although the estimate is the same for normal individualsas it is for switchers, the function of parameter kc will beweakened when m1 and m2 are large numbers. The influ-ence of m1 and m2 are set to be similar in our test modelsince the size of the simulated region is small. Figure 12depicts the simulated results when m1 and m2 ranges from0 to 1000.The number of infected individuals decreases as m1
(local risk perceptions) or m2 (global risk perceptions)increases. When m1 is small, individuals will underesti-mate the risk of infection and most individuals will benormal individuals. When m1 becomes significantly large,the influence of kc can be ignored and almost all suscep-tible individuals chose the switch strategy. The effects form2 is similar to m1.
Changes of estimated externality parameters c1 and c2 InEqs. (5) and (6), parameters c1 and c2 denote the estimatedexternality of switchers for both normal individuals andswitchers, respectively. They represent the estimate of riskreductions to infectious disease due to switchers. Similarly,the effectiveness of c1 and c2 are fairly similar if the simu-lated region is too small. However, the local impact isassumed to be stronger than the global impact (m1 is 10
times m2), c2 which means that the global externalityof switchers has little influence on the switching rate.Figure 13 depicts simulated results based on c1 and c2 beingchanged from 0 to 10.Figure 13 shows that as the value of c1 increases, the total
number of infected individuals also increase due to switch-ers overestimation of the externality. Large values of c1 willresult in larger payoff for normal individuals (Eq. (5)).Intrinsically, there will be fewer susceptible individualschoosing the switch strategy and more individuals will beexposed to the infectious disease, which will eventuallyincrease the infected population. The effects of c2 arerelatively less significant than that of c1, which means thatthe externality of the normal population is more dominantthan the externality of the switchers.
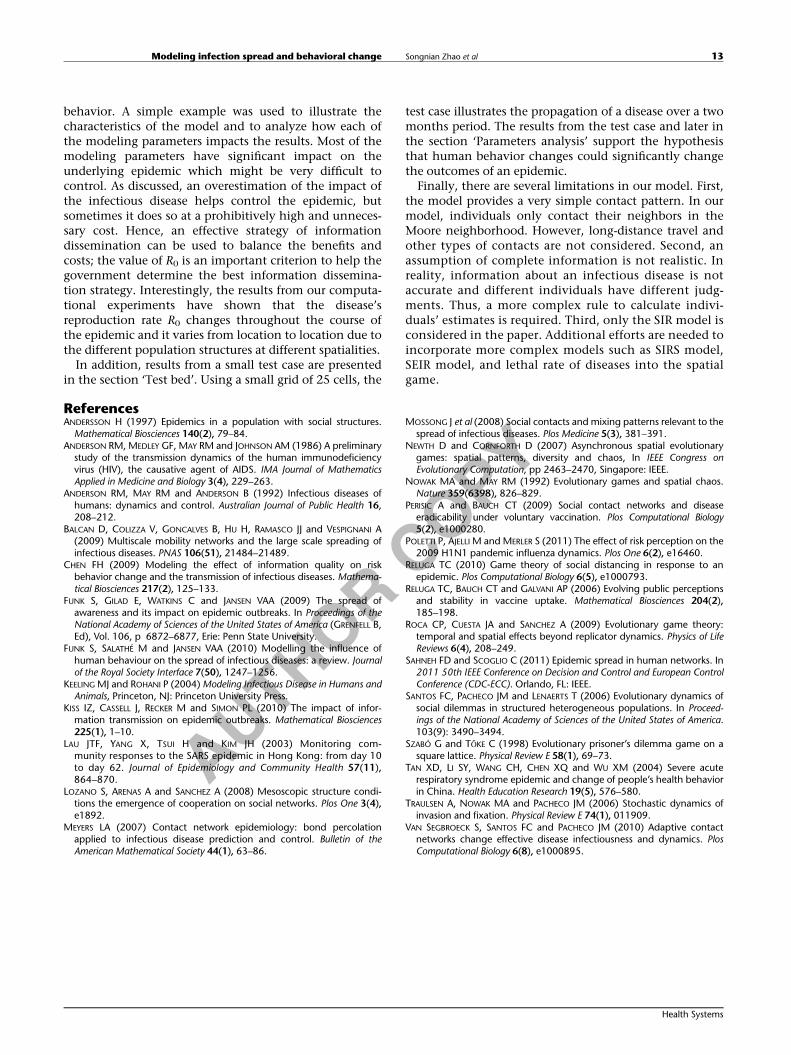
Change of intensity of selection θ The parameter θ in Eq.(7) denotes the intensity of selection, which shows theextent of rationality (or irrationality) in human behaviors.If θ is equal to 0, the game is useless and individuals willchoose either strategy randomly since the choice of astrategy ignores the difference in their corresponding pay-offs. A large value of θ means strong intensity of selectionand the decision of individuals’ strategies are vastly con-tingent upon the difference in payoffs. Figure 14 shows theinfluences of different values of θ.Initial rational behavior leads to fewer infected popula-
tions since the total number of infected individuals dropssignificantly when the value of θ increases at first. Afterthat (when θ>0.5), increasing the value of selectionintensity will not help prevent infection. The main reasonmay be that most individuals have already chosen theswitching strategy beyond this point.
Changes of parameters related to the decreasing rate ofinteractions for switchers γ1 and γ2 In Eqs. (9) and (19), γ1and γ2 are two essential parameters which determine the
0 100 200 300 400 500 600 700 800 900 10001000
1500
2000
2500
Value of m1 and m2
Num
ber
of in
fect
ed in
divi
dual
s
m1m2
Figure 12 Change m1 and m2.
0 1 2 3 4 5 6 7 8 9 10
2120
2140
2160
2180
2200
2220
2240
Value of c1 and c2
Num
ber
of in
fect
ed in
divi
dual
s
c1c2
2100
Figure 13 Total infected population based on different valuesof c1 and c2.
Modeling infection spread and behavioral change Songnian Zhao et al10
Health Systems
A
UTHOR COPY
effectiveness of the switch strategy. If either of them isequal to 0, the switcher will definitely avoid infection fromcontacting an infected person. In the real world, γ2 will be0 when the individual is vaccinated and could be con-sidered a recovered individual. If the switcher does notcontact any other individuals, γ1 will be 0 and obviouslythe switcher is not infected. The results associated withchanging γ1 and γ2 are shown in Figure 15.Low values of γ1 and γ2 could effectively prevent indivi-
duals from infectious disease. Many are still being infectedbecause most individuals do not choose the switch strat-egy, according to the spatial game rule.
Calculating R0The basic ratio R0 is defined as ‘the average numberof secondary cases arising from an average primary case inan entirely susceptible population’ (Keeling & Rohani,2004). In the deterministic SIR model, R0 could be calcu-lated as the ratio of transmission rate over the recoveryrate. In the stochastic SIR model on a contacting network,the basic reproductive ratio can be estimated as R̂0 by(Anderson et al, 1986; Andersson, 1997; Meyers, 2007;Funk et al, 2009):
R̂0 ¼ TDk (20)
Dk ¼ k -1 +Var kð Þk
(21)
where T is the probability of infection per contact, Dk
represents the effective number of contacts for each indi-vidual in the network, and k denotes the average contactsfor each individual. The basic reproductive number R̂0
defines a threshold similar to R0.
Here, normal individuals and switchers have differentvalues of T and Dk. At any time t on location(i, j):
R̂t0 i; jð Þ ¼ ptn i; jð Þ*Tt
n i; jð Þ*DKn
+ pts i; jð Þ*Tts i; jð Þ*DKs ð22Þ
ptn i; jð Þ ¼ NORMALt i; jð ÞNORMALt i; jð Þ + St i; jð Þð Þ (23)
pts i; jð Þ ¼ 1 - ptn i; jð Þ (24)
Ttn i; jð Þ ¼ β
β + μð Þ (25)
Tts i; jð Þ ¼ γ2β
γ2β + μð Þ (26)
DKn ¼ k -1 +Var kð Þk
(27)
DKs ¼ γ1k -1 +Var γ1kð Þγ1k
(28)
where pnt (i ,j) represents the proportion of the susceptible
population who did not practice social distancing onlocation (i, j). The relationship between R̂t
0ði; jÞ and pnt (i ,j)
is linear implying that as the portion of normal individualsincreases, a larger outbreak of the infectious disease willhappen with a larger possibility. We use Rn
t (i, j) to representthe basic reproductive ratio when there are no switchers onlocation (i, j). Similarly, Rs
t(i, j) denotes the basic reproduc-tive rate when all susceptible individuals are switchers on
0 0.1 0.2 0.3 0.4 0.5 0.6 0.7 0.8 0.9 12100
2120
2140
2160
2180
2200
2220
2240
2260
Value of gamma1 and gamma2
Num
ber
of in
fect
ed in
divi
dual
s
gamma1gamma2
Figure 15 Total infected population based on different valuesof γ1 and γ2.
0 0.1 0.2 0.3 0.4 0.5 0.6 0.7 0.8 0.9 12050
2100
2150
2200
2250
2300
Value of theta
Num
ber
of in
fect
ed in
divi
dual
s
Figure 14 Change in selection intensity parameter θ.
Modeling infection spread and behavioral change Songnian Zhao et al 11
Health Systems

A
UTHOR COPY
location (i, j). To prevent the disease from spreadingglobally, the condition R̂0<1 should be satisfied, whichimplies
ptn i; jð Þ< 1 -Rts i; jð Þ� �
Rtn i; jð Þ -Rt
s i; jð Þ� � (29)
Rtn i; jð Þ ¼ Tt
n i; jð Þ*DKn (30)
Rts i; jð Þ ¼ Tt
s i; jð Þ*DKs (31)
Rnt (i, j) and Rs
t(i, j) are defined in a similar way to R̂t0 i; jð Þ, but
for the population in which all susceptible individuals arenormal individuals and switchers, respectively.According to the spatial game update (using Eq. (7)), we
have
ptn i; jð Þ ¼ 11 + exp - θ 1 - λð ÞFt
n i; jð Þ + kc� �� � (32)
If Rnt (i, j)<1, R̂t
0 i; jð Þ will be less than 1 even without anyswitchers. If Rs
t(i, j)>1, the infectious disease will spread outglobally with only self-protective strategies when we donot consider any other forces such as public policies andother measures taken to control the epidemic. In this case,switchers could only slow down the transmission of infec-tious disease and reduce the number of infected indivi-duals, but could not eliminate the epidemics. If Rn
t (i, j)>1and Rs
t(i, j)<1, pnt (i, j) from Eq. (32) are plugged into the Eq.
(29) the inequality for Fnt (i, j) becomes:
Ftn i; jð Þ<
- θkc - lnRtn i; jð Þ -1
1 -Rts i; jð Þ
� �θ 1 - λð Þ ¼ Fcritical (33)
Fcritical is the threshold from which the infectious diseasewill be controlled due to the switchers’ impact. WhenFnt (i, j)<Fcritical, the infectious disease cannot spread out;
otherwise switchers who changed their behaviors becauseof information dissemination cannot eradicate theepidemics.If we consider that the local information to be much
more effective than the global information, the results areas follows:
Sl i; jð Þ> 1c1
-m1Il i; jð Þm2Ig
1 + c2Sg+ Fcritical
-1
0@
1A
� 1c1
-m1Il i; jð ÞFcritical
-1�
ð34Þ
If this simple inequality is satisfied, R̂0 will be less than 1,which means that individuals’ self-protective behaviorscould eliminate the transmission of an infectious disease.
DiscussionOne key point highlighted by this model is the importanceof incentives that motivate individuals to become switchersand how switchers effectively avoid getting infected bypotential epidemics. On the basis of a sensitivity analysis
of the model, most parameters have significant impact onthe disease-spreading process; however, some are difficultto manage and to control. For example, the parameters kcand θ can vary significantly from one individual to anotherdepending on different occupations, education level,ethnical culture, and so on. Hence, parameters which arerelatively easy to control will be the focus of the study.Parameters γ1 and γ2 in Eqs. (19) and (9) are good examples.More powerful antibiotic medicines, immunization,broadcast, or education on prevention methods by thefederal and local governments could effectively reduce thevalues of γ1 and γ2, since switchers who adopt thesestrategies could have better resistances to the disease. Thisis one way to better protect switchers. On the other hand,government should lead susceptible individuals to recog-nize epidemic situations correctly and give them sufficientincentives to become switchers. Two other importantfactors are the speculative prevalence of an infectiousdisease (an individual’s perception of the prevalence of adisease) by each individual, as the parameters m1 and m2
denoted in Eqs. (3) and (4). It is difficult to collectcomplete and real-time disease-spreading information onall normal individuals. Two main information sources arelocal and global information sources such as mass media(TV, radio, internet, social media, and newspapers). Under-estimating the impact or spread of the disease could lead toa worsening situation. In such a case, increasing thedissemination of information will develop awareness ofthe infection risk to susceptible individuals and mayconvince them to protect themselves.Although it is always preferable to prevent an infectious
disease from spreading, there is also the danger of vastunnecessary and wasteful spending intended to promoteprotective measures. A criterion generally used to evaluatethe risk of an infectious disease is R0, which our modelfound to vary based on location, and may change overtime, as human behaviors change. Effective disseminationof information related to an infectious disease can controlthe proportion of switchers based on the assumptiondiscussed in our model. Hence, different informationtransmission strategies can be used by the governmentbased on the value of R0 at that time. If R0 is smaller than 1,no further information about the disease is necessary to bereleased to the public.
SummaryThis paper presents a general spatial game model designedto represent the dynamics of transmission of an infectiousdisease, considering spontaneous changes in human beha-vior based on information acquired related to the disease.This model includes the consideration of informationsynthesis, individual decision making based on the trade-offs between the benefits and costs of changing behavior,and information evaluation based on both local and globalinformation with a heterogeneous population distribu-tion. Without the loss of generality, a classical SIR modelis assumed to be the underlying infectious disease
Modeling infection spread and behavioral change Songnian Zhao et al12
Health Systems
A
UTHOR COPY
behavior. A simple example was used to illustrate thecharacteristics of the model and to analyze how each ofthe modeling parameters impacts the results. Most of themodeling parameters have significant impact on theunderlying epidemic which might be very difficult tocontrol. As discussed, an overestimation of the impact ofthe infectious disease helps control the epidemic, butsometimes it does so at a prohibitively high and unneces-sary cost. Hence, an effective strategy of informationdissemination can be used to balance the benefits andcosts; the value of R0 is an important criterion to help thegovernment determine the best information dissemina-tion strategy. Interestingly, the results from our computa-tional experiments have shown that the disease’sreproduction rate R0 changes throughout the course ofthe epidemic and it varies from location to location due tothe different population structures at different spatialities.In addition, results from a small test case are presented
in the section ‘Test bed’. Using a small grid of 25 cells, the
test case illustrates the propagation of a disease over a twomonths period. The results from the test case and later inthe section ‘Parameters analysis’ support the hypothesisthat human behavior changes could significantly changethe outcomes of an epidemic.Finally, there are several limitations in our model. First,
the model provides a very simple contact pattern. In ourmodel, individuals only contact their neighbors in theMoore neighborhood. However, long-distance travel andother types of contacts are not considered. Second, anassumption of complete information is not realistic. Inreality, information about an infectious disease is notaccurate and different individuals have different judg-ments. Thus, a more complex rule to calculate indivi-duals’ estimates is required. Third, only the SIR model isconsidered in the paper. Additional efforts are needed toincorporate more complex models such as SIRS model,SEIR model, and lethal rate of diseases into the spatialgame.
ReferencesANDERSSON H (1997) Epidemics in a population with social structures.
Mathematical Biosciences 140(2), 79–84.ANDERSON RM, MEDLEY GF, MAY RM and JOHNSON AM (1986) A preliminary
study of the transmission dynamics of the human immunodeficiencyvirus (HIV), the causative agent of AIDS. IMA Journal of MathematicsApplied in Medicine and Biology 3(4), 229–263.
ANDERSON RM, MAY RM and ANDERSON B (1992) Infectious diseases ofhumans: dynamics and control. Australian Journal of Public Health 16,208–212.
BALCAN D, COLIZZA V, GONCALVES B, HU H, RAMASCO JJ and VESPIGNANI A(2009) Multiscale mobility networks and the large scale spreading ofinfectious diseases. PNAS 106(51), 21484–21489.
CHEN FH (2009) Modeling the effect of information quality on riskbehavior change and the transmission of infectious diseases. Mathema-tical Biosciences 217(2), 125–133.
FUNK S, GILAD E, WATKINS C and JANSEN VAA (2009) The spread ofawareness and its impact on epidemic outbreaks. In Proceedings of theNational Academy of Sciences of the United States of America (GRENFELL B,Ed), Vol. 106, p 6872–6877, Erie: Penn State University.
FUNK S, SALATHÉ M and JANSEN VAA (2010) Modelling the influence ofhuman behaviour on the spread of infectious diseases: a review. Journalof the Royal Society Interface 7(50), 1247–1256.
KEELING MJ and ROHANI P (2004)Modeling Infectious Disease in Humans andAnimals, Princeton, NJ: Princeton University Press.
KISS IZ, CASSELL J, RECKER M and SIMON PL (2010) The impact of infor-mation transmission on epidemic outbreaks. Mathematical Biosciences225(1), 1–10.
LAU JTF, YANG X, TSUI H and KIM JH (2003) Monitoring com-munity responses to the SARS epidemic in Hong Kong: from day 10to day 62. Journal of Epidemiology and Community Health 57(11),864–870.
LOZANO S, ARENAS A and SANCHEZ A (2008) Mesoscopic structure condi-tions the emergence of cooperation on social networks. Plos One 3(4),e1892.
MEYERS LA (2007) Contact network epidemiology: bond percolationapplied to infectious disease prediction and control. Bulletin of theAmerican Mathematical Society 44(1), 63–86.
MOSSONG J et al (2008) Social contacts and mixing patterns relevant to thespread of infectious diseases. Plos Medicine 5(3), 381–391.
NEWTH D and CORNFORTH D (2007) Asynchronous spatial evolutionarygames: spatial patterns, diversity and chaos, In IEEE Congress onEvolutionary Computation, pp 2463–2470, Singapore: IEEE.
NOWAK MA and MAY RM (1992) Evolutionary games and spatial chaos.Nature 359(6398), 826–829.
PERISIC A and BAUCH CT (2009) Social contact networks and diseaseeradicability under voluntary vaccination. Plos Computational Biology5(2), e1000280.
POLETTI P, AJELLI M and MERLER S (2011) The effect of risk perception on the2009 H1N1 pandemic influenza dynamics. Plos One 6(2), e16460.
RELUGA TC (2010) Game theory of social distancing in response to anepidemic. Plos Computational Biology 6(5), e1000793.
RELUGA TC, BAUCH CT and GALVANI AP (2006) Evolving public perceptionsand stability in vaccine uptake. Mathematical Biosciences 204(2),185–198.
ROCA CP, CUESTA JA and SANCHEZ A (2009) Evolutionary game theory:temporal and spatial effects beyond replicator dynamics. Physics of LifeReviews 6(4), 208–249.
SAHNEH FD and SCOGLIO C (2011) Epidemic spread in human networks. In2011 50th IEEE Conference on Decision and Control and European ControlConference (CDC-ECC). Orlando, FL: IEEE.
SANTOS FC, PACHECO JM and LENAERTS T (2006) Evolutionary dynamics ofsocial dilemmas in structured heterogeneous populations. In Proceed-ings of the National Academy of Sciences of the United States of America.103(9): 3490–3494.
SZABÓ G and TŐKE C (1998) Evolutionary prisoner’s dilemma game on asquare lattice. Physical Review E 58(1), 69–73.
TAN XD, LI SY, WANG CH, CHEN XQ and WU XM (2004) Severe acuterespiratory syndrome epidemic and change of people’s health behaviorin China. Health Education Research 19(5), 576–580.
TRAULSEN A, NOWAK MA and PACHECO JM (2006) Stochastic dynamics ofinvasion and fixation. Physical Review E 74(1), 011909.
VAN SEGBROECK S, SANTOS FC and PACHECO JM (2010) Adaptive contactnetworks change effective disease infectiousness and dynamics. PlosComputational Biology 6(8), e1000895.
Modeling infection spread and behavioral change Songnian Zhao et al 13
Health Systems