Modeling a Cortical Auxin Maximum for Nodulation: Different Signatures of Potential Strategies
19
ORIGINAL RESEARCH ARTICLE published: 28 May 2012 doi: 10.3389/fpls.2012.00096 Modeling a cortical auxin maximum for nodulation: different signatures of potential strategies Eva Elisabeth Deinum 1,2 *, René Geurts 2 ,Ton Bisseling 2 and Bela M. Mulder 1,3 1 Department of Systems Biophysics, FOM Institute AMOLF, Amsterdam, Netherlands 2 Laboratory of Molecular Biology, Wageningen University, Wageningen, Netherlands 3 Laboratory of Cell Biology, Wageningen University, Wageningen, Netherlands Edited by: Michael Knoblauch, Washington State University, USA Reviewed by: Winfried S. Peters, Indiana/Purdue University Fort Wayne, USA Nick Gould, Plant and Food Research, New Zealand *Correspondence: Eva Elisabeth Deinum, Department of Biomolecular Systems, FOM Institute AMOLF, Science Park 104, 1098 XG Amsterdam, Netherlands. e-mail: [email protected] Lateral organ formation from plant roots typically requires the de novo creation of a meris- tem, initiated at the location of a localized auxin maximum. Legume roots can form both root nodules and lateral roots. From the basic principles of auxin transport and metabo- lism only a few mechanisms can be inferred for increasing the local auxin concentration: increased influx, decreased efflux, and (increased) local production. Using computer sim- ulations we investigate the different spatio-temporal patterns resulting from each of these mechanisms in the context of a root model of a generalized legume. We apply all mech- anisms to the same group of preselected cells, dubbed the controlled area. We find that each mechanism leaves its own characteristic signature. Local production by itself can not create a strong auxin maximum. An increase of influx, as is observed in lateral root forma- tion, can result in an auxin maximum that is spatially more confined than the controlled area. A decrease of efflux on the other hand leads to a broad maximum, which is more similar to what is observed for nodule primordia. With our prime interest in nodulation, we further investigate the dynamics following a decrease of efflux. We find that with a homogeneous change in the whole cortex, the first auxin accumulation is observed in the inner cortex. The steady state lateral location of this efflux reduced auxin maximum can be shifted by slight changes in the ratio of central to peripheral efflux carriers.We discuss the implications of this finding in the context of determinate and indeterminate nodules, which originate from different cortical positions.The patterns we have found are robust under disruption of the (artificial) tissue layout. The same patterns are therefore likely to occur in many other contexts. Keywords: root nodules, auxin transport manipulation, modeling 1. INTRODUCTION 1.1. SETTING Legume roots can form two kinds of lateral organs: lateral roots and root nodules, the latter in response to Rhizobium-secreted sig- naling molecules named Nod factors. Although these organs are induced in different ways and their primordia originate from dif- ferent cell layers, in both cases local accumulation of the hormone auxin coincides with the site of primordium initiation (Larkin et al., 1996; Rolfe et al., 1997; Mathesius et al., 1998; Pacios-Bras et al., 2003; Takanashi et al., 2011). In this light it is not surpris- ing that the number of lateral roots can be increased by exogenous auxin application (Blakely and Evans, 1979; Woodward and Bartel, 2005). For root nodules, however, this is not the case. Auxin’s text- book antagonist, cytokinin, plays an important role in nodulation: a cytokinin receptor is essential for nodulation (Gonzalez-Rizzo et al., 2006; Murray et al., 2007; Tirichine et al., 2007; Plet et al., Abbreviations: DZ, Differentiation zone; Effl↓, scenario in which the efflux perme- ability is decreased in the controlled area (see Figure 1A); EZ, elongation zone; IAA, indole-3-acetic acid (an auxin); Infl↑, scenario in which the influx permeability is increased in the controlled area; Prod↑, Scenario in which all cells of the controlled area produce auxin. 2011) and exogenously applied cytokinin can induce nodule-like structures (Cooper and Long, 1994), as can auxin transport block- ers (Hirsch et al., 1989). In contrast, cytokinin has an inhibitory effect on lateral root formation (Laplaze et al., 2007), possibly by removing PIN1, an auxin efflux carrier upregulated in lateral root primordia, from the membranes of primordium cells (Marhavý et al., 2011). This apparent paradox hints at different mechanisms causing the initial auxin accumulation in either case. We hypothesize that the Nod factor activated cytokinin signaling causes the accumu- lation of auxin in the cortical cell layers of the root that form the nodule primordium. We investigate the possibilities for inducing local auxin accumulation by modeling three conceptually different mechanisms. We start with an unbiased analysis of their generic properties, than continue with the best candidate for nodulation. In the discussion we come back upon the likelihood that cytokinin can activate the proposed mechanism. 1.2. BACKGROUND To date lateral root formation is studied most extensively in the model organism Arabidopsis thaliana (Arabidopsis ). In this plant the lateral root originates exclusively from a few pericycle cells, www.frontiersin.org May 2012 |Volume 3 | Article 96 | 1
-
Upload
wageningen-ur -
Category
Documents
-
view
0 -
download
0
Transcript of Modeling a Cortical Auxin Maximum for Nodulation: Different Signatures of Potential Strategies

ORIGINAL RESEARCH ARTICLEpublished: 28 May 2012
doi: 10.3389/fpls.2012.00096
Modeling a cortical auxin maximum for nodulation:different signatures of potential strategiesEva Elisabeth Deinum1,2*, René Geurts2,Ton Bisseling2 and Bela M. Mulder 1,3
1 Department of Systems Biophysics, FOM Institute AMOLF, Amsterdam, Netherlands2 Laboratory of Molecular Biology, Wageningen University, Wageningen, Netherlands3 Laboratory of Cell Biology, Wageningen University, Wageningen, Netherlands
Edited by:
Michael Knoblauch, Washington StateUniversity, USA
Reviewed by:
Winfried S. Peters, Indiana/PurdueUniversity Fort Wayne, USANick Gould, Plant and Food Research,New Zealand
*Correspondence:
Eva Elisabeth Deinum, Department ofBiomolecular Systems, FOM InstituteAMOLF, Science Park 104, 1098 XGAmsterdam, Netherlands.e-mail: [email protected]
Lateral organ formation from plant roots typically requires the de novo creation of a meris-tem, initiated at the location of a localized auxin maximum. Legume roots can form bothroot nodules and lateral roots. From the basic principles of auxin transport and metabo-lism only a few mechanisms can be inferred for increasing the local auxin concentration:increased influx, decreased efflux, and (increased) local production. Using computer sim-ulations we investigate the different spatio-temporal patterns resulting from each of thesemechanisms in the context of a root model of a generalized legume. We apply all mech-anisms to the same group of preselected cells, dubbed the controlled area. We find thateach mechanism leaves its own characteristic signature. Local production by itself can notcreate a strong auxin maximum. An increase of influx, as is observed in lateral root forma-tion, can result in an auxin maximum that is spatially more confined than the controlledarea. A decrease of efflux on the other hand leads to a broad maximum, which is moresimilar to what is observed for nodule primordia. With our prime interest in nodulation,we further investigate the dynamics following a decrease of efflux. We find that with ahomogeneous change in the whole cortex, the first auxin accumulation is observed in theinner cortex. The steady state lateral location of this efflux reduced auxin maximum canbe shifted by slight changes in the ratio of central to peripheral efflux carriers. We discussthe implications of this finding in the context of determinate and indeterminate nodules,which originate from different cortical positions. The patterns we have found are robustunder disruption of the (artificial) tissue layout. The same patterns are therefore likely tooccur in many other contexts.
Keywords: root nodules, auxin transport manipulation, modeling
1. INTRODUCTION1.1. SETTINGLegume roots can form two kinds of lateral organs: lateral rootsand root nodules, the latter in response to Rhizobium-secreted sig-naling molecules named Nod factors. Although these organs areinduced in different ways and their primordia originate from dif-ferent cell layers, in both cases local accumulation of the hormoneauxin coincides with the site of primordium initiation (Larkinet al., 1996; Rolfe et al., 1997; Mathesius et al., 1998; Pacios-Braset al., 2003; Takanashi et al., 2011). In this light it is not surpris-ing that the number of lateral roots can be increased by exogenousauxin application (Blakely and Evans, 1979; Woodward and Bartel,2005). For root nodules, however, this is not the case. Auxin’s text-book antagonist, cytokinin, plays an important role in nodulation:a cytokinin receptor is essential for nodulation (Gonzalez-Rizzoet al., 2006; Murray et al., 2007; Tirichine et al., 2007; Plet et al.,
Abbreviations: DZ, Differentiation zone; Effl↓, scenario in which the efflux perme-ability is decreased in the controlled area (see Figure 1A); EZ, elongation zone; IAA,indole-3-acetic acid (an auxin); Infl↑, scenario in which the influx permeability isincreased in the controlled area; Prod↑, Scenario in which all cells of the controlledarea produce auxin.
2011) and exogenously applied cytokinin can induce nodule-likestructures (Cooper and Long, 1994), as can auxin transport block-ers (Hirsch et al., 1989). In contrast, cytokinin has an inhibitoryeffect on lateral root formation (Laplaze et al., 2007), possibly byremoving PIN1, an auxin efflux carrier upregulated in lateral rootprimordia, from the membranes of primordium cells (Marhavýet al., 2011).
This apparent paradox hints at different mechanisms causingthe initial auxin accumulation in either case. We hypothesize thatthe Nod factor activated cytokinin signaling causes the accumu-lation of auxin in the cortical cell layers of the root that form thenodule primordium. We investigate the possibilities for inducinglocal auxin accumulation by modeling three conceptually differentmechanisms. We start with an unbiased analysis of their genericproperties, than continue with the best candidate for nodulation.In the discussion we come back upon the likelihood that cytokinincan activate the proposed mechanism.
1.2. BACKGROUNDTo date lateral root formation is studied most extensively in themodel organism Arabidopsis thaliana (Arabidopsis). In this plantthe lateral root originates exclusively from a few pericycle cells,
www.frontiersin.org May 2012 | Volume 3 | Article 96 | 1

Deinum et al. Cortical auxin maximum for nodulation
called founder cells (Malamy and Benfey, 1997; Casimiro et al.,2003). The first auxin accumulation occurs in these cells (Hirotaet al., 2007). Arabidopsis roots contain only a single cortical layer.In model legumes, which all have a multi-layered cortex, the lateralroot primordia are also predominantly of pericycle origin (Mal-lory et al., 1970) and the first auxin accumulation is observed inthe pericycle (Larkin et al., 1996; Rolfe et al., 1997).
Nodules can be induced upon contact with a compatible Rhizo-bium strain, recognized by the plant through the precise chemicalstructure of the Nod factors the particular Rhizobium species pro-duces (Jones et al., 2007). Two major types of legume nodules exist:indeterminate and determinate, discerned by the presence of a per-sistent meristem in the former (Hirsch, 1992). The model legumeMedicago truncatula (Medicago) makes indeterminate, whereasLotus japonicus (Lotus), the other model legume, forms determi-nate nodules. Of special interest is that indeterminate nodules areformed from cell divisions induced in the inner cortical layers,while determinate nodule formation starts with divisions in moreouter cortical layers (Hirsch, 1992). Studies in Lotus and whiteclover have shown local auxin accumulation at the site of the cor-tical cell divisions (Mathesius et al., 1998; Pacios-Bras et al., 2003;Takanashi et al., 2011) respectively.
In legumes, lateral roots and root nodules originate in approx-imately the same zone of the root. The zone for nodule inductionis called the susceptible zone (Bhuvaneswari et al., 1981). Corticalcells in the susceptible zone have fully differentiated and will de-and redifferentiate in the process of nodule formation. Epidermalcells start developing root hairs from the youngest part of the sus-ceptible zone. In this paper we sometimes refer to the susceptiblezone of a legume using DZ (standing for “differentiation zone”)to stress the origin of the parameters we use (see Materials andMethods).
The phytohormone auxin is active in minute concentrations(typical measurements: tens to hundreds pg per mg fresh weight(Ljung et al., 2001; Marchant et al., 2002; Petersson et al., 2009, i.e.,1–102 μmol ml−1) and no methods exist for live monitoring ofthe actual auxin concentration. All available techniques for auxindetection are either indirect, or kill the plant, or both. This is a keyreason why analytical and computational models of auxin trans-port have become an important tool for studying the implicationsof auxin related hypotheses with high spatial and temporal reso-lution (see Kramer, 2008; Grieneisen and Scheres, 2009; Garnettet al., 2010; Jonsson and Krupinski, 2010; for some reviews). Theearliest models focused on the propagation of radio-labeled auxinthrough “linear” tissue (Mitchison, 1980; Goldsmith et al., 1981;Martin et al., 1990). With increasing computer power a plethoraof more complex developmental questions came within reach, ontopics such as phyllotaxis (Heisler and Jonsson, 2006; Jonsson et al.,2006; Smith et al., 2006; Bainbridge et al., 2008; Stoma et al., 2008),venation (Rolland-Lagan and Prusinkiewicz, 2005; Merks et al.,2007; Bayer et al., 2009; Wabnik et al., 2010), apical dominance(Prusinkiewicz et al., 2009), and root gradients (Swarup et al.,2005; Grieneisen et al., 2007; Laskowski et al., 2008; Jones et al.,2009).
Here, we will use a model of auxin transport and metab-olism to investigate different possible scenarios for local auxinaccumulation in the root cortex and relate the resulting patterns
of auxin accumulation to those observed upon Rhizobium Nodfactor induced signaling. To infer the possible scenarios we reca-pitulate the basics of auxin transport and metabolism. Auxin is aweak acid [the most abundant active natural auxin, indole-3-aceticacid (IAA), has pKa ≈ 4.8]. Its protonated form is uncharged andcan therefore passively cross the cell membrane. The apoplast ismildly acidic and thus contains a fair fraction of protonated auxin(e.g., 24% at pH = 5.3). The cytoplasm, however, is near neutraland thus hardly contains any protonated auxin (e.g., ≈0.4% atpH = 7.2; Jonsson et al., 2006). As only the concentration of pro-tonated auxin matters for the passive influx, the pH difference hasthe potential to drive a passive auxin influx against the difference intotal auxin concentration. Its magnitude is mostly determined bythe apoplastic pH as this is closest to the pKa. Moreover, the influxcan be enhanced by more than an order of magnitude by influxcarriers such as the AUX1/LAX protein family, that exploit the pro-ton gradient for the import of deprotonated auxin (Swarup et al.,2005). They are usually located homogeneously over the cell mem-brane, or at higher levels on both apical and basal sides (Swarupet al., 2001, 2004; Kleine-Vehn et al., 2006). Efflux of auxin occurspredominantly by active transport through efflux carriers such asthe PIN proteins (Galweiler et al., 1998; Paponov et al., 2005).The membrane PINs often appear concentrated at specific sides ofthe cells, giving rise to directional auxin transport (Benkova et al.,2003; Blilou et al., 2005). For information about the productionof auxin we refer to some reviews (Ljung et al., 2002; Woodwardand Bartel, 2005).
1.3. APPROACHReasoning from this overview of auxin transport and metabo-lism we arrive at three major scenarios for increasing the auxinconcentration inside a cell: increasing the amount of influx carri-ers, decreasing the amount of efflux carriers and (activating) localauxin production. These scenarios we will refer to by (n-fold)Infl↑, Effl↓, and Prod↑, respectively. In this “n-fold” refers to thefactor of increase or decrease compared to the starting situation,respectively.
For Infl↑ we specifically focus on the carriers, as changes in thepassive influx (such as resulting from changes of the apoplasticpH) will be practically the same on both sides of the wall. As aresult the change in the influx capacity will be almost fully com-pensated by an opposite change in the apoplastic concentration,with hardly any change in the intracellular concentration in eithercell (c.f. For the same reason Grieneisen et al., 2007 found nonoticeable effect of the, in their case uniform, influx permeabilityon the intracellular auxin concentrations, despite large variationsin the values tested).
We will not consider a decrease of auxin degradation, becausethis part of the root has to support the passage of auxin fromshoot to root tip. To increase the local auxin concentration througha decrease of degradation by any significant degree, a large basedegradation rate is required. This is inconsistent with auxin’s func-tion as a long range signal. We will neither consider (the reversibleforms of) conjugation and deconjugation of auxin, as this wouldeither complicate the model by having separately to account for theconjugate concentrations, next to active concentrations, or, with-out this, reduce to a combination of decay and production that
Frontiers in Plant Science | Plant Biophysics and Modeling May 2012 | Volume 3 | Article 96 | 2

Deinum et al. Cortical auxin maximum for nodulation
need to (almost completely) balance each other on the cell level inorder to sustain long range auxin signaling.
Starting from these scenarios we aim to tackle the followingquestions: which changes in auxin transport/metabolism in thecortex of the DZ can create a sufficiently strong cortical auxinmaximum as is observed in root nodule initiation? Furthermore,how do the different scenarios relate to observed patterns of auxinaccumulation in nodulation and lateral root formation?
1.4. KEY FINDINGSWe find that these three scenarios produce clearly different spatialsignatures, of which Effl↓ is most compatible with nodulation.The time scales of auxin accumulation under Infl↑ and Effl↓ arecomparable and both sufficiently fast to be compatible with theexperimentally observed timing of early nodulation events.
We also find that the lateral position of a cortical auxin max-imum can be shifted by minor changes in the distribution ofcortical PINs. Based on this observation we formulate the tenta-tive hypothesis that differences in the distribution of cortical PINscould determine the lateral position of the early cell divisions innodulation. This in turn is correlated with the nodule type.
The signatures we have found occur consistently and robustly.We therefore argue that the understanding of these different signa-tures is of general importance for the area of plant development.
2. RESULTS2.1. SIGNATURES OF INCREASING INFLUX, DECREASING EFFLUX, AND
LOCAL AUXIN PRODUCTIONLacking the relevant PIN data for model legumes we have cre-ated an in silico DZ root segment based on the Arabidopsis modelby Laskowski et al. (2008) by adapting the tissue geometry. Theresulting segment has five cortical layers, which is typical for themodel legumes Lotus and Medicago (Figure 1A). The PIN layoutof the DZ root segment is shown in Figure 1B. This layout resultsin a strong rootward flux in the stele and a shootward flux in thecortex and epidermis. The equal amount of PINs on the inner andouter sides of the cortical cells, results in a flat transverse auxinconcentration profile in the cortex. More details on the creation ofthe root segment and the verification of the boundary conditionsare provided in the Methods section (3).
From the available knowledge on auxin transport and metab-olism we have identified three scenarios that could in theory leadto a local auxin maximum (Infl↑, Effl↓, and Prod↑). To assesswhether these scenarios actually are compatible with the eventsthat occur during nodulation we applied each scenario separatelyto a block of cells on one (lateral) side of the DZ fragment, dubbedthe controlled area. It has a length of 500 μm (in the simulations5 cells long), which corresponds well with the typical length of anodule primordium. The controlled area includes all cortical lay-ers and the epidermis, as indicated in Figure 1A. For simplicitywe assume that the parameter change as a reaction to Nod factorperception is the same for all cells in the controlled area.
In this text, the word segment is reserved for the whole simu-lation domain (Figure 1A). A segment without any (additional)change in the controlled area is called a reference segment.
We first focused on the steady states of each scenario as obtainedfrom evaluating the model. Although all three scenarios resulted
in at least some increase of the local auxin concentration, theireffects were remarkably different.
With an increase of the influx permeability, we observed a strongincrease of the auxin concentration only in the most shootwardcells of the controlled area (Figure 1C). Considering the mainflow directions of auxin through the controlled area (i.e., throughcortex and epidermis), this corresponds to its downstream side.This strong focus on the most downstream cells inside the con-trolled area was independent of the length [number of cells inthe longitudinal/(y)-direction] of the controlled area (data notshown). This means that the area of the strong(est) auxin accu-mulation can be much smaller than the area with increased influxactivity. A 10-fold (but not a 4-fold) Infl↑ change was suffi-cient for increasing the cortical auxin concentration above thevascular auxin concentration in the reference segment Cv, whichthroughout we use as our unit of concentration.
A decrease of the efflux permeability on the other hand resultedin a fairly homogeneous increase throughout the whole controlledarea, independent of the reduction factor (Figure 1D). In all casesthe auxin accumulation showed a slight maximum on the down-stream (shootward) side in the area. This bias, however, was muchweaker than with an increase of auxin influx. A 10-fold (but not a4-fold) Effl↓ change was sufficient for increasing the cortical auxinconcentration above the vascular level Cv.
Local auxin production in the controlled area led to a ill confinedincrease of the local auxin concentration, reaching at most a smallfraction of the resting state vascular concentration Cv (Figure 1E),even with what we considered a high production rate (estimatedfrom gas chromatography and mass spectroscopy measurementsby Ljung et al., 2001; Marchant et al., 2002). This cannot be con-tributed to a too low production rate, but happened because thelocally produced auxin is transported away and accumulates some-where else. With the highest production rate tested (p = 10−3
Cv μm−3 s−1) the absolute increase of the auxin concentrationwas larger in the vascular tissue rootward from the production sitethan in the controlled area itself. This is in marked contrast to theother two scenarios, in which the changes of the auxin concentra-tion were limited to the controlled area and a small surroundingregion.
In biological tissues the cells are not aligned in a square pat-tern as in our idealized root segment. We therefore also testedour scenarios on randomly generated root segments without lat-eral alignment between cell files and with variable cell lengths. Allsignatures were conserved (Figures 1F–H).
From the three mechanisms tested, only the reduction of theefflux permeabilities (Effl↓) resulted in a strong auxin accumula-tion that was fairly homogeneous along the length of the controlledarea, as is observed in nodulation. Increased influx (x) resulted ina too narrow (single cell wide) maximum and local auxin produc-tion alone could not yield a local auxin maximum in the cortex atall. We therefore focused on Effl↓ for the rest of this study.
We next asked how fast auxin accumulates under this scenario,what determines the time scales of auxin accumulation in thiscase and where the accumulation starts. The final steady stateauxin maximum spanned all layers of the cortex, whereas thecell divisions founding a nodule occur either in the inner, or theouter cortex, depending on the legume species. To gain insight
www.frontiersin.org May 2012 | Volume 3 | Article 96 | 3

Deinum et al. Cortical auxin maximum for nodulation
FIGURE 1 | Effect of single changes in the controlled area on steady state
auxin concentrations. (A) Layout of the root segment and the maindirections of auxin flow. Throughout the text the word “segment” refers tothe whole simulation domain, including the parts not shown in the figures.Thesame parameter change is applied to all cells in the controlled area (indicatedby a gray block). The gray arrows indicate the main flow direction in the steleand cortex. Stylized leaves and root tips are used throughout the manuscriptto indicate the orientation of the root segments. (B) Effective effluxpermeabilities for each cell from center to periphery. Following Laskowskiet al. (2008) we distinguish three levels: high, low, and bg (background). (C,F)
Increase of influx permeability (Pin) by an increasing factor (as shown left of
the pictures). (D,G) Reduction of all efflux permeabilities (Pout,x). (E,H) Localauxin production with rate p (in Cv s−1 μm−3). (F–H) The strongest change fromeach category was repeated on randomly generated realistic tissue layouts,with an average cell length of 100 μm, normally distributed with σ = 4 μm.The controlled area consists of all cells that fall in the desired area with morethan 50% of their volume. (C + F, D + G) Note that with increasing the influxthe effect concentrates on the downstream side of the controlled area,whereas the effect of decreasing all efflux with the same factor is much morehomogeneous over the controlled area. For maximum information the auxinconcentration color gradient is rescaled for each picture. The gradient alwaysstarts from 0 and the maximum value is indicated per picture.
into this lateral confinement of the auxin accumulation we lookedinto both the dynamics of auxin accumulation after a change inthe controlled area and the impact of slight changes of the lat-eral cortical PINs on the lateral position of the steady state auxinmaximum.
2.2. TIME EVOLUTION OF AUXIN ACCUMULATION2.2.1. Auxin accumulation following Effl↓ is sufficiently fastAfter studying the steady state patterns the first important questionwas: is auxin accumulation following reduction of the efflux fastenough to explain the Rhizobium induced cortical cell responses?To be compatible with the formation of a nodule primordium,a scenario should yield a sufficient increase in auxin concentra-tion at least several hours prior to the first cortical cell divisions.For this a time window of at most 20 h is available: cortical cellsshow cytoskeletal signs of activation for division after 18–24 hafter inoculation (Timmers et al., 1999) and no cortical cell divi-sions are observed within 20 h after inoculation (Yang et al., 1994).The actual time window is probably even shorter, as we startthe clock at the moment the cells change with respect to auxin
dynamics (which is instantaneously in this model). In reality, thetranscription and translation of regulatory genes likely reduces theavailable time window by a few hours.
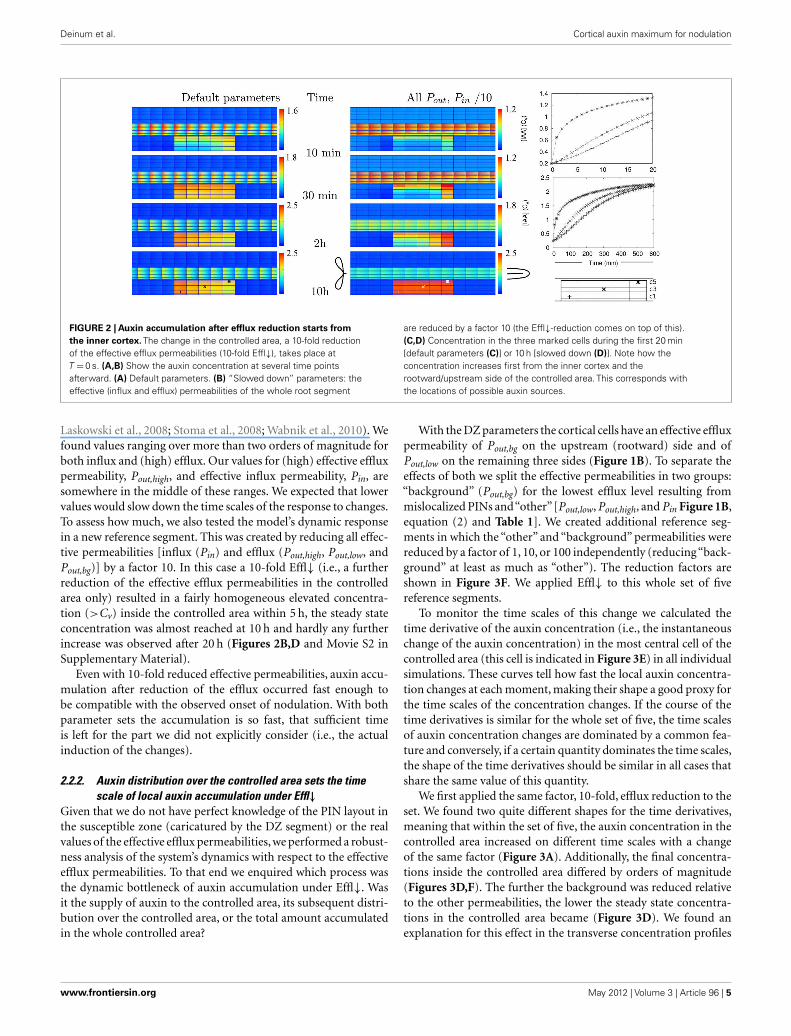
We only investigated the dynamics for the strongest (=10-fold)Effl↓ and Infl↑ changes from Figures 1C,D, respectively, becausethey have the longest adaptation times. With Effl↓, a fairly homo-geneous elevated concentration over the whole controlled area wasobserved within 30 min and almost no further changes occurredafter 2 h (Figures 2A,C and Movie S1 in Supplementary Material).Adaptation to a 10-fold Infl↑ was even faster (Figures A1A,B).Both processes happened much faster than strictly required, imply-ing that either our dynamics is too fast, or that the time scales forauxin accumulation are dominated by other processes, such as theinduction and buildup of the changes in efflux (or influx) per-meabilities that are implemented as instantaneous changes in oursimulations.
We have calculated (wherever possible) or estimated the effec-tive influx and efflux permeabilities used by other authors (Gold-smith et al., 1981; Kramer, 2004; Swarup et al., 2005; Heislerand Jonsson, 2006; Jonsson et al., 2006; Grieneisen et al., 2007;
Frontiers in Plant Science | Plant Biophysics and Modeling May 2012 | Volume 3 | Article 96 | 4
Deinum et al. Cortical auxin maximum for nodulation
FIGURE 2 | Auxin accumulation after efflux reduction starts from
the inner cortex. The change in the controlled area, a 10-fold reductionof the effective efflux permeabilities (10-fold Effl↓), takes place atT = 0 s. (A,B) Show the auxin concentration at several time pointsafterward. (A) Default parameters. (B) “Slowed down” parameters: theeffective (influx and efflux) permeabilities of the whole root segment
are reduced by a factor 10 (the Effl↓-reduction comes on top of this).(C,D) Concentration in the three marked cells during the first 20 min[default parameters (C)] or 10 h [slowed down (D)]. Note how theconcentration increases first from the inner cortex and therootward/upstream side of the controlled area. This corresponds withthe locations of possible auxin sources.
Laskowski et al., 2008; Stoma et al., 2008; Wabnik et al., 2010). Wefound values ranging over more than two orders of magnitude forboth influx and (high) efflux. Our values for (high) effective effluxpermeability, Pout,high, and effective influx permeability, Pin, aresomewhere in the middle of these ranges. We expected that lowervalues would slow down the time scales of the response to changes.To assess how much, we also tested the model’s dynamic responsein a new reference segment. This was created by reducing all effec-tive permeabilities [influx (Pin) and efflux (Pout,high, Pout,low, andPout,bg)] by a factor 10. In this case a 10-fold Effl↓ (i.e., a furtherreduction of the effective efflux permeabilities in the controlledarea only) resulted in a fairly homogeneous elevated concentra-tion (>Cv) inside the controlled area within 5 h, the steady stateconcentration was almost reached at 10 h and hardly any furtherincrease was observed after 20 h (Figures 2B,D and Movie S2 inSupplementary Material).
Even with 10-fold reduced effective permeabilities, auxin accu-mulation after reduction of the efflux occurred fast enough tobe compatible with the observed onset of nodulation. With bothparameter sets the accumulation is so fast, that sufficient timeis left for the part we did not explicitly consider (i.e., the actualinduction of the changes).
2.2.2. Auxin distribution over the controlled area sets the timescale of local auxin accumulation under Effl↓
Given that we do not have perfect knowledge of the PIN layout inthe susceptible zone (caricatured by the DZ segment) or the realvalues of the effective efflux permeabilities, we performed a robust-ness analysis of the system’s dynamics with respect to the effectiveefflux permeabilities. To that end we enquired which process wasthe dynamic bottleneck of auxin accumulation under Effl↓. Wasit the supply of auxin to the controlled area, its subsequent distri-bution over the controlled area, or the total amount accumulatedin the whole controlled area?
With the DZ parameters the cortical cells have an effective effluxpermeability of Pout,bg on the upstream (rootward) side and ofPout,low on the remaining three sides (Figure 1B). To separate theeffects of both we split the effective permeabilities in two groups:“background” (Pout,bg) for the lowest efflux level resulting frommislocalized PINs and“other”[Pout,low, Pout,high, and Pin Figure 1B,equation (2) and Table 1]. We created additional reference seg-ments in which the “other” and “background” permeabilities werereduced by a factor of 1, 10, or 100 independently (reducing“back-ground” at least as much as “other”). The reduction factors areshown in Figure 3F. We applied Effl↓ to this whole set of fivereference segments.
To monitor the time scales of this change we calculated thetime derivative of the auxin concentration (i.e., the instantaneouschange of the auxin concentration) in the most central cell of thecontrolled area (this cell is indicated in Figure 3E) in all individualsimulations. These curves tell how fast the local auxin concentra-tion changes at each moment, making their shape a good proxy forthe time scales of the concentration changes. If the course of thetime derivatives is similar for the whole set of five, the time scalesof auxin concentration changes are dominated by a common fea-ture and conversely, if a certain quantity dominates the time scales,the shape of the time derivatives should be similar in all cases thatshare the same value of this quantity.
We first applied the same factor, 10-fold, efflux reduction to theset. We found two quite different shapes for the time derivatives,meaning that within the set of five, the auxin concentration in thecontrolled area increased on different time scales with a changeof the same factor (Figure 3A). Additionally, the final concentra-tions inside the controlled area differed by orders of magnitude(Figures 3D,F). The further the background was reduced relativeto the other permeabilities, the lower the steady state concentra-tions in the controlled area became (Figure 3D). We found anexplanation for this effect in the transverse concentration profiles
www.frontiersin.org May 2012 | Volume 3 | Article 96 | 5

Deinum et al. Cortical auxin maximum for nodulation
Table 1 | Overview of model parameters.
Parameter (Default) value Description
DC 300 μm2 s−1 Auxin diffusion constant inside cells (Laskowski et al., 2008)
DW 44 μm2 s−1 Auxin diffusion constant in apoplast (Jones et al., 2009)
Pout,high 20 μm s−1 Effective efflux permeability, high value (Grieneisen et al., 2007; Laskowski et al., 2008)
Pout,low 5 μm s−1 Effective efflux permeability, low value (Grieneisen et al., 2007; Laskowski et al., 2008)
Pout,bg 1 μm s−1 Effective efflux permeability, background value (due to misplaced PINs Grieneisen et al., 2007; Laskowski et al.,
2008)
Pin 20 μm s−1 Effective influx permeability (Grieneisen et al., 2007; Laskowski et al., 2008)
Cv Concentration The average auxin concentration in the vascular tissue is normalized to 1 Cv. (Strictly speaking, Cv is not a
parameter.)
p 0 Cv μm–3 s−1 Auxin production rate; default: no production. Estimates for reasonable rates based on (Ljung et al., 2001), scaled
relative to total concentrations (Marchant et al., 2002): order 10−4 Cv μm−3s−1.
l 100 μm Cell length
wC 20 μm Width of cortical cells
wx 10 μm Width of other cells
dW 0.2 μm Wall thickness (Jones et al., 2009)
dp 2 μm Pixel size for the cells’ interior
t 0.5, 1, 2.5 s Integration time step (dependent on interval between measurements)
of the reference segments. Actually, in all five cases the corticalconcentration in the controlled area increased with a similar fac-tor, but the starting level, or resting state cortical concentration,varied. As we always normalized the vascular concentration to 1Cv for ease of interpretation (see Materials and Methods), the rest-ing state cortical concentration necessarily differed among thesesegments. From a 1D calculation along a transverse (x-direction)section with the DZ PIN layout we obtained a first order estimate
for the resting state cortical concentration:Pout ,bg
Pout ,lowCv . Any devia-
tions from this must result from diffusive transport through theapoplast, which is always part of our model. The impact of dif-fusive transport will be larger for lower (influx) permeabilities, asauxin molecules will then typically remain longer in the apoplastbefore re-entering a cell.
We also calculated 100 and 1000-fold Effl↓ for the set of fivesegments and plotted their time derivatives with (Figure 3B) simi-lar steady state concentrations and (Figure 3C) equal Pout,low in thecontrolled area. Only in the last case, the course of the time deriva-tives was very similar for all five segments. Revisiting Figures 3A,Bwith this observation in mind, it became clear that also in the othertwo cases the curves of root segments with equal Pout,low in thecontrolled area have a similar shape.
In summary: the amount of auxin available in the cortexdetermines the level of auxin accumulation with a given degreeof efflux reduction. This is a property of the PIN layout ofthe whole segment, especially its lateral components. The effluxlevel inside the controlled area (which in this case is mostlyset by Pout,low) determines the time scales of auxin accumu-lation, apparently independent of the supply from outside thecontrolled area. This implies that the final efflux level in the con-trolled area (the region of the nodule primordium in biologicalterms) is important for predicting the time scale of local auxinaccumulation, rather than the reduction factor compared to theunaffected root.
2.2.3. Auxin accumulation under Effl↓ starts close to auxin sourcesLooking closer at Figure 2 and Movies S1 and S2 in Supplemen-tary Material we observe that despite the homogeneous changein the parameters, the initial auxin accumulation is strongest ontwo sides of the controlled area: the inner cortex and the root-ward (=upstream) side. This is most pronounced in the referencesegment with 10-fold reduced parameters (Figures 2B,D). Thisis particularly interesting, as in legumes forming indeterminatenodules the formation of the primordium occurs predominantlyin the inner cortex.
To assess the importance of this transient phenomenon werepeated the analysis from section 2 for the inner cortex (mid-dle of the controlled area; data not shown). We found that also inthe inner cortex the time scales are dominated by the efflux levelinside the controlled area/Pout,low. The finding that the initial rateof auxin accumulation was faster in the inner cortex than in thecentral cortex was consistently retrieved in all reference segmentsand for different reduction factors (Figure A2 in Appendix). Theduration of the period with faster auxin accumulation in the innercortex than in the middle cortex strongly depended on the value ofPout,low in the controlled area, rather than the factor of efflux reduc-tion (compare both parts of Figure A2 in Appendix). The lowerPout,low in the controlled area, the longer this period, so the greaterthe importance of the inner cortex dominated transient state.
2.3. PRECISE DISTRIBUTION OF CORTICAL PINs CAN SHIFT THELATERAL POSITION OF THE AUXIN MAXIMUM
Determinate and indeterminate nodules differ in the radial posi-tion of the root cortical cell divisions from which they originateand (most likely) also in the position of the correlated auxinmaximum. The formation of indeterminate nodules starts in theinner cortex, whereas determinate nodule formation occurs in theouter cortex (Libbenga and Harkes, 1973; Mathesius et al., 1998;Timmers et al., 1999; Pacios-Bras et al., 2003; Takanashi et al.,
Frontiers in Plant Science | Plant Biophysics and Modeling May 2012 | Volume 3 | Article 96 | 6

Deinum et al. Cortical auxin maximum for nodulation
FIGURE 3 | Determinants of time scales. To determine what factor governsthe time scales of auxin accumulation in the controlled area (CA in the scopeof this figure) under Effl↓ we followed the changes in the auxin concentrationover time in five different reference segments, created by reducing theeffective permeabilities with different factors for Pout,bg and all others(Pother = {Pout,low, Pout,high, Pin}). (A–C) Each graph shows simulations that share acommon factor. If all five curves have a similar shape, this common factor isthe most likely key determinant of the auxin accumulation time scales. (A–C)d[IAA]
dtIn the most central cell of the CA [indicated with “X” in (E)]. (A) Ten-fold
(further) reduction of efflux inside the CA. Steady state profiles and overviews
matching these curves in (D,F) respectively. (B) Similar steady state [IAA] inthe CA: [IAA]CA ≈ 2–6 Cv. (C) Pout,low = 0.05 μm s−1 inside the CA. (D) Steadystate [IAA] profile along the dotted line in (E) for all curves in (A). (F) Legendfor all: Pout,bg/100, Pother/1 red pluses, Pout,bg/10, Pother/1 cyan crosses, Pout,bg/1,Pother/1 (original DZ segment) green asterisks, Pout,bg/100, Pother/10 blue opensquares, Pout,bg/10, Pother/10 magenta filled squares, next to steady states forthe curves in (A). Note that only in (C) all five curves show a similar shape.This implies that the value of Pout,low in the CA, which governs the distributionof auxin over the CA, is the key determinant of the time scales of local auxinaccumulation under Effl↓.
2011). Despite an early increase from the inner cortex (andupstream edge), in our simulations so far the system reached asteady state with a homogeneous increase of the auxin concentra-tion over the full width of the cortex. Coincidentally, the lateralPINs in our DZ reference segment are equally strong on the central
and peripheral sides. We wondered if a bias in the lateral PINpositioning in the cortex, either to the periphery or the center,could shift the lateral position of the auxin maximum resultingfrom Effl↓ and if this would still allow for a sufficiently strongmaximum.
www.frontiersin.org May 2012 | Volume 3 | Article 96 | 7

Deinum et al. Cortical auxin maximum for nodulation
FIGURE 4 | Shifting the auxin maximum by changing the ratio of lateral
PINs in the cortex. All maxima are induced by 10-fold decreased efflux(Effl↓). The cartoon on top shows the ratio of peripheral to central lateral PINs
in each cortical cell of the root segment. The original DZ segment is indicatedwith*. Note that in all cases the highest concentration in the controlled area iswell above the vascular concentration Cv.
To test this we created a set of reference segments based onthe original DZ segment but with a varying ratio of inward to out-ward effective efflux permeability in the lateral walls of the corticalcells. We fixed the inward effective efflux permeability at Pout,low
and varied the outward efflux permeability. We then applied a 10-fold Effl↓ to these segments (Figure 4). Indeed the lateral positionof the maximum shifted along with the changes of the effectiveefflux permeability: most auxin accumulated on the side of thecontrolled area (inner/outer) of the largest effective efflux perme-ability. In all cases the maximum cortical concentration was wellabove the vascular level Cv.
Our scenario Effl↓ for the reduction of the effective effluxpermeability preserves the inward to outward ratio inside the con-trolled area. As a consequence, changes in this ratio can shift thelateral position of the resulting cortical auxin maximum frominner to outer cortex. This means that the same change of effectiveefflux permeabilities can result in cortical auxin maxima in differ-ent positions, depending on the PIN layout of the root segmentconcerned. In the discussion we will return to the importance oftransient and steady state patterns relative to each other.
2.4. ENDODERMAL PIN LAYOUT STRONGLY AFFECTS NODULATIONPOTENTIAL
The DZ PIN layout was the obvious choice for the susceptiblezone, but as we did not start from actual legume PIN localizationstudies in the susceptible zone we asked ourselves if the EZ layoutwould also allow for the creation of a cortical auxin maximum.
If yes, this would imply that the location of the susceptible zoneis likely determined independent of the PIN layout (e.g., by thepresence of growing root hairs only). If not, we could perhapsidentify the feature of the PIN layout responsible for the differencein behavior.
We compared the response to 10-fold Infl↑ and Effl↓ in the DZand a similarly created EZ segment. To make the EZ root segmentwe changed the PIN layout (but not the cell sizes) of the DZ rootsegment, again according to the layout from Laskowski et al. (2008;Figure 5I). This layout differs in two ways from the DZ layout: Inthe EZ segment the endodermis has a PIN level at the inwardand rootward side, rather than ubiquitous and low as in the DZsegment. Additionally, the PIN level at the shootward side of thecortex cells is high in the EZ segment and low in the DZ segment.
Contrary to the DZ root segment (Figures 5C,D), stronglyincreasing influx or decreasing efflux in the controlled area of theEZ segment showed little effect (Figures 5K,L). The auxin concen-tration in the controlled area did increase (Figures 5G,H), but thehighest concentration reached was low compared to the vascularauxin concentration Cv (Figures 5K,L).
This can be understood from the (resting state) auxin pro-files: they arise as a direct consequence of the segment’s PINlayout (Figures 5A,I). Compared to the DZ segment, the EZsegment contained far less auxin in the cortex and the auxin con-centration declined toward the outer cortex (Figures 5G,H,J).The DZ segment, on the other hand, showed a flat transversecortical profile (Figures 5B,E,F). As in the case with reduced
Frontiers in Plant Science | Plant Biophysics and Modeling May 2012 | Volume 3 | Article 96 | 8

Deinum et al. Cortical auxin maximum for nodulation
FIGURE 5 | Increased influx and decreased efflux in different zones
of the root. The same change in parameters has a different impact withdifferent PIN layouts (but equal tissue geometry). (A–F) DZ, (G–L) EZparameters. Parameters for the left half of the root (A,I) on top(Pout-levels: red for “high,” cyan for “low,” and white for “bg” as inFigure 1B). The EZ PIN layout results in a much lower auxinconcentration in the cortex [compare reference profiles (B,J)]. As a
result, the impact of increasing the influx (C,K) or decreasing the efflux(D,L) is hardly visible with the EZ parameters (K,L). (E–H) Showtransverse concentration profiles on a logarithmic scale through themiddle of the rows of cells indicated in (C,D,K,L) at the shootward androotward side of the controlled area (Infl↑: cyan, Effl↓: blue). Note howthe shape of the profiles in the controlled area largely resembles theshape of the respective reference profiles (in red).
permeabilities (Figure 3D) the profile within the controlled areaalways resembled the reference profile, apart from a certain offset(Figures 5E–H).
These results show that the creation of a cortical auxin max-imum is much harder with the EZ PIN layout than with the DZPIN layout. As the only difference in PIN layout between the EZ(with little auxin increase upon 10-fold Effl↓) and the rightmostsegment in Figure 4 is in the endodermis, this has to be the dif-ferentiating element. The transverse concentration profiles showthat the difference in the endodermal PINs results in a much loweramount of auxin in the cortex (Figures 5B,E–H,J), explaining thedifferent nodulation potential.
3. DISCUSSION3.1. AUXIN ACCUMULATION IN NODULATIONOur simulations have yielded distinct auxin accumulation signa-tures for all conceptually different scenarios for creating a local
auxin maximum along a root [increasing influx (Infl↑), decreasingefflux (Effl↓), and local auxin production (Prod↑)]. One of these,Effl↓, provides a scenario that is most compatible with Nod fac-tor induced cortical cell divisions, which form the start of noduleformation.
At the start of nodule primordium formation auxin accumu-lates either in the inner or outer cortex with a homogeneousconcentration in a region of several cells long (Pacios-Bras et al.,2003; Takanashi et al., 2011). Of the three simple scenarios Effl↓ isthe only one that yields an auxin concentration that is both strongand fairly homogeneous along the length of the root (Figure 1D).Moreover, the lateral location of this position can be shifted bysmall changes in the lateral PINs in the cortex (Figure 4), allow-ing for both “Lotus” and “Medicago” locations of the inducedauxin maximum. The downregulation of PIN proteins (Effl↓)as the mechanism behind auxin accumulation in the corticalcells that will form a nodule primordium is also compatible with
www.frontiersin.org May 2012 | Volume 3 | Article 96 | 9

Deinum et al. Cortical auxin maximum for nodulation
several lines of experimental evidence: The induction of nodule-like structures with auxin transport blocker NPA (Hirsch et al.,1989; Rightmyer and Long, 2011), a decrease of polar auxin trans-port 24 h after treatment with Rhizobium (van Noorden et al.,2006).
A cytokinin response is observed early in nodulation (Frugieret al., 2008; Plet et al., 2011). A gain of function mutation ofa specific cytokinin receptor results in spontaneous pseudon-odule formation (Tirichine et al., 2007) and several cytokininresponse regulators are induced in nodule primordia (Op denCamp et al., 2011; Plet et al., 2011). Moreover, this key nodulationhormone caused a reduction of PIN expression and/or membranelocalization in several Arabidopsis tissues (Dello Ioio et al., 2007,2008; Pernisova et al., 2009; Ruzicka et al., 2009; Marhavý et al.,2011).
Therefore we argue that cytokinin is a likely candidate forinducing a removal of PIN proteins from the membrane innodulation, leading to local auxin accumulation.
In our simulations auxin accumulation through efflux reduc-tion was fast enough to be compatible with the known timing ofnodulation events (Yang et al., 1994; Timmers et al., 1999). Inter-estingly, the auxin accumulation started from the inner cortex(Figure 2 and Movies S1 and S2 in Supplementary Material), eventhough the change (reduction of efflux) occurred simultaneouslyin all cells of the controlled area. This “head start” for the innercortex became more pronounced if the effective efflux level in thecortex was reduced to a lower value (Figures 2A,B and Figure A2in Appendix).
The current view, in which Nod factor signaling inducescytokinin production, which reduces the amount of PIN in themembranes and thus invokes local auxin accumulation, invokes anaive question: why has the pathway evolved such that it includescytokinin? Is this contingent, or necessary? In other words: wouldit be possible to create a cortical auxin maximum without asecondary signal such as cytokinin, but with a direct auxin signal?
First thing to note is that such a scenario is similar to our localproduction scenario (Prod↑). Most of the auxin signal (whetherof epidermal or rhizobial origin) would be transported away fromthe production site and the little local increase will be ill con-fined (as in Figures 1E,H. Moreover, due to the net shootwardflux in the cortex the strongest accumulation will occur lon-gitudinally shifted relative to the production site. These issuesare further illustrated in Figure A4 in Appendix. The use of asecond signal, that is not transported away like auxin, bypassesthis problem. Such a signal could induce local changes in theauxin transport system, which would then result in local auxinaccumulation. Indeterminate nodules such as those of Med-icago species are also in another way incompatible with a directauxin signal. These nodules are formed from the inner cortex(Timmers et al., 1999). A direct auxin signal, if effective at all,would always induce divisions starting from the outer cortex.We have observed that under Effl↓, auxin accumulation natu-rally starts from the sources of auxin, notably the inner cortex(Figure 2).
From this we hypothesize that a secondary signal, in this casecytokinin, is required to induce a cortical auxin maximum in thevicinity of the original epidermal Rhizobium infection.
3.2. THE ACCUMULATION MECHANISM AFFECTS THE DIMENSIONSOF THE PRIMORDIUM
We have observed that in Medicago nodule primordia have a typ-ical width of 5–6 undivided cortical cells which is much broaderthan a lateral root primordium (data not shown). Could thisbe a consequence of the mechanism underlying the local auxinaccumulation?
Several authors have shown that in Arabidopsis the influx carrierAUX1 is strongly upregulated in the pericycle cells founding thelateral root primordium and their descendants, including the earlyprimordium stages (Marchant et al., 2002; Laskowski et al., 2008).We observed from our simulations that with increased influx amuch narrower auxin maximum is formed than with decreasingefflux. This maximum can even be much narrower than the zoneof Aux1/Lax expression. Data by Hirota et al. (2007) actually showan auxin maximum that is more focused than the known area ofAUX1 expression.
This combination of experimentally observed morphologiesand auxin accumulation patterns together with the distinct pat-terns resulting from different scenarios for auxin accumulationlead to the hypothesis that the mechanism used for local auxinaccumulation in a given case affects the dimensions of theemerging organ.
3.3. STEADY STATE VS. TRANSIENT PATTERNSWe have identified two mechanisms that affect the lateral positionof the Effl↓ induced local auxin maximum. A possibility for shift-ing the steady state maximum toward either the inner or the outercortex is changing the inward: outward ratio of lateral PINs in thecortex. In that case the steady state maximum will occur on theside of the largest effective efflux permeability (Figure 4). Fromthe dynamics we have observed that without such a lateral bias,the inner cortex accumulates auxin faster than the outer and mid-dle layers (Figures 2 and Figure A2 in Appendix). Specially forstrong reductions of the efflux transient patterns could becomemore important for development than the steady state. How dothese two findings interact?
For an auxin maximum in the inner cortex we found two pos-sibilities. The first is a very strong reduction of the efflux, tosuch a low level that the transient state becomes the only rel-evant one. The second comprises any reduction that is strongenough to obtain a sufficiently high steady state concentrationat the location of the maximum, combined with an inward bias ofthe lateral cortical PINs. In that case the steady state and transientpatterns will be similar, both with the strongest accumulation inthe inner cortex. Moreover, with less auxin available in the outercortex, the vascular tissue will become practically the only auxinsource. This would strongly reduce the auxin accumulation fromthe upstream/rootward side of the controlled area we observed inFigure 2, reducing the dynamical rootward/shootward differencesin the process of the local auxin accumulation.
For an auxin maximum in the outer cortex, on the other hand,it seems important that the minimal efflux level in the region ofthe primordium does not become too low, as that would proba-bly result in a long lived transient maximum in the inner cortex,something that has not been reported in auxin reporter studies inLotus (Pacios-Bras et al., 2003; Takanashi et al., 2011). Therefore it
Frontiers in Plant Science | Plant Biophysics and Modeling May 2012 | Volume 3 | Article 96 | 10

Deinum et al. Cortical auxin maximum for nodulation
is more likely that in this case the steady state dominates the devel-opment. A slight efflux bias toward the outer side could furtherincrease the auxin accumulation in the outer cortex.
3.4. ARE CORTICAL PINs DISTRIBUTED DIFFERENTLY FORDETERMINATE AND INDETERMINATE NODULES?
A key difference between determinate and indeterminate nod-ules is the main site of the primordial cell divisions: the outeror the inner cortex respectively. This has also been observed in thelocation of auxin accumulation (Mathesius et al., 1998; Pacios-Bras et al., 2003; Takanashi et al., 2011). Under the strict, but notnecessarily fully true, assumption that the location of auxin accu-mulation perfectly predicts the division site and this turn perfectlypredicts nodule type, we like relate our findings for the formationdifferent nodule types.
The phylogenetic distribution of determinate and indetermi-nate nodule types within the legumes can not be explained by asingle transition from an ancestral to a derived type (Doyle, 1994;Mergaert et al., 2003). From this we conclude that the distinguish-ing difference must be relatively easy to “invent.” Additionally ithas to be root autonomous, as grafting experiments show thatthe shoot does not affect the nodule type formed (Lohar andVandenBosch, 2005).
We have shown that changing the ratio of inward to outwardPINs can be sufficient for shifting the axial position of the Effl↓auxin maximum. Slight differences in the PIN positioning appearto us as relatively easy changes in an evolutionary sense. Under theassumption that the position of the initial auxin maximum andresulting cell divisions is the key determinant for (in)determinatenodule type, we tentatively hypothesize that the lateral PIN local-ization in cortex of the DZ could differ between legumes makingeither nodule type, with a bias toward the center for indeterminateand no bias or a slight bias toward the periphery for determinatenodules.
Phosphorylation and dephosphorylation of PIN proteins byPINOID and PP2A respectively plays an important role in thepolar targeting of PIN proteins (Friml et al., 2004; Michniewiczet al., 2007). It has been shown that changes in PINOID activ-ity impact the central/peripheral lateral distribution of PINs inanother context (Ding et al., 2011). Differences among legumes inthe lateral PIN positioning in the cortex could perhaps result fromdifferential regulation of these players.
3.5. BIOLOGICAL LIMITS OF THE SIMPLE CHANGESAlthough in our simulations we are essentially free to give anyvalue to the effective influx- and efflux permeabilities, in realitythey are bound by biological constraints. What does this mean forour results?
The increase of influx under Infl↑ must result from a strongerexpression of influx carriers. Of course, a plant can and will onlyproduce a certain amount of these proteins. A frequently usedvalue for AUX1 based influx [PAUX1 = 0.55 μm s−1; Swarup et al.,2005; Heisler and Jonsson, 2006)1 permeability results in a carrierbased influx that is 15 times higher than passive diffusive influx
1This is not the same quantity as our effective influx permeability Pin.
(Swarup et al., 2005). Taking into account the strong upregulationof AUX1 observed in lateral root founder cells (Marchant et al.,2002; Laskowski et al., 2008), a difference between cells of up totwo orders of magnitude can be considered reasonable. The modelby Laskowski et al. (2008) our starting point, assumes (initially)homogeneous AUX1 expression. Under this assumption the max-imum increase we used under Infl↑ is still reasonable, but couldbe close to the upper bound.
Under Effl↓ the decrease of efflux has to originate from adecrease of PINs or other efflux carriers from the membraneand/or a reduction of their activity. Our implementation of usingthe same reduction factor for all sides of the cell assumes that theefflux is facilitated by a single type of carrier, or, if it results frommultiple types, that these all show the same response to the ini-tial signal. Following current studies on PIN proteins, which showthat they can disappear almost completely from the membraneupon addition of large amounts of cytokinin (see e.g., Pernisovaet al., 2009), our approach is probably the most reasonable one,barring the explicit consideration of of PIN activity regulation andlocalization dynamics.
However, a different type of efflux carriers, known as PGP, orABCB (Noh et al., 2001; Mravec et al., 2008) has been suggestedto give rise to a small but significant base efflux permeability evenin the absence of PINs (Leyser, 2011). Additionally, some sugges-tions for a minimal efflux permeability in absence of efflux carriersappear in the literature (Delbarre et al., 1996; Swarup et al., 2005).
The importance of such a minimal efflux permeability will onlysurface with strong reductions of the efflux carriers. In that case theratios between Pout,high, Pout,low, and Pout,bg will necessarily changeinside the controlled area, resulting in transverse profiles that areflatter than the reference profile. How this affects the auxin accu-mulation throughout the cortex makes an interesting topic forfurther research.
3.6. ON SIMPLE ROOTSThe root segments used in our work are a generalization of PINlayouts measured and modeled in Arabidopsis (Laskowski et al.,2008). Lacking clear PIN layout data of the relevant zones of anylegume’s root this starting point is the best we have. It is likelythat the rootward flux in the stele and the shootward flux in thecortex, which set the directional bias in the patterns we observe,are conserved. If more precise quantitative predictions are desired,however, actual legume PIN data are needed.
This does not mean that our simple approach is but a poorman’s choice. Its simplicity is also one of its strengths. The firstrecognition of the typical signature of each scenario is easier witha simple PIN and tissue layout than with a more “realistic” layout.In a next step we checked that they are also well distinguishableon a “realistic” layout (Figures 1F–H). From this we conclude thatthe signatures we have discovered are general phenomena with ascope well beyond this pseudo-legume.
The way these signatures are affected by certain aspects of thePIN layout sets requirements on the actual PIN layout of diverselegumes. These observations brought us to the tentative hypothe-sis that differences in the distribution of cortical PINs in the lateralwalls might distinguish determinate and indeterminate legumes.We also found a very important role for the endodermal PIN layout
www.frontiersin.org May 2012 | Volume 3 | Article 96 | 11

Deinum et al. Cortical auxin maximum for nodulation
on the overall nodulation potential of a stretch of root, as it is piv-otal in determining the amount of auxin available in the (inner)cortex.
Our approach is based on the strong link between the posi-tions of auxin carriers and the steady state auxin concentrationdistribution. We use differences in the patterns resulting fromdifferent scenarios (Infl↑, Effl↓, and Prod↑) to address the dif-ferential likelihood of these scenarios in a particular situation.This approach may also prove useful in elucidating PIN position-ing information from fluorescence data. This data can be hard tointerpret, because cell membranes from neighboring cells are usu-ally less than a wavelength apart. When available, information onthe auxin accumulation pattern could be used to find the mostlikely positioning scenario that fits the fluorescence data.
3.7. THE NEXT STEP: A STEP BACKIn this work we applied all changes in an all-or-nothing mannerto a well defined block of cells (the controlled area). This proveda very powerful approach for recognizing different patterns andtheir distinguishing features. No plant in its right (absence of)mind, however, will ever show exactly such a precise and all-or-nothing change. This brings forth a very natural follow-up ques-tion: how is, upon contact with Rhizobium, such a confined localchange in the auxin transport/metabolism induced? What mech-anism(s) can spatially confine the response to the signal (likelycytokinin) originating from a single epidermal cell to the cor-rect area? The dynamic localization of PIN proteins (Grunewaldand Friml, 2010) will most likely play an important role in theestablishment of a local auxin maximum.
4. MATERIALS AND METHODS4.1. GENERAL APPROACHWe have simulated auxin diffusion and transport on a static roottissue using conventional numerical methods (4.5). We explic-itly model intracellular auxin concentrations. This is customaryfor models describing root tissue (Kramer, 2004; Swarup et al.,2005; Grieneisen et al., 2007; Laskowski et al., 2008; Jones et al.,2009), as, assuming realistic diffusion constants, the relatively longcells give rise to significant concentration differences between theends of the cell (Kramer, 2008). Following these previous workswe also use a static influx/efflux/production parameters withinindividual simulations (4.2), focusing on the consequences of ourdifferent scenarios (4.4). For ease of interpretation we normalizeauxin concentrations with the average vascular level (4.6.1) of therespective reference segment (a segment without any change in thecontrolled area).
4.2. TISSUE GEOMETRY AND PIN LAYOUTOur simulations are carried out on a 2D root segment represent-ing the susceptible zone of a generalized legume. Current modellegumes typically have 4–6 cortical layers, so we have created asegment with five cortical layers. Cell sizes were chosen to matchthe typical length of cortical cells in the susceptible zone, a rep-resentative root diameter and the right ratio between cortical andvascular tissue, see Table 1 and Figure 1A.
Lacking good PIN position data for the susceptible zone ofmodel legumes (Medicago or Lotus), we used the DZ part of the
Arabidopsis model by Laskowski et al. (2008) as a starting point,as the differentiation zone comes closest to the susceptible zone.Arabidopsis has only a single cortical layer, so we copied the para-meters for the cortical layer to four additional layers. All cells ofthe same type (e.g., cortex, epidermis, vascular) have the same PINdistribution, as in (Laskowski et al., 2008). The resulting PIN lay-out of the DZ root segment is shown in Figure 1B. We also usedthe EZ PIN layout from the same paper (shown in Figure 5I).
4.3. BOUNDARY CONDITIONSThe biological root continues on both (rootward and shootward)ends of the segment (Figure 1A). We modeled these edges withan open boundary consisting of a row of open cells of half thenormal length. The concentration at the boundary grid points isfixed. Lateral boundaries have a no-flux boundary condition: noauxin leaves from the epidermis into the surroundings.
The full root simulations from Laskowski et al. show almost nolongitudinal gradient within the DZ. Based on this we chose thesame concentration profile on both the rootward and shootwardside of the segment. In this situation the transverse concentra-tion profile settles at a fixed profile, which is to a very large extentdictated by the PIN layout of the segment. This transverse con-centration profile we call “resting state,” because in theory onecould create an infinitely long segment with the same concentra-tion profile everywhere along its length by forever repeating thesame transverse building blocks (as long as decay is negligible).The rootward and shootward boundaries are fixed at this restingstate. Although the concentrations at these boundaries are fixed, anet flux of auxin through the segment does occur.
Considering the whole root, it is conceivable that at the edgeof the DZ the resting state is not fully reached yet and the actualconcentrations at the boundary are different. A small deviationfrom the resting state is perhaps far more likely than none atall. For this reason we tested the impact of deviations from theresting state profile at the boundaries of the DZ segment. Look-ing at a transverse line through the middle of the cells (all atthe same distance from the rootward boundary) the resting stateprofile has the same concentration in all vascular cells includ-ing the pericycle. As explained in 1, this level is normalized to 1Cv. In the DZ fragment all peripheral layers (i.e., epidermis, cor-tex, and endodermis) have a resting state concentration of 0.2 Cv
(Figures 5A,B).We changed the boundary conditions of the DZ segment by
changing the ratio between the vascular and the peripheral auxinconcentration (Cv and X in Figure A3A). After equilibration werenormalized the total amount of auxin with the transverse rowof cells with a profile closest to the resting state. We found that inthe shootward direction the deviation from the resting state trans-verse profile (integrated over the whole line) decayed exponentially∼e−n/4.3 (with n the cell number counted from the rootward edgeof the segment). This decay constant implies that the deviationfrom the resting state is halved every 2.9 cell lengths in the shoot-ward direction (Figure A3B). In the opposite direction deviationsdecay even faster.
With this we are confident that a segment without a longitu-dinal gradient, settled at the resting state transverse concentrationprofile is a very reasonable model of the DZ situation.
Frontiers in Plant Science | Plant Biophysics and Modeling May 2012 | Volume 3 | Article 96 | 12

Deinum et al. Cortical auxin maximum for nodulation
4.4. CHANGES ARE APPLIED IN THE “CONTROLLED AREA”We investigate both dynamic and steady state effects of homoge-neous changes of a block of cells situated on one side of the root,dubbed controlled area. It consists of all five cortical layers and theepidermis and is five cells (5 × 100 μm) long (Figure 1A). Thiscorresponds well with the typical length of a nodule primordium.The same change is applied to every cell inthe controlled area:
• (n-fold) Infl↑: increase the effective influx permeability (Pin; ntimes)
• (n-fold) Effl↓: decrease the effective efflux permeabilities(Pout,bg, Pout,low, and Pout,high; n times)
• Prod↑: local auxin production with the given rate (per volume)in Cv s−1 μm−3
4.5. SIMULATION METHODWe use in house developed C++ code for simulating the transportand metabolism of auxin. Our simulations are carried out on a 2Dlongitudinal slice through the center of a generalized root segment,in most cases representing the DZ (Figures 1A,B). We simulateauxin diffusion (in cells and walls separately) and transport (overmembranes) with subcellular precision (Figure 6; pixel sizes inTable 1). The apoplast is considered as a separate continuous com-partment. Spatial coordinates are denoted with x (transverse) andy (rootward or longitudinal) with coordinates in μm.
Within a compartment auxin moves by diffusion, with differentdiffusion constants for cells (C) and walls (W):
Jdiff ,CW(x , y
) = −DCW ∇C(x , y
)(1)
with C(x, y) the auxin concentration at a given position and DCW
the respective diffusion constant. The combined effects of activetransport and passive permeability are grouped into a single para-meter for effective efflux permeability Pout and effective influxpermeability Pin. In principle Pout can be set for each face ofa cell independently, whereas a cell always has a single value ofPin for all four faces. These parameters control the flux over themembrane:
Jmem(x , y
) = (Pout ,xx CC
(x , y
) − PinCW(x , y
)) · n̂ (2)
FIGURE 6 | Simulation details. The figure shows the simulation grid of asmall corner section of a cell and the surrounding apoplast. Membranes areindicated with thick lines, the grid with thin lines. Different types of arrowsindicate the different equations: diffusion inside the cell and within theapoplast (differing only in the value of the diffusion constant) andactive + passive transport over the membrane. n̂ Is a unit length vectorpointing out of the cell. Note that the apoplast thickness is not drawnto scale.
Here Pout,xx is the relevant effective efflux permeability. In thereference segment three different levels are used: high, low, and bgfor strong and weak PIN expression and a background level dueto ubiquitously expressed PINs respectively. In the choice of threelevels we follow (Laskowski et al., 2008). n̂ is a unit length normalvector pointing out of the cell. We follow (Laskowski et al., 2008)in assuming a single value of Pin for the whole reference segment.
These equations are solved using the Alternating DirectionImplicit (ADI) algorithm (Peaceman and Rachford, 1955) using a2D finite volume description of the tissue. We use a rectangulargrid topology with different volume sizes within the cell and wallcompartments and at junctions. This allows us to use a realisticcell wall width without wasting excessive memory on the cells’interiors.
The integration time step is chosen depending on the intervalbetween measurements, with typical values of 0.5, 1, and 2.5 s.Results were checked for numerical artifacts and if necessary thetime step was adapted.
4.6. PARAMETERSWhen thinking of the root segment as a thin 3D slice with unitthickness (1 μm, much thinner than a cell’s diameter) all para-meters and quantities can be used in their usual dimensions.For reasons of familiarity we present them as such, although oursimulations are carried out on a strictly 2D template.
For an overview of all model parameters, see Table 1.
4.6.1. Normalization of IAA concentration unitsBy lack of a real 3D volume, concentrations units are arbitrary.This means all concentrations can be multiplied with an arbitraryconstant without affecting the model’s behavior. (The only para-meter that contains concentration units is the auxin productionrate. Thus, this is the only parameter that scales with the actualconcentration.) For the ease of interpretation we choose to scaleall concentrations such that the average auxin concentration in thecenter of the vascular cylinder of a reference root segment with-out a longitudinal gradient is 1 Cv. Without information aboutthe cells’, likely differential, sensitivity to changes in the auxin con-centration and/or the absolute concentration it is probably mostinsightful to compare concentrations to a known level. Neverthe-less, it is important to bear in mind that cells could show differentresponses to the same auxin concentration or change.
ACKNOWLEDGMENTSWe thank both reviewers for their constructive feedback on themanuscript. Funding: The work of EED is funded within theresearch program of the Netherlands Consortium for SystemsBiology (NCSB), which is part of the Netherlands Genomics Ini-tiative (NGI)/NWO, René Geurts is funded by NWO VIDI grant864.06.007 and the work of Bela M. Mulder is part of the researchprogram of the “Stichting voor Fundamenteel Onderzoek derMaterie (FOM),” which is financially supported by the “Neder-landse Organisatie voor Wetenschappelijk Onderzoek (NWO).”
SUPPLEMENTARY MATERIALThe Movies S1 and S2 for this article can be found onlineat http://www.frontiersin.org/Plant_Biophysics_and_Modeling/10.3389/fpls.2012.00096/abstract
www.frontiersin.org May 2012 | Volume 3 | Article 96 | 13

Deinum et al. Cortical auxin maximum for nodulation
REFERENCESBainbridge, K., Guyomarc’h, S., Bayer,
E., Swarup, R., Bennett, M., Mandel,T., and Kuhlemeier, C. (2008). Auxininflux carriers stabilize phyllotacticpatterning. Genes Dev. 22, 810–823.
Bayer, E. M., Smith, R. S., Man-del, T., Nakayama, N., Sauer, M.,Prusinkiewicz, P., and Kuhlemeier,C. (2009). Integration of transport-based models for phyllotaxis andmidvein formation. Genes Dev. 23,373–384.
Benkova, E., Michniewicz, M., Sauer,M., Teichmann, T., Seifertova, D.,Jurgens, G., and Friml, J. (2003).Local, efflux-dependent auxin gradi-ents as a common module for plantorgan formation. Cell 115, 591–602.
Bhuvaneswari, T. V., Bhagwat, A. A., andBauer, W. D. (1981). Transient sus-ceptibility of root cells in four com-mon legumes to nodulation by rhi-zobia. Plant Physiol. 68, 1144–1149.
Blakely, L., and Evans, T. (1979). Celldynamics studies on the pericycle ofradish seedling roots. Plant Sci. Lett.14, 79–83.
Blilou, I., Xu, J., Wildwater, M., Willem-sen, V., Paponov, I., Friml, J., Hei-dstra, R., Aida, M., Palme, K., andScheres, B. (2005). The PIN auxinefflux facilitator network controlsgrowth and patterning in Arabidop-sis roots. Nature 433, 39–44.
Casimiro, I., Beeckman, T., Graham, N.,Bhalerao, R., Zhang, H., Casero, P.,Sandberg, G., and Bennett, M. J.(2003). Dissecting Arabidopsis lat-eral root development. Trends PlantSci. 8, 165–171.
Cooper, J. B., and Long, S. R. (1994).Morphogenetic rescue of Rhizo-bium meliloti nodulation mutants bytrans-zeatin secretion. Plant Cell 6,215–225.
Delbarre, A., Muller, P., Imhoff, V.,and Guern, J. (1996). Compari-son of mechanisms controllinguptake and accumulation of2,4-dichlorophenoxy acetic acid,naphthalene-1-acetic acid, andindole-3-acetic acid in suspension-cultured tobacco cells. Planta 198,532–541.
Dello Ioio, R., Linhares, F. S., Scacchi,E., Casamitjana-Martinez, E., Hei-dstra, R., Costantino, P., and Saba-tini, S. (2007). Cytokinins determineArabidopsis root-meristem size bycontrolling cell differentiation. Curr.Biol. 17, 678–682.
Dello Ioio, R., Nakamura, K.,Moubayidin, L., Perilli, S., Taniguchi,M., Morita, M. T., Aoyama, T.,Costantino, P., and Sabatini, S.(2008). A genetic framework forthe control of cell division and
differentiation in the root meristem.Science 322, 1380–1384.
Ding, Z., Galván-Ampudia, C. S.,Demarsy, E., Åangowski, Å., Kleine-Vehn, J., Fan, Y., Morita, M. T.,Tasaka, M., Fankhauser, C., Offringa,R., and Friml, J. (2011). Light-mediated polarization of the pin3auxin transporter for the pho-totropic response in Arabidopsis.Nat. Cell Biol. 13, 447–452.
Doyle, J. (1994). Phylogeny of thelegume family: an approach tounderstanding the origins of nodu-lation. Annu. Rev. Ecol. Syst. 25,325–349.
Friml, J., Yang, X., Michniewicz, M.,Weijers, D., Quint, A., Tietz, O.,Benjamins, R., Ouwerkerk, P. B. F.,Ljung, K., Sandberg, G., Hooykaas,P. J. J., Palme, K., and Offringa, R.(2004). A pinoid-dependent binaryswitch in apical-basal pin polar tar-geting directs auxin efflux. Science306, 862–865.
Frugier, F., Kosuta, S., Murray, J. D.,Crespi, M., and Szczyglowski, K.(2008). Cytokinin: secret agent ofsymbiosis. Trends Plant Sci. 13,115–120.
Galweiler, L., Guan, C., Muller, A., Wis-man, E., Mendgen, K., Yephremov,A., and Palme, K. (1998). Regulationof polar auxin transport by AtPIN1in Arabidopsis vascular tissue. Sci-ence 282, 2226–2230.
Garnett, P., Steinacher, A., Stepney, S.,Clayton, R., and Leyser, O. (2010).Computer simulation: the imagi-nary friend of auxin transport biol-ogy. Bioessays 32, 828–835.
Goldsmith, M. H., Goldsmith, T. H., andMartin, M. H. (1981). Mathematicalanalysis of the chemosmotic polardiffusion of auxin through plant tis-sues. Proc. Natl. Acad. Sci. U.S.A. 78,976–980.
Gonzalez-Rizzo, S., Crespi, M., andFrugier, F. (2006). The Medicagotruncatula cre1 cytokinin receptorregulates lateral root developmentand early symbiotic interaction withSinorhizobium meliloti. Plant Cell 18,2680–2693.
Grieneisen,V. A., and Scheres, B. (2009).Back to the future: evolution of com-putational models in plant morpho-genesis. Curr. Opin. Plant Biol. 12,606–614.
Grieneisen, V. A., Xu, J., Maree, A.F., Hogeweg, P., and Scheres, B.(2007). Auxin transport is sufficientto generate a maximum and gradi-ent guiding root growth. Nature 449,1008–1013.
Grunewald, W., and Friml, J. (2010).The march of the PINs: develop-mental plasticity by dynamic polar
targeting in plant cells. EMBO J. 29,2700–2714.
Heisler, M. G., and Jonsson, H. (2006).Modeling auxin transport and plantdevelopment. J. Plant Growth Regul.25, 302–312.
Hirota, A., Kato, T., Fukaki, H., Aida,M., and Tasaka, M. (2007). Theauxin-regulated AP2/EREBP genePUCHI is required for morphogen-esis in the early lateral root pri-mordium of Arabidopsis. Plant Cell19, 2156–2168.
Hirsch, A. (1992). Developmental biol-ogy of legume nodulation. New Phy-tol. 122, 211–237.
Hirsch, A. M., Bhuvaneswari, T. V.,Torrey, J. G., and Bisseling, T. (1989).Early nodulin genes are inducedin alfalfa root outgrowths elicitedby auxin transport inhibitors.Proc. Natl. Acad. Sci. U.S.A. 86,1244–1248.
Jones, A. R., Kramer, E. M., Knox, K.,Swarup, R., Bennett, M. J., Lazarus,C. M., Leyser, H. M., and Grier-son, C. S. (2009). Auxin transportthrough non-hair cells sustains root-hair development. Nat. Cell Biol. 11,78–84.
Jones, K. M., Kobayashi, H., Davies,B. W., Taga, M. E., and Walker, G.C. (2007). How rhizobial symbiontsinvade plants: the Sinorhizobium-Medicago model. Nat. Rev. Microbiol.5, 619–633.
Jonsson, H., Heisler, M. G., Shapiro, B.E., Meyerowitz, E. M., and Mjol-sness, E. (2006). An auxin-drivenpolarized transport model for phyl-lotaxis. Proc. Natl. Acad. Sci. U.S.A.103, 1633–1638.
Jonsson, H., and Krupinski, P. (2010).Modeling plant growth and patternformation. Curr. Opin. Plant Biol. 13,5–11.
Kleine-Vehn, J., Dhonukshe, P., Swarup,R., Bennett, M., and Friml, J. (2006).Subcellular trafficking of the Ara-bidopsis auxin influx carrier aux1uses a novel pathway distinct frompin1. Plant Cell 18, 3171–3181.
Kramer, E. M. (2004). Pin and aux/laxproteins: their role in auxin accumu-lation. Trends Plant Sci. 9, 578–582.
Kramer, E. M. (2008). Computer mod-els of auxin transport: a review andcommentary. J. Exp. Bot. 59, 45–53.
Laplaze, L., Benkova, E., Casimiro, I.,Maes, L., Vanneste, S., Swarup, R.,Weijers, D., Calvo, V., Parizot, B.,Herrera-Rodriguez, M. B., Offringa,R., Graham, N., Doumas, P., Friml,J., Bogusz, D., Beeckman, T., andBennett, M. (2007). Cytokinins actdirectly on lateral root founder cellsto inhibit root initiation. Plant Cell19, 3889–3900.
Larkin, P. J., Gibson, J. M., Mathe-sius, U., Weinman, J. J., Gartner, E.,Hall, E., Tanner, G. J., Rolfe, B. G.,and Djordjevic, M. A. (1996). Trans-genic white clover. Studies with theauxin-responsive promoter, GH3,in root gravitropism and lateralroot development. Transgenic Res. 5,325–335.
Laskowski, M., Grieneisen, V. A.,Hofhuis, H., Hove, C. A., Hogeweg,P., Maree, A. F., and Scheres,B. (2008). Root system architec-ture from coupling cell shape toauxin transport. PLoS Biol. 6, e307.doi:10.1371/journal.pbio.0060307
Leyser, O. (2011). Auxin, self-organisation, and the colonialnature of plants. Curr. Biol. 21,R331–R337.
Libbenga, K., and Harkes, P. (1973). Ini-tial proliferation of cortical cells inthe formation of root nodules inPisum sativum l. Planta 114, 17–28.
Ljung, K., Bhalerao, R. P., and Sand-berg, G. (2001). Sites and homeo-static control of auxin biosynthe-sis in Arabidopsis during vegetativegrowth. Plant J. 28, 465–474.
Ljung, K., Hull, A. K., Kowalczyk, M.,Marchant, A., Celenza, J., Cohen, J.D., and Sandberg, G. (2002). Biosyn-thesis, conjugation, catabolism andhomeostasis of indole-3-acetic acidin Arabidopsis thaliana. Plant Mol.Biol. 49, 249–272.
Lohar, D. P., and VandenBosch, K.A. (2005). Grafting between modellegumes demonstrates roles for rootsand shoots in determining noduletype and host/rhizobia specificity. J.Exp. Bot. 56, 1643–1650.
Malamy, J. E., and Benfey, P. N. (1997).Organization and cell differentia-tion in lateral roots of Arabidopsisthaliana. Development 124, 33–44.
Mallory, T., Chiang, S., Cutter, E., andGifford, E. (1970). Sequence andpattern of lateral root formation in5 selected species. Am. J. Bot. 57,800–809.
Marchant, A., Bhalerao, R., Casimiro,I., Eklof, J., Casero, P. J., Bennett,M., and Sandberg, G. (2002). AUX1promotes lateral root formation byfacilitating indole-3-acetic acid dis-tribution between sink and sourcetissues in the Arabidopsis seedling.Plant Cell 14, 589–597.
Marhavý, P., Bielach, A., Abas, L.,Abuzeineh, A., Duclercq, J., Tanaka,H., Parezová, M., Petrášek, J.,Friml, J., Kleine-Vehn, J., andBenková, E. (2011). Cytokinin mod-ulates endocytic trafficking of pin1auxin efflux carrier to controlplant organogenesis. Dev. Cell 21,796–804.
Frontiers in Plant Science | Plant Biophysics and Modeling May 2012 | Volume 3 | Article 96 | 14

Deinum et al. Cortical auxin maximum for nodulation
Martin, M. H., Goldsmith, M. H., andGoldsmith, T. H. (1990). On polarauxin transport in plant cells. J.Math. Biol. 28, 197–223.
Mathesius, U., Schlaman, H. R., Spaink,H. P., Of Sautter, C., Rolfe, B. G.,and Djordjevic, M. A. (1998). Auxintransport inhibition precedes rootnodule formation in white cloverroots and is regulated by flavonoidsand derivatives of chitin oligosac-charides. Plant J. 14, 23–34.
Mergaert, P., Nikovics, K., Kelemen, Z.,Maunoury, N., Vaubert, D., Kon-dorosi, A., and Kondorosi, E. (2003).A novel family in Medicago trun-catula consisting of more than 300nodule-specific genes coding forsmall, secreted polypeptides withconserved cysteine motifs. PlantPhysiol. 132, 161–173.
Merks, R. M., Van de Peer, Y., Inze,D., and Beemster, G. T. (2007).Canalization without flux sensors:a traveling-wave hypothesis. TrendsPlant Sci. 12, 384–390.
Michniewicz, M., Zago, M. K., Abas,L., Weijers, D., Schweighofer, A.,Meskiene, I., Heisler, M. G., Ohno,C., Zhang, J., Huang, F., Schwab,R., Weigel, D., Meyerowitz, E. M.,Luschnig, C., Offringa, R., and Friml,J. (2007). Antagonistic regulation ofPIN phosphorylation by PP2A andPINOID directs auxin flux. Cell 130,1044–1056.
Mitchison, G. (1980). The dynamics ofauxin transport. Proc. R. Soc. Lond.B Biol. Sci. 209, 489–511.
Mravec, J., Kubes, M., Bielach, A.,Gaykova, V., Petrasek, J., Skupa, P.,Chand, S., Benkova, E., Zazimalova,E., and Friml, J. (2008). Interac-tion of PIN and PGP transportmechanisms in auxin distribution-dependent development. Develop-ment 135, 3345–3354.
Murray, J. D., Karas, B. J., Sato, S.,Tabata, S., Amyot, L., and Szczy-glowski, K. (2007). A cytokinin per-ception mutant colonized by Rhi-zobium in the absence of nod-ule organogenesis. Science 315,101–104.
Noh, B., Murphy, A. S., and Spald-ing, E. P. (2001). Multidrugresistance-like genes of Arabidopsisrequired for auxin transport andauxin-mediated development. PlantCell 13, 2441–2454.
Op den Camp, R. H., De Mita, S., Lillo,A., Cao, Q., Limpens, E., Bisseling,T., and Geurts R. (2011). A phylo-genetic strategy based on a legume-specific whole genome duplication
yields symbiotic cytokinin type-aresponse regulators. Plant Physiol.157, 2013–2022.
Pacios-Bras, C., Schlaman, H. R., Boot,K., Admiraal, P., Langerak, J. M.,Stougaard, J., and Spaink, H. P.(2003). Auxin distribution in duringroot nodule development. Plant Mol.Biol. 52, 1169–1180.
Paponov, I. A., Teale, W. D., Trebar, M.,Blilou, I., and Palme, K. (2005). Thepin auxin efflux facilitators: evolu-tionary and functional perspectives.Trends Plant Sci. 10, 170–177.
Peaceman, D., and Rachford, H. (1955).The numerical solution of parabolicand elliptic differential equations. J.Soc. Ind. Appl. Math. 3, 28–41.
Pernisova, M., Klima, P., Horak, J.,Valkova, M., Malbeck, J., Soucek, P.,Reichman, P., Hoyerova, K., Dubova,J., Friml, J., Zazimalova, E., andHejatko, J. (2009). Cytokinins mod-ulate auxin-induced organogenesisin plants via regulation of the auxinefflux. Proc. Natl. Acad. Sci. U.S.A.106, 3609–3614.
Petersson, S. V., Johansson, A. I., Kowal-czyk, M., Makoveychuk, A., Wang,J. Y., Moritz, T., Grebe, M., Ben-fey, P. N., Sandberg, G., and Ljung,K. (2009). An auxin gradient andmaximum in the Arabidopsis rootapex shown by high-resolution cell-specific analysis of IAA distribu-tion and synthesis. Plant Cell 21,1659–1668.
Plet, J., Wasson, A., Ariel, F., LeSignor, C., Baker, D., Mathesius, U.,Crespi, M., and Frugier, F. (2011).MtCRE1-dependent cytokininsignaling integrates bacterial andplant cues to coordinate sym-biotic nodule organogenesis inMedicago truncatula. Plant J. 65,622–633.
Prusinkiewicz, P., Crawford, S., Smith,R. S., Ljung, K., Bennett, T., Ongaro,V., and Leyser, O. (2009). Control ofbud activation by an auxin transportswitch. Proc. Natl. Acad. Sci. U.S.A.106, 17431–17436.
Rightmyer, A. P., and Long, S. (2011).Pseudonodule formation bywild type and symbiotic mutantMedicago truncatula in responseto auxin transport inhibitors.Mol. Plant Microbe Interact. 24,1372–1384.
Rolfe, B., Djordjevic, M., Weinman, J.,Mathesius, U., Pittock, C., Gartner,E., Ride, K., Dong, Z., McCully, M.,and McIver, J. (1997). Root morpho-genesis in legumes and cereals andthe effect of bacterial inoculation on
root development. Plant Soil 194,131–144.
Rolland-Lagan, A., and Prusinkiewicz,P. (2005). Reviewing models ofauxin canalization in the con-text of leaf vein pattern forma-tion in Arabidopsis. Plant J. 44,854–865.
Ruzicka, K., Simaskova, M., Duclercq, J.,Petrasek, J., Zazimalova, E., Simon,S., Friml, J., Van Montagu, M. C.,and Benkova, E. (2009). Cytokininregulates root meristem activity viamodulation of the polar auxin trans-port. Proc. Natl. Acad. Sci. U.S.A.106, 4284–4289.
Smith, R. S., Guyomarc’h, S., Mandel, T.,Reinhardt, D., Kuhlemeier, C., andPrusinkiewicz, P. (2006). A plausi-ble model of phyllotaxis. Proc. Natl.Acad. Sci. U.S.A. 103, 1301–1306.
Stoma, S., Lucas, M., Chopard, J.,Schaedel, M., Traas, J., and Godin,C. (2008). Flux-based transportenhancement as a plausible uni-fying mechanism for auxin trans-port in meristem development.PLoS Comput. Biol. 4, e1000207.doi:10.1371/journal.pcbi.1000207
Swarup, R., Friml, J., Marchant, A.,Ljung, K., Sandberg, G., Palme, K.,and Bennett, M. (2001). Localizationof the auxin permease aux1 suggeststwo functionally distinct hormonetransport pathways operate in theArabidopsis root apex. Genes Dev. 15,2648–2653.
Swarup, R., Kargul, J., Marchant, A.,Zadik, D., Rahman, A., Mills, R.,Yemm, A., May, S., Williams, L., Mill-ner, P., Tsurumi, S., Moore, I., Napier,R., Kerr, I. D., and Bennett, M.J. (2004). Structure-function analy-sis of the presumptive Arabidopsisauxin permease aux1. Plant Cell 16,3069–3083.
Swarup, R., Kramer, E. M., Perry, P.,Knox, K., Leyser, H. M., Haseloff,J., Beemster, G. T., Bhalerao, R.,and Bennett, M. J. (2005). Rootgravitropism requires lateral rootcap and epidermal cells for trans-port and response to a mobileauxin signal. Nat. Cell Biol. 7,1057–1065.
Takanashi, K., Sugiyama, A., and Yazaki,K. (2011). Involvement of auxin dis-tribution in root nodule develop-ment of Lotus japonicus. Planta 234,73–81.
Timmers, A., Auriac, M., and Truchet,G. (1999). Refined analysis of earlysymbiotic steps of the rhizobium-medicago interaction in relation-ship with microtubular cytoskeleton
rearrangements. Development 126,3617–3628.
Tirichine, L., Sandal, N., Madsen, L.H., Radutoiu, S., Albrektsen, A. S.,Sato, S., Asamizu, E., Tabata, S.,and Stougaard, J. (2007). A gain-of-function mutation in a cytokininreceptor triggers spontaneous rootnodule organogenesis. Science 315,104–107.
van Noorden, G. E., Ross, J. J., Reid,J. B., Rolfe, B. G., and Mathesius,U. (2006). Defective long-distanceauxin transport regulation in theMedicago truncatula super numericnodules mutant. Plant Physiol. 140,1494–1506.
Wabnik, K., Kleine-Vehn, J., Balla, J.,Sauer, M., Naramoto, S., Reinohl,V., Merks, R. M., Govaerts, W.,and Friml, J. (2010). Emergenceof tissue polarization from syn-ergy of intracellular and extracellu-lar auxin signaling. Mol. Syst. Biol.6, 447.
Woodward, A. W., and Bartel, B. (2005).Auxin: regulation, action, and inter-action. Ann. Bot. 95, 707–735.
Yang, W. C., de Blank, C., Meskiene, I.,Hirt, H., Bakker, J., van Kammen,A., Franssen, H., and Bisseling, T.(1994). Rhizobium nod factors reac-tivate the cell cycle during infectionand nodule primordium formation,but the cycle is only completed inprimordium formation. Plant Cell 6,1415–1426.
Conflict of Interest Statement: Theauthors declare that the research wasconducted in the absence of any com-mercial or financial relationships thatcould be construed as a potential con-flict of interest.
Received: 24 January 2012; accepted: 24April 2012; published online: 28 May2012.Citation: Deinum EE, Geurts R, Bissel-ing T and Mulder BM (2012) Modelinga cortical auxin maximum for nodu-lation: different signatures of potentialstrategies. Front. Plant Sci. 3:96. doi:10.3389/fpls.2012.00096This article was submitted to Frontiersin Plant Biophysics and Modeling, aspecialty of Frontiers in Plant Science.Copyright © 2012 Deinum, Geurts, Bis-seling and Mulder. This is an open-accessarticle distributed under the terms ofthe Creative Commons Attribution NonCommercial License, which permits non-commercial use, distribution, and repro-duction in other forums, provided theoriginal authors and source are credited.
www.frontiersin.org May 2012 | Volume 3 | Article 96 | 15

Deinum et al. Cortical auxin maximum for nodulation
APPENDIX
FIGURE A1 | Dynamic response to influx and efflux changes compared.
At T = 0 s the influx is increased 10-fold [Infl↑ (A,B)] or the efflux isdecreased 10× [Effl↓ (C,D)] in the controlled area. The top part showssnapshots of selected time points (A,C). Graphs (B,D) show the auxin
concentration in the three indicated cells (see lowest snapshot) over thefirst 2 h. Note that under Infl↑ the new steady state is reached faster thanunder flux, but the reverse is true for the most rootward inner cortex cell ofthe controlled area (marked *).
Frontiers in Plant Science | Plant Biophysics and Modeling May 2012 | Volume 3 | Article 96 | 16

Deinum et al. Cortical auxin maximum for nodulation
FIGURE A2 | Faster auxin accumulation in the inner cortex with Effl↓.
Time derivatives of the auxin concentration in two different cells in the(longitudinal) middle of the controlled area: inner cortex (large symbols) andcentral cortex (small symbols). Colors and symbols as in Figure 3. (Forclarity of the graphs the two cases with Pother/10 are omitted. In both casesthey are very similar to their respective matches from the lower two pairsof curves, as in Figure 3C.) In all segments, Pout,low in the controlled area isreduced to the same value: Pout,low = 0.05 μm s−1 (top), Pout,low = 0.005 μm s−1
(bottom). In the beginning the auxin concentration increases faster in theinner cortex than in the central cortex, as can be seen from the higher rateof change of the auxin concentration. With a stronger reduction the effluxthis period of faster increase in the inner cortex was longer.
www.frontiersin.org May 2012 | Volume 3 | Article 96 | 17

Deinum et al. Cortical auxin maximum for nodulation
FIGURE A3 |Test of DZ parameters with respect to disturbed boundary
conditions. The cortical auxin concentration at both edges is clipped atdifferent values (X ) relative to the vascular concentration at the edge, asshown in (A). After equilibration with these boundary conditions andnormalization with the central vascular auxin concentration the transverseprofile through the center of the cells is compared to the resting stateprofile for four values of X (B). In the restingstate profile X ≈ 0.2 Cv. Foreach value of X the deviation form the reference decays exponentiallyaccording to e−n/τ , with τ = 4.3 and n the number of the cell counted fromthe rootward edge (curves fitted to the data). This means that the deviationfrom the resting state profile is halved every 2.9 cells.
Frontiers in Plant Science | Plant Biophysics and Modeling May 2012 | Volume 3 | Article 96 | 18

Deinum et al. Cortical auxin maximum for nodulation
FIGURE A4 | Auxin is not suitable as a direct signal. In all three cases auxinis produced in a single epidermal cell (position is indicated with an arrow inthe line graphs). For a notable increase of the auxin concentration in someparts of the segment, very high production rates are needed, even withslowed down transport. Moreover, in the inner cortical layers the auxinconcentration increases a bit over a wide region and the maximum increasedoes not occur closest to the production side, but shootward of it(downstream considering the cortical flow direction). The bottom imagesshow steady state auxin concentrations. The graphs on top show theconcentrations in the indicated layers (thick lines: pericycle, 5× cortex, andepidermis). The resting state concentrations (i.e., before production started)are plotted in thin black (vascular) and gray (cortex) lines. (A,B) Defaultparameters (C): “slowed down” parameters from Figure 2B: all effectivepermeabilities are reduced by a factor 10. Production rates are much higher
than in Figures 1E,H, as here only a single cell produces: 0.1 Cv μm–3 s−1 (A),0.01 Cv μm–3 s−1 (B,C). Note that in (A) the producing epidermal cell producesthe full amount of auxin present in a vascular cell (both have the same size) ofthe reference segment every 10 s. The total amount produced per second isslightly more than half of the total in Figure 2E and consequently from severalcells rootward of the production site onward the auxin concentration issignificantly increased in all cell files. We consider this value (A) absurdly high,but use it because hardly any change is seen with the already high productionrate of (B). This is because the auxin is very efficiently transported away fromthe production site. Reducing the efficiency of this transport by reducing alleffective permeabilities of the whole segment [“slowing it down” (C)], a lessabsurd production rate is enough to support an obvious accumulation, but theissues of ill confined auxin accumulation and a shift of the maximum in theinner cortical layers (C5–C3) remain.
www.frontiersin.org May 2012 | Volume 3 | Article 96 | 19