MOBILE IN-APP AD MONETIZATION - Appodeal
63
PERFOR MANCE INDEX MOBILE IN-APP AD MONETIZATION H1 2018 EDITION APPODEAL.COM © 2018 APPODEAL
-
Upload
khangminh22 -
Category
Documents
-
view
1 -
download
0
Transcript of MOBILE IN-APP AD MONETIZATION - Appodeal

PERFOR MANCE INDEX
MOBILE IN-APP AD MONETIZATION
H1 2018 EDITION
APPODEAL.COM© 2018 APPODEAL

Introduction
Key Insights
How to Use This Index
Meet the Ad Formats
Methodology
Rankings: USA
Western Europe
Eastern Europe
East Asia
South America
BONUS: DSP mini performance index
About Appodeal
TABLE OF CONTENTS
4
8
16
18
22
110
118
30
46
62
78
94
MOBILE IN-APP AD MONETIZATION PERFORMANCE INDEX H1 2018
© 2018 APPODEAL2 3

INTRODUCTION
© 2018 APPODEAL4 5
This index report is also an acknowledgment and
appreciation of our top performing ad demand
partners. Thank you partners for working with
Appodeal in generating the highest ad revenue
for publishers worldwide.
Yours Truly,
The A-Team
Appodeal offers an ad mediation platform that
is 100% unbiased, which means we are not an
ad network nor do we have our own internal
demands. Therefore, we are uniquely able to
evaluate the performance of our 60+ ad demand
partners from a neutral point of view to make this
index possible.
For every ad request we receive through the
33,000+ apps monetizing with Appodeal, our
ad mediation algorithm makes our ad demand
partners compete against each other so that only
the highest earning ad bid wins for each and every
ad impression.
Mobile ad monetization is not known for being transparent. That is a problem, especially as more and more mobile app publishers and developers rely on ads to generate income. Information is vital for making smarter decisions for success with ad monetization.
That is why the industry’s only Mobile In-App Ad
Monetization Performance Index report is back. Analyzing
over 51 billion impressions in five different regional
markets in H1 of 2018, this index provides insights to
monetize smarter with in-app mobile advertising. Findings
point to how different ad formats and different ad demand
sources should be prioritized for different regional markets
for the best earning results.

WH
AT’S
NEW
© 2018 APPODEAL6 7MOBILE IN-APP AD MONETIZATION PERFORMANCE INDEX INTRODUCTION
What’s New
There are several changes to note in the second installment of this report:
Consolidation of static, rich and video interstitial ads under “Interstitials”
Previously, skippable video interstitials
and static/rich interstitials were
grouped and analyzed separately.
Because they are all essentially
full-screen ads with similar request
behavior, they have since been
grouped together as one ad format in
our algorithm, as well as in this index.
Two additional eCPM trendlines for ad formats
Our last index showed the trend of ad
format’s eCPMs with a trendline that
showed their performance on all of
our apps. In this version, we’ve added
two more lines -- “Top Apps Only” and
“Top Apps Excluded.”
Performance results of rewarded video by AdMob and Facebook Audience Network Among the ad demand partners that we
have been adding to our ad mediation
stack, the new additions of rewarded
videos by Google AdMob and Facebook
Audience Network are the most notable
to observe.
BONUS mini-index of DSPs
Our DSP demand partners are now
featured in their own separate
performance index as bonus content.
Check it out to see how programmatic
demands perform amongst each other
within our ad exchange.

MOBILE IN-APP AD MONETIZATION PERFORMANCE INDEX KEY INSIGHTS
© 2018 APPODEAL8 9
USA Remained Top eCPM Performing Market With East Asia At Close Second
The US market had always led with the highest eCPM
performance. It continued to do so in this index. What was
surprising to see was just how fast and high the eCPMs
of the East Asian market grew in the past year. Since the
eCPMs of rewarded videos and interstitials on iOS were
around $1 lower for the East Asia market (compared to the
US), it is probable that the East Asia market could surpass
the US in certain categories in the near future.
KEY INSIGHTS

© 2018 APPODEAL10 11MOBILE IN-APP AD MONETIZATION PERFORMANCE INDEX KEY INSIGHTS
Google AdMob And Facebook Audience Network Made Big Splash With Rewarded Videos The two tech giants’ entry into the rewarded video ad
format category in the latter half of 2017 led to a significant
boost in rewarded videos’ monetization power. With their
dominant access to vast numbers of advertisers, along
with their promotion of the value this ad format brings to
both advertisers and publishers, we predict that the gains in
rewarded videos’ eCPM performance will continue to rise.
eCPMs On iOS Were Higher Than On Android By Significant Margins In Certain MarketsWhile it is generally understood that the eCPMs on iOS tend
to be higher than on Android — given the higher price-point
of iOS devices, and advertisers’ desire of reaching those
users — it is interesting to note how wide the margins can be
based on the market.
In the US market, the eCPM gap between iOS and Android
was not that significant. However, for other markets
analyzed in this index, the eCPMs on iOS were two times, or
even three times higher, than on Android. For publishers, this
insight on the gap between the platforms should help inform
different user acquisition and monetization strategies for
various markets.

© 2018 APPODEAL12 13
Interstitials Monetized The Most Overall Revenue
Interstitials generated the most revenue in all regions
(except iOS in South America). Since these full-screen ads
can come in the form of a static image, video or interactive
rich media (or playable ads), interstitials can be quite flexible
as a happy medium between banner ads (with its low
eCPMs, but high frequency), and rewarded video (with its
high eCPMs, but low frequency).
While other markets showed a modest eCPM increase in
general, the U.S. and East Asia markets both showed a
noticeable $2 increase in eCPM on iOS.
High user engagement and action completion effectiveness
have driven widespread adoption of rich interstitials. We
predict that this ad format will continue to be a leader in the
coming year.
Rewarded Video Remained The Top Performing Format In Terms Of eCPMsRewarded video debuted a mere few years ago, but has
quickly become popular in the ad tech market. Thanks to
high user engagement and revenue potential marks, this ad
format has only grown in popularity.
Its eCPM performance continued to be the highest among
all other ad formats, with the greatest increase in the U.S.
and East Asia markets. New offerings by major players
like Google AdMob and Facebook contributed significantly
to eCPM growth; however, the inability to serve rewarded
videos more frequently is one key barrier as it limits
revenue potential.
MOBILE IN-APP AD MONETIZATION PERFORMANCE INDEX KEY INSIGHTS

© 2018 APPODEAL14 15
Banner Continued To Be A Reliable Monetizing Ad FormatDespite being one of the oldest ad formats and having
the lowest eCPMs, banners continued to be an important
and reliable monetizing ad format thanks to its superior
availability of ads and ability to be served frequently or even
continuously. As a result, this format represented about at
least a quarter of monetization power share across most
regions. In South America, it even made up more than half of
the revenue on iOS.
While its eCPM performance remained at the same level
for most categories, the Eastern Europe and South America
markets on iOS saw banner’s eCPMs notably increase by
almost double (by 9¢ - 15¢) compared to last year.
MOBILE IN-APP AD MONETIZATION PERFORMANCE INDEX KEY INSIGHTS

MOBILE IN-APP AD MONETIZATION PERFORMANCE INDEX HOW TO USE THIS INDEX
© 2018 APPODEAL16 17
HOW TO USE THIS INDEX
If you are an app publisher, your app might reach users from many different regions of the world, and a one-size-fits-all monetization approach will simply not work.
This in-app ad monetization performance index offers insights that will help mobile app publishers decide which ad formats to use for specific target audience.
Ad Format Trends
It pays to use different approaches. Global regions where
Android is more popular will react to specific types of ad
formats, while regions where iOS is more prevalent will
see an increase of earnings under a different ad format
strategy.
Ad Networks Ranking
Different ad networks monetize better in different regions.
For publishers interested in taking a more manual
approach in positioning ad networks, our ranking of the
top ad networks’ overall monetization power offers a
benchmark to compare and gauge your setup.
Revenue Planning
The eCPM trend reports of each ad format can serve as
a revenue planning tool. For example, some ad formats’
eCPMs are trending up in certain regions, while some are
trending down. Publishers can use this information to make
better forecast of what eCPMs they can expect to earn.

MOBILE IN-APP AD MONETIZATION PERFORMANCE INDEX MEET THE AD FORMATS
© 2018 APPODEAL18 19
MEET THE AD FORMATS
Interstitials
Interstitials are attention grabbing ads that cover
the entire screen and can appear as a static image,
a video, or even an interactive image. Although
this format can be more disruptive to the user
experience than others, when placed at the right
moments within an app, interstitials are a great
choice for publishers to use. They offer high CTR,
high eCPMs and high availability of ads. Plus, new
innovations with this format, like interactive ads,
continue to make this format more user-friendly.
Banners
Banner ad is a traditional ad format that neatly
places a small rectangle ad at the top or bottom
of the screen. Despite this format’s low CTR and
low eCPM, it endured as a high earning format
for publishers. This is largely due to its ability to
be shown with much higher frequency than other
formats. Its low cost and easy production sustain
the popularity of banners among advertisers,
pointing to an opportunity for publishers to obtain
high supplies and varieties.
Rewarded Videos
Rewarded videos are user-initiated ads where
users can earn in-app rewards in exchange for
viewing a video ad. Since the release of this format
just a few years ago, rewarded videos have proven
to be very popular with users, advertisers and
publishers. Thanks to the high user satisfaction
and high CTR of this format, publishers can earn
the highest eCPMs with rewarded videos.

© 2018 APPODEAL20 21MOBILE IN-APP AD MONETIZATION PERFORMANCE INDEX MEET THE AD FORMATS
Rewarded Videos Interstitials Banners
USA $13.75 $8.55 $0.46
Western Europe $5.77 $3.44 $0.23
Eastern Europe $2.32 $2.24 $0.29
East Asia $12.32 $7.83 $0.32
South America $2.26 $1.91 $0.24
90%
2%8%
29%
21%
50%
USA 4.1 Billion Impressions
South America 0.9 Billion Impressions
East Asia 2.0 Billion Impressions
90%
2%8%
26%
21%
54%
90%
2%8%
52%11%
36%
Eastern Europe 2.2 Billion Impressions
Western Europe 6.2 Billion Impressions
90%
2%8%
34%
19%
47%
80%
7%
13%
35%
23%
42%
Impressions Share Monetization Power Share
Impressions Share Monetization Power Share
Impressions Share Monetization Power Share
Impressions Share Monetization Power Share
Impressions Share Monetization Power Share
Ad Formats At A Glance
Average eCPM All Apps
iOS Impressions & Monetization Power Distribution
Rewarded Videos Interstitials Banners
USA $12.01 $5.24 $0.52
Western Europe $2.95 $1.52 $0.15
Eastern Europe $1.57 $1.18 $0.12
East Asia $5.43 $2.61 $0.24
South America $0.66 $0.61 $0.08
80%
3%
17%
25%
21%
54%
USA 4.7 Billion Impressions
South America 7.5 Billion Impressions
East Asia 1.0 Billion Impressions
66%
4%
30%
14%
20%
66%
79%
5%
16%
33%
17%
50%
Eastern Europe 13.7 Billion Impressions
Western Europe 9.8 Billion Impressions
78%
4%
18%
23%
23%
54%
83%
5%
12%
29%
21%
50%
Impressions Share Monetization Power Share
Impressions Share Monetization Power Share
Impressions Share Monetization Power Share
Impressions Share Monetization Power Share
Impressions Share Monetization Power Share
Ad Formats At A Glance
Average eCPM All Apps
Android Impressions & Monetization Power Distribution
Rewarded Videos Interstitials Banners Rewarded Videos Interstitials Banners

SCOPE
© 2018 APPODEAL22 23
METHODOLOGY SCOPE
6 Months: H1 2018 (Jan - Jun)
5 Regions: United States, Western Europe, Eastern Europe, East Asia, South America
3 Ad Formats: Rewarded Video, Banner, Interstitial
2 Platforms: iOS, Android
33,000+ Apps
60+ Ad Demand Sources
51+ Billions Impressions
MOBILE IN-APP AD MONETIZATION PERFORMANCE INDEX METHODOLOGY

RANKING© 2018 APPODEAL24 25
MOBILE IN-APP AD MONETIZATION PERFORMANCE INDEX METHODOLOGY
Ad Network Monetization Power Ranking
Only top performing ad networks (representing more than 1% of the revenue generated based on a particular ad format and region) are included in the index. And are ranked based on the revenue they generate for publishers.
The revenue is based on a combination of ad networks’ eCPMs, impressions and fillrates. The higher each of these factors were, the higher the ad network’s revenue and the higher the ad network’s ranking.
While all the ad networks
ranked in this index
represent the top performing
ones, there are variations in
performance where some
networks have higher share
of the revenue due to higher
eCPMs, impressions and/or
fill-rates.
These distinctions are
shown by the ranking’s
wreath colors:
Over 20%
10-20%
1-10%
of revenue share
of revenue share
of revenue share

eCPM TRENDS
© 2018 APPODEAL26 27MOBILE IN-APP AD MONETIZATION PERFORMANCE INDEX METHODOLOGY
Ad Formats eCPM Trends
Each of the three ad formats’ monthly average eCPMs for each of the five regions analyzed are shown to illustrate how the ad format’s eCPMs are trending.
To provide more transparency to our
readers, we have added two new plots
of eCPMs data lines, Top Apps Only
and Top Apps Excluded, along with the
main trend line for All Apps.
The Top Apps consist of fewer than 1%
of all the apps analyzed for this index,
but they represent almost half of the
total impressions and revenue shares.
Because these Top Apps garner
more attention from ad networks and
advertisers, they are generally able
to command higher eCPM deals with
ad networks. In many cases, the Top
Apps do show higher eCPMs than all
other apps, which influences the main
All Apps reference line.
With the inclusion of eCPM trend
lines for Top Apps Only and Top Apps
Excluded, publishers can get a fuller
more accurate picture of what eCPMs
they can expect for their own apps.
Impressions Share
Impressions Share
Revenue Share
Revenue Share
Top Apps vs. All Apps
$10.00
$11.00
$12.00
$13.00
$14.00
$15.00
$16.00
Jan Feb Mar Apr May Jun
58%
41%
54%
38%

28 29 © 2018 APPODEAL
AD FORMATS eCPMs AND AD NETWORKS RANKINGS
MOBILE IN-APP AD MONETIZATION PERFORMANCE INDEX AD FORMATS eCPMs AND AD NETWORKS RANKINGS

© 2018 APPODEALMOBILE IN-APP AD MONETIZATION PERFORMANCE INDEX USA / AD FORMATS eCPMs AND AD NETWORKS RANKINGS
30 31MOBILE IN-APP AD MONETIZATION PERFORMANCE INDEX USA / AD FORMATS eCPMs AND AD NETWORKS RANKINGS
USA 90%
2%8%
80%
3%
17%
29%
21%
50%
25%
21%
54%
4.1 Billion Impressions
4.7 Billion Impressions
iOS
Android
Impressions Share
Impressions Share
Monetization Power Share
Monetization Power Share
Impressions & Monetization Power Distribution Rewarded Videos Interstitials Banners

© 2018 APPODEALMOBILE IN-APP AD MONETIZATION PERFORMANCE INDEX USA / AD FORMATS eCPMs AND AD NETWORKS RANKINGS
32 33
Rewarded video’s eCPMs increased significantly in 2018 and remained steadily
high with an average of $13.75 on iOS and $12.01 on Android across all apps. In
April, the average peaked to $15.34 on iOS.
Rewarded videos from Facebook Audience Network and AdMob, which were added
to Appodeal’s ad mediation towards the end of 2017, attributed to the significant
gains in this format’s average eCPMs.
Banners’ eCPMs trended back up after a dip following the year-end peak holiday
period to an average of $0.46 on iOS and $0.51 on Android.
AdMob and MoPub performed the best for banners thanks to AdMob’s superior
fill-rates and MoPub’s combination of high fill-rates and eCPMs.
KEY FINDINGSUSA
Interstitial’s eCPMs increased slightly in 2018 and remained consistent with an
average of $8.55 on iOS and $5.24 on Android across all apps.
AdMob performed among the top for interstitials across all apps on both iOS
and Android with its combination of high fill-rates and high eCPMs. AppLovin
ranked among the top on iOS thanks to its high fill-rates among Appodeal’s top
monetizing apps.
Performance of eCPMs on iOS and Android were on par for rewarded video and
banner, but higher on iOS for interstitial; while in other regions iOS generally
outperformed Android in terms of eCPMs across all ad formats.

© 2018 APPODEALMOBILE IN-APP AD MONETIZATION PERFORMANCE INDEX USA / AD FORMATS eCPMs AND AD NETWORKS RANKINGS
34 35
Rewarded Videos
$13.75Average eCPM
All Apps
Rewarded video’s eCPMs increased significantly and remained steadily high with an
average of $13.75. In April, the average peaked at $15.34.
Rewarded videos from Facebook Audience Network and AdMob, which were added to
Appodeal’s ad mediation stack towards the end of 2017, attributed to the significant gains
in this format’s average eCPMs.
Impressions ShareBased on 4.1 Billion Impressions
Ad Revenue Share
eCPM Trends
$10.00
$11.00
$12.00
$13.00
$14.00
$15.00
$16.00
Jan Feb Mar Apr May Jun
All Apps
Top Apps Only
Top Apps Excluded
Monetization Trends
2% 21%
USA
Monetization Power Ranking
1
AppLovin
4
AdMob
8
Vungle
9
MoPub
2
Facebook Audience Network
6
Unity Ads
10
Mintegral
3
Tapjoy
7
AdColony
5
IronSource
USA

© 2018 APPODEALMOBILE IN-APP AD MONETIZATION PERFORMANCE INDEX USA / AD FORMATS eCPMs AND AD NETWORKS RANKINGS
36 37
Interstitials
$8.55Average eCPM
All Apps
Interstitial’s eCPMs increased slightly and remained consistent with an average of $8.55.
AdMob performed among the top for interstitials across all apps, with its combination of
high fill-rates and high eCPMs. AppLovin ranked among the top also, thanks to its high
fill-rates among Appodeal’s top monetizing apps.
eCPM Trends
$6.00
$7.00
$8.00
$9.00
$10.00
$11.00
$12.00
Jan Feb Mar Apr May Jun
All Apps
Top Apps Only
Top Apps Excluded
Monetization Trends
USA
Impressions ShareBased on 4.1 Billion Impressions
Ad Revenue Share
8% 50%
1
AppLovin
6
Tapjoy
4
Vungle
5
Facebook Audience Network
3
MoPub
7
Unity Ads
8
IronSource
Monetization Power Ranking
USA
2
AdMob

© 2018 APPODEALMOBILE IN-APP AD MONETIZATION PERFORMANCE INDEX USA / AD FORMATS eCPMs AND AD NETWORKS RANKINGS
38 39
Banners
$0.46Average eCPM
All Apps
Banners’ eCPMs trended back up after a dip following the year-end peak holiday period,
rising to an average of $0.46.
AdMob and MoPub performed the best for banners, in large part thanks to AdMob’s
superior fill-rates and MoPub’s combination of high fill-rates and eCPMs.
eCPM Trends
$0.30
$0.37
$0.43
$0.50
$0.57
$0.63
$0.70
Jan Feb Mar Apr May Jun
All Apps
Top Apps Only
Top Apps Excluded
Monetization Trends
USA
Impressions ShareBased on 4.1 Billion Impressions
Ad Revenue Share
90% 29%3
Amazon Ads
5
Fyber
4
AppLovin
6
Smaato
Monetization Power Ranking
USA
1
AdMob
2
MoPub

© 2018 APPODEALMOBILE IN-APP AD MONETIZATION PERFORMANCE INDEX USA / AD FORMATS eCPMs AND AD NETWORKS RANKINGS
40 41
Rewarded Videos
$12.01Average eCPM
All Apps
Rewarded video’s eCPMs increased significantly and remained steadily high with an
average of $12.01 across all apps.
Rewarded videos from Facebook Audience Network and AdMob, which were added to
Appodeal’s ad mediation stack towards the end of 2017, attributed to the significant gains
in this format’s average eCPMs.
eCPM Trends
$9.00
$10.50
$12.00
$13.50
$15.00
$16.50
$18.00
Jan Feb Mar Apr May Jun
All Apps
Top Apps Only
Top Apps Excluded
Monetization Trends
USA
Impressions ShareBased on 4.7 Billion Impressions
Ad Revenue Share
3% 21%
4
AdMob
8
Vungle
1
Unity Ads
5
Facebook Audience Network
9
MoPub
2
AppLovin
10
Mintegral
3
Tapjoy
6
AdColony
7
IronSource
USA
Monetization Power Ranking

© 2018 APPODEALMOBILE IN-APP AD MONETIZATION PERFORMANCE INDEX USA / AD FORMATS eCPMs AND AD NETWORKS RANKINGS
42 43
Impressions ShareBased on 4.7 Billion Impressions
Ad Revenue Share
Interstitials
$5.24Average eCPM
All Apps
Interstitial’s eCPMs increased slightly and remained consistent with an average of $5.24
across all apps.
AdMob delivered the best results for interstitials across all apps with its combination of
high fill-rates and high eCPMs.
eCPM Trends
$4.00
$4.50
$5.00
$5.50
$6.00
$6.50
$7.00
Jan Feb Mar Apr May Jun
All Apps
Top Apps Only
Top Apps Excluded
Monetization Trends
USA
17% 54%
12
Smaato
7
Vungle
13
Chartboost
8
Ogury
2
Unity Ads
6
StartApp
9
Fyber
3
AppLovin
10
AdColony
11
IronSource
USA
5
Monetization Power Ranking
Facebook Audience Network
4
MoPub
1
AdMob

© 2018 APPODEALMOBILE IN-APP AD MONETIZATION PERFORMANCE INDEX USA / AD FORMATS eCPMs AND AD NETWORKS RANKINGS
44 45
Impressions ShareBased on 4.7 Billion Impressions
Ad Revenue Share
Banners
$0.52Average eCPM
All Apps
Banners’ eCPMs trended back up after a dip following the year-end peak holiday period to
an average of $0.52.
AdMob and MoPub performed the best for banners thanks to AdMob’s superior fill-rates
and MoPub’s combination of high fill-rates and eCPMs.
eCPM Trends
$0.30
$0.37
$0.43
$0.50
$0.57
$0.63
$0.70
Jan Feb Mar Apr May Jun
All Apps
Top Apps Only
Top Apps Excluded
Monetization Trends
USA
80% 25%
6
OpenX
7
Facebook Audience Network
3
Fyber
4
Smaato
5
Amazon Ads
USA
Monetization Power Ranking
1
AdMob
2
MoPub

© 2018 APPODEALMOBILE IN-APP AD MONETIZATION PERFORMANCE INDEX WESTERN EUROPE / AD FORMATS eCPMs AND AD NETWORKS RANKINGS
46 47
WESTERN EUROPE 90%
2%8%
78%
4%
18%
34%
19%
47%
23%
23%
54%
6.2 Billion Impressions
9.8 Billion Impressions
iOS
Android
Impressions Share
Impressions Share
Monetization Power Share
Monetization Power Share
Impressions & Monetization Power Distribution
Andorra
Austria
Belgium
Denmark
Finland
France
Germany
Iceland
Ireland
Isle of Man
Italy
Jersey
Liechtenstein
Luxembourg
Malta
Monaco
Netherlands
Norway
Portugal
San Marino
Spain
Sweden
Switzerland
United Kingdom
Vatican City
Rewarded Videos Interstitials Banners

© 2018 APPODEALMOBILE IN-APP AD MONETIZATION PERFORMANCE INDEX WESTERN EUROPE / AD FORMATS eCPMs AND AD NETWORKS RANKINGS
48 49
Rewarded videos continued to lead with the highest eCPM performance, with a
steady average of $5.77 on iOS and $2.95 on Android.
The top performing ad networks for rewarded videos were AdMob and Facebook
Audience Network for iOS, while AdMob and Unity Ads were the top performing
ones for Android.
Interstitial’s eCPMs did not change much in 2018 with a steady average of $3.44
on iOS and $1.52 on Android.
The top performing ad networks for interstitials were AdMob and AppLovin on
iOS, while AdMob dominated on Android.
KEY FINDINGSWESTERN EUROPE
Banners’ eCPMs steadily climbed back up on iOS after a dip following the year-
end peak holiday period to an average of $0.23. On Android, however, the eCPMs
decreased slightly to an average of $0.15.
AdMob performed among the top for interstitials across all apps with its
combination of high fill-rates and high eCPMs on both iOS and Android.
AppLovin ranked among the top on iOS thanks to its high fill-rates among
Appodeal’s top monetizing apps.
eCPMs from iOS were significantly higher than on Android, about two times
higher across all formats.

© 2018 APPODEALMOBILE IN-APP AD MONETIZATION PERFORMANCE INDEX WESTERN EUROPE / AD FORMATS eCPMs AND AD NETWORKS RANKINGS
50 51
Rewarded Videos
$5.77Average eCPM
All Apps
Rewarded videos continued to lead with the highest eCPM performance. Their eCPMs did
not see significant shift in 2018 though, compared to last year, with a steady average of
$5.77.
The top performing ad networks for rewarded videos were AdMob and Facebook Audience
Network. Their eCPM performances were especially strong, elevating the average eCPMs
of this ad format.
Impressions ShareBased on 6.2 Billion Impressions
Ad Revenue Share
eCPM Trends
$3.00
$4.00
$5.00
$6.00
$7.00
$8.00
$9.00
Jan Feb Mar Apr May Jun
All Apps
Top Apps Only
Top Apps Excluded
Monetization Trends
2% 19%
WESTERN EUROPE
Monetization Power Ranking
8
Chartboost
10
Vungle
9
MoPub
2
Facebook Audience Network
5
Unity Ads
6
Tapjoy
3
AppLovin
7
AdColony
4
IronSource
WESTERN EUROPE
1
AdMob

© 2018 APPODEALMOBILE IN-APP AD MONETIZATION PERFORMANCE INDEX WESTERN EUROPE / AD FORMATS eCPMs AND AD NETWORKS RANKINGS
52 53
Interstitials
$3.44Average eCPM
All Apps
Interstitial’s eCPMs did not change much in 2018 with a steady average of $3.44.
The top performing ad networks for interstitials were AdMob and AppLovin. AdMob
ranked high thanks to its high fill-rates and higher than average eCPMs while AppLovin
had among the highest fill-rates.
eCPM Trends
$0.00
$1.00
$2.00
$3.00
$4.00
$5.00
$6.00
Jan Feb Mar Apr May Jun
All Apps
Top Apps Only
Top Apps Excluded
Monetization Trends
WESTERN EUROPE
Impressions ShareBased on 6.2 Billion Impressions
Ad Revenue Share
8% 47%
5
Fyber
9
Vungle
3
MoPub
6
Unity Ads
7
Facebook Audience Network
8
Tapjoy
4
IronSource
Monetization Power Ranking
WESTERN EUROPE
2
AppLovin
1
AdMob

© 2018 APPODEALMOBILE IN-APP AD MONETIZATION PERFORMANCE INDEX WESTERN EUROPE / AD FORMATS eCPMs AND AD NETWORKS RANKINGS
54 55
Banners
$0.23Average eCPM
All Apps
Banners’ eCPMs steadily climbed back up on iOS after a dip following the year-end peak
holiday period, to an average of $0.23.
AdMob is the top performing ad network for banners, with its superior fill-rates. MoPub
ranked among the top thanks to its higher than average eCPMs.
eCPM Trends
$0.00
$0.08
$0.15
$0.23
$0.30
$0.38
$0.45
Jan Feb Mar Apr May Jun
All Apps
Top Apps Only
Top Apps Excluded
Monetization Trends
WESTERN EUROPE
Impressions ShareBased on 6.2 Billion Impressions
Ad Revenue Share
90% 34%4
AppLovin
5
Amazon Ads
2
MoPub
6
Smaato
3
Fyber
Monetization Power Ranking
WESTERN EUROPE
1
AdMob

© 2018 APPODEALMOBILE IN-APP AD MONETIZATION PERFORMANCE INDEX WESTERN EUROPE / AD FORMATS eCPMs AND AD NETWORKS RANKINGS
56 57
Rewarded Videos
$2.95Average eCPM
All Apps
Rewarded videos continued to lead with the highest eCPM performance. Their eCPMs did
not see significant shift in 2018 though, compared to last year, with a steady average of
$2.95.
The top performing ad networks for rewarded videos were AdMob and Unity Ads overall.
In terms of eCPMs, AdMob and Facebook’s strong performance, in particular, elevated this
ad format’s eCPM average.
eCPM Trends
$0.00
$0.75
$1.50
$2.25
$3.00
$3.75
$4.50
Jan Feb Mar Apr May Jun
All Apps
Top Apps Only
Top Apps Excluded
Monetization Trends
WESTERN EUROPE
Impressions ShareBased on 9.8 Billion Impressions
Ad Revenue Share
4% 23%
9
MoPub
5
Facebook Audience Network
10
Chartboost
3
Tapjoy
4
AppLovin
8
IronSource
WESTERN EUROPE
Monetization Power Ranking
6
AdColony
7
Vungle
1
AdMob
2
Unity Ads

© 2018 APPODEALMOBILE IN-APP AD MONETIZATION PERFORMANCE INDEX WESTERN EUROPE / AD FORMATS eCPMs AND AD NETWORKS RANKINGS
58 59
Impressions ShareBased on 9.8 Billion Impressions
Ad Revenue Share
Interstitials
$1.52Average eCPM
All Apps
Interstitial’s eCPMs did not change much in 2018 with a steady average of $1.52.
The top performing ad network was AdMob, thanks to its superior fill-rates in this ad
format.
eCPM Trends
$0.00
$0.50
$1.00
$1.50
$2.00
$2.50
$3.00
Jan Feb Mar Apr May Jun
All Apps
Top Apps Only
Top Apps Excluded
Monetization Trends
WESTERN EUROPE
18% 54%
8
Smaato
7
Vungle
5
Ogury
4
MoPub
2
Unity Ads
6
Fyber
10
StartApp
3
AppLovin
9
Facebook Audience Network
12
Chartboost
WESTERN EUROPE
Monetization Power Ranking
11
AdColony
13
IronSource
1
AdMob

© 2018 APPODEALMOBILE IN-APP AD MONETIZATION PERFORMANCE INDEX WESTERN EUROPE / AD FORMATS eCPMs AND AD NETWORKS RANKINGS
60 61
Impressions ShareBased on 9.8 Billion Impressions
Ad Revenue Share
Banners
$0.15Average eCPM
All Apps
Banner’s eCPMs decreased slightly following the holiday peak to an average of $0.15.
AdMob is the top performing ad network for banners on Android with its superior fill-
rates. MoPub, on the other hand, ranked among the top thanks to its higher than average
eCPMs.
eCPM Trends
$0.00
$0.05
$0.10
$0.15
$0.20
$0.25
$0.30
Jan Feb Mar Apr May Jun
All Apps
Top Apps Only
Top Apps Excluded
Monetization Trends
WESTERN EUROPE
78% 23%
4
Amazon Ads
5
Smaato
3
Fyber
2
MoPub
6
OpenX
7
Facebook Audience Network
WESTERN EUROPE
Monetization Power Ranking
1
AdMob

© 2018 APPODEALMOBILE IN-APP AD MONETIZATION PERFORMANCE INDEX EASTERN EUROPE / AD FORMATS eCPMs AND AD NETWORKS RANKINGS
62 63
EASTERN EUROPE 80%
7%
13%
83%
5%
12%
35%
23%
42%
29%
21%
50%
2.2 Billion Impressions
13.7 Billion Impressions
iOS
Android
Impressions Share
Impressions Share
Monetization Power Share
Monetization Power Share
Impressions & Monetization Power Distribution Rewarded Videos Interstitials Banners
Albania
Belarus
Bosnia & Herzegovina
Bulgaria
Croatia
Czech Republic
Estonia
Greece
Hungary
Latvia
Lithuania
Macedonia
Moldova
Montenegro
Poland
Romania
Russia
Serbia
Slovakia
Slovenia
Ukraine
© 2018 APPODEALMOBILE IN-APP AD MONETIZATION PERFORMANCE INDEX EASTERN EUROPE / AD FORMATS eCPMs AND AD NETWORKS RANKINGS
64 65
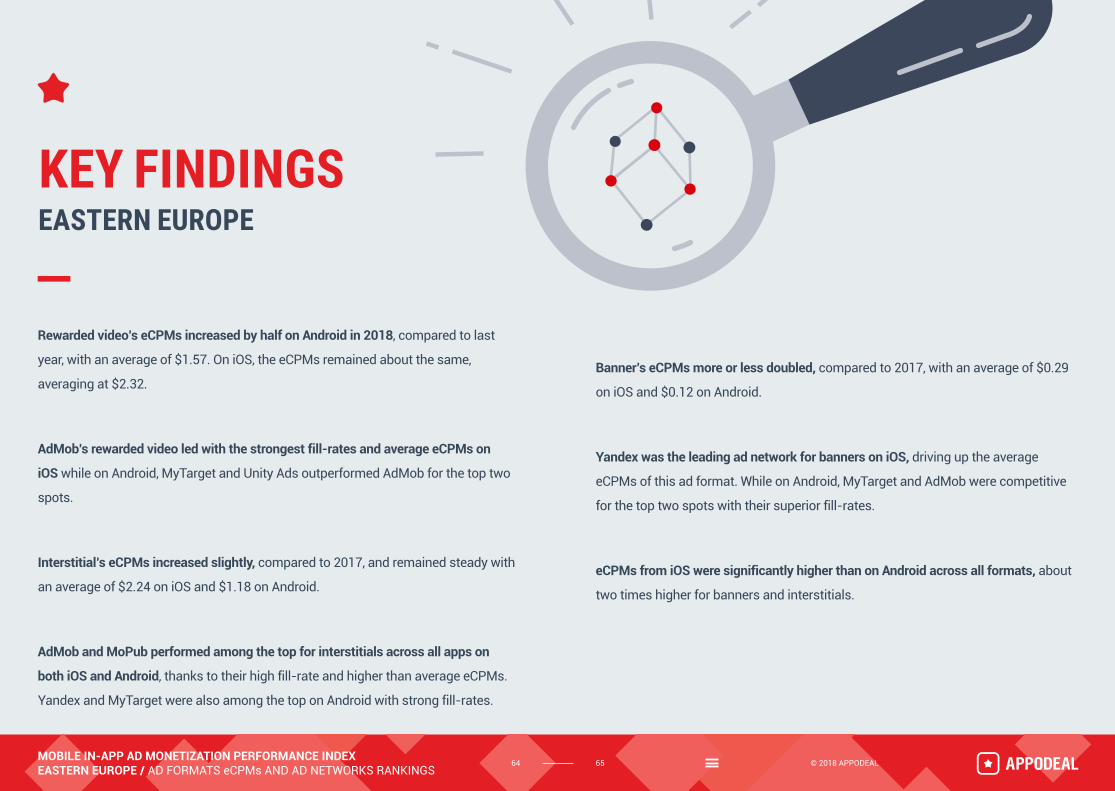
Rewarded video’s eCPMs increased by half on Android in 2018, compared to last
year, with an average of $1.57. On iOS, the eCPMs remained about the same,
averaging at $2.32.
AdMob’s rewarded video led with the strongest fill-rates and average eCPMs on
iOS while on Android, MyTarget and Unity Ads outperformed AdMob for the top two
spots.
Interstitial’s eCPMs increased slightly, compared to 2017, and remained steady with
an average of $2.24 on iOS and $1.18 on Android.
AdMob and MoPub performed among the top for interstitials across all apps on
both iOS and Android, thanks to their high fill-rate and higher than average eCPMs.
Yandex and MyTarget were also among the top on Android with strong fill-rates.
KEY FINDINGSEASTERN EUROPE
Banner’s eCPMs more or less doubled, compared to 2017, with an average of $0.29
on iOS and $0.12 on Android.
Yandex was the leading ad network for banners on iOS, driving up the average
eCPMs of this ad format. While on Android, MyTarget and AdMob were competitive
for the top two spots with their superior fill-rates.
eCPMs from iOS were significantly higher than on Android across all formats, about
two times higher for banners and interstitials.

© 2018 APPODEALMOBILE IN-APP AD MONETIZATION PERFORMANCE INDEX EASTERN EUROPE / AD FORMATS eCPMs AND AD NETWORKS RANKINGS
66 67
Rewarded Videos
$2.32Average eCPM
All Apps
Rewarded video’s eCPMs remained about the same, compared to last year, averaging at
$2.32.
AdMob’s rewarded video led with the strongest fill-rates and average eCPMs.
Impressions ShareBased on 2.2 Billion Impressions
Ad Revenue Share
eCPM Trends
$0.00
$1.00
$2.00
$3.00
$4.00
$5.00
$6.00
Jan Feb Mar Apr May Jun
All Apps
Top Apps Only
Top Apps Excluded
Monetization Trends
7% 23%
EASTERN EUROPE
Monetization Power Ranking
4
IronSource
8
Chartboost
9
Tapjoy
2
AppLovin
6
MyTarget
10
Facebook Audience Network
3
Unity Ads
11
Vungle
EASTERN EUROPE
5
AdColony
7
MoPub
1
AdMob

© 2018 APPODEALMOBILE IN-APP AD MONETIZATION PERFORMANCE INDEX EASTERN EUROPE / AD FORMATS eCPMs AND AD NETWORKS RANKINGS
68 69
Interstitials
$2.24Average eCPM
All Apps
Interstitial’s eCPMs increased slightly, compared to 2017, and remained steady with an
average of $2.24.
AdMob and MoPub performed among the top for interstitials across all apps, thanks to
their high fill-rate and higher than average eCPMs.
eCPM Trends
$0.00
$0.75
$1.50
$2.25
$3.00
$3.75
$4.50
Jan Feb Mar Apr May Jun
All Apps
Top Apps Only
Top Apps Excluded
Monetization Trends
EASTERN EUROPE
Impressions ShareBased on 2.2 Billion Impressions
Ad Revenue Share
13% 42%
6
IronSource
5
Yandex
9
Facebook Audience Network
4
Unity Ads
2
AppLovin
7
Fyber
3
MoPub
10
AdColony
8
MyTarget
Monetization Power Ranking
EASTERN EUROPE
1
AdMob

© 2018 APPODEALMOBILE IN-APP AD MONETIZATION PERFORMANCE INDEX EASTERN EUROPE / AD FORMATS eCPMs AND AD NETWORKS RANKINGS
70 71
Banners
$0.29Average eCPM
All Apps
Banner’s eCPMs almost doubled, compared to 2017, with an average of $0.29.
Yandex was the leading ad network for banners, driving up the average eCPMs of this ad
format.
eCPM Trends
$0.00
$0.10
$0.20
$0.30
$0.40
$0.50
$0.60
Jan Feb Mar Apr May Jun
All Apps
Top Apps Only
Top Apps Excluded
Monetization Trends
EASTERN EUROPE
Impressions ShareBased on 2.2 Billion Impressions
Ad Revenue Share
80% 35%3
AdMob
5
AppLovin
6
MyTarget
4
Fyber
Monetization Power Ranking
EASTERN EUROPE
2
MoPub
1
Yandex
© 2018 APPODEALMOBILE IN-APP AD MONETIZATION PERFORMANCE INDEX EASTERN EUROPE / AD FORMATS eCPMs AND AD NETWORKS RANKINGS
72 73
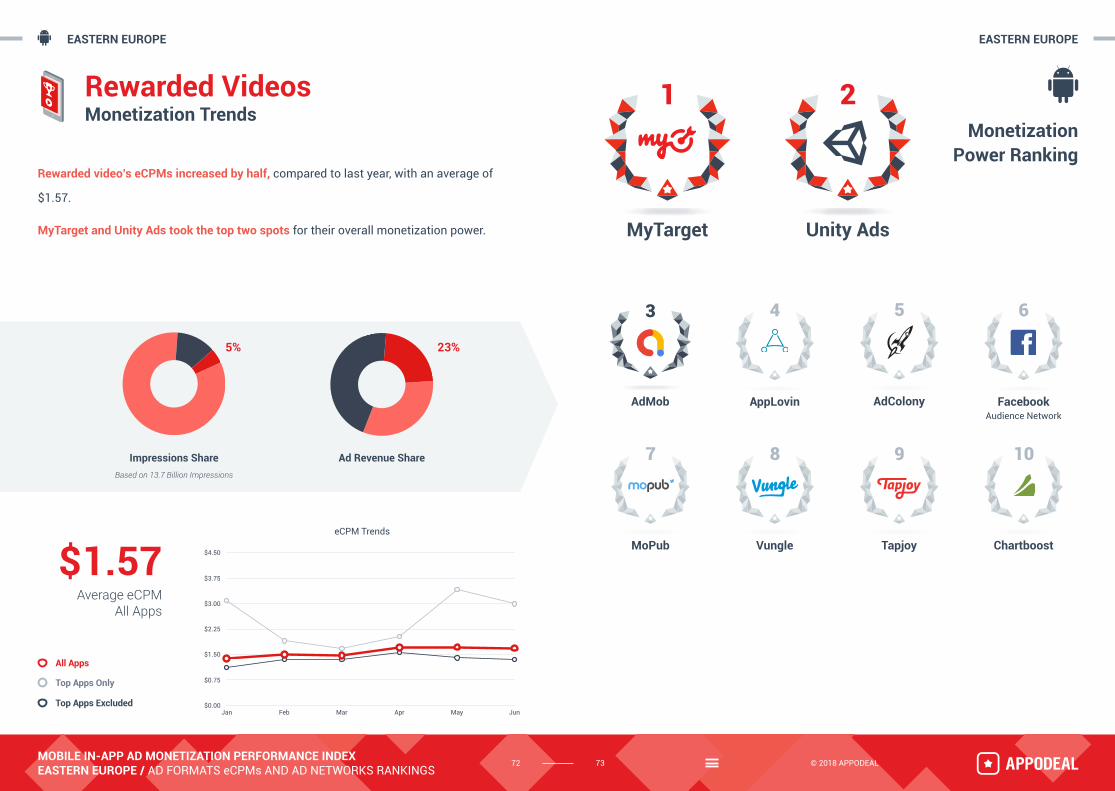
Rewarded Videos
$1.57Average eCPM
All Apps
Rewarded video’s eCPMs increased by half, compared to last year, with an average of
$1.57.
MyTarget and Unity Ads took the top two spots for their overall monetization power.
eCPM Trends
$0.00
$0.75
$1.50
$2.25
$3.00
$3.75
$4.50
Jan Feb Mar Apr May Jun
All Apps
Top Apps Only
Top Apps Excluded
Monetization Trends
EASTERN EUROPE
Impressions ShareBased on 13.7 Billion Impressions
Ad Revenue Share
5% 23%
3
AdMob
9
Tapjoy
10
Chartboost
6
Facebook Audience Network
4
AppLovin
8
Vungle
EASTERN EUROPE
Monetization Power Ranking
5
AdColony
7
MoPub
2
Unity Ads
1
MyTarget

© 2018 APPODEALMOBILE IN-APP AD MONETIZATION PERFORMANCE INDEX EASTERN EUROPE / AD FORMATS eCPMs AND AD NETWORKS RANKINGS
74 75
Impressions ShareBased on 13.7 Billion Impressions
Ad Revenue Share
Interstitials
$1.18Average eCPM
All Apps
Interstitial’s eCPMs increased slightly, compared to 2017, and remained steady with an
average of $1.18.
AdMob and MoPub performed among the top for interstitials across all apps, thanks
to their high fill-rate and higher than average eCPMs. Yandex and MyTarget were also
among the top with strong fill-rates.
eCPM Trends
$0.00
$0.50
$1.00
$1.50
$2.00
$2.50
$3.00
Jan Feb Mar Apr May Jun
All Apps
Top Apps Only
Top Apps Excluded
Monetization Trends
EASTERN EUROPE
12% 45%
4
MoPub
9
IronSource
8
Facebook Audience Network
2
Yandex
5
Unity Ads
6
AppLovin
3
MyTarget
7
Fyber
EASTERN EUROPE
Monetization Power Ranking
1
AdMob

© 2018 APPODEALMOBILE IN-APP AD MONETIZATION PERFORMANCE INDEX EASTERN EUROPE / AD FORMATS eCPMs AND AD NETWORKS RANKINGS
76 77
Impressions ShareBased on 13.7 Billion Impressions
Ad Revenue Share
Banners
$0.12Average eCPM
All Apps
Banner’s eCPMs almost doubled, compared to 2017, with an average of $0.12.
MyTarget and AdMob took the top two spots with their superior fill-rates.
eCPM Trends
$0.00
$0.05
$0.10
$0.15
$0.20
$0.25
$0.30
Jan Feb Mar Apr May Jun
All Apps
Top Apps Only
Top Apps Excluded
Monetization Trends
EASTERN EUROPE
83% 32%
5
Fyber
3
Yandex
4
MoPub
EASTERN EUROPE
Monetization Power Ranking
2
AdMob
1
MyTarget

China
Japan
South Korea
Taiwan
Hong Kong
© 2018 APPODEALMOBILE IN-APP AD MONETIZATION PERFORMANCE INDEX EAST ASIA / AD FORMATS eCPMs AND AD NETWORKS RANKINGS
78 79
EAST ASIA
90%
2%8%
66%
4%
30%
52%11%
36%
14%
20%
66%
2.0 Billion Impressions
1.0 Billion Impressions
iOS
Android
Impressions Share
Impressions Share
Monetization Power Share
Monetization Power Share
Impressions & Monetization Power Distribution Rewarded Videos Interstitials Banners

© 2018 APPODEALMOBILE IN-APP AD MONETIZATION PERFORMANCE INDEX EAST ASIA / AD FORMATS eCPMs AND AD NETWORKS RANKINGS
80 81
Overall, iOS showed impressive gains in eCPMs in all formats, especially rewarded
video and interstitial. The results on Android were more modest and mixed.
Interstitial’s eCPMs increased significantly on iOS, compared to last year, with an
average of $7.83. On Android, eCPMs remained at around the same level, averaging
at $2.61.
AdMob ranked among the top for Interstitials across all apps with its superior
eCPMs and fill-rates on both iOS and Android.
Rewarded videos saw a significant bump in their eCPMs on both iOS and Android,
averaging at $12.32 and $5.43 respectively.
KEY FINDINGSEAST ASIA
Rewarded videos by AdMob and Facebook, recently added towards the end of 2017,
contributed to the significant boost in the eCPM averages on both platforms.
Banners on iOS saw its eCPMs trending up to an average of $0.32. On Android,
banners trended down slightly to an average eCPM of $0.24.
AdMob dominated the banner format with its superior fill-rates and decent eCPMs
on both platforms.
The eCPMs on iOS across all ad formats are significantly higher than on Android,
especially with Interstitials, which were three times higher.

© 2018 APPODEALMOBILE IN-APP AD MONETIZATION PERFORMANCE INDEX EAST ASIA / AD FORMATS eCPMs AND AD NETWORKS RANKINGS
82 83
Rewarded Videos
$12.32Average eCPM
All Apps
Rewarded videos saw a significant bump in their eCPMs, compared to last year, averaging
at $12.32.
Rewarded videos by AdMob and Facebook, recently added towards the end of 2017,
contributed to the significant boost in the eCPM averages.
Impressions ShareBased on 2.0 Billion Impressions
Ad Revenue Share
eCPM Trends
$6.00
$8.00
$10.00
$12.00
$14.00
$16.00
$18.00
Jan Feb Mar Apr May Jun
All Apps
Top Apps Only
Top Apps Excluded
Monetization Trends
2% 21%
EAST ASIA
Monetization Power Ranking
4
Vungle
5
IronSource
8
Chartboost
7
Unity Ads
2
AppLovin
6
Tapjoy
9
Mintegral
3
Facebook Audience Network
10
AdColony
EAST ASIA
1
AdMob

© 2018 APPODEALMOBILE IN-APP AD MONETIZATION PERFORMANCE INDEX EAST ASIA / AD FORMATS eCPMs AND AD NETWORKS RANKINGS
84 85
Interstitials
$7.83Average eCPM
All Apps
Interstitial’s eCPMs increased significantly, compared to last year, with an average of
$7.83.
AdMob ranked among the top for Interstitials across all apps, with its superior eCPMs and
fill-rates.
eCPM Trends
$4.00
$5.00
$6.00
$7.00
$8.00
$9.00
$10.00
Jan Feb Mar Apr May Jun
All Apps
Top Apps Only
Top Apps Excluded
Monetization Trends
EAST ASIA
Impressions ShareBased on 2.0 Billion Impressions
Ad Revenue Share
8% 54%
8
Chartboost
5
MoPub
6
Unity Ads
Monetization Power Ranking
EAST ASIA
3
Tapjoy
4
IronSource
9
Facebook Audience Network
7
Vungle
2
AdMob
1
AppLovin

© 2018 APPODEALMOBILE IN-APP AD MONETIZATION PERFORMANCE INDEX EAST ASIA / AD FORMATS eCPMs AND AD NETWORKS RANKINGS
86 87
Banners
$0.32Average eCPM
All Apps
Banners on iOS saw eCPMs trending up to an average of $0.32.
AdMob dominated the banner format, with its superior fill-rates and steady eCPMs.
eCPM Trends
$0.00
$0.10
$0.20
$0.30
$0.40
$0.50
$0.60
Jan Feb Mar Apr May Jun
All Apps
Top Apps Only
Top Apps Excluded
Monetization Trends
EAST ASIA
Impressions ShareBased on 2.0 Billion Impressions
Ad Revenue Share
90% 26%
Monetization Power Ranking
EAST ASIA
5
Amazon Ads
2
AppLovin
3
MoPub
4
Fyber
1
AdMob

© 2018 APPODEALMOBILE IN-APP AD MONETIZATION PERFORMANCE INDEX EAST ASIA / AD FORMATS eCPMs AND AD NETWORKS RANKINGS
88 89
Rewarded Videos
$5.43Average eCPM
All Apps
Rewarded videos saw a significant bump in their eCPMs, compared to last year, averaging
at $5.43.
Rewarded videos by AdMob and Facebook Audience Network, recently added towards the
end of 2017, contributed to the significant boost in the eCPM averages.
eCPM Trends
$3.00
$4.00
$5.00
$6.00
$7.00
$8.00
$9.00
Jan Feb Mar Apr May Jun
All Apps
Top Apps Only
Top Apps Excluded
Monetization Trends
EAST ASIA
Impressions ShareBased on 1.0 Billion Impressions
Ad Revenue Share
4% 20%
EAST ASIA
Monetization Power Ranking
3
Facebook Audience Network
9
Chartboost
10
MoPub
6
Tapjoy
4
AppLovin
8
AdColony
5
Vungle
7
IronSource
2
AdMob
1
Unity Ads

© 2018 APPODEALMOBILE IN-APP AD MONETIZATION PERFORMANCE INDEX EAST ASIA / AD FORMATS eCPMs AND AD NETWORKS RANKINGS
90 91
Impressions ShareBased on 1.0 Billion Impressions
Ad Revenue Share
Interstitials
$2.61Average eCPM
All Apps
Interstitial’s eCPMs remained at around the same level as last year’s, averaging at $2.61.
AdMob ranked as the top network for Interstitials across all apps, with its superior eCPMs
and fill-rates.
eCPM Trends
$0.00
$1.00
$2.00
$3.00
$4.00
$5.00
$6.00
Jan Feb Mar Apr May Jun
All Apps
Top Apps Only
Top Apps Excluded
Monetization Trends
EAST ASIA
30% 66%
EAST ASIA
Monetization Power Ranking
3
MoPub
9
Smaato
6
Facebook Audience Network
8
IronSource
5
Vungle
7
Fyber
4
AppLovin
1
AdMob
2
Unity Ads

© 2018 APPODEALMOBILE IN-APP AD MONETIZATION PERFORMANCE INDEX EAST ASIA / AD FORMATS eCPMs AND AD NETWORKS RANKINGS
92 93
Impressions ShareBased on 1.0 Billion Impressions
Ad Revenue Share
Banners
$0.24Average eCPM
All Apps
Banners on Android trended down slightly to an average eCPM of $0.24.
AdMob dominated the banner format with its superior fill-rates and consistent eCPMs.
eCPM Trends
$0.00
$0.10
$0.20
$0.30
$0.40
$0.50
$0.60
Jan Feb Mar Apr May Jun
All Apps
Top Apps Only
Top Apps Excluded
Monetization Trends
EAST ASIA
66% 14%
EAST ASIA
Monetization Power Ranking
5
Smaato
2
MoPub
6
Amazon Ads
4
Facebook Audience Network
3
Fyber
1
AdMob

© 2018 APPODEALMOBILE IN-APP AD MONETIZATION PERFORMANCE INDEX SOUTH AMERICA / AD FORMATS eCPMs AND AD NETWORKS RANKINGS
94 95
SOUTH AMERICA 90%
2%8%
79%
5%
16%
52%11%
36%
33%
17%
50%
0.9 Billion Impressions
7.5 Billion Impressions
iOS
Android
Impressions Share
Impressions Share
Monetization Power Share
Monetization Power Share
Impressions & Monetization Power Distribution Rewarded Videos Interstitials Banners
Argentina
Bolivia
Brazil
Chile
Colombia
Ecuador
Falkland Islands
French Guiana
Guyana
Paraguay
Peru
Suriname
Uruguay
Venezuela
© 2018 APPODEALMOBILE IN-APP AD MONETIZATION PERFORMANCE INDEX SOUTH AMERICA / AD FORMATS eCPMs AND AD NETWORKS RANKINGS
96 97
Overall eCPMs of ad formats on iOS increased modestly compared to last year.
Android, on the other hand, did not see a noticeable shift.
Interstitial’s eCPMs increased steadily on both platforms with an average of
$1.91 on iOS and $0.61 on Android.
AdMob ranked top for Interstitials across all apps with its superior eCPMs and
fill-rates on both iOS and Android.
Rewarded video also saw a steady eCPM increase on both platforms with an
average of $2.26 on iOS and $0.65 on Android. This format has yet to surpass
interstitial by wider margins in South America, as compared to other regions.
KEY FINDINGSSOUTH AMERICA
AdMob takes the top place for rewarded video thanks to its combination of
superior fill-rates and higher than average eCPMs on both platforms. Facebook
and MoPub’s high eCPMs in this ad format were major contributors in boosting
this format’s average eCPMs.
Banners on iOS increased quite significantly, compared to last year, to an
average of $0.23. It stayed flat on Android though, averaging at $0.08.
AdMob dominated the banner format with its superior fill-rates on both
platforms. MoPub was another strong network, particular on iOS, with its
impressive high eCPMs.

© 2018 APPODEALMOBILE IN-APP AD MONETIZATION PERFORMANCE INDEX EAST ASIA / AD FORMATS eCPMs AND AD NETWORKS RANKINGS
98 99
Rewarded Videos
$2.26Average eCPM
All Apps
Rewarded video saw a steady eCPM increase, with an average of $2.26. This format
has yet to surpass interstitial by wider margins in South America, as compared to other
regions.
AdMob takes the top place for rewarded video, thanks to its combination of superior
fill-rates and higher than average eCPMs. Facebook and MoPub’s high eCPMs in this ad
format were major contributors in boosting this format’s average eCPMs.
Impressions ShareBased on 0.9 Billion Impressions
Ad Revenue Share
eCPM Trends
$0.00
$0.75
$1.50
$2.25
$3.00
$3.75
$4.50
Jan Feb Mar Apr May Jun
All Apps
Top Apps Only
Top Apps Excluded
Monetization Trends
2% 11%
SOUTH AMERICA
Monetization Power Ranking
SOUTH AMERICA
4
AppLovin
5
IronSource
8
Chartboost
7
Unity Ads
2
Facebook Audience Network
6
AdColony
9
Tapjoy
3
MoPub
10
Vungle
1
AdMob

© 2018 APPODEALMOBILE IN-APP AD MONETIZATION PERFORMANCE INDEX SOUTH AMERICA / AD FORMATS eCPMs AND AD NETWORKS RANKINGS
100 101
Interstitials
$1.91Average eCPM
All Apps
Interstitial’s eCPMs increased steadily, with an average of $1.91.
AdMob ranked top for Interstitials across all apps with its superior eCPMs and fill-rates.
eCPM Trends
$0.00
$0.50
$1.00
$1.50
$2.00
$2.50
$3.00
Jan Feb Mar Apr May Jun
All Apps
Top Apps Only
Top Apps Excluded
Monetization Trends
SOUTH AMERICA
Impressions ShareBased on 0.9 Billion Impressions
Ad Revenue Share
8% 36%
Monetization Power Ranking
SOUTH AMERICA
3
MoPub
9
AdColony
6
Fyber
8
Vungle
5
IronSource
7
Tapjoy
4
Facebook Audience Network
10
Unity Ads
1
AdMob
2
AppLovin

© 2018 APPODEALMOBILE IN-APP AD MONETIZATION PERFORMANCE INDEX SOUTH AMERICA / AD FORMATS eCPMs AND AD NETWORKS RANKINGS
102 103
Banners
$0.24Average eCPM
All Apps
Banners on iOS increased quite significantly, compared to last year, to an average of
$0.24.
AdMob dominated the banner format, with its superior fill-rates. MoPub was another
strong network with its impressive high eCPMs.
eCPM Trends
$0.00
$0.08
$0.15
$0.23
$0.30
$0.38
$0.45
Jan Feb Mar Apr May Jun
All Apps
Top Apps Only
Top Apps Excluded
Monetization Trends
SOUTH AMERICA
Impressions ShareBased on 0.9 Billion Impressions
Ad Revenue Share
90% 52%
Monetization Power Ranking
SOUTH AMERICA
5
Smaato
4
AppLovin
3
Fyber
1
AdMob
2
MoPub

© 2018 APPODEALMOBILE IN-APP AD MONETIZATION PERFORMANCE INDEX SOUTH AMERICA / AD FORMATS eCPMs AND AD NETWORKS RANKINGS
104 105
Rewarded Videos
$0.66Average eCPM
All Apps
Rewarded video also saw a steady eCPM increase, with an average of $0.66. This format
has yet to surpass interstitial by wider margins in South America, as compared to other
regions.
AdMob takes the top place for rewarded video thanks to its combination of superior fill-
rates and higher than average eCPMs, on both platforms. Facebook and MoPub’s high
eCPMs in this ad format gave major boost to this format’s average eCPMs.
eCPM Trends
$0.00
$0.25
$0.50
$0.75
$1.00
$1.25
$1.50
Jan Feb Mar Apr May Jun
All Apps
Top Apps Only
Top Apps Excluded
Monetization Trends
SOUTH AMERICA
Impressions ShareBased on 7.5 Billion Impressions
Ad Revenue Share
5% 17%
SOUTH AMERICA
Monetization Power Ranking
5
AdColony
2
MoPub
6
Tapjoy
4
Unity Ads
3
AppLovin
9
Vungle
8
IronSource
7
Facebook Audience Network
10
Chartboost
1
AdMob

© 2018 APPODEALMOBILE IN-APP AD MONETIZATION PERFORMANCE INDEX SOUTH AMERICA / AD FORMATS eCPMs AND AD NETWORKS RANKINGS
106 107
Impressions ShareBased on 7.5 Billion Impressions
Ad Revenue Share
Interstitials
$0.61Average eCPM
All Apps
Interstitial’s eCPMs increased steadily with an average of $0.61.
AdMob ranked top for Interstitials across all apps with its superior eCPMs and fill-rates.
eCPM Trends
$0.30
$0.40
$0.50
$0.60
$0.70
$0.80
$0.90
Jan Feb Mar Apr May Jun
All Apps
Top Apps Only
Top Apps Excluded
Monetization Trends
SOUTH AMERICA
16% 50%
SOUTH AMERICA
Monetization Power Ranking
5
Facebook Audience Network
8
Vungle
7
Fyber
2
AppLovin
6
Smaato
9
StartApp
3
MoPub
10
AdColony
4
Unity Ads
11
IronSource
1
AdMob

© 2018 APPODEALMOBILE IN-APP AD MONETIZATION PERFORMANCE INDEX SOUTH AMERICA / AD FORMATS eCPMs AND AD NETWORKS RANKINGS
108 109
Impressions ShareBased on 7.5 Billion Impressions
Ad Revenue Share
Banners
$0.08Average eCPM
All Apps
Banner’s eCPMs stayed relatively flat on Android, averaging at $0.08.
AdMob dominated the banner format with its superior fill-rates.
eCPM Trends
$0.00
$0.03
$0.05
$0.08
$0.10
$0.13
$0.15
Jan Feb Mar Apr May Jun
All Apps
Top Apps Only
Top Apps Excluded
Monetization Trends
SOUTH AMERICA
79% 33%
SOUTH AMERICA
Monetization Power Ranking
5
Facebook Audience Network
2
MoPub
4
Smaato
3
Fyber
1
AdMob

© 2018 APPODEAL110 111MOBILE IN-APP AD MONETIZATION PERFORMANCE INDEX DSPs MINI-PERFORMANCE INDEX
DSPs (demand-side platforms) are another major type
of ad demand source. Unlike ad networks, DSPs run
ads programmatically in real-time and require a type of
integration that is generally more complex, making them
inaccessible to most publishers. However, Appodeal has
access to their performance data as our SDK also includes a
built-in ad exchange with a big number of DSPs competing
for the publisher’s inventory.
This Bonus Mini-Performance Index of DSPs showcases
the top monetizing DSPs that not only won the auction
within the ad exchange but also against ad networks for ad
impressions from H1 2018.
As more DSPs continue to be added to our ad exchange
and ad networks adopt more programmatic approaches at
the same time, expect to see some interesting shifts and
convergence of these two types of ad demand sources in the
upcoming year.
DSP MINI-PERFORMANCE INDEX
+ BONUS

© 2018 APPODEAL112 113MOBILE IN-APP AD MONETIZATION PERFORMANCE INDEX DSPs MINI-PERFORMANCE INDEX
Interstitials Interstitials
Non-Skippable Videos Non-Skippable Videos
Banners Banners
USA WESTERN EUROPE
2
AppGrowth
3
Manage
5
MobvistaBIDEASE
41
Fractional Media
1
Fractional Media
1
Fractional Media
2
Fractional Media
3
AppGrowth
3
Mobvista
2
Manage
1
Manage
4
Mobvista BIDEASE
5
3
GroundTruthClickky
51
LiquidM
1
LiquidM
4
GroundTruth
3
GroundTruth
4
GroundTruth
6
Manage
1
GroundTruth
1
GroundTruth
2
Manage
2
AxonixBIDEASE
53
Clickky
6
LiquidM
6
LiquidM
2
AppGrowth
1
BIDEASE
1
Manage
1
Manage
1
Manage
2
AppGrowth
5
Axonix
5
Axonix
2
Mobvista
2
Axonix
4
Mobvista
5
Mobvista
3
Mobvista
3
Mobvista
3
Mobvista
2
Manage
4
LiquidM
6
LiquidM
Bucksense
5
Bucksense
7
6
Mobvista
4
Getloyal
Manage
7
Manage
3
1
ManageManage
4
3
Altamob
4
Altamob

© 2018 APPODEAL114 115MOBILE IN-APP AD MONETIZATION PERFORMANCE INDEX DSPs MINI-PERFORMANCE INDEX
Interstitials Interstitials
Non-Skippable Videos Non-Skippable Videos
Banners Banners
EASTERN EUROPE EAST ASIA
1
Fractional Media
1
Fractional Media
1
Fractional Media
2
Fractional Media
2
BIDEASE
2
BIDEASE
Manage
3
Manage
4
Manage
4
Manage
7
4
HyperAdX
3
BIDEASE Appreciate
5
1
Getloyal
1
Getloyal
2
BIDEASE
3
Clickky
4
Bucksense
4
Bucksense
LiquidM
5
Mobvista
6 7
Appreciate
5
Appreciate
3
Appreciate
3
Mobvista
4
Bucksense
6
Clickky
1
BIDEASE
1
BIDEASE
2
HyperAdX
3
HyperAdX
2
Appreciate
Persona.ly
5
Mobvista
3
Mobvista
3
Mobvista
3
1
Persona.ly
2
Persona.ly
Mobvista
2
Mobvista
1
1
Altamob
2
LiquidM
Persona.ly
2
Persona.ly
21
HyperAdX

PLEASE,STAND BY
© 2018 APPODEAL116 117MOBILE IN-APP AD MONETIZATION PERFORMANCE INDEX DSPs MINI-PERFORMANCE INDEX
Interstitials
Non-Skippable Videos
Banners
SOUTH AMERICA
1
Fractional Media
2
Fractional Media
Manage
3
Manage
3
2
LiquidM
1
LiquidM
2
LiquidM
Manage
3
1
Clickky
Mobvista
21
Manage

© 2018 APPODEAL118 119
ABOUT APPODEAL
Appodeal’s ad mediation is 100% unbiased (we are not an ad
network nor do we have our own internal ad demands).
That is why we are uniquely able to evaluate the
performance of our 60+ ad demand partners from a neutral
point of view to publish the industry’s only in-app ad
monetization performance index report.
We believe transparency is key for publisher’s success
with ad monetization.
Appodeal is a leading all-in-one ad monetization solution that puts app publishers first. Our one ad mediation SDK gives publishers access to over 60 ad demand sources, all competing against each other in a real-time auction for each and every ad impression.

© 2018 APPODEALMOBILE IN-APP AD MONETIZATION PERFORMANCE INDEX H1 2018
120 121
All-In-One Ad Monetization Solution
All Winning Mobile Ad Formats
100% Unbiased Ad Mediation
Monetize effortlessly as over 60 ad demand sources compete for each of your
ad impression. Now powered by the latest in-app header bidding technology.
Full Ad Monetization ControlsTake full control to manage your ad networks, waterfall and ad units. A/B test
different user segments and ad placements for optimize results.
Powerful Ad ServerRun cross-promo ads to grow your apps or direct deal ads through your
premium ad inventory to monetize even more.
Transparent Ad Revenue AnalyticsView ad performance of over 60 ad demand sources all on one dashboard.
Understand the ad revenue attribution of your newly acquired users.
One Unified Payout SystemGet paid in advance on-demand or every 30 days in one aggregated payment
option of your choice.
All In One Ready-to-Go SDK
Sign up free:
appodeal.com
Rewarded Video
Interstitial (static, video, rich)
Banner Native Ad
We Support:
Questions? Media inquiries: [email protected]
Sales: [email protected]

© 2018 APPODEALMOBILE IN-APP AD MONETIZATION PERFORMANCE INDEX H1 2018
122 123
AdColony ! !AdMob ! ! ! !Amazon Mobile Ads ! !AppLovin ! ! ! !Chartboost ! !Facebook Audience Network ! ! ! !Fyber/Inneractive ! ! !Flurry ! ! ! !InMobi ! ! ! !IronSource ! !Mintegral ! ! !MoPub ! ! ! !MyTarget ! ! ! !Ogury !OpenX ! !Smaato ! ! !StartApp ! ! ! !Tapjoy ! !Unity Ads ! !Vungle ! !Yandex ! !
Ad Networks & Ad Exchanges Rewarded
VideosBannerInterstitial
Rich | Video | Static
Native Ads
Over 60 Ad Demand Sources In One SDKList As of November 2018
DSPs Rewarded Videos
BannerInterstitial Rich | Video | Static
Native Ads
Altamob !Amadoad ! ! !AppGrowth ! ! !Applift ! ! ! !Appreciate ! ! ! !Avazu ! ! !Axonix ! !Beeline Programmatic ! ! !BIDEASE ! ! ! !Bucksense ! ! !Epom ! !Fractional Media ! !Getloyal DSP ! !GroundTruth (xAd) ! !HyperadX ! !Index Exchange ! !Jampp ! ! ! !LeadBolt ! !LiquidM ! !Manage.com ! ! ! !Mobvista ! !Oxonux Digital Media !Persona.ly ! !Pubnative ! ! !Woobi ! !Yeahmobi ! ! !Zorka Mobi !

H1 2018 EDITION
PERFOR MANCE INDEX
MOBILE IN-APP AD MONETIZATION
APPODEAL.COM
© 2018 APPODEAL