
Mitochondrial DNA reveals multiple introductions of domestic chicken in East Africa
10
This article appeared in a journal published by Elsevier. The attached copy is furnished to the author for internal non-commercial research and education use, including for instruction at the authors institution and sharing with colleagues. Other uses, including reproduction and distribution, or selling or licensing copies, or posting to personal, institutional or third party websites are prohibited. In most cases authors are permitted to post their version of the article (e.g. in Word or Tex form) to their personal website or institutional repository. Authors requiring further information regarding Elsevier’s archiving and manuscript policies are encouraged to visit: http://www.elsevier.com/copyright
-
Upload
independent -
Category
Documents
-
view
2 -
download
0
Transcript of Mitochondrial DNA reveals multiple introductions of domestic chicken in East Africa
This article appeared in a journal published by Elsevier. The attachedcopy is furnished to the author for internal non-commercial researchand education use, including for instruction at the authors institution
and sharing with colleagues.
Other uses, including reproduction and distribution, or selling orlicensing copies, or posting to personal, institutional or third party
websites are prohibited.
In most cases authors are permitted to post their version of thearticle (e.g. in Word or Tex form) to their personal website orinstitutional repository. Authors requiring further information
regarding Elsevier’s archiving and manuscript policies areencouraged to visit:
http://www.elsevier.com/copyright
Author's personal copy
Mitochondrial DNA reveals multiple introductions of domestic chicken in East Africa
J.M. Mwacharo a,⇑, G. Bjørnstad b,c, V. Mobegi c, K. Nomura d, H. Hanada d, T. Amano e, H. Jianlin c,f,O. Hanotte a,c
a School of Biology, Centre for Genetics and Genomics, The University of Nottingham, University Park, Nottingham NG7 2RD, UKb Norwegian School of Veterinary Science, Department of Basic Sciences & Aquatic Medicine, P.O. Box 8146, N-0033 Oslo, Norwayc International Livestock Research Institute, P.O. Box 30709, Nairobi 00100, Kenyad Laboratory of Animal Genetics and Breeding, Department of Animal Science, Tokyo University of Agriculture, 1737 Funako Atsugi-Shi, Kanagawa 243-0034, Japane Nakagawa 5-21-22, Tsuzuki-Ku, Yokohama-Shi, Kanagawa-Ken 224-0001, Japanf CAAS-ILRI Joint Laboratory on Livestock and Forage Genetic Resources, Institute of Animal Science, Chinese Academy of Agricultural Sciences (CAAS), Beijing 100094, China
a r t i c l e i n f o
Article history:Received 1 November 2010Accepted 29 November 2010Available online 5 December 2010
Keywords:Gallus gallusVillage chickenControl regionIndian Ocean
a b s t r a c t
Chicken were possibly domesticated in South and Southeast Asia. They occur ubiquitously in East Africawhere they show extensive phenotypic diversity. They appeared in the region relatively late, with thefirst undisputed evidence of domestic chicken in Sudan, around �700 BC. We reveal through a detailedanalysis of mitochondrial DNA D-loop sequence diversity of 512 domestic village chickens, from four EastAfrican countries (Kenya, Ethiopia, Sudan, Uganda), the presence of at least five distinct mitochondrialDNA haplogroups. Phylogeographic analyses and inclusion of reference sequences from Asia allow usto address the origin, ways of introduction and dispersion of each haplogroup. The results indicate a likelyIndian subcontinent origin for the commonest haplogroup (D) and a maritime introduction for the nextcommonest one (A) from Southeast and/or East Asia. Recent introgression of commercial haplotypes intothe gene pool of village chickens might explain the rare presence of two haplogroups (B and C) while theorigin of the last haplogroup (E) remains unclear being currently observed only outside the African con-tinent in the inland Yunnan Province of China. Our findings not only support ancient historical maritimeand terrestrial contacts between Asia and East Africa, but also indicate the presence of large maternalgenetic diversity in the region which could potentially support genetic improvement programmes.
� 2010 Elsevier Inc. All rights reserved.
1. Introduction
Village chickens (Gallus gallus) are ubiquitous in East Africa witha total population of 100.8 million birds (FAOSTAT, 2007). Thesebirds fulfil various roles ranging from socio-cultural to sustaininglivelihoods, suggesting a long historical presence in the region.Chicken are not a native species to Africa where no wildGallus sp. is found (Delacour, 1977). A previous phylogenetic studyof chicken mitochondrial DNA (mtDNA) control region suggestedthat the Indochinese red junglefowl subspecies Gallus gallus galluswas the primary maternal ancestor of all domestic fowlsG. g. domesticus and that Southeast Asia (Thailand) was the likelycenter of domestication (Fumihito et al., 1996). A recent study,which analysed a larger fragment of the mtDNA control regionencompassing the first hypervariable segment, in a comparativelylarge and diverse gene pool of domestic chickens from a wide geo-graphic area (Europe and Asia), was the first to suggest multiplematernal geographic centers of origin for the domestic species(Liu et al., 2006). They identified nine divergent clades, (called here
haplogroups), seven of which included both domestic chickens andwild red junglefowl subspecies haplotypes. Three of the nine cladesinvolved mtDNA control region haplotypes found across Europeand Asia, whereas the other six clades contained haplotypes foundexclusively in South and Southeast Asia. Both Fumihito et al.(1996) and Liu et al. (2006) studies lacked samples from theAfrican continent.
More recently, three studies have made an attempt to addressthe origin of African village chickens through the analysis of partialmtDNA D-loop sequences. Muchadeyi et al. (2008) observed twodistinct haplogroups in Zimbabwe village chickens which they pos-tulated came from Southeast Asia and the Indian subcontinent.Similarly, Razafindraibe et al. (2008) observed two haplogroupsin Madagascar village chicken and speculated that one was of Indo-nesian and the other of African continental origin or an introgres-sion from commercial lines. At the opposite a single haplogroupthought to be of Indian origin was observed in Nigeria villagechickens by Adebambo et al. (2010), while no information is yetavailable for the East African region.
Since historical times, Africa and Asia have been linked via mar-itime and terrestrial corridors. The Indian Ocean was one of theworld’s earliest arenas that provided a maritime corridor linking
1055-7903/$ - see front matter � 2010 Elsevier Inc. All rights reserved.doi:10.1016/j.ympev.2010.11.027
⇑ Corresponding author. Fax: +44 (0) 115 951 3251.E-mail address: [email protected] (J.M. Mwacharo).
Molecular Phylogenetics and Evolution 58 (2011) 374–382
Contents lists available at ScienceDirect
Molecular Phylogenetics and Evolution
journal homepage: www.elsevier .com/locate /ympev
Author's personal copy
Africa and Asia. Following the monsoon wind patterns of the IndianOcean, Asia and East Africa witnessed important seafaring andmaritime exchanges across historical times. Asia and Africa werealso connected via a terrestrial route that traversed the ArabianPeninsula, a region which occupies a key geographic junction, withthe African landmass to the West and the Asian continent to theEast (Boivin and Fuller, 2009). These terrestrial and maritimeroutes witnessed the long distance movement of people, livestockand crops within and between continents. Domesticates that dis-persed from Asia to Africa included cattle, pigs, chicken, broomcornmillet, bananas, water yam and taro and those that moved fromAfrica to Asia are donkey’s, sorghum, pearl millet, finger millet,cowpeas and hyacinth beans (Fuller and Boivin, 2009).
Village chickens in East Africa are found across the entire regionand in all agro-ecological zones; they show large within populationphenotypic diversity in plumage colour, feather morphology andpattern, skin colour, comb type etc. (Msoffe et al., 2001; Danaet al., 2010a). Raised under free-range scavenging system, villagechickens contribute substantially to egg and meat productionunder almost a zero input system under small holder subsistenceeconomies (Sonaiya, 1997; Kitalyi, 1998). The possible geographicorigin of East African village chickens remains unknown, with theIndian subcontinent, Southeast Asia and North Africa as possibleprimary centers of origin and entry in agreement with our knowl-edge of the history of trading of the region. To investigate the ori-gin of East African village chicken, we generated mtDNA controlregion sequences from 512 village chickens and analysed theirphylogenetic relationships with representative Asian haplotypesfrom the nine haplogroups described by Liu et al. (2006). In addi-tion, we evaluated the phylogeographic structure of the villagechickens to assess their pattern of diffusion across East Africa.Our results reveal an unexpected complex pattern of introductionof domestic chicken in the region and provide new informationconcerning the history of trading and human contacts betweenEast Africa and Asia.
2. Materials and methods
2.1. Sample collection and DNA extraction
Blood samples from 512 genetically unrelated village chickenswere collected from 23 populations in four countries in East Africa(Table 1). All samples were from unimproved village chickensraised under free-range scavenging. Two mature birds were sam-pled per flock and the sampling strategy and characteristics ofthe sampling locations were described previously (Mwacharoet al., 2007). Genomic DNA was extracted from either whole bloodusing phenol–chloroform or from air dried blood preserved on FTAclassic cards (Whatman Biosciences) using the manufacturers pro-tocol. To ascertain the genetic affinities of the study populations toAsiatic and other African chickens, 30 haplotypes were down-loaded from the GenBank and were included in the analysis (seeTable S1). For this purpose, the central and most common haplo-types for the nine clades observed in Liu et al. (2006) were selectedfor the study to determine the possible origins of chicken found inEast Africa within the geographic range of the wild ancestor, thered junglefowl.
2.2. PCR amplification and sequencing
The first 700 bp of the mtDNA D-loop region were amplified viaPCR using primers AV1F2 (50-AGGACTACGGCTTGAAAAGC-30) andCR1b (50-CCATACACGCAAACCGTCTC-30). PCR amplifications werecarried out in 25 ll reaction volumes containing 20 ng genomicDNA, 1 X PCR buffer (10 mM Tris–HCl pH 8.3, 50 mM KCl, 0.1%
Triton X-100), 2.5 mM of each dNTP, 10 pM of each primer and 1unit of Taq DNA polymerase (Promega, Madison WI, USA). Ther-mo-cycling conditions were: 94 �C (3 min), 35 cycles of 94 �C(1 min), 58 �C (1 min) and 72 �C (2 min), and a final extension stepat 72 �C (10 min). PCR products were purified using the Wizard� SVGel and PCR Clean-Up Kit (Promega, Madison WI, USA). Purifiedproducts were sequenced directly using the BigDye� Terminatorv3.1 (Applied Biosystems, USA) on an ABI prism 3100 Avant DNAanalyzer. The two PCR primers and an internal primer f1-3m(50-TGGTTCCTCGGTCAGGCACATCC-30) were used for the sequenc-ing reactions.
2.3. Sequence and phylogenetic analysis
For each sample, three fragments were generated. These wereedited manually using BioEdit 7.0 (Hall, 1999) and subsequentlyjoined to reconstruct a fragment of 700 bp. The fragments werealigned using Clustal X 1.83 (Thompson et al., 1997) against areference sequence (GenBank accession number X52392;Desjardins and Morais, 1990). Subsequent analyses were re-stricted to the first 397 bp incorporating the first hypervariablesegment (HVS1). We set to determine the number of haplogroupspresent in East Africa village chickens by constructing a Median-Joining (MJ) network (Bandelt et al., 1999) using NETWORK 4.5(fluxus-engineering.com). This analysis was augmented by con-structing a phylogenetic tree involving the haplotypes observedin East Africa using the Neighbour-Joining (NJ) algorithm asimplemented in MEGA 4.0 (Tamura et al., 2007) following 1000bootstrap replications. To portray the affinity of East Africa hap-lotypes to those observed in Asia and Africa, a MJ network incor-porating the 30 haplotypes downloaded from the GenBank (seeTable S1) was also constructed. The nomenclature of the haplo-groups observed in this study compared to the study of Liuet al. (2006), Silva et al. (2008) and Muchadeyi et al. (2008) areshown in Table S2.
2.4. Population genetic variability and structure
Genetic variation (nucleotide diversity, haplotype diversity andnucleotide differences) for each population were calculated usingDnaSP 5.10 (Librado and Rozas, 2009). Population genetic structurewas assessed by nested analysis of molecular variance (AMOVA).The groupings used for AMOVA were as follows: (i) the overalldataset assuming no groups; (ii) between the haplogroups ob-served on the MJ network; (iii) between chicken populations foundin different countries (country specific groups); (iv) between pop-ulations for haplogroup D only and (v) between populations forhaplogroup A only. Phi (U) statistics representing haplotype corre-lations at various levels of hierarchical clusters UCT, USC, and UST
(Excoffier et al., 2005) were calculated. Significance testing wasperformed using 10,100 coalescent simulations in Arlequin 3.1(Excoffier et al., 2005).
A Mantel test was used to assess the non-random associationbetween genetic differentiation (FST) and geographic distances(km) between populations using the IBDWS v3.05 software(http://ibdws.sdsu.edu). Population pairwise FST values were calcu-lated using Arlequin 3.1 (Excoffier et al., 2005). Geographic dis-tances between populations were calculated using the MapCrowTravel Distance Calculator between central towns within the sam-pling locations based on geographical coordinates (http://www.mapcrow.info/). For the analysis all negative FST values were setto zero. This analysis was limited to haplogroup D with the widestgeographic range in the region. Several comparative analyses wereperformed across all countries and between all countries.
J.M. Mwacharo et al. / Molecular Phylogenetics and Evolution 58 (2011) 374–382 375
Author's personal copy
2.5. Population demographic structure
Population dynamics were inferred on the basis of mismatchdistribution patterns (Rogers and Harpending, 1992) for all EastAfrican chickens and for the different clusters observed from theMJ network and the NJ tree. Departures of the observed mismatchdistributions from the simulated model of expansion were testedwith v2 test of goodness of fit and Harpending’s raggedness index‘‘r’’ (Harpending, 1994) following 1000 coalescent simulations. Thetwo tests were augmented with the Fu’s FS statistic (Fu, 1997), acoalescent based estimator of neutrality, whose significance wasalso tested with 1000 coalescent simulations in Arlequin 3.1(Excoffier et al., 2005).
3. Results
3.1. mtDNA D-loop sequence variability and haplotype distributionpattern
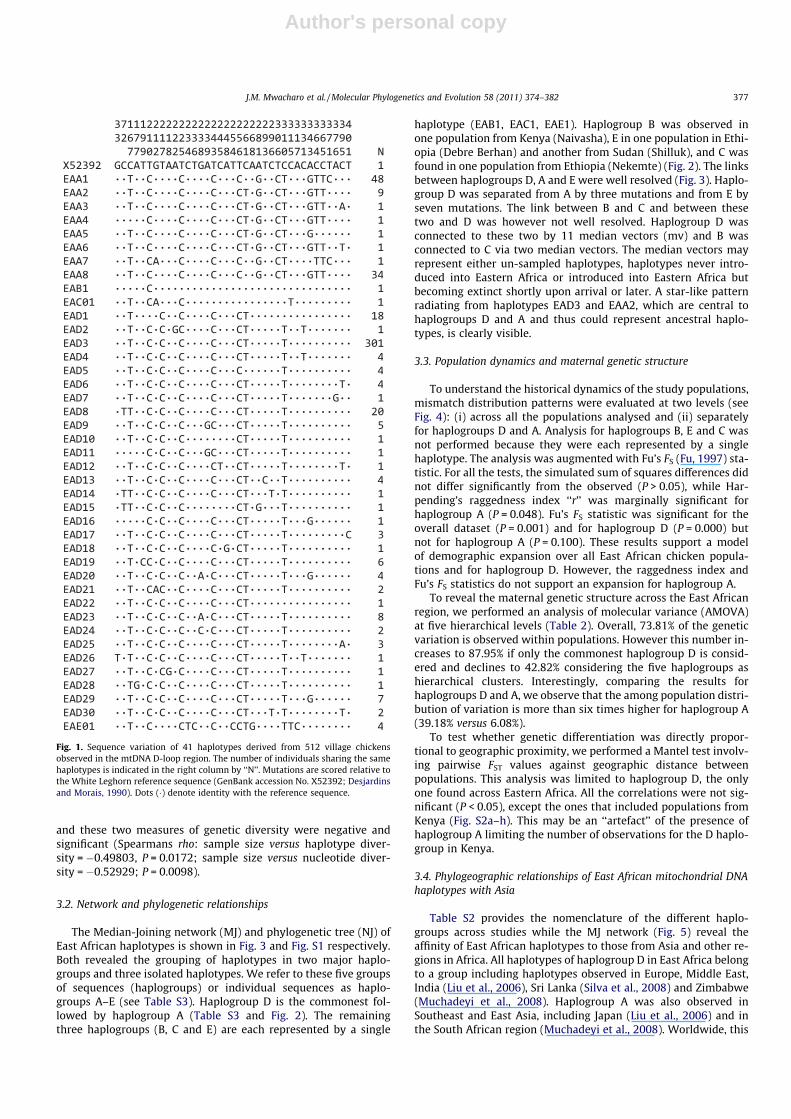
Sequences spanning the first 397 bp of the mtDNA D-loopand which included the first hypervariable segment were usedfor analysis. From 512 sequences, 41 haplotypes defined by 37polymorphic sites were generated. For this study, the individualhaplotypes were abbreviated EA (East Africa) A/B/C/D/E followedby a number (see Fig. 1 and Table S3). We observed 35 transi-tions and four transversions and a mean number of nucleotide
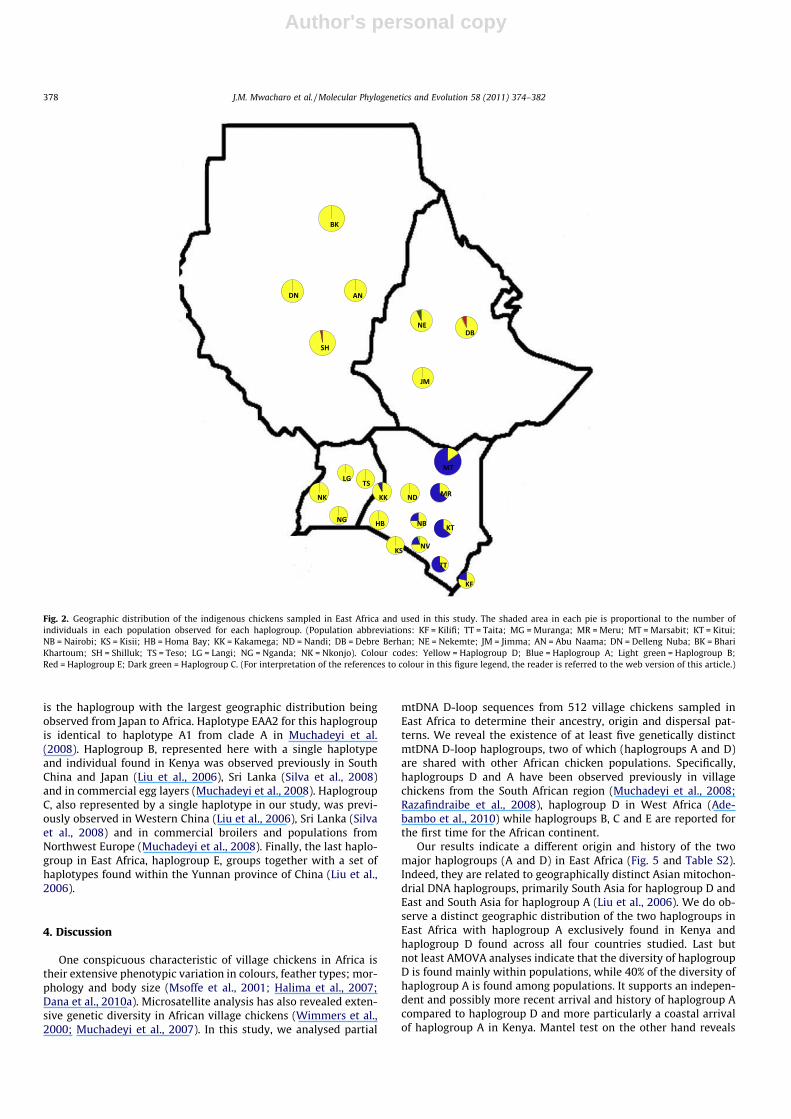
differences (k) between haplotypes of 2.951 ± 1.548. Five haplo-types (EAD1, EAD3, EAD8, EAA1 and EAA8) were the most fre-quently observed with a total of 421 out of 512 individuals(82.22%). Haplotype EAD3 was the only haplotype observed inall the 23 study populations (Table S3 and Fig. 2). The nextcommonest haplotype was EAA1 observed in seven populationsall from Kenya. The rest of the haplotypes occurred at lowfrequencies and some of them were specific to particular coun-tries and populations while others were shared between popula-tions within and between countries (Table S3). For instance,haplotype EAB1 was specific to Kenya, haplotype EAC1 toEthiopia and haplotype EAE1 was observed in Ethiopia andSudan. Excluding haplotype EAD3, Kenya shared one haplotypeeach with Ethiopia (EAD6) and Sudan (EAD4) and two withUganda (EAD4 and EAD13). Sudan shared two haplotypes withUganda (EAD4 and EAD25), while Ethiopia shared one haplotype(EAD17) with Uganda.
The study populations showed a wide range of haplotype(0.167 ± 0.134–0.923 ± 0.05) and nucleotide (0.00042 ± 0.00034–0.01469 ± 0.00558) diversities (Table 1). These values howeverare within the range of those observed in other chicken popula-tions from Africa (see Muchadeyi et al., 2007) and Asia (see Liuet al., 2006; Oka et al., 2007; Silva et al., 2008). Generally, both hap-lotype (0.923 ± 0.050 for Taita) and nucleotide diversities(0.01469 ± 0.00558 for Nairobi) were higher for populations inKenya (Table 1). The overall correlations between sample size
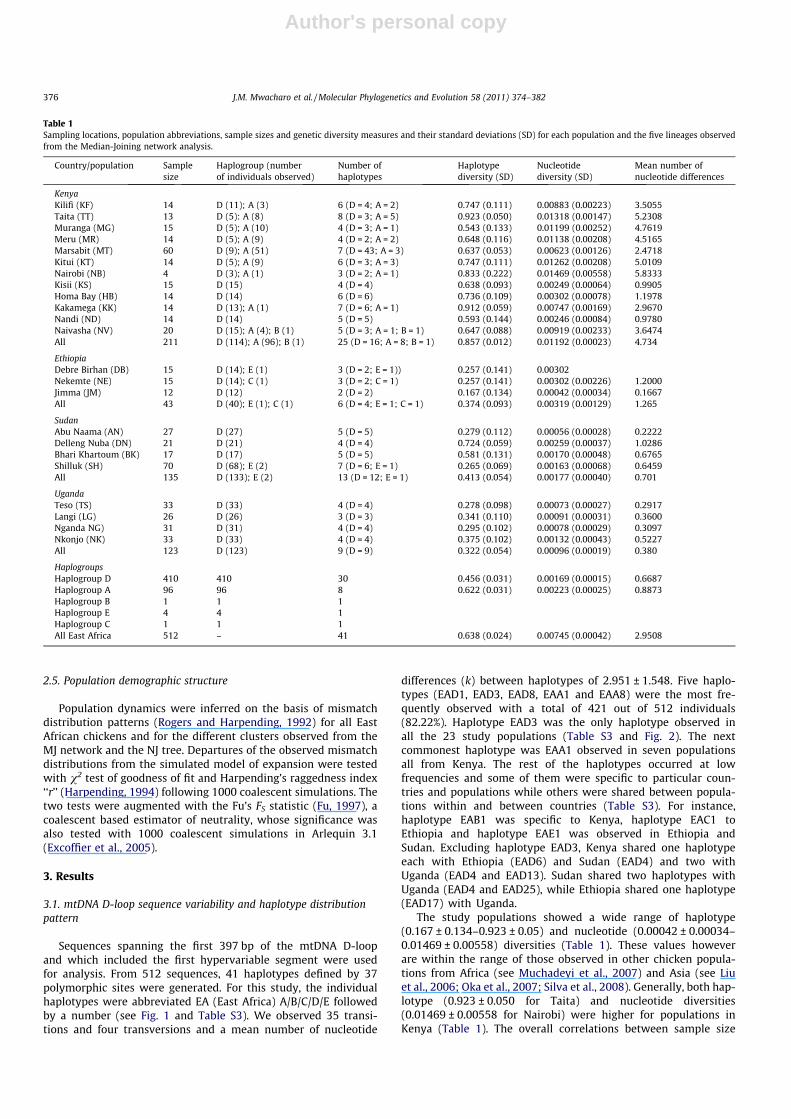
Table 1Sampling locations, population abbreviations, sample sizes and genetic diversity measures and their standard deviations (SD) for each population and the five lineages observedfrom the Median-Joining network analysis.
Country/population Samplesize
Haplogroup (numberof individuals observed)
Number ofhaplotypes
Haplotypediversity (SD)
Nucleotidediversity (SD)
Mean number ofnucleotide differences
KenyaKilifi (KF) 14 D (11); A (3) 6 (D = 4; A = 2) 0.747 (0.111) 0.00883 (0.00223) 3.5055Taita (TT) 13 D (5): A (8) 8 (D = 3; A = 5) 0.923 (0.050) 0.01318 (0.00147) 5.2308Muranga (MG) 15 D (5); A (10) 4 (D = 3; A = 1) 0.543 (0.133) 0.01199 (0.00252) 4.7619Meru (MR) 14 D (5); A (9) 4 (D = 2; A = 2) 0.648 (0.116) 0.01138 (0.00208) 4.5165Marsabit (MT) 60 D (9); A (51) 7 (D = 43; A = 3) 0.637 (0.053) 0.00623 (0.00126) 2.4718Kitui (KT) 14 D (5); A (9) 6 (D = 3; A = 3) 0.747 (0.111) 0.01262 (0.00208) 5.0109Nairobi (NB) 4 D (3); A (1) 3 (D = 2; A = 1) 0.833 (0.222) 0.01469 (0.00558) 5.8333Kisii (KS) 15 D (15) 4 (D = 4) 0.638 (0.093) 0.00249 (0.00064) 0.9905Homa Bay (HB) 14 D (14) 6 (D = 6) 0.736 (0.109) 0.00302 (0.00078) 1.1978Kakamega (KK) 14 D (13); A (1) 7 (D = 6; A = 1) 0.912 (0.059) 0.00747 (0.00169) 2.9670Nandi (ND) 14 D (14) 5 (D = 5) 0.593 (0.144) 0.00246 (0.00084) 0.9780Naivasha (NV) 20 D (15); A (4); B (1) 5 (D = 3; A = 1; B = 1) 0.647 (0.088) 0.00919 (0.00233) 3.6474All 211 D (114); A (96); B (1) 25 (D = 16; A = 8; B = 1) 0.857 (0.012) 0.01192 (0.00023) 4.734
EthiopiaDebre Birhan (DB) 15 D (14); E (1) 3 (D = 2; E = 1)) 0.257 (0.141) 0.00302Nekemte (NE) 15 D (14); C (1) 3 (D = 2; C = 1) 0.257 (0.141) 0.00302 (0.00226) 1.2000Jimma (JM) 12 D (12) 2 (D = 2) 0.167 (0.134) 0.00042 (0.00034) 0.1667All 43 D (40); E (1); C (1) 6 (D = 4; E = 1; C = 1) 0.374 (0.093) 0.00319 (0.00129) 1.265
SudanAbu Naama (AN) 27 D (27) 5 (D = 5) 0.279 (0.112) 0.00056 (0.00028) 0.2222Delleng Nuba (DN) 21 D (21) 4 (D = 4) 0.724 (0.059) 0.00259 (0.00037) 1.0286Bhari Khartoum (BK) 17 D (17) 5 (D = 5) 0.581 (0.131) 0.00170 (0.00048) 0.6765Shilluk (SH) 70 D (68); E (2) 7 (D = 6; E = 1) 0.265 (0.069) 0.00163 (0.00068) 0.6459All 135 D (133); E (2) 13 (D = 12; E = 1) 0.413 (0.054) 0.00177 (0.00040) 0.701
UgandaTeso (TS) 33 D (33) 4 (D = 4) 0.278 (0.098) 0.00073 (0.00027) 0.2917Langi (LG) 26 D (26) 3 (D = 3) 0.341 (0.110) 0.00091 (0.00031) 0.3600Nganda NG) 31 D (31) 4 (D = 4) 0.295 (0.102) 0.00078 (0.00029) 0.3097Nkonjo (NK) 33 D (33) 4 (D = 4) 0.375 (0.102) 0.00132 (0.00043) 0.5227All 123 D (123) 9 (D = 9) 0.322 (0.054) 0.00096 (0.00019) 0.380
HaplogroupsHaplogroup D 410 410 30 0.456 (0.031) 0.00169 (0.00015) 0.6687Haplogroup A 96 96 8 0.622 (0.031) 0.00223 (0.00025) 0.8873Haplogroup B 1 1 1Haplogroup E 4 4 1Haplogroup C 1 1 1All East Africa 512 – 41 0.638 (0.024) 0.00745 (0.00042) 2.9508
376 J.M. Mwacharo et al. / Molecular Phylogenetics and Evolution 58 (2011) 374–382
Author's personal copy
and these two measures of genetic diversity were negative andsignificant (Spearmans rho: sample size versus haplotype diver-sity = �0.49803, P = 0.0172; sample size versus nucleotide diver-sity = �0.52929; P = 0.0098).
3.2. Network and phylogenetic relationships
The Median-Joining network (MJ) and phylogenetic tree (NJ) ofEast African haplotypes is shown in Fig. 3 and Fig. S1 respectively.Both revealed the grouping of haplotypes in two major haplo-groups and three isolated haplotypes. We refer to these five groupsof sequences (haplogroups) or individual sequences as haplo-groups A–E (see Table S3). Haplogroup D is the commonest fol-lowed by haplogroup A (Table S3 and Fig. 2). The remainingthree haplogroups (B, C and E) are each represented by a single
haplotype (EAB1, EAC1, EAE1). Haplogroup B was observed inone population from Kenya (Naivasha), E in one population in Ethi-opia (Debre Berhan) and another from Sudan (Shilluk), and C wasfound in one population from Ethiopia (Nekemte) (Fig. 2). The linksbetween haplogroups D, A and E were well resolved (Fig. 3). Haplo-group D was separated from A by three mutations and from E byseven mutations. The link between B and C and between thesetwo and D was however not well resolved. Haplogroup D wasconnected to these two by 11 median vectors (mv) and B wasconnected to C via two median vectors. The median vectors mayrepresent either un-sampled haplotypes, haplotypes never intro-duced into Eastern Africa or introduced into Eastern Africa butbecoming extinct shortly upon arrival or later. A star-like patternradiating from haplotypes EAD3 and EAA2, which are central tohaplogroups D and A and thus could represent ancestral haplo-types, is clearly visible.
3.3. Population dynamics and maternal genetic structure
To understand the historical dynamics of the study populations,mismatch distribution patterns were evaluated at two levels (seeFig. 4): (i) across all the populations analysed and (ii) separatelyfor haplogroups D and A. Analysis for haplogroups B, E and C wasnot performed because they were each represented by a singlehaplotype. The analysis was augmented with Fu’s FS (Fu, 1997) sta-tistic. For all the tests, the simulated sum of squares differences didnot differ significantly from the observed (P > 0.05), while Har-pending’s raggedness index ‘‘r’’ was marginally significant forhaplogroup A (P = 0.048). Fu’s FS statistic was significant for theoverall dataset (P = 0.001) and for haplogroup D (P = 0.000) butnot for haplogroup A (P = 0.100). These results support a modelof demographic expansion over all East African chicken popula-tions and for haplogroup D. However, the raggedness index andFu’s FS statistics do not support an expansion for haplogroup A.
To reveal the maternal genetic structure across the East Africanregion, we performed an analysis of molecular variance (AMOVA)at five hierarchical levels (Table 2). Overall, 73.81% of the geneticvariation is observed within populations. However this number in-creases to 87.95% if only the commonest haplogroup D is consid-ered and declines to 42.82% considering the five haplogroups ashierarchical clusters. Interestingly, comparing the results forhaplogroups D and A, we observe that the among population distri-bution of variation is more than six times higher for haplogroup A(39.18% versus 6.08%).
To test whether genetic differentiation was directly propor-tional to geographic proximity, we performed a Mantel test involv-ing pairwise FST values against geographic distance betweenpopulations. This analysis was limited to haplogroup D, the onlyone found across Eastern Africa. All the correlations were not sig-nificant (P < 0.05), except the ones that included populations fromKenya (Fig. S2a–h). This may be an ‘‘artefact’’ of the presence ofhaplogroup A limiting the number of observations for the D haplo-group in Kenya.
3.4. Phylogeographic relationships of East African mitochondrial DNAhaplotypes with Asia
Table S2 provides the nomenclature of the different haplo-groups across studies while the MJ network (Fig. 5) reveal theaffinity of East African haplotypes to those from Asia and other re-gions in Africa. All haplotypes of haplogroup D in East Africa belongto a group including haplotypes observed in Europe, Middle East,India (Liu et al., 2006), Sri Lanka (Silva et al., 2008) and Zimbabwe(Muchadeyi et al., 2008). Haplogroup A was also observed inSoutheast and East Asia, including Japan (Liu et al., 2006) and inthe South African region (Muchadeyi et al., 2008). Worldwide, this
Fig. 1. Sequence variation of 41 haplotypes derived from 512 village chickensobserved in the mtDNA D-loop region. The number of individuals sharing the samehaplotypes is indicated in the right column by ‘‘N’’. Mutations are scored relative tothe White Leghorn reference sequence (GenBank accession No. X52392; Desjardinsand Morais, 1990). Dots (�) denote identity with the reference sequence.
J.M. Mwacharo et al. / Molecular Phylogenetics and Evolution 58 (2011) 374–382 377
Author's personal copy
is the haplogroup with the largest geographic distribution beingobserved from Japan to Africa. Haplotype EAA2 for this haplogroupis identical to haplotype A1 from clade A in Muchadeyi et al.(2008). Haplogroup B, represented here with a single haplotypeand individual found in Kenya was observed previously in SouthChina and Japan (Liu et al., 2006), Sri Lanka (Silva et al., 2008)and in commercial egg layers (Muchadeyi et al., 2008). HaplogroupC, also represented by a single haplotype in our study, was previ-ously observed in Western China (Liu et al., 2006), Sri Lanka (Silvaet al., 2008) and in commercial broilers and populations fromNorthwest Europe (Muchadeyi et al., 2008). Finally, the last haplo-group in East Africa, haplogroup E, groups together with a set ofhaplotypes found within the Yunnan province of China (Liu et al.,2006).
4. Discussion
One conspicuous characteristic of village chickens in Africa istheir extensive phenotypic variation in colours, feather types; mor-phology and body size (Msoffe et al., 2001; Halima et al., 2007;Dana et al., 2010a). Microsatellite analysis has also revealed exten-sive genetic diversity in African village chickens (Wimmers et al.,2000; Muchadeyi et al., 2007). In this study, we analysed partial
mtDNA D-loop sequences from 512 village chickens sampled inEast Africa to determine their ancestry, origin and dispersal pat-terns. We reveal the existence of at least five genetically distinctmtDNA D-loop haplogroups, two of which (haplogroups A and D)are shared with other African chicken populations. Specifically,haplogroups D and A have been observed previously in villagechickens from the South African region (Muchadeyi et al., 2008;Razafindraibe et al., 2008), haplogroup D in West Africa (Ade-bambo et al., 2010) while haplogroups B, C and E are reported forthe first time for the African continent.
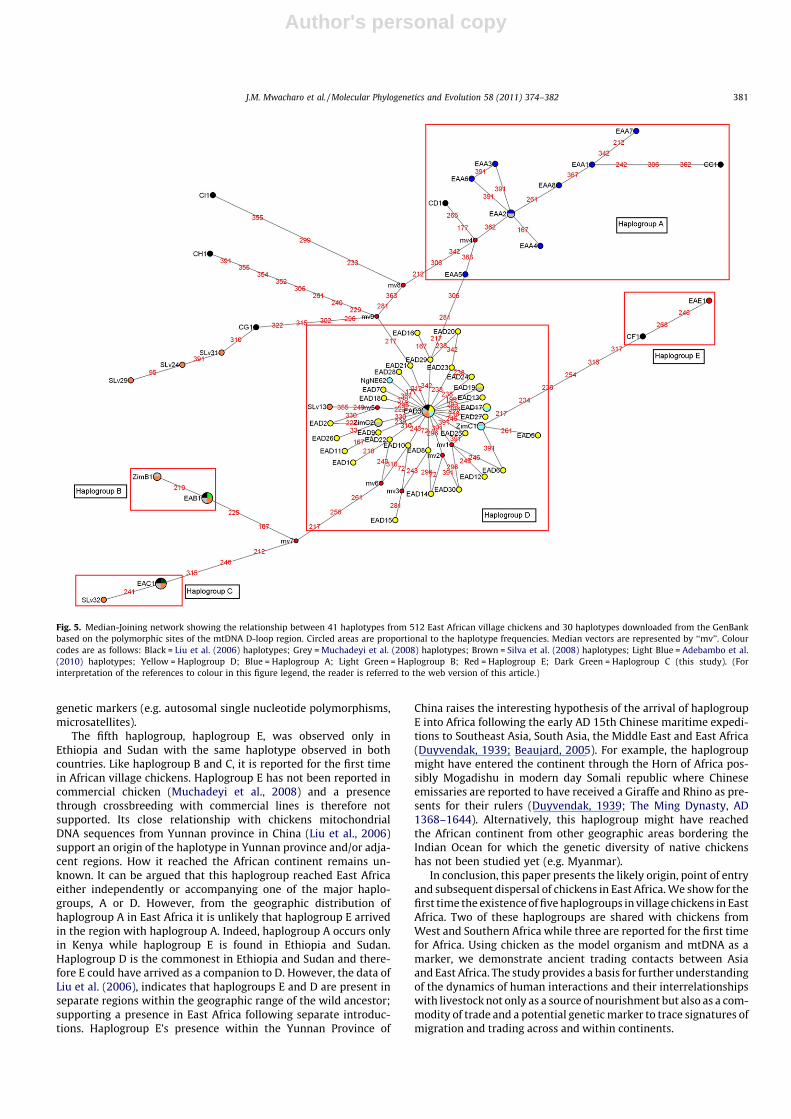
Our results indicate a different origin and history of the twomajor haplogroups (A and D) in East Africa (Fig. 5 and Table S2).Indeed, they are related to geographically distinct Asian mitochon-drial DNA haplogroups, primarily South Asia for haplogroup D andEast and South Asia for haplogroup A (Liu et al., 2006). We do ob-serve a distinct geographic distribution of the two haplogroups inEast Africa with haplogroup A exclusively found in Kenya andhaplogroup D found across all four countries studied. Last butnot least AMOVA analyses indicate that the diversity of haplogroupD is found mainly within populations, while 40% of the diversity ofhaplogroup A is found among populations. It supports an indepen-dent and possibly more recent arrival and history of haplogroup Acompared to haplogroup D and more particularly a coastal arrivalof haplogroup A in Kenya. Mantel test on the other hand reveals
Fig. 2. Geographic distribution of the indigenous chickens sampled in East Africa and used in this study. The shaded area in each pie is proportional to the number ofindividuals in each population observed for each haplogroup. (Population abbreviations: KF = Kilifi; TT = Taita; MG = Muranga; MR = Meru; MT = Marsabit; KT = Kitui;NB = Nairobi; KS = Kisii; HB = Homa Bay; KK = Kakamega; ND = Nandi; DB = Debre Berhan; NE = Nekemte; JM = Jimma; AN = Abu Naama; DN = Delleng Nuba; BK = BhariKhartoum; SH = Shilluk; TS = Teso; LG = Langi; NG = Nganda; NK = Nkonjo). Colour codes: Yellow = Haplogroup D; Blue = Haplogroup A; Light green = Haplogroup B;Red = Haplogroup E; Dark green = Haplogroup C. (For interpretation of the references to colour in this figure legend, the reader is referred to the web version of this article.)
378 J.M. Mwacharo et al. / Molecular Phylogenetics and Evolution 58 (2011) 374–382

Author's personal copy
the absence of geographic structure within the East African region(Uganda, Sudan, Ethiopia) for haplogroup D indicating that thepopulations found within and between these countries are pan-mictic with exchange of genetic material not being uncommon.
The point of entry and subsequent dispersal of chickens on theAfrican continent remain unsolved. It has been suggested thatchicken arrived in Africa first through Egypt, where the most an-cient undisputed presence of domestic fowls are found (Coltherd,1966; Houlihan and Goodman, 1986) and later through the IndianOcean coastline (MacDonald, 1992; MacDonald and Edwards,1993). Haplogroup D is predominant in East (this study) and WestAfrica (Adebambo et al., 2010) and also occurs in the South Africanregion (Muchadeyi et al., 2008; Razafindraibe et al., 2008). Threeroutes by which this haplogroup could have arrived in East Africafrom its supposedly Indian subcontinent origin are possible: (i) fol-lowing terrestrial routes through the Middle East (Iraq, Syria,Jordan) into Egypt from where it diffused southwards into Sudan,Ethiopia and Uganda; (ii) through the Horn of Africa via the Ara-bian Peninsula/Gulf of Aden with subsequent dispersion west-wards to Sudan and southwards to Kenya and Uganda; or(iii) directly to Coastal East Africa via the Indian ocean tradingand subsequently movement inland towards Uganda, Sudan andEthiopia. Our genetic data cannot yet distinguish between thesethree possibilities in the absence of information on mitochondrialDNA diversity from Northern Africa (e.g. Egypt) and the ArabianPeninsula. However, archaeological evidences indicate that chickenarrived in Egypt and Sudan much earlier than in Kenya, Uganda orEthiopia. For instance, a silver bowl with an image of a domestic
fowl was excavated at Tell Basta dating to the late XIX (BC1307–1196) or early XX (BC 1196–1070) Egyptian dynasties(Houlihan and Goodman, 1986). Also, chicken were already knownin Sudan by the mid 7th century BC being depicted on four ivoryplaques from the tomb of Queen Yeturow at Nuri (Dunham,1955). Earliest finds from East Africa date only to between 800and 1400 AD (MacDonald and Edwards, 1993). So archaeologicalinformation favours a terrestrial arrival of domestic chicken insub-Saharan Africa from the North East of the African continentrather than an arrival through the Horn of Africa.
The second major haplogroup in East Africa, haplogroup A, isfound only in Kenya. This haplogroup has also been observed inZimbabwe (Muchadeyi et al., 2007) and Madagascar (Razafindra-ibe et al., 2008), but it is absent in West Africa (Adebambo et al.,2010). It occurs in the same group with representative haplotypesfrom clades C and D in Liu et al. (2006) (see Fig. 5) and theauthors speculated that it could be derived from South andSouthwest China and/or surrounding regions. Muchadeyi et al.(2008) speculates that it originates from Southeast Asia, whileRazafindraibe et al. (2008) speculated without corroborating evi-dences that the haplogroup may originate from Indonesia follow-ing the Austronesian arrivals on the island. Whether haplogroupA originates from South/Southwest China and/or surroundingareas or Southeast Asia remains unclear. However, our data indi-cate that this haplogroup is present both in the South and EastAfrican regions suggesting either an early trading contact allalong the coast of East Africa with East Asia or an arrival in a sin-gle African coastal region and subsequent dispersal along the
Fig. 3. Median-Joining network of 41 haplotypes observed in 512 East African village chickens based on the polymorphic sites of the mtDNA D-loop region. Circled areas areproportional to the haplotype frequencies. Median vectors are represented by ‘‘mv’’.
J.M. Mwacharo et al. / Molecular Phylogenetics and Evolution 58 (2011) 374–382 379

Author's personal copy
coastal area of the continent. When such an event took place isunknown. Our data seem to suggest that it most likely happenedafter the arrival of the D haplogroup in East Africa given the morerestricted geographic distribution of A compared to D in theregion.
The biological history of haplogroups B and C appear to be sim-ilar. This is the first time that they are reported in African villagechickens. The origins of these two haplogroups are uncertain butLiu et al. (2006) proposed that they originate from Yunnan prov-ince, and/or surrounding areas (Myanmar, Thailand). Of interest isthat haplogroup B is identical to haplotypes found in commercialbrown and white egg layers and haplogroup C has close geneticaffinity to haplotypes found in commercial broilers and chickenfrom Northwest Europe (Muchadeyi et al., 2008). In the pasttwo or more decades, crossbreeding programmes involving villagechickens and commercial layers and broilers to improve produc-
tivity have been undertaken by various development agenciesand governments in East Africa (Pedersen et al., 2000). It is possi-ble that these two haplogroups have been introduced to EastAfrica in recent times via commercial flocks through such cross-breeding activities. Similar introgression has also been shown tohave occurred in Dutch fancy breeds of chicken based on mtDNAanalysis (Dana et al., 2010b). These haplotypes therefore couldrepresent signatures of recent introgression of commercial broilerand layer mtDNA haplotypes into village chickens. A recentintrogression theory is supported by a lack of diversity of thehaplogroups in East Africa and their presence in a single popula-tion. From a conservation and utilisation of indigenous chickengenetic diversity point of view, it indicates that exotic commercialgenotypes might have successfully introgressed some indigenousvillage chicken populations in East Africa. The extent of suchintrogression will benefit to be assessed with different sets of
0
20
40
60
1 2 3 4 5 6 7
Rel
ativ
e fr
eque
ncie
s (%
)
Number of mismatches
Lineage DObserved
Simulated
0
10
20
30
40
1 2 3 4 5 6 7 8 9 10 11 12 13 14 15
Rel
ativ
e fr
eque
ncie
s (%
)
Number of mismatches
Overall ObservedSimulated
0
10
20
30
40
50
1 2 3 4 5 6 7 8
Rel
ativ
e fr
eque
ncie
s (%
)
Number of mismatches
Lineage A Observed
Simulated
Fig. 4. Mismatch distribution patterns for the overall, haplogroup D and haplogroup A for mtDNA D-loop region sequence haplotypes generated using 512 village chickenssampled in East Africa.
Table 2Population genetic structure estimated from the hierarchical analysis of molecular variance (AMOVA) based on the frequencies of the 41 haplotypes observed from 512 mtDNA D-loop sequences of East African village chicken.
Hierarchical clusters Hierarchy Variance components Percentof variation
F P-value
1. Overall 1 Within populations 73.81 – –Among populations 26.19 0.26191 0.0000
2. Among countries 4 Within populations 70.85 0.15520 0.01271Among populations within countries 13.62 0.16128 0.00000Among countries 15.52 0.29145 0.00000
3. Among countries (haplogroup D) 4 Within populations 87.95 0.05972 0.0000Among populations within countries 6.08 0.12054 0.0000Among countries 5.97 0.06468 0.0000
4. Haplogroup A only (Kenya) 1 Within populations 60.82Among populations 39.18 0.39176 0.0000
5. Between the 5 haplogroups 5 Within populations 42.82 0.48110 0.0000Among populations within haplogroups 9.07 0.17478 0.0000Among haplogroups 48.11 0.57179 0.0000
380 J.M. Mwacharo et al. / Molecular Phylogenetics and Evolution 58 (2011) 374–382
Author's personal copy
genetic markers (e.g. autosomal single nucleotide polymorphisms,microsatellites).
The fifth haplogroup, haplogroup E, was observed only inEthiopia and Sudan with the same haplotype observed in bothcountries. Like haplogroup B and C, it is reported for the first timein African village chickens. Haplogroup E has not been reported incommercial chicken (Muchadeyi et al., 2008) and a presencethrough crossbreeding with commercial lines is therefore notsupported. Its close relationship with chickens mitochondrialDNA sequences from Yunnan province in China (Liu et al., 2006)support an origin of the haplotype in Yunnan province and/or adja-cent regions. How it reached the African continent remains un-known. It can be argued that this haplogroup reached East Africaeither independently or accompanying one of the major haplo-groups, A or D. However, from the geographic distribution ofhaplogroup A in East Africa it is unlikely that haplogroup E arrivedin the region with haplogroup A. Indeed, haplogroup A occurs onlyin Kenya while haplogroup E is found in Ethiopia and Sudan.Haplogroup D is the commonest in Ethiopia and Sudan and there-fore E could have arrived as a companion to D. However, the data ofLiu et al. (2006), indicates that haplogroups E and D are present inseparate regions within the geographic range of the wild ancestor;supporting a presence in East Africa following separate introduc-tions. Haplogroup E’s presence within the Yunnan Province of
China raises the interesting hypothesis of the arrival of haplogroupE into Africa following the early AD 15th Chinese maritime expedi-tions to Southeast Asia, South Asia, the Middle East and East Africa(Duyvendak, 1939; Beaujard, 2005). For example, the haplogroupmight have entered the continent through the Horn of Africa pos-sibly Mogadishu in modern day Somali republic where Chineseemissaries are reported to have received a Giraffe and Rhino as pre-sents for their rulers (Duyvendak, 1939; The Ming Dynasty, AD1368–1644). Alternatively, this haplogroup might have reachedthe African continent from other geographic areas bordering theIndian Ocean for which the genetic diversity of native chickenshas not been studied yet (e.g. Myanmar).
In conclusion, this paper presents the likely origin, point of entryand subsequent dispersal of chickens in East Africa. We show for thefirst time the existence of five haplogroups in village chickens in EastAfrica. Two of these haplogroups are shared with chickens fromWest and Southern Africa while three are reported for the first timefor Africa. Using chicken as the model organism and mtDNA as amarker, we demonstrate ancient trading contacts between Asiaand East Africa. The study provides a basis for further understandingof the dynamics of human interactions and their interrelationshipswith livestock not only as a source of nourishment but also as a com-modity of trade and a potential genetic marker to trace signatures ofmigration and trading across and within continents.
Fig. 5. Median-Joining network showing the relationship between 41 haplotypes from 512 East African village chickens and 30 haplotypes downloaded from the GenBankbased on the polymorphic sites of the mtDNA D-loop region. Circled areas are proportional to the haplotype frequencies. Median vectors are represented by ‘‘mv’’. Colourcodes are as follows: Black = Liu et al. (2006) haplotypes; Grey = Muchadeyi et al. (2008) haplotypes; Brown = Silva et al. (2008) haplotypes; Light Blue = Adebambo et al.(2010) haplotypes; Yellow = Haplogroup D; Blue = Haplogroup A; Light Green = Haplogroup B; Red = Haplogroup E; Dark Green = Haplogroup C (this study). (Forinterpretation of the references to colour in this figure legend, the reader is referred to the web version of this article.)
J.M. Mwacharo et al. / Molecular Phylogenetics and Evolution 58 (2011) 374–382 381
Author's personal copy
Acknowledgements
The authors wish to thank all farmers who provided the villagechickens for sampling. The following members of the chickendiversity consortium also contributed to the study by assisting insample collection: D. Tadelle, G. Abebe (Ethiopia); J. Hirbo, W.N.Mnene (Kenya); Veterinaire Sans Frontieres (Sudan); E. Ssewann-yana and L. Serungoji (Uganda). ILRI research is principally fundedby program grants from the United Kingdom, Japan, The EuropeanUnion, Ireland, and France, as well as unrestricted funding fromother donors to the Consultative Group on International Agricul-tural Research (CGIAR). This work was funded in large part througha Monbukagakusho scholarship to the first author from theJapanese Government.
Appendix A. Supplementary material
Supplementary data associated with this article can be found, inthe online version, at doi:10.1016/j.ympev.2010.11.027.
References
Adebambo, A.O., Mobegi, V.A., Mwacharo, J.M., Oladejo, B.M., Adewale, R.A., Ilori,L.O., Makanjuola, B.O., Afolayan, O., Bjørnstad, G., Jianlin, H., Hanotte, O., 2010.Lack of phylogeographic structure in Nigerian village chickens revealed bymitochondrial DNA D-loop sequence analysis. Int. J. Poult. Sci. 9, 503–507.
Bandelt, H.-J., Forster, P., Röhl, A., 1999. Median-joining networks for inferringintraspecific phylogenies. Mol. Biol. Evol. 16, 37–48.
Beaujard, P., 2005. The Indian Ocean in Eurasia and African world systems beforethe sixteenth century. J. World Hist. 16, 411–465.
Boivin, N., Fuller, D.Q., 2009. Shell middens, ships and seeds: exploring coastalsubsistence, maritime trade and the dispersal of domesticates in and around theancient Arabian Peninsula. J. World Prehist. 22, 113–180.
Coltherd, J.B., 1966. The domestic fowl in ancient Egypt. Ibis 108, 217–223.Dana, N., Dessie, T., van der Waaij, L.H., van Arendonk, J.A.M., 2010a. Morphological
features of indigenous chicken populations of Ethiopia. AGRI 46, 11–23.Dana, N., Megens, H.-J., Crooijmans, R.P.M.A., Hanotte, O., Mwacharo, J., Groenen,
M.A.M., van Arendonk, J.A.M., 2010b. East Asian contributions to Dutchtraditional and western commercial chickens inferred from mtDNA analysis.Anim. Genet. doi: 10.1111/j.1365-2052.2010.02134.x.
Delacour, J., 1977. The Pheasants of the World, second ed. Spur Publications, Liss,Hants, England.
Desjardins, P., Morais, R., 1990. Sequence and gene organisation of the chickenmitochondrial genome: a novel gene order in higher vertebrates. J. Mol. Biol.212, 599–634.
Dunham, D., 1955. The Royal Cemeteries of Kush II, Nuri. Boston, Massachusetsmuseum of Fine Arts.
Duyvendak, J.J.L., 1939. The True Dates of the Chinese Maritime Expeditions in theEarly Fifteenth Century. T’oung Pao, Second Series, vol. 34, Livr. 5, pp. 341–413.
Excoffier, L.G., Laval, G., Schneider, S., 2005. Arlequin ver 3.0: an integrated softwarepackage for population genetics data analysis. Evol. Bioinform 1, 47–50.
FAOSTAT, 2007. Food and Agriculture Organization statistical databases. CDROM.Fu, Y.-X., 1997. Statistical tests of neutrality of mutations against population
growth, hitchhiking and background selection. Genetics 147, 915–925.Fuller, D.Q., Boivin, N., 2009. Crops, Cattle and Commensals Across the Indian
Ocean: Current and potential archaeobiological evidence: in ‘‘Etudes OcéanIndien no 42/43: Plantes et Sociétés’’, Paris: Centre d’Études et de Recherche surL’ Océan Indien Occidental (CEROI), pp 13–46.
Fumihito, A., Miyake, T., Takada, M., Shingu, R., Endo, T., Gojobori, T., Kondo, N.,Ohno, S., 1996. Monophyletic origin and unique dispersal patterns of domesticfowls. Proc. Natl. Acad. Sci. USA 93, 6792–6795.
Halima, H., Neser, F.W.C., van Marle-Koster, E., de Kock, A., 2007. Phenotypicvariation of native chicken populations in northwest Ethiopia. Trop. Anim.Health Prod. 39, 507–513.
Hall, T.A., 1999. BioEdit: a user-friendly biological sequence alignment editor andanalysis program for Windows 95/98/NT. Nucl. Acids Symp. Ser. 41, 95–98.
Harpending, H., 1994. Signature of ancient population growth in a low-resolutionmitochondrial DNA mismatch distribution. Hum. Biol. 66, 591–600.
Houlihan, P.F., Goodman, S.M., 1986. The Birds of Ancient Egypt. Aris and PhillipsLtd., Teddington House, Warminster, England.
Kitalyi, A.J., 1998. Village Chicken Production Systems in Rural Africa. HouseholdFood Security and Gender Issues. FAO Animal Production and Health Paper No.142. FAO, Rome Italy, 81pp.
Librado, P., Rozas, J., 2009. DnaSP v5: A software for comprehensive analysis of DNApolymorphism data. Bioinformatics 25, 1451–1452.
Liu, Y.P., Wu, G.S., Yao, Y.-G., Miao, Y.-W., Luikart, G., Baig, M., Beja-Pereira, A., Ding,Z.-L., Palanichamy, M.G., Zhang, Y.-P., 2006. Multiple maternal origins ofchickens: out of the Asian jungles. Mol. Phylogenet. Evol. 38, 12–19.
MacDonald, K.C., 1992. The domestic chicken (Gallus gallus) in sub-Saharan Africa: Abackground to its introduction and its osteological differentiation fromindigenous fowls (Numidinae and Francolinus sp). J. Archaeol. Sci. 19, 303–318.
MacDonald, K.C., Edwards, D.N., 1993. Chickens in Africa: the importance of QasrIbrim. Antiquity 67, 584–590.
Msoffe, P.L., Minga, U.M., Olsen, J.E., Yongolo, M.G., Jull-Madsen, H.R., Gwakisa, P.S.,Mtambo, M.M., 2001. Phenotypes including immunocompetence inscavenging local chicken ecotypes in Tanzania. Trop. Anim. Health Prod. 33,341–354.
Muchadeyi, F.C., Eding, H., Wollny, C.B.A., Groeneveld, E., Makuza, S.M., Shamseldin,R., Simianer, H., Weigend, S., 2007. Absence of population substructuring inZimbabwe chicken ecotypes inferred using microsatellite analysis. Anim. Genet.38, 332–339.
Muchadeyi, F.C., Eding, H., Simianer, H., Wollny, C.B.A., Groeneveld, E., Weigend, S.,2008. Mitochondrial DNA D-loop sequences suggest a Southeast Asian andIndian origin of Zimbabwean village chickens. Anim. Genet. 39, 615–622.
Mwacharo, J.M., Nomura, K., Hanada, H., Jianlin, H., Hanotte, O., Amano, T., 2007.Genetic relationships among Kenyan and other East African indigenouschickens. Anim. Genet. 38, 485–490.
Oka, T., Ino, Y., Nomura, K., Kawashima, S., Kuwayama, T., Hanada, H., Amano, T.,Takada, M., Takahata, N., Hayashi, Y., Akishinonomiya, F., 2007. Analysis ofmtDNA sequences shows Japanese native chickens have multiple origins. Anim.Genet. 38, 287–293.
Pedersen, G., Permin, A., Minga, U.M., 2000. Possibilities for smallholder poultryprojects in Eastern and Southern Africa. In: Proceeding of a WorkshopMorogoro, Tanzania 22–25 May 2000. Network for Smallholder PoultryDevelopment. The Royal Veterinary and Agricultural University. Copenhagen,Denmark, 61pp.
Razafindraibe, H., Mobegi, V.A., Ommeh, S.C., Rakotondravao, J., Bjørnstad, G.,Hanotte, O., Jianlin, H., 2008. Mitochondrial DNA origin of indigenous Malagasychicken: implications for a functional polymorphism at the Mx gene. Ann. NYAcad. Sci. 1149, 77–79.
Rogers, A.R., Harpending, H., 1992. Population growth makes waves in thedistribution of pairwise genetic differences. Mol. Biol. Evol. 9, 552–569.
Silva, P., Guan, X., Ho-Shing, O., Jones, J., Xu, J., Hui, D., Notter, D., Smith, E., 2008.Mitochondrial DNA-based analysis of genetic variation and relatedness amongSri Lankan indigenous chickens and the Ceylon Junglefowl (Gallus lafayetti).Anim. Genet. 40, 1–9.
Sonaiya, E.B., 1997. African Network on Rural Poultry Development. In: ProceedingsANRPD Workshop, Addis Ababa, Ethiopia, pp. 134–143.
Tamura, K., Dudley, J., Nei, M., Kumar, S., 2007. MEGA4: Molecular EvolutionaryGenetics Analysis (MEGA) software version 4.0. Mol. Biol. Evol. 24, 1596–1599.
The Ming Dynasty (AD 1368–1644). <http://www.chinavoc.com/history/ming/zh.htm>.
Thompson, J.D., Gibson, T.J., Plewniak, F., Jeanmougin, F., Higgins, D.G., 1997. TheClustalX windows interface. flexible strategies for multiple sequence alignmentaided by quality analysis tools. Nucl. Acids Res. 24, 4876–4882.
Wimmers, K., Ponsuksili, S., Hardge, T., Valle-Zarate, A., Mathur, P.K., Horst, P., 2000.Genetic distinctness of African, Asian and South American local chickens. Anim.Genet. 31, 159–165.
382 J.M. Mwacharo et al. / Molecular Phylogenetics and Evolution 58 (2011) 374–382