Miron, Gary Evaluation of the Michigan Public School Ac - ERIC
196
ED 434 389 AUTHOR TITLE INSTITUTION SPONS AGENCY PUB DATE NOTE AVAILABLE FROM PUB TYPE EDRS PRICE DESCRIPTORS IDENTIFIERS ABSTRACT DOCUMENT RESUME EA 030 050 Horn, Jerry; Miron, Gary Evaluation of the Michigan Public School Academy Initiative: Final Report [and] Executive Summary. Western Michigan Univ., Kalamazoo. Evaluation Center. Michigan State Dept. of Education, Lansing. 1999-01-00 196p. For full text: <http://www.mde.state.mi.us>. Reports Evaluative (142) MF01/PC08 Plus Postage. *Charter Schools; *Educational Assessment; Educational Change; Elementary Secondary Education; Privatization; Profiles; *Summative Evaluation *Michigan This is the final report of a one-year evaluation of the Michigan Public School Academy (PSA) initiative. The evaluation involved both formative and summative evaluations and used both qualitative and quantitative methods. The study was conducted between October 1997 and December 1998. Data-collection methods included a charter-school survey and a school-climate survey administered to PSA staff, students, and parents; interviews with representatives of all stakeholder groups; demographic data, financial data, and test scores; and documents, literature, school portfolios, and student work samples. Findings show that the number of PSAs operating in the state rose from 38 in 1995-96 to 137 in the 1998-99 school year. PSAs were small in terms of size with the trend toward more management companies starting or running the PSAs. The findings show that there are four distinct groups of charter schools in Michigan: converted private schools, converted public schools, "mom and pop" schools, and "franchise" or "cookie cutter" schools. Governance and leadership issues of the schools are described, as are curriculums and quality of instruction, financial status of the schools, teachers and staff in PSAs, working conditions and staff satisfaction, students and parents, PSA legislation, authorizing agencies, management companies, and other information. (17 appendices provide further data.) (RJM) ******************************************************************************** * Reproductions supplied by EDRS are the best that can be made * * from the original document. * ********************************************************************************
-
Upload
khangminh22 -
Category
Documents
-
view
2 -
download
0
Transcript of Miron, Gary Evaluation of the Michigan Public School Ac - ERIC
ED 434 389
AUTHORTITLE
INSTITUTIONSPONS AGENCYPUB DATENOTEAVAILABLE FROMPUB TYPEEDRS PRICEDESCRIPTORS
IDENTIFIERS
ABSTRACT
DOCUMENT RESUME
EA 030 050
Horn, Jerry; Miron, GaryEvaluation of the Michigan Public School Academy Initiative:Final Report [and] Executive Summary.Western Michigan Univ., Kalamazoo. Evaluation Center.Michigan State Dept. of Education, Lansing.1999-01-00196p.
For full text: <http://www.mde.state.mi.us>.Reports Evaluative (142)MF01/PC08 Plus Postage.*Charter Schools; *Educational Assessment; EducationalChange; Elementary Secondary Education; Privatization;Profiles; *Summative Evaluation*Michigan
This is the final report of a one-year evaluation of theMichigan Public School Academy (PSA) initiative. The evaluation involved bothformative and summative evaluations and used both qualitative andquantitative methods. The study was conducted between October 1997 andDecember 1998. Data-collection methods included a charter-school survey and aschool-climate survey administered to PSA staff, students, and parents;interviews with representatives of all stakeholder groups; demographic data,financial data, and test scores; and documents, literature, schoolportfolios, and student work samples. Findings show that the number of PSAsoperating in the state rose from 38 in 1995-96 to 137 in the 1998-99 schoolyear. PSAs were small in terms of size with the trend toward more managementcompanies starting or running the PSAs. The findings show that there are fourdistinct groups of charter schools in Michigan: converted private schools,converted public schools, "mom and pop" schools, and "franchise" or "cookiecutter" schools. Governance and leadership issues of the schools aredescribed, as are curriculums and quality of instruction, financial status ofthe schools, teachers and staff in PSAs, working conditions and staffsatisfaction, students and parents, PSA legislation, authorizing agencies,management companies, and other information. (17 appendices provide furtherdata.) (RJM)
********************************************************************************* Reproductions supplied by EDRS are the best that can be made *
* from the original document. *
********************************************************************************
Evaluation of the MichiganPublic School Academy
Initiative
Final Report
Jerry Horn
Gary Miron
The Evaluation CenterWestern Michigan University
January 1999
Le U.S. DEPARTMENT OF EDUCATION(2) Office of Educational Research and Improvement
EDUCATIONAL RESOURCES INFORMATIONsc.)
CENTER (ERIC)(Y) MIThis document has been reproduced as0 received from the person or organization
originating it.
Minor changes have been made to
1.
improve reproduction quality.
Points of view or opinions stated in thisdocument do not necessarily representofficial OERI position or policy.
2D33130T COM' AMU LIE
Foreword
This is the final report of the one year evaluation of the Michigan public school academy (PSA)initiative. Over the past year, we have immersed ourselves in this reform, visiting schools,conducting interviews, reviewing documents, gathering and analyzing data in many forms, andtalking with stakeholders both in PSAs and in the traditional public schools. We have followed thedebate both at an academic level and at a political level. We have been treated with great suspicionin some places and warmly welcomed in others. It isin factfor us, one of the most complex schoolreforms that we have had the opportunity to evaluate. The polarized nature of the reform and thestrong divisions that exist between the proponents and opponents made our task difficult. We expectthat both opponents and proponents will be happy with some of our findings and upset with others.Our real concern is that the evaluation's results will be used to shore up each side's arguments. Asreaders will see, there are negative and positive outcomes, and there is considerable diversity amongthe schools that we studied. We identified both the strengths and weaknesses of the schools and theinitiative, and we hope that decision makers understand and make full use of the findings tostrengthen the PSA initiative and the public education system as a whole.
At The Evaluation Center, we are most interested in advancing the theory and practice of evaluation.It is not our business to engage in an advocacy role for any of the stakeholder groups of this or anyother education reform effort. The intent of this evaluation of the PSA initiative is to "improve, notto prove." We hope the readers of this report will consider ways in which the public schoolacademies can be strengthened, through additional legislation to steer and regulate the schools so thatthey can fulfill their original expectations; through the development of more effective routines tooversee and support the schools; through more effective efforts to govern and administer the schools;and through more effective policies to support teachers and strengthen the quality of instruction inthe classroom.
We welcome the readers of this report to supply us with feedback in the form of comments,corrections, and compliments. Our contact information can be found below. The final version ofthis report will be delivered to the Michigan Department of Education in January 1999.
Jerry Horn and Gary Miron
Evaluation of the PSA InitiativeThe Evaluation CenterWestern Michigan UniversityKalamazoo, MI. 49008-5178
3
i
Tel. (616) 387-5895Fax. (616) 387-5923e-mail. <[email protected]>
<jerry.hom@ wmich.edu>
Table of Contents
page
Foreword i
Executive Summary
Table of Contents ii
List of Tables and Figures v.List of Appendices vi
Acknowledgments vii
Chapter 1 Background and Methodological Frame of the Evaluation 1
1.1 Background 21.2 Evaluation Questions 3
1.3 Design and Methods of the Evaluation 61.4 Data Collection 91.5 Limitations to the Evaluation 11
Chapter 2 Public School Academies 13
2.1 Description of the Schools 13
2.2 Mission of the School 182.3 Basis or Reasons for the School 202.4 Governance 212.5 Curriculum 272.6 Quality of Instruction 302.7 Safety at School 312.8 Barriers and Challenges 31
2.9 Financial Status of the Schools 34
ii
4
Chapter 3 Teachers and Staff 39
3.1 Description of Sampled Teachers and Staff 393.2 Working Conditions for Teachers and Staff 443.3 Expectations of Teachers and Staff 463.4 Factors Influencing Teachers and Staff to Seek Employment at Their PSA 463.5 Professional Opportunities for Teachers 47
Chapter 4 Students and Parents 50
4.1 Description of Sampled Students and Parents 504.2 Factors Influencing Students and Parents to Enroll in a PSA 524.3 Student and Parent Satisfaction 534.4 Students With Special Needs 54
Chapter 5 Legislation, Oversight and Management 56
5.1 Legislation 565.2 The Role of the Michigan Department of Education 585.3 Authorizing Agencies 605.4 Management Companies 67
Chapter 6 Innovations in the Charter Schools 72
6.1 Innovative Practices in Instruction, Management, and Operations 736.2 Educational Technology 746.3 Transportability of Innovations to Other Schools 76
Chapter 7 Demonstrating Success 78
7.1 Indicators/Evidence of School Excellence 787.2 How Effective Are Charter Schools With Large Amounts of Start-up Monies? . 807.3 What Are the Affective and Effective Outcomes for Students
Attending PSAs with a Cultural Focus? 827.4 Has Accountability for the Educational Performance of
Students Been Assumed at the School Site Level? 82
iii
5
7.5 Evidence of Student Success 837.6 MEAP Test Scores 887.7 School Climate 887.8 Actual Use of Evaluation in the PSAs 89
Chapter 8 Major Findings and Recommendations 92
8.1 Impact on Local School Districts 928.2 Legal and Legislative Issues That Need to Be Addressed 958.3 Major Findings and Recommendations 968.4 Areas for Future Research 102
References 104
Appendices
iv
List of Tables and Figures
TablesTable 1:1 Schedule for Data Collection 9
Table 1:2 Data Collection Strategies and Information Sources 11
Table 2:1 PSAs That Have a Charter But Are Not Currently in Operation 15
Table 2:2 PSAs That Have Closed and No Longer Have a Charter 15
Table 2:3 Comparison of Traditional School Boards and PSA Boards of Directors 24
Table 2:4 Average Teacher Salaries: PSAs and Host Districts 37
Table 3:1 Role and Certification Status Among Teachers and Staff 40
Table 3:2 Role and Age Distribution Among Teachers and Staff 41
Table 3:3 Role and Amount of Formal Education 42
Table 3:4 Do You Plan to Teach Here Next Year? 43
Table 3:5 Role and Highest Academic Degree 42
Table 3:6 Years of Experience as an PSA Educator by Role and in Various Types of School 43
Table 3:7 Level of Satisfaction with the Mission of the School 44
Table 3:8 Reasons for Seeking Employment at this School 47
Table 5:1 Authorizing Bodies by Type and Number of Schools. 62
Table 7:1 Graduation Rates in Percent for PSAs and Their Host Districts 87
Table 7:2 Dropout Rates in Percent for PSAs and Their Host Districts 87
FiguresFigure 2:1 Growth in the Number of PSAs and Students Enrolled in PSAs 13
Figure 2:2 Ethnic Composition of PSAs, Host Districts, and the State of Michigan 16
Figure 2:3 Changes in the Ethnic Composition of PSAs Between 1995/96 and 1998/99. . . 17
Figure 2:4 Distribution of Students Responses to the Statement`Students Feel Safe at This School' 31
Figure 3:1 Distribution of Teachers and Staff by Grade Level 40
Figure 3:2 Satisfaction With Salary 45
Figure 3:3 Satisfaction With Fringe Benefits 45
Figure 5:1 Typology of EMOs Operating in Michigan 68
Figure 7:1 Results on School Climate Survey Subscales in Relation to National Norms 89
List of Appendices
Appendix A-1 Target and Achieved Samples of Teachers and Staff (Charter School Survey) 106
Appendix A-2 Target and Achieved Samples of Teachers and Staff (School Climate Survey) 107
Appendix B-1 Target and Achieved Samples of Students (Charter School Survey, Grades 5-12)108
Appendix B-2 Target and Achieved Samples of Students (School Climate Survey) 109
Appendix C-1 Target and Achieved Samples of Parents and Guardians (Charter School Surve3I)10
Appendix C-2 Target and Achieved Samples of Parents and Guardians (School Climate SurveD1
Appendix D Teacher and Staff Results from the Charter School Survey 112
Appendix E Student Results from the Charter School Survey 116
Appendix F Parent and Guardian Results from the Charter School Survey 119
Appendix G Teacher and Staff Results from the School Climate Survey 122
Appendix H Student Results from the School Climate Survey 125
Appendix I Parent and Guardian Results from the School Climate Survey 128
Appendix J Ethnic Composition of Students Enrolled in PSAs and Their Host Districts . 131
Appendix K Percent of Students Qualifying for Free or Reduced Lunches 133
Appendix L Selected Financial Data Comparison of PSAs and Their Host Districts 135
Appendix M Average Teacher Salaries: Comparison of PSAs and Their Host Districts .. . 137
Appendix N MEAP Test Scores in Mathematics (Grades 4, 7 and 11) 139
Appendix 0 MEAP Test Scores in Reading (Grades 4, 7 and 11) 145
Appendix P MEAP Test Scores in Science (Grades 5, 8 and 11) 151
Appendix Q MEAP Test Scores in Writing (Grades 5, 8 and 11) 157
vi
Acknowledgments
We want to thank all the parents, staff, and students of the 51 charter schools we worked with inMichigan who contributed to this study. In times of extreme pressure and heavy demands on theirtime, the school directors and teachers provided the evaluation team with information and insightsthat they alone could describe.
The task of collected qualitative and quantitative data for such an extensive evaluation requiressupport from many persons and agencies. We conducted interviews with representatives from otherstakeholder groups, such as authorizing agencies, management companies, traditional public schoolsand their administrative offices, and persons in the communities where the public school academiesare located. We are grateful to all those persons who provided us with information and documentation.
We were fortunate to recruit four qualified and dedicated Traveling Observers who helped with thedata collection in the field: Ms. Sarah Barratt from the Bay City area, Ms. Audrey Brown fromFrankfort, Dr. Michael Mintrom from Lansing, and Ms. Maggie VandeVelde from Grand Rapids.They were persistent and thorough in their work and in completing the wide range of tasks at eachschools. At Western Michigan University, William Post provided assistance in merging data setsand conducting the analysis of data obtained from the Department of Education.
There are a number of persons we wish to recognize and thank at the Michigan Department ofEducation. First of all we would like to recognize and thank Dr. Donald Weatherspoon, who wasour contact for the evaluation. He met with us regularly and provided oversight and guidance.Caro lee Mikulcik was able to provide answers to many of our questions, and she served as acontinuous link to information and persons at MDE. Gary Cass, Joan May, and Kim Sidel in thecharter school unit at MDE answered numerous questions and provided information. Glenda Raider,who works in the State Aid and School Finance office assisted us in securing financial data on thePSAs and their host districts.
At The Evaluation Center, we express our appreciation to Ms. Sally Veeder for her expert editingof the many documents and forms and for her personal interest in this project. Other Centerpersonnel who worked on various aspects of the administration of the project are Ms. Mary Ram low,Ms. Maxine Robb, Mr. Krishna Kalluru, and Ms. Kristin Kutter. We also thank Dr. DanielStufflebeam, Director of The Evaluation Center, for his support and encouragement as well as hisexpert advice on various aspects of the evaluation.
Finally, we want to recognize and express our appreciation to the leadership of this state for itscommitment and courage to initiate an evaluation of this groundbreaking educational reformmovement.
On behalf of The Evaluation Center,
Jerry G. Horn and Gary Miron
vii
Chapter OneBackground and Methodological Frame of the Evaluation
At The Evaluation Center, we are most interested in developing the theory and practice of evaluation.It is not our business to engage in an advocacy role for any of the stakeholder groups of this or anyother education reform effort. We hope the results from this evaluation can be used to strengthenthe public school academy' (PSA) initiative; for example, through additional legislation to steer andregulate the schools so that they can fulfill their original expectations, through the development ofmore effective routines to oversee and support the schools, through more effective efforts to governand administer the schools, and through more effective policies that can support teachers andstrengthen the quality of instruction in the classroom.
The Evaluation Center was one of two organizations asked by the Michigan Department of Education(MDE) to evaluate the charter school initiative in Michigan. In evaluating the overall initiative, wehave collected data and information from charter schools, authorizing agencies, managementcompanies, MDE officials, as well as representatives of traditional public schools and intermediateschool districts. While we have not been charged with the task of evaluating individual schools, wehave collected a large amount of school-specific data from the 51 schools that we visited. Thisparticular evaluation was started in October 1997 and was completed in December 1998. The datacollection in the schools only took part during the 1997-98 school year. The analysis reflects onlythe schools that were in operation during that time.
Like most of the studies conducted by The Evaluation Center at Western Michigan University, thisevaluation is marked by the following characteristics and principles:
O We wish to promote an appreciation of and capacity to conduct evaluations that can be used anddeveloped by each participating school in the future.
O We perceive evaluation to be the systematic investigation (assessment) of the worth or merit ofan object.
O The most important purpose of the evaluation is not to prove, but to improve.O The evaluation has a holistic approach in that aspects of both formative and summative
evaluation are included.O Both qualitative and quantitative methods of data collection are used and interwoven during both
the field work and report writing.O The design and conduct of the evaluation meet the applicable utility, feasibility, propriety, and
accuracy standards of The Program Evaluation Standards (Joint Committee, 1994).
' In the state of Michigan, the terms "charter schools" and "public school academies" are usedinterchangeably. Both terms are used in this report. The legislation refers only to public school academies.
Evaluation of the Michigan PSA Initiative 1 The Evaluation Center, WMU
10
The legislative and regulatory actions that created the initiative, policies, and procedures to guide thedevelopment and operation of public school academies in Michigan provide a clear intent that theinitiative is to be monitored and evaluated in a quality manner. In addition, there is a promise to thepeople of Michigan and a responsibility to the professional practice of education that this innovativeinitiative be submitted to the highest quality of evaluation and standards. Evaluation and oversightof charter schools are shared responsibilities of school personnel, the authorizers, and the MichiganDepartment of Education. While the emphases and general audiences for the evaluations aredifferent, it is in this collective manner that the fullest knowledge and understanding of thissignificant reform effort (i.e., the charter school initiative) will be realized. To ensure objectivity andcredibility, it is important that a third party evaluator, without vested interests or direct involvementin creating, operating, or providing services to charter schools, be engaged to conduct an overallevaluation of the initiative.
An overriding goal for this evaluation is to provide the state-level decision makers with the necessaryinformation to determine if the charter school movement is meeting its statutory objectives, as statedin The Revised School Code, 1995 Public Act 291, Part 6A. Additionally, the evaluation has thefollowing objectives:
1. To provide information about the effectiveness of the authorizing process2. To provide charter schools with guidance regarding effective processes that are being used in
other charter schools3. To provide students and parents with information about how well their charter school is doing
relative to other charter schools and traditional public schools
During both the planning and conducting of the study, we have been conscious of the widespreadand diverse interests of the various stakeholder groups. Michigan has played a leadership role inshaping the legislation and developing the infrastructure for the development of charter schools.This evaluation was designed to serve the needs of the various stakeholders and provide qualityinformation to strengthen the reform. We have worked cooperatively with the MDE, authorizingagencies, and charter schools to ensure that this effort provides positive contributions to theinformation base about charter schools and evaluation of innovative schools/agencies.
The charter school movement across the United States is of interest to educators, researchers,legislators, parents, and the press. Since Michigan is one of the pioneers in this movement andbecause the initiative has expanded at a rate greater than in most states, the charter schools inMichigan and the evaluation of this initiative have/will receive substantial attention. In this report,we have identified both the strengths and weaknesses of the schools and the initiative, and we hopethat decision makers understand and make full use of the findings to strengthen the PSAs initiativeand the public education system as a whole.
1.1 Background
Charter schools offer students alternative and diverse educational programs, with the goal ofimproving academic achievement. The intention behind this new form of public schooling is that by
Evaluation of the Michigan PSA Initiative 2 The Evaluation Center, WIVIU
providing further autonomy to schools, they can pursue innovative teaching practices and create adiversity of school options from which parents can choose. During the last three years, the numberof charter schools (i.e., public school academies) in Michigan has grown rapidly and currentlyincludes 137 operating schools across the state with approximately 34,000 students enrolled.
Selected assumptions about charter schools. In evaluating the charter schools for any given year,there are certain regulations and considerations that should be appropriately recognized in the datacollection and interpretation. Below we list some of these. It is important to note that these wereconsidered in the design and conduct of our evaluation.
1. Schools have existed for varying lengths of time and are in different stages of becoming fullydeveloped and maximally efficient and effective. Each school is authorized for a particularmission and has identified goals and purposes unique to that mission.
2. Generalizations cannot easily be made among PSAs since they differ in so many respects fromone another.
3. Teachers must be certified just as they are at other public schools, except as allowed by laws,rules, or regulations.
4. Schools may not screen students, but they may limit the number of students they serve. If morestudents apply than can be enrolled, students are chosen through a random selection process.
5. Neither the state board of education nor the state legislature mandated a core curriculum forMichigan. However, a Michigan core curriculum was recommended as a framework for all publicschools to use.
6. Charter schools are subject to all laws and regulations that apply to public schools generally,including The Revised School Code, 1995 PA21, Part 6A, and other related laws. These schoolsmay not teach religion.
7. Charter schools receive the state foundation grant on a per-pupil basis. This level of fundingcannot exceed the amount received by the local school district in which the charter school islocated). Charter schools cannot charge tuition. However, they can raise funds through legalfoundations, receive grants, etc., as any public school can do.
1.2 Evaluation Questions
Since the charter school initiative is relatively new in Michigan and schools are in various stages ofdevelopment, the evaluation plan incorporates elements of both formative and summative evaluation.The purpose of formative evaluation is to provide information to improve the charter schools byassessing their ongoing activities. It should be conducted continuously throughout the duration ofa school's existence. Typical questions that would be asked within the context of formativeevaluation are listed below:
O Are the schools being operated as proposed/authorized?O Were the appropriate persons selected and included in the planned activities?O Are the schools' management plans being followed or adjusted for defensible reasons?O Are students moving toward the anticipated/planned goals?O Which elements/factors of the schools are aiding students to move toward these goals?O Are the resources being appropriately directed to fulfill the goals of the schools?
Evaluation of the Michigan PSA Initiative 3 The Evaluation Center, WMU
g2
Within the framework of summative evaluation, the following questions would be appropriate toconsider:
O Did the schools meet their goals and the goals of the initiative?O Have the needs of the students and community been met?O Can the schools and the initiative be continued/perpetuated under existing conditions?O Were there unintended or unanticipated outcomes as a result of these schools? What are their
value and merit?
Further, there is an implicit monitoring element within this plan. However, the purpose is not tomonitor the operations or activities of individual schools. This is one of the designatedresponsibilities of the authorizers and should be an important element in their judging the quality ofthe educational programs in the schools they have authorized and in their decision to continue orwithdraw charters. The monitoring process of the statewide evaluation in this plan relates to theoverall initiative.
In recognition that the public school academies are new, operating with small administrative staffs,and of considerable interest to researchers and the general public, the comprehensive evaluation planis designed to make maximum use of existing/statutorily required data and to be as unobtrusive aspossible into the daily activities of the school. However, there is a substantial need to ensure thatinformation derived from secondary sources is accurate and credible.
The evaluation plan is designed to address the primary purposes for which charter schools and theassociated legislation and regulations were created. To determine whether or not these purposes havebeen fulfilled, evaluation questions answerable through this evaluation plan have been created.These questions as specified in the RFP are included in the following section. Answers to thesequestions are provided throughout the text of the report. A concise summary of these key questionsand answers based on the evaluation results are also summarized in the concluding chapter and inthe executive summary of the report.
Primary evaluation questions as specified in the RFP.
A. Legislation1. How have the changes since the original charter school legislation affected the operation of
charter schools?2. Has the legislation been helpful in responding to individual charter school operations?3. Has the legislation provided parents and pupils with greater choices among public schools,
both within and outside their existing school districts?
B. Michigan Department of Education (MDE)1. Has MDE staff provided appropriate support and guidance for charter schools and
authorizing agencies?2. Has MDE provided leadership and supervision for charter schools and authorizing agencies?3. Is MDE viewed as reasonable in its data requests?
Evaluation of the Michigan PSA Initiative 4 The Evaluation Center, WMU
13
C. Authorizers1. Are the authorizing agencies providing appropriate oversight of charter schools?2. How expensive is the application process?3. How long does the application process take?4. How many visits have the authorizing agencies made to each charter school?5. Are the visits by the authorizing agencies to charter schools helpful?6. Is written feedback of the school visitation provided to MDE when requested?7. Has MDE been provided with an analysis of the line item expenditures from the authorizing
agencies' 3 percent fee, when requested?
D. Charter Schools Broad Questions Regarding Effectiveness1. How effective are charter schools that have large amounts of start-up moneys, compared
with charter schools that have insufficient money to begin operating?2. Will the lack of affordable buildings be a significant obstacle to the charter school
movement?3. What are the affective and effective outcomes for students attending charter schools with
a cultural focus?4. Have new professional opportunities for teachers been created in a new type of public
school in which the school structure and educational programs have been innovativelydesigned and managed by teachers at the school site level?
5. Has accountability for the educational performance of students been assumed at the schoolsite level?
6. To what extent is each charter school fulfilling its performance contract with its authorizingagency?
7. What are the students' and parents' perceptions and levels of satisfaction with their charterschool?
8. Is the climate of the charter schools perceived by the students and parents as safe andconducive to learning?
9. What, if any, impact occurred in the local school district in which the charter school islocated?
10. Why have local school districts, intermediate school districts, and community colleges usedtheir statutory authority to authorize public school academies to such a limited extent?
11. What other obstacles have charter schools faced in organizing and operating?
Additional evaluation questions added by The Evaluation Center are listed below:
1. What, if any, innovative teaching methods or educational practices have been stimulated by thecharter schools? To what extent are these transportable to other schools?
2. To what extent and in what ways have parents become involved in the charter schools attendedby their children?
To fully understand the context of the charter schools in the annual descriptive report, basicinformation on charter schools operating on or before the MDE first student count of the school year
Evaluation of the Michigan PSA Initiative 5 The Evaluation Center, WMU
under investigation will be included. This includes information about the schools' missions,activities, various demographic figures, as well as any additional information that the Departmentof Education deems appropriate.
Further, the study will result in a set of recommendations identifying
O exemplary programsO successful variables to be emulated by other charter schoolsO unsuccessful charter schools, listing a set of variables that need improvement
1.3 Design and Methods of the Evaluation
Scope and duration of the evaluation. The evaluation was limited to the 1997/98 school year.Only schools that were in operation during that school year were considered in the study. Some datafor these schools from previous school years (i.e., such as enrollments, test scores, etc.) have beenincluded where available and relevant.
In terms of the scope of the study, 51 charter schools were included. This includes all of theoperating charter schools in the geographic area designated for the study. The specific areadesignated for the study included all of the state of Michigan except for Detroit and its surroundingcounties. The 51 schools included in the study were found in the following counties: Allegan, Bay,Berrien, Branch, Charlevoix, Chippewa, Eaton, Emmet, Gladwin, Grand Traverse, Ingham, Ionia,Iosco, Isabella, Hillsdale, Jackson, Kalamazoo, Kent, Manistee, Marquette, Menominee, Midland,Muskegon, Oceana, and Ottawa.
The intermediate school districts in which the 51 charter schools were located included thefollowing: Allegan, Bay-Arenac, Berrien, Branch, Charlevoix-Emmet, Clare-Gladwin,Delta-Schoolcraft, Eastern U.P., Eaton, Gratiot-Isabella, Ingham, Ionia, Iosco, Jackson, KalamazooValley, Kent, Lapeer, Manistee, Mason-Lake, Midland, Muskegon, Ottawa, and Traverse Bay.
General phases of the evaluation. There were three overlapping phases of the evaluation, i.e.,planning, data collection, and report writing. The planning and preparation for the study werecompleted by mid-December 1997. This included the development, testing, and revision of datacollection instruments, as well as finalizing the plan for data collection. Most of the data collectiontook place between mid-December 1997, and the end of May 1998. There were two rounds of schoolvisits during which the surveys were administered and interviews conducted. The first round ofschool visits extended from December 15, 1997, to February 20, 1998, and the second round ofschool visits took place between April 27 and May 29, 1998. The time between and after these tworounds of school visits was devoted to meetings/interviews with representatives from (i) theMichigan Department of Education, (ii) authorizing agencies, (iii) management companies, (iv)intermediate school districts, and (v) traditional public schools. Initial data analysis of the surveyresults took place after each round of school visits. Summarized results for each school werereturned to the schools in August and September 1998. A review of relevant documentation and
Evaluation of the Michigan PSA Initiative 6 The Evaluation Center, WMU
± 5
literature continued throughout the duration of the project. Final report writing took take placeduring the autumn of 1998, with the final report submitted in January 1998.
Evaluation team. The evaluation team was comprised of a project director, project manager,traveling observers (TOs), and resources persons. The project director was responsible foroverseeing all aspects of the project as well as participating in many of the activities. The projectmanager was responsible for the day-to-day conduct of the evaluation. The project director andproject manager made a total of 71 visits to the charter schools.
As a part of the evaluation team, we utilized the services of four part-time traveling observers whoparticipated directly in the collection of information from identified sources, provided on-siteassistance and consulted with the schools regarding the collection of data. In many respects, theywere the daily "eyes and ears" of the core evaluation team. The TOs did not make evaluativejudgments regarding charter schools or other related agencies, i.e., authorizers; rather, they servedas a conduit for information about the charter schools to the project director and manager. The TOconcept has been used extensively in The Evaluation Center on a variety of projects.
The evaluation project benefited from the advice and support of a number of resource persons. Someof these resource persons are employed or associated with The Evaluation Center, and some are fromother departments and even other universities.
Metaevaluation. We believe that the evaluation of the charter school initiative in Michigan is ofsuch importance and potential impact that a metaevaluation is not only appropriate but should bemandatory. Therefore, we included this as a part of our study. A further description ofmetaevaluation, as taken from The Program Evaluation Standards (Joint Committee, 1994), is foundbelow.
Metaevaluation is evaluation of an evaluation. The program evaluation should be evaluatedby those who design and carry it through. And, inasmuch as program evaluations often aresubject to outside scrutiny, criticism, and legal action by program supporters, detractors, andmetaevaluators, separate concurrent review of the program evaluation process by externalmetaevaluators can help program evaluators avoid critical mistakes. Clients can also conductmetaevaluations. Documentation of the effective/ineffective application of programevaluation procedures facilitates the proper interpretation of data. Regular employment ofmetaevaluation should enhance the credibility of particular program evaluations and theoverall evaluation profession (p. 185).
In this project we will have a summative metaevaluation conducted by an external evaluator near theclose of the evaluation. The summative metaevaluation report will be submitted to The EvaluationCenter after ample time is allowed for review of the final report. This metaevaluation report will beavailable for review by the MDE as requested.
Evaluation of the Michigan PSA Initiative 7 The Evaluation Center, WMU
Technical assistance and evaluation capacity building. While not specifically called for in theRFP, we perceived a need to engender the cooperation and assistance of all the charter schools in thecollection of data that are essential to this study. Otherwise, the costs to meet the expectations of thisstudy would far exceed those available. Further, we expected that charter schools and authorizerswill have continuing responsibilities for reporting evaluative information, and we hope they willevaluate the schools and make improvements based on valid information in the future. Therefore,we provided basic technical assistance and facilitated capacity building in the area of evaluation andits use for school improvement.
To assist the schools in continuous school improvement efforts, gathering information for requiredand optional reports, and helping to meet the needs of this study, we developed and distributed toeach charter school in our evaluation area a School Self-Evaluation Kit. The following items wereincluded in the kit:
O Rationale and explanation for the evaluationO A description of the general steps and procedures for conducting the evaluationO A bibliography of printed resources and a list of electronic resourcesO Directory of support servicesO Reporting forms/instruments
- School basic information/reporting form- Parent survey (master and laminated copies)- Student survey for grades 5-12
Teacher survey- School climate battery
O Schedule for administering instrumentsO Overall plan for school self-evaluationO A Model for School Evaluation (book) (Sanders, et al. 1995)O The Program Evaluation Standards, 2nd edition (book) (Joint Committee, 1994)O A Consumer Report on School Report Cards (book) (Jaeger, et al., 1994)O Step Guide for the Program Evaluation Standards (pocket booklet)
The systematic collection of information, as described in the school portfolio component of the kit,could serve as a useful response format to organize and prepared information for others requestinginformation/documentation from the school.
Six half-day workshops were conducted around the state during the first few months of the project.The workshops focused on the Program Evaluation Standards, the school-level expectations for datacollection, and the broader concept of school self-evaluation. Charter school representatives weregiven a thorough review of the School Self-Evaluation Kit and a general overview of data collectionactivities that took place through the 1997/98 school year. Representatives of authorizing agenciesand MDE were also invited to participate in the workshops.
Evaluation of the Michigan PSA Initiative 8 The Evaluation Center, WMU
17
Electronic access to the evaluation team and The Evaluation Center was available via e-mail and theweb site for the evaluation. Beginning in 1997, a specific web site was made available for theevaluation project. This web site contained information about the evaluation, copies of all theinstruments and documents concerning the data collection, and information about resources for theparticipating schools. We also intend to use the web site as a means for dissemination of the finalreport for the evaluation.
1.4 Data Collection
The bulk of the data collected was through the surveys of teachers/staff, students, and teachers.Below a brief description of the questionnaires and targeted informant groups is included as well asinformation about the timing of the administration of the questionnaires and the actual data collectionprocess. To ensure the collection of consistent information across all charter schools, we developedthe following schedule for data collection with questionnaires (see Table 1:1).
Each school was encouraged to add questions or items to the standard questionnaires that we used.None of the schools took advantage of this opportunity to have specific questions asked, analyzed,and reported back to them. The summarized results from each survey were returned to each schoolfor its own planning purposes.
Table 1:1 Schedule for Data Collection
Instrument Period for Administrationand Targeted Informants
Description of Data Collection
Basic Ongoing activity with final copy The basic information form and the school portfolio included a number ofInformation due by May 29, 1998. This items for which responses and supplemental documentation could beForm and form and portfolio were provided. Will be available at various times during the year.School compiled by the schoolPortfolio principal/ administrator.
Parent/ 15-20 randomly selected parents Parents were randomly selected by the external evaluator based uponGuardian sampled between December 15, information provided by the school. This was usually done by randomly
Survey 1997, and February 20, 1998,and an equal number of parents
selecting students from a roster of all those enrolled in the school. If twostudents from the same family were selected one was replaced by another
between April 27 and May 29,1998.
randomly selected student. Specific information about how the parentswere selected can be found on the evaluation web site in the documententitled "Instructions for Administering the Parent/Guardian Survey."Half of the sample parents received the Parent/Guardian Survey during thfirst round of school visits. The second half received this survey as well athe School Climate Survey during the second round of data collection. Acover letter explained the purpose of the survey, and each parent receivedan envelope in which to enclose the survey.
Evaluation of the Michigan PSA Initiative 9 The Evaluation Center, WMU
18
Instrument Period for Administrationand Targeted Informants
Description of Data Collection
StudentSurvey
Between December 15, 1997,and February 20,1998. Onerepresentative classroom ofstudents was selected from eachgrade level (grades 5-12) in eachschool. All of the students inthese selected classes wereasked to complete a question-naire. Due to limitations of timeand the coinciding scheduling ofMEAP testing, some gradelevels were not sampled in a fewschools. Missing classes wereincluded during the secondround of data collection.
The administration of the student questionnaire took between 20 and 40minutes. These questionnaires were administered by a member of theevaluation team. The purpose of the survey and the manner in which theresults would be used were explained to the students before they begancompleting the forms. Students in grades 7-12 could typically completethe questionnaires on their own, after initial instructions. Because somestudents in grades 5-7 had difficulty understanding some of the conceptsappearing in the questionnaires, the persons administering the surveyswere instructed to progress item by item and read each question/itemaloud.
Students were assured that they could respond in an honest and straight-forward manner without concern about retribution. Before accepting thesurveys from the students, each completed survey was checked by theperson administering the survey to make sure that all bubbles werecompletely filled in and no stray marks appeared on the forms.
TeacherSurvey
Between December 15, 1997,and February 20, 1998. Allteachers and school personnelinvolved with instruction,including administrative andprofessional support personnel,were asked to complete thisquestionnaire.
New teachers or others who could not complete this survey during the firsround of school visits were asked to complete this survey during thesecond round of visits.
All teachers and school personnel involved with instruction, includingadministrative and professional support personnel, were asked to complathis questionnaire. The respondents were asked to complete the survey,enclose it in an envelope, and then return it to a designated person at theschool. Teachers were instructed not to place their names on thequestionnaire, although they were asked to check off their name from a lisso that we could trace and follow up missing respondents. Since thecompleted forms were to be collected, sealed, and mailed to the externalevaluator by a designated person at each school, ample assurance wasgiven that the responses would be anonymous. Specific instructions aboutthe selection and administration of the teacher survey can be found in thedocument entitled "Instructions for Administering the Teacher Survey."
A cover letter explained the purpose of the survey, and each teacherreceived an envelope in which to enclose the survey.
SchoolClimateSurvey
Between April 27 and May 29,1998 (i.e., the second round ofschool visits), this survey wasgiven to a sample of parents,students, and teachers at allparticipating schools.
This is a commercially developed instrument by the National Associationof Secondary School Principals. Dissemination and data analysis functionare provided by The Evaluation Center at Western Michigan University.The administration of this instrument was coordinated by the externalevaluators or by a traveling observer who worked as part of the evaluatiorteam.
Beyond the surveys described above, qualitative data were collected through interviews and/or focusgroups with various stakeholders and through school visits made by the external evaluators or by thetraveling observers. (Traveling observers are field workers based in various parts of the state whowill assist in the data collection.)
Target and achieved samples. Tables depicting the target and achieved samples can be found inAppendices A, B, and C. Furthermore, a description of the sample of teachers and staff is containedin Chapter 3, and a description of the samples of students and parents/guardians can be found inChapter 4. The data were weighted to account for disproportionate samples in some schools. Theappendices (A, B, and C) also contain a description of the weights that were applied to each groupof informants.
Evaluation of the Michigan PSA Initiative 10 The Evaluation Center, WMU
13
LSIET COPY' AVAIILABILE
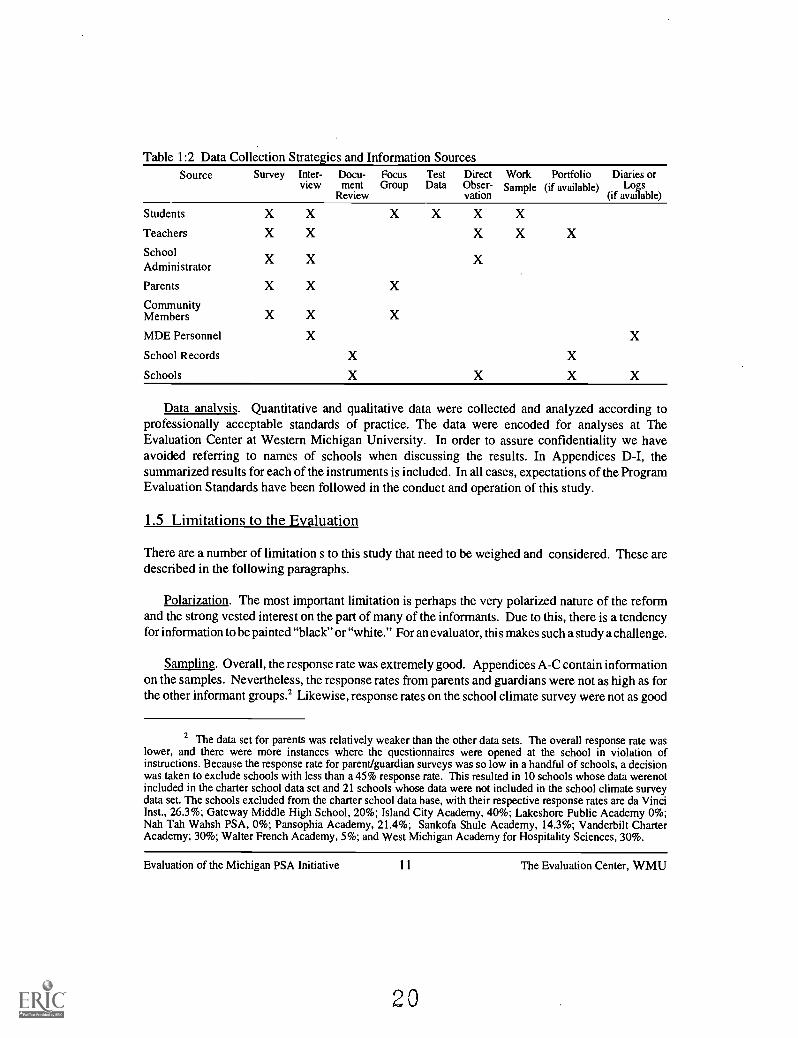
Table 1:2 Data Collection Strategies and Information SourcesSource Survey Inter- Docu- Focus Test Direct Work Portfolio Diaries or
view mentReview
Group Data Obser-vation
Sample (if available) Logs(if available)
Students X X X X X X
Teachers X X X X X
SchoolAdministrator
X X X
Parents X X X
CommunityMembers X X X
MDE Personnel X X
School Records X X
Schools X X X X
Data analysis. Quantitative and qualitative data were collected and analyzed according toprofessionally acceptable standards of practice. The data were encoded for analyses at TheEvaluation Center at Western Michigan University. In order to assure confidentiality we haveavoided referring to names of schools when discussing the results. In Appendices D-I, thesummarized results for each of the instruments is included. In all cases, expectations of the ProgramEvaluation Standards have been followed in the conduct and operation of this study.
1.5 Limitations to the Evaluation
There are a number of limitation s to this study that need to be weighed and considered. These aredescribed in the following paragraphs.
Polarization. The most important limitation is perhaps the very polarized nature of the reformand the strong vested interest on the part of many of the informants. Due to this, there is a tendencyfor information to be painted "black" or "white." For an evaluator, this makes such a study a challenge.
Sampling. Overall, the response rate was extremely good. Appendices A-C contain informationon the samples. Nevertheless, the response rates from parents and guardians were not as high as forthe other informant groups.' Likewise, response rates on the school climate survey were not as good
2 The data set for parents was relatively weaker than the other data sets. The overall response rate waslower, and there were more instances where the questionnaires were opened at the school in violation ofinstructions. Because the response rate for parent/guardian surveys was so low in a handful of schools, a decisionwas taken to exclude schools with less than a 45% response rate. This resulted in 10 schools whose data werenotincluded in the charter school data set and 21 schools whose data were not included in the school climate surveydata set. The schools excluded from the charter school data base, with their respective response rates are da VinciInst., 26.3%; Gateway Middle High School, 20%; Island City Academy, 40%; Lakeshore Public Academy 0%;Nah Tah Wahsh PSA, 0%; Pansophia Academy, 21.4%; Sankofa Shule Academy, 14.3%; Vanderbilt CharterAcademy; 30%; Walter French Academy, 5%; and West Michigan Academy for Hospitality Sciences, 30%.
Evaluation of the Michigan PSA Initiative 11 The Evaluation Center, WMU
20
as those for the charter school survey. We did extensive follow-up to raise the response rates but,since the school climate survey was administered in May 1998, there was less time before the closeof the year to follow up on persons not responding. Schools with a response rate lower than 45percent were removed from the data set
We opted to have the PSAs assist us in distributing and collecting questionnaires. While this helpedus to obtain a higher response rate, it also limited the data, since some informants thought that thequestionnaires would be opened and read at the school before they were returned to WMU. In fact,even while we had strict instructions not to open any of the sealed envelopes, this occurred at morethan 15 schools. In two instances, we were told by school staff who had left their school that somesurveys were removed before they were forwarded to WMU. We cannot estimate the extent of anytampering, but knowing the measures that were taken, think that this was still rather limited.
Because of the strong vested interests, there is obviously the possibility of misleading informationbeing provided by those we interviewed. Wherever possible, we tried to double-check information,or when references were made to financial issues or testing results, we attempted to confirm suchinformation using the databases we obtained from MDE.
Timing. The fact that the evaluation was so short in duration is also a limitation, since theimpact of the charter schools can hardly be measured over so short a period of time. We have usedMEAP test scores as one indicator of success, but mostly view this as an indicator of the type ofstudents enrolling in the charter schools. Furthermore, due to the time that is required to prepareand recheck school statistics before they are released, we have often been dependent on interpretingolder data on school characteristics.
A considerable portion of the schools we visited were in their first year of operation. We are wellaware of the growing pains of opening a new school and the heavy demands on the personnel whorun these schools. For many of the school personnel who were less than cooperative, we attributeit to the fact that they were overwhelmed with immediate tasks at hand.
Absence of a standard requirement for demonstrating accountability and evidence of studentachievement. Some states such as California and Massachusetts are ahead of Michigan in terms ofhaving standard requirements for how schookiel demonstrate success. We have encouraged theschools to demonstrate success in terms of diermission and in terms of student achievement withalternative indicators. Unfortunately, only a small number of schools had the time, interest and/orability to do so. Having standard expectations in terms of how schools will demonstrate success willmake the task of evaluating the public school academies less complicated.
Evaluation of the Michigan PSA Initiative 12 The Evaluation Center, WMU
Chapter TwoPublic School Academies
2.1 Description of the Schools
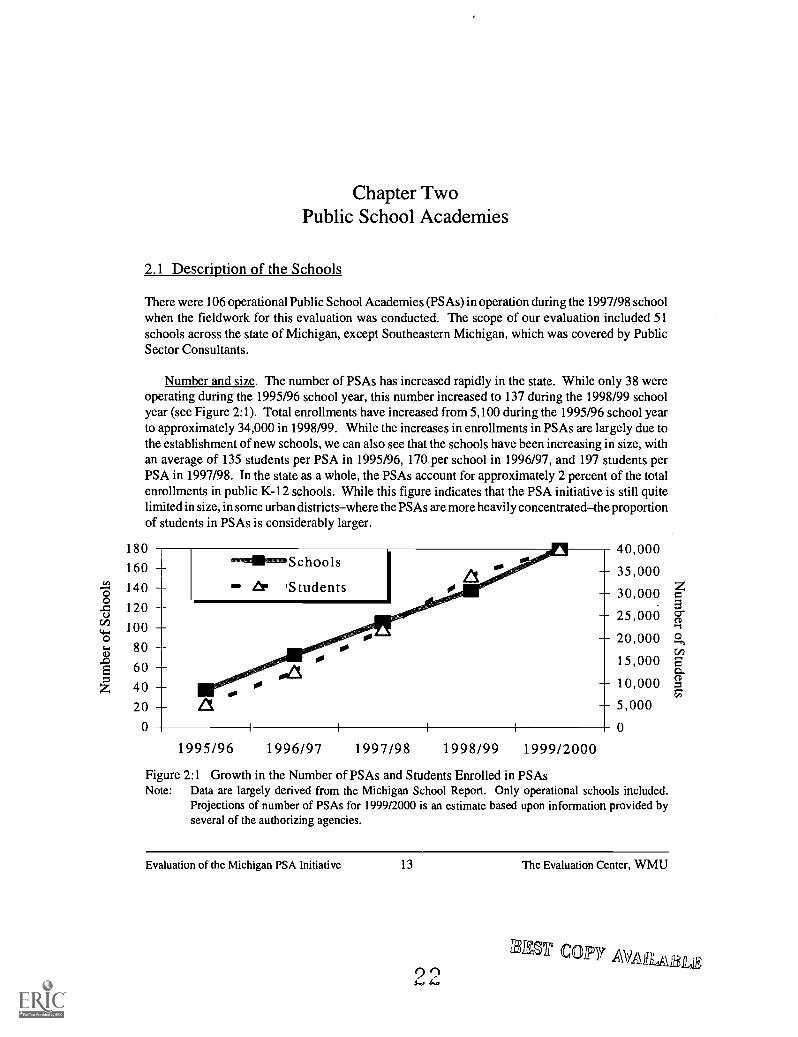
There were 106 operational Public School Academies (PSAs) in operation during the 1997/98 schoolwhen the fieldwork for this evaluation was conducted. The scope of our evaluation included 51schools across the state of Michigan, except Southeastern Michigan, which was covered by PublicSector Consultants.
Number and size. The number of PSAs has increased rapidly in the state. While only 38 wereoperating during the 1995/96 school year, this number increased to 137 during the 1998/99 schoolyear (see Figure 2:1). Total enrollments have increased from 5,100 during the 1995/96 school yearto approximately 34,000 in 1998/99. While the increases in enrollments in PSAs are largely due tothe establishment of new schools, we can also see that the schools have been increasing in size, withan average of 135 students per PSA in 1995/96, 170 per school in 1996/97, and 197 students perPSA in 1997/98. In the state as a whole, the PSAs account for approximately 2 percent of the totalenrollments in public K-12 schools. While this figure indicates that the PSA initiative is still quitelimited in size, in some urban districtswhere the PSAs are more heavily concentratedthe proportionof students in PSAs is considerably larger.
180
160
140
120
100
80
60
4020
0
a' 'Students
1.0
1995/96 1996/97 1997/98 1998/99 1999/2000
40,000
35,000
30,000
25,000
20,000
15,000
10,000
5,000
0
Figure 2:1 Growth in the Number of PSAs and Students Enrolled in PSAsNote: Data are largely derived from the Michigan School Report. Only operational schools included.
Projections of number of PSAs for 1999/2000 is an estimate based upon information provided byseveral of the authorizing agencies.
Evaluation of the Michigan PSA Initiative 13 The Evaluation Center, WMU
0 0307 C01117 AVAilliABLIE
Determining the specific number of public school academies and the number of students enrolled inthem is actually quite difficult. For example, different figures are provided by MDE than thoseprovided by the Michigan Association of Public School Academies (MAPSA). Even for theDepartment of Education, it is a difficult task to keep track of the number of schools and the keycontact information related to those schools. Many schools have changed locations, and even morehave changed principals or primary contact persons. Several schools have also changed names. Insome cases, PSAs have even changed the host school district in which they lie.
The task of keeping up-to-date information on the schools is further complicated by the fact that theauthorizing agencies, who are more likely to have current information, are not always sharing thisinformation in a timely fashion. In some instances, the audit unit at MDE has been able to alert thecharter school unit at MDE of changes. When inconsistencies or an absence of information turnsup, the audit unit follows up with an inquiry. Some of these inquiries revealed that the schools inquestion were no longer in operation.' As indicated in Figure 2:1, we have decided to count onlythose schools that are currently in operation.
There has also been some confusion about whether or not the University School at Wayne StateUniversity is a public school academy. Due to the presence of this school, some sources also listWayne State University as an authorizing agency. In fact, the University School, which wasestablished under the State School Aid Act, is similar but falls under another category.
Table 2:1 includes a list of PSAs that have a charter but are not currently in operation. The first threeschools on the list are schools that obtained a charter but did not open as scheduled. All of theseschool intend to open in 1999. The following two PSAs are schools that formerly were in operationbut which are now, reportedly, "taking a pause." We cannot understand why the two schools thatare taking a pause are not closed. According to the regulations, since they had no students duringthe last official head count, they cannot receive a full per student grant if/when they have studentsat the next head count. According to the State School Aid Act, Section 6 (4), those schools woulduse a 40/60 blend of last February and the fall count from 1998-99 to determine pupil membershipsfor the current year. Since the PSAs had no fall count, 60 percent of the blend would be equal to 0.Under current law, the schools would be severely limited in state school aid revenue if they shouldopen any time after the fall count date.
The schools listed in Table 2:2 were formerly in operation but are now closed and no longer havecharters. In the case of Saginaw Preparatory, this school was closed by the authorizer just as it wasabout to open, since the building did not meet the approval of the fire marshal. The decision forNorthlane to close was apparently a decision on the part of the PSA school board. At this point, wedo not know the reasons for the closing of Kenquest and Turtle Island Learning Circle.
3 In the case of one school, we found the building empty, the telephone number changed and thencanceled. According to persons we contacted at both MDE andinitiallyat the authorizing agency, thisschool was still in operation. Further inquiries to present and former board members revealed that the schoolwas no longer in operation. We were later informed that this school was taking a "pause."
Evaluation of the Michigan PSA Initiative 14 The Evaluation Center, WMU
23

Table 2:1 PSAs That Have a Charter But Are Not Currently in OperationSchool Name Grades Authorizing Comments
(FTE) Agency
Family Inst. Early Child-hood Develop (Kalamazoo)
K-3(54)
GVSU Authorized 5/97, planned opening 8/24/98, delayed until 9/99
George Washington K-6 GVSU Authorized 6/98, planned opening 9/98, delayed until 9/99(South Haven) (88)
Pathfinder K-2 GVSU Authorized 7/98, planned opening 8/31/98, delayed until 9/99(Benton Harbor) (136)
New School for Creative K-6 CMU Authorized 9/95, opened 9/5/95, pause during 1997/98 schoolLearning (Grand Rapids) (51) year
Sierra Leone Educational K-5 CMU Authorized 8/95, opened 9/20/95, pause during 1998/99 schoolOutreach Academy (227) year
Table 2:2 PSAs That Have Closed and No Longer Have a CharterSchool Name Grades Authorizing
(FTE) AgencyComments
Kenquest Academy 9-12(Grayling) (13)
Saginaw Preparatory 5-8(Saginaw)
North lane Math and Science K-6Academy (Freeland) (34)
Turtle Island Learning Circle 6-1(Southgate) (51)
CMU Authorized and opened in September 1995, operated one year asa charter..
SVSU Authorized in 1997. Due to lack of approval by fire marshal, theauthorizor revoked its charter and the school was closed.
CMU Authorized 4/95, began operation 9/95, closed by school boarddue to low enrollments, perhaps partially due to facility problem
Oakland Authorized 1997, opened 9/22/97, closed before 1998/99 schoolUniversity year
Nature and types of schools. The PSAs operating in the state are extremely diverse. In fact, thereis greater diversity among the charter schools than between the charter schools and the traditionalpublic schools. Therefore, any generalization about the charter schools must be made very cautiously.
The charter schools range from those that are striving to be as "public" as the traditional publicschools to those that are striving to create profiles that resemble elite-oriented private schools. Someschools focus on serving at-risk students or students with special needs, while others develop aprofile to attract a very homogeneous group of students. While some schools celebrate diversity andstrive to increase the racial and social diversity of the students, others have few if any minorities orstudents with special needs.
The individual leaders and groups of people drawn to the reform come from extremely variedbackgrounds. On the one hand you have businesspeople with investment plans, and on the other youhave groups that are "anti-establishment" in nature who are attracted to the initiative because theybelieve they can retain complete control of the instruction provided in their school. While someschools only cater to elementary grades, others provide only upper secondary education. Someschools have a strong desire not to grow in size, while others intend to expand on a large scale assoon as they can.
Evaluation of the Michigan PSA Initiative 15 The Evaluation Center, WMU
I CORY
There are four distinct groups of charter schools, each with their particular characteristics.
O Converted private schools. This group of schools was largest among the first charter schools inoperation. In fact, some authorizing agencies only considered charter applications fromconversion schools initially. Within this group, there is a number of schools that were parochialschools and others that were private schools.
O Converted public schools. There are a handful of PSAs in the state that were formerly publicschools which "opted out" to become a PSA. In all cases that we are aware of, these wereformer alternative high schools.
O "Mom and Pop" schools. These include the many small schools started by individuals or smallgroups of concerned adults. These schools, because of their small size and because of theirlimited economic clout, have struggled to secure buildings for their schools. Fewer and fewerof these types of schools are receiving charters, since the authorizers understand that they willrequire more assistance and their small size will make them more vulnerable to shifts inenrollments. Many of these schools have sought the services of management companies.
O "Franchise" or "Cookie cutter" schools. These are schools that are started by managementcompanies and must follow the established curriculum and management prescribed by their plan.
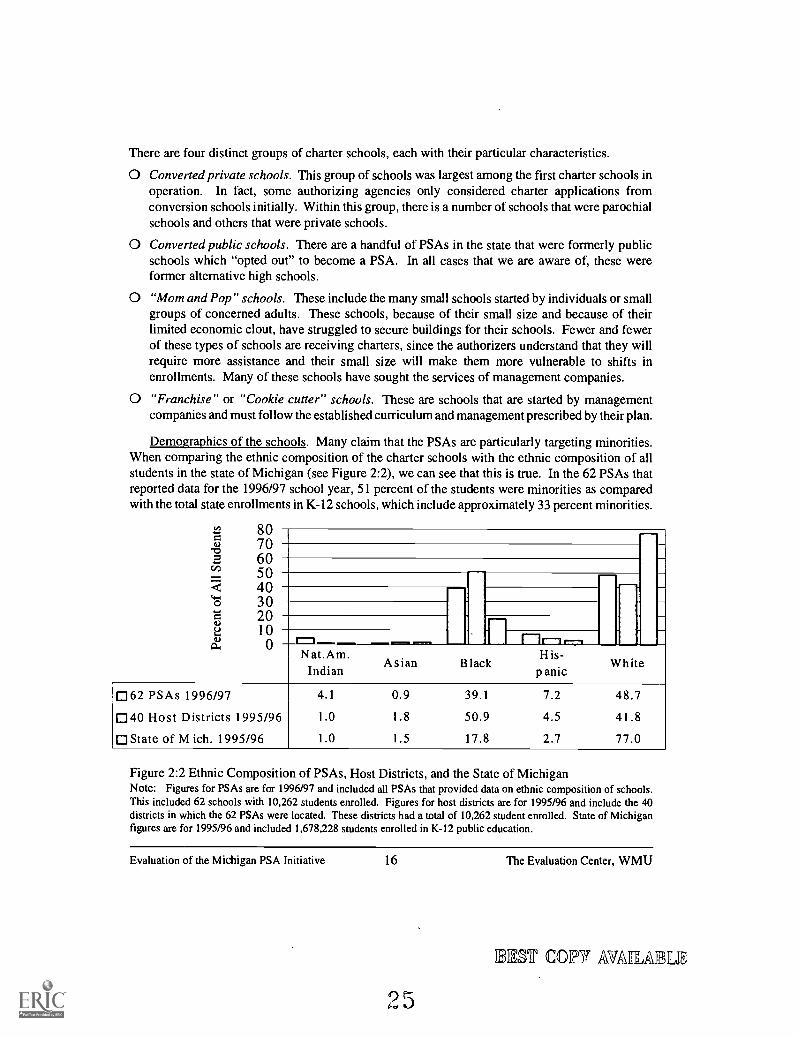
Demographics of the schools. Many claim that the PSAs are particularly targeting minorities.When comparing the ethnic composition of the charter schools with the ethnic composition of allstudents in the state of Michigan (see Figure 2:2), we can see that this is true. In the 62 PSAs thatreported data for the 1996/97 school year, 51 percent of the students were minorities as comparedwith the total state enrollments in K-12 schools, which include approximately 33 percent minorities.
8070605040302010 r-1 ri r--10
Nat.Am. H is -Asian Black WhiteIndian p anic
62 PSAs 1996/97040 Host Districts 1995/96
State of M ich. 1995/96
4.1 0.9 39.1 7.2 48.7
1.0 1 . 8 50.9 4.5 41.8
1.0 1.5 17.8 2.7 77.0
Figure 2:2 Ethnic Composition of PSAs, Host Districts, and the State of MichiganNote: Figures for PSAs are for 1996/97 and included all PSAs that provided data on ethnic composition of schools.This included 62 schools with 10,262 students enrolled. Figures for host districts are for 1995/96 and include the 40districts in which the 62 PSAs were located. These districts had a total of 10,262 student enrolled. State of Michiganfigures are for 1995/96 and included 1,678,228 students enrolled in K -12 public education.
Evaluation of the Michigan PSA Initiative 16 The Evaluation Center, WMU
207 COPY AVAITABLIE
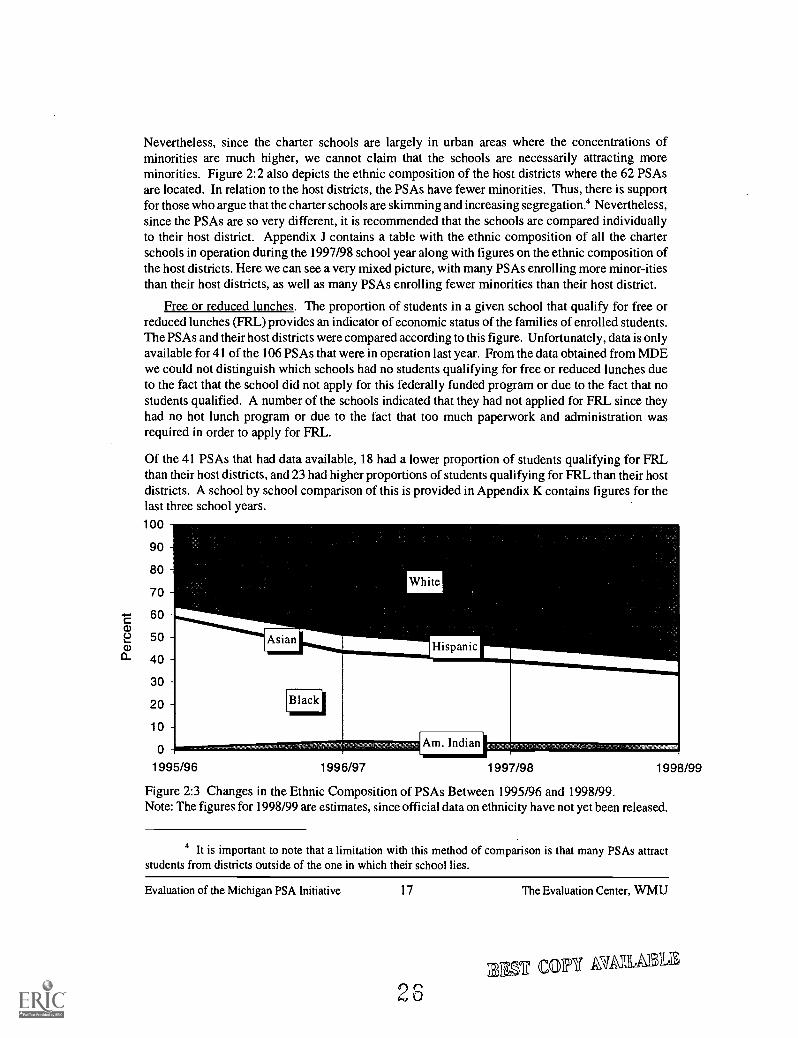
Nevertheless, since the charter schools are largely in urban areas where the concentrations ofminorities are much higher, we cannot claim that the schools are necessarily attracting moreminorities. Figure 2:2 also depicts the ethnic composition of the host districts where the 62 PSAsare located. In relation to the host districts, the PSAs have fewer minorities. Thus, there is supportfor those who argue that the charter schools are skimming and increasing segregation.' Nevertheless,since the PSAs are so very different, it is recommended that the schools are compared individuallyto their host district. Appendix J contains a table with the ethnic composition of all the charterschools in operation during the 1997/98 school year along with figures on the ethnic composition ofthe host districts. Here we can see a very mixed picture, with many PSAs enrolling more minor-itiesthan their host districts, as well as many PSAs enrolling fewer minorities than their host district.
Free or reduced lunches. The proportion of students in a given school that qualify for free orreduced lunches (FRL) provides an indicator of economic status of the families of enrolled students.The PSAs and their host districts were compared according to this figure. Unfortunately, data is onlyavailable for 41 of the 106 PSAs that were in operation last year. From the data obtained from MDEwe could not distinguish which schools had no students qualifying for free or reduced lunches dueto the fact that the school did not apply for this federally funded program or due to the fact that nostudents qualified. A number of the schools indicated that they had not applied for FRL since theyhad no hot lunch program or due to the fact that too much paperwork and administration wasrequired in order to apply for FRL.
Of the 41 PSAs that had data available, 18 had a lower proportion of students qualifying for FRLthan their host districts, and 23 had higher proportions of students qualifying for FRL than their hostdistricts. A school by school comparison of this is provided in Appendix K contains figures for thelast three school years.100
90
80
70
60a)2 50a)
0_ 40
30
20
10
0
1995/96 1996/97 1997/98 1998/99
Figure 2:3 Changes in the Ethnic Composition of PSAs Between 1995/96 and 1998/99.Note: The figures for 1998/99 are estimates, since official data on ethnicity have not yet been released.
4 It is important to note that a limitation with this method of comparison is that many PSAs attractstudents from districts outside of the one in which their school lies.
Evaluation of the Michigan PSA Initiative 17 The Evaluation Center, WMU
23EMU COIPT AWILA 1%;
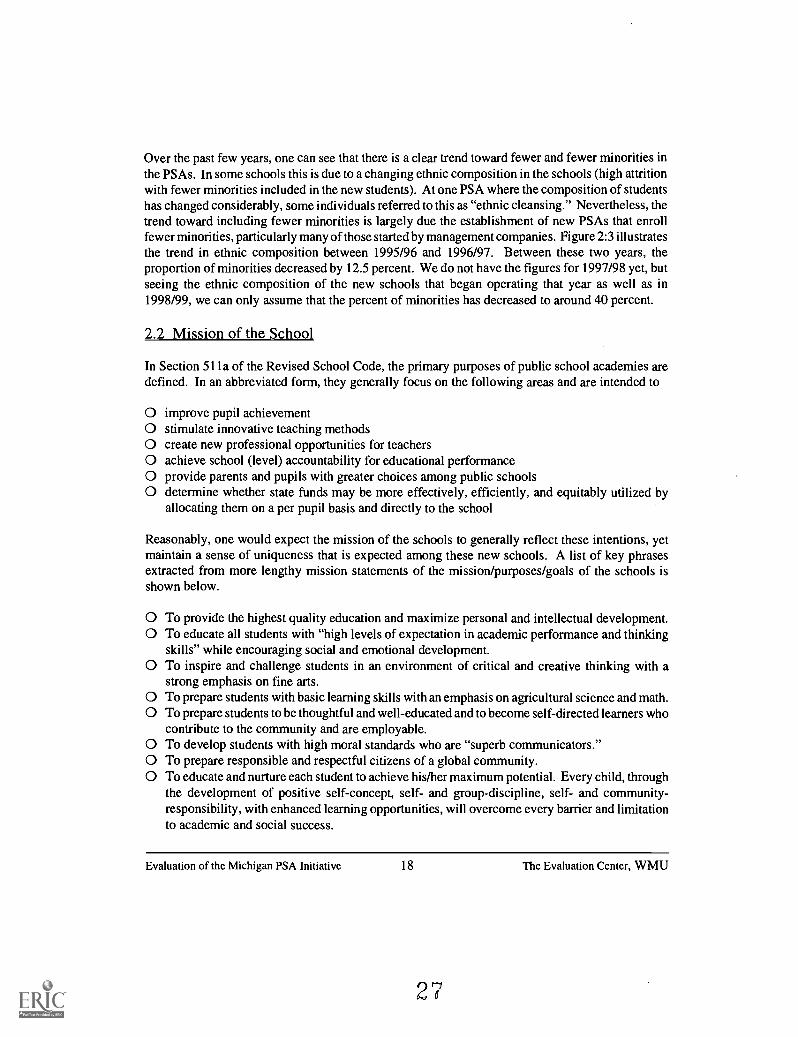
Over the past few years, one can see that there is a clear trend toward fewer and fewer minorities inthe PSAs. In some schools this is due to a changing ethnic composition in the schools (high attritionwith fewer minorities included in the new students). At one PSA where the composition of studentshas changed considerably, some individuals referred to this as "ethnic cleansing." Nevertheless, thetrend toward including fewer minorities is largely due the establishment of new PSAs that enrollfewer minorities, particularly many of those started by management companies. Figure 2:3 illustratesthe trend in ethnic composition between 1995/96 and 1996/97. Between these two years, theproportion of minorities decreased by 12.5 percent. We do not have the figures for 1997/98 yet, butseeing the ethnic composition of the new schools that began operating that year as well as in1998/99, we can only assume that the percent of minorities has decreased to around 40 percent.
2.2 Mission of the School
In Section 511a of the Revised School Code, the primary purposes of public school academies aredefined. In an abbreviated form, they generally focus on the following areas and are intended to
O improve pupil achievementO stimulate innovative teaching methodsO create new professional opportunities for teachersO achieve school (level) accountability for educational performanceO provide parents and pupils with greater choices among public schoolsO determine whether state funds may be more effectively, efficiently, and equitably utilized by
allocating them on a per pupil basis and directly to the school
Reasonably, one would expect the mission of the schools to generally reflect these intentions, yetmaintain a sense of uniqueness that is expected among these new schools. A list of key phrasesextracted from more lengthy mission statements of the mission/purposes/goals of the schools isshown below.
O To provide the highest quality education and maximize personal and intellectual development.O To educate all students with "high levels of expectation in academic performance and thinking
skills" while encouraging social and emotional development.O To inspire and challenge students in an environment of critical and creative thinking with a
strong emphasis on fine arts.O To prepare students with basic learning skills with an emphasis on agricultural science and math.O To prepare students to be thoughtful and well-educated and to become self-directed learners who
contribute to the community and are employable.O To develop students with high moral standards who are "superb communicators."O To prepare responsible and respectful citizens of a global community.O To educate and nurture each student to achieve his/her maximum potential. Every child, through
the development of positive self-concept, self- and group-discipline, self- and community-responsibility, with enhanced learning opportunities, will overcome every barrier and limitationto academic and social success.
Evaluation of the Michigan PSA Initiative 18 The Evaluation Center, WMU
O To equip all students with the necessary skills and experiences that will empower them to bepositive and productive citizens of a global community in the twenty-first century, while fosteringan understanding of, and an appreciation for, contributions of all people to our world.
O To provide an educational choice in XXX County that includes a comprehensive educationemphasizing arts, literature, service, learning, and individual academic programming usingtechnology and creative, flexible teaching strategies.
O To enable students to reach full potential and be contributing members of society.O To provide quality education within a multicultural environment.O To provide an enriched, caring environment that supports the natural and joyous learning process
where children, families, and educators will flourish as a community of learners.O [The XXXX Academy] is founded on the principles of academic excellence and strong character
development. The Academy will focus on academic excellence, character development,competence, conservative family values, citizenship principles, environmental awareness anddevelopment of lifelong skills.
O To provide a transitional education program for students with cognitive impairments and toprovide assistance for such student in developing a full range of skills for success in thecommunity and the workplace.
O To create a school that achieves quantum gains in students' academic performance and in thequality of their lives.
O To provide a values-driven, rigorous academic learning environment that challenges each studentto reach his/her full academic potential.
O To provide an education for young children based on their individual development needs andlearning styles and real life experienceswhere the constructive, interactive process of learningwill encourage growth, cooperation, and the joy of learning.
O To provide inner-city elementary children with a better prospect in life through education.O To provide a nurturing, individualized learning environment in which every child can grow and
excel personally and intellectually.O To provide an alternative environment for at-risk students.O To educate and nurture all students to achieve their maximum potential while developing future
world leaders.
Obviously, there is quite an array of mission statements. These statements are required in the PSAapplication process. The exact statement about the mission statement in CMU' s application materialsis as follows.
Mission and vision. Why is the school being formed? What is its philosophy and broadobjective? What will it accomplish? Why is the school needed?
In the main, these mission statements are much like those describing the mission statements of manytraditional public schools. In some instances, there are some unique emphases that may not bewidely used and/or carried out as the major theme for traditional public schools. Examples of thiswould be specific emphases on an African-American centered-approach, a targeted at-risk studentclientele, a fine arts theme, etc. Of importance is the fact that almost every mission statement focuseson the child (student). At the same time, there is little evidence that the major missions of these
Evaluation of the Michigan PSA Initiative 19 The Evaluation Center, WMU
28
schools include other critical elements of the purposes of PSAs as set forth in the legislation suchas teaching methods; more effective, efficient/equitable use of funds; greater accountability at thelocal school level; and/or the creation of new professional opportunities for teachers. While the lackof including these elements in the missions does not prevent their occurrence, there is some evidencethat the legislative purposes have been prioritized in practice.
2.3 Basis or Reasons for the School
Through on-site visits and interviews with key informants in PSAs, we have discovered a rather longlist of reasons why particular schools were developed. For the sake of brevity, we have simplyidentified representative reasons that are followed by a brief discussion of these findings.
O Dissatisfaction by a group of parents with the educational program being provided by the localschool district, which may include perceived failure to provide an acceptable level or quality ofspecial services, lack of emphasis or support for a particular student activity, larger than desiredclass size, failure to include certain languages or study areas within the curriculum, etc.
O Opportunity to obtain a more stable financial base for a private school by converting to a PSAwith state support
O Personal mission of one or more individuals to develop a school with a particular emphasis, e.g.,environment, agriculture, service learning component, etc.
O Opportunity to create a school that is perceived to be more safe, drug/crime free, etc.O (In concert with a local board to be created) Opportunity to create a financial profit by one or
more entities from the private sectorO Response to a group of parents who wish to send their children to a school that emphasizes
certain valuesO Response to/by a group of parents who wish to enforce certain disciplinary codes and regulations
for student behaviorsO Response to/by a group of parents or an organization that believes that the traditional public
schools are unable to educate their children
If the PSAs are created as a part of a free market environment, then one must assume that the schoolsthat have been successful in attracting students have attended to the desires of the parents of potentialstudents. However, we know that the PSAs are not equally available to all students for reasons ofgeographic location, availability of transportation, etc., and that some schools have been heavilymarketed. In essence, certain management companies and even individuals identify potential areasfor a charter school (public school academy) and conduct market surveys and campaigns to generateinterest. With an acceptable response, they facilitate the development of the nonprofit entity and theother requirements for the charter application. Whether or not this approach was envisioned by thedesigners of the legislation in Michigan is unknown to these evaluators. Likewise, we have noindication as to whether this is a desirable or undesirable outcome. Clearly, this approach is quitea departure from the rather small and tightly held PSAs that developed in some communities duringthe early period of this initiative.
Evaluation of the Michigan PSA Initiative 20 The Evaluation Center, WMU
23
It is probably appropriate to say that parents have chosen to send their children to PSAs for "good"reasons, i.e., the potential for a better learning environment for their children. Whether the foundersof PSAs have decided to create these schools for the purposes of the legislation is not nearly as easyto answer. Discussions with "for profit" management companies clearly indicate that they intend toturn a profit within a given time period and, while a charter can only be granted to a "nonprofitcorporation," it is clear that the impetus for these schools came from outside the community in manycases. Some persons with whom we have discussed the idea of profit taking from the operation ofPSAs reply that if it is not illegal, there should not be a problem. Others find it repugnant thatanyone or a company would be permitted to profit by withholding monies for their own use fromthose intended to be spent on the education of K-12 students in public schools.
In summary, there are many reasons why charter schools or PSAs have formed. Compared with thesmaller group of PSAs that The Evaluation Center included in its preliminary study in early 1998,there has been a dramatic shift to the utilization of management companies to provide contractualservices. In some cases, this is as little as financial accounting services, while in other cases itincludes contracting for almost total management of operations. The motives for developing theschools can be put into two categoriesone relates to a group with profit motives and the otherincludes a mix of reasons, i.e., desired focus of curriculum, dissatisfaction with the local publicschool, attractiveness of a stable base of resources for converted private schools, expectations of asafe school environment, etc. The latter group can only be described on a case-by-case basis.
2.4 Governance
The governance of public school academies (PSAs) is one of the most radical changes from thetraditional structure of public schools throughout the history of the United States. School boardselected by eligible residents of a school district have been the pattern to which we are accustomed.However, the legislation that provided for the creation of PSAs indicates that there must be agoverning board at the local level. The authorizing body is responsible for setting out the parametersfor the selection process, length of service, qualifications, etc. Generally, the authorizing bodies inMichigan ask the entity that is requesting a charter or contract to operate a PSA for a list of proposedmembers of the board of directors and a description of the qualifications and method for appointmentor election of members of the board of directors. Most often, the list is expected to include at leasttwo nominations for each available position on the board. In addition, a set of bylaws is submittedto the authorizing body; and these bylaws, after approval, serve to guide the action of the board ofdirectors. However, and as noted in Attorney General Opinion No. 6996, "The Michigan SupremeCourt held that 'public school academy board members are public officials and are subject to allapplicable laws pertaining to public officials.'" (Council of Organizations and others for Educationv Governor, 455 Mich 557, 585, 566 NW2d 208, 1997). Thus, the roles and responsibilities of boardmembers may be specifically defined for a particular school, but individuals and the board itself aresubject to state and federal laws and regulations applicable to any board of education of a publicschool, charter/public school academy, or otherwise. At the same time, PSA board members havethe same protection provided under the law for other public officials.
Evaluation of the Michigan PSA Initiative 21 The Evaluation Center, WMU
30
Most often, PSA boards of directors are officially appointed by the authorizer and not elected byparents or any other specified group of stakeholders or persons. Initially, the founding members ofmost PSAs identified or selected persons to serve as members of the board of directors. In somecases, there appears to have been an attempt to identify persons who represented particularstakeholders of the school, i.e, identifiable groups of parents, persons with a particular interest in theemphasis of the school, etc. In other cases, persons were selected or placed on the nomination listbecause of their particular area of expertise or position in the community, i.e., a member of the lawprofession, banker, city council member, accountant, educator, etc. Obviously, there are advantagesto each approach; and it is reported that considerable thought and discussion went into thenomination process. In a few cases, difficulties in getting persons to serve were reported. When thelist of nominees is submitted to the authorizing body for its actual appointment of the boardmembers, a number of factors are considered, including the recommendation of the PSA's primaryfounder or president/head of the nonprofit entity involved in the development of the proposal. Aswe examine the information requested by authorizers about nominees, it is clear that the process isbecoming more sophisticated; and demand for information is being expanded. For example, oneauthorizer has a structured, 6-page form for interested applicants. The applicant form includesquestions about relationships with the PSA, ethical issues, and inquiries/statements about a criminalbackground check, as well as more generally recognized qualifications, i.e., education, experience, etc.
The roles and responsibilities of the PSA board of directors are defined in the bylaws as approvedby the authorizing body. However, the primary responsibility appears to be the setting of policiesand establishing the operational procedures of the PSA. As an authorizer, Central MichiganUniversity (CMU) states on its Application for Appointment to the Board of a Public SchoolAcademy, that
The boards of these schools play a vital role in their future. Board members set policy,ensure the schools live up to their charters and help direct the ongoing vitality of the school,its staff and its children. They help ensure that the school remains focused on its vision.
In another CMU document (Application to Charter, September 1998), the following information isprovided under the "Governance and Management" section.
As the planning process unfolds, a governing authority must emerge. The development teambegins the governance process with decisions it makes in creating the school. Shortlythereafter, the Academy Board (likely to include development team members) formally takesover and plays a vital role in the school's future. As public officials, board members setpolicy, are responsible for compliance with the charter and applicable laws, and help guidethe ongoing vitality of the school, its staff and its students. The board's primary job is toensure adherence to the philosophy and mission of the school.
In the application itself, CMU asks responses to questions like the following.
0 What broad skills does each team member bring to the development effort?0 What specific experience, including budgeting, does the team have in planning, direction and
operating businesses?
Evaluation of the Michigan PSA Initiative 22 The Evaluation Center, WMU
31
O What relationships do the team members have to each other? To the management company, ifthe school will use one?
O Describe the role of the school board.O What role will the lead administrator have in relation to the board and the management company?
Also, boards approve contractual arrangements and are generally responsible for oversight of thefinancial affairs of the schools. In the early stages of a new school and during the period in whichthis study was completed, boards of directors played major roles in identifying and obtainingfinancial resources, selecting at least the major leadership personnel, engaging in the developmentof operational manuals, etc. In other words, they engaged in work more normally conducted by paidemployees of the school. Practically, many board members worked in relatively close concert withthe school's director and often served as spokespersons for the school in a variety of settings. Asa result, there appears to be considerable ownership of the school among board members, especiallythose who participated as a part of the founding group.
Schools initiated by management companies seem to have board members nominated on the basisof their positions/reputations in the community. Locally developed PSAs are more likely to havemembers who are closely related to the school and/or the founding group, i.e., parents, leaders of aconverted private school, etc.
When there is a need to replace a board member, procedures often call for the sitting board ofdirectors to select nominees. While this procedure may help ensure compatibility and other desirablecharacteristics, it also has the potential for "closing the door" to others with high interest andleadership responsibilities. In a practical sense, the founders of PSAs have considerable influenceon the composition of the boards and direction of the school. In some cases, conflicts arose betweenboards and founders when boards were reconstituted with members whose visions were differentfrom that of the founder, who may now be the director of the school, and who may have considerablefinancial investment in the school.
In our study, it was reported and confirmed that some boards found considerable difficulty inworking effectively as a group and/or with a designated school director or top administrator. In somecases, conflict rose to the point that divisive actions threatened the stability of the school. In othercases, open conflicts within the board and between the board and the school director were aired inthe media. As a result of these situations, personnel changes among the schools' staff and boardhave occurred, and the schools' reputations were damaged.
In some cases, we surmise that problems within or related to actions of boards of directors are relatedto the inexperience of members in this role, the urgency and critical nature of some of the immediateissues that had to be addressed, and the vested interests of some individuals in the schools' missions,financial futures, and the extent of idealism that pervades many of the schools.
The selection process of board members created some interesting situations that beg for anexplanation. For the most part, they are in regard to real or potential conflicts of interest. Amongthese situations are those in which one spouse holds a leadership position in the school and the other
Evaluation of the Michigan PSA Initiative 23 The Evaluation Center, WMU
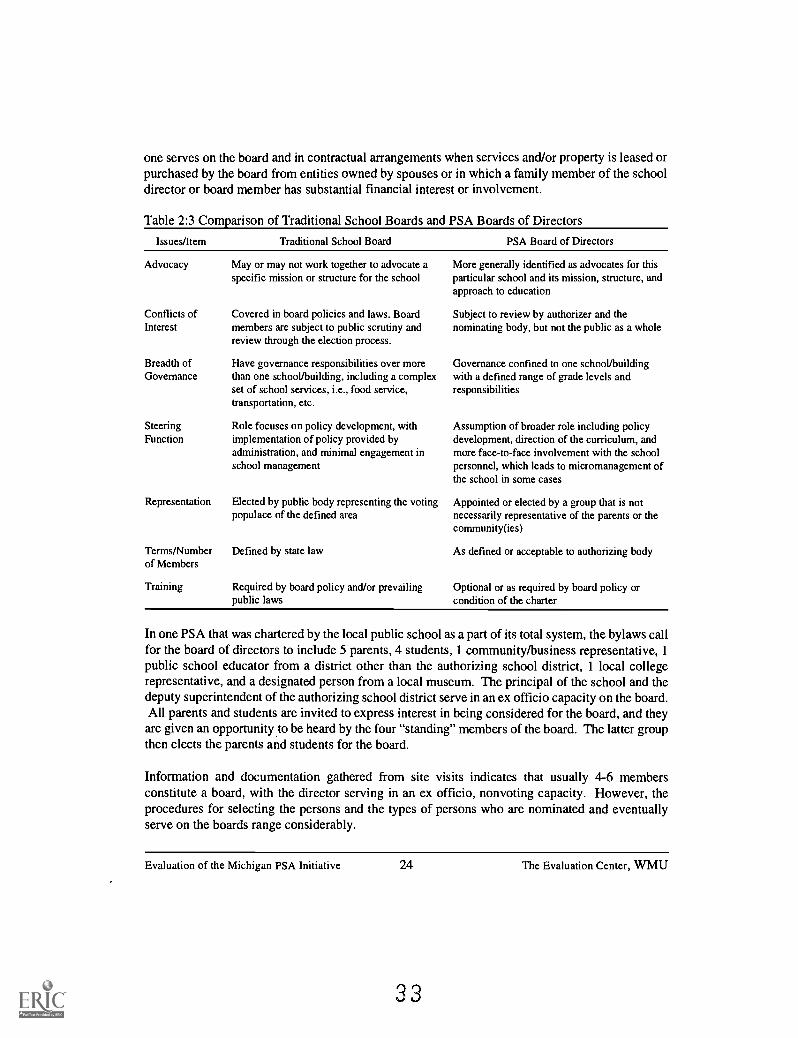
one serves on the board and in contractual arrangements when services and/or property is leased orpurchased by the board from entities owned by spouses or in which a family member of the schooldirector or board member has substantial financial interest or involvement.
Table 2:3 Comparison of Traditional School Boards and PSA Boards of Directors
Issues/Item Traditional School Board PSA Board of Directors
Advocacy May or may not work together to advocate aspecific mission or structure for the school
Conflicts of Covered in board policies and laws. BoardInterest members are subject to public scrutiny and
review through the election process.
Breadth of Have governance responsibilities over moreGovernance than one school/building, including a complex
set of school services, i.e., food service,transportation, etc.
SteeringFunction
Role focuses on policy development, withimplementation of policy provided byadministration, and minimal engagement inschool management
Representation Elected by public body representing the votingpopulace of the defined area
Terms/Number Defined by state lawof Members
Training Required by board policy and/or prevailing
More generally identified as advocates for thisparticular school and its mission, structure, andapproach to education
Subject to review by authorizer and thenominating body, but not the public as a whole
Governance confined to one school/buildingwith a defined range of grade levels andresponsibilities
Assumption of broader role including policydevelopment, direction of the curriculum, andmore face-to-face involvement with the schoolpersonnel, which leads to micromanagement ofthe school in some cases
Appointed or elected by a group that is notnecessarily representative of the parents or thecommunity(ies)
As defined or acceptable to authorizing body
Optional or as required by board policy orpublic laws condition of the charter
In one PSA that was chartered by the local public school as a part of its total system, the bylaws callfor the board of directors to include 5 parents, 4 students, 1 community/business representative, 1public school educator from a district other than the authorizing school district, 1 local collegerepresentative, and a designated person from a local museum. The principal of the school and thedeputy superintendent of the authorizing school district serve in an ex officio capacity on the board.All parents and students are invited to express interest in being considered for the board, and they
are given an opportunity to be heard by the four "standing" members of the board. The latter groupthen elects the parents and students for the board.
Information and documentation gathered from site visits indicates that usually 4-6 membersconstitute a board, with the director serving in an ex officio, nonvoting capacity. However, theprocedures for selecting the persons and the types of persons who are nominated and eventuallyserve on the boards range considerably.
Evaluation of the Michigan PSA Initiative 24 The Evaluation Center, WMU
33
While some might describe the governance of PSAs to be an evolving role, it is clear that PSAs areauthorized with the expectation that there will be a fully functioning governance structure, at thecenter of which is the board of directors or some similar body. While the selection/ appoint-mentprocess varies from the traditional school board member, the board members are considered to bepublic officials and are subject to the same regulations and laws as other public officials. However,some differences are summarized above.
Some descriptive information about individual PSA boards of directors is shown below.
The Board meets on the third Thursday of each month, in the 5-12 building at 7:00 p.m.Meetings are open to the public, and a time is set aside during each meeting for publiccomment. Directors are appointed by the Board of Trustees at Central Michigan University,from a list of nominees submitted by the sitting Board. At least two nominations are madefor each occurring vacancy. XXXX is a public school, and the XXXX' s finances are openlydiscussed at each Board meeting, along with the other business affairs of the XXXX.
The Board of Directors will be the policy making group for the XXXX Academy. Theprimary responsibility of the Board will be to assure that the long term goals of theorganization are met and that the Program Director meets the academic, legal, moral, andadministrative functions outlined in the academy agreement between Central MichiganUniversity and XXXX Academy. The Board is empowered to hire the Program Director, setlong-range goals for the organization and to hold the Program Director accountable for theday-to-day administrative and academic performance of the school. The Program Directorwill be responsible for hiring staff and holding them accountable for the educational goalsof the students.
Our school board members are the voices of our community and guide our school to establishProcedures and Policies which are in the best interest of our students. The guidelines theyset forth are for all children equally, so everyone has a sound and stable learning environmentwith which to gain knowledge.
The Board of Education members are a very vital part of the XXX Public School Academyin the operation of its educational system. There are seven board members appointed by theauthorizing agent, XXXX.
All Board of Education meetings are open to the public, and the public may request thatconcerns be addressed by the Board under new business. The regular Board of Educationmeetings are posted and published in the community newspaper. Special Board meetings orwork study sessions will be called according to need, with dates, times and locationsannounced according to Board policy.
(Notes from interview) The selected board members must be approved by the authorizingagency. Three members of the board must have served on other school boards. Currently,
Evaluation of the Michigan PSA Initiative 25 The Evaluation Center, WMU
3 4'
all board members hold membership in MASB. The board is just like regular school boards,i.e., it meets monthly, makes decisions, approves handbooks and finances, and hiresemployees. Board members from the (authorizing agency) are invited to attend (thisschool's) board meetings, which helps with communications.
(Section of contract between the PSA and a management company) Article IV Obligationsof the BoardA. Good Faith Obligation. The Board shall be responsible for its fiscal andacademic policy. The Board shall exercise good faith in considering the recommendationsof (the management company), including but not limited to, (the management company's)recommendations concerning policies, rules, regulations, procedures, curriculum, andbudgets, subject to constraints of law and requirements of the Contract with (the authorizingagent). The Board shall retain the authority, as provided in Section 1300 of the Code, tomake reasonable regulations relative to anything necessary for the proper establishment,maintenance, management, and carrying on of the Academy, including regulations relativeto the conduct of pupils while in attendance at the Academy or enroute to and from theAcademy. The Board shall further retain the obligation as provided in Section 1274 of theCode, to adopt written policies governing the procurement of supplies, materials, andequipment.
(Pertinent sections/excerpts from the contract between a PSA and the board of control of auniversity acting as authorizing agent.) Section 2.1. Method of Selection and Number ofMembers of the Board of Directors. The University Board has adopted the Resolutionproviding for the method of selection, length of term, number, qualification of members, theprocedure for removal of members and the names of the initial Academy Board.
The Academy shall act exclusively as a governmental agency.
Section 6.1. Governance Structure. The Academy shall be organized and administratedunder the direction of the Academy Board and pursuant to the governance structure as setforth in the Bylaws. The Academy's Board of Directors shall meet monthly unless anotherschedule is mutually agreed upon by the President of the Academy.
Compliance with Part 6A and Part B of code and other Laws (State School Aid Act, OpenMeetings Act, Freedom of Information Act, Public Employees Act, Non-discrimination,Other State Laws, and Federal Laws).
Section 2.4. University Board as Fiscal Agent of the Academy. The University Board is thefiscal agent for the Academy. The University Board shall promptly, within three (3) businessdays, forward to the Academy all state school aid funds or other public or private fundsreceived by the University Board for the benefit of the Academy. The University shall retainany amount owed to the University by the Academy pursuant to this Contract. For purposesof this section, the responsibilities of the University, the State of Michigan, and the Academyare set forth in the Fiscal Agent Agreement incorporated herein as Schedule 7.
Evaluation of the Michigan PSA Initiative 26 The Evaluation Center, WMU
35
We have not been able to fully investigate the role of management companies in the governance ofPSAs, other than what has been described. During the course of the current study, we have observeda dramatically increasing presence of management companies. This is an area that needs considerablestudy because of the range of services provided by management companies across the state andwithin a particular school. For example, some management companies provide a restricted list ofcontracted services, while others appear to be a dominant force in operating the school. It isimportant for decision makers to understand the real and potential impact these many arrangementshave on policy and operating procedures. Further, there is a need to better understand the extent towhich authorizing decisions are influenced by the makeup of the proposed board.
2.5 Curriculum
The areas within the curricula of the PSAs that occur most often are the traditional discipline areasof the respective levels of the schools. For example, elementary level schools indicate that theircurriculum includes language arts (reading, writing, listening, spelling, etc.), math, social studies,science, and physical education. Within each of the areas, one can identify some specific emphasesthat mark the unique approaches of some of the schools. Such unique areas are culturaldevelopment, attitude development, values and character education, problem solving, languages, andspecial areas of the arts.
At the secondary level PSAs, one generally finds the core subjects' plus an additional array of specialareas of study, e.g., computer technology; economics and business; food, agriculture, and naturalresources; visual and fine arts; the humanities; life management education; career explorations;career and employability skills; health care; international studies, etc. Of course, this is not to saythat all students are able to enroll in all or even a choice of these many unique, specialized subjects.Again, one must examine the curriculum on a school-by-school basis.
Since most of the schools began as newly founded schools (as opposed to a conversion), thecurriculum is still evolving. Teachers have spent many hours engaged in selecting, adapting, anddeveloping curriculum. In many cases, this work had to be done during the summer and at othertimes in which they were not employed by the PSA. In other PSAs, a prepackaged curriculum witha particular emphasis and a prescribed teaching methodology has been implemented. In thoseschools operated by an outside management company, it is common to find a prescribed curriculumidentified and developed/approved by a committee as a condition of the contract with the localnonprofit entity.
In the parent survey, 75.1 percent of the respondents agreed or strongly agreed with the statement"I am satisfied with the school's curriculum" in the school in which his/her child attended. To thissame question, only 9.6 percent strongly disagreed or disagreed. Among the 1,880 students whowere surveyed, 54.3 percent of the respondents agreed or strongly agreed with the statement "I wish
5 Neither the State Board of Education nor the state Legislature mandated a core curriculum forMichigan. However, a core curriculum has been recommended as a framework for all public schools to use.
Evaluation of the Michigan PSA Initiative 27 The Evaluation Center, WMU
there were more courses I could choose from." Yet almost half (41 percent) of the 723 surveyedteachers were unsure, dissatisfied or very dissatisfied with the school's curriculum. As is true withmost of the cases, it is difficult to generalize across the schools; much more meaning can be derivedfrom a case-by-case examination of each school. In interviews with teachers, we heard commentsabout the curriculum that ranged from excitement and enthusiasm about the freedom they had tochoose/develop what they perceived as an appropriate curriculum for their students, to total disgustand resentment about the heavy-handed control of a prescriptive curriculum by the director, board,or others in an authority position, to a confession of almost hopelessness in trying to teach all dayand somehow develop curriculum and teaching materials at night.
It is important to understand that the schools are encouraged to identify unique missions, but at thesame time their students and the schools will be held accountable for achievement in recognizedareas of study and as reflected in the statewide testing program (MEAP). Thus, each school mustbe concerned about the curriculum to ensure that the school provides students with the opportunityto study and learn and develop the skills for which they will be held individually and collectivelyaccountable.
Decision making about the school curriculum. In each of the schools we visited, we made aneffort to inquire about the decision making process surrounding the curriculum. Decisions aboutcurriculum in the PSAs is often determined by the principal. If this is not a school established bya management company, the principal is usually one of the founders. In those school established bya management company, particular Type 5 EMOs (Section 5.5, which deals with managementcompanies, explains this more clearly), nearly all aspects of the curriculum are pre-determined bythe management company. Some of the schools reported that the teachers' input is included in thecurriculum decision-making process and a few schools reported that parents' input is included in aformal manner.
In some cases, the principals reported having control over the decision making of the curriculum;however, provisions were made for the teachers to adapt and coordinate their efforts concerning thecurriculum. In a few schools, principals reported that the curriculum was decided by the board ofdirectors with input from other stakeholders. One principal commented that he developed andimplemented the curriculum with suggestions offered by the teachers and parents. Some of theschools also noted using the Michigan Department of Education core curriculum as a set of minimumstandards to which the teachers are able to adapt their teaching styles.
0 The principal of one school said that there was a lot more teacher input into school decisionmaking than you would find in a traditional school. He said "this is real site-based management."He said that consensus is the goal, and that reaching this can often be time-consuming. Thereis some minimal parental input into curriculum decision-making. He said that so far they havenot really worked out a satisfactory way to make good use of parental input. One parent sits inon the curriculum meetings when she can. She is also on the school board. Twice a year, theschool asks parents for suggestions on how to improve the school program.
Evaluation of the Michigan PSA Initiative 28 The Evaluation Center, WMU
3 7
O After one site visit, a field researchers wrote the following comments about one school: "Thereare several mechanisms allowing for parental and teacher input into school decision-making. Itreally seems like the principal runs the school, and it is clear that she is in charge of most thatgoes on. Even on something as basic as administration of the parent and teacher surveys, theprincipal wanted to keep control."
O "The basic structure of the curriculum in our school was set by the first principal. Teachers nowhave the opportunity to interpret the curriculum guidelines and translate them into lesson plans."
O "The curriculum is decided by the board, with input from the principal. There is a schoolmanagement team that makes suggestions for school improvement .. .. But clearly there is somedissension in this school between the board and the teachers." An opinion piece in a local paperwritten by one of the teachers at this school was extremely critical of the practices in the school:"[u]nfortunately, there is no shared vision, there is only the board's vision. It does not ask orgive credence to the opinions of the faculty. Decisions are made about duties, class load, payscale, calendar and benefits without input or regard for professional educators in its employ. Theteachers aren't even public school employees anymore."
O According to a board member at one urban school, the curriculum was controlled by theprincipal. "But she believes that she is doing what parents want. The principal has some fairlydistinctive views about how the school should be run and what should be taught. This has causedsome conflicts." The board member said that "they are now seeing a lot of teachers coming outof college who are not prepared for this situation . . . there seems to be something lacking in theteachers colleges. [The principal] likes to see lesson plans for each student as opposed to eachclass. . . . There have also been tensions in the school between the certified teachers and thenoncertified teachers. The noncertified teachers have been around for a long time." [Noncertifiedteachers are presumably working as classroom assistants and/or pre-K instructors.]
O The principal at another school said that teachers would bring their ideas to the board, and theboard would think them over. The principal at this school appeared not to be well informed abouteducational issues. The situation at the school has, reportedly, evolved over time. The schoolprincipal said that there had been some problems with parents being on the board and wantingto "run the place." Clearly, one board member who is now a teacher has played a huge role inthe establishment and the vision of the school. The management company appears committedto letting the people in the school continue to have input and make the major decisions about thedirection of the school. So there appears to be potential for teachers and parents to make adifference.
O "Broad strategies for the school are set primarily by me [the principal]. But there is much roomfor teachers to reach their own understandings of how to turn that curriculum into the practiceof teaching."
O The principal at one school decided to work with the Michigan Department of Educationcurriculum benchmarks. Teachers are free to decide what to do from there as long as they staywithin the school vision.
Evaluation of the Michigan PSA Initiative 29 The Evaluation Center, WMU
O One school principal said that the management company handles the curriculum. Further, "theschool is bound by its charter to adhere to particular math and reading programs. Deviationwould have to be approved both by the school board and by the authorizing agency."
O The school handbook contains several curriculum mission statements. The principal said thatshe made sure that the teachers cover the material contained in the Michigan Department ofEducation curriculum guidelines. These benchmarks were seen as a minimum standard uponwhich to build.
2.6 Quality of Instruction
In the surveys of students, teachers get generally high marks on items related to the quality ofinstruction. A summary list of some of these survey items and the percentage of students who agreedor strongly agreed with each item is found below.
O I am learning more here than at the previous school (64.3 percent).O I thought the teachers at this school would be better (51.1 percent).O My grades are determined by tests (28.4 percent).O My teachers encourage me to think about my future (58 percent).O If the teacher left the room, most students would continue to work on their assignments (37.6
percent).O Almost every assignment that I turn in to the teacher is returned with corrections and suggestions
for improvement (50.2 percent).O My teacher is available to talk about academic matters (72.2 percent).O We work in groups most of the time (30.2 percent).O At this school, a mistake is understood as a learning experience (59.6 percent).
Among the survey parents, 69.1 percent agreed or strongly agreed that they "were satisfied with theinstruction," and 71.8 percent agreed or strongly agreed that "Teachers are challenged to beeffective."
While we have no comparison with other public schools or for these students or parents fromprevious experiences, we recognize the ratings of elements related to instruction by students andteachers as quite high. On-site observations and interviews with students, teachers, and parentsconfirm this general indication. However, like any school, the range of satisfaction varies fromschool to school and from teacher to teacher. We learned of some resignations and dismissals ofteachers that were reportedly related to ineffective instruction. At the same time, queries and reviewsof documents indicate that there are generally very weak personnel (teacher) evaluation proceduresin place in most schools.
Evaluation of the Michigan PSA Initiative 30 The Evaluation Center, WMU
33
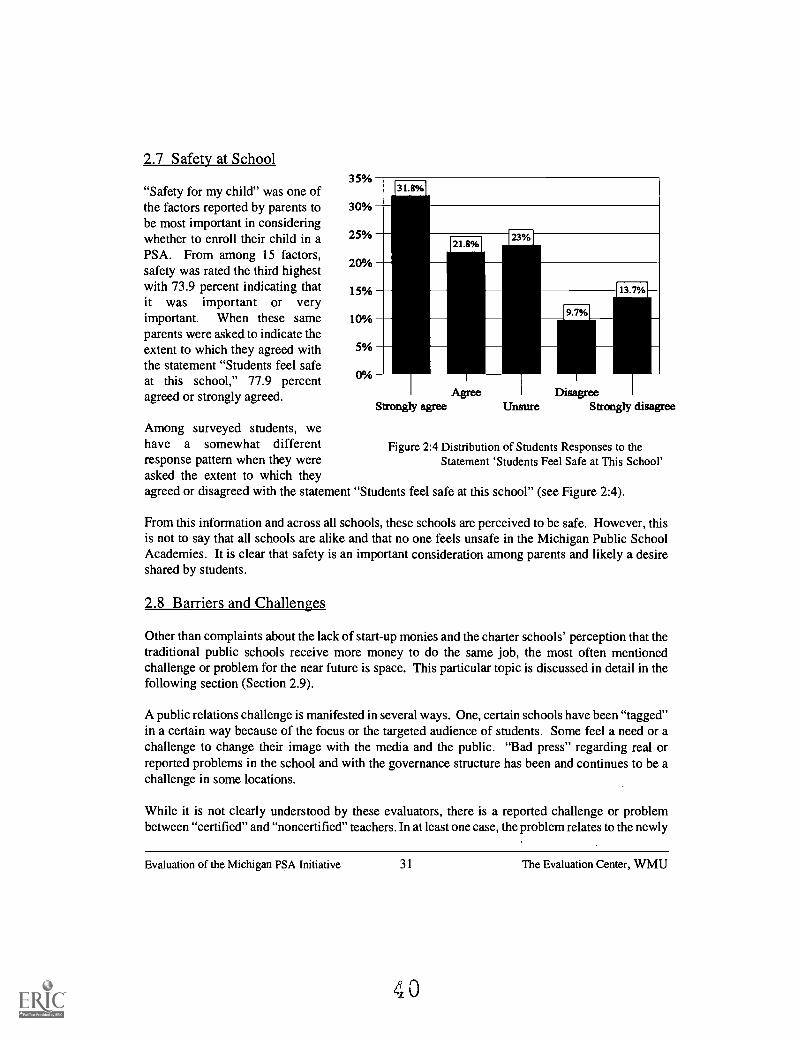
2.7 Safety at School
"Safety for my child" was one ofthe factors reported by parents tobe most important in consideringwhether to enroll their child in aPSA. From among 15 factors,safety was rated the third highestwith 73.9 percent indicating thatit was important or veryimportant. When these sameparents were asked to indicate theextent to which they agreed withthe statement "Students feel safeat this school," 77.9 percentagreed or strongly agreed.
Among surveyed students, wehave a somewhat differentresponse pattern when they wereasked the extent to which theyagreed or disagreed with the statement "Students feel safe at this school" (see Figure 2:4).
35%
30%
25%
20%
15%
10%
5%
0%
23%
Agree DisagreeStrongly agree Unsure Strongly disagree
Figure 2:4 Distribution of Students Responses to theStatement 'Students Feel Safe at This School'
From this information and across all schools, these schools are perceived to be safe. However, thisis not to say that all schools are alike and that no one feels unsafe in the Michigan Public SchoolAcademies. It is clear that safety is an important consideration among parents and likely a desireshared by students.
2.8 Barriers and Challenges
Other than complaints about the lack of start-up monies and the charter schools' perception that thetraditional public schools receive more money to do the same job, the most often mentionedchallenge or problem for the near future is space. This particular topic is discussed in detail in thefollowing section (Section 2.9).
A public relations challenge is manifested in several ways. One, certain schools have been "tagged"in a certain way because of the focus or the targeted audience of students. Some feel a need or achallenge to change their image with the media and the public. "Bad press" regarding real orreported problems in the school and with the governance structure has been and continues to be achallenge in some locations.
While it is not clearly understood by these evaluators, there is a reported challenge or problembetween "certified" and "noncertified" teachers. In at least one case, the problem relates to the newly
Evaluation of the Michigan PSA Initiative 31 The Evaluation Center, WMU
40
certified teachers with recent degrees and a sense of idealism that clashes with the "noncertifiedpersonnel who have gained their knowledge through practice." Since all teachers, with certainspecified exceptions, are required to be certified to teach in Michigan, we are not sure how tointerpret this reported challenge unless it pertains to volunteers, aides, and noncertifiedadministrative personnel.
While addressed in a number of ways, a general challenge across almost all schools relates to whatis often referred to as the "bureaucracy." From information received in many interviews, we thinkthese concerns relate to an overload of information that is sent by the MDE (see Section 5.2), theinexperience and lack of formal preparation of many PSA administrators, and lack of efficientdatabases and qualified staff to respond to the large array of requests for information and completedreports. Other views of the bureaucracy relate to incidences of micromangement by boards orindividuals on the boards and the arrangements made with management companies. However, thereis evidence that concerns about the bureaucracy is not as apparent in externally managed schools,which would be an expected result.
Over time, we see a substantial challenge in retaining and attracting quality teaching personnel. Asdiscussed elsewhere in this report, PSA teachers are currently paid far less than the teachers in thelocal public school district in which the PSA is located, and there are few plans that will providesufficient financial incentives for teachers to remain employees of most charter schools. The endresult of the present situation will be a continuous turnover of teachers, which will not be conduciveto the continuity of the school or quality of the services provided to students. We fear that the profitmotive may dictate the types of teachers who are employed as opposed to the quality of theinstruction. Granted, there are sporadic efforts to reward productivity with bonuses, which mightevolve to a performance-based salary structure. From observations at meetings of PSAadministrative personnel, there is outward evidence of considerable concern about unionization andhow that might impact the schools. In fact, programs have been presented at professional meetingsthat provide information as to how to recognize and prevent personnel from forming unions withinschools. We are not suggesting that unionization will improve or not improve the quality of teachers,but it would be naive to think that continuing low salaries will not be an issue related to futureconsiderations in contracts and union discussions.
While we have not collected quantifiable information, indications are that many schools did notexpect the number and variety of students with diagnosed special needs who enrolled or soughtenrollment. We find that not only did many of the schools not expect these considerable needs, theyhave found considerable difficulty in responding. At the national level, it is reported that manycharter schools are "counseling out" students with disabilities and thus avoiding a considerableoutlay of resources. We have not conducted any in-depth investigation of this issue in Michigan, butit is certainly worthy of further study, both in terms of whether enrolled students are receiving theservices they need and for which they are legally eligible and whether there is an unacceptableselection mechanism operating in practice. However, it is only fair to say that it is also reported tous that in some cases the local public schools counsel/advise students with certain problems or thoseof a particular type to seek admission in a PSA. At the same time, we have to recognize that parents
Evaluation of the Michigan PSA Initiative 32 The Evaluation Center, WMU
41
chose to move their children from the local public school to the PSA for a reason, and some formof dissatisfaction may have been the overpowering factor in this decision.
One final area in which schools are especially challenged is the need to demonstrate school success,especially student achievement. This is almost universally found to be a challenge, if not a majorproblem. This topic will be discussed in Chapter 7.
In summary, each school has its own challenges. Some are more critical than others; but generally,we see the major challenges to be resources/space, accountability to the public, and the need todemonstrate effectiveness. While this may be a short list, the magnitude and seriousness of thesefor the individual schools and the initiative cannot be overemphasized.
Will the lack of affordable buildings be a significant obstacle to the charter school movement?While the need for better and/or additional space varies from school to school, it is evident that thereare important decisions to be made in the very near future. The decisions fall within the purview ofthe authorizers, state government, and the schools themselves. Some schools have leased facilitiesfor a short time, such as 2-3 years, and these leases will expire before the conclusion of the charter.Affordable facilities that met local and state codes were difficult to find and not very suitable forinstruction or for meeting the needs of the students, parents, and school staff. The rush to identifya location and start the school was apparently a higher priority than the acquisition of long-term,functional facilities for a school as authorized. Because many of the schools have waiting lists ofstudents and have plans to increase enrollments and to add grade levels, they also identify space asa challenge and barrier to fulfilling their current plans. Decisions with regard to enrollment growth,indebtedness, school location, chartering restrictions, etc. are all related to the space issues that arereported as challenges
When we talk with charter school leaders, they indicate that there is significant space available inmost communities; but there are obstacles to overcome before this space can be utilized. Amongthese considerations are zoning codes, remodeling to accommodate the handicapped and specializedinstructional needs, lack of adequate and safe playgrounds and parking lots, willingness of the ownerto lease the property for a school or to make the necessary modifications, potential for negativeexternal influence (drugs and crime), and objections by neighboring businesses or private citizens.Many schools obtained short-term leases for buildings and almost immediately had to begin lookingfor different or additional space. Several schools leased portable classrooms for immediate use andavailability; but most schools consider portable classrooms as only a temporary, short-term solution.
In several instances, loans were obtained by the founders, or nonprofit corporations of the schoolsor management companies built and leased back new facilities for the PSAs. These buildings aregenerally attractive and functional for the purpose for which they were intended. While they areattractive and of a style that is acceptable by neighbors, they are of relatively low-cost constructionand designed to be more easily modified, enlarged, or expanded. These buildings are being built forabout a 20-year lifetime, as opposed to a much longer period for most traditional schools built byschool boards.
Evaluation of the Michigan PSA Initiative 33 The Evaluation Center, WMU
4 2
It was reported that the building for a K-5 enrollment of about 300 students was built in 95 days at"half the cost of the equivalent sized traditional public school." This building was described by oneobserver as "having no frills, but it is carpeted and air-conditioned."
Another school with an enrollment of about 500 students in grades 6-12 pays $600,000 per year forrent. This amounts to approximately 20 percent of its base allocation of $5,700 per student. Inother terms, the amount of this rent is approximately equivalent to the salary and fringe benefits for16 teachers based on a salary of $30,000 and fringe benefits of $7,500 (25 percent of the salary).
The lack of available and affordable buildings could be a detriment to the goal of free choice andequal access in some locations. For example, a potential founder of a charter school might identifya target group of students or parents; but if affordable and usable facilities are not available in thatarea, either the school may not develop or it will be established in an area that is unacceptable forthe target audience. There is already some evidence that charter schools may be responding as muchto the market or profit potential as they are for the educational needs of a particular area. Inpotentially high market areas, several for-profit management companies vie for students with highgeared marketing campaigns, while areas with less potential are left without any type of school ofchoice. Of course, one could argue that any student could apply to a charter school, but convenienceand distance to the school are influential or even essential considerations for some and they reallycan't exercise a choice.
In some of the more rural areas that are common to the region where The Evaluation Center's studywas directed, there may simply not be usable facilities. Some founders have reported spendingmonths searching for facilities with mixed success. Again, transportation and distance to the schoolare important considerations.
2.9 Financial Status of the Schools
The PSAs are very "loud" in expressing their need for more resources. Of greatest concern is theneed for start up funds. In terms of resources, the greatest disparities among PSAs is clearly visiblein the facilities they have for instruction. While the majority of PSAs do not have a permanent sitefor their school, some are still struggling after a few years of operation to secure a permanentbuilding site for renovation or a new building. Of course, for many of the schools in this situation,the problem is not one of finding an available site; rather, it is a problem of securing sufficientresources with which to renovate or build. The schools started by management companies havesufficient capital to secure a building. The private school conversions retain their facilities fromwhen they were a private school, and the public school conversions (alternative high schools)typically can rent the facilities they used previously or else they can secure a facility through the localschool district with which they usually have good relations.
Grants. Figures from the Michigan Department of Education indicate that the PSAs typicallyreceived between $20,000 and $40,000 for the 1997/98school year from the Michigan Charter
Evaluation of the Michigan PSA Initiative 34 The Evaluation Center, WMU
43
School Grant Program (these grants are from federal funds intended to help charter schools withstart-up costs).
In addition to the Michigan Charter School Grant, most schools were awarded two or more othergrants. Nevertheless, the schools vary considerably in terms of qualifying and applying for andsecuring grants. While one school was able to secure as much as $570,000 in a single year, mostschools receive between $40,000 and $100,000 in a single year from external grant. Examples ofthese grants are listed below:
O Goals 2000 grantsO Title IO Title VI innovative educational program strategiesO Drug Free Formula grantsO Technology literacy grantsO Eisenhower formula grants
Foundation grants. In terms of the foundation grants,' the PSAs are to receive the same perstudent allocations as does the host district in which their school lies, or a maximum of $5962 duringthe 1997/98 school year. During the 1997/98 school year the average per pupil foundation grant forthe whole state was $6,061. In more than half of the schools, the foundation grant is the same as forthe host districts. In 37 PSAs, the host district received additional funds that exceeded $100 perpupil, and in 21 cases the additional per pupil foundation grant exceeded $500. In a few cases, thehost districts had such high foundation grants that they ended up receiving as much as $2,000 to$3,000 more per student than did the local PSA. These cases typically occurred in the Detroit areawhere foundation grants range from $6,000 - $9,900. In Appendix L thelist of foundation grantsfor the PSAs and their host districts is included. From this table, a case-by-case comparison can bemade for each of the 106 PSAs that were in operation during the 1997/98 school year.
Revenues. In terms of total revenues for the 1996/97 school year,' we find 15 of the 73 PSAshad more resources per pupil than did their host district. For most PSAs, however, the additionalfunding that host districts had available per pupil (based solely on the foundation grant) remainedlarger or actually increased. During the 1996/97 school year the average state per pupil revenue was$7,050.
Interestingly, the two PSAs in Michigan's Upper Peninsula which are operated by Native AmericanIndian groups, had substantially more total revenues than did their host districts. In fact, their total
6 Foundation grant refers to the combination of state and local monies that each school district isallocated per pupil under Article 9, Section II of the Michigan Constitution.
7 Total revenues per pupil refers to the total amount of funds per pupil received by the school for usein general and school food operations. Although we were able to secure data on foundation grants for theprevious school year, we were dependent on using 1996/97 data on revenues and expenditures. This isbecause 1997/98 data on revenues and expenditures were not yet officially available and were subject to change.
Evaluation of the Michigan PSA Initiative 35 The Evaluation Center, WMU
n 4
revenues, which were $13,239 and $14,146, were more than double the per pupil revenues in theirhost district and ranked highest in the state. These schools, which have multiple sources of regularfunding from the state and federal governments, have been effective in securing external grants.When a director of one of the Native American Indian schools was asked to comment on the extremeadvantages in terms of resources that their school had, the director said that "when we weredependent on BIA funds and had less resources than the public schools, we didn't hear anyonecomplain that we were receiving too little money, so why should anyone complain now when wehave more?"
Expenditures. In terms of expenditures' in 1996/97, seven of the 73 PSAs were spending moreper pupil than their host districts. On the average, the host districts were spending between $900 and$1,800 more per pupil than the PSAs located within their district. Obvious differences in spendingwould be the costs of transportation, which many PSAs do not provide, as well as the largedifference in teacher's salaries. Appendix L contains the data on revenues and expenditures for eachPSA as well as their host districts. For the 1996/97 school year, the average state per pupilexpenditure was $6,507.
According to the findings of a study conducted by an employee in the House Fiscal Agency (Prince,1998) the PSAs reported spending a higher proportion of funds on support services than didcomparable districts. They also spend more on administrative activities. Over time, there alsoappears to be a trend toward reduced spending on general administration and school administration,but increased spending by the business office. This is likely to be due to the increased involvementof management companies.
Average Teacher Salaries.9 Disparities in salary between the PSAs and host districts areextremely large. A number of PSAs have teachers' salaries as large as their host district, and in atleast two cases, the average salaries of PSA teachers are one-third the size of average salaries ofteachers in their host district. The teachers in five PSAs had average salaries that were $30,000 ormore lower than their counterparts in the host districts. Table 2:4, as well as Appendix M, includesschool-by-school data on the average salaries of teachers in PSAs and in their host districts.
The salary levels vary widely around the state and tend to be higher in metropolitan areas and lowerin rural areas. The PSAs clearly have lower salaries. Even for starting salaries of beginning teacherswith comparable training, the PSAs reported that they pay 10-20 percent less than their host district.There are a number of factors that can explainin partthe large differences between the PSAs and
8 Expenditures per pupil refers to the costs for basic programs, salaries, and other support andadministrative services. District figures include districtwide activities such as instruction, transportation,operations and maintenance, as well as food service operations reported in a district's school service fund.
9 Average teacher salary refers to classroom teachers' average salaries. It is computed by dividingthe total basic classroom teacher salaries reported by the school by the total number of basic classroomteachers (FTEs) reported by the school. This number does not reflect employee benefits.
Evaluation of the Michigan PSA Initiative 36 The Evaluation Center, WMU
45
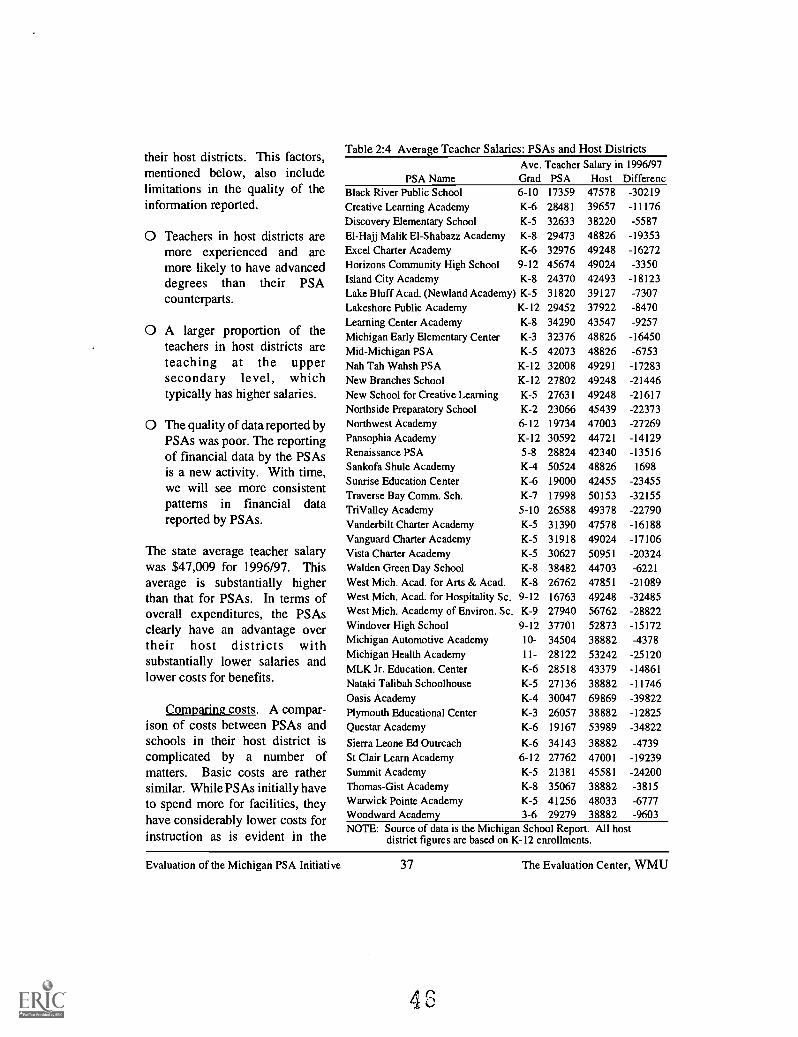
their host districts. This factors,mentioned below, also includelimitations in the quality of theinformation reported.
O Teachers in host districts aremore experienced and aremore likely to have advanceddegrees than their PSAcounterparts.
O A larger proportion of theteachers in host districts areteaching at the uppersecondary level, whichtypically has higher salaries.
O The quality of data reported byPSAs was poor. The reportingof financial data by the PSAsis a new activity. With time,we will see more consistentpatterns in financial datareported by PSAs.
The state average teacher salarywas $47,009 for 1996/97. Thisaverage is substantially higherthan that for PSAs. In terms ofoverall expenditures, the PSAsclearly have an advantage overtheir host districts withsubstantially lower salaries andlower costs for benefits.
Comparing costs. A compar-ison of costs between PSAs andschools in their host district iscomplicated by a number ofmatters. Basic costs are rathersimilar. While PSAs initially haveto spend more for facilities, theyhave considerably lower costs forinstruction as is evident in the
Table 2:4 Average Teacher Salaries: PSAs and Host DistrictsAve. Teacher Salary in 1996/97
PSA Name Grad PSA Host DifferencBlack River Public School 6-10 17359 47578 -30219Creative Learning Academy K-6 28481 39657 -11176Discovery Elementary School K-5 32633 38220 -5587El-Hajj Malik EI-Shabazz Academy K-8 29473 48826 -19353Excel Charter Academy K-6 32976 49248 -16272Horizons Community High School 9-12 45674 49024 -3350Island City Academy K-8 24370 42493 -18123Lake Bluff Acad. (Newland Academy) K-5 31820 39127 -7307Lakeshore Public Academy K-12 29452 37922 -8470Learning Center Academy K-8 34290 43547 -9257Michigan Early Elementary Center K-3 32376 48826 -16450Mid-Michigan PSA K-5 42073 48826 -6753Nah Tah Wahsh PSA K-12 32008 49291 -17283New Branches School K-12 27802 49248 -21446New School for Creative Learning K-5 27631 49248 -21617Northside Preparatory School K-2 23066 45439 -22373Northwest Academy 6-12 19734 47003 -27269Pansophia Academy K-12 30592 44721 -14129Renaissance PSA 5-8 28824 42340 -13516Sankofa Shule Academy K-4 50524 48826 1698
Sunrise Education Center K-6 19000 42455 -23455Traverse Bay Comm. Sch. K-7 17998 50153 -32155TriValley Academy 5-10 26588 49378 -22790Vanderbilt Charter Academy K-5 31390 47578 -16188Vanguard Charter Academy K-5 31918 49024 -17106Vista Charter Academy K-5 30627 50951 -20324Walden Green Day School K-8 38482 44703 -6221West Mich. Acad. for Arts & Acad. K-8 26762 47851 -21089West Mich. Acad. for Hospitality Sc. 9-12 16763 49248 -32485West Mich. Academy of Environ. Sc. K-9 27940 56762 -28822Windover High SchoolMichigan Automotive AcademyMichigan Health AcademyMLK Jr. Education. CenterNataki Talibah SchoolhouseOasis AcademyPlymouth Educational CenterQuestar Academy
Sierra Leone Ed OutreachSt Clair Learn AcademySummit AcademyThomas-Gist AcademyWarwick Pointe AcademyWoodward AcademyNOTE: Source of data is the Michigan School Report. All host
district figures are based on K-12 enrollments.
9-1210-
11-
K-6K-5
K-4K-3
K-6
K-66-12K-5
K-8
K-53-6
3770134504281222851827136300472605719167
341432776221381350674125629279
5287338882532424337938882698693888253989
388824700145581388824803338882
-15172-4378-25120-14861-11746-39822-12825-34822
-4739-19239-24200-3815-6777-9603
Evaluation of the Michigan PSA Initiative 37 The Evaluation Center, WMU
comparison of salaries. While the traditional public schools have to devote a portion of their stateaid for such things as transportation, meals, and other support services, this is optional for PSAs.Most PSAs provide instruction at only the elementary level, which is considerably less expensivethen the secondary level. The traditional public schools are obligated to provide instruction for allstudents.
In terms of economic planning, the PSAs have an advantage in that they can accept only as manystudents as economically planned for while the presence of PSAs poses problems in planning for thetraditional public schools since it is more difficult to plan for a specific number of students.
Particular areas where there is a lack of knowledge and information to make comparisons includethe costs for such things as start-up and facilities. Likewise, it is difficult to determine the value ofin-kind services. Both traditional public schools and PSAs claim that the "playing field is not level."Further research into this area would be helpful in determining measures to distribute resourcesfairly.
Evaluation of the Michigan PSA Initiative 38 The Evaluation Center, WMU
47
Chapter ThreeTeachers and Staff
3.1 Description of Sampled Teachers and Staff
For the purpose of our evaluation, we defined the teachers and staff to be surveyed as those workingmore than-half time in the classroom or in the administration of the school. There were 728 teachersand staff sampled. While official statistics for the number of teachers and staff working more thanhalf time at the schools do not exist, figures provided by the schools indicate that the targetpopulation was 812 teachers and staff. That makes the total response rate for teachers and staff onthe charter school survey to be 89.7 percent. This response rate was deemed to be quite satisfactory.The item response for each question in the survey was typically 96 percent or higher. The responserate for each item in the survey can be found in Appendices D - I.
There were three schoolsall from Lansingwith rather low response rates. One school, MichiganEarly Elementary Center, was sufficiently low (i.e., 44.4 percent) that we considered removing itfrom the analysis. Nevertheless, since the school was so small and four out of nine staff answeredthe survey we decided not to remove it since it would have little or no impact on the total figures forthe state. The other two schools with lower than desired response rates were Mid-MichiganAcademy with 57.1 percent and Walter French Academy with 57.9 percent, respectively.
The surveys from each school were weighted according to their proportion of the target sample ofteachers and staff. Calculations for total samples of schools reflect weighted data. The achieved andtargeted sample of teachers and the weighting formula and individual school weights applied toteacher and staff data are found in Appendix A.
Among the 728 teachers and staff sampled, 69.3 percent indicated that they are teachers, 12.4 percentteaching assistants, and 7.3 percent specialists. There were no student teachers in the schools duringdata collection. Just under 4 percent indicated that they were principals or school directors, andnearly 20 percent indicated that they had some other title or position. Many of the teachers and staffhave more than one role. The information for those individuals who indicated more than one rolewas classified together with those who did not indicate any role. There were 18 individuals who hadmissing data, many because they indicated more than one role.
Of the 488 staff who indicated they are teachers, 92 percent reported that they are currently certifiedl°to teach in the state, 2 percent were certified in another state, 3.9 percent indicated that were workingto obtain certification, and 2 percent indicated that they were not certified and were not working to
m All classroom teachers must be certified just as they are at other public schools, except as allowedby laws, rules, or regulations.
Evaluation of the Michigan PSA Initiative 39 The Evaluation Center, WMU
4
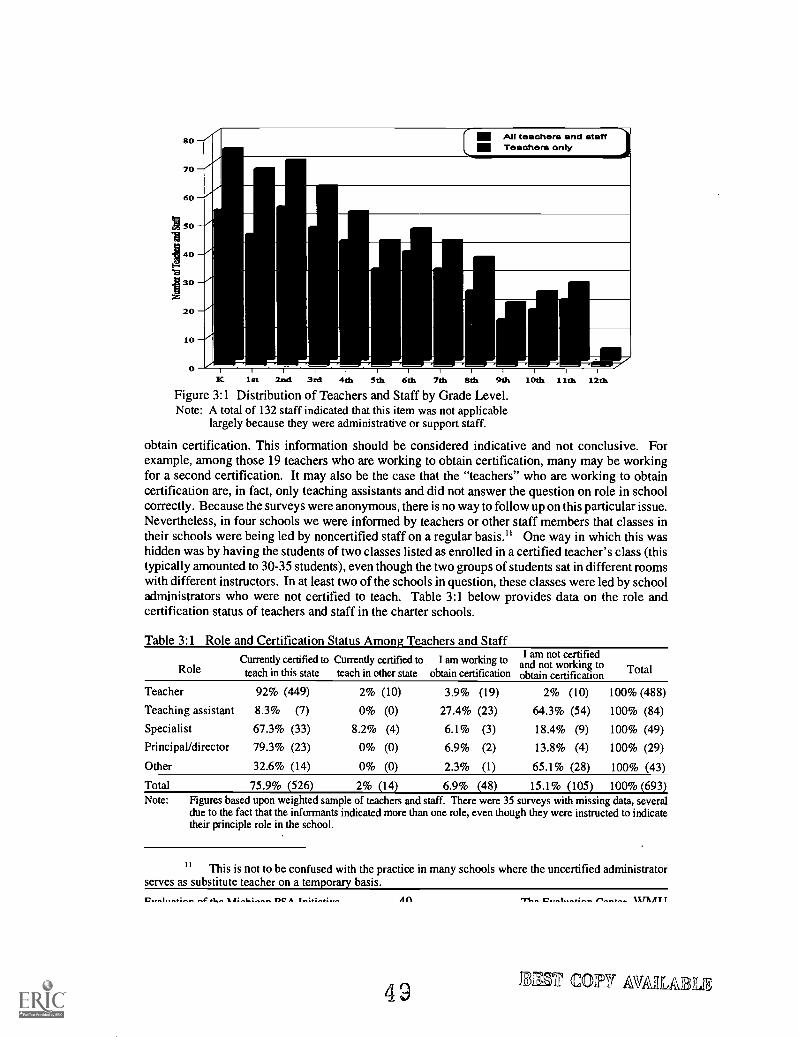
80
70
60
Xi 50
gG
40Fa'33
13020
10
0K 1st 2nd 3rd 4th Sth 6th 7th 8th 9th 10th 11th 12th
Figure 3:1 Distribution of Teachers and Staff by Grade Level.Note: A total of 132 staff indicated that this item was not applicable
largely because they were administrative or support staff.
obtain certification. This information should be considered indicative and not conclusive. Forexample, among those 19 teachers who are working to obtain certification, many may be workingfor a second certification. It may also be the case that the "teachers" who are working to obtaincertification are, in fact, only teaching assistants and did not answer the question on role in schoolcorrectly. Because the surveys were anonymous, there is no way to follow up on this particular issue.Nevertheless, in four schools we were informed by teachers or other staff members that classes intheir schools were being led by noncertified staff on a regular basis." One way in which this washidden was by having the students of two classes listed as enrolled in a certified teacher's class (thistypically amounted to 30-35 students), even though the two groups of students sat in different roomswith different instructors. In at least two of the schools in question, these classes were led by schooladministrators who were not certified to teach. Table 3:1 below provides data on the role andcertification status of teachers and staff in the charter schools.
Table 3:1 Role and Certification Status Among Teachers and StaffCurrently certified to Currently certified to I am working to
Role teach in this state teach in other state obtain certification
Teacher
Teaching assistant
Specialist
Principal/director
Other
TotalNote:
92% (449) 2% (10) 3.9% (19)
8.3% (7) 0% (0) 27.4% (23)
67.3% (33) 8.2% (4) 6.1% (3)
79.3% (23) 0% (0) 6.9% (2)
32.6% (14) 0% (0) 2.3% (1)
75.9% (526) 2% (14) 6.9% (48)
I am not certifiedand not working toobtain certification
2% (10)64.3% (54)
18.4% (9)13.8% (4)
65.1% (28)
Total
100% (488)
100% (84)
100% (49)
100% (29)
100% (43)
15.1% (105) 100% (693)Figures based upon weighted sample of teachers and staff. There were 35 surveys with missing data, severaldue to the fact that the informants indicated more than one role, even though they were instructed to indicatetheir principle role in the school.
" I This is not to be confused with the practice in many schools where the uncertified administratorserves as substitute teacher on a temporary basis.
DC A T.A:gAg..A
49
r IITT ST T
LT .3511' 00117 AVAilLABRA
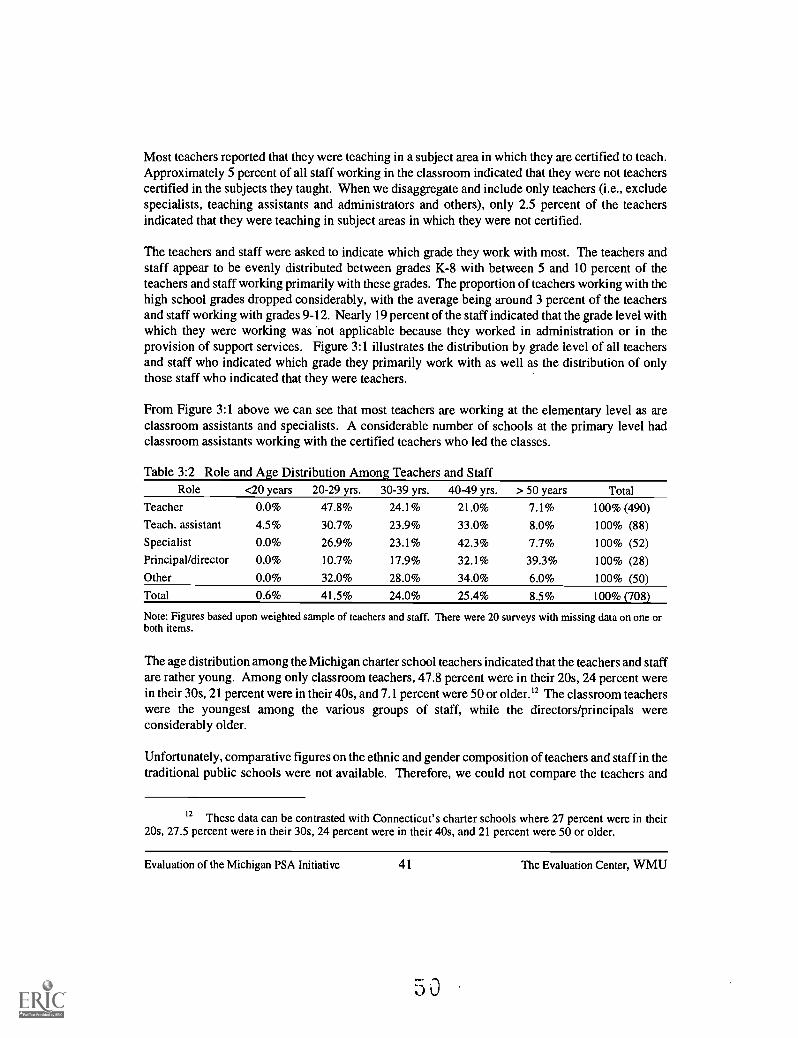
Most teachers reported that they were teaching in a subject area in which they are certified to teach.Approximately 5 percent of all staff working in the classroom indicated that they were not teacherscertified in the subjects they taught. When we disaggregate and include only teachers (i.e., excludespecialists, teaching assistants and administrators and others), only 2.5 percent of the teachersindicated that they were teaching in subject areas in which they were not certified.
The teachers and staff were asked to indicate which grade they work with most. The teachers andstaff appear to be evenly distributed between grades K-8 with between 5 and 10 percent of theteachers and staff working primarily with these grades. The proportion of teachers working with thehigh school grades dropped considerably, with the average being around 3 percent of the teachersand staff working with grades 9-12. Nearly 19 percent of the staff indicated that the grade level withwhich they were working was not applicable because they worked in administration or in theprovision of support services. Figure 3:1 illustrates the distribution by grade level of all teachersand staff who indicated which grade they primarily work with as well as the distribution of onlythose staff who indicated that they were teachers.
From Figure 3:1 above we can see that most teachers are working at the elementary level as areclassroom assistants and specialists. A considerable number of schools at the primary level hadclassroom assistants working with the certified teachers who led the classes.
Table 3:2 Role and Age Distribution Among Teachers and StaffRole <20 years 20-29 yrs. 30-39 yrs. 40-49 yrs. > 50 years Total
Teacher 0.0% 47.8% 24.1% 21.0% 7.1% 100% (490)
Teach. assistant 4.5% 30.7% 23.9% 33.0% 8.0% 100% (88)Specialist 0.0% 26.9% 23.1% 42.3% 7.7% 100% (52)Principal/director 0.0% 10.7% 17.9% 32.1% 39.3% 100% (28)Other 0.0% 32.0% 28.0% 34.0% 6.0% 100% (50)Total 0.6% 41.5% 24.0% 25.4% 8.5% 100% (708)
Note: Figures basedboth items.
upon weighted sample of teachers and staff. There were 20 surveys with missing data on one or
The age distribution among the Michigan charter school teachers indicated that the teachers and staffare rather young. Among only classroom teachers, 47.8 percent were in their 20s, 24 percent werein their 30s, 21 percent were in their 40s, and 7.1 percent were 50 or older.' The classroom teacherswere the youngest among the various groups of staff, while the directors/principals wereconsiderably older.
Unfortunately, comparative figures on the ethnic and gender composition of teachers and staff in thetraditional public schools were not available. Therefore, we could not compare the teachers and
12 These data can be contrasted with Connecticut's charter schools where 27 percent were in their20s, 27.5 percent were in their 30s, 24 percent were in their 40s, and 21 percent were 50 or older.
Evaluation of the Michigan PSA Initiative 41 The Evaluation Center, WIVIU
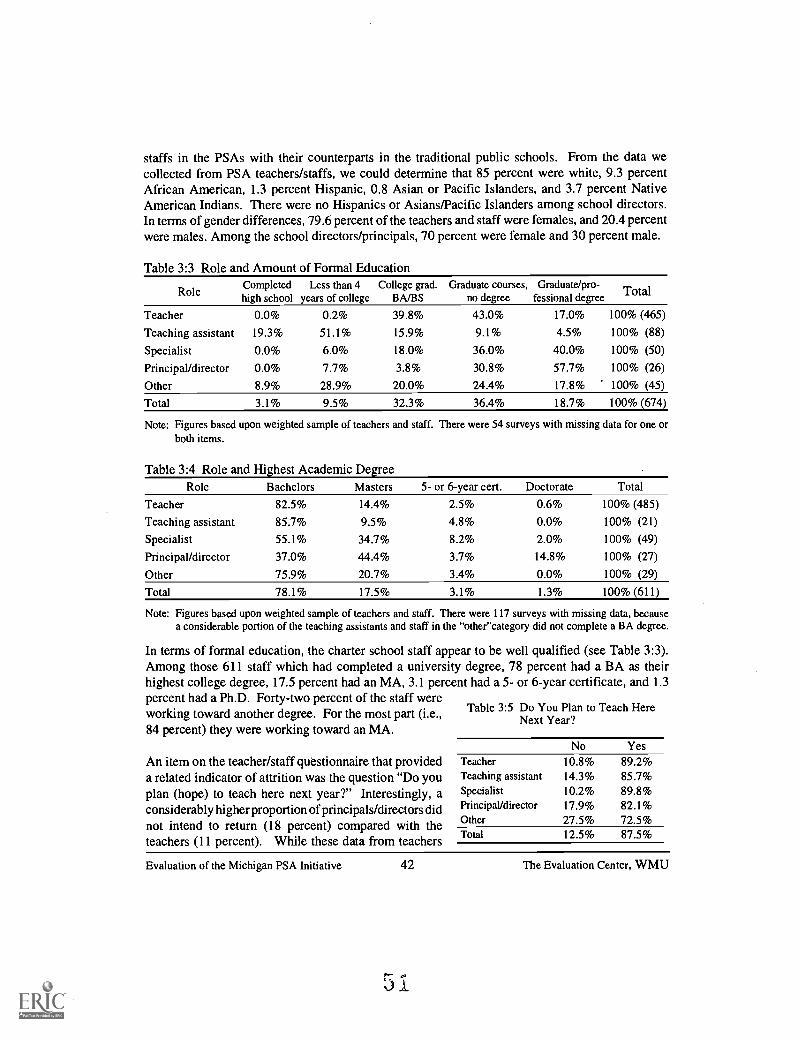
staffs in the PSAs with their counterparts in the traditional public schools. From the data wecollected from PSA teachers/staffs, we could determine that 85 percent were white, 9.3 percentAfrican American, 1.3 percent Hispanic, 0.8 Asian or Pacific Islanders, and 3.7 percent NativeAmerican Indians. There were no Hispanics or Asians/Pacific Islanders among school directors.In terms of gender differences, 79.6 percent of the teachers and staff were females, and 20.4 percentwere males. Among the school directors/principals, 70 percent were female and 30 percent male.
Table 3:3 Role and Amount of Formal Education
RoleCompletedhigh school
Less than 4years of college
College grad.BA/BS
Graduate courses, Graduate/pro-no degree fessional degree Total
Teacher 0.0% 0.2% 39.8% 43.0% 17.0% 100% (465)
Teaching assistant 19.3% 51.1% 15.9% 9.1% 4.5% 100% (88)
Specialist 0.0% 6.0% 18.0% 36.0% 40.0% 100% (50)
Principal/director 0.0% 7.7% 3.8% 30.8% 57.7% 100% (26)
Other 8.9% 28.9% 20.0% 24.4% 17.8% 100% (45)
Total 3.1% 9.5% 32.3% 36.4% 18.7% 100% (674)
Note: Figures basedboth items.
upon weighted sample of teachers and staff.
Table 3:4 Role and Highest Academic Degree
There were 54 surveys with missing data for one or
Role Bachelors Masters 5- or 6-year cert. Doctorate Total
Teacher 82.5% 14.4% 2.5% 0.6% 100% (485)
Teaching assistant 85.7% 9.5% 4.8% 0.0% 100% (21)
Specialist 55.1% 34.7% 8.2% 2.0% 100% (49)
Principal/director 37.0% 44.4% 3.7% 14.8% 100% (27)
Other 75.9% 20.7% 3.4% 0.0% 100% (29)
Total 78.1% 17.5% 3.1% 1.3% 100% (611)
Note: Figures based upon weighted sample of teachers and staff. There were 117 surveys with missing data, becausea considerable portion of the teaching assistants and staff in the "other"category did not complete a BA degree.
In terms of formal education, the charter school staff appear to be well qualified (see Table 3:3).Among those 611 staff which had completed a university degree, 78 percent had a BA as theirhighest college degree, 17.5 percent had an MA, 3.1 percent had a 5- or 6-year certificate, and 1.3percent had a Ph.D. Forty-two percent of the staff wereworking toward another degree. For the most part (i.e.,84 percent) they were working toward an MA.
An item on the teacher/staff questionnaire that provideda related indicator of attrition was the question "Do youplan (hope) to teach here next year?" Interestingly, aconsiderably higher proportion of principals/directors didnot intend to return (18 percent) compared with theteachers (11 percent). While these data from teachers
Table 3:5 Do You Plan to Teach HereNext Year?
No YesTeacher 10.8% 89.2%Teaching assistant 14.3% 85.7%Specialist 10.2% 89.8%Principal/director 17.9% 82.1%Other 27.5% 72.5%Total 12.5% 87.5%
Evaluation of the Michigan PSA Initiative 42 The Evaluation Center, WMU
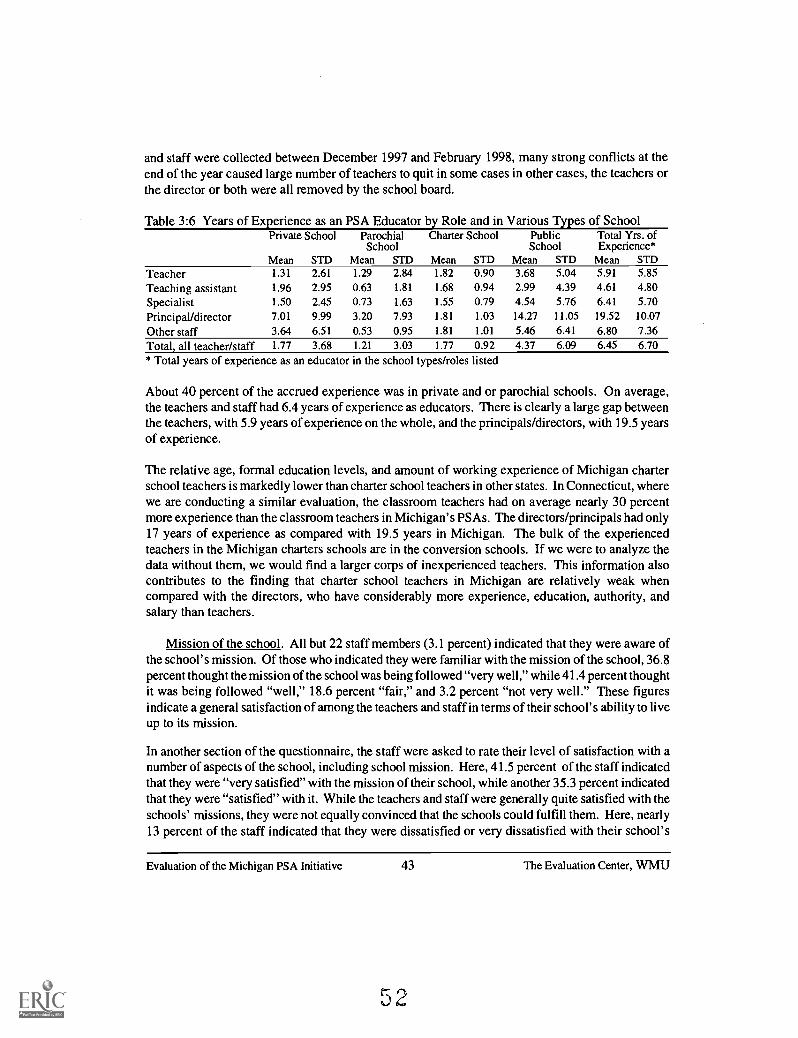
and staff were collected between December 1997 and February 1998, many strong conflicts at theend of the year caused large number of teachers to quit in some cases in other cases, the teachers orthe director or both were all removed by the school board.
Table 3:6 Years of Experience as an PSA Educator by Role and in Various Types of SchoolPrivate School
Mean STD
ParochialSchool
Mean STD
Charter School
Mean STD
PublicSchool
Mean STD
Total Yrs. ofExperience*
Mean STDTeacher 1.31 2.61 1.29 2.84 1.82 0.90 3.68 5.04 5.91 5.85
Teaching assistant 1.96 2.95 0.63 1.81 1.68 0.94 2.99 4.39 4.61 4.80Specialist 1.50 2.45 0.73 1.63 1.55 0.79 4.54 5.76 6.41 5.70
Principal/director 7.01 9.99 3.20 7.93 1.81 1.03 14.27 11.05 19.52 10.07
Other staff 3.64 6.51 0.53 0.95 1.81 1.01 5.46 6.41 6.80 7.36
Total, all teacher/staff 1.77 3.68 1.21 3.03 1.77 0.92 4.37 6.09 6.45 6.70* Total years of experience as an educator in the school types/roles listed
About 40 percent of the accrued experience was in private and or parochial schools. On average,the teachers and staff had 6.4 years of experience as educators. There is clearly a large gap betweenthe teachers, with 5.9 years of experience on the whole, and the principals/directors, with 19.5 yearsof experience.
The relative age, formal education levels, and amount of working experience of Michigan charterschool teachers is markedly lower than charter school teachers in other states. In Connecticut, wherewe are conducting a similar evaluation, the classroom teachers had on average nearly 30 percentmore experience than the classroom teachers in Michigan's PSAs. The directors/principals had only17 years of experience as compared with 19.5 years in Michigan. The bulk of the experiencedteachers in the Michigan charters schools are in the conversion schools. If we were to analyze thedata without them, we would find a larger corps of inexperienced teachers. This information alsocontributes to the finding that charter school teachers in Michigan are relatively weak whencompared with the directors, who have considerably more experience, education, authority, andsalary than teachers.
Mission of the school. All but 22 staff members (3.1 percent) indicated that they were aware ofthe school's mission. Of those who indicated they were familiar with the mission of the school, 36.8percent thought the mission of the school was being followed "very well," while 41.4 percent thoughtit was being followed "well," 18.6 percent "fair," and 3.2 percent "not very well." These figuresindicate a general satisfaction of among the teachers and staff in terms of their school's ability to liveup to its mission.
In another section of the questionnaire, the staff were asked to rate their level of satisfaction with anumber of aspects of the school, including school mission. Here, 41.5 percent of the staff indicatedthat they were "very satisfied" with the mission of their school, while another 35.3 percent indicatedthat they were "satisfied" with it. While the teachers and staff were generally quite satisfied with theschools' missions, they were not equally convinced that the schools could fulfill them. Here, nearly13 percent of the staff indicated that they were dissatisfied or very dissatisfied with their school's
Evaluation of the Michigan PSA Initiative 43 The Evaluation Center, WMU
2
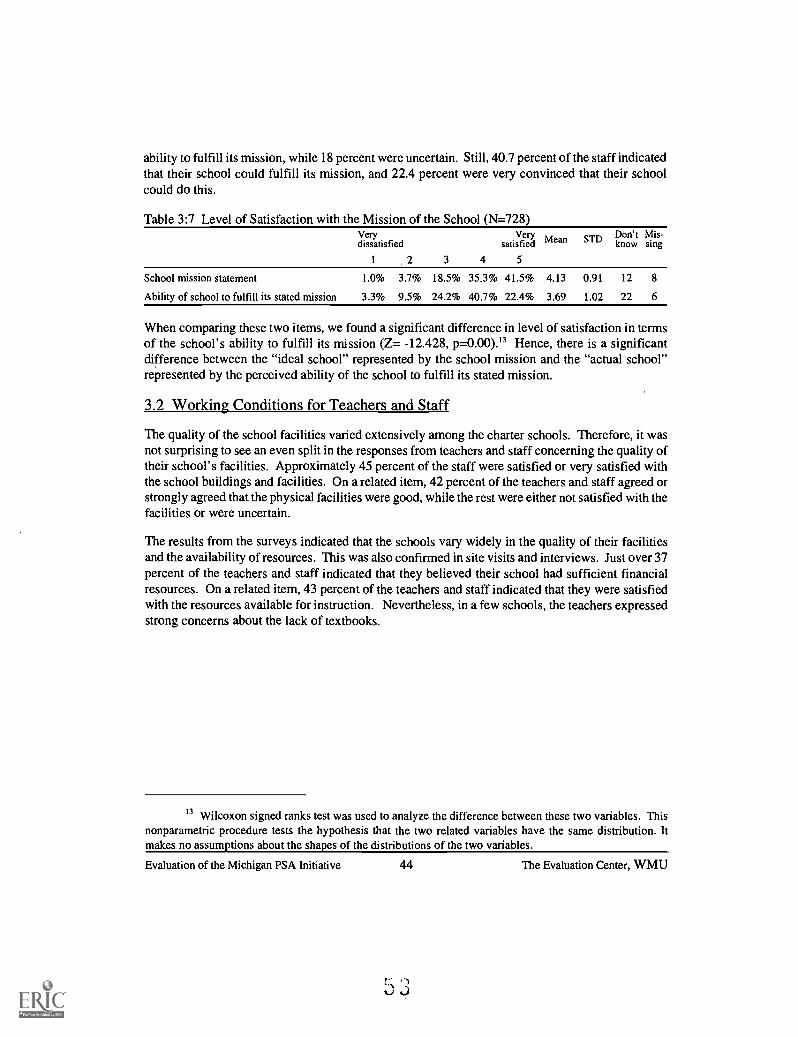
ability to fulfill its mission, while 18 percent were uncertain. Still, 40.7 percent of the staff indicatedthat their school could fulfill its mission, and 22.4 percent were very convinced that their schoolcould do this.
Table 3:7 Level of Satisfaction with the Mission of the School (N=728)Verydissatisfied
1 .2 3 4
Verysatisfied
5
Mean STD Don't Mis-know sing
School mission statement
Ability of school to fulfill its stated mission
1.0%
3.3%
3.7%
9.5%
18.5%
24.2%
35.3%
40.7%
41.5%
22.4%
4.13
3.69
0.91
1.02
12
22
8
6
When comparing these two items, we found a significant difference in level of satisfaction in termsof the school's ability to fulfill its mission (Z= -12.428, p=0.00).'3 Hence, there is a significantdifference between the "ideal school" represented by the school mission and the "actual school"represented by the perceived ability of the school to fulfill its stated mission.
3.2 Working Conditions for Teachers and Staff
The quality of the school facilities varied extensively among the charter schools. Therefore, it wasnot surprising to see an even split in the responses from teachers and staff concerning the quality oftheir school's facilities. Approximately 45 percent of the staff were satisfied or very satisfied withthe school buildings and facilities. On a related item, 42 percent of the teachers and staff agreed orstrongly agreed that the physical facilities were good, while the rest were either not satisfied with thefacilities or were uncertain.
The results from the surveys indicated that the schools vary widely in the quality of their facilitiesand the availability of resources. This was also confirmed in site visits and interviews. Just over 37percent of the teachers and staff indicated that they believed their school had sufficient financialresources. On a related item, 43 percent of the teachers and staff indicated that they were satisfiedwith the resources available for instruction. Nevertheless, in a few schools, the teachers expressedstrong concerns about the lack of textbooks.
13 Wilcoxon signed ranks test was used to analyze the difference between these two variables. Thisnonparametric procedure tests the hypothesis that the two related variables have the same distribution. Itmakes no assumptions about the shapes of the distributions of the two variables.
Evaluation of the Michigan PSA Initiative 44 The Evaluation Center, WMU
40%35%30%25%20%15%10%
5%0%
Salary level
1
Very
dissatisfied
3 5
Very
satisfied
40%
35%
30%
25%
20%
15%
10%
5%
0%
Fringe benefits
Very
dissatisfied
3 5
Very
satisfied
Figure 3:2 Satisfaction With Salary Figure 3:3 Satisfaction With Fringe Benefits
Thirty-nine percent of the teachers and staff were satisfied or very satisfied with the salaries theyreceived, while 23.9 percent were either dissatisfied or very dissatisfied with their salaries (seeFigure 3:2 above). A very large proportion of the staff (37 percent) indicated that they were neithersatisfied nor dissatisfied with their salaries. Fringe benefits appear to vary considerably among theschools. This can be seen in the large proportion of teachers and staff who were "very dissatisfied"or "very satisfied" with the fringe benefits they received (see Figure 3:3 above).
One particular area where the teachers were particularly satisfied was the small class sizes. Anumber of items in the questionnaire addressed class size, and it was clear that this was an importantreason for seeking employment at the charter school and an aspect of the schools with which theteachers were particularly satisfied.
While a majority of staff indicated they were not insecure about their future at their particular school,36 percent of the teachers and staff indicated otherwise. It is not clear if this insecurity is due touncertainty about the charter school reform or due to the role of the particular school in itscommunity and its ability to live up to its mission. In terms of satisfaction with their jobs, 12.3percent of the teachers and staff indicated that they did not plan/hope to be teaching in that particularschool next year, as compared with 87.7 percent who intended to return. Among those teachers notplanning to return next year, a female teacher from one school expressed that she would not bereturning due to "frustration with lack of supplies and professional supportmostly the lack ofprofessional support and guidance."
The survey results indicated that most teachers and staff have many noninstructional duties inaddition to their teaching load. During the site visits and interviews, there were some complaintsabout this and some concerns about burn-out; but on the whole, the teachers and staff were quiteaware of the large commitment they needed to make to get the school "up and running" and werewilling to make this commitment.
Evaluation of the Michigan PSA Initiative 45 The Evaluation Center, WMU
BEN COPY AVAIILABLIS
Correlations were run to examine differences between teachers and school principals/directors. Asone would expect, the principals had more experience, more training, and were more likely to haveworked in private and/or parochial schools. Teachers were less positive about the school and wereless likely to think they could influence the direction of the school. As one would expect, teachersdid not rate the administrative leadership of their schools as high as did the principals. The charterschool principals were less likely to indicate that class sizes were too large and were less inclinedto indicate that teachers had many noninstructional duties.
Overall, teachers are too busy to engage in serious curriculum development during the regular schoolyear. In some schools, teachers devoted the full summer to this activity; and, in other cases, theyreport spending very long days in attempting to develop the curriculum along with regular duties ofteaching on a full-time basis. In a few cases, teachers are given full responsibility for developing thecurriculum for their students. In other cases, the school is adopting a packaged curriculum from themarketplace or implementing the curriculum prescribed by the management company.
3.3 Expectations of Teachers and Staff
A number of identical items were used in the surveys to examine and compare the charter schoolstaffs' "initial expectations" as opposed to "current experience" (See Appendix D, Question 16).In general, it is clear that the teachers and other staff were content with their schools and satisfiedwith the services they provide. It is interested to note, however, that there were significantdifferences between what was initially expected and what the educators were currently experiencing.What the staff were reporting as "current experience" was significantly less positive than their"initial expectations.'
The biggest differences between initial expectations and current experience were on the followingitems:
O The school will have/has effective leadership and administration.O Students will receive/receive sufficient individual attention.O Teachers will be able to influence the steering and direction of the school.
This does not infer that teachers were not satisfied with these aspects of their school. Rather, itinfers that they had high expectations in these areas that did not correspond with their currentexperience.
3.4 Factors Influencing Teachers/Staff to Seek Employment at Their PSAA number of possible reasons for the teachers and staff to seek employment at the charter schoolwere listed, and the staff were asked to rate each reason on a 5-point scale according to how relevant
14 Because these questions are actually nonparametric in nature and the variables are ordinal, themarginal homogeneity test was used to compare the paired distribution of responses. This also foundsignificant reductions in expectations on all items (p = .01).
Evaluation of the Michigan PSA Initiative 46
55
The Evaluation Center, WMU
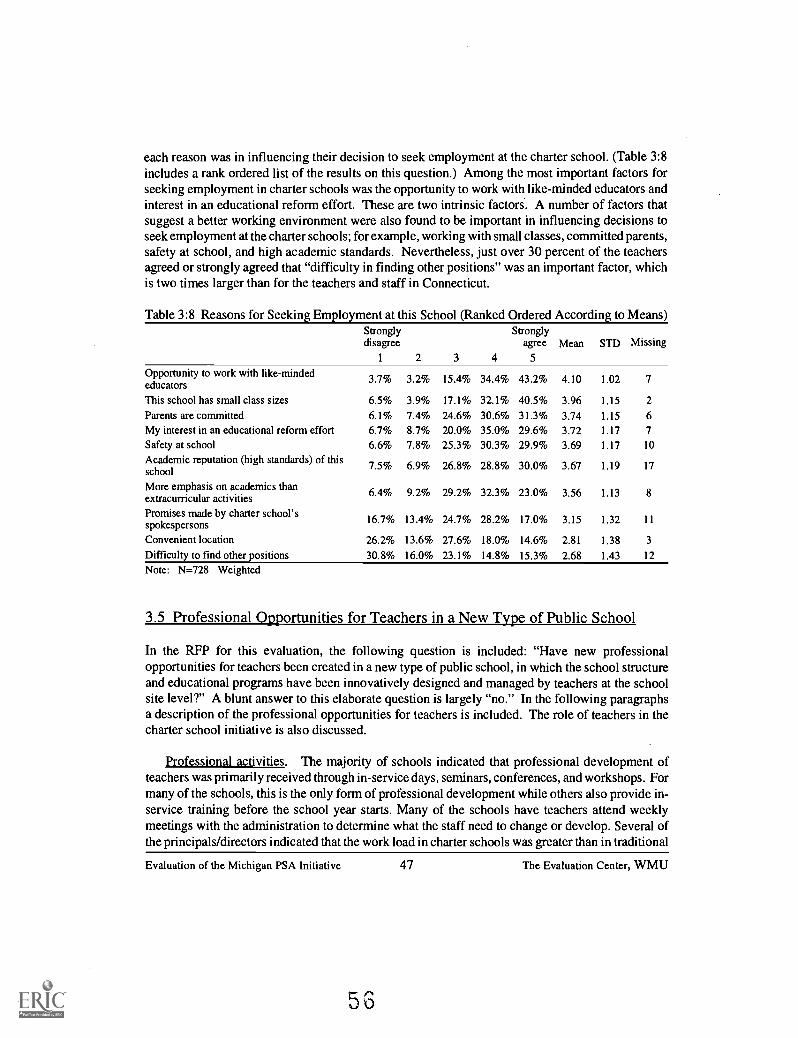
each reason was in influencing their decision to seek employment at the charter school. (Table 3:8includes a rank ordered list of the results on this question.) Among the most important factors forseeking employment in charter schools was the opportunity to work with like-minded educators andinterest in an educational reform effort. These are two intrinsic factors. A number of factors thatsuggest a better working environment were also found to be important in influencing decisions toseek employment at the charter schools; for example, working with small classes, committed parents,safety at school, and high academic standards. Nevertheless, just over 30 percent of the teachersagreed or strongly agreed that "difficulty in finding other positions" was an important factor, whichis two times larger than for the teachers and staff in Connecticut.
Table 3:8 Reasons for Seeking Employment at this School (Ranked Ordered According to Means)Stronglydisagree
1 2 3 4
Stronglyagree
5
Mean STD Missing
Opportunity to work with like-mindededucatorsThis school has small class sizesParents are committedMy interest in an educational reform effortSafety at schoolAcademic reputation (high standards) of thisschool
More emphasis on academics thanextracurricular activitiesPromises made by charter school'sspokespersonsConvenient location
Difficulty to find other positions
3.7%
6.5%
6.1%6.7%6.6%
7.5%
6.4%
16.7%
26.2%
30.8%
3.2%
3.9%
7.4%8.7%7.8%
6.9%
9.2%
13.4%
13.6%
16.0%
15.4%
17.1%
24.6%20.0%25.3%
26.8%
29.2%
24.7%
27.6%
23.1%
34.4%
32.1%
30.6%35.0%30.3%
28.8%
32.3%
28.2%
18.0%
14.8%
43.2%
40.5%31.3%29.6%29.9%
30.0%
23.0%
17.0%
14.6%
15.3%
4.10
3.96
3.743.723.69
3.67
3.56
3.15
2.81
2.68
1.02
1.15
1.15
1.17
1.17
1.19
1.13
1.32
1.38
1.43
7
2
67
10
17
8
11
3
12
Note: N=728 Weighted
3.5 Professional Opportunities for Teachers in a New Type of Public School
In the RFP for this evaluation, the following question is included: "Have new professionalopportunities for teachers been created in a new type of public school, in which the school structureand educational programs have been innovatively designed and managed by teachers at the schoolsite level?" A blunt answer to this elaborate question is largely "no." In the following paragraphsa description of the professional opportunities for teachers is included. The role of teachers in thecharter school initiative is also discussed.
Professional activities. The majority of schools indicated that professional development ofteachers was primarily received through in-service days, seminars, conferences, and workshops. Formany of the schools, this is the only form of professional development while others also provide in-service training before the school year starts. Many of the schools have teachers attend weeklymeetings with the administration to determine what the staff need to change or develop. Several ofthe principals/directors indicated that the work load in charter schools was greater than in traditional
Evaluation of the Michigan PSA Initiative 47 The Evaluation Center, WMU
schools, which led to difficulty in scheduling time for training. To remedy this problem, oneprincipal tries to train teachers on the job as opposed to sending them to conferences, etc. Oneschool receives funding to maintain a professional development library. One principal noted thatthere was unlimited professional development available for teachers, while a few other principalsstated that there was no professional development available thus far. Two principals commented thatprofessional development opportunities were evaluated on a needs basis by the principal.
Below are examples of how the schools responded to our inquiry about professional developmentopportunities for teachers.
O One school has year-round employees who have six weeks of in-service during the summer.
O Teachers have the opportunity to attend several seminars/staff development conferences andworkshops to help them develop their skills.
O One school has a professional development library purchased with Goals 2000 grant money, aswell as professional development days available to teachers. Teachers get two professional leavedays a year, but are given more if it is relevant to the school's needs. Teachers have attended theMichigan Reading Association Conference, AIMS, ASCD, and Multi-Age Classroomworkshops.
O "Teachers go to conferences and workshops for the purposes of training, but this is not doneextensively. Instead, the teachers set aside a substantial amount of time to devote to two areas:considering how to measure student success and discussing the curriculum and the instructionalprocess. Typically, the staff meet for one 4 hour meeting on these and related topics each week.In terms of work load, everyone in the school is spread thinly."
O Teachers at one school attend workshops offered by the state. For example, several teachersattended science teaching workshops. At the school itself, teachers attend workshops on matterssuch as classroom management, etc. There was considerable staff turnover in the school's firstyear of operations, but this has stabilized in the past two years.
O Eventually, one PSA has plans to allow teachers to visit other schools and observe practiceswithin them. Teachers will also attend workshops and so on for professional development. Thatis not happening at present. The principal explained, however, that the organizational structureof the school and the innovative pedagogic approach are actually giving teachers someimpressive opportunities for self-development.
O The teachers at one school have attended a couple of conferences. As a group, they also visiteda school in Grand Rapids to observe teaching practices. The principal was quite critical of thestaff. All but one of the teachers would not be returning in the Fall of 1998; therefore, plans foradditional professional development were not being considered at the time of the interview.
O The principal of one school said that the school offers more opportunities for teachers to improvetheir professional skills than traditional schools do. For example, he said that teachers can take
Evaluation of the Michigan PSA Initiative 48 The Evaluation Center, WMU
57
days off for professional training; some attended workshops to learn about such things as howto help children with reading and how to manage multiage classrooms.
O The principal at one school said professional development for teachers is a challenge. "I. try totrain the teachers on the job . . . the teachers would like to attend in-service workshops and soon, but I think it is better to do things on the job." This principal said her school intends to beginsending teachers outside for training, but they will be very careful to see where the money goes.
O "Teachers are given 5 professional or sick days per year. There are three in-service days priorto the beginning of school year and there are six days built into the calendar for professionaldevelopment. The area ISD does some of the charter school professional development."
O "The teachers meet each morning from 8:00 to 8:30 a.m. for professional development. Theyalso have a formal meeting once a month. Along with this, staff can participate in workshops,conferences, etc. Typically, funding for attendance at these events is funded by the school."
O "All teachers attended discipline and personality testing/learning styles in-service trainingsessions. Every staff member completes an individual goal sheet each school year specifying anytraining desired. Training is then made available when possible."
O "[Professional development] is on a need-based basis. This year it was computer classes andgrant writing."
O In an annual report, one principal wrote, "A crucial development plan must be effected to exposeteachers to the management of multiple learning levels in the classroom. This exposure shouldsupport teachers in managing the challenging composition of our student body. However, dueto lack of funds our staff development efforts have centered on discussions and peerpresentations."
O At one school the professional leave days are provided at the principal's discretion. "All areallowed to go and are provided the opportunity. With four I pull teeth to get them to go; one willgo at every chance given.
Evaluation of the Michigan PSA Initiative 49 The Evaluation Center, WMU
Chapter FourStudents and Parents
4.1 Description of Sampled Students and Parents
Student samples. Two surveys were administered to classes of students in the PSAs. TheStudent Charter School Survey was administered to Grades 5-12, and the School Climate Survey wasadministered to Grades 6-12. Forty-seven of the 51 PSAs in our part of the state had at least oneclass of students in Grades 5-12. A total of 1,880 student surveys were collected from these schools.In the classes selected for sampling, there were a total of 2,025 students enrolled (this was our targetpopulation). Therefore, 92.8 percent of the students were in attendance and completed the survey.There were 8,904 students in the 47 sampled schools (there were 9,206 students in all 51 PSAs inour part of the state). Our sample of students included 21 percent of the total student population.If the total student population has been restricted to Grades 5-12, we would likely have sampled closeto 60 percent of the total student population in Grades 5-12.
For the School Climate Survey, 7 schools were not included because they did not have students inGrades 6 or higher and 4 schools were not included because they were unwilling/or unable toparticipate in the survey.' A total of 1,145 School Climate Surveys were collected from the studentsin the 40 schools included in the sample, which represented 86 percent of the students selected foradministering the survey.
Parent and guardian samples. Two surveys were administered to a sample of parents andguardians at each PSA. The Parent Charter School Survey was administered to different groups ofparents at two points in time, the first between December 1997 and February 1998 and the secondin May 1998. During the second sample of parents, the School Climate Survey was also included.Considerable effort was put into a follow-up of parents so that we could receive a satisfactoryresponse rate. For the Parent Charter School Survey,10 schools were not included in the analysissince they had a response rate lower than 45 percent. Appendix C includes specific informationabout the achieved sample. After eliminating these 10 schools, the overall response rate for parentswas 70 percent, which is quite good for this stakeholder group. A total of 981 parents wereincluded in the analysis for this survey.
Because the School Climate Survey was administered only once, at the end of the school year, therewere limitations in how extensive a follow-up could be done. A total of 21 schools were notincluded in the analyses since they had response rates below 45 percent. The overall response rate
15 The schools not included in the sample are indicated in Appendix B.
Evaluation of the Michigan PSA Initiative 50 The Evaluation Center, WMU
5
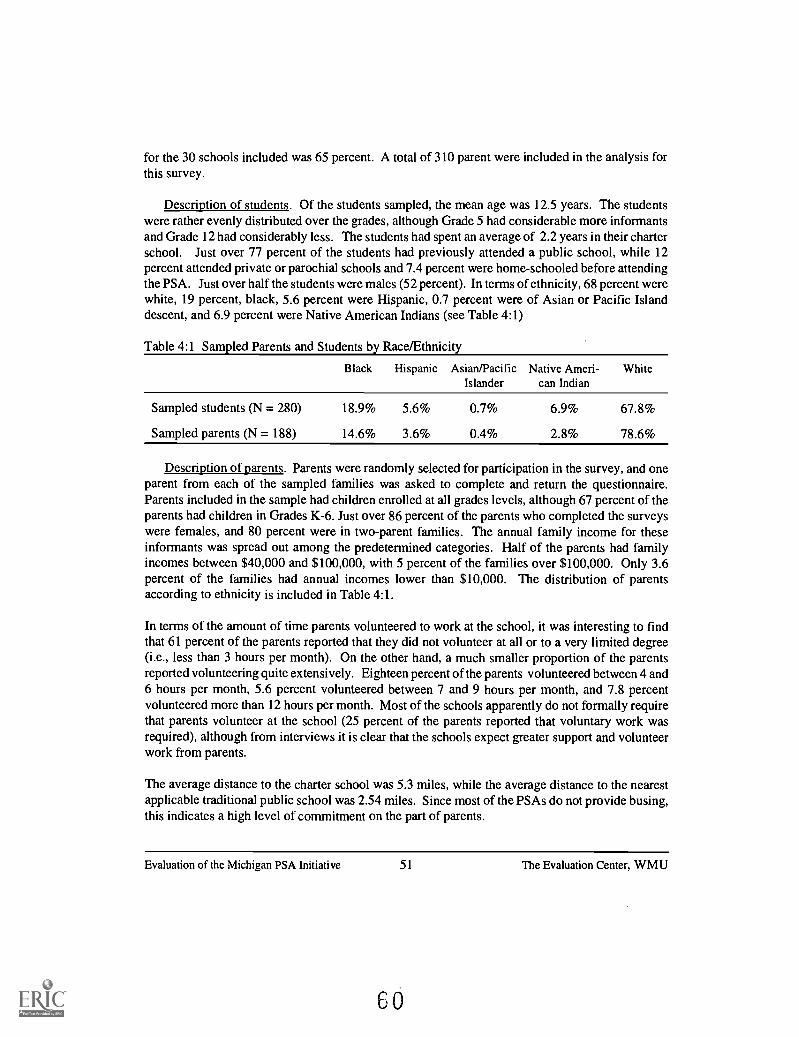
for the 30 schools included was 65 percent. A total of 310 parent were included in the analysis forthis survey.
Description of students. Of the students sampled, the mean age was 12.5 years. The studentswere rather evenly distributed over the grades, although Grade 5 had considerable more informantsand Grade 12 had considerably less. The students had spent an average of 2.2 years in their charterschool. Just over 77 percent of the students had previously attended a public school, while 12percent attended private or parochial schools and 7.4 percent were home-schooled before attendingthe PSA. Just over half the students were males (52 percent). In terms of ethnicity, 68 percent werewhite, 19 percent, black, 5.6 percent were Hispanic, 0.7 percent were of Asian or Pacific Islanddescent, and 6.9 percent were Native American Indians (see Table 4:1)
Table 4:1 Sampled Parents and Students by Race/Ethnicity
Black Hispanic Asian/Pacific Native Ameri- WhiteIslander can Indian
Sampled students (N = 280) 18.9% 5.6% 0.7% 6.9% 67.8%
Sampled parents (N = 188) 14.6% 3.6% 0.4% 2.8% 78.6%
Description of parents. Parents were randomly selected for participation in the survey, and oneparent from each of the sampled families was asked to complete and return the questionnaire.Parents included in the sample had children enrolled at all grades levels, although 67 percent of theparents had children in Grades K-6. Just over 86 percent of the parents who completed the surveyswere females, and 80 percent were in two-parent families. The annual family income for theseinformants was spread out among the predetermined categories. Half of the parents had familyincomes between $40,000 and $100,000, with 5 percent of the families over $100,000. Only 3.6percent of the families had annual incomes lower than $10,000. The distribution of parentsaccording to ethnicity is included in Table 4:1.
In terms of the amount of time parents volunteered to work at the school, it was interesting to findthat 61 percent of the parents reported that they did not volunteer at all or to a very limited degree(i.e., less than 3 hours per month). On the other hand, a much smaller proportion of the parentsreported volunteering quite extensively. Eighteen percent of the parents volunteered between 4 and6 hours per month, 5.6 percent volunteered between 7 and 9 hours per month, and 7.8 percentvolunteered more than 12 hours per month. Most of the schools apparently do not formally requirethat parents volunteer at the school (25 percent of the parents reported that voluntary work wasrequired), although from interviews it is clear that the schools expect greater support and volunteerwork from parents.
The average distance to the charter school was 5.3 miles, while the average distance to the nearestapplicable traditional public school was 2.54 miles. Since most of the PSAs do not provide busing,this indicates a high level of commitment on the part of parents.
Evaluation of the Michigan PSA Initiative 51 The Evaluation Center, WMU
60
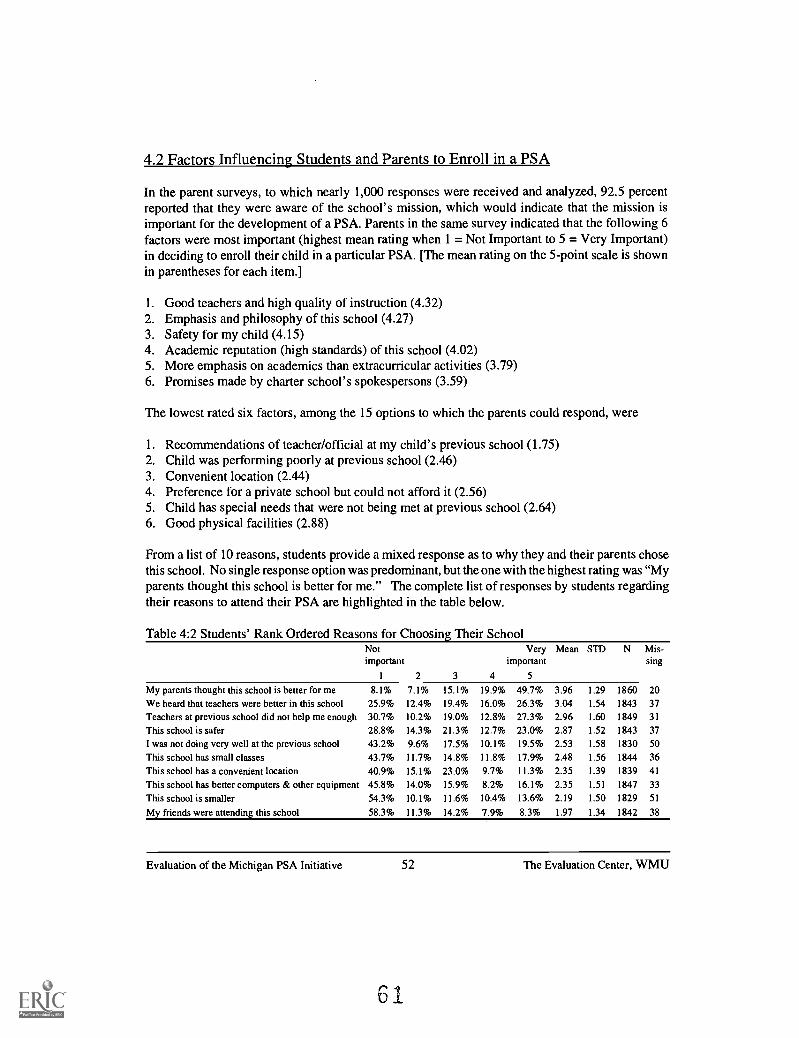
4.2 Factors Influencing Students and Parents to Enroll in a PSA
In the parent surveys, to which nearly 1,000 responses were received and analyzed, 92.5 percentreported that they were aware of the school's mission, which would indicate that the mission isimportant for the development of a PSA. Parents in the same survey indicated that the following 6factors were most important (highest mean rating when 1 = Not Important to 5 = Very Important)in deciding to enroll their child in a particular PSA. [The mean rating on the 5-point scale is shownin parentheses for each item.]
1. Good teachers and high quality of instruction (4.32)2. Emphasis and philosophy of this school (4.27)3. Safety for my child (4.15)4. Academic reputation (high standards) of this school (4.02)5. More emphasis on academics than extracurricular activities (3.79)6. Promises made by charter school's spokespersons (3.59)
The lowest rated six factors, among the 15 options to which the parents could respond, were
1. Recommendations of teacher/official at my child's previous school (1.75)2. Child was performing poorly at previous school (2.46)3. Convenient location (2.44)4. Preference for a private school but could not afford it (2.56)5. Child has special needs that were not being met at previous school (2.64)6. Good physical facilities (2.88)
From a list of 10 reasons, students provide a mixed response as to why they and their parents chosethis school. No single response option was predominant, but the one with the highest rating was "Myparents thought this school is better for me." The complete list of responses by students regardingtheir reasons to attend their PSA are highlighted in the table below.
Table 4:2 Students' Rank Ordered Reasons for Choosing Their SchoolNot Very Mean STD N Mis-important important sing
1 2 3 4 5
My parents thought this school is better for me 8.1% 7.1% 15.1% 19.9% 49.7% 3.96 1.29 1860 20
We heard that teachers were better in this school 25.9% 12.4% 19.4% 16.0% 26.3% 3.04 1.54 1843 37
Teachers at previous school did not help me enough 30.7% 10.2% 19.0% 12.8% 27.3% 2.96 1.60 1849 31
This school is safer 28.8% 14.3% 21.3% 12.7% 23.0% 2.87 1.52 1843 37
I was not doing very well at the previous school 43.2% 9.6% 17.5% 10.1% 19.5% 2.53 1.58 1830 50
This school has small classes 43.7% 11.7% 14.8% 11.8% 17.9% 2.48 1.56 1844 36
This school has a convenient location 40.9% 15.1% 23.0% 9.7% 11.3% 2.35 1.39 1839 41
This school has better computers & other equipment 45.8% 14.0% 15.9% 8.2% 16.1% 2.35 1.51 1847 33
This school is smaller 54.3% 10.1% 11.6% 10.4% 13.6% 2.19 1.50 1829 51
My friends were attending this school 58.3% 11.3% 14.2% 7.9% 8.3% 1.97 1.34 1842 38
Evaluation of the Michigan PSA Initiative 52 The Evaluation Center, WMU
61
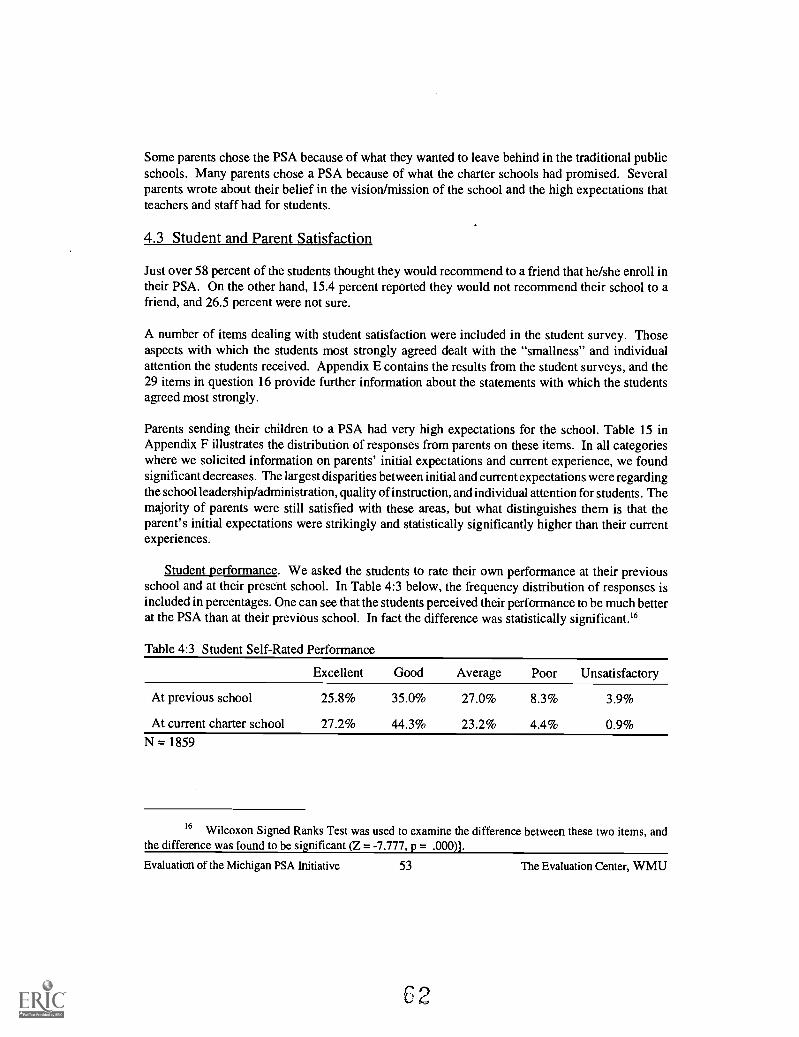
Some parents chose the PSA because of what they wanted to leave behind in the traditional publicschools. Many parents chose a PSA because of what the charter schools had promised. Severalparents wrote about their belief in the vision/mission of the school and the high expectations thatteachers and staff had for students.
4.3 Student and Parent Satisfaction
Just over 58 percent of the students thought they would recommend to a friend that he/she enroll intheir PSA. On the other hand, 15.4 percent reported they would not recommend their school to afriend, and 26.5 percent were not sure.
A number of items dealing with student satisfaction were included in the student survey. Thoseaspects with which the students most strongly agreed dealt with the "smallness" and individualattention the students received. Appendix E contains the results from the student surveys, and the29 items in question 16 provide further information about the statements with which the studentsagreed most strongly.
Parents sending their children to a PSA had very high expectations for the school. Table 15 inAppendix F illustrates the distribution of responses from parents on these items. In all categorieswhere we solicited information on parents' initial expectations and current experience, we foundsignificant decreases. The largest disparities between initial and current expectations were regardingthe school leadership/administration, quality of instruction, and individual attention for students. Themajority of parents were still satisfied with these areas, but what distinguishes them is that theparent's initial expectations were strikingly and statistically significantly higher than their currentexperiences.
Student performance. We asked the students to rate their own performance at their previousschool and at their present school. In Table 4:3 below, the frequency distribution of responses isincluded in percentages. One can see that the students perceived their performance to be much betterat the PSA than at their previous school. In fact the difference was statistically significant.'
Table 4:3 Student Self-Rated Performance
Excellent Good Average Poor Unsatisfactory
At previous school 25.8% 35.0% 27.0% 8.3% 3.9%
At current charter school 27.2% 44.3% 23.2% 4.4% 0.9%N = 1859
16 Wilcoxon Signed Ranks Test was used to examine the difference between these two items, andthe difference was found to be significant (Z = -7.777, p = .000)].
Evaluation of the Michigan PSA Initiative 53
C2
The Evaluation Center, WMU
When the students were asked to compare their interest in their schoolwork at their current schoolthan at their previous school, 50.6 percent indicated they were more interested in their schoolworkthan they were at their previous school, 13 percent were less interested, and 36.4 percent indicatedtheir interest level was about the same.
Safety at school has been an important concern of parents and an important factor for choosing acharter school. Only 13.4 percent of the sampled parents reported they had concerns for their child'ssafety at the PSA. Several parents still had concerns about the safety of their children on the schoolgrounds.
4.4 Students With Special Needs
Most of the PSAs work with local ISDs in order to meet the special needs of students within theirschools. A small proportion of the schools can provide the necessary special education with onlytheir own staff. A few schools contract with a local center to provide for the special needs ofstudents. One principal commented that the concepts of the school (one-to-one teaching, lowteacher/student ratio, etc.) reduce the need to have special education teachers. One principal statedthat there are no students receiving special education because the school does not label students inthat manner. One school principal stated that they could not afford students with special needs, butwould either contract services or refer students back to their local school if there was a need.
O One school has three special education students. There is a special education teacher on staffwho she works with each student 11/2 hours daily.
O One suburban school provides excellent opportunities for students who are academicallyoverachieving. These students can take many courses offered by the local community college,and the school pays for the tuition. A quarter of the students take courses at the communitycollege. To meet the special needs of students as conventionally defined, the school worksclosely with the local ISD. The principal said that 6-10 percent of the students in the school arelearning disabled.
O "Many students have made a conscious switch to this school to avoid being identified and labeledas special education students. Many high school students are sensitive to being labeled, and bycoming to a new school and having something of a fresh start, they can often do better than theyotherwise would have. But this does mean that the school has to be aware of the possibility thata student has a learning disability that will manifest itself over time. The school has no resourceroom and the small classes make it easier for teachers to accommodate students with specialneeds."
O Several schools make use of the resources of the ISD.
O The school has a high percentage of children with special needs. However, it has attempted toavoid labeling students. The small-group work that is a major characteristic of the school mightmake it easier for teachers to notice if students are having particular learning problems. To help
Evaluation of the Michigan PSA Initiative 54 The Evaluation Center, WMU
c3
students with special needs, the school contracts with a local therapy center, which charges$2,000 a month for its services. The school also has contacts with the ISD, which is very helpful.The school intends to hire a special needs teacher to be on site all the time. However, even then,it will continue to work with the ISD and the therapy center.
O "We have few special needs students. The low teacher/student ratio and the one-to-one teaching,plus developmental groupings of students reduce the need to have special teaching for studentswith special needs. In the future, we expect to be working more with the ISD to accommodateour students' special needs.
O According to one principal at a PSA that attracted students from several school districts, "we donot have any students with IEPs or with special needs, although a few receive speech therapyservices from the ISD." When asked if the school had "counseled out" students with specialneeds, the principal alluded that this was the practice before she started working there a half yearearlier.
O One principal claimed that more than 20 percent of their students had special needs, and theseneeds were met with minimal resources. "The special education is provided and funded by theISD." In addition, the school has a certified special education teacher on the staff who providesa lot of advice and assistance to teachers and the administrator on special needs issues.
O There is nobody in the school receiving special education because we don't label children.Parents must request to have their student evaluated for special education. The ISD did tests onthe children in one family, but found no special education needs. If needs were identified, theISD would be used to support the students and provide the help needed."
O At one suburban school, the special needs coordinator for the management company said that theschool has some contracts with two area ISDs. She said that they are very good for helpingchildren with special physical needs and that the school does a lot of work to support childrenwith special needs in-house. She said that the small class sizes mean that children with specialneeds can often have those needs accommodated within a regular classroom without unduedisruption or the reduction of the learning experience for other students.
O According to one principal, "We can't afford these students [students with special needs]."Although the principal said he did not discourage anyone from attending the school, somestudents were "IEPed out" prior to enrolling. He said "no families have asked for services andif they did, it would cause a financial nightmare. If this did occur, I would either contract outthese services or refer them back to their local school."
Evaluation of the Michigan PSA Initiative 55 The Evaluation Center, WMU
4
Chapter FiveLegislation and Oversight and Management
5.1 Legislation
During nearly all our interviews, a number of questions were asked concerning the legislationregulating the charter school initiative in Michigan. In this section we will review the ideas andconcerns raised by the various stakeholders.
A clear majority of the informants were generally content with the current legislation and had nospecific suggestions for changes to be made in the legislation. The most common concern raised bythe representatives of the charter schools was regarding start-up money. Many individuals expressedtheir wish that the legislation would stipulate that funds be made available to the schools so that theycould secure, build, or renovate a facility. Some persons thought the state of Michigan shouldguarantee bank loans or establish a fund from which schools could borrow money.
Some individuals said that the charter schools received inadequate funds when compared with thepublic schools.
There should be some type of mandatory time period for planning charter schools before theycan open their doors to students so there is not a "rush" to get everything done prior tostudents' arrival.
Another area of concern touched upon by several informants including some authorizers was theamount of time required to plan and develop the school prior to opening the doors to students. Moremandated time to prepare and plan was thought to be necessary. In the words of one person, "thiswould allow the school principal and the board to clarify their organizational philosophy and visionand determine the sort of curriculum they wanted before the staff arrived." A few individualsindicated specific lengths of time required for laying the groundwork ranging from 8 - 18 months.While this issue may be addressed with new legislation, it may be more logical to require this as partof the authorization process.
A number of school leaders mentioned that they thought the cap on the number of charter schoolsshould be removed or raised. Staff from a few of the new schools also thought that a publicadministrative agency should be established to assist charter schools. One school principal said,"This agency should be different from a management company. It makes no sense that all charterschools currently need to employ their own attorneys, accountants, and so on."
Evaluation of the Michigan PSA Initiative 56 The Evaluation Center, WMU
65
Below some of the other less often mentioned issues are included:
O "There are two major problems with the legislation at present. First, there is inadequate financialprovision made for charter schools. Second, the question of accommodation for charter schoolsis not appropriately addressed. In the case of our school, it continues to run a deficit because ofthe initial start-up expenditures. The school continues to lease a building and, in so doing,indirectly pays property taxes back to the state. This is a much different situation than that of atraditional public school."
O One principal did not really know much about the legislation since she only came to Michiganabout a year ago and this was her first job as a principal in the state.
O One principal suggested several changes that would be good for the school in the future: (i)don't require the 3 percent fee out of gross revenues for oversight, (ii) provide start-up funds forcharter schools, and (iii) change the payment system so that you don't have to borrow money tobegin at the start of the school year.
O One principal at a school run by a for-profit management company noted that "the cap on thenumber of charter schools that can operate in the state should be removed and the amount ofper-student compensation from the state to charter schools should be increased . . . . Ultimately,charter schools should be able to receive all the resources that traditional public schools receive."
O "Charter schools need to have some procedures in place that give them easier access to capitalfunding. Competition from charter schools was a good way to keep the traditional public schoolsin check and to ensure that personnel in those schools would not arrogantly follow their ownapproaches to doing things with little concern from students."
There are a number of legislative issues that were raised by PSA directors during interviews weconducted. The most prominent legislative issues raised by EMOs and PSA spokespersons includethe following:
O Provision of more start-up funds or guaranteed loansO Allow multiple site charters as in the case of ArizonaO Allow second sites for schools that are performing well, and have long waiting list
Other specific evaluation questions raised in the RFP, are discussed below.
How have the changes since the original charter school legislation affected the operation ofcharter schools? The few nonconversion charter schools that went into operation during the firstyear of the initiative were negatively affected by the Supreme Court ruling that delayed funding forthe first year. Many of the schools that were preparing to open were negatively affected by thegeneral uncertainty of the initiative.
Evaluation of the Michigan PSA Initiative 57 The Evaluation Center, WMU
66
Has the legislation provided parents and pupils with greater choices among public schools, bothwithin and outside their existing school districts? Approximately 2 percent of the compulsory levelstudents in Michigan's public schools now attend PSAs. While this is a low figure indicating limitedchoice, there is a much wider awareness of the presence of PSAs. The PSA initiative is widelydiscussed and debated across the state, both in districts that have several PSAs and in those withnone. One can clearly note that choice has increased in urban areas where most of the PSAs arelocated. In Grand Rapids, a family can choose from several very distinct PSAs, with a wide rangeof specific profiles. Some of these schools even provide busing, which makes them a viable optionfor a large proportion of families.
In rural areas of the state, there is a limited presence of PSAs. The few rural PSAs that exist are inthe proximity of a town from which they can attract students. In many of the smaller cities andtowns, particularly those in the northeastern half of the lower peninsula and in the upper peninsula,the availability of choice provided by PSA is very limited or nonexistent.
5.2 The Role of the Michigan Department of Education
In the RFP, three specific evaluation questions regarding the Michigan Department of Educationwere included: (1) Is MDE viewed as reasonable in its data requests? (2) Has MDE staff providedappropriate support and guidance for charter schools and authorizing agencies? and (3) Has MDEprovided leadership and supervision for charter schools and authorizing agencies? These threeevaluation questions will be addressed in this section, with particular attention given to the firstquestion.
Is MDE viewed as reasonable in its data requests? During the site visits to the charter schools,the school principals/directors were asked about how they perceived the requests for data from theMichigan Department of Education. A wide range of responses resulted. On the whole, mostprincipals indicated that they thought there was too much paperwork and too many reportingrequirements. There were a number of schools where the principals were extremely vocal incriticizing the extensive reporting requirements.
Even in terms of routine reporting practices, the principals said they had more reporting to do thanthe public schools. While this is not likely to be the case, this perception appears to be due to the factthat the principals were not aware of the reporting requirements that all public schools and schooldistricts are required to complete. In some cases, the charter school principals were former publicschool administrators and complained that they never had such reporting requirements when workingin traditional public schools. In one such case, the principal referred to criminal background checksof teachers. Obviously when these persons were employed in a similar role in a traditional publicschool, the checks were done by district-level rather than school-level staff.
In terms of the quantity of the documentation and information sent by MDE to the schools, thecharter schools arein their own wordsbeing swamped with mail from MDE, most of which theyclaim is irrelevant to their particular school. One principal said the message he wanted MDE to hear
Evaluation of the Michigan PSA Initiative 58 The Evaluation Center, WMU
was "Save trees!" He claimed that in the space of a year he could accumulate more than a four footstack of paper from MDE. Because each charter school is also a district, the department of educationsends all paperwork for principals and school superintendents. It also seems that schools receivecopies of all mailings regardless of whether or not they are appropriate to the level of education eachschool provides.
Probably the charter schools will be able to develop routines to more efficiently deal with the burdenof excess information. Because the Department of Education is concerned that it not be accused ofoverlooking any particular school in terms of access to information, it will likely continue to sendcopies of all documentation to all schools and districts regardless of its immediate relevance to eachschool.
The role of MDE in the charter school initiative. During the site visits to the charter schools, theschool principals/directors were asked how they perceived the role of MDE in the charter schoolinitiative. It was clear that MDE had a minimal role in terms of oversight. The principal requests forinformation concerned applications for grants (federal and or state) that were distributed throughMDE.
While most schools reported that they had never had a single visit from a representative from theMDE, there was widespread agreement that the response to telephone requests for support andguidance was quite good. The schools were particularly satisfied with the ability of Gary Cass, whoheaded the charter school office at MDE, to reply to all their requests for information.
A number of the schools indicated that they had virtually no contact with the MDE, and someprincipals said they wanted to keep contact to a minimum. Below is a summary of some of theresponses by charter school principals to the questions asked about MDE.
O One school principal said that his only contact with the Department of Education had been overcompliance issues. He said he thought the Department's reporting requirements were reasonable,and he noted that they were trying to make things easier for the schools by introducing reportingthrough the Internet.
O One principal said that he has had virtually no contact with Michigan Department of Educationother than responding to their reporting requirements. He said that initially he thought thereporting requirements were burdensome, but reasonable. He also said that the introduction ofelectronic (on-line) reporting had required him to learn some new systems and to make some newcomputer purchases. However, he was learning his way with this and now did not think that thereporting requirements were too bad.
O One school principal said that the information requests from the Department of Education taketime, but that MDE helps on all the financial information, making things easier for him.
O One principal reported that their school has had very good relations with the Department ofEducation. She attributed the good relations to the fact that the former principal had worked for
Evaluation of the Michigan PSA Initiative 59 The Evaluation Center, WMU
the Department of Education twice at earlier points in his career. This former principal was ableto help arrange the leasing of the school property from the Department of Education.
0 One school principal said that she tries to keep contact with the Department of Education to aminimum . .. "no news is good news." She said that "a major problem right now is that you havethese organizations like the Department of Education breathing down your neck, but none ofthem are actually there to help the charter schools."
0 One school principal was scathing of the Michigan Department of Education, suggesting that itsenergies are spent mostly on "self-adulation." She said that it requires too many reports, yet doesnot seem to read them. She gave as evidence of this a panel that she attended. During themeeting, staff from the Department asked representatives of charter schools for information that,in fact, the schools had already provided to them in written notes before the meeting took place.
Two final questions in the RFP concerned the role of the MDE and asked whether MDE staffprovided appropriate support and guidance and whether MDE provided leadership and supervisionfor charter schools and authorizing agencies. The charter school representatives indicated that MDEdid provide support and guidance when requested. The schools reported that the charter schooloffice was exceptionally good in providing support and guidance and other units in MDE weresufficiently good, although comments varied.
In terms of whether MDE provided leadership and supervision to charter schools and authorizingagencies, the answer is not so clear. In fact, representatives at MDE thought it was important to treatthe charter schools equally with the traditional public schools and not to provide any more leadershipand supervision than the traditional public schools received. The authorizing agencies appear to bereceiving a considerable amount of support and guidance from one another.
5.3 Authorizing Agencies
There are currently 137 PSAs operating in Michigan. Of these, 109 of these are authorized byuniversities, 1 by a community college, 15 by intermediate school districts, and 12 by local publicschool districts. Among the state universities, there are five that have not authorized charter schools(i.e., University of Michigan, Michigan State University, Wayne State University, Western MichiganUniversity, and Michigan Tech-nological University). The Board of Trustees at Western MichiganUniversity has decided to development a policy to begin chartering schools, possibly as many as 6by the 1999/2000 school year.
The decision to have universities authorize PSAs is rather unique. In most states, the localeducational authorities or a state authority, or both, issue charters. Many point out that this attributein Michigan is due to a political decision: since the governor wants charter schools, and since thegovernor appoints the members of the boards of all state universities (aside from Michigan StateUniversity, The University of Michigan, and Wayne State University), this is a political arena thatthe governor can control. The president of Eastern Michigan University stated in December 1998
Evaluation of the Michigan PSA Initiative 60 The Evaluation Center, WMU
69
that he was against charter schools but when the governor threatened the university's allocations, hechanged his mind (Shelton, 1998).
Approximately 90 percent of the total charter school enrollment is in schools authorized byuniversities. There are advantages and disadvantages for the universities and for the charter schoolinitiative with this particular arrangement. While university boards tend to mandate involvement inchartering schools, the colleges/departments of education at these universities tend to oppose charterschools and their university's involvement in authorizing charter schools. The involvement ofuniversity staff is usually limited to staff in the charter school office and does not include a broaderexchange. At a few universities, opposition by the faculty has reportedly decreased.
Northern Michigan University decided to start authorizing PSAs after new board members appointedby the governor pushed the issue at board meetings. This university took a compromise position andapproved a policy stating the conditions under which it would authorize charter schools. The mainpoints of this policy include the following points: (1) only authorize schools in the in the U.P., (2)only authorize charter schools that do not compete with traditional public schools, and (3) onlyauthorize schools whose mission or curriculum is of particular interest to faculty in the Departmentof Education. NMU has chartered only three schools to date, and the cooperation of the Departmentof Education is very good.
The role of authorizer is inconsistently understood and applied across the state. The value ofauthorizer oversight and assistance varies considerably among the authorizing agencies.
In some cases the authorizers attempt to conceal rather than reveal weaknesses or problems at theirschools. One authorizer has had several schools that have run into a number of serious problems.The head of this authorizing office reported that it has little power to steer the schools. Anotherauthorizer has taken a very different course by initiating a process of investigation that led to adecision not to renew one school's charter.
In this section an overview of the nature and roles of the authorizing agencies is included.Additionally, a number of evaluation questions originating from the RFP will be addressed. Thesequestions include the following:
Are the authorizing agencies providing appropriate oversight of charter schools?How expensive is the application process?How long does the application process take?How many visits have the authorizing agencies made to each charter school?Are the visits by the authorizing agencies to charter schools helpful?Is written feedback of the school visitation provided to MDE when requested?Has MDE been provided with an analysis of the authorizing agencies' expenditures from the 3percent fee, when requested?
Description of the authorizing agencies. There are four potential authorizing agencies inMichigan: public universities, community colleges, intermediate school districts, and local school
Evaluation of the Michigan PSA Initiative 61 The Evaluation Center, WMU
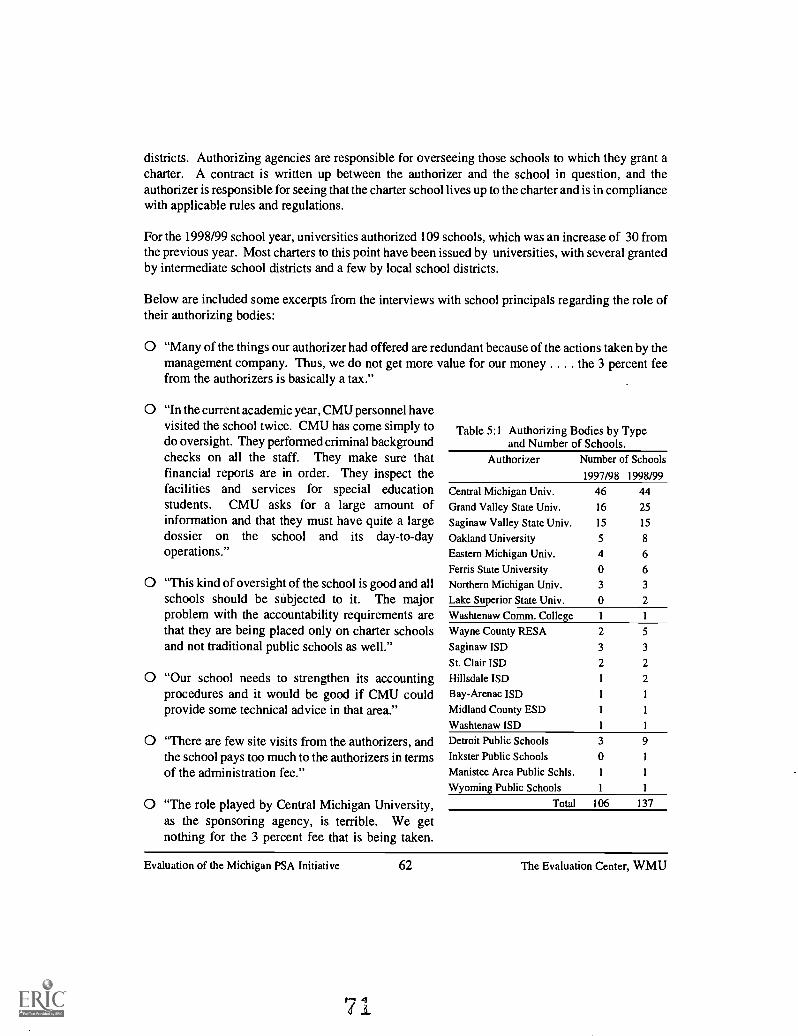
districts. Authorizing agencies are responsible for overseeing those schools to which they grant acharter. A contract is written up between the authorizer and the school in question, and theauthorizer is responsible for seeing that the charter school lives up to the charter and is in compliancewith applicable rules and regulations.
For the 1998/99 school year, universities authorized 109 schools, which was an increase of 30 fromthe previous year. Most charters to this point have been issued by universities, with several grantedby intermediate school districts and a few by local school districts.
Below are included some excerpts from the interviews with school principals regarding the role oftheir authorizing bodies:
0 "Many of the things our authorizer had offered are redundant because of the actions taken by themanagement company. Thus, we do not get more value for our money . . . . the 3 percent feefrom the authorizers is basically a tax."
0 "In the current academic year, CMU personnel havevisited the school twice. CMU has come simply todo oversight. They performed criminal backgroundchecks on all the staff. They make sure that
Table 5:1 Authorizing Bodies by Typeand Number of Schools.
Authorizer Number of Schoolsfinancial reports are in order. They inspect thefacilities and services for special educationstudents. CMU asks for a large amount of
1997/98 1998/99
Central Michigan Univ.
Grand Valley State Univ.
46
16
44
25
information and that they must have quite a large Saginaw Valley State Univ. 15 15
dossier on the school and its day-to-day Oakland University 5 8
operations." Eastern Michigan Univ. 4 6
Ferris State University 0 60 "This kind of oversight of the school is good and all Northern Michigan Univ. 3 3
schools should be subjected to it. The major Lake Superior State Univ. 0 2
problem with the accountability requirements are Washtenaw Comm. College 1
that they are being placed only on charter schools Wayne County RESA 2 5
and not traditional public schools as well." Saginaw ISD 3 3
St. Clair ISD 2 2
0 "Our school needs to strengthen its accounting Hillsdale ISD 1 2
procedures and it would be good if CMU could Bay-Arenac ISD 1 1
provide some technical advice in that area." Midland County ESD 1 1
Washtenaw ISD 1 1
0 "There are few site visits from the authorizers, and Detroit Public Schools 3 9
the school pays too much to the authorizers in terms Inkster Public Schools 0 1
of the administration fee." Manistee Area Public Schls. 1 1
Wyoming Public Schools 1 1
0 "The role played by Central Michigan University,as the sponsoring agency, is terrible. We getnothing for the 3 percent fee that is being taken.
Total 106 137
Evaluation of the Michigan PSA Initiative 62 The Evaluation Center, WMU
Rather, the school ends up with double the paperwork of a traditional public school. CMUtypically just sends letters of noncompliance to the school and the regulations areoverwhelming."
O "CMU works mostly with the Leona Group, and that is because Leona Group deals with allfinancial issues pertaining to the school. Representatives of CMU visit the school about 2 or 3times a year. They have been helpful in giving advice on things like the organization of supportfor students requiring special education."
In many cases, the school principals' claims are out of perspective. For instance, because many ofthese principals are so overwhelmed with their multiple roles, any amount of paperwork can beperceived as overwhelming. Many of the principals have backgrounds as teachers or in another fieldand do not have a great amount of experience with administering a public school. Many simplyunderestimated just how much organization must go into the running of a school.
The authorizers receive three percent of the state grant to each school. The charter schools pay a 3percent administrative fee to the authorizing agency. This fee covers costs for reviewing applications,issuing charters, and providing oversight to the schools. Many of the authorizers, especially thosewith small schools and or few schools, feel that this amount of money is barely sufficient or notsufficient enough to conduct the oversight required. There is one authorizer, however, which istaking steps to return money to the schools since they feel they receive too much money for theoversight and technical assistance they provide.
Services provided by the authorizers include the following:
O Monthly newsletters. In the case of SVSU, these newsletters have contained, among otherthings, suggestions for professional development.
O Monthly or quarterly workshops or meetings for school directors. These sessions cover topicssuch as the organization of budgets, salary decisions, developing benefits packages, and so on.Department of Education staff have been invited to many of these training sessions since theycan best explain many of the reporting procedures and provide a solid rationale for why schoolsneed to report reliable data on a regular basis.
O In some cases, the PSAs can also receive assistance of third-party consultants paid for by theauthorizing agencies.
Are the authorizing agencies providing appropriate oversight of charter schools? Oversight isa rather new activity, and in many respects, it is fair to say that the authorizers are learning as theygo. Given the experience of the first few years, many of the authorizing agencies are developingrather effective routines that help to streamline oversight activities. They have also been able todevelop comprehensive packages of information to facilitate the schools' operation in terms ofcompliance issues. The authorizing agencies that started later have benefitted from the learningexperiences of the initial authorizers.
Evaluation of the Michigan PSA Initiative 63 The Evaluation Center, WMU
7 2
How expensive is the application process? Many of the authorizers indicated that it is notpossible to distinguish specific expenses, although they indicated that the processing of applicationscan consume between 10 and 25 percent of their total expenditures, depending on the authorizer.
How long does the application process take? After requesting an application form for submittingan application for a charter, it usually takes 5-6 months before successful applicants receive acontract with an authorizing agency. There is, of course, considerable differences among theauthorizers as well as differences that occur from year to year. Once again, it can be pointed out thatthe authorizers that have been working for a few years are establishing sound routines andprocedures to expedite such procedures.
How many visits have the authorizing agencies made to each charter school? At each of theschools we visited, we asked the school principal/director to describe the number and nature of thevisits made by authorizing agencies. Generally, the schools reported receiving between 3 and 7 visitsper year from representatives of the authorizing agencies. Most of the authorizing agencies arrangefor the same person to visit the school each time so that there is some continuity. CMU was notusing this practice during the previous year; rather, they sent a number of persons to the schools,each with responsibility to review specific areas. Some CMU-authorized schools noted that theypreferred how CMU had earlier used regional representatives who made all the site visits.Documentation provided by CMU indicated that the number of visits they made to their PSAs rangedfrom 4 to 27 during the 1996/97 school year. Other authorizers also indicated that they made farmore visits to the schools than the schools themselves had indicated. For example, many of theauthorizers have a representative attend PSA board meetings.
Are the visits by the authorizing agencies to charter schools helpful? At the 51 schools wherewe conducted interviews, the comments from the school principals regarding their particularauthorizing agencies varied extensively depending upon which authorizer they had and how certainthey were that their comments would remain confidential.
Among the four state universities that were authorizing in our part of the state, the schools charteredby Grand Valley State University and Saginaw Valley State University were clearly most satisfiedwith the oversight and support they were receiving. The comments from the directors of the threeschools chartered by Northern Michigan University were generally quite favorable, although onedirector was quite negative. This was most likely due to the director's position that no oversightshould be required and that the staff at his particular school were more qualified than anybody sentby the university.
The comments regarding Central Michigan University's role as an authorizing agency were rathernegative. Questions regarding the role of authorizers were discussed in interviews during our firstround of school visits. The extensive audit of CMU had pushed into an uncomfortable position, anda number of schools claimed that CMU went from treating them in a protective fashion to usingthemin the words of one school directoras its "whipping boy." "The communications from CMUhad turned from friendly letters to legalistic letters demanding compliance."
Evaluation of the Michigan PSA Initiative 64 The Evaluation Center, WMU
73
The CMU charter school office also had a quick turnover of directors. Many of the schools, eventhe one located in Mount Pleasant, were astonished by the fact that the previous director of thecharter school office had never visited their school. When the new director, Jim Goenner, took overthe leadership of the CMU charter school office, a moratorium on authorizing new schools wasissued. Priority was to be given to rebuilding relationships with the schools and putting things inorder before authorizing more schools.
In some cases, the schools did not feel that the persons sent to the their schools were sufficientlyknowledgeable to provide assistance. In line with such criticism, a number of PSA leaders indicatedthat they would prefer to be "free" from their authorizer at some point since they believed that afterthey have established a functioning school they should be treated as any other school district. Theseschools were also interested to retain the 3 percent administration fee that the authorizers receive forproviding oversight.
Is written feedback of the school visitation provided to MDE when requested? Unfortunately,we have not been provided access to this information by MDE. This information is to be containedin the legislatively mandated annual report of the charter schools. Since this (these) reports have notyet been approved for release, we were not allowed to review the information. Some commentsabout this information were provided by an MDE employee. Based upon these comments we canreport that the length and quality of the information provided by the authorizing agencies varyextensively. Not all authorizing agencies have provided the requested information to MDE. It wasreported that CMU provided extensive information about its visits, while the information from otheruniversity authorizers is less extensive. Some of the ISDs that authorized schools provided so littleinformation about their visits that it could fit on a single sheet of paper.
Has MDE been provided with an analysis of the authorizing agencies' expenditures from the 3percent fee, when requested? The Michigan Department of Education does not receive financialstatements from the authorizing agencies. These entities are generally universities with no reportingresponsibilities to the MDE. Public school districts that charter schools may receive theadministrative fee; however, they report expenditures and revenues in total, not by individual revenuesource.
Public School Academies are directed to report the 3 percent fee on their Form Bs as "purchasedservices" under the function code for General Administration (230). No detail of the types ofservices they receive is currently available in reporting documents.
To what extent is each PSA fulfilling its performance contract with its authorizing agency? Thisis a difficult question to answer since the schools vary considerably in their performance and in theirability to demonstrate concretely how well they are performing. On top of this, the authorizingagencies vary considerably in the expectations they set for their schools. Large differences existbetween authorizers, and differences exists in contracts from the same authorizer. Severalauthorizing agencies noted that they have become more stringent in setting high expectations andrequiring more standardized testing.
Evaluation of the Michigan PSA Initiative 65 The Evaluation Center, WMU
As was mentioned earlier in this chapter, there has been a tendency for some authorizers to concealrather than reveal schools that are not living up to their contracts. This fact has also complicatedanswering this question.
Whv have local school districts, intermediate school districts, and community colleges used theirstatutory authority to authorize public school academies to such a limited extent? There are a numberof reasons why eligible organizations have chosen not to exercise their authority to authorize PSAs.For the local school districts, the list might include the following:
O view that charter schools are competitorsO potential conflicts with the unionO failure to gain board support for engaging in this activityO loss of enrollment and revenue for the traditional public schools in the districtO potential of the PSA to draw students from other districts (including private and parochial
schools) and cause strained relationships with colleaguesO disagreement with the concept and the use of public funds for charter schools
For the intermediate school districts, the following reasons are likely to apply in addition to thosereasons mentioned for the school districts:
O potential for loss of support from local school districts (clients) who are opposed to charterschools
O lack of centrality of this initiative to the mission and purpose of the ISD
For community colleges, it seems that the idea of engaging in the charter school initiative as anauthorizer is simply not a priority. At the same time, there may be opportunities for sharingresources/facilities and providing educational opportunities in specialized areas of study compatiblewith the mission/focus of the charter school. In other words, there may be a viable place forcommunity colleges in the charter school initiative, but they don't seem to have the interest,experience, or possible expertise that would be needed by an authorizing agency.
For four-year public universities, there seems to be a growing list of participants; but the reasonsagainst serving in an authorizing role include the following:
O lack of compatibility of this activity with the mission and purpose of the universityO lack of personnel and/or resources to fulfill the expectations of an authorizerO potential conflict of interest and loss of support from public schools from which the university
enjoys support and cooperation for student teaching, internships, research, etc., and the real orpotential threat of the loss of these relationships
O disagreement of the faculty with the conceptO potential for disrupting the balance of enrollments within one or more school districtsO disinterest in engaging in a politically charged agenda item that is not central to the legislative
authority of higher education
Evaluation of the Michigan PSA Initiative 66 The Evaluation Center, WMU
75
O unwillingness to engage in a relationship with specific parties (and their beliefs) that haveapproached selected universities about the chartering/authorizing process
From input that we have received, it is clear that eligible organizations have contemplated and madedeliberate decisions about whether they should become authorizers. At least in some instances, thesediscussions/decisions have included considerations regarding the potential or real local and statelevel political ramifications. More specifically, would future resource allocations to a university beaffected by a politically unpopular stance? How much authority/responsibility would the universityhave for a failing school (PSA)? Would the development and operation of a charter in an areabeyond the normally recognized service area of a university be good use of resources and acceptableto other universities? How would the relationship between the university and the larger communitybe affected by a decision to create a school that would be in competition with the local public andprivate/parochial schools? If the initiative or a school should fail, what are the legal and ethicalresponsibilities for the university?
In summary, there are many reasons why potential authorizers have chosen not to assume this role.The opportunity to attract the 3 percent administrative fee seems to have little impact on thesedecisions. Mission of the organization, relationships with collaborators/clients, and uncertainty ofsupport for the initiative are probably the three major factors that were central to these decisions.At the same time, we have to recognize that informants are not particularly interested in explainingwhy they did not choose an option for which they had a choice that is as politically loaded as is thisissue.
5.4 Management Companies
When we started this evaluation, we had little or no knowledge of the existence and role ofmanagement companies in the charter school initiative. In fact, the RFP makes no reference to thiscomponent. After our first round of school visits, we were made aware of how important andinfluential educational management organizations (EMOs) were for the initiative.
During the 1997/98 school year, just under 50 percent of the schools were contracting out servicesto EMOs. During the 1998/99 school year. This figure jumped to almost 70 percent. There alsoappears to be a trend with a larger proportion of new charters granted to applicants that already haveagreements with management companies. For the authorizers, it is clearly advantageous to haveschools that work with management companies. These schools will have access to capital, less needfor technical assistance and will have fewer budgetary problems.
Relative to other states, Michigan's Constitution is among the most restrictive in terms of use ofpublic funds for only nonprofit and public entities. While the state has tax credits for highereducation, this is not allowed for K-12 education. Nevertheless, Michigan is one of the two mostEMO-friendly states in the country (Arizona is the other). Mintrom and Vergari (1998) haveconducted an analysis of charter school legislation across the country and identify Michigan as oneof the states with permissive legislation.
Evaluation of the Michigan PSA Initiative 67 The Evaluation Center, WMU
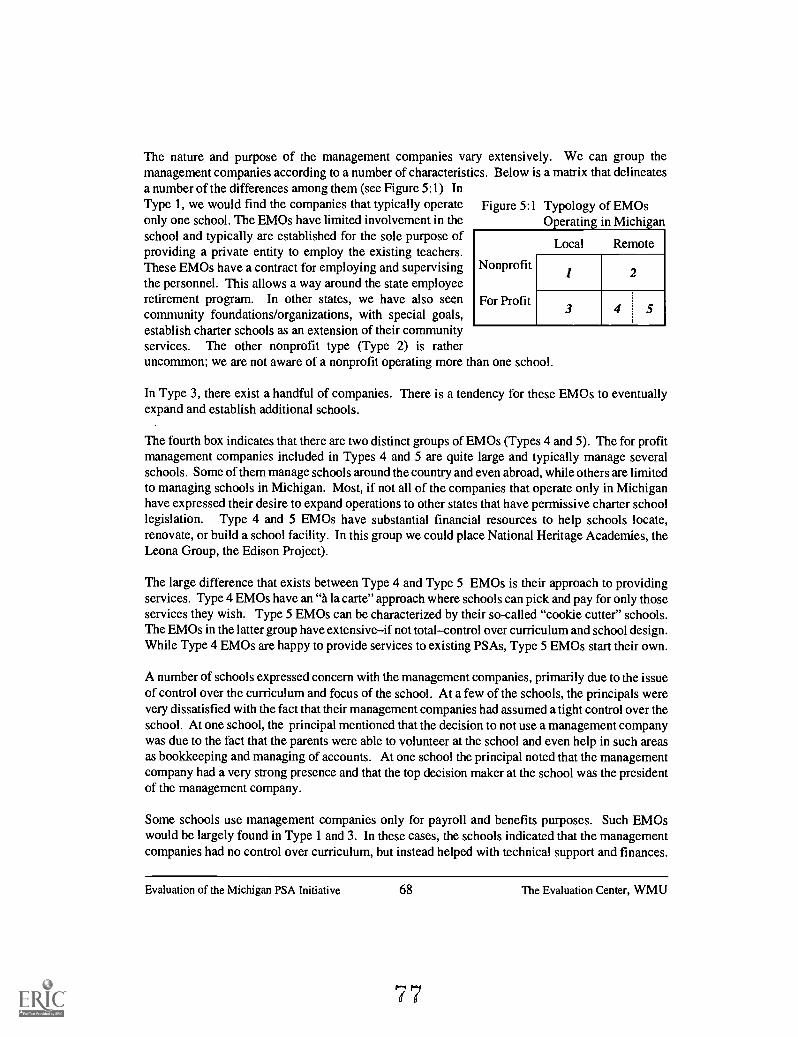
The nature and purpose of the management companies vary extensively. We can group themanagement companies according to a number of characteristics. Below is a matrix that delineatesa number of the differences among them (see Figure 5:1) InType 1, we would find the companies that typically operateonly one school. The EMOs have limited involvement in the Operating in Michiganschool and typically are established for the sole purpose ofproviding a private entity to employ the existing teachers.These EMOs have a contract for employing and supervisingthe personnel. This allows a way around the state employeeretirement program. In other states, we have also seencommunity foundations/organizations, with special goals,establish charter schools as an extension of their communityservices. The other nonprofit type (Type 2) is ratheruncommon; we are not aware of a nonprofit operating more than one school.
Figure 5:1 Typology of EMOs
Nonprofit
For Profit
Local Remote
1 2
3 4 5
In Type 3, there exist a handful of companies. There is a tendency for these EMOs to eventuallyexpand and establish additional schools.
The fourth box indicates that there are two distinct groups of EMOs (Types 4 and 5). The for profitmanagement companies included in Types 4 and 5 are quite large and typically manage severalschools. Some of them manage schools around the country and even abroad, while others are limitedto managing schools in Michigan. Most, if not all of the companies that operate only in Michiganhave expressed their desire to expand operations to other states that have permissive charter schoollegislation. Type 4 and 5 EMOs have substantial financial resources to help schools locate,renovate, or build a school facility. In this group we could place National Heritage Academies, theLeona Group, the Edison Project).
The large difference that exists between Type 4 and Type 5 EMOs is their approach to providingservices. Type 4 EMOs have an "A la carte" approach where schools can pick and pay for only thoseservices they wish. Type 5 EMOs can be characterized by their so-called "cookie cutter" schools.The EMOs in the latter group have extensiveif not totalcontrol over curriculum and school design.While Type 4 EMOs are happy to provide services to existing PSAs, Type 5 EMOs start their own.
A number of schools expressed concern with the management companies, primarily due to the issueof control over the curriculum and focus of the school. At a few of the schools, the principals werevery dissatisfied with the fact that their management companies had assumed a tight control over theschool. At one school, the principal mentioned that the decision to not use a management companywas due to the fact that the parents were able to volunteer at the school and even help in such areasas bookkeeping and managing of accounts. At one school the principal noted that the managementcompany had a very strong presence and that the top decision maker at the school was the presidentof the management company.
Some schools use management companies only for payroll and benefits purposes. Such EMOswould be largely found in Type 1 and 3. In these cases, the schools indicated that the managementcompanies had no control over curriculum, but instead helped with technical support and finances.
Evaluation of the Michigan PSA Initiative 68 The Evaluation Center, WMU
7
For some schools, their limited budgets and the limited scope of such tasks as payroll and benefitsprohibit the use of a management company. Likewise a number of management companies are notinterested in very small schools since they are not as efficient to manage. Several of the schools thatdo not have a management company employ a business manager who shares the administrative taskswith the school principal.
The management companies have authority over hiring and firing in the schools. In a few cases, themanagement company provides a job description for the principal that states that the principal isresponsible for the hiring and firing at that particular site for the management company. In practice,the school principal/director and the school board have influence in hiring and firing since they makerecommendations to the management company.
Several of the management companies are involved in the selection process of board members. Whilethe final decision for board appointments is made by the authorizing agency, the recruitment andrecommendations for board members have also come from the management companies. This is oftenthe case with Type 4 and 5 EMOs.
There is an emerging group of businesses catering specifically to charter schools. They provide arange of services. Some are limited to specific services, while others provide wide variety ofservices. Among the services provided are those listed below:
O busingO lunch and foodO special educationO loansO financial advice
O accountingO loansO legal adviceO personnel recruitmentO payroll and benefits
Below are some of the comments provided by the school principals regarding managementcompanies.
O The principal at one school said that, aside from the fact that the management companies mighttake 10 percent of the budget in return for their services, there is a big issue here of control. Hesaid that the school would not be comfortable with someone else getting involved. "Would theybe compatible with our goals, our beliefs, our values?" The principal said that "managementfirms are obviously in it to make money. When you're in it to make money, unavoidablydecisions will be influenced by this, and what is best for students and corporations might be inconflict. We are not doing this for the profit motive." The principal said that the schoolboardwhich has some quite savvy people on itprovides advice and the sort of consultationthat a management company might be able to offer. Although the school does not make use ofa management company, the staff formed a corporation. All the salary components of theschool's budget goes to this corporation. The staff, through the corporation, subcontract theirservices to the school board. The motivation for this was purely to avoid having to follow theguidelines and rules governing the employment of government workers in Michigan.
Evaluation of the Michigan PSA Initiative 69 The Evaluation Center, WMU
O "For the most part, our school provides all its own services. Unlike some other charter schoolsthat have begun to contract with other school districts or management companies fortransportation, and lunch services, this school makes do alone or with parental support. Forexample, parents transport their children to the school. The children bring their own lunches.The school contracts with specialists, where necessary, to help with special education students.The one aspect where our school contracts for services is in the area of employment services.The school does not employ any of the teachers or staff itself. Rather, they are employed by aseparate company. This company provides employment services to other firms, but this is thefirst charter school it has provided with services. The company's success with this school hadled them to begin looking for other business with charter schools. The major reason for usingthis company was to avoid having to make payments into the Michigan Public ServicesRetirement Fund (MPSR). "Instead of having about 16 percent of the payroll going to the MPSRfund, now only about 5 percent of it goes into retirement benefits, in the form of contributionsto a 401k plan. Beyond this 5 percent of payroll, the school also pays a fee for the servicesprovided by the company, but the combined costs are still lower than if the staff were treated asstate employees. For employees, this means that the major difference is that they now have adefined contribution to a retirement account rather than having a defined benefit to be paid in thefuture."
0 "Our school employs the services of a professional accountant and a lawyer. It also contractswith the local school district for the provision of lunches for some of the students. This is theextent of involvement with outside parties. We have been approached by several managementcompanies, but we have a philosophical disagreement with the presence of these companies."The principal said that she did not believe anyone should be making a profit from education. Shesaid that management companies are only interested in making a profit and that the people inthem have no personal commitment to education. The principal also said that when she hasspoken with management companies, she received the impression that the first thing they wouldlike to do is expand the enrollment of the school because this would allow them to make moremoney. Further, she was concerned that some management companies have a lot of say over thehiring and firing of teachers and principals, and that the companies can make recommendationsas to who sits on the school board. The principal said that she wanted to keep a family focus inthe school and ensure that people involved in the school were there because they wanted to makea personal commitment to the education of the children there. The school principal has madesome trade-offs for herself and her staff by wanting to keep tight control of all school-relatedissues and not wanting to work with management companies. For example, she noted elsewherein the interview that she would like to have the teachers pay into a 401k retirement plan, not thestate retirement plan as they presently do. But this is exactly what working with a managementcompany would allow. Also, she gets overwhelmed with the paperwork aspects of her job. Shesaid that she is principal, administrator, and still likes to teach. Potentially, a managementcompany could relieve her of some of these burdens. Finally, management companies can serveas a source of finance for charter schools. The principal said that one of the big problems forcharter schools is that, unlike traditional public schools, they do not have a district office to helpthem with administrative matters.
Evaluation of the Michigan PSA Initiative 70 The Evaluation Center, WMU
P-,6 3
O ?We would be happy to work with a nonprofit agency that assisted charter schools. Our schooldoes not use a management company, even though our authorizing agency has recommendedthis."
Among the major problems that PSA administrators face are (i) being overwhelmed with paperwork,(ii) financial issues and bookkeeping, and (iii) lack of resources. In fact, these are the three areas inwhich the management companies provide assistance. There is clearly a symbiotic relationship thatexists between many of the PSAs and their management companies. A number of rather seriousissues have arisen due to the presence of the management companies. Among them are thefollowing:
O While the PSA initiative was intended to promote parent and teacher influence in the schools,we find EMOs that start and run the schools according to their own visions and motives.
O While the logical development of the relationship between a PSA and a management companydevelops when the PSA searches for a management company to provide for its particular needs,we are not so aware of the increasing phenomenon of management companies who go in searchof a "community" to host its schools. In fact, at several schools we were informed that theimpetus behind the school was not a local group of parents or educators; rather, it was themanagement company.
Evaluation of the Michigan PSA Initiative 71 The Evaluation Center, WMU
80
Chapter SixInnovations in the Public School Academies
As a part of the Michigan legislative action that created the opportunity for charter schools (publicschool academies) to be developed, Section 511a of the Revised School Code provided a list ofprimary purposes for this action. Listed among the 6 purposes was "to stimulate innovative teachingmethods." While not specifically included among the several evaluation questions in the RFP forthis study, we added the following questions to investigate.
What, if any, innovative teaching methods or educational practices have been stimulated bythe charter schools? To what extent are these transportable to other schools (charters andnoncharters)?
As we became involved in the data collection phase of this study, it became clear that there arenumerous operational definitions of "innovation." In our interviews and on-site observations, weaccepted the local definitions of innovation as we recorded them in field notes. However, there is aneed to establish a definition of innovation that is credible among educational professionals and otherexternal audiences, yet reasonably reflective of local perceptions. Generally, innovation is definedin recognized dictionaries, e.g., Random House, Compact Unabridged Dictionary (1996), as"something new and different that is introduced." Even with this definition, does this mean that forsomething to be innovative it must be totally new and never observed in another school setting; orare there degrees of innovation, i.e., something that is infrequently found in other school settings?Also, should we consider anything that is new and different, even if it appears to have negative orno impact on the success of the school?
A seemingly more liberal definition of innovation is provided by Rogers (1995) in which he definesit as "an idea, practice, or object that is perceived as new by an individual or other unit of adoption."As one will see later, a number of "innovations" are reported by individuals associated with thecharter schools; to them, these may be new, but experienced educators would likely not agree.
To be reasonable, we will consider and report examples of educational practices that seem to beinfrequently found in most schools at this level. This information about possible innovations wasgathered via on-site interviews and observations of school practices and by written/printeddocumentation provided to the evaluation team by the school. Also, we broadened our search forinnovations to include not only "teaching methods," but also innovative educational practices. Thefollowing sections, 6.1 - 6.3, relate to innovations in management, operations, and technology andthe potential for transportability of innovations to other school settings. Sections 6.4 - 6.6 pertainto more evaluative judgments about programs and practices found and/or needed in the charterschools.
Evaluation of the Michigan PSA Initiative 72 The Evaluation Center, WMU
S I
6.1 Innovative Practices in Instruction, Management, and Operations
In the area of instruction and teaching methods, some of the innovations are listed below.
O specific focus of a curriculum, i.e., Native American, African American, fine arts, agriculture,ecology, etc.community activity experiences for students with a mentor (K-12 school)set aside time (-30 minutes/day) for readingco-enrollment of high school students in community college coursesmultilevel (grade/age) classroomsbefore and after school activities programIndividual Education Plans (IEPs) for all studentssmall class size with additional adults (aides or volunteers) assisting the teachergreater individualizationuse of teaching assistants and volunteers in the classroomMontessori methods
Other practices described by the schools as innovative, but clearly not new to schools generally, are
cooperative learningChicago math and Saxon mathsmall and large group instructionlearning labsforeign languageoutcomes baseddirect approach/differential approach to instruction
The practices listed above may be perceived as innovative in some quarters or something less thaninnovative by others. More importantly, there is little evidence that these practices have a positiveimpact on the achievement of the students or the overall success of the school.
In terms of school management and operations, we saw some practices that are quite different fromthe regular public schools. Obviously, some of these come as no surprise because the legislationeither dictates or specifically authorizes such an arrangement. For example, the involvement ofauthorizers and nonelected governing boards are characteristics of Michigan PSAs. We have notincluded practices related to these entities as a part of this section on innovations. Other educationalpractices cited or recognized as infrequently occurring with regard to the broad area of schoolmanagement and governance are listed below.
O school founders self- or board-appointed as administrative heads/managers of schoolsO use of for- and not-for-profit management companies for diverse services ranging from the
provision of limited financial services to general management of a schoolO contracting for instructional services with a private company as opposed to employing
individuals as teachers
Evaluation of the Michigan PSA Initiative 73 The Evaluation Center, WMU
62
O renovation of a variety of structures/buildings for school useO nepotism in employment of spouses and sons/daughtersO acquisition of bank loans and acquisitions of property for the development of schools and
campusesO parents responsible for transportation of students to and from schoolO absence of lunch program for students, especially the lack of free or reduced meals for students
with demonstrated needsO personal assumption of school indebtedness by founder and/or parentsO shared or sole decision-making by teachers in selected areas
The practices listed above as innovations in the realm of school management and operations are notgenerally found in all charter schools. Each school, with the exception of those with contractedmanagement responsibilities, seems to have its own characteristics. However, we found forms ofthese innovations in one or more schools. Those under the management of private companies havedegrees of similarities, particularly in the area of business functions. Interviews with managementcompany representatives indicate that they see the potential for profits or savings in more effectivebusiness practices. Having a single office serve as a business office for multiple schools providesan economic benefit that could be similarly found in centralized business operations in a regularschool district.
As one examines the innovations identified with school management and operations, questions couldbe raised about the desirability of some of them. For example, is it desirable that the managementof a school or key positions are held by persons in the same family? Potential conflicts of interestare inherent in family relationships between employee and supervisor and between the schooldirector and the owner of a contracting business. Are reasonable forms of accountabilitycompromised in these situations? With limited opportunity for generating income and lack ofassurance of a long-term charter, is it a good business practice for nonprofit organizations to becreated and incur an indebtedness for the operation and/or construction/remodeling of a public school(public school academy)? Does the absence of free transportation and free or reduced-price lunchesfor charter schools create an undesirable selection factor? Are there advantages or disadvantageswhen teachers are employees of a private company, as opposed to the traditional form of schoolemployer/employee arrangement?
In total, there are clearly a number of innovations in school management and operations. However,there are no convincing arguments or evidence that all of these are legally or ethically desirable. Inthe future, considerable attention should be addressed to these key issues.
6.2 Educational Technology
In discussions with charter school representatives, whether teachers, administrators, or parents, theconcept of technology is almost totally confined to computers. Other forms of technology are seldommentioned or identified as a point of discussion. In promotional materials for charter schools,especially informational materials widely disseminated in communities to attract students, greater
Evaluation'of the Michigan PSA Initiative 74 The Evaluation Center, WMU
83
access and use of technology or computers are often stated among the advantages of charter schoolsover their regular public school counterparts.
On-site visits to the charter schools in Michigan provided us with an opportunity to see whattechnology is available and some idea of how much and in what ways it is being used. Overall,computers are available in classrooms or in centralized laboratories in almost every school. In anumber of the schools, teachers have a dedicated computer for their use; and it is primarily used forkeeping records, preparing student materials, and/or demonstrating particular forms of software.While clearly not based on a substantial amount of data, we perceive that teachers and administratorshave limited knowledge of the potential uses of computers for instruction and/or classroom/schoolmanagement. A number cited their desire to have training in the use of computers.
As to student use of computers, there is a broad spectrum of use being made of computers. In mostschools, software packages have been installed for word processing, developing presentations, accessto the Internet, references/encyclopedias, games, and some specialized subject matter programs. Insome schools there is a "computer literacy" requirement, and in many schools students are taughtkeyboarding skills. In some instances, we observed students writing papers for classes, developinggroup presentations, and engaging in drill activities to hone their knowledge and skills in a particularsubject area, i.e., math, language arts, etc.
What we did not see in the use of technology may have been the most revealing. Seldom, if at all,are the Michigan charter schools equipped or planning to make use of distance education technologyor programs. Among these technologies would be satellite, compressed video, and interactivecomputers. Many of the current charter schools have characteristics common to regular smallschools serving rural communities throughout the country, i.e., limited student enrollment; lack ofhighly specialized teachers; limited ability to offer specialized or advanced courses in science, math,and foreign languages especially at the high school level; etc. To overcome these problems, smallschools have turned to the use of distance education to meet a number of these needs. We weresurprised that the smaller charter schools had not recognized or at least considered the capabilitiesof the various forms of distance education.
Start-up as well as maintenance costs for technology are significant, and this could be a reason forthe current lack of extensive use of technology in the charter schools. Some schools had receivedgrants or gifts for the purchase of equipment, and others reported that they had sought moniesthrough various channels for purchasing computers with mixed success. In the schools themselves,the facilities for housing computer student stations or labs ranged from a variety of makeshiftarrangements to well-designed laboratories.
There is little evidence to indicate that charter schools have made greater or more innovative use oftechnology/computers than a typical regular school. Generally, charter school teachers are minimallyprepared to use the computers and probably less knowledgeable about the potential uses/benefits ofother forms of technology. In addition, there is seldom a technology coordinator associated withcharter schools. In the absence of such a person, various committees of teachers and, on occasion,parents or board members serve in that capacity.
Evaluation of the Michigan PSA Initiative 75 The Evaluation Center, WMU
84
It is fair to say that technology is appropriately viewed as a tool, and unless a teacher can see benefitsfor students or more economical use of time for him/herself, there is little hope or expectation thatgreater interest and use of technology will occur. Without this recognition and support, expendituresof monies from regular school revenues for technology will not likely increase in any significantamount.
6.3 Transportability of Innovations to Other Schools
For over 30 years, a body of research has been developing in relationship to the acceptance anddiffusion of innovations and exemplary educational programs. With the development of the"alphabet curricula," i.e., ESS, SCIS, HPP, S-APA, BSCS, etc., the National Science Foundationspent hundreds of millions of dollars developing new approaches to teaching K-12 science andmathematics. The existing practices of dissemination and implementation included summer andacademic year training of potential leaders or trainers of trainers and inservice training programs forschool faculties. Most science educators and curriculum directors would judge these efforts as onlypartially successful. During the 1970s, Gene Hall and Shirley Hord (1987) developed the ConcernsBased Adoption Model (CBAM) to explain and predict the adoption and implementation ofinnovations, and the innovation-decision process is depicted as five stages in Diffusion ofInnovations by Rogers (1995, p. 162). These stages are described below.
1. Knowledge occurs when an individual (or other decision-making unit) is exposed toan innovation's existence and gains some understanding of how it functions.
2. Persuasion occurs when an individual (or some other decision-making unit) formsa favorable or unfavorable attitude toward the innovation.
3. Decision occurs when an individual (or some other decision-making unit) engagesin activities that lead to a choice to adopt or reject the innovation.
4. Implementation occurs when an individual (or other decision-making unit) puts aninnovation into use.
5. Configuration occurs when an individual (or some other decision-making unit) seeksreinforcement of an innovation-decision already made, or reverses a previousdecision to adopt or reject the innovation if exposed to conflicting messages aboutthe innovation.
Within the time frame that charter schools have been in existence in Michigan, it is probably notreasonable to expect that much noteworthy transfer of innovations to the regular public schoolswould have occurred. With respect to the steps listed above, we suggest that most actions are stillwithin step 1, i.e., the innovations' existence and understanding of how they function are beinglearned. With regard to CBAM, one of the earliest predicted concerns by teachers about theinnovation would be the negative impact of the innovation on their students.
Evaluation of the Michigan PSA Initiative 76 The Evaluation Center, WMU
8 5
Other efforts to identify and validate exemplary educational programs and disseminate these wereundertaken by the federal government with cooperation within each of the states through the"National Diffusion Network." Of course, the ERIC system has been operational for many yearswith a general mission of providing information across a broad spectrum of subject areas. Further,the many professional organizations and other groups/companies who cater to the professionaleducation community provide information about "innovative practices" in various forms, i.e.,professional meetings, journals, training, product/program, literature, etc. In fact, the charterschools' organization (Michigan Association of Public School Academies) disseminates a periodicnewsletter and conducts an annual conference in which exemplary programs/practices arehighlighted.
In summary, there are many opportunities for charter schools to learn about innovative practices.Since all of these schools are newly developed, with the exception of the relatively few convertedprivate or parochial schools, one might expect that innovative practices would be frequent andwidespread. However, such is not the case. We found unpredictably few clear innovations, whichwould not suggest that transportability is an immediate expectation. In fact, we found the charterschools to be remarkably similar to the regular public schools, with the notable exceptions ofgenerally smaller student enrollments, the presence of additional adults (teachingassistants/volunteers) in the classroom, governance, and span of contracted (management) services.
Evaluation of the Michigan PSA Initiative 77 The Evaluation Center, WMU
83
Chapter SevenDemonstrating Success
7.1 Indicators/Evidence of School Excellence
The need to demonstrate school success, especially student achievement, is almost universally foundto be a challenge, if not a major problem. This is not to say that the schools are not successful orstudents are not learning. However, the founders and key personnel in many of the PSAs areuncomfortable using the traditional measures of success (standardized tests), and they have not beensuccessful in identifying or at least in reporting results in other defensible/persuasive ways. We aretroubled by the many misleading reports about student success found in newspapers and otherpublicly distributed materials. Oftentimes, these reports are based on selected and very small(inappropriate) samples without properly identified comparisons or adequately explanatoryinformation about the measures themselves. While a waiting list of students is an indication ofparental desires, by itself it is not a sufficient indication of success or demonstration ofaccountability.
Many schools claim that the single, most important piece of evidence is that parents choose theirschool for their children. While most of the schools are filled, there are high rates of attrition amongteachers, students, and even principals in many of the schools. Due to the limited indicators onattrition, we were dependent on the school supplying this evidence, and in some schools the dataprovided clearly contrasted with other sources of information.
The school principals were asked about the factors that contributed to the success of their schools.Small size of the school and the classrooms was an often cited factor. The commitment anddedication of the staff was another often referred to factor. In a few schools, the principals attributedthe success of the school to the capabilities of their school boards. Additionally, a few principalsattributed the success of the school to their own work and experience. Other frequently cited factorsincluded the clearly defined purpose and set of expectations for the school; the absence of "labeling"students into various groups. Three principals felt that their schools could not be consideredsuccessful.
Below we include a sample of some of the responses regarding factors behind the success of theirschool.
0 One school principal stated the factors of success for this school are as follows. Classes are notgraded and the school has small class sizes, of between 15 to 20 students. There is less emphasison lectures and more on engagement, group discussion, conversation, and so on. The school hasan extended the school year, running for 191 days rather than the standard 180. The school has
Evaluation of the Michigan PSA Initiative 78 The Evaluation Center, WM U
87
a three week summer session which students are required to attend. This summer, the school willoffer courses on: film theory, college planning and visitation, woodworking, Michigan history,art history, and national parks. In January of each year, the school asks teachers and students forsuggestions for the summer core course offerings. The teachers, along with the principal, refinethe list to the final set of offerings. Next, the school figures out how to raise funds to supportthe activities. The students have engaged in things like weekend car washes to help pay thesummer school costs. The school principal said that the success of the school could be attributedto: the dedication and commitment of the staff; and the clearly defined purpose and set ofexpectations.
O One school principal said that her many years of experience was important for making the schoola success. She stated, "Starting up a school is such a challenge. It is almost impossible to createa charter school without experience." The principal commented that the principal should knowthe laws, know about different learning styles, how to evaluate the staff, and find ways todemonstrate that the school is doing well.
O One school principal attributed the success of the school to its narrow focus and the commitmentof the staff.
O The principal of one school said that a lot of people are very committed to the school. Forexample, the board had a meeting about the development of a new building. Two out of threeof the teachers came to the meeting, and a third of the parents came along. The principal alsosaid that there has been a lot of stability in the school over the years in terms of personnel,although this is not the case with the certified teachers.
O One school principal who did not believe his school was successful said he thought that thingsare beginning to stabilize in the school. He said that they have introduced a spoils program tohelp develop a sense of belonging. The principal said that the teachers at the school are verycaring. "Things here are not great, but we are working on it. My goal is to see all studentsgraduate from high school."
O The principal of one school said that the teaching staff are wonderful. They buy into and enjoywhat is going on in the school. The principal said that, if she were to leave, there are now threeor four teachers in the school who could readily take over from her. The school board is also anexcellent source of strength for the school. It has parents and community leaders on it who caredeeply for the future of the school.
O One school principal thinks the most important things are good leadership and the excellent staff.
O One principal commented, "The school is not really a success at this stage. There are someproblems that need to be worked out." The structure of the school might be appropriate, butthere are problems with the culture of the school.
Evaluation of the Michigan PSA Initiative 79 The Evaluation Center, WMU
O The teachers of one school all agreed that the small size was important to the success of theschool. This made a difference across a range of matters. A topic that came up at a staff meetingconcerned the composition of the classes for the following year. The teachers talked at lengthabout certain children and the teachers who would work best for them. They also talked aboutthe composition of the class groups and how to ensure that all the children with strongpersonalities were not included in the same group. One teacher said to me, "You'd never see thissort of careful discussion in a traditional school. They are too big to have this sort ofdiscussion." The small size of the school also produces a "family atmosphere." The word familywas used often. The mission of the school involves trying to extend the notion of family toinclude the community and school. Another teacher said that an important feature of the schoolis that children are not categorized. A criticism of traditional schools is that they tend to "label"and then dispense with, or give up on, children with special needs. In this school, that does nothappen. Children with special needs are kept with the whole group and they are not singled outor labeled. Another teacher said that they subscribe to the view in this school that "If kids aren'tlearning, then you're not teaching." They try hard to find ways to reach out to and to makeconnections with their children.
7.2 How Effective Are Charter Schools With Large Amounts of Start-Up Monies?
While this question was included in the RFP for this evaluation effort, a better question might be,"How does the lack of start-up monies affect the operations and effectiveness of charter schools?"Charter school founders and directors provided the following answers to this question:
O Buildings/facilities were hurriedly acquired and "make-do" repairs to meet codes wereaccomplished within a few months or even days before the school was scheduled to open.
O Only essential supplies and materials were purchased; often major cost items, e.g., computers,were delayed.
O Teachers (and administrators) were paid late during the first few months, and in some casespersonal loans from founders or board members were extended to these employees.
O Short-term/bridge loans were obtained from local financial institutions, often on the reputationor the signature of board members.
O Much of the attention and time of charter school boards were devoted to financial matters.O Management companies solicited contracts with schools that were known to be in financial
difficulty.
Most schools with "large amounts of start-up monies" were developed or are being operated by amanagement company. PSAs with substantial financial backing are able to
O build or purchase facilitiesO devote time and resources to promotions and student recruitmentO offer better salaries and fringe benefits for teachers and staffO purchase/obtain furniture, equipment, etc.
Evaluation of the Michigan PSA Initiative 80 The Evaluation Center, WMU
89
Those PSAs without adequate start-up monies find it necessary to devote larger portions of theirmonies to finding and retrofitting commercial buildings for use as schools. As a result, this limitsthe expenditures for direct student services. Whether this has a direct effect on student learning isunknown; but it is reasonable to assume that low teacher salaries were not attractive to manyqualified and experienced personnel, and students did not have access to resources, i.e., computers,library materials, etc. In interviews with board members and other school officials, it is common tohear stories about how founders or others who arranged for second mortgages on their own homestook out large personal loans to offset initial expenses of the charter schools and even used personalcredit cards for initial expenses.
To establish one school, it was reported to the evaluation team that the Edison Project spent $1.5million on start-up costs. Of these costs, one third covered salaries for four weeks of training forteachers before the school opened, one third covered the costs of buying computers for each familyin the school, and the other third covered the costs of facility updating, wiring, painting, etc.
At another school, it was reported that more than $1M had been raised from donors. The informantdeclined to name the donors or the specific reasons why they contributed to the founding of thisschool.
In a number of locations where the charter schools were founded and are now managed by theNational Heritage Academies (NHA), this for-profit organization has provided substantial resourcesin the form of start-up support. For example, NHA builds and owns the buildings and leases themback to the school. (It is our understanding that purchasing the school building is not an option inthese cases.) For 98 percent of the school's revenue, NHA provides management services thatinclude curriculum/technical support, salaries for employees, special education consultants,accounting, marketing, etc.
Another school that had identified the use of technology (computers) as a central part of itsinstruction and focus was nearing the time of opening when the appointed director discovered thatno computers had been purchased and there was no money available for that purpose. Consequently,the school detached itself from its founders, made some dramatic changes in its focus, and madearrangements to work with a management company as a means to address severe financial issues.
Reasonably, school leaders not faced with large financial problems should have more time andresources to devote to improving the instructional opportunities for children; the school should enjoya more stable operational beginning; and it should be more physically attractive and functional. Dothese actually happen in practice? The answer is both "yes" and "no" because this seems to dependon an array of factors, acting singly or interactively. For example, some schools operating undercertain management companies appear to operate at a highly effective level. However, it is unclearwhether this is due to the availability of start-up resources of the company or some other factor, i.e.,better teachers, more effective accounting procedures, defined operating procedures, etc., or acombination of factors.
Evaluation of the Michigan PSA Initiative 81 The Evaluation Center, WMU
90
Do the better funded PSAs produce greater student achievement? We simply don't have the data toindicate one way or another, and it is doubtful that any study will be able to identify the true or actualimpact of differential levels of funding on schools or on the educational progress of students. Inother parts of this report, we provide information and some interpretation of MEAP results, but theseat best provide tentative descriptions of the students who are enrolled in the schools and not theactual achievement that could be attributed to any particular school. Over time, one might be ableto analyze the academic growth of students during the time they are enrolled in the charter schoolsand gain some understanding of trends. However, we must be cautious and ensure that we are in factassessing achievement in areas appropriate for individual schools and compatible with theexpectations of individual schools and charter schools generally. Whether these expectations aredifferent from the traditional public schools may not be adequately addressed in the applicablelegislation, rules/regulations, and charters. A school that identifies at-risk and traditionallyunderachieving students as their target population should not be criticized for overall lower scoreswhile, at the same time, a school that targets a traditionally higher achieving group of students isbeing applauded.
7.3 What Are the Affective and Effective Outcomes for Students Attending PSAswith a Cultural Focus?
This section title outlines one of the specific questions to be addressed for this evaluation. Data forthis question simply do not exist in any defensible way. However, we acknowledge that this is animportant consideration and there is a need to study this issue; but within the scope of this evaluation,we have not been able to develop an objective and valid response.
While teachers, administrators, parents, and even students themselves report that they are generallyhappy with the PSA that they now attend, there is weak evidence that there are differences betweenschools with a cultural focus and those that have other foci.
Information from interviews indicate that the founder and teachers of one such school intend tointroduce African-American children to their heritage and history, but this emphasis is not at theexclusion of teaching other knowledge and skills. The director reports that "a strong emphasis isplaced on reading, mathematics, and foreign language learning (French, Spanish, Japanese, andSwahili, which are taught by language specialists)."
7.4 Has Accountability for the Educational Performance of Students BeenAssumed at the School Site Level?
This question seems to be based on the premise that accountability for educational performance inthe traditional public schools is not at the school site level. We are not convinced that this is anaccurate assumption, particularly in light of the school-based management efforts over the pastseveral years and the normal reporting of student performance data on a building-by-building basis.While these data may be aggregated by school districts at the state level, local schools have these data
Evaluation of the Michigan PSA Initiative 82 The Evaluation Center, WMU
disaggregated by a number of categories, i.e., gender, grade level, building, and even teacher in manycases.
Since charter schools/PSAs in Michigan consist of a single school site and each is singly charteredto operate, there is really no other way that performance data can be reported. However, we oftenhear the following comments (which are certainly not new to charter schools).
O We cannot be held responsible for the poor education these students had in earlier years.
O This school has targeted students with poor academic backgrounds, and we hope only to improvetheir learning, not correct their past failures.
O We are being sent the problem kids and those with learning/behavior disorders (by the localpublic schools).
O The MEAP tests do not provide an assessment of what we are trying to accomplish.
In other words, there are pockets of denial even in the charter schools about where the ultimateaccountability for student performance should lie. At the same time, charter schools are acutelyaware of the fact that they must be attractive to the students and parents if they are to survive, andone would hope that demonstrated accountability for student performance would be one factor in aschool being attractive. In summary, we do not see substantial changes or innovative ideas abouthow accountability of student performance is being assumed at the school site level other than bydefinition of the charter school itself.
7.5 Evidence of Student Success
At each of the schools we visited, we asked the principals or directors of the schools about evidenceof student success. Because many spokespersons for the PSAs are critical of the use of MEAP testscores, it was surprising to hear many schools suggest this as part of the evidence that their studentsare succeeding. In fact, we suggested that since their missions were unique, so should the evidenceof success they provide. We even suggested alternative pieces of evidence such as letters fromparents, awards that students won, etc.
Several schools only employ standardized tests to measure student achievement/success either dueto the difficulty of measuring achievement/success in other formats, as stated by several principals,or due to other factors. Several schools list the MEAP test as their only evidence of studentsuccess/achievement, whereas others list the MEAP test and various other tests as their only evidenceof student success/achievement. Several schools also list factors such as enrollment, reenrollment,and attendance as evidence of the success/achievement of students. A couple of schools mentionedcommunity awards and college scholarships as evidence of student success/achievement. Otherprincipals stated that the students' change in behavior, character, and morals during school isevidence of the success/achievement of students. A couple of principals commented on goodcommunications with parents as proof of student success/achievement.
Evaluation of the Michigan PSA Initiative 83 The Evaluation Center, WMU
J2
Below are included additional examples of responses from individual schools.
O One school listed the MEAP test, California Achievement Test, and the High School ProficiencyTest as their evidence of student success/achievement.
O One school noted MEAP test results and "behavior changes, for example, a decrease in crueltyto one another, a decrease in violence (last year several fights, this year one), a decrease instudent suspensions (last year 5-6, this year 3) as evidence of student success/achievement.
O One school listed the High School Proficiency Test scores as evidence of student success as wellas stating that "anecdotal evidence suggests that the students are gaining a lot from theorganization of learning in the school. In particular, some students appear to be thriving throughthe opportunities for taking courses with the community college that are provided at the school."
O One school principal said, "the school has a lot of at-risk students" and that "such students oftenengage in bad behavior." However, the principal said that she and the teachers have noticedimprovements in student behavior and that parents report better behavior as well. In addition,the principal said that attendance rates have increased over time. The school uses incentiveschemes to try to modify student behavior. If students are well behaved during the week, theybecome eligible to see a movie, or have ice cream, or play some special games on Friday of thatweek.
O One school principal stated that student success/achievement is difficult to assess. The principalnoted that there are some students who come to the school on the bus from the suburbs. Initially,other people living nearby these families questioned why they would send their childrendowntown for school. But as the people in these neighborhoods have seen the pleasure thechildren are getting from school, they have begun to seriously consider sending their ownchildren to the school. So this would seem to be some evidence that positive things arehappening in this school.
O One school is making use of CTBS tests in the fall and spring, as well as employing MEAPresults to aid in determining the success of the students. The principal also stated, "there is someanecdotal stuff about behavioral problems being addressed. Partly, as special educationaccommodation has occurred, behavior problems have abated."
O One principal stated, that "you can observe obvious differences in the school hallways in thebehavior of students. The children are doing respectful things." While gathering informationand surveying, the impression was that the school is very orderly. The students were respectfulin the classroom and they seemed to play well together.
O According to one principal, "evidence of success at their school was the fact that students areprogressing both academically and in character from when we received them. Our students havebeen rewarded for character traits and social studies essay contests." Another piece of evidenceof success is in the parental approval and reenrollment.
Evaluation of the Michigan PSA Initiative 84 The Evaluation Center, WMU
93
O Aside from MEAP and the Metropolitan Achievement Test, one principal said that studentsuccess/achievement is difficult to pin down, but that she looks for evidence that students loveto be educated. She listens for children saying, "I love school," or parents reporting that "hewants to do his homework."
O One principal commented that "informal classroom assessments and the Terranova tests are given. . . ." to provide evidence of student success/achievement.
O As well as gaining evidence of student achievement/success from the MEAP test and theMetropolitan Achievement Test, one principal said that "Next year the school will look moreclosely at issues to do with student character and social growth. Students in this school havecommitted crimes in the public schools. One made bomb threats. They seem to be doing betterin this school, but there is a long way to go."
O One principal noted that detentions, vandalism, and rudeness, etc. have all dropped in frequency.She said that she "was surprised when the school opened to see so much vandalism by thestudents. The school has closed-circuit TV, so that student behavior can be monitored. Parentscan be shown evidence of bad behavior if need be." The principal also commented on a studentin the 8th grade who requested to be kept in that grade for another year. The student said to theprincipal that when she first came to the school she was reading at 2nd grade level. Now she isreading at 5th grade level. The student said that by staying on for another year she would be ableto get up to or beyond her grade level, and thought this would be a positive thing.
O The principal of one school received a card from the parent of a student in the school. The parentis also a board member. The child has had a lot of problems. Before coming to the school, hehad been suspended or expelled from 20 childcare centers and one kindergarten by age five. Theprincipal spent a lot of time with the student and she began to think that he had problems of amedical, not just a social, nature. So she had two doctors examine him and they concluded thathe had attention deficit disorder (ADD) and was hyperactive (ADHD). This is what was writtenin the card:
To all of the great teachers at XXXX Academy,I find this the perfect time to show our most sincere appreciation to all of you for the manygreat things you have done for my children and me. It is such a wonderful feeling to see himenjoy his childhood, his school, and even friends. What a changed young man he is becausea group of people made it their goal to change him, and not give up on him like so many peoplehad done before. I'm so proud to be a part of this school because of the team that steers theAcademy in the right direction. My gosh, what a first year. What an impact. What a family!Words will never be able to express the thanks or gratitude that is due to each and everyone ofyou.
O Aside from the MEAP test and Metropolitan Test results to gather some evidence of studentsuccess/achievement, one principal said that "students are able to define the meaning of different
Evaluation of the Michigan PSA Initiative 85 The Evaluation Center, WMU
morals." He said that communications with parents are good and that teachers and parents arereporting improvements in student behavior. He said that the aim in the school is to build aconscious climate of good discipline, and he thought that this was happening.
0 One principal said that each morning she has a school assembly, and she uses this as a "bullypulpit" where she tries to help the students with character building. Students then come up withwords, e.g. nonviolence. The school has a "house system" like in private schoolsthat isdesigned to develop norms of good behavior in student groups. The principal also stated thatMEAP, the California Achievement Test, and the High School Proficiency Test were also usedas evidence of student achievement/success.
0 Achievement is measured at one school "primarily by attendance." The grading system is basedon a point system and students cannot get points without attending. These are "intelligent kids;attendance is the primary drawback." The school also uses standardized tests to measureachievement (MEAP, etc.). Achievement is also measured by academic credit earned andgraduation rates. Evidence of success included the following: "graduation rates, increase instudents' self-esteem, level of acceptance among students, college scholarships, two studentsreceived awards from the County Art Expo. With time, students become more respectful, theydevelop better social skills, and they are working together collaboratively."
Graduation rates. Graduation rates can also serve as an indicator of success. Unfortunately,more time is needed before this can be a valid indicator of a PSA's relative success. Few PSAsprovide instruction at the upper-secondary level, but among those schools we can make a comparisonbetween the PSAs and their host districts. Table 7:1 below illustrates the graduation rates for PSAsand their host districts for the 1995/96 and 1996/97 school years. Figures indicating the differencebetween the PSAs and their host districts are also included in the table. When interpreting the data,one should consider that the total number of students in the PSAs is very low, so the figures canchange extensively from year to year. For example, in one year the number of students graduatingcan triple in a PSA, which might reflect an increase of only 3 to 5 more students. Furthermore, thereader should note that some schools listed in the table are alternative high schools, in which casea comparison with the host district may not be the most appropriate.
Evaluation of the Michigan PSA Initiative 86 The Evaluation Center, WMU
j5
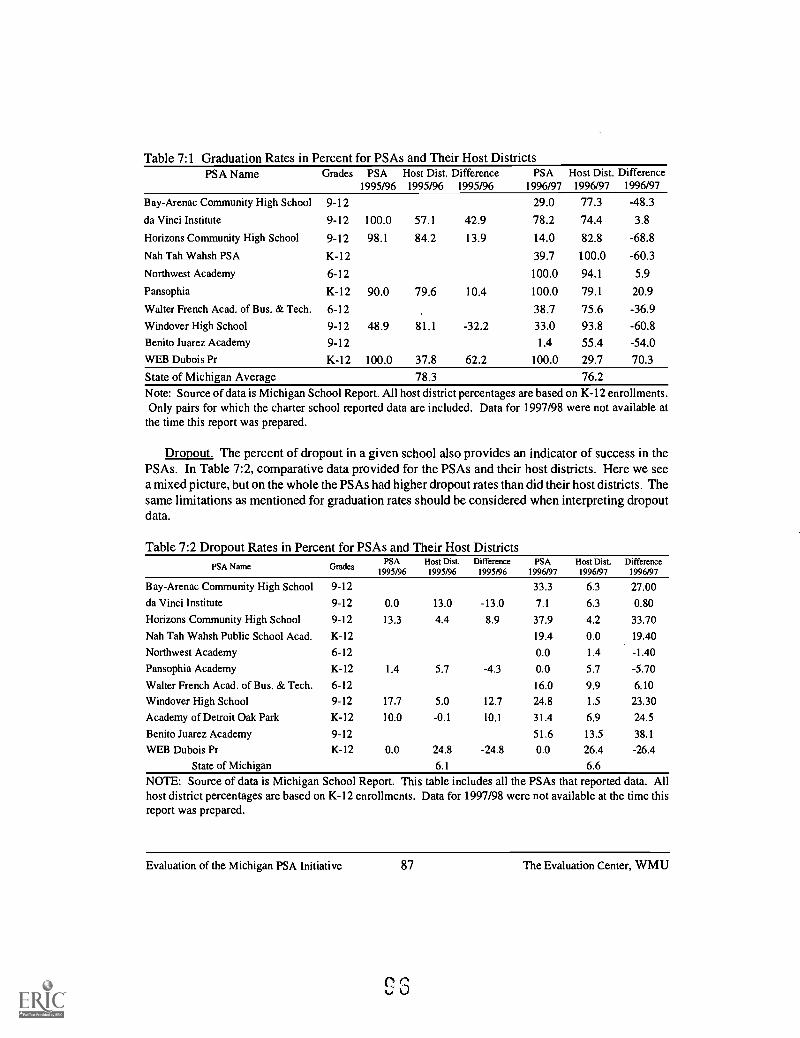
Table 7:1 Graduation Rates in Percent for PSAs and Their Host DistrictsPSA Name Grades PSA
1995/96Host Dist. Difference1995/96 1995/96
PSA1996/97
Host Dist. Difference1996/97 1996/97
Bay-Arenac Community High School 9-12 29.0 77.3 -48.3
da Vinci Institute 9-12 100.0 57.1 42.9 78.2 74.4 3.8
Horizons Community High School 9-12 98.1 84.2 13.9 14.0 82.8 -68.8
Nah Tah Wahsh PSA K-12 39.7 100.0 -60.3
Northwest Academy 6-12 100.0 94.1 5.9
Pansophia K-12 90.0 79.6 10.4 100.0 79.1 20.9
Walter French Acad. of Bus. & Tech. 6-12 38.7 75.6 -36.9
Windover High School 9-12 48.9 81.1 -32.2 33.0 93.8 -60.8
Benito Juarez Academy 9-12 1.4 55.4 -54.0
WEB Dubois Pr K-12 100.0 37.8 62.2 100.0 29.7 70.3
State of Michigan Average 78.3 76.2Note: Source of data is Michigan School Report. All host district percentages are based on K-12 enrollments.Only pairs for which the charter school reported data are included. Data for 1997/98 were not available at
the time this report was prepared.
Dropout. The percent of dropout in a given school also provides an indicator of success in thePSAs. In Table 7:2, comparative data provided for the PSAs and their host districts. Here we seea mixed picture, but on the whole the PSAs had higher dropout rates than did their host districts. Thesame limitations as mentioned for graduation rates should be considered when interpreting dropoutdata.
Table 7:2 Dropout Rates in Percent for PSAs and Their Host DistrictsPSA Name Grades
PSA1995/96
Host Dist.1995/96
Difference1995/96
PSA1996/97
Host Dist.1996/97
Difference1996/97
Bay-Arenac Community High School 9-12 33.3 6.3 27.00
da Vinci Institute 9-12 0.0 13.0 -13.0 7.1 6.3 0.80
Horizons Community High School 9-12 13.3 4.4 8.9 37.9 4.2 33.70
Nah Tah Wahsh Public School Acad. K-12 19.4 0.0 19.40
Northwest Academy 6-12 0.0 1.4 -1.40
Pansophia Academy K-12 1.4 5.7 -4.3 0.0 5.7 -5.70
Walter French Acad. of Bus. & Tech. 6-12 16.0 9.9 6.10
Windover High School 9-12 17.7 5.0 12.7 24.8 1.5 23.30
Academy of Detroit Oak Park K-12 10.0 -0.1 10.1 31.4 6.9 24.5
Benito Juarez Academy 9-12 51.6 13.5 38.1
WEB Dubois Pr K-12 0.0 24.8 -24.8 0.0 26.4 -26.4
State of Michigan 6.1 6.6
NOTE: Source of data is Michigan School Report. This table includes all the PSAs that reported data. Allhost district percentages are based on K-12 enrollments. Data for 1997/98 were not available at the time thisreport was prepared.
Evaluation of the Michigan PSA Initiative 87 The Evaluation Center, WMU
7.6 MEAP Test Scores
MEAP test scores do not provide a fair indicator of the success of PSAs for a number of reasons.One reason is that the schools are too new. Another reason cited by charter school spokespersonsis that the schools attract a high proportion of "at-risk" students and students with special needs.
While the first point is valid (i.e., more time is needed for the schools to have an impact), we madecomparisons of PSAs that have been in operation for at least three years. We compared the PSAswith their host districts and then we compared the gains in MEAP scores over 2 and 3 years. ThePSAs that have taken in a large proportion of at-risk students can be treated fairly in thisinterpretation since we are measuring increases in the performance of their students over a few years.Appendices M-Q include the tables with the MEAP results for each of the 106 PSAs in operationduring the 1997/98 school year as well as their host districts.
As a group, the PSAs have significantly lower MEAP scores than do their host districts. However,a school-by-school comparison shows that students in some PSAs have higher scores than studentsin their host districts. Even when comparing 2- and 3-year gains, we find that the schools in the hostdistricts have larger gains, on the whole, than do the PSAs.
What is most important to note is that the picture is mixed. Even while one school is far behind itshost district in Grade 4 reading, for example, it may be outperforming the host district in reading atanother grade level or in another subject area.
To the extent possible, more factors need to be controlled in order to make a fair and "scientific"comparison between the PSAs and their host districts. We think that the results included inAppendices N-Q are a step in the right direction, although we recognize the need to compare theschools over a longer period of time. There is also a need to control more background factors.
7.7 School Climate
School climate provides a secondary indicator of success in schools. As a means of comparing PSAswith traditional public schools, we used a nationally normed instrument to measure school climatein the PSAs. Appendices G, H, and I include the results from these surveys for teachers (AppendixG), students (Appendix H), and parents and guardians (Appendix I). There are 10 subscales usedto provide information on key aspects of the school climate. These 10 subscales are listed in theappendices, and they are included in Figure 7:1.
Figure 7:1 illustrates the standard scores for each informant group in relation to the national norm,which is indicated by the 50th percentile. We can see from these results that the teachers, students,and parents in the PSAs perceived that the teacher-student relationships were noticeably higher thanthe national norm (subscale 1). On a number of the other subscales, the informants in the PSAs alsoreportedly have higher (i.e., more positive) scores than the national norms. On a few subscales, suchas "Guidance," "Student Activities," and "Administration," the PSAs were equal or slightly lowerthan the national norms.
Evaluation of the Michigan PSA Initiative 88 The Evaluation Center, WMU
9 7
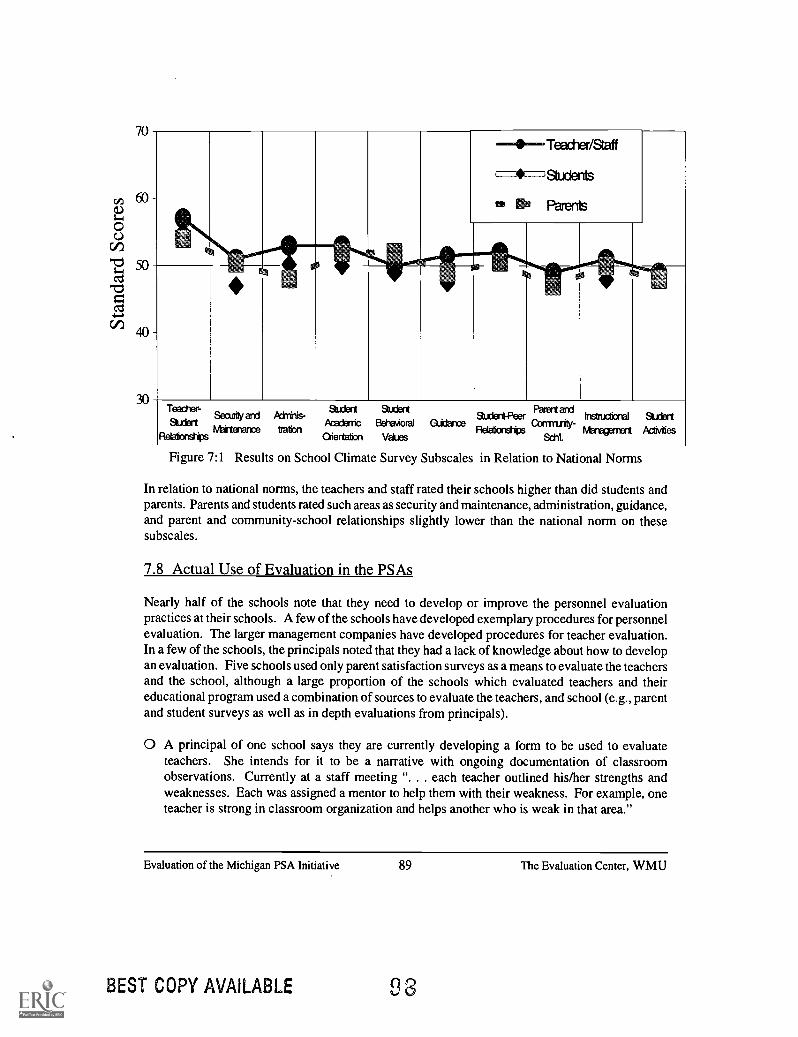
70
60-
50
40-
'14'4-111117
Teacher- Studert &dentSudent
Scany and Alrin*s-AcadericBeNuioral Cdance
SbxientP%Eft n
rstudonal StudentCcmnnty
tVbrtenance* baton Relationships Maregrnal ActivitiesRelatonstips* Orientation Values Schl.
Figure 7:1 Results on School Climate Survey Subscales in Relation to National Norms
In relation to national norms, the teachers and staff rated their schools higher than did students andparents. Parents and students rated such areas as security and maintenance, administration, guidance,and parent and community-school relationships slightly lower than the national norm on thesesubscales.
7.8 Actual Use of Evaluation in the PSAs
Nearly half of the schools note that they need to develop or improve the personnel evaluationpractices at their schools. A few of the schools have developed exemplary procedures for personnelevaluation. The larger management companies have developed procedures for teacher evaluation.In a few of the schools, the principals noted that they had a lack of knowledge about how to developan evaluation. Five schools used only parent satisfaction surveys as a means to evaluate the teachersand the school, although a large proportion of the schools which evaluated teachers and theireducational program used a combination of sources to evaluate the teachers, and school (e.g., parentand student surveys as well as in depth evaluations from principals).
0 A principal of one school says they are currently developing a form to be used to evaluateteachers. She intends for it to be a narrative with ongoing documentation of classroomobservations. Currently at a staff meeting ". . . each teacher outlined his/her strengths andweaknesses. Each was assigned a mentor to help them with their weakness. For example, oneteacher is strong in classroom organization and helps another who is weak in that area."
Evaluation of the Michigan PSA Initiative 89 The Evaluation Center, WMU
BEST COPY AVAILABLE 9 3
O One school principal said that the school needs to continue to work on the issue of professionalstaff evaluation. At present, this is done quite informally. For the most part, it occurs as part ofthe process of discussion concerning curriculum, instruction, and so on. The principal said thatthe selection process for the teachers is critical, and this helps to make what could be a delicateissue easier to deal with. All staff are involved in the selection of new staff members.
O One school principal has developed an evaluation plan that she uses for each teacher. She visitsthe classrooms of teachers and reads their lesson plans. Based on this, she writes a report andsuggests ways that the teachers could improve their performance. She then has a formalinterview with each teacher to discuss the report and the suggested action. This is designed todevelop the skills of the teachers. Many of the teachers in the school are very junior andinexperienced. The principal said that consistently bad performance from a teacher would leadto a recommendation to the board for dismissal. However, she said that there is a lot offorgiveness built into the evaluation process.
O At present, one school principal evaluates the teachers as needed. Official evaluations will bedone in the future as new contracts are worked out for the teachers.
O One school principal stated that the management group developed a fairly comprehensive methodby which the school principal evaluates the teaching staff. This is used to determine salaryadjustments and retention. For the most part, the forms are completely based on in-classobservations of the teacher (several scheduled and several unscheduled). The criteria forassessment include: instructional relevancy, individualized instruction, working relationshipswith special education staff, feedback given to students and parents, support given to studentsthrough achievement awards, use made of various teaching strategies, and management ofstudent behavior.
O One school principal commented that he evaluates the teachers using a system that is basicallythe same as in traditional public schools.
O One school principal said, "[Evaluations are] used to find out what the concerns of parents areand what direction they would like us to go in."
O One school principal stated that "evaluation is staff is based on performance and someobservation." According to the principal, one teacher requires more support and help than theothers. He did not intend to renew the contract for this teacher.
O One principal commented, "I am not sure how this is done. My sense is that things have beenin such a mess at the school that matters like this are yet to be worked out. The board would liketo reward teachers with BA and MA degrees. The board can make recommendations to themanagement company about hiring and firing staff."
O One school employs student interest inventory surveys to determine the success of the school.
Evaluation of the Michigan PSA Initiative 90 The Evaluation Center, WMU
9 9
O One principal has developed a four-page standardized form for the evaluation of teachers andteacher assistants. In this form, teachers are evaluated in terms of their personal character (e.g.trustworthiness, appearance), knowledge of subject matter, volunteerism with respect to specialschool events, and attitudes to students. Teachers are required to state their goals for themselves,the class, and the school on the form.
O One principal noted that every year teachers have two formal, written evaluations provided bythe supervisor. They also do one formal self-evaluation. Another insight into staff performanceis provided by responses from parent surveys and one formal peer review.
O According to one school principal, parent surveys and teacher evaluations are used to evaluatethe teachers, the school and the students. "There is a teacher evaluation and an administrationevaluation. The two are compared and recommendations are made."
O One school principal noted that procedures are still being developed for evaluation purposes atthe school.
O One school principal used parent satisfaction surveys and student attendance as sources ofevaluation of the teachers, students, and school.
O Aside from parent satisfaction surveys, the evaluation of teachers at one school involves a verythorough, carefully documented process. Appraisal is conducted by the school principal whomust, among other things, visit the teacher's class at least twice for formal evaluations ofteaching, consider the change in performance of students in the class as assessed by the MATscores of the students, consider parental satisfaction survey results regarding the teacher, andobtain input regarding the teacher's conduct as a team member in the school as a whole. Thecriteria for judging a teacher include:- demonstrates effective long and short range planning- properly manages the physical setting- maintains a classroom atmosphere that promotes learning- possesses knowledge of subject matter- uses a variety of instructional materials effectively- demonstrates innovation and creativity in attempting to meet the needs of students- maintains good records- utilizes technology in the education process- is receptive to parent and community involvement in the classroom- implements a variety of incentives for learning and methods to counteract improper behavior- emphasizes and supports building goals and objectives
O One school principal employs parent surveys as well as student surveys to evaluate the schooland teachers.
O One school principal commented that teachers were evaluated through student performance,self-assessment, peer evaluation and student evaluation processes.
Evaluation of the Michigan PSA Initiative 91 The Evaluation Center, WMU
1 0 0
Chapter EightMajor Findings and Recommendations
8.1 Impact on Local School Districts
The PSAs are clearly having an impact on their local school districts. Interviews of stakeholders ateach of the 51 schools included in our evaluation and in many of the host school districts includedquestions about the negative and positive impacts that the PSAs have had upon the local host schooldistricts. In the state as a whole, the impact is still quite limited, since only around 2 percent of theK-12 enrollments are in PSAs. However, in some cities and some suburban areas where the PSAsare more concentrated, the negative and positive impacts are more noticeable.
Because the PSA initiative coincides with a number of other public education reforms in Michigan,it is sometimes difficult to distinguish whether or not changes in traditional public schools are dueto the presence of PSAs. Not surprisingly, PSA leaders were more apt to report positive impacts andthe leaders of traditional public schools were more apt to report negative impacts attributable to thepresence of PSAs.
Positive impacts. Without doubt, the presence of PSAs has put pressure on the traditional publicschools to be more accountable. Even in areas with no PSAs in operation, evidence of the impactof the PSA initiative can be seen in the renewed debate about the quality and performance of publicschools.
Important characteristics of the PSAs are small class and school size. One principal aptly stated,"The era of big schools is over, and charter schools have proven this!" In other countries withsimilar reforms, the consolidation of smaller schools has largely stopped and even been reversedsince rural populations can reopen village schoolslong since closedwithout the permission of thelocal education authority (Miron, 1997). Nevertheless, the larger for-profit management companiesare playing an increasing role in establishing new PSAs in Michigan, and for economic purposes theyrequire larger schools.
In some areas, the ISD or the local school district questioned parents who left their traditional publicschool to enroll in a PSA. From our perspective, this process of inquiry resulted in action by thelocal public schools in nearly all cases. In one area the parents reportedly told the ISD that they wereconcerned that there was no supervision outside the school buildings before and after school as wellas during lunch. After hearing this, the traditional public schools found new ways to arrange adultsupervision outside all of their school buildings. Ironically, we were told that many parents hadcomplained about a lack of supervision for years before the PSA appeared.
Evaluation of the Michigan PSA Initiative 92 The Evaluation Center, WMU
1 0 1
In other countries, the presence of new alternatives to the public schools have induced changes inthe public school sector such as a stronger willingness on the part of education bureaucracies andteachers unions to seek new ways in which to make changes in the public schools (Miron, 1997).We can expect that this may be one impact of the PSA initiative.
O Positive changes in local public schools that appear to be attributable to the presence of PSAsinclude the following:
S an introduction of all-day kindergartenS increased adult supervision on the playgroundsS increased emphasis on customer satisfactionS provision of more before and after school programsS more efforts to involve parentsS increased efforts on the part of schools to communicate with their students' parents/guardiansS increased marketing of traditional public schoolsS more emphasis on foreign languageS more attention to performance on the MEAP is seen by many as an improvement that isin
partattributable to the charter schools that compete with the traditional public schools
Below are included some of the responses highlighting positive changes in the local public schoolsdue to the presence of PSAs.
O "We draw our students from two local school districts. The superintendent in one of themwatches his own teachers and the enrollment leaving his school. There is a competitive feeling. . . financially this has hurt the locals but the locals are working to promote their programsthrough the newspaper."
O One PSA principal reported that the local superintendent of the traditional public schools hadteachers go door to door in the community to try to ensure parents that they should keep theirchildren in the traditional public schools. Subsequently, the principal reported that KentIntermediate School District undertook a large parental survey, trying to assess the needs ofparents and their students.
O "Our school and other charter schools have made the traditional public schools 'wake up.' Forexample, Lansing Public Schools now offer full-day kindergarten."
O "Our local district has tried to get foreign language into its elementary schools for two years .. .they now hire away our foreign language teachers. The locals school districts are becomingmore accommodating to meet individual needs versus having the student fitting into the existingstructure ... we haven't taken students from one district exclusively, so no one has been hurt toobad."
O "Two area school districts are considering adding before and after school 'enrichment' like weoffer (6:30-5:30). Another district came to observe our all day kindergarten and Project Read."
Evaluation of the Michigan PSA Initiative 93 The Evaluation Center, WMU
102
This particular principal said his/her school would like the list of area teachers being let go sincethey hope to get more experienced teachers who need less support and counseling than first yearteachers. The principal claimed that the PSAs use the same pay scale as the local district, inaddition to which the school provided merit pay. [This claim could not be supported by dataprovided by MDE.] "Our teachers are 'at will' and the current teachers are uncomfortable withthat, possibly since they are new and do not yet understand that public schools can get rid ofpeople too."
O "Relations with the local schools have been quite good. The local schools have not feltparticularly threatened. In some cases, they have been very pleased to have problem studentstaken from their hands."
O "Parents come to our school and say that 'My child needs special attention and the public schoolsaren't doing anything about it.' Well, the public schools are now contacting parents to offerspecial help . . . whereas before they dragged their feet."
O A curriculum coordinator working for a management company said the traditional schools couldlearn from their schools in a number of ways, including the following: (i) the strong focus on"back-to-basics" in academics, discipline, morals, and values; (ii) greater latitude that teachersare given to teach their own way; (iii) smaller group size, which is crucial and allows teachersto have one-to-one interactions with students; (iv) frequent parental feedback to help monitor theprogram; (v) increasing emphasis on teacher performance and the way that teachers are heldresponsible for the changes in the test scores of students in their classes.
O At an alternative high school the principal stated the following: "Impact on local schools is allpositive. We provide an alternative means of educating the students from the local schooldistricts, and it is not viewed as competition."
Negative impacts. The most immediate negative impact of the PSAs is a loss of finance for thelocal public schools. Nevertheless, in the state as a whole, the impact has been minimal sinceapproximately 2 percent of the state's total K-12 enrollment attends PSAs. Nevertheless, the PSAsare highly concentrated in a number of particular cities, which contributes to large impacts in ahandful of areas. Most stakeholders are aware of the negative financial impact that the traditionalpublic schools are faced with. What many are not aware of, however, is the negative consequencesthat PSAs have in terms of general administration and planning.
While a PSA can set the exact number of students it wishes to enroll, the traditional public schoolsare obligated to take all who apply. Many parents initially double enroll their students in the newlystarted PSA as well as in the traditional public school. In some cases, when the school year starts,the traditional public school has a number of less-than-full classes. In other cases, the local publicschool district receives more students than it planned for and has to scramble for teachers.
The local school districts have defined catchment areas for their schools. Considerable planning isbased upon these divisions. The presence of one of more PSAs has caused some urban districts to
Evaluation of the Michigan PSA Initiative 94 The Evaluation Center, WMU
103
consider or actually redraw catchment areas. Parents are easily scared by not knowing where theirchild(ren) will be enrolled. Uncertainty about catchment areas as well as class size, assignedteachers, etc., creates anxiety among both parents and educators and contributes to a decrease inlegitimacy for the traditional public schools. In one small town, which has struggled to have its ownhigh school, the arrival of a PSA undermined the support for maintaining the high school.
Related to this planning issue is the shift of students during the school year. While no PSAscomplained about having to take students after the first student count, several local school districtshave protested that the PSAs "are dumping" students after the fourth Friday count. If students switchschools at the last minute, a PSA can select another student from a waiting list or, if necessary,remove a teacher to account for the unexpected decrease in enrollments.
Several PSAs claim they have minimal impact on the local public schools, since they attract studentsfrom two or more school districts, and negative impact in terms of loss of funds dispersed amongthem. While many PSAs cater to minorities and at-risk pupils, there are several PSAs that use anumber of mechanisms to structure their learning communities (these mechanisms include absenceof busing, selective advertising, requirements for parental involvement, lack of hot lunch programs,etc.). In these instances, one can claim that the PSAs are "creaming" off the students according toracial and socioeconomic characteristics. These schools will also attract students whose parents aremore resourceful and supportive.
Below we include some of the responses from stakeholders regarding the negative impact that PSAshave had or may have on the local public schools.
O "There has been quite a lot of hostility to our charter school in this area . . . . Our school hasprobably resulted in a loss of about $5,000,000 per year for the local public schools. Thehostility toward the school has made it difficult for the school to obtain permits at times."
O "In the local district, about 20 teachers have been cut due to charter schools."
O In the Grand Rapids area, a PSA principal reported that "even the private schools in the area arefeeling a pinch from the emergence of charter schools."
O "The impact has been a financial one. Two schools have called to ask about the kindergartenenrollment for next year. That information has been shared with them for planning purposes."
8.2 Legal and Legislative Issues That Need to Be Addressed
There are a number of legal issues that the PSA initiative has raised. Because each PSA functionsas an individual school as well as its own school district, this reform touches upon a number of areas.New stakeholders such as universities, community colleges, and management companies have beenbrought into the K-12 public education sphere; and there is currently little experience in defining theroles and responsibilities and limitations of each of the new stakeholder groups. Therefore, it isunderstandable that a number of legislative and legal issues will be raised. These will have to be
Evaluation of the Michigan PSA Initiative 95 The Evaluation Center, WMU
104
addressed by the State Board of Education and the various branches of the state government. Manyof these issues have already been tested in the judicial system, and we can expect more. Below wehave included a list of some of the issues that will need to be addressed because they are new orbecause they are still unclear.
Legal issues
O Status of public school academies
O Eligibility for grant programs
O Whether or not PSAs can buy and sell services
O Conflicts of interest
O Roles and responsibilities of PSA school boards
O Expulsion/suspension of students
O Employer role and responsibility as contracting agencies
O Closure of PSAs and closure of PSAs with deficits
Legislative issues
O Start-up funds, funds for buildings and other capital improvements
O Caps on numbers of schools to be chartered by universities
O Clarification of oversight/supervisory and monitoring responsibilities
O Special education funding
O Need for continuing evaluation and evidence of accountability
8.3 Major Findings and Recommendations
In this section, we have elaborated some of the main findings and recommendations from the study.Some of these findings are discussed earlier in the report, other findingsbecause they did not fitunder a specific chapter or section headingare included here.
Public school academies. For the next few years, we expect that the PSA initiative will continueto grow at the same rate (i.e., increases of 25 to 35 schools per year and 8,000 to12,000 students peryear). Since universities are likely to be the main authorizers, this growth assumes that the cap onthe number of schools that universities can authorize will be raised or removed. As we have seenin other countries that open opportunities for groups to start new schools with public funds, thegreatest interest for starting new schools is strongest in the first few years and declines afterwards(Miron, 1996).
Evaluation of the Michigan PSA Initiative 96 The Evaluation Center, WMU
105
The PSAs have not been welcomed by the traditional public schools. Initially, there appears to berather strong opposition, largely due to fear of the unknown. We have already seen in somecommunities where PSA have been operating for some years that relations between the PSA and thetraditional public schools improve over time. In a few cases, we have even documented an exchangeof services between PSAs and local schools. If negative impacts of the PSAs are minimal, we canexpect relations to improve between the PSAs and the traditional public schools.
One ideal behind the charter school reform was to empower teachers and parents. Nevertheless, wefind that the stakeholders with the most influence are school administrators and managementcompanies. Compared with traditional public schools, PSA teachers appear disproportionatelyweaker than their school administrators/leaders in terms of experience, training, and salaries.
While some schools celebrate diversity and strive to increase the racial and social diversity of thestudents, others have few, if any, minorities or students with special needs. In the 62 PSAs thatreported data for the 1996/97 school year, 51 percent of the students were minorities as comparedwith the total enrollments in K-12 schools, which include approximately 33 percent minorities.Therefore, once can say that the PSAs have more minority students enrolled in them than the stateof Michigan average for K-12 education. Nevertheless, since the charter schools are largely in urbanareas where the concentrations of minorities are higher, we cannot claim that the schools arenecessarily attracting more minorities. In fact, in relation to the host districts, the PSAs as a wholehave fewer minorities. Over the past few years, one can see that there is a clear trend toward fewerand fewer minorities in the PSAs. In some schools this is due to a changing ethnic composition inthe schools (high attrition with fewer minorities included in the new students). However, this trendis largely due to the establishment of new PSAs that enroll fewer minorities. Between 1995/96 and1996/97, the proportion of minorities decreased by 12.5 percent. Between 1997/98 and 1998/99, thepercent of minorities in PSAs is estimated to have decreased by another 10-12 percent.
One of the key findings from our study is that the PSAs are extremely diverse. There are greatschools and poor schools. There are large and small schools. There are schools with minoritiescomprising more than 90 percent of the enrollment and other schools with no minorities or studentswith special needs. Some schools have improved their scores on the MEAP over time, and otherschools have shown a decline in test results. The schools also vary considerably depending onwhether they enroll only elementary students or only high school students. Because of more strictrequirements and expectations on the part of university authorizers and because of the increasing roleof managment companies that start and run their own schools, we can expect the amount of diversityamong the PSAs to decrease with time.
Other factors that would suggest less diversity in time include the following:
0 Many PSAs are revertingover timeto curriculums and models that more closely resemble thosein the traditional public schools. For example, we have seen in a number of cases where schoolswith unique curriculums decide to use "canned curriculums" that do not necessarily address thegoals and objectives of the school. One of the reasons for this is because so little of thecurriculum was in place before the schools began operating.
Evaluation of the Michigan PSA Initiative 97 The Evaluation Center, WMU
106'
O While many innovative and unique ideas were highlighted in school plans, in a number of casesthat the schools were not able to develop and implement these ideas.
One other significant finding is that many poor performing PSAs are not likely to close, even whenparents "vote with their feet" and exit the school on a large scale. This is due to the abilities offounders to recruit new families and authorizing agencies not acting on poor performing schools orschools plagued with problems.
Governance and leadership. The PSAs' school boards are critical to the success of the school.Two of the most important issues relative to the boards are their composition and preparation. Insome instances, considerable turmoil and discontent have resulted from boards that are composedof persons with vested interests and lacking an understanding of their role and function. In a numberof schools, effective and comprehensive board and operational policies are poorly designed and notwell used. The authorizing agencies are aware of weaknesses and problems related to the PSAboards and are taking steps to address it.
Without question, the administrators of the PSAs are an extremely devoted and hardworking group.These administrators are overburdened with tasks and responsibilities that have direct impact on theoperational aspects and missions of the schools. While most of these founders/leaders have provento be effective as visionaries and at developing the idea and basis for the school, a number of themhave not been as effective at running a school on a day-to-day basis. In fact, many of the earlycharter schools that were not conversion schools were started by persons who focused on the profileand curriculum of the school rather than on the actual operation of the school.
Likewise, sharing decision making with other stakeholders has been problematic for many of theseleaders. In more than a few schools, we have heard accusations by teachers, parents, and boardmembers that the school leader is micromanaging. This leadership/administrative style isunacceptable or incompatible with an environment that includes parental and teacher involvementand decision making. School leaders are often ill prepared for their assignments in terms of formaltraining and/or experience, especially in the areas of school law and regulations, personnel andprogram evaluation, and budgeting.
A number of PSAs have been plagued with conflicts between and among the school boards, schooladministrators, and teaching staff. These conflicts have resulted in terminations or resignations orcontinuing conflicts and confrontation. Some authorizing agencies have contracted with third partyconsultants to mediate and train personnel in conflict resolution. While the conflicts are not endemicto charter schools, we can see that they are part of the growing process.
Management companies. Educational management organizations (EMOs) have become aninfluential stakeholder group in the PSA initiative. During the 1997/98 school year, just under 50percent of the schools were contracting out services to EMOs. During the 1998/99 school year, thisfigure jumped to approximately 70 percent. There also appears to be a trend that a larger proportionof new applicants that receive a charter already have agreements with management companies.
Evaluation of the Michigan PSA Initiative 98 The Evaluation Center, WMU
While the PSA initiative was intended to promote parent and teacher influence in the schools, somemanagement companies start and run the schools according to their own visions and motives. In fact,there is a visible trend for PSAs to establish these companies in suburban areas with high potentialenrollment. In addition to this, an increasing number of existing PSAs are seeking or being pressuredby authorizing agencies to contract with external management companies. The extent of thisassistance may be as little as financial accounting to as much as full operations of the school. Inextreme cases, questions about school autonomy may be raised with regard to mission and purpose,curriculum, and use of funds. A number of schools expressed concern with the managementcompanies, primarily due to the issue of control over the curriculum and focus of the school. At afew schools, the staff and parents were angry and upset that their management companies hadassumed a tight control over the school.
Innovations. As noted in the PSA legislation, one of the primary purposes for PSAs is tostimulate innovations. While a number of innovations were reported by individuals associated withthe charter schools, experienced educators would likely not agree that these ideas or practices werenew. Based upon school visits and documentation provided by PSAs, we conclude that there arelimited innovations being developed and applied in the PSAs. In fact, the charter schools wereremarkably similar to the regular public schools, with the notable exceptions of generally smallerstudent enrollments, the presence of additional adults in the classroom, governance, and span ofcontracted (management) services.
In terms of school management and operations, we saw some practices that are quite different fromthe regular public schools. Obviously, some of these come as no surprise because the legislationeither dictates or specifically authorizes such an arrangement. While charter schools can developand refine innovations that can be transferred to other schools, individual charter schools are notlikely to develop new models of management that can be applied to the overall management andoperation of school districts or intermediate school districts. Large EMOs, however, are developingand putting into practice a number of new management and operational ideas, many of which areborrowed from business. Traditional public school districts can learn from many of these ideas.Examples of these include new approaches to the construction of school buildings; more competitiveapproaches to purchasing of materials; and more effective business management, which requiresfewer personnel.
Authorizers. Very large differences exist in how the authorizers operate. Additionally, the roleof authorizer is inconsistently understood and applied across the state. In the eyes of the PSAadministrators, the value of authorizer oversight and assistance varies considerably among theauthorizing agencies. Oversight is a rather new activity, and in many respects it is fair to say that theauthorizers are learning as they go. Given the experience of the first few years, many authorizingagencies are developing rather effective routines that help to streamline oversight activities. Theyhave also been able to develop comprehensive packages of information to facilitate the schools'operations in terms of compliance issues. Authorizing agencies appear to be receiving a considerableamount of support and guidance from one another. In some cases the authorizers attempt to concealrather than reveal weaknesses or problems at their schools.
Evaluation of the Michigan PSA Initiative 99 The Evaluation Center, WMU
103
Major barriers and challenges. For the near future the major barriers and challenges the PSAswill face include the following: (i) lack of available start-up monies; (ii) building or finding suitablefacilities; (iii) space for increased enrollments and/or additional grade levels in established PSAs;(iv) dealing with the bureaucracy; (v) retaining and attracting certified and qualified teachers,especially with current salary levels; (vi) adequately addressing the special needs of students withvarious disabilities/challenges; (vii) need to demonstrate school success and student achievement.
Just like any reform effort, there is a lot of energy and effort being expended on this importantinitiative. From our perspective, the PSAs have attracted a hardworking, dedicated group ofteachers. They seem willing and do work long hours for minimal salaries. We have seen a genuineinterest on their part to improve educational opportunities for children and to expand their influencein this effort.
It is too early to present definitive data about student achievement and long-term impact on regularschools. We are troubled by the claims made in the media and other public documents aboutextraordinary achievements and accomplishments. In fact, the PSAs as a group are not currentlyperforming as well on the MEAP test as the host districts, even when only comparing gains over twoand three years. The charter school initiative is one of the most rapidly growing educational reformsin recent years. School choice, parental involvement, innovative instruction, low administrativecosts, etc., sound very good. However, there are many unanswered questions about the long-termresults. The charter schools' potential for overall impact and improvement may be in the area offorcing more accountability upon the traditional public schools.
Characteristics of exemplary programs/practices. We have identified several characteristics thatwe value in the charter schools that we studied. We have little evidence to suggest that they havesubstantial or any impact on student achievement or school success. Based on our professionaljudgment, however, these are among the characteristics that seem to be noteworthy.
desire and intent of involving parents in the schoolreduced student enrollment in individual buildingsability to accept students from across geographic linesidentified theme or focus of the schooldecision to construct less costly but functional buildingsreduced student/teacher ratio and use of teaching assistants/volunteersincreased emphasis on the facilitation role of building administratorinvolvement of teachers in decision-making processes that have direct effect on instruction
Successful variables to be emulated by other charter schools. Each charter school has its owncharacter and was authorized/granted a charter on a collective set of characteristics and plans. Ifthese schools are to be unique, then a movement toward standardization may not be the mostproductive course. However, there are some characteristics or variables that seem to be associatedwith PSAs that appear to be the most successful. Yet, perceptions of success vary from school toschool, and it is still too early to assess the effect of the charter schools on student learning. The
Evaluation of the Michigan PSA Initiative 100 The Evaluation Center, WMU
1 0 3
following characteristics or variables are associated with the PSAs that we perceived to be moresuccessful in the initial years of operation:
O teachers committed to the philosophy and mission of the school and willing to work long hoursO teachers willing and able to communicate directly with families/parentsO buildings with classrooms and other facilities suitable for the number of students and type of
instructionO mutually supportive teachers and administratorsO clear separation of school board and director administrative responsibilitiesO school personnel without financial investment in the school or the companies and organizations
with which it worksO an array of student services reflective of the needs of all studentsO experienced personnel in charge of administrative matters
Areas that need improvement. Each school has its own positive and negative attributes. Amongthose attributes that schools need a better understanding of and which need improvement, thefollowing can be mentioned:
adequate time for designated building administratorsschool start-up moniesreal or potential conflicts of interest among employees and board membersaccountability for public moniesadequate teacher salaries to sustain a stable, quality teaching facultycongruence between curriculum and the philosophy/mission of the schooldefined role of board membersassessment and evaluation procedures for students and employeesdefined level of influence by management companies/service contractorsseparation of financial interests and educational interests of personnel (founders, board members,teachers, administrators, and corporation officers)
O clear justification of need for schoolO role definition of authorizers
Recommendations. More start-up time is needed for schools for planning and preparing. Thisissue should be addressed by the authorizing agencies rather than with new legislation.
The state government and the public are dependent upon the authorizing agencies to provideoversight of the PSAs. Some authorizers demonstrate a vested interest in the schools they charterand in some cases attempt to conceal rather than reveal schools that are not living up to theircontracts. Authorizing agencies must be prepared to identify weaknesses in their schools and closeschools that are in violation of their mission and established laws governing public education. Thiswill send a message to other schools and give more credibility to the charter school initiative.Measures should be taken to monitor the schools and the work of the authorizing agencies. The legalissues regarding responsibility for schools that close with deficits must be dealt with first.
Evaluation of the Michigan PSA Initiative 101 The Evaluation Center, WMU
1 0
Procedures are needed for sanctions and/or withdrawal or nonrenewal of charters by the authorizerand/or the Michigan Department of Education.
Safeguards can be considered for traditional public schools. Other states have used a wide varietyof mechanisms, depending on the specific regulations governing charters schools, to help safeguardagainst further segregation based upon race, class, and ability. Some states have public hearings anda mechanism where decisions can be appealed. Other examples of measures to restrict furthersegregation include requirements for adequate public announcement of openings, provision oftransportation, etc. The trends we see with the nature and location of many of the newly charteredschools suggest that this will be a key issue in several cities where segregation based on class, race,and ability are being increased by charter schools.
8.4 Areas for Future Research
There are a number of reasons why there should be additional research on the PSA initiative.
O This is a new reform and deserves study so that improvements can be made to improve the PSAsand the initiative as a whole.
O Because PSAs receive more autonomy in exchange for greater accountability, further researchwill help decision makers determine if the schools are demonstrating success and living up totheir missions.
O Charter schools are the focus of debate at many levels. Research on the reform will focus thedebate on its objective merits rather than subjective beliefs.
O There are a number of studies being conducted in other states that will add to our knowledgeabout charter schools. Nevertheless, because the nature of the reform in Michigan is differentin many respects from other states, monitoring and evaluation are needed.
One area that deserves more research are innovations in school management and operations. In termsof innovations, we found that the PSAs had more to contribute in terms of the way their schools wereadministered and operated, rather than in the curricular or instructional innovations. A greaterunderstanding of these innovations or unique practices would facilitate the diffusion or sharing ofthis knowledge.
Further analysis of fiscal data is needed to determine how PSAs differ from traditional publicschools. Areas where PSAs are more efficient may warrant attention to determine if new practicesin the PSAs can be adapted to other schools. Documented examples of greater efficiency inparticular areas will also be useful in applying pressure on traditional public schools to address theseareas.
While some PSAs are struggling to provide special educational support for their students, other havebeen quite successful in catering to them. A few PSAs have developed models of provision thatappear to be exemplary in including students with special educational needs in the regularclassrooms. This topic area merits greater attention in future research.
Evaluation of the Michigan PSA Initiative 102 The Evaluation Center, WMU
ill
The RFP for our evaluation did not include questions about the role of management companies andeducational management organizations. After completing our study, we have come to understand thatmanagement companies play a big role in the Michigan PSA initiative. Therefore, further researchinto the role of management companies should be a priority.
Competition and efficiency are underlying issues related to the PSA initiative. Comparisons arebeing made between the outputs of the PSAs and traditional public schools, but both sides claim thatthe "playing field is not level" in terms of financial resources. Further research into this area wouldhelp to compare PSAs and traditional schools in terms of efficiency and would help in determiningmeasures to distribute resources fairly.
It is important to understand that this study was conducted over a limited period of time in which weobserved some outstanding efforts, especially among the PSA teachers, and strong commitments onthe part of many administrators and founders. Clearly, there are some PSAs with potentially brightfutures but, at the same time, there are PSAs that are facing major challenges and the expectation oftheir success is quite limited. There are strong PSAs and there are weak PSAsa situation notdissimilar among traditional public schools. The PSA/charter school initiative is a bold effort ofeducation reform, and it should be continually evaluated and judged on the merits and benefits itprovides for the most important element of any public schoolthe students.
Evaluation of the Michigan PSA Initiative 103 The Evaluation Center, WMU
112
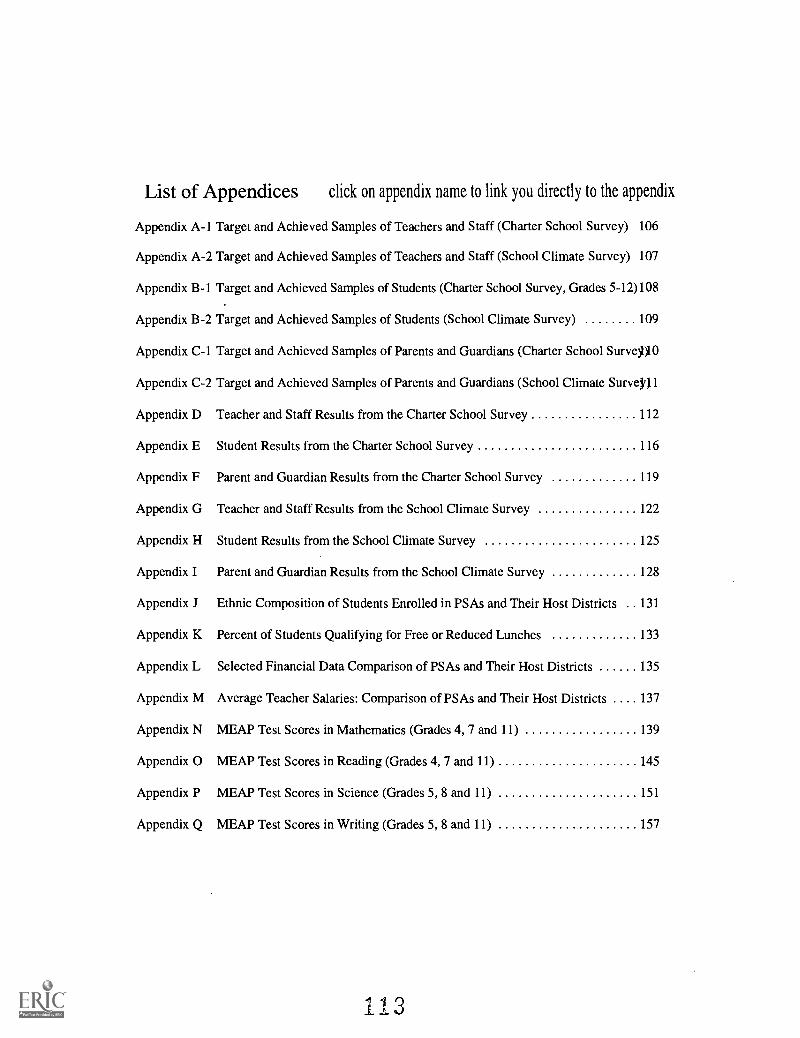
List of Appendices click on appendix name to link you directly to the appendix
Appendix A-1 Target and Achieved Samples of Teachers and Staff (Charter School Survey) 106
Appendix A-2 Target and Achieved Samples of Teachers and Staff (School Climate Survey) 107
Appendix B-1 Target and Achieved Samples of Students (Charter School Survey, Grades 5-12)108
Appendix B-2 Target and Achieved Samples of Students (School Climate Survey) 109
Appendix C-1 Target and Achieved Samples of Parents and Guardians (Charter School Surve)1)10
Appendix C-2 Target and Achieved Samples of Parents and Guardians (School Climate Survej'J 1
Appendix D Teacher and Staff Results from the Charter School Survey 112
Appendix E Student Results from the Charter School Survey 116
Appendix F Parent and Guardian Results from the Charter School Survey 119
Appendix G Teacher and Staff Results from the School Climate Survey 122
Appendix H Student Results from the School Climate Survey 125
Appendix I Parent and Guardian Results from the School Climate Survey 128
Appendix J Ethnic Composition of Students Enrolled in PSAs and Their Host Districts . 131
Appendix K Percent of Students Qualifying for Free or Reduced Lunches 133
Appendix L Selected Financial Data Comparison of PSAs and Their Host Districts 135
Appendix M Average Teacher Salaries: Comparison of PSAs and Their Host Districts . . 137
Appendix N MEAP Test Scores in Mathematics (Grades 4, 7 and 11) 139
Appendix 0 MEAP Test Scores in Reading (Grades 4, 7 and 11) 145
Appendix P MEAP Test Scores in Science (Grades 5, 8 and 11) 151
Appendix Q MEAP Test Scores in Writing (Grades 5, 8 and 11) 157
113
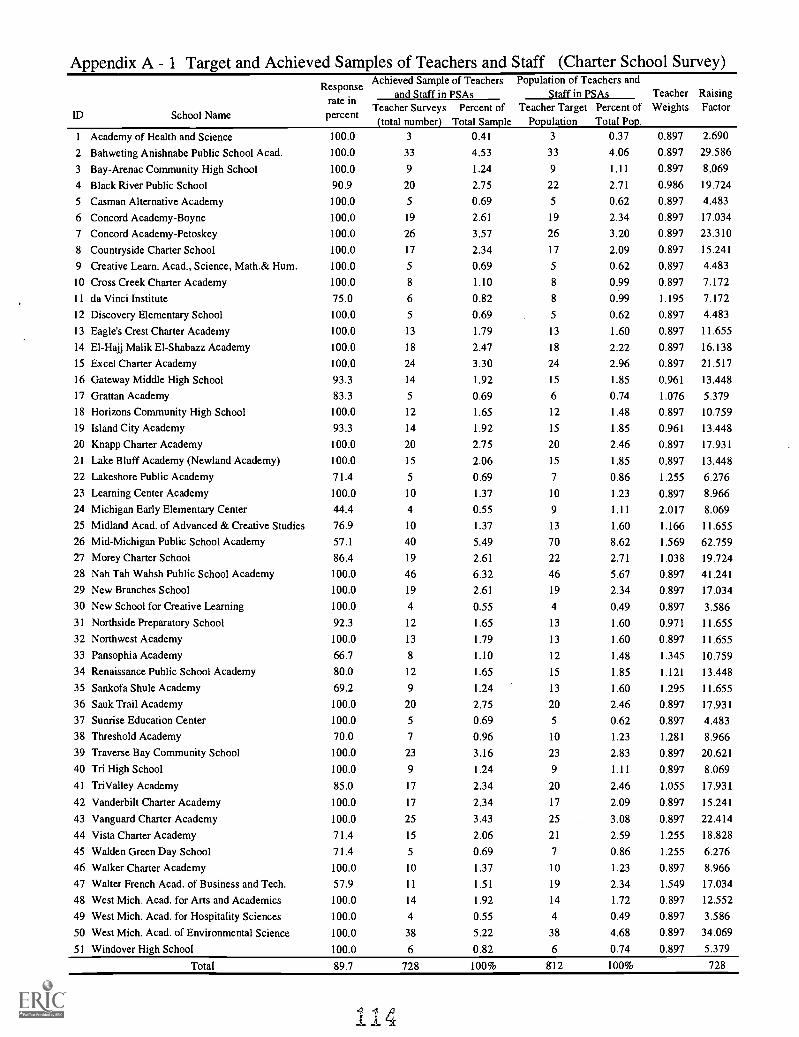
Appendix A 1 Target and Achieved Samples of Teachers and Staff (Charter School Survey)
ID School Name
Responserate inpercent
Achieved Sample of Teachersand Staff in PSAs
Population of Teachers andStaff in PSAs Teacher
WeightsRaisingFactorTeacher Surveys Percent of Teacher Target Percent of
(total number) Total Sample Population Total Pop.1 Academy of Health and Science 100.0 3 0.41 3 0.37 0.897 2.690
2 Bahweting Anishnabe Public School Acad. 100.0 33 4.53 33 4.06 0.897 29.586
3 Bay-Arenac Community High School 100.0 9 1.24 9 1.11 0.897 8.069
4 Black River Public School 90.9 20 2.75 22 2.71 0.986 19.724
5 Casman Alternative Academy 100.0 5 0.69 5 0.62 0.897 4.483
6 Concord Academy-Boyne 100.0 19 2.61 19 2.34 0.897 17 .034
7 Concord Academy-Petoskey 100.0 26 3.57 26 3.20 0.897 23.310
8 Countryside Charter School 100.0 17 2.34 17 2.09 0.897 15.241
9 Creative Learn. Acad., Science, Math.& Hum. 100.0 5 0.69 5 0.62 0.897 4.483
10 Cross Creek Charter Academy 100.0 8 1.10 8 0.99 0.897 7.172
11 da Vinci Institute 75.0 6 0.82 8 0.99 1.195 7.172
12 Discovery Elementary School 100.0 5 0.69 5 0.62 0.897 4.483
13 Eagle's Crest Charter Academy 100.0 13 1.79 13 1.60 0.897 11.655
14 El-Hajj Malik EI-Shabazz Academy 100.0 18 2.47 18 2.22 0.897 16.138
15 Excel Charter Academy 100.0 24 3.30 24 2.96 0.897 21.517
16 Gateway Middle High School 93.3 14 1.92 15 1.85 0.961 13.448
17 Grattan Academy 83.3 5 0.69 6 0.74 1.076 5.379
18 Horizons Community High School 100.0 12 1.65 12 1.48 0.897 10.759
19 Island City Academy 93.3 14 1.92 15 1.85 0.961 13.448
20 Knapp Charter Academy 100.0 20 2.75 20 2.46 0.897 17.931
21 Lake Bluff Academy (Newland Academy) 100.0 15 2.06 15 1.85 0.897 13.448
22 Lakeshore Public Academy 71.4 5 0.69 7 0.86 1.255 6.27623 Learning Center Academy 100.0 10 1.37 10 1.23 0.897 8.966
24 Michigan Early Elementary Center 44.4 4 0.55 9 1.11 2.017 8.069
25 Midland Acad. of Advanced & Creative Studies 76.9 10 1.37 13 1.60 1.166 11.655
26 Mid-Michigan Public School Academy 57.1 40 5.49 70 8.62 1.569 62.759
27 Morey Charter School 86.4 19 2.61 22 2.71 1.038 19.724
28 Nah Tah Wahsh Public School Academy 100.0 46 6.32 46 5.67 0.897 41.241
29 New Branches School 100.0 19 2.61 19 2.34 0.897 17.034
30 New School for Creative Learning 100.0 4 0.55 4 0.49 0.897 3.586
31 Northside Preparatory School 92.3 12 1.65 13 1.60 0.971 11.655
32 Northwest Academy 100.0 13 1.79 13 1.60 0.897 11.655
33 Pansophia Academy 66.7 8 1.10 12 1.48 1.345 10.759
34 Renaissance Public School Academy 80.0 12 1.65 15 1.85 1.121 13.448
35 Sankofa Shule Academy 69.2 9 1.24 13 1.60 1.295 11.655
36 Sauk Trail Academy 100.0 20 2.75 20 2.46 0.897 17.931
37 Sunrise Education Center 100.0 5 0.69 5 0.62 0.897 4.483
38 Threshold Academy 70.0 7 0.96 10 1.23 1.281 8.966
39 Traverse Bay Community School 100.0 23 3.16 23 2.83 0.897 20.621
40 Tri High School 100.0 9 1.24 9 1.11 0.897 8.069
41 TriValley Academy 85.0 17 2.34 20 2.46 1.055 17.931
42 Vanderbilt Charter Academy 100.0 17 2.34 17 2.09 0.897 15.241
43 Vanguard Charter Academy 100.0 25 3.43 25 3.08 0.897 22.414
44 Vista Charter Academy 71.4 15 2.06 21 2.59 1.255 18.828
45 Walden Green Day School 71.4 5 0.69 7 0.86 1.255 6.276
46 Walker Charter Academy 100.0 10 1.37 10 1.23 0.897 8.966
47 Walter French Acad. of Business and Tech. 57.9 11 1.51 19 2.34 1.549 17.034
48 West Mich. Acad. for Arts and Academics 100.0 14 1.92 14 1.72 0.897 12.552
49 West Mich. Acad. for Hospitality Sciences 100.0 4 0.55 4 0.49 0.897 3.586
50 West Mich. Acad. of Environmental Science 100.0 38 5.22 38 4.68 0.897 34.069
51 Windover High School 100.0 6 0.82 6 0.74 0.897 5.379
Total 89.7 728 100% 812 100% 728
114
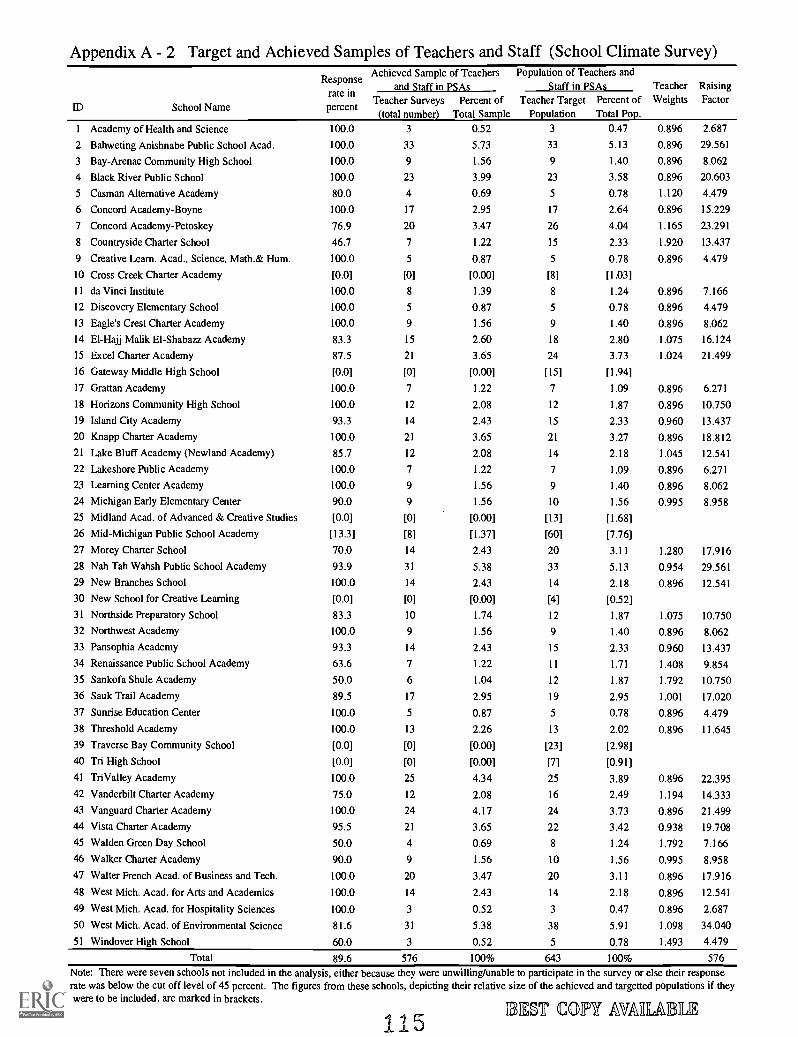
Appendix A - 2 Target and Achieved Samples of Teachers and Staff (School Climate Survey)
ID School Name
Responserate inpercent
Achieved Sample of Teachersand Staff in PSAs
Population of Teachers andStaff in PSAs Teacher
WeightsRaisingFactorTeacher Surveys
(total number)Percent of
Total SampleTeacher Target
PopulationPercent ofTotal Pop.
1 Academy of Health and Science 100.0 3 0.52 3 0.47 0.896 2.687
2 Bahweting Anishnabe Public School Acad. 100.0 33 5.73 33 5.13 0.896 29.561
3 Bay-Arenac Community High School 100.0 9 1.56 9 1.40 0.896 8.062
4 Black River Public School 100.0 23 3.99 23 3.58 0.896 20.603
5 Casman Altemative Academy 80.0 4 0.69 5 0.78 1.120 4.479
6 Concord Academy-Boyne 100.0 17 2.95 17 2.64 0.896 15.229
7 Concord Academy-Petoskey 76.9 20 3.47 26 4.04 1.165 23.291
8 Countryside Charter School 46.7 7 1.22 15 2.33 1.920 13.437
9 Creative Learn. Acad., Science, Math.& Hum. 100.0 5 0.87 5 0.78 0.896 4.479
10 Cross Creek Charter Academy [0.0] [0] [0.00] [8] [1.03]
11 da Vinci Institute 100.0 8 1.39 8 1.24 0.896 7.166
12 Discovery Elementary School 100.0 5 0.87 5 0.78 0.896 4.479
13 Eagle's Crest Charter Academy 100.0 9 1.56 9 1.40 0.896 8.062
14 El-Hajj Malik El-Shabazz Academy 83.3 15 2.60 18 2.80 1.075 16.124
15 Excel Charter Academy 87.5 21 3.65 24 3.73 1.024 21.499
16 Gateway Middle High School [0.0] [0] [0.00] [15] [1.94]
17 Grattan Academy 100.0 7 1.22 7 1.09 0.896 6.271
18 Horizons Community High School 100.0 12 2.08 12 1.87 0.896 10.750
19 Island City Academy 93.3 14 2.43 15 2.33 0.960 13.437
20 Knapp Charter Academy 100.0 21 3.65 21 3.27 0.896 18.812
21 Lake Bluff Academy (Newland Academy) 85.7 12 2.08 14 2.18 1.045 12.541
22 Lakeshore Public Academy 100.0 7 1.22 7 1.09 0.896 6.271
23 Learning Center Academy 100.0 9 1.56 9 1.40 0.896 8.062
24 Michigan Early Elementary Center 90.0 9 1.56 10 1.56 0.995 8.958
25 Midland Acad. of Advanced & Creative Studies [0.0] [0] [0.00] [13] [1.68]
26 Mid-Michigan Public School Academy [13.3] [8] [1.37] [60] [7.76]
27 Morey Charter School 70.0 14 2.43 20 3.11 1.280 17.916
28 Nah Tah Wahsh Public School Academy 93.9 31 5.38 33 5.13 0.954 29.561
29 New Branches School 100.0 14 2.43 14 2.18 0.896 12.541
30 New School for Creative Learning [0.0] [0] [0.00] [4] [0.52]
31 Northside Preparatory School 83.3 10 1.74 12 1.87 1.075 10.750
32 Northwest Academy 100.0 9 1.56 9 1.40 0.896 8.062
33 Pansophia Academy 93.3 14 2.43 15 2.33 0.960 13.437
34 Renaissance Public School Academy 63.6 7 1.22 11 1.71 1.408 9.854
35 Sankofa Shule Academy 50.0 6 1.04 12 1.87 1.792 10.750
36 Sauk Trail Academy 89.5 17 2.95 19 2.95 1.001 17.020
37 Sunrise Education Center 100.0 5 0.87 5 0.78 0.896 4.479
38 Threshold Academy 100.0 13 2.26 13 2.02 0.896 11.645
39 Traverse Bay Community School [0.0] [0] [0.00] [23] [2.98]
40 Tri High School [0.0] [0] [0.00] [7] [0.91]
41 TriValley Academy 100.0 25 4.34 25 3.89 0.896 22.395
42 Vanderbilt Charter Academy 75.0 12 2.08 16 2.49 1.194 14.333
43 Vanguard Charter Academy 100.0 24 4.17 24 3.73 0.896 21.499
44 Vista Charter Academy 95.5 21 3.65 22 3.42 0.938 19.708
45 Walden Green Day School 50.0 4 0.69 8 1.24 1.792 7.166
46 Walker Charter Academy 90.0 9 1.56 10 1.56 0.995 8.958
47 Walter French Acad. of Business and Tech. 100.0 20 3.47 20 3.11 0.896 17.916
48 West Mich. Acad. for Arts and Academics 100.0 14 2.43 14 2.18 0.896 12.541
49 West Mich. Acad. for Hospitality Sciences 100.0 3 0.52 3 0.47 0.896 2.687
50 West Mich. Acad. of Environmental Science 81.6 31 5.38 38 5.91 1.098 34.040
51 Windover High School 60.0 3 0.52 5 0.78 1.493 4.479
Total 89.6 576 100% 643 100% 576Note: There were seven schools not included in the analysis, either because they were unwilling/unable to participate in the survey or else their responserate was below the cut off level of 45 percent. The figures from these schools, depicting their relative size of the achieved and targetted populations if theywere to be included. are marked in brackets.
1152307 COPY AVARLAINTA
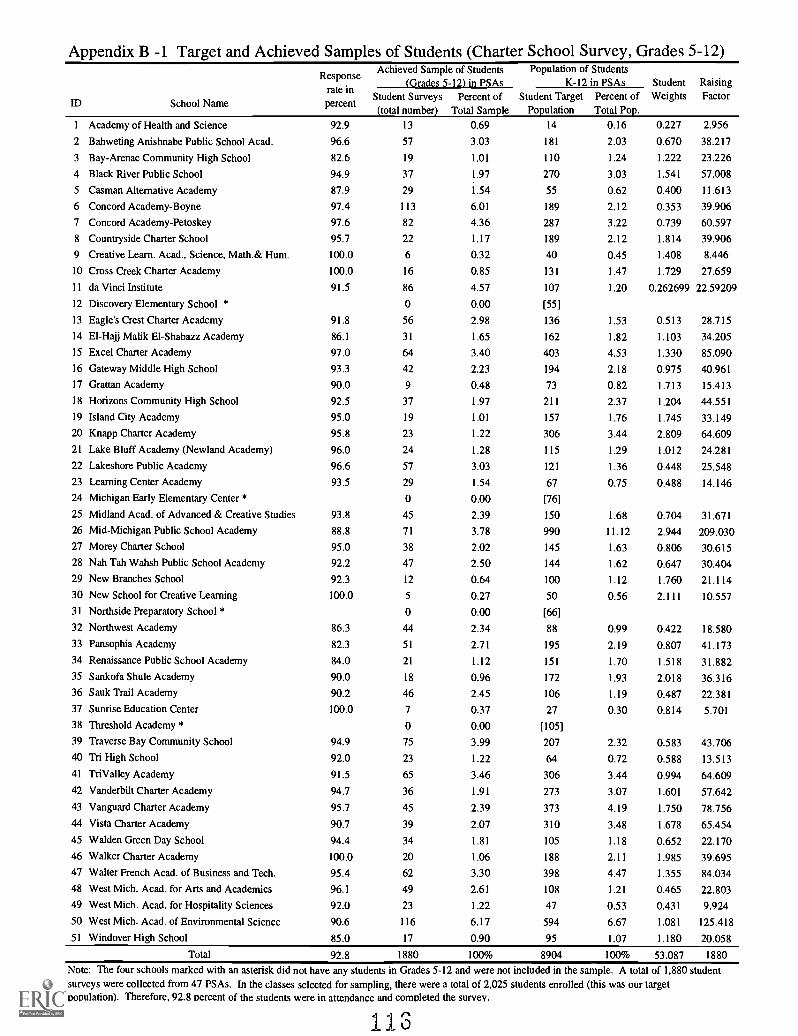
Appendix B -1 Target and Achieved Samples of Students (Charter School Survey, Grades 5-12)
ID School Name
Responserate inpercent
Achieved Sample of Students(Grades 5-12) in PSAs
Population of StudentsK-12 in PSAs Student
WeightsRaisingFactorStudent Surveys Percent of
(total number) Total SampleStudent Target
PopulationPercent ofTotal Pop.
1 Academy of Health and Science 92.9 13 0.69 14 0.16 0.227 2.956
2 Bahweting Anishnabe Public School Acad. 96.6 57 3.03 181 2.03 0.670 38.217
3 Bay-Arenac Community High School 82.6 19 1.01 110 1.24 1.222 23.226
4 Black River Public School 94.9 37 1.97 270 3.03 1.541 57.008
5 Casman Alternative Academy 87.9 29 1.54 55 0.62 0.400 11.613
6 Concord Academy-Boyne 97.4 113 6.01 189 2.12 0.353 39.906
7 Concord Academy-Petoskey 97.6 82 4.36 287 3.22 0.739 60.597
8 Countryside Charter School 95.7 22 1.17 189 2.12 1.814 39.906
9 Creative Learn. Acad., Science, Math.& Hum. 100.0 6 0.32 40 0.45 1.408 8.446
10 Cross Creek Charter Academy 100.0 16 0.85 131 1.47 1.729 27.659
11 da Vinci Institute 91.5 86 4.57 107 1.20 0.262699 22.59209
12 Discovery Elementary School * 0 0.00 [55]
13 Eagle's Crest Charter Academy 91.8 56 2.98 136 1.53 0.513 28.715
14 El-Hajj Malik El-Shabazz Academy 86.1 31 1.65 162 1.82 1.103 34.205
15 Excel Charter Academy 97.0 64 3.40 403 4.53 1.330 85.090
16 Gateway Middle High School 93.3 42 2.23 194 2.18 0.975 40.961
17 Grattan Academy 90.0 9 0.48 73 0.82 1.713 15.413
18 Horizons Community High School 92.5 37 1.97 211 2.37 1.204 44.551
19 Island City Academy 95.0 19 1.01 157 1.76 1.745 33.149
20 Knapp Charter Academy 95.8 23 1.22 306 3.44 2.809 64.60921 Lake Bluff Academy (Newland Academy) 96.0 24 1.28 115 1.29 1.012 24.281
22 Lakeshore Public Academy 96.6 57 3.03 121 1.36 0.448 25.54823 Learning Center Academy 93.5 29 1.54 67 0.75 0.488 14.146
24 Michigan Early Elementary Center * 0 0.00 [76]
25 Midland Acad. of Advanced & Creative Studies 93.8 45 2.39 150 1.68 0.704 31.671
26 Mid-Michigan Public School Academy 88.8 71 3.78 990 11.12 2.944 209.03027 Morey Charter School 95.0 38 2.02 145 1.63 0.806 30.61528 Nah Tah Wahsh Public School Academy 92.2 47 2.50 144 1.62 0.647 30.40429 New Branches School 92.3 12 0.64 100 1.12 1.760 21.11430 New School for Creative Learning 100.0 5 0.27 50 0.56 2.111 10.557
31 Northside Preparatory School * 0 0.00 [66]
32 Northwest Academy 86.3 44 2.34 88 0.99 0.422 18.58033 Pansophia Academy 82.3 51 2.71 195 2.19 0.807 41.17334 Renaissance Public School Academy 84.0 21 1.12 151 1.70 1.518 31.88235 Sankofa Shule Academy 90.0 18 0.96 172 1.93 2.018 36.31636 Sauk Trail Academy 90.2 46 2.45 106 1.19 0.487 22.381
37 Sunrise Education Center 100.0 7 0.37 27 0.30 0.814 5.701
38 Threshold Academy * 0 0.00 [105]
39 Traverse Bay Community School 94.9 75 3.99 207 2.32 0.583 43.70640 Tri High School 92.0 23 1.22 64 0.72 0.588 13.513
41 TriValley Academy 91.5 65 3.46 306 3.44 0.994 64.60942 Vanderbilt Charter Academy 94.7 36 1.91 273 3.07 1.601 57.642
43 Vanguard Charter Academy 95.7 45 2.39 373 4.19 1.750 78.75644 Vista Charter Academy 90.7 39 2.07 310 3.48 1.678 65.45445 Walden Green Day School 94.4 34 1.81 105 1.18 0.652 22.17046 Walker Charter Academy 100.0 20 1.06 188 2.11 1.985 39.695
47 Walter French Acad. of Business and Tech. 95.4 62 3.30 398 4.47 1.355 84.034
48 West Mich. Acad. for Arts and Academics 96.1 49 2.61 108 1.21 0.465 22.803
49 West Mich. Acad. for Hospitality Sciences 92.0 23 1.22 47 0.53 0.431 9.924
50 West Mich. Acad. of Environmental Science 90.6 116 6.17 594 6.67 1.081 125.418
51 Windover High School 85.0 17 0.90 95 1.07 1.180 20.058
Total 92.8 1880 100% 8904 100% 53.087 1880
Note: The four schools marked with an asterisk did not have any students in Grades 5-12 and were not included in the sample. A totalof 1,880 studentsurveys were collected from 47 PSAs. In the classes selected for sampling, there were a total of 2,025 students enrolled (this was our targetpopulation). Therefore, 92.8 percent of the students were in attendance and completed the survey.
11
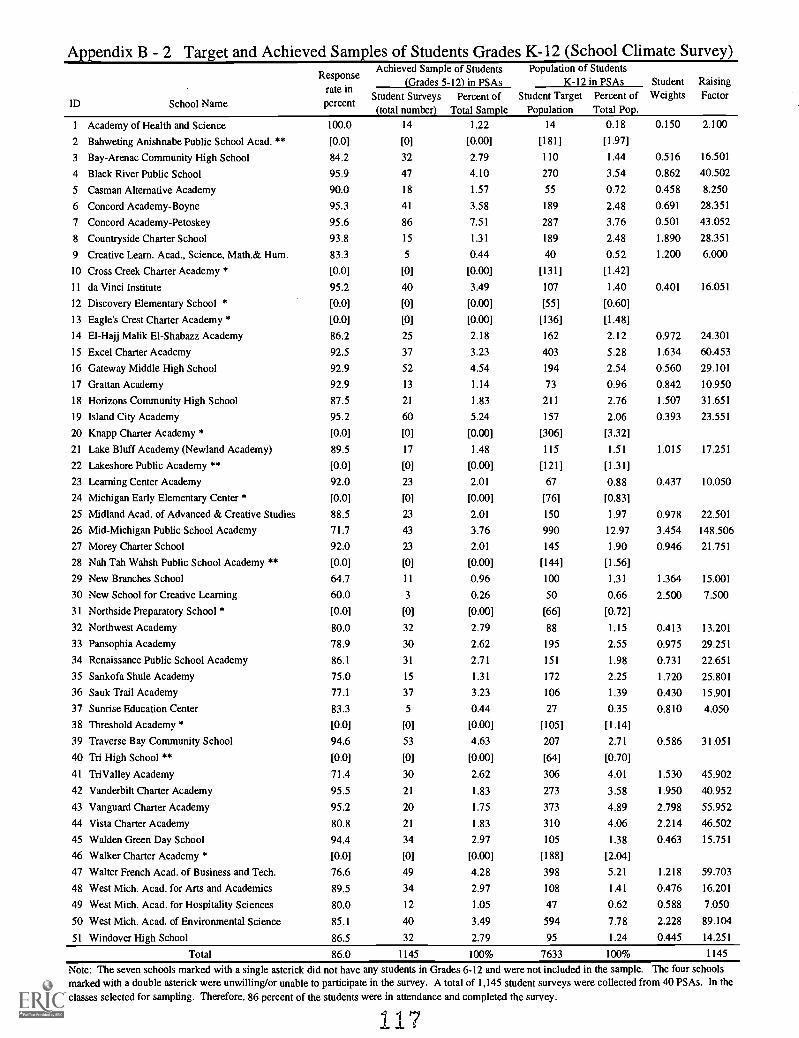
Appendix B - 2 Target and Achieved Samples of Students Grades K-12 (School Climate Survey)
ID School Name
Responserate inpercent
Achieved Sample of Students(Grades 5-12) in PSAs
Population of StudentsK-12 in PSAs Student Raising
Weights FactorStudent Surveys(total number)
Percent ofTotal Sample
Student TargetPopulation
Percent ofTotal Pop.
1 Academy of Health and Science 100.0 14 1.22 14 0.18 0.150 2.100
2 Bahweting Anishnabe Public School Acad. ** [0.0] [0] [0.00] [181] [1.97]
3 Bay-Arenac Community High School 84.2 32 2.79 110 1.44 0.516 16.501
4 Black River Public School 95.9 47 4.10 270 3.54 0.862 40.502
5 Casman Alternative Academy 90.0 18 1.57 55 0.72 0.458 8.250
6 Concord Academy-Boyne 95.3 41 3.58 189 2.48 0.691 28.351
7 Concord Academy-Petoskey 95.6 86 7.51 287 3.76 0.501 43.052
8 Countryside Charter School 93.8 15 1.31 189 2.48 1.890 28.351
9 Creative Learn. Acad., Science, Math.& Hum. 83.3 5 0.44 40 0.52 1.200 6.000
10 Cross Creek Charter Academy * [0.0] [0] [0.00] [131] [1.42]
11 da Vinci Institute 95.2 40 3.49 107 1.40 0.401 16.051
12 Discovery Elementary School * [0.0] [0] [0.00] [55] [0.60]
13 Eagles Crest Charter Academy * [0.0] [0] [0.00] [136] [1.48]
14 El-Hajj Malik El-Shabazz Academy 86.2 25 2.18 162 2.12 0.972 24.301
15 Excel Charter Academy 92.5 37 3.23 403 5.28 1.634 60.453
16 Gateway Middle High School 92.9 52 4.54 194 2.54 0.560 29.101
17 Grattan Academy 92.9 13 1.14 73 0.96 0.842 10.950
18 Horizons Community High School 87.5 21 1.83 211 2.76 1.507 31.651
19 Island City Academy 95.2 60 5.24 157 2.06 0.393 23.551
20 Knapp Charter Academy * [0.0] [0] [0.00] [306] [3.32]
21 Lake Bluff Academy (Newland Academy) 89.5 17 1.48 115 1.51 1.015 17.251
22 Lakeshore Public Academy ** [0.0] [0] [0.00] [121] [1.31]
23 Learning Center Academy 92.0 23 2.01 67 0.88 0.437 10.050
24 Michigan Early Elementary Center * [0.0] [0] [0.00] [76] [0.83]
25 Midland Acad. of Advanced & Creative Studies 88.5 23 2.01 150 1.97 0.978 22.501
26 Mid-Michigan Public School Academy 71.7 43 3.76 990 12.97 3.454 148.506
27 Morey Charter School 92.0 23 2.01 145 1.90 0.946 21.751
28 Nah Tah Wahsh Public School Academy ** [0.0] [0] [0.00] [144] [1.56]
29 New Branches School 64.7 11 0.96 100 1.31 1.364 15.001
30 New School for Creative Learning 60.0 3 0.26 50 0.66 2.500 7.500
31 Northside Preparatory School * [0.0] [0] [0.00] [66] [0.72]
32 Northwest Academy 80.0 32 2.79 88 1.15 0.413 13.201
33 Pansophia Academy 78.9 30 2.62 195 2.55 0.975 29.251
34 Renaissance Public School Academy 86.1 31 2.71 151 1.98 0.731 22.651
35 Sankofa Shule Academy 75.0 15 1.31 172 2.25 1.720 25.801
36 Sauk Trail Academy 77.1 37 3.23 106 1.39 0.430 15.901
37 Sunrise Education Center 83.3 5 0.44 27 0.35 0.810 4.050
38 Threshold Academy * [0.0] [0] [0.00] [105] [1.14]
39 Traverse Bay Community School 94.6 53 4.63 207 2.71 0.586 31.051
40 Tri High School ** [0.0] [0] [0.00] [64] [0.70]
41 TriValley Academy 71.4 30 2.62 306 4.01 1.530 45.902
42 Vanderbilt Charter Academy 95.5 21 1.83 273 3.58 1.950 40.952
43 Vanguard Charter Academy 95.2 20 1.75 373 4.89 2.798 55.952
44 Vista Charter Academy 80.8 21 1.83 310 4.06 2.214 46.502
45 Walden Green Day School 94.4 34 2.97 105 1.38 0.463 15.751
46 Walker Charter Academy * [0.0] [0] [0.00] [188] [2.04]
47 Walter French Acad. of Business and Tech. 76.6 49 4.28 398 5.21 1.218 59.703
48 West Mich. Acad. for Arts and Academics 89.5 34 2.97 108 1.41 0.476 16.201
49 West Mich. Acad. for Hospitality Sciences 80.0 12 1.05 47 0.62 0.588 7.050
50 West Mich. Acad. of Environmental Science 85.1 40 3.49 594 7.78 2.228 89.104
51 Windover High School 86.5 32 2.79 95 1.24 0.445 14.251
Total 86.0 1145 100% 7633 100% 1145
Note: The seven schools marked with a single asterick did not have any students in Grades 6-12 and were not included in the sample. The four schoolsmarked with a double asterick were unwilling/or unable to participate in the survey. A total of 1,145 student surveys were collected from 40 PSAs. In the
classes selected for sampling. Therefore, 86 percent of the students were in attendance and completed the survey.
117
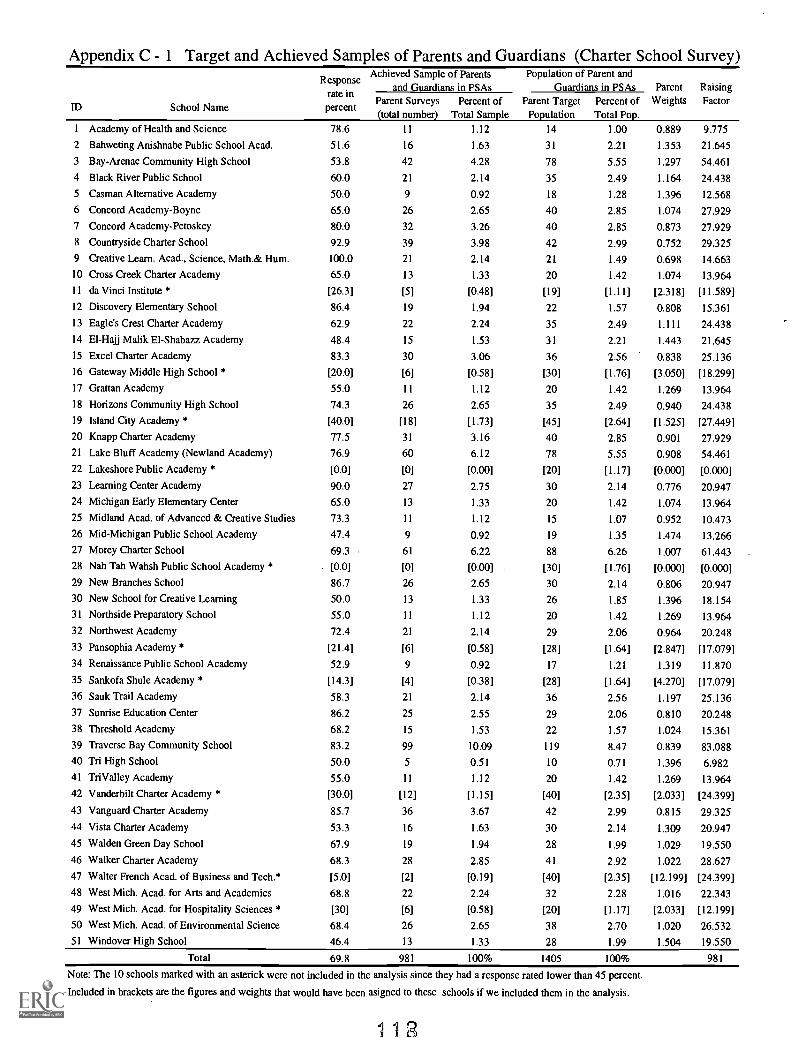
Appendix C - 1 Target and Achieved Samples of Parents and Guardians (Charter School Survey)
ID School Name
Responserate inpercent
Achieved Sample of Parentsand Guardians in PSAs
Population of Parent andGuardians in PSAs Parent
WeightsRaisingFactorParent Surveys
(total number)Percent of
Total SampleParent TargetPopulation
Percent ofTotal Pop.
1 Academy of Health and Science 78.6 11 1.12 14 1.00 0.889 9.775
2 Bahweting Anishnabe Public School Acad. 51.6 16 1.63 31 2.21 1.353 21.645
3 Bay-Arenac Community High School 53.8 42 4.28 78 5.55 1.297 54.461
4 Black River Public School 60.0 21 2.14 35 2.49 1.164 24.438
5 Casman Alternative Academy 50.0 9 0.92 18 1.28 1.396 12.568
6 Concord Academy-Boyne 65.0 26 2.65 40 2.85 1.074 27.929
7 Concord Academy-Petoskey 80.0 32 3.26 40 2.85 0.873 27.929
8 Countryside Charter School 92.9 39 3.98 42 2.99 0.752 29.3259 Creative Learn. Acad., Science, Math.& Hum. 100.0 21 2.14 21 1.49 0.698 14.663
10 Cross Creek Charter Academy 65.0 13 1.33 20 1.42 1.074 13.964
11 da Vinci Institute * [26.3] [5] [0.48] [19] [1.11] [2.318] [11.589]
12 Discovery Elementary School 86.4 19 1.94 22 1.57 0.808 15.361
13 Eagle's Crest Charter Academy 62.9 22 2.24 35 2.49 1.111 24.438
14 El-Hajj Malik El-Shabazz Academy 48.4 15 1.53 31 2.21 1.443 21.645
15 Excel Charter Academy 83.3 30 3.06 36 2.56 0.838 25.13616 Gateway Middle High School * [20.0] [6] [0.58] [30] [1.76] [3.050] [18.299]
17 Grattan Academy 55.0 11 1.12 20 1.42 1.269 13.964
18 Horizons Community High School 74.3 26 2.65 35 2.49 0.940 24.438
19 Island City Academy * [40.0] [18] [1.73] [45] [2.64] [1.525] [27.449]20 Knapp Charter Academy 77.5 31 3.16 40 2.85 0.901 27.92921 Lake Bluff Academy (Newland Academy) 76.9 60 6.12 78 5.55 0.908 54.461
22 Lakeshore Public Academy * [0.0] [0] [0.00] [20] [1.17] [0.000] [0.000]
23 Learning Center Academy 90.0 27 2.75 30 2.14 0.776 20.94724 Michigan Early Elementary Center 65.0 13 1.33 20 1.42 1.074 13.964
25 Midland Acad. of Advanced & Creative Studies 73.3 11 1.12 15 1.07 0.952 10.473
26 Mid-Michigan Public School Academy 47.4 9 0.92 19 1.35 1.474 13.26627 Morey Charter School 69.3 61 6.22 88 6.26 1.007 61.44328 Nah Tah Wahsh Public School Academy * . [0.0] [0] [0.00] [30] [1.76] [0.000] [0.000]29 New Branches School 86.7 26 2.65 30 2.14 0.806 20.94730 New School for Creative Learning 50.0 13 1.33 26 1.85 1.396 18.15431 Northside Preparatory School 55.0 11 1.12 20 1.42 1.269 13.96432 Northwest Academy 72.4 21 2.14 29 2.06 0.964 20.248
33 Pansophia Academy * [21.4] [6] [0.58] [28] [1.64] [2.847] [17.079]34 Renaissance Public School Academy 52.9 9 0.92 17 1.21 1.319 11.870
35 Sankofa Shule Academy * [14.3] [4] [0.38] [28] [1.64] [4.270] [17.079]36 Sauk Trail Academy 58.3 21 2.14 36 2.56 1.197 25.13637 Sunrise Education Center 86.2 25 2.55 29 2.06 0.810 20.24838 Threshold Academy 68.2 15 1.53 22 1.57 1.024 15.361
39 Traverse Bay Community School 83.2 99 10.09 119 8.47 0.839 83.08840 Tri High School 50.0 5 0.51 10 0.71 1.396 6.98241 TriValley Academy 55.0 11 1.12 20 1.42 1.269 13.964
42 Vanderbilt Charter Academy * [30.0] [12] [1.15] [40] [2.35] [2.033] [24.399]
43 Vanguard Charter Academy 85.7 36 3.67 42 2.99 0.815 29.32544 Vista Charter Academy 53.3 16 1.63 30 2.14 1.309 20.947
45 Walden Green Day School 67.9 19 1.94 28 1.99 1.029 19.550
46 Walker Charter Academy 68.3 28 2.85 41 2.92 1.022 28.627
47 Walter French Acad. of Business and Tech.* [5.0] [2] [0.19] [40] [2.35] [12.199] [24.399]
48 West Mich. Acad. for Arts and Academics 68.8 22 2.24 32 2.28 1.016 22.343
49 West Mich. Acad. for Hospitality Sciences * [30] [6] [0.58] [20] [1.17] [2.033] [12.199]
50 West Mich. Acad. of Environmental Science 68.4 26 2.65 38 2.70 1.020 26.532
51 Windover High School 46.4 13 1.33 28 1.99 1.504 19.550
Total 69.8 981 100% 1405 100% 981
Note: The 10 schools marked with an asterick were not included in the analysis since they had a response rated lower than 45 percent.
Included in brackets are the figures and weights that would have been asigned to these schools if we included them in the analysis.
1 1 2
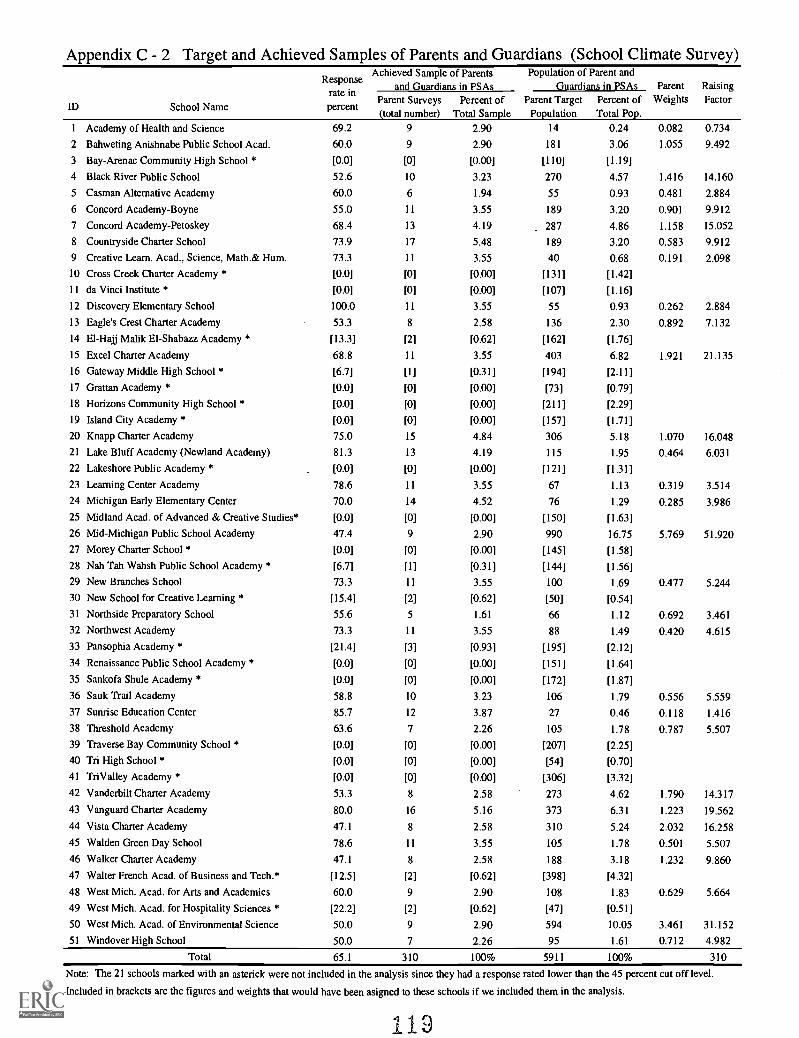
Appendix C - 2 Target and Achieved Samples of Parents and Guardians (School Climate Survey)
ID School Name
Responserate inpercent
Achieved Sample of Parentsand Guardians in PSAs
Population of Parent andGuardians in PSAs Parent
WeightsRaisingFactorParent Surveys
(total number)Percent of
Total SampleParent Target
PopulationPercent ofTotal Pop.
I Academy of Health and Science 69.2 9 2.90 14 0.24 0.082 0.734
2 Bahweting Anishnabe Public School Acad. 60.0 9 2.90 181 3.06 1.055 9.492
3 Bay-Arenac Community High School * [0.0] [0] [0.00] [110] [1.19]
4 Black River Public School 52.6 10 3.23 270 4.57 1.416 14.160
5 Casman Alternative Academy 60.0 6 1.94 55 0.93 0.481 2.884
6 Concord Academy-Boyne 55.0 11 3.55 189 3.20 0.901 9.912
7 Concord Academy-Petoskey 68.4 13 4.19 287 4.86 1.158 15.052
8 Countryside Charter School 73.9 17 5.48 189 3.20 0.583 9.912
9 Creative Learn. Acad., Science, Math.& Hum. 73.3 11 3.55 40 0.68 0.191 2.098
10 Cross Creek Charter Academy * [0.0] [0] [0.00] [131] [1.42]
11 da Vinci Institute * [0.0] [0] [0.00] [107] [1.16]
12 Discovery Elementary School 100.0 11 3.55 55 0.93 0.262 2.884
13 Eagle's Crest Charter Academy 53.3 8 2.58 136 2.30 0.892 7.132
14 El-Raj Malik E1- Shabazz Academy * [13.3] [2] [0.62] [162] [1.76]
15 Excel Charter Academy 68.8 11 3.55 403 6.82 1.921 21.135
16 Gateway Middle High School * [6.7] [1] [0.31] [194] [2.11]
17 Grattan Academy * [0.0] [0] [0.00] [73] [0.79]
18 Horizons Community High School * [0.0] [0] [0.00] [211] [2.29]
19 Island City Academy * [0.0] [0] [0.00] [157] [1.71]
20 Knapp Charter Academy 75.0 15 4.84 306 5.18 1.070 16.048
21 Lake Bluff Academy (Newland Academy) 81.3 13 4.19 115 1.95 0.464 6.031
22 Lakeshore Public Academy * [0.0] [0] [0.00] [121] [1.31]
23 Learning Center Academy 78.6 11 3.55 67 1.13 0.319 3.514
24 Michigan Early Elementary Center 70.0 14 4.52 76 1.29 0.285 3.986
25 Midland Acad. of Advanced & Creative Studies* [0.0] [0] [0.00] [150] [1.63]
26 Mid-Michigan Public School Academy 47.4 9 2.90 990 16.75 5.769 51.92027 Morey Charter School * [0.0] [0] [0.00] [145] [1.58]
28 Nah Tah Wahsh Public School Academy * [6.7] [1] [0.31] [144] [1.56]
29 New Branches School 73.3 11 3.55 100 1.69 0.477 5.244
30 New School for Creative Learning * [15.4] [2] [0.62] [50] [0.54]
31 Northside Preparatory School 55.6 5 1.61 66 1.12 0.692 3.461
32 Northwest Academy 73.3 11 3.55 88 1.49 0.420 4.615
33 Pansophia Academy * [21.4] [3] [0.93] [195] [2.12)
34 Renaissance Public School Academy * [0.0] [0] [0.00] [151] [1.64]
35 Sankofa Shule Academy * [0.0] [0] [0.00] [172] [1.87]
36 Sauk Trail Academy 58.8 10 3.23 106 1.79 0.556 5.559
37 Sunrise Education Center 85.7 12 3.87 27 0.46 0.118 1.416
38 Threshold Academy 63.6 7 2.26 105 1.78 0.787 5.507
39 Traverse Bay Community School * [0.0] [0] [0.00] [207] [2.25]
40 Tri High School * [0.0] [0] [0.00] [54] [0.70]
41 TriValley Academy * [0.0] [0] [0.00] [306] [3.32]
42 Vanderbilt Charter Academy 53.3 8 2.58 273 4.62 1.790 14.317
43 Vanguard Charter Academy 80.0 16 5.16 373 6.31 1.223 19.562
44 Vista Charter Academy 47.1 8 2.58 310 5.24 2.032 16.258
45 Walden Green Day School 78.6 11 3.55 105 1.78 0.501 5.507
46 Walker Charter Academy 47.1 8 2.58 188 3.18 1.232 9.860
47 Walter French Acad. of Business and Tech.* [12.5] [2] [0.62] [398] [4.32]
48 West Mich. Acad. for Arts and Academics 60.0 9 2.90 108 1.83 0.629 5.664
49 West Mich. Acad. for Hospitality Sciences * [22.2] [2] [0.62] [47] [0.51]
50 West Mich. Acad. of Environmental Science 50.0 9 2.90 594 10.05 3.461 31.152
51 Windover High School 50.0 7 2.26 95 1.61 0.712 4.982
Total 65.1 310 100% 5911 100% 310
Note: The 21 schools marked with an asterick were not included in the analysis since they had a response rated lower than the 45 percent cut off level.
Included in brackets are the figures and weights that would have been asigned to these schools if we included them in the analysis.
119
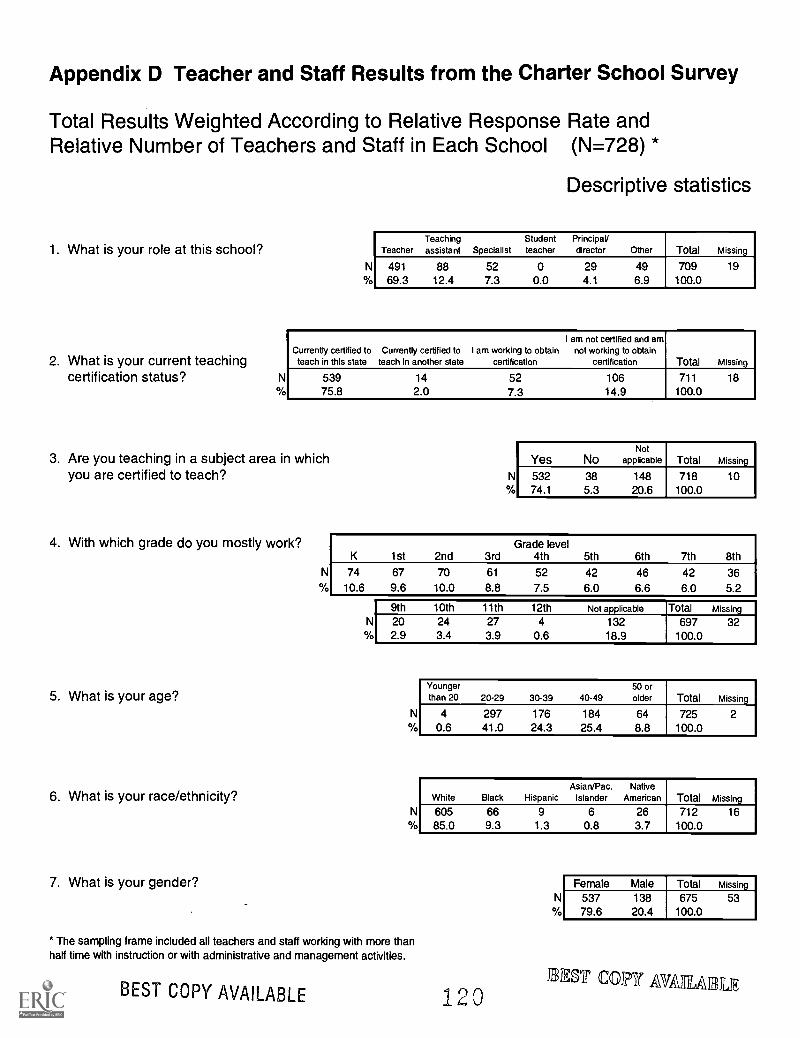
Appendix D Teacher and Staff Results from the Charter School Survey
Total Results Weighted According to Relative Response Rate andRelative Number of Teachers and Staff in Each School (N=728) *
Descriptive statistics
1. What is your role at this school?
2. What is your current teachingcertification status?
OA,
N
TeacherTeachingassistant Specialist
Studentteacher
Principaldirector Other Total Missing
49169.3
8812.4
527.3
00.0
294.1
496.9
709100.0
19
Currently certified toteach in this state
Currently certified toteach in another state
I am working to obtaincertification
I am not certified and amnot working to obtain
certification Total Missing
53975.8
142.0
527.3
10614.9
711100.0
18
3. Are you teaching in a subject area in whichyou are certified to teach?
4. With which grade do you mostly work?
N
%
5. What is your age?
6. What is your race/ethnicity?
7. What is your gender?
N0/0
Yes NoNot
applicable Total Missing
53274.1
385.3
14820.6
718100.0
10
Grade levelK 1st 2nd 3rd 4th 5th 6th 7th 8th
74 67 70 61 52 42 46 42 36
10.6 9.6 10.0 8.8 7.5 6.0 6.6 6.0 5.2
N
9th 10th 11th 12th Not applicable Total Missing
202.9
243.4
273.9
40.6
13218.9
697100.0
32
N
N
* The sampling frame included all teachers and staff working with more thanhalf time with instruction or with administrative and management activities.
Younger 50 orthan 20 20-29 30-39 40-49 older Total Missing
4 297 176 184 64 725 20.6 41.0 24.3 25.4 8.8 100.0
White Black HispanicAsian/Pac.
IslanderNative
American Total Missing
60585.0
669.3
91.3
60.8
263.7
712100.0
16
BEST COPY AVAILABLE 120
N0/0
Female Male Total missing
53779.6
13820.4
675100.0
53
JEST COE7 MAMA LIF
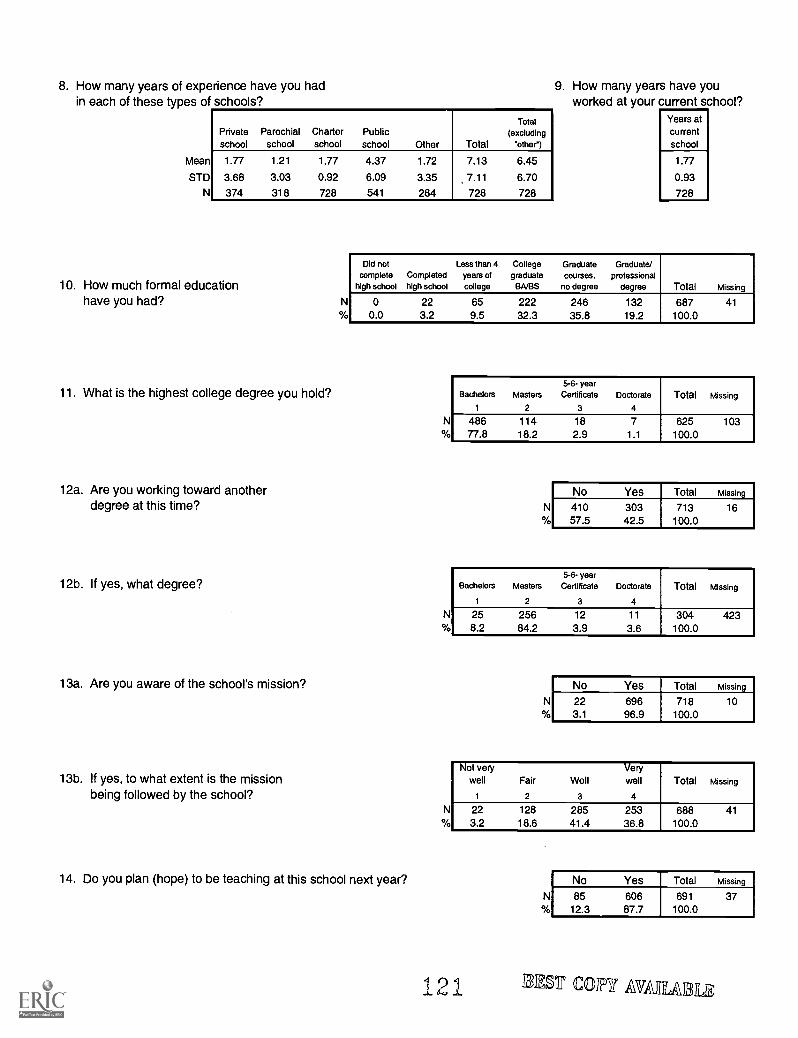
8. How many years of experience have you hadin each of these types o
Mean
STD
N
Privateschool
Parochialschool
Charterschool
Publicschool Other Total
Total(excluding
'other)
1.77
3.68
374
1.21
3.03
318
1.77
0.92
728
4.37
6.09
541
1.72
3.35
284
7.13
7.11
728
6.45
6.70
728
10. How much formal educationhave you had?
11. What is the highest college degree you hold?
12a. Are you working toward anotherdegree at this time?
12b. If yes, what degree?
13a. Are you aware of the school's mission?
13b. If yes, to what extent is the missionbeing followed by the school?
9. How many years have youworked at your current school?
Years atcurrentschool
1.77
0.93
728
Did notcomplete
high schoolCompletedhigh school
Less than 4years ofcollege
Collegegraduate
BA/BS
Graduatecourses,
no degree
Graduate/professional
degree Total Missing
00.0
223.2
659.5
22232.3
24635.8
13219.2
687100.0
41
14. Do you plan (hope) to be teaching at this school next year?
N
N
N
Bachelors
1
Masters
2
5-6- yearCertificate
3
Doctorate
4
Total Missing
48677.8
11418.2
182.9
71.1
625100.0
103
N
No Yes Total Missing
41057.5
30342.5
713100.0
16
Bachelors
1
Masters
2
5-6- yearCertificate
3
Doctorate
4
Total Missing
258.2
25684.2
123.9
11
3.6304
100.0423
N
No Yes Total Missing
223.1
69696.9
718100.0
10
Not verywell
1
Fair
2
Well
3
Verywell
4
Total Missing
223.2
12818.6
28541.4
25336.8
688100.0
41
191
N
No Yes Total Missing
8512.3
60687.7
691100.0
37
23011' Can AVAIILA
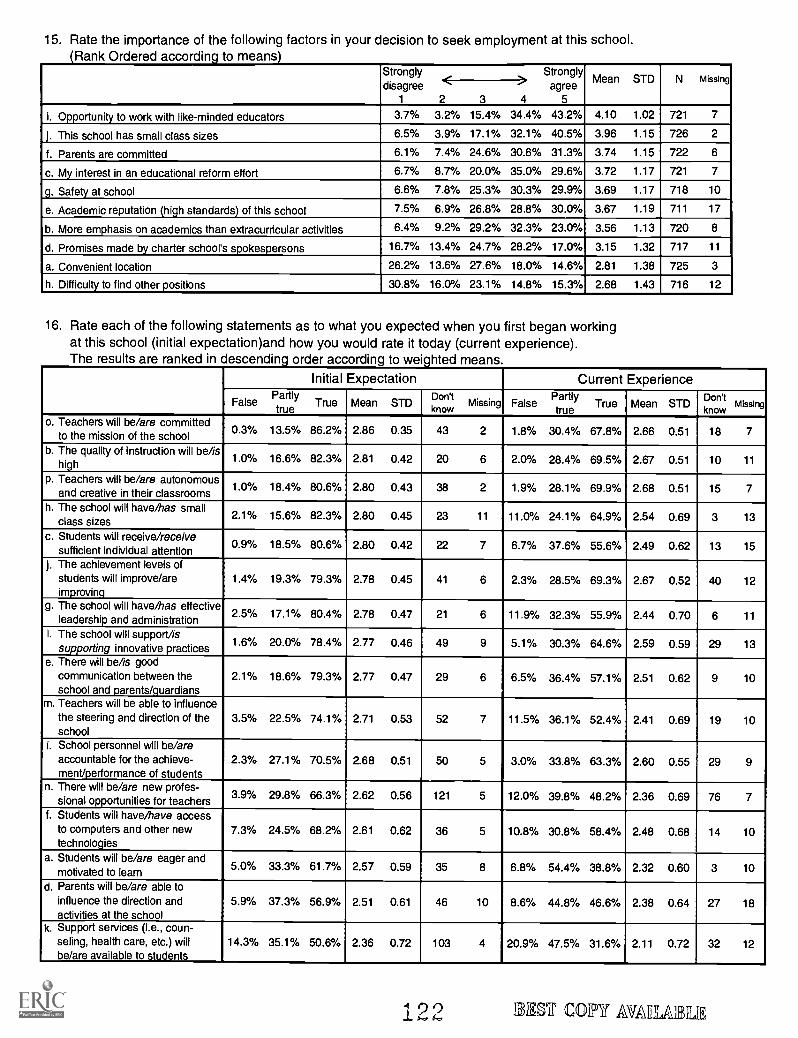
15. Rate the importance of the following factors in your decision to seek employment at this school.Rank Ordered according to means
Stronglydisagree
1
Stronglyagree
5
Mean STD N Missing
2 3 4
i. Opportunity to work with like-minded educators 3.7% 3.2% 15.4% 34.4% 43.2% 4.10 1.02 721 7
j. This school has small class sizes 6.5% 3.9% 17.1% 32.1% 40.5% 3.96 1.15 726 2
f. Parents are committed 6.1% 7.4% 24.6% 30.6% 31.3% 3.74 1.15 722 6
c. My interest in an educational reform effort 6.7% 8.7% 20.0% 35.0% 29.6% 3.72 1.17 721 7
g. Safety at school 6.6% 7.8% 25.3% 30.3% 29.9% 3.69 1.17 718 10
e. Academic reputation (high standards) of this school 7.5% 6.9% 26.8% 28.8% 30.0% 3.67 1.19 711 17
b. More emphasis on academics than extracurricular activities 6.4% 9.2% 29.2% 32.3% 23.0% 3.56 1.13 720
d. Promises made by charter school's spokespersons 16.7% 13.4% 24.7% 28.2% 17.0% 3.15 1.32 717 11
a. Convenient location 26.2% 13.6% 27.6% 18.0% 14.6% 2.81 1.38 725 3
h. Difficulty to find other positions 30.8% 16.0% 23.1% 14.8% 15.3% 2.68 1.43 716 12
16. Rate each of the following statements as to what you expected when you first began workingat this school (initial expectation)and how you would rate it today (current experience).The results are ranked in descending order according to weighted means.
Initial Expectation Current Experience
FalsePartlytrue
True Mean STDDon'tknow
Missing FalsePartlytrue
True Mean STDDon'tknow
Missing
o. Teachers will be/are committedto the mission of the school 0.3% 13.5% 86.2% 2.86 0.35 43 2 1.8% 30.4% 67.8% 2.66 0.51 18 7
b. The quality of instruction will be/ishigh
1.0% 16.6% 82.3% 2.81 0.42 20 6 2.0% 28.4% 69.5% 2.67 0.51 10 11
p. Teachers will be/are autonomousand creative in their classrooms
1.0% 18.4% 80.6% 2.80 0.43 38 2 1.9% 28.1% 69.9% 2.68 0.51 15 7
h. The school will have/has smallclass sizes
2.1% 15.6% 82.3% 2.80 0.45 23 11 11.0% 24.1% 64.9% 2.54 0.69 3 13
c. Students will receive/receivesufficient individual attention 0.9% 18.5% 80.6% 2.80 0.42 22 7 6.7% 37.6% 55.6% 2.49 0.62 13 15
j. The achievement levels ofstudents will improve/areimproving
1.4% 19.3% 79.3% 2.78 0.45 41 6 2.3% 28.5% 69.3% 2.67 0.52 40 12
g. The school will have/has effectiveleadership and administration
2.5% 17.1% 80.4% 2.78 0.47 21 6 11.9% 32.3% 55.9% 2.44 0.70 6 11
I. The school will support/issupporting innovative practices
1.6% 20.0% 78.4% 2.77 0.46 49 9 5.1% 30.3% 64.6% 2.59 0.59 29 13
e. There will be/is goodcommunication between theschool and parents/guardians
2.1% 18.6% 79.3% 2.77 0.47 29 6 6.5% 36.4% 57.1% 2.51 0.62 9 10
m. Teachers will be able to influencethe steering and direction of theschool
3.5% 22.5% 74.1% 2.71 0.53 52 7 11.5% 36.1% 52.4% 2.41 0.69 19 10
i. School personnel will be/areaccountable for the achieve-ment/performance of students
2.3% 27.1% 70.5% 2.68 0.51 50 5 3.0% 33.8% 63.3% 2.60 0.55 29 9
n. There will be/are new profes-sional opportunities for teachers
3.9% 29.8% 66.3% 2.62 0.56 121 5 12.0% 39.8% 48.2% 2.36 0.69 76 7
f. Students will have/have accessto computers and other newtechnologies
7.3% 24.5% 68.2% 2.61 0.62 36 5 10.8% 30.8% 58.4% 2.48 0.68 14 10
a. Students will be/are eager andmotivated to leam 5.0% 33.3% 61.7% 2.57 0.59 35 8 6.8% 54.4% 38.8% 2.32 0.60 3 10
d. Parents will be/are able toinfluence the direction andactivities at the school
5.9% 37.3% 56.9% 2.51 0.61 46 10 8.6% 44.8% 46.6% 2.38 0.64 27 18
k. Support services (i.e., coun-seling, health care, etc.) willbe/are available to students
14.3% 35.1% 50.6% 2.36 0.72 103 4 20.9% 47.5% 31.6% 2.11 0.72 32 12
.1 00I(.... .., MEM COPY' MAMA IL LIE
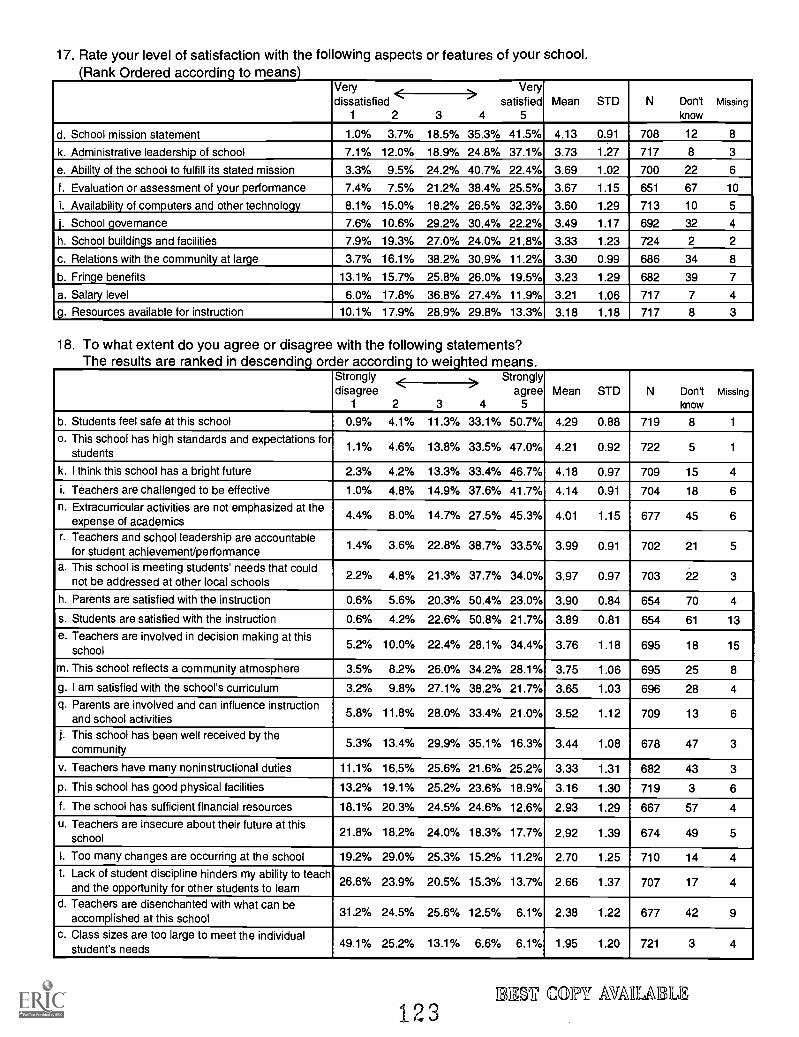
17. Rate your level of satisfaction with the following aspects or features of your school.Rank Ordered according to means
Verydissatisfied
1
Verysatisfied
5Mean STD N Don't
knowMissing
<2 3
>4
d. School mission statement 1.0% 3.7% 18.5% 35.3% 41.5% 4.13 0.91 708 12 8
k. Administrative leadership of school 7.1% 12.0% 18.9% 24.8% 37.1% 3.73 1.27 717 8 3
e. Ability of the school to fulfill its stated mission 3.3% 9.5% 24.2% 40.7% 22.4% 3.69 1.02 700 22 6
f. Evaluation or assessment of your performance 7.4% 7.5% 21.2% 38.4% 25.5% 3.67 1.15 651 67 10
i. Availability of computers and other technology 8.1% 15.0% 18.2% 26.5% 32.3% 3.60 1.29 713 10 5
j. School govemance 7.6% 10.6% 29.2% 30.4% 22.2% 3.49 1.17 692 32 4
h. School buildings and facilities 7.9% 19.3% 27.0% 24.0% 21.8% 3.33 1.23 724 2 2
c. Relations with the community at large 3.7% 16.1% 38.2% 30.9% 11.2% 3.30 0.99 686 34 8
b. Fringe benefits 13.1% 15.7% 25.8% 26.0% 19.5% 3.23 1.29 682 39 7
a. Salary level 6.0% 17.8% 36.8% 27.4% 11.9% 3.21 1.06 717 7 4
g. Resources available for instruction 10.1% 17.9% 28.9% 29.8% 13.3% 3.18 1.18 717 8 3
18. To what extent do you agree or disagree with the following statements?The results are ranked in descending order according to weighted means.
Stronglydisagree
1
Stronglyagree
5Mean STD N Don't
knowMissing
2 3 4
b. Students feel safe at this school 0.9% 4.1% 11.3% 33.1% 50.7% 4.29 0.88 719 8 1
o. This school has high standards and expectations forstudents
1.1% 4.6% 13.8% 33.5% 47.0% 4.21 0.92 722 5 1
k. I think this school has a bright future 2.3% 4.2% 13.3% 33.4% 46.7% 4.18 0.97 709 15 4
i. Teachers are challenged to be effective 1.0% 4.8% 14.9% 37.6% 41.7% 4.14 0.91 704 18 6
n. Extracurricular activities are not emphasized at theexpense of academics 4.4% 8.0% 14.7% 27.5% 45.3% 4.01 1.15 677 45 6
r. Teachers and school leadership are accountablefor student achievement/performance 1.4% 3.6% 22.8% 38.7% 33.5% 3.99 0.91 702 21 5
a. This school is meeting students' needs that couldnot be addressed at other local schools 2.2% 4.8% 21.3% 37.7% 34.0% 3.97 0.97 703 22 3
h. Parents are satisfied with the instruction 0.6% 5.6% 20.3% 50.4% 23.0% 3.90 0.84 654 70 4
s. Students are satisfied with the instruction 0.6% 4.2% 22.6% 50.8% 21.7% 3.89 0.81 654 61 13
e. Teachers are involved in decision making at thisschool 5.2% 10.0% 22.4% 28.1% 34.4% 3.76 1.18 695 18 15
m. This school reflects a community atmosphere 3.5% 8.2% 26.0% 34.2% 28.1% 3.75 1.06 695 25 8
g. I am satisfied with the school's curriculum 3.2% 9.8% 27.1% 38.2% 21.7% 3.65 1.03 696 28 4
q. Parents are involved and can influence instructionand school activities 5.8% 11.8% 28.0% 33.4% 21.0% 3.52 1.12 709 13 6
j. This school has been well received by thecommunity 5.3% 13.4% 29.9% 35.1% 16.3% 3.44 1.08 678 47 3
v. Teachers have many noninstructional duties 11.1% 16.5% 25.6% 21.6% 25.2% 3.33 1.31 682 43 3
p. This school has good physical facilities 13.2% 19.1% 25.2% 23.6% 18.9% 3.16 1.30 719 3 6
f. The school has sufficient financial resources 18.1% 20.3% 24.5% 24.6% 12.6% 2.93 1.29 667 57 4
u. Teachers are insecure about their future at thisschool 21.8% 18.2% 24.0% 18.3% 17.7% 2.92 1.39 674 49 5
I. Too many changes are occurring at the school 19.2% 29.0% 25.3% 15.2% 11.2% 2.70 1.25 710 14 4
t. Lack of student discipline hinders my ability to teachand the opportunity for other students to learn 26.6% 23.9% 20.5% 15.3% 13.7% 2.66 1.37 707 17 4
d. Teachers are disenchanted with what can beaccomplished at this school 31.2% 24.5% 25.6% 12.5% 6.1% 2.38 1.22 677 42 9
c. Class sizes are too large to meet the individualstudent's needs 49.1% 25.2% 13.1% 6.6% 6.1% 1.95 1.20 721 3 4
Ilan COT" AVAIlliA1 2 3
11; LIE
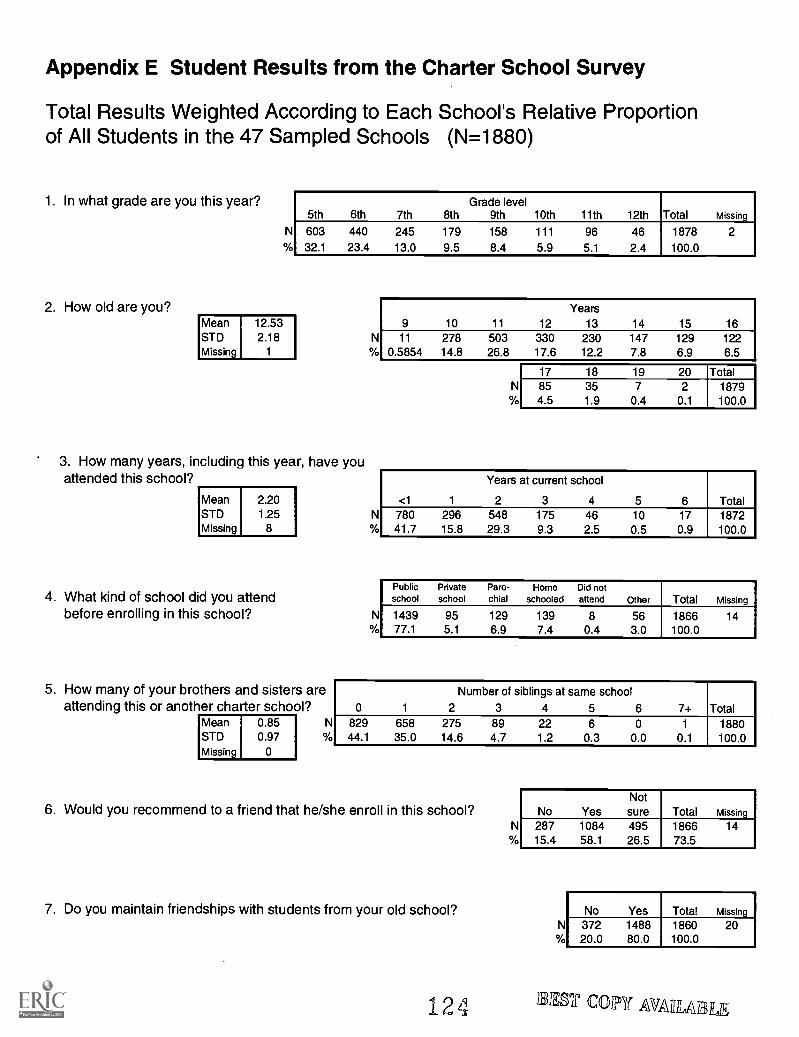
Appendix E Student Results from the Charter School Survey
Total Results Weighted According to Each School's Relative Proportionof All Students in the 47 Sampled Schools (N=1880)
1. In what grade are you this year?
N
Grade level5th 6th 7th 8th 9th 10th 11th 12th Total Missing
603 440 245 179 158 111 96 46 1878 2
32.1 23.4 13.0 9.5 8.4 5.9 5.1 2.4 100.0
2. How old are you? YearsMean 12.53 9 10 11 12 13 14 15 16STD 2.18 N 11 278 503 330 230 147 129 122Missing 1 0.5854 14.8 26.8 17.6 12.2 7.8 6.9 6.5
3. How many years, including this year, have youattended this school?
MeanSTDMissing
2.201.25
8
4. What kind of school did you attendbefore enrolling in this school?
5. How many of your brothers and sisters areattending this or another charter school?
NMeanSTDMissing
0.850.97
0
N
N
N17 18 19 20 Total854.5
351.9
70.4
20.1
1879100.0
Years at current school
<1 1 2 3 4 5 6 Total780 296 548 175 46 10 17 187241.7 15.8 29.3 9.3 2.5 0.5 0.9 100.0
Publicschool
Privateschool
Paro-chial
Homeschooled
Did notattend Other Total Missing
143977.1
955.1
1296.9
1397.4
80.4
563.0
1866100.0
14
Number of siblings at same school0 1 2 3 4 5 6 7+ Total
829 658 275 89 22 6 0 1 188044.1 35.0 14.6 4.7 1.2 0.3 0.0 0.1 100.0
6. Would you recommend to a friend that he/she enroll in this school?
7. Do you maintain friendships with students from your old school?
124
N
NotNo Yes sure Total Missing
287 1084 495 1866 1415.4 58.1 26.5 73.5
N
No Yes Total Missing
37220.0
148880.0
1860100.0
20
111337 Con MARA
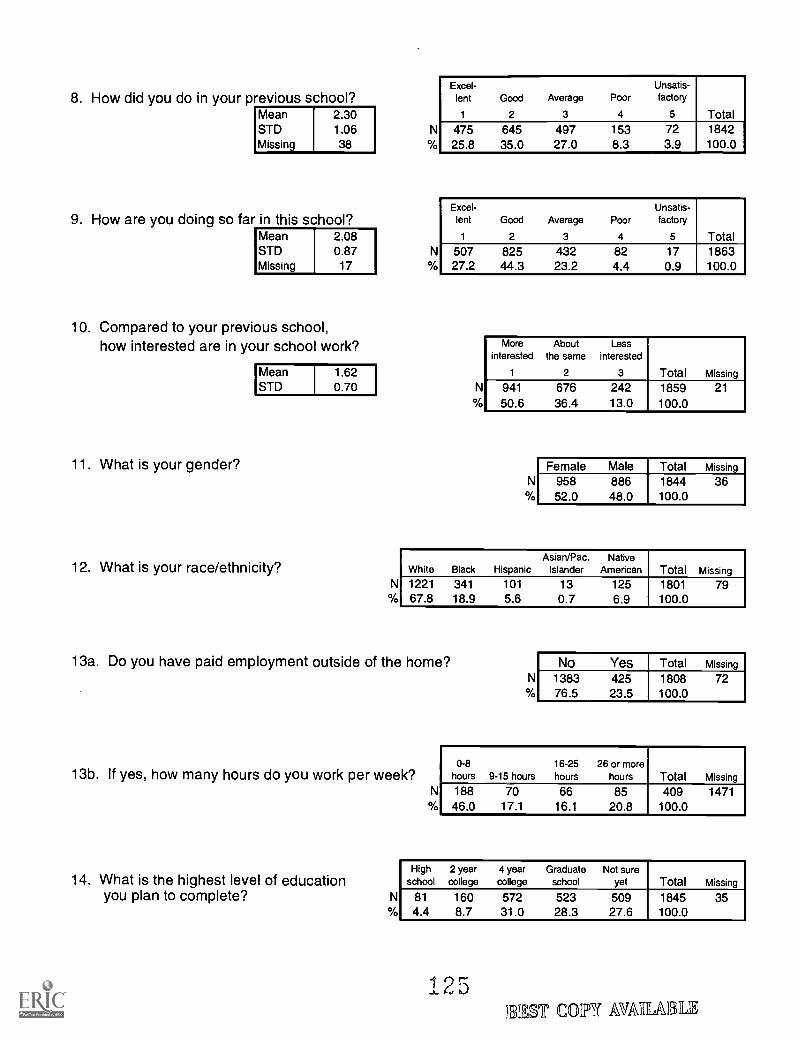
8. How did you do in your previous school?Mean 2.30STD 1.06Missing 38
9. How are you doing so far in this school?Mean 2.08STD 0.87Missing 17
10. Compared to your previous school,how interested are in your school work?
1.620.70
11. What is your gender?
12. What is your race/ethnicity?
MeanSTD
N
N
N
Excel-lent Good Average Poor
Unsatis-factory
1 2 3 4 5 Total475 645 497 153 72 184225.8 35.0 27.0 8.3 3.9 100.0
Excel-lent Good Average Poor
Unsatis-factory
1 2 3 4 5 Total507 825 432 82 17 186327.2 44.3 23.2 4.4 0.9 100.0
N
Moreinterested
1
Aboutthe same
2
Lessinterested
3 Total Missing
941
50.667636.4
24213.0
1859100.0
21
N0/0
Female Male Total Missing
95852.0
88648.0
1844100.0
36
White Black HispanicAsian/Pac.
IslanderNative
American Total Missing122167.8
34118.9
101
5.6130.7
1256.9
1801100.0
79
13a. Do you have paid employment outside of the home?
13b. If yes, how many hours do you work per week?N
14. What is the highest level of educationyou plan to complete?
N
No Yes Total Missing
138376.5
42523.5
1808100.0
72
0-8hours 9-15 hours
16-25hours
26 or morehours Total Missing
18846.0
7017.1
6616.1
8520.8
409100.0
1471
Highschool
2 yearcollege
4 yearcollege
Graduateschool
Not sureyet Total Missing
81
4.41608.7
57231.0
52328.3
50927.6
1845100.0
35
1 r-
1111331° COPT AVATILABLE
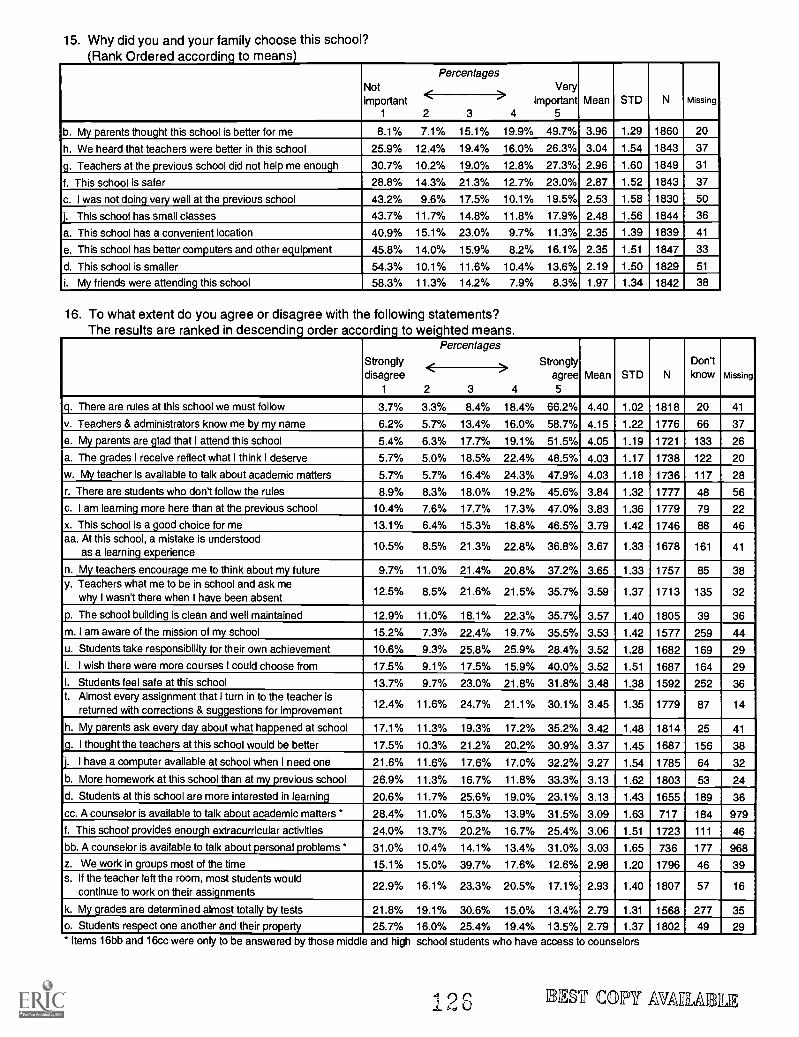
15. Why did you and your family choose this school?Rank Ordered according to means
Notimportant
1
PercentagesVery
important5
Mean STD N Missing
2 3 4
b. My parents thought this school is better for me 8.1% 7.1% 15.1% 19.9% 49.7% 3.96 1.29 1860 20
h. We heard that teachers were better in this school 25.9% 12.4% 19.4% 16.0% 26.3% 3.04 1.54 1843 37
g. Teachers at the previous school did not help me enough 30.7% 10.2% 19.0% 12.8% 27.3% 2.96 1.60 1849 31
f. This school is safer 28.8% 14.3% 21.3% 12.7% 23.0% 2.87 1.52 1843 37
c. I was not doing very well at the previous school 43.2% 9.6% 17.5% 10.1% 19.5% 2.53 1.58 1830 50
j. This school has small classes 43.7% 11.7% 14.8% 11.8% 17.9% 2.48 1.56 1844 36
a. This school has a convenient location 40.9% 15.1% 23.0% 9.7% 11.3% 2.35 1.39 1839 41
e. This school has better computers and other equipment 45.8% 14.0% 15.9% 8.2% 16.1% 2.35 1.51 1847 33
d. This school is smaller 54.3% 10.1% 11.6% 10.4% 13.6% 2.19 1.50 1829 51
i. My friends were attending this school 58.3% 11.3% 14.2% 7.9% 8.3% 1.97 1.34 1842 38
16. To what extent do you agree or disagree with the following statements?The results are ranked in descending order according to weighted means.
Stronglydisagree
1
Percentages
Stronglyagree5
Mean STD N
Don'tknow Missing
2 3 4
q. There are rules at this school we must follow 3.7% 3.3% 8.4% 18.4% 66.2% 4.40 1.02 1818 20 41
v. Teachers & administrators know me by my name 6.2% 5.7% 13.4% 16.0% 58.7% 4.15 1.22 1776 66 37
e. My parents are glad that I attend this school 5.4% 6.3% 17.7% 19.1% 51.5% 4.05 1.19 1721 133 26
a. The grades I receive reflect what I think I deserve 5.7% 5.0% 18.5% 22.4% 48.5% 4.03 1.17 1738 122 20
w. My teacher is available to talk about academic matters 5.7% 5.7% 16.4% 24.3% 47.9% 4.03 1.18 1736 117 28
r. There are students who don't follow the rules 8.9% 8.3% 18.0% 19.2% 45.6% 3.84 1.32 1777 48 56
c. I am learning more here than at the previous school 10.4% 7.6% 17.7% 17.3% 47.0% 3.83 1.36 1779 79 22
x. This school is a good choice for me 13.1% 6.4% 15.3% 18.8% 46.5% 3.79 1.42 1746 88 46aa. At this school, a mistake is understood
as a learning experience10.5% 8.5% 21.3% 22.8% 36.8% 3.67 1.33 1678 161 41
n. My teachers encourage me to think about my future 9.7% 11.0% 21.4% 20.8% 37.2% 3.65 1.33 1757 85 38y. Teachers what me to be in school and ask me
why I wasn't there when I have been absent12.5% 8.5% 21.6% 21.5% 35.7% 3.59 1.37 1713 135 32
p. The school building is clean and well maintained 12.9% 11.0% 18.1% 22.3% 35.7% 3.57 1.40 1805 39 36m. I am aware of the mission of my school 15.2% 7.3% 22.4% 19.7% 35.5% 3.53 1.42 1577 259 44
u. Students take responsibility for their own achievement 10.6% 9.3% 25.8% 25.9% 28.4% 3.52 1.28 1682 169 29i. I wish there were more courses I could choose from 17.5% 9.1% 17.5% 15.9% 40.0% 3.52 1.51 1687 164 29I. Students feel safe at this school 13.7% 9.7% 23.0% 21.8% 31.8% 3.48 1.38 1592 252 36t. Almost every assignment that I turn in to the teacher is
returned with corrections & suggestions for improvement12.4% 11.6% 24.7% 21.1% 30.1% 3.45 1.35 1779 87 14
h. My parents ask every day about what happened at school 17.1% 11.3% 19.3% 17.2% 35.2% 3.42 1.48 1814 25 41
g. I thought the teachers at this school would be better 17.5% 10.3% 21.2% 20.2% 30.9% 3.37 1.45 1687 156 38
j. I have a computer available at school when I need one 21.6% 11.6% 17.6% 17.0% 32.2% 3.27 1.54 1785 64 32
b. More homework at this school than at my previous school 26.9% 11.3% 16.7% 11.8% 33.3% 3.13 1.62 1803 53 24
d. Students at this school are more interested in learning 20.6% 11.7% 25.6% 19.0% 23.1% 3.13 1.43 1655 189 36
cc. A counselor is available to talk about academic matters * 28.4% 11.0% 15.3% 13.9% 31.5% 3.09 1.63 717 184 979
f. This school provides enough extracurricular activities 24.0% 13.7% 20.2% 16.7% 25.4% 3.06 1.51 1723 111 46
bb. A counselor is available to talk about personal problems * 31.0% 10.4% 14.1% 13.4% 31.0% 3.03 1.65 736 177 968
z. We work in groups most of the time 15.1% 15.0% 39.7% 17.6% 12.6% 2.98 1.20 1796 46 39s. If the teacher left the room, most students would
continue to work on their assignments 22.9% 16.1% 23.3% 20.5% 17.1% 2.93 1.40 1807 57 16
k. My grades are determined almost totally by tests 21.8% 19.1% 30.6% 15.0% 13.4% 2.79 1.31 1568 277 35
o. Students respect one another and their property 25.7% 16.0% 25.4% 19.4% 13.5% 2.79 1.37 1802 49 29* Items 16bb and 16cc were only to be answered by those middle and high school students who have access to counselors
4 0 rt BEST COPY AVA111,01f3:
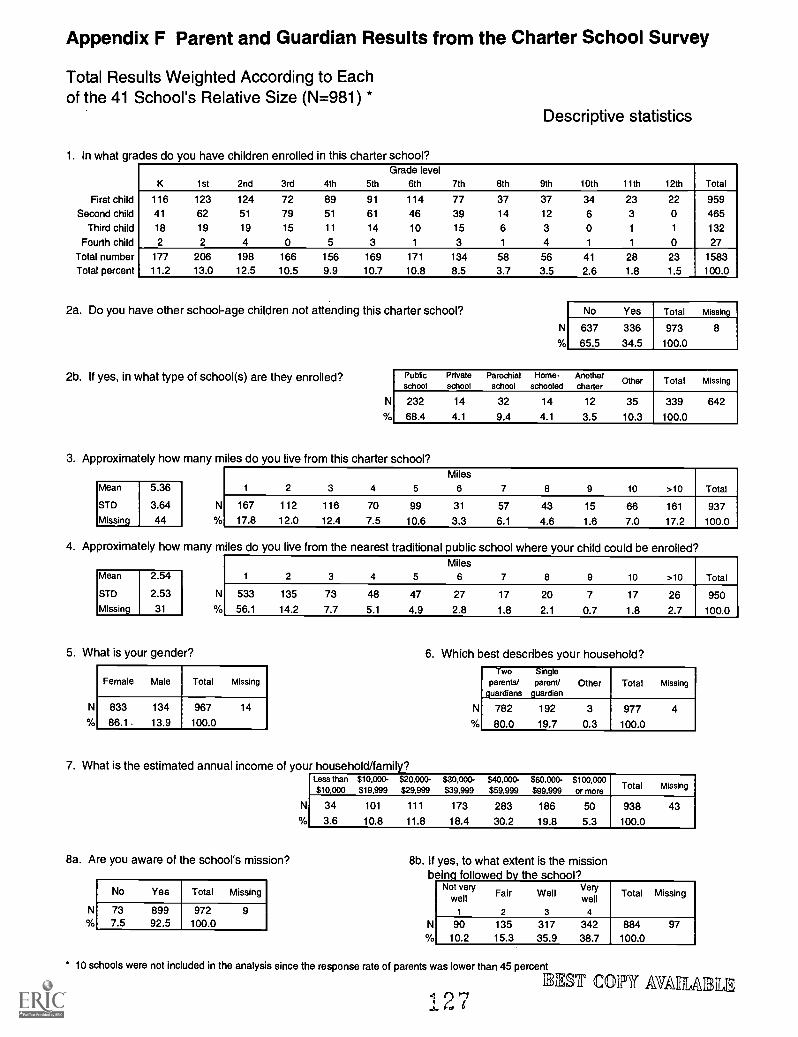
Appendix F Parent and Guardian Results from the Charter School Survey
Total Results Weighted According to Eachof the 41 School's Relative Size (N=981) *
1. In what grades do you have children enrolled in this charter school?
First child
Second childThird child
Fourth child
Total numberTotal percent
Descriptive statistics
K 1st 2nd 3rd 4th 5th
Grade level6th 7th 8th 9th 10th 11th 12th Total
116 123 124 72 89 91 114 77 37 37 34 23 22 95941 62 51 79 51 61 46 39 14 12 6 3 0 46518 19 19 15 11 14 10 15 6 3 0 1 1 132
2 2 4 0 5 3 1 3 1 4 1 1 0 27
177 206 198 166 156 169 171 134 58 56 41 28 23 158311.2 13.0 12.5 10.5 9.9 10.7 10.8 8.5 3.7 3.5 2.6 1.8 1.5 100.0
2a. Do you have other school-age children not attending this charter school?
2b. If yes, in what type of school(s) are they enrolled?
N
N
No Yes Total Missing
637
65.5
336
34.5
973
100.0
8
Publicschool
Privateschool
Parochialschool
Home-schooled
Anothercharter
Other Total Missing
232
68.4
14
4.1
32
9.4
14
4.1
12
3.5
35
10.3
339
100.0
642
3. Approximately how many miles do you live from this charter school?
Mean
STD
Missing
5.36
3.64
44
N
Miles1 2 3 4 5 6 7 8 9 10 >10 Total
167 112 116 70 99 31 57 43 15 66 161 93717.8 12.0 12.4 7.5 10.6 3.3 6.1 4.6 1.6 7.0 17.2 100.0
4. Approximately how many miles do you live from the nearest traditional public school where your child could be enrolled?
Mean
STD
Missing
2.54
2.53
31
5. What is your gender?
N
N
Miles1 2 3 4 5 6 7 8 9 10 >10 Total
533 135 73 48 47 27 17 20 7 17 26 95056.1 14.2 7.7 5.1 4.9 2.8 1.8 2.1 0.7 1.8 2.7 100.0
Female Male Total Missing
833 134 967 14
86.1. 13.9 100.0
7. What is the estimated annual income of yo
8a. Are you aware of the school's mission?
N
No Yes Total Missing
737.5
89992.5
972100.0
9
N
6. Which best describes your household?
N
Twoparents/
guardians
Singleparent/
guardianOther Total Missing
782
80.0
192
19.7
3
0.3
977
100.0
4
Less than$10,000
$10,000-$19,999
$20,000-$29,999
$30,000-$39,999
$40,000-$59,999
$60,000-$99,999
$100,000or more
Total Missing
34 101 111 173 283 186 50 938 433.6 10.8 11.8 18.4 30.2 19.8 5.3 100.0
8b. If yes, to what extent is the missionbeing followed by the school?
Notwell
1
Fair
2
Well
3
VeryWry
ell4
Total Missing
9010.2
13515.3
31735.9
34238.7
884100.0
97
10 schools were not included in the analysis since the response rate of parents was lower than 45 percent
0 f",bye d
BEST COTT AVAILAIBILIF,
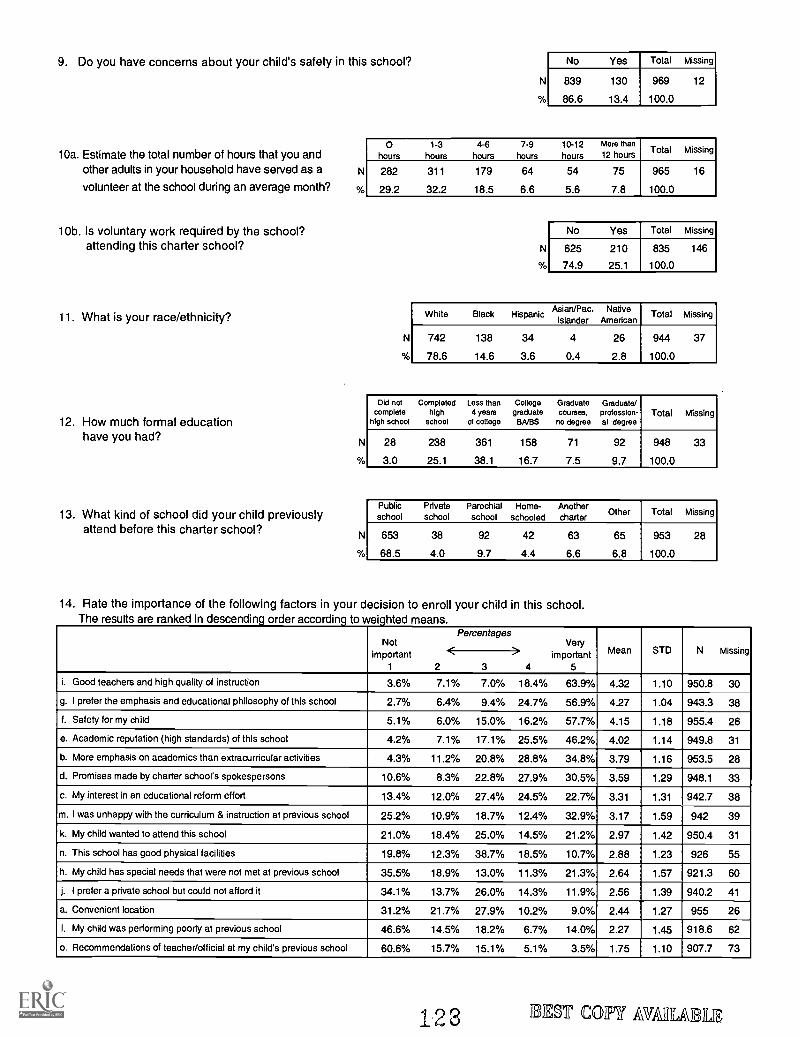
9. Do you have concerns about your child's safety in this school?
10a. Estimate the total number of hours that you andother adults in your household have served as a
volunteer at the school during an average month?
10b. Is voluntary work required by the school?attending this charter school?
11. What is your race/ethnicity?
12. How much formal educationhave you had?
13. What kind of school did your child previouslyattend before this charter school?
N
N
ok
N
N
ok
No Yes Total Missing
839
86.6
130
13.4
969
100.0
12
0hours
1-3hours
4-6hours
7.9hours
10-12hours
More than
12 hoursTotal Missing
282
29.2
311
32.2
179
18.5
64
6.6
54
5.6
75
7.8
965
100.0
16
N
N
No Yes Total Missing
625
74.9
210
25.1
835
100.0
146
White Black HispanicAsian/Pac. Native
Islander AmericanTotal Missing
742
78.6
138
14.6
34 4 26
3.6 0.4 2.8
944
100.0
37
Did notcomplete
high school
Completedhigh
school
Less than4 years
of college
CollegegraduateBA/BS
Graduatecourses,
no degree
Graduate/profession-al degree
Total Missing
28
3.0
238
25.1
361
38.1
158
16.7
71
7.5
92
9.7
948
100.0
33
Publicschool
Privateschool
Parochialschool
Home-schooled
Anothercharter
Other Total Missing
653
68.5
38
4.0
92
9.7
42
4.4
63
6.6
65
6.8
953
100.0
28
14. Rate the importance of the following factors in your decision to enroll your child in this school.The results are ranked in descending order according to weighted means.
Notimportant
1
PercentagesVery
important5
Mean STD N Missing<2 3
>4
i. Good teachers and high quality of instruction 3.6% 7.1% 7.0% 18.4% 63.9% 4.32 1.10 950.8 30
g. I prefer the emphasis and educational philosophy of this school 2.7% 6.4% 9.4% 24.7% 56.9% 4.27 1.04 943.3 38
f. Safety for my child 5.1% 6.0% 15.0% 16.2% 57.7% 4.15 1.18 955.4 26
e. Academic reputation (high standards) of this school 4.2% 7.1% 17.1% 25.5% 46.2% 4.02 1.14 949.8 31
b. More emphasis on academics than extracurricular activities 4.3% 11.2% 20.8% 28.8% 34.8% 3.79 1.16 953.5 28
d. Promises made by charter school's spokespersons 10.6% 8.3% 22.8% 27.9% 30.5% 3.59 1.29 948.1 33
c. My interest in an educational reform effort 13.4% 12.0% 27.4% 24.5% 22.7% 3.31 1.31 942.7 38
m. I was unhappy with the curriculum & instruction at previous school 25.2% 10.9% 18.7% 12.4% 32.9% 3.17 1.59 942 39
k. My child wanted to attend this school 21.0% 18.4% 25.0% 14.5% 21.2% 2.97 1.42 950.4 31
n. This school has good physical facilities 19.8% 12.3% 38.7% 18.5% 10.7% 2.88 1.23 926 55
h. My child has special needs that were not met at previous school 35.5% 18.9% 13.0% 11.3% 21.3% 2.64 1.57 921.3 60
j. I prefer a private school but could not afford it 34.1% 13.7% 26.0% 14.3% 11.9% 2.56 1.39 940.2 41
a. Convenient location 31.2% 21.7% 27.9% 10.2% 9.0% 2.44 1.27 955 26
I. My child was performing poorly at previous school 46.6% 14.5% 18.2% 6.7% 14.0% 2.27 1.45 918.6 62
o. Recommendations of teacher/official at my child's previous school 60.6% 15.7% 15.1% 5.1% 3.5% 1.75 1.10 907.7 73
123 BETT CON MARLA
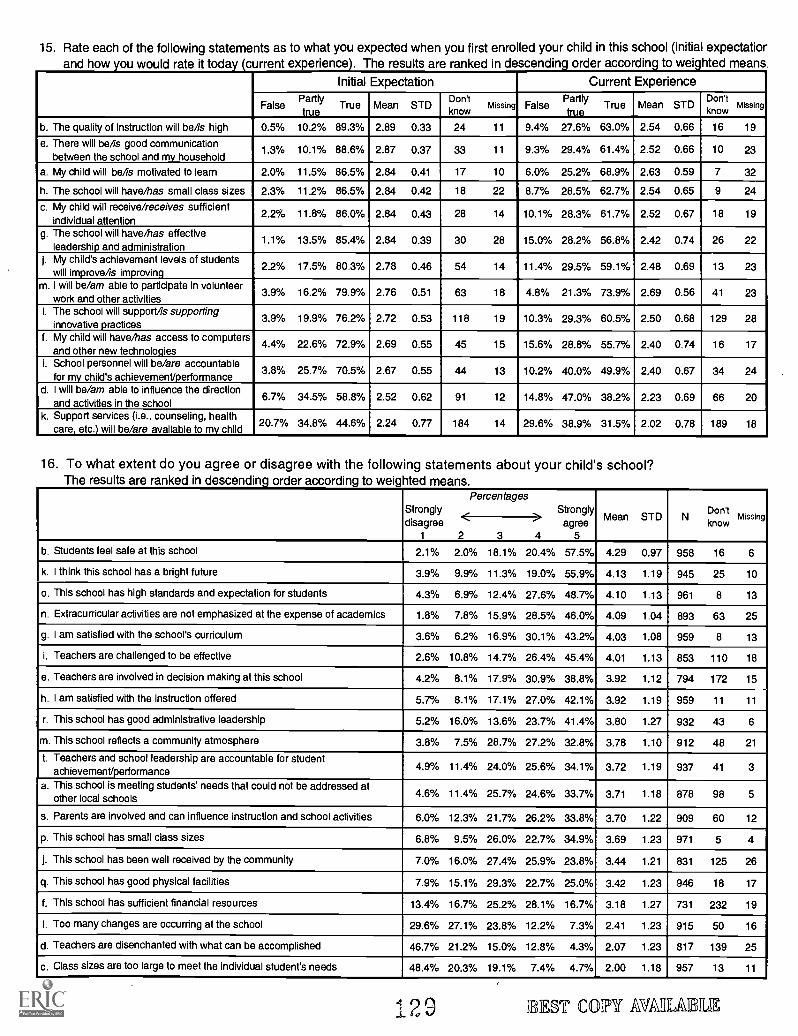
15. Rate each of the following statements as to what you expected when you first enrolled your child in this school (initial expectatiorand how you would rate it today (current ex erience . The results are ranked in descending order according to weighted means.
Initial Expectation Current Experience
FalsePartlytrue
True Mean STDDon'tknow
Missing FalsePartlytrue
True Mean STDDon'tknow
Missing
b. The quality of instruction will bens high 0.5% 10.2% 89.3% 2.89 0.33 24 11 9.4% 27.6% 63.0% 2.54 0.66 16 19
e. There will be/is good communicationbetween the school and my household
1.3% 10.1% 88.6% 2.87 0.37 33 11 9.3% 29.4% 61.4% 2.52 0.66 10 23
a. My child will bens motivated to learn 2.0% 11.5% 86.5% 2.84 0.41 17 10 6.0% 25.2% 68.9% 2.63 0.59 7 32
h. The school will have/has small class sizes 2.3% 11.2% 86.5% 2.84 0.42 18 22 8.7% 28.5% 62.7% 2.54 0.65 9 24
c. My child will receive/receives sufficientindividual attention
2.2% 11.8% 86.0% 2.84 0.43 28 14 10.1% 28.3% 61.7% 2.52 0.67 18 19
g. The school will have/has effectiveleadership and administration
1.1% 13.5% 85.4% 2.84 0.39 30 28 15.0% 28.2% 56.8% 2.42 0.74 26 22
j. My child's achievement levels of studentswill improve/is Improving
2.2% 17.5% 80.3% 2.78 0.46 54 14 11.4% 29.5% 59.1% 2.48 0.69 13 23
m. I will be/am able to participate in volunteerwork and other activities
3.9% 16.2% 79.9% 2.76 0.51 63 18 4.8% 21.3% 73.9% 2.69 0.56 41 23
I. The school will supports supportinginnovative practices
3.9% 19.9% 76.2% 2.72 0.53 118 19 10.3% 29.3% 60.5% 2.50 0.68 129 28
f. My child will have/has access to computersand other new technologies
4.4% 22.6% 72.9% 2.69 0.55 45 15 15.6% 28.8% 55.7% 2.40 0.74 16 17
i. School personnel will be/are accountablefor my child's achievement/performance
3.8% 25.7% 70.5% 2.67 0.55 44 13 10.2% 40.0% 49.9% 2.40 0.67 34 24
d. I will be/am able to influence the directionand activities in the school
6.7% 34.5% 58.8% 2.52 0.62 91 12 14.8% 47.0% 38.2% 2.23 0.69 66 20
k. Support services (i.e., counseling, healthcare, etc.) will be/are available to my child
20.7% 34.8% 44.6% 2.24 0.77 184 14 29.6% 38.9% 31.5% 2.02 0.78 189 18
16. To what extent do you agree or disagree with the following statements about your child's school?The results are ranked in descending order according to weighted means.
Stronglydisagree
1
PercentagesStrongly
agree5
Mean STD NDon'tknow
Missing<2 3
>4
b. Students feel safe at this school 2.1% 2.0% 18.1% 20.4% 57.5% 4.29 0.97 958 16 6
k. I think this school has a bright future 3.9% 9.9% 11.3% 19.0% 55.9% 4.13 1.19 945 25 10
o. This school has high standards and expectation for students 4.3% 6.9% 12.4% 27.6% 48.7% 4.10 1.13 961 8 13
n. Extracurricular activities are not emphasized at the expense of academics 1.8% 7.8% 15.9% 28.5% 46.0% 4.09 1.04 893 63 25
g. I am satisfied with the school's curriculum 3.6% 6.2% 16.9% 30.1% 43.2% 4.03 1.08 959 8 13
i. Teachers are challenged to be effective 2.6% 10.8% 14.7% 26.4% 45.4% 4.01 1.13 853 110 18
e. Teachers are Involved in decision making at this school 4.2% 8.1% 17.9% 30.9% 38.8% 3.92 1.12 794 172 15
h. I am satisfied with the instruction offered 5.7% 8.1% 17.1% 27.0% 42.1% 3.92 1.19 959 11 11
r. This school has good administrative leadership 5.2% 16.0% 13.6% 23.7% 41.4% 3.80 1.27 932 43 6
m. This school reflects a community atmosphere 3.8% 7.5% 28.7% 27.2% 32.8% 3.78 1.10 912 48 21
t. Teachers and school leadership are accountable for studentachievement/performance 4.9% 11.4% 24.0% 25.6% 34.1% 3.72 1.19 937 41 3
a. This school is meeting students' needs that could not be addressed atother local schools 4.6% 11.4% 25.7% 24.6% 33.7% 3.71 1.18 878 98 5
s. Parents are involved and can influence instruction and school activities 6.0% 12.3% 21.7% 26.2% 33.8% 3.70 1.22 909 60 12
p. This school has small class sizes 6.8% 9.5% 26.0% 22.7% 34.9% 3.69 1.23 971 5 4
j. This school has been well received by the community 7.0% 16.0% 27.4% 25.9% 23.8% 3.44 1.21 831 125 26
q. This school has good physical facilities 7.9% 15.1% 29.3% 22.7% 25.0% 3.42 1.23 946 18 17
f. This school has sufficient financial resources 13.4% 16.7% 25.2% 28.1% 16.7% 3.18 1.27 731 232 19
I. Too many changes are occurring at the school 29.6% 27.1% 23.8% 12.2% 7.3% 2.41 1.23 915 50 16
d. Teachers are disenchanted with what can be accomplished 46.7% 21.2% 15.0% 12.8% 4.3% 2.07 1.23 817 139 25
c. Class sizes are too large to meet the individual student's needs 48.4% 20.3% 19.1% 7.4% 4.7% 2.00 1.18 957 13 11
1 2 9 BEST C43IFY AVAllYuk

Appendix G Teacher and Staff Results from the School Climate Survey
School Climate SurveyDescriptive statistics
Total Results Weighted According to Each School's Relative Proportion of AllTeachers and Staff in the 44 Sampled Schools (N=576)
What role do you have in the school?
What is your gender?
What is your race/ethnicity?
1
2
3
4
5
6
7
8
9
10
N
Teacher School staffother thanteacher or
administrator
Schooladministrator
Total Missing
421
73.1
121
21.0
34
5.9
576
100.0
0
N
Female Male Total Missing
41679.4%
10820.6%
524100.0%
52
Native AsianAmerican American
Black Hispanic White Other Total Missing
19
3.7%
2
0.4%
38
7.4%
12
2.3%
433
84.2%
10
1.9%
514
100.0%
62
Subscale
PSASchool Data
Mean STD
National NormData
Mean STD
Teacher-Student Relationships 52.9 7.2 47.7 5.9
Security and Maintenance 29.5 4.4 28.4 4.5
Administration (Principal, Assist. Principal, etc.) 24.8 5.1 22.8 4.2
Student Academic Orientation 15.6 3.3 14.1 2.9
Student Behavioral Values 9.7 3.0 9.0 2.3
Guidance 16.8 2.6 16.1 2.4
Student-Peer Relationships 15.9 3.1 14.8 2.4
Parent and Community-School Relationships 13.0 4.1 13.2 3.2
Instructional Management 28.4 4.6 27.4 4.1
Student Activities 16.4 3.3 16.2 2.6
ICIEST COPY( AVATILABILE
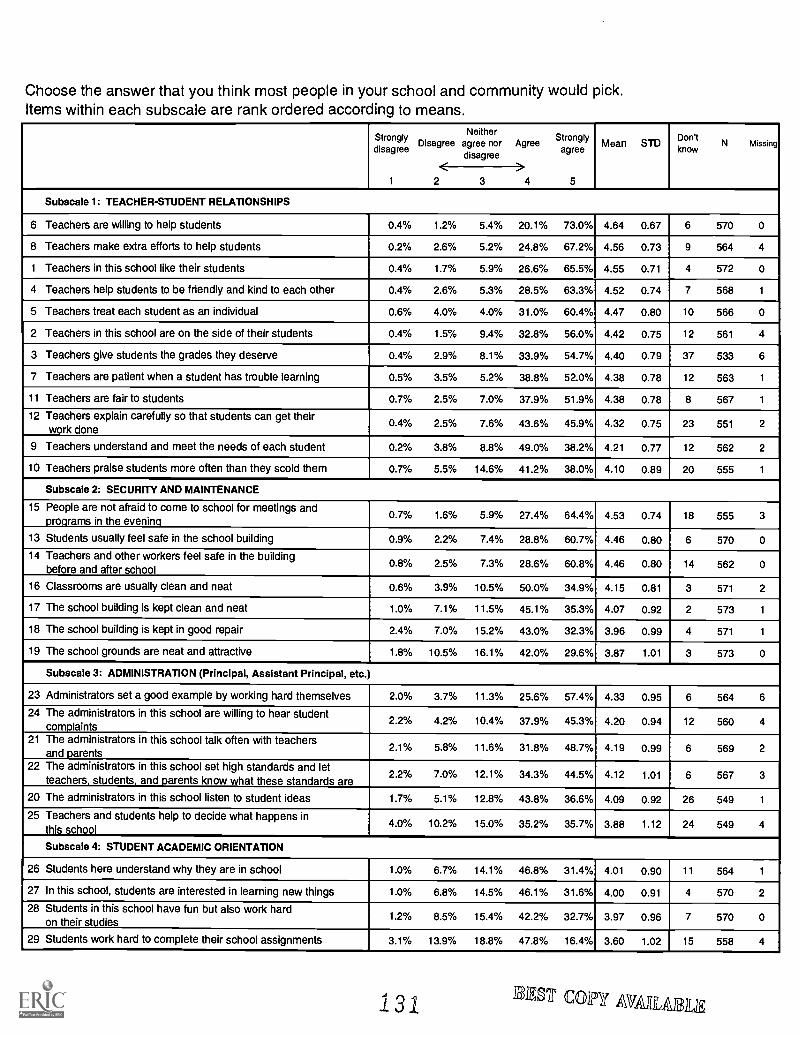
Choose the answer that you think most people in your school and community would pick.Items within each subscale are rank ordered according to means.
Stronglydisagree
1
NeitherDisagree agree nor
disagreeAgree
Stronglyagree
5
Mean STDDon'tnow
N Missing
<2 3
>4
Subscale 1: TEACHER-STUDENT RELATIONSHIPS
6 Teachers are willing to help students 0.4% 1.2% 5.4% 20.1% 73.0% 4.64 0.67 6 570 0
8 Teachers make extra efforts to help students 0.2% 2.6% 5.2% 24.8% 67.2% 4.56 0.73 9 564 4
1 Teachers in this school like their students 0.4% 1.7% 5.9% 26.6% 65.5% 4.55 0.71 4 572 0
4 Teachers help students to be friendly and kind to each other 0.4% 2.6% 5.3% 28.5% 63.3% 4.52 0.74 7 568 1
5 Teachers treat each student as an individual 0.6% 4.0% 4.0% 31.0% 60.4% 4.47 0.80 10 566 0
2 Teachers in this school are on the side of their students 0.4% 1.5% 9.4% 32.8% 56.0% 4.42 0.75 12 561 4
3 Teachers give students the grades they deserve 0.4% 2.9% 8.1% 33.9% 54.7% 4.40 0.79 37 533 6
7 Teachers are patient when a student has trouble learning 0.5% 3.5% 5.2% 38.8% 52.0% 4.38 0.78 12 563 1
11 Teachers are fair to students 0.7% 2.5% 7.0% 37.9% 51.9% 4.38 0.78 8 567 1
12 Teachers explain carefully so that students can get theirwork done
0.4% 2.5% 7.6% 43.6% 45.9% 4.32 0.75 23 551 2
9 Teachers understand and meet the needs of each student 0.2% 3.8% 8.8% 49.0% 38.2% 4.21 0.77 12 562 2
10 Teachers praise students more often than they scold them 0.7% 5.5% 14.6% 41.2% 38.0% 4.10 0.89 20 555 1
Subscale 2: SECURITY AND MAINTENANCE
15 People are not afraid to come to school for meetings andPrograms in the evening
0.7% 1.6% 5.9% 27.4% 64.4% 4.53 0.74 18 555 3
13 Students usually feel safe in the school building 0.9% 2.2% 7.4% 28.8% 60.7% 4.46 0.80 6 570 0
14 Teachers and other workers feel safe in the buildingbefore and after school
0.8% 2.5% 7.3% 28.6% 60.8% 4.46 0.80 14 562 0
16 Classrooms are usually clean and neat 0.6% 3.9% 10.5% 50.0% 34.9% 4.15 0.81 3 571 2
17 The school building is kept clean and neat 1.0% 7.1% 11.5% 45.1% 35.3% 4.07 0.92 2 573 1
18 The school building is kept in good repair 2.4% 7.0% 15.2% 43.0% 32.3% 3.96 0.99 4 571 1
19 The school grounds are neat and attractive 1.8% 10.5% 16.1% 42.0% 29.6% 3.87 1.01 3 573 0
Subscale 3: ADMINISTRATION (Principal, Assistant Principal, etc.
23 Administrators set a good example by working hard themselves 2.0% 3.7% 11.3% 25.6% 57.4% 4.33 0.95 6 564 6
24 The administrators in this school are willing to hear studentcomplaints
2.2% 4.2% 10.4% 37.9% 45.3% 4.20 0.94 12 560 4
21 The administrators in this school talk often with teachersand parents
2.1% 5.8% 11.6% 31.8% 48.7% 4.19 0.99 6 569 2
22 The administrators in this school set high standards and letteachers, students, and parents know what these standards are
2.2% 7.0% 12.1% 34.3% 44.5% 4.12 1.01 6 567 3
20 The administrators in this school listen to student ideas 1.7% 5.1% 12.8% 43.8% 36.6% 4.09 0.92 26 549 1
25 Teachers and students help to decide what happens inthis school
4.0% 10.2% 15.0% 35.2% 35.7% 3.88 1.12 24 549 4
Subscale 4: STUDENT ACADEMIC ORIENTATION
26 Students here understand why they are in school 1.0% 6.7% 14.1% 46.8% 31.4% 4.01 0.90 11 564 1
27 In this school, students are interested in learning new things 1.0% 6.8% 14.5% 46.1% 31.6% 4.00 0.91 4 570 2
28 Students in this school have fun but also work hardon their studies
1.2% 8.5% 15.4% 42.2% 32.7% 3.97 0.96 7 570 0
29 Students work hard to complete their school assignments 3.1% 13.9% 18.8% 47.8% 16.4% 3.60 1.02 15 558 4
131 33071' COIN AVAITUIEKLIE
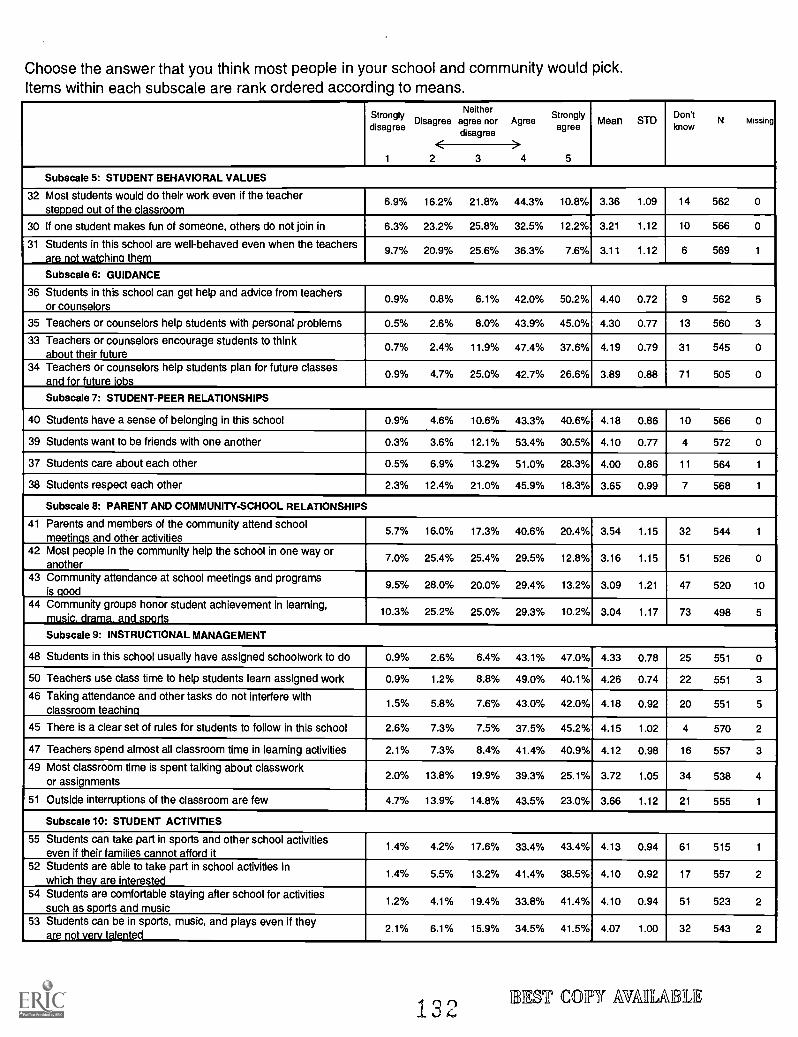
Choose the answer that you think most people in your school and community would pick.Items within each subscale are rank ordered according to means.
Strongly lv
disagree
1
Disagree agree nordisagree
<
AgreeStrongly
agree
5
Mean STDDon'tnow
N Missing
2 3
>4
Subscale 5: STUDENT BEHAVIORAL VALUES
32 Most students would do their work even if the teacherstepped out of the classroom
6.9% 16.2% 21.8% 44.3% 10.8% 3.36 1.09 14 562 0
30 If one student makes fun of someone, others do not join in 6.3% 23.2% 25.8% 32.5% 12.2% 3.21 1.12 10 566 0
31 Students in this school are well-behaved even when the teachersare not watching them
9.7% 20.9% 25.6% 36.3% 7.6% 3.11 1.12 6 569 1
Subscale 6: GUIDANCE
36 Students in this school can get help and advice from teachersor counselors
0.9% 0.8% 6.1% 42.0% 50.2% 4.40 0.72 9 562 5
35 Teachers or counselors help students with personal problems 0.5% 2.6% 8.0% 43.9% 45.0% 4.30 0.77 13 560 3
33 Teachers or counselors encourage students to thinkabout their future
0.7% 2.4% 11.9% 47.4% 37.6% 4.19 0.79 31 545 0
34 Teachers or counselors help students plan for future classesand for future lobs
0.9% 4.7% 25.0% 42.7% 26.6% 3.89 0.88 71 505 0
Subscale 7: STUDENT-PEER RELATIONSHIPS
40 Students have a sense of belonging in this school 0.9% 4.6% 10.6% 43.3% 40.6% 4.18 0.86 10 566 0
39 Students want to be friends with one another 0.3% 3.6% 12.1% 53.4% 30.5% 4.10 0.77 4 572 0
37 Students care about each other 0.5% 6.9% 13.2% 51.0% 28.3% 4.00 0.86 11 564 1
38 Students respect each other 2.3% 12.4% 21.0% 45.9% 18.3% 3.65 0.99 7 568 1
Subscale 8: PARENT AND COMMUNITY-SCHOOL RELATIONSHIPS
41 Parents and members of the community attend schoolmeetings and other activities
5.7% 16.0% 17.3% 40.6% 20.4% 3.54 1.15 32 544 1
42 Most people in the community help the school in one way oranother
7.0% 25.4% 25.4% 29.5% 12.8% 3.16 1.15 51 526 0
43 Community attendance at school meetings and programsis good
9.5% 28.0% 20.0% 29.4% 13.2% 3.09 1.21 47 520 10
44 Community groups honor student achievement in learning,music. drama. and sports
10.3% 25.2% 25.0% 29.3% 10.2% 3.04 1.17 73 498 5
Subscale 9: INSTRUCTIONAL MANAGEMENT
48 Students in this school usually have assigned schoolwork to do 0.9% 2.6% 6.4% 43.1% 47.0% 4.33 0.78 25 551 0
50 Teachers use class time to help students learn assigned work 0.9% 1.2% 8.8% 49.0% 40.1% 4.26 0.74 22 551 3
46 Taking attendance and other tasks do not interfere withclassroom teaching
1.5% 5.8% 7.6% 43.0% 42.0% 4.18 0.92 20 551 5
45 There is a clear set of rules for students to follow in this school 2.6% 7.3% 7.5% 37.5% 45.2% 4.15 1.02 4 570 2
47 Teachers spend almost all classroom time in leaming activities 2.1% 7.3% 8.4% 41.4% 40.9% 4.12 0.98 16 557 3
49 Most classroom time is spent talking about classworkor assignments
2.0% 13.8% 19.9% 39.3% 25.1% 3.72 1.05 34 538 4
51 Outside interruptions of the classroom are few 4.7% 13.9% 14.8% 43.5% 23.0% 3.66 1.12 21 555 1
Subscale 10: STUDENT ACTIVITIES
55 Students can take part in sports and other school activitieseven if their families cannot afford it
1.4% 4.2% 17.6% 33.4% 43.4% 4.13 0.94 61 515 1
52 Students are able to take part in school activities inwhich they are interested
1.4% 5.5% 13.2% 41.4% 38.5% 4.10 0.92 17 557 2
54 Students are comfortable staying after school for activitiessuch as sports and music
1.2% 4.1% 19.4% 33.8% 41.4% 4.10 0.94 51 523 2
53 Students can be in sports, music, and plays even if theyare not very talented
2.1% 6.1% 15.9% 34.5% 41.5% 4.07 1.00 32 543 2
132,DIEET COIP7 AVAIILABLE
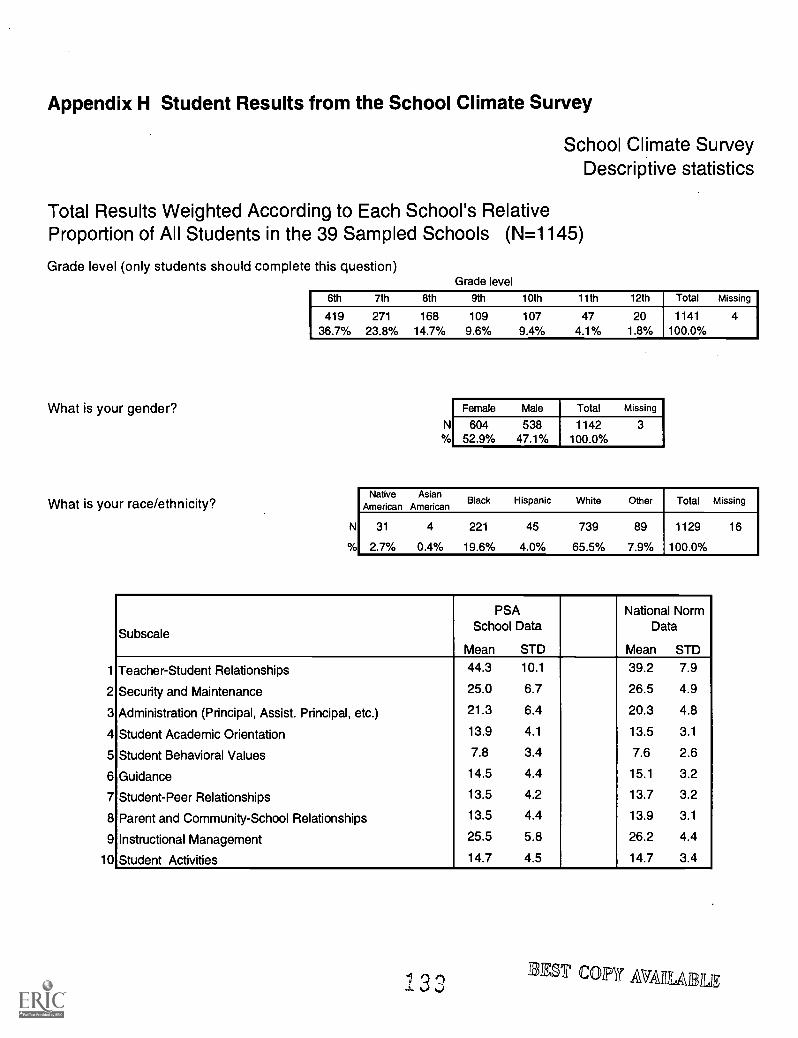
Appendix H Student Results from the School Climate Survey
School Climate SurveyDescriptive statistics
Total Results Weighted According to Each School's RelativeProportion of All Students in the 39 Sampled Schools (N=1145)
Grade level (only students should complete this question)
What is your gender?
What is your race/ethnicity?
1
2
3
4
5
6
7
8
9
10
Grade level
6th 7th 8th 9th 10th 11th 12th Total Missing
41936.7%
271
23.8%168
14.7%109
9.6%107
9.4%47
4.1%20
1.8%1141
100.0%4
N
N0/0
Female Male Total Missing
60452.9%
53847.1%
1142100.0%
3
Native AsianAmerican American
Black Hispanic White Other Total Missing
31
2.7%
4
0.4%
221
19.6%
45
4.0%
739
65.5%
89
7.9%
1129
100.0%
16
Subscale
PSASchool Data
Mean STD
National NormData
Mean STD
Teacher-Student Relationships 44.3 10.1 39.2 7.9
Security and Maintenance 25.0 6.7 26.5 4.9
Administration (Principal, Assist. Principal, etc.) 21.3 6.4 20.3 4.8
Student Academic Orientation 13.9 4.1 13.5 3.1
Student Behavioral Values 7.8 3.4 7.6 2.6
Guidance 14.5 4.4 15.1 3.2
Student-Peer Relationships 13.5 4.2 13.7 3.2
Parent and Community-School Relationships 13.5 4.4 13.9 3.1
Instructional Management 25.5 5.8 26.2 4.4
Student Activities 14.7 4.5 14.7 3.4
330'T COPY AMU IiiLIE
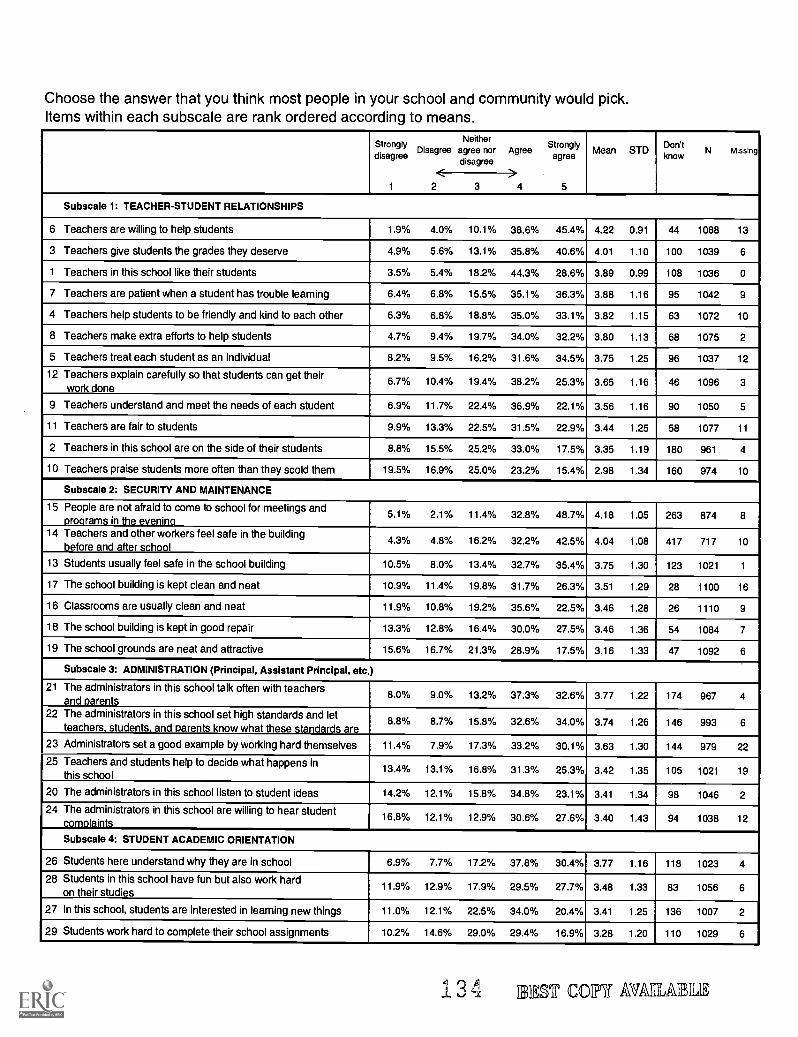
Choose the answer that you think most people in your school and community would pick.Items within each subscale are rank ordered according to means.
Stronglydisagree
1
NeitherDisagree agree nor
disagreeAgree
Stronglyagree
5
Mean STDDon'tknow
N Missing
2 3 4
Subscale 1: TEACHER-STUDENT RELATIONSHIPS
6 Teachers are willing to help students 1.9% 4.0% 10.1% 38.6% 45.4% 4.22 0.91 44 1088 13
3 Teachers give students the grades they deserve 4.9% 5.6% 13.1% 35.8% 40.6% 4.01 1.10 100 1039 6
1 Teachers in this school like their students 3.5% 5.4% 18.2% 44.3% 28.6% 3.89 0.99 108 1036 0
7 Teachers are patient when a student has trouble leaming 6.4% 6.8% 15.5% 35.1% 36.3% 3.88 1.16 95 1042 9
4 Teachers help students to be friendly and kind to each other 6.3% 6.8% 18.8% 35.0% 33.1% 3.82 1.15 63 1072 10
8 Teachers make extra efforts to help students 4.7% 9.4% 19.7% 34.0% 32.2% 3.80 1.13 68 1075 2
5 Teachers treat each student as an individual 8.2% 9.5% 16.2% 31.6% 34.5% 3.75 1.25 96 1037 12
12 Teachers explain carefully so that students can get theirwork done
6.7% 10.4% 19.4% 38.2% 25.3% 3.65 1.16 46 1096 3
9 Teachers understand and meet the needs of each student 6.9% 11.7% 22.4% 36.9% 22.1% 3.56 1.16 90 1050 5
11 Teachers are fair to students 9.9% 13.3% 22.5% 31.5% 22.9% 3.44 1.25 58 1077 11
2 Teachers in this school are on the side of their students 8.8% 15.5% 25.2% 33.0% 17.5% 3.35 1.19 180 961 4
10 Teachers praise students more often than they scold them 19.5% 16.9% 25.0% 23.2% 15.4% 2.98 1.34 160 974 10
Subscale 2: SECURITY AND MAINTENANCE
15 People are not afraid to come to school for meetings andprograms in the evening
5.1% 2.1% 11.4% 32.8% 48.7% 4.18 1.05 263 874 8
14 Teachers and other workers feel safe in the buildingbefore and after school
4.3% 4.8% 16.2% 32.2% 42.5% 4.04 1.08 417 717 10
13 Students usually feel safe in the school building 10.5% 8.0% 13.4% 32.7% 35.4% 3.75 1.30 123 1021 1
17 The school building is kept clean and neat 10.9% 11.4% 19.8% 31.7% 26.3% 3.51 1.29 28 1100 16
16 Classrooms are usually clean and neat 11.9% 10.8% 19.2% 35.6% 22.5% 3.46 1.28 26 1110 9
18 The school building is kept in good repair 13.3% 12.8% 16.4% 30.0% 27.5% 3.46 1.36 54 1084 7
19 The school grounds are neat and attractive 15.6% 16.7% 21.3% 28.9% 17.5% 3.16 1.33 47 1092 6
Subscale 3: ADMINISTRATION (Principal, Assistant Principal, etc.)
21 The administrators in this school talk often with teachersand parents
8.0% 9.0% 13.2% 37.3% 32.6% 3.77 1.22 174 967 4
22 The administrators in this school set high standards and letteachers, students, and parents know what these standards are
8.8% 8.7% 15.8% 32.6% 34.0% 3.74 1.26 146 993 6
23 Administrators set a good example by working hard themselves 11.4% 7.9% 17.3% 33.2% 30.1% 3.63 1.30 144 979 22
25 Teachers and students help to decide what happens inthis school
13.4% 13.1% 16.8% 31.3% 25.3% 3.42 1.35 105 1021 19
20 The administrators in this school listen to student ideas 14.2% 12.1% 15.8% 34.8% 23.1% 3.41 1.34 98 1046 2
24 The administrators in this school are willing to hear studentcomplaints
16.8% 12.1% 12.9% 30.6% 27.6% 3.40 1.43 94 1038 12
Subscale 4: STUDENT ACADEMIC ORIENTATION
26 Students here understand why they are in school 6.9% 7.7% 17.2% 37.8% 30.4% 3.77 1.16 118 1023 4
28 Students in this school have fun but also work hardon their studies
11.9% 12.9% 17.9% 29.5% 27.7% 3.48 1.33 83 1056 6
27 In this school, students are interested in learning new things 11.0% 12.1% 22.5% 34.0% 20.4% 3.41 1.25 136 1007 2
29 Students work hard to complete their school assignments 10.2% 14.6% 29.0% 29.4% 16.9% 3.28 1.20 110 1029 6
1 Q..; `-x Egli Can AVARLA
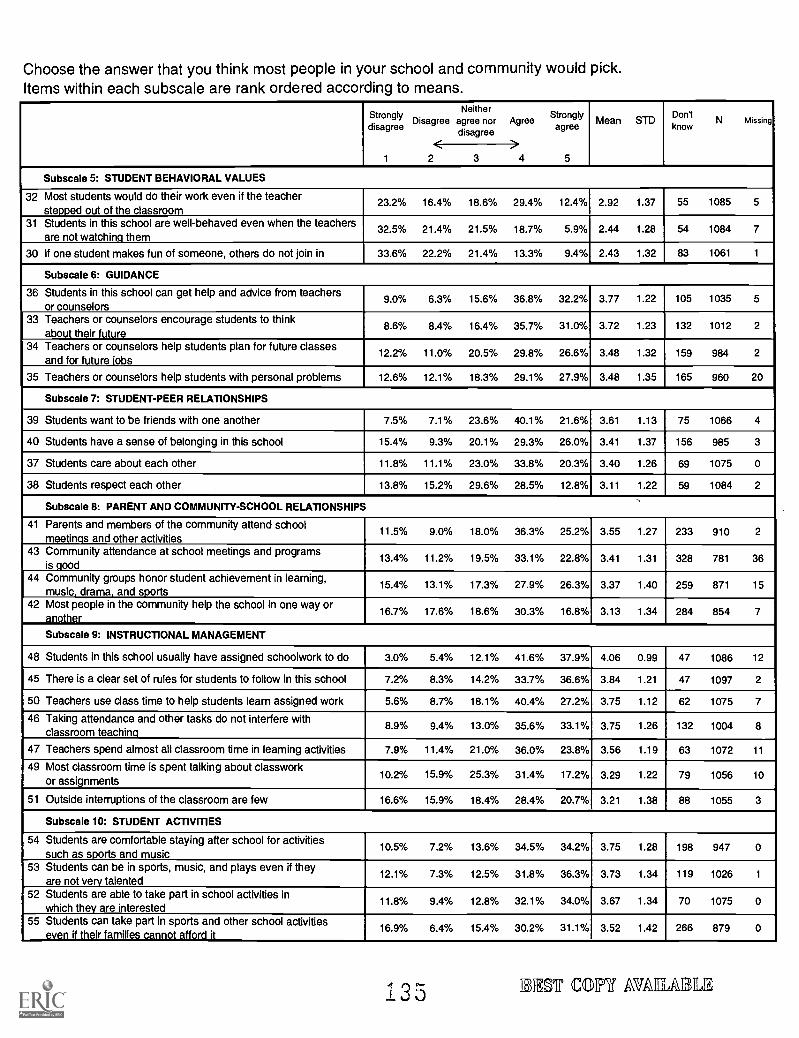
Choose the answer that you think most people in your school and community would pick.Items within each subscale are rank ordered according to means.
Strongly lv
disagree
1
Disagree agree nordisagree
AgreeStrongly
agree
5
Mean STDDon'tknow
N Missing
2 3 4
Subscale 5: STUDENT BEHAVIORAL VALUES
32 Most students would do their work even if the teacherstepped out of the classroom
23.2% 16.4% 18.6% 29.4% 12.4% 2.92 1.37 55 1085 5
31 Students in this school are well-behaved even when the teachersare not watching them
32.5% 21.4% 21.5% 18.7% 5.9% 2.44 1.28 54 1084 7
30 If one student makes fun of someone, others do not join in 33.6% 22.2% 21.4% 13.3% 9.4% 2.43 1.32 83 1061 1
Subscale 6: GUIDANCE
36 Students in this school can get help and advice from teachersor counselors
9.0% 6.3% 15.6% 36.8% 32.2% 3.77 1.22 105 1035 5
33 Teachers or counselors encourage students to thinkabout their future
8.6% 8.4% 16.4% 35.7% 31.0% 3.72 1.23 132 1012 2
34 Teachers or counselors help students plan for future classesand for future lobs
12.2% 11.0% 20.5% 29.8% 26.6% 3.48 1.32 159 984 2
35 Teachers or counselors help students with personal problems 12.6% 12.1% 18.3% 29.1% 27.9% 3.48 1.35 165 960 20
Subscale 7: STUDENT-PEER RELATIONSHIPS
39 Students want to be friends with one another 7.5% 7.1% 23.6% 40.1% 21.6% 3.61 1.13 75 1066 4
40 Students have a sense of belonging in this school 15.4% 9.3% 20.1% 29.3% 26.0% 3.41 1.37 156 985 3
37 Students care about each other 11.8% 11.1% 23.0% 33.8% 20.3% 3.40 1.26 69 1075 0
38 Students respect each other 13.8% 15.2% 29.6% 28.5% 12.8% 3.11 1.22 59 1084 2
Subscale 8: PARENT AND COMMUNITY-SCHOOL RELATIONSHIPS
41 Parents and members of the community attend schoolmeetings and other activities
11.5% 9.0% 18.0% 36.3% 25.2% 3.55 1.27 233 910 2
43 Community attendance at school meetings and programsis good
13.4% 11.2% 19.5% 33.1% 22.8% 3.41 1.31 328 781 36
44 Community groups honor student achievement in learning,music, drama, and sports
15.4% 13.1% 17.3% 27.9% 26.3% 3.37 1.40 259 871 15
42 Most people in the community help the school in one way oranother
16.7% 17.6% 18.6% 30.3% 16.8% 3.13 1.34 284 854 7
Subscale 9: INSTRUCTIONAL MANAGEMENT
48 Students in this school usually have assigned schoolwork to do 3.0% 5.4% 12.1% 41.6% 37.9% 4.06 0.99 47 1086 12
45 There is a clear set of rules for students to follow in this school 7.2% 8.3% 14.2% 33.7% 36.6% 3.84 1.21 47 1097 2
50 Teachers use class time to help students learn assigned work 5.6% 8.7% 18.1% 40.4% 27.2% 3.75 1.12 62 1075 7
46 Taking attendance and other tasks do not interfere withclassroom teaching
8.9% 9.4% 13.0% 35.6% 33.1% 3.75 1.26 132 1004 8
47 Teachers spend almost all classroom time in learning activities 7.9% 11.4% 21.0% 36.0% 23.8% 3.56 1.19 63 1072 11
49 Most classroom time is spent talking about classworkor assignments
10.2% 15.9% 25.3% 31.4% 17.2% 3.29 1.22 79 1056 10
51 Outside interruptions of the classroom are few 16.6% 15.9% 18.4% 28.4% 20.7% 3.21 1.38 88 1055 3
Subscale 10: STUDENT ACTIVITIES
54 Students are comfortable staying after school for activitiessuch as sports and music
10.5% 7.2% 13.6% 34.5% 34.2% 3.75 1.28 198 947 0
53 Students can be in sports, music, and plays even if theyare not very talented
12.1% 7.3% 12.5% 31.8% 36.3% 3.73 1.34 119 1026 1
52 Students are able to take part in school activities inwhich they are interested
11.8% 9.4% 12.8% 32.1% 34.0% 3.67 1.34 70 1075 0
55 Students can take part in sports and other school activitieseven if their families cannot affersi it
16.9% 6.4% 15.4% 30.2% 31.1% 3.52 1.42 266 879 0
135 Mgr C6117 AVAIEA 111,
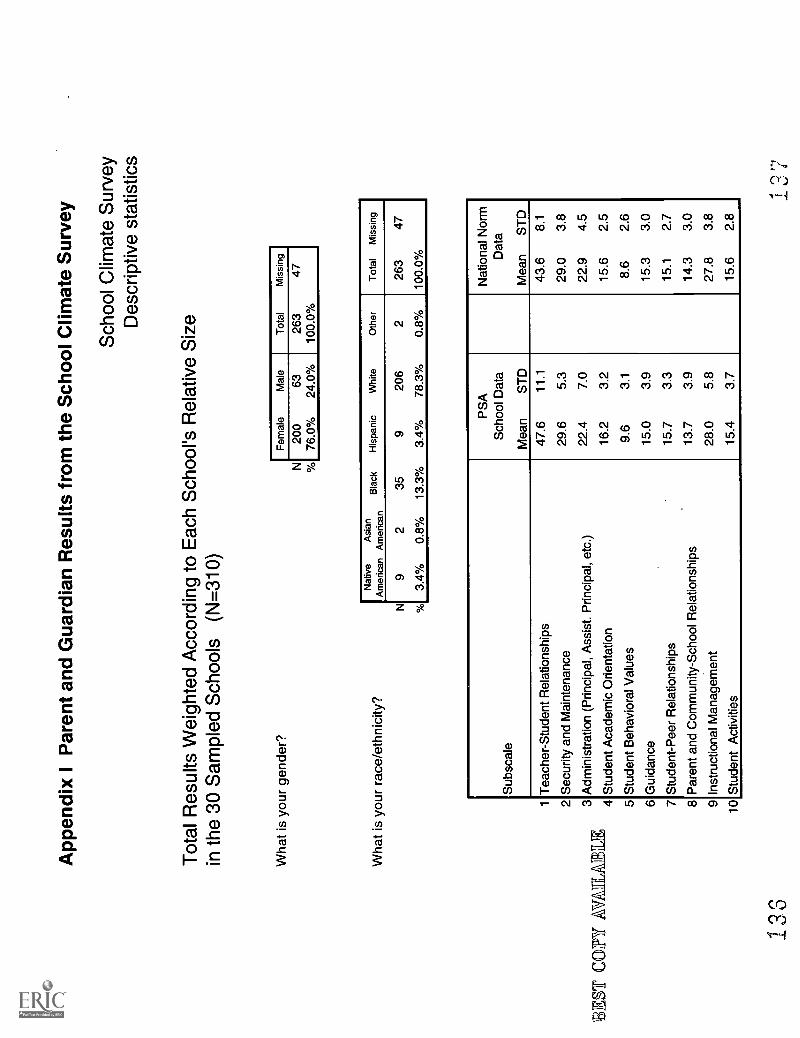
App
endi
x I P
aren
t and
Gua
rdia
n R
esul
ts fr
om th
e S
choo
l Clim
ate
Sur
vey
Sch
ool C
limat
e S
urve
yD
escr
iptiv
e st
atis
tics
Tot
al R
esul
ts W
eigh
ted
Acc
ordi
ng to
Eac
h S
choo
l's R
elat
ive
Siz
ein
the
30 S
ampl
ed S
choo
ls (
N=
310)
Wha
t is
your
gen
der?
Wha
t is
your
rac
e/et
hnic
ity?
BE
ST C
OPY
AV
EIT
A11
:
1 2 3 4 5 6 7 8 9
10
N
N (Yo
Fem
ale
Mal
eT
otal
Mis
sing
200
76.0
%63
24.0
%26
310
0.0%
47
Nat
ive
Asi
anA
mer
ican
Am
eric
anB
lack
His
pani
cW
hite
Oth
erT
otal
Mis
sing
92
3.4%
0.8%
35
13.3
%
9
3.4%
206
78.3
%
2
0.8%
263
100.
0%
47
Sub
scal
e
PS
AS
choo
l Dat
a
Mea
nS
TD
Nat
iona
l Nor
mD
ata
Mea
nS
TD
Tea
cher
-Stu
dent
Rel
atio
nshi
ps47
.611
.143
.68.
1
Sec
urity
and
Mai
nten
ance
29.6
5.3
29.0
3.8
Adm
inis
trat
ion
(Prin
cipa
l, A
ssis
t. P
rinci
pal,
etc.
)22
.47.
022
.94.
5
Stu
dent
Aca
dem
ic O
rient
atio
n16
.23.
215
.62.
5
Stu
dent
Beh
avio
ral V
alue
s9.
63.
18.
62.
6
Gui
danc
e15
.03.
915
.33.
0
Stu
dent
-Pee
r R
elat
ions
hips
15.7
3.3
15.1
2.7
Par
ent a
nd C
omm
unity
-Sch
ool R
elat
ions
hips
13.7
3.9
14.3
3.0
Inst
ruct
iona
l Man
agem
ent
28.0
5.8
27.8
3.8
Stu
dent
Act
iviti
es15
.43.
715
.62.
8
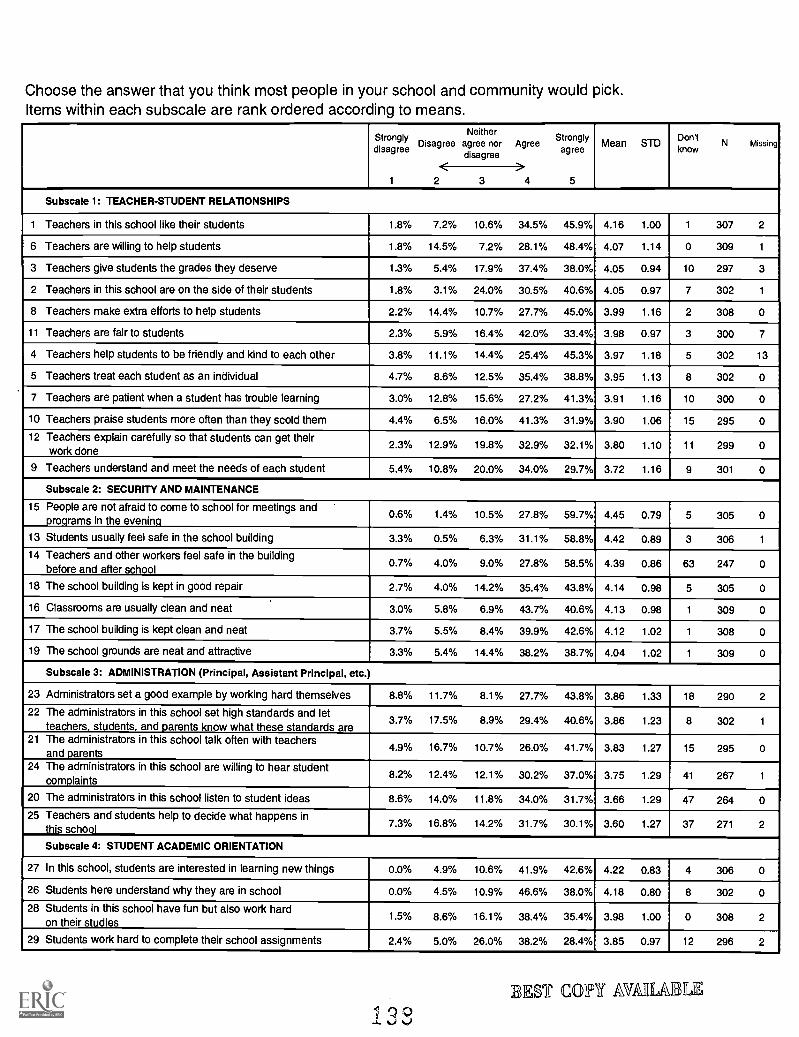
Choose the answer that you think most people in your school and community would pick.Items within each subscale are rank ordered according to means.
Stronglydisagree
1
NeitherDisagree agree nor
disagreeAgree
Stronglyagree
5
Mean STDDon'tnow
N Missing
2 3 4
Subscale 1: TEACHER-STUDENT RELATIONSHIPS
1 Teachers in this school like their students 1.8% 7.2% 10.6% 34.5% 45.9% 4.16 1.00 1 307 2
6 Teachers are willing to help students 1.8% 14.5% 7.2% 28.1% 48.4% 4.07 1.14 0 309 1
3 Teachers give students the grades they deserve 1.3% 5.4% 17.9% 37.4% 38.0% 4.05 0.94 10 297 3
2 Teachers in this school are on the side of their students 1.8% 3.1% 24.0% 30.5% 40.6% 4.05 0.97 7 302 1
8 Teachers make extra efforts to help students 2.2% 14.4% 10.7% 27.7% 45.0% 3.99 1.16 2 308 0
11 Teachers are fair to students 2.3% 5.9% 16.4% 42.0% 33.4% 3.98 0.97 3 300 7
4 Teachers help students to be friendly and kind to each other 3.8% 11.1% 14.4% 25.4% 45.3% 3.97 1.18 5 302 13
5 Teachers treat each student as an individual 4.7% 8.6% 12.5% 35.4% 38.8% 3.95 1.13 8 302 0
7 Teachers are patient when a student has trouble learning 3.0% 12.8% 15.6% 27.2% 41.3% 3.91 1.16 10 300 0
10 Teachers praise students more often than they scold them 4.4% 6.5% 16.0% 41.3% 31.9% 3.90 1.06 15 295 0
12 Teachers explain carefully so that students can get theirwork done
2.3% 12.9% 19.8% 32.9% 32.1% 3.80 1.10 11 299 0
9 Teachers understand and meet the needs of each student 5.4% 10.8% 20.0% 34.0% 29.7% 3.72 1.16 9 301 0
Subscale 2: SECURITY AND MAINTENANCE
15 People are not afraid to come to school for meetings andprograms in the evening
0.6% 1.4% 10.5% 27.8% 59.7% 4.45 0.79 5 305 0
13 Students usually feel safe in the school building 3.3% 0.5% 6.3% 31.1% 58.8% 4.42 0.89 3 306 1
14 Teachers and other workers feel safe in the buildingbefore and after school
0.7% 4.0% 9.0% 27.8% 58.5% 4.39 0.86 63 247 0
18 The school building is kept in good repair 2.7% 4.0% 14.2% 35.4% 43.8% 4.14 0.98 5 305 0
16 Classrooms are usually clean and neat 3.0% 5.8% 6.9% 43.7% 40.6% 4.13 0.98 1 309 0
17 The school building is kept clean and neat 3.7% 5.5% 8.4% 39.9% 42.6% 4.12 1.02 1 308 0
19 The school grounds are neat and attractive 3.3% 5.4% 14.4% 38.2% 38.7% 4.04 1.02 1 309 0
Subscale 3: ADMINISTRATION (Principal, Assistant Principal, etc.)
23 Administrators set a good example by working hard themselves 8.8% 11.7% 8.1% 27.7% 43.8% 3.86 1.33 18 290 2
22 The administrators in this school set high standards and letteachers, students, and parents know what these standards are
3.7% 17.5% 8.9% 29.4% 40.6% 3.86 1.23 8 302 1
21 The administrators in this school talk often with teachersand parents
4.9% 16.7% 10.7% 26.0% 41.7% 3.83 1.27 15 295 0
24 The administrators in this school are willing to hear studentcomplaints
8.2% 12.4% 12.1% 30.2% 37.0% 3.75 1.29 41 267 1
20 The administrators in this school listen to student ideas 8.6% 14.0% 11.8% 34.0% 31.7% 3.66 1.29 47 264 0
25 Teachers and students help to decide what happens inthis school
7.3% 16.8% 14.2% 31.7% 30.1% 3.60 1.27 37 271 2
Subscale 4: STUDENT ACADEMIC ORIENTATION
27 In this school, students are interested in learning new things 0.0% 4.9% 10.6% 41.9% 42.6% 4.22 0.83 4 306 0
26 Students here understand why they are in school 0.0% 4.5% 10.9% 46.6% 38.0% 4.18 0.80 8 302 0
28 Students in this school have fun but also work hardon their studies
1.5% 8.6% 16.1% 38.4% 35.4% 3.98 1.00 0 308 2
29 Students work hard to complete their school assignments 2.4% 5.0% 26.0% 38.2% 28.4% 3.85 0.97 12 296 2
fe
QEST COM( AVAIL II
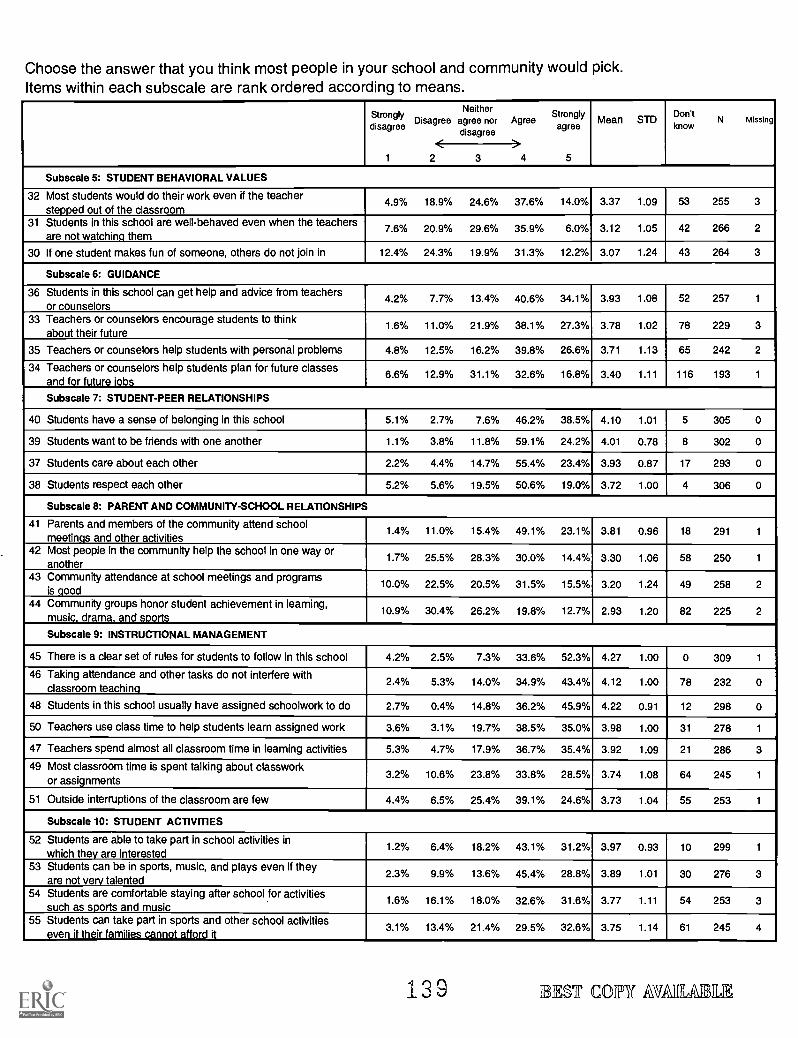
Choose the answer that you think most people in your school and community would pick.Items within each subscale are rank ordered according to means.
Stronglydisagree
1
NeitherDisagree agree nor
disagreeAgree
Stronglyagree
5
Mean STDDon'tknow
N Missing
<2 3
>4
Subscale 5: STUDENT BEHAVIORAL VALUES
32 Most students would do their work even if the teacherstepped out of the classroom
4.9% 18.9% 24.6% 37.6% 14.0% 3.37 1.09 53 255 3
31 Students in this school are well-behaved even when the teachersare not watching them
7.6% 20.9% 29.6% 35.9% 6.0% 3.12 1.05 42 266 2
30 If one student makes fun of someone, others do not join in 12.4% 24.3% 19.9% 31.3% 12.2% 3.07 1.24 43 264 3
Subscale 6: GUIDANCE
36 Students in this school can get help and advice from teachersor counselors
4.2% 7.7% 13.4% 40.6% 34.1% 3.93 1.08 52 257 1
33 Teachers or counselors encourage students to thinkabout their future
1.6% 11.0% 21.9% 38.1% 27.3% 3.78 1.02 78 229 3
35 Teachers or counselors help students with personal problems 4.8% 12.5% 16.2% 39.8% 26.6% 3.71 1.13 65 242 2
34 Teachers or counselors help students plan for future classesand for future iobs
6.6% 12.9% 31.1% 32.6% 16.8% 3.40 1.11 116 193 1
Subscale 7: STUDENT-PEER RELATIONSHIPS
40 Students have a sense of belonging in this school 5.1% 2.7% 7.6% 46.2% 38.5% 4.10 1.01 5 305 0
39 Students want to be friends with one another 1.1% 3.8% 11.8% 59.1% 24.2% 4.01 0.78 8 302 0
37 Students care about each other 2.2% 4.4% 14.7% 55.4% 23.4% 3.93 0.87 17 293 0
38 Students respect each other 5.2% 5.6% 19.5% 50.6% 19.0% 3.72 1.00 4 306 0
Subscale 8: PARENT AND COMMUNITY-SCHOOL RELATIONSHIPS
41 Parents and members of the community attend schoolmeetings and other activities
1.4% 11.0% 15.4% 49.1% 23.1% 3.81 0.96 18 291 1
42 Most people in the community help the school in one way oranother
1.7% 25.5% 28.3% 30.0% 14.4% 3.30 1.06 58 250 1
43 Community attendance at school meetings and programsis good
10.0% 22.5% 20.5% 31.5% 15.5% 3.20 1.24 49 258 2
44 Community groups honor student achievement in learning,music drama and worts
10.9% 30.4% 26.2% 19.8% 12.7% 2.93 1.20 82 225 2
Subscale 9: INSTRUCTIONAL MANAGEMENT
45 There is a clear set of rules for students to follow in this school 4.2% 2.5% 7.3% 33.6% 52.3% 4.27 1.00 0 309 1
46 Taking attendance and other tasks do not interfere withclassroom teaching
2.4% 5.3% 14.0% 34.9% 43.4% 4.12 1.00 78 232 0
48 Students in this school usually have assigned schoolwork to do 2.7% 0.4% 14.8% 36.2% 45.9% 4.22 0.91 12 298 0
50 Teachers use class time to help students learn assigned work 3.6% 3.1% 19.7% 38.5% 35.0% 3.98 1.00 31 278 1
47 Teachers spend almost all classroom time in leaming activities 5.3% 4.7% 17.9% 36.7% 35.4% 3.92 1.09 21 286 3
49 Most classroom time is spent talking about classworkor assignments
3.2% 10.6% 23.8% 33.8% 28.5% 3.74 1.08 64 245 1
51 Outside interruptions of the classroom are few 4.4% 6.5% 25.4% 39.1% 24.6% 3.73 1.04 55 253 1
Subscale 10: STUDENT ACTIVITIES
52 Students are able to take part in school activities inwhich they are interested
1.2% 6.4% 18.2% 43.1% 31.2% 3.97 0.93 10 299 1
53 Students can be in sports, music, and plays even if theyare not very talented
2.3% 9.9% 13.6% 45.4% 28.8% 3.89 1.01 30 276 3
54 Students are comfortable staying after school for activitiessuch as sports and music
1.6% 16.1% 18.0% 32.6% 31.6% 3.77 1.11 54 253 3
55 Students can take part in sports and other school activitieseven if their families cannot afford it
3.1% 13.4% 21.4% 29.5% 32.6% 3.75 1.14 61 245 4
139 BEE,'Ir COTT AVAIIIEMIE
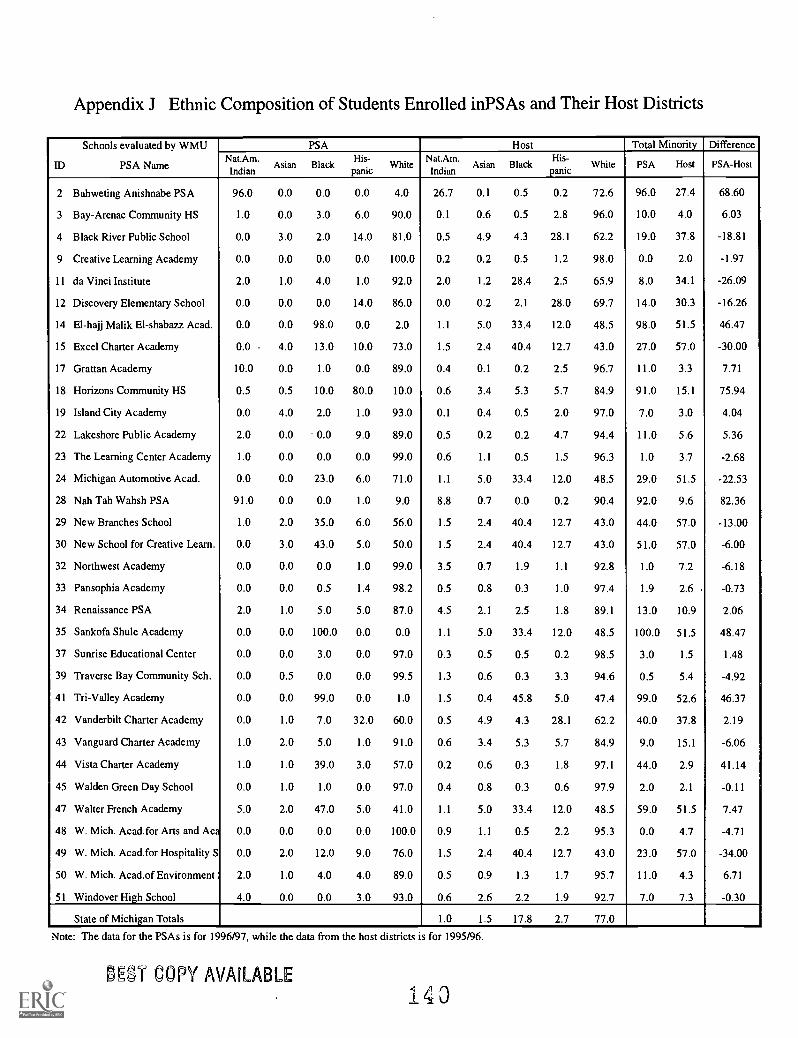
Appendix J Ethnic Composition of Students Enrolled inPSAs and Their Host Districts
Schools evaluated by WMU
ID PSA Name
PSA Host Total Minority DifferenceAm..Nat.Am.
IndianAsian Black
His-panic
WhiteNat.Am.
IndianAsian Black
His-panic
White PSA Host PSA-Host
2 Bahweting Anishnabe PSA 96.0 0.0 0.0 0.0 4.0 26.7 0.1 0.5 0.2 72.6 96.0 27.4 68.60
3 Bay-Arenac Community HS 1.0 0.0 3.0 6.0 90.0 0.1 0.6 0.5 2.8 96.0 10.0 4.0 6.03
4 Black River Public School 0.0 3.0 2.0 14.0 81.0 0.5 4.9 4.3 28.1 62.2 19.0 37.8 -18.81
9 Creative Learning Academy 0.0 0.0 0.0 0.0 100.0 0.2 0.2 0.5 1.2 98.0 0.0 2.0 -1.97
11 da Vinci Institute 2.0 1.0 4.0 1.0 92.0 2.0 1.2 28.4 2.5 65.9 8.0 34.1 -26.09
12 Discovery Elementary School 0.0 0.0 0.0 14.0 86.0 0.0 0.2 2.1 28.0 69.7 14.0 30.3 -16.26
14 El-hajj Malik El-shabazz Acad. 0.0 0.0 98.0 0.0 2.0 1.1 5.0 33.4 12.0 48.5 98.0 51.5 46.47
15 Excel Charter Academy 0.0 4.0 13.0 10.0 73.0 1.5 2.4 40.4 12.7 43.0 27.0 57.0 -30.00
17 Grattan Academy 10.0 0.0 1.0 0.0 89.0 0.4 0.1 0.2 2.5 96.7 11.0 3.3 7.71
18 Horizons Community HS 0.5 0.5 10.0 80.0 10.0 0.6 3.4 5.3 5.7 84.9 91.0 15.1 75.94
19 Island City Academy 0.0 4.0 2.0 1.0 93.0 0.1 0.4 0.5 2.0 97.0 7.0 3.0 4.04
22 Lakeshore Public Academy 2.0 0.0 0.0 9.0 89.0 0.5 0.2 0.2 4.7 94.4 11.0 5.6 5.36
23 The Learning Center Academy 1.0 0.0 0.0 0.0 99.0 0.6 1.1 0.5 1.5 96.3 1.0 3.7 -2.68
24 Michigan Automotive Acad. 0.0 0.0 23.0 6.0 71.0 1.1 5.0 33.4 12.0 48.5 29.0 51.5 -22.53
28 Nah Tah Wahsh PSA 91.0 0.0 0.0 1.0 9.0 8.8 0.7 0.0 0.2 90.4 92.0 9.6 82.36
29 New Branches School 1.0 2.0 35.0 6.0 56.0 1.5 2.4 40.4 12.7 43.0 44.0 57.0 -13.00
30 New School for Creative Learn. 0.0 3.0 43.0 5.0 50.0 1.5 2.4 40.4 12.7 43.0 51.0 57.0 -6.00
32 Northwest Academy 0.0 0.0 0.0 1.0 99.0 3.5 0.7 1.9 1.1 92.8 1.0 7.2 -6.18
33 Pansophia Academy 0.0 0.0 0.5 1.4 98.2 0.5 0.8 0.3 1.0 97.4 1.9 2.6 -0.73
34 Renaissance PSA 2.0 1.0 5.0 5.0 87.0 4.5 2.1 2.5 1.8 89.1 13.0 10.9 2.06
35 Sankofa Shule Academy 0.0 0.0 100.0 0.0 0.0 1.1 5.0 33.4 12.0 48.5 100.0 51.5 48.47
37 Sunrise Educational Center 0.0 0.0 3.0 0.0 97.0 0.3 0.5 0.5 0.2 98.5 3.0 1.5 1.48
39 Traverse Bay Community Sch. 0.0 0.5 0.0 0.0 99.5 1.3 0.6 0.3 3.3 94.6 0.5 5.4 -4.92
41 Tri-Valley Academy 0.0 0.0 99.0 0.0 1.0 1.5 0.4 45.8 5.0 47.4 99.0 52.6 46.37
42 Vanderbilt Charter Academy 0.0 1.0 7.0 32.0 60.0 0.5 4.9 4.3 28.1 62.2 40.0 37.8 2.19
43 Vanguard Charter Academy 1.0 2.0 5.0 1.0 91.0 0.6 3.4 5.3 5.7 84.9 9.0 15.1 -6.06
44 Vista Charter Academy 1.0 1.0 39.0 3.0 57.0 0.2 0.6 0.3 1.8 97.1 44.0 2.9 41.14
45 Walden Green Day School 0.0 1.0 1.0 0.0 97.0 0.4 0.8 0.3 0.6 97.9 2.0 2.1 -0.11
47 Walter French Academy 5.0 2.0 47.0 5.0 41.0 1.1 5.0 33.4 12.0 48.5 59.0 51.5 7.47
48 W. Mich. Acad.for Arts and Aca 0.0 0.0 0.0 0.0 100.0 0.9 1.1 0.5 2.2 95.3 0.0 4.7 -4.71
49 W. Mich. Acad.for Hospitality S 0.0 2.0 12.0 9.0 76.0 1.5 2.4 40.4 12.7 43.0 23.0 57.0 -34.00
50 W. Mich. Acad.of Environment , 2.0 1.0 4.0 4.0 89.0 0.5 0.9 1.3 1.7 95.7 11.0 4.3 6.71
51 Windover High School 4.0 0.0 0.0 3.0 93.0 0.6 2.6 2.2 1.9 92.7 7.0 7.3 -0.30
State of Michigan Totals 1.0 1.5 17.8 2.7 77.0
Note: The data for the PSAs is for 1996/97, while the data from the host districts is for 1995/96.
UST COPY AVAILABLE143
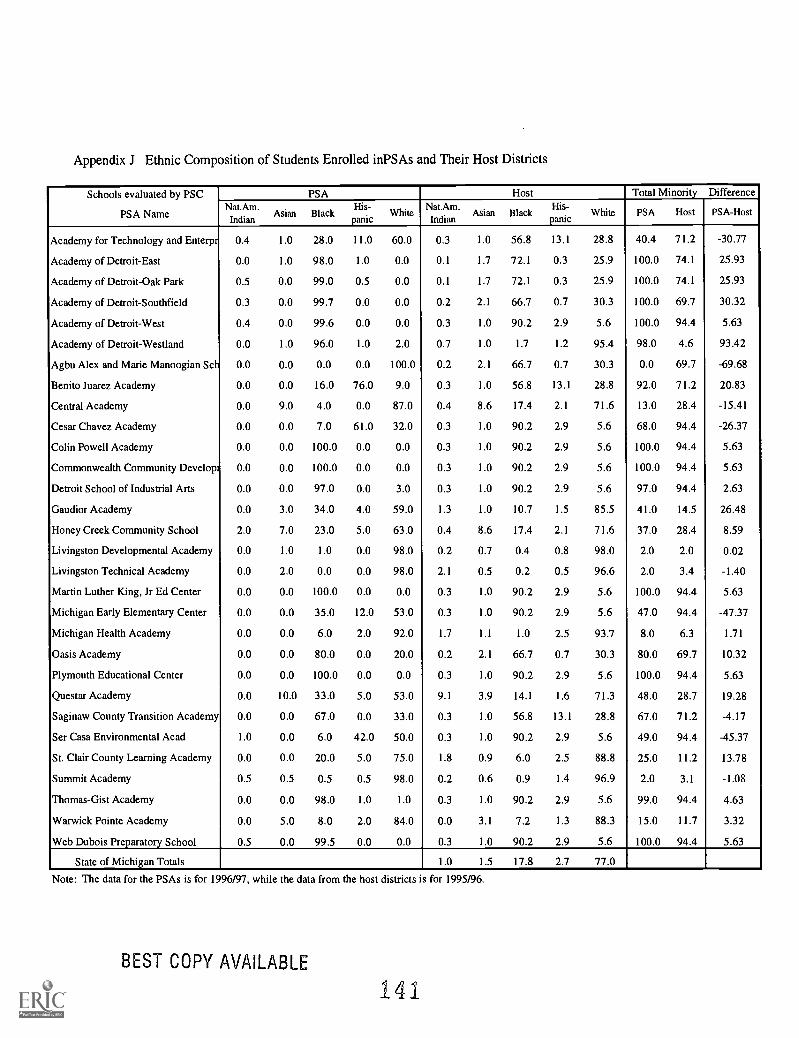
Appendix J Ethnic Composition of Students Enrolled inPSAs and Their Host Districts
Schools evaluated by PSC
PSA Name
PSA Host Total Minority DifferenceNat.Am.
IndianAsian Black
His -
panicWhite
Nat.Am.Indian
Asian BlackHis-
panicWhite PSA Host PSA-Host
Academy for Technology and Enterpr 0.4 1.0 28.0 11.0 60.0 0.3 1.0 56.8 13.1 28.8 40.4 71.2 -30.77
Academy of Detroit-East 0.0 1.0 98.0 1.0 0.0 0.1 1.7 72.1 0.3 25.9 100.0 74.1 25.93
Academy of Detroit -Oak Park 0.5 0.0 99.0 0.5 0.0 0.1 1.7 72.1 0.3 25.9 100.0 74.1 25.93
Academy of Detroit-Southfield 0.3 0.0 99.7 0.0 0.0 0.2 2.1 66.7 0.7 30.3 100.0 69.7 30.32
Academy of Detroit-West 0.4 0.0 99.6 0.0 0.0 0.3 1.0 90.2 2.9 5.6 100.0 94.4 5.63
Academy of Detroit-Westland 0.0 1.0 96.0 1.0 2.0 0.7 1.0 1.7 1.2 95.4 98.0 4.6 93.42
Agbu Alex and Marie Manoogian Scl 0.0 0.0 0.0 0.0 100.0 0.2 2.1 66.7 0.7 30.3 0.0 69.7 -69.68
Benito Juarez Academy 0.0 0.0 16.0 76.0 9.0 0.3 1.0 56.8 13.1 28.8 92.0 71.2 20.83
Central Academy 0.0 9.0 4.0 0.0 87.0 0.4 8.6 17.4 2.1 71.6 13.0 28.4 -15.41
Cesar Chavez Academy 0.0 0.0 7.0 61.0 32.0 0.3 1.0 90.2 2.9 5.6 68.0 94.4 -26.37
Colin Powell Academy 0.0 0.0 100.0 0.0 0.0 0.3 1.0 90.2 2.9 5.6 100.0 94.4 5.63
Commonwealth Community Develop 0.0 0.0 100.0 0.0 0.0 0.3 1.0 90.2 2.9 5.6 100.0 94.4 5.63
Detroit School of Industrial Arts 0.0 0.0 97.0 0.0 3.0 0.3 1.0 90.2 2.9 5.6 97.0 94.4 2.63
Gaudior Academy 0.0 3.0 34.0 4.0 59.0 1.3 1.0 10.7 1.5 85.5 41.0 14.5 26.48
Honey Creek Community School 2.0 7.0 23.0 5.0 63.0 0.4 8.6 17.4 2.1 71.6 37.0 28.4 8.59
Livingston Developmental Academy 0.0 1.0 1.0 0.0 98.0 0.2 0.7 0.4 0.8 98.0 2.0 2.0 0.02
Livingston Technical Academy 0.0 2.0 0.0 0.0 98.0 2.1 0.5 0.2 0.5 96.6 2.0 3.4 -1.40
Martin Luther King, Jr Ed Center 0.0 0.0 100.0 0.0 0.0 0.3 1.0 90.2 2.9 5.6 100.0 94.4 5.63
Michigan Early Elementary Center 0.0 0.0 35.0 12.0 53.0 0.3 1.0 90.2 2.9 5.6 47.0 94.4 -47.37
Michigan Health Academy 0.0 0.0 6.0 2.0 92.0 1.7 1.1 1.0 2.5 93.7 8.0 6.3 1.71
Oasis Academy 0.0 0.0 80.0 0.0 20.0 0.2 2.1 66.7 0.7 30.3 80.0 69.7 10.32
Plymouth Educational Center 0.0 0.0 100.0 0.0 0.0 0.3 1.0 90.2 2.9 5.6 100.0 94.4 5.63
Questar Academy 0.0 10.0 33.0 5.0 53.0 9.1 3.9 14.1 1.6 71.3 48.0 28.7 19.28
Saginaw County Transition Academy 0.0 0.0 67.0 0.0 33.0 0.3 1.0 56.8 13.1 28.8 67.0 71.2 -4.17
Ser Casa Environmental Acad 1.0 0.0 6.0 42.0 50.0 0.3 1.0 90.2 2.9 5.6 49.0 94.4 -45.37
St. Clair County Learning Academy 0.0 0.0 20.0 5.0 75.0 1.8 0.9 6.0 2.5 88.8 25.0 11.2 13.78
Summit Academy 0.5 0.5 0.5 0.5 98.0 0.2 0.6 0.9 1.4 96.9 2.0 3.1 -1.08
Thomas-Gist Academy 0.0 0.0 98.0 1.0 1.0 0.3 1.0 90.2 2.9 5.6 99.0 94.4 4.63
Warwick Pointe Academy 0.0 5.0 8.0 2.0 84.0 0.0 3.1 7.2 1.3 88.3 15.0 11.7 3.32
Web Dubois Preparatory School 0.5 0.0 99.5 0.0 0.0 0.3 1.0 90.2 2.9 5.6 100.0 94.4 5.63
State of Michigan Totals 1.0 1.5 17.8 2.7 77.0
Note: The data for the PSAs is for 1996/97, while the data from the host districts is for 1995/96.
BEST COPY AVAILABLE
141
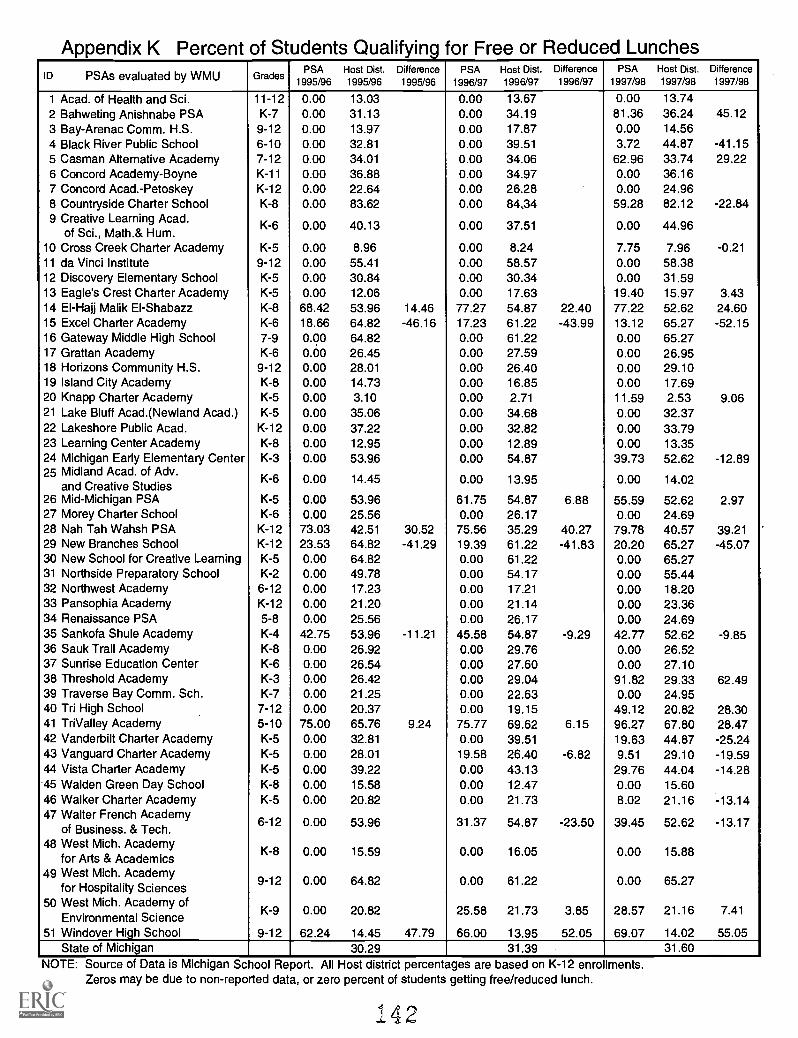
Appendix K Percent of Students Qualifvina for Free or Reduced LunchesID PSAs evaluated by WMU Grades
PSA1995/96
Host Dist.1995/96
Difference1995/96
PSA1996/97
Host Dist.1996/97
Difference1996/97
PSA1997/98
Host Dist.1997/98
Difference1997/98
1 Acad. of Health and Sci. 11-12 0.00 13.03 0.00 13.67 0.00 13.742 Bahweting Anishnabe PSA K-7 0.00 31.13 0.00 34.19 81.36 36.24 45.123 Bay-Arenac Comm. H.S. 9-12 0.00 13.97 0.00 17.87 0.00 14.564 Black River Public School 6-10 0.00 32.81 0.00 39.51 3.72 44.87 -41.155 Casman Alternative Academy 7-12 0.00 34.01 0.00 34.06 62.96 33.74 29.226 Concord Academy-Boyne K-11 0.00 36.88 0.00 34.97 0.00 36.167 Concord Acad.-Petoskey K-12 0.00 22.64 0.00 26.28 0.00 24.968 Countryside Charter School K-8 0.00 83.62 0.00 84,34 59.28 82.12 -22.849 Creative Learning Acad.
of Sci., Math.& Hum.K-6 0.00 40.13 0.00 37.51 0.00 44.96
10 Cross Creek Charter Academy K-5 0.00 8.96 0.00 8.24 7.75 7.96 -0.2111 da Vinci Institute 9-12 0.00 55.41 0.00 58.57 0.00 58.3812 Discovery Elementary School K-5 0.00 30.84 0.00 30.34 0.00 31.5913 Eagle's Crest Charter Academy K-5 0.00 12.06 0.00 17.63 19.40 15.97 3.4314 El-Hajj Malik EI-Shabazz K-8 68.42 53.96 14.46 77.27 54.87 22.40 77.22 52.62 24.6015 Excel Charter Academy K-6 18.66 64.82 -46.16 17.23 61.22 -43.99 13.12 65.27 -52.1516 Gateway Middle High School 7-9 0.00 64.82 0.00 61.22 0.00 65.2717 Grattan Academy K-6 0.60 26.45 0.00 27.59 0.00 26.9518 Horizons Community H.S. 9-12 0.00 28.01 0.00 26.40 0.00 29.1019 Island City Academy K-8 0.00 14.73 0.00 16.85 0.00 17.6920 Knapp Charter Academy K-5 0.00 3.10 0.00 2.71 11.59 2.53 9.0621 Lake Bluff Acad.(Newland Acad.) K-5 0.00 35.06 0.00 34.68 0.00 32.3722 Lakeshore Public Acad. K-12 0.00 37.22 0.00 32.82 0.00 33.7923 Learning Center Academy K-8 0.00 12.95 0.00 12.89 0.00 13.3524 Michigan Early Elementary Center K-3 0.00 53.96 0.00 54.87 39.73 52.62 -12.8925 Midland Acad. of Adv.
and Creative StudiesK-6 0.00 14.45 0.00 13.95 0.00 14.02
26 Mid-Michigan PSA K-5 0.00 53.96 61.75 54.87 6.88 55.59 52.62 2.9727 Morey Charter School K-6 0.00 25.56 0.00 26.17 0.00 24.6928 Nah Tah Wahsh PSA K-12 73.03 42.51 30.52 75.56 35.29 40.27 79.78 40.57 39.2129 New Branches School K-12 23.53 64.82 -41.29 19.39 61.22 -41.83 20.20 65.27 -45.0730 New School for Creative Learning K-5 0.00 64.82 0.00 61.22 0.00 65.2731 Northside Preparatory School K-2 0.00 49.78 0.00 54.17 0.00 55.4432 Northwest Academy 6-12 0.00 17.23 0.00 17.21 0.00 18.2033 Pansophia Academy K-12 0.00 21.20 0.00 21.14 0.00 23.3634 Renaissance PSA 5-8 0.00 25.56 0.00 26.17 0.00 24.6935 Sankofa Shule Academy K-4 42.75 53.96 -11.21 45.58 54.87 -9.29 42.77 52.62 -9.8536 Sauk Trail Academy K-8 0.00 26.92 0.00 29.76 0.00 26.5237 Sunrise Education Center K-6 0.00 26.54 0.00 27.60 0.00 27.1038 Threshold Academy K-3 0.00 26.42 0.00 29.04 91.82 29.33 62.4939 Traverse Bay Comm. Sch. K-7 0.00 21.25 0.00 22.63 0.00 24.9540 Tri High School 7-12 0.00 20.37 0.00 19.15 49.12 20.82 28.3041 TriValley Academy 5-10 75.00 65.76 9.24 75.77 69.62 6.15 96.27 67.80 28.4742 Vanderbilt Charter Academy K-5 0.00 32.81 0.00 39.51 19.63 44.87 -25.2443 Vanguard Charter Academy K-5 0.00 28.01 19.58 26.40 -6.82 9.51 29.10 -19.5944 Vista Charter Academy K-5 0.00 39.22 0.00 43.13 29.76 44.04 -14.28.45 Walden Green Day School K-8 0.00 15.58 0.00 12.47 0.00 15.6046 Walker Charter Academy K-5 0.00 20.82 0.00 21.73 8.02 21.16 -13.1447 Walter French Academy
of Business. & Tech.6-12 0.00 53.96 31.37 54.87 -23.50 39.45 52.62 -13.17
48 West Mich. Academyfor Arts & Academics
K-8 0.00 15.59 0.00 16.05 0.00 15.88
49 West Mich. Academyfor Hospitality Sciences
9-12 0.00 64.82 0.00 61.22 0.00 65.27
50 West Mich. Academy ofEnvironmental Science
K-9 0.00 20.82 25.58 21.73 3.85 28.57 21.16 7.41
51 Windover High School 9-12 62.24 14.45 47.79 66.00 13.95 52.05 69.07 14.02 55.05State of Michigan 30.29 31.39 31.60
NOTE: Source of Data is Michigan School Report. All Host district percentages are based on K-12 enrollments.Zeros may be due to non-reported data, or zero percent of students getting free/reduced lunch.
142
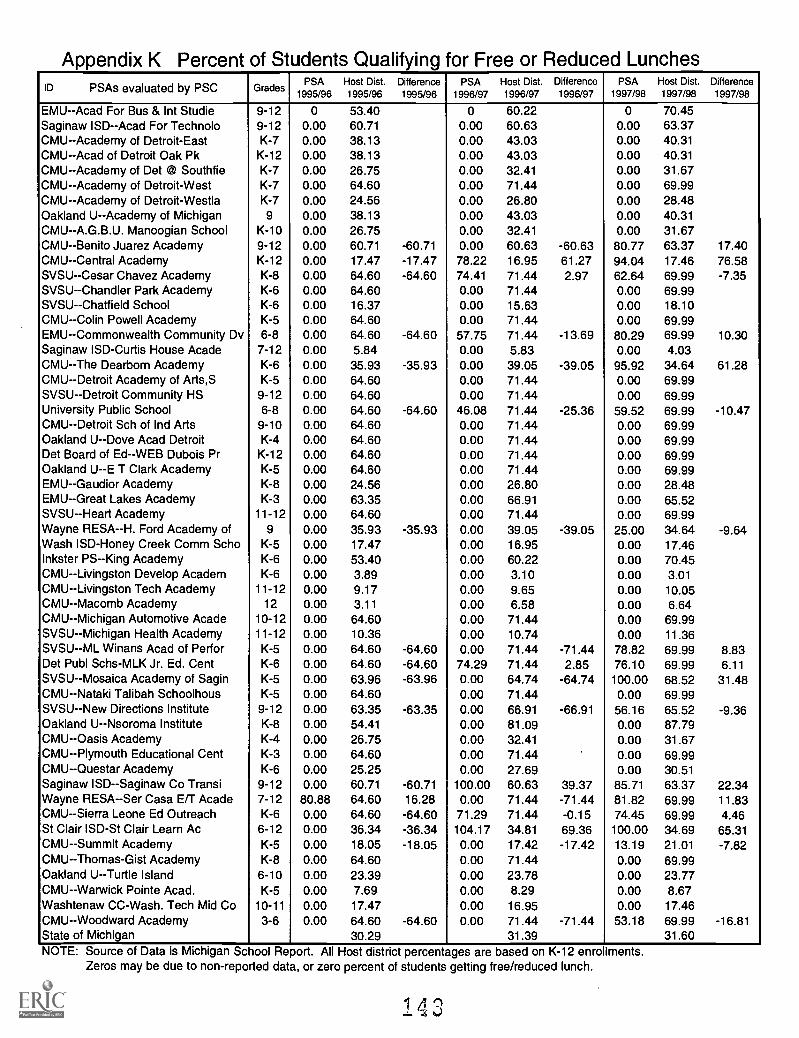
Appendix K Percent of Students Qualifying for Free or Reduced LunchesID PSAs evaluated by PSC Grades
PSA1995/96
Host Dist.1995/96
Difference1995/96
PSA1996/97
Host Dist.1996/97
Difference1996/97
PSA1997/98
Host Dist.1997/98
Difference1997/98
EMU--Acad For Bus & Int Studie 9-12 0 53.40 0 60.22 0 70.45Saginaw ISD--Acad For Technolo 9-12 0.00 60.71 0.00 60.63 0.00 63.37CMU--Academy of Detroit-East K-7 0.00 38.13 0.00 43.03 0.00 40.31CMU--Acad of Detroit Oak Pk K-12 0.00 38.13 0.00 43.03 0.00 40.31CMU--Academy of Det @ Southfie K-7 0.00 26.75 0.00 32.41 0.00 31.67CMU--Academy of Detroit-West K-7 0.00 64.60 0.00 71.44 0.00 69.99CMU--Academy of Detroit-Westla K-7 0.00 24.56 0.00 26.80 0.00 28.48Oakland U--Academy of Michigan 9 0.00 38.13 0.00 43.03 0.00 40.31CMU--A.G.B.U. Manoogian School K-10 0.00 26.75 0.00 32.41 0.00 31.67CMU--Benito Juarez Academy 9-12 0.00 60.71 -60.71 0.00 60.63 -60.63 80.77 63.37 17.40CMU--Central Academy K-12 0.00 17.47 -17.47 78.22 16.95 61.27 94.04 17.46 76.58SVSU--Cesar Chavez Academy K-8 0.00 64.60 -64.60 74.41 71.44 2.97 62.64 69.99 -7.35SVSU--Chandler Park Academy K-6 0.00 64.60 0.00 71.44 0.00 69.99SVSU--Chatfield School K-6 0.00 16.37 0.00 15.63 0.00 18.10CMU--Colin Powell Academy K-5 0.00 64.60 0.00 71.44 0.00 69.99EMU--Commonwealth Community Dv 6-8 0.00 64.60 -64.60 57.75 71.44 -13.69 80.29 69.99 10.30Saginaw ISD-Curtis House Acade 7-12 0.00 5.84 0.00 5.83 0.00 4.03CMU--The Dearborn Academy K-6 0.00 35.93 -35.93 0.00 39.05 -39.05 95.92 34.64 61.28CMU--Detroit Academy of Arts,S K-5 0.00 64.60 0.00 71.44 0.00 69.99SVSU--Detroit Community HS 9-12 0.00 64.60 0.00 71.44 0.00 69.99University Public School 6-8 0.00 64.60 -64.60 46.08 71.44 -25.36 59.52 69.99 -10.47CMU-Detroit Sch of Ind Arts 9-10 0.00 64.60 0.00 71.44 0.00 69.99Oakland U--Dove Acad Detroit K-4 0.00 64.60 0.00 71.44 0.00 69.99Det Board of Ed--WEB Dubois Pr K-12 0.00 64.60 0.00 71.44 0.00 69.99Oakland U--E T Clark Academy K-5 0.00 64.60 0.00 71.44 0.00 69.99EMU--Gaudior Academy K-8 0.00 24.56 0.00 26.80 0.00 28.48EMU--Great Lakes Academy K-3 0.00 63.35 0.00 66.91 0.00 65.52SVSU - -Heart Academy 11-12 0.00 64.60 0.00 71.44 0.00 69.99Wayne RESA--H. Ford Academy of 9 0.00 35.93 -35.93 0.00 39.05 -39.05 25.00 34.64 -9.64Wash ISD-Honey Creek Comm Scho K-5 0.00 17.47 0.00 16.95 0.00 17.46Inkster PS--King Academy K-6 0.00 53.40 0.00 60.22 0.00 70.45CMU--Livingston Develop Academ K-6 0.00 3.89 0.00 3.10 0.00 3.01CMU--Livingston Tech Academy 11-12 0.00 9.17 0.00 9.65 0.00 10.05CMU--Macomb Academy 12 0.00 3.11 0.00 6.58 0.00 6.64CMU--Michigan Automotive Acade 10-12 0.00 64.60 0.00 71.44 0.00 69.99SVSU -- Michigan Health Academy 11-12 0.00 10.36 0.00 10.74 0.00 11.36SVSU--ML Winans Acad of Perfor K-5 0.00 64.60 -64.60 0.00 71.44 -71.44 78.82 69.99 8.83Det Publ Schs-MLK Jr. Ed. Cent K-6 0.00 64.60 -64.60 74.29 71.44 2.85 76.10 69.99 6.11SVSU--Mosaica Academy of Sagin K-5 0.00 63.96 -63.96 0.00 64.74 -64.74 100.00 68.52 31.48CMU--Nataki Talibah Schoolhous K-5 0.00 64.60 0.00 71.44 0.00 69.99SVSU--New Directions Institute 9-12 0.00 63.35 -63.35 0.00 66.91 -66.91 56.16 65.52 -9.36Oakland U--Nsoroma Institute K-8 0.00 54.41 0.00 81.09 0.00 87.79CMU--Oasis Academy K-4 0.00 26.75 0.00 32.41 0.00 31.67CMU--Plymouth Educational Cent K-3 0.00 64.60 0.00 71.44 0.00 69.99CMU--Questar Academy K-6 0.00 25.25 0.00 27.69 0.00 30.51Saginaw ISD--Saginaw Co Transi 9-12 0.00 60.71 -60.71 100.00 60.63 39.37 85.71 63.37 22.34Wayne RESA--Ser Casa E/T Acade 7-12 80.88 64.60 16.28 0.00 71.44 -71.44 81.82 69.99 11.83CMU--Sierra Leone Ed Outreach K-6 0.00 64.60 -64.60 71.29 71.44 -0.15 74.45 69.99 4.46St Clair ISD-St Clair Learn Ac 6-12 0.00 36.34 -36.34 104.17 34.81 69.36 100.00 34.69 65.31CMU--Summit Academy K-5 0.00 18.05 -18.05 0.00 17.42 -17.42 13.19 21.01 -7.82CMU--Thomas-Gist Academy K-8 0.00 64.60 0.00 71.44 0.00 69.99Oakland U--Turtle Island 6-10 0.00 23.39 0.00 23.78 0.00 23.77CMU--Warwick Pointe Acad. K-5 0.00 7.69 0.00 8.29 0.00 8.67Washtenaw CC-Wash. Tech Mid Co 10-11 0.00 17.47 0.00 16.95 0.00 17.46CMU--Woodward Academy 3-6 0.00 64.60 -64.60 0.00 71.44 -71.44 53.18 69.99 -16.81State of Michigan 30.29 31.39 31.60NOTE: Source of Data is Michigan School Report. All Host district percentages are based on K-12 enrollments.
Zeros may be due to non-reported data, or zero percent of students getting free/reduced lunch.
143
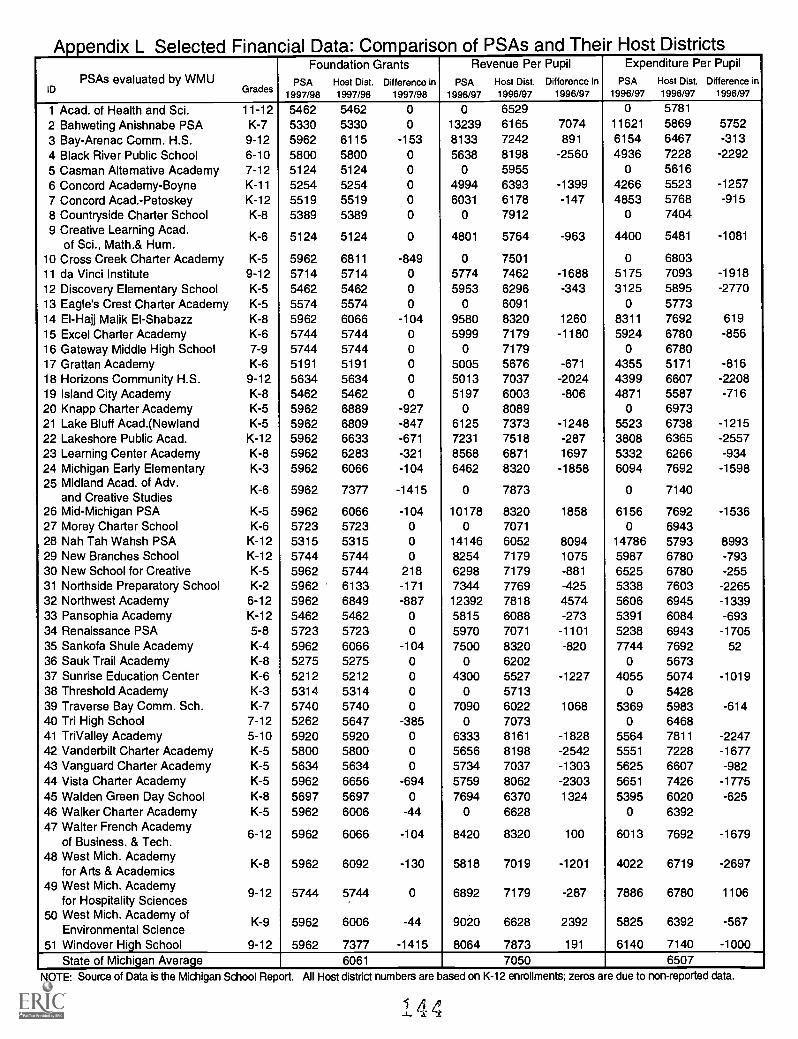
Appendix L Selected Financial Data: Comparison of PSAs and Their Host Districts. .
PSAs evaluated by WMUID Grades
Foundation GrantsPSA Host Dist. Difference in
1997/98 1997/98 1997/98
Revenue Per PupilPSA Host Dist. Difference in
1996/97 1996/97 1996/97
Expenditure Per Pupil
PSA Host Dist. Difference in1996/97 1996/97 1996/97
1 Acad. of Health and Sc i. 11-12 5462 5462 0 0 6529 0 5781
2 Bahweting Anishnabe PSA K-7 5330 5330 0 13239 6165 7074 11621 5869 5752
3 Bay-Arenac Comm. H.S. 9-12 5962 6115 -153 8133 7242 891 6154 6467 -3134 Black River Public School 6-10 5800 5800 0 5638 8198 -2560 4936 7228 -2292
5 Casman Alternative Academy 7-12 5124 5124 0 0 5955 0 5616
6 Concord Academy-Boyne K-11 5254 5254 0 4994 6393 -1399 4266 5523 -12577 Concord Acad.-Petoskey K-12 5519 5519 0 6031 6178 -147 4853 5768 -9158 Countryside Charter School K-8 5389 5389 0 0 7912 0 74049 Creative Learning Acad.
of Sci., Math.& Hum.K-6 5124 5124 0 4801 5764 -963 4400 5481 -1081
10 Cross Creek Charter Academy K-5 5962 6811 -849 0 7501 0 680311 da Vinci Institute 9-12 5714 5714 0 5774 7462 -1688 5175 7093 -191812 Discovery Elementary School K-5 5462 5462 0 5953 6296 -343 3125 5895 -277013 Eagle's Crest Charter Academy K-5 5574 5574 0 0 6091 0 577314 El-Hajj Malik EI-Shabazz K-8 5962 6066 -104 9580 8320 1260 8311 7692 61915 Excel Charter Academy K-6 5744 5744 0 5999 7179 -1180 5924 6780 -85616 Gateway Middle High School 7-9 5744 5744 0 0 7179 0 678017 Grattan Academy K-6 5191 5191 0 5005 5676 -671 4355 5171 -81618 Horizons Community H.S. 9-12 5634 5634 0 5013 7037 -2024 4399 6607 -220819 Island City Academy K-8 5462 5462 0 5197 6003 -806 4871 5587 -71620 Knapp Charter Academy K-5 5962 6889 -927 0 8089 0 697321 Lake Bluff Acad.(Newland K-5 5962 6809 -847 6125 7373 -1248 5523 6738 -121522 Lakeshore Public Acad. K-12 5962 6633 -671 7231 7518 -287 3808 6365 -255723 Learning Center Academy K-8 5962 6283 -321 8568 6871 1697 5332 6266 -93424 Michigan Early Elementary K-3 5962 6066 -104 6462 8320 -1858 6094 7692 -159825 Midland Acad. of Adv.
and Creative StudiesK-6 5962 7377 -1415 0 7873 0 7140
26 Mid-Michigan PSA K-5 5962 6066 -104 10178 8320 1858 6156 7692 -153627 Morey Charter School K-6 5723 5723 0 0 7071 0 694328 Nah Tah Wahsh PSA K-12 5315 5315 0 14146 6052 8094 14786 5793 899329 New Branches School K-12 5744 5744 0 8254 7179 1075 5987 6780 -79330 New School for Creative K-5 5962 5744 218 6298 7179 -881 6525 6780 -25531 Northside Preparatory School K-2 5962 6133 -171 7344 7769 -425 5338 7603 -226532 Northwest Academy 6-12 5962 6849 -887 12392 7818 4574 5606 6945 -133933 Pansophia Academy K-12 5462 5462 0 5815 6088 -273 5391 6084 -69334 Renaissance PSA 5-8 5723 5723 0 5970 7071 -1101 5238 6943 -170535 Sankofa Shule Academy K-4 5962 6066 -104 7500 8320 -820 7744 7692 5236 Sauk Trail Academy K-8 5275 5275 0 0 6202 0 567337 Sunrise Education Center K-6 5212 5212 0 4300 5527 -1227 4055 5074 -101938 Threshold Academy K-3 5314 5314 0 0 5713 0 542839 Traverse Bay Comm. Sch. K-7 5740 5740 0 7090 6022 1068 5369 5983 -61440 Tri High School 7-12 5262 5647 -385 0 7073 0 646841 TriValley Academy 5-10 5920 5920 0 6333 8161 -1828 5564 7811 -224742 Vanderbilt Charter Academy K-5 5800 5800 0 5656 8198 -2542 5551 7228 -167743 Vanguard Charter Academy K-5 5634 5634 0 5734 7037 -1303 5625 6607 -98244 Vista Charter Academy K-5 5962 6656 -694 5759 8062 -2303 5651 7426 -177545 Walden Green Day School K-8 5697 5697 0 7694 6370 1324 5395 6020 -62546 Walker Charter Academy K-5 5962 6006 -44 0 6628 0 639247 Walter French Academy
of Business. & Tech.6-12 5962 6066 -104 8420 8320 100 6013 7692 -1679
48 West Mich. Academyfor Arts & Academics
K-8 5962 6092 -130 5818 7019 -1201 4022 6719 -2697
49 West Mich. Academyfor Hospitality Sciences
9-12 5744 5744 0 6892 7179 -287 7886 6780 1106
50 West Mich. Academy ofEnvironmental Science
K-9 5962 6006 -44 9020 6628 2392 5825 6392 -567
51 Windover High School 9-12 5962 7377 -1415 8064 7873 191 6140 7140 -1000State of Michigan Average 6061 7050 6507
NOTE: Source of Data is the Michigan School Report. All Host district numbers are based on K-12 enrollments; zeros are due to non-reported data.
1 4 4
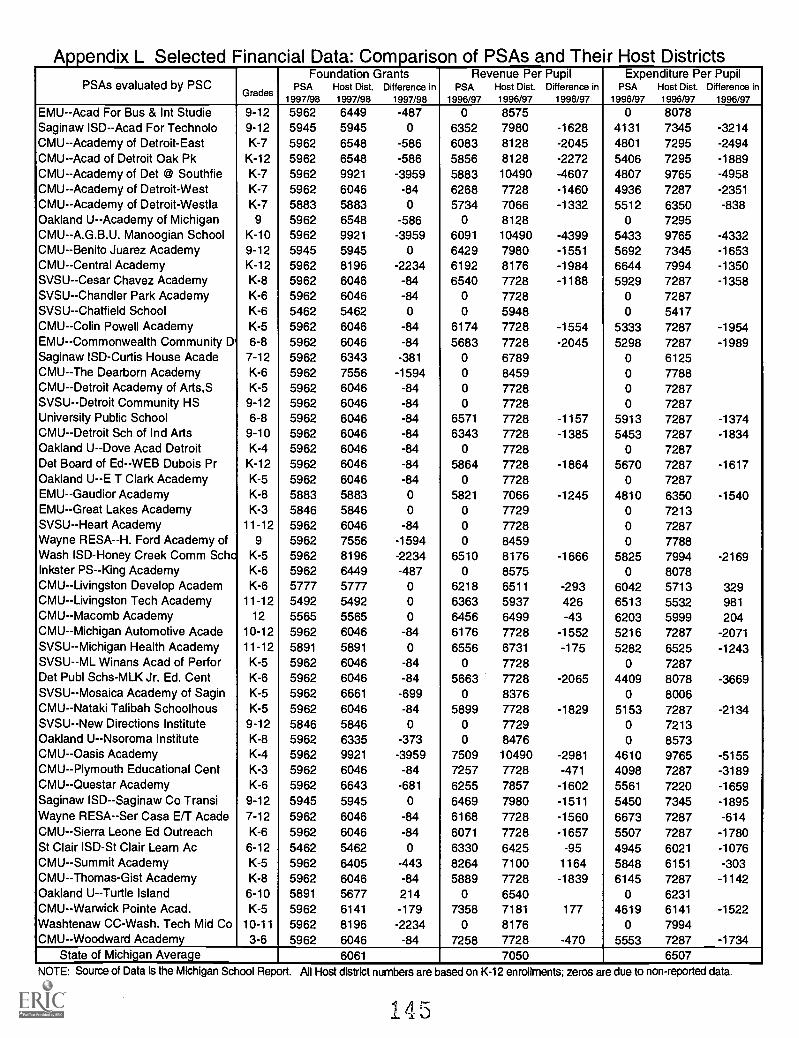
Appendix L Selected Financial Data: Comparison of PSAs and Their Host Districts
PSAs evaluated by PSCGrades
Foundation GrantsPSA Host Dist. Difference in
1997/98 1997/98 1997/98
Revenue Per PupilPSA Host Dist. Difference in
1996/97 1996/97 1996/97
Expenditure Per PupilPSA Host Dist. Difference in
1996/97 1996/97 1996/97
EMU--Acad For Bus & Int Studie 9-12 5962 6449 -487 0 8575 0 8078Saginaw ISD--Acad For Technolo 9-12 5945 5945 0 6352 7980 -1628 4131 7345 -3214CMU--Academy of Detroit-East K-7 5962 6548 -586 6083 8128 -2045 4801 7295 -2494CMU--Acad of Detroit Oak Pk K-12 5962 6548 -586 5856 8128 -2272 5406 7295 -1889CMU--Academy of Det @ Southfie K-7 5962 9921 -3959 5883 10490 -4607 4807 9765 -4958CMU--Academy of Detroit-West K-7 5962 6046 -84 6268 7728 -1460 4936 7287 -2351CMU--Academy of Detroit-Westla K-7 5883 5883 0 5734 7066 -1332 5512 6350 -838Oakland U--Academy of Michigan 9 5962 6548 -586 0 8128 0 7295CMU--A.G.B.U. Manoogian School K-10 5962 9921 -3959 6091 10490 -4399 5433 9765 -4332CMU--Benito Juarez Academy 9-12 5945 5945 0 6429 7980 -1551 5692 7345 -1653CMU--Central Academy K-12 5962 8196 -2234 6192 8176 -1984 6644 7994 -1350SVSU--Cesar Chavez Academy K-8 5962 6046 -84 6540 7728 -1188 5929 7287 -1358SVSU--Chandler Park Academy K-6 5962 6046 -84 0 7728 0 7287SVSU--Chatfield School K-6 5462 5462 0 0 5948 0 5417CMU--Colin Powell Academy K-5 5962 6046 -84 6174 7728 -1554 5333 7287 -1954EMU--Commonwealth Community DI 6-8 5962 6046 -84 5683 7728 -2045 5298 7287 -1989Saginaw ISD-Curtis House Acade 7-12 5962 6343 -381 0 6789 0 6125CMU--The Dearborn Academy K-6 5962 7556 -1594 0 8459 0 7788CMU--Detroit Academy of Arts,S K-5 5962 6046 -84 0 7728 0 7287SVSU--Detroit Community HS 9-12 5962 6046 -84 0 7728 0 7287University Public School 6-8 5962 6046 -84 6571 7728 -1157 5913 7287 -1374CMU--Detroit Sch of Ind Arts 9-10 5962 6046 -84 6343 7728 -1385 5453 7287 -1834Oakland U--Dove Acad Detroit K-4 5962 6046 -84 0 7728 0 7287Det Board of Ed--WEB Dubois Pr K-12 5962 6046 -84 5864 7728 -1864 5670 7287 -1617Oakland U--E T Clark Academy K-5 5962 6046 -84 0 7728 0 7287EMU--Gaudior Academy K-8 5883 5883 0 5821 7066 -1245 4810 6350 -1540EMU--Great Lakes Academy K-3 5846 5846 0 0 7729 0 7213SVSU--Heart Academy 11-12 5962 6046 -84 0 7728 0 7287Wayne RESA--H. Ford Academy of 9 5962 7556 -1594 0 8459 0 7788Wash ISD-Honey Creek Comm Scho K-5 5962 8196 -2234 6510 8176 -1666 5825 7994 -2169Inkster PS--King Academy K-6 5962 6449 -487 0 8575 0 8078CMU--Livingston Develop Academ K-6 5777 5777 0 6218 6511 -293 6042 5713 329CMU--Livingston Tech Academy 11-12 5492 5492 0 6363 5937 426 6513 5532 981CMU--Macomb Academy 12 5565 5565 0 6456 6499 -43 6203 5999 204CMU--Michigan Automotive Acade 10-12 5962 6046 -84 6176 7728 -1552 5216 7287 -2071SVSU--Michigan Health Academy 11-12 5891 5891 0 6556 6731 -175 5282 6525 -1243SVSU--ML Winans Acad of Perfor K-5 5962 6046 -84 0 7728 0 7287Det Publ Schs-MLK Jr. Ed. Cent K-6 5962 6046 -84 5663 7728 -2065 4409 8078 -3669SVSU--Mosaica Academy of Sagin K-5 5962 6661 -699 0 8376 0 8006CMU--Nataki Talibah Schoolhous K-5 5962 6046 -84 5899 7728 -1829 5153 7287 -2134SVSU--New Directions Institute 9-12 5846 5846 0 0 7729 0 7213Oakland U--Nsoroma Institute K-8 5962 6335 -373 0 8476 0 8573CMU--Oasis Academy K-4 5962 9921 -3959 7509 10490 -2981 4610 9765 -5155CMU--Plymouth Educational Cent K-3 5962 6046 -84 7257 7728 -471 4098 7287 -3189CMU--Questar Academy K-6 5962 6643 -681 6255 7857 -1602 5561 7220 -1659Saginaw ISD--Saginaw Co Transi 9-12 5945 5945 0 6469 7980 -1511 5450 7345 -1895Wayne RESA--Ser Casa E/T Acade 7-12 5962 6046 -84 6168 7728 -1560 6673 7287 -614CMU--Sierra Leone Ed Outreach K-6 5962 6046 -84 6071 7728 -1657 5507 7287 -1780St Clair ISD-St Clair Learn Ac 6-12 5462 5462 0 6330 6425 -95 4945 6021 -1076CMU--Summit Academy K-5 5962 6405 -443 8264 7100 1164 5848 6151 -303CMU--Thomas-Gist Academy K-8 5962 6046 -84 5889 7728 -1839 6145 7287 -1142Oakland U--Turtle Island 6-10 5891 5677 214 0 6540 0 6231CMU--Warwick Pointe Acad. K-5 5962 6141 -179 7358 7181 177 4619 6141 -1522Washtenaw CC-Wash. Tech Mid Co 10-11 5962 8196 -2234 0 8176 0 7994CMU--Woodward Academy 3-6 5962 6046 -84 7258 7728 -470 5553 7287 -1734
State of Michigan Average 6061 7050 6507NOTE: Source of Data is the Michigan School Report. All Host district numbers are based on K-12 enrollments; zeros are due to non-reported data.
145
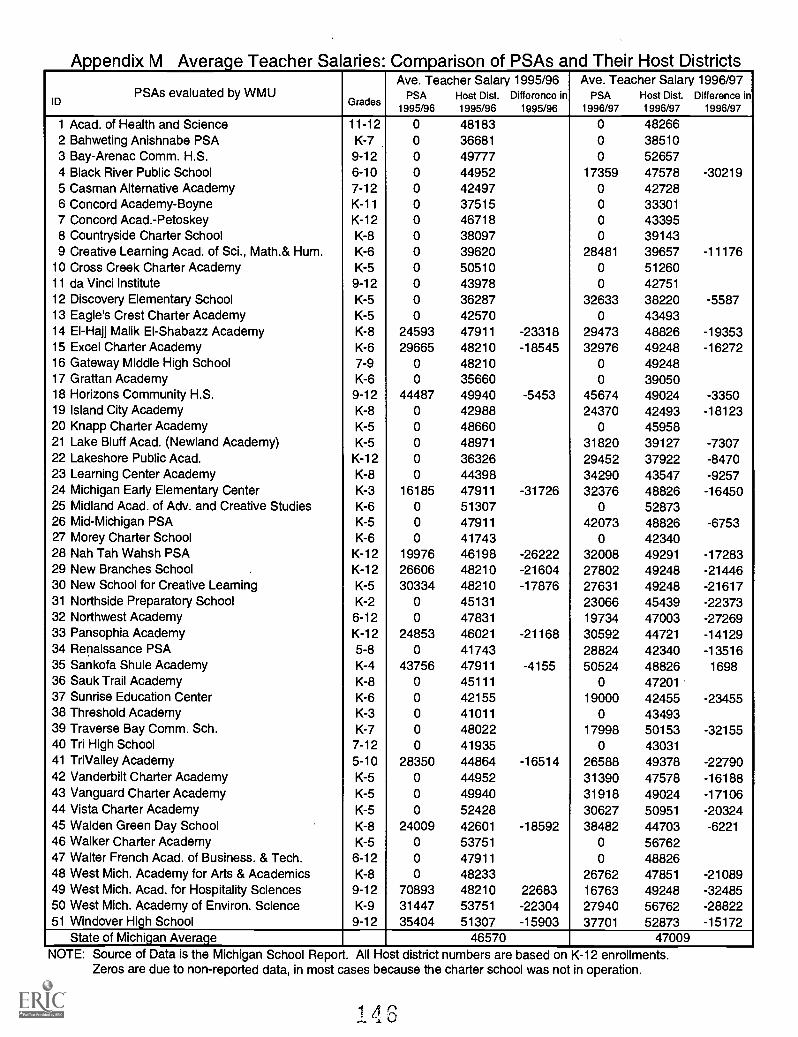
Appendix M Average Teacher Salaries: Comparison of PSAs and Their Host Districts
PSAs evaluated by WMUID Grades
Ave. Teacher Salary 1995/96PSA Host Dist. Difference in
1995/96 1995/96 1995/96
Ave. Teacher Salary 1996/97PSA Host Dist. Difference in
1996/97 1996/97 1996/97
1 Acad. of Health and Science 11-12 0 48183 0 482662 Bahweting Anishnabe PSA K-7 0 36681 0 385103 Bay-Arenac Comm. H.S. 9-12 0 49777 0 526574 Black River Public School 6-10 0 44952 17359 47578 -302195 Casman Alternative Academy 7-12 0 42497 0 427286 Concord Academy-Boyne K-11 0 37515 0 333017 Concord Acad.-Petoskey K-12 0 46718 0 433958 Countryside Charter School K-8 0 38097 0 391439 Creative Learning Acad. of Sci., Math.& Hum. K-6 0 39620 28481 39657 -11176
10 Cross Creek Charter Academy K-5 0 50510 0 5126011 da Vinci Institute 9-12 0 43978 0 4275112 Discovery Elementary School K-5 0 36287 32633 38220 -558713 Eagle's Crest Charter Academy K-5 0 42570 0 4349314 El-Hajj Malik EI-Shabazz Academy K-8 24593 47911 -23318 29473 48826 -1935315 Excel Charter Academy K-6 29665 48210 -18545 32976 49248 -1627216 Gateway Middle High School 7-9 0 48210 0 4924817 Grattan Academy K-6 0 35660 0 3905018 Horizons Community H.S. 9-12 44487 49940 -5453 45674 49024 -335019 Island City Academy K-8 0 42988 24370 42493 -1812320 Knapp Charter Academy K-5 0 48660 0 4595821 Lake Bluff Acad. (Newland Academy) K-5 0 48971 31820 39127 -730722 Lakeshore Public Acad. K-12 0 36326 29452 37922 -847023 Learning Center Academy K-8 0 44398 34290 43547 -925724 Michigan Early Elementary Center K-3 16185 47911 -31726 32376 48826 -1645025 Midland Acad. of Adv. and Creative Studies K-6 0 51307 0 5287326 Mid-Michigan PSA K-5 0 47911 42073 48826 -675327 Morey Charter School K-6 0 41743 0 4234028 Nah Tah Wahsh PSA K-12 19976 46198 -26222 32008 49291 -1728329 New Branches School . K-12 26606 48210 -21604 27802 49248 -2144630 New School for Creative Learning K-5 30334 48210 -17876 27631 49248 -2161731 Northside Preparatory School K-2 0 45131 23066 45439 -2237332 Northwest Academy 6-12 0 47831 19734 47003 -2726933 Pansophia Academy K-12 24853 46021 -21168 30592 44721 -1412934 Renaissance PSA 5-8 0 41743 28824 42340 -1351635 Sankofa Shule Academy K-4 43756 47911 -4155 50524 48826 169836 Sauk Trail Academy K-8 0 45111 0 4720137 Sunrise Education Center K-6 0 42155 19000 42455 -2345538 Threshold Academy K-3 0 41011 0 4349339 Traverse Bay Comm. Sch. K-7 0 48022 17998 50153 -3215540 Tri High School 7-12 0 41935 0 4303141 TriValley Academy 5-10 28350 44864 -16514 26588 49378 -2279042 Vanderbilt Charter Academy K-5 0 44952 31390 47578 -1618843 Vanguard Charter Academy K-5 0 49940 31918 49024 -1710644 Vista Charter Academy K-5 0 52428 30627 50951 -2032445 Walden Green Day School K-8 24009 42601 -18592 38482 44703 -622146 Walker Charter Academy K-5 0 53751 0 5676247 Walter French Acad. of Business. & Tech. 6-12 0 47911 0 4882648 West Mich. Academy for Arts & Academics K-8 0 48233 26762 47851 -2108949 West Mich. Acad. for Hospitality Sciences 9-12 70893 48210 22683 16763 49248 -3248550 West Mich. Academy of Environ. Science K-9 31447 53751 -22304 27940 56762 -2882251 Windover High School 9-12 35404 51307 -15903 37701 52873 -15172
State of Michigan Average 46570 47009NOTE: Source of Data is the Michigan School Report. All Host district numbers are based on K-12 enrollments.
Zeros are due to non-reported data, in most cases because the charter school was not in operation.
11. S
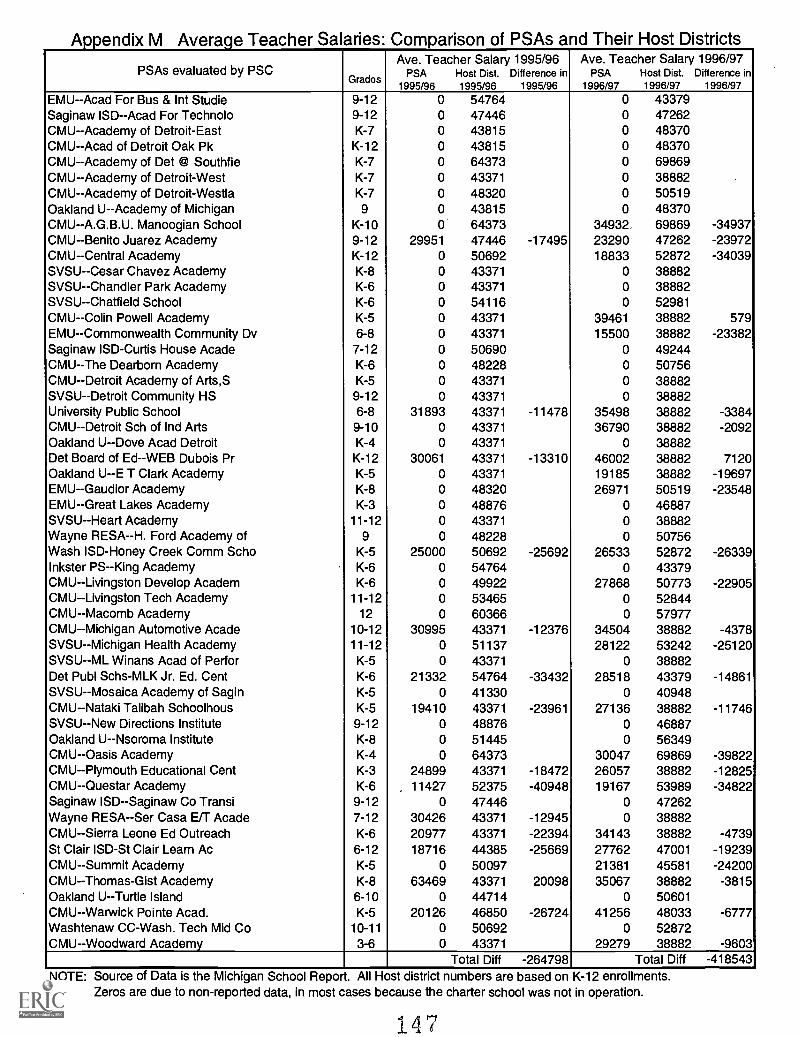
Appendix M Average Teacher Salaries: Comparison of PSAs and Their Host Districts
PSAs evaluated by PSCGrades
Ave. Teacher Salary 1995/96PSA Host Dist. Difference in
1995/96 1995/96 1995/96
Ave. Teacher Salary 1996/97PSA Host Dist. Difference in
1996/97 1996/97 1996/97
EMU--Acad For Bus & Int Studie 9-12 0 54764 0 43379Saginaw ISD--Acad For Technolo 9-12 0 47446 0 47262CMU--Academy of Detroit-East K-7 0 43815 0 48370CMU--Acad of Detroit Oak Pk K-12 0 43815 0 48370CMU--Academy of Det @ Southfie K-7 0 64373 0 69869CMU--Academy of Detroit-West K-7 0 43371 0 38882CMU--Academy of Detroit-Westla K-7 0 48320 0 50519Oakland U--Academy of Michigan 9 0 43815 0 48370CMU--A.G.B.U. Manoogian School K-10 0 64373 34932, 69869 -34937CMU--Benito Juarez Academy 9-12 29951 47446 -17495 23290 47262 -23972CMU--Central Academy K-12 0 50692 18833 52872 -34039SVSU--Cesar Chavez Academy K-8 0 43371 0 38882SVSU--Chandler Park Academy K-6 0 43371 0 38882SVSU--Chatfield School K-6 0 54116 0 52981CMU--Colin Powell Academy K-5 0 43371 39461 38882 579EMU--Commonwealth Community Dv 6-8 0 43371 15500 38882 -23382Saginaw ISD-Curtis House Acade 7-12 0 50690 0 49244CMU--The Dearborn Academy K-6 0 48228 0 50756CMU--Detroit Academy of Arts,S K-5 0 43371 0 38882SVSU--Detroit Community HS 9-12 0 43371 0 38882University Public School 6-8 31893 43371 -11478 35498 38882 -3384CMU--Detroit Sch of Ind Arts 9-10 0 43371 36790 38882 -2092Oakland U--Dove Acad Detroit K-4 0 43371 0 38882Det Board of Ed--WEB Dubois Pr K-12 30061 43371 -13310 46002 38882 7120Oakland U--E T Clark Academy K-5 0 43371 19185 38882 -19697EMU--Gaudior Academy K-8 0 48320 26971 50519 -23548EMU--Great Lakes Academy K-3 0 48876 0 46887SVSU - -Heart Academy 11-12 0 43371 0 38882Wayne RESA--H. Ford Academy of 9 0 48228 0 50756Wash ISD-Honey Creek Comm Scho K-5 25000 50692 -25692 26533 52872 -26339Inkster PS--King Academy K-6 0 54764 0 43379CMU--Livingston Develop Academ K-6 0 49922 27868 50773 -22905CMU--Livingston Tech Academy 11-12 0 53465 0 52844CMU--Macomb Academy 12 0 60366 0 57977CMU--Michigan Automotive Acade 10-12 30995 43371 -12376 34504 38882 -4378SVSU--Michigan Health Academy 11-12 0 51137 28122 53242 -25120SVSU--ML Winans Acad of Perfor K-5 0 43371 0 38882Det Publ Schs-MLK Jr. Ed. Cent K-6 21332 54764 -33432 28518 43379 -14861SVSU--Mosaica Academy of Sagin K-5 0 41330 0 40948CMU--Nataki Talibah Schoolhous K-5 19410 43371 -23961 27136 38882 -11746SVSU--New Directions Institute 9-12 0 48876 0 46887Oakland U--Nsoroma Institute K-8 0 51445 0 56349CMU--Oasis Academy K-4 0 64373 30047 69869 -39822CMU--Plymouth Educational Cent K-3 24899 43371 -18472 26057 38882 -12825CMU--Questar Academy K-6 11427 52375 -40948 19167 53989 -34822Saginaw ISD--Saginaw Co Transi 9-12 0 47446 0 47262Wayne RESA--Ser Casa Ea Acade 7-12 30426 43371 -12945 0 38882CMU--Sierra Leone Ed Outreach K-6 20977 43371 -22394 34143 38882 -4739St Clair ISD-St Clair Learn Ac 6-12 18716 44385 -25669 27762 47001 -19239CMU--Summit Academy K-5 0 50097 21381 45581 -24200CMU--Thomas-Gist Academy K-8 63469 43371 20098 35067 38882 -3815Oakland U--Turtle Island 6-10 0 44714 0 50601CMU--Warwick Pointe Acad. K-5 20126 46850 -26724 41256 48033 -6777Washtenaw CC-Wash. Tech Mid Co 10-11 0 50692 0 52872CMU--Woodward Academy 3-6 0 43371 29279 38882 -9603
Total Diff -264798 Total Diff -418543NOTE: Source of Data is the Michigan School Report. All Host district numbers are based on K-12 enrollments.
Zeros are due to non-reported data, in most cases because the charter school was not in operation.
14 7
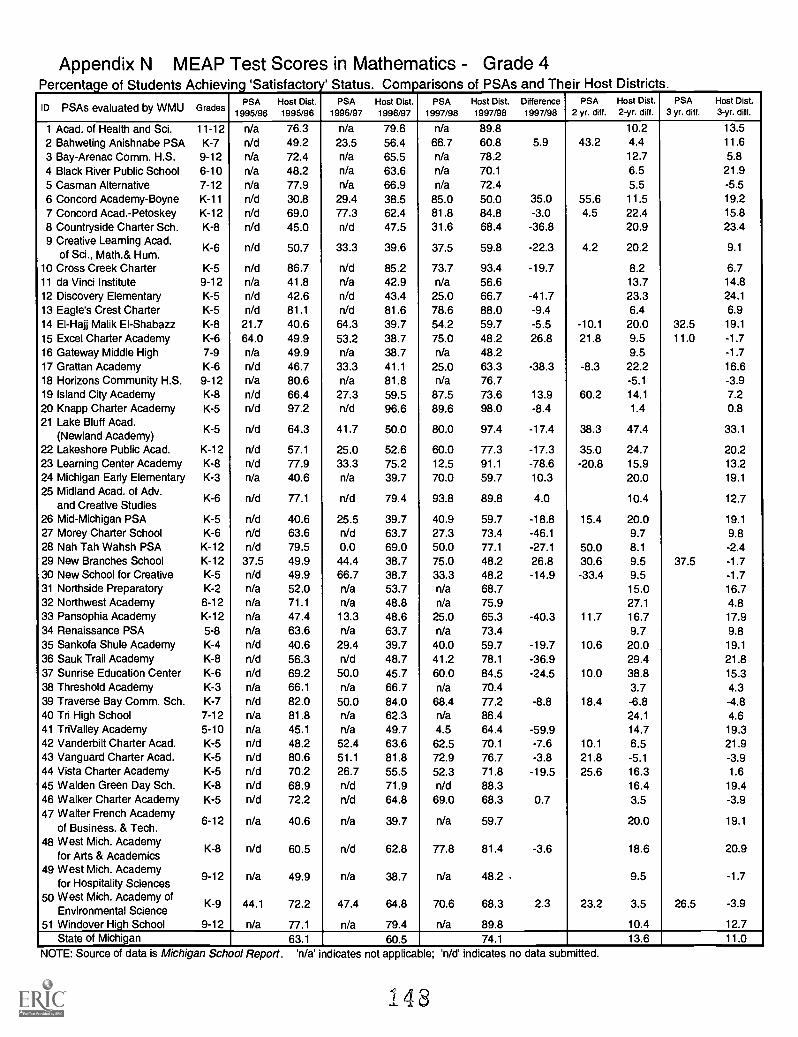
Appendix N MEAP Test Scores in Mathematics Grade 4Percentage of Students Achieving 'Satisfactory' Status. Comparisons of PSAs and Their Host Districts.
ID PSAs evaluated by WMU GradesPSA
1995/96Host Dist.1995/96
PSA1996/97
Host Dist.1996/97
PSA1997/98
Host Dist.1997/98
Difference1997/98
PSA2 yr. cliff.
Host Dist.2-yr. diff.
PSA3 yr. diff.
Host Dist.3-yr. diff.
1 Acad. of Health and Sci. 11-12 n/a 76.3 n/a 79.6 n/a 89.8 10.2 13.5
2 Bahweting Anishnabe PSA K-7 n/d 49.2 23.5 56.4 66.7 60.8 5.9 43.2 4.4 11.6
3 Bay-Arenac Comm. H.S. 9-12 n/a 72.4 n/a 65.5 n/a 78.2 12.7 5.8
4 Black River Public School 6-10 n/a 48.2 n/a 63.6 n/a 70.1 6.5 21.95 Casman Alternative 7-12 n/a 77.9 n/a 66.9 n/a 72.4 5.5 -5.56 Concord Academy-Boyne K-11 n/d 30.8 29.4 38.5 85.0 50.0 35.0 55.6 11.5 19.27 Concord Acad.-Petoskey K-12 n/d 69.0 77.3 62.4 81.8 84.8 -3.0 4.5 22.4 15.88 Countryside Charter Sch. K-8 n/d 45.0 n/d 47.5 31.6 68.4 -36.8 20.9 23.49 Creative Learning Acad.
of Sci., Math.& Hum.K-6 n/d 50.7 33.3 39.6 37.5 59.8 -22.3 4.2 20.2 9.1
10 Cross Creek Charter K-5 n/d 86.7 n/d 85.2 73.7 93.4 -19.7 8.2 6.711 da Vinci Institute 9-12 n/a 41.8 n/a 42.9 n/a 56.6 13.7 14.812 Discovery Elementary K-5 n/d 42.6 n/d 43.4 25.0 66.7 -41.7 23.3 24.1
13 Eagles Crest Charter K-5 n/d 81.1 n/d 81.6 78.6 88.0 -9.4 6.4 6.914 El-Hajj Malik EI-Shabazz K-8 21.7 40.6 64.3 39.7 54.2 59.7 -5.5 -10.1 20.0 32.5 19.1
15 Excel Charter Academy K-6 64.0 49.9 53.2 38.7 75.0 48.2 26.8 21.8 9.5 11.0 -1.716 Gateway Middle High 7-9 n/a 49.9 n/a 38.7 n/a 48.2 9.5 -1.717 Grattan Academy K-6 n/d 46.7 33.3 41.1 25.0 63.3 -38.3 -8.3 22.2 16.618 Horizons Community H.S. 9-12 n/a 80.6 n/a 81.8 n/a 76.7 -5.1 -3.919 Island City Academy K-8 n/d 66.4 27.3 59.5 87.5 73.6 13.9 60.2 14.1 7.220 Knapp Charter Academy K-5 n/d 97.2 n/d 96.6 89.6 98.0 -8.4 1.4 0.821 Lake Bluff Acad.
(Newland Academy)K-5 n/d 64.3 41.7 50.0 80.0 97.4 -17.4 38.3 47.4 33.1
22 Lakeshore Public Acad. K-12 n/d 57.1 25.0 52.6 60.0 77.3 -17.3 35.0 24.7 20.223 Learning Center Academy K-8 n/d 77.9 33.3 75.2 12.5 91.1 -78.6 -20.8 15.9 13.224 Michigan Early Elementary K-3 n/a 40.6 n/a 39.7 70.0 59.7 10.3 20.0 19.1
25 Midland Acad. of Adv.and Creative Studies
K-6 n/d 77.1 n/d 79.4 93.8 89.8 4.0 10.4 12.7
26 Mid-Michigan PSA K-5 n/d 40.6 25.5 39.7 40.9 59.7 -18.8 15.4 20.0 19.1
27 Morey Charter School K-6 n/d 63.6 n/d 63.7 27.3 73.4 -46.1 9.7 9.828 Nah Tah Wahsh PSA K-12 n/d 79.5 0.0 69.0 50.0 77.1 -27.1 50.0 8.1 -2.429 New Branches School K-12 37.5 49.9 44.4 38.7 75.0 48.2 26.8 30.6 9.5 37.5 -1.730 New School for Creative K-5 n/d 49.9 66.7 38.7 33.3 48.2 -14.9 -33.4 9.5 -1.731 Northside Preparatory K-2 n/a 52.0 n/a 53.7 n/a 68.7 15.0 16.732 Northwest Academy 6-12 n/a 71.1 n/a 48.8 n/a 75.9 27.1 4.833 Pansophia Academy K-12 n/a 47.4 13.3 48.6 25.0 65.3 -40.3 11.7 16.7 17.934 Renaissance PSA 5-8 n/a 63.6 n/a 63.7 n/a 73.4 9.7 9.835 Sankofa Shule Academy K-4 n/d 40.6 29.4 39.7 40.0 59.7 -19.7 10.6 20.0 19.1
36 Sauk Trail Academy K-8 n/d 56.3 n/d 48.7 41.2 78.1 -36.9 29.4 21.837 Sunrise Education Center K-6 n/d 69.2 50.0 45.7 60.0 84.5 -24.5 10.0 38.8 15.338 Threshold Academy K-3 n/a 66.1 n/a 66.7 n/a 70.4 3.7 4.339 Traverse Bay Comm. Sch. K-7 n/d 82.0 50.0 84.0 68.4 77.2 -8.8 18.4 -6.8 -4.840 Tri High School 7-12 n/a 81.8 n/a 62.3 n/a 86.4 24.1 4.641 TriValley Academy 5-10 n/a 45.1 n/a 49.7 4.5 64.4 -59.9 14.7 19.342 Vanderbilt Charter Acad. K-5 n/d 48.2 52.4 63.6 62.5 70.1 -7.6 10.1 6.5 21.943 Vanguard Charter Acad. K-5 n/d 80.6 51.1 81.8 72.9 76.7 -3.8 21.8 -5.1 -3.944 Vista Charter Academy K-5 n/d 70.2 26.7 55.5 52.3 71.8 -19.5 25.6 16.3 1.645 Walden Green Day Sch. K-8 n/d 68.9 n/d 71.9 n/d 88.3 16.4 19.446 Walker Charter Academy K-5 n/d 72.2 n/d 64.8 69.0 68.3 0.7 3.5 -3.947 Walter French Academy
of Business. & Tech.6-12 n/a 40.6 n/a 39.7 n/a 59.7 20.0 19.1
48 West Mich. Academyfor Arts & Academics
K-8 n/d 60.5 n/d 62.8 77.8 81.4 -3.6 18.6 20.9
49 West Mich. Academyfor Hospitality Sciences
9-12 n/a 49.9 n/a 38.7 n/a 48.2 9.5 -1.7
50 West Mich. Academy ofEnvironmental Science
K-9 44.1 72.2 47.4 64.8 70.6 68.3 2.3 23.2 3.5 26.5 -3.9
51 Windover High School 9-12 n/a 77.1 n/a 79.4 n/a 89.8 10.4 12.7State of Michigan 63.1 60.5 74.1 13.6 11.0
NOTE: Source of data is Michigan School Report. 'n/a' indicates not applicable; 'n/d' indicates no data submitted.
143
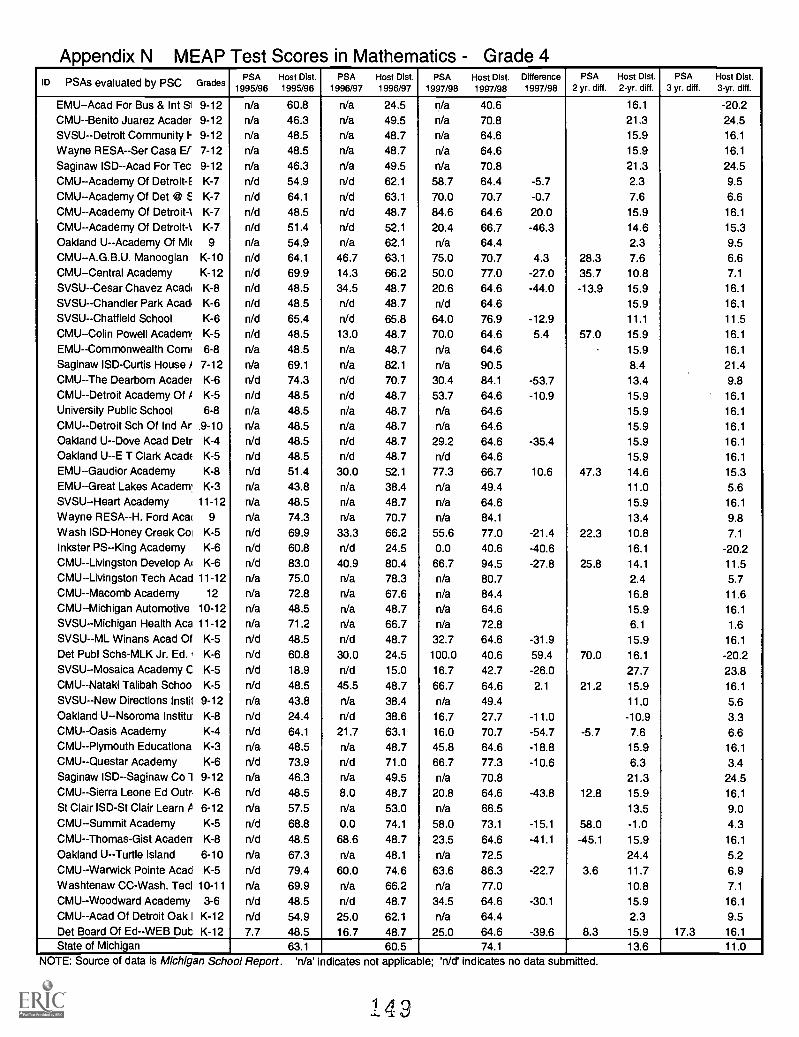
Appendix N MEAP Test Scores in Mathematics - Grade 4ID PSAs evaluated by PSC Grades
PSA1995/96
Host Dist.1995/96
PSA1996/97
Host Dist.1996/97
PSA1997/98
Host Dist.1997/98
reDifference1997/98
PSA2 yr. diff.
Host Dist.2-yr. diff.
PSA3 yr. diff.
Host Dist.3-yr. diff.
EMU--Acad For Bus & Int Si 9-12 n/a 60.8 n/a 24.5 n/a 40.6 16.1 -20.2CMU--Benito Juarez Acader 9-12 n/a 46.3 n/a 49.5 n/a 70.8 21.3 24.5SVSU-Detroit Community I- 9-12 n/a 48.5 n/a 48.7 n/a 64.6 15.9 16.1
Wayne RESA--Ser Casa ET 7-12 n/a 48.5 n/a 48.7 n/a 64.6 15.9 16.1
Saginaw ISD--Acad For Tec 9-12 n/a 46.3 n/a 49.5 n/a 70.8 21.3 24.5CMU--Academy Of Detroit-E K-7 n/d 54.9 n/d 62.1 58.7 64.4 -5.7 2.3 9.5
CMU--Academy Of Det @ E K-7 n/d 64.1 n/d 63.1 70.0 70.7 -0.7 7.6 6.6CMU--Academy Of Detroit-1 K-7 n/d 48.5 n/d 48.7 84.6 64.6 20.0 15.9 16.1
CMU-Academy Of Detroit-1 K-7 n/d 51.4 n/d 52.1 20.4 66.7 -46.3 14.6 15.3Oakland U--Academy Of Mk 9 n/a 54.9 n/a 62.1 n/a 64.4 2.3 9.5CMU--A.G.B.U. Manoogian K-10 n/d 64.1 46.7 63.1 75.0 70.7 4.3 28.3 7.6 6.6CM U--Central Academy K-12 n/d 69.9 14.3 66.2 50.0 77.0 -27.0 35.7 10.8 7.1
SVSU--Cesar Chavez Acadi K-8 n/d 48.5 34.5 48.7 20.6 64.6 -44.0 -13.9 15.9 16.1
SVSU--Chandler Park Acad. K-6 n/d 48.5 n/d 48.7 n/d 64.6 15.9 16.1
SVSU--Chatfield School K-6 n/d 65.4 n/d 65.8 64.0 76.9 -12.9 11.1 11.5CMU--Colin Powell Acadern: K-5 n/d 48.5 13.0 48.7 70.0 64.6 5.4 57.0 15.9 16.1
EMU -- Commonwealth Com 6-8 n/a 48.5 n/a 48.7 n/a 64.6 . 15.9 16.1
Saginaw ISD-Curtis House 1 7-12 n/a 69.1 n/a 82.1 n/a 90.5 8.4 21.4CMU--The Dearborn Acader K-6 n/d 74.3 n/d 70.7 30.4 84.1 -53.7 13.4 9.8CMU-Detroit Academy Of / K-5 n/d 48.5 n/d 48.7 53.7 64.6 -10.9 15.9 16.1
University Public School 6-8 n/a 48.5 n/a 48.7 n/a 64.6 15.9 16.1
CMU--Detroit Sch Of Ind Ar .9 -10 n/a 48.5 n/a 48.7 n/a 64.6 15.9 16.1
Oakland U--Dove Acad Detr K-4 n/d 48.5 n/d 48.7 29.2 64.6 -35.4 15.9 16.1
Oakland U--E T Clark Acadt K-5 n/d 48.5 n/d 48.7 n/d 64.6 15.9 16.1
EMU--Gaudior Academy K-8 n/d 51.4 30.0 52.1 77.3 66.7 10.6 47.3 14.6 15.3EMU--Great Lakes Academ: K-3 n/a 43.8 n/a 38.4 n/a 49.4 11.0 5.6SVSU--Heart Academy 11-12 n/a 48.5 n/a 48.7 n/a 64.6 15.9 16.1
Wayne RESA--H. Ford Acai 9 n/a 74.3 n/a 70.7 n/a 84.1 13.4 9.8Wash ISD-Honey Creek Col K-5 n/d 69.9 33.3 66.2 55.6 77.0 -21.4 22.3 10.8 7.1
Inkster PS--King Academy K-6 n/d 60.8 n/d 24.5 0.0 40.6 -40.6 16.1 -20.2CMU--Livingston Develop Ai K-6 n/d 83.0 40.9 80.4 66.7 94.5 -27.8 25.8 14.1 11.5CMU--Livingston Tech Acad 11-12 n/a 75.0 n/a 78.3 n/a 80.7 2.4 5.7CMU--Macomb Academy 12 n/a 72.8 n/a 67.6 n/a 84.4 16.8 11.6CMU--Michigan Automotive 10-12 n/a 48.5 n/a 48.7 n/a 64.6 15.9 16.1
SVSU--Michigan Health Aca 11-12 n/a 71.2 n/a 66.7 n/a 72.8 6.1 1.6SVSU--ML Winans Acad Of K-5 n/d 48.5 n/d 48.7 32.7 64.6 -31.9 15.9 16.1
Det Pub! Schs-MLK Jr. Ed. f K-6 n/d 60.8 30.0 24.5 100.0 40.6 59.4 70.0 16.1 -20.2SVSU--Mosaica Academy C K-5 n/d 18.9 n/d 15.0 16.7 42.7 -26.0 27.7 23.8CMU--Nataki Talibah Schoo K-5 n/d 48.5 45.5 48.7 66.7 64.6 2.1 21.2 15.9 16.1
SVSU--New Directions Instil 9-12 n/a 43.8 n/a 38.4 n/a 49.4 11.0 5.6Oakland U--Nsoroma Institu K-8 n/d 24.4 n/d 38.6 16.7 27.7 -11.0 -10.9 3.3CMU--Oasis Academy K-4 n/d 64.1 21.7 63.1 16.0 70.7 -54.7 -5.7 7.6 6.6CMU--Plymouth Educationa K-3 n/a 48.5 n/a 48/ 45.8 64.6 -18.8 15.9 16.1
CMU--Questar Academy K-6 n/d 73.9 n/d 71.0 66.7 77.3 -10.6 6.3 3.4Saginaw ISD--Saginaw Co 1 9-12 n/a 46.3 n/a 49.5 n/a 70.8 21.3 24.5CMU--Sierra Leone Ed Outr K-6 n/d 48.5 8.0 48.7 20.8 64.6 -43.8 12.8 15.9 16.1
St Clair ISD-St Clair Learn A 6-12 n/a 57.5 n/a 53.0 n/a 66.5 13.5 9.0CM U-Sum mit Academy K-5 n/d 68.8 0.0 74.1 58.0 73.1 -15.1 58.0 -1.0 4.3CMU--Thomas-Gist Acaderr K-8 n/d 48.5 68.6 48.7 23.5 64.6 -41.1 -45.1 15.9 16.1
Oakland U--Turtle Island 6-10 n/a 67.3 n/a 48.1 n/a 72.5 24.4 5.2CMU--Warwick Pointe Acad K-5 n/d 79.4 60.0 74.6 63.6 86.3 -22.7 3.6 11.7 6.9Washtenaw CC-Wash. Ted 10-11 n/a 69.9 n/a 66.2 n/a 77.0 10.8 7.1
CMU--Woodward Academy 3-6 n/d 48.5 n/d 48.7 34.5 64.6 -30.1 15.9 16.1
CMU--Acad Of Detroit Oak I K-12 n/d 54.9 25.0 62.1 n/a 64.4 2.3 9.5Det Board Of Ed--WEB Dub K-12 7.7 48.5 16.7 48.7 25.0 64.6 -39.6 8.3 15.9 17.3 16.1State of Michigan 63.1 60.5 74.1 13.6 11.0
NOTE: Source of data is Michigan School Report. 'n/a' indicates not applicable; 'n/d' indicates no data submitted.
1 4 3

Appendix N MEAP Test Scores in Mathematics - Grade 7Percentage of Students Achieving 'Satisfactory' Status. Comparisons of PSAs and Their Host Districts.
ID PSAs evaluated by WMU GradesPSA
1995/96Host Dist.1995/96
PSA1996/97
Host Dist.1996/97
PSA1997/98
Host Dist.1997/98
Difference1997/98
PSA2 yr. diff.
Host Dist.2-yr. diff.
PSA3 yr. diff.
Host Dist.3-yr. diff.
1 Acad. of Health and Sci. 11-12 n/a 65.0 n/a 60.9 100.0 74.1 25.9 13.2 9.1
2 Bahweting Anishnabe PSA K-7 n/d 45.3 6.7 34.6 50.0 62.3 -12.3 43.3 27.7 17.03 Bay-Arenac Comm. H.S. 9-12 n/a 75.5 n/a 67.4 n/a 72.5 5.1 -3.04 Black River Public School 6-10 n/d 52.3 53.7 52.6 64.5 66.2 -1.7 10.8 13.6 13.95 Casman Alternative 7-12 n/d 52.7 n/d 54.0 n/d 56.7 2.7 4.06 Concord Academy-Boyne K-11 n/d 31.8 71.4 52.0 87.5 70.8 16.7 16.1 18.8 39.07 Concord Acad.-Petoskey K-12 n/d 74.5 72.7 73.8 57.1 81.7 -24.6 -15.6 7.9 7.28 Countryside Charter Sch. K-8 n/d 13.8 n/d 8.7 30.0 14.3 15.7 5.6 0.59 Creative Learning Acad.
of Sci., Math.& Hum.K-6 n/a 43.8 n/a 39.4 n/a 50.0 10.6 6.2
10 Cross Creek Charter K-5 n/a 81.2 n/a 62.2 n/a 67.0 4.8 -14.211 da Vinci Institute 9-12 n/a 27.1 n/a 25.7 n/a 32.4 6.7 5.312 Discovery Elementary K-5 n/a 61.7 n/a 56.9 n/a 52.3 -4.6 -9.413 Eagles Crest Charter K-5 n/a 69.1 n/a 69.8 n/a 74.4 4.6 5.314 El-Hajj Malik EI-Shabazz K-8 n/a 34.1 n/a 31.0 n/a 41.5 10.5 7.415 Excel Charter Academy K-6 n/a 30.9 n/a 27.2 72.7 34.6 38.1 7.4 3.716 Gateway Middle High 7-9 n/d 30.9 n/d 27.2 43.5 34.6 8.9 7.4 3.717 Grattan Academy K-6 n/a 37.3 n/a 36.3 25.0 49.3 -24.3 13.0 12.018 Horizons Community H.S. 9-12 n/a 58.1 n/a 52.8 n/a 60.3 7.5 2.219 Island City Academy K-8 n/d 47.7 36.8 50.4 64.7 60.2 4.5 27.9 9.8 12.520 Knapp Charter Academy K-5 n/a 92.7 n/a 86.1 n/a 94.6 8.5 1.921 Lake Bluff Acad.
(Newland Academy)K-5 n/a 70.7 n/a 47.4 n/a 73.0 25.6 2.3
22 Lakeshore Public Acad. K-12 n/d 58.3 50.0 24.1 30.0 70.4 -40.4 -20.0 46.3 12.123 Learning Center Academy K-8 n/d 59.7 14.3 49.0 55.6 73.7 -18.1 41.3 24.7 14.024 Michigan Early Elementary K-3 n/a 34.1 n/a 31.0 n/a 41.5 10.5 7.425 Midland Acad. of Adv.
and Creative StudiesK-6 n/a 72.3 n/a 72.0 93.3 83.4 9.9 11.4 11.1
26 Mid-Michigan PSA K-5 n/a 34.1 n/a 31.0 21.4 41.5 -20.1 10.5 7.427 Morey Charter School K-6 n/a 69.3 n/a 56.1 n/a 63.6 7.5 -5.728 Nah Tah Wahsh PSA K-12 n/d 56.1 0.0 42.9 0.0 69.6 -69.6 0.0 26.7 13.529 New Branches School K-12 n/a 30.9 n/a 27.2 n/a 34.6 7.4 3.730 New School for Creative K-5 n/a 30.9 n/a 27.2 n/a 34.6 7.4 3.731 Northside Preparatory K-2 n/a 42.7 n/a 46.7 n/a 50.3 3.6 7.632 Northwest Academy 6-12 n/d 60.8 72.2 54.0 73.1 60.2 12.9 0.9 6.2 -0.633 Pansophia Academy K-12 n/a 54.5 30.0 55.6 28.6 64.9 -36.3 -1.4 9.3 10.434 Renaissance PSA 5-8 n/d 69.3 28.6 56.1 62.2 63.6 -1.4 33.6 7.5 -5.735 Sankofa Shule Academy K-4 n/a 34.1 n/a 31.0 55.0 41.5 13.5 10.5 7.436 Sauk Trail Academy K-8 n/d 50.0 n/d 47.1 27.3 60.8 -33.5 13.7 10.837 Sunrise Education Center K-6 n/a 61.8 n/a 67.4 n/a 78.5 11.1 16.738 Threshold Academy K-3 n/a 54.3 n/a 50.0 n/a 58.5 8.5 4.239 Traverse Bay Comm. Sch. K-7 n/d 61.3 58.8 63.7 47.6 79.2 -31.6 -11.2 15.5 17.940 Tri High School 7-12 n/d 68.2 n/d 83.7 n/d 87.5 3.8 19.341 TriValley Academy 5-10 10.8 26.7 2.0 31.7 7.0 37.3 -30.3 5.0 5.6 -3.8 10.642 Vanderbilt Charter Acad. K-5 n/a 52.3 n/a 52.6 n/a 66.2 13.6 13.943 Vanguard Charter Acad. K-5 n/a 58.1 n/a 52.8 n/a 60.3 7.5 2.244 Vista Charter Academy K-5 n/a 51.8 n/a 42.3 n/a 56.7 14.4 4.945 Walden Green Day Sch. K-8 n/d 52.8 n/d 55.2 n/d 73.1 17.9 20.346 Walker Charter Academy K-5 n/a 51.2 n/a 53.3 n/a 60.8 7.5 9.647 Walter French Academy
of Business. & Tech.6-12 n/d 34.1 13.4 31.0 27.9 41.5 -13.6 14.5 10.5 7.4
48 West Mich. Academyfor Arts & Academics
K-8 n/d 69.9 n/d 61.0 60.0 74.8 -14.8 13.8 4.9
49 West Mich. Academyfor Hospitality Sciences
9-12 n/a 30.9 n/a 27.2 n/a 34.6 7.4 3.7
50 West Mich. Academy ofEnvironmental Science
K-9 45.5 51.2 41.7 53.3 64.8 60.8 4.0 23.1 7.5 19.3 9.6
51 Windover High School 9-12 n/a 72.3 n/a 72.0 n/a 83.4 11.4 11.1
State of Michigan 55.0 51.4 61.4 10.0 6.4NOTE: Source of data is Michigan School Report. 'n/a' indicates not applicable; 'n/d' indicates no data submitted.
150
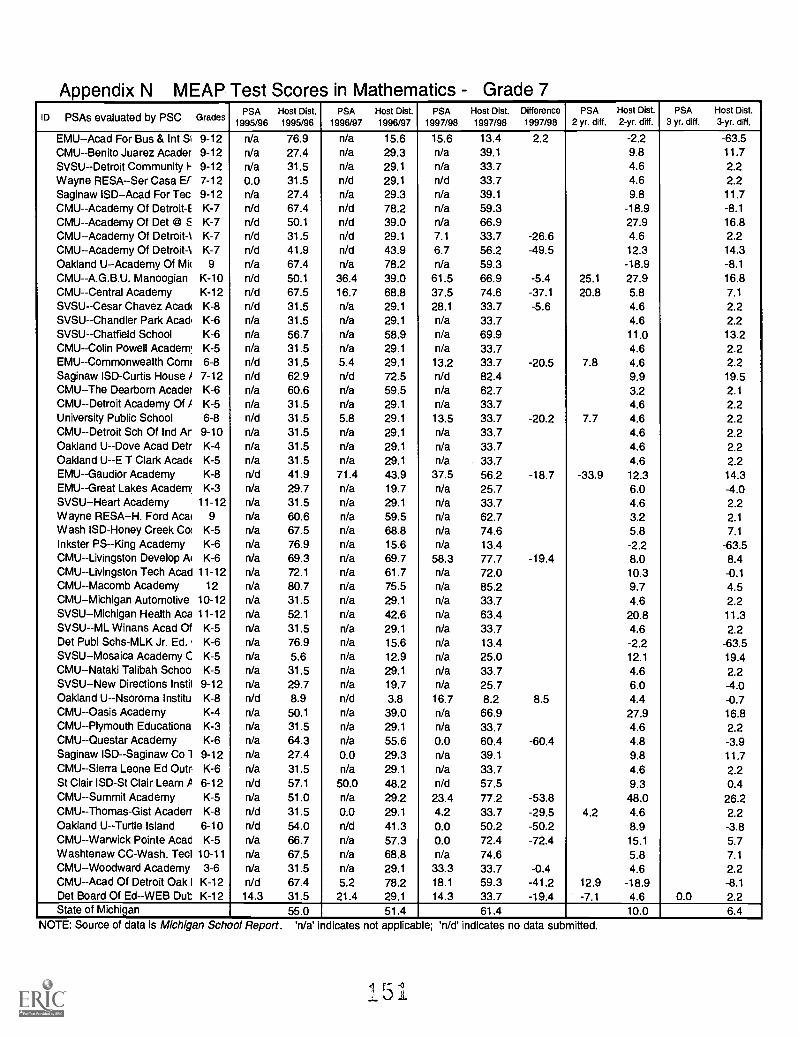
Appendix N MEAP Test Scores in Mathematics Grade 7ID PSAs evaluated by PSC Grades
PSA1995/96
Host Dist.1995/96
PSA1996/97
Host Dist.1996/97
PSA1997/98
Host Dist.1997/98
Difference1997/98
PSA2 yr. diff.
Host Dist.2-yr. diff.
PSA3 yr. diff.
Host Dist.3-yr. diff.
EMU--Acad For Bus & Int Si 9-12 n/a 76.9 n/a 15.6 15.6 13.4 2.2 -2.2 -63.5CMU--Benito Juarez Acader 9-12 n/a 27.4 n/a 29.3 n/a 39.1 9.8 11.7SVSU-Detroit Community F 9-12 n/a 31.5 n/a 29.1 n/a 33.7 4.6 2.2Wayne RESA--Ser Casa ET 7-12 0.0 31.5 n/d 29.1 n/d 33.7 4.6 2.2Saginaw ISD--Acad For Tec 9-12 n/a 27.4 n/a 29.3 n/a 39.1 9.8 11.7CMU--Academy Of Detroit-E K-7 n/d 67.4 n/d 78.2 n/a 59.3 -18.9 -8.1
CMU--Academy Of Det @ E K-7 n/d 50.1 n/d 39.0 n/a 66.9 27.9 16.8CMU--Academy Of Detroit -\ K-7 n/d 31.5 n/d 29.1 7.1 33.7 -26.6 4.6 2.2CMU--Academy Of Detroit-% K-7 n/d 41.9 n/d 43.9 6.7 56.2 -49.5 12.3 14.3Oakland U--Academy Of Mir 9 n/a 67.4 n/a 78.2 n/a 59.3 -18.9 -8.1CMU--A.G.B.U. Manoogian K-10 n/d 50.1 36.4 39.0 61.5 66.9 -5.4 25.1 27.9 16.8CMU--Central Academy K-12 n/d 67.5 16.7 68.8 37.5 74.6 -37.1 20.8 5.8 7.1
SVSU-Cesar Chavez Acadi K-8 n/d 31.5 n/a 29.1 28.1 33.7 -5.6 4.6 2.2SVSU--Chandler Park Acad, K-6 n/a 31.5 n/a 29.1 n/a 33.7 4.6 2.2SVSU--Chatfield School K-6 n/a 56.7 n/a 58.9 n/a 69.9 11.0 13.2CMU--Colin Powell Academ' K-5 n/a 31.5 n/a 29.1 n/a 33.7 4.6 2.2EMU--Commonwealth Corm 6-8 n/d 31.5 5.4 29.1 13.2 33.7 -20.5 7.8 4.6 2.2Saginaw ISD-Curtis House ) 7-12 n/d 62.9 n/d 72.5 n/d 82.4 9.9 19.5CMU--The Dearborn Acader K-6 n/a 60.6 n/a 59.5 n/a 62.7 3.2 2.1CMU--Detroit Academy Of / K-5 n/a 31.5 n/a 29.1 n/a 33.7 4.6 2.2University Public School 6-8 n/d 31.5 5.8 29.1 13.5 33.7 -20.2 7.7 4.6 2.2CMU--Detroit Sch Of Ind Ar 9-10 n/a 31.5 n/a 29.1 n/a 33.7 4.6 2.2Oakland U--Dove Acad Detr K-4 n/a 31.5 n/a 29.1 n/a 33.7 4.6 2.2Oakland U--E T Clark AcadE K-5 n/a 31.5 n/a 29.1 n/a 33.7 4.6 2.2EMU--Gaudior Academy K-8 n/d 41.9 71.4 43.9 37.5 56.2 -18.7 -33.9 12.3 14.3EMU -Great Lakes Academ' K-3 n/a 29.7 n/a 19.7 n/a 25.7 6.0 -4.0SVSU--Heart Academy 11-12 n/a 31.5 n/a 29.1 n/a 33.7 4.6 2.2Wayne RESA--H. Ford Aca 9 n/a 60.6 n/a 59.5 n/a 62.7 3.2 2.1Wash ISD-Honey Creek Col K-5 n/a 67.5 n/a 68.8 n/a 74.6 5.8 7.1Inkster PS--King Academy K-6 n/a 76.9 n/a 15.6 n/a 13.4 -2.2 -63.5CMU--Livingston Develop Ai K-6 n/a 69.3 n/a 69.7 58.3 77.7 -19.4 8.0 8.4CMU--Livingston Tech Acad 11-12 n/a 72.1 n/a 61.7 n/a 72.0 10.3 -0.1CMU--Macomb Academy 12 n/a 80.7 n/a 75.5 n/a 85.2 9.7 4.5CMU--Michigan Automotive 10-12 n/a 31.5 n/a 29.1 n/a 33.7 4.6 2.2SVSU--Michigan Health Aca 11-12 n/a 52.1 n/a 42.6 n/a 63.4 20.8 11.3SVSU--ML Winans Acad Of K-5 n/a 31.5 n/a 29.1 n/a 33.7 4.6 2.2Det Publ Schs-MLK Jr. Ed. I K-6 n/a 76.9 n/a 15.6 n/a 13.4 -2.2 -63.5SVSU--Mosaica Academy C K-5 n/a 5.6 n/a 12.9 n/a 25.0 12.1 19.4CMU--Nataki Talibah Schoo K-5 n/a 31.5 n/a 29.1 n/a 33.7 4.6 2.2SVSU--New Directions Instil 9-12 n/a 29.7 n/a 19.7 n/a 25.7 6.0 -4.0Oakland U--Nsoroma Institu K-8 n/d 8.9 n/d 3.8 16.7 8.2 8.5 4.4 -0.7CMU--Oasis Academy K-4 n/a 50.1 n/a 39.0 n/a 66.9 27.9 16.8CMU--Plymouth Educationa K-3 n/a 31.5 n/a 29.1 n/a 33.7 4.6 2.2CMU--Questar Academy K-6 n/a 64.3 n/a 55.6 0.0 60.4 -60.4 4.8 -3.9Saginaw ISD--Saginaw Co 1 9-12 n/a 27.4 0.0 29.3 n/a 39.1 9.8 11.7CMU--Sierra Leone Ed Outr K-6 n/a 31.5 n/a 29.1 n/a 33.7 4.6 2.2St Clair ISD-St Clair Learn P 6-12 n/d 57.1 50.0 48.2 n/d 57.5 9.3 0.4CMU--Summit Academy K-5 n/a 51.0 n/a 29.2 23.4 77.2 -53.8 48.0 26.2CMU--Thomas-Gist Acaden K-8 n/d 31.5 0.0 29.1 4.2 33.7 -29.5 4.2 4.6 2.2Oakland U- -Turtle Island 6-10 n/d 54.0 n/d 41.3 0.0 50.2 -50.2 8.9 -3.8CMU--Warwick Pointe Acad K-5 n/a 66.7 n/a 57.3 0.0 72.4 -72.4 15.1 5.7Washtenaw CC-Wash. Ted 10-11 n/a 67.5 n/a 68.8 n/a 74.6 5.8 7.1CMU--Woodward Academy 3-6 n/a 31.5 n/a 29.1 33.3 33.7 -0.4 4.6 2.2CMU--Acad Of Detroit Oak I K-12 rVd 67.4 5.2 78.2 18.1 59.3 -41.2 12.9 -18.9 -8.1Det Board Of Ed--WEB Dub K-12 14.3 31.5 21.4 29.1 14.3 33.7 -19.4 -7.1 4.6 0.0 2.2State of Michigan 55.0 51.4 61.4 10.0 6.4
NOTE: Source of data is Michigan School Report. 'n/a' indicates not applicable; 'n/d' indicates no data submitted.
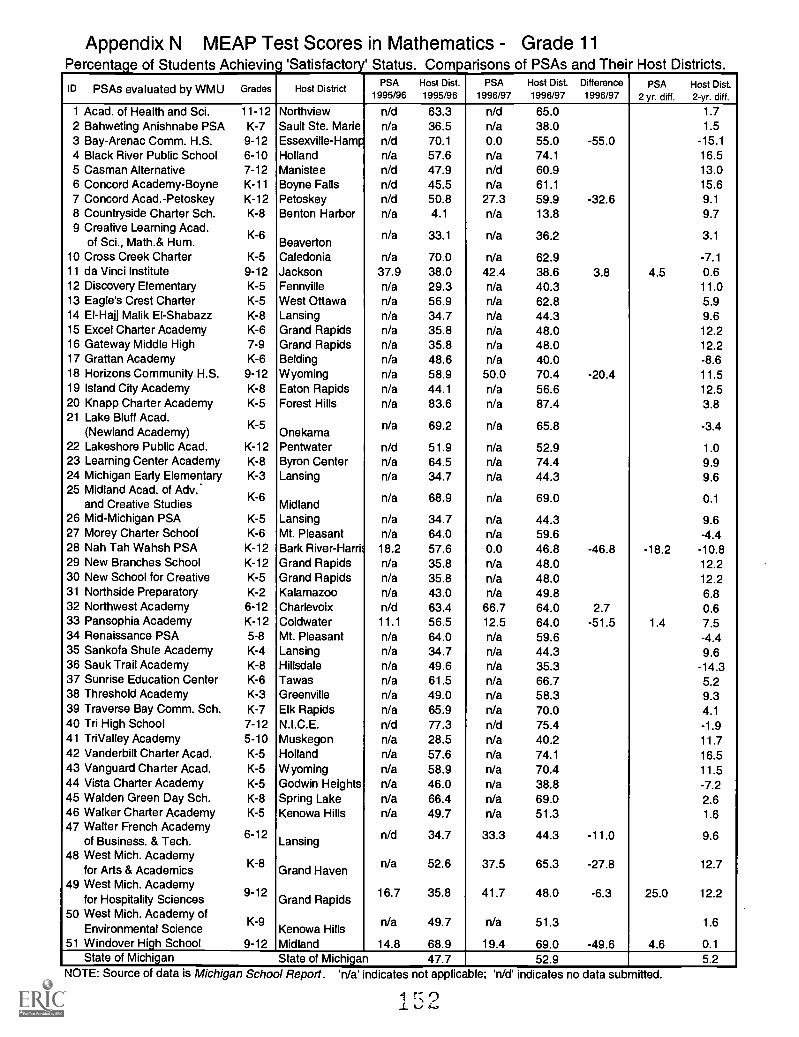
Appendix N MEAP Test Scores in Mathematics Grade 11Percentage of Students Achieving 'Satisfactory' Status. Comparisons of PSAs and Their Host Districts.
ID PSAs evaluated by WMU Grades Host DistrictPSA
1995/96Host Dist.1995/96
PSA1996/97
Host Dist.1996/97
Difference1996/97
PSA2 yr. diff.
Host Dist.2-yr. diff.
1 Acad. of Health and Sci. 11-12 Northview n/d 63.3 n/d 65.0 1.72 Bahweting Anishnabe PSA K-7 Sault Ste. Marie n/a 36.5 n/a 38.0 1.53 Bay-Arenac Comm. H.S. 9-12 Essexville-Hamp n/d 70.1 0.0 55.0 -55.0 -15.14 Black River Public School 6-10 Holland n/a 57.6 n/a 74.1 16.55 Casman Alternative 7-12 Manistee n/d 47.9 n/d 60.9 13.06 Concord Academy-Boyne K-11 Boyne Falls n/d 45.5 n/a 61.1 15.67 Concord Acad.-Petoskey K-12 Petoskey n/d 50.8 27.3 59.9 -32.6 9.18 Countryside Charter Sch. K-8 Benton Harbor n/a 4.1 n/a 13.8 9.79 Creative Learning Acad.
of Sci., Math.& Hum.K-6
Beavertonn/a 33.1 Na 36.2 3.1
10 Cross Creek Charter K-5 Caledonia n/a 70.0 n/a 62.9 -7.111 da Vinci Institute 9-12 Jackson 37.9 38.0 42.4 38.6 3.8 4.5 0.612 Discovery Elementary K-5 Fennville n/a 29.3 n/a 40.3 11.013 Eagle's Crest Charter K-5 West Ottawa n/a 56.9 n/a 62.8 5.914 El-Hajj Malik EI-Shabazz K-8 Lansing n/a 34.7 n/a 44.3 9.615 Excel Charter Academy K-6 Grand Rapids n/a 35.8 n/a 48.0 12.216 Gateway Middle High 7-9 Grand Rapids n/a 35.8 n/a 48.0 12.217 Grattan Academy K-6 Belding n/a 48.6 n/a 40.0 -8.618 Horizons Community H.S. 9-12 Wyoming n/a 58.9 50.0 70.4 -20.4 11.519 Island City Academy K-8 Eaton Rapids n/a 44.1 n/a 56.6 12.520 Knapp Charter Academy K-5 Forest Hills n/a 83.6 n/a 87.4 3.821 Lake Bluff Acad.
(Newland Academy)K-5
Onekaman/a 69.2 n/a 65.8 -3.4
22 Lakeshore Public Acad. K-12 Pentwater n/d 51.9 n/a 52.9 1.023 Learning Center Academy K-8 Byron Center n/a 64.5 n/a 74.4 9.924 Michigan Early Elementary K-3 Lansing n/a 34.7 n/a 44.3 9.625 Midland Acad. of Adv.
and Creative Studies K-6Midland n/a 68.9 n/a 69.0 0.1
26 Mid-Michigan PSA K-5 Lansing n/a 34.7 n/a 44.3 9.627 Morey Charter School K-6 Mt. Pleasant n/a 64.0 n/a 59.6 -4.428 Nah Tah Wahsh PSA K-12 Bark River - Harris 18.2 57.6 0.0 46.8 -46.8 -18.2 -10.829 New Branches School K-12 Grand Rapids n/a 35.8 n/a 48.0 12.230 New School for Creative K-5 Grand Rapids n/a 35.8 n/a 48.0 12.231 Northside Preparatory K-2 Kalamazoo n/a 43.0 n/a 49.8 6.832 Northwest Academy 6-12 Charlevoix n/d 63.4 66.7 64.0 2.7 0.633 Pansophia Academy K-12 Coldwater 11.1 56.5 12.5 64.0 -51.5 1.4 7.534 Renaissance PSA 5-8 Mt. Pleasant n/a 64.0 n/a 59.6 -4.435 Sankofa Shule Academy K-4 Lansing n/a 34.7 n/a 44.3 9.636 Sauk Trail Academy K-8 Hillsdale n/a 49.6 n/a 35.3 -14.337 Sunrise Education Center K-6 Tawas n/a 61.5 n/a 66.7 5.238 Threshold Academy K-3 Greenville n/a 49.0 n/a 58.3 9.339 Traverse Bay Comm. Sch. K-7 Elk Rapids n/a 65.9 n/a 70.0 4.140 Tri High School 7-12 N.I.C.E. n/d 77.3 n/d 75.4 -1.941 TriValley Academy 5-10 Muskegon n/a 28.5 n/a 40.2 11.742 Vanderbilt Charter Acad. K-5 Holland n/a 57.6 n/a 74.1 16.543 Vanguard Charter Acad. K-5 Wyoming n/a 58.9 n/a 70.4 11.544 Vista Charter Academy K-5 Godwin Heights n/a 46.0 n/a 38.8 -7.245 Walden Green Day Sch. K-8 Spring Lake n/a 66.4 n/a 69.0 2.646 Walker Charter Academy K-5 Kenowa Hills n/a 49.7 n/a 51.3 1.647 Walter French Academy
of Business. & Tech.6-12
Lansing n/d 34.7 33.3 44.3 -11.0 9.6
48 West Mich. Academyfor Arts & Academics
K-8Grand Haven Na 52.6 37.5 65.3 -27.8 12.7
49 West Mich. Academyfor Hospitality Sciences
9-12Grand Rapids
16.7 35.8 41.7 48.0 -6.3 25.0 12.2
50 West Mich. Academy ofEnvironmental Science
K-9Kenowa Hills
Na 49.7 Na 51.3 1.6
51 Windover High School 9-12 Midland 14.8 68.9 19.4 69.0 -49.6 4.6 0.1State of Michigan State of Michigan 47.7 52.9 5.2
NOTE: Source of data is Michigan School Report. 'n/a' indicates not applicable; 'n/d' indicates no data submitted.
';7.Jtd
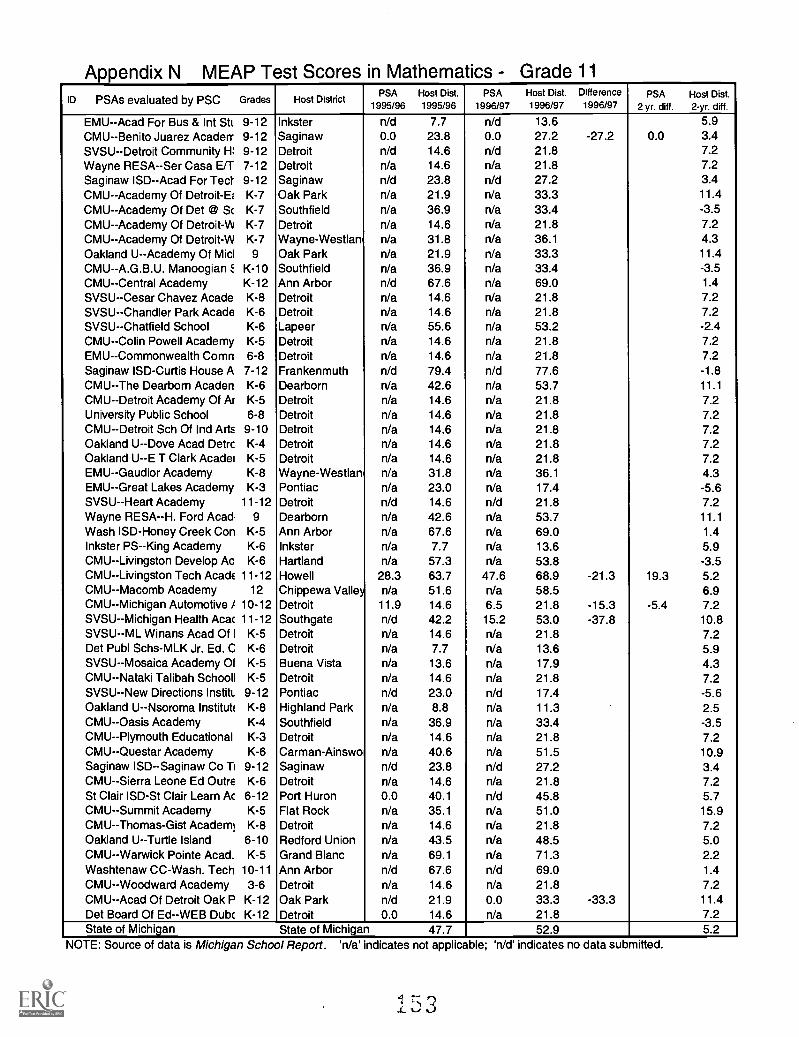
Appendix N MEAP Test Scores in Mathematics - Grade 11ID PSAs evaluated by PSC Grades Host District
PSA1995/96
Host Dist.1995/96
PSA1996/97
Host Dist.1996/97
Difference1996/97
PSA2 yr. diff.
Host Dist.2-yr. diff.
EMU--Acad For Bus & Int StL 9-12 Inkster n/d 7.7 n/d 13.6 5.9CMU--Benito Juarez Acaderr 9-12 Saginaw 0.0 23.8 0.0 27.2 -27.2 0.0 3.4SVSU--Detroit Community R 9-12 Detroit n/d 14.6 n/d 21.8 7.2Wayne RESA--Ser Casa E/T 7-12 Detroit n/a 14.6 n/a 21.8 7.2Saginaw ISD--Acad For Ted. 9-12 Saginaw n/d 23.8 n/d 27.2 3.4CMU--Academy Of Detroit-El K-7 Oak Park n/a 21.9 n/a 33.3 11.4CMU--Academy Of Det @ Sc K-7 Southfield n/a 36.9 n/a 33.4 -3.5CMU--Academy Of Detroit-W K-7 Detroit n/a 14.6 n/a 21.8 7.2CMU--Academy Of Detroit-W K-7 Wayne-Westlan n/a 31.8 n/a 36.1 4.3Oakland U--Academy Of Mid 9 Oak Park n/a 21.9 n/a 33.3 11.4CMU--A.G.B.U. Manoogian E. K-10 Southfield n/a 36.9 n/a 33.4 -3.5CMU--Central Academy K-12 Ann Arbor n/d 67.6 n/a 69.0 1.4SVSU--Cesar Chavez Acade K-8 Detroit n/a 14.6 n/a 21.8 7.2SVSU-Chandler Park Acade K-6 Detroit n/a 14.6 n/a 21.8 7.2SVSU--Chatfield School K-6 Lapeer n/a 55.6 n/a 53.2 -2.4CMU--Colin Powell Academy K-5 Detroit n/a 14.6 n/a 21.8 7.2EMU--Commonwealth Coma 6-8 Detroit n/a 14.6 n/a 21.8 7.2Saginaw ISD-Curtis House A 7-12 Frankenmuth n/d 79.4 n/d 77.6 -1.8CMU--The Dearborn Acaden K-6 Dearborn n/a 42.6 n/a 53.7 11.1CMU-Detroit Academy Of Ar K-5 Detroit n/a 14.6 n/a 21.8 7.2University Public School 6-8 Detroit n/a 14.6 n/a 21.8 7.2CMU--Detroit Sch Of Ind Arts 9-10 Detroit n/a 14.6 n/a 21.8 7.2Oakland U--Dove Acad Detrc K-4 Detroit n/a 14.6 n/a 21.8 7.2Oakland U--E T Clark Acadei K-5 Detroit n/a 14.6 n/a 21.8 7.2EMU--Gaudior Academy K-8 Wayne-Westlan n/a 31.8 n/a 36.1 4.3EMU--Great Lakes Academy K-3 Pontiac n/a 23.0 n/a 17.4 -5.6SVSU - -Heart Academy 11-12 Detroit n/d 14.6 n/d 21.8 7.2Wayne RESA--H. Ford Acad 9 Dearborn n/a 42.6 n/a 53.7 11.1Wash ISD-Honey Creek Con K-5 Ann Arbor n/a 67.6 n/a 69.0 1.4Inkster PS--King Academy K-6 Inkster n/a 7.7 n/a 13.6 5.9CMU--Livingston Develop Ac K-6 Hartland n/a 57.3 n/a 53.8 -3.5CMU--Livingston Tech Acade 11-12 Howell 28.3 63.7 47.6 68.9 -21.3 19.3 5.2CMU--Macomb Academy 12 Chippewa Valley n/a 51.6 n/a 58.5 6.9CMU-Michigan Automotive i 10-12 Detroit 11.9 14.6 6.5 21.8 -15.3 -5.4 7.2SVSU--Michigan Health Acac 11-12 Southgate n/d 42.2 15.2 53.0 -37.8 10.8SVSU--ML Winans Acad Of I K-5 Detroit n/a 14.6 n/a 21.8 7.2Det Publ Schs-MLK Jr. Ed. C K-6 Detroit n/a 7.7 n/a 13.6 5.9SVSU--Mosaica Academy 01 K-5 Buena Vista n/a 13.6 n/a 17.9 4.3CMU--Nataki Talibah School] K-5 Detroit n/a 14.6 n/a 21.8 7.2SVSU--New Directions Instit 9-12 Pontiac n/d 23.0 n/d 17.4 -5.6Oakland U--Nsoroma Institute K-8 Highland Park n/a 8.8 n/a 11.3 2.5CMU--Oasis Academy K-4 Southfield n/a 36.9 n/a 33.4 -3.5CMU--Plymouth Educational K-3 Detroit n/a 14.6 n/a 21.8 7.2CMU--Questar Academy K-6 Carman-Ainswo n/a 40.6 n/a 51.5 10.9Saginaw ISD-Saginaw Co Ti 9-12 Saginaw n/d 23.8 n/d 27.2 3.4CMU--Sierra Leone Ed Outre K-6 Detroit n/a 14.6 n/a 21.8 7.2St Clair ISD-St Clair Learn Ac 6-12 Port Huron 0.0 40.1 n/d 45.8 5.7CMU--Summit Academy K-5 Flat Rock n/a 35.1 n/a 51.0 15.9CMU--Thomas-Gist Academy K-8 Detroit n/a 14.6 n/a 21.8 7.2Oakland U--Turtle Island 6-10 Redford Union n/a 43.5 n/a 48.5 5.0CMU--Warwick Pointe Acad. K-5 Grand Blanc n/a 69.1 n/a 71.3 2.2Washtenaw CC-Wash. Tech 10-11 Ann Arbor n/d 67.6 n/d 69.0 1.4CMU--Woodward Academy 3-6 Detroit n/a 14.6 n/a 21.8 7.2CMU--Acad Of Detroit Oak P K-12 Oak Park n/d 21.9 0.0 33.3 -33.3 11.4Det Board Of Ed--WEB Dubc K-12 Detroit 0.0 14.6 n/a 21.8 7.2State of Michigan State of Michigan 47.7 52.9 5.2
NOTE: Source of data is Michigan School Report. 'n/a' indicates not applicable; 'n/d' indicates no data submitted.
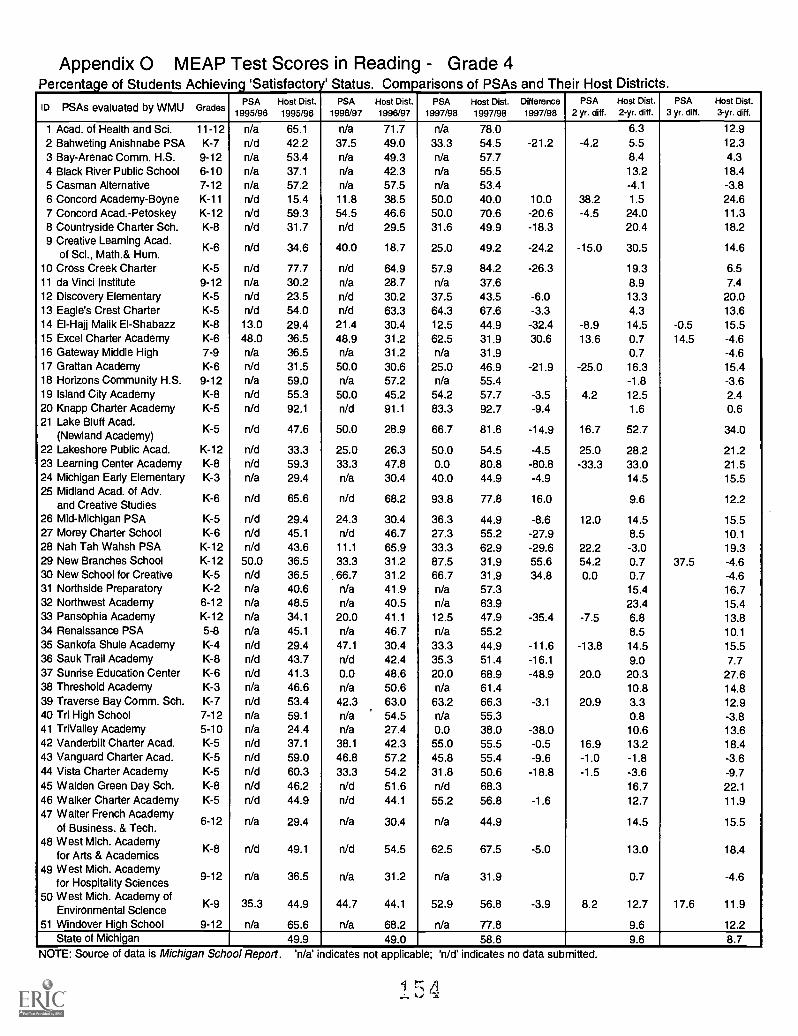
Appendix 0 MEAP Test Scores in Reading Grade 4Percentage of Students Achieving 'Satisfactory' Status. Comparisons of PSAs and Their Host Districts.
ID PSAs evaluated by WMU GradesPSA
1995/96Host Dist.1995/96
PSA1996/97
Host Dist.1996/97
PSA1997/98
Host Dist.1997/98
reDifference1997/98
PSA2 yr. diff.
Host Dist.2-yr. diff.
PSA3 yr. diff.
Host Dist.3-yr. diff.
1 Acad. of Health and Sci. 11-12 n/a 65.1 n/a 71.7 n/a 78.0 6.3 12.92 Bahweting Anishnabe PSA K-7 n/d 42.2 37.5 49.0 33.3 54.5 -21.2 -4.2 5.5 12.33 Bay-Arenac Comm. H.S. 9-12 n/a 53.4 n/a 49.3 n/a 57.7 8.4 4.34 Black River Public School 6-10 n/a 37.1 n/a 42.3 n/a 55.5 13.2 18.45 Casman Alternative 7-12 n/a 57.2 n/a 57.5 n/a 53.4 -4.1 -3.86 Concord Academy-Boyne K-11 n/d 15.4 11.8 38.5 50.0 40.0 10.0 38.2 1.5 24.67 Concord Acad.-Petoskey K-12 n/d 59.3 54.5 46.6 50.0 70.6 -20.6 -4.5 24.0 11.38 Countryside Charter Sch. K-8 n/d 31.7 n/d 29.5 31.6 49.9 -18.3 20.4 18.29 Creative Learning Acad.
of Sci., Math.& Hum.K-6 n/d 34.6 40.0 18.7 25.0 49.2 -24.2 -15.0 30.5 14.6
10 Cross Creek Charter K-5 n/d 77.7 n/d 64.9 57.9 84.2 -26.3 19.3 6.511 da Vinci Institute 9-12 n/a 30.2 n/a 28.7 n/a 37.6 8.9 7.412 Discovery Elementary K-5 n/d 23.5 n/d 30.2 37.5 43.5 -6.0 13.3 20.013 Eagles Crest Charter K-5 n/d 54.0 n/d 63.3 64.3 67.6 -3.3 4.3 13.614 El-Hajj Malik EI-Shabazz K-8 13.0 29.4 21.4 30.4 12.5 44.9 -32.4 -8.9 14.5 -0.5 15.515 Excel Charter Academy K-6 48.0 36.5 48.9 31.2 62.5 31.9 30.6 13.6 0.7 14.5 -4.616 Gateway Middle High 7-9 n/a 36.5 n/a 31.2 n/a 31.9 0.7 -4.617 Grattan Academy K-6 n/d 31.5 50.0 30.6 25.0 46.9 -21.9 -25.0 16.3 15.418 Horizons Community H.S. 9-12 n/a 59.0 n/a 57.2 n/a 55.4 -1.8 -3.619 Island City Academy K-8 n/d 55.3 50.0 45.2 54.2 57.7 -3.5 4.2 12.5 2.420 Knapp Charter Academy K-5 n/d 92.1 n/d 91.1 83.3 92.7 -9.4 1.6 0.621 Lake Bluff Acad.
(Newland Academy)K-5 n/d 47.6 50.0 28.9 66.7 81.6 -14.9 16.7 52.7 34.0
22 Lakeshore Public Acad. K-12 n/d 33.3 25.0 26.3 50.0 54.5 -4.5 25.0 28.2 21.223 Learning Center Academy K-8 n/d 59.3 33.3 47.8 0.0 80.8 -80.8 -33.3 33.0 21.524 Michigan Early Elementary K-3 n/a 29.4 n/a 30.4 40.0 44.9 -4.9 14.5 15.525 Midland Acad. of Adv.
and Creative StudiesK-6 n/d 65.6 n/d 68.2 93.8 77.8 16.0 9.6 12.2
26 Mid-Michigan PSA K-5 n/d 29.4 24.3 30.4 36.3 44.9 -8.6 12.0 14.5 15.527 Morey Charter School K-6 n/d 45.1 n/d 46.7 27.3 55.2 -27.9 8.5 10.128 Nah Tah Wahsh PSA K-12 n/d 43.6 11.1 65.9 33.3 62.9 -29.6 22.2 -3.0 19.329 New Branches School K-12 50.0 36.5 33.3 31.2 87.5 31.9 55.6 54.2 0.7 37.5 -4.630 New School for Creative K-5 n/d 36.5 66.7 31.2 66.7 31.9 34.8 0.0 0.7 -4.631 Northside Preparatory K-2 n/a 40.6 n/a 41.9 n/a 57.3 15.4 16.732 Northwest Academy 6-12 n/a 48.5 n/a 40.5 n/a 63.9 23.4 15.433 Pansophia Academy K-12 n/a 34.1 20.0 41.1 12.5 47.9 -35.4 -7.5 6.8 13.834 Renaissance PSA 5-8 n/a 45.1 n/a 46.7 n/a 55.2 8.5 10.135 Sankofa Shule Academy K-4 n/d 29.4 47.1 30.4 33.3 44.9 -11.6 -13.8 14.5 15.536 Sauk Trail Academy K-8 n/d 43.7 n/d 42.4 35.3 51.4 -16.1 9.0 7.737 Sunrise Education Center K-6 n/d 41.3 0.0 48.6 20.0 68.9 -48.9 20.0 20.3 27.638 Threshold Academy K-3 n/a 46.6 n/a 50.6 n/a 61.4 10.8 14.839 Traverse Bay Comm. Sch. K-7 n/d 53.4 42.3 63.0 63.2 66.3 -3.1 20.9 3.3 12.940 Tri High School 7-12 n/a 59.1 n/a 54.5 n/a 55.3 0.8 -3.841 TriValley Academy 5-10 n/a 24.4 n/a 27.4 0.0 38.0 -38.0 10.6 13.642 Vanderbilt Charter Acad. K-5 n/d 37.1 38.1 42.3 55.0 55.5 -0.5 16.9 13.2 18.443 Vanguard Charter Acad. K-5 n/d 59.0 46.8 57.2 45.8 55.4 -9.6 -1.0 -1.8 -3.644 Vista Charter Academy K-5 n/d 60.3 33.3 54.2 31.8 50.6 -18.8 -1.5 -3.6 -9.745 Walden Green Day Sch. K-8 n/d 46.2 n/d 51.6 n/d 68.3 16.7 22.146 Walker Charter Academy K-5 n/d 44.9 n/d 44.1 55.2 56.8 -1.6 12.7 11.947 Walter French Academy
of Business. & Tech.6-12 n/a 29.4 n/a 30.4 n/a 44.9 14.5 15.5
48 West Mich. Academyfor Arts & Academics
K-8 n/d 49.1 n/d 54.5 62.5 67.5 -5.0 13.0 18.4
49 West Mich. Academyfor Hospitality Sciences
9-12 n/a 36.5 n/a 31.2 n/a 31.9 0.7 -4.6
50 West Mich. Academy ofEnvironmental Science
K-9 35.3 44.9 44.7 44.1 52.9 56.8 -3.9 8.2 12.7 17.6 11.9
51 Windover High School 9-12 n/a 65.6 n/a 68.2 n/a 77.8 9.6 12.2State of Michigan 49.9 49.0 58.6 9.6 8.7
NOTE: Source of data is Michigan School Report. 'n/a' indicates not applicable; 'n/d' indicates no data submitted.
r; A711.
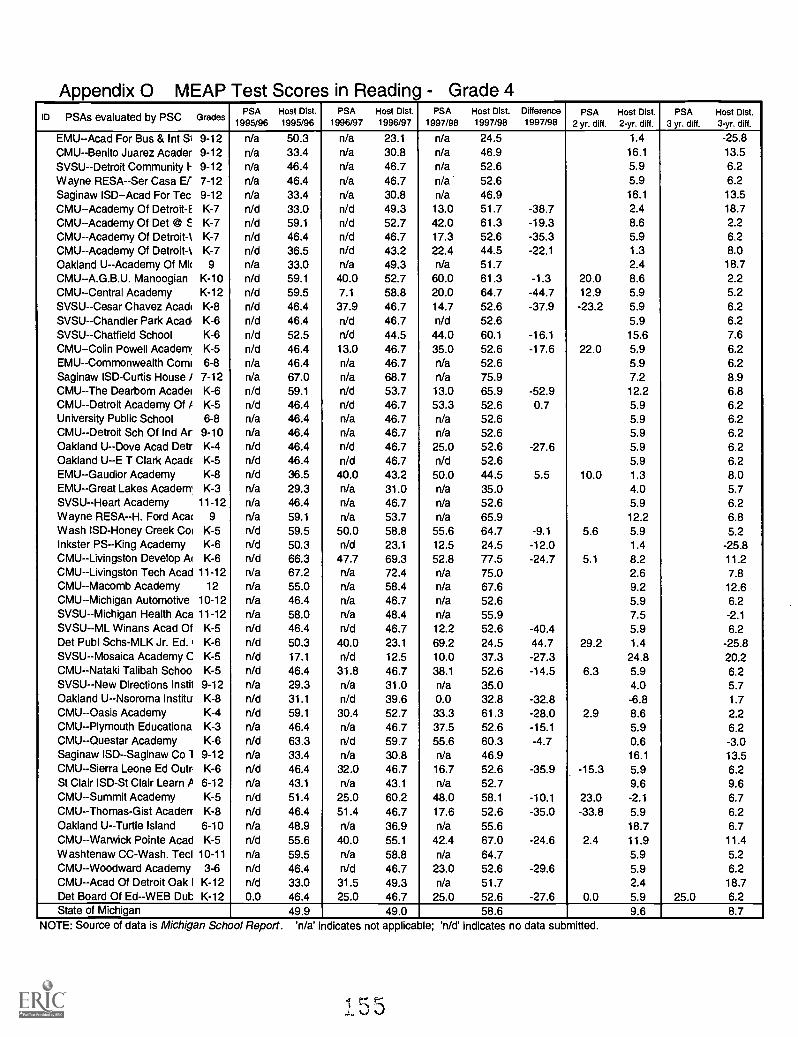
Appendix 0 MEAP Test Scores in Reading - Grade 4ID PSAs evaluated by PSC Grades
PSA1995/96
Host Dist.1995/96
PSA1996/97
Host Dist.1996/97
PSA1997/98
Host Dist.1997/98
Difference1997/98
PSA2 yr. diff.
Host Dist.2-yr. diff.
PSA3 yr. dill.
Host Dist.3-yr. diff.
EMU--Acad For Bus & Int Si 9-12 n/a 50.3 n/a 23.1 n/a 24.5 1.4 -25.8CMU--Benito Juarez Acader 9-12 n/a 33.4 n/a 30.8 n/a 46.9 16.1 13.5
SVSU -- Detroit Community I- 9-12 n/a 46.4 n/a 46.7 n/a 52.6 5.9 6.2Wayne RESA--Ser Casa ET 7-12 n/a 46.4 n/a 46.7 n/a 52.6 5.9 6.2Saginaw ISD--Acad For Tec 9-12 n/a 33.4 n/a 30.8 n/a 46.9 16.1 13.5CMU--Academy Of Detroit-E K-7 n/d 33.0 n/d 49.3 13.0 51.7 -38.7 2.4 18.7CMU--Academy Of Det @ E K-7 n/d 59.1 n/d 52.7 42.0 61.3 -19.3 8.6 2.2CMU--Academy Of Detroit -\ K-7 n/d 46.4 n/d 46.7 17.3 52.6 -35.3 5.9 6.2CMU--Academy Of Detroit -\ K-7 n/d 36.5 n/d 43.2 22.4 44.5 -22.1 1.3 8.0Oakland U--Academy Of Mic 9 n/a 33.0 n/a 49.3 n/a 51.7 2.4 18.7CMU--A.G.B.U. Manoogian K-10 n/d 59.1 40.0 52.7 60.0 61.3 -1.3 20.0 8.6 2.2CM U--Central Academy K-12 n/d 59.5 7.1 58.8 20.0 64.7 -44.7 12.9 5.9 5.2SVSU--Cesar Chavez Acad( K-8 n/d 46.4 37.9 46.7 14.7 52.6 -37.9 -23.2 5.9 6.2SVSU -- Chandler Park Acad. K-6 n/d 46.4 n/d 46.7 n/d 52.6 5.9 6.2SVSU -- Chatfield School K-6 n/d 52.5 n/d 44.5 44.0 60.1 -16.1 15.6 7.6CMU--Colin Powell Academ' K-5 n/d 46.4 13.0 46.7 35.0 52.6 -17.6 22.0 5.9 6.2EMU -- Commonwealth Comi 6-8 n/a 46.4 n/a 46.7 n/a 52.6 5.9 6.2Saginaw ISD-Curtis House 1 7-12 n/a 67.0 n/a 68.7 n/a 75.9 7.2 8.9CMU--The Dearborn Acadei K-6 n/d 59.1 n/d 53.7 13.0 65.9 -52.9 12.2 6.8CMU--Detroit Academy Of / K-5 n/d 46.4 n/d 46.7 53.3 52.6 0.7 5.9 6.2University Public School 6-8 n/a 46.4 n/a 46.7 n/a 52.6 5.9 6.2CMU--Detroit Sch Of Ind Ar 9-10 n/a 46.4 n/a 46.7 n/a 52.6 5.9 6.2Oakland U--Dove Acad Detr K-4 n/d 46.4 n/d 46.7 25.0 52.6 -27.6 5.9 6.2Oakland U--E T Clark Acad( K-5 n/d 46.4 n/d 46.7 n/d 52.6 5.9 6.2EMU--Gaudior Academy K-8 n/d 36.5 40.0 43.2 50.0 44.5 5.5 10.0 1.3 8.0EMU--Great Lakes Academ' K-3 n/a 29.3 n/a 31.0 n/a 35.0 4.0 5.7SVSU--Heart Academy 11-12 n/a 46.4 n/a 46.7 n/a 52.6 5.9 6.2Wayne RESA--H. Ford Aca( 9 n/a 59.1 n/a 53.7 n/a 65.9 12.2 6.8Wash ISD-Honey Creek Col K-5 n/d 59.5 50.0 58.8 55.6 64.7 -9.1 5.6 5.9 5.2Inkster PS--King Academy K-6 n/d 50.3 n/d 23.1 12.5 24.5 -12.0 1.4 -25.8CMU--Livingston Develop At K-6 n/d 66.3 47.7 69.3 52.8 77.5 -24.7 5.1 8.2 11.2CMU--Livingston Tech Acad 11-12 n/a 67.2 n/a 72.4 n/a 75.0 2.6 7.8CMU--Macomb Academy 12 n/a 55.0 n/a 58.4 n/a 67.6 9.2 12.6CMU--Michigan Automotive 10-12 n/a 46.4 n/a 46.7 n/a 52.6 5.9 6.2SVSU--Michigan Health Aca 11-12 n/a 58.0 n/a 48.4 n/a 55.9 7.5 -2.1SVSU--ML Winans Acad Of K-5 n/d 46.4 n/d 46.7 12.2 52.6 -40.4 5.9 6.2Det Publ Schs-MLK Jr. Ed.1 K-6 n/d 50.3 40.0 23.1 69.2 24.5 44.7 29.2 1.4 -25.8SVSU--Mosaica Academy C K-5 n/d 17.1 n/d 12.5 10.0 37.3 -27.3 24.8 20.2CMU--Nataki Talibah Schoo K-5 n/d 46.4 31.8 46.7 38.1 52.6 -14.5 6.3 5.9 6.2SVSU--New Directions Instil 9-12 n/a 29.3 n/a 31.0 n/a 35.0 4.0 5.7Oakland U--Nsoroma Institu K-8 n/d 31.1 n/d 39.6 0.0 32.8 -32.8 -6.8 1.7CMU--Oasis Academy K-4 n/d 59.1 30.4 52.7 33.3 61.3 -28.0 2.9 8.6 2.2CMU--Plymouth Educationa K-3 n/a 46.4 n/a 46.7 37.5 52.6 -15.1 5.9 6.2CMU--Questar Academy K-6 n/d 63.3 n/d 59.7 55.6 60.3 -4.7 0.6 -3.0Saginaw ISD--Saginaw Co 1 9-12 n/a 33.4 n/a 30.8 n/a 46.9 16.1 13.5CMU--Sierra Leone Ed Outr K-6 n/d 46.4 32.0 46.7 16.7 52.6 -35.9 -15.3 5.9 6.2St Clair ISD-St Clair Learn P 6-12 n/a 43.1 n/a 43.1 n/a 52.7 9.6 9.6CMU--Summit Academy K-5 n/d 51.4 25.0 60.2 48.0 58.1 -10.1 23.0 -2.1 6.7CMU-Thomas-Gist Acaderr K-8 n/d 46.4 51.4 46.7 17.6 52.6 -35.0 -33.8 5.9 6.2Oakland U--Turtle Island 6-10 n/a 48.9 n/a 36.9 n/a 55.6 18.7 6.7CMU--Warwick Pointe Acad K-5 n/d 55.6 40.0 55.1 42.4 67.0 -24.6 2.4 11.9 11.4Washtenaw CC-Wash. Tecl 10-11 n/a 59.5 n/a 58.8 n/a 64.7 5.9 5.2CMU--Woodward Academy 3-6 n/d 46.4 n/d 46.7 23.0 52.6 -29.6 5.9 6.2CMU--Acad Of Detroit Oak I K-12 n/d 33.0 31.5 49.3 n/a 51.7 2.4 18.7Det Board Of Ed--WEB Dub K-12 0.0 46.4 25.0 46.7 25.0 52.6 -27.6 0.0 5.9 25.0 6.2State of Michigan 49.9 49.0 58.6 9.6 8.7
NOTE: Source of data is Michigan School Report. 'n/a' indicates not applicable; 'n/d' indicates no data submitted.
5 5
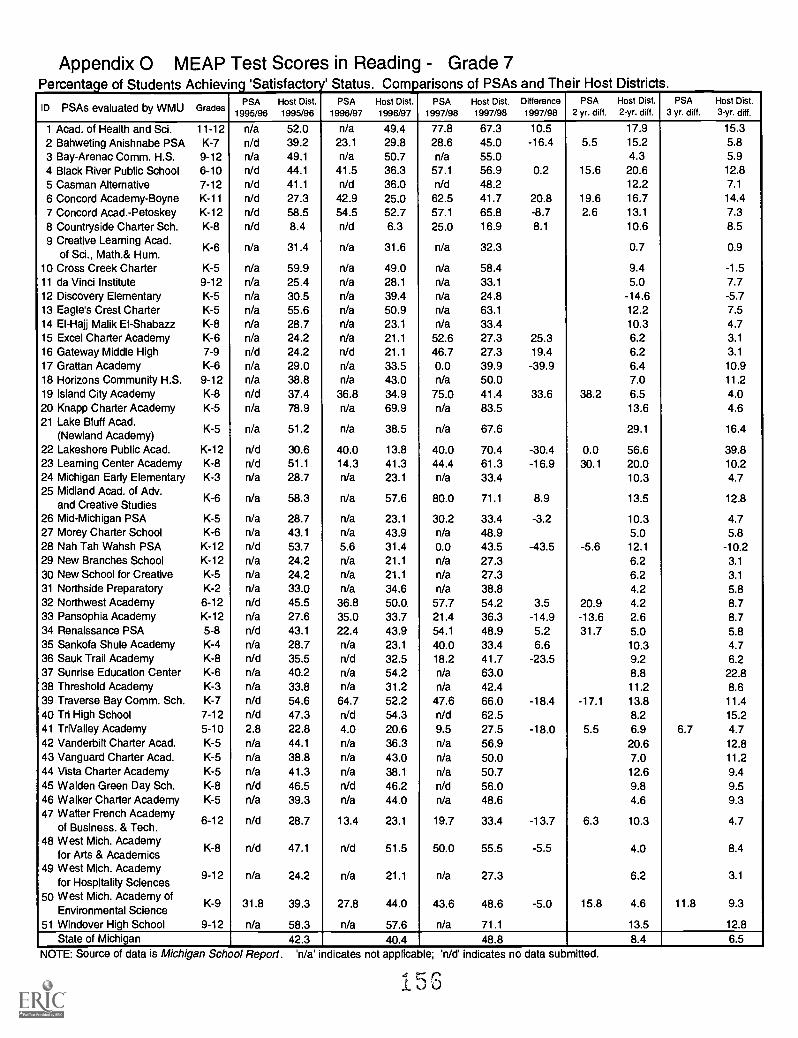
Appendix 0 MEAP Test Scores in Reading - Grade 7Percentage of Students Achieving 'Satisfactory' Status. Comparisons of PSAs and Their Host Districts.
ID PSAs evaluated by WMU GradesPSA
1995/96Host Dist.1995/96
PSA1996/97
Host Dist.1996/97
PSA1997/98
Host Dist.1997/98
Difference1997/98
PSA2 yr. diff.
Host Dist.2-yr. diff.
PSA3 yr. diff.
Host Dist.3-yr. diff.
1 Acad. of Health and Sci. 11-12 Na 52.0 n/a 49.4 77.8 67.3 10.5 17.9 15.3
2 Bahweting Anishnabe PSA K-7 n/d 39.2 23.1 29.8 28.6 45.0 -16.4 5.5 15.2 5.83 Bay-Arenac Comm. H.S. 9-12 n/a 49.1 Na 50.7 n/a 55.0 4.3 5.94 Black River Public School 6-10 n/d 44.1 41.5 36.3 57.1 56.9 0.2 15.6 20.6 12.8
5 Casman Alternative 7-12 Nd 41.1 n/d 36.0 n/d 48.2 12.2 7.1
6 Concord Academy-Boyne K-11 n/d 27.3 42.9 25.0 62.5 41.7 20.8 19.6 16.7 14.4
7 Concord Acad.-Petoskey K-12 n/d 58.5 54.5 52.7 57.1 65.8 -8.7 2.6 13.1 7.38 Countryside Charter Sch. K-8 n/d 8.4 n/d 6.3 25.0 16.9 8.1 10.6 8.59 Creative Learning Acad.
of Sci., Math.& Hum.K-6 Na 31.4 n/a 31.6 n/a 32.3 0.7 0.9
10 Cross Creek Charter K-5 n/a 59.9 Na 49.0 n/a 58.4 9.4 -1.511 da Vinci Institute 9-12 n/a 25.4 n/a 28.1 n/a 33.1 5.0 7.712 Discovery Elementary K-5 n/a 30.5 n/a 39.4 n/a 24.8 -14.6 -5.713 Eagles Crest Charter K-5 n/a 55.6 n/a 50.9 n/a 63.1 12.2 7.514 El-Hajj Malik EI-Shabazz K-8 n/a 28.7 Na 23.1 n/a 33.4 10.3 4.715 Excel Charter Academy K-6 n/a 24.2 n/a 21.1 52.6 27.3 25.3 6.2 3.1
16 Gateway Middle High 7-9 n/d 24.2 n/d 21.1 46.7 27.3 19.4 6.2 3.1
17 Grattan Academy K-6 n/a 29.0 n/a 33.5 0.0 39.9 -39.9 6.4 10.918 Horizons Community H.S. 9-12 n/a 38.8 n/a 43.0 n/a 50.0 7.0 11.219 Island City Academy K-8 n/d 37.4 36.8 34.9 75.0 41.4 33.6 38.2 6.5 4.020 Knapp Charter Academy K-5 n/a 78.9 n/a 69.9 n/a 83.5 13.6 4.621 Lake Bluff Acad.
(Newland Academy)K-5 n/a 51.2 n/a 38.5 n/a 67.6 29.1 16.4
22 Lakeshore Public Acad. K-12 n/d 30.6 40.0 13.8 40.0 70.4 -30.4 0.0 56.6 39.823 Learning Center Academy K-8 n/d 51.1 14.3 41.3 44.4 61.3 -16.9 30.1 20.0 10.224 Michigan Early Elementary K-3 n/a 28.7 n/a 23.1 n/a 33A 10.3 4.725 Midland Acad. of Adv.
and Creative StudiesK-6 n/a 58.3 n/a 57.6 80.0 71.1 8.9 13.5 12.8
26 Mid-Michigan PSA K-5 n/a 28.7 n/a 23.1 30.2 33.4 -3.2 10.3 4.727 Morey Charter School K-6 n/a 43.1 n/a 43.9 n/a 48.9 5.0 5.828 Nah Tah Wahsh PSA K-12 n/d 53.7 5.6 31.4 0.0 43.5 -43.5 -5.6 12.1 -10.229 New Branches School K-12 n/a 24.2 n/a 21.1 n/a 27.3 6.2 3.1
30 New School for Creative K-5 Na 24.2 Na 21.1 n/a 27.3 6.2 3.131 Northside Preparatory K-2 n/a 33.0 Na 34.6 n/a 38.8 4.2 5.832 Northwest Academy 6-12 n/d 45.5 36.8 50.0. 57.7 54.2 3.5 20.9 4.2 8.733 Pansophia Academy K-12 n/a 27.6 35.0 33.7 21.4 36.3 -14.9 -13.6 2.6 8.734 Renaissance PSA 5-8 n/d 43.1 22.4 43.9 54.1 48.9 5.2 31.7 5.0 5.835 Sankofa Shule Academy K-4 n/a 28.7 n/a 23.1 40.0 33.4 6.6 10.3 4.736 Sauk Trail Academy K-8 n/d 35.5 n/d 32.5 18.2 41.7 -23.5 9.2 6.237 Sunrise Education Center K-6 Na 40.2 n/a 54.2 Na 63.0 8.8 22.838 Threshold Academy K-3 n/a 33.8 n/a 31.2 n/a 42.4 11.2 8.639 Traverse Bay Comm. Sch. K-7 n/d 54.6 64.7 52.2 47.6 66.0 -18.4 -17.1 13.8 11.440 Tri High School 7-12 n/d 47.3 n/d 54.3 Nd 62.5 8.2 15.241 TriValley Academy 5-10 2.8 22.8 4.0 20.6 9.5 27.5 -18.0 5.5 6.9 6.7 4.742 Vanderbilt Charter Acad. K-5 n/a 44.1 Na 36.3 n/a 56.9 20.6 12.843 Vanguard Charter Acad. K-5 n/a 38.8 n/a 43.0 Na 50.0 7.0 11.244 Vista Charter Academy K-5 Na 41.3 n/a 38.1 n/a 50.7 12.6 9.445 Walden Green Day Sch. K-8 n/d 46.5 n/d 46.2 n/d 56.0 9.8 9.546 Walker Charter Academy K-5 n/a 39.3 n/a 44.0 n/a 48.6 4.6 9.347 Walter French Academy
of Business. & Tech.6-12 n/d 28.7 13.4 23.1 19.7 33.4 -13.7 6.3 10.3 4.7
48 West Mich. Academyfor Arts & Academics
K-8 n/d 47.1 Nd 51.5 50.0 55.5 -5.5 4.0 8.4
49 West Mich. Academyfor Hospitality Sciences
9-12 n/a 24.2 n/a 21.1 n/a 27.3 6.2 3.1
50 West Mich. Academy ofEnvironmental Science
K-9 31.8 39.3 27.8 44.0 43.6 48.6 -5.0 15.8 4.6 11.8 9.3
51 Windover High School 9-12 n/a 58.3 Na 57.6 n/a 71.1 13.5 12.8
State of Michigan 42.3 40.4 48.8 8.4 6.5NOTE: Source of data is Michigan School Report. 'n/a' indicates not applicable; 'n/d' indicates no data submitted.
156
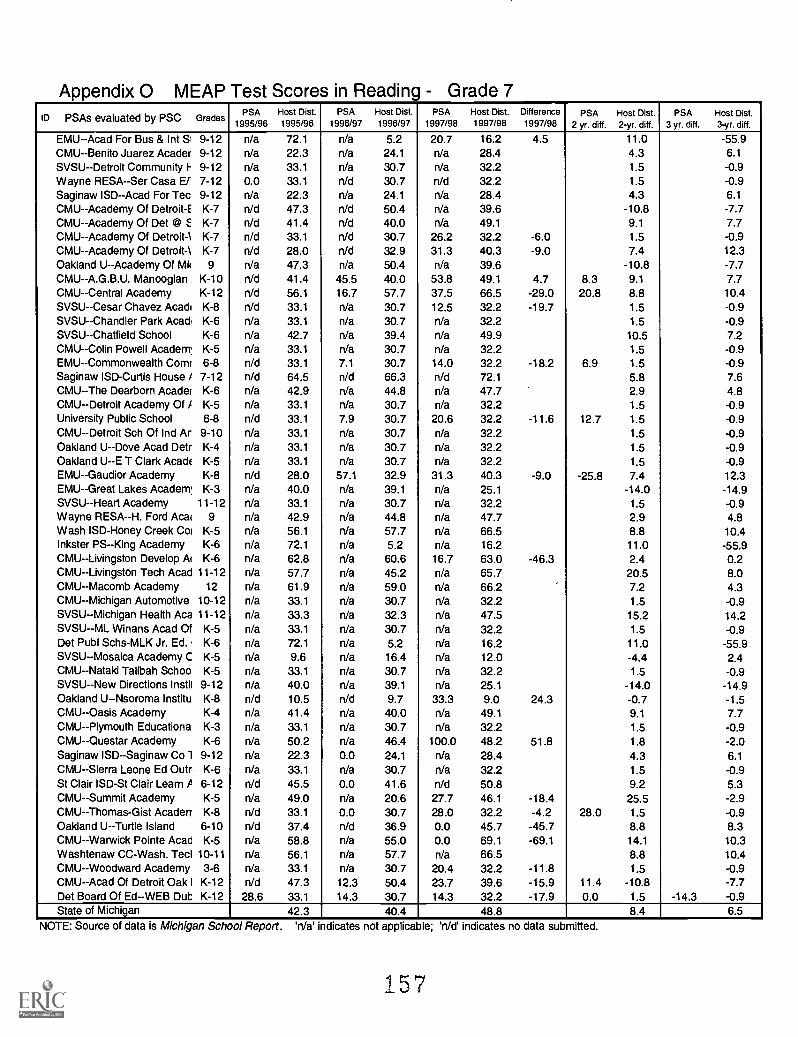
Appendix 0 MEAP Test Scores in Reading Grade 7ID PSAs evaluated by PSC Grades
PSA1995/96
Host Dist.1995/96
PSA1996/97
Host Dist.1996/97
PSA1997/98
Host Dist.1997/98
Difference1997/98
PSA2 yr. diff.
Host Dist.2-yr. diff.
PSA3 yr. diff.
Host Dist.3-yr. diff.
EMU--Acad For Bus & Int Si 9-12 n/a 72.1 n/a 5.2 20.7 16.2 4.5 11.0 -55.9CMU--Benito Juarez Acader 9-12 n/a 22.3 n/a 24.1 n/a 28.4 4.3 6.1
SVSU-Detroit Community I- 9-12 n/a 33.1 n/a 30.7 n/a 32.2 1.5 -0.9Wayne RESA--Ser Casa El 7-12 0.0 33.1 n/d 30.7 n/d 32.2 1.5 -0.9Saginaw ISD--Acad For Tec 9-12 n/a 22.3 Na 24.1 Na 28.4 4.3 6.1
CMU--Academy Of Detroit-E K-7 n/d 47.3 n/d 50.4 n/a 39.6 -10.8 -7.7CMU--Academy Of Det @ E K-7 n/d 41.4 n/d 40.0 Na 49.1 9.1 7.7CMU--Academy Of Detroit-1 K-7 n/d 33.1 n/d 30.7 26.2 32.2 -6.0 1.5 -0.9CMU--Academy Of Detroit -\ K-7 n/d 28.0 n/d 32.9 31.3 40.3 -9.0 7.4 12.3Oakland U--Academy Of Mk 9 n/a 47.3 n/a 50.4 n/a 39.6 -10.8 -7.7CMU--A.G.B.U. Manoogian K-10 n/d 41.4 45.5 40.0 53.8 49.1 4.7 8.3 9.1 7.7CMU--Central Academy K-12 n/d 56.1 16.7 57.7 37.5 66.5 -29.0 20.8 8.8 10.4SVSU--Cesar Chavez Acach K-8 n/d 33.1 Na 30.7 12.5 32.2 -19.7 1.5 -0.9SVSU--Chandler Park Acad K-6 Na 33.1 n/a 30.7 n/a 32.2 1.5 -0.9SVSU--Chatfield School K-6 n/a 42.7 n/a 39.4 n/a 49.9 10.5 7.2CMU--Colin Powell Academ' K-5 n/a 33.1 n/a 30.7 n/a 32.2 1.5 -0.9EMU--Commonwealth Com 6-8 n/d 33.1 7.1 30.7 14.0 32.2 -18.2 6.9 1.5 -0.9Saginaw ISD-Curtis House / 7-12 n/d 64.5 n/d 66.3 n/d 72.1 5.8 7.6CMU--The Dearborn Acader K-6 n/a 42.9 n/a 44.8 n/a 47.7 2.9 4.8CMU--Detroit Academy Off K-5 n/a 33.1 n/a 30.7 n/a 32.2 1.5 -0.9University Public School 6-8 n/d 33.1 7.9 30.7 20.6 32.2 -11.6 12.7 1.5 -0.9CMU--Detroit Sch Of Ind Ar 9-10 n/a 33.1 n/a 30.7 n/a 32.2 1.5 -0.9Oakland U--Dove Acad Detr K-4 n/a 33.1 Na 30.7 n/a 32.2 1.5 -0.9Oakland U--E T Clark Acad( K-5 n/a 33.1 Na 30.7 n/a 32.2 1.5 -0.9EMU--Gaudior Academy K-8 n/d 28.0 57.1 32.9 31.3 40.3 -9.0 -25.8 7.4 12.3EMU--Great Lakes Academ' K-3 n/a 40.0 n/a 39.1 n/a 25.1 -14.0 -14.9SVSU - -Heart Academy 11-12 n/a 33.1 n/a 30.7 n/a 32.2 1.5 -0.9Wayne RESA--H. Ford Aca( 9 n/a 42.9 n/a 44.8 n/a 47.7 2.9 4.8Wash ISD-Honey Creek Col K-5 n/a 56.1 n/a 57.7 n/a 66.5 8.8 10.4Inkster PS--King Academy K-6 n/a 72.1 n/a 5.2 n/a 16.2 11.0 -55.9CMU--Livingston Develop Iv K-6 n/a 62.8 n/a 60.6 16.7 63.0 -46.3 2.4 0.2CMU--Livingston Tech Acad 11-12 n/a 57.7 n/a 45.2 n/a 65.7 20.5 8.0CMU--Macomb Academy 12 n/a 61.9 n/a 59.0 Na 66.2 7.2 4.3CMU--Michigan Automotive 10-12 n/a 33.1 Na 30.7 n/a 32.2 1.5 -0.9SVSU--Michigan Health Aca 11-12 n/a 33.3 n/a 32.3 Na 47.5 15.2 14.2SVSU--ML Winans Acad Of K-5 n/a 33.1 n/a 30.7 n/a 32.2 1.5 -0.9Det Publ Schs-MLK Jr. Ed. i K-6 n/a 72.1 n/a 5.2 n/a 16.2 11.0 -55.9SVSU--Mosaica Academy C K-5 Na 9.6 n/a 16.4 n/a 12.0 -4.4 2.4CMU--Nataki Talibah Schoo K-5 n/a 33.1 n/a 30.7 n/a 32.2 1.5 -0.9SVSU--New Directions Instil 9-12 n/a 40.0 n/a 39.1 n/a 25.1 -14.0 -14.9Oakland U--Nsoroma Institu K-8 n/d 10.5 n/d 9.7 33.3 9.0 24.3 -0.7 -1.5CMU--Oasis Academy K-4 n/a 41.4 n/a 40.0 n/a 49.1 9.1 7.7CMU--Plymouth Educationa K-3 n/a 33.1 n/a 30.7 Na 32.2 1.5 -0.9CMU--Questar Academy K-6 n/a 50.2 n/a 46.4 100.0 48.2 51.8 1.8 -2.0Saginaw ISD--Saginaw Co 1 9-12 n/a 22.3 0.0 24.1 n/a 28.4 4.3 6.1
CMU--Sierra Leone Ed Outr K-6 n/a 33.1 n/a 30.7 Na 32.2 1.5 -0.9St Clair ISD-St Clair Learn P 6-12 n/d 45.5 0.0 41.6 n/d 50.8 9.2 5.3CMU--Summit Academy K-5 Na 49.0 n/a 20.6 27.7 46.1 -18.4 25.5 -2.9CMU--Thomas-Gist Acaderr K-8 n/d 33.1 0.0 30.7 28.0 32.2 -4.2 28.0 1.5 -0.9Oakland U--Turtle Island 6-10 n/d 37.4 n/d 36.9 0.0 45.7 -45.7 8.8 8.3CMU--Warwick Pointe Acad K-5 n/a 58.8 n/a 55.0 0.0 69.1 -69.1 14.1 10.3Washtenaw CC-Wash. Ted 10-11 n/a 56.1 Na 57.7 n/a 66.5 8.8 10.4CMU--Woodward Academy 3-6 n/a 33.1 n/a 30.7 20.4 32.2 -11.8 1.5 -0.9CMU--Acad Of Detroit Oak I K-12 n/d 47.3 12.3 50.4 23.7 39.6 -15.9 11.4 -10.8 -7.7Det Board Of Ed--WEB Dub K-12 28.6 33.1 14.3 30.7 14.3 32.2 -17.9 0.0 1.5 -14.3 -0.9State of Michigan 42.3 40.4 48.8 8.4 6.5
NOTE: Source of data is Michigan School Report. 'n/a' indicates not applicable; 'n/d' indicates no data submitted.
57
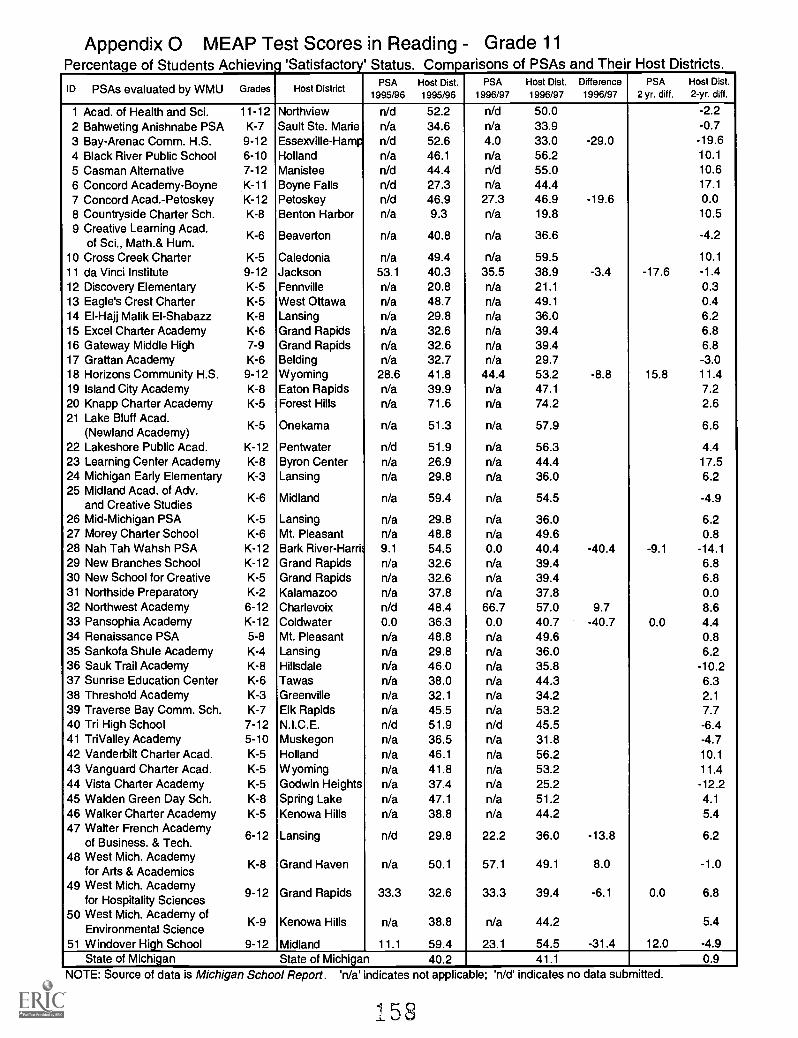
Appendix 0 MEAP Test Scores in Reading Grade 11Percentage of Students Achieving 'Satisfactory' Status. Comparisons of PSAs and Their Host Districts.
ID PSAs evaluated by WMU Grades Host DistrictPSA
1995/96Host Dist.1995/96
PSA1996/97
Host Dist.1996/97
Difference1996/97
PSA2 yr. diff.
Host Dist.2-yr. diff.
1 Acad. of Health and Sci. 11-12 Northview n/d 52.2 n/d 50.0 -2.22 Bahweting Anishnabe PSA K-7 Sault Ste. Marie n/a 34.6 n/a 33.9 -0.73 Bay-Arenac Comm. H.S. 9-12 Essexville-Hamp n/d 52.6 4.0 33.0 -29.0 -19.64 Black River Public School 6-10 Holland n/a 46.1 n/a 56.2 10.1
5 Casman Alternative 7-12 Manistee n/d 44.4 n/d 55.0 10.66 Concord Academy-Boyne K-11 Boyne Falls n/d 27.3 n/a 44.4 17.1
7 Concord Acad.-Petoskey K-12 Petoskey n/d 46.9 27.3 46.9 -19.6 0.08 Countryside Charter Sch. K-8 Benton Harbor n/a 9.3 n/a 19.8 10.59 Creative Learning Acad.
of Sci., Math.& Hum.K-6 Beaverton n/a 40.8 n/a 36.6 -4.2
10 Cross Creek Charter K-5 Caledonia n/a 49.4 n/a 59.5 10.1
11 da Vinci Institute 9-12 Jackson 53.1 40.3 35.5 38.9 -3.4 -17.6 -1.412 Discovery Elementary K-5 Fennville n/a 20.8 n/a 21.1 0.313 Eagle's Crest Charter K-5 West Ottawa n/a 48.7 n/a 49.1 0.414 El-Hajj Malik EI-Shabazz K-8 Lansing n/a 29.8 n/a 36.0 6.215 Excel Charter Academy K-6 Grand Rapids n/a 32.6 n/a 39.4 6.816 Gateway Middle High 7-9 Grand Rapids n/a 32.6 n/a 39.4 6.817 Grattan Academy K-6 Belding n/a 32.7 n/a 29.7 -3.018 Horizons Community H.S. 9-12 Wyoming 28.6 41.8 44.4 53.2 -8.8 15.8 11.419 Island City Academy K-8 Eaton Rapids n/a 39.9 n/a 47.1 7.220 Knapp Charter Academy K-5 Forest Hills n/a 71.6 n/a 74.2 2.621 Lake Bluff Acad.
(Newland Academy)K-5 Onekama n/a 51.3 n/a 57.9 6.6
22 Lakeshore Public Acad. K-12 Pentwater n/d 51.9 n/a 56.3 4.423 Learning Center Academy K-8 Byron Center n/a 26.9 n/a 44.4 17.524 Michigan Early Elementary K-3 Lansing n/a 29.8 n/a 36.0 6.225 Midland Acad. of Adv.
and Creative StudiesK-6 Midland n/a 59.4 n/a 54.5 -4.9
26 Mid-Michigan PSA K-5 Lansing n/a 29.8 n/a 36.0 6.227 Morey Charter School K-6 Mt. Pleasant n/a 48.8 n/a 49.6 0.828 Nah Tah Wahsh PSA K-12 Bark River - Harris 9.1 54.5 0.0 40.4 -40.4 -9.1 -14.129 New Branches School K-12 Grand Rapids n/a 32.6 n/a 39.4 6.830 New School for Creative K-5 Grand Rapids n/a 32.6 n/a 39.4 6.831 Northside Preparatory K-2 Kalamazoo n/a 37.8 n/a 37.8 0.032 Northwest Academy 6-12 Charlevoix n/d 48.4 66.7 57.0 9.7 8.633 Pansophia Academy K-12 Coldwater 0.0 36.3 0.0 40.7 -40.7 0.0 4.434 Renaissance PSA 5-8 Mt. Pleasant n/a 48.8 n/a 49.6 0.835 Sankofa Shule Academy K-4 Lansing n/a 29.8 n/a 36.0 6.236 Sauk Trail Academy K-8 Hillsdale n/a 46.0 n/a 35.8 -10.237 Sunrise Education Center K-6 Tawas n/a 38.0 n/a 44.3 6.338 Threshold Academy K-3 Greenville n/a 32.1 n/a 34.2 2.139 Traverse Bay Comm. Sch. K-7 Elk Rapids n/a 45.5 n/a 53.2 7.740 Tri High School 7-12 N.I.C.E. n/d 51.9 n/d 45.5 -6.441 TriValley Academy 5-10 Muskegon n/a 36.5 n/a 31.8 -4.742 Vanderbilt Charter Acad. K-5 Holland n/a 46.1 n/a 56.2 10.143 Vanguard Charter Acad. K-5 Wyoming n/a 41.8 n/a 53.2 11.444 Vista Charter Academy K-5 Godwin Heights n/a 37.4 n/a 25.2 -12.245 Walden Green Day Sch. K-8 Spring Lake n/a 47.1 n/a 51.2 4.1
46 Walker Charter Academy K-5 Kenowa Hills n/a 38.8 n/a 44.2 5.447 Walter French Academy
of Business. & Tech.6-12 Lansing n/d 29.8 22.2 36.0 -13.8 6.2
48 West Mich. Academyfor Arts & Academics
K-8 Grand Haven n/a 50.1 57.1 49.1 8.0 -1.0
49 West Mich. Academyfor Hospitality Sciences
9-12 Grand Rapids 33.3 32.6 33.3 39.4 -6.1 0.0 6.8
50 West Mich. Academy ofEnvironmental Science
K-9 Kenowa Hills n/a 38.8 n/a 44.2 5.4
51 Windover High School 9-12 Midland 11.1 59.4 23.1 54.5 -31.4 12.0 -4.9State of Michigan State of Michigan 40.2 41.1 0.9
NOTE: Source of data is Michigan School Report. 'n/a' indicates not applicable; 'n/d' indicates no data submitted.
1 5 8
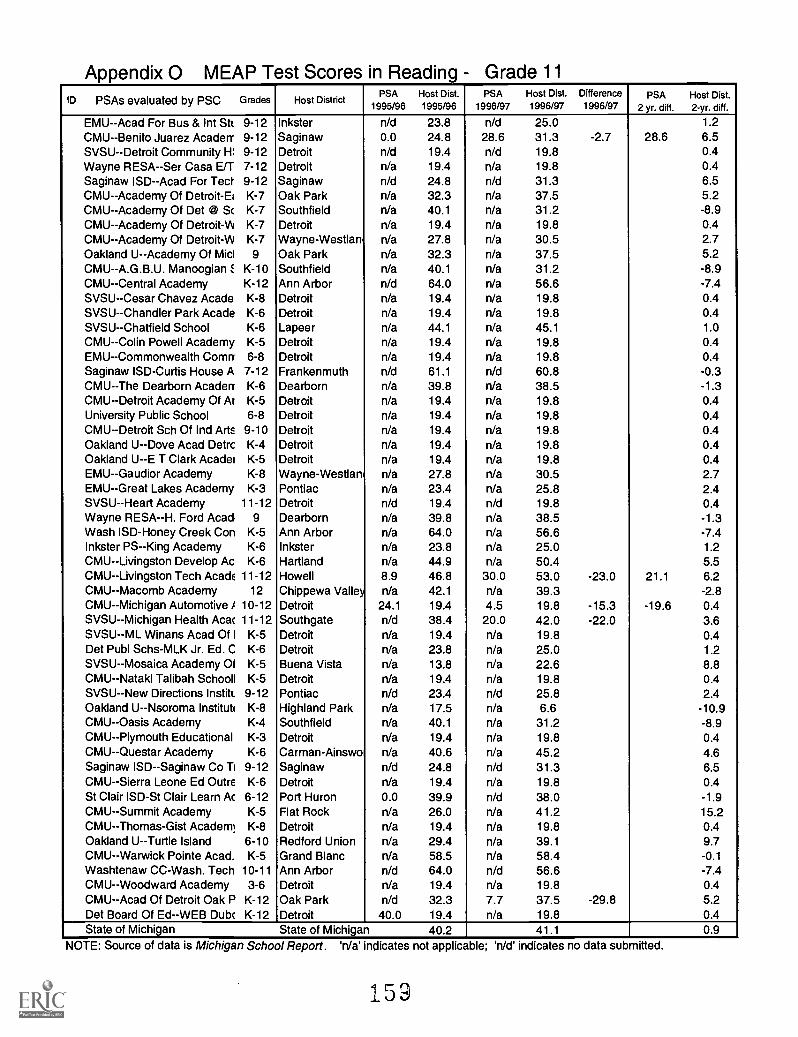
ADDendix 0 MEAP Test Scores in Reading Grade 11ID PSAs evaluated by PSC Grades Host District
PSA1995/96
Host Dist.1995/96
PSA1996/97
Host Dist.1996/97
Difference1996/97
PSA2 yr. diff.
Host Dist.2-yr. diff.
EMU--Acad For Bus & Int Stt 9-12 Inkster n/d 23.8 n/d 25.0 1.2
CMU-Benito Juarez Acaderr 9-12 Saginaw 0.0 24.8 28.6 31.3 -2.7 28.6 6.5SVSU--Detroit Community H: 9-12 Detroit n/d 19.4 n/d 19.8 0.4Wayne RESA--Ser Casa Err 7-12 Detroit n/a 19.4 n/a 19.8 0.4Saginaw ISD--Acad For Ted 9-12 Saginaw n/d 24.8 n/d 31.3 6.5CMU--Academy Of Detroit-E K-7 Oak Park n/a 32.3 n/a 37.5 5.2CMU--Academy Of Det © Sc K-7 Southfield n/a 40.1 n/a 31.2 -8.9CMU--Academy Of Detroit-VY K-7 Detroit n/a 19.4 n/a 19.8 0.4CMU--Academy Of Detroit-W K-7 Wayne-Westlan, n/a 27.8 n/a 30.5 2.7Oakland U--Academy Of Micl 9 Oak Park n/a 32.3 n/a 37.5 5.2CMU--A.G.B.U. Manoogian : K-10 Southfield n/a 40.1 n/a 31.2 -8.9CMU--Central Academy K-12 Ann Arbor n/d 64.0 n/a 56.6 -7.4SVSU--Cesar Chavez Acade K-8 Detroit n/a 19.4 n/a 19.8 0.4SVSU--Chandler Park Acade K-6 Detroit n/a 19.4 n/a 19.8 0.4SVSU--Chatfield School K-6 Lapeer n/a 44.1 n/a 45.1 1.0CMU--Colin Powell Academy K-5 Detroit n/a 19.4 n/a 19.8 0.4EMU--Commonwealth Comrr 6-8 Detroit n/a 19.4 n/a 19.8 0.4Saginaw ISD-Curtis House A 7-12 Frankenmuth n/d 61.1 n/d 60.8 -0.3CMU--The Dearborn Acaderr K-6 Dearborn n/a 39.8 n/a 38.5 -1.3CMU--Detroit Academy Of AT K-5 Detroit n/a 19.4 n/a 19.8 0.4University Public School 6-8 Detroit n/a 19.4 n/a 19.8 0.4CMU--Detroit Sch Of Ind Arts 9-10 Detroit n/a 19.4 n/a 19.8 0.4Oakland U--Dove Acad Detrc K-4 Detroit n/a 19.4 n/a 19.8 0.4Oakland U--E T Clark Acadet K-5 Detroit n/a 19.4 n/a 19.8 0.4EMU--Gaudior Academy K-8 Wayne- Westlan n/a 27.8 n/a 30.5 2.7EMU--Great Lakes Academy K-3 Pontiac n/a 23.4 n/a 25.8 2.4SVSU - -Heart Academy 11-12 Detroit n/d 19.4 n/d 19.8 0.4Wayne RESA--H. Ford Acad 9 Dearborn n/a 39.8 n/a 38.5 -1.3Wash ISD-Honey Creek Con K-5 Ann Arbor n/a 64.0 n/a 56.6 -7.4Inkster PS--King Academy K-6 Inkster n/a 23.8 n/a 25.0 1.2CMU--Livingston Develop Ac K-6 Hartland n/a 44.9 n/a 50.4 5.5CMU--Livingston Tech Acade 11-12 Howell 8.9 46.8 30.0 53.0 -23.0 21.1 6.2CMU--Macomb Academy 12 Chippewa Valley n/a 42.1 n/a 39.3 -2.8CMU-Michigan Automotive i 10-12 Detroit 24.1 19.4 4.5 19.8 -15.3 -19.6 0.4SVSU--Michigan Health Acac 11-12 Southgate n/d 38.4 20.0 42.0 -22.0 3.6SVSU--ML Winans Acad Of I K-5 Detroit n/a 19.4 n/a 19.8 0.4Det Publ Schs-MLK Jr. Ed. C K-6 Detroit n/a 23.8 n/a 25.0 1.2SVSU--Mosaica Academy Of K-5 Buena Vista n/a 13.8 n/a 22.6 8.8CMU--Nataki Talibah Schooll K-5 Detroit n/a 19.4 n/a 19.8 0.4SVSU--New Directions Institi 9-12 Pontiac n/d 23.4 n/d 25.8 2.4Oakland U--Nsoroma Institut( K-8 Highland Park n/a 17.5 n/a 6.6 -10.9CMU--Oasis Academy K-4 Southfield n/a 40.1 n/a 31.2 -8.9CMU--Plymouth Educational K-3 Detroit n/a 19.4 n/a 19.8 0.4CMU--Questar Academy K-6 Carman-Ainswo n/a 40.6 n/a 45.2 4.6Saginaw ISD--Saginaw Co Ti 9-12 Saginaw n/d 24.8 n/d 31.3 6.5CMU--Sierra Leone Ed Outs K-6 Detroit n/a 19.4 n/a 19.8 0.4St Clair ISD-St Clair Learn Ac 6-12 Port Huron 0.0 39.9 n/d 38.0 -1.9CMU--Summit Academy K-5 Flat Rock n/a 26.0 n/a 41.2 15.2CMU-Thomas-Gist Academe K-8 Detroit n/a 19.4 n/a 19.8 0.4Oakland U--Turtle Island 6-10 Redford Union n/a 29.4 n/a 39.1 9.7CMU--Warwick Pointe Acad. K-5 Grand Blanc n/a 58.5 n/a 58.4 -0.1Washtenaw CC-Wash. Tech 10-11 Ann Arbor n/d 64.0 n/d 56.6 -7.4CMU--Woodward Academy 3-6 Detroit n/a 19.4 n/a 19.8 0.4CMU--Acad Of Detroit Oak P K-12 Oak Park n/d 32.3 7.7 37.5 -29.8 5.2Det Board Of Ed--WEB Dubc K-12 Detroit 40.0 19.4 n/a 19.8 0.4State of Michigan State of Michigan 40.2 41.1 0.9
NOTE: Source of data is Michigan School Report. 'n/a' indicates not applicable; 'n/d' indicates no data submitted.
159
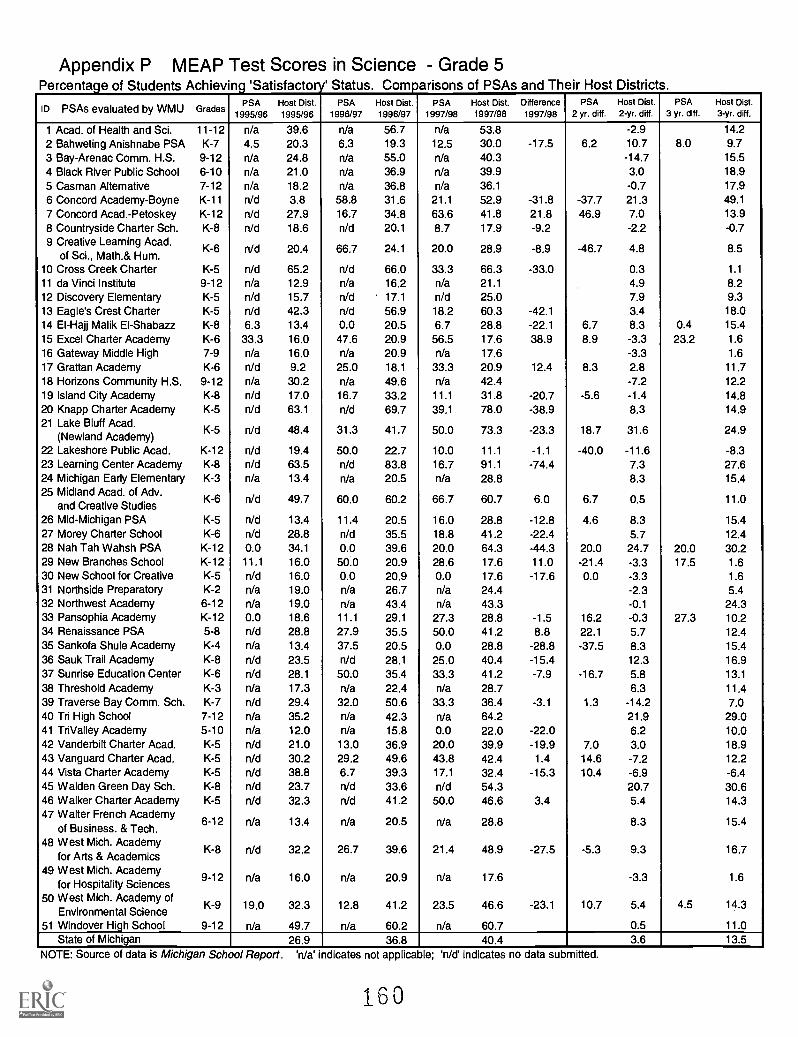
Appendix P MEAP Test Scores in Science Grade 5Percentage of Students Achieving 'Satisfactory' Status. Comparisons of PSAs and Their Host Districts.
ID PSAs evaluated by WMU GradesPSA
1995/96Host Dist.1995/96
PSA1996/97
Host Dist.1996/97
PSA1997/98
Host Dist.1997/98
Differencere
1997/98PSA
2 yr. diff.Host Dist.2-yr. diff.
PSA3 yr. diff.
Host Dist.3-yr. diff.
1 Acad. of Health and Sci. 11-12 n/a 39.6 n/a 56.7 n/a 53.8 -2.9 14.2
2 Bahweting Anishnabe PSA K-7 4.5 20.3 6.3 19.3 12.5 30.0 -17.5 6.2 10.7 8.0 9.73 Bay-Arenac Comm. H.S. 9-12 n/a 24.8 n/a 55.0 n/a 40.3 -14.7 15.5
4 Black River Public School 6-10 n/a 21.0 n/a 36.9 n/a 39.9 3.0 18.9
5 Gasman Alternative 7-12 n/a 18.2 n/a 36.8 n/a 36.1 -0.7 17.9
6 Concord Academy-Boyne K-11 n/d 3.8 58.8 31.6 21.1 52.9 -31.8 -37.7 21.3 49.1
7 Concord Acad.-Petoskey K-12 n/d 27.9 16.7 34.8 63.6 41.8 21.8 46.9 7.0 13.98 Countryside Charter Sch. K-8 n/d 18.6 n/d 20.1 8.7 17.9 -9.2 -2.2 -0.79 Creative Learning Acad.
of Sci., Math.& Hum.K-6 n/d 20.4 66.7 24.1 20.0 28.9 -8.9 -46.7 4.8 8.5
10 Cross Creek Charter K-5 n/d 65.2 n/d 66.0 33.3 66.3 -33.0 0.3 1.1
11 da Vinci Institute 9-12 n/a 12.9 n/a 16.2 n/a 21.1 4.9 8.212 Discovery Elementary K-5 n/d 15.7 n/d 17.1 n/d 25.0 7.9 9.313 Eagle's Crest Charter K-5 n/d 42.3 n/d 56.9 18.2 60.3 -42.1 3.4 18.014 El-Hajj Malik EI-Shabazz K-8 6.3 13.4 0.0 20.5 6.7 28.8 -22.1 6.7 8.3 0.4 15.415 Excel Charter Academy K-6 33.3 16.0 47.6 20.9 56.5 17.6 38.9 8.9 -3.3 23.2 1.6
16 Gateway Middle High 7-9 n/a 16.0 n/a 20.9 n/a 17.6 -3.3 1.6
17 Grattan Academy K-6 n/d 9.2 25.0 18.1 33.3 20.9 12.4 8.3 2.8 11.718 Horizons Community H.S. 9-12 n/a 30.2 n/a 49.6 n/a 42.4 -7.2 12.219 Island City Academy K-8 n/d 17.0 16.7 33.2 11.1 31.8 -20.7 -5.6 -1.4 14.820 Knapp Charter Academy K-5 n/d 63.1 n/d 69.7 39.1 78.0 -38.9 8.3 14.921 Lake Bluff Acad.
(Newland Academy)K-5 n/d 48.4 31.3 41.7 50.0 73.3 -23.3 18.7 31.6 24.9
22 Lakeshore Public Acad. K-12 n/d 19.4 50.0 22.7 10.0 11.1 -1.1 -40.0 -11.6 -8.323 Learning Center Academy K-8 n/d 63.5 n/d 83.8 16.7 91.1 -74.4 7.3 27.624 Michigan Early Elementary K-3 n/a 13.4 n/a 20.5 n/a 28.8 8.3 15.425 Midland Acad. of Adv.
and Creative StudiesK-6 n/d 49.7 60.0 60.2 66.7 60.7 6.0 6.7 0.5 11.0
26 Mid-Michigan PSA K-5 n/d 13.4 11.4 20.5 16.0 28.8 -12.8 4.6 8.3 15.427 Morey Charter School K-6 n/d 28.8 n/d 35.5 18.8 41.2 -22.4 5.7 12.428 Nah Tah Wahsh PSA K-12 0.0 34.1 0.0 39.6 20.0 64.3 -44.3 20.0 24.7 20.0 30.229 New Branches School K-12 11.1 16.0 50.0 20.9 28.6 17.6 11.0 -21.4 -3.3 17.5 1.630 New School for Creative K-5 n/d 16.0 0.0 20.9 0.0 17.6 -17.6 0.0 -3.3 1.631 Northside Preparatory K-2 n/a 19.0 n/a 26.7 n/a 24.4 -2.3 5.432 Northwest Academy 6-12 n/a 19.0 n/a 43.4 n/a 43.3 -0.1 24.333 Pansophia Academy K-12 0.0 18.6 11.1 29.1 27.3 28.8 -1.5 16.2 -0.3 27.3 10.234 Renaissance PSA 5-8 n/d 28.8 27.9 35.5 50.0 41.2 8.8 22.1 5.7 12.435 Sankofa Shule Academy K-4 n/a 13.4 37.5 20.5 0.0 28.8 -28.8 -37.5 8.3 15.436 Sauk Trail Academy K-8 n/d 23.5 n/d 28.1 25.0 40.4 -15.4 12.3 16.937 Sunrise Education Center K-6 n/d 28.1 50.0 35.4 33.3 41.2 -7.9 -16.7 5.8 13.1
38 Threshold Academy K-3 n/a 17.3 n/a 22.4 n/a 28.7 6.3 11.439 Traverse Bay Comm. Sch. K-7 n/d 29.4 32.0 50.6 33.3 36.4 -3.1 1.3 -14.2 7.040 Tri High School 7-12 n/a 35.2 n/a 42.3 n/a 64.2 21.9 29.041 TriValley Academy 5-10 n/a 12.0 n/a 15.8 0.0 22.0 -22.0 6.2 10.042 Vanderbilt Charter Acad. K-5 n/d 21.0 13.0 36.9 20.0 39.9 -19.9 7.0 3.0 18.943 Vanguard Charter Acad. K-5 n/d 30.2 29.2 49.6 43.8 42.4 1.4 14.6 -7.2 12.244 Vista Charter Academy K-5 n/d 38.8 6.7 39.3 17.1 32.4 -15.3 10.4 -6.9 -6.445 Walden Green Day Sch. K-8 n/d 23.7 n/d 33.6 n/d 54.3 20.7 30.646 Walker Charter Academy K-5 n/d 32.3 n/d 41.2 50.0 46.6 3.4 5.4 14.347 Walter French Academy
of Business. & Tech.6-12 n/a 13.4 n/a 20.5 n/a 28.8 8.3 15.4
48 West Mich. Academyfor Arts & Academics
K-8 n/d 32.2 26.7 39.6 21.4 48.9 -27.5 -5.3 9.3 16.7
49 West Mich. Academyfor Hospitality Sciences
9-12 n/a 16.0 n/a 20.9 n/a 17.6 -3.3 1.6
50 West Mich. Academy ofEnvironmental Science
K-9 19.0 32.3 12.8 41.2 23.5 46.6 -23.1 10.7 5.4 4.5 14.3
51 Windover High School 9-12 n/a 49.7 n/a 60.2 n/a 60.7 0.5 11.0State of Michigan 26.9 36.8 40.4 3.6 13.5
NOTE: Source of data is Michigan School Report. 'n/a' indicates not applicable; 'n/d' indicates no data submitted.
160
Appendix P MEAP Test Scores in Science Grade 5ID PSAs evaluated by PSC Grades
PSA1995/96
Host Dist.1995/96
PSA1996/97
Host Dist.1996/97
PSA1997/98
Host Dist.1997/98
Difference1997/98
PSA2 yr. diff.
Host Dist.2-yr. diff.
PSA3 yr. diff.
Host Dist.3-yr. diff.
EMU--Acad For Bus & Int Si 9-12 n/a 30.8 Na 31.0 n/a 7.0 -24.0 -23.8CMU--Benito Juarez Acader 9-12 n/a 9.2 n/a 13.3 n/a 20.4 7.1 11.2SVSU--Detroit Community I- 9-12 n/a 18.3 n/a 31.0 n/a 32.7 1.7 14.4Wayne RESA--Ser Casa El 7-12 n/a 18.3 n/a 31.0 n/a 32.7 1.7 14.4Saginaw ISD--Acad For Tec 9-12 n/a 9.2 n/a 13.3 n/a 20.4 7.1 11.2CMU--Academy Of Detroit-E K-7 n/d 16.1 0.0 42.3 4.9 40.3 -35.4 4.9 -2.0 24.2CMU--Academy Of Det @ E K-7 n/d 24.3 6.9 34.2 54.5 41.0 13.5 47.6 6.8 16.7CMU--Academy Of Detroit-1 K-7 n/d 18.3 5.1 31.0 6.1 32.7 -26.6 1.0 1.7 14.4CMU--Academy Of Detroit-1 K-7 n/d 13.0 0.0 22.8 5.0 25.8 -20.8 5.0 3.0 12.8Oakland U--Academy Of Mk 9 n/a 16.1 n/a 42.3 n/a 40.3 -2.0 24.2CMU--A.G.B.U. Manoogian K-10 0.0 24.3 21.4 34.2 18.8 41.0 -22.2 -2.6 6.8 18.8 16.7CMU--Central Academy K-12 n/d 38.3 14.3 51.9 0.0 52.7 -52.7 -14.3 0.8 14.4SVSU--Cesar Chavez Acadi K-8 n/d 18.3 0.0 31.0 14.7 32.7 -18.0 14.7 1.7 14.4SVSU-Chandler Park Acad, K-6 n/d 18.3 n/d 31.0 n/d 32.7 1.7 14.4SVSU--Chatfield School K-6 n/d 21.8 n/d 33.1 37.5 45.7 -8.2 12.6 23.9CMU--Colin Powell Academ K-5 n/d 18.3 4.2 31.0 16.7 32.7 -16.0 12.5 1.7 14.4EMU--Commonwealth Com! 6-8 n/a 18.3 n/a 31.0 n/a 32.7 1.7 14.4Saginaw ISD-Curtis House oi 7-12 n/a 51.7 n/a 36.3 n/a 52.1 15.8 0.4CMU--The Dearborn Acader K-6 n/d 19.5 . n/d 39.8 n/a 40.0 0.2 20.5CMU-Detroit Academy Off K-5 n/d 18.3 n/d 31.0 2.8 32.7 -29.9 1.7 14.4University Public School 6-8 n/a 18.3 n/a 31.0 n/a 32.7 1.7 14.4CMU--Detroit Sch Of Ind Ar 9-10 n/a 18.3 Na 31.0 n/a 32.7 1.7 14.4Oakland U--Dove Acad Detr K-4 n/a 18.3 n/a 31.0 Na 32.7 1.7 14.4Oakland U--E T Clark Acad( K-5 n/d 18.3 n/d 31.0 n/d 32.7 1.7 14.4EMU--Gaudior Academy K-8 n/d 13.0 8.3 22.8 21.1 25.8 -4.7 12.8 3.0 12.8EMU--Great Lakes Academ! K-3 n/a 11.1 n/a 25.2 n/a 19.8 -5.4 8.7SVSU - -Heart Academy 11-12 n/a 18.3 Na 31.0 n/a 32.7 1.7 14.4Wayne RESA--H. Ford Aca 9 n/a 19.5 n/a 39.8 n/a 40.0 0.2 20.5Wash ISD-Honey Creek Col K-5 n/d 38.3 n/d 51.9 66.7 52.7 14.0 0.8 14.4Inkster PS--King Academy K-6 n/d 30.8 n/d 31.0 14.3 7.0 7.3 -24.0 -23.8CMU--Livingston Develop AI K-6 n/d 49.5 31.0 64.1 51.9 67.8 -15.9 20.9 3.7 18.3CMU--Livingston Tech Acad 11-12 n/a 23.4 n/a 36.1 n/a 43.5 7.4 20.1CMU--Macomb Academy 12 n/a 30.1 n/a 44.4 n/a 47.4 3.0 17.3CMU--Michigan Automotive 10-12 n/a 18.3 n/a 31.0 n/a 32.7 1.7 14.4SVSU--Michigan Health Aca 11-12 n/a 30.6 n/a 38.3 n/a 42.8 4.5 12.2SVSU--ML Winans Acad Of K-5 n/d 18.3 n/d 31.0 4.2 32.7 -28.5 1.7 14.4Det Publ Schs-MLK Jr. Ed.1 K-6 50.0 30.8 66.7 31.0 85.7 7.0 78.7 19.0 -24.0 35.7 -23.8SVSU--Mosaica Academy C K-5 n/d 5.3 n/d 9.0 0.0 2.9 -2.9 -6.1 -2.4CMU--Nataki Talibah Schoo K-5 n/d 18.3 0.0 31.0 68.8 32.7 36.1 68.8 1.7 14.4SVSU--New Directions Instil 9-12 n/a 11.1 n/a 25.2 n/a 19.8 -5.4 8.7Oakland U--Nsoroma Institu K-8 Nd 1.0 n/d 4.1 20.0 16.7 3.3 12.6 15.7CMU--Oasis Academy K-4 n/a 24.3 n/a 34.2 38.1 41.0 -2.9 6.8 16.7CMU--Plymouth Educationa K-3 n/a 18.3 n/a 31.0 n/a 32.7 1.7 14.4CMU--Questar Academy K-6 Nd 39.6 50.0 43.2 0.0 48.7 -48.7 -50.0 5.5 9.1Saginaw ISD--Saginaw Co 1 9-12 n/a 9.2 n/a 13.3 n/a 20.4 7.1 11.2CMU--Sierra Leone Ed Outr K-6 n/d 18.3 10.5 31.0 0.0 32.7 -32.7 -10.5 1.7 14.4St Clair ISD-St Clair Learn P 6-12 n/a 24.5 n/a 33.9 n/a 40.6 6.7 16.1CMU--Summit Academy K-5 n/d 29.2 35.3 42.3 32.5 51.0 -18.5 -2.8 8.7 21.8CMU--Thomas-Gist Acaden K-8 0.0 18.3 4.3 31.0 0.0 32.7 -32.7 -4.3 1.7 0.0 14.4Oakland U--Turtle Island 6-10 n/a 25.1 n/a 36.3 n/a 30.6 -5.7 5.5CMU--Warwick Pointe Acad K-5 n/d 36.0 100.0 48.8 29.4 46.0 -16.6 -70.6 -2.8 10.0Washtenaw CC-Wash. Ted 10-11 Na 38.3 n/a 51.9 n/a 52.7 0.8 14.4CMU--Woodward Academy 3-6 n/d 18.3 n/d 31.0 2.2 32.7 -30.5 1.7 14.4CMU--Acad Of Detroit Oak I K-12 n/d 16.1 n/a 42.3 n/a 40.3 -2.0 24.2Det Board Of Ed--WEB Dub K-12 40.0 18.3 0.0 31.0 0.0 32.7 -32.7 0.0 1.7 -40.0 14.4State of Michigan 26.9 36.8 40.4 3.6 13.5
NOTE: Source of data is Michigan School Report. 'Na' indicates not applicable; 'n/d' indicates no data submitted.
Appendix P MEAP Test Scores in Science Grade 8Percentage of Students Achieving 'Satisfactory' Status. Comparisons of PSAs and Their Host Districts.
ID PSAs evaluated by WMU GradesPSA
1995/96Host Dist.1995/96
PSA1996/97
Host Dist.1996/97
PSA1997/98
Host Dist.1997/98
Difference1997/98
PSA2 yr. diff.
Host Dist.2-yr. diff.
PSA3 yr. diff.
Host Dist.3-yr. diff.
1 Acad. of Health and Sci. 11-12 n/a 38.1 n/a 13.7 80.0 33.2 46.8 19.5 -4.9
2 Bahweting Anishnabe PSA K-7 n/a 12.1 0.0 10.2 0.0 13.4 -13.4 0.0 3.2 1.3
3 Bay-Arenac Comm. H.S. 9-12 n/a 10.3 n/a 12.5 n/a 16.9 4.4 6.64 Black River Public School 6-10 n/d 19.1 20.0 26.9 23.6 31.9 -8.3 3.6 5.0 12.8
5 Gasman Alternative 7-12 n/d 27.0 n/d 24.4 0.0 31.2 -31.2 6.8 4.26 Concord Academy-Boyne K-11 n/d 4.3 50.0 17.6 30.0 32.0 -2.0 -20.0 14.4 27.77 Concord Acad.-Petoskey K-12 n/d 27.4 10.0 30.4 38.5 33.9 4.6 28.5 3.5 6.58 Countryside Charter Sch. K-8 n/d 6.6 n/d 20.5 0.0 1.8 -1.8 -18.7 -4.89 Creative Learning Acad.
of Sci., Math.& Hum.K-6 n/a 20.3 n/a 10.5 n/a 12.3 1.8 -8.0
10 Cross Creek Charter K-5 n/a 17.3 n/a 55.3 n/a 47.3 -8.0 30.011 da Vinci Institute 9-12 n/a 10.4 n/a 10.3 n/a 14.0 3.7 3.612 Discovery Elementary K-5 n/a 10.5 n/a 13.2 n/a 5.6 -7.6 -4.913 Eagle's Crest Charter K-5 n/a 32.9 n/a 21.3 n/a 33.1 11.8 0.214 El-Hajj Malik EI-Shabazz K-8 n/a 11.0 n/a 12.4 n/a 11.6 -0.8 0.615 Excel Charter Academy K-6 n/a 13.7 n/a 6.7 n/a 11.4 4.7 -2.316 Gateway Middle High 7-9 n/d 13.7 n/d 6.7 2.0 11.4 -9.4 4.7 -2.317 Grattan Academy K-6 n/a 8.0 n/a 13.0 n/a 12.4 -0.6 4.418 Horizons Community H.S. 9-12 n/a 46.9 n/a 26.6 n/a 30.3 3.7 -16.619 Island City Academy K-8 n/d 27.7 0.0 13.7 5.9 12.6 -6.7 5.9 -1.1 -15.120 Knapp Charter Academy K-5 n/a 56.0 n/a 51.3 n/a 59.3 8.0 3.321 Lake Bluff Acad.
(Newland Academy)K-5 n/a 53.3 n/a 27.0 n/a 30.6 3.6 -22.7
22 Lakeshore Public Acad. K-12 n/d 13.8 12.5 37.5 16.7 24.1 -7.4 4.2 -13.4 10.323 Learning Center Academy K-8 n/d 24.2 n/d 21.1 10.0 24.5 -14.5 3.4 0.324 Michigan Early Elementary K-3 n/a 11.0 n/a 12.4 n/a 11.6 -0.8 0.625 Midland Acad. of Adv.
and Creative StudiesK-6 n/a 45.6 n/a 40.6 n/a 42.0 1.4 -3.6
26 Mid-Michigan PSA K-5 n/a 11.0 n/a 12.4 2.0 11.6 -9.6 -0.8 0.627 Morey Charter School K-6 n/a 18.3 n/a 12.5 n/a 32.0 19.5 13.728 Nah Tah Wahsh PSA K-12 0.0 34.0 0.0 11.1 0.0 17.1 -17.1 0.0 6.0 0.0 -16.929 New Branches School K-12 n/a 13.7 n/a 6.7 n/a 11.4 4.7 -2.330 New School for Creative K-5 n/a 13.7 n/a 6.7 n/a 11.4 4.7 -2.331 Northside Preparatory K-2 n/a 15.8 n/a 10.2 n/a 14.0 3.8 -1.832 Northwest Academy 6-12 n/d 21.2 27.3 18.4 41.2 24.2 17.0 13.9 5.8 3.033 Pansophia Academy K-12 14.3 17.3 0.0 10.6 0.0 19.8 -19.8 0.0 9.2 -14.3 2.534 Renaissance PSA 5-8 n/d 18.3 8.3 12.5 10.3 32.0 -21.7 2.0 19.5 13.735 Sankofa Shule Academy K-4 n/a 11.0 n/a 12.4 n/a 11.6 -0.8 0.636 Sauk Trail Academy K-8 n/d 13.5 n/d 16.0 0.0 18.8 -18.8 2.8 5.337 Sunrise Education Center K-6 n/a 31.9 n/a 13.5 n/a 26.4 12.9 -5.538 Threshold Academy K-3 n/a 19.2 n/a 19.1 n/a 16.8 -2.3 -2.439 Traverse Bay Comm. Sch. K-7 n/a 30.2 36.8 30.6 33.3 34.2 -0.9 -3.5 3.6 4.040 Tri High School 7-12 n/d 24.0 n/d 25.4 n/d 11.5 -13.9 -12.541 TriValley Academy 5-10 0.0 10.6 0.0 4.6 3.4 6.4 -3.0 3.4 1.8 3.4 -4.242 Vanderbilt Charter Acad. K-5 n/a 19.1 n/a 26.9 n/a 31.9 5.0 12.843 Vanguard Charter Acad. K-5 n/a 46.9 n/a 26.6 n/a 30.3 3.7 -16.644 Vista Charter Academy K-5 n/a 39.5 n/a 46.3 n/a 44.7 -1.6 5.245 Walden Green Day Sch. K-8 n/d 35.2 n/d 19.3 n/d 33.3 14.0 -1.946 Walker Charter Academy K-5 n/a 43.7 n/a 16.7 n/a 39.8 23.1 -3.947 Walter French Academy
of Business. & Tech.6-12 n/d 11.0 7.8 12.4 5.6 11.6 -6.0 -2.2 -0.8 0.6
48 West Mich. Academyfor Arts & Academics
K-8 n/d 33.3 0.0 21.4 44.4 28.2 16.2 44.4 6.8 -5.1
49 West Mich. Academyfor Hospitality Sciences
9-12 n/a 13.7 n/a 6.7 n/a 11.4 4.7 -2.3
50 West Mich. Academy ofEnvironmental Science
K-9 16.7 43.7 16.7 16.7 7.1 39.8 -32.7 -9.6 23.1 -9.6 -3.9
51 Windover High School 9-12 n/a 45.6 n/a 40.6 n/a 42.0 1.4 -3.6State of Michigan 21.5 17.5 22.0 4.5 0.5
NOTE: Source of data is Michigan School Report. 'n/a' indicates not applicable; 'n/d' indicates no data submitted.
162
Appendix P MEAP Test Scores in Science Grade 8ID PSAs evaluated by PSC Grades
PSA1995/96
Host Dist.1995/96
PSA1996/97
Host Dist.1996/97
PSA1997/98
Host Dist.1997/98
Difference1997/98
PSA2 yr. diff.
Host Dist.2-yr. diff.
PSA3 yr. dill.
Host Dist.3-yr. dill.
EMU--Acad For Bus & Int Si 9-12 n/a 3.2 n/a 0.0 0.0 1.3 -1.3 1.3 -1.9CMU--Benito Juarez Acader 9-12 Na 7.3 n/a 4.7 n/a 12.0 7.3 4.7SVSU--Detroit Community I- 9-12 n/a 7.9 n/a 10.6 n/a 9.9 -0.7 2.0Wayne RESA--Ser Casa Er 7-12 0.0 7.9 0.0 10.6 0.0 9.9 -9.9 0.0 -0.7 0.0 2.0Saginaw ISD--Acad For Tec 9-12 n/a 7.3 n/a 4.7 Na 12.0 7.3 4.7CMU -- Academy Of Detroit-E K-7 n/a 6.8 n/a 11.6 n/a 38.5 26.9 31.7CMU--Academy Of Det @ E K-7 n/a 12.2 n/a 11.9 n/a 15.6 3.7 3.4CMU--Academy Of Detroit-1 K-7 n/a 7.9 n/a 10.6 n/a 9.9 -0.7 2.0CMU--Academy Of Detroit-1 K-7 n/a 12.5 n/a 9.8 n/a 12.5 2.7 0.0Oakland U--Academy Of Mir 9 n/a 6.8 n/a 11.6 n/a 38.5 26.9 31.7CMU--A.G.B.U. Manoogian K-10 23.5 12.2 6.3 11.9 45.5 15.6 29.9 39.2 3.7 22.0 3.4CMU--Central Academy K-12 n/d 37.5 0.0 38.4 12.5 40.3 -27.8 12.5 1.9 2.8SVSU--Cesar Chavez Acad K-8 n/d 7.9 n/a 10.6 0.0 9.9 -9.9 -0.7 2.0SVSU--Chandler Park Acad. K-6 n/a 7.9 n/a 10.6 n/a 9.9 -0.7 2.0SVSU--Chatfield School K-6 n/a 23.4 n/a 11.7 n/a 17.4 5.7 -6.0CMU--Colin Powell Academ' K-5 n/a 7.9 n/a 10.6 Na 9.9 -0.7 2.0EMU--Commonwealth Comt 6-8 n/d 7.9 0.0 10.6 0.0 9.9 -9.9 0.0 -0.7 2.0Saginaw ISD-Curtis House i 7-12 n/d 48.1 n/d 29.9 0.0 39.8 -39.8 9.9 -8.3CMU--The Dearborn Acader K-6 Na 20.1 n/a 22.5 n/a 22.0 -0.5 1.9CMU -- Detroit Academy Of / K-5 n/a 7.9 n/a 10.6 Na 9.9 -0.7 2.0University Public School 6-8 n/d 7.9 n/d 10.6 n/d 9.9 -0.7 2.0CMU--Detroit Sch Of Ind Ar 9-10 n/a 7.9 n/a 10.6 n/a 9.9 -0.7 2.0Oakland U--Dove Acad Detr K-4 n/a 7.9 n/a 10.6 n/a 9.9 -0.7 2.0Oakland U--E T Clark Acad( K-5 n/a 7.9 n/a 10.6 n/a 9.9 -0.7 2.0EMU--Gaudior Academy K-8 n/d 12.5 14.3 9.8 27.3 12.5 14.8 13.0 2.7 0.0EMU--Great Lakes Academ' K-3 n/a 7.2 n/a , 5.2 n/a 7.8 2.6 0.6SVSU--Heart Academy 11-12 n/a 7.9 n/a 10.6 n/a 9.9 -0.7 2.0Wayne RESA--H. Ford Acar 9 n/a 20.1 n/a 22.5 n/a 22.0 -0.5 1.9Wash ISD-Honey Creek Col K-5 n/a 37.5 n/a 38.4 n/a 40.3 1.9 2.8Inkster PS--King Academy K-6 n/a 3.2 n/a 0.0 n/a 1.3 1.3 -1.9CMU--Livingston Develop Ai K-6 n/a 41.0 n/a 24.6 n/a 33.0 8.4 -8.0CMU--Livingston Tech Acad 11-12 n/a 21.8 n/a 22.8 n/a 26.9 4.1 5.1CMU--Macomb Academy 12 n/a 30.0 n/a 24.0 n/a 32.6 8.6 2.6CMU--Michigan Automotive 10-12 n/a 7.9 n/a 10.6 Na 9.9 -0.7 2.0SVSU--Michigan Health Aca 11-12 n/a 29.7 n/a 12.3 n/a 12.0 -0.3 -17.7SVSU--ML Winans Acad Of K-5 n/a 7.9 n/a 10.6 n/a 9.9 -0.7 2.0Det Publ Schs-MLK Jr. Ed. K-6 n/a 3.2 n/a 0.0 n/a 1.3 1.3 -1.9SVSU--Mosaica Academy C K-5 n/a 0.0 n/a 0.9 n/a 8.7 7.8 8.7CMU--Nataki Talibah Schoo K-5 n/a 7.9 n/a 10.6 n/a 9.9 -0.7 2.0SVSU--New Directions Instil 9-12 Na 7.2 n/a 5.2 n/a 7.8 2.6 0.6Oakland U--Nsoroma Institu K-8 n/d 0.0 Nd 0.0 25.0 2.2 22.8 2.2 2.2CMU--Oasis Academy K-4 n/a 12.2 n/a 11.9 n/a 15.6 3.7 3.4CMU--Plymouth Educationa K-3 n/a 7.9 n/a 10.6 n/a 9.9 -0.7 2.0CMU--Questar Academy K-6 n/a 23.0 n/a 19.9 n/a 17.5 -2.4 -5.5Saginaw ISD--Saginaw Co 1 9-12 n/a 7.3 n/a 4.7 Na 12.0 7.3 4.7CMU--Sierra Leone Ed Outr K-6 n/a 7.9 n/a 10.6 n/a 9.9 -0.7 2.0St Clair ISD-St Clair Learn P 6-12 0.0 24.0 Nd 20.5 0.0 19.4 -19.4 -1.1 0.0 -4.6CMU--Summit Academy K-5 n/a 15.5 Na 14.5 7.7 8.0 -0.3 -6.5 -7.5CMU--Thomas-Gist Acaderr K-8 n/a 7.9 0.0 10.6 0.0 9.9 -9.9 0.0 -0.7 2.0Oakland U--Turtle Island 6-10 Nd 21.3 n/d 17.2 7.7 27.0 -19.3 9.8 5.7CMU--Warwick Pointe Acad K-5 n/a 31.7 n/a 26.6 n/a 35.1 8.5 3.4Washtenaw CC-Wash. Ted 10-11 n/a 37.5 n/a 38.4 n/a 40.3 1.9 2.8CMU--Woodward Academy 3-6 n/a 7.9 n/a 10.6 n/a 9.9 -0.7 2.0CMU--Acad Of Detroit Oak I K-12 n/d 6.8 0.0 11.6 0.0 38.5 -38.5 0.0 26.9 31.7Det Board Of Ed--WEB Dub K-12 11.1 7.9 6.7 10.6 6.7 9.9 -3.2 0.0 -0.7 -4.4 2.0State of Michigan 21.5 17.5 22.0 4.5 0.5
NOTE: Source of data is Michigan School Report. 'n/a' indicates not applicable; 'n/d' indicates no data submitted.
163
Appendix P MEAP Test Scores in Science - Grade 11Percentage of Students Achieving 'Satisfactory' Status. Comparisons of PSAs and Their Host Districts.
ID PSAs evaluated by WMU Grades Host DistrictPSA
1995/96Host Dist.1995/96
PSA1996/97
Host Dist.1996/97
Difference1996/97
PSA2 yr. diff.
Host Dist.2-yr. diff.
1 Acad. of Health and Sci. 11-12 Northview n/d 49.6 n/d 54.3 4.72 Bahweting Anishnabe PSA K-7 Sault Ste. Marie n/a 23.9 n/a 31.7 7.83 Bay-Arenac Comm. H.S. 9-12 Essexville-Hampton n/d 50.7 0.0 37.6 -37.6 -13.14 Black River Public School 6-10 Holland n/a 32.4 n/a 56.6 24.25 Casman Alternative Academy 7-12 Manistee n/d 40.2 n/d 49.0 8.86 Concord Academy-Boyne K-11 Boyne Falls n/d 19.0 n/a 22.2 3.27 Concord Acad.-Petoskey K-12 Petoskey n/d 50.3 27.3 48.3 -21.0 -2.08 Countryside Charter Sch. K-8 Benton Harbor n/a 1.0 n/a 8.6 7.69 Creative Learning Acad.
of Sci., Math.& Hum.K-6
Beavertonn/a 26.4 n/a 29.3 2.9
10 Cross Creek Charter Academy K-5 Caledonia n/a 45.1 n/a 51.3 6.211 da Vinci Institute 9-12 Jackson 29.4 23.7 39.4 27.9 11.5 10.0 4.212 Discovery Elementary School K-5 Fennville n/a 21.1 n/a 29.6 8.513 Eagle's Crest Charter Academy K-5 West Ottawa n/a 43.6 n/a 49.9 6.314 El-Hajj Malik EI-Shabazz K-8 Lansing n/a 18.3 n/a 26.9 8.615 Excel Charter Academy K-6 Grand Rapids n/a 20.3 n/a 29.7 9.416 Gateway Middle High School 7-9 Grand Rapids n/a 20.3 n/a 29.7 9.417 Grattan Academy K-6 Belding n/a 27.7 n/a 25.4 -2.318 Horizons Community H.S. 9-12 Wyoming 23.5 46.0 25.0 60.4 -35.4 1.5 14.419 Island City Academy K-8 Eaton Rapids n/a 28.2 n/a 43.7 15.520 Knapp Charter Academy K-5 Forest Hills n/a 66.6 n/a 73.5 6.921 Lake Bluff Acad.
(Newland Academy)K-5
Onekaman/a 61.5 n/a 60.5 -1.0
22 Lakeshore Public Acad. K-12 Pentwater n/d 60.0 n/a 55.6 -4.423 Learning Center Academy K-8 Byron Center n/a 34.0 n/a 60.0 26.024 Michigan Early Elementary K-3 Lansing n/a 18.3 n/a 26.9 8.625 Midland Acad. of Adv.
and Creative StudiesK-6
Midland n/a 54.1 n/a 54.3 0.2
26 Mid-Michigan PSA K-5 Lansing n/a 18.3 n/a 26.9 8.627 Morey Charter School K-6 Mt. Pleasant n/a 45.9 n/a 46.6 0.728 Nah Tah Wahsh PSA K-12 Bark River-Harris 8.3 51.5 0.0 55.3 -55.3 -8.3 3.829 New Branches School K-12 Grand Rapids n/a 20.3 n/a 29.7 9.430 New School for Creative K-5 Grand Rapids n/a 20.3 n/a 29.7 9.431 Northside Preparatory School K-2 Kalamazoo n/a 26.9 n/a 35.2 8.332 Northwest Academy 6-12 Charlevoix n/d 47.9 33.3 54.7 -21.4 6.833 Pansophia Academy K-12 Coldwater 0.0 36.4 15.4 42.1 -26.7 15.4 5.734 Renaissance PSA 5-8 Mt. Pleasant n/a 45.9 n/a 46.6 0.735 Sankofa Shule Academy K-4 Lansing n/a 18.3 n/a 26.9 8.636 Sauk Trail Academy K-8 Hillsdale n/a 27.3 n/a 26.8 -0.537 Sunrise Education Center K-6 Tawas n/a 32.3 n/a 51.3 19.038 Threshold Academy K-3 Greenville n/a 29.9 n/a 43.0 13.139 Traverse Bay Comm. Sch. K-7 Elk Rapids n/a 52.2 n/a 53.1 0.940 Tri High School 7-12 N.I.C.E. n/d 41.6 n/d 46.7 5.141 TriValley Academy 5-10 Muskegon n/a 17.0 n/a 22.9 5.942 Vanderbilt Charter Acad. K-5 Holland n/a 32.4 n/a 56.6 24.243 Vanguard Charter Acad. K-5 Wyoming n/a 46.0 n/a 60.4 14.444 Vista Charter Academy K-5 Godwin Heights n/a 26.8 n/a 18.6 -8.245 Walden Green Day Sch. K-8 Spring Lake n/a 40.3 n/a 65.1 .24.846 Walker Charter Academy K-5 Kenowa Hills n/a 32.8 n/a 35.3 2.547 Walter French Academy
of Business. & Tech.6-12
Lansingn/d 18.3 20.6 26.9 -6.3 8.6
48 West Mich. Academyfor Arts & Academics
K-8Grand Haven
n/a 36.1 12.5 56.7 -44.2 20.6
49 West Mich. Academyfor Hospitality Sciences
9-12Grand Rapids
33.3 20.3 33.3 29.7 3.6 0.0 9.4
50 West Mich. Academy ofEnvironmental Science
K-9Kenowa Hills
Na 32.8 Na 35.3 2.5
51 Windover High School 9-12 Midland 3.7 54.1 22.6 54.3 -31.7 18.9 0.2State of Michigan State of Michigan 32.0 38.5 6.5
NOTE: Source of data is Michigan School Report. 'n/a' indicates not applicable; 'n/d' indicates no data submitted.Ai
Lti
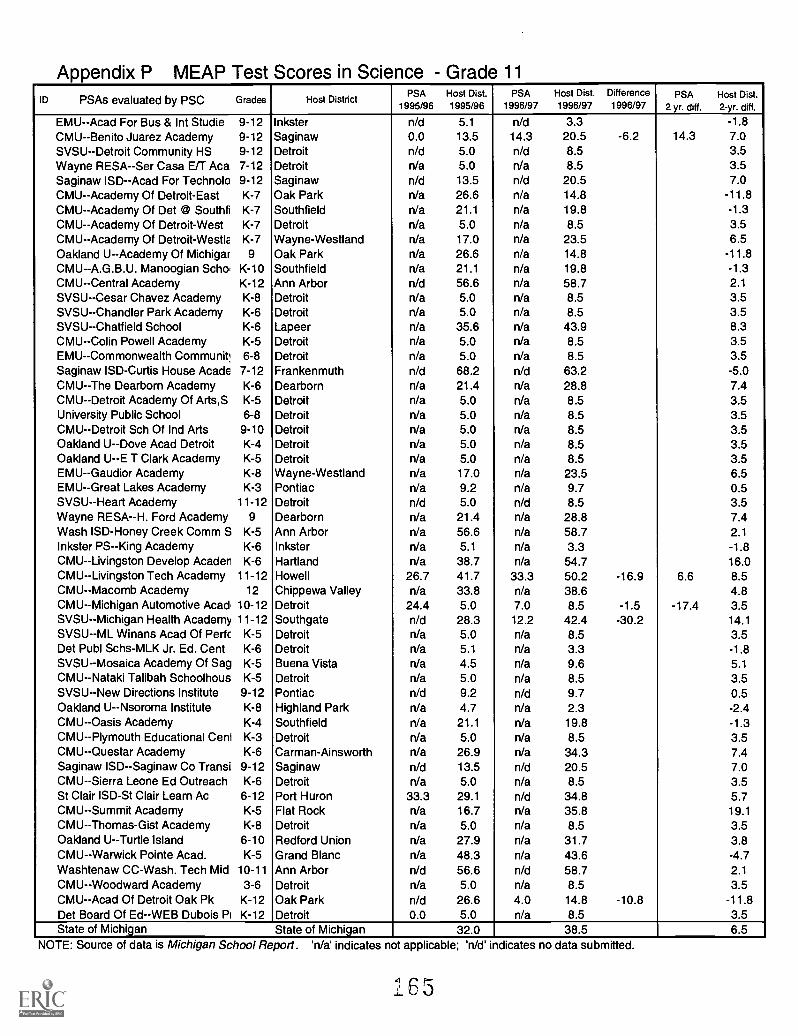
Appendix P MEAP Test Scores in Science - Grade 11ID PSAs evaluated by PSC Grades Host District
PSA1995/96
Host Dist.1995/96
PSA1996/97
Host Dist.1996/97
Difference1996/97
PSA2 yr. diff.
Host Dist.2-yr. diff.
EMU--Acad For Bus & Int Studie 9-12 Inkster n/d 5.1 n/d 3.3 -1.8CMU--Benito Juarez Academy 9-12 Saginaw 0.0 13.5 14.3 20.5 -6.2 14.3 7.0SVSU--Detroit Community HS 9-12 Detroit n/d 5.0 n/d 8.5 3.5Wayne RESA--Ser Casa UT Aca 7-12 Detroit n/a 5.0 n/a 8.5 3.5Saginaw ISD--Acad For Technolo 9-12 Saginaw n/d 13.5 n/d 20.5 7.0CMU--Academy Of Detroit-East K-7 Oak Park n/a 26.6 n/a 14.8 -11.8CMU-Academy Of Det © Southfi K-7 Southfield n/a 21.1 n/a 19.8 -1.3CMU--Academy Of Detroit-West K-7 Detroit n/a 5.0 n/a 8.5 3.5CMU--Academy Of Detroit-WestlE K-7 Wayne-Westland n/a 17.0 n/a 23.5 6.5Oakland U--Academy Of Michigar 9 Oak Park n/a 26.6 n/a 14.8 -11.8CMU--A.G.B.U. Manoogian Scho, K-10 Southfield n/a 21.1 n/a 19.8 -1.3CMU--Central Academy K-12 Ann Arbor n/d 56.6 n/a 58.7 2.1
SVSU--Cesar Chavez Academy K-8 Detroit n/a 5.0 n/a 8.5 3.5SVSU--Chandler Park Academy K-6 Detroit n/a 5.0 n/a 8.5 3.5SVSU--Chatfield School K-6 Lapeer n/a 35.6 n/a 43.9 8.3CMU--Colin Powell Academy K-5 Detroit n/a 5.0 n/a 8.5 3.5EMU -- Commonwealth Communit' 6-8 Detroit n/a 5.0 n/a 8.5 3.5Saginaw ISD-Curtis House Acade 7-12 Frankenmuth n/d 68.2 n/d 63.2 -5.0CMU--The Dearborn Academy K-6 Dearborn n/a 21.4 n/a 28.8 7.4CMU--Detroit Academy Of Arts,S K-5 Detroit n/a 5.0 n/a 8.5 3.5University Public School 6-8 Detroit n/a 5.0 n/a 8.5 3.5CMU--Detroit Sch Of Ind Arts 9-10 Detroit n/a 5.0 n/a 8.5 3.5Oakland U--Dove Acad Detroit K-4 Detroit n/a 5.0 n/a 8.5 3.5Oakland U--E T Clark Academy K-5 Detroit n/a 5.0 n/a 8.5 3.5EMU--Gaudior Academy K-8 Wayne-Westland n/a 17.0 n/a 23.5 6.5EMU--Great Lakes Academy K-3 Pontiac n/a 9.2 n/a 9.7 0.5SVSU - -Heart Academy 11-12 Detroit n/d 5.0 n/d 8.5 3.5Wayne RESA--H. Ford Academy 9 Dearborn n/a 21.4 n/a 28.8 7.4Wash ISD-Honey Creek Comm S K-5 Ann Arbor n/a 56.6 n/a 58.7 2.1Inkster PS--King Academy K-6 Inkster n/a 5.1 n/a 3.3 -1.8CMU--Livingston Develop Acaden K-6 Hartland n/a 38.7 n/a 54.7 16.0CMU--Livingston Tech Academy 11-12 Howell 26.7 41.7 33.3 50.2 -16.9 6.6 8.5CMU--Macomb Academy 12 Chippewa Valley n/a 33.8 n/a 38.6 4.8CMU--Michigan Automotive Acad, 10-12 Detroit 24.4 5.0 7.0 8.5 -1.5 -17.4 3.5SVSU--Michigan Health Academy 11-12 Southgate n/d 28.3 12.2 42.4 -30.2 14.1SVSU--ML Winans Acad Of Perk K-5 Detroit n/a 5.0 n/a 8.5 3.5Det Publ Schs-MLK Jr. Ed. Cent K-6 Detroit n/a 5.1 n/a 3.3 -1.8SVSU--Mosaica Academy Of Sag K-5 Buena Vista n/a 4.5 n/a 9.6 5.1CMU--Nataki Talibah Schoolhous K-5 Detroit n/a 5.0 n/a 8.5 3.5SVSU--New Directions Institute 9-12 Pontiac n/d 9.2 n/d 9.7 0.5Oakland U--Nsoroma Institute K-8 Highland Park n/a 4.7 n/a 2.3 -2.4CMU--Oasis Academy K-4 Southfield n/a 21.1 n/a 19.8 -1.3CMU--Plymouth Educational Ceni K-3 Detroit n/a 5.0 n/a 8.5 3.5CMU--Questar Academy K-6 Carman-Ainsworth n/a 26.9 n/a 34.3 7.4Saginaw ISD--Saginaw Co Transi 9-12 Saginaw n/d 13.5 n/d 20.5 7.0CMU--Sierra Leone Ed Outreach K-6 Detroit n/a 5.0 n/a 8.5 3.5St Clair ISD-St Clair Learn Ac 6-12 Port Huron 33.3 29.1 n/d 34.8 5.7CMU--Summit Academy K-5 Flat Rock n/a 16.7 n/a 35.8 19.1CMU--Thomas-Gist Academy K-8 Detroit n/a 5.0 n/a 8.5 3.5Oakland U--Turtle Island 6-10 Redford Union n/a 27.9 n/a 31.7 3.8CMU--Warwick Pointe Acad. K-5 Grand Blanc n/a 48.3 n/a 43.6 -4.7Washtenaw CC-Wash. Tech Mid 10-11 Ann Arbor n/d 56.6 n/d 58.7 2.1CMU--Woodward Academy 3-6 Detroit n/a 5.0 n/a 8.5 3.5CMU--Acad Of Detroit Oak Pk K-12 Oak Park n/d 26.6 4.0 14.8 -10.8 -11.8Det Board Of Ed--WEB Dubois Pi K-12 Detroit 0.0 5.0 n/a 8.5 3.5State of Michigan State of Michigan 32.0 38.5 6.5
NOTE: Source of data is Michigan School Report. 'n/a' indicates not applicable; 'n/d' indicates no data submitted.
165
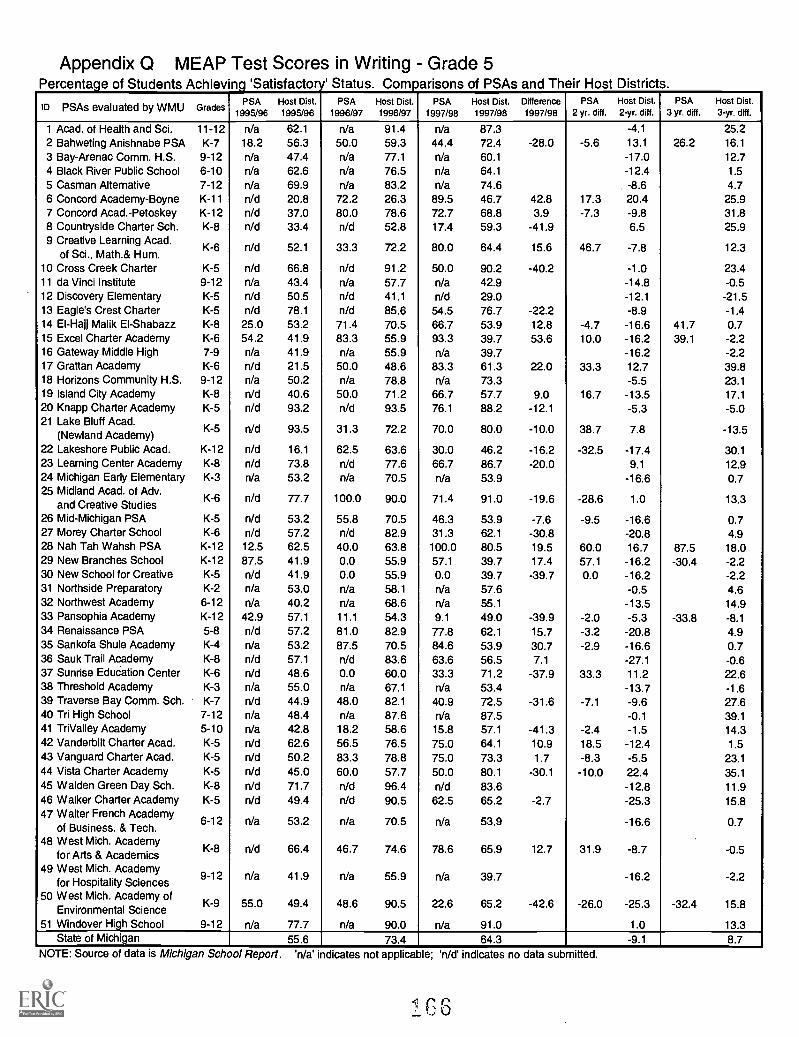
Appendix Q MEAP Test Scores in Writing Grade 5Percentage of Students Achieving 'Satisfactory' Status. Comparisons of PSAs and Their Host Districts.
ID PSAs evaluated by WMU GradesPSA
1995/96Host Dist.1995/96
PSA1996/97
Host Dist.1996/97
PSA1997/98
Host Dist.1997/98
Difference1997/98
PSA2 yr. diff.
Host Dist.2-yr. diff.
PSA3 yr. diff.
Host Dist.3-yr. diff.
1 Acad. of Health and Sci. 11-12 n/a 62.1 n/a 91.4 Na 87.3 -4.1 25.22 Bahweting Anishnabe PSA K-7 18.2 56.3 50.0 59.3 44.4 72.4 -28.0 -5.6 13.1 26.2 16.1
3 Bay-Arenac Comm. H.S. 9-12 Na 47.4 n/a 77.1 n/a 60.1 -17.0 12.74 Black River Public School 6-10 n/a 62.6 n/a 76.5 n/a 64.1 -12.4 1.55 Casman Alternative 7-12 n/a 69.9 n/a 83.2 n/a 74.6 -8.6 4.76 Concord Academy-Boyne K-11 n/d 20.8 72.2 26.3 89.5 46.7 42.8 17.3 20.4 25.97 Concord Acad.-Petoskey K-12 n/d 37.0 80.0 78.6 72.7 68.8 3.9 -7.3 -9.8 31.88 Countryside Charter Sch. K-8 n/d 33.4 n/d 52.8 17.4 59.3 -41.9 6.5 25.99 Creative Learning Acad.
of Sci., Math.& Hum.K-6 n/d 52.1 33.3 72.2 80.0 64.4 15.6 46.7 -7.8 12.3
10 Cross Creek Charter K-5 Nd 66.8 n/d 91.2 50.0 90.2 -40.2 -1.0 23.411 da Vinci Institute 9-12 n/a 43.4 n/a 57.7 n/a 42.9 -14.8 -0.512 Discovery Elementary K-5 Nd 50.5 n/d 41.1 n/d 29.0 -12.1 -21.513 Eagles Crest Charter K-5 n/d 78.1 n/d 85.6 54.5 76.7 -22.2 -8.9 -1.414 El-Hajj Malik EI-Shabazz K-8 25.0 53.2 71.4 70.5 66.7 53.9 12.8 -4.7 -16.6 41.7 0.715 Excel Charter Academy K-6 54.2 41.9 83.3 55.9 93.3 39.7 53.6 10.0 -16.2 39.1 -2.216 Gateway Middle High 7-9 n/a 41.9 Na 55.9 Na 39.7 -16.2 -2.217 Grattan Academy K-6 n/d 21.5 50.0 48.6 83.3 61.3 22.0 33.3 12.7 39.818 Horizons Community H.S. 9-12 n/a 50.2 n/a 78.8 n/a 73.3 -5.5 23.119 Island City Academy K-8 n/d 40.6 50.0 71.2 66.7 57.7 9.0 16.7 -13.5 17.120 Knapp Charter Academy K-5 n/d 93.2 n/d 93.5 76.1 88.2 -12.1 -5.3 -5.021 Lake Bluff Acad.
(Newland Academy)K-5 n/d 93.5 31.3 72.2 70.0 80.0 -10.0 38.7 7.8 -13.5
22 Lakeshore Public Acad. K-12 n/d 16.1 62.5 63.6 30.0 46.2 -16.2 -32.5 -17.4 30.123 Learning Center Academy K-8 n/d 73.8 n/d 77.6 66.7 86.7 -20.0 9.1 12.924 Michigan Early Elementary K-3 n/a 53.2 n/a 70.5 n/a 53.9 -16.6 0.725 Midland Acad. of Adv.
and Creative StudiesK-6 n/d 77.7 100.0 90.0 71.4 91.0 -19.6 -28.6 1.0 13.3
26 Mid-Michigan PSA K-5 n/d 53.2 55.8 70.5 46.3 53.9 -7.6 -9.5 -16.6 0.727 Morey Charter School K-6 n/d 57.2 n/d 82.9 31.3 62.1 -30.8 -20.8 4.928 Nah Tah Wahsh PSA K-12 12.5 62.5 40.0 63.8 100.0 80.5 19.5 60.0 16.7 87.5 18.029 New Branches School K-12 87.5 41.9 0.0 55.9 57.1 39.7 17.4 57.1 -16.2 -30.4 -2.230 New School for Creative K-5 Nd 41.9 0.0 55.9 0.0 39.7 -39.7 0.0 -16.2 -2.231 Northside Preparatory K-2 n/a 53.0 n/a 58.1 n/a 57.6 -0.5 4.632 Northwest Academy 6-12 n/a 40.2 n/a 68.6 n/a 55.1 -13.5 14.933 Pansophia Academy K-12 42.9 57.1 11.1 54.3 9.1 49.0 -39.9 -2.0 -5.3 -33.8 -8.134 Renaissance PSA 5-8 n/d 57.2 81.0 82.9 77.8 62.1 15.7 -3.2 -20.8 4.935 Sankofa Shule Academy K-4 n/a 53.2 87.5 70.5 84.6 53.9 30.7 -2.9 -16.6 0.736 Sauk Trail Academy K-8 n/d 57.1 n/d 83.6 63.6 56.5 7.1 -27.1 -0.637 Sunrise Education Center K-6 n/d 48.6 0.0 60.0 33.3 71.2 -37.9 33.3 11.2 22.638 Threshold Academy K-3 n/a 55.0 n/a 67.1 n/a 53.4 -13.7 -1.639 Traverse Bay Comm. Sch. K-7 n/d 44.9 48.0 82.1 40.9 72.5 -31.6 -7.1 -9.6 27.640 Tri High School 7-12 n/a 48.4 n/a 87.6 n/a 87.5 -0.1 39.141 TriValley Academy 5-10 n/a 42.8 18.2 58.6 15.8 57.1 -41.3 -2.4 -1.5 14.342 Vanderbilt Charter Acad. K-5 n/d 62.6 56.5 76.5 75.0 64.1 10.9 18.5 -12.4 1.543 Vanguard Charter Acad. K-5 Nd 50.2 83.3 78.8 75.0 73.3 1.7 -8.3 -5.5 23.144 Vista Charter Academy K-5 Nd 45.0 60.0 57.7 50.0 80.1 -30.1 -10.0 22.4 35.145 Walden Green Day Sch. K-8 n/d 71.7 n/d 96.4 n/d 83.6 -12.8 11.946 Walker Charter Academy K-5 n/d 49.4 n/d 90.5 62.5 65.2 -2.7 -25.3 15.847 Walter French Academy
of Business. & Tech.6-12 n/a 53.2 Na 70.5 n/a 53.9 -16.6 0.7
48 West Mich. Academyfor Arts & Academics
K-8 n/d 66.4 46.7 74.6 78.6 65.9 12.7 31.9 -8.7 -0.5
49 West Mich. Academyfor Hospitality Sciences
9-12 n/a 41.9 Na 55.9 n/a 39.7 -16.2 -2.2
50 West Mich. Academy ofEnvironmental Science
K-9 55.0 49.4 48.6 90.5 22.6 65.2 -42.6 -26.0 -25.3 -32.4 15.8
51 Windover High School 9-12 n/a 77.7 n/a 90.0 n/a 91.0 1.0 13.3State of Michigan 55.6 73.4 64.3 -9.1 8.7
NOTE: Source of data is Michigan School Report. 'Na' indicates not applicable; 'n/d' indicates no data submitted.
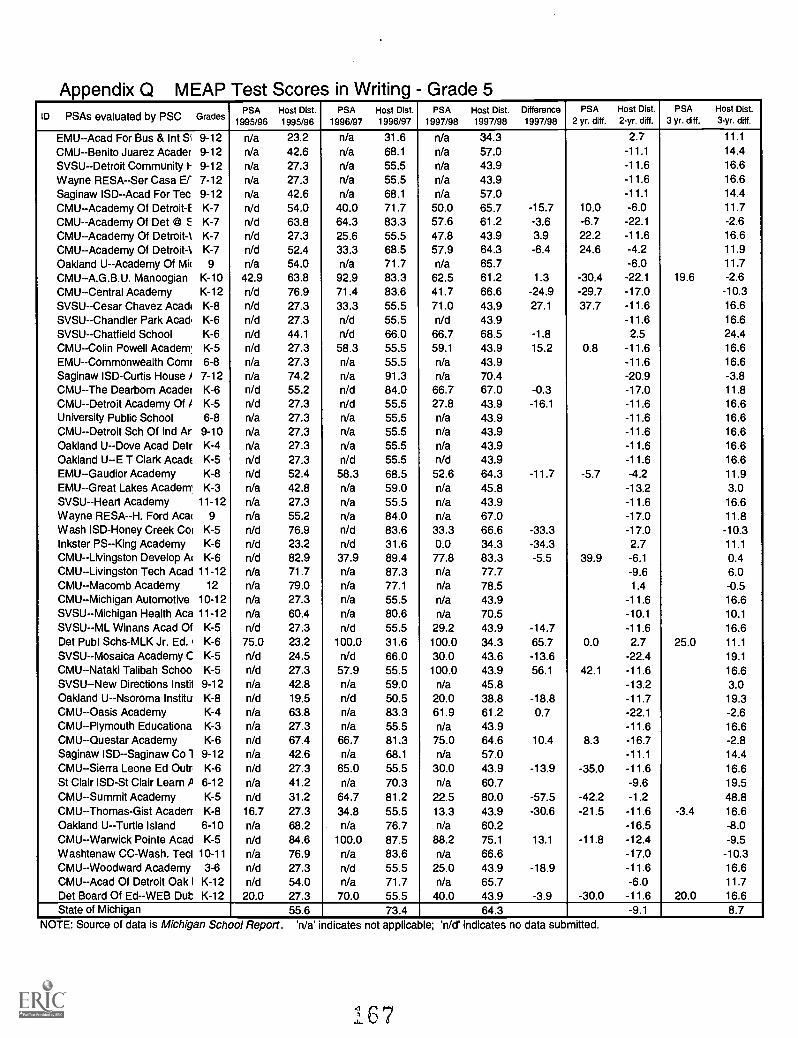
Appendix Q MEAP Test Scores in Writing - Grade 5ID PSAs evaluated by PSC Grades
PSA1995/96
Host Dist.1995/96
PSA1996/97
Host Dist.1996/97
PSA1997/98
Host Dist.1997/98
Difference1997/98
PSA2 yr. diff.
Host Dist.2-yr. diff.
PSA3 yr. diff.
Host Dist.3-yr. diff.
EMU--Acad For Bus & Int Si 9-12 n/a 23.2 n/a 31.6 n/a 34.3 2.7 11.1
CMU--Benito Juarez Acader 9-12 n/a 42.6 n/a 68.1 n/a 57.0 -11.1 14.4
SVSU--Detroit Community I- 9-12 n/a 27.3 n/a 55.5 n/a 43.9 -11.6 16.6
Wayne RESA--Ser Casa El 7-12 n/a 27.3 n/a 55.5 n/a 43.9 -11.6 16.6
Saginaw ISD--Acad For Tec 9-12 n/a 42.6 n/a 68.1 n/a 57.0 -11.1 14.4
CMU--Academy Of Detroit-E K-7 n/d 54.0 40.0 71.7 50.0 65.7 -15.7 10.0 -6.0 11.7
CMU--Academy Of Det CO 5 K-7 n/d 63.8 64.3 83.3 57.6 61.2 -3.6 -6.7 -22.1 -2.6
CMU-Academy Of Detroit-s K-7 n/d 27.3 25.6 55.5 47.8 43.9 3.9 22.2 -11.6 16.6
CMU--Academy Of Detroit-% K-7 n/d 52.4 33.3 68.5 57.9 64.3 -6.4 24.6 -4.2 11.9
Oakland U--Academy Of Mk 9 n/a 54.0 n/a 71.7 n/a 65.7 -6.0 11.7
CMU--A.G .B. U. Manoogian K-10 42.9 63.8 92.9 83.3 62.5 61.2 1.3 -30.4 -22.1 19.6 -2.6CMU--Central Academy K-12 n/d 76.9 71.4 83.6 41.7 66.6 -24.9 -29.7 -17.0 -10.3SVSU--Cesar Chavez Acadi K-8 n/d 27.3 33.3 55.5 71.0 43.9 27.1 37.7 -11.6 16.6
SVSU--Chandler Park Acad, K-6 n/d 27.3 n/d 55.5 n/d 43.9 -11.6 16.6SVSU-- Chattield School K-6 n/d 44.1 n/d 66.0 66.7 68.5 -1.8 2.5 24.4CMU--Colin Powell Academ' K-5 n/d 27.3 58.3 55.5 59.1 43.9 15.2 0.8 -11.6 16.6EMU-Commonwealth Com' 6-8 n/a 27.3 n/a 55.5 n/a 43.9 -11.6 16.6Saginaw ISD-Curtis House ) 7-12 n/a 74.2 n/a 91.3 n/a 70.4 -20.9 -3.8CMU--The Dearborn Acader K-6 n/d 55.2 n/d 84.0 66.7 67.0 -0.3 -17.0 11.8CMU-Detroit Academy Off K-5 n/d 27.3 n/d 55.5 27.8 43.9 -16.1 -11.6 16.6University Public School 6-8 n/a 27.3 n/a 55.5 n/a 43.9 -11.6 16.6CMU--Detroit Sch Of Ind Ar 9-10 n/a 27.3 n/a 55.5 n/a 43.9 -11.6 16.6Oakland U--Dove Acad Detr K-4 n/a 27.3 n/a 55.5 n/a 43.9 -11.6 16.6Oakland U--E T Clark Acadc K-5 n/d 27.3 n/d 55.5 n/d 43.9 -11.6 16.6EMU--Gaudior Academy K-8 n/d 52.4 58.3 68.5 52.6 64.3 -11.7 -5.7 -4.2 11.9EMU--Great Lakes Academ' K-3 n/a 42.8 n/a 59.0 n/a 45.8 -13.2 3.0SVSU -Heart Academy 11-12 n/a 27.3 n/a 55.5 n/a 43.9 -11.6 16.6Wayne RESA--H. Ford Aca 9 n/a 55.2 n/a 84.0 n/a 67.0 -17.0 11.8Wash ISD-Honey Creek Col K-5 n/d 76.9 n/d 83.6 33.3 66.6 -33.3 -17.0 -10.3Inkster PS--King Academy K-6 n/d 23.2 n/d 31.6 0.0 34.3 -34.3 2.7 11.1CMU--Livingston Develop Ar K-6 n/d 82.9 37.9 89.4 77.8 83.3 -5.5 39.9 -6.1 0.4CMU--Livingston Tech Acad 11-12 n/a 71.7 n/a 87.3 n/a 77.7 -9.6 6.0CMU--Macomb Academy 12 n/a 79.0 n/a 77.1 n/a 78.5 1.4 -0.5CMU--Michigan Automotive 10-12 n/a 27.3 n/a 55.5 n/a 43.9 -11.6 16.6SVSU--Michigan Health Aca 11-12 n/a 60.4 n/a 80.6 n/a 70.5 -10.1 10.1
SVSU--ML Winans Acad Of K-5 n/d 27.3 n/d 55.5 29.2 43.9 -14.7 -11.6 16.6Det Publ Schs-MLK Jr. Ed.1 K-6 75.0 23.2 100.0 31.6 100.0 34.3 65.7 0.0 2.7 25.0 11.1
SVSU--Mosaica Academy C K-5 n/d 24.5 n/d 66.0 30.0 43.6 -13.6 -22.4 19.1CMU--Nataki Talibah Schoo K-5 n/d 27.3 57.9 55.5 100.0 43.9 56.1 42.1 -11.6 16.6SVSU--New Directions Instil 9-12 n/a 42.8 n/a 59.0 n/a 45.8 -13.2 3.0Oakland U--Nsoroma Institu K-8 n/d 19.5 n/d 50.5 20.0 38.8 -18.8 -11.7 19.3CMU--Oasis Academy K-4 n/a 63.8 n/a 83.3 61.9 61.2 0.7 -22.1 -2.6CMU--Plymouth Educationa K-3 n/a 27.3 n/a 55.5 n/a 43.9 -11.6 16.6CMU--Questar Academy K-6 n/d 67.4 66.7 81.3 75.0 64.6 10.4 8.3 -16.7 -2.8Saginaw ISD--Saginaw Co 1 9-12 n/a 42.6 n/a 68.1 n/a 57.0 -11.1 14.4CMU--Sierra Leone Ed Outr K-6 n/d 27.3 65.0 55.5 30.0 43.9 -13.9 -35.0 -11.6 16.6St Clair ISD-St Clair Learn /3 6-12 n/a 41.2 n/a 70.3 n/a 60.7 -9.6 19.5CMU--Summit Academy K-5 n/d 31.2 64.7 81.2 22.5 80.0 -57.5 -42.2 -1.2 48.8CMU--Thomas-Gist Acaderr K-8 16.7 27.3 34.8 55.5 13.3 43.9 -30.6 -21.5 -11.6 -3.4 16.6Oakland U--Turtle Island 6-10 n/a 68.2 n/a 76.7 n/a 60.2 -16.5 -8.0CMU--Warwick Pointe Acad K-5 n/d 84.6 100.0 87.5 88.2 75.1 13.1 -11.8 -12.4 -9.5Washtenaw CC-Wash. Ted 10-11 n/a 76.9 n/a 83.6 n/a 66.6 -17.0 -10.3CMU--Woodward Academy 3-6 n/d 27.3 n/d 55.5 25.0 43.9 -18.9 -11.6 16.6CMU--Acad Of Detroit Oak I K-12 n/d 54.0 n/a 71.7 n/a 65.7 -6.0 11.7Det Board Of Ed--WEB Dub K-12 20.0 27.3 70.0 55.5 40.0 43.9 -3.9 -30.0 -11.6 20.0 16.6State of Michigan 55.6 73.4 64.3 -9.1 8.7
NOTE: Source of data is Michigan School Report. 'n/a' indicates not applicable; 'n/d' indicates no data submitted.
167
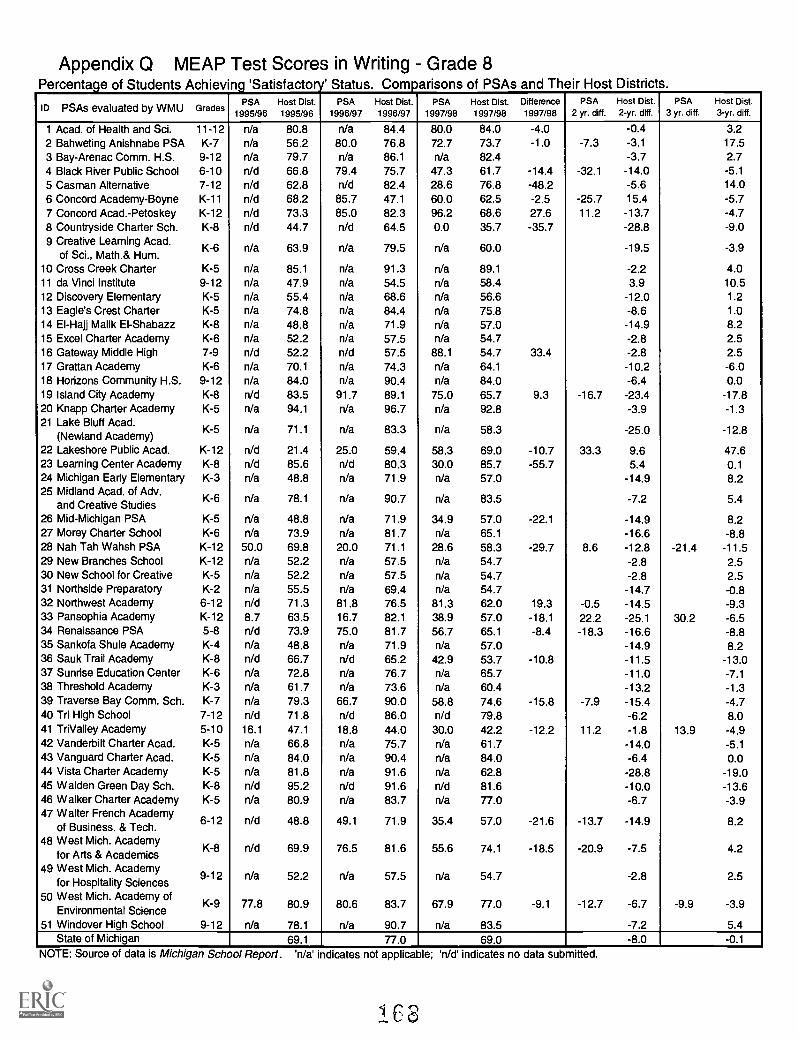
Appendix Q MEAP Test Scores in Writing - Grade 8Percentage of Students Achieving 'Satisfactory' Status. Comparisons of PSAs and Their Host Districts.
ID PSAs evaluated by WMU GradesPSA
1995/96Host Dist.1995/96
PSA1996/97
Host Dist.1996/97
PSA1997/98
Host Dist.1997/98
Difference1997/98
PSA2 yr. diff.
Host Dist.2-yr. diff.
PSA3 yr. diff.
Host Dist.3-yr. diff.
1 Acad. of Health and Sci. 11-12 n/a 80.8 n/a 84.4 80.0 84.0 -4.0 -0.4 3.22 Bahweting Anishnabe PSA K-7 n/a 56.2 80.0 76.8 72.7 73.7 -1.0 -7.3 -3.1 17.5
3 Bay-Arenac Comm. H.S. 9-12 n/a 79.7 n/a 86.1 n/a 82.4 -3.7 2.74 Black River Public School 6-10 n/d 66.8 79.4 75.7 47.3 61.7 -14.4 -32.1 -14.0 -5.1
5 Casman Alternative 7-12 n/d 62.8 n/d 82.4 28.6 76.8 -48.2 -5.6 14.06 Concord Academy-Boyne K-11 n/d 68.2 85.7 47.1 60.0 62.5 -2.5 -25.7 15.4 -5.77 Concord Acad.-Petoskey K-12 n/d 73.3 85.0 82.3 96.2 68.6 27.6 11.2 -13.7 -4.78 Countryside Charter Sch. K-8 n/d 44.7 n/d 64.5 0.0 35.7 -35.7 -28.8 -9.09 Creative Learning Acad.
of Sci., Math.& Hum.K-6 n/a 63.9 n/a 79.5 n/a 60.0 -19.5 -3.9
10 Cross Creek Charter K-5 n/a 85.1 n/a 91.3 n/a 89.1 -2.2 4.011 da Vinci Institute 9-12 n/a 47.9 n/a 54.5 n/a 58.4 3.9 10.512 Discovery Elementary K-5 n/a 55.4 n/a 68.6 n/a 56.6 -12.0 1.213 Eagle's Crest Charter K-5 n/a 74.8 n/a 84.4 n/a 75.8 -8.6 1.014 El-Hajj Malik EI-Shabazz K-8 n/a 48.8 n/a 71.9 n/a 57.0 -14.9 8.215 Excel Charter Academy K-6 n/a 52.2 n/a 57.5 n/a 54.7 -2.8 2.516 Gateway Middle High 7-9 n/d 52.2 n/d 57.5 88.1 54.7 33.4 -2.8 2.517 Grattan Academy K-6 n/a 70.1 n/a 74.3 n/a 64.1 -10.2 -6.018 Horizons Community H.S. 9-12 n/a 84.0 n/a 90.4 n/a 84.0 -6.4 0.019 Island City Academy K-8 n/d 83.5 91.7 89.1 75.0 65.7 9.3 -16.7 -23.4 -17.820 Knapp Charter Academy K-5 n/a 94.1 n/a 96.7 n/a 92.8 -3.9 -1.321 Lake Bluff Acad.
(Newland Academy)K-5 n/a 71.1 n/a 83.3 n/a 58.3 -25.0 -12.8
22 Lakeshore Public Acad. K-12 n/d 21.4 25.0 59.4 58.3 69.0 -10.7 33.3 9.6 47.623 Learning Center Academy K-8 n/d 85.6 n/d 80.3 30.0 85.7 -55.7 5.4 0.124 Michigan Early Elementary K-3 n/a 48.8 n/a 71.9 n/a 57.0 -14.9 8.225 Midland Acad. of Adv.
and Creative StudiesK-6 n/a 78.1 n/a 90.7 n/a 83.5 -7.2 5.4
26 Mid-Michigan PSA K-5 n/a 48.8 n/a 71.9 34.9 57.0 -22.1 -14.9 8.227 Morey Charter School K-6 n/a 73.9 n/a 81.7 n/a 65.1 -16.6 -8.828 Nah Tah Wahsh PSA K-12 50.0 69.8 20.0 71.1 28.6 58.3 -29.7 8.6 -12.8 -21.4 -11.529 New Branches School K-12 n/a 52.2 n/a 57.5 n/a 54.7 -2.8 2.530 New School for Creative K-5 n/a 52.2 n/a 57.5 n/a 54.7 -2.8 2.531 Northside Preparatory K-2 n/a 55.5 n/a 69.4 n/a 54.7 -14.7 -0.832 Northwest Academy 6-12 n/d 71.3 81.8 76.5 81.3 62.0 19.3 -0.5 -14.5 -9.333 Pansophia Academy K-12 8.7 63.5 16.7 82.1 38.9 57.0 -18.1 22.2 -25.1 30.2 -6.534 Renaissance PSA 5-8 n/d 73.9 75.0 81.7 56.7 65.1 -8.4 -18.3 -16.6 -8.835 Sankofa Shule Academy K-4 n/a 48.8 n/a 71.9 n/a 57.0 -14.9 8.236 Sauk Trail Academy K-8 n/d 66.7 n/d 65.2 42.9 53.7 -10.8 -11.5 -13.037 Sunrise Education Center K-6 n/a 72.8 n/a 76.7 n/a 65.7 -11.0 -7.138 Threshold Academy K-3 n/a 61.7 n/a 73.6 n/a 60.4 -13.2 -1.339 Traverse Bay Comm. Sch. K-7 n/a 79.3 66.7 90.0 58.8 74.6 -15.8 -7.9 -15.4 -4.740 Tri High School 7-12 n/d 71.8 n/d 86.0 n/d 79.8 -6.2 8.041 TriValley Academy 5-10 16.1 47.1 18.8 44.0 30.0 42.2 -12.2 11.2 -1.8 13.9 -4.942 Vanderbilt Charter Acad. K-5 n/a 66.8 n/a 75.7 n/a 61.7 -14.0 -5.143 Vanguard Charter Acad. K-5 n/a 84.0 n/a 90.4 n/a 84.0 -6.4 0.044 Vista Charter Academy K-5 n/a 81.8 n/a 91.6 n/a 62.8 -28.8 -19.045 Walden Green Day Sch. K-8 n/d 95.2 n/d 91.6 n/d 81.6 -10.0 -13.646 Walker Charter Academy K-5 n/a 80.9 n/a 83.7 n/a 77.0 -6.7 -3.947 Walter French Academy
of Business. & Tech.6-12 n/d 48.8 49.1 71.9 35.4 57.0 -21.6 -13.7 -14.9 8.2
48 West Mich. Academyfor Arts & Academics
K-8 n/d 69.9 76.5 81.6 55.6 74.1 -18.5 -20.9 -7.5 4.2
49 West Mich. Academyfor Hospitality Sciences
9-12 n/a 52.2 n/a 57.5 n/a 54.7 -2.8 2.5
50 West Mich. Academy ofEnvironmental Science
K-9 77.8 80.9 80.6 83.7 67.9 77.0 -9.1 -12.7 -6.7 -9.9 -3.9
51 Windover High School 9-12 n/a 78.1 n/a 90.7 n/a 83.5 -7.2 5.4State of Michigan 69.1 77.0 69.0 -8.0 -0.1
NOTE: Source of data is Michigan School Report. 'n/a' indicates not applicable; 'n/d' indicates no data submitted.
c
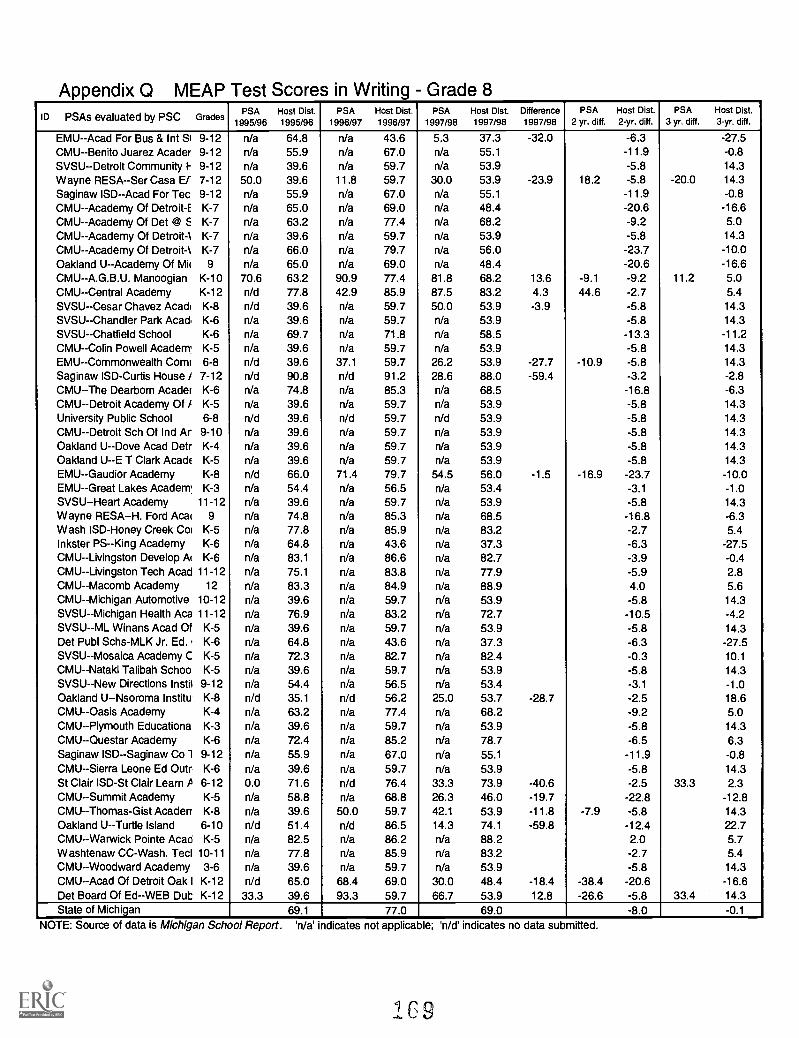
Appendix Q MEAP Test Scores in Writing Grade 8ID PSAs evaluated by PSC Grades
PSA1995/96
Host Dist.1995/96
PSA1996/97
Host Dist.1996/97
PSA1997/98
Host Dist.1997/98
Difference1997/98
PSA2 yr. diff.
Host Dist.2-yr. diff.
PSA3 yr. diff.
Host Dist.3-yr. diff.
EMU--Acad For Bus & Int SI 9-12 n/a 64.8 n/a 43.6 5.3 37.3 -32.0 -6.3 -27.5CMU--Benito Juarez Acader 9-12 n/a 55.9 n/a 67.0 n/a 55.1 -11.9 -0.8SVSU--Detroit Community I- 9-12 n/a 39.6 n/a 59.7 n/a 53.9 -5.8 14.3
Wayne RESA--Ser Casa El 7-12 50.0 39.6 11.8 59.7 30.0 53.9 -23.9 18.2 -5.8 -20.0 14.3
Saginaw ISD--Acad For Tec 9-12 n/a 55.9 n/a 67.0 n/a 55.1 -11.9 -0.8CMU--Academy Of Detroit-E K-7 n/a 65.0 n/a 69.0 n/a 48.4 -20.6 -16.6CMU--Academy Of Det @ E K-7 n/a 63.2 n/a 77.4 n/a 68.2 -9.2 5.0CMU--Academy Of Detroit-1 K-7 n/a 39.6 n/a 59.7 n/a 53.9 -5.8 14.3
CMU--Academy Of Detroit-% K-7 n/a 66.0 Na 79.7 n/a 56.0 -23.7 -10.0Oakland U--Academy Of Mir 9 n/a 65.0 n/a 69.0 Na 48.4 -20.6 -16.6CMU--A.G.B.U. Manoogian K-10 70.6 63.2 90.9 77.4 81.8 68.2 13.6 -9.1 -9.2 11.2 5.0CMU--Central Academy K-12 n/d 77.8 42.9 85.9 87.5 83.2 4.3 44.6 -2.7 5.4SVSU--Cesar Chavez Acad K-8 n/d 39.6 n/a 59.7 50.0 53.9 -3.9 -5.8 14.3SVSU--Chandler Park Acad. K-6 n/a 39.6 n/a 59.7 n/a 53.9 -5.8 14.3SVSU--Chatfield School K-6 n/a 69.7 n/a 71.8 Na 58.5 -13.3 -11.2CMU--Colin Powell Acadern: K-5 n/a 39.6 n/a 59.7 Na 53.9 -5.8 14.3EMU--Commonwealth Com! 6-8 n/d 39.6 37.1 59.7 26.2 53.9 -27.7 -10.9 -5.8 14.3Saginaw ISD-Curtis House 1 7-12 n/d 90.8 n/d 91.2 28.6 88.0 -59.4 -3.2 -2.8CMU--The Dearborn Acader K-6 n/a 74.8 n/a 85.3 n/a 68.5 -16.8 -6.3CMU-Detroit Academy Off K-5 Na 39.6 n/a 59.7 n/a 53.9 -5.8 14.3University Public School 6-8 Nd 39.6 n/d 59.7 n/d 53.9 -5.8 14.3CMU--Detroit Sch Of Ind Ar 9-10 n/a 39.6 n/a 59.7 n/a 53.9 -5.8 14.3Oakland U--Dove Acad Detr K-4 n/a 39.6 n/a 59.7 n/a 53.9 -5.8 14.3Oakland U--E T Clark Acad( K-5 n/a 39.6 n/a 59.7 n/a 53.9 -5.8 14.3EMU--Gaudior Academy K-8 n/d 66.0 71.4 79.7 54.5 56.0 -1.5 -16.9 -23.7 -10.0EMU--Great Lakes Acadern! K-3 n/a 54.4 n/a 56.5 Na 53.4 -3.1 -1.0SVSU - -Heart Academy 11-12 n/a 39.6 n/a 59.7 n/a 53.9 -5.8 14.3Wayne RESA--H. Ford Aca( 9 n/a 74.8 n/a 85.3 n/a 68.5 -16.8 -6.3Wash ISD-Honey Creek Col K-5 n/a 77.8 n/a 85.9 n/a 83.2 -2.7 5.4Inkster PS--King Academy K-6 n/a 64.8 n/a 43.6 n/a 37.3 -6.3 -27.5CMU--Livingston Develop A( K-6 n/a 83.1 n/a 86.6 n/a 82.7 -3.9 -0.4CMU--Livingston Tech Acad 11-12 Na 75.1 n/a 83.8 Na 77.9 -5.9 2.8CMU--Macomb Academy 12 Na 83.3 n/a 84.9 Na 88.9 4.0 5.6CMU--Michigan Automotive 10-12 n/a 39.6 n/a 59.7 Na 53.9 -5.8 14.3SVSU--Michigan Health Aca 11-12 n/a 76.9 n/a 83.2 n/a 72.7 -10.5 -4.2SVSU--ML Winans Acad Of K-5 Na 39.6 n/a 59.7 Na 53.9 -5.8 14.3Det Publ Schs-MLK Jr. Ed., K-6 n/a 64.8 n/a 43.6 Na 37.3 -6.3 -27.5SVSU--Mosaica Academy C K-5 n/a 72.3 n/a 82.7 n/a 82.4 -0.3 10.1
CMU--Nataki Talibah Schoo K-5 Na 39.6 n/a 59.7 n/a 53.9 -5.8 14.3SVSU--New Directions Instil 9-12 n/a 54.4 n/a 56.5 n/a 53.4 -3.1 -1.0Oakland U--Nsoroma Institu K-8 n/d 35.1 n/d 56.2 25.0 53.7 -28.7 -2.5 18.6CMU--Oasis Academy K-4 n/a 63.2 n/a 77.4 Na 68.2 -9.2 5.0CMU--Plymouth Educationa K-3 n/a 39.6 n/a 59.7 Na 53.9 -5.8 14.3CMU--Questar Academy K-6 n/a 72.4 n/a 85.2 n/a 78.7 -6.5 6.3Saginaw ISD--Saginaw Co 1 9-12 n/a 55.9 n/a 67.0 n/a 55.1 -11.9 -0.8CMU--Sierra Leone Ed Out K-6 n/a 39.6 n/a 59.7 n/a 53.9 -5.8 14.3St Clair ISD-St Clair Learn /5 6-12 0.0 71.6 n/d 76.4 33.3 73.9 -40.6 -2.5 33.3 2.3CMU--Summit Academy K-5 Na 58.8 Na 68.8 26.3 46.0 -19.7 -22.8 -12.8CMU--Thomas-Gist Acaderr K-8 n/a 39.6 50.0 59.7 42.1 53.9 -11.8 -7.9 -5.8 14.3Oakland U--Turtle Island 6-10 n/d 51.4 n/d 86.5 14.3 74.1 -59.8 -12.4 22.7CMU--Warwick Pointe Acad K-5 n/a 82.5 n/a 86.2 n/a 88.2 2.0 5.7Washtenaw CC-Wash. Ted 10-11 n/a 77.8 n/a 85.9 n/a 83.2 -2.7 5.4CMU--Woodward Academy 3-6 Na 39.6 n/a 59.7 Na 53.9 -5.8 14.3CMU--Acad Of Detroit Oak I K-12 Nd 65.0 68.4 69.0 30.0 48.4 -18.4 -38.4 -20.6 -16.6Det Board Of Ed--WEB Dub K-12 33.3 39.6 93.3 59.7 66.7 53.9 12.8 -26.6 -5.8 33.4 14.3State of Michigan 69.1 77.0 69.0 -8.0 -0.1
NOTE: Source of data is Michigan School Report. 'n/a' indicates not applicable; 'n/d' indicates no data submitted.
169
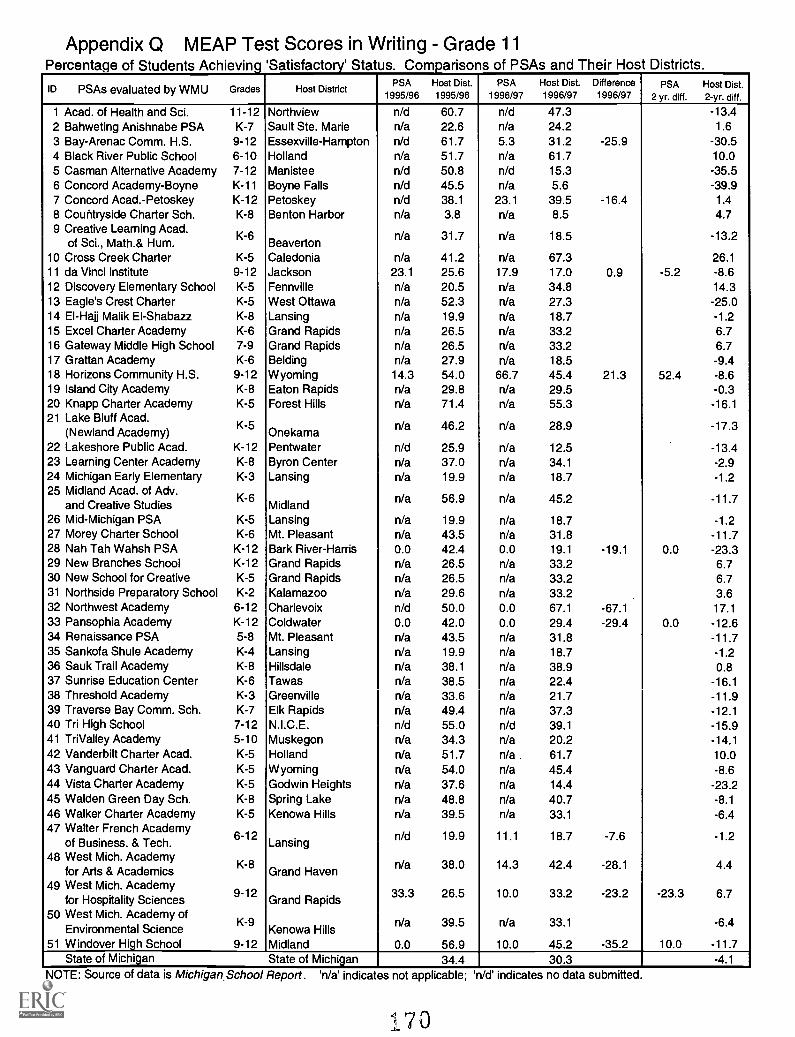
Appendix Q MEAP Test Scores in Writing - Grade 11Percentage of Students Achieving 'Satisfactory' Status. Comparisons of PSAs and Their Host Districts.
ID PSAs evaluated by WMU Grades Host DistrictPSA
1995/96Host Dist.1995/96
PSA1996/97
Host Dist.1996/97
Difference1996/97
PSA
2 yr. diff.Host Dist.2-yr. diff.
1 Acad. of Health and Sci. 11-12 Northview n/d 60.7 n/d 47.3 -13.42 Bahweting Anishnabe PSA K-7 Sault Ste. Marie n/a 22.6 n/a 24.2 1.6
3 Bay-Arenac Comm. H.S. 9-12 Essexville-Hampton n/d 61.7 5.3 31.2 -25.9 -30.54 Black River Public School 6-10 Holland n/a 51.7 n/a 61.7 10.05 Casman Alternative Academy 7-12 Manistee n/d 50.8 n/d 15.3 -35.56 Concord Academy-Boyne K-11 Boyne Falls n/d 45.5 n/a 5.6 -39.97 Concord Acad.-Petoskey K-12 Petoskey n/d 38.1 23.1 39.5 -16.4 1.48 Countryside Charter Sch. K-8 Benton Harbor n/a 3.8 n/a 8.5 4.79 Creative Learning Acad.
of Sci., Math.& Hum.K-6
BeavertonNa 31.7 n/a 18.5 -13.2
10 Cross Creek Charter K-5 Caledonia n/a 41.2 n/a 67.3 26.111 da Vinci Institute 9-12 Jackson 23.1 25.6 17.9 17.0 0.9 -5.2 -8.612 Discovery Elementary School K-5 Fennville n/a 20.5 n/a 34.8 14.313 Eagle's Crest Charter K-5 West Ottawa n/a 52.3 n/a 27.3 -25.014 El-Hajj Malik EI-Shabazz K-8 Lansing n/a 19.9 n/a 18.7 -1.215 Excel Charter Academy K-6 Grand Rapids n/a 26.5 n/a 33.2 6.716 Gateway Middle High School 7-9 Grand Rapids n/a 26.5 n/a 33.2 6.717 Grattan Academy K-6 Belding n/a 27.9 n/a 18.5 -9.418 Horizons Community H.S. 9-12 Wyoming 14.3 54.0 66.7 45.4 21.3 52.4 -8.619 Island City Academy K-8 Eaton Rapids n/a 29.8 n/a 29.5 -0.320 Knapp Charter Academy K-5 Forest Hills n/a 71.4 n/a 55.3 -16.121 Lake Bluff Acad.
(Newland Academy)K-5
Onekama Na 46.2 n/a 28.9 -17.3
22 Lakeshore Public Acad. K-12 Pentwater n/d 25.9 n/a 12.5 -13.423 Learning Center Academy K-8 Byron Center n/a 37.0 n/a 34.1 -2.924 Michigan Early Elementary K-3 Lansing n/a 19.9 n/a 18.7 -1.225 Midland Acad. of Adv.
and Creative StudiesK-6
Midland n/a 56.9 n/a 45.2 -11.7
26 Mid-Michigan PSA K-5 Lansing n/a 19.9 n/a 18.7 -1.227 Morey Charter School K-6 Mt. Pleasant n/a 43.5 n/a 31.8 -11.728 Nah Tah Wahsh PSA K-12 Bark River-Harris 0.0 42.4 0.0 19.1 -19.1 0.0 -23.329 New Branches School K-12 Grand Rapids n/a 26.5 n/a 33.2 6.730 New School for Creative K-5 Grand Rapids n/a 26.5 n/a 33.2 6.731 Northside Preparatory School K-2 Kalamazoo n/a 29.6 n/a 33.2 3.632 Northwest Academy 6-12 Charlevoix n/d 50.0 0.0 67.1 -67.1 17.133 Pansophia Academy K-12 Coldwater 0.0 42.0 0.0 29.4 -29.4 0.0 -12.634 Renaissance PSA 5-8 Mt. Pleasant n/a 43.5 n/a 31.8 -11.735 Sankofa Shule Academy K-4 Lansing n/a 19.9 n/a 18.7 -1.236 Sauk Trail Academy K-8 Hillsdale n/a 38.1 n/a 38.9 0.837 Sunrise Education Center K-6 Tawas n/a 38.5 n/a 22.4 -16.138 Threshold Academy K-3 Greenville n/a 33.6 n/a 21.7 -11.939 Traverse Bay Comm. Sch. K-7 Elk Rapids n/a 49.4 n/a 37.3 -12.140 Tri High School 7-12 N.I.C.E. n/d 55.0 n/d 39.1 -15.941 TriValley Academy 5-10 Muskegon n/a 34.3 n/a 20.2 -14.142 Vanderbilt Charter Acad. K-5 Holland n/a 51.7 n/a 61.7 10.043 Vanguard Charter Acad. K-5 Wyoming n/a 54.0 n/a 45.4 -8.644 Vista Charter Academy K-5 Godwin Heights n/a 37.6 n/a 14.4 -23.245 Walden Green Day Sch. K-8 Spring Lake n/a 48.8 n/a 40.7 -8.146 Walker Charter Academy K-5 Kenowa Hills n/a 39.5 n/a 33.1 -6.447 Walter French Academy
of Business. & Tech. 6-12Lansing
n/d 19.9 11.1 18.7 -7.6 -1.2
48 West Mich. Academyfor Arts & Academics
K-8Grand Haven Na 38.0 14.3 42.4 -28.1 4.4
49 West Mich. Academyfor Hospitality Sciences
9-12Grand Rapids 33.3 26.5 10.0 33.2 -23.2 -23.3 6.7
50 West Mich. Academy ofEnvironmental Science
K-9Kenowa Hills
Na 39.5 Na 33.1 -6.4
51 Windover High School 9-12 Midland 0.0 56.9 10.0 45.2 -35.2 10.0 -11.7State of Michigan State of Michigan 34.4 30.3 -4.1
NOTE: Source of data is Michigan. School Report. 'n/a' indicates not applicable; 'n/d' indicates no data submitted.
170
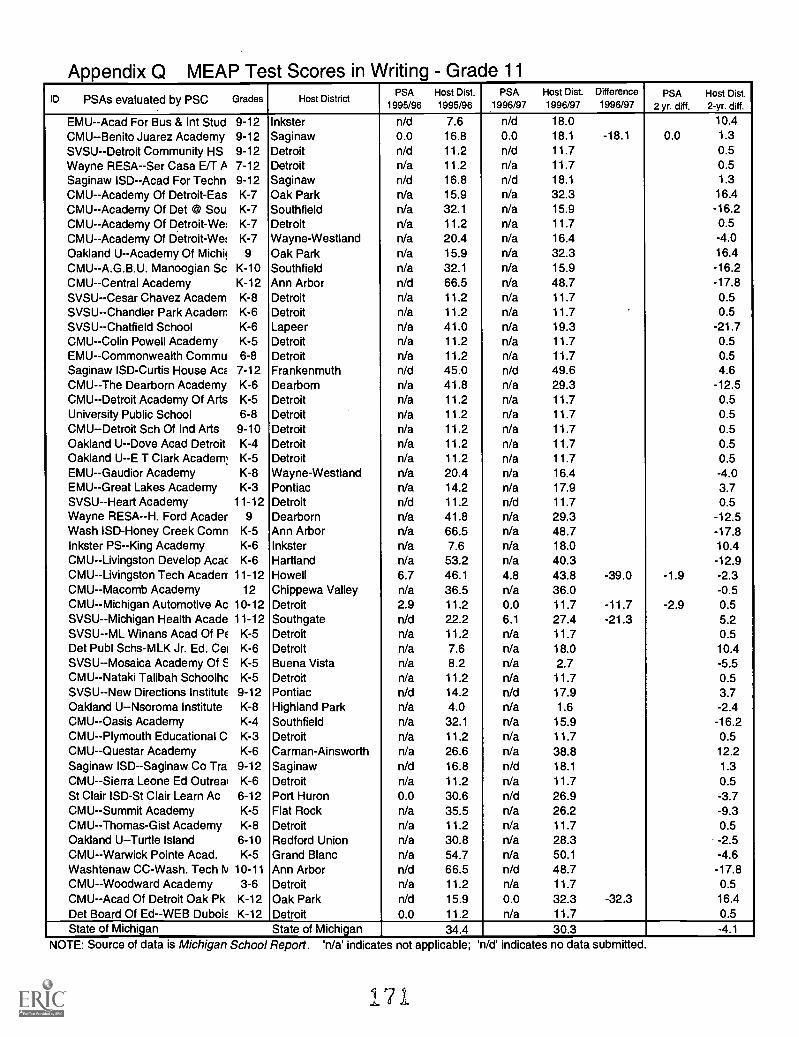
Appendix Q MEAP Test Scores in Writing - Grade 11ID PSAs evaluated by PSC Grades Host District
PSA1995/96
Host Dist.1995/96
PSA1996/97
Host Dist.1996/97
Difference1996/97
PSA2 yr. diff.
Host Dist.2-yr. diff.
EMU--Acad For Bus & Int Stud 9-12 Inkster n/d 7.6 n/d 18.0 10.4
CMU--Benito Juarez Academy 9-12 Saginaw 0.0 16.8 0.0 18.1 -18.1 0.0 1.3
SVSU--Detroit Community HS 9-12 Detroit n/d 11.2 n/d 11.7 0.5Wayne RESA--Ser Casa Ea A 7-12 Detroit n/a 11.2 n/a 11.7 0.5Saginaw ISD--Acad For Techn 9-12 Saginaw n/d 16.8 n/d 18.1 1.3
CMU--Academy Of Detroit-Eas K-7 Oak Park n/a 15.9 n/a 32.3 16.4CMU--Academy Of Det @ Sou K-7 Southfield n/a 32.1 n/a 15.9 -16.2CMU--Academy Of Detroit-We K-7 Detroit n/a 11.2 n/a 11.7 0.5CMU -- Academy Of Detroit-We K-7 Wayne-Westland n/a 20.4 n/a 16.4 -4.0Oakland U -- Academy Of Michi! 9 Oak Park n/a 15.9 n/a 32.3 16.4CMU--A.G.B.U. Manoogian Sc K-10 Southfield n/a 32.1 n/a 15.9 -16.2CMU--Central Academy K-12 Ann Arbor n/d 66.5 n/a 48.7 -17.8SVSU--Cesar Chavez Academ K-8 Detroit n/a 11.2 n/a 11.7 0.5SVSU--Chandler Park Academ K-6 Detroit n/a 11.2 n/a 11.7 0.5SVSU--Chatfield School K-6 Lapeer n/a 41.0 n/a 19.3 -21.7CMU--Colin Powell Academy K-5 Detroit n/a 11.2 n/a 11.7 0.5EMU--Commonwealth Commu 6-8 Detroit n/a 11.2 n/a 11.7 0.5Saginaw ISD-Curtis House Au 7-12 Frankenmuth n/d 45.0 n/d 49.6 4.6CMU--The Dearborn Academy K-6 Dearborn n/a 41.8 n/a 29.3 -12.5CMU--Detroit Academy Of Arts K-5 Detroit n/a 11.2 n/a 11.7 0.5University Public School 6-8 Detroit n/a 11.2 n/a 11.7 0.5CMU-Detroit Sch Of Ind Arts 9-10 Detroit n/a 11.2 n/a 11.7 0.5Oakland U--Dove Acad Detroit K-4 Detroit n/a 11.2 n/a 11.7 0.5Oakland U--E T Clark Academ' K-5 Detroit n/a 11.2 n/a 11.7 0.5EMU--Gaudior Academy K-8 Wayne-Westland n/a 20.4 n/a 16.4 -4.0EMU--Great Lakes Academy K-3 Pontiac n/a 14.2 n/a 17.9 3.7SVSU - -Heart Academy 11-12 Detroit n/d 11.2 n/d 11.7 0.5Wayne RESA--H. Ford Acader 9 Dearborn n/a 41.8 n/a 29.3 -12.5Wash ISD-Honey Creek Comn K-5 Ann Arbor n/a 66.5 n/a 48.7 -17.8Inkster PS--King Academy K-6 Inkster n/a 7.6 n/a 18.0 10.4CMU--Livingston Develop Acac K-6 Hartland n/a 53.2 n/a 40.3 -12.9CMU--Livingston Tech Acaderr 11-12 Howell 6.7 46.1 4.8 43.8 -39.0 -1.9 -2.3CMU--Macomb Academy 12 Chippewa Valley n/a 36.5 n/a 36.0 -0.5CMU--Michigan Automotive Ac 10-12 Detroit 2.9 11.2 0.0 11.7 -11.7 -2.9 0.5SVSU--Michigan Health Acade 11-12 Southgate n/d 22.2 6.1 27.4 -21.3 5.2SVSU--ML Winans Acad Of P( K-5 Detroit n/a 11.2 n/a 11.7 0.5Det Publ Schs-MLK Jr. Ed. Cei K-6 Detroit n/a 7.6 n/a 18.0 10.4SVSU--Mosaica Academy Of E K-5 Buena Vista n/a 8.2 n/a 2.7 -5.5CMU--Nataki Talibah Schoolhc K-5 Detroit n/a 11.2 n/a 11.7 0.5SVSU--New Directions Institute 9-12 Pontiac n/d 14.2 n/d 17.9 3.7Oakland U--Nsoroma Institute K-8 Highland Park n/a 4.0 n/a 1.6 -2.4CMU--Oasis Academy K-4 Southfield n/a 32.1 n/a 15.9 -16.2CMU--Plymouth Educational C K-3 Detroit n/a 11.2 n/a 11.7 0.5CMU--Questar Academy K-6 Carman-Ainsworth n/a 26.6 n/a 38.8 12.2Saginaw ISD--Saginaw Co Tra 9-12 Saginaw n/d 16.8 n/d 18.1 1.3CMU--Sierra Leone Ed Outreal K-6 Detroit n/a 11.2 n/a 11.7 0.5St Clair ISD-St Clair Learn Ac 6-12 Port Huron 0.0 30.6 n/d 26.9 -3.7CMU--Summit Academy K-5 Flat Rock n/a 35.5 n/a 26.2 -9.3CMU--Thomas-Gist Academy K-8 Detroit n/a 11.2 n/a 11.7 0.5Oakland U--Turtle Island 6-10 Redford Union n/a 30.8 n/a 28.3 -2.5CMU--Warwick Pointe Acad. K-5 Grand Blanc n/a 54.7 n/a 50.1 -4.6Washtenaw CC-Wash. Tech ry 10-11 Ann Arbor n/d 66.5 n/d 48.7 -17.8CMU--Woodward Academy 3-6 Detroit n/a 11.2 n/a 11.7 0.5CMU--Acad Of Detroit Oak Pk K-12 Oak Park n/d 15.9 0.0 32.3 -32.3 16.4Det Board Of Ed--WEB DuboiE K-12 Detroit 0.0 11.2 n/a 11.7 0.5State of Michigan State of Michigan 34.4 30.3 -4.1
NOTE: Source of data is Michigan School Report. 'n/a' indicates not applicable; 'n/d' indicates no data submitted.
171
Evaluation of the MichiganPublic School Academy
Initiative
Executive Summary
Jerry Horn
Gary Miron
The Evaluation CenterWestern Michigan University
January 1999
:72
Foreword
This is the final report of the one year evaluation of the Michigan public school academy (PSA)initiative. Over the past year, we have immersed ourselves in this reform, visiting schools,conducting interviews, reviewing documents, gathering and analyzing data in many forms, andtalking with stakeholders both in PSAs and in the traditional public schools. We have followed thedebate both at an academic level and at a political level. We have been treated with great suspicionin some places and warmly welcomed in others. It isin factfor us, one of the most complex schoolreforms that we have had the opportunity to evaluate. The polarized nature of the reform and thestrong divisions that exist between the proponents and opponents made our task difficult. We expectthat both opponents and proponents will be happy with some of our findings and upset with others.Our real concern is that the evaluation's results will be used to shore up each side's arguments. Asreaders will see, there are negative and positive outcomes, and there is considerable diversity amongthe schools that we studied. We identified both the strengths and weaknesses of the schools and theinitiative, and we hope that decision makers understand and make full use of the findings tostrengthen the PSA initiative and the public education system as a whole.
At The Evaluation Center, we are most interested in advancing the theory and practice of evaluation.It is not our business to engage in an advocacy role for any of the stakeholder groups of this or anyother education reform effort. The intent of this evaluation of the PSA initiative is to "improve, notto prove." We hope the readers of this report will consider ways in which the public schoolacademies can be strengthened, through additional legislation to steer and regulate the schools so thatthey can fulfill their original expectations; through the development of more effective routines tooversee and support the schools; through more effective efforts to govern and administer the schools;and through more effective policies to support teachers and strengthen the quality of instruction inthe classroom.
We welcome the readers of this report to supply us with feedback in the form of comments,corrections, and compliments. Our contact information can be found below. The final version ofthis report will be delivered to the Michigan Department of Education in January 1999.
Jerry Horn and Gary Miron
Evaluation of the PSA InitiativeThe Evaluation CenterWestern Michigan UniversityKalamazoo, MI. 49008-5178
Tel. (616) 387-5895Fax. (616) 387-5923e-mail. <[email protected]><[email protected]>
X73

Executive Summary
Background and Methodology
0 This evaluation was one of two studies commissioned by the Michigan Department of Education to examinethe Michigan Public School Academies (PSA) Initiative) Geographically, The Evaluation Center wascharged with examining all the charter schools in the state except for those in Southeastern Michigan. Thisincluded 51 PSAs, or close to half of all PSAs in the state. The evaluation addresses a wide range of questionsraised by the Michigan Department of Education, as well as questions added by The Evaluation Center.
0 Aside from addressing the specific evaluation questions, an underlying aim of the study was to promote anappreciation and capacity to conduct evaluations that can be used and developed by each participating school.
0 The approach used by The Evaluation Center involved both formative and summative evaluation and usedboth qualitative and quantitative methods. The evaluation was designed and conducted in accordance withthe utility, feasibility, propriety, and accuracy standards of The Program Evaluation Standards (JointCommittee, 1994). A summative metaevaluation was conducted by an external evaluator.
0 The duration of the study was between October 1997 and December 1998. School-based data were largelycollected during the 1997/98 school year, although available data from the MDE were used to trace trendsin the schools over the ldst three years.
0 Data collection methods included the following:
S A charter school survey and a school climate survey were administered to PSA staff, students, and parents.S Interviews were held with the representatives of all stakeholder groups including PSA teachers/staff,
students and parents, traditional public school superintendents and school personnel, MDE officials,representatives of authorizing agencies, management companies, and community representatives.
S Demographic data, financial data and MEAP test scores from the last three years for PSAs and their hostdistricts were analyzed.
S Documents, literature, school portfolios, and student work samples were reviewed.
Overall, there was a high response rate for the two sets of surveys. PSAs were used to assist in collectingsurveys from staff and parents. While this helped to achieve a high response rate, it also posed a limitation,since the surveys were opened at several schools in violation of given instructions. The table below includesgeneral information about the achieved samples.
The term "public school academies" is synonymous with "charter schools" in Michigan.
ii
L74
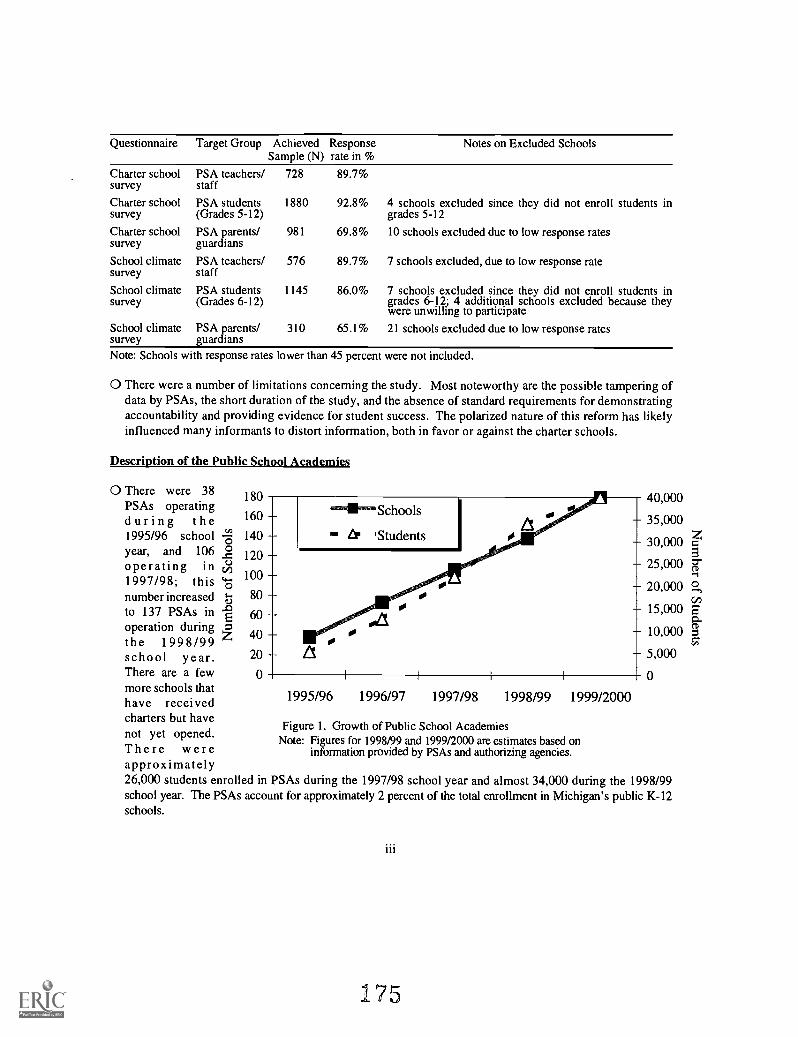
Questionnaire Target Group Achieved Response Notes on Excluded SchoolsSample (N) rate in %
Charter schoolsurvey
PSA teachers/staff
728 89.7%
Charter school PSA students 1880 92.8% 4 schools excluded since they did not enroll students insurvey (Grades 5-12) grades 5-12
Charter schoolsurvey
PSA parents/guardians
981 69.8% 10 schools excluded due to low response rates
School climatesurvey
PSA teachers/staff
576 89.7% 7 schools excluded, due to low response rate
School climate PSA students 1145 86.0% 7 schools excluded since they did not enroll students insurvey (Grades 6-12) grades 6-12; 4 additional schools excluded because they
were unwilling to participate
School climatesurvey
PSA parents/guardians
310 65.1% 21 schools excluded due to low response rates
Note: Schools with response rates lower than 45 percent were not included.
0 There were a number of limitations concerning the study. Most noteworthy are the possible tampering ofdata by PSAs, the short duration of the study, and the absence of standard requirements for demonstratingaccountability and providing evidence for student success. The polarized nature of this reform has likelyinfluenced many informants to distort information, both in favor or against the charter schools.
Description of the Public School Academies
0 There were 38PSAs operatingduring the1995/96 schoolyear, and 106operating in1997/98; thisnumber increasedto 137 PSAs inoperation duringthe 1998/99school year.There are a few 0 I I I I 0more schools thathave receivedcharters but havenot yet opened.There wereapproximately26,000 students enrolled in PSAs during the 1997/98 school year and almost 34,000 during the 1998/99school year. The PSAs account for approximately 2 percent of the total enrollment in Michigan's public K-12schools.
180
160
140
120
100
80
60
40
20
40,000
35,000
30,000
25,000
20,000
15,000
10,000
5,000
1995/96 1996/97 1997/98 1998/99 1999/2000
Figure 1. Growth of Public School AcademiesNote: Figures for 1998/99 and 1999/2000 are estimates based on
information provided by PSAs and authorizing agencies.
iii
175
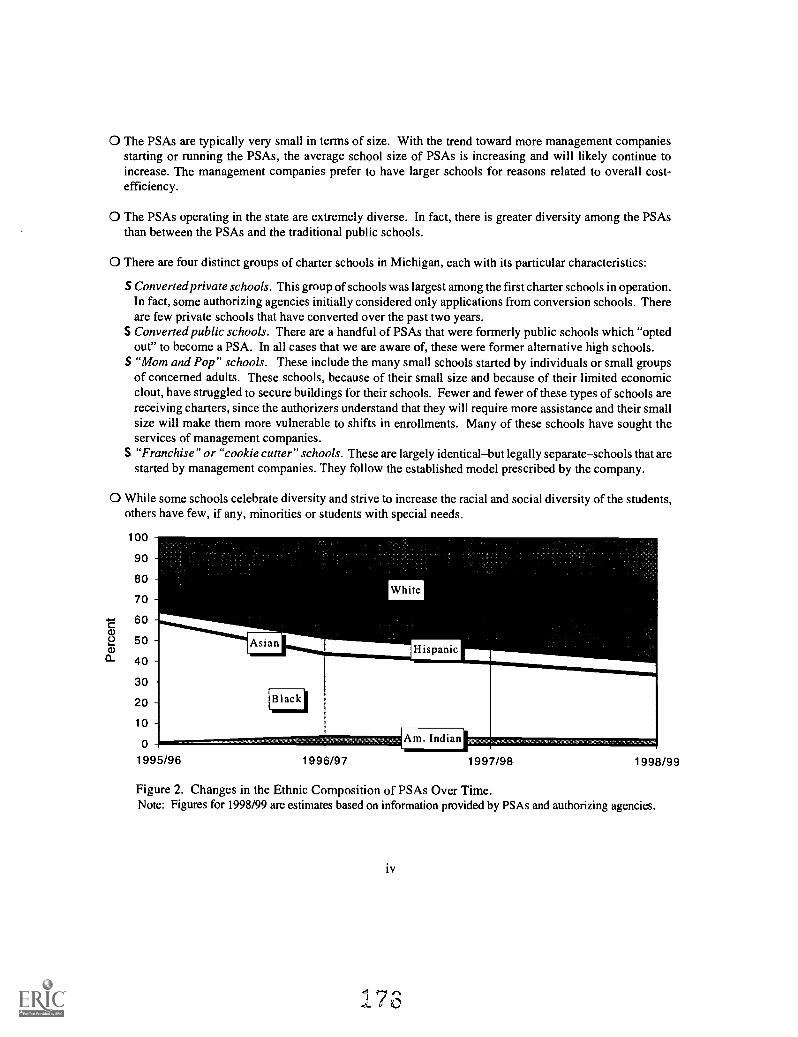
O The PSAs are typically very small in terms of size. With the trend toward more management companiesstarting or running the PSAs, the average school size of PSAs is increasing and will likely continue toincrease. The management companies prefer to have larger schools for reasons related to overall cost-efficiency.
0 The PSAs operating in the state are extremely diverse. In fact, there is greater diversity among the PSAsthan between the PSAs and the traditional public schools.
0 There are four distinct groups of charter schools in Michigan, each with its particular characteristics:
S Converted private schools. This group of schools was largest among the first charter schools in operation.In fact, some authorizing agencies initially considered only applications from conversion schools. Thereare few private schools that have converted over the past two years.
S Converted public schools. There are a handful of PSAs that were formerly public schools which "optedout" to become a PSA. In all cases that we are aware of, these were former alternative high schools.
S "Mom and Pop" schools. These include the many small schools started by individuals or small groupsof concerned adults. These schools, because of their small size and because of their limited economicclout, have struggled to secure buildings for their schools. Fewer and fewer of these types of schools arereceiving charters, since the authorizers understand that they will require more assistance and their smallsize will make them more vulnerable to shifts in enrollments. Many of these schools have sought theservices of management companies.
S "Franchise" or "cookie cutter" schools. These are largely identicalbut legally separateschools that arestarted by management companies. They follow the established model prescribed by the company.
0 While some schools celebrate diversity and strive to increase the racial and social diversity of the students,others have few, if any, minorities or students with special needs.
100
90
80
70
C- 60a)2 50a)
a_ 40
30
20
10
0
1995/96 1996/97 1997/98 1998/99
Figure 2. Changes in the Ethnic Composition of PSAs Over Time.Note: Figures for 1998/99 are estimates based on information provided by PSAs and authorizing agencies.
iv
O In the 62 PSAs that reported data for the 1996/97 school year, 51 percent of the students were minoritiesas compared with the total enrollments in K-12 schools, which include approximately 33 percent minorities.Therefore, once can say that the PSAs have more minority students enrolled in them than the state ofMichigan average for K-12 education. Nevertheless, since the charter schools are largely in urban areaswhere the concentrations of minorities are higher, we cannot claim that the schools are necessarily attractingmore minorities. In fact, in relation to the host districts, the PSAs as a whole have fewer minorities. Thus,there is support for those who argue that the charter schools are skimming and increasing segregation.
0 Over the past few years, one can see that there is a clear trend toward fewer and fewer minorities in thePSAs. In some schools this is due to a changing ethnic composition in the schools (high attrition with fewerminorities included in the new students). This trend toward enrolling fewer minorities is largely due to theestablishment of new PSAs that enroll fewer minorities. Between 1995/96 and 1996/97, the proportion ofminorities decreased by 12.5 percent. Between 1997/98 and 1998/99, the percent of minorities is estimatedto have decreased by another 10-12 percent.
0 The data on students qualifying for free or reduced lunches was mixed, with some PSAs having a largerproportion of their students qualifying for FRL than the host district and others having a lower proportion.Most PSAs reported having no students qualifying for FRL, either because none qualified or because theydid not complete the paperwork for this federally funded program.
0 Mission statements of PSAs are much like those of many traditional public schools, yet there are someunique emphases that may not be widely used and/or carried out as the major theme for traditional publicschools. Examples of this would be specific emphases on an African-American-centered-approach, atargeted at-risk student clientele, a fine arts theme, etc.
0 In a large number of PSAs, there is little evidence that the missions of these schools include other criticalelements of the purposes of PSAs as set forth in the legislation such as innovative teaching methods; moreeffective, efficient/equitable use of funds; greater accountability at the local school level; and/or the creationof new professional opportunities for teachers.
0 There are a number of reasons for establishing PSAs. The most common are listed below:
S Dissatisfaction by a group of parents with the educational program being provided by the local schooldistrict, which may include perceived failure to provide an acceptable level or quality of special services,lack of emphasis or support for a particular student activity, larger than desired class size, failure toinclude certain languages or study areas within the curriculum, lack of instruction regarding certain values,inability to guarantee the safety of all students at the school, etc.
S Opportunity to obtain a more stable financial base for a private schoolS Personal mission of one or more individuals to develop a school with a particular emphasis, e.g.,
environment, agriculture, service learning component, etc.S Opportunity to create a school that is perceived to be more safe, drug/crime free, etc.S Opportunity to create a financial profit by one or more entities from the private sector
Governance and Leadership of PSAs
0 The governance of public school academies is one of the most radical changes from the traditional structureof public schools throughout the history of the United States. PSA boards of directors are officially
v
77
appointed by the authorizer and not elected by parents or any other specified group of stakeholders orpersons. The roles and responsibilities of the PSA boards of directors are defined in the bylaws as approvedby the authorizing body. However, the primary responsibilities appear to be the setting of policies andestablishing the operational procedures of the PSA.
0 While some might describe the governance of PSAs to be an evolving role, it is clear that PSAs areauthorized with the expectation that there will be a fully functioning governance structure, at the center ofwhich is the board of directors or some similar body. While the selection/appointment process varies fromthe traditional school board member, PSA board members are considered to be public officials and aresubject to the same regulations and laws as other public officials. Over the past year, the authorizingagencies became more involved in training and preparing board members.
0 Effective and comprehensive board and operational policies are poorly designed and not well used in severalschools. Authorizing agencies are aware of this problem and are taking steps to address it.
0 Boards are critical to the success of a school. Problems within or related to actions of boards of directorsare often related to the inexperience of members in this role; lack of understanding of their role and function;the urgency and critical nature of some of the issues that need to be addressed; and the vested interests ofsome board members in the schools' missions and financial future of the school.
0 Schools initiated by management companies seem to have board members nominated on the basis of theirpositions/reputations in the community. Locally developed PSAs are more likely to have members who areclosely related to the school and/or the founding group, i.e., parents, leaders of a converted private school, etc.
0 Individuals in school leadership roles may be visionary and quite good at developing the idea and basis fora school, but ineffective and unwilling to relinquish control of the school to the board. References aboutmicro-management of some school principals have been voiced by stakeholders, since this is unacceptableor incompatible with an environment that includes parental and teacher involvement and decision making.A number of PSA leaders are poorly prepared for their assignments in terms of formal training and/or experi-ence, especially in the areas of school law and regulations, personnel and program evaluation, andbudgeting.
0 The weakest element in many schools seems to be the "administrative" function. This was evident from thesurvey results and from interviews. Administrators are overburdened with tasks and responsibilities thathave direct impact on the operational aspects and missions of the schools.
O A large number of PSAs have experienced outright conflicts and strained relationships between teachers andadministrators and between boards and administrators. These conflicts appear to be due to poorcommunications and/or personal and professional differences of opinion. Many conflicts appear to be dueto strong vested interests on the part of some stakeholders. The result is often terminations or resignationsor continuing conflicts and confrontations.
Curriculums and Ouality of Instruction of PSAs
0 While the school curriculum is outlined in applications, many new charter schools do not have a fullyoperational curriculum in place when the school starts. Many schools still lack instructional materialsappropriate to the school curriculum.
O The curriculums of the PSAs in many respects resemble the curriculums of the traditional public schools.Within each curricular area, however, one can identify some specific emphases that mark the unique
vi
478
approaches of some of the schools such as cultural development, attitude development, values and charactereducation, problem solving, languages, and special areas of the arts. At the secondary level PSAs, onegenerally finds the core subjects of a traditional curriculum plus an array of special areas of study, e.g.,computer technology; economics and business; food, agriculture, and natural resources; visual and fine arts;the humanities; life management education; career explorations; career and employability skills; health care;international studies, etc.
0 Since most PSAs began as newly founded schools (as opposed to a conversion), the curriculum is stillevolving. Teachers have spent many hours selecting, adapting, and developing curriculum. In many cases,this work had to be done during the summer and at other times in which they were not employed by the PSA.In other PSAs, a prepackaged curriculum with a particular emphasis and a prescribed teaching methodologyhas been implemented. In those schools operated by an outside management company, it is common to finda prescribed curriculum identified and developed/approved by a committee as a condition of the contract.
0 In the parent survey, 75.1 percent of the respondents agreed or strongly agreed with the statement "I amsatisfied with the school's curriculum." Almost half (41 percent) of the 723 surveyed teachers were unsure,dissatisfied, or very dissatisfied with the school's curriculum. Among the surveyed students, 54.3 percentagreed or strongly agreed with the statement "I wish there were more courses I could choose from."
0 Decisions about curriculum in the PSAs are often determined by the principal. However, there are otherinstances in which curricular decisions are made with considerable input from teachers and parents. Schoolsrun by the large management companies are usually expected to follow the prescribed curriculums.
0 Teachers received generally high marks on items related to the quality of instruction on the charter schoolsurvey. Selected survey items and the percentage of students who agree or strongly agree with the item arelisted below:
S I am learning more here than at the previous school (64.3 percent).S Almost every assignment that I turn in to the teacher is returned with corrections and suggestions for
improvement (50.2 percent).S My teacher is available to talk about academic matters (72.2 percent).
0 As measured by the school climate survey, teacher-student relationships were noticeably better in the PSAsthan in average public schools (this instrument had national norms with which the PSAs were compared).
0 Among the surveyed parents, 69.1 percent agreed or strongly agreed that they "were satisfied with theinstruction," and 71.8 percent agreed or strongly agreed that "Teachers are challenged to be effective."
0 Some resignations and dismissals of teachers were reportedly related to ineffective instruction. At the sametime, queries and reviews of documents indicated that there are generally weak personnel (teacher)evaluation procedures in place in most schools.
Financial Status of the Schools
0 PSAs struggle with finding necessary start-up funding. Personal loans and "bridge" loans seem to becommon characteristics of "grass-roots" PSAs. Management companies are able to provide start-up moniesor guarantee loans for buildings, equipment, personnel, etc. Long-term funding for capital improvementshave been difficult to obtain in many cases. Generally, successful efforts to obtain loans from local financialinstitutions are credited to the reputations of board members and other key officials associated with theschools.
vii
O The PSAs are very "loud" in expressing their need for more resources. In terms of resources, the greatestdisparities among PSAs are clearly visible in their instructional facilities. While a large number of PSAsdo not have permanent sites for their schools, even after a few years of operation some are still strugglingto secure a permanent facility. For many of the schools in this situation, the problem is not one of findingan available site; rather, it is a problem of securing sufficient resources with which to renovate or build.
0 The private school conversions retain their facilities from when they were private schools, and the publicschool conversions (alternative high schools) typically can rent the facilities they used previously or cansecure a facility through the local school district with which they usually have good relations.
0 The operational monies provided by the state seem to be sufficient at the current level of operational costs.Some PSA directors reported that the schools can be operated with a profit expectation of $1,000 perstudent. The majority of PSAs in Michigan are operational at the lower grade levels, and the recognized costof instruction is considerably less than it is for high school grades. Also, the average salaries for teachersare at a comparable or even lower level than the starting salaries for beginning teachers in the school districtsin which the PSAs are located.
0 For the 1997/98 school year, the PSAs typically received between $20,000 and $40,000 from the MichiganCharter School Grant Program (these grants are from federal funds intended to help charter schools withstart-up costs). In addition, most schools were awarded two or more other grants. Nevertheless, the schoolsvary considerably in terms of qualifying and applying for and securing grants. While one school was ableto secure as much as $570,000 in a single year, most schools receive between $40,000 and $100,000 fromexternal grants in a single year.
0 The PSAs vary considerably in their ability to attract private gifts and donations. Some PSAs have receivedprivate gifts and donations in the form of money, loan guarantees, supplies, and even buildings.
0 The PSAs are to receive the same per student allocations (foundation grants) as the host district in whichtheir school lies, or a maximum of $5,962 during the 1997/98 school year. During the 1997/98 school year,the average per pupil foundation grant for the state was $6,061. In more than half of the schools, thefoundation grant is the same as for the host districts. In 37 PSAs, the host district received additional fundsthat exceeded $100 per pupil, and in 21 cases the additional per pupil foundation grant exceeded $500. Ina few cases, the host districts had such high foundation grants that they ended up receiving as much as$2,000 to $3,000 more per student than did the local PSA.
0 In terms of total revenues for the 1996/97 school year, 15 of the 73 PSAs had more resources per pupil thandid their host district. The two PSAs operated by Native American Indian groups had more than double theper pupil revenues of their host districts. For most PSAs, however, the additional funding that host districtshad available per pupil (based solely on the foundation grant) remained larger or actually increased. Duringthe 1996/97 school year, the average state per pupil revenue was $7,050.
0 In 1996/97, 7 of the 73 PSAs spent more per pupil than did their host districts. On the average, the hostdistricts were spending between $900 and $1,800 more per pupil than the PSAs located within their district.Obvious differences in spending would be the costs of transportation, which many PSAs do not provide, aswell as the large difference in teachers' salaries.
viii
1 3
O The PSAs appear to be spending a higher proportion of funds on support services than did comparabledistricts (Prince, 1998). They also spend more on administrative activities. Over time, there also appearsto be a trend toward reduced spending on general administration and school administration, but increasedspending by the business office. This is likely to be due to the increased involvement of managementcompanies.
0 Disparities in salaries between the PSAs and host districts are extremely large. In at least two cases, theaverage salaries of PSA teachers are one-third the average salaries of teachers in their host district. Theteachers in five PSAs had average salaries that were $30,000 or more lower than their counterparts in thehost districts. Even for salaries of beginning teachers with comparable training, the PSAs reported that theypay 10-25 percent less than their host district.
0 A comparison of costs between PSAs and schools in their host district is complicated by a number of factorsthat weigh differently for PSAs and traditional public schools. Some of these include the following:
S While PSAs initially have to spend more for facilities, they have considerably lower costs for instructionas is evident in the comparison of salaries.
S While the traditional public schools have to devote a portion of their state aid for such things astransportation, meals, and other support services, this is optional for PSAs.
S Most PSAs provide instruction at only the elementary level, which is considerably less expensive thanschooling at the high school level.
S In terms of economic planning, the PSAs have an advantage since they can accept only a specific numberof students that fit into their economic plans. On the other hand, the presence of PSAs poses problemsin planning for the traditional public schools, who must provide a place for all students who want one,since it is more difficult to plan for a specific number of students.
S Particular areas where there is a lack of knowledge and information to make comparisons include the costsfor such things as start-up and facilities. Likewise, it is difficult to determine the value of in-kind services.
0 Both traditional public schools and PSAs claim that the "playing field is not level" in terms of resources.Further research into this area would be helpful in determining measures to distribute resources fairly.
Description of Teachers and Staff in PSAs
0 Among the 728 teachers and staff sampled, 69.3 percent indicated that they are teachers, 12.4 percentteaching assistants, and 7.3 percent specialists. There were no student teachers in the schools during datacollection. Just under 4 percent indicated that they were principals or school directors, and nearly 20 percentindicated that they had some other title or position. Many of the teachers and staff have more than one role.
0 Of the 488 staff who indicated they are teachers, 92 percent reported that they are currently certified to teachin Michigan, 2 percent were certified in another state, 3.9 percent were working to obtain certification, and2 percent indicated that they were not certified and were not working to obtain certification. Thisinformation should be considered indicative and not conclusive.
0 Most teachers reported that they were teaching in a subject area in which they are certified to teach.Approximately 5 percent of all staff working in the classroom indicated that they were not certified in thesubjects they taught.
ix
181
O The age distribution among the PSA teachers and staff indicated that they are rather young. Amongclassroom teachers, 47.8 percent were in their 20s, 24 percent were in their 30s, 21.4 percent were in their40s, and 7.1 percent were 50 or older.
0 In terms of ethnic composition of teachers/staff, 85 percent were white, 9.3 percent African American, 1.3percent Hispanic, 0.8 Asian or Pacific Islander, and 3.7 percent Native American Indian. In terms of genderdifferences, 79.6 percent of the teachers and staff were females, and 20.4 percent were males.
0 Among those 611 staff who had completed a university degree, 78 percent had a BA as their highest collegedegree, 17.5 percent had an MA, 3.1 percent had a 5- or 6-year certificate, and 1.3 percent had a Ph.D.Forty-two percent of the staff were working toward another degree.
0 Eighteen percent of directors/principals and 11 percent of teachers indicated that they did not intend toreturn during the next school year. While these data were collected between December 1997 and February1998, many strong conflicts at the end of the year caused a large number of teachers to quit in some cases;in other cases the teachers or the director or both were removed by the school board.
0 On average, the teachers and staff had 6.4 years of experience as educators. There is clearly a large gapbetween the teachers, with an average of 5.9 years of experience, and the principals/directors, with 19.5 yearsof experience. A considerable percentage of the teachers are in their first or second year of teaching. About40 percent of the accrued experience of teachers and staff was in private and/or parochial schools. The bulkof the experienced teachers in the Michigan charters schools are in the conversion schools. Charter schoolteachers in Michigan are relatively weak when compared with the directors, who have considerably moreexperience, education, authority, and salary than teachers.
0 The relative age, formal education levels, and amount of working experience of these charter school teachersis markedly lower than charter school teachers in other states (in Connecticut, where we are conducting asimilar evaluation, the classroom teachers had, on average, nearly 30 percent more experience than theclassroom teachers in Michigan's PSAs).
0 All but 22 staff members (3.1 percent) indicated that they were aware of the school's mission. Of those whoindicated they were familiar with the mission of the school, 36.8 percent thought the mission was beingfollowed "very well," while 41.4 percent thought it was being followed "well," 18.6 percent "fair," and 3.2percent "not very well."
0 While the teachers and staff were generally quite satisfied with the schools' missions (76 percent of the staffindicated that they were "satisfied" or "very satisfied" with it), they were not equally convinced that theschools could fulfill them. There was a statistically significant difference between the "ideal school"represented by the school mission and the "actual school" represented by the perceived ability of the schoolto fulfill its stated mission.
Working Conditions and Level of Satisfaction for Teachers and Staff
0 The quality of the school facilities varied extensively among the charter schools. Therefore, it was notsurprising to see an even split in the responses from teachers and staff concerning the quality of theirschools' facilities. Approximately 45 percent of the staff were satisfied or very satisfied with the schoolbuildings and facilities. On a related item, 42 percent of the teachers and staff agreed or strongly agreed thatthe physical facilities were good, while the rest were either not satisfied with the facilities or were uncertain.
x
182
O The survey results indicated that the schools vary widely in the quality of their facilities and the availabilityof resources. This was also confirmed in site visits and interviews. Just over 37 percent of the teachers andstaff indicated that they thought their school had sufficient financial resources. On a related item, 43 percentof the teachers and staff indicated that they were satisfied with the resources available for instruction.
O PSA teachers typically receive 10-25 percent less pay relative to what they would earn in the traditionalpublic schools with their particular training and experience. Because there are more experienced teachersin the traditional public schools, in many cases the average teacher salaries in the PSAs are less than halfthe average salaries in the host districts.
0 Thirty-nine percent of the teachers and staff were satisfied or very satisfied with the salaries they received,while 23.9 percent were either dissatisfied or very dissatisfied with their salaries. A large proportion of thestaff (37 percent) indicated that they were neither satisfied nor dissatisfied with their salaries.
0 The teachers do not have tenure, although nearly all of them have some form of benefits and retirement.Fringe benefits appear to vary considerably among the schools. This can be seen in the large proportion ofteachers and staff who were "very dissatisfied" or "very satisfied" with the fringe benefits they received. Thismay be indicative of a need to consider this and other issues on a school-by-school basis.
0 Teachers were particularly satisfied with the small class sizes. This was an important reason for seekingemployment at the charter school.
0 Thirty-six percent of the teachers and staff indicated that they were insecure about their future at theirparticular school. In terms of satisfaction with their jobs, 12.3 percent of the teachers and staff indicatedthat they did not plan/hope to be teaching in that particular school next year, as compared with 87.7 percentwho intended to return.
0 Most teachers and staff have many noninstructional duties in addition to their teaching load. A large numberof teachers and staff complained about this. On the whole, however, the teachers and staff were quite awareof the large commitment they needed to make to get the school "up and running."
0 A number of differences existed between teachers and school principals/directors. The principals had moreexperience, more training, and were more likely to have worked in private and/or parochial schools.Teachers were less positive about the schools and were less likely to think they could influence the directionof their school. As one would expect, teachers did not rate the administrative leadership of their schools ashigh as did the principals. The charter school principals were less likely to indicate that class sizes were toolarge and were less inclined to indicate that teachers had many noninstructional duties.
0 A number of significant differences existed between the schools/classes at the primary and secondary levels.Parents hador exercisedless influence over schools in the upper grades, and communication with the homewas perceived to decline in the upper grades. The teachers and staff indicated that less innovation and lowerachievement levels were more likely with the upper grades. The staff also indicated that fewer supportservices and fewer resources for instruction were available in the upper grades. Likewise, the teachers in theupper grades were less satisfied with the school facilities although they were more satisfied with fringe benefits.
0 A number of identical items were used in the surveys to examine and compare the charter school staffs'"initial expectations" as opposed to "current experience." In general, it is clear that the teachers and otherstaff were content with their schools and satisfied with the services they provide. However, there were
xi
183
significant differences between what was initially expected and what the educators were currentlyexperiencing. What the teachers and staff were reporting as "current experience" was significantly lesspositive than their "initial expectations." The biggest differences between initial expectations and currentexperience were on the following items: (i) The school will have/has effective leadership and administration;(ii) Students will receive/receive sufficient individual attention; and (iii) Teachers will be able to influencethe steering and direction of the school.
0 Among the most important factors for seeking employment in charter schools was the opportunity to workwith like-minded educators and interest in an educational reform effort. These are two intrinsic factors. Anumber of factors that suggest a better working environment were also found to be important in influencingdecisions to seek employment at the charter schools; for example, working with small classes, committedparents, safety at school, and high academic standards. Just over 30 percent of the teachers agreed orstrongly agreed that "difficulty in finding other positions" was an important factor.
0 Relative to the traditional public schools, the PSAs did not appear to have better professional developmentopportunities. Of course, possibilities, for professional development in the PSAs varied extensively.
Students and Parents
0 At the start of the 1997-98 school year, there was a total of approximately 26,000 students in all the schools.(This figure is only a reasonable estimate since it includes expected enrollments in September 1997 for allexisting schools and anticipated enrollments for the 27 new charter schools that had begun operating). Forthe 1998/99 school year, the enrollments are estimated to be close to 34,000.
0 Among the sampled students, the average amount of time enrolled in their schools was 2.2 years. Just over77 percent of the students had previously attended a public school, while 12 percent had attended privateor parochial schools and 7.4 percent were home-schooled. Because of the location and nature of the PSAs,most students live in urban or suburban areas and are enrolled at the elementary level.
0 In terms of ethnicity, 68 percent of the sampled students were white, 19 percent African American, 5.6percent Hispanic, 0.7 percent of Asian or Pacific Island descent, and 6.9 percent were Native AmericanIndians. Forty-eight percent of the sampled students were females.
0 Among the sampled parents, 78.6 percent were white, 14.6 percent were African American, 3.6 percent wereHispanic, 0.4 percent were of Asian or Pacific Island descent, and 2.8 percent were Native AmericanIndians. Eighty-six percent of the parents who completed the surveys were females.
0 Half of the sampled parents had family incomes between $40,000 and $100,000, with 5 percent of thefamilies over $100,000. Only 3.6 percent of the families had annual incomes lower than $10,000.
0 Sixty-one percent of the parents reported that they did not volunteer at school at all or to a very limited degree(i.e., less than 3 hours per month). On the other hand, a much smaller proportion of the parents reportedvolunteering quite extensively. Eighteen percent of the parents volunteered between 4 and 6 hours per month,5.6 percent volunteered between 7 and 9 hours per month, and 7.8 percent volunteered more than 12 hours amonth.
xii
O Most PSAs apparently do not formally require that parents volunteer at the school (25 percent of the parentsreported that voluntary work was required), although from interviews it is clear that the schools expectgreater support and volunteer work from parents.
0 The average distance to the charter school was 5.3 miles, while the average distance to the nearest applicabletraditional public school was 2.5 miles. Since most PSAs do not provide busing, this indicates a high levelof commitment on the part of parents.
0 Parents indicated that the following 6 factors were most important to them in choosing the school: (i) goodteachers and high quality of instruction, (ii) emphasis and philosophy of this school, (iii) safety, (iv)academic reputation (high standards), (v) more emphasis on academics than extracurricular activities, and(vi) promises made by charter school's spokespersons.
0 Just over 58 percent of the students thought they would recommend to a friend that he/she enroll in theirPSA. On the other hand, 15.4 percent reported they would not recommend their school to a friend, and 26.5percent were not sure.
0 Parents sending their children to a PSA had high expectations for the school. In all categories where wesolicited information on parents' initial expectations and current experience, we found significant decreases.The largest disparities between initial and current expectations were regarding school leadership/administration, quality of instruction, and individual attention for students.
0 Students were asked to rate their own performance at school. The sampled students perceived theirperformance to be better at the PSA than at their previous school. Just over 50 percent of the sampledstudents indicated they were more interested in their schoolwork at their PSA than they were at theirprevious school, 13 percent were less interested, and 36.4 percent indicated their interest level was aboutthe same.
0 Safety at school has been an important concern of parents and an important factor for choosing a charterschool. Only 13.4 percent of the sampled parents reported they had concerns for their child's safety at thePSA. Nevertheless, several parents still had concerns about the safety of their children on the schoolgrounds.
0 Some PSAs have few or no students with special educational needs, while others have more than their hostdistricts. Many PSAs advocate full inclusion of students with disabilities. Characteristics of PSAs deemedto be successfully providing for students with disabilities include the following: more individualizedinstruction for all students, lower teacher/student ratio, and absence or limited use of special educationlabels.
0 Most PSAs work with local intermediate school districts (ISDs) in order to meet the special needs of theirstudents. A small proportion of the schools can provide the necessary special education with only their ownstaff. A few schools contract with a local private center to provide for the special needs of students.
PSA Legislation and Role of MDE
0 A majority of PSA informants were generally content with the current legislation. Many individualsexpressed their wish that the legislation would stipulate that start-up funds be made available to the schoolsso that they could secure, build, or renovate a facility. Some persons thought the state of Michigan shouldguarantee bank loans or establish a fund from which schools could borrow money.
O Several informants, including some authorizers, thought that more time should be mandated to plan anddevelop the school prior to opening the doors to students. While this issue may be addressed with newlegislation, it may be more logical to require this as part of the authorization process.
0 Several charter school representatives thought that the state should provide more technical assistance to thecharter schools.
0 The most prominent legislative issues raised by educational management organizations (EMOs) include thefollowing: (i) provision of more start-up funds or guaranteed loans, (ii) allow multiple site charters as in thecase of Arizona, and (iii) allow expansion to second sites for schools that are performing well and have longwaiting lists.
0 The PSA legislation has only begun to provide parents and pupils with greater choices among publicschools, both within and outside their existing school districts. Currently, approximately 2 percent of thecompulsory level students in Michigan's public schools are enrolled in PSAs. Choice opportunities createdwithin the public school sector are largely limited to urban areas. The few rural PSAs that exist are in theproximity of a town from which they can attract students.
0 Principals of PSAs indicated that the state required too much paperwork and too many reports. Someprincipals were extremely vocal in criticizing the extensive reporting requirements.
0 The charter schools arein their own wordsbeing swamped with mail from MDE, most of which they claimis irrelevant to their particular school (each PSA receives all pertinent paperwork for principals and schoolsuperintendents). The MDE, on the other hand, is concerned that it is not accused of overlooking anyparticular school in terms of access to information.
0 Nearly all PSAs reported that MDE representatives had never visited their schools, although there waswidespread agreement that the response to telephone requests for support and guidance was quite good. Anumber of the schools indicated that they had virtually no contact with the MDE, and some principals saidthey wanted to keep contact to a minimum.
Authorizing Agencies
0 There are four potential types of authorizing agencies in Michigan: public universities, community colleges,intermediate school districts, and local school districts. Authorizing agencies are responsible for overseeingthose schools to which they grant a charter. A contract is written up between the authorizer and the schoolin question, and the authorizer is responsible for seeing that the charter school lives up to the charter andis in compliance with applicable rules and regulations.
0 There are currently 137 PSAs operating in Michigan. Of these, 109 are authorized by universities, 1 by acommunity college, 15 by intermediate school districts, and 12 by local public school districts. Among thestate universities, 5 that have not authorized charter schools (i.e., University of Michigan, Michigan StateUniversity, Wayne State University, Western Michigan University, and Michigan Technological University).The Board of Trustees at Western Michigan University has decided to develop a policy to begin charteringschools, possibly as many as 6 by the 1999/2000 school year.
xiv
188
O The decision to have universities authorize PSAs is rather unique in the country. In most states, the localeducation authorities or a state authority, or both, issue charters. Many point out that this attribute inMichigan is due to a political decision: since the governor wants charter schools, and since the governorappoints the members of the boards of all state universities (aside from Michigan State University, TheUniversity of Michigan, and Wayne State University), this is a political arena that the governor can control.At a conference in December 1998, the president of Eastern Michigan University stated that he was againstcharter schools, but when the governor threatened Eastern Michigan University with allocations, he changedhis mind.
0 Approximately 90 percent of the total charter school enrollment is in schools authorized by universities.There are advantages and disadvantages for the universities and for the charter school initiative with thisparticular arrangement. While university boards tend to mandate involvement in chartering schools, thecolleges/ departments of education at these universities tend to oppose charter schools and their university'sinvolvement in authorizing charter schools. The involvement of university staff is usually limited to staffin the charter school office and does not include a broader exchange. At a few universities, opposition bythe faculty has reportedly decreased.
0 The role of authorizer is inconsistently understood and applied across the state. The value of authorizeroversight and assistance varies considerably among the authorizing agencies.
0 In some cases the authorizers attempt to conceal rather than reveal weaknesses or problems at their schools.One authorizer has had several schools that have run into a number of very serious problems. The head ofthis authorizing office reported that they have little power to steer the schools. Another authorizer took avery different course by initiating a process of investigation that led to a decision not to renew one school'scharter.
0 The charter schools pay a 3 percent administrative fee to the authorizing agency. This fee covers costs forreviewing applications, issuing charters, and providing oversight to the schools. Authorizing agencies alsoprovide some technical assistance to the schools they charter. Examples of services provided by theauthorizers include the following: monthly newsletters, workshops or meetings for school directors, trainingfor new board members, and assistance from third-party consultants paid for by the authorizing agencies.
0 Many of the authorizers, especially those with small schools and/or few schools, thought that the 3 percentfee was barely sufficient or not sufficient enough to conduct the oversight required. Reportedly, oneauthorizer is taking steps to return money to the schools it authorizes since it thinks it receives too moneyfor the oversight and technical assistance it provides.
0 Many of the authorizers we interviewed indicated that it is not possible to distinguish specific expenses.The processing of applications can consume between 10 and 25 percent of their total expenditures.
0 After requesting an application form for submitting an application for a charter, it usually takes 5-6 monthsbefore successful applicants receive a contract with an authorizing agency. There are, of course,considerable differences among the authorizers as well as differences that occur from year to year.
0 Oversight is a rather new activity, and in many respects it is fair to say that the authorizers are learning asthey go. Given the experience of the first few years, many authorizing agencies are developing rathereffective routines that help to streamline oversight activities. They have also been able to develop
xv
187
comprehensive packages of information to facilitate the schools' operations in terms of compliance issues.Authorizing agencies appear to be receiving a considerable amount of support and guidance from oneanother.
0 Generally, the schools reported receiving between 3 and 7 visits per year from representatives of theauthorizing agencies. Documentation provided by Central Michigan University indicated that the numberof visits made to PSAs ranged from 4 to 27 during the 1996/97 school year. Other authorizers also indicatedthat they made far more visits to the schools than the schools themselves had indicated. For example, manyauthorizers have a representative attend PSA board meetings.
0 Comments from the school principals regarding their authorizing agencies varied extensively dependingupon which authorizer they had and how certain they were that their comments would remain confidential.
0 Among the four state universities that were authorizing in our part of the state, the schools chartered byGrand Valley State University and Saginaw Valley State University were clearly most satisfied with theoversight and support they were receiving. The comments from the directors of the three schools charteredby Northern Michigan University were generally quite favorable. Due to a number of factors, such aschanges in charter office leadership and pressure on PSAs resulting from a state audit, the principals of PSAschartered by Central Michigan University were clearly least satisfied with the role their authorizer played.
0 Not all authorizing agencies provide the MDE with requested information. The length and quality of theinformation provided vary extensively. The Michigan Department of Education does not usually receivefinancial statements from authorizing agencies regarding how the 3 percent administrative fee is used.These entities are generally universities that have no reporting responsibilities to the MDE.
0 Eligible organizations have a number of reasons for not exercising their authority to authorize PSAs. Forthe local school districts, the list might include the following: (i) view that charter schools are competitors,(ii) potential conflicts with the union, (iii) loss of enrollment and revenue for the traditional public schools,and (iv) disagreement with the concept and the use of public funds for charter schools.
0 Reasons why universities and community colleges did not exercise their authority to charter PSAs includethe following: (i) lack of compatibility of this activity with the mission and purpose of the university; (ii)lack of personnel and/or resources to fulfill the expectations of an authorizer; (iii) potential conflict ofinterest and loss of support from other public schools from which the university enjoys support andcooperation for student teaching, internships, research, etc.; (iv) faculty disagreement with the concept ofPSAs; (v) disinterest in engaging in a politically charged agenda item that is not central to the legislativeauthority of higher education; and (vi) unwillingness to engage in a relationship with specific parties (andtheir beliefs) that have approached selected universities about the chartering/authorizing process.
0 Other factors that affect decisions by state universities: (i) Would future resource allocations to a universitybe affected by a politically unpopular stance? (ii) How much authority/responsibility would the universityhave for a failing PSA? (iii)The opportunity to attract the 3 percent administrative fee seems to have littleimpact on these decisions.
Management Companies
0 Educational management organizations (EMOs) have become influential stakeholder group in the PSAinitiative. During the 1997/98 school year, just under 50 percent of the schools were contracting out services
xvi
183
to EMOs. During the 1998/99 school year, this figure jumped to approximately 70 percent. There alsoappears to be a trend that a larger proportion of new applicants that receive a charter already haveagreements with management companies.
0 The nature and purpose of the management companies vary extensively according to a number ofcharacteristics including whether they are for-profit or nonprofit and whether they work with one school,locally, or several schools in several different communities. Five types of management companies areidentified in the report.
0 An emerging group of businesses cater specifically to charter schools and provide a range of services. Someare limited to specific services, while others provide a wide variety of services. Some schools usemanagement companies only for payroll and benefits purposes, while other schools use EMOs to plan,develop, and manage most aspects of the school.
0 Relative to other states, Michigan's PSA initiative is more attractive to EMOs. Some of the factors thatmake Michigan charter schools an attractive market for EMOs include a lack of restrictions on school size,limited involvement of local school districts, and a lack of restrictions about the operation of for-profitcompanies in the charter schools.
0 Some of the factors that influence PSAs to contract out part or all of their instructional and managementservices included the following: limited start-up funds, limited technical assistance, pressure fromauthorizing agencies, and PSA administrators being overwhelmed by paperwork and bookkeeping. Thereis clearly a symbiotic relationship between many of the PSAs and their management companies.
0 For the authorizers, it is clearly advantageous to have schools that work with management companies. Theseschools will have access to capital and fewer budgetary problems.
O A number of schools expressed concern with the management companies, primarily due to the issue ofcontrol over the curriculum and focus of the school. At a few schools, the staff and parents were angry andupset that their management companies had assumed a tight control over the school.
0 While the PSA initiative was intended to promote parent and teacher influence in the schools, some EMOsstart and run the schools according to their own visions and motives. Several management companies areinvolved in the selection process of board members. Although board appointments are made by theauthorizing agency, the recruitment and recommendations for board members have also come from themanagement companies.
0 The logical development of the relationship between PSAs and a management company begins when thePSA searches for a company to provide for its particular needs. Increasingly, we are seeing the opposite,with management companies going in search of a "community" to host its schools. In fact, at severalschools we were informed that the impetus behind the school was not a local group of parents or educators;rather, it was the management company.
Innovations and Use of Educational Technology
O As noted in the PSA legislation, one of the primary purposes for PSAs is to stimulate innovations. For thepurpose of this evaluation, we have considered innovations to be something new and different that isintroduced. There are numerous operational definitions of "innovation,"and it is clear that there is a need
xvii
182
to establish a definition that is credible among education professionals and other external audiences, yetreasonably reflective of local perceptions. While a number of innovations were reported by individualsassociated with the charter schools, experienced educators would likely not agree that these ideas orpractices were new. To be reasonable, we also considered and reported examples of educational practicesthat seem to be infrequently found in other schools. Additionally, we broadened our search for innovationsto include not only teaching methods, but also innovative educational practices.
0 Based upon school visits and documentation provided by PSAs, we conclude that there are limitedinnovations being developed and applied in the PSAs. In fact, the charter schools were remarkably similarto' the regular public schools, with the notable exceptions of generally smaller student enrollments, thepresence of additional adults in the classroom, governance, and span of contracted (management) services.Many schools that had unique curriculums areover timereverting to "canned curriculums" that do notnecessarily address the goals and objectives of the school. While many innovative and unique ideas werehighlighted in school plans, we found that many schools were not able to develop and implement theseideas.
0 Instances of reported innovations include team teaching, direct instruction, cooperative learning,modular/block scheduling, uniforms for students, etc. Many of the reported innovations have actually beenpracticedon at least a limited scalein traditional public schools.
0 Since there were few clear innovations, the issue of transportability is not an immediate expectation.Nonetheless, there is little evidence that communications or procedures to engage in dialogue with thetraditional public schools exist with regard to transportability of innovations or effective practices.
0 Among some of the most noteworthy innovative or unique practices in instruction and teaching that werehighlighted by PSA staff, the following can be mentioned:
S specific focus or theme in the curriculum, i.e., Native American, African American, fine arts, agriculture,ecology, etc.
S community activity experiences for students with a mentorS co-enrollment of high school students in community college coursesS multilevel (grade/age) classroomsS Montessori methodsS extensive before and after school activities programS small class size with additional adults (aides or volunteers) assisting the teacherS greater individualization, in some cases with Individual Education Plans (IEPs) for all studentsS desire and intent of involving parents in the school
0 In terms of school management and operations, we saw some practices that are quite different from theregular public schools. Obviously, some of these come as no surprise because the legislation either dictatesor specifically authorizes such an arrangement. For example, the involvement of authorizers and nonelectedgoverning boards are unique characteristics of Michigan PSAs. Other educational practices cited orrecognized as innovative or unique with regard to the broad area of school management and governance arelisted below (the practices listed above as innovations in the realm of school management and operationsare not generally found in all charter schools):
S use of for- and not-for-profit management companies for diverse services ranging from the provision oflimited financial services to general management of a school
xviii
190
S contracting for instructional services with a private company as opposed to employing teachersS renovation of a variety of structures/buildings for school useS extensive nepotism in employment of relativesS transportation of students to and from school provided by parentsS absence of a lunch program for students (this results in a lack of free or reduced meals for students who
would qualify)S personal assumption of school indebtedness by founder and/or parentsS lack of tenure for teachersS use of bonuses for teachers to supplement otherwise low salaries in selected casesS shared or sole decision making by teachers in selected areasS ability to accept students from across geographic linesS decision to construct less costly but functional buildingsS increased emphasis on the facilitator role of building administrator
0 Questions could be raised about the desirability of some of the innovations identified with schoolmanagement and operations.
0 While charter schools can develop and refine innovations that can be transferred to other schools, individualcharter schools are not likely to develop new models of management that can be applied to the overallmanagement and operation of school districts or intermediate school districts. Large EMOs, however, aredeveloping and putting into practice a number of new management and operational ideas, many of whichare borrowed from business. Traditional public school districts can learn from many of these ideas.Examples of these include new approaches to the construction of school buildings; more competitiveapproaches to purchasing of materials; and more effective business management, which requires fewerpersonnel.
0 Aside from computers, other forms of technology are seldom mentioned or identified by PSAs. Inpromotional materials for charter schools, especially informational materials widely disseminated incommunities to attract students, greater access and use of technology or computers are often stated amongthe advantages of charter schools. The surveys from teachers, parents, and students indicate that educationaltechnology was an area where most PSAs were not living up to expectations.
0 Start-up as well as maintenance costs for technology are significant, and this could be a reason for thecurrent lack of extensive use of technology in the charter schools. Some schools received grants or gifts forthe purchase of equipment, and others reported that they had sought monies for purchasing computers withmixed success. In the schools themselves, the facilities for housing computer student stations or labs rangedfrom a variety of makeshift arrangements to well-designed laboratories.
0 There is little evidence to indicate that charter schools have made greater or more innovative use oftechnology/computers than a typical regular school. Generally, charter school teachers are minimallyprepared to use the computers and probably less knowledgeable about the potential uses/benefits of otherforms of technology.
Demonstrating Success
0 The need to demonstrate school success, especially student achievement, is almost universally found to bea challenge, if not a major problem.
xix
191
O There are pockets of denial even in the charter schools about where the ultimate accountability for studentperformance should lie. At the same time, charter schools are acutely aware of the fact that they must beattractive to students and parents if they are to survive, and one would hope that demonstrated accountabilityfor student performance would be one factor in a school being considered attractive.
0 Concerns have been raised by PSAs regarding accountability in terms of student achievement. Some ofthese are exemplified by the following:
S There are too many outside factors that influence student achievement which we cannot control.S We cannot be held responsible for the poor education these students had in earlier years.S This school has targeted students with poor academic backgrounds, and we hope only to improve their
learning, not make up for their poor educational background.S We are being sent the problem kids and those with learning/behavior disorders (by the local public
schools).S The MEAP tests and other standardized tests do not provide an assessment of what we are trying to
accomplish.
0 While many PSAs prefer not to administer standardized tests, they have not been successful in identifyingor at least in reporting evidence of success in other defensible/persuasive ways.
0 Nearly half of the PSAs note that they need to develop or improve the personnel evaluation practices at theirschools. A few schools have developed exemplary procedures for personnel evaluation. The largermanagement companies also tend to have more elaborate procedures to evaluate teachers. In a few schools,the principals noted that they lacked knowledge about how to develop an evaluation system.
0 There are many misleading reports about student success found in newspapers and other publicly distributedmaterials. Oftentimes, these reports are based on selected and very small (inappropriate) samples withoutproperly identified comparisons or adequate explanatory information.
0 Many schools claim that the single most important piece of evidence regarding the success of the school isthat parents choose their school for their children. Nevertheless, while most of the schools are filled, thereappear to be high rates of attrition among teachers, students, and even principals.
0 It is difficult to determine if each PSA is fulfilling its performance contract with its authorizing agency sincethe schools vary considerably in their performance and in their ability to demonstrate concretely how wellthey are performing. The authorizing agencies also vary considerably in the expectations they set for theirschools. Large differences exist among authorizers, and differences exist in contracts from the sameauthorizer. Several authorizing agencies noted that they have become more stringent in setting highexpectations and requiring more standardized testing.
0 The results from the evaluation did not indicate substantial changes or innovative ideas about howaccountability of student performance is being assumed at the school site level other than by definition ofthe charter school itself.
0 PSAs were chartered on the basis of a specific mission and curriculum. In a number of instances, we findlittle relationship between the stated mission of the school and the achievements cited for the students.
xx
P 2
O Since many PSA spokespersons are critical of the use of MEAP test scores, it was surprising to hear manyschools suggest this as part of the evidence that their students are succeeding.
0 Several schools employ only standardized tests to measure student achievement/success. Some schools listthe MEAP test as their only evidence of student success/achievement, whereas others list two or morestandardized tests.
0 Other indicators of success mentioned by PSAs included enrollment, retention, attendance, communityawards and college scholarships, changes in student behavior, character, morals, and quality and quantityof communications with parents.
0 There is a trend toward greater use of standardized tests to demonstrate success in PSAs. The new PSAsare also being pressed to identify objectives that are more readily measurable. The reason for these changesis because the authorizing agencies expect and require them. Charter schools in other states have gonethrough a similar process. After the first few years, providing evidence of success becomes a higher priorityfor the schools and their oversight authorities.
0 Graduation rates can also serve as an indicator of success. Unfortunately, more time is needed before thiscan be a valid indicator of a PSA's relative success. Few PSAs provide instruction at the high school level,and even fewer have students in Grade 12. Among the 10 PSAs that reported data on graduation rates duringthe 1996/97 school year, 4 had higher graduation rates and 6 PSAs had lower graduation rates than their hostdistricts.
0 On the whole, the PSAs had higher dropout rates than did their host districts. Three of the 11 PSAs forwhich comparable data were available for the 1996/97 school year had lower rates of dropout than their hostdistricts. These three schools reported 0 percent dropout and were the only schools that had dropout rateslower than the state average of 6.1 percent. The other 8 schools had dropout rates that ranged from 7 to 51percent, with most falling between 19 and 33 percent.
MEAP Test Scores
0 The design of the PSA initiative is to place accountability for student progress, or lack of progress, on theschools themselves. In Michigan, MEAP test results can be reported on a school-by-school basis for boththe traditional public schools and for the PSAs. The use of these data will help to measure the performanceof the schools. Of course, more time is required; andpreferablymore rigorous methods to measure studentachievement should be used.
0 It is too early to attribute test scores to the PSAs. For the newly established PSAs, tests results, such as theMEAP, can provide an indication of the students attracted to the PSAs.
0 MEAP test scores do not provide a fair indicator of the success of PSAs for a number of reasons. Onereason is that the schools are too new. Another reason cited by charter school spokespersons is that theschools attract a high proportion of at-risk students and students with special needs. In order to control forsome of these factors, an analysis of gains in terms of MEAP test scores were conducted over time in ourstudy. Thus, a PSA that attracted a large number of poor performing students could still show more progressthan the host district in terms of "value added."
xxi
I q3
O We compared the PSAs with their host districts and then compared the gains in MEAP scores over 2 and3 years. The PSAs that have taken in a large proportion of at-risk students can be treated fairly in thisinterpretation since we are measuring increases in the performance of their students over a few years. Theappendices contain the results of our analysis of the MEAP results for each of the 106 PSAs in operationduring the 1997/98 school year as well as their host districts.
0 As a group, the PSAs have significantly lower MEAP scores than their host districts. However, a school-by-school comparison shows that students in some PSAs have higher scores than the students in their hostdistricts.
0 When comparing 2- and 3-year gains, we find that the schools in the host districts have larger gains, on thewhole, than do the PSAs.
0 It is important to note that the overall picture is very mixed. Even while one school is far behind its hostdistrict in Grade 4 reading, for example, it may be outperforming the host district in reading at another gradelevel or in another subject area.
0 To the extent possible, more factors need to be controlled in order to make a fair comparison between thePSAs and their host districts. We believe that our approach to the analysis of test results is a step in the rightdirection, although we recognize the need to compare the schools over a longer period of time.
0 School climate provides a secondary indicator of success in schools. As a means of comparing PSAs withtraditional public schools, we used a nationally normed instrument to measure school climate in the PSAs.The results from the School Climate Surveys indicated that the PSAs had, on average, better school climatesthan the national norm. The teachers, students, and parents in the PSAs perceived that the teacher-studentrelationships were noticeably higher than in an average public school. Some limitations to consider are thatthe national norms are based on K-12 schools, while most PSAs cater to elementary schools only. Also alarge number of schools that were perceived to be less successful and/or which were undergoing large staffturnover due to conflicts refused to take part in this component of the study.
0 On a few of the subscales identified on the School Climate Survey, such as "Guidance," "StudentActivities," and "Administration," the PSAs were equal or slightly lower than the national norms.
Impact on Local School Districts
0 The PSAs are clearly having an impact on their local school districts. Interviews of stakeholders at each ofthe 51 schools included in our evaluation and in many of the host school districts included questions aboutthe negative and positive impacts the PSAs have had upon the local host school districts. In the state as awhole, the impact is still quite limited since only around 2 percent of the K-12 enrollments are in PSAs.However, in some cities and some suburban areas where the PSAs are more concentrated, the negative andpositive impacts are more noticeable.
0 Because the PSA initiative coincides with a number of other public education reforms in Michigan, it issometimes difficult to distinguish whether or not changes in traditional public schools are due to thepresence of PSAs.
0 Not surprisingly, the PSA leaders were more apt to report positive impacts and the leaders of traditionalpublic schools were more apt to report negative impacts attributable to the presence of PSAs.
0 The presence of PSAs has put pressure on the traditional public schools to be more accountable. Even inareas with no PSAs in operation, evidence of the impact of the PSA initiative can be seen in the reneweddebate about the quality and performance of public schools.
1 94.
O Important characteristics of the PSAs are small class and school size. The presence of PSAs is likely to bea factor that can inhibit further consolidation of public schools.
0 In some areas, the ISD or the local school district questioned parents who left their traditional public schoolto enroll in a PSA. This inquiry often resulted in action by the local public schools.
0 In other countries, the presence of new alternatives to the public schools have induced changes in the publicschool sector such as a stronger willingness on the part of education bureaucracies and teachers unions toseek new ways in which to make changes in the public schools. We can expect that this may be one impactof the PSA initiative.
0 Positive changes in local public schools that appear to be attributable to the presence of PSAs include thefollowing:
S the introduction of all-day kindergartenS increase in adult supervision on the playgroundsS increased emphasis on customer satisfactionS provision of more before and after school programsS more efforts to involve parentsS increased efforts on the part of schools to communicate with the homes of their studentsS increased marketing of traditional public schoolsS more emphasis on foreign languageS more attention to performance on the MEAP is seen by many as an improvement that isin
partattributable to the charter schools that compete with the traditional public schools
0 The most immediate negative impact of the PSAs is a loss of finance for the local public school.
0 Further complications for traditional public schools in terms of planning and general administration are dueto uncertainty about enrollments at the beginning of the school year and shifts of students during the schoolyear. Many parents double enroll their children, which further complicates this. While a PSA can set theexact number of students it wishes to enroll, the traditional public schools are obligated to take all who apply.In some cases, the traditional public school starts the year with a number of less-than-full classes. In othercases, the local public school district receives more students than it planned for and has to scramble forteachers.
0 The presence of one or more PSAs has caused some urban districts to consider or actually redraw catchmentareas. Parents are easily scared by not knowing where their child(ren) will be enrolled. Uncertainty aboutcatchment areas as well as class size, assigned teachers, etc., creates anxiety among both parents andeducators and contributes to a decrease in legitimacy for the traditional public schools.
0 While many PSAs cater to minorities and at-risk pupils, there are several PSAs that use a number ofmechanisms to structure their learning communities (these mechanisms include absence of busing, selectiveadvertizing, requirements for parental involvement, lack of hot lunch programs, etc.). In these instances,one can claim that the PSAs are "creaming" off the students according to racial and socioeconomiccharacteristics. These schools will also attract students whose parents are more resourceful and supportive.
0 While no PSAs have complained about having to take students after the first student count, several localschool districts have protested that the PSAs "are dumping" students back after the fourth Friday count.
q 5
Major Findings and Future Research
0 There are a number of legal issues that the PSA initiative has raised. Key legal issues include the status ofpublic school academies; conflicts of interest; expulsion/suspension of students; employer role andresponsibility as contracting agencies; and the closure of PSAs, particularly those with deficits. Keylegislative issues include start-up funds, funds for buildings and other capital improvements; caps onnumbers of schools to be chartered by universities; clarification of oversight/supervisory and monitoringresponsibilities; special education funding; and the need for continuing evaluation and evidence ofaccountability.
0 For the next few years, we expect that the PSA initiative will continue to grow at the same rate.Nevertheless, as we have seen in other countries, the greatest interest for starting new schools is strongestin the first few years and declines afterwards.
0 The PSAs have not been welcomed by the traditional public schools. Initially, there appears to be ratherstrong opposition, but over time relations improve. We have even seen examples of cooperation betweenthe PSAs and local public schools.
0 One of the key findings from our study is that the PSAs are so extremely diverse. Because of a number offactors spelled out in the report, we expect that diversity among the PSAs will decrease with time.
0 One other significant finding is that many poor performing PSAs are not likely to close, even when parents"vote with their feet" and exit the school on a large scale. This is due to the abilities of founders to recruitnew families and authorizing agencies not acting on poor performing schools or schools plague with problems.
0 Major barriers and challenges for the near future include the following: (i) lack of available start-up monies;(ii) building or finding suitable facilities; (iii) dealing with the bureaucracy; (iv) retaining and attractingcertified and qualified teachers; (v) adequately addressing the special needs of students with variousdisabilities/challenges; and (vi) need to demonstrate school success and student achievement.
0 The greatest impact of the PSAs is that they are forcing more accountability upon the traditional publicschools.
0 Other states have used a wide variety of mechanisms to help safeguard against further segregation basedupon race, class, and ability. Michigan should consider such safeguards.
0 Areas for future research: innovations in school management and operations; further analysis of fiscal datato determine how PSAs differ from traditional public schools; areas where PSAs are more efficient;provision of special educational support for students; and the nature, role, and consequences of EMOs.
0 Finally, it is important to understand that this study was conducted over a limited period of time in whichwe observed some outstanding efforts, especially among the PSA teachers, and strong commitments on thepart of many administrators and founders. Clearly, there are some PSAs with potentially bright futures but,at the same time, there are PSAs that are facing major challenges and the expectation of their success is quitelimited. There are strong PSAs and there are weak PSAsa situation not dissimilar among traditional publicschools. The PSA/charter school initiative is a bold effort of education reform, and it should be continuallyevaluated and judged on the merits and benefits it provides for the most important element of any publicschoolthe students.
xxiv
196
d
U.S. Department of EducationOffice of Educational Research and Improvement (OERI)
National Library of Education (NLE)Educational Resources Information Center (ERIC)
NOTICE
REPRODUCTION BASIS
IC
This document is covered by a signed "Reproduction Release(Blanket) form (on file within the ERIC system), encompassing allor classes of documents from its source organization and, therefore,does not require a "Specific Document" Release form.
This document is Federally-funded, or carries its own permission toreproduce, or is otherwise in the public domain and, therefore, maybe reproduced by ERIC without a signed Reproduction Release form(either "Specific Document" or "Blanket").
EFF-089 (9/97)