BIOGRAPHICAL SKETCH Gary W. North Department of the ...
12
BIOGRAPHICAL SKETCH Gary W. North Department of the Interior U.S. Geological Survey Washington, D.C. Mr. North was born in Schenectady, New York; was graduated from Davis and Elkins College, Elkins, West Virginia, with a Bachelor of Arts degree in history and political science; and has done graduate work at Utica College of Syracuse University. In 1962 he attended the Air Force's Photo-Radar Interpretation School and subsequently served as a photo interpretation officer with that organization. In 1965 he joined Raytheon Autometric Company's Rome, New York, office and worked in support of various remote sensor evaluation programs and associated projects of the Rome Air Development Center. In 1968 he joined Raytheon's terrain sciences department and was responsible for the system's integra- tion for the NASA/U.S. Geological Survey, Southern California Remote Sensing Test Program. In addition, he was the on-site program manager for a side looking radar survey in Ecuador, South America. In 1969 Mr. North joined the U.S. Geological Survey where he is assigned to the Geographic Applications Program and works in association with the Department of the Interior's Earth Resources Observation Systems Program (EROS) and with the NASA Earth Resources Aircraft Program. During 1970 he was responsible for two special projects involving the application of remotely sensed data to environmental problems. The first project resulted in the publication of a booklet entitled "Environmental Conditions and Resources of Southwestern Mississippi" and the second, in the preparation of a report entitled, "Remote Sensing of Environmental Pollution." During the summer of 1970 he was selected to serve as the alternate representative of the Department of the Interior on the National Aeronautics and Space Council's Interagency Ad Hoc Study Group on the Earth Resources Survey Program. Mr. North is a member of the Association of American Geographers and the American Society of Photogrammetry. He was named to the 1961-62 edition of Who's Who in American Universities and Colleges and the 1970 list of Outstanding Young Men of America.
-
Upload
khangminh22 -
Category
Documents
-
view
1 -
download
0
Transcript of BIOGRAPHICAL SKETCH Gary W. North Department of the ...
BIOGRAPHICAL SKETCH
Gary W. NorthDepartment of the InteriorU.S. Geological Survey
Washington, D.C.
Mr. North was born in Schenectady, New York; was graduatedfrom Davis and Elkins College, Elkins, West Virginia, with aBachelor of Arts degree in history and political science; andhas done graduate work at Utica College of Syracuse University.In 1962 he attended the Air Force's Photo-Radar InterpretationSchool and subsequently served as a photo interpretation officerwith that organization. In 1965 he joined Raytheon AutometricCompany's Rome, New York, office and worked in support of variousremote sensor evaluation programs and associated projects of theRome Air Development Center. In 1968 he joined Raytheon's terrainsciences department and was responsible for the system's integra-tion for the NASA/U.S. Geological Survey, Southern CaliforniaRemote Sensing Test Program. In addition, he was the on-siteprogram manager for a side looking radar survey in Ecuador, SouthAmerica. In 1969 Mr. North joined the U.S. Geological Surveywhere he is assigned to the Geographic Applications Program andworks in association with the Department of the Interior's EarthResources Observation Systems Program (EROS) and with the NASAEarth Resources Aircraft Program. During 1970 he was responsiblefor two special projects involving the application of remotelysensed data to environmental problems. The first project resultedin the publication of a booklet entitled "Environmental Conditionsand Resources of Southwestern Mississippi" and the second, in thepreparation of a report entitled, "Remote Sensing of EnvironmentalPollution." During the summer of 1970 he was selected to serve asthe alternate representative of the Department of the Interior onthe National Aeronautics and Space Council's Interagency Ad HocStudy Group on the Earth Resources Survey Program. Mr. North is amember of the Association of American Geographers and the AmericanSociety of Photogrammetry. He was named to the 1961-62 edition ofWho's Who in American Universities and Colleges and the 1970 listof Outstanding Young Men of America.
291
REMOTE SENSINGOP
ENVIRONMENTAL POLLUTION
by
Gary W. North
Department of the InteriorU.S. Geological SurveyWashington, D.C. 20242
ABSTRACT
Environmental pollution is a problem of international scopeand concern. It can be subdivided into problems relating to water,air, or land pollution. Many of the problems in these three cate-gories lend themselves to study and possible sollution by remotesensing. Through the use of remote sensing systems and techniques,it is possible to detect and monitor; and in some cases, identify,measure, and study the effects of various environmental pollutants.As a guide for making decisions regarding the use of remote sensorsfor pollution studies, a special five-dimensional sensor/applica-tions matrix has been designed. The matrix defines an environ-mental goal, ranks the various remote sensing objectives in termsof their ability to assist in solving environmental problems, liststhe environmental problems, ranks the sensors that can be used forcollecting data on each problem, and finally ranks the sensor plat-form options that are currently available.
Examples of remote sensor data relating to various environ-mental problems will be shown during the oral presentation of thispaper. These examples have been extracted from a special reportentitled "Remote Sensing of Environmental Pollution." This reportwas prepared by the Geographic Applications Program of the U.S.Geological Survey for the Department of the Interior's EarthResources Observations Systems Program, and for the Earth Observa-tions Program of the National Aeronautics and Space Administration.
INTRODUCTION
Several days ago, during the first part of this InternationalWorkshop, many of you heard a paper outlining the various stepsrequired to carry out a regional assessment of environmentalquality through the use of remote sensing. The objective of thispaper is to concentrate on one of those steps and look in detailat many of the detrimental factors that tend to lower the quality
232
of an environment. We are going to examine some of the problems ofland, air, and water pollution and discuss many examples of howremote sensing devices can detect, identify, measure, monitor, ordetermine the effects of various environmental pollutants. Withineach category an attempt will be made to show what can be observed,interpreted, and/or monitored from currently available experi-mental and operational spacecraft, high and low altitude aircraft,and ground based platforms. Examples of special processing, en-hancement, and analysis techniques will not be discussed in detail,since they have already been, or will be, covered in several of theother papers during the workshop.
The illustrations shown during the oral presentation of thispaper were taken from a special report entitled "Remote Sensing ofEnvironmental Pollution" prepared by the U.S. Geological Survey,with substantive contributions from many different governmentalagencies and commercial firms. This report covers more than 50 ofthe environmental problems faced by this nation. Many of these maybe problems in your own country and if they are not, they representpotential problems that you may face in the near future.
REMOTE SENSING SYSTEMS
Various remote sensing devices can be used to collect thedifferent kinds of data relating to pollution. In many cases asingle sensor can provide the necessary data while for others, aspecialty sensor or combination of sensors may be required.
Cameras;
Perhaps the oldest, best known, and most widely used remotesensor is the camera. You will probably find this to be the easi-est, cheapest, and most flexible sensor to use. With lens optionsand different film/filter combinations, much can be accomplishedwith a camera system.
Infrared and Multlspectral Line Scanners:
A second family of sensors includes the infrared and multi-spectral line scanners. Infrared scanners are built to detect thethermal infrared, or heat energy emitted by objects. They are mostuseful in detecting heated effluents from power plants, industrialprocesses, or monitoring the surface temperatures of rivers, lakes,and streams. They can be used during the day or night, since theyrecord energy emittance and not the sun's reflected energy. Vari-ous models of these scanners are available commercially and can becarried about in suitcase size boxes and used in small aircraft.
293
Multispectral scanners operate on the same principle asthe Infrared scanners except that they record data In other por-tions of the spectrum, In addition to the Infrared. Only a fewof these sensors are being flown experimentally In this country.They are very expensive to operate and maintain, and often requirea computer system to effectively analyze the raw data.
Radiometers:
Radiometers are non-Imaging sensors which measure emitted orreflected electromagnetic energy and graphically display thisinformation on a strip chart recorder. They can be built to besensitive to a range of energy from the ultraviolet portion of thespectrum to the infrared region, and are useful in recordingspectral signatures for various objects. When flown in conjunc-tion with a thermal scanner, they can provide temperature measure-ments of the ground or water which can then be correlated with thedifferent grey tones of the thermal imagery. By using radiometersand scanners together, it is possible to eliminate the need fortaking temperature samples on the ground. Another application ofthese sensors involves using them to determine the thickness ofcrude oil slicks lying on water surfaces.
Side Looking Radar:
Side looking radar is an all weather, day/night sensor that isparticularly effective in imaging large areas of terrain. Aspecial advantage of this sensor is that it penetrates most cloudsand thus, if you live in a perpetually cloud covered region of theworld, it may be practical to acquire radar coverage instead ofphotography. This sensor, while not specifically designed forpollution detection, is effective in monitoring strip and open pitmining operations and other large scale changes to the landscape.It could also be used to monitor extent and level of contentchanges in large industrial waste ponds or tailings dumps andfor monitoring oil spills.
Correlation Spectrometer:
Another specialty sensor is the correlation spectrometer.This non-imaging sensor was built to detect quantities of gases inthe atmosphere from either an aircraft, or hopefully, spacecraftplatform. This device measures the concentrations of a singleair pollutant in a column of air between the ground and the plat-form and then prints out the concentrations on a strip chartrecorder. Even though it is undergoing development tests, it hasdemonstrated its usefulness in detecting, from aircraft, sulfurdioxide and nitrogen dioxide, two pollutants that are major
294
components of smog. These sensors can also be placed in mobilevans to be moved about on the ground to check on various smoke-stack emissions.
Decibel Recorders:
A decibel recorder is a device to measure the relative inten-sity of sound. The sensor detects and records various noises on astrip chart recorder thus producing a graphic record of its inten-sity. Such devices could be used to determine whether or nothousing should be allowed near such things as airports, expressways,heavy industry, etc.
Fraunhofer Line Discriminator;
The Praunhofer Line Discriminator was built specifically todetect and measure fluorescence. Currently undergoing flightdevelopment tests in a helicopter, the device has effectivelydetected concentrations of Rhodamine WT dye as small as five partsper billion. This alone is encouraging since this dye is oftenused to study current and mixing patterns in water bodies. Bymixing portions of the dye with particular pollutants, it may bepossible to determine to a greater extent what the fate of thesesubstances may be once they enter a stream or lake. It is hopedthat additional instruments will be built to detect small quantitiesof such things as crude oil, fish oil, pulp mill wastes, and othersubstances that fluoresce.
Scintillation Detectors:
Scintillation detectors are often referred to as aeroradio-activity equipment and are placed in low flying aircraft to detectand monitor gamma radiation. The sensors record radioactivity incounts per second, and by plotting flight paths and sensor readings,individual ranges or radioactivity levels can be assigned to speci-fic areas. These instruments are useful in monitoring radioactivewaste material disposal areas and in checking radioactivity levelsof nuclear power plant effluents.
SENSOR/APPLICATIONS MATRIX
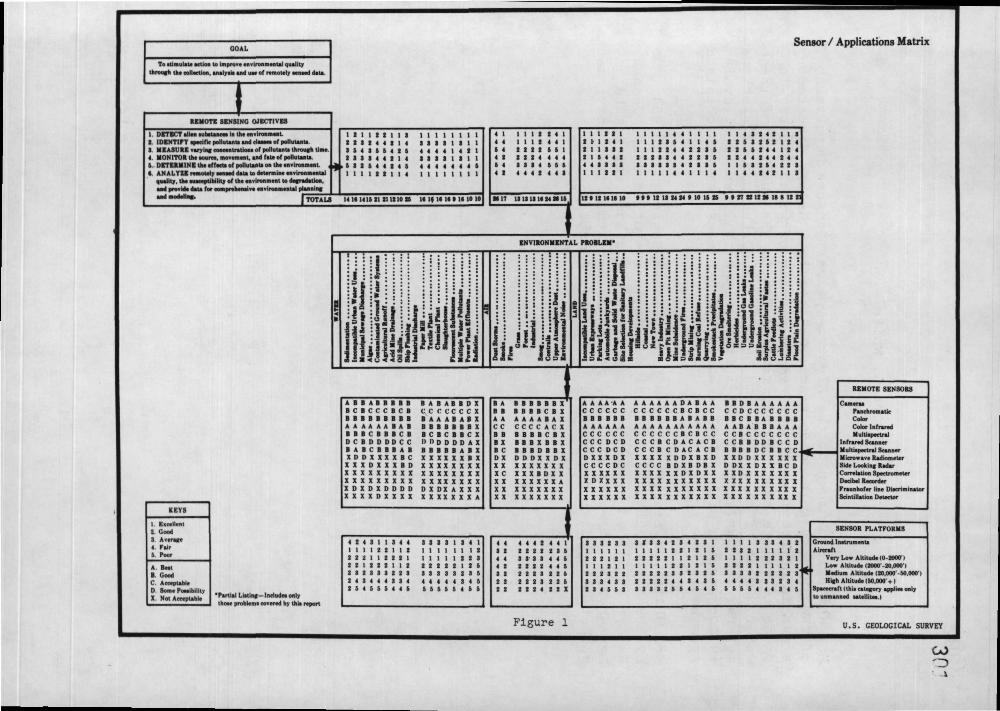
With the sensors that have just been described it is possibleto detect and monitor; and in some cases, identify, measure, andstudy the effects of various environmental pollutants. There are,of course, many variables involved and once a basic photographiccoverage has been fully interpreted for current and potential pollu-tion sources, new decisions requiring supplementary data will benecessary. As a guide for making these decisions, a special five-dimensional matrix has been designed. The matrix defines an envi-
295
ronmental goal, lists the environmental problems, ranks the sensorsthat can be used for collecting data on each problem, and finallyranks the sensor platform options that are currently available.
Figure 1 shows the matrix for water, air, and land pollutionproblems. To use the matrix one simply reads the numbers andletters in each of the blocks, and checks them against the key tosee what they mean. Each block represents a decision involvingtwo factors. For example, if the environmental problem is oilspills, the matrix indicates that remote sensing is an excellentway to detect, identify, and monitor such spills and that it repre-sents an excellent input for environmental planning and modeling.This is shown by the use of the number (1) in the appropriateblocks. Remote sensing is only a fair way, however, to determinethe effects of oil spills on the environment, since this requiressupplemental ground level sampling and analysis. This is shown bythe use of the number (4). In the blocks involving the sensor/problem interaction, the matrix indicates that a multispectralscanner is the best, or (A), sensor for providing data, but thateither a camera with color infrared film, a side looking radarsystem, or a microwave radiometer would be good (B) choices toprovide additional oil spill data. The last of the matrix blockssuggests that an aircraft flying at altitudes of 600 - 6,000meters would be an excellent, or (1), platform for the chosensensor or sensors.
To show the overall range of effectiveness of remote sensingto assist in solving environmental problems, the numbers in theRemote Sensing Objectives block have been totaled. By checkingthe total for each environmental problem, one is able to determinewhich problems are most amenable to solution by remote sensing.
ENVIRONMENTAL PROBLEMS
A. Water
Water pollution is a world-wide phenomena, and irresponsiblehuman attitudes and activities will probably create an even morecritical problem in the future. Water pollution is not a localproblem for once a pollutant has been added to the water it iscarried downstream into lakes, underground acquifer systems andeventually the oceans. Multiple demands for water will continueto increase, especially near the urban centers of the world. Asthis demand increases, we must remember that the discharge fromone user becomes part of the water supply for the next. Thus, itis critical that each time water is used it must be released in asafe condition. Remote sensing can detect and monitor many ofman's activities regarding the use and misuse of water.
296
The following list represents a few selected examples ofvarious water pollution problems in the United States. By examiningremote sensor data covering these subjects and then studying thematrix, one may gain a better understanding of how effective remotesensing is in trying to find a means to solve these problems.
1. Incompatible Urban Water Uses
2. Municipal Sewage Discharges
3. Algae
4. Contaminated Ground Water Systems
5. Acid Mine Drainage
B. Air
The Earth's atmosphere is the most mobile of the three basiccomponents of our environment. It is a dynamic system which hasneither regional boundaries nor ownership attached to it. Naturecontributes particulate matter to the atmosphere when a volcanoerrupts, when a forest burns, and when winds blow across a barrenarea. Man does a comparable thing when he burns fossil fuels,drives his automobiles, or runs his factories. In fact, whereconcentrations of people are the greatest, so are the concentrationsof air pollutants. Because cities have become heat and particulateanomolies, they are beginning to affect the climate of areas aroundthem. Polluted air masses also cost these same areas a significantnumber of days of sunshine per year. Add to this the fact thatrespiratory illnesses and even deaths increase with high levels ofair pollution, and one can see the severity of the problem we face.
Remote sensing systems have a significant role to play in thecollection of air pollution data. They will not replace the presentground monitoring systems and laboratory analyses which are performed,but they can add a new dimension to air pollution control by provid-ing a regional perspective, by detecting sources and some specifictypes of pollutants, and by determining representative sample points.The combination of both the more common ground sampling networksand the synoptic view provided by remote sensors can provide aneffective detection and monitoring system. Eventually we may evenbe able to plot and trace concentrations of various pollutantsaround the globe in much the same way that we presently monitorcloud and weather systems.
The following list represents examples of air pollution pro-blems that are also included and ranked on the Sensor/ApplicationsMatrix.
297
1. Smog
2. Dust Storms
3. Fire and Volcanoes
4. Contrails from Aircraft and Ships
5. Ore Smelter Smokestack Plumes
C. Land
The lana resources of the world are neither unlimited inareal extent nor equally capable of supporting human activity.Some of it has been abused and some of it has actually been de-stroyed for any future productive capability by exploitation anduncontrollled growth. In areas where the land is adaptable to avariety of productive purposes, the demand is greatest and thecompetition between various land uses is most intense. At present,land use policy is usually determined by who will pay the highestprice for each parcel of land. In the years ahead it will becomeincreasingly important for each nation to decide what value itplaces on each activity and each parcel of land. Each of youshould make these decisions based on scientific data and humanvalues in an attempt to establish an environmentally sound masterplan for future development. In this way each activity will beallocated the proper amount and type of land, many land pollutionproblems will be eliminated, and the quality of the overall envi-ronment will be improved.
Land pollution problems are different from air and waterproblems because with land ownership is involved. Parcels of landbelong to someone but no one owns the air or a river and besides,unless they are detected at their source, water and air pollutantsdrift or float away. Land problems, however, remain stationaryand until the owner and probable cause are identified and forcedto correct the situation, the problem will remain.
Remote sensing can locate and identify these problems andmonitor any remedial actions that are taken. The following listof examples from the matrix will illustrate various land problemsand how they can be observed by remote sensing.
1. Parking Lots
2. Garbage and Solid Waste Disposal
3. Hillside and Coastal Housing Developments
298
4. Open Pit Mining
5. Underground Fires
6. Underground Gasoline Leaks
7. Lumbering Activities
8. Disasters
CONCLUSION
On February 10, 1970, the President of the United States madean address to Congress on the environment. In this speech he said:
"... We came only late to a recognition of how preciousand how vulnerable our resources of land, water, and airreally are...The time has come when we can wait no longer torepair the damage already done, and to establish new criteriato guide us in the future...The tasks that need doing requiremoney, resolve, and ingenuity—and they are too big to bedone by government alone. They call for fundamentally newphilosophies of land, air, and water use, for stricter regu-lation, for expanded government actions, for greater citizeninvolvement, and for new programs to ensure that government,industry, and individuals all are called on to do their shareof the job and to pay their share of the cost...The fightagainst pollution, however, is not a search for villains.For the most part, the damage done to our environment hasnot been the work of evil men, nor has it been the inevitableby-product either of advancing technology or of growingpopulation. It results not so much from choices made, asfrom choices neglected: not from malaign intention, butfrom failure to take into account the full consequences ofour actions."
This message applies not just to Americans, but to the citizensof all the nations of the Earth. If you too can accept this as achallenge, and perhaps employ some of the remote sensing techniquesyou have learned about at this workshop, we can all work togetherto build a quality environment for the many generations who willfollow us here on the Earth.
299
GLOSSARY OF TERMS
Acid Mine Drainage - Phrase used to describe the acidic waterwhich commonly drains from strip and underground coal mines. Itspresence can usually be inferred whenever a stream has a brightyellow/orange color. This color is produced by a liquid called"yellow boy" which is the result of the chemical reaction of theacidic water with iron.
Aeroradioactlvlty Equipment - Sensor or instrument that isused in low flying aircraft to detect and monitor gamma radiation.
Anomolies - Quantities which increase uniformily with time.
Correlation Spectrometer - A sensor built to detect gasses inthe atmosphere. This device analyzes the column of air between thesensor and the ground and then plots out the concentrations of eachgas on a strip chart recorder. By plotting these readings alongthe line of flight, a verticle profile map of gas concentrationscan be made. It is used primarily to detect sulfur dioxide.
Decibel Recorder - A sensor used to measure the relativeintensity of sounds.
Effluent - Term used to describe any liquid discharge.
Enhancement - Process by which certain details or grey tonesof a piece of remote sensor data are magnified and/or intensified.
Flourescence - Property possessed by certain substances ofemitting light following exposure to external radiation.
Fraunhofer Line Discriminator - A remote sensing device builtspecifically to detect and measure flourescence.
Infrared Line Scanner - A remote sensing device built todetect the thermal infrared energy emitted by objects. The wordscanner is used in connection with this sensor because the detec-tion system involves the use of a rotating mirror which directsthe incoming radiation through a detector and onto a piece of filmat the rate of one scan line per rotation.
Matrix - A form which shows the linkages between two or moreinterrelated subjects.
Multispectral Line Scanner - A remote sensing device whichoperates on the same principle as the infrared scanner except thatit is capable of recording data in the ultraviolet and visibleportions of the spectrum as well as the Infrared.
300
Platform - Term used to describe the vehicle or equipment onwhich a remote sensing device can be mounted. An aircraft orspacecraft is often referred to as a sensor platform since it iscapable of having sensors attached to it.
Radiometer - A non-imaging sensor which measures emitted orreflected electromagnetic energy.
Remote Sensing - Term used to describe the use of instru-ments that measure properties of objects without coming intodirect contact with them. It is also used to describe a seriesof related problem solving activities involving data acquisition,collection, processing, distribution, and analysis.
Rhodamlne WT Dye - A red dye used in hydrology studies. TheWT indicates a specific type of rhodamine which has a peak fluores-cence of between 5,800 and 5,820 angstroms.
Scintillation Detector - A remote sensing device built todetect gamma radiation with energy levels greater than 50 Kev(thousand electron volts).
Side Looking Radar - An all weather, day/night remote sensorwhich is particularly effective in imaging large areas of terrain.It is called an "active" sensor since it generates its own energywhich is transmitted and received out the side of the aircraft toproduce a photo-like picture of the ground.
Smog - Term used to describe a polluted air mass comprised ofa mixture of smoke, fog, gasses, and other particulates.
Spectral Signature - Quantitative measurement of the prop-erties of an object at several wavelength intervals.
Tailings - Term used to describe the material separated asresidue in the preparation of various products, grains or treatedores.
is11"VJ
GOAL
to Improve environmental qualityanalytic and uae of remotely eeneed daU.
n SENSING OBJECTIVES |
1 i
||
_ « «
»
-
,-*, ~
-, M
M M
- -
::::::
UIKOB in the environment 1pollutant! and daeaea of pollutants. I
[ concentration* of polluUnU throufh lime |•ce, movement, and faU of pollutant*. Ifforta of polluunu on the environmMt. , f . 5y aeneed daU to determine in vironmenul 1•illty of the environment U degradation .r comprehensive enviroBmental planning
iffijiniliillliiiiiiiiiE
EiilS
tfliliilifi-«-,«,.
M2II21«a2aaM«•M«
11 II MM 11 J |ll
2Mi
1 11 1 II 10 10
as2SS
\ TOTAL* 14 U Mil
!
|s
•»|M
*|u»H
»M
*v»r4
"»S
tyoq
tup
p^e
oJie
pan
Mfl«
pu«K
| «Nt«taB
eA
»«niim
MM
do
filiniii <
*e»H
•PM
HH
flMV
l
' "
»*̂
«̂I *
^B
PP
V
•B
REHOTE SENSORS
|
I
1 *
1
<u
"«
UQ
U«
«K
KK
K
oa
'^
^o
xa
KK
K
CENSOR PLATFORMS
£ c
u
±
* J!
nttrum.nu
Low Altitude 10-2000' 1
Altilud. 12000 -20.000 1urn Altitude 120.000 M.OOOl
Altitude IM.OOO'-t-l
ft ( thu category appliw only
ned utellitOT.I
1JIH
IJI
o<
.Is
1 *
1
»._
«„,
""""""»
— ft
~ ft
ft r)
— tt
— e
t ft n
M M
M
M N
M
V N
« « «• M
M
W N
w
«
M
M N
•« M
•• M
M M
^
"° "*""**"**
1 41 11 21 19 14 Si 4
•Pirli.l Lulint- Include, only
, ?if
i-i IlIJi
•a
*<
«
< o
a o
O
x
&
U.S. GEOLOGICAL SUF
r-\
<Ub•Hfc
30*