
Minutes No.13 Southwest Power Pool OVERSIGHT COMMITTEE ...
75
Minutes No.13 Southwest Power Pool OVERSIGHT COMMITTEE MEETING October 1, 2007 DFW Hyatt Regency, Dallas, TX • MINUTES • Agenda Item 1 – Administrative Items SPP Chair Josh Martin called the meeting to order at 12:15 p.m. The following members were in attendance: Josh Martin (Director), Phyllis Bernard (Director), and Quentin Jackson (Director). Staff in attendance included Stacy Duckett. Guests included Jim Eckelberger (Director); David Hodges and Matt Harward (SPP); and Craig Roach (Boston Pacific). Mr. Martin referred to the draft minutes of the June 28, 2007 meeting and asked for corrections or a motion for approval (6/28/07 Minutes – Attachment 1). Quentin Jackson moved to approve the minutes as presented. Phyllis Bernard seconded the motion, which passed unopposed. Agenda Item 2 – Review of Past Action Items Stacy Duckett reviewed the Action Items report (Action Items - Attachment 2). Agenda Item 7 – FERC Fines Report Stacy Duckett reviewed the Summary of the FERC Penalty Assessments report (FERC Penalty Report – Attachment 3). Following discussion, the group requested to receive this report at each quarterly meeting. Agenda 3 – Annual Assessment Stacy Duckett presented a draft of the revised Committee scope for consideration. Following discussion, Mr. Jackson moved to approve the revised scope. Ms. Bernard seconded the motion, which passed unopposed (Oversight Committee Scope – Attachment 4). The committee reviewed the Annual Assessment (Oversight Committee Assessment - Attachment 5). No revisions were offered. Agenda Item 4 – ANOPR/Marketing Monitoring Comments Stacy Duckett reviewed comments for the ANOPR that SPP participated in with the IRC related to market monitoring. Another item of discussion was the recent PJM order regarding the market monitoring function and independence. The Committee asked to be kept up to date on these matters. Agenda Item 5 – Update on Current Activities Market Monitoring Unit Richard Dillon reviewed the quarterly activity report for the Market Monitoring Unit (MMU Report – Attachment 6). Two primary concerns in regards to market operations today are: • Ensure the calling of appropriate levels of TLR • Ramp rates
-
Upload
khangminh22 -
Category
Documents
-
view
2 -
download
0
Transcript of Minutes No.13 Southwest Power Pool OVERSIGHT COMMITTEE ...
Minutes No.13
Southwest Power Pool
OVERSIGHT COMMITTEE MEETING
October 1, 2007
DFW Hyatt Regency, Dallas, TX
• M I N U T E S •
Agenda Item 1 – Administrative Items
SPP Chair Josh Martin called the meeting to order at 12:15 p.m. The following members were in attendance: Josh Martin (Director), Phyllis Bernard (Director), and Quentin Jackson (Director). Staff in attendance included Stacy Duckett. Guests included Jim Eckelberger (Director); David Hodges and Matt Harward (SPP); and Craig Roach (Boston Pacific).
Mr. Martin referred to the draft minutes of the June 28, 2007 meeting and asked for corrections or a motion for approval (6/28/07 Minutes – Attachment 1). Quentin Jackson moved to approve the minutes as presented. Phyllis Bernard seconded the motion, which passed unopposed.
Agenda Item 2 – Review of Past Action Items
Stacy Duckett reviewed the Action Items report (Action Items - Attachment 2).
Agenda Item 7 – FERC Fines Report
Stacy Duckett reviewed the Summary of the FERC Penalty Assessments report (FERC Penalty Report – Attachment 3). Following discussion, the group requested to receive this report at each quarterly meeting.
Agenda 3 – Annual Assessment
Stacy Duckett presented a draft of the revised Committee scope for consideration. Following discussion, Mr. Jackson moved to approve the revised scope. Ms. Bernard seconded the motion, which passed unopposed (Oversight Committee Scope – Attachment 4). The committee reviewed the Annual Assessment (Oversight Committee Assessment - Attachment 5). No revisions were offered.
Agenda Item 4 – ANOPR/Marketing Monitoring Comments
Stacy Duckett reviewed comments for the ANOPR that SPP participated in with the IRC related to market monitoring. Another item of discussion was the recent PJM order regarding the market monitoring function and independence. The Committee asked to be kept up to date on these matters.
Agenda Item 5 – Update on Current Activities
Market Monitoring Unit Richard Dillon reviewed the quarterly activity report for the Market Monitoring Unit (MMU Report – Attachment 6). Two primary concerns in regards to market operations today are:
• Ensure the calling of appropriate levels of TLR • Ramp rates
Compliance Committee Meeting October 1, 2007
SPP staff is following up appropriately and beginning to see results. Mr. Martin requested that Mr. Dillon provide an update and an appropriate recommendation for any mitigation measures at the next meeting. Mr. Dillon presented the revised Market Monitoring Inquiry Process (Inquiry Process – Attachment 7). Revisions reflect recent changes in the Committee scope, and clarification that the process is between the market monitors and the Committee/Board. Ms. Bernard moved to approve the revisions as presented. Mr. Jackson seconded the motion, which passed unopposed. External Market Advisor Craig Roach reviewed the quarterly activity report for the External Market Advisor (EMA) (EMA Report – Attachment 8). Boston Pacific is to provide an assessment of Market Monitoring and Mitigation Plans. Mr. Roach presented the outline of an approach for consideration and concurrence. The report will be provided at the meeting in Dallas on December 11. Mr. Roach discussed efforts related to the benefits calculation for the EIS Market. The Committee requested that Boston Pacific continue to work on methodology; but not actual calculations and report at the December meeting. SPP staff will assess members’ related activities and filing requirements and report as well. Mr. Roach presented a proposal for the 2008 scope of work for Boston Pacific. The Committee will consider and provide direction to SPP staff. Compliance Department David Hodges reviewed the quarterly activity report for the Internal Compliance Department (Internal Compliance Report – Attachment 9). The primary focus is Order 890 compliance. In addition, the SPP Reliability Coordinator will undergo an audit in October. Extensive preparations are being made by the compliance and operations staff. Mr. Hodges requested feedback on any other information the Committee would like to receive at future meetings.
Agenda Item 6 – EIS Market Update
EIS Market updates were discussed during other presentations.
Agenda Item 8 – Future Meetings
Future Compliance Committee meetings were confirmed as:
Schedule for 2007: December 11 Dallas – immediately following the BOD/MC meeting Schedule for 2008: March 27 Washington D.C.
June 26 Philadelphia September 25 Chicago December TBD
Executive Session
SPP staff and Boston Pacific are to bring a proposed 2008 scope of work to the December Oversight Committee meeting for review and approval. The executive session adjourned at 3:05 p.m. Respectfully Submitted, Stacy Duckett Secretary
Southwest Power Pool, Inc. OVERSIGHT COMMITTEE MEETING
October 1, 2007 DFW Hyatt Regency, Dallas, TX
• A G E N D A •
12:00 p.m. CDT
(or immediately following the Board of Directors/Members Committee meeting)
1. Call to Order/Administrative Items.......................................................................... Josh Martin
2. Action Items Status Report................................................................................. Stacy Duckett
3. Annual Assessment............................................................................................ Stacy Duckett
a. Revised Charter
b. Assessment Form
4. ANOPR/Marketing Monitoring Comments.......................................................... Stacy Duckett
5. Quarterly Activity Reports
a. Market Monitoring Unit...................................................................... Richard Dillon
b. External Market Advisor.......................................................................Craig Roach
c. Internal Compliance.......................................................................... David Hodges
6. EIS Market Update ........................................................................ Richard Dillon/Craig Roach
7. FERC Fines Report ........................................................................................... Stacy Duckett
8. Future Meetings ..................................................................................................... Josh Martin
Schedule for 2007:
December TBD
Schedule for 2008:
March 27 Washington D.C.
June 26 TBD
September 25 Chicago
December TBD
Executive Session
Relationship-Based • Member-Driven • Independence Through Diversity
Evolutionary vs. Revolutionary • Reliability & Economics Inseparable 1 of 65
Minutes No.12
Southwest Power Pool
COMPLIANCE COMMITTEE MEETING
June 28, 2007
Hilton Philadelphia Airport, Philadelphia, PA
• M I N U T E S •
Agenda Item 1 – Administrative Items
SPP Chair Josh Martin called the meeting to order at 9:00 a.m. The following members were in attendance: Josh Martin (Director), Phyllis Bernard (Director), and Quentin Jackson (Director). Staff in attendance included Stacy Duckett. Guests included David Hodges (SPP) and Craig Roach (Boston Pacific).
Mr. Martin referred to the draft minutes of the March 29, 2007 meeting and asked for corrections or a motion for approval (3/29/07 Meeting Minutes – Attachment 1). Quentin Jackson moved to approve the minutes as presented. Phyllis Bernard seconded the motion, which passed unopposed.
Agenda Item 2 – Review of Past Action Items
Stacy Duckett reported two past action items to review. Richard Dillon will report on inquiries to MMU and David Hodges will report on the internal compliance program. The committee asked for clarification of duties now that the Regional Entity (RE) Trustees are established. Stacy Duckett led the discussion and is to check the committee’s scope versus the new RE Bylaws and ensure synchronization. Phyllis Bernard requested information regarding the location of Ron Ciesiel and his group. The Compliance office remains in Plaza West, but is relocating to a separate space from other SPP staff to ensure appropriate segregation given their responsibilities.
Agenda Item 3 – Update on Current Activities
Market Monitoring Unit Richard Dillon referred to the quarterly activity report (MMU Report – Attachment 2). The Market Monitoring Unit (MMU) has received few inquiries during the quarter. Mr. Dillon provided an example of an education/what if inquiry that they would receive. The process remains informal and the MMU adheres to limitations of the type of information they can provide. The MMU staff is in the Maumelle office part time, but will shift to full time, during regular office hours. This facilitates discussions with operators and speedier resolution of issues/questions. Mr. Dillon discussed some potential issues with the committee related to compliance with the Tariff. This was for informational purposes only and the committee will continue to be updated. FERC has received appropriate reports as well. Mr. Dillon noted that the MMU is receiving increasing requests for data and information. Additional staff is requested in the 2008 budget to support these increasing requests. He provided some additional updates on inquiries, answering questions for the committee. External Market Advisor Craig Roach reviewed the quarterly activity report for the External Market Advisor (EMA) (EMA Report – Attachment 3). Work continues on the development of the quarterly report format. The State of the Market Report is completed. The EMA and the MMU met with FERC on May 23 to present the State of the Market Report, which was received well with good feedback. A full presentation will follow later in the agenda. The July report to the SPP Board of Directors will include June data, but will have to be distributed at the meeting rather than in advance.
Compliance Committee Meeting June 28, 2007
Compliance Department David Hodges provided background on FERC orders and industry initiatives necessitating establishment of the Compliance Department (Compliance Report – Attachment 4). To date, a gap analysis has been done to determine SPP’s (RTO, ICT, ITO) status in relation to the new standards requests. He was pleased to report zero self reports resulted, but did find processes to improve. Entergy will perform an audit on ICT operations later this year as provided for in the contract. Mr. Hodges then reviewed Order 693 Compliance Requests for RTO, ICT and ITO (Slides - Attachment 5). Audits will cover the applicable standards and may cover up to three years. In addition, there are data retention and documentation rights to support audits. Each standard has multiple requirements; each requirement has measurements; audits check the results. David will provide status reports at future meetings.
Agenda Item 4 – 2006 State of the Market Report
Craig Roach reviewed the 2006 State of the Market Report (SOM Report and Presentation – Attachment 6). Mr. Roach responded to questions from the committee. Ms. Bernard requested an update for appropriate person(s) at the July Board of Directors meeting on the Aggregate Study Process and its enhancements. Ms. Bernard moved to have an updated report provided at the Board meeting in July. Mr. Jackson seconded the motion, which passed unanimously.
Agenda Item 5 – 2007 Market Update
Richard Dillon reviewed the presentation provided to FERC on market operations through April (Market Update – Attachment 7). Mr. Dillon responded to questions from the committee. He then reviewed the market monthly Metrics Report for May (Metrics Report – Attachment 8). The group discussed various components of the report.
Agenda Item 6 – SPP Compliance Program
David Hodges provided additional information on the start up of the Compliance function, including software support; status of compliance monitoring programs; training; Center of Excellence initiatives; stakeholder support; participation in appropriate national forums; and participation in national standards development through the public comment process.
Agenda Item 7 – Summary of Action Items
Stacy Duckett reviewed action items for the next meeting: • Ms. Duckett to ensure the scope for the Compliance Committee is current given the new RE
Bylaws • Ms. Duckett to ensure update on the Aggregate Study Process on the July Board of Directors
agenda
Agenda Item 8 – Future Meetings
Future Compliance Committee meetings were confirmed as:
Schedule for 2007: September 27 Chicago December TBD Schedule for 2008: March 27 Washington D.C.
June 26 Philadelphia September 25 Chicago December TBD
3 of 65
Compliance Committee Meeting June 28, 2007
Other
The request was reviewed for Boston Pacific to review the PRR137a approach, per request from the special Board of Directors meeting on June 21 (Memo – Attachment 9).
Executive Session
The executive session adjourned at 3:00 p.m. Respectfully Submitted, Stacy Duckett Secretary
4 of 65

Southwest Power Pool, Inc. OVERSIGHT COMMITTEE
Pending Action Items Status Report September 20, 2007
Action Item Date Originated Status Comments
S. Duckett to revise committee scope to reflect new duties resulting from implementation of the Regional Entity
6/28/07 Pending
October 1 agenda item
S. Duckett to ensure inclusion of an update on the Aggregate Study Process on the July BOD/MC agenda
6/28/07 Completed
Discussed during MOPC report at July 24 BOD/MC meeting
5 of 65
Results of the 2007 Survey of Reliability Issues
6 of 65
Acknowledgement
Results of Reliability Issue Survey September 6, 2007
2
Acknowledgement The NERC Reliability Assessments & Performance Analysis Program would like to thank all the stakeholders and individuals who took the time to participate in this very important survey. We know the results will support the goal of improving electric reliability. We would like to thank everyone in advance for their continued support and contributions in the next step. Now the program will develop a white paper aimed at identifying the proper reliability metrics. Through collaboration and industry consensus, we expect to provide a solid framework of reliability benchmarking that will help measure the reliability performance of the bulk power system.
7 of 65
Table of Contents Acknowledgement .......................................................................................................................... 2
Table of Contents ........................................................................................................................... 3
Introduction.................................................................................................................................... 4 Mission of the Electric Reliability Organization.................................................................................. 4 Purpose of the Survey............................................................................................................................. 4 How this Survey was Conducted........................................................................................................... 4
Summary of Survey Results........................................................................................................... 5
Survey Results by Participation Rankings .................................................................................... 6 Organization Type.................................................................................................................................. 6 Position .................................................................................................................................................... 7 NERC Region.......................................................................................................................................... 8
Survey Results by Business Issue Rankings ................................................................................. 9 Likelihood of Occurrence ...................................................................................................................... 9 Severity of Impact................................................................................................................................. 10
Survey Results by Technical Issue Rankings ............................................................................. 12 Likelihood of Occurrence .................................................................................................................... 12 Severity of Impact................................................................................................................................. 13
Top Five Non-Survey Issues Identified by Participants ............................................................. 15
Survey Results by Preparedness Rankings ................................................................................. 16
Feedback....................................................................................................................................... 17
8 of 65
Introduction
Results of Reliability Issue Survey September 6, 2007
4
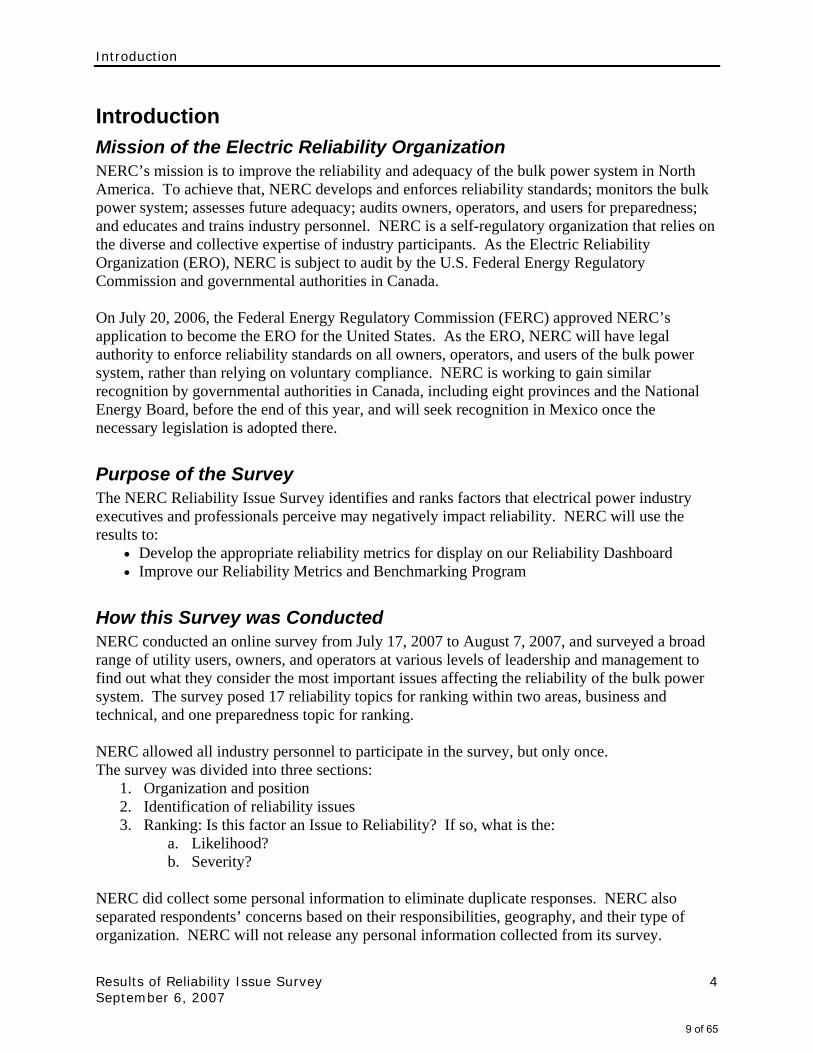
Introduction Mission of the Electric Reliability Organization NERC’s mission is to improve the reliability and adequacy of the bulk power system in North America. To achieve that, NERC develops and enforces reliability standards; monitors the bulk power system; assesses future adequacy; audits owners, operators, and users for preparedness; and educates and trains industry personnel. NERC is a self-regulatory organization that relies on the diverse and collective expertise of industry participants. As the Electric Reliability Organization (ERO), NERC is subject to audit by the U.S. Federal Energy Regulatory Commission and governmental authorities in Canada. On July 20, 2006, the Federal Energy Regulatory Commission (FERC) approved NERC’s application to become the ERO for the United States. As the ERO, NERC will have legal authority to enforce reliability standards on all owners, operators, and users of the bulk power system, rather than relying on voluntary compliance. NERC is working to gain similar recognition by governmental authorities in Canada, including eight provinces and the National Energy Board, before the end of this year, and will seek recognition in Mexico once the necessary legislation is adopted there.
Purpose of the Survey The NERC Reliability Issue Survey identifies and ranks factors that electrical power industry executives and professionals perceive may negatively impact reliability. NERC will use the results to:
• Develop the appropriate reliability metrics for display on our Reliability Dashboard • Improve our Reliability Metrics and Benchmarking Program
How this Survey was Conducted NERC conducted an online survey from July 17, 2007 to August 7, 2007, and surveyed a broad range of utility users, owners, and operators at various levels of leadership and management to find out what they consider the most important issues affecting the reliability of the bulk power system. The survey posed 17 reliability topics for ranking within two areas, business and technical, and one preparedness topic for ranking. NERC allowed all industry personnel to participate in the survey, but only once. The survey was divided into three sections:
1. Organization and position 2. Identification of reliability issues 3. Ranking: Is this factor an Issue to Reliability? If so, what is the:
a. Likelihood? b. Severity?
NERC did collect some personal information to eliminate duplicate responses. NERC also separated respondents’ concerns based on their responsibilities, geography, and their type of organization. NERC will not release any personal information collected from its survey.
9 of 65

Summary of Survey Results
Results of Reliability Issue Survey September 6, 2007
5
Summary of Survey Results NERC received 236 responses during the three weeks allotted for the survey. The majority of responses, 35%, by Organization Type came from participants categorized as “Other,” while 22% of such responses came from participants identified as “Transmission Operators.” The largest amount of survey participants by position, 43%, came from middle managers, such as directors, program managers and operations managers, followed by 18% of survey participation by general management, such as supervisors, project managers, and senior technical advisors. The Northeast Power Coordinating Council (NPCC) led survey participation at 18%, followed by ReliabilityFirst Corporation (RFC) and Western Electricity Coordinating Council (WECC) at 17% of survey participation each. Within the category of Business Issues, survey participants ranked first, at 67%, a high likelihood that there would be a reliability risk due to the occurrence of an aging workforce and lack of skilled workers, with 51% assigning it at a high severity level. Participants also noted that there was a high likelihood that environmental regulation could impact electric reliability at 55%, with a 26% high severity ranking, and 48% medium severity ranking. Within the category of Technical Issues, survey participants ranked first, at 65%, a high likelihood that there would be a reliability risk due to the aging infrastructure and limited new construction, with 53% assigning it at a high severity level. Participants also noted that there was a high likelihood of transmission system congestion impacting electric reliability at 62%, with a 39% high severity ranking, and 48% medium severity ranking. Within the category of Preparedness, survey responses reveal that by less than 2%, there is almost an equal split (49% and 51%) regarding if the electric power industry is prepared to respond to catastrophic threats that could simultaneously impact multiple utilities.
10 of 65
Survey Results by Participation Rankings
Results of Reliability Issue Survey September 6, 2007
6
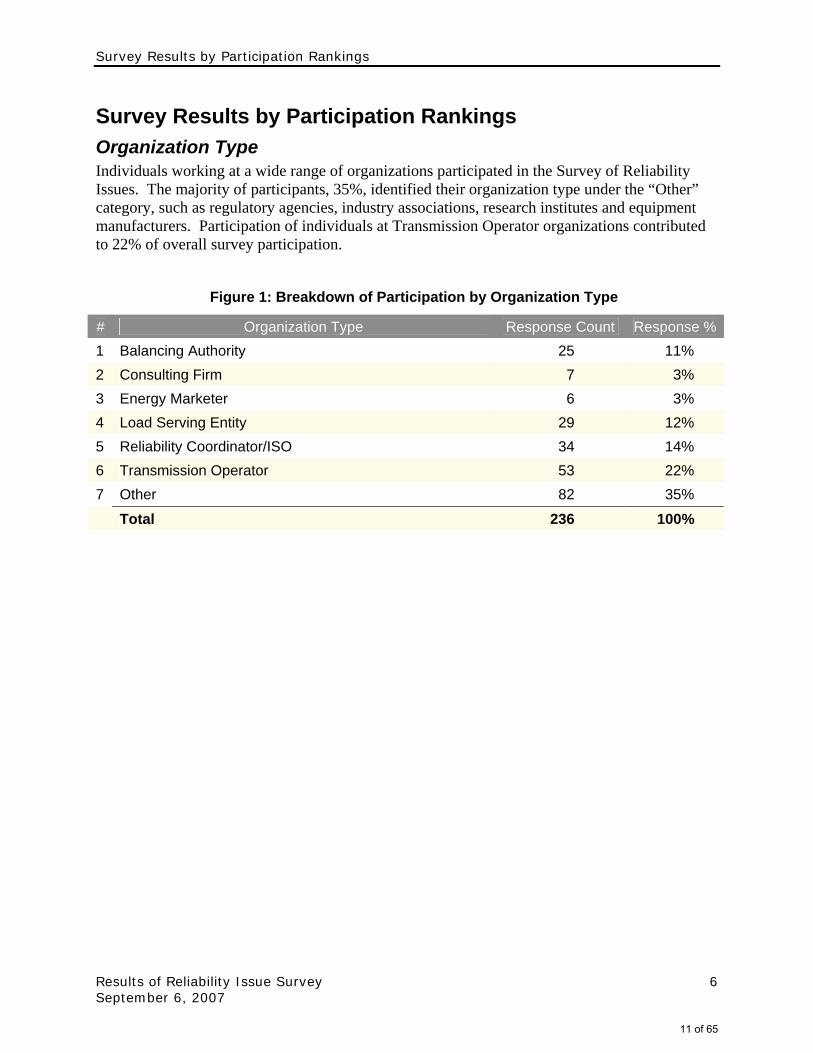
Survey Results by Participation Rankings Organization Type Individuals working at a wide range of organizations participated in the Survey of Reliability Issues. The majority of participants, 35%, identified their organization type under the “Other” category, such as regulatory agencies, industry associations, research institutes and equipment manufacturers. Participation of individuals at Transmission Operator organizations contributed to 22% of overall survey participation.
Figure 1: Breakdown of Participation by Organization Type
# Organization Type Response Count Response %1 Balancing Authority 25 11% 2 Consulting Firm 7 3% 3 Energy Marketer 6 3% 4 Load Serving Entity 29 12% 5 Reliability Coordinator/ISO 34 14% 6 Transmission Operator 53 22% 7 Other 82 35%
Total 236 100%
11 of 65
Survey Results by Participation Rankings
Results of Reliability Issue Survey September 6, 2007
7
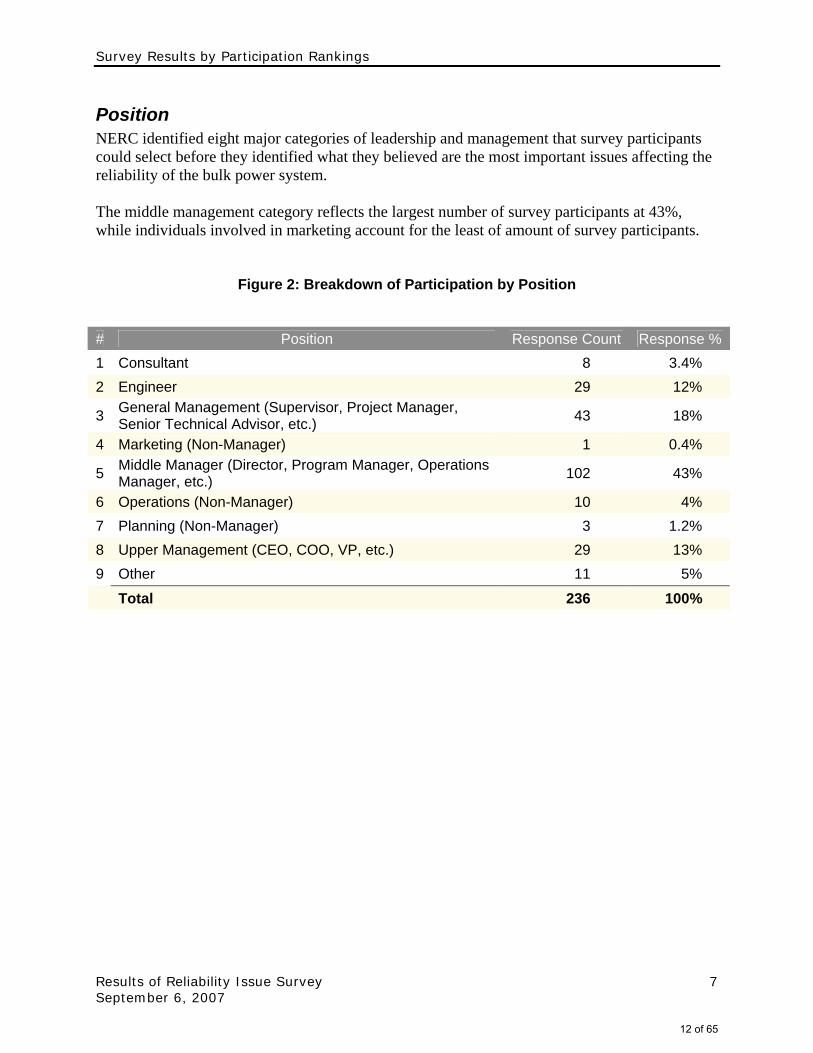
Position NERC identified eight major categories of leadership and management that survey participants could select before they identified what they believed are the most important issues affecting the reliability of the bulk power system. The middle management category reflects the largest number of survey participants at 43%, while individuals involved in marketing account for the least of amount of survey participants.
Figure 2: Breakdown of Participation by Position
# Position Response Count Response %1 Consultant 8 3.4% 2 Engineer 29 12%
3 General Management (Supervisor, Project Manager, Senior Technical Advisor, etc.) 43 18%
4 Marketing (Non-Manager) 1 0.4%
5 Middle Manager (Director, Program Manager, Operations Manager, etc.) 102 43%
6 Operations (Non-Manager) 10 4% 7 Planning (Non-Manager) 3 1.2% 8 Upper Management (CEO, COO, VP, etc.) 29 13% 9 Other 11 5%
Total 236 100%
12 of 65

Survey Results by Participation Rankings
Results of Reliability Issue Survey September 6, 2007
8
NERC Region NERC works with eight Regional Reliability Councils to improve the reliability of the bulk power system. The members of the regional councils come from all segments of the electric industry: investor-owned utilities; federal power agencies; rural electric cooperatives; state, municipal and provincial utilities; independent power producers; power marketers; and end-use customers. Regions in the Eastern Interconnection represent the highest amount of participation in the survey, and 5% of responses came from outside the NERC footprint.
Figure 3: Breakdown of Participation by NERC Region
# Region Response Count Response
% 1 Electric Reliability Council of Texas, Inc. (ERCOT) 17 7% 2 Florida Reliability Coordinating Council (FRCC) 10 4% 3 Midwest Reliability Organization (MRO) 27 11% 4 Northeast Power Coordinating Council (NPCC) 42 18% 5 ReliabilityFirst Corporation (RFC) 40 17% 6 SERC Reliability Corporation (SERC) 38 16% 7 Southwest Power Pool, Inc. (SPP) 11 5% 8 Western Electricity Coordinating Council (WECC) 40 17% 9 Outside of the NERC footprint 11 5%
Total 236 100%
13 of 65
Survey Results by Business Issue Rankings
Results of Reliability Issue Survey September 6, 2007
9
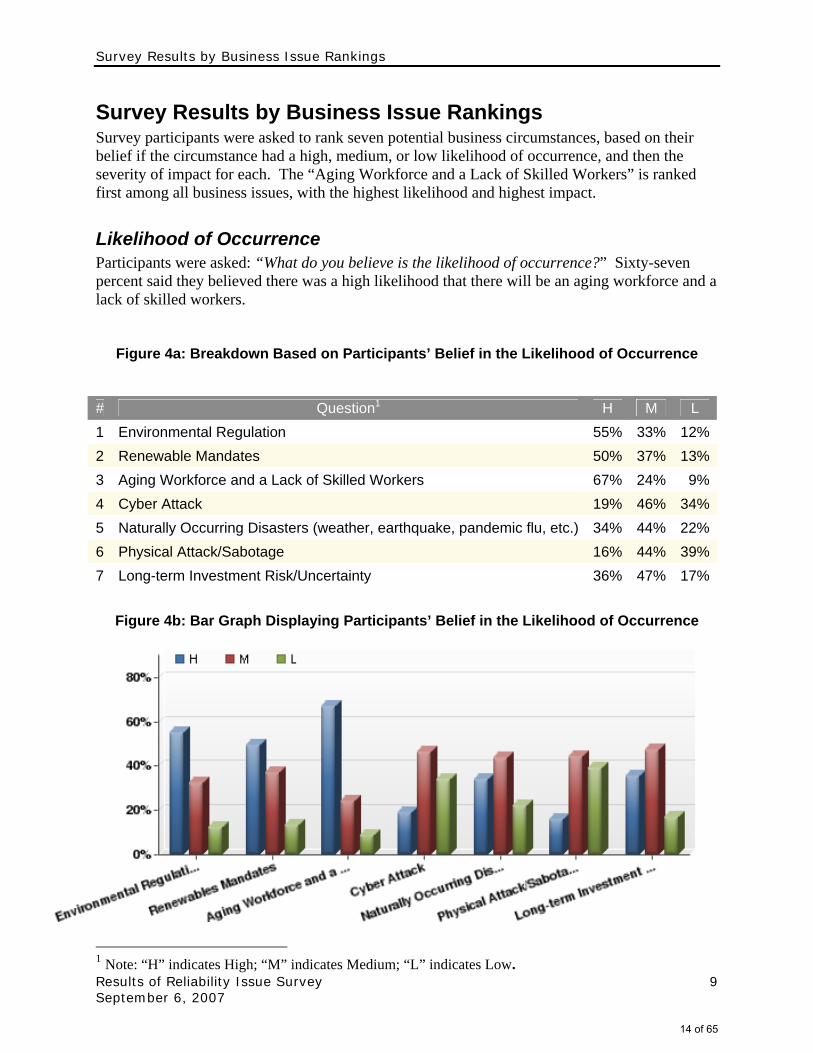
Survey Results by Business Issue Rankings Survey participants were asked to rank seven potential business circumstances, based on their belief if the circumstance had a high, medium, or low likelihood of occurrence, and then the severity of impact for each. The “Aging Workforce and a Lack of Skilled Workers” is ranked first among all business issues, with the highest likelihood and highest impact.
Likelihood of Occurrence Participants were asked: “What do you believe is the likelihood of occurrence?” Sixty-seven percent said they believed there was a high likelihood that there will be an aging workforce and a lack of skilled workers.
Figure 4a: Breakdown Based on Participants’ Belief in the Likelihood of Occurrence
# Question1 H M L 1 Environmental Regulation 55% 33% 12%2 Renewable Mandates 50% 37% 13%3 Aging Workforce and a Lack of Skilled Workers 67% 24% 9%4 Cyber Attack 19% 46% 34%5 Naturally Occurring Disasters (weather, earthquake, pandemic flu, etc.) 34% 44% 22%6 Physical Attack/Sabotage 16% 44% 39%7 Long-term Investment Risk/Uncertainty 36% 47% 17%
Figure 4b: Bar Graph Displaying Participants’ Belief in the Likelihood of Occurrence
1 Note: “H” indicates High; “M” indicates Medium; “L” indicates Low.
14 of 65
Survey Results by Business Issue Rankings
Results of Reliability Issue Survey September 6, 2007
10
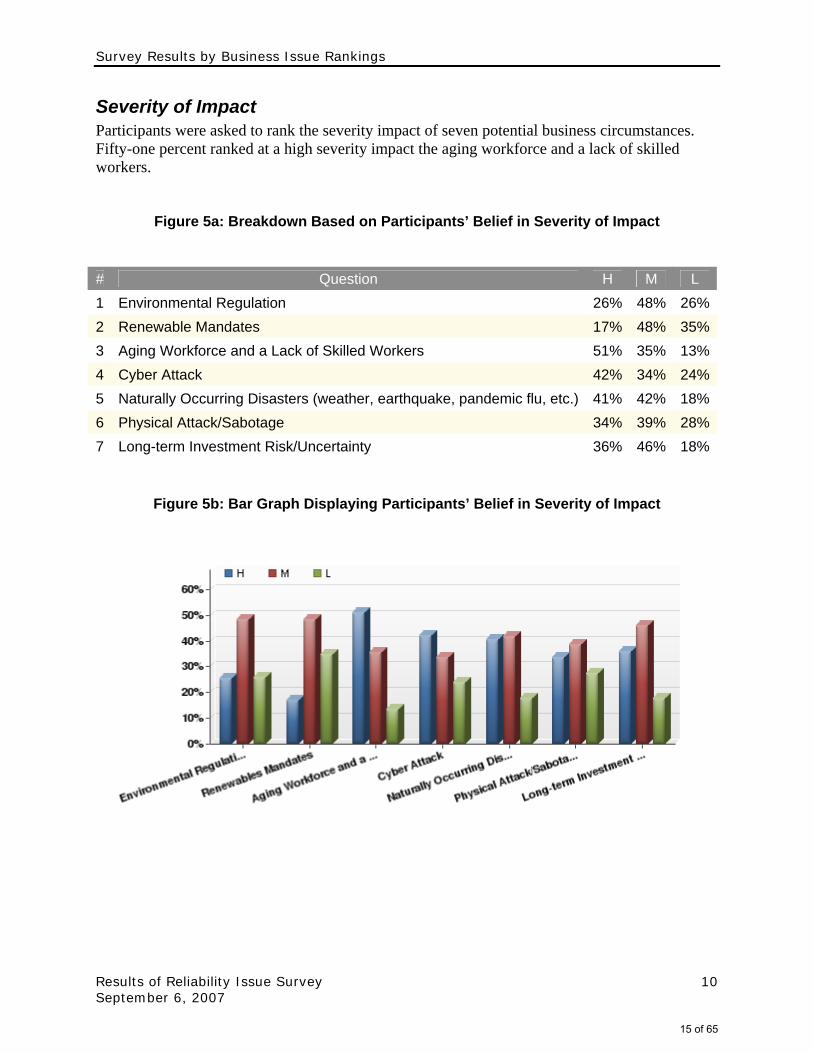
Severity of Impact Participants were asked to rank the severity impact of seven potential business circumstances. Fifty-one percent ranked at a high severity impact the aging workforce and a lack of skilled workers.
Figure 5a: Breakdown Based on Participants’ Belief in Severity of Impact
# Question H M L 1 Environmental Regulation 26% 48% 26%2 Renewable Mandates 17% 48% 35%3 Aging Workforce and a Lack of Skilled Workers 51% 35% 13%4 Cyber Attack 42% 34% 24%5 Naturally Occurring Disasters (weather, earthquake, pandemic flu, etc.) 41% 42% 18%6 Physical Attack/Sabotage 34% 39% 28%7 Long-term Investment Risk/Uncertainty 36% 46% 18%
Figure 5b: Bar Graph Displaying Participants’ Belief in Severity of Impact
15 of 65
Survey Results by Business Issue Rankings
Results of Reliability Issue Survey September 6, 2007
11
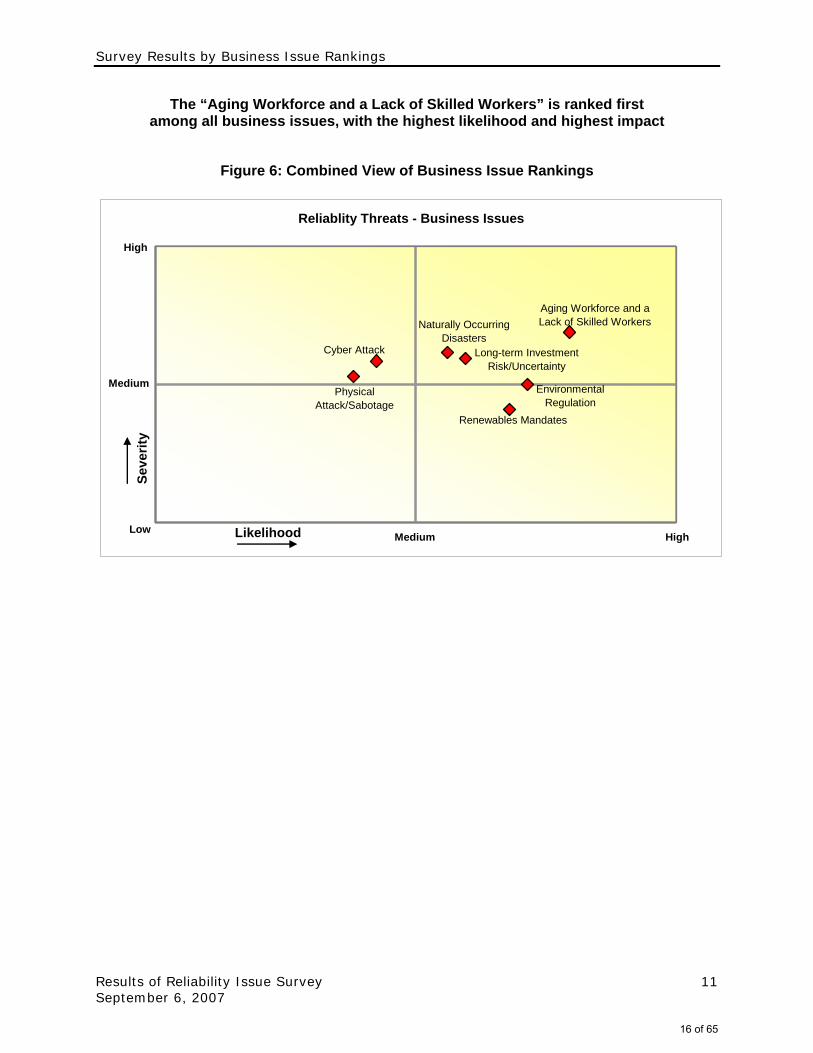
The “Aging Workforce and a Lack of Skilled Workers” is ranked first among all business issues, with the highest likelihood and highest impact
Figure 6: Combined View of Business Issue Rankings
Reliablity Threats - Business Issues
Renewables Mandates
Environmental Regulation
Physical Attack/Sabotage
Cyber Attack Long-term Investment Risk/Uncertainty
Naturally Occurring Disasters
Aging Workforce and a Lack of Skilled Workers
Likelihood
Seve
rity
Low
Medium
Medium
High
High
16 of 65
Survey Results by Technical Issue Rankings
Results of Reliability Issue Survey September 6, 2007
12
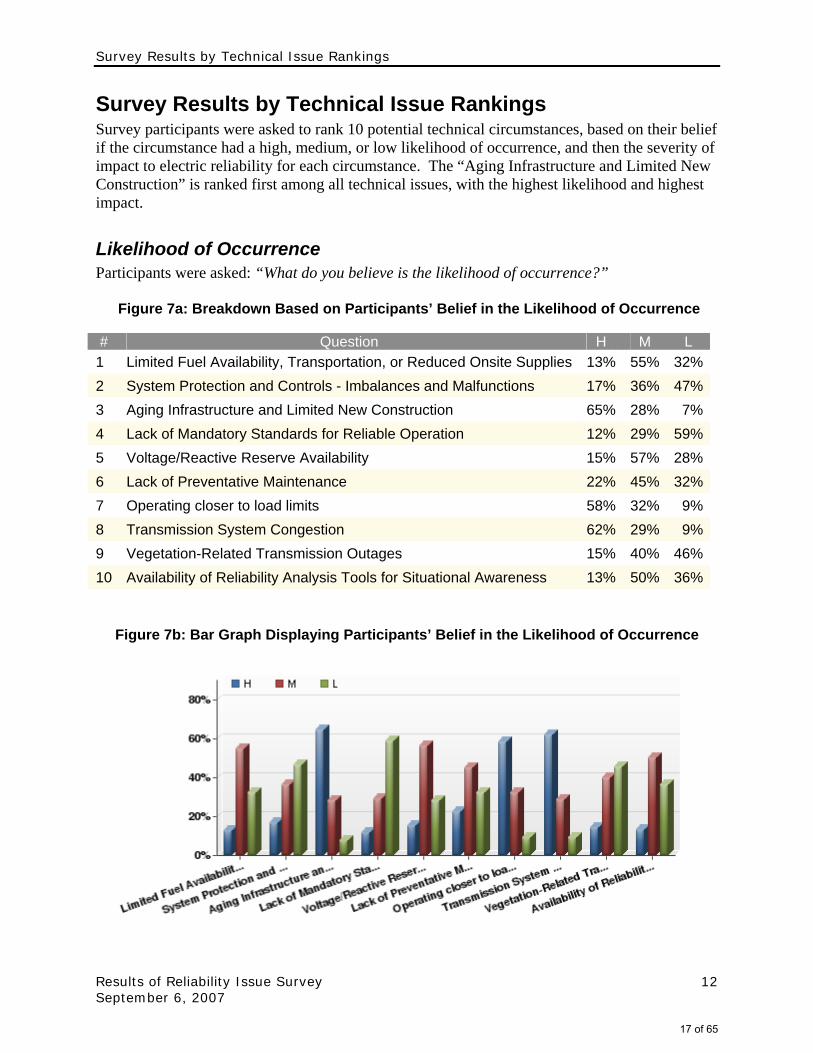
Survey Results by Technical Issue Rankings Survey participants were asked to rank 10 potential technical circumstances, based on their belief if the circumstance had a high, medium, or low likelihood of occurrence, and then the severity of impact to electric reliability for each circumstance. The “Aging Infrastructure and Limited New Construction” is ranked first among all technical issues, with the highest likelihood and highest impact.
Likelihood of Occurrence Participants were asked: “What do you believe is the likelihood of occurrence?”
Figure 7a: Breakdown Based on Participants’ Belief in the Likelihood of Occurrence
Figure 7b: Bar Graph Displaying Participants’ Belief in the Likelihood of Occurrence
# Question H M L 1 Limited Fuel Availability, Transportation, or Reduced Onsite Supplies 13% 55% 32%2 System Protection and Controls - Imbalances and Malfunctions 17% 36% 47%3 Aging Infrastructure and Limited New Construction 65% 28% 7%4 Lack of Mandatory Standards for Reliable Operation 12% 29% 59%5 Voltage/Reactive Reserve Availability 15% 57% 28%6 Lack of Preventative Maintenance 22% 45% 32%7 Operating closer to load limits 58% 32% 9%8 Transmission System Congestion 62% 29% 9%9 Vegetation-Related Transmission Outages 15% 40% 46%10 Availability of Reliability Analysis Tools for Situational Awareness 13% 50% 36%
17 of 65
Survey Results by Technical Issue Rankings
Results of Reliability Issue Survey September 6, 2007
13
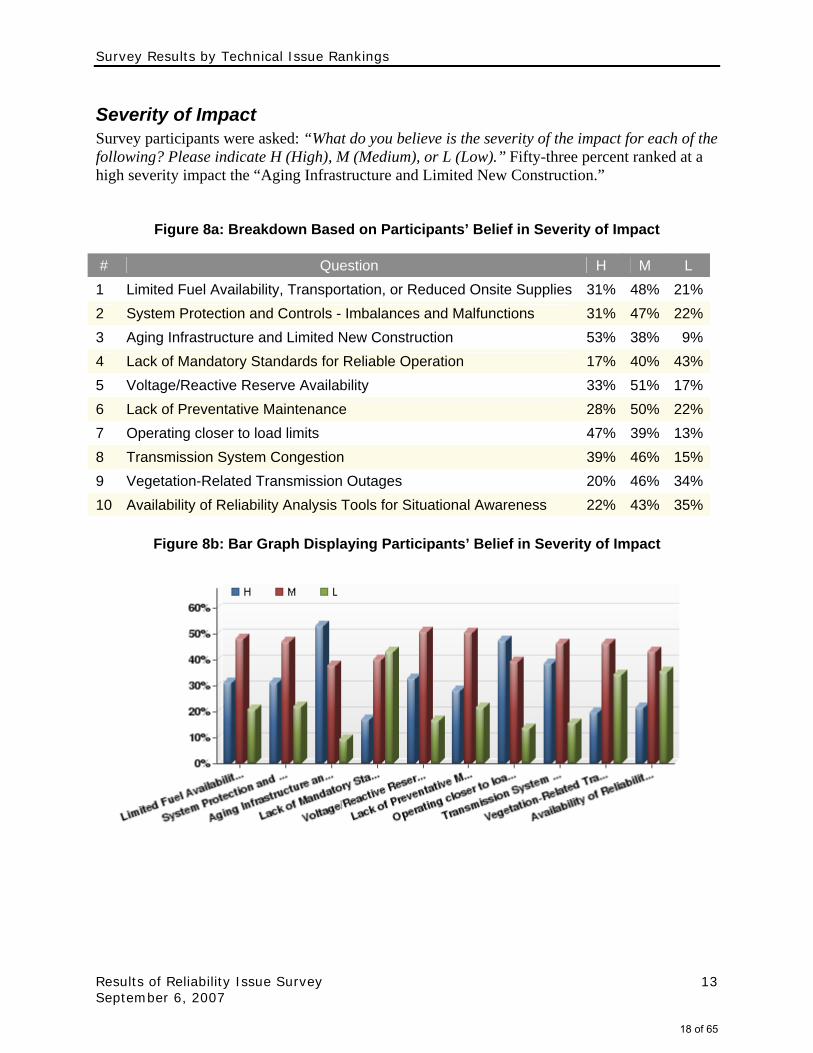
Severity of Impact Survey participants were asked: “What do you believe is the severity of the impact for each of the following? Please indicate H (High), M (Medium), or L (Low).” Fifty-three percent ranked at a high severity impact the “Aging Infrastructure and Limited New Construction.”
Figure 8a: Breakdown Based on Participants’ Belief in Severity of Impact
# Question H M L 1 Limited Fuel Availability, Transportation, or Reduced Onsite Supplies 31% 48% 21%2 System Protection and Controls - Imbalances and Malfunctions 31% 47% 22%3 Aging Infrastructure and Limited New Construction 53% 38% 9%4 Lack of Mandatory Standards for Reliable Operation 17% 40% 43%5 Voltage/Reactive Reserve Availability 33% 51% 17%6 Lack of Preventative Maintenance 28% 50% 22%7 Operating closer to load limits 47% 39% 13%8 Transmission System Congestion 39% 46% 15%9 Vegetation-Related Transmission Outages 20% 46% 34%10 Availability of Reliability Analysis Tools for Situational Awareness 22% 43% 35%
Figure 8b: Bar Graph Displaying Participants’ Belief in Severity of Impact
18 of 65
Survey Results by Technical Issue Rankings
Results of Reliability Issue Survey September 6, 2007
14
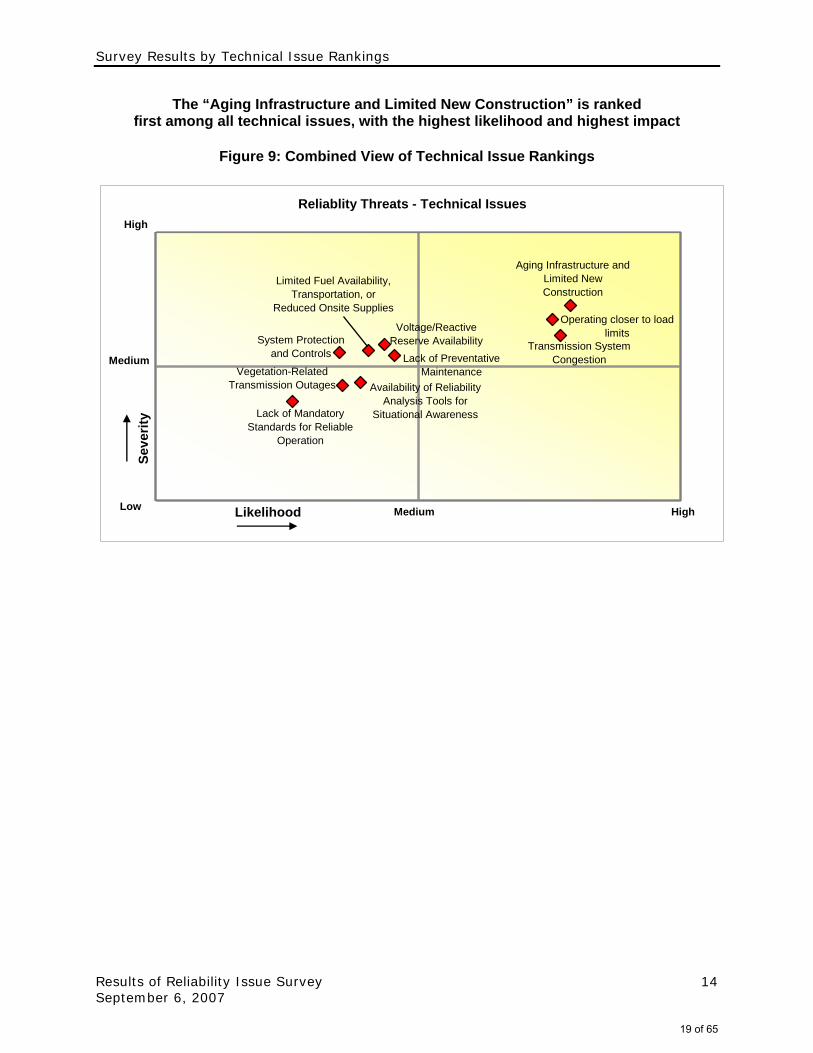
The “Aging Infrastructure and Limited New Construction” is ranked first among all technical issues, with the highest likelihood and highest impact
Figure 9: Combined View of Technical Issue Rankings
Reliablity Threats - Technical Issues
Availability of Reliability Analysis Tools for
Situational Awareness
Vegetation-Related Transmission Outages
Transmission System Congestion
Operating closer to load limitsVoltage/Reactive
Reserve Availability
Lack of Mandatory Standards for Reliable
Operation
Aging Infrastructure and Limited New Construction
System Protection and Controls
Limited Fuel Availability, Transportation, or
Reduced Onsite Supplies
Lack of Preventative Maintenance
Likelihood
Seve
rity
Low
High
Medium
Medium High
19 of 65
Top Five Non-Survey Issues Identified by Participants
Results of Reliability Issue Survey September 6, 2007
15
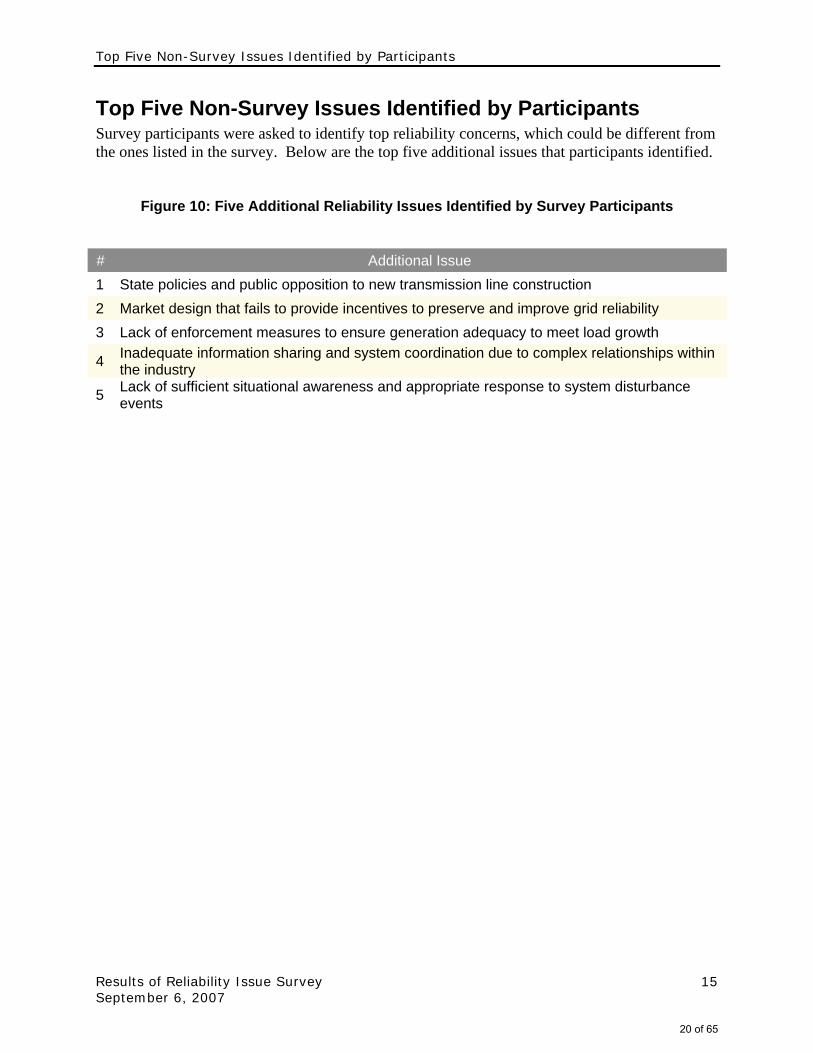
Top Five Non-Survey Issues Identified by Participants Survey participants were asked to identify top reliability concerns, which could be different from the ones listed in the survey. Below are the top five additional issues that participants identified.
Figure 10: Five Additional Reliability Issues Identified by Survey Participants
# Additional Issue 1 State policies and public opposition to new transmission line construction 2 Market design that fails to provide incentives to preserve and improve grid reliability 3 Lack of enforcement measures to ensure generation adequacy to meet load growth
4 Inadequate information sharing and system coordination due to complex relationships within the industry
5 Lack of sufficient situational awareness and appropriate response to system disturbance events
20 of 65
Survey Results by Preparedness Rankings
Results of Reliability Issue Survey September 6, 2007
16
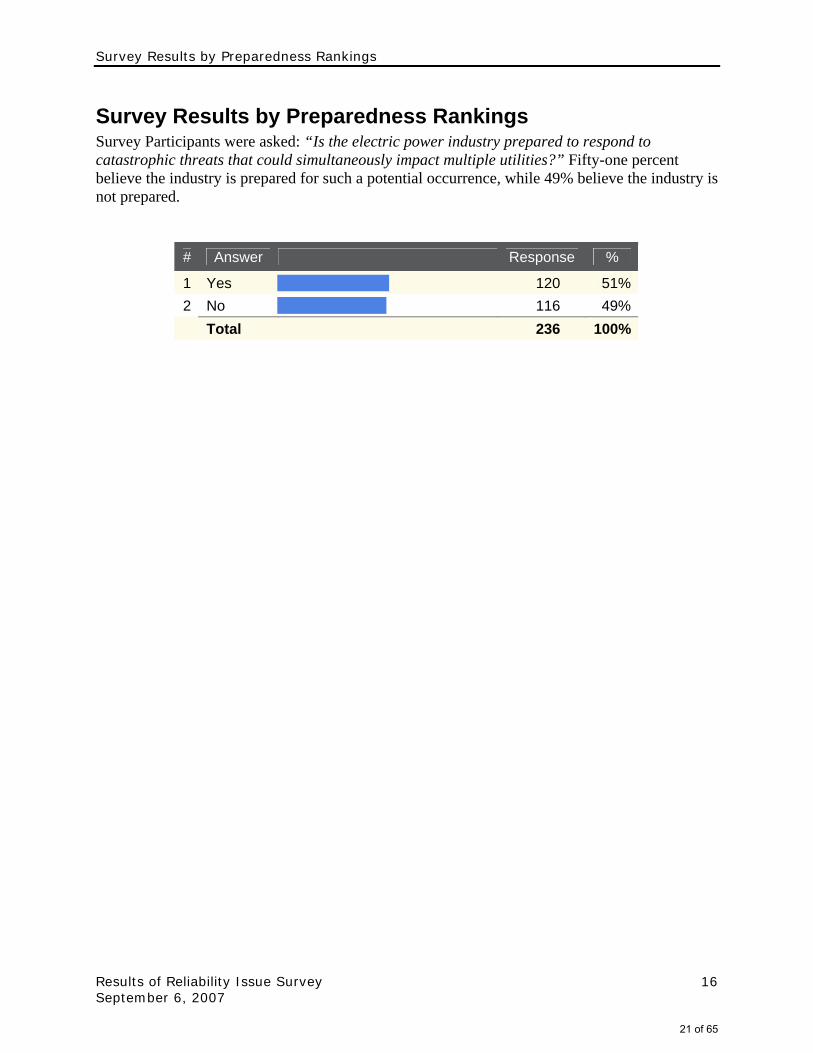
Survey Results by Preparedness Rankings Survey Participants were asked: “Is the electric power industry prepared to respond to catastrophic threats that could simultaneously impact multiple utilities?” Fifty-one percent believe the industry is prepared for such a potential occurrence, while 49% believe the industry is not prepared.
# Answer Response %
1 Yes 120 51% 2 No 116 49% Total 236 100%
21 of 65
Feedback
Results of Reliability Issue Survey September 6, 2007
17
Feedback If you have questions or comments about this report, the survey, or the upcoming white paper and its role in the process of reliability benchmarking, please contact Jessica Bian at [email protected], or 609-452-8060, ext. 162.
22 of 65
Power - Ratings and Research Electric reliability focus shifting to compliance issues September 06, 2007 6:12 PM ET By Kathleen Hart
Increasingly, owners, operators and users of the bulk power system are asking the North American Electric Reliability Corp. what they have to do to make certain that they are in compliance with the new reliability standards.
"People are asking us for interpretations of the standards so they know what they have to comply with," David Nevius, senior vice president and director of reliability assessment and performance analysis at NERC, said Sept. 6 at an electric reliability and transmission conference in Washington, D.C., sponsored by Law Seminars International. Companies are now going through everything they do "with a fine-tooth comb and making sure everything is documented," Nevius said. People are taking compliance very seriously and mitigating shortcomings that might have existed previously.
The Energy Policy Act of 2005 transformed electric reliability in the United States by making a voluntary system mandatory. On July 20, 2006, FERC approved NERC's application to become the electric reliability organization for the United States. As the ERO, NERC has legal authority to enforce reliability standards for all owners, operators, and users of the bulk power system. NERC is working to gain similar recognition by governmental authorities in Canada, including eight provinces and the National Energy Board, before the end of this year, and is planning to seek recognition in Mexico once the necessary legislation is adopted there.
NERC has set up a compliance registry to register all of the entities that must comply with the mandatory reliability standards.
Nevius said that 1,819 entities and 4,451 functions have been registered as of Aug. 30. He noted that 78 entities disputed their inclusion on the registry. Of those, currently 40 parties have resolved their disagreements with NERC and 38 parties are appealing.
NERC has developed a penalty tool to help the regional entities determine the amount of a penalty to assess for violations of reliability standards. Depending on the level of risk and the severity of the violation, penalties can reach a maximum of $1 million per day per violation, which is the top amount that FERC can assess under the Energy Policy Act. As of June 18, all users of the bulk power system are expected to be in compliance with the reliability standards.
NERC filed a work plan with the commission and with Canadian agencies in December 2006 that Nevius said includes a great deal of activity on the reliability standards that FERC did not approve. In Order 693, FERC did not remand any of the 107 reliability standards that NERC proposed. However, the commission approved 83 and held the other 24 pending further information and development.
23 of 65
"FERC is looking for more and more consistency across the continent," Nevius said.
NERC intended to file an updated work plan with the commission by Sept. 16, but that is running behind schedule. Nevius said that the final draft should be available this week. He expects it to go to the NERC standards committee and the NERC board for approval later this month and to be submitted to FERC by the end of September.
Calling the Energy Policy Act "a fundamental transformation of how we do the reliability business," Thomas Burgess, director of FERC compliance for FirstEnergy Corp., said that the focus in the industry has shifted from technical aspects of reliability standards development to regulatory and legal aspects of compliance. Compliance programs involve data submittals, exception reporting, compliance audits, self-certifications, spot checking and compliance violation investigations.
Burgess noted that FERC's enforcement policy encourages a critical, internal self-reporting culture.
Developing a corporate culture that aims at continuous improvement in performance is difficult, but very important, Burgess said. "Compliance starts at the top," he said. Recommending that companies should dedicate significant resources to compliance, he said that FirstEnergy has an executive reliability steering committee.
"We have a continuous improvement process borrowed from the [Institute of Nuclear Power Operators] model," he told the conference. INPO was developed by the U.S. nuclear power industry in the wake of the Three Mile Island accident to bolster the safe operation of the nation's nuclear reactors.
Site content and design Copyright © 2007, SNL Financial LC Usage of this product is governed by the License Agreement.
SNL Financial LC, One SNL Plaza, PO Box 2124, Charlottesville, Virginia 22902, (434)
977-1600
24 of 65
SUMMARY OF
FERC PENALTY ASSESSMENTS UNDER THE ENERGY POLICY ACT OF 2005
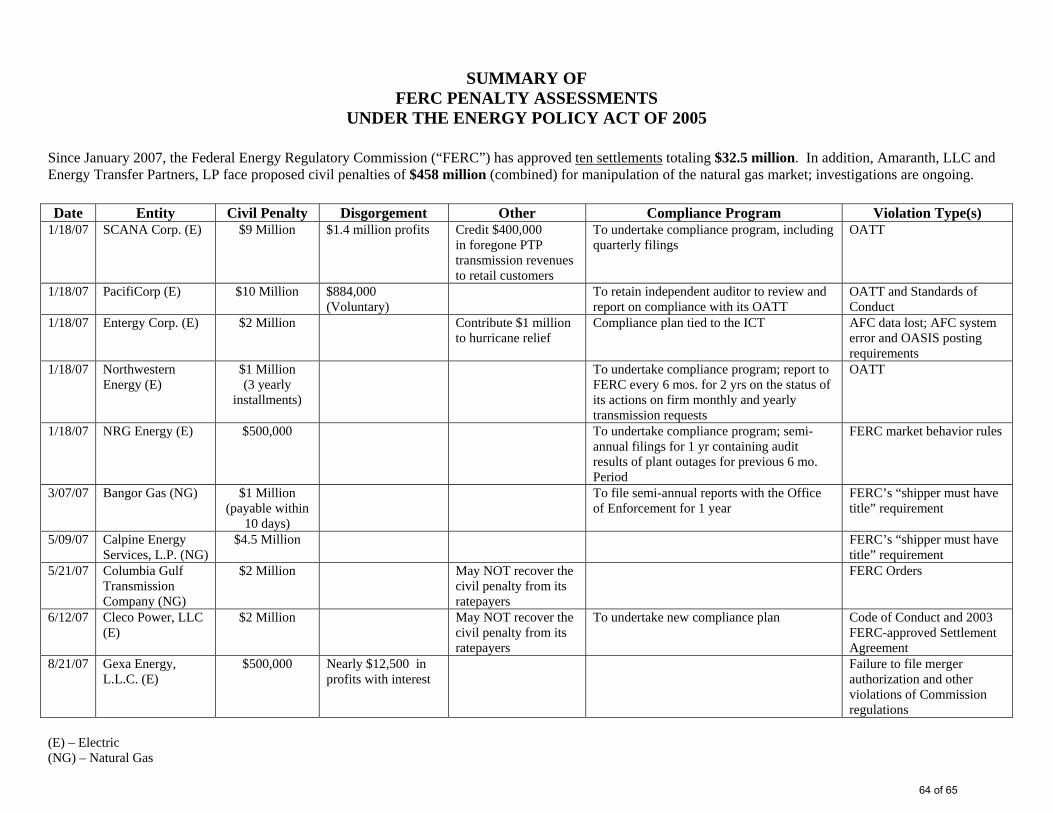
Since January 2007, the Federal Energy Regulatory Commission (“FERC”) has approved ten settlements totaling $32.5 million. In addition, Amaranth, LLC and Energy Transfer Partners, LP face proposed civil penalties of $458 million (combined) for manipulation of the natural gas market; investigations are ongoing.
Date Entity Civil Penalty Disgorgement Other Compliance Program Violation Type(s) 1/18/07 SCANA Corp. (E) $9 Million $1.4 million profits Credit $400,000
in foregone PTP transmission revenues to retail customers
To undertake compliance program, including quarterly filings
OATT
1/18/07 PacifiCorp (E) $10 Million $884,000 (Voluntary)
To retain independent auditor to review and report on compliance with its OATT
OATT and Standards of Conduct
1/18/07 Entergy Corp. (E) $2 Million Contribute $1 million to hurricane relief
Compliance plan tied to the ICT AFC data lost; AFC system error and OASIS posting requirements
1/18/07 Northwestern Energy (E)
$1 Million (3 yearly
installments)
To undertake compliance program; report to FERC every 6 mos. for 2 yrs on the status of its actions on firm monthly and yearly transmission requests
OATT
1/18/07 NRG Energy (E) $500,000 To undertake compliance program; semi-annual filings for 1 yr containing audit results of plant outages for previous 6 mo. Period
FERC market behavior rules
3/07/07 Bangor Gas (NG) $1 Million (payable within
10 days)
To file semi-annual reports with the Office of Enforcement for 1 year
FERC’s “shipper must have title” requirement
5/09/07 Calpine Energy Services, L.P. (NG)
$4.5 Million FERC’s “shipper must have title” requirement
5/21/07 Columbia Gulf Transmission Company (NG)
$2 Million May NOT recover the civil penalty from its ratepayers
FERC Orders
6/12/07 Cleco Power, LLC (E)
$2 Million May NOT recover the civil penalty from its ratepayers
To undertake new compliance plan Code of Conduct and 2003 FERC-approved Settlement Agreement
8/21/07 Gexa Energy, L.L.C. (E)
$500,000 Nearly $12,500 in profits with interest
Failure to file merger authorization and other violations of Commission regulations
(E) – Electric (NG) – Natural Gas
64 of 65

FERC NEWS RELEASES: http://www.ferc.gov/news/news-releases/2007/2007-1/01-18-07-M-3.asp#skipnavsub http://www.ferc.gov/news/news-releases/2007/2007-1/03-07-07.asp#skipnavsub http://www.ferc.gov/news/news-releases/2007/2007-2/05-09-07.asp#skipnavsub http://www.ferc.gov/news/news-releases/2007/2007-2/05-21-07.asp#skipnavsub http://www.ferc.gov/news/news-releases/2007/2007-2/06-12-07.pdf http://www.ferc.gov/news/news-releases/2007/2007-3/07-26-07.asp http://www.ferc.gov/news/news-releases/2007/2007-3/08-21-07.asp
65 of 65
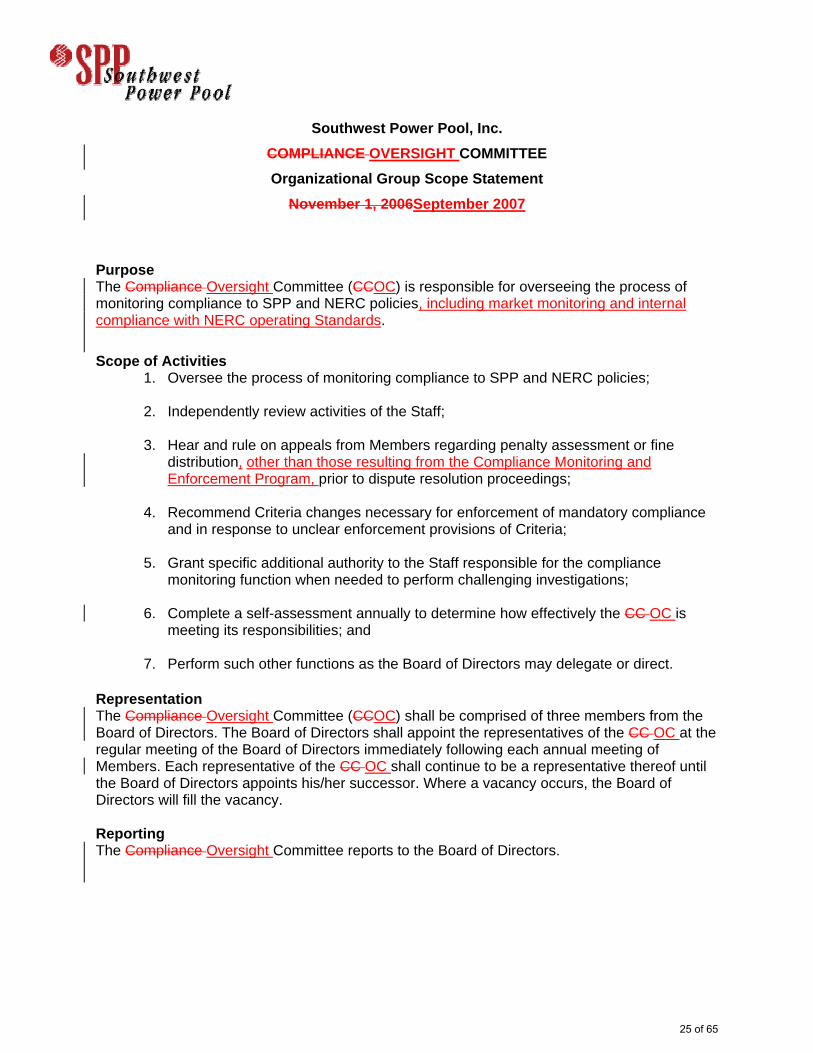
Southwest Power Pool, Inc. COMPLIANCE OVERSIGHT COMMITTEE Organizational Group Scope Statement
November 1, 2006September 2007
Purpose The Compliance Oversight Committee (CCOC) is responsible for overseeing the process of monitoring compliance to SPP and NERC policies, including market monitoring and internal compliance with NERC operating Standards.
Scope of Activities 1. Oversee the process of monitoring compliance to SPP and NERC policies; 2. Independently review activities of the Staff;
3. Hear and rule on appeals from Members regarding penalty assessment or fine
distribution, other than those resulting from the Compliance Monitoring and Enforcement Program, prior to dispute resolution proceedings;
4. Recommend Criteria changes necessary for enforcement of mandatory compliance
and in response to unclear enforcement provisions of Criteria;
5. Grant specific additional authority to the Staff responsible for the compliance monitoring function when needed to perform challenging investigations;
6. Complete a self-assessment annually to determine how effectively the CC OC is
meeting its responsibilities; and
7. Perform such other functions as the Board of Directors may delegate or direct. Representation The Compliance Oversight Committee (CCOC) shall be comprised of three members from the Board of Directors. The Board of Directors shall appoint the representatives of the CC OC at the regular meeting of the Board of Directors immediately following each annual meeting of Members. Each representative of the CC OC shall continue to be a representative thereof until the Board of Directors appoints his/her successor. Where a vacancy occurs, the Board of Directors will fill the vacancy. Reporting The Compliance Oversight Committee reports to the Board of Directors.
25 of 65
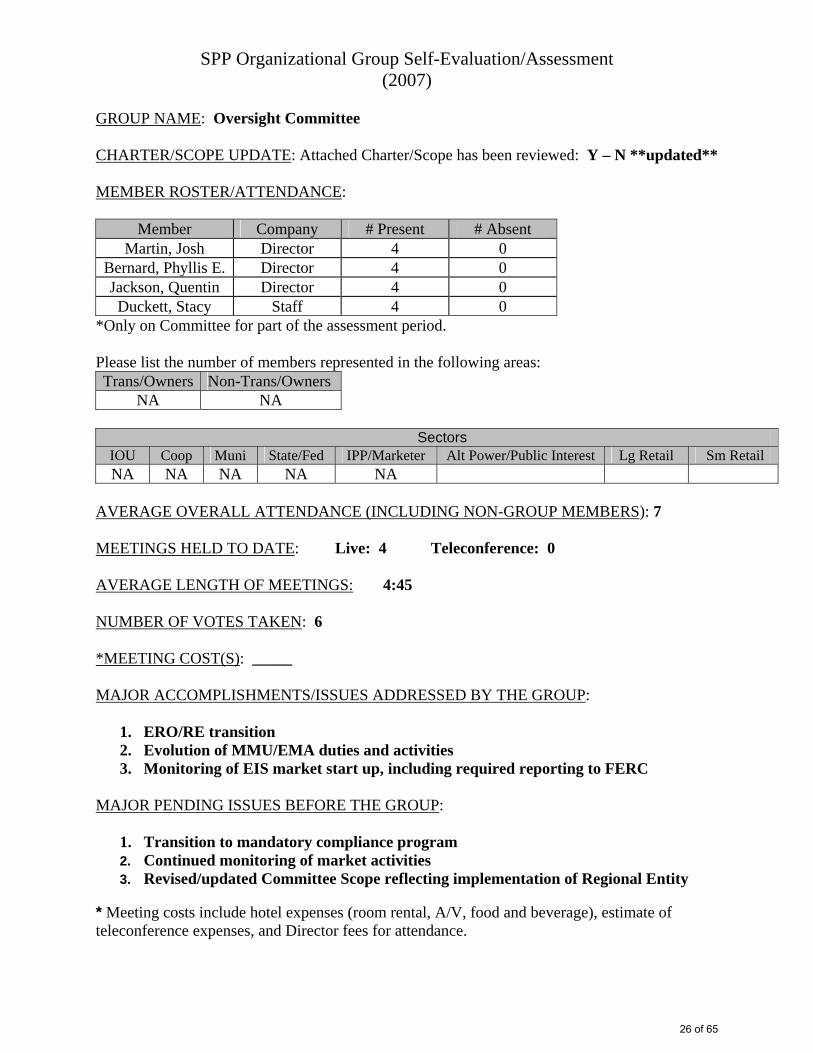
SPP Organizational Group Self-Evaluation/Assessment (2007)
GROUP NAME: Oversight Committee CHARTER/SCOPE UPDATE: Attached Charter/Scope has been reviewed: Y – N **updated** MEMBER ROSTER/ATTENDANCE:
Member Company # Present # Absent Martin, Josh Director 4 0
Bernard, Phyllis E. Director 4 0 Jackson, Quentin Director 4 0 Duckett, Stacy Staff 4 0
*Only on Committee for part of the assessment period. Please list the number of members represented in the following areas: Trans/Owners Non-Trans/Owners
NA NA
Sectors IOU Coop Muni State/Fed IPP/Marketer Alt Power/Public Interest Lg Retail Sm Retail NA NA NA NA NA
AVERAGE OVERALL ATTENDANCE (INCLUDING NON-GROUP MEMBERS): 7 MEETINGS HELD TO DATE: Live: 4 Teleconference: 0 AVERAGE LENGTH OF MEETINGS: 4:45 NUMBER OF VOTES TAKEN: 6 *MEETING COST(S): _____ MAJOR ACCOMPLISHMENTS/ISSUES ADDRESSED BY THE GROUP:
1. ERO/RE transition 2. Evolution of MMU/EMA duties and activities 3. Monitoring of EIS market start up, including required reporting to FERC
MAJOR PENDING ISSUES BEFORE THE GROUP:
1. Transition to mandatory compliance program 2. Continued monitoring of market activities 3. Revised/updated Committee Scope reflecting implementation of Regional Entity
* Meeting costs include hotel expenses (room rental, A/V, food and beverage), estimate of teleconference expenses, and Director fees for attendance.
26 of 65
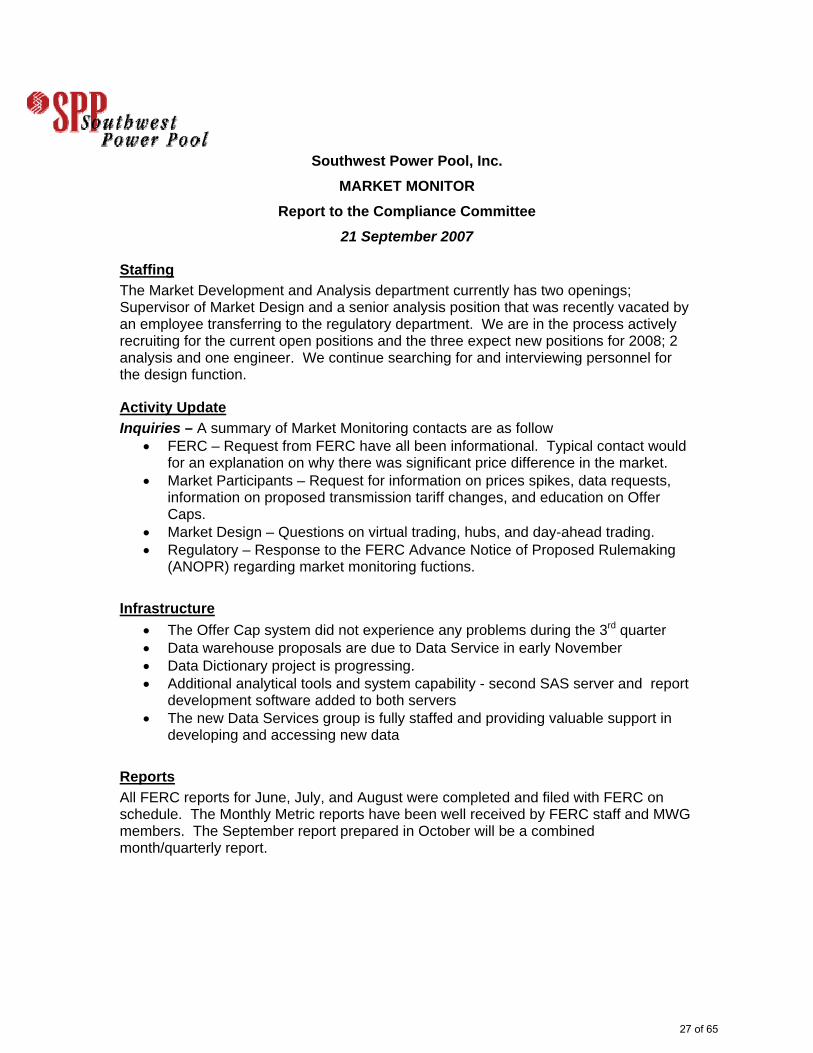
Southwest Power Pool, Inc.
MARKET MONITOR Report to the Compliance Committee
21 September 2007
Staffing The Market Development and Analysis department currently has two openings; Supervisor of Market Design and a senior analysis position that was recently vacated by an employee transferring to the regulatory department. We are in the process actively recruiting for the current open positions and the three expect new positions for 2008; 2 analysis and one engineer. We continue searching for and interviewing personnel for the design function.
Activity Update Inquiries – A summary of Market Monitoring contacts are as follow
• FERC – Request from FERC have all been informational. Typical contact would for an explanation on why there was significant price difference in the market.
• Market Participants – Request for information on prices spikes, data requests, information on proposed transmission tariff changes, and education on Offer Caps.
• Market Design – Questions on virtual trading, hubs, and day-ahead trading. • Regulatory – Response to the FERC Advance Notice of Proposed Rulemaking
(ANOPR) regarding market monitoring fuctions.
Infrastructure • The Offer Cap system did not experience any problems during the 3rd quarter • Data warehouse proposals are due to Data Service in early November • Data Dictionary project is progressing. • Additional analytical tools and system capability - second SAS server and report
development software added to both servers • The new Data Services group is fully staffed and providing valuable support in
developing and accessing new data
Reports All FERC reports for June, July, and August were completed and filed with FERC on schedule. The Monthly Metric reports have been well received by FERC staff and MWG members. The September report prepared in October will be a combined month/quarterly report.
27 of 65
Market Analysis – Market Monitoring staff members developed the FERC VLR filing and are leading the development of responses to comments. The RNU Task Force was lead by a Market Monitoring staff member (Naomi Zottoli). The task force results were presented to the SPP members on 9/13 and were greatly appreciated by all that attended the meeting. Market Monitoring staff continues to support Operations in the validation of repricing. Respectfully submitted, Richard Dillon Director, Market Development and Analysis
28 of 65
Monthly Metrics Report for SPP Energy Imbalance Services (EIS) Market
August 2007
September 18, 2007
29 of 65
SPP Market Monitoring Unit
August 2007 2
Table of Contents
Executive Summary.................................................................................................................... 3
Disclaimer.................................................................................................................................... 4
I. Market Activity....................................................................................................................... 5
Table 1 - EIS Market Average Daily Electricity Sales and Purchases...............................6 II. Prices ..................................................................................................................................... 7
Table 2 – SPP, MISO, and ERCOT Hourly Price..............................................................8 Figure 1 – Price Duration Curve........................................................................................9 Figure 2 – Monthly Average Prices for SPP, MISO, and ERCOT...................................10 Figure 3 - Average Daily Prices for SPP, MISO, and ERCOT ........................................11 Figure 4 – Natural Gas Prices Compared to SPP Daily Price.........................................12 Figure 5 - Monthly Average Prices by Load Settlement Location ...................................13 Figure 6 - Average Price by Market Participant by Month...............................................14
III. Participation ........................................................................................................................ 15
Figure 8 – Market Up Capacity Above Maximum Daily Net Obligation ...........................16 Figure 9 – Market Down Capacity Below Minimum Daily Net Obligation........................16 Table 3 – Resource Five-Minute Ramp ..........................................................................17
IV. Transmission Congestion .................................................................................................. 18
Figure 10 - Congested 5 Minute Intervals by Operating Constraint ................................19 Table 4 - Five-Minute Intervals Experiencing Market Ramp Violations...........................20 Table 5 – Congestion Resolution ....................................................................................21
V. Market Power Measurement and Mitigation ..................................................................... 22
Table 6 - Effect of FERC and SPP Offer Caps ...............................................................23 VI. EIS Market Revenue Neutrality Uplift (RNU)..................................................................... 24
Table 7 - All-In Price........................................................................................................25 Figure 11 - Components of RNU by Month.....................................................................26
A. Appendix.............................................................................................................................. 27
Table A1 – Electricity Sales and Purchases in the EIS Market .......................................28 Table A2 – Daily Congestion Resolution.........................................................................29 Table A3 – EFFECT OF FERC AND SPP OFFER CAPS ..............................................30 Figure A1 - Components of RNU Daily ...........................................................................31
30 of 65
SPP Market Monitoring Unit
August 2007 3
Executive Summary
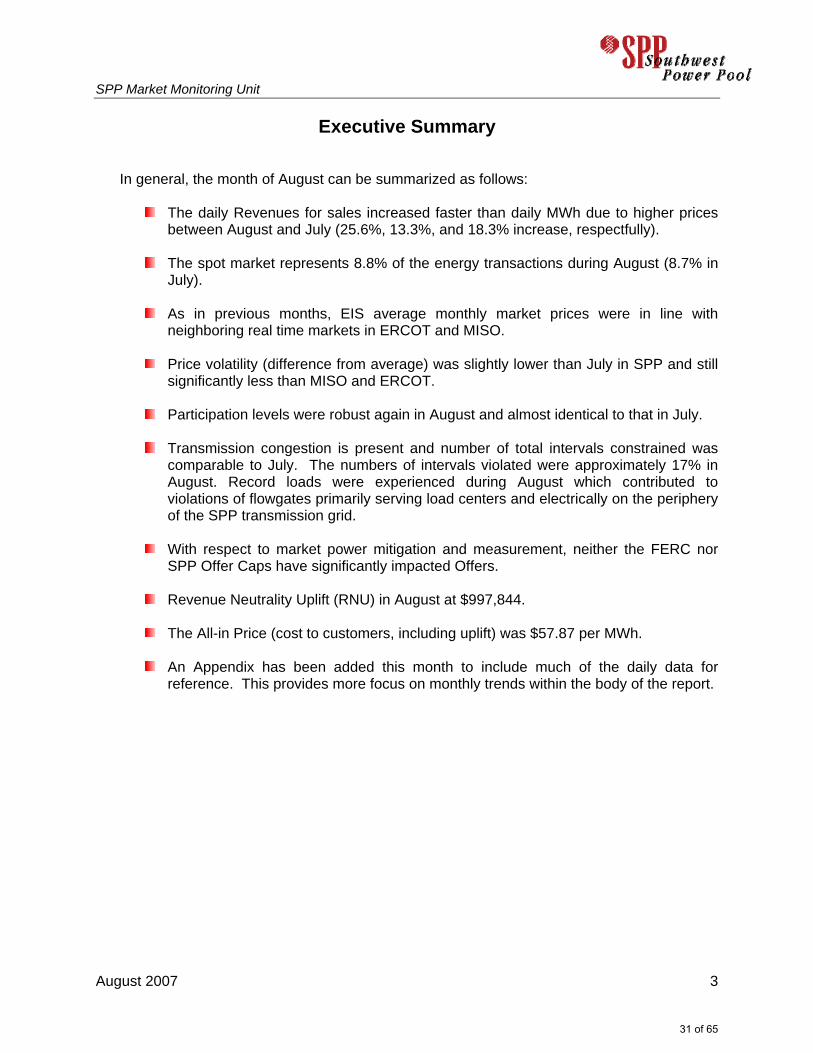
In general, the month of August can be summarized as follows:
The daily Revenues for sales increased faster than daily MWh due to higher prices between August and July (25.6%, 13.3%, and 18.3% increase, respectfully).
The spot market represents 8.8% of the energy transactions during August (8.7% in July).
As in previous months, EIS average monthly market prices were in line with
neighboring real time markets in ERCOT and MISO.
Price volatility (difference from average) was slightly lower than July in SPP and still significantly less than MISO and ERCOT.
Participation levels were robust again in August and almost identical to that in July.
Transmission congestion is present and number of total intervals constrained was
comparable to July. The numbers of intervals violated were approximately 17% in August. Record loads were experienced during August which contributed to violations of flowgates primarily serving load centers and electrically on the periphery of the SPP transmission grid.
With respect to market power mitigation and measurement, neither the FERC nor
SPP Offer Caps have significantly impacted Offers.
Revenue Neutrality Uplift (RNU) in August at $997,844.
The All-in Price (cost to customers, including uplift) was $57.87 per MWh.
An Appendix has been added this month to include much of the daily data for reference. This provides more focus on monthly trends within the body of the report.
31 of 65

SPP Market Monitoring Unit
August 2007 4
Disclaimer The data and analysis in this report are provided for informational purposes only and shall not be considered or relied upon as market advice or market settlement data. The Southwest Power Pool Market Monitoring Unit (SPP MMU) makes no representation or warranties of any kind, express or implied, with respect to the accuracy or adequacy of the information contained herein. The SPP MMU shall have no liability to recipients of this information or third parties for the consequences arising from errors or discrepancies in this information , or for any claim, loss or damage of any kind or nature whatsoever arising out of or in connection with (i) the deficiency or inadequacy of this information for any purpose, whether or not known or disclosed to the authors, (ii) any error or discrepancy in this information, (iii) the use of this information, or (iv) a loss of business or other consequential loss or damage whether or not resulting from any of the foregoing.
32 of 65
SPP Market Monitoring Unit
August 2007 5
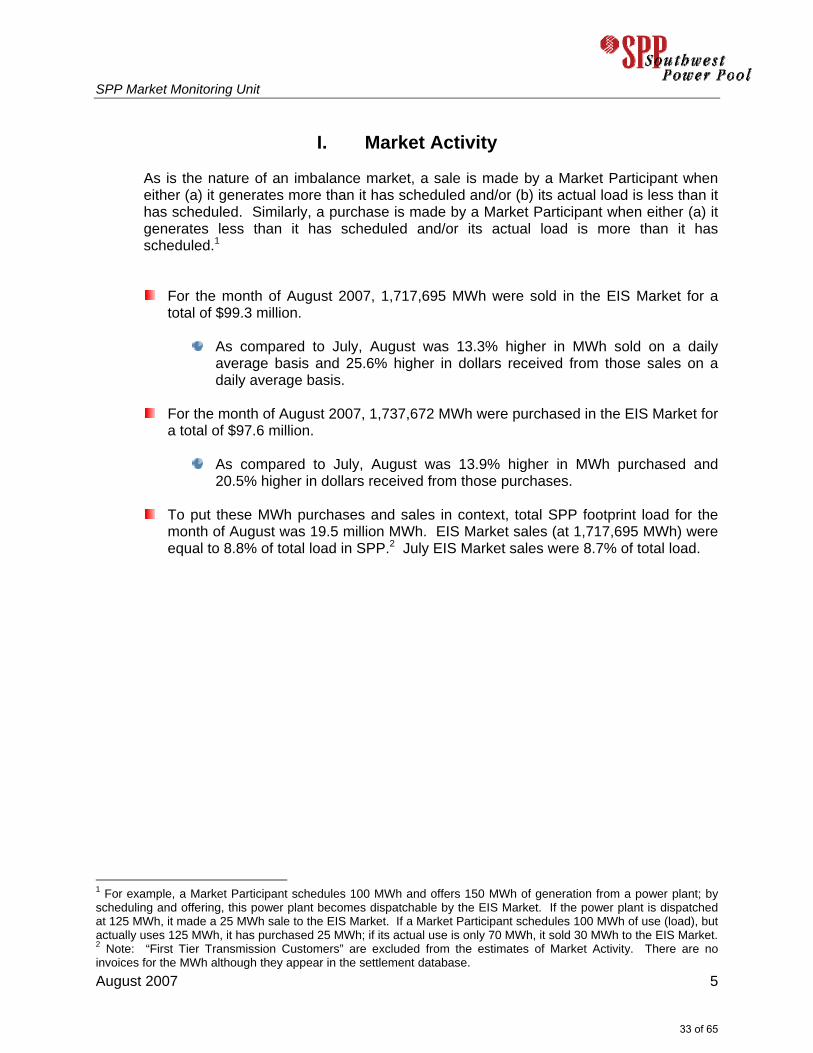
I. Market Activity
As is the nature of an imbalance market, a sale is made by a Market Participant when either (a) it generates more than it has scheduled and/or (b) its actual load is less than it has scheduled. Similarly, a purchase is made by a Market Participant when either (a) it generates less than it has scheduled and/or its actual load is more than it has scheduled.1
For the month of August 2007, 1,717,695 MWh were sold in the EIS Market for a total of $99.3 million.
As compared to July, August was 13.3% higher in MWh sold on a daily
average basis and 25.6% higher in dollars received from those sales on a daily average basis.
For the month of August 2007, 1,737,672 MWh were purchased in the EIS Market for
a total of $97.6 million.
As compared to July, August was 13.9% higher in MWh purchased and 20.5% higher in dollars received from those purchases.
To put these MWh purchases and sales in context, total SPP footprint load for the
month of August was 19.5 million MWh. EIS Market sales (at 1,717,695 MWh) were equal to 8.8% of total load in SPP.2 July EIS Market sales were 8.7% of total load.
1 For example, a Market Participant schedules 100 MWh and offers 150 MWh of generation from a power plant; by scheduling and offering, this power plant becomes dispatchable by the EIS Market. If the power plant is dispatched at 125 MWh, it made a 25 MWh sale to the EIS Market. If a Market Participant schedules 100 MWh of use (load), but actually uses 125 MWh, it has purchased 25 MWh; if its actual use is only 70 MWh, it sold 30 MWh to the EIS Market. 2 Note: “First Tier Transmission Customers” are excluded from the estimates of Market Activity. There are no invoices for the MWh although they appear in the settlement database.
33 of 65
SPP Market Monitoring Unit
August 2007 6
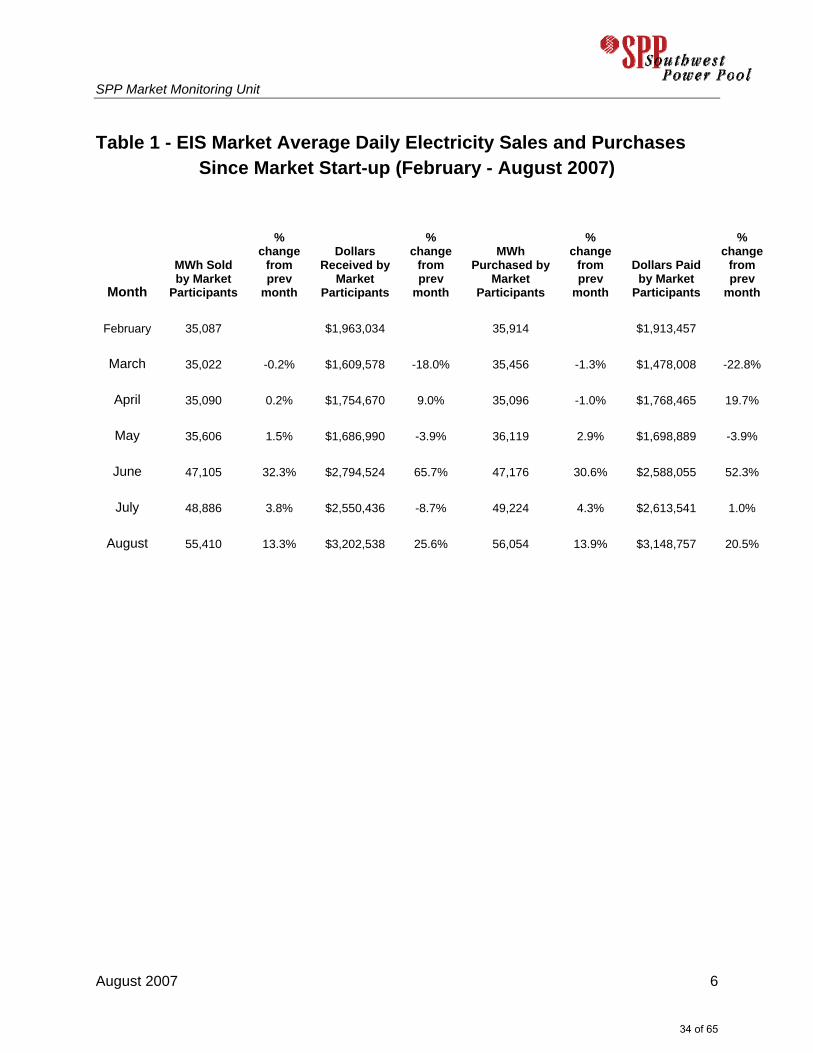
Table 1 - EIS Market Average Daily Electricity Sales and Purchases Since Market Start-up (February - August 2007)
Month
MWh Sold by Market
Participants
% change
from prev
month
Dollars Received by
Market Participants
% change
from prev
month
MWh Purchased by
Market Participants
% change
from prev
month
Dollars Paid by Market
Participants
% change
from prev
month
February 35,087 $1,963,034 35,914 $1,913,457
March 35,022 -0.2% $1,609,578 -18.0% 35,456 -1.3% $1,478,008 -22.8%
April 35,090 0.2% $1,754,670 9.0% 35,096 -1.0% $1,768,465 19.7%
May 35,606 1.5% $1,686,990 -3.9% 36,119 2.9% $1,698,889 -3.9%
June 47,105 32.3% $2,794,524 65.7% 47,176 30.6% $2,588,055 52.3%
July 48,886 3.8% $2,550,436 -8.7% 49,224 4.3% $2,613,541 1.0%
August 55,410 13.3% $3,202,538 25.6% 56,054 13.9% $3,148,757 20.5%
34 of 65
SPP Market Monitoring Unit
August 2007 7
II. Prices SPP calculates the price of energy at all Settlement Locations required for the operation of the EIS Market on the basis of Locational Imbalance Pricing (LIP). The LIP is the offer price that cleared the market in a security constrained economic dispatch.
The SPP-wide, weighted-average hourly price to consumers (load) for August 2007 was $57.58/MWh in the EIS Market. The August average price is up 18.3% from July.
The SPP-wide hourly prices ranged from a low of $14.24/MWh to a high of
$197.92/MWh. The median price was $55.07/MWh. (The median means half of the prices were above this level and half below.)
The SPP-wide weighted-average hourly on-peak price was $68.54/MWh and the
off-peak average hourly price was $46.85/MWh.
Volatility of SPP-wide hourly prices, as indicated by a Coefficient of Variation, was 43%. (This means that the SPP-wide price in any given hour differed, on average, from the monthly average by 43%.) This was down from 48% volatility in July. In June, there was significant congestion from temporary flowgates causing much price volatility (76% in June) and those problems were not present in July or August.
The SPP weighted average price of $57.58/MWh (a) was above the MISO simple
average price of $52.69/MWh and (b) was also slightly above the ERCOT simple average of $56.39/MWh. Volatility continues to be significantly lower in the SPP market than in the MISO and ERCOT markets with the Coefficients of Variation at 72% and 70%, respectively.
Swings in natural gas prices do affect on-peak electricity price but the daily
cyclical nature of the load overwhelms the variance in daily gas prices. The daily swings in load are often 10,000 MWs. Also, the marginal unit during peak period is a gas unit. During low demand periods, the marginal unit is usually a non-gas unit when gas units are at minimums and therefore not setting prices.
35 of 65
SPP Market Monitoring Unit
August 2007 8
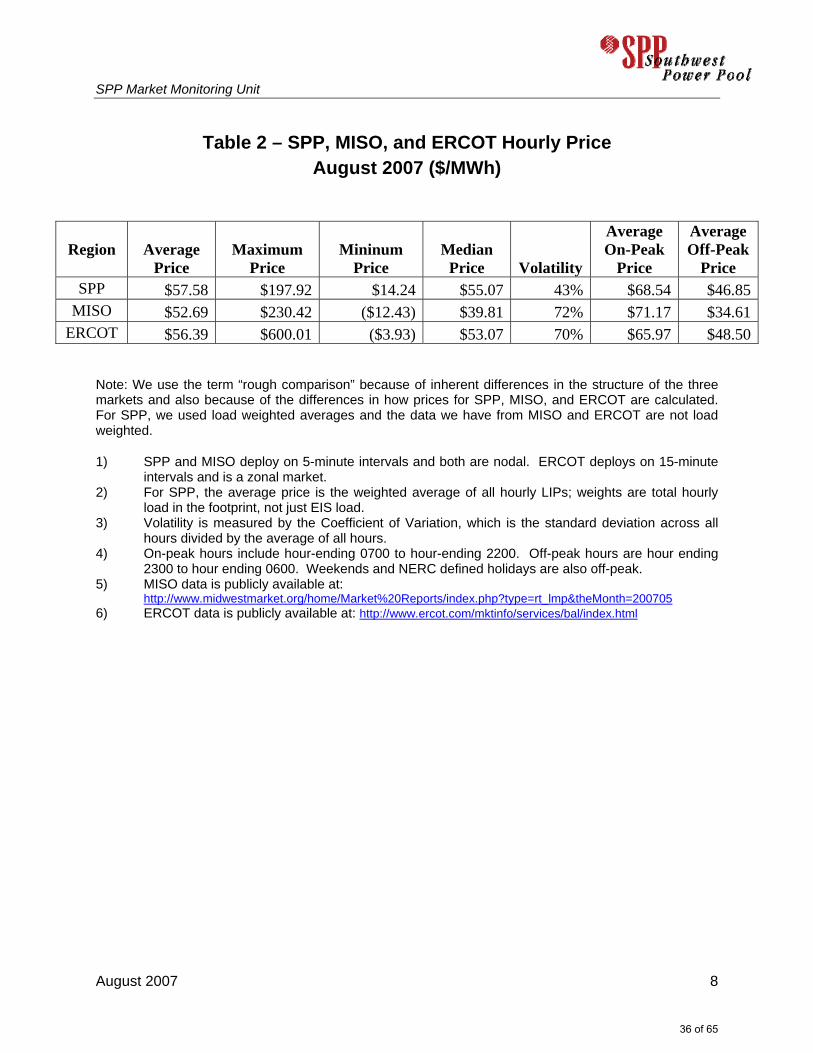
Table 2 – SPP, MISO, and ERCOT Hourly Price August 2007 ($/MWh)
Region Average Price
Maximum Price
Mininum Price
Median Price Volatility
Average On-Peak
Price
Average Off-Peak
Price SPP $57.58 $197.92 $14.24 $55.07 43% $68.54 $46.85
MISO $52.69 $230.42 ($12.43) $39.81 72% $71.17 $34.61 ERCOT $56.39 $600.01 ($3.93) $53.07 70% $65.97 $48.50
Note: We use the term “rough comparison” because of inherent differences in the structure of the three markets and also because of the differences in how prices for SPP, MISO, and ERCOT are calculated. For SPP, we used load weighted averages and the data we have from MISO and ERCOT are not load weighted.
1) SPP and MISO deploy on 5-minute intervals and both are nodal. ERCOT deploys on 15-minute intervals and is a zonal market.
2) For SPP, the average price is the weighted average of all hourly LIPs; weights are total hourly load in the footprint, not just EIS load.
3) Volatility is measured by the Coefficient of Variation, which is the standard deviation across all hours divided by the average of all hours.
4) On-peak hours include hour-ending 0700 to hour-ending 2200. Off-peak hours are hour ending 2300 to hour ending 0600. Weekends and NERC defined holidays are also off-peak.
5) MISO data is publicly available at: http://www.midwestmarket.org/home/Market%20Reports/index.php?type=rt_lmp&theMonth=200705
6) ERCOT data is publicly available at: http://www.ercot.com/mktinfo/services/bal/index.html
36 of 65
SPP Market Monitoring Unit
August 2007 9
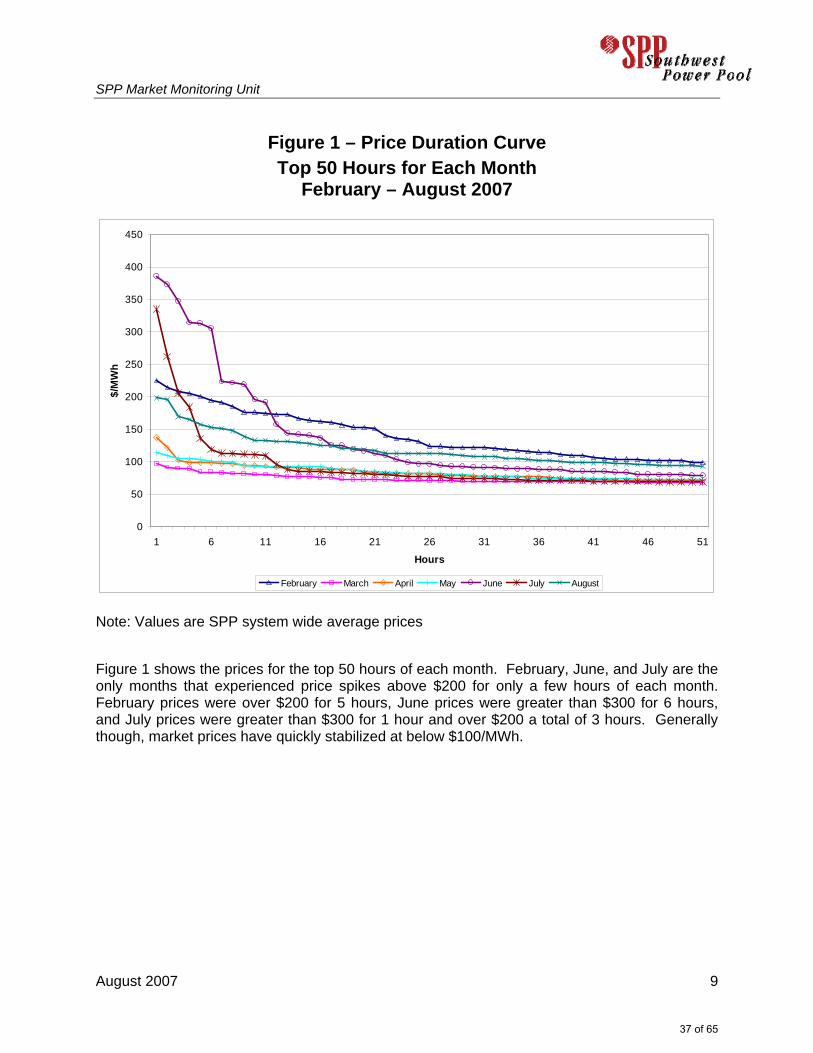
Figure 1 – Price Duration Curve Top 50 Hours for Each Month
February – August 2007
0
50
100
150
200
250
300
350
400
450
1 6 11 16 21 26 31 36 41 46 51
Hours
$/M
Wh
February March April May June July August
Note: Values are SPP system wide average prices Figure 1 shows the prices for the top 50 hours of each month. February, June, and July are the only months that experienced price spikes above $200 for only a few hours of each month. February prices were over $200 for 5 hours, June prices were greater than $300 for 6 hours, and July prices were greater than $300 for 1 hour and over $200 a total of 3 hours. Generally though, market prices have quickly stabilized at below $100/MWh.
37 of 65

SPP Market Monitoring Unit
August 2007 10
Figure 2 – Monthly Average Prices for SPP, MISO, and ERCOT For February–August 2007
$-
$10.00
$20.00
$30.00
$40.00
$50.00
$60.00
$70.00
February March April May June July August
$/M
Wh
SPP MISO ERCOT
Figure 2 shows that SPP prices for the first seven months of the EIS Market were in line with prices in both MISO and ERCOT.
38 of 65
SPP Market Monitoring Unit
August 2007 11
Figure 3 - Average Daily Prices for SPP, MISO, and ERCOT for August 2007
0
10
20
30
40
50
60
70
80
90
100
1 2 3 4 5 6 7 8 9 10 11 12 13 14 15 16 17 18 19 20 21 22 23 24 25 26 27 28 29 30 31
$/M
Wh
SPP MISO ERCOT
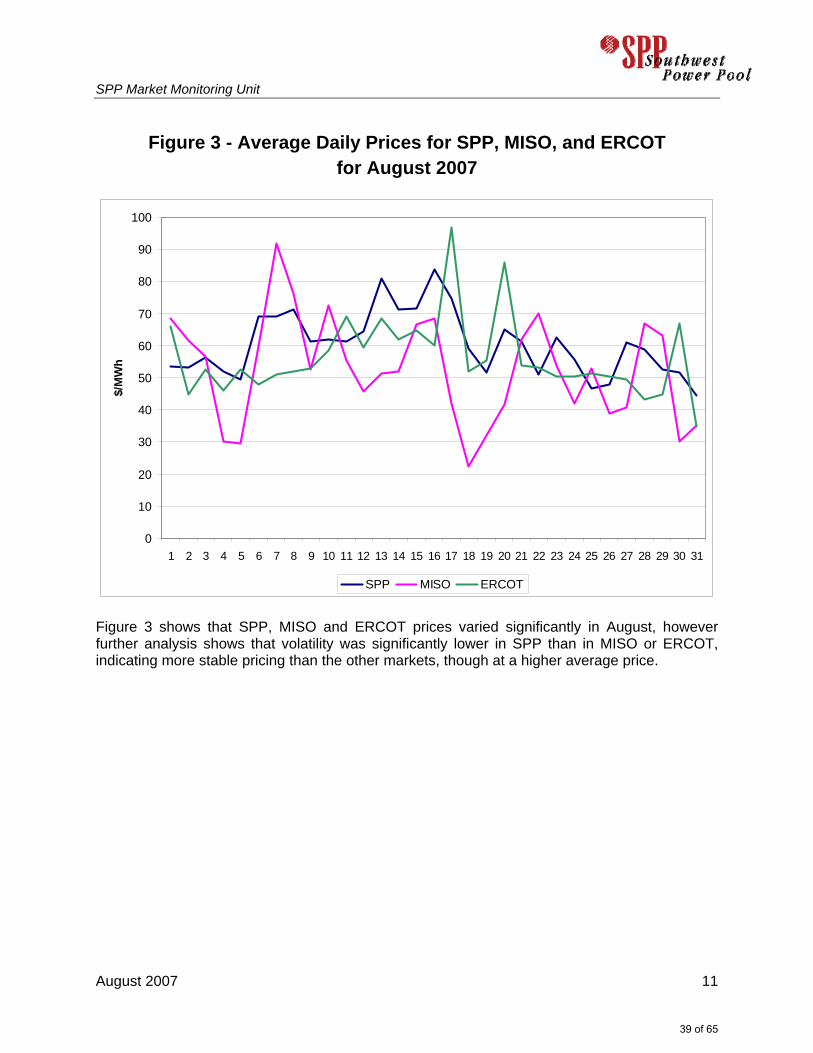
Figure 3 shows that SPP, MISO and ERCOT prices varied significantly in August, however further analysis shows that volatility was significantly lower in SPP than in MISO or ERCOT, indicating more stable pricing than the other markets, though at a higher average price.
39 of 65
SPP Market Monitoring Unit
August 2007 12
Figure 4 – Natural Gas Prices Compared to SPP Daily Price August 2007
0
10
20
30
40
50
60
70
80
90
1 2 3 4 5 6 7 8 9 10 11 12 13 14 15 16 17 18 19 20 21 22 23 24 25 26 27 28 29 30 31
$/M
Wh
5.00
5.50
6.00
6.50
7.00
7.50
$/m
mB
Tu
SPP Price Henry Hub
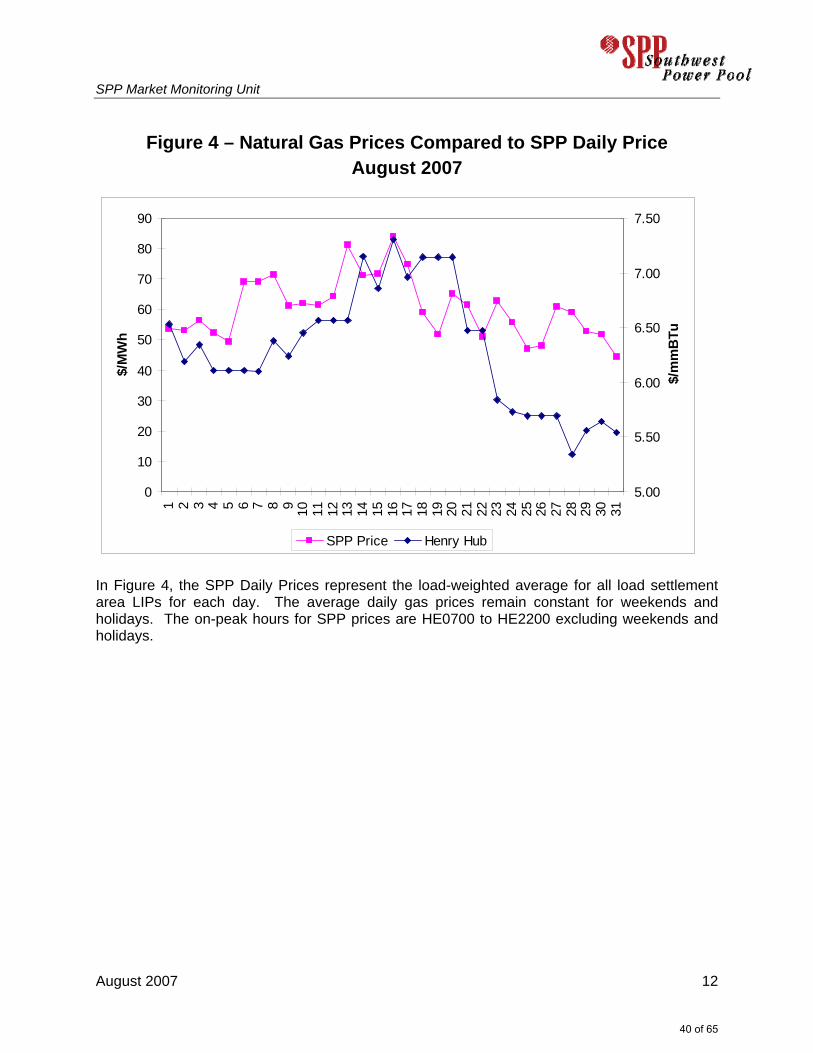
In Figure 4, the SPP Daily Prices represent the load-weighted average for all load settlement area LIPs for each day. The average daily gas prices remain constant for weekends and holidays. The on-peak hours for SPP prices are HE0700 to HE2200 excluding weekends and holidays.
40 of 65
SPP Market Monitoring Unit
August 2007 13
Figure 5 - Monthly Average Prices by Load Settlement Location August 2007
0
20
40
60
80
100
120
140
16.24 14.24 8.19 11.90 12.31 7.57 19.76 12.71 6.11 11.49
CSWS EDE GRDA KACY KCPL OKGE SECI SPS WFEC WR
Balancing Authority
Ave
rage
Mon
thly
Pri
ces
($/M
Wh)
0
20
40
60
80
100
120
140
Std. Dev.
Max Min BA Average SPP Average
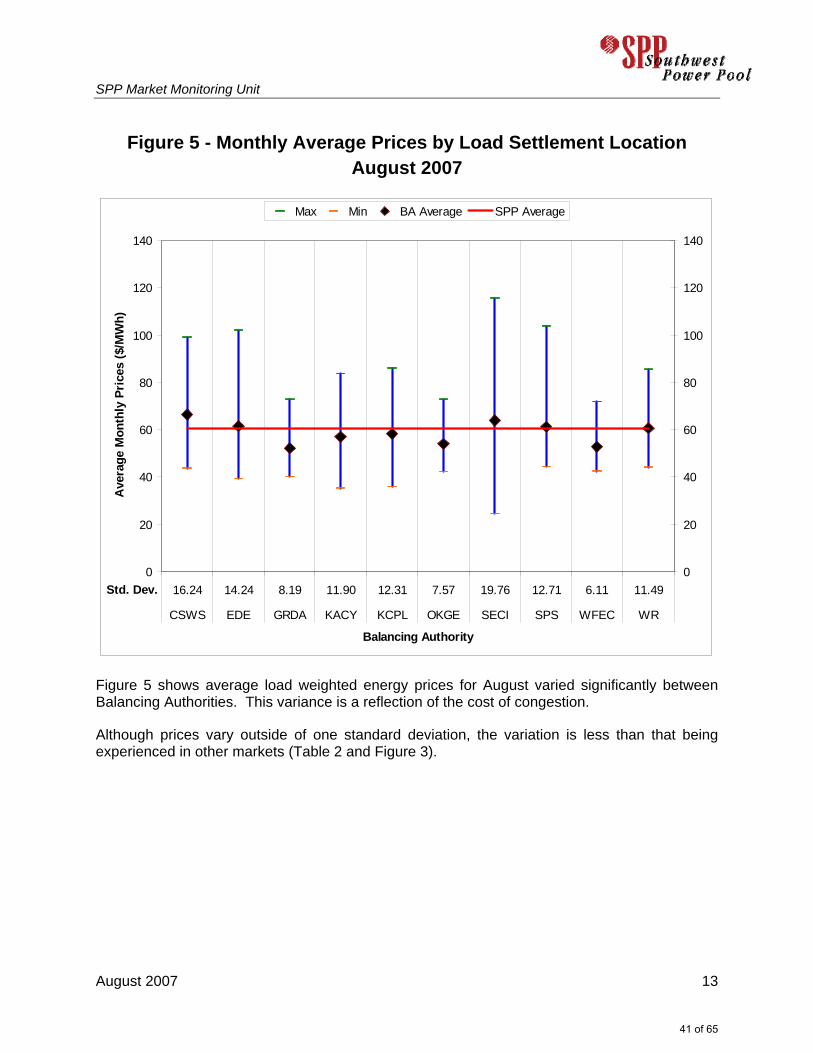
Figure 5 shows average load weighted energy prices for August varied significantly between Balancing Authorities. This variance is a reflection of the cost of congestion.
Although prices vary outside of one standard deviation, the variation is less than that being experienced in other markets (Table 2 and Figure 3).
41 of 65
SPP Market Monitoring Unit
August 2007 14
Figure 6 - Average Price by Market Participant by Month For the Months May-August 2007
0
10
20
30
40
50
60
70
80
90
CSWS EDE GRDA KACY KCPL OKGE SECI SPS WFEC WRMARKET PARTICIPANT
AVE
RA
GE
DA
ILY
PRIC
E
MAYJUNJULAUG
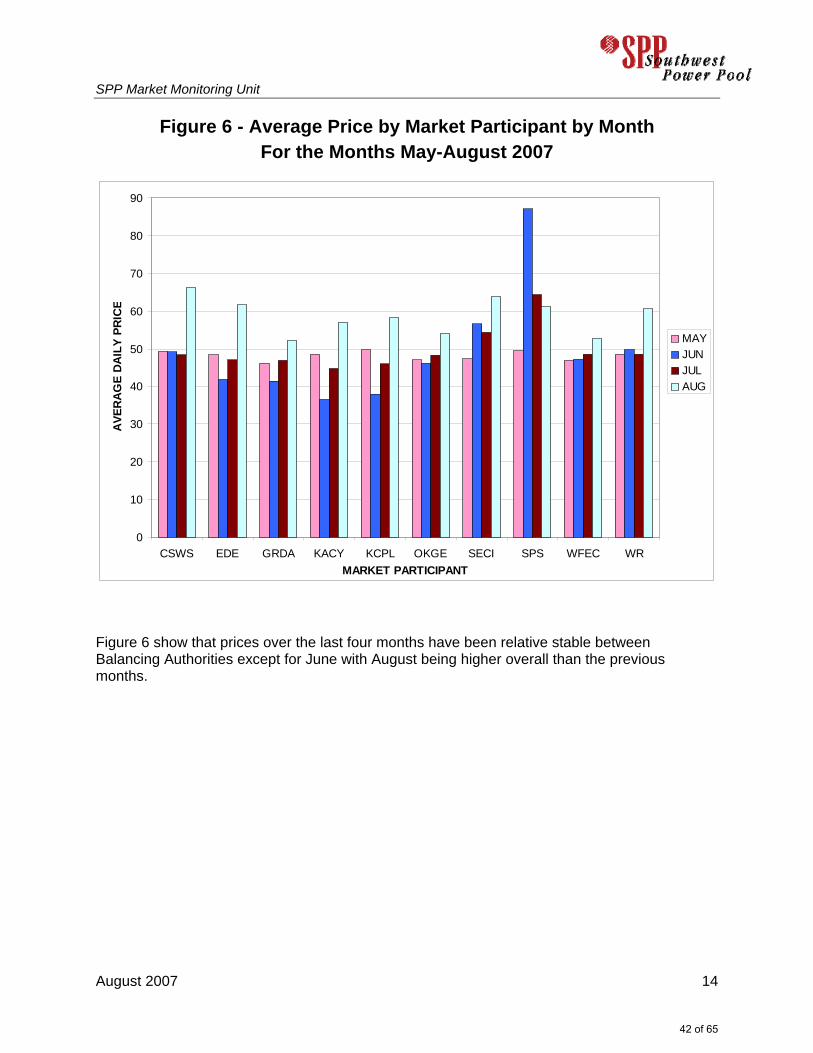
Figure 6 show that prices over the last four months have been relative stable between Balancing Authorities except for June with August being higher overall than the previous months.
42 of 65

SPP Market Monitoring Unit
August 2007 15
III. Participation Participation in the SPP EIS Market is voluntary. Market participants decide whether resources will be available for market dispatch, self-dispatch, or operated manually. The depth of the market is calculated by summing available, self-scheduled, and manual resources and comparing the total to net load obligation.
Participation in the EIS Market was robust in August with 73% of the on-line capacity being made available to the EIS Market.
On-line capacity includes market dispatch, self-dispatched, and manual.
At time of minimum load, the additional capacity online and available for dispatch
down was in excess of 1,830 MW each day of the month. Although additional capacity was online during minimum load, the capacity available for dispatch up was as low as 409 MW during the month.
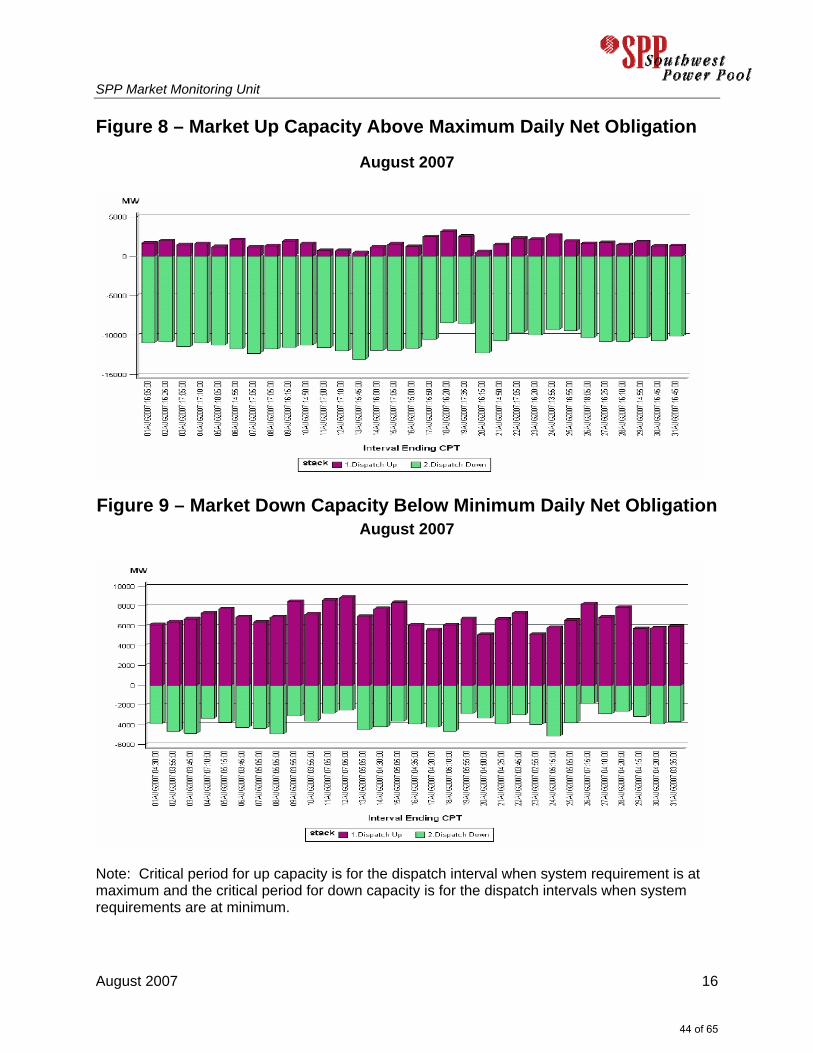
The amount of available capacity above the highest net load obligation for
each day in August is shown in Figure 8. The minimum up-side capacity always exceeded 409 MW. The amount of available capacity below the lowest net load obligation for each day in August is shown in Figure 9. The minimum down-side capacity always exceeded 1,830 MW for the month.
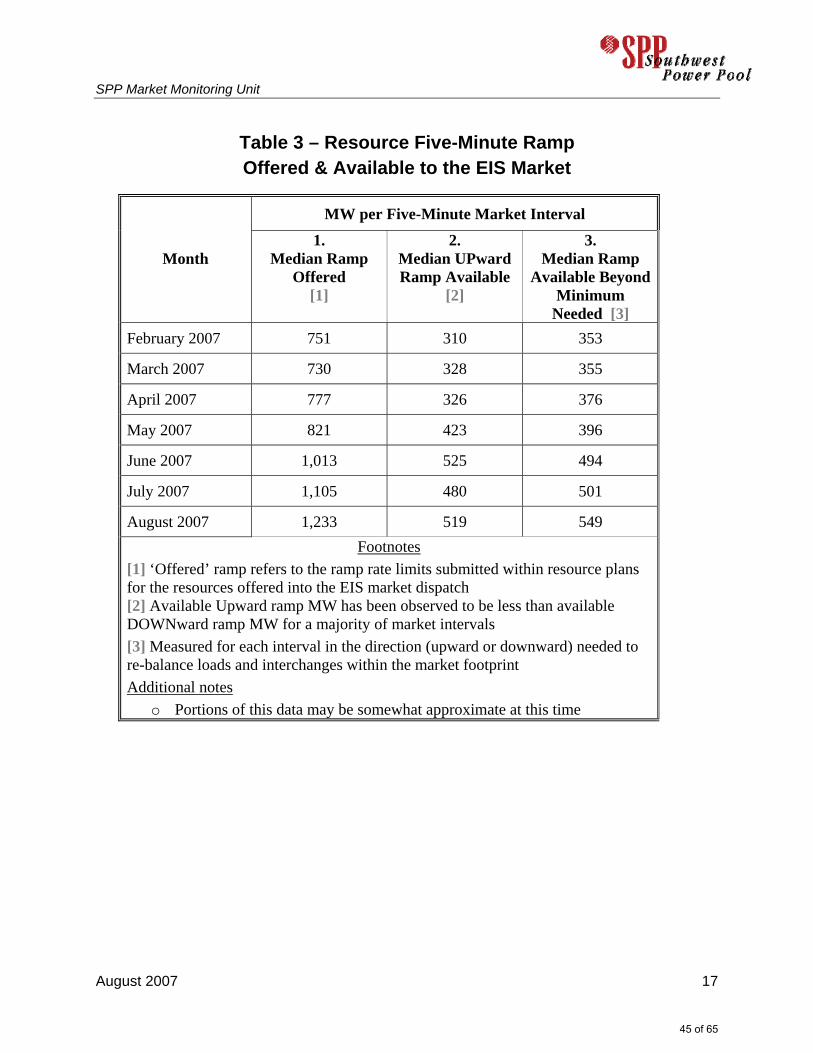
SPP continues to review and evaluate the amount of ramp available to the EIS
market, which reflects the MW range that resources available to the market can be deployed upward or downward within a five-minute market interval to enforce loads and constraints, as well as for economic dispatch.3
Although the median level of ramp offered into the market increased 12% in
August (Table 4), the median ramp has moderated to around 500 MW in excess of the needs. Note, that the median is the midpoint between the observations, meaning that 50% of the time, the ramp is below 500 MW of excess.
3 The amount of ramp available to the market is always less then the amount offered into the market, because 1) some resources are typically already at or near maximum or minimum output at the beginning of each market interval, 2) some resources will typically be locked out of the market due to uninstructed deviation instructions, and 3) in some intervals, self-scheduled resources ramp upward or downward at rates significantly greater than market loads and interchanges are changing.
43 of 65
SPP Market Monitoring Unit
August 2007 16
Figure 8 – Market Up Capacity Above Maximum Daily Net Obligation
August 2007
Figure 9 – Market Down Capacity Below Minimum Daily Net Obligation August 2007
Note: Critical period for up capacity is for the dispatch interval when system requirement is at maximum and the critical period for down capacity is for the dispatch intervals when system requirements are at minimum.
44 of 65
SPP Market Monitoring Unit
August 2007 17
Table 3 – Resource Five-Minute Ramp Offered & Available to the EIS Market
MW per Five-Minute Market Interval
Month 1.
Median Ramp Offered
[1]
2. Median UPward Ramp Available
[2]
3. Median Ramp
Available Beyond Minimum
Needed [3] February 2007 751 310 353
March 2007 730 328 355
April 2007 777 326 376
May 2007 821 423 396
June 2007 1,013 525 494
July 2007 1,105 480 501
August 2007 1,233 519 549 Footnotes
[1] ‘Offered’ ramp refers to the ramp rate limits submitted within resource plans for the resources offered into the EIS market dispatch [2] Available Upward ramp MW has been observed to be less than available DOWNward ramp MW for a majority of market intervals [3] Measured for each interval in the direction (upward or downward) needed to re-balance loads and interchanges within the market footprint Additional notes
o Portions of this data may be somewhat approximate at this time
45 of 65
SPP Market Monitoring Unit
August 2007 18
IV. Transmission Congestion
Congestion occurs whenever one or more parts of the transmission grid have reached their loading limit. Locational prices in the EIS market diverge when there is transmission congestion because the marginal dispatch and associated price to deliver is no longer the same at all locations.
The number of five minute intervals that had congestion in August was comparable to
July, though increased over the springtime congestion.
Congestion was present in 67% of all market intervals in August. This compares to congestion in July, June, May, April, March, and February of 65%, 86%, 25%, 40%, 49%, and 49%, respectively. On-peak hour only congestion generally decreased in August during the same period.
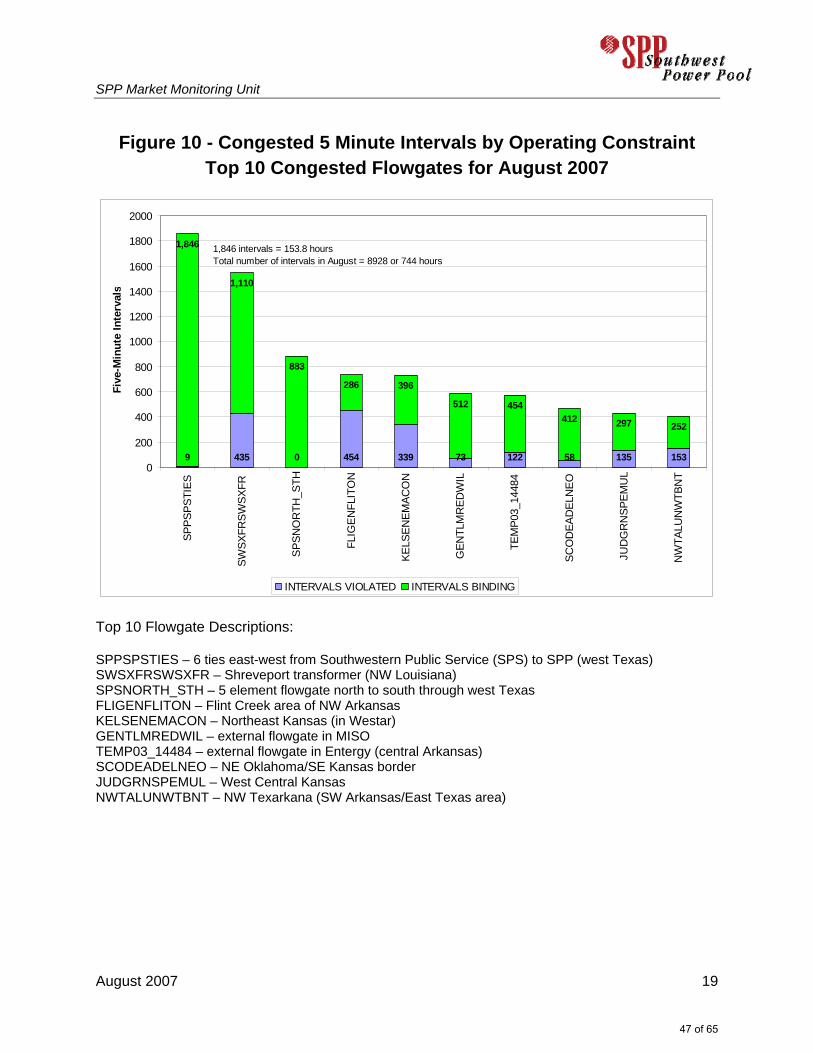
There are a relatively small number of flowgates experiencing most of the congestion on
the SPP transmission grid. In fact, the top 5 flowgates accounted for 58% of the total flowgate congestion intervals in August.
The EIS Market security constrained economic dispatch (SCED) expands the range of
transactions that can be applied to relieve congestion. Congestion can be relieved by EIS Market response (re-dispatch) as well as by traditional curtailment through transmission loading relief (TLRs).
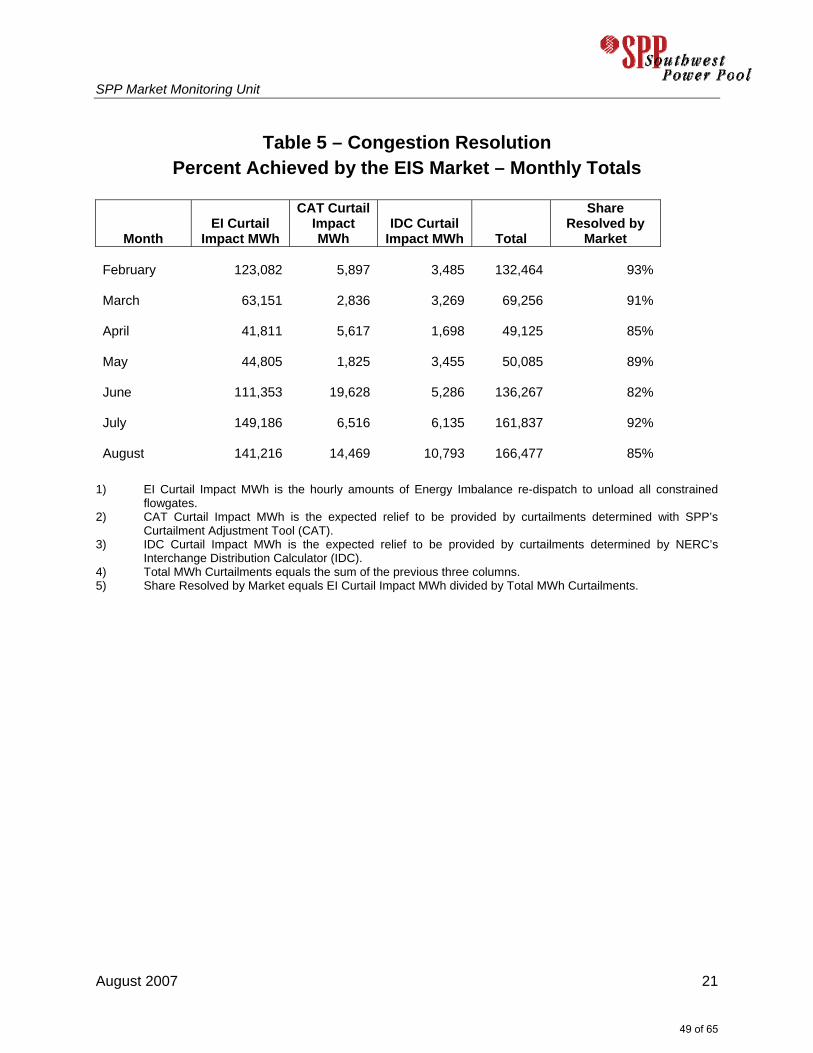
The EIS Market is designed to resolve a portion of congestion through re-
dispatch. Estimated congestion resolved by the market in August was 85%. This is a good first step forward in that market resolution is thought to be less costly than physical curtailment.
Flowgate constraint violations represent situations where a flowgate loading as reflected
in the EIS market dispatch solution exceeded the limit by at least 1 MW. The total market intervals with a flowgate violation in August were 17% in comparison to 5.0% in July. Record loads were experienced during August which contributed to violations of flowgates primarily serving load centers (e.g. NW Arkansas, Shreveport) and electrically on the periphery of the SPP transmission grid.
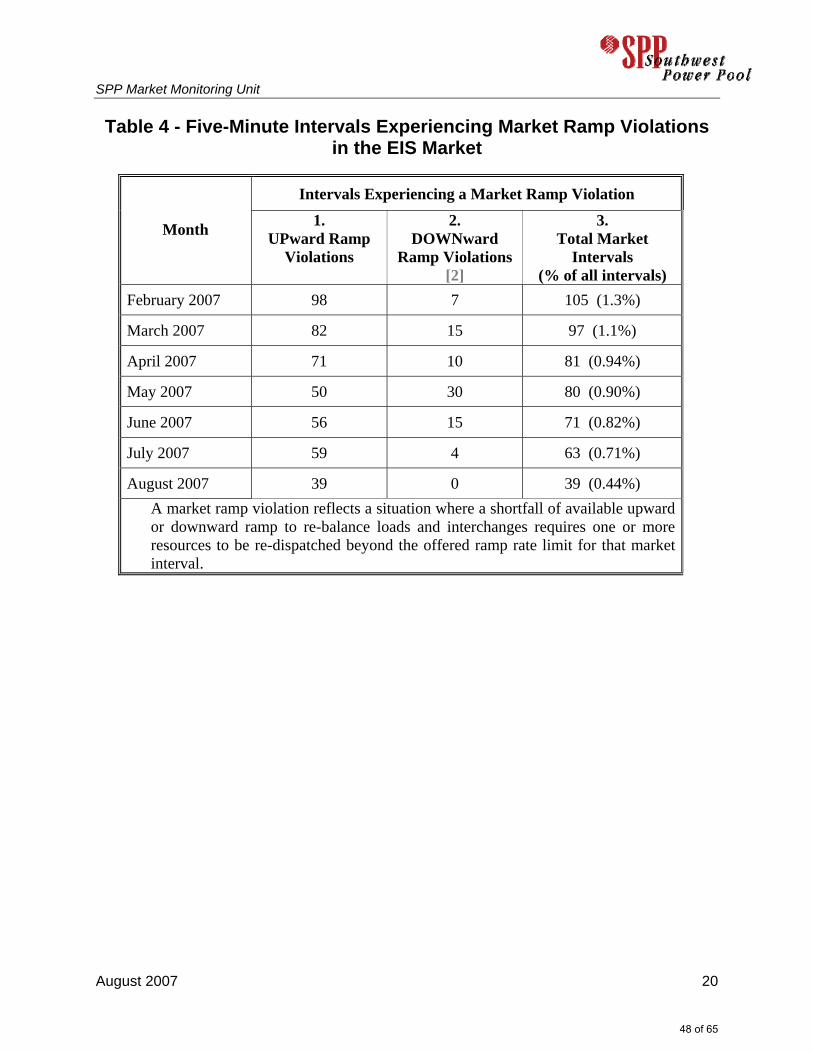
As summarized in Table 5, the number of five-minute market intervals experiencing a
market ramp violation in August was 39, compared to 63 market intervals in July. The reduction of violations is attributed primarily to somewhat higher offered ramp levels and additional resources remaining on-line overnight due to high daytime loads experienced during the month of August.
46 of 65
SPP Market Monitoring Unit
August 2007 19
Figure 10 - Congested 5 Minute Intervals by Operating Constraint Top 10 Congested Flowgates for August 2007
9 435 0 454 339 73 122 58 135 153
1,846
1,110
883
286 396
512 454412 297 252
0
200
400
600
800
1000
1200
1400
1600
1800
2000
SPPS
PSTI
ES
SWSX
FRSW
SXFR
SPSN
OR
TH_S
TH
FLIG
ENFL
ITO
N
KELS
ENEM
ACO
N
GEN
TLM
RED
WIL
TEM
P03_
1448
4
SCO
DEA
DEL
NEO
JUD
GR
NSP
EMU
L
NW
TALU
NW
TBN
T
Five
-Min
ute
Inte
rval
s
INTERVALS VIOLATED INTERVALS BINDING
1,846 intervals = 153.8 hoursTotal number of intervals in August = 8928 or 744 hours
Top 10 Flowgate Descriptions: SPPSPSTIES – 6 ties east-west from Southwestern Public Service (SPS) to SPP (west Texas) SWSXFRSWSXFR – Shreveport transformer (NW Louisiana) SPSNORTH_STH – 5 element flowgate north to south through west Texas FLIGENFLITON – Flint Creek area of NW Arkansas KELSENEMACON – Northeast Kansas (in Westar) GENTLMREDWIL – external flowgate in MISO TEMP03_14484 – external flowgate in Entergy (central Arkansas) SCODEADELNEO – NE Oklahoma/SE Kansas border JUDGRNSPEMUL – West Central Kansas NWTALUNWTBNT – NW Texarkana (SW Arkansas/East Texas area)
47 of 65
SPP Market Monitoring Unit
August 2007 20
Table 4 - Five-Minute Intervals Experiencing Market Ramp Violations in the EIS Market
Intervals Experiencing a Market Ramp Violation
Month 1. UPward Ramp
Violations
2. DOWNward
Ramp Violations [2]
3. Total Market
Intervals (% of all intervals)
February 2007 98 7 105 (1.3%)
March 2007 82 15 97 (1.1%)
April 2007 71 10 81 (0.94%)
May 2007 50 30 80 (0.90%)
June 2007 56 15 71 (0.82%)
July 2007 59 4 63 (0.71%)
August 2007 39 0 39 (0.44%) A market ramp violation reflects a situation where a shortfall of available upward or downward ramp to re-balance loads and interchanges requires one or more resources to be re-dispatched beyond the offered ramp rate limit for that market interval.
48 of 65
SPP Market Monitoring Unit
August 2007 21
Table 5 – Congestion Resolution Percent Achieved by the EIS Market – Monthly Totals
Month EI Curtail
Impact MWh
CAT Curtail Impact MWh
IDC Curtail Impact MWh Total
Share Resolved by
Market
February
123,082
5,897
3,485
132,464 93%
March
63,151
2,836
3,269
69,256 91%
April
41,811
5,617
1,698
49,125 85%
May
44,805
1,825
3,455
50,085 89%
June
111,353
19,628
5,286
136,267 82%
July
149,186
6,516
6,135
161,837 92%
August
141,216
14,469
10,793
166,477 85%
1) EI Curtail Impact MWh is the hourly amounts of Energy Imbalance re-dispatch to unload all constrained flowgates.
2) CAT Curtail Impact MWh is the expected relief to be provided by curtailments determined with SPP’s Curtailment Adjustment Tool (CAT).
3) IDC Curtail Impact MWh is the expected relief to be provided by curtailments determined by NERC’s Interchange Distribution Calculator (IDC).
4) Total MWh Curtailments equals the sum of the previous three columns. 5) Share Resolved by Market equals EI Curtail Impact MWh divided by Total MWh Curtailments.
49 of 65
SPP Market Monitoring Unit
August 2007 22
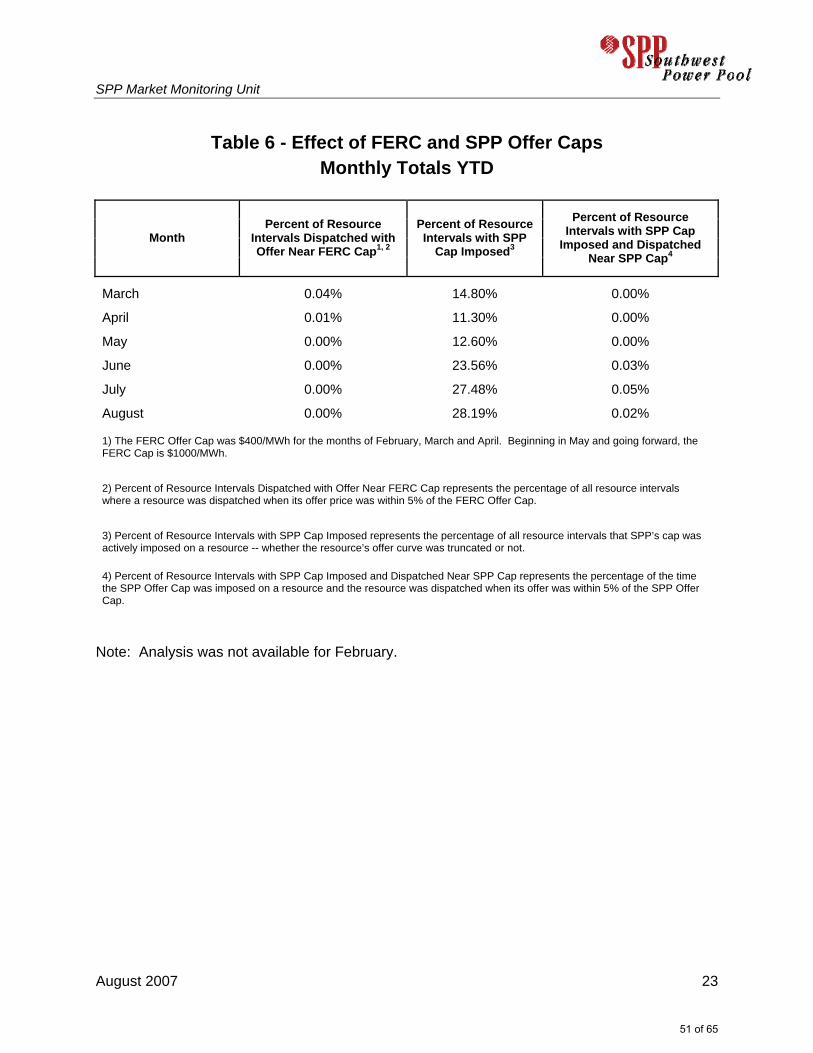
V. Market Power Measurement and Mitigation
Beginning in May and going forward, the FERC Offer Cap (Safety Net Offer Cap) is set at $1000/MWh. For the first three months of the EIS Market (February through April), the FERC cap was set at $400/MWh. The FERC Offer Cap applies at all times to all resources.
The effect of the Safety Net Offer Cap has been negligible. In August, 0.02%
of offers were accepted near the cap.
SPP’s Offer Cap applies only when there is transmission congestion to resources on the load-constrained side. The level of offer cap varies by Resource.
The SPP Offer Cap was imposed in a significant number of opportunities
(Resource Intervals), but its effect was negligible. The SPP Offer Cap was imposed in 28.19% of all Resource Intervals, up from July at 27.48%.
50 of 65
SPP Market Monitoring Unit
August 2007 23
Table 6 - Effect of FERC and SPP Offer Caps Monthly Totals YTD
Month Percent of Resource
Intervals Dispatched with Offer Near FERC Cap1, 2
Percent of Resource Intervals with SPP
Cap Imposed3
Percent of Resource Intervals with SPP Cap
Imposed and Dispatched Near SPP Cap4
March 0.04% 14.80% 0.00%
April 0.01% 11.30% 0.00%
May 0.00% 12.60% 0.00%
June 0.00% 23.56% 0.03%
July 0.00% 27.48% 0.05%
August 0.00% 28.19% 0.02%
1) The FERC Offer Cap was $400/MWh for the months of February, March and April. Beginning in May and going forward, the FERC Cap is $1000/MWh.
2) Percent of Resource Intervals Dispatched with Offer Near FERC Cap represents the percentage of all resource intervals where a resource was dispatched when its offer price was within 5% of the FERC Offer Cap.
3) Percent of Resource Intervals with SPP Cap Imposed represents the percentage of all resource intervals that SPP’s cap was actively imposed on a resource -- whether the resource’s offer curve was truncated or not.
4) Percent of Resource Intervals with SPP Cap Imposed and Dispatched Near SPP Cap represents the percentage of the time the SPP Offer Cap was imposed on a resource and the resource was dispatched when its offer was within 5% of the SPP Offer Cap.
Note: Analysis was not available for February.
51 of 65
SPP Market Monitoring Unit
August 2007 24
VI. EIS Market Revenue Neutrality Uplift (RNU) This month a new table has been added to this section. Table 7 is an all-in price that is the sum of the average SPP settled price plus the total RNU dollars divided by EIS MWh for the month of August.
The All-in Price increased 0.5% over the settlement LIP prices during August from an undercollection of EIS charges.
The RNU has improved over prior months due to changes in the tools utilized by SPP
Operations in maintaining simultaneous feasibility.
52 of 65

SPP Market Monitoring Unit
August 2007 25
Table 7 - All-In Price YTD 2007
All-In Price = Energy (LIP) + RNU
February $59.26 $58.98 $0.28
March $47.85 $46.35 $1.50
April $50.88 $51.25 -$0.37
May $48.34 $48.65 -$0.31
June $55.59 $53.40 $2.19
July $47.85 $48.66 -$0.81
August $57.87 $57.58 $0.29
The All-In Price effectively represents the cost of delivered energy, including congestion costs that were not explicitly levied upon Market Participants through schedule adjustments and credits from over/under scheduling and uninstructed deviation charges.
53 of 65
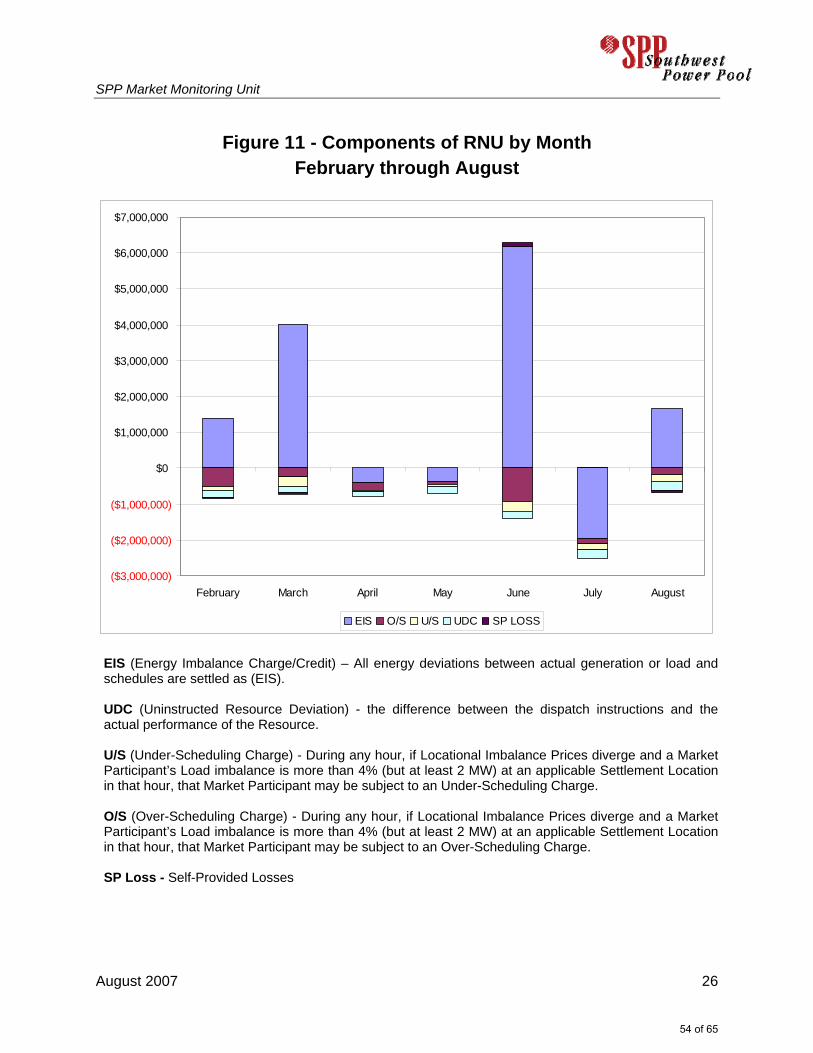
SPP Market Monitoring Unit
August 2007 26
Figure 11 - Components of RNU by Month February through August
($3,000,000)
($2,000,000)
($1,000,000)
$0
$1,000,000
$2,000,000
$3,000,000
$4,000,000
$5,000,000
$6,000,000
$7,000,000
February March April May June July August
EIS O/S U/S UDC SP LOSS
EIS (Energy Imbalance Charge/Credit) – All energy deviations between actual generation or load and schedules are settled as (EIS).
UDC (Uninstructed Resource Deviation) - the difference between the dispatch instructions and the actual performance of the Resource.
U/S (Under-Scheduling Charge) - During any hour, if Locational Imbalance Prices diverge and a Market Participant’s Load imbalance is more than 4% (but at least 2 MW) at an applicable Settlement Location in that hour, that Market Participant may be subject to an Under-Scheduling Charge.
O/S (Over-Scheduling Charge) - During any hour, if Locational Imbalance Prices diverge and a Market Participant’s Load imbalance is more than 4% (but at least 2 MW) at an applicable Settlement Location in that hour, that Market Participant may be subject to an Over-Scheduling Charge.
SP Loss - Self-Provided Losses
54 of 65

SPP Market Monitoring Unit
August 2007 27
A. Appendix Tables related to topics in this report that include daily data have been moved to this appendix going forward in order to focus the report on monthly trends.
55 of 65
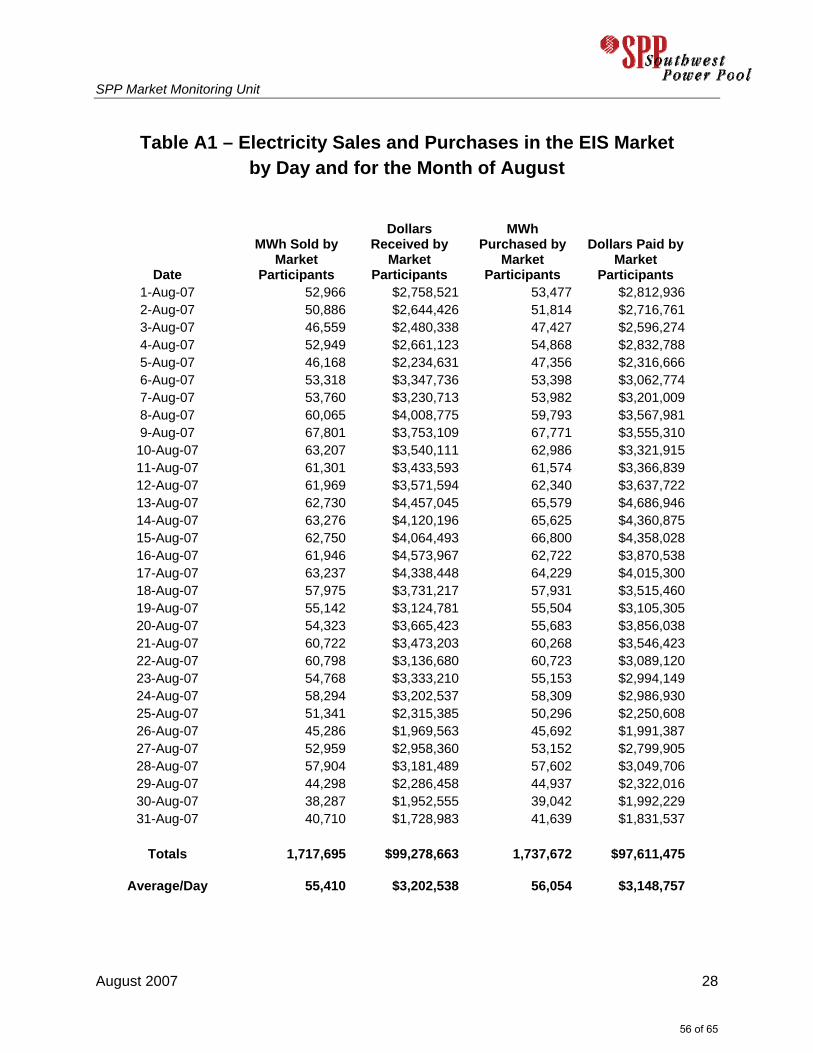
SPP Market Monitoring Unit
August 2007 28
Table A1 – Electricity Sales and Purchases in the EIS Market by Day and for the Month of August
Date
MWh Sold by Market
Participants
Dollars Received by
Market Participants
MWh Purchased by
Market Participants
Dollars Paid by Market
Participants 1-Aug-07 52,966 $2,758,521 53,477 $2,812,9362-Aug-07 50,886 $2,644,426 51,814 $2,716,7613-Aug-07 46,559 $2,480,338 47,427 $2,596,2744-Aug-07 52,949 $2,661,123 54,868 $2,832,7885-Aug-07 46,168 $2,234,631 47,356 $2,316,6666-Aug-07 53,318 $3,347,736 53,398 $3,062,7747-Aug-07 53,760 $3,230,713 53,982 $3,201,0098-Aug-07 60,065 $4,008,775 59,793 $3,567,9819-Aug-07 67,801 $3,753,109 67,771 $3,555,31010-Aug-07 63,207 $3,540,111 62,986 $3,321,91511-Aug-07 61,301 $3,433,593 61,574 $3,366,83912-Aug-07 61,969 $3,571,594 62,340 $3,637,72213-Aug-07 62,730 $4,457,045 65,579 $4,686,94614-Aug-07 63,276 $4,120,196 65,625 $4,360,87515-Aug-07 62,750 $4,064,493 66,800 $4,358,02816-Aug-07 61,946 $4,573,967 62,722 $3,870,53817-Aug-07 63,237 $4,338,448 64,229 $4,015,30018-Aug-07 57,975 $3,731,217 57,931 $3,515,46019-Aug-07 55,142 $3,124,781 55,504 $3,105,30520-Aug-07 54,323 $3,665,423 55,683 $3,856,03821-Aug-07 60,722 $3,473,203 60,268 $3,546,42322-Aug-07 60,798 $3,136,680 60,723 $3,089,12023-Aug-07 54,768 $3,333,210 55,153 $2,994,14924-Aug-07 58,294 $3,202,537 58,309 $2,986,93025-Aug-07 51,341 $2,315,385 50,296 $2,250,60826-Aug-07 45,286 $1,969,563 45,692 $1,991,38727-Aug-07 52,959 $2,958,360 53,152 $2,799,90528-Aug-07 57,904 $3,181,489 57,602 $3,049,70629-Aug-07 44,298 $2,286,458 44,937 $2,322,01630-Aug-07 38,287 $1,952,555 39,042 $1,992,22931-Aug-07 40,710 $1,728,983 41,639 $1,831,537
Totals 1,717,695 $99,278,663 1,737,672 $97,611,475
Average/Day 55,410 $3,202,538 56,054 $3,148,757
56 of 65

SPP Market Monitoring Unit
August 2007 29
Table A2 – Daily Congestion Resolution Percent Achieved by the EIS Market – August 2007
Day EI Curtail Impact
MWh CAT Curtail Impact MWh
IDC Curtail Impact MWh Total
Share Resolved by
Market 1-Aug-07 6,624 470 276 7,370 90%2-Aug-07 5,507 755 396 6,658 83%3-Aug-07 3,480 389 59 3,928 89%4-Aug-07 9,264 409 249 9,921 93%5-Aug-07 8,182 96 85 8,362 98%6-Aug-07 2,947 322 1,015 4,284 69%7-Aug-07 1,831 808 694 3,333 55%8-Aug-07 1,160 102 351 1,613 72%9-Aug-07 2,358 195 146 2,699 87%10-Aug-07 2,883 230 200 3,313 87%11-Aug-07 6,369 2,177 175 8,722 73%12-Aug-07 5,990 626 521 7,137 84%13-Aug-07 1,942 344 398 2,684 72%14-Aug-07 4,891 70 427 5,388 91%15-Aug-07 5,888 183 470 6,541 90%16-Aug-07 4,527 227 527 5,281 86%17-Aug-07 2,887 256 249 3,392 85%18-Aug-07 4,850 20 356 5,226 93%19-Aug-07 6,389 20 378 6,786 94%20-Aug-07 5,271 269 110 5,650 93%21-Aug-07 3,201 2,382 213 5,797 55%22-Aug-07 5,945 761 385 7,091 84%23-Aug-07 1,530 181 503 2,213 69%24-Aug-07 1,529 231 548 2,308 66%25-Aug-07 2,061 460 74 2,595 79%26-Aug-07 2,773 380 39 3,192 87%27-Aug-07 5,344 446 43 5,833 92%28-Aug-07 5,813 447 252 6,513 89%29-Aug-07 5,107 363 568 6,038 85%30-Aug-07 5,612 12 362 5,986 94%31-Aug-07 9,062 838 722 10,622 85%
Total 141,217 14,469 10,791 166,476 85%
57 of 65
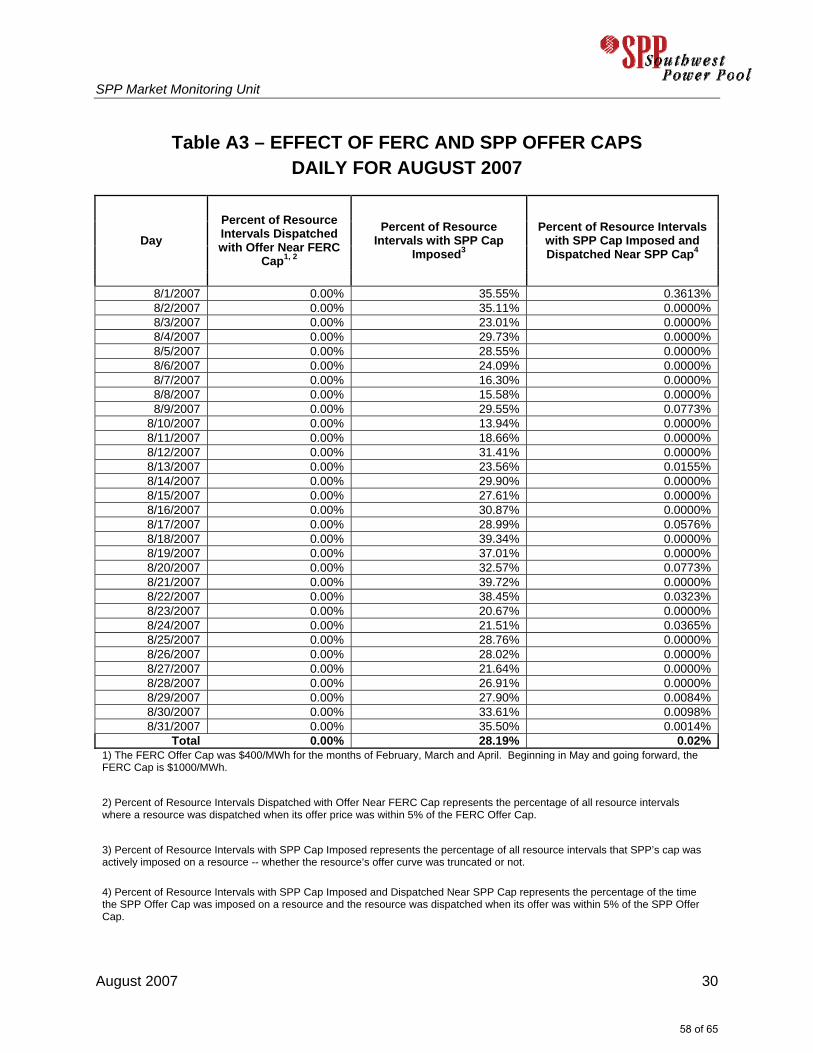
SPP Market Monitoring Unit
August 2007 30
Table A3 – EFFECT OF FERC AND SPP OFFER CAPS DAILY FOR AUGUST 2007
Day Percent of Resource Intervals Dispatched with Offer Near FERC
Cap1, 2
Percent of Resource Intervals with SPP Cap
Imposed3
Percent of Resource Intervals with SPP Cap Imposed and Dispatched Near SPP Cap4
8/1/2007 0.00% 35.55% 0.3613% 8/2/2007 0.00% 35.11% 0.0000% 8/3/2007 0.00% 23.01% 0.0000% 8/4/2007 0.00% 29.73% 0.0000% 8/5/2007 0.00% 28.55% 0.0000% 8/6/2007 0.00% 24.09% 0.0000% 8/7/2007 0.00% 16.30% 0.0000% 8/8/2007 0.00% 15.58% 0.0000% 8/9/2007 0.00% 29.55% 0.0773%
8/10/2007 0.00% 13.94% 0.0000% 8/11/2007 0.00% 18.66% 0.0000% 8/12/2007 0.00% 31.41% 0.0000% 8/13/2007 0.00% 23.56% 0.0155% 8/14/2007 0.00% 29.90% 0.0000% 8/15/2007 0.00% 27.61% 0.0000% 8/16/2007 0.00% 30.87% 0.0000% 8/17/2007 0.00% 28.99% 0.0576% 8/18/2007 0.00% 39.34% 0.0000% 8/19/2007 0.00% 37.01% 0.0000% 8/20/2007 0.00% 32.57% 0.0773% 8/21/2007 0.00% 39.72% 0.0000% 8/22/2007 0.00% 38.45% 0.0323% 8/23/2007 0.00% 20.67% 0.0000% 8/24/2007 0.00% 21.51% 0.0365% 8/25/2007 0.00% 28.76% 0.0000% 8/26/2007 0.00% 28.02% 0.0000% 8/27/2007 0.00% 21.64% 0.0000% 8/28/2007 0.00% 26.91% 0.0000% 8/29/2007 0.00% 27.90% 0.0084% 8/30/2007 0.00% 33.61% 0.0098% 8/31/2007 0.00% 35.50% 0.0014%
Total 0.00% 28.19% 0.02%1) The FERC Offer Cap was $400/MWh for the months of February, March and April. Beginning in May and going forward, the FERC Cap is $1000/MWh.
2) Percent of Resource Intervals Dispatched with Offer Near FERC Cap represents the percentage of all resource intervals where a resource was dispatched when its offer price was within 5% of the FERC Offer Cap.
3) Percent of Resource Intervals with SPP Cap Imposed represents the percentage of all resource intervals that SPP’s cap was actively imposed on a resource -- whether the resource’s offer curve was truncated or not.
4) Percent of Resource Intervals with SPP Cap Imposed and Dispatched Near SPP Cap represents the percentage of the time the SPP Offer Cap was imposed on a resource and the resource was dispatched when its offer was within 5% of the SPP Offer Cap.
58 of 65
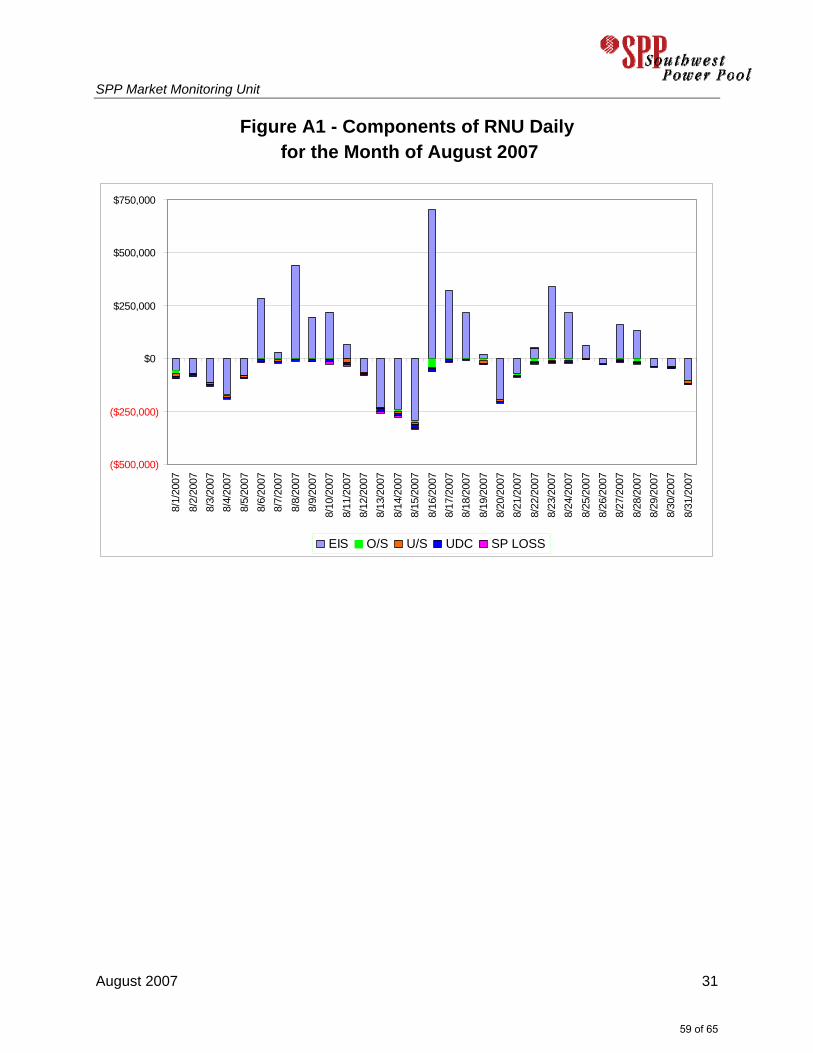
SPP Market Monitoring Unit
August 2007 31
Figure A1 - Components of RNU Daily for the Month of August 2007
($500,000)
($250,000)
$0
$250,000
$500,000
$750,000
8/1/
2007
8/2/
2007
8/3/
2007
8/4/
2007
8/5/
2007
8/6/
2007
8/7/
2007
8/8/
2007
8/9/
2007
8/10
/200
78/
11/2
007
8/12
/200
78/
13/2
007
8/14
/200
78/
15/2
007
8/16
/200
78/
17/2
007
8/18
/200
78/
19/2
007
8/20
/200
78/
21/2
007
8/22
/200
78/
23/2
007
8/24
/200
7
8/25
/200
78/
26/2
007
8/27
/200
78/
28/2
007
8/29
/200
78/
30/2
007
8/31
/200
7
EIS O/S U/S UDC SP LOSS
59 of 65
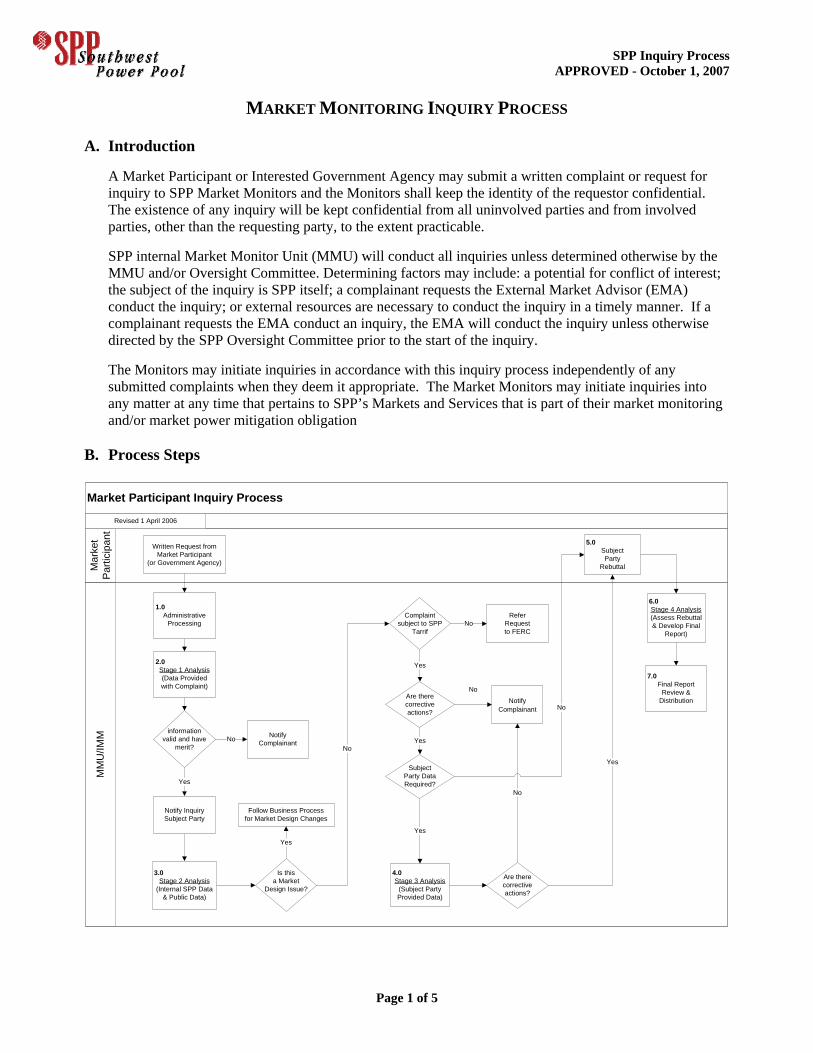
SPP Inquiry Process APPROVED - October 1, 2007
Page 1 of 5
MARKET MONITORING INQUIRY PROCESS A. Introduction
A Market Participant or Interested Government Agency may submit a written complaint or request for inquiry to SPP Market Monitors and the Monitors shall keep the identity of the requestor confidential. The existence of any inquiry will be kept confidential from all uninvolved parties and from involved parties, other than the requesting party, to the extent practicable. SPP internal Market Monitor Unit (MMU) will conduct all inquiries unless determined otherwise by the MMU and/or Oversight Committee. Determining factors may include: a potential for conflict of interest; the subject of the inquiry is SPP itself; a complainant requests the External Market Advisor (EMA) conduct the inquiry; or external resources are necessary to conduct the inquiry in a timely manner. If a complainant requests the EMA conduct an inquiry, the EMA will conduct the inquiry unless otherwise directed by the SPP Oversight Committee prior to the start of the inquiry. The Monitors may initiate inquiries in accordance with this inquiry process independently of any submitted complaints when they deem it appropriate. The Market Monitors may initiate inquiries into any matter at any time that pertains to SPP’s Markets and Services that is part of their market monitoring and/or market power mitigation obligation
B. Process Steps Market Participant Inquiry Process
MM
U/IM
MM
arke
t P
artic
ipan
t
Written Request from Market Participant
(or Government Agency)
2.0Stage 1 Analysis (Data Provided with Complaint)
Complaint subject to SPP
Tarrif
3.0Stage 2 Analysis
(Internal SPP Data & Public Data)
NotifyComplainant
information valid and have
merit?
Subject Party Data Required?
4.0Stage 3 Analysis
(Subject Party Provided Data)
Are there corrective actions?
NotifyComplainant
5.0Subject Party
Rebuttal
1.0Administrative
Processing
No
Is this a Market
Design Issue?
Follow Business Processfor Market Design Changes
Are there corrective actions?
Yes
Yes
No
NoNo
No
Yes
Yes
Yes
Yes
Refer Request to FERC
No
Revised 1 April 2006
Notify InquirySubject Party
7.0Final Report
Review & Distribution
6.0Stage 4 Analysis(Assess Rebuttal & Develop Final
Report)
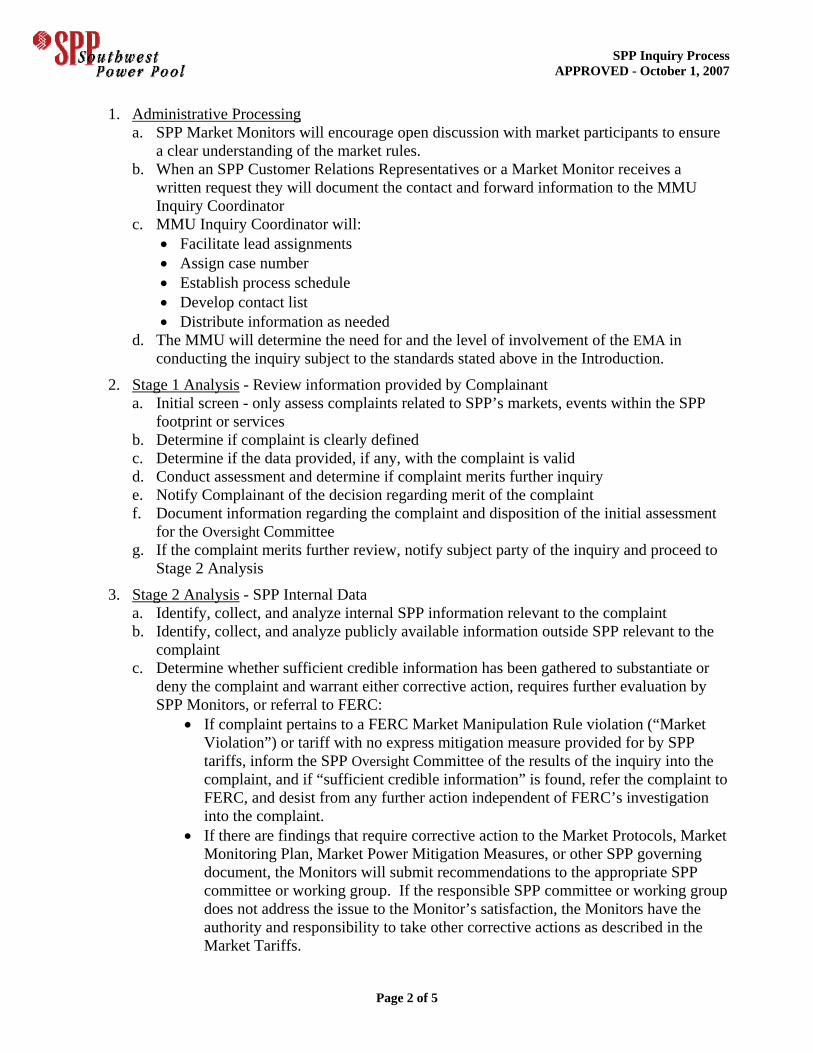
SPP Inquiry Process APPROVED - October 1, 2007
Page 2 of 5
1. Administrative Processing a. SPP Market Monitors will encourage open discussion with market participants to ensure
a clear understanding of the market rules. b. When an SPP Customer Relations Representatives or a Market Monitor receives a
written request they will document the contact and forward information to the MMU Inquiry Coordinator
c. MMU Inquiry Coordinator will: • Facilitate lead assignments • Assign case number • Establish process schedule • Develop contact list • Distribute information as needed
d. The MMU will determine the need for and the level of involvement of the EMA in conducting the inquiry subject to the standards stated above in the Introduction.
2. Stage 1 Analysis - Review information provided by Complainant a. Initial screen - only assess complaints related to SPP’s markets, events within the SPP
footprint or services b. Determine if complaint is clearly defined c. Determine if the data provided, if any, with the complaint is valid d. Conduct assessment and determine if complaint merits further inquiry e. Notify Complainant of the decision regarding merit of the complaint f. Document information regarding the complaint and disposition of the initial assessment
for the Oversight Committee g. If the complaint merits further review, notify subject party of the inquiry and proceed to
Stage 2 Analysis
3. Stage 2 Analysis - SPP Internal Data a. Identify, collect, and analyze internal SPP information relevant to the complaint b. Identify, collect, and analyze publicly available information outside SPP relevant to the
complaint c. Determine whether sufficient credible information has been gathered to substantiate or
deny the complaint and warrant either corrective action, requires further evaluation by SPP Monitors, or referral to FERC:
• If complaint pertains to a FERC Market Manipulation Rule violation (“Market Violation”) or tariff with no express mitigation measure provided for by SPP tariffs, inform the SPP Oversight Committee of the results of the inquiry into the complaint, and if “sufficient credible information” is found, refer the complaint to FERC, and desist from any further action independent of FERC’s investigation into the complaint.
• If there are findings that require corrective action to the Market Protocols, Market Monitoring Plan, Market Power Mitigation Measures, or other SPP governing document, the Monitors will submit recommendations to the appropriate SPP committee or working group. If the responsible SPP committee or working group does not address the issue to the Monitor’s satisfaction, the Monitors have the authority and responsibility to take other corrective actions as described in the Market Tariffs.
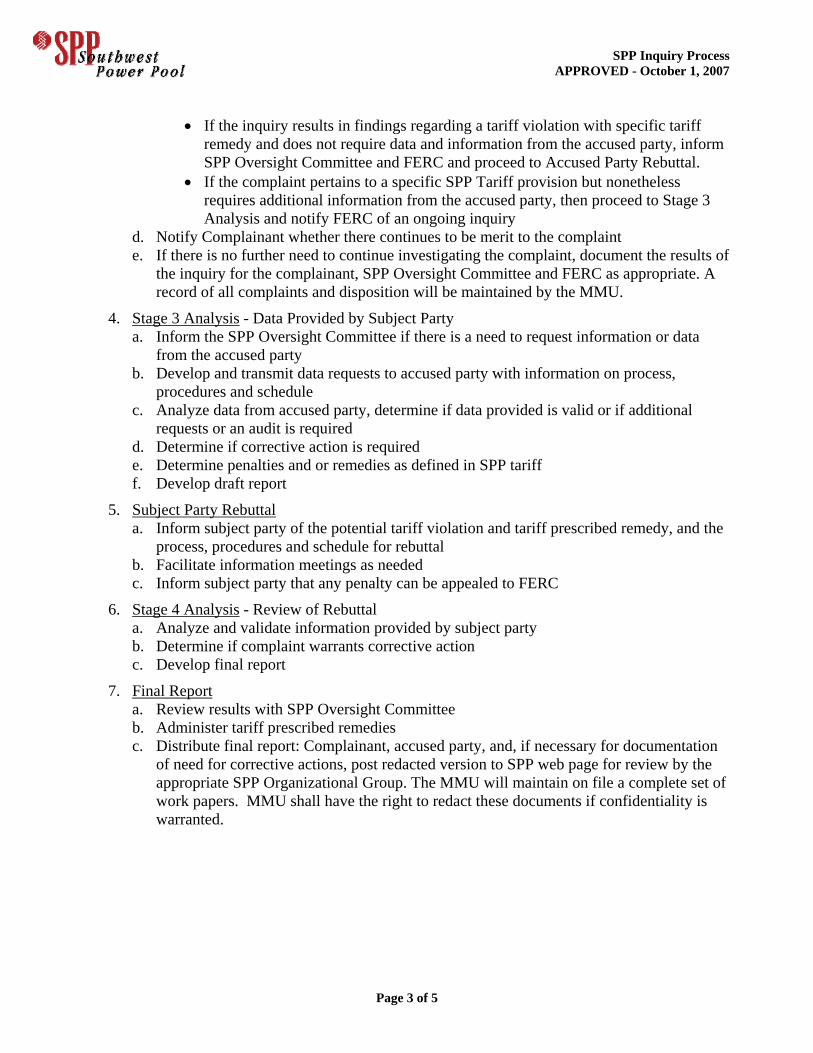
SPP Inquiry Process APPROVED - October 1, 2007
Page 3 of 5
• If the inquiry results in findings regarding a tariff violation with specific tariff
remedy and does not require data and information from the accused party, inform SPP Oversight Committee and FERC and proceed to Accused Party Rebuttal.
• If the complaint pertains to a specific SPP Tariff provision but nonetheless requires additional information from the accused party, then proceed to Stage 3 Analysis and notify FERC of an ongoing inquiry
d. Notify Complainant whether there continues to be merit to the complaint e. If there is no further need to continue investigating the complaint, document the results of
the inquiry for the complainant, SPP Oversight Committee and FERC as appropriate. A record of all complaints and disposition will be maintained by the MMU.
4. Stage 3 Analysis - Data Provided by Subject Party a. Inform the SPP Oversight Committee if there is a need to request information or data
from the accused party b. Develop and transmit data requests to accused party with information on process,
procedures and schedule c. Analyze data from accused party, determine if data provided is valid or if additional
requests or an audit is required d. Determine if corrective action is required e. Determine penalties and or remedies as defined in SPP tariff f. Develop draft report
5. Subject Party Rebuttal a. Inform subject party of the potential tariff violation and tariff prescribed remedy, and the
process, procedures and schedule for rebuttal b. Facilitate information meetings as needed c. Inform subject party that any penalty can be appealed to FERC
6. Stage 4 Analysis - Review of Rebuttal a. Analyze and validate information provided by subject party b. Determine if complaint warrants corrective action c. Develop final report
7. Final Report a. Review results with SPP Oversight Committee b. Administer tariff prescribed remedies c. Distribute final report: Complainant, accused party, and, if necessary for documentation
of need for corrective actions, post redacted version to SPP web page for review by the appropriate SPP Organizational Group. The MMU will maintain on file a complete set of work papers. MMU shall have the right to redact these documents if confidentiality is warranted.
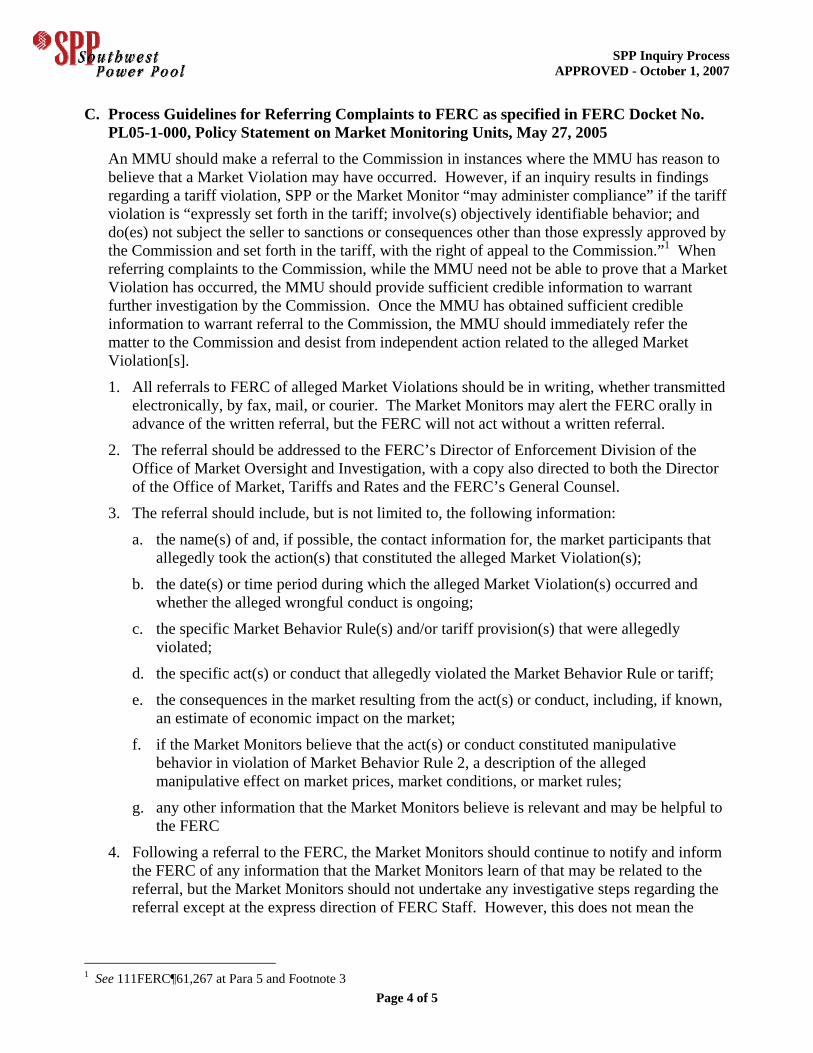
SPP Inquiry Process APPROVED - October 1, 2007
Page 4 of 5
C. Process Guidelines for Referring Complaints to FERC as specified in FERC Docket No. PL05-1-000, Policy Statement on Market Monitoring Units, May 27, 2005 An MMU should make a referral to the Commission in instances where the MMU has reason to believe that a Market Violation may have occurred. However, if an inquiry results in findings regarding a tariff violation, SPP or the Market Monitor “may administer compliance” if the tariff violation is “expressly set forth in the tariff; involve(s) objectively identifiable behavior; and do(es) not subject the seller to sanctions or consequences other than those expressly approved by the Commission and set forth in the tariff, with the right of appeal to the Commission.”1 When referring complaints to the Commission, while the MMU need not be able to prove that a Market Violation has occurred, the MMU should provide sufficient credible information to warrant further investigation by the Commission. Once the MMU has obtained sufficient credible information to warrant referral to the Commission, the MMU should immediately refer the matter to the Commission and desist from independent action related to the alleged Market Violation[s].
1. All referrals to FERC of alleged Market Violations should be in writing, whether transmitted electronically, by fax, mail, or courier. The Market Monitors may alert the FERC orally in advance of the written referral, but the FERC will not act without a written referral.
2. The referral should be addressed to the FERC’s Director of Enforcement Division of the Office of Market Oversight and Investigation, with a copy also directed to both the Director of the Office of Market, Tariffs and Rates and the FERC’s General Counsel.
3. The referral should include, but is not limited to, the following information:
a. the name(s) of and, if possible, the contact information for, the market participants that allegedly took the action(s) that constituted the alleged Market Violation(s);
b. the date(s) or time period during which the alleged Market Violation(s) occurred and whether the alleged wrongful conduct is ongoing;
c. the specific Market Behavior Rule(s) and/or tariff provision(s) that were allegedly violated;
d. the specific act(s) or conduct that allegedly violated the Market Behavior Rule or tariff;
e. the consequences in the market resulting from the act(s) or conduct, including, if known, an estimate of economic impact on the market;
f. if the Market Monitors believe that the act(s) or conduct constituted manipulative behavior in violation of Market Behavior Rule 2, a description of the alleged manipulative effect on market prices, market conditions, or market rules;
g. any other information that the Market Monitors believe is relevant and may be helpful to the FERC
4. Following a referral to the FERC, the Market Monitors should continue to notify and inform the FERC of any information that the Market Monitors learn of that may be related to the referral, but the Market Monitors should not undertake any investigative steps regarding the referral except at the express direction of FERC Staff. However, this does not mean the
1 See 111FERC¶61,267 at Para 5 and Footnote 3
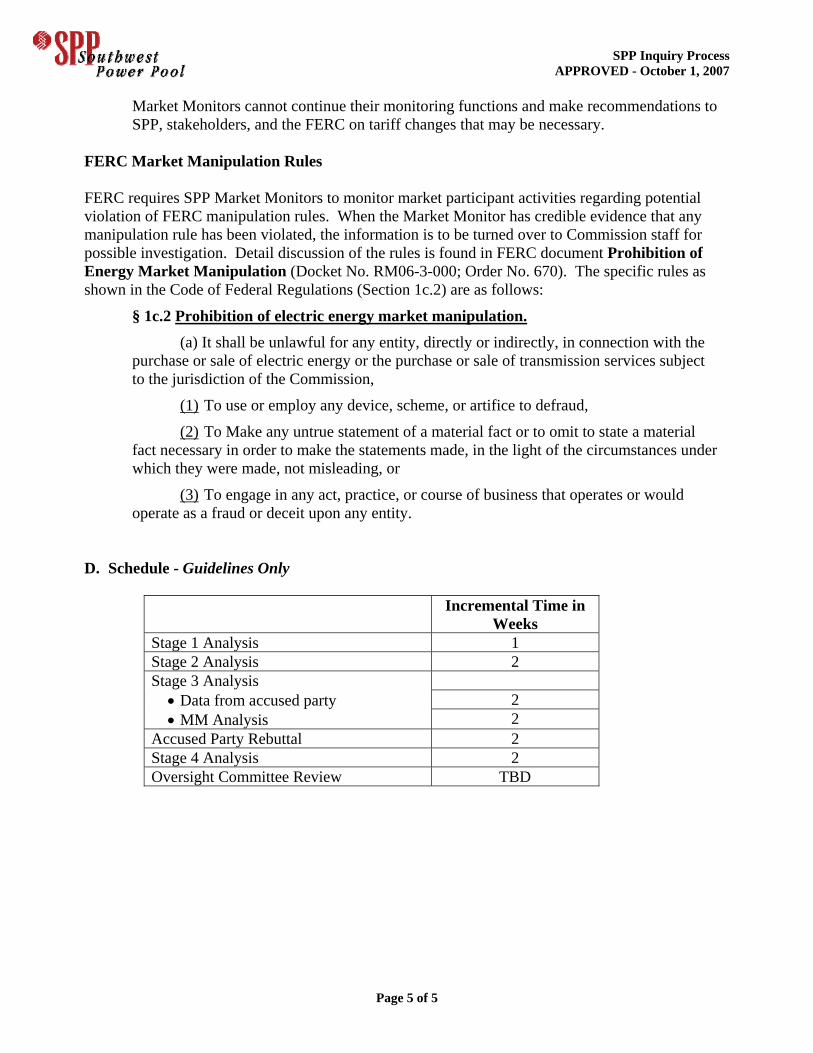
SPP Inquiry Process APPROVED - October 1, 2007
Page 5 of 5
Market Monitors cannot continue their monitoring functions and make recommendations to SPP, stakeholders, and the FERC on tariff changes that may be necessary.
FERC Market Manipulation Rules FERC requires SPP Market Monitors to monitor market participant activities regarding potential violation of FERC manipulation rules. When the Market Monitor has credible evidence that any manipulation rule has been violated, the information is to be turned over to Commission staff for possible investigation. Detail discussion of the rules is found in FERC document Prohibition of Energy Market Manipulation (Docket No. RM06-3-000; Order No. 670). The specific rules as shown in the Code of Federal Regulations (Section 1c.2) are as follows:
§ 1c.2 Prohibition of electric energy market manipulation. (a) It shall be unlawful for any entity, directly or indirectly, in connection with the
purchase or sale of electric energy or the purchase or sale of transmission services subject to the jurisdiction of the Commission,
(1) To use or employ any device, scheme, or artifice to defraud,
(2) To Make any untrue statement of a material fact or to omit to state a material fact necessary in order to make the statements made, in the light of the circumstances under which they were made, not misleading, or
(3) To engage in any act, practice, or course of business that operates or would operate as a fraud or deceit upon any entity.
D. Schedule - Guidelines Only
Incremental Time in Weeks
Stage 1 Analysis 1 Stage 2 Analysis 2
2
Stage 3 Analysis • Data from accused party • MM Analysis 2
Accused Party Rebuttal 2 Stage 4 Analysis 2 Oversight Committee Review TBD
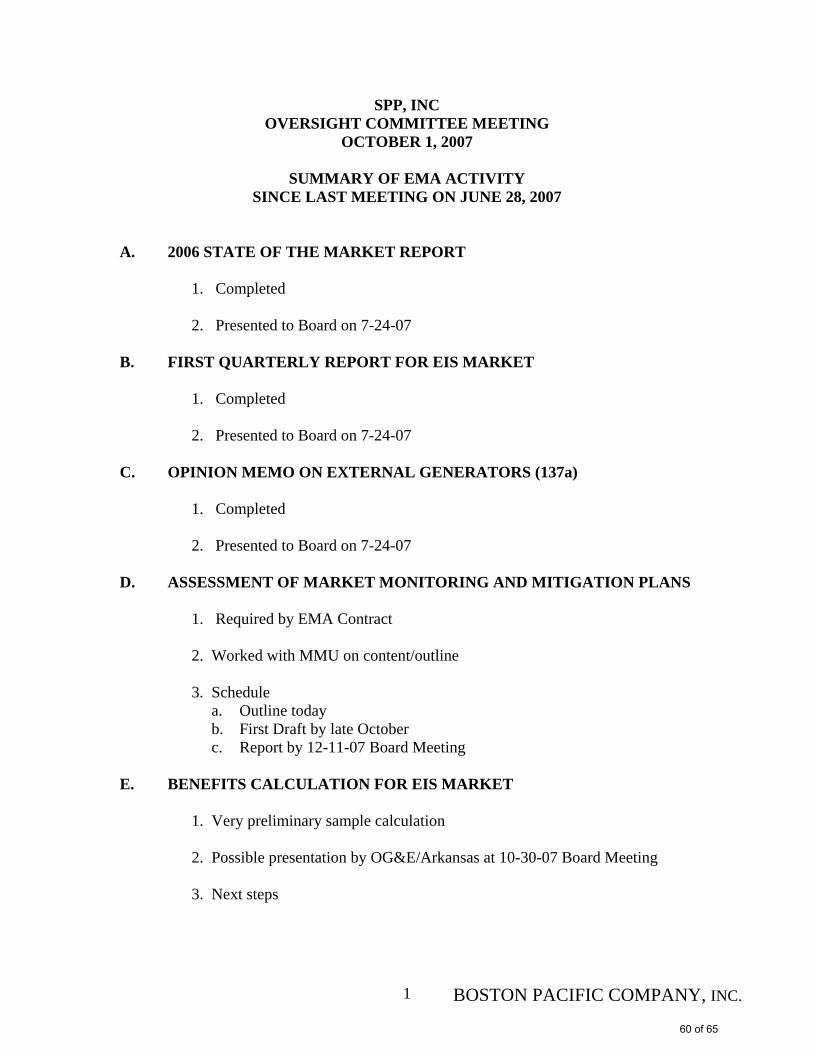
SPP, INC OVERSIGHT COMMITTEE MEETING
OCTOBER 1, 2007
SUMMARY OF EMA ACTIVITY SINCE LAST MEETING ON JUNE 28, 2007
A. 2006 STATE OF THE MARKET REPORT
1. Completed 2. Presented to Board on 7-24-07
B. FIRST QUARTERLY REPORT FOR EIS MARKET
1. Completed
2. Presented to Board on 7-24-07 C. OPINION MEMO ON EXTERNAL GENERATORS (137a) 1. Completed 2. Presented to Board on 7-24-07 D. ASSESSMENT OF MARKET MONITORING AND MITIGATION PLANS 1. Required by EMA Contract 2. Worked with MMU on content/outline 3. Schedule a. Outline today b. First Draft by late October c. Report by 12-11-07 Board Meeting E. BENEFITS CALCULATION FOR EIS MARKET 1. Very preliminary sample calculation 2. Possible presentation by OG&E/Arkansas at 10-30-07 Board Meeting 3. Next steps
BOSTON PACIFIC COMPANY, INC. 1
60 of 65
BOSTON PACIFIC COMPANY, INC. 2
F. POSSIBLE CONTINUING ROLE FOR BOSTON PACIFIC IN 2008 1. Discussion with others
2. Boston Pacific’s ideas a. Scope b. Ballpark budget
3. Feedback from Oversight Committee
61 of 65
BOSTON PACIFIC COMPANY, INC. 1
MEMORANDUM
October 1, 2007 TO: Josh Martin Phyllis Bernard Quentin Jackson Oversight Committee of the SPP Board of Directors FROM: Craig Roach SUBJECT: Proposed outline for our Assessment of SPP’s Market Mitigation
Measures and Market Monitoring Plans
OVERVIEW OF BOSTON PACIFIC’S PROPOSED REPORT
Under the External Market Advisor’s (EMA) 2007 contract, Boston Pacific is required to provide an assessment of SPP’s market monitoring plan and market power mitigation measures. The 2007 EMA contract states, “The EMA will assess the effectiveness of the Plan and Measures by asking whether stated goals are being met.”1 Boston Pacific has defined two goals for this report.
First, to assess the effectiveness of the current plan and measures, we will focus
on the results of the plan and measures. That is to say, we will examine the EIS Market to see if they have helped foster and maintain a competitive marketplace. To do so, we will analyze current metrics such as those included in the Monthly and Quarterly Reports to determine whether there is any evidence of market power abuse in SPP.
Second, we will provide an assessment of the need for additional metrics. The
MMU now has significant experience monitoring SPP’s markets around the clock. It is our understanding that, given this experience, the MMU has some preliminary thoughts on additional metrics that could enhance its ability to monitor SPP. In addition, based on our expertise and conversations with the MMU we may also propose new metrics. We will analyze each proposed metric in terms of feasibility, effectiveness, and whether additional tools or authority for the MMU is required for implementation.
We propose to provide a draft of this document in late October for review. The
final draft will be completed by the December 11, 2007 Board Meeting. Attached we provide a rough outline for discussion.
1 See Boston Pacific Services Agreement Contract Year 2007 at Exhibit B.
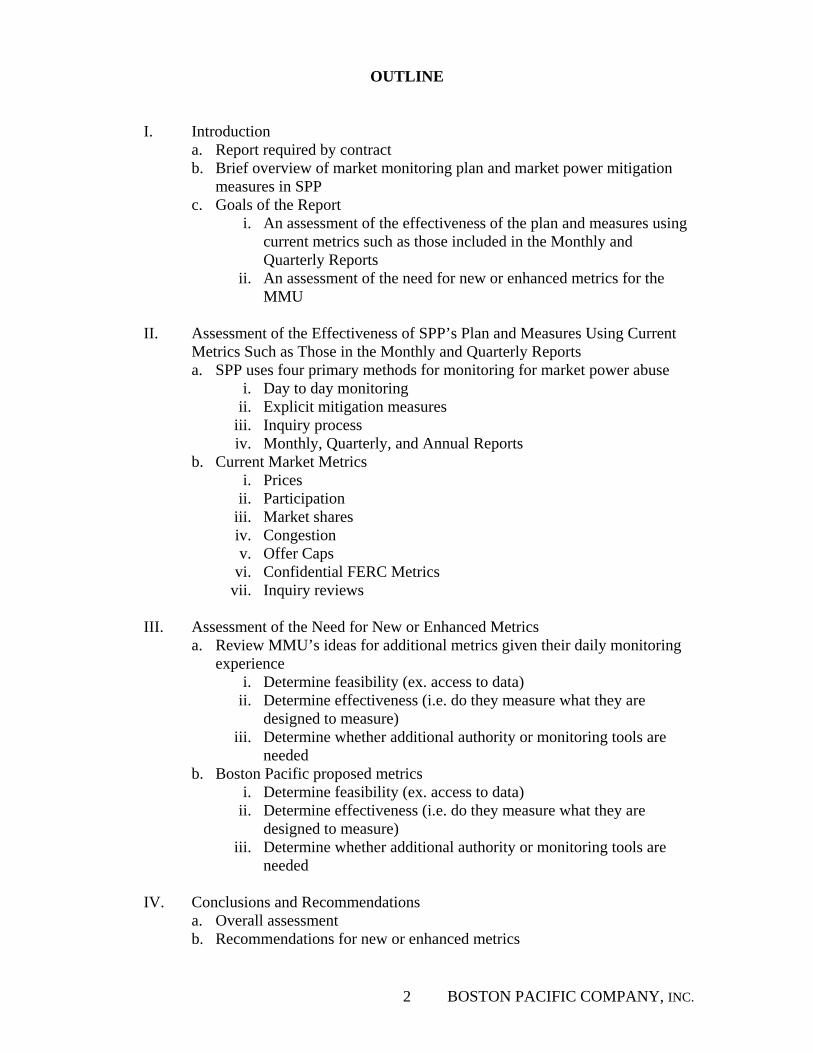
BOSTON PACIFIC COMPANY, INC. 2
OUTLINE
I. Introduction a. Report required by contract b. Brief overview of market monitoring plan and market power mitigation
measures in SPP c. Goals of the Report
i. An assessment of the effectiveness of the plan and measures using current metrics such as those included in the Monthly and Quarterly Reports
ii. An assessment of the need for new or enhanced metrics for the MMU
II. Assessment of the Effectiveness of SPP’s Plan and Measures Using Current
Metrics Such as Those in the Monthly and Quarterly Reports a. SPP uses four primary methods for monitoring for market power abuse
i. Day to day monitoring ii. Explicit mitigation measures
iii. Inquiry process iv. Monthly, Quarterly, and Annual Reports
b. Current Market Metrics i. Prices
ii. Participation iii. Market shares iv. Congestion v. Offer Caps
vi. Confidential FERC Metrics vii. Inquiry reviews
III. Assessment of the Need for New or Enhanced Metrics
a. Review MMU’s ideas for additional metrics given their daily monitoring experience
i. Determine feasibility (ex. access to data) ii. Determine effectiveness (i.e. do they measure what they are
designed to measure) iii. Determine whether additional authority or monitoring tools are
needed b. Boston Pacific proposed metrics
i. Determine feasibility (ex. access to data) ii. Determine effectiveness (i.e. do they measure what they are
designed to measure) iii. Determine whether additional authority or monitoring tools are
needed IV. Conclusions and Recommendations
a. Overall assessment b. Recommendations for new or enhanced metrics
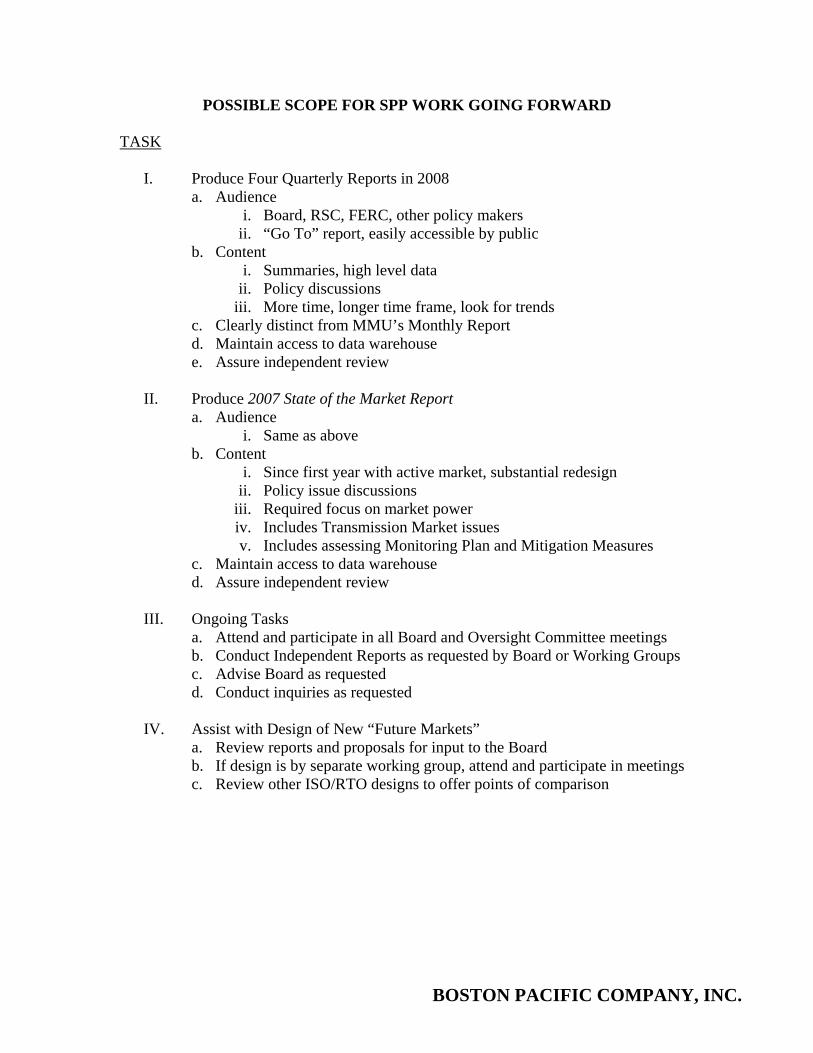
BOSTON PACIFIC COMPANY, INC.
POSSIBLE SCOPE FOR SPP WORK GOING FORWARD TASK
I. Produce Four Quarterly Reports in 2008 a. Audience
i. Board, RSC, FERC, other policy makers ii. “Go To” report, easily accessible by public
b. Content i. Summaries, high level data
ii. Policy discussions iii. More time, longer time frame, look for trends
c. Clearly distinct from MMU’s Monthly Report d. Maintain access to data warehouse e. Assure independent review
II. Produce 2007 State of the Market Report
a. Audience i. Same as above
b. Content i. Since first year with active market, substantial redesign
ii. Policy issue discussions iii. Required focus on market power iv. Includes Transmission Market issues v. Includes assessing Monitoring Plan and Mitigation Measures
c. Maintain access to data warehouse d. Assure independent review
III. Ongoing Tasks
a. Attend and participate in all Board and Oversight Committee meetings b. Conduct Independent Reports as requested by Board or Working Groups c. Advise Board as requested d. Conduct inquiries as requested
IV. Assist with Design of New “Future Markets”
a. Review reports and proposals for input to the Board b. If design is by separate working group, attend and participate in meetings c. Review other ISO/RTO designs to offer points of comparison
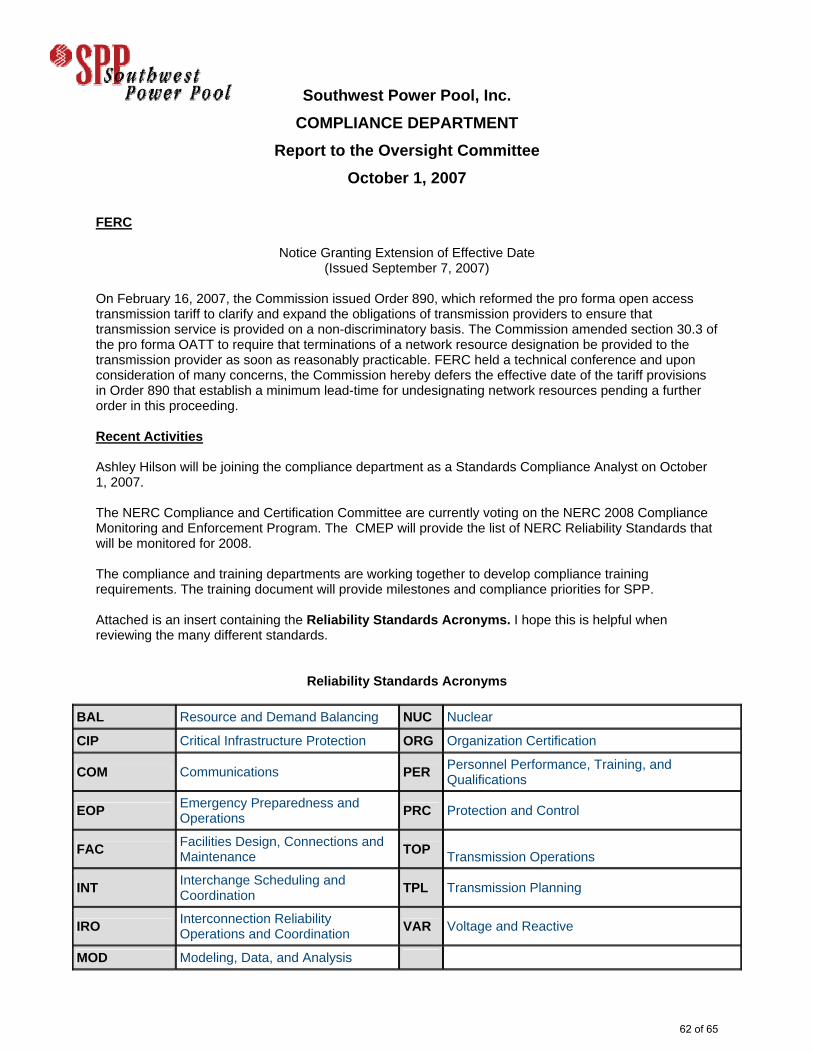
Southwest Power Pool, Inc. COMPLIANCE DEPARTMENT
Report to the Oversight Committee October 1, 2007
FERC
Notice Granting Extension of Effective Date (Issued September 7, 2007)
On February 16, 2007, the Commission issued Order 890, which reformed the pro forma open access transmission tariff to clarify and expand the obligations of transmission providers to ensure that transmission service is provided on a non-discriminatory basis. The Commission amended section 30.3 of the pro forma OATT to require that terminations of a network resource designation be provided to the transmission provider as soon as reasonably practicable. FERC held a technical conference and upon consideration of many concerns, the Commission hereby defers the effective date of the tariff provisions in Order 890 that establish a minimum lead-time for undesignating network resources pending a further order in this proceeding. Recent Activities Ashley Hilson will be joining the compliance department as a Standards Compliance Analyst on October 1, 2007. The NERC Compliance and Certification Committee are currently voting on the NERC 2008 Compliance Monitoring and Enforcement Program. The CMEP will provide the list of NERC Reliability Standards that will be monitored for 2008. The compliance and training departments are working together to develop compliance training requirements. The training document will provide milestones and compliance priorities for SPP. Attached is an insert containing the Reliability Standards Acronyms. I hope this is helpful when reviewing the many different standards.
Reliability Standards Acronyms
BAL Resource and Demand Balancing NUC Nuclear
CIP Critical Infrastructure Protection ORG Organization Certification
COM Communications PER Personnel Performance, Training, and Qualifications
EOP Emergency Preparedness and Operations
PRC Protection and Control
FAC Facilities Design, Connections and Maintenance
TOP Transmission Operations
INT Interchange Scheduling and Coordination
TPL Transmission Planning
IRO Interconnection Reliability Operations and Coordination
VAR Voltage and Reactive
MOD Modeling, Data, and Analysis
62 of 65
Compliance The compliance department continues to work through the gap analysis for Order 890. We are waiting on NAESB to develop standards pertaining to many of the OASIS requirements. The NAESB standards are expected in January 2008. Audits SPP Reliability Coordination has a compliance audit scheduled for October 29th - 31st of 2007. This audit will be lead by NERC. The ICT has a SERC compliance audit tentatively scheduled for the first week of November 2008. Future Activities SPP Compliance Workshop in Tulsa, OK on October 10–11. Provide assistance to members and registered entities regarding compliance. Participate in national forums NERC Compliance and Certification Committee OATI webCompliance Software being implemented for compliance tracking, monitoring, and standards updates. Work in conjunction with Center of Excellence Respectfully submitted by: David H. Hodges Standards Compliance Manager September 21, 2007
63 of 65