Milk and Food Technology
64
Journal of MAY 1975 Vol. 38, No.5 Pages 253-312 JMFTA 38(5) :253-312 (1975) Milk and Food Technology 62nd ANNUAL MEETING ROYAL YORK HOTEL AUGUST 10-14, 1975 TORONTO 1, ONTARIO, CANADA Official Publication
-
Upload
khangminh22 -
Category
Documents
-
view
0 -
download
0
Transcript of Milk and Food Technology
Journal of
MAY 1975
Vol. 38, No.5
Pages 253-312
JMFTA 38(5) :253-312 (1975)
Milk and Food Technology
62nd ANNUAL MEETING
ROYAL YORK HOTEL
AUGUST 10-14, 1975
TORONTO 1, ONTARIO, CANADA
Official
Publication

When you join a clean-up crew, you learn a lot about soil. And how to get rid of it! Which is why we like to pull on our whites, yank on a pair of boots and pitch-in with your clean-up crew. After al l, that's the number one way to get a line on your san itation requirements and problems .
Call it the Klenzade san itation checkup. Better yet, call it the first step in greater sanitation effic iency and economy. Because our close-up look can lead directly to Standardized Cleaning Procedures for all operations . And that can pay off big in quality protection and reduced costs. Ask us to take that first step. You'll be surprised at all the ways Klenzade can help. Just call or write Glenn Weavers . Director of Sales.
Clean or rinse at 700 psi with Klenzade Porta-Washer. Portable unit goes wherever high pressure cleaning is needed. Puts extra effrcrency on the processing line. Delrvers 3 gpm at temperatures to 180° F. Has selector valve for cleaning or rinsing.
KLENZAOE PRODUCTS OIVISION,Dept. 287• ECONOMICS LABORATORY INC . Osborn Bu1ldrng, St. Paul, Minnesota 55!02 • 6!2 / 224·4678 '
• , , ;. I
,
•
•
I
·' l
' •
'
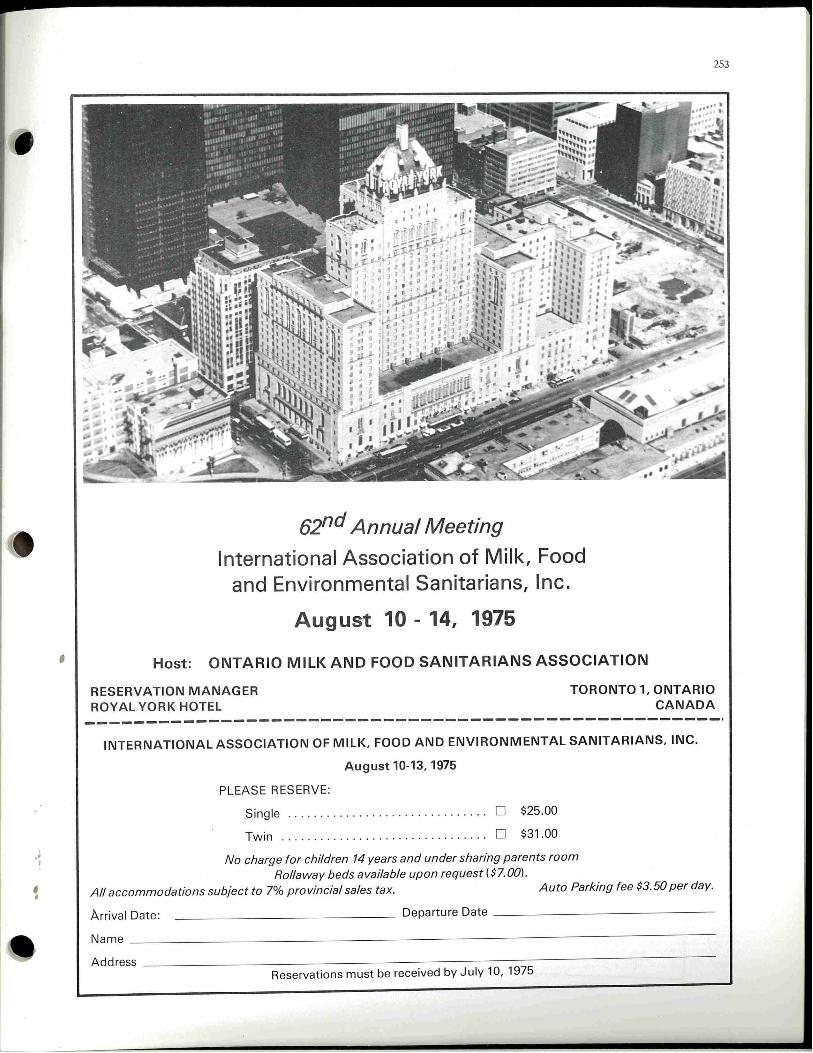
62nd Annual Meeting
International Association of Milk, Food and Environmental Sanitarians, Inc.
August 10 - 14, 1975
Host: ONTARIO MILK AND FOOD SANITARIANS ASSOCIATION
RESERVATION MANAGER ROYAL YORK HOTEL
TORONTO 1, ONTARIO CANADA
253
---------------------------------------------------· INTERNATIONAL ASSOCIATION OF MILK, FOOD AND ENVIRONMENTAL SANITARIANS, INC.
August 10-13,1975
PLEASE RESERVE:
Single . . . . . . . . . . . . . . . . . . . . . . . . . . . . . . . 0 $25 .00
Twin . . . . . . . . . . . . . . . . . . . . . . . . . . . . . . . . 0 $31.00
No charge for children 74 years and under sharing parents room Rollaway beds ava1Jable upon request ($7.00).
All accommodations subject to 7% provincial sales tax. Auto Parking fee $3.50 per day .
Arrival Date: Departure Date _______________ _
Name ___________________________________________________________________________ __
Address __________________________________________________________________________ _
Reservations must be received by July 10, 1975

254
43 million Americans are learning something about you in these NSF messages -
Here are two of three NSF messages scheduled for the Reader's Digest in 1975. They are giving millions of educated adult Americans a quick insight into some of the things we do and you do to protect the public health by means of standards .
Trusted lifeguard at a million
swimming pools
Water purity in family swimming
pools is safeguarded by filters that arc made to NSF standards, tested
in the NSF laboratory and identi·
lied with the NSF seal , shown below . Thousands of othet· products that
affect family health and environ·
mental safety are marked with the NSF seal. Among them arc rcstau·
null food service euipment, plastic
piping systems, refuse hags and icc machines as well as sanitation equip· ment for mobile home, boats and
reueational vehicles. Public health officials rely on the
NSF seal. You can too.
NATIONAL SANITATION FOUNDATION
Ann Arbor, Mich. 48105 Standards for consumer health and environmental
safety. •
The NSF seal is appearing on more and more products , and the repeated presence of the seal in the nation 's greatest magazine is an important step towards consumer recognition.
Why Americans trust their
eating places
U .S. restaurants are among the cleanest in the world because own.
crs care abotll sanitation and public health authorities insist upon it.
Roth specify kitchen and food sel"V·
icc equipment which bears the NSF
-~cal as evidence that it has been
tested in the NSF laboratory against
NSF sanitation standards. More
than 600 food equipment manufacturers voluntarily participate in the
NSF seal program to protect the
foo~ that is served to you and your lamlly.
Do what health officials do. Look for blue and silver NSF seals on
food service equipment when you
cat out. They are visible at thou· sands of <Juick service counters .
NATIONAL SANITATION FOUNDATION
Ann Arbor, Mich. 48105 Standards for consumer
health and environmental safety. • .
,

' ~
'
OFFICERS AND EXECUTIVE BOARD President, P. J . SKULBORSTA D, 2100
South York Rd ., Oakbrook, Ill. 60521 .
President-Elect, HAROLD E. THOMPSON, Jr ., Milk Sanitation Section, Food and Drug Admin., 200 C. St ., S.W., Wash. , D.C. 20204. .
First Vice-President, HENRY V. ATH EA-TON, Dairy Bid ., Univ. of Vermont, Burlington, Vt. 05401 .
Second Vice-President, DAV ID FRY, P.O. Box 2113, Orlando, Fla., 32802.
Secretary - Treasurer, RICHARD P. MARCH, 118 Stocking Hall, Cornell Un iv., Ithaca, N. Y. 14850.
Junior Past-President, EARL 0 . WR IGHT, P.O. Box 701 , Ames, Ia . 50010 .
Senior Past-President, WALTER F. WILSON, County Los Angeles Hea lth.Dept., 313 N. F1gueroa St ., Los Angeles, Ca. 90012.
Editors
DR. ELMER H. MARTH, Editor, Dept. of Food Science, University of Wisconsin , Madison, Wis. 53706.
EARL 0 . WRIGHT, Executive Secretary and Managing Editor, Box 701 , Ames, Ia. 50010.
Editorial Board
H. S. ADAMS-------------- Indianapolis , Ind. J. A. ALFORD -----------------Beltsville Md. E. F. BAER ----------------Washington,' D.C . F. W. BARBER ------------------Glenview, Ill. F. L. BRYAN ----------------------Atlanta , Ga. W. J . DYER ----------------------Hal ifax, N.S. J. C. FLAKE---------------Washington, D.C . S. E. GILLILAND--------------- Raleigh, N.C. H. S . GRONINGER ----------Seattle , Wash . L. G. HARMON ---------East Lansing , Mich . N. F. INSALATA --------White Plains, N.Y. C. K. JOHNS --------------------Ottawa, Ont. H. KOREN-------------------Te rre Haute, Ind . R. V. LECHOWICH---------Biacksburg, Va. R. T. MARSHALL------------Columbia, Mo . S . A. MATZ ----------------------Villa Park Ill. E. M. MIKOLAJCIK--------Columbus, Ohio J. C. OLSON , Jr. --------Washington, D.C . R. L. OLSON--------------------Albany, Calif. Z. J. ORDAL ----------------------- Urbana , Ill . J . W. PENCE--------------------Albany, Calif. H. J. PEPPLER -------------Milwaukee, Wis. H. PIVNICK ----------------------Ottawa, Ont . D. S. POSTLE --------------------Ithaca, N.Y . W. D. POWR IE-------------Vancouver, B.C . R. B. READ , Jr. ----------Washington, D.C . G. W. REINBOLD -------------Denver, Colo . G. H. RICHARDSON ----------- Logan, Utah R. L. SAFFLE ---------------------Athens, Ga. W . E. SAN DINE -----------Corvallis, Oregon F. M. SAWYER -------------Amherst, Mass. D. F. SPLITTSTOESSER ----Geneva , N.Y . C. E. SWIFT----------------- Philadelphia, Pa . B. A. TWIGG --------------College Park, Md . C. VANDERZANT--College Station , Texas H. W. WALKER ------------ ---------Ames, Ia . H. B. WARREN------------ Kansas City, Mo. K. G. WECKEL ----------------Madison, Wis. J. C. WHITE ---------------------- Ithaca , N.Y. H. WISTREICH --- - - --------~-----Chicago, Ill. E. R. WOLFORD -----------Puyallup, Wash. E. A. ZOTTOLA --------------St. Paul, Minn .
Journal of
Milk and Food Technology
INCLUDING MILK AND FOOD SANITATION
Official Publication ,
255
Intern ational Association of Milk , Food and Environmental Sanitarians, Inc., Reg. U.S. Pat. Off.
Vol. 38 May 1975 No.5
Research Papers
Histamine and Tyramine Content of Meat Products
S. Rice, R. R. Eitenmiller, and P. E. Koehler--------------------------------256
Growth of Salmonella heidelberg at Room Temperature in Irradiated and
Nonirradiated Potato Chip Dip Marleen M. Wekell and Charlene S. Martinsen------------------------------259
A Research Note-Evaluation of an Automatic Gram-Staining Machine
Daniel Y. C. Fung -------------------------------------------------------------------262
A Comparison of Phosphate Buffered and Distilled Water Dilution Blanks for
the Standard Plate Count of Raw-Milk Bacteria
C. N. Huhtanen, A . R. Brazis, W. L. Arledge, C. B. Donnelly,
R. E. Ginn, H. E. Randolph, and E. J. Koch----------------------------------264
Starters and Bacteriophages in Lactic Acid Casein Manufacture. I. Mixed
Strain Starters T. D. Thomas and R. J. Lowrie --------------------------------------------------269
Starters and Bacteriophages in Lactic Acid Casein Manufacture. II. Develop
ment of a Controlled Starter System T . D. Thomas and R. J. Lowrie --------------------------------------------------275
A Research Note-Productivity of Boiled and Autoclaved Violet Red Bile Agar
Jane P. Jensen and W. J. Hausler, Jr. -----------------------------------------279
Characterization of Waste Loads from Unit Processes of a Commercial Potato
Canning Operation Wayne A. Bough---------------------------------------------------------------------281
General Interest
Exposure of Man to Mercury. A Review . I. Environmental Contamination and
Biochemical Relationships A. G. Hugunin and R. L. Bradley, Jr. ------------------------------------------285
Report of the Committee on Food Equipment Sanitary Standards, 1973-1974 --301
PROGRAM-Sixty-Second Annual Meeting of The International Association
of Milk, Food and Environmental Sanitarians, Inc. -------------------------------304
As so cia tio n Affairs ------------------------------------------------------------------------------309
News and Events --------------------------------------------------------------------------------312
Index to Advertisers ---------------------------------------------------------------------------312
C I assified Ad--------------------------------------------------------------------------------------312
1 yr. Vol. 38, 1975---------------------------$16.00 Publi c and Education Institution
Libraries 1 yr. ---------------------------------$16.00 Single Copies----------------------------------------$ 1.50
Manuscripts : Correspondence rega rding manuscripts and other reading material should be addressed to Dr . Elmer H. Marth, Dept . of Food ~~~'b~~e, University of Wisconsin, Madison, Wis.
Orders for Reprints: All orders for reprints should
" Instruction to Contributors" can be obtained be sent to the executive office of the Association,
The Journal of M ilk and Food Technology is from the editor for the use of contributors of P.O. Box 701, Ames, Ia. 50010.
issued monthly beginning with the January papers . Mem be rship d ues: Membership in the lnterna-
number. Ea ch volume comprises 12 numbers. tional Associat ion of Milk, Food and Environmen~al
Published by the International Association of Milk , Page Charge: Effective January 1, 1969 a charge Sanitarians, Inc., is $14.00 per _year, and Spec1al
Food and Environmental Sanitarians, Inc. with of $25.00 per printed page will be made for all Certified Student membership !S $5.00 per year,
executive offices of the Association , 413 Kellogg research papers which are published. See Volume which includes annual subscnptlon to the J ournal
0 0 50 31, issues 10, 11, or 12 for details. of Mi lk and Food Techn ology. All Correspond-
Ave., P .. Box 7 1, Ames, Ia. 010. Printed by ence regardinp mem~ership,_ remitla!'ces for du~s.
Huess Printing and Signs, Inc. , 204 N. Oak, Ames, Business Matters: Correspondence regarding fa ilure to receive copies (notice of fa1lure to rece1ve
Iowa 50010. business matters, advBrtising, subscriptions, orders copies must be reported within 90 days, otherwise
2nd Class postage paid at Ames, Ia. 50010. for sinple copies, etc., should be addressea to Earl single copy rate Will apply) of the J ournal. changes
Editorial Offices: Dr. Elmer H . Marth, Dept. of 0. Wnght (address above). in address and other such matters should be
Food Science, University of Wisconsin , Madison, Subscription Rates : One volume per year addressed to th0e WEx<!chutivpe 05 eBcret'!,'61 ~m~se
individual non-members. Government and Com- A ssociation, Ea rl - ng t, · · ox • •
Wis. 52706. Earl 0 . Wright, P.O. Box 701 , Ames, mercial Organizations subscription. Ia. 50010.
Ia . 50010. Copyright © 1975, International Association of Milk, Food, and Environmental Sanitarians, Inc.
' 256
J. Milk Food Techno/. Vol. 38, No. 4, Pages 256-258 (May. 1975) Copyright © 1975, International Association of Milk, Food, and Environmental Sanitarians
Histamine and Tyramine Content of Meat Products S. RICE, R. R. EITENMILLER, and P. E. KOEHLER
Department of Food Science University of Georgia, Athens, Georgia 30602
(Received for publication September 19, 1974)
ABSTRACT
A survey was conducted to determine the histamine a nd tyramine contents of a variety of meat products. Histamine was found in all products at concentrations only slightly greater than one would expect from normal physiological amounts found in muscle. Semi-dry sausage products contained an average histamine concentration of 3.59 1-'g/ g compared to an average of 2.87 1-'g/ g in dry sausages. Country-cured hams averaged 1.691-'g histamine/ g. Emulsion type products contained slightly less histamine than the fermented sausages . Braunschweiger, an exception, contained 3.6 1-1g histamine/ g but would be expected to contain more histamine than other emu lsion-type products because of its liver content. Data indicate that histamine is not formed to an appreciable extent in these meat products under normal processing conditions.
Detectable amounts of tyramine were found in 71 % of the sausages and in 39% of semi-dry sausages. Tyramine was not detected in country-cured . ham. Average tyramine concentrations were 244 and 85.8 1-'g/ g in the dry and semi-dry sausages, respective ly. The greatest tyramine concentration found in this study was 1237 j.lg/ g in a Genoa salami. It is apparent that sufficient tyramine can occur in ripened sausages to be troublesome to tyramine-susceptible individuals.
Recent outbreaks of histamine food poisoning from consumption of commercially canned tuna fish (1) have again demonstrated the public health implications of biologically active amine formation in food . Build-up of amines such as histamine and tyramine with physiological activity is primarily due to microbial amino acid decarboxylation. Small amounts of histamine are normally found in a variety of food products including sauerkraut (12), wine (I 3), and cheese (3, 7. 16, 17, 18, 20). Although the toxicity of histamine to man is a controversial subject, ingestion of from 70-1000 mg histamine will usually cause clinical symptoms of intoxication (9). The small amounts normally found in lactic fermented or aged products are harmless to man, but problems arise when large numbers of histidine decarboxylating bacteria are present, which through improper handling or processing, are given the opportunity to produce appreciable amounts of histidine decarboxylase in the product. The probability of large amounts of histamine being formed in a food is greatly increased if much free histidine is present. This is particularly true for fish of the suborder Scombroidei (including tuna fish) that characteristically contain much free histidine (I 1).
Tyramine formation in foods has been extensively studied because of its relationship to illnesses noted in patients treated with monoamine oxidase (MAO) inhibitors which block the pathway for catabolism and
inactivation of the amine after ingestion (2) . Cheese has been reported to contain tyramine at concentrations up to 3. 7 mg/ g (5) and was the food initially associated with hypertensive disturbances noted in patients undergoing treatment with monoamine oxidase inhibitors (2. 3). Quantitative studies have shown tyramine to be present at variab le concentrations in cheese (I 4, 20), wine (13), salted fish (14) , meat extracts (14), and yeast extracts (4. 14).
Although little quantitative information is available concerning histamine and tyramine content of meat products , fermented sausage products have been shown to have potential for histamine development. Henry (9) reported that dry sausages should contain only 1 to 2 JAg histamine/ g based upon physiological muscle histamine levels , but sausages contaminated by undesirable microorganisms may easily reach histamine concentrations of 100 11gl g or greater during the early stages of the fermentation. Recently Dierick eta!. (6) reported that the concentration of histamine and tyramine increased at least tenfold in experimental dry sausages with the rate of tyramine increase being maximal during the first 3 days of ripening.
Since there appears to be little information available on biologically active amine content of most meat products , the following study was completed to provide data on the presence of histamine and tyramine in a variety of meat products. Particular emphasis has been placed on obtaining data on dry and semi-dry sausages and on country-cured ham since amine build-up generally occurs in products undergoing lactic fermentation or long term aging.
MATERIALS AND METHODS
Source of meat products
All meat samples were purchased from retail stores except for a limited number of country-cured hams that were obtained directly from the processor. All sa mples were stored at - 30 C until assayed . In mos t 1nsta nces, hi stamine a nd tyramine analyses we re done on adjacent
portions of the same ham. Histamine and tyramine analyses of sausages were not always from the same sausage sample.
Tyramine ex traction
Tyramine was extracted from sausage and ham samples using a mod ifica tion of the method of Lovenburg and Engelman (1 0) . Forty gra ms of the meat prod uct we1·e homogenized for 5 min with 80.0 ml of 0.1 N HCI in one pint Mason jars using a Son•all Omni-Mi xer homoge nizer. The homogenate was then centrifuged at 4 c at 12.1 00 x g for 20 min . the fat layer was scraped off a nd the aqu eous ph ase was transferred to a 125-ml Erl enmeyer nask and shaken for 10
, ' ,. '
'
•

' · ~
' -
AMINES IN MEAT PRODUCTS 2S7
min with IS ml of n-heptane using a w:·ist action shaker. The mixture
was transferred to a SO ml centrifuge tube and centrifuged for 10 min at
12,000 x g. Twe nty milliliters of the aqueous phase were adj usted to pH
lO with solid Na2C0 3• The liquid was then saturated with NaC I (about
S g), l 5.0 ml of n-buta nolwere added , and the mixture was shaken fo r
lO min using a wrist action shaker. After centrifuging for 20 min at
12 ,100 x g, the butanol laye r was decanted and used fo r amine
quanti tation.
Tyramine quantitation
Glass plates we re coated with a 250-1' layer of silica gel
(MN-Kieselge l G-HR 89, Brinkman Instruments , Westbury, New
York) . The layer was applied as a sl urry cons isting of 35 g of silica gel
suspend ed in 70 ml of distilled water. Plates were dried for 2 h in a n
oven at 100 C and stored in a desiccator un til used. Plates were
reactivated a t 100 C for 20 min immediately before use. The amine
ex tracts (50 1'1) were applied 2 em from the base of plates with
quantitative capil lary pipets . The solvent system used consisted of
CH3Cl :CH 30 H:N H40 H (1 2:4 :1) .
Afte r development, plates were a ir dried at 37 C for 24 h , sprayed
with a 0.4 % 7-chloro-4-nitrobenzofuraz• n (NBD-CI) methanol
solu t ion, and held for 24 h at 2S C (19). The fluorescent amine spots
were scraped from the plates and e luted from the silica gel with 3.0 ml
of ethyl acetate. The silica gel-ethyl acetate mixtu re was agitated on a
Gen ie Votiex mixer for four 30-sec intervals over a 10-min period and
centrifuged fo r IS min at 5000 x g to remove the suspended silica gel.
Fluorescent measurements were determined on a T urner Model 430
Spectrofluorometer with an exc itation wavelength of 464 nm and
emission wavelength of 520 nm (8) . These wavelengths gave the
max im um sens itivity for the tyram ine-N ED derivative. Amine contents
were determ ined from the fluorescence of standards spotted on each
plate , and the percent recovery (73 ± 9%) of the ex traction method
determined by extracting va rious samples of sausages containing
known amounts of tyra mine. Duplicate meat samples were extracted
and quantitated.
Histamine analysis
Histam ine was determined by the method of Shore (15) . Five grams
of the meat product were homogen ized in 4S ml of0.4 N perchloric ac id
using a Sorva ll homogen izer. T he homogenate was allowed to stand at
room temperature fo r severa l minu tes and then centrifuged. A 2-ml
a liquot of the supem atant fluid was transferred to a centrifuge tube
containi'lg 5 ml ofn-butanol, 0.2S ml 5 N NaOH, and 0.7S g NaCI. T he
tube was shake n for 5 min and centrifuged. To remove any free
1 histidine, the butanol layer was transferred to a second tube containing
2.5 ml of NaC l -saturated 0.1 N NaOH, shaken for 1 min, and
centrifu ged. A 4-ml aliquot of the washed butanol extract was
transferred to a thi rd tube contain ing 2.5 ml ofO .l N HCI and 7.S ml of
n-heptane. The tube was shaken for 1 min, centrifuged , and the organ ic
phase removed by asp ira tion.
To 2 ml of the acid phase conta ining histamine was added 0.4 ml of 1
N NaOH followed by 0. 1 ml of o-ph thalaldehyde (OPT) (10 mg/ ml in
methanol). After 4 min at room temperature, 0.2 ml of 3 N HC1 was
added. T he contents of the reaction tube were mixed using a Genie
Vortex mixer following each addition.
The fluorescence at 450 nm resulting from activation at 360 nm was
measured on a Tumer Model 430 Spectrofluorometer. Histamine
concentrat ion was determ ined from a standard curve based on varyious
concentrations of free hi stan;ine wh ich we re carried through the
ex tract ion procedure and OPT reaction. Reagent blanks were run to
correct any native flu orescence.
RESULTS AND DISCUSSION
Table shows the histamine contents of the meat
products examined in this study. The highest histamine
concentration was 7.81 11gl g found in a dry salami . The
range in amount of his ta mine in all dry sausage sam ples
was 0.74 - 7.81 11g! g. Semi-dry sausages ranged from
TABLE I. Histamine Content of Various M eat Products
Histamine ij.og/ g)
Product Range Average
Fermented or aged products Dry sausage (ll)a 0.74-7.81 2.87
Semi-dry sausage (11) 1.80-S.47 3.S9
Country-cured ham (27) 0 .82-2.66 1.69
Fresh and cooked products Fresh ham ( 3) 0.74-0.76 0 .7S
Cooked ham ( 1) o.ss o.ss Braunschweiger (10) l.S2-4 .69 3.60
Bologna (10) 0.82-3.36 1.89
Weiners (10) 0.66-3.63 1.7S
Ground beef (10 1.41-3.66 2.70
aNum ber of samples examined .
1.80-5.47 11g histamine/ g and averaged slightly higher
than the dry sausages (3.59 11gl g for semi-dry compared
to 2.87 11gl g for the dry). Country-cured ham samples
contained less histamine than the fermented sausage
products. The greatest histamine concentration found in
the country-cured hams was 2.66 11gl g and the average amount was 1.69J1gl g.
Three fresh ham samples and one fresh cooked ham
were included in the study for comparison with the
processed meat products. Histamine content of the fresh
hams average 0.75 Jlgl g and the cooked ham contained
0 .55 J-Ig / g. These values agree well with published muscle
histamine concentrations of 0 .2-0.6 11glg (9). Of the
cooked , emulsion-type products , Braunschweigher
contained higher histamine concentrations than did
bologna or weiners. The average histamine concentration
of Braunschweigher was 3.60 11gl g compared to an
average of 1.89 11gl g and 1.75 11gl g ~ bologna and
weiners, respectively . The Braunschweiger would be
expected to have slightly more histamine than other
emulsion products because liver has a higher phy
siological histamine concentration than muscle {1-30
11gl g) (9) . Ground beef histamine concentrations ranged
from 1.41 - 3.66 11gl g and averaged 2.7 11glg.
The data just discussed indicate that histamine
concentations in fermented or aged meat products and ·in
cooked emulsion type products a re only slightly greater
than one would expect from amounts in normal
physiologica l tissue. The amounts of histamine found in
commercial meat samples are lower then values
(approximately 60 11gl g dry matter) reported by Dierick
et a!. (6) in experimental dry sausages after a 36-day
ripening period. Since ingestion of relatively large
amounts (70 - 1000 mg) of histamine is required to
produce moderate intoxication symptoms (9), the
histamine present in products surveyed in this study
hea rs no significance from a toxicity viewpoint.
Furthermore, the absence of large amounts of histamine
in any of the products examined seems to indicate that
extensive histamine formation in red meat products
would occur only through gross product mishandling.
T he tyramine contents of Qry and semi-dry sausages
and country-cured hams are given in Table 2. Tyramine
was found in 59.4 o/o (22 tyramine positive of 37 sausages

258 RICE, EITENMILLER. AND KOEHLER
TABLE 2. Tyramine Contents of Various Sausage Products and
Country-Cured Hams
Product
Country cured ham (18)a
Salami ( 7) Thuringer cervelat ( 2) Lebanon bologna ( 4)
Dry sausage Hard sa lami (11
Pepperoni ( 5)
Summer sausage ( 1) Farmer salami ( 1)
Genoa salami ( 5) Smoked landjaeger ( 1)
aN umber of samples examined. bND =Not detectable at levels below 10 11g/ g. cNumber of positive samples .
Tyramine ls<g i gl
Range Average
Nob
ND- 56 8 (l)c
ND-162 ND-333 224.5(3)
ND-392 210 (9)
ND-195 39 (1)
184 184 314 314
ND-1237 534 (4) 396 396
examined) of the dry and semi-dry sausages. Tyramine was not detected in any of the country-cured hams. Detectable amounts of tyramine were found in 70.9% of the dry sausages and in 38.5% of the semi-dry sausages . The average tyramine concentration of the dry sausages was 244 11glg and 85.8 11gl g in the semi-dry sausages. The highest tyramine concentration (1237 11gl g) was present in a Genoa salami. There are several factors that could contribute to the wide range in amountof tyramine found in fermented sausages. The most important factors are the numbers of organisms present that can decarboxylate tyrosine, and the availability of free tyrosine. Dierick et al. (6) showed that there is generally an increase in free amino acids during sausage ripening. Variations in sausage processing may also account for differences in tyramine levels . Those processes that provide optimum conditions and sufficient time for growth of tyramine-forming organisms will cause production of more tyramine than when sausages are, for example, cooked immediately after the desired pH is attained.
The greater tyramine contents noted in dry sausages compared to semi-dry sausages could, except in those instances where the amount of tyramine was unusually high, resu lt from differences in moisture content. Longer ripening times for dry sausage may also contribute to greater amounts of tyramine. The tyramine values reported here for ripened sausage products correspond closely to amounts of tyramine reported for other food s. For example, Voigt et al. (20) found average tyramine contents of0.27 mg/ g, 0.21 mg/ g and 0.24 mg/ g in extrasharp, sharp, and medium Cheddar cheeses , respectively. Sen (14) reported tyramine concentrations from 5 11gl g to 2,170 J.Lg l g in variety of cheeses. Sen (14) also found tyramine in amounts from 95 11gl g to 304 J.Lg l g in mea t extracts but only negligible amounts in various alcoholic beverages.
Judging from results of this survey, histamine is not
formed extensively in processed meat products and potentially dangerous amounts are unlikely to occur. When one considers that Blackwell and Mabbitt (3) reported 0.5 mg tyramine/ g in cheese to be a dang~rous amount and 25 mg total tyramine intake to be a dangerous dose for patients receiving MAO inhibitors, dry sausages containing the higher tyramine concentrations would provide sufficient tyramine in moderate servings to produce pressor responses in tyramine susceptible individwils.
REFERENCES
l. Anonymous. 1973. Follow-up on scombroid fi sh poisoning in canned tuna fish. United States , CDC Morbidity and Mortality W eekly Report 22:78.
2. Asatoor , A.M. , A . J. Levi , and M. D . Milne. 1963. Tranylcypro
mine and cheese. Lancet ii: 733· 734.
3 . Blackwell, B. , and L. A. Mabbitt. 1965. T yramine in cheese related to hypertensive crises a fter monoamine oxidase inhibition . Lancet i:938-940.
4 . Blackwell , B., L.A. Mabbitt , and E . Ma rley. 1969. Histamine a nd
tyramine content of yeast products . J. Food Sci. 34 :47-51. 1 5. Bullock , D. H. , and 0 . R. Irvine. 1956 . A chromatogra phic study
of Chedd ar cheese ripening. J. Dairy Sci . 39:1229-1235. 6 . Dierick, N ., P. Va ndekerckhove, a nd D . Demeyer. 1974. Cha nges
in nonprotein nitrogen compounds during dry sausage ripening. J. Food Sci. 39:301-304.
7. Doeglas , H . M.G ., J. Huisman , a nd J.P. Nater. 1967. Histamine intoxication after cheese. Lancet ii:1361-1362.
8 . Ghosh , P. B. and M . W. Whitehouse . 1968. 7-Chloro-4-nitrobe nzo-2-oxa -1 ,3-diazole: A new tluorigenic reagent for amino
acids and other amines . Bioche m. J. 108 :1 55-1 56. 9 . Henry, M . 1960. Dosage b iologique de !' hista mine d a ns les ail
ments. Ann . Fa ls. Exp . Chim. 53:24-33. 10. Lovenburg , W ., a nd K. E ngelma n . 1971. Assay of serotonin re
la ted metabolites , a nd enzymes . pp . 1-24 . In D. Glick (ed .) Meth
ods of biochemica l analys is. Vol. Suppleme ntal. Intersc ience Publisher. New York.
I J. Lukton , A. , and H. S . Olcott . 1958. Content of free imid azole compounds in the muscle t issue of aquatic an ima ls. Food Res. 23:611 -6 18 .
12 . Mayer, K. , and G . Pa use. 1972 . Biogene amine in Sauerkraut. Lebensm .-Wiss. Techno!. 5: 108- 109.
13. Ough , C. S. 1971. Measurement of hista mine in California wines . J. Agr . Food Chem . 19:241 -244.
14 . Sen, N. P. 1969 . Ana lys is a nd signitica nce of tyra mine in foods. J. Food Sc i. 34 :22-26.
15. Shore , P. A . 1971. The che mica l determination of histamine. pp . 89-97. In D. G lick (ed.) Methods of biochemica l ana lys is. Vol. Supplementa l. lnterscience Publishers, New York.
16. Silverm a n , G. J. , a nd F. V. Kos ikowsk i. 1956 . Amines in chedda r cheese. J. Da iry Sci. 39: 1134- 1141.
I 7. Swiatek , A., a nd J. Kisza . 1959 . Beitrag zur Kenntnes d er freien
di azopositive n Aminen a nd Aminosa uren in einigen Kasesorten. Intern. Da iry Congress 3:1 459-1 466.
18. Uuspaa. K. J ., a nd P. Torsti . 195 1. T he hi stamine content of Finnish c heeses. Ann. Med. Ex p . Fe nn . 29:58-68.
19. Voigt, M . N .. a nd R . R . Eite nmiller. 1974. Fluorescent q ua nt ita
tion of biologica lly active a mines in foods with 7-chloro-4-ni trobenzofurazan (N BD-C J). J. Food Sci. 39 :420-421.
20. Voigt , M. N., R . R . Eitenmill er , P. E. Koehler , a nd M. K . Hamdy.
1974 . Tyra mine, hi stam ine, a nd tryptam ine content of cheese. J.
Mil k Food Techno!. 37 :377-38 1.
\ •• '

I
'
259
J. Milk Food Techno/. Vol. 38, No. 5, Pages 259-261 (May, 1975) Copyright © 1975, International Association of Milk, Food, and Environmental Sanitarians
Growth of Salmonella heidelberg at Room Temperature in Irradiated and Nonirradiated Potato Chip Dip
MARLEEN M. WEKELL and CHARLENE S. MARTINSEN
Institute for Food Science and Technology, College ofFisheries University of Washington, Seattle, Washington98195
(Received for publication September 3, 1974)
ABSTRACT
Irradiated and nonirradiated cottage cheese-based potato chip dips were inoculated with low (101 cells / ml) and high numbers (106 cells / ml)
of Salmonella heidelberg. At room temperature, both samples
supported growth of Salmonella, but highest counts were found in the
non irradiated samples. Salmonella inoculated at low levels reached 106
cells / ml after 18 h but little change occurred with the high inoculum
after 2.5 h. Growth of Salmonella was detected by both the
conventional plate count and by a modified radiometric technique.
Radiometric detection times were 2.5 and 18 h for samples inoculated
with high and low numbers of Salmonella respectively, which
corresponded to 106 cells/ ml at the time of detection.
Salmonellae normally grow most rapidly at 37 C, however, growth is possible at much lower temperatures (13). This low temperature growth is influenced by conditions of the medium such as pH and salt concentrations (1, 4, 14) with most rapid growth being obtained under optimum conditions.
Growth of salmonellae in different foods is responsible for many cases offood poisoning every year (2) with great economic loss to processors and consumers. The fate of salmonellae in cultured milk and cheese products in the event of consumer contamination and subsequent temperature abuse is presently not clear. Potato chip dips prepared with dairy products are often allowed to remain at room temperature for substantial periods. These products can be contaminated either when prepared in the home or during consumption when pieces of food, often handled by many individuals, are placed into the dip. Therefore, this study was undertaken to investigate the growth of Salmonella heidelberg at low inoculum levels in a homemade cottage cheese-based potato chip dip (pH 5.3) subjected to temperature abuse. To assess growth of Salmonella without interference from the indigenous flora, portions of the dip in this investigation were subjected to pasteurizing doses of gamma radiation. Growth of Salmonella was detected by plate counts and by a modifiP-d radiometric technique. The latter has recently been demonstrated by several investigators to be faster, comparable in accuracy, and more sensitive than the former (6, 7, 8. 16, 18).
MATERIALS AND METHODS
Test organisms Salmonella heidelberg. ATCC 8326 , was used in these studies
because it is among the serotypes most frequently isolated from human
sources (J). This organism has been among the serotypes demonstrated
in outbreaks of human illness attributed to consumption of
contaminated raw milk (5, 10, I I) , and dried milk products from
contaminated dried milk plants (12).
Inoculation
The inoculum was prepared by add ing 18-h brain heart infusion
(BHI, Difco) broth cultures of the organism to 0.1 o/o peptone water to
obtain 55% transmittency at 660 nm in a Bausch and Lomb
spectrophotometer . Appropriate serial decimal dilutions for
inoculation were prepared in BHI broth . Irradiated and nonirradiated
chip dip samples were equilibrated at room temperature for 4 h. Samples were inoculated with 0.1 ml of the appropriate dilutions of S.
heidelberg in BHI broth. Both irradiated and nonirradiated control
samples were prepared in the same manner except 0.1 ml of sterile BHI
broth was added.
Sample preparation
One 8 oz. can of commercially canned minced clams plus juice was
added to 16 fluid oz. of commercially prepared fresh small curd creamed cottage cheese. The mixture was blended at top speed for 2
min in a Waring Blendor. The final pH was 5.3. No pH changes occurred in any of the inoculated samples after incubation . To simulate
home preparation as closely as possible, aseptic technique was followed only after blending of the ingredients. Both irradiated and
non irradiated samples were stored at 4 C for 18 h before use to reduce possible free radica ls formed during radiation. Samples were then
allowed to equilibrate at room temperature for 4 h before incubation.
Irradiation
Nine-milliliter aliquots of the samples were measured , using a 10-ml
sterile plastic pipet with the tip removed, into sterile 50-ml serum vials
and capped with sterile aluminum foil. Samples were irradiated in the
College of Fisheries with 300 Krad of gamma radiation in the Cobalt 60
Mark II food irradiator at a dose rate of 160 Krad / h and a temperature
of 24 C. Samples were irradiated to reduce or destroy the normal bacterial flora resulting from ingredients and handling contamination
during preparation.
Enumeration
Salmonella counts were obtained by the spread plate method on
brilliant green (BG) and salmonella shigella (SS) agars (Difco) using
0.1-ml volumes of the appropriate dilutions of the chip dip. Total counts of bacteria ab le to grow at pH 5.0 were obtained by the same
method using Difco's tomato juice agar, special (TJ). Incubation was at
37 C for 2 days.
Radiometric procedure
Samples were inoculated with O.l ml uniformly labeled 1•C-glucose (Amersham-Searle. 280 mCi/m mole), 0.1 f.1Ci / sample, containing 0 .06 f.lg glucose. The same quantity of unlabeled glucose was added to samples counted by the sp read plate technique. Samples were mixed by swirling for 1 min and incubated at room temperature. Three replicates were used for each treatment for each sampling time. One replicate was used as a blank and 2.0 ml of 1.0 N H2SO. was added before add ing the isotope. Each bottle (after add ition of labeled glucose) was immediately capped with a serum cap pierced with a small plastic rod and cup assembly (Kontes Glass Co., Vineland, N.J.,; K-882320) . Samples were

260 WEKELL AND MARTINSEN
tested by the method of Harrison et a l. (9) with incubation times of 2.5 to 18 h. All samples were counted in a Packard Tri-carb Scintillation Counter. Data were corrected for blank activity. Blanks consistently gave va lues of 38-45 counts per minute (CPM). Quenching was corrected by testing simil arly quenched 14C-glucose and 14CQ2
Standards. Recovery ofl4C0 2 from the d ip was complete . When 0.3~JCi
of Na2 14co, was added to each of five a liquots of d ip and acid ified as .
described, a ll of the label was recovered.
RESULTS AND DISCUSSION
Salmonella heidelberg inoculated at low levels can grow in a homemade cottage cheese based-clam potato chip dip, The organisms inoculated at 2.8 X 101 cells / ml were able to grow in the chip dip at room temperature during the 18-h test period (Table 1). Growth was ob-
TABLE 1. Growth ofS. he idelberg in chip dip at low inoculum level incubated at'room temperature (2 1 C)
Incubation Average plate count/ ml CPM/
Sample time(h) BG agar• SS agarb TJ agarc sampled
Irradiated Control 0-18 No growth in any sample
Irradiated and 0 2.8 X !01 2.8 X 101 2.8 X 101 0 inoculated with 4 3.0 X 10² 2.0 x 10² 1.0 X 10³ 0 S. heidelberg 6 6.0 X 10² 2.0 X 10³ 6.0 X 10³ 0
18 2.2 X J04 2.7x l 04 6.0 X 10⁴ 0
Nonirradiated 0 J.O X 103 0 Control 4 No growth 4.0 X 10² 0
6 1.6 X 10⁴ 0 18 9.6 X 10⁷ 1570
Non irradiated 0 2.8 X 101 2.8 X 101 1.0 X 10³ 0 and inocu lated 4 5.0 X 10³ 1.0 X 10³ 0 with S. heidelberg 6 9.0x 10² 8.0 X J03 1.5 X 10⁴ 0
18 5.0 X 10s 4.0 X J06 1.2 X 10⁸ 1700
aBrilliant Green agar bSalmonella Shigella agar cTomato juice agar dcounts per minute/ sample, represents the mean of duplicate samples corrected for blank activity
tained in both irradiated and nonirradiated samples with the highest level obtained in the nonirradiated samples. Counts increased from the inoculum level of 2.8 x 101
cells / ml on the irradiated samples to 2.2 x 10⁴ and 2.7 x 10⁴ cells/ ml after 18 has detected on brilliant green and salmonella shigella agars, respectively. During the same incubation period counts as measured with tomato juice agar increased to 6 x 10⁴ cells / mi. These data indicate that better recovery of Salmonella was obtained on TJ agar with a pH of 5.0 than on the two selective agars used for Salmonella. No growth was obtained on the three media with the irradiated control showing the effectiveness of the irradiation. In addition, organisms growing on the three media from the irradiated inoculated samples were randomly selected and tested on triple sugar iron agar and shown to react as salmonellae.
Counts in the nonirradiated inoculated samples increased from the inoculum level of 2.8 x 101 to 5 x 10⁵,
4 x 10⁶ and 1.2 x 10⁸ cells / ml on BG, SS, and TJ agars, respectively.
No growth was obtained when nonirradiated control samples were plated on BG and SS agars due to the inhibitory nature of these media. However, counts
increased from 1 x 10³ to 9.6 x 10⁷ during 18 h of incubation when tested on TJ agar. The normal flora of a cottage cheese based chip dip would be composed predominately of lactic acid bacteria which were able to grow on the TJ agar at pH 5.0 and the organisms from the nonirradiated incoulated samples enumerated on TJ agar were a reflection of both and normal flora and the Salmonella which will grow at pH 5.0 (14).
Although samples were held. at 4 C for 18 h and at room temperature for 4 h in an effort to reduce or eliminate inhibitory effects due to radiation, such as free radical formation, slightly lower counts were obtained on the irradiated than on the nonirradiated samples. Although this slight inhibition was evident, the irradiation was effective in reducing the competition from the normal bacterial flora on the samples.
With high levels of S. heidelberg inoculum (2.8 x 10⁶
cells / ml) , the changes in numbers of cells during 2.5 h of incubation were less than when low inoculum levels were used (Table 2) . Results with both irradiated and nonirra- 1
TABLE 2. Growth ofS. heidelberg in chip dip at high inoculum level incubated at room temperature (21 C)
Incubation Average plate count/ ml CPM/
Sample time(h) BG agar• SS agarb TJ agarc sampled
lnadiated and 0 2.8 X J06 2.8 X 10⁶ 2.8 X 10⁶ 0 inoculated with 2.5 2.0 X 10s 7.0 X lOS 4.0 X 10⁶ 59 S. heidelberg
Non irradiated and inoculated 0 2.8 X J06 2.8 X 10⁶ 2.8 X 10⁶ 0 with S. heidelberg 2.5 9.0 X 10⁶ 2.4 X 10⁷ 101
aBrilliant Green agar bsalmonella Shigella agar CTomato juice agar dcounts per minute/ sample, represents the mean of duplicate samples corrected for blank activity
diated controls were the same as already reported . Counts from an inoculum level of 2.8 x 10⁶ cells / ml in irradiated chip dip decreased to 2.9 x 10 5 and 7.0 x 10⁵/ml as measured on BG and SS agars respectively. The TJ agar counts increased from 2.8 x 10⁶
to 4.0 x 10⁶ cells / mi. Counts obtained from nonirradiated inoculated samples increased from 2.8 x 10⁶ to 9.0 x 10⁶ and 2.4 x 10⁷ cells / ml on SS and TJ agars respectively. The irradiated inoculated sample showed a decrease in counts as measured on both BG and SS agars and only a very slight increase as measured on TJ agar. An increase in numbers of cells was obtained on both test media when nonirradiated chip dip was used.
Use of the radiometric technique for detection of S. heidelberg growth in this study was dependent on the initial inoculum and incubation time. The radiometric technique is a measure of the 14C0 2 produced by the total microflora present. At low inoculum levels , labeled 14C0 2
was detected in only nonirradiated samples after 18 h of incubation. The average 14C0 2 values were 1700 and 1570 CPM, respectively, for inoculated and control samples (Table 1), which corresponds to total counts of 1.2 x 10⁸ and 9.7 x 10⁷, respectively. Detection time was
. ~
;
I
I
I
·~
' -
'
GROWTH OF SALMONELLAE IN CHIP DIP 26 1
found to be 2.5 h at a high inoculum level and
corresponded to a minimum of 6 x 10⁶ cells of S.
heidelberg, a detection level in close agreement with that
found by Previte (16) for Salmonella typhimurium in
broth. More rapid detection times can sometimes be
achieved by shaking samples during incubation and is
recommended for future work.
Most cottage cheese manufacturing procedures will
kill any salmonellae which may be present in milk used
for cheese production or in nonfat dried milk used for
fortification provided the cooking temperature is at least
51.7 C (15). Salmonella heidelberg can grow in a
homemade cottage cheese based potato chip dip , pH 5.3 ,
incubated at room temperature, and inoculated at low
levels that might result from careless consumer handling.
T he number of cells can increase from levels of the
borderline of detection to infective doses , of 3 x 10 5 to
5 x 10⁷ (I 7) , within a few hours, depending on the type
and particular strain of Salmonella.
The radiometric technique has been shown to be
applicab le to estimation of numbers of bacteria in
culture media with detection times directly related to the
log of the initial inoculum (I 8). These studies suggest
that radiometric techniques can be applied directly to
detection of bacteria in dairy products , but only when
high numbers of bacteria are present. This technique
can , however , be used as a rapid method to determine the
presence of heavy bacterial growth on a food under
specific environmental conditions.
ACKNOWLEDGEMENT
We thank the Pacific Uti lization Research Center. National Marine
Fisheries Service, for use of the Packard Tri-Carb Scintillation
Counter. Contribution No. 416, College of Fisheries, University of
Washington , Seattle, Was hington 98195.
REFERENCES
1. Alford , J. A., and S. A. Palumbo. 1969. Interaction of salt , pH.
a nd temperature on the growth and survival of salmonellae in
ground pork . Appl. Microbial. 17:528-532.
2. Anonymous. 1973 . Communicable Disease Center Morbidity and
Mortality. Annual Supplement Summary , 1972. U.S. Department
of Health , Education and Welfare , Washington , D.C.
3 . Anonymous. 1974. Communicable Disease Center Morbidity and
Mortality, Weekly Report 118:1 , U .S. Department of Health . Edu
ca tion and Welfare, Washington , D.C.
4 . Ayres, J. C. 1942. The surviva l of pathogenic bacteria and other
microorga nisms in fruit juice. In th e destruction of sa lmonell ae.
Agricultura l Research Service, 74-37, U.S. Department of Agr ..
July. 1966. 5. Dav ies, E . T ., and J. A. J. Venn. 1962. The detection of bovine
carrier of Salmonella heidelberg. J. Hyg. 60 :495-500.
6. DeBlanc, H . J. , Jr ., F. DeLand , and H . N. Wagner, Jr. 1971. Auto
mated radiometric detection of bacteria in 2.967 blood cu ltures .
Appl. Microbial. 22:846-849.
7. DeLand, F., and H . N. Wagner, Jr. 1970. Automated radiometric
detection of bacterial growth in blood cultures. J. Lab . Clin. Med.
75:529-534 . 8 . Evancho, G. M ., D. H . Ashton , and A. A. Zwarun. 197 1. Use of a
radiometric technique for the rapid detection of growth of clostri
dial species. J. Food Sci . 39:77-79.
9. Harrison , M. J. , R. T . Wright , and R. Y. Morita . 197 1. Method for
measuring mineralizat ion in lake sed iments. Appl. Microbial. 21 :
698-702. 10 . Hutchinson, R. I. 1964 . Mi lk-borne outbreak of Salmonella
heidelberg. Brit. Med: J. 1964-1:479-480.
11. Knox , W. A. , N. S. Galbraith , M . J . Lewis , G. C. Hickie, and H. H.
Johnston. 1963. A milk -borne outbreak of food poisoning due to
Salmonella heidelberg. J. Hyg. 61:175-185.
12. Marth, E. H. 1969. Salmonellae and sa lmonellosis assoc iated with
milk and milk products. A review . J. Dairy Sci. 52 :283-315.
13. Matches, J. R .. and J. Liston. 1968. Low temperature growth of
Salmon ella. J. Food Sci . 33 :641-645.
14. Matches, J. R. , and J. Liston . 1972. Effect of pH on low tempera
ture growth of Salmon ella. J. Milk Food Techno!. 35:49-52.
15 . McDonough , F. E., R. E. Hargrove, and R. P. Tittsler. 1967. The
fate of sa lmonell ae in the manufacture of cottage cheese. J. Milk
Food T echno!. 30:354-356.
16. Previte, J. J. 1972. Radiometric detection of some food-borne bac
teria. Appl. Microbial. 24:535-539.
17. Taylor, J. , and J. H. McCoy. 1969. Salmonella and Arizona infec
tions , p. 7 to 9. In: H . Riemann (ed.) Food-borne infections and in
toxications . Academic Press , New York. New York.
18. Waters, J . R. 1972. Sensitivity of the 14C02 radiometric method for
bacterial detect ion. Appl. Microbial. 23: 198- 199.

262
J. Milk Food Techno/. Vol. 38, No. 5, Pages 262-263 (May, 1975) Copyright © 1975, International Association of Milk , Food, and Environmental Sanitarians
Evaluation of an Automatic Gram-Staining Machine
DANIEL Y. C. FUNG
Department ofMicrobiology
Pennsylvania State University, University Park, Pennsylvania 16802
(Received for publication September 13 , 1974)
ABSTRACT
An automated staining machine-the Microstainer II-was evaluat
ed for its effectiveness in the Gram staining of bacterial cultures. The
conventional hand staining procedure was used as a comparison.
Microscopic examination of stained slides revealed that both
techniques gave correct Gram reaction of the bacterial cultures tested.
The Microstainer II has an overall "efficiency factor" of 10 x com
pared to the conventional method.
To increase efficiency of laboratory analysis a few
automated Gram-staining procedures and machines
have been developed and tested (1, 2, 4). In 1973, Ryan et
a!. (4) reported a clinical laboratory evaluation of a
commerically available automatic Gram-staining ma
chine--the Microstainer I (TomTec Inc., Orange, Conn .
06477). Using Staphylococcus aureus, Escherichia coli,
Neisseria sp., and sputum as test samples, they
concluded that slides stained in the Microstainer were
reproducible, accurate, and in most instances much
clearer than those stained by hand. The purpose of this
investigation was to evaluate a newer model of this
machine (Microstainer II) using more species and strains of those organisms usually encountered in food
microbiological analysis.
MATERIALS AND METHODS
Twenty-three named Gram-positive and 37 named Gram-negative
organisms, and 24 unknown broth cultures (Table 1) were tested. Sever
alloopsfull of cultures were placed on the glass slide for air drying and
heat fixing. Duplicate sets of slides were made for each organism. One
set of slides was stained by hand following the procedure recorded in
Manual of Clinical Microbiology (3) and the other set was stained by
the Microstainer II (marketed by Cooke Lab. , Inc. Alexandria , VA
22314). The operation and mechanical aspects of the Microstainer were
described in detail by the manufacturer and by Ryan eta!. (4). Basically
the machine has a reaction chamber in which up to 30 prepared slides
can be stained at one time. Staining and washing times for each of the
four reagents were previously determined and set on the digital timers
on the Microstainer paneL When the stainer was activated, the reagents
were sequentially introduced to the staining chamber, held in place for
designated time intervals, and then drained back to the original
container. A wash cycle between each reagent cycle was introduced to
rid the sl ides of residual reagents . The time intervals for the four
reagents and washing cycles used in this evaluation were as fo llows:
crystal violet (30 sec), washing (50 sec), iodine (30 sec), washing (50 sec),
alcohol (7 sec) , washing (SO sec), safranin (60 sec), and final washing (50
sec). After staining, slides were automatically dried by hot air in the
TABLE 1. Bacterial cultu res stained by the Microstainer and by the
conventional method
GRAM-POSITIVE BACTERIA'
Bacillus cereus 43 Sarcina lutea Bacillus danicus Staphylococcus au reus Bacillus megaterium 41 Staphylococcus aureus S-6 Bacillus polymyxa Staphylococcus au reus 241b Bacillus subtilis Staphylococcus au reus 241c Bacillus sulfidus Staphylococcus au reus 241f Clostridium acetobutylicum Staphylococcus aureus 241g Clostridium perfringens Streptococcus bovis Clostridium perftingens ATCC 32625Streptococcus faeca l is Micrococcusflavus Streptococcus liquefaciens
Micrococcus rhodochrous Streptococcus lactis
Micrococcus varians
GRAM-NEGATIVE BACTERIA
Alcaligenes jaecalis Alcaligenes viscolactis Enterobacter aerogenes Enterobacter aerogenes 11 a Enterobacter aerogenes 11 b E nterobacter cloacae 1 Enterobacter cloacae 2 Enterobacter cloacae 3 Enterobacter cloacae 12 Escherichia coli Escherichia coli lOS Escherichia coli 106 Klebsiella pneumoniae I Klebsiella pneumoniae 2 Proteus vu lgaris 186 Proteus vu lgaris 186a Pseudomonas aeruginosa Pseudomonas aeruginosa I Pseudomonas aeruginosa 2
Pseudomonas aeruginosa 3 Pseudomonas aeruginosa 191a Pseudomonas aeruginosa 191 b Pseudomonas fluorescens 192a Pseudomonas fluorescens 192b Pseudomonas putida Pseudomonas putida 193 Salmonella cholerasuis Salmonella paratyphi b Salmon ella pullorum Salmon ella thompson Salmonella typhimurium Salmon ella typhosa Serratia marcescens Shigella flexneri 232 Shigella flexneri 232a Shigella flexneri 232d Shigella so!wei
UNKNOWN CULTURES'
11 Gram-positive Cocci 11 Gram-negative Rods 2 Gram -positive Rods
1 All named cultures were obtained from the cu lture collection of the
Pennsylvania State Univers ity except isolates of Enterobacter cloacae,
Klebsiella pneumoniae, and Pseudomonas aeruginosa which were
supplied by Dr. S. D. Kominos, Mercy Hospital , Pittsburgh , Pa. 'Unknown isolates were obtained from a variety offood commodities by
students of a Food Microbiology course.
sta ining chamber. Slides were ready to be observed. The time sequence
used in th is study was determined by staining a series of slides
containing pure and mixed cultures of Escherichia coli and
Staphylococcus au reus by varying the reagent staining time. These time
intervals were considered to be satisfactory for this study. Since the
machine had the capacity of varying sta ining time between 1 to 999 sec,
a wide range of time intervals could be used depending on needs of
particular situations .
;. I
'

'
I
·~
AUTOMATIC STAINING MACHINE 263
RESULTS AND DISCUSSION
Microscopic examination of slides under oil immersion
revealed that both techniques gave correct Gram reaction of the respective named organisms. Of the 24 unknown
cultures , 11 were Gram-positive cocci , 11 Gram-negative
rods and 2 Gram-positive rods. Both methods gave the
same results. Although Ryan eta!. (4) graded the quality
of the slides on a 4+ scale to compare the two methods ,
such a scale was not used in t his study. For all practical
purposes the two methods stained bacteria equally well.
The amount of residual dyes on the slides was about the
same in both methods. It took about 6-7 h to carefully hand stain 90 slides
individually with constant watching of the clock and
changing reagents. For the same number of slides it took
the Microstainer about 45 min. The only manual steps
required were loading and unloading of slides and
pressing the "start" button of the machine. When time,
labor, and cleanliness were taken into consideration an
arbitrary "efficiency factor" of 10 x was assigned for the
Microstainer compared to hand staining. The most time and energy consuming part of this
study was the microscopic examination of all the slides
using the oil immersion lens. It is apparent that a
machine for the automatic read-out and print-out of
Gram reaction of bacteria is needed to handle large numbers of slides. In conclusion, the Microstainer is a
useful machine for Gram sta ining numerous slides. It
shou ld be helpful in large hospitals , public health laboratories, and quality control laboratories where
numerous slides are processed daily . For smaller
laboratories the conventional hand staining method
remains more applicable. ACKNOWLEDGMENT
The author thanks the Dynatech Lab Inc. for use of the Microstainer
II and Mr. Gary Hollick for tec hnica l ass istance.
REFERENCES
1. Cremer, A. W . F. 1968. Automatic slide sta ining in clinical bacter
iology . J . Med. Lab . Technol. 25:387-390.
2. Drew, W. L. , A. N. Pedersen , and J. J . Roy . !972. Automated slide
sta ining marchine. Appl. Microbial. 23: 17-20.
3. Lennette, E . H., E. H. Spaulding, and J . P. Truant. 1974. Manual of
clinica l microbiology, 2nd ed . Amer. Soc . Microbial. , Wahingion,
D.C. 4. Ryan, R. W., A. K. Sedgwick , and R. C. Tilton. 1973. Laboratory
eva luation of an automatic Gram stain ing machine. Health Lab.
Sci. 10:82·87.
264
J. Milk Food Techno/. Vol. 38, No. 5, Pages 264-268 (May, 1975) Copyright © 1975, International Association of Milk, Food, and Environmental Sanitarians
A Comparison of Phosphate Buffered and Distilled Water · Dilution Blanks for the Standard Plate Count
of Raw-Milk Bacteria 1
C. N. HUH~ANEN, A. R. BRAZIS2, W. L. ARLEDGE3, C. B. OONMLLv1, R. E. GINN5, H. E. RANDOLPH6, and E. J. KOCH7
Eastern R egional R esearch Cente,.S Philadelphia, Pennsylvania 19118
(Received for publication September 3, 1974)
ABSTRACT
Raw milk samples were diluted with distilled water or distilled water with added phosphate buffer as recommended by Standard Methods for the Examination of Dairy Products. The standard plate counts were higher in diluent without phosphate buffer with both high and low count milk . The higher counts were significant when ana lyzed by a nonparametric sign test or a t -test of differences but were ,not significant with an analysis of variance technique. Reproducibility was not statistically different in the two diluents. It is suggested that the use of phosphate buffer for raw milk bacteria counts be discontinued until information showing defin ite advantages is provided.
Use of dilution water fortified with buffers was originally developed for studying biochemical oxygen demand in polluted waters that might not support adequate ba_cterial growth due to lack of necessary minerals or to high pH. Mohlman et al. (7) proposed a dilution water containing 500 ppm NaHC0 3 (bicarbonate water). Theriault et al. (9) compared distilled water, bicarbonate water, and phosphate buffer (1.25 ml per liter of stock solution of 34.0 g KH 2P04 in one liter of distilled water with the pH adjusted to 7.2 with 1 N NaOH-the same concentration now recommended by Standard Methods (1)]. These authors (9) concluded that phosphate buffer by itself was a suitable diluent for biochemical oxygen demand analyses of polluted waters.
Butterfield (3) extended the buffered dilution blank studies to the isolation of bacteria from the water of seven rivers or creeks. He found a high pH (7.6-8 .2) in six of the waters after autoclaving and these remained
1A contribution from the Subcommillee .for the Examination of Milk and Milk Products, Applied Laboratory Methods Committee, International Association of Milk, Food, and Environmental Sanitarians. Inc. 2Di•·ision ofMicrobiology, FDA. 1090 Tusculum Ave .. Cin cinnati, 0. 45226. (Chairman , Applied Laboratory M ethods Committee). 'Dairymen, In c .. 200 West Broadway, Louisville. Ky. 40202. 4Division of Microbiology. FDA , 1090 Tusculum Ave .. Cincinnati, 0. 45226. 5Dairy Quality Control Institute. In c., 2353 North Rice St .. St. Paul, Minn . 55113. 6 Department of Animal Science, Texas A &M University. College Station. Texas 77843. 7 Biometrical St(!lf: Agricultural Research Sen•ice. U.S. Department of Agriculture. Beltsville. Md. 20705. 8Agricultural Research Sen•ice. U.S. Department of Agriculture.
high for 48 h. Distilled water also became alkaline but reverted to pH 7.2 in 48 h. Phosphate buffered distilled water with or without the added minerals remained at a constant pH (7.4). Bacterial counts were obtained in an 1 unspecified agar incubated at 37 C. Highest counts were obtained using the above fortified phosphate buffer although phosphate buffer alone was nearly as good. Lowest counts were obtained with bicarbonate water with distilled water being somewhat better but not as good as phosphate alone.
As far as we know, the practice of using phosphate buffer for isolating bacteria from dairy products stems from the studies of the above workers on water-borne bacteria. The only reference to its use in Standard Methods is the paper by Butterfield (3) . We undertook the study reported here because of the lack of data on the efficacy of phosphate buffer as a diluent for bacteria in dairy products.
MATERIALS AND METHODS
Methods advocated by Standard Methods (I) were followed with the exception of the distilled water [non phosphate buffered (NPB)] series. This was a collaborative assay by the members of the Subcommittee for the Examination of Milk and Milk Products , Applied Laboratory Methods Committee, International Association of Milk, Food, and Environmental Sanitarians, Inc. Nine analysts secu red their own raw milk samples (total of 82 for this study) which were from the states of Minnesota , Louisiana, Tennessee, North Carol ina, Ohio, and Texas. Distilled water (NPB) with or without phosphate buffer (PB) at the concentration recommended by Standard Methods(/) and Theriault et al. (9) was used as the diluent. Duplicate petri-dishes were poured and in most instances replicate aliquots of raw milk were plated.
RESULTS
pH measurements
Distilled water pH values reported by the different laboratories ranged from 5.50 to 8.70 with 13 of 19 samples in the range 5.80 to 6.80. Freshly distilled water gave the highest values of 8.55 and 8.70; these, which were used in two days and one day, respectively, showed a drop in pH to 7.35 and 7.50 , respectively. The other pH measurements reported were those of distilled water just before addition of milk or buffer . When buffer was added, the pH values reported were 7.05 in 14 cases;
;
' .. I

BUFFERED DILUTION WATER 265
TABLE I. Effect of phosphate buffer in dilution water on plate counts of raw milk bacteria
Increase ( +) or
' Milk Phosphate (PB) No phosphate (NPB)
decrease (-) sample without
Investigator no. Rep.l Rep. 2 Rep.l Rep. 2 phosphatee
A F 119b 124 146 158 179 168 198 194 + 2 30 .0 27.9 30 .9 29.3 27.7 28.2 30.1 27.3 3a 398 422 369 389 368 397 386 390 4a 205 239 241 234 205 237 240 239 + sa 113 118 106 110 121 99 103 146 + 6a 71 104 93 104 84 124 93 98 + 7 13.1 8.4 12.5 11.7 10.7 12.2 14 .7 14.6 + sa 350 319 337 291 314 277 298 267
9 8.8 9.5 9.1 9.1 8 .7 7.3 8.4 7.5 lOa 43 43 56 59 53 41 43 40
Arith. mean 139.Q3 139.98 + Geom . meand 4 .326 4.337 +
B II 4 .2 4 .8 4 .2 4.5 4.1 5 .0 4 .0 3.0
12 4.0 3.4 3.6 4 .3 3.8 4.4 3.0 2 .9
13 6.8 7.6 7.4 8.0 4.7 4.4 6 .7 8. 1 14a 62 57 55 61 62 61 54 40
IS 27 30 30 28 28 27 29 30
16 3.9 2.8 3.6 4.2 3.2 3.1 2.0 3.1 17a 69 77 72 64 69 57 70 71 18a 60 53 so 51 67 72 75 79 +
Arith. mean 28.85 29 .91 + Geom. mean 2.720 2.658
c 19 21.0 20.6 21.8 22 .9 21.6 19.5 24.4 23 .0 + 20 11.9 10 .8 12.5 12.3 12 .7 12.6 12.8 13.7 + 21 15 .2 13.8 15 .9 17.7 16.3 17 .2 17.4 17.9 + 22 18.5 17.4 20.9 17.2 19.7 20 .6 18.7 21.8 + 23 10.1 9.6 10.3 9 .7 8.7 11.2 IJ.l 9.9 + 24 8 .4 8.6 8.7 7.9 8 .9 9.2 8.2 9.1 +
Arith. mean 14.32 15 .26 + Geom . mean 2.604 2.666 + D 25 14.4 13.6 14.4 14.7 +
26 6.2 7.2 7.3 7.4 + 27 14.1 12 .9 13.7 14.6 + 28 3.0 3.9 2.8 2.9 29 8 .4 8.6 6.9 6.7 30 7. 1 5.8 5.2 4 .3 31 16.2 20.4 19.7 19.6 + 32a 143 145 108 92
Arith. mean 26.86 21.26
' Geom. mean 2.529 2.427
E 33a 104 110 106 115 120 Ill 123 98 + 34a 210 242 270 265 274 302 232 237 + 35 293 263 259 240 27.1 24.9 26 .0 25.8 36a 72 69 53 77 63 72 76 82 + 37a 161 !56 141 133 160 159 141 142 + 38 8 .3 11.0 9.2 10.3 9.9 9.5 10.5 8.3 39 23 .1 22 .4 23.7 27 .0 23.8 23 .7 22 .7 24 .6 40 8.4 7.5 9.4 6 .7 9.8 8. 1 8.3 9.7 + 41 18.5 15.2 20 .5 18 .6 24 .0 26. 7 12.9 19.7 +
Arith . mean 99.41 102.28 + Geom. mean 3.930 3.972 + F 42 18.5 20.6 20 .2 21.1 24 .0 20.8 23.2 22.8 +
43 28 .7 26 .4 25.2 28 .5 29.1 24 .2 24.7 24 .9 44a 77 71 71 60 56 79 79 66 45a 57 61 57 54 51 60 64 6 1 + 46 6.8 5.1 6.4 5.7 6 .3 7.5 8 .0 8. 1 + 47 6 .7 6.6 6.4 6.9 6 .5 7.2 9.4 7.0 + 48 7.0 5.4 6 .5 7 .2 5.9 5 .8 6. 1 7. 1
Arith . mean 27.64 28.38 + Geom. mean 2.876 2 .93 1 +
G . 49 15.8 16.9 18.2 15.5 16 .4 17.6 15.4 17.1 +
so a 190 198 186 197 193 !8 1 188 234 + 5 1 14.0 15 .1 18 .0 18 .7 16.3 16.6 17. 1 17.2 + 52 10. 1 9.5 8 .4 9.0 J0.3 9.5 11.2 11.6 + 53 9.5 11.2 10.5 10.0 9 .0 9.5 7.8 8 .6
54 9.1 9.5 8 .4 7.6 11.7 6 .2 9.0 11 .3 + 55 3.4 3.2 2.3 2 .7 3.2 3.2 3.6 3.3 +

266 HUHTANEN ET AL.
TABLE 1. Continued.
Increase!+) or
Milk Phosphate (PB) No phosphate (NPB) decrease (-)
sample withput Investigator no. Rep. 1 Rep . 2 Rep.l Rep. 2 phosphatee
56 6.3 5.3 6.4 4.7 6.2 5. 7 5.0 5.1 57 2.7 3.6 1.7 2.6 2.3 2.1 3.3 3.3 + 58 a 44 32 41 39 34 39 47 41 + 59a 123 141 132 149 131 158 120 149 + 60a 200 239 239 218 222 251 259 231 + 61a 170 188 138 172 140 164 162 176 62a 234 194 203 241 202 247 249 230 + 63a 102 121 121 118 124 110 120 113 + 64a 268 288 279 251 282 288 281 269 + 65a 135 140 157 176 153 180 130 141 66a 249 226 231 261 279 242 261 258 + 67a 230 238 241 221 245 223 209 221
Arith. mean 108.56 111.48 +
Geom. mean 3.792 3.818 +
H 68 6.0 6.4 7.0 7.9 + 69a 59 65 74 69 + 70a 168 160 175 163 +
71 5.4 6.2 5.6 6.4 +
72 8.4 8.2 6.1 7.0 73 10.6 9.4 8.9 10.0 74 8.5 8.2 9.8 9.8 +
75 6.6 7.1 7.9 6.8 +
76 7.4 6.6 6.8 6.2 Arith. mean 30.94 32.62 +
Geom . mean 2.579 2.606 +
77 5.0 5.9 6.3 5.9 +
78 7.0 6.4 6.8 6.7 +
79 10.2 9.5 10.0 9.1 80 9.3 8 .7 10.0 10.1 +
81 6.4 6.3 6.8 6.5 +
82 7.0 6.5 6.4 5.9 Arith . mean 7.35 7.54 +
Geom. mean 1.972 1.998 +
All samples Arith . mean 54.00 54.64 +
Geom . mean 3.037 3.046 +
aThese milk samples were " high count" with the 10-3 dilution used for enumeration . bFor actual counts per ml milk, multiply by 1000. cBased on geometric means. dNatural log.
7.10, 7.20, 7.35, and 7.5 for four other samples. The two highest were those having the highest initial pH values. Addition of 1 ml of milk to the unbuffered water brought the pH values to a range of6.8 to 7.2. Addition of milk to the buffered dilution blanks resulted in a very slight drop in pH (about 0.1 unit) in most instances.
Analysis of paired differences
The original plate count values are shown in Table 1. The overall mean counts of NPB were very slightly greater than PB. Eight and seven of the nine analysts reported higher mean counts with NPB dilutions for arithmetic and geometric means , respectively. Of the 82 milk samples tested, the geometric means of plate counts in NPB dilution blanks were greater than PB in SO cases. Using a nonparametric sign test for matched pairs (5), the differences between NPB as opposed to PB , as shown in Table 1, were found to be significant (0.05 < P < 0.01) . A t-test of paired differences of the proportion NPB-PB ,
PB
transformed to y = 2 arcsin fi (for normalizing the distribution), also showed the two diluents to give significantly different means (P < 0.05).
Since a significant amount of milk phosphate could be carried over in the first dilution and less in the second, the possibility existed that high count milk, i.e. that with counts over 30,000/ ml, would behave differently from lower count milk. Analyses of these milk samples showed NPB > PB in 20/ 30 high count and 30/ 52 low count samples. A Chi square test of goodness-of-fit, however, did not indicate these ratio differences to be significant.
Analysis of variance
An examination ofthedifferences between plate counts of NPB and PB in Table 1 shows that analyst B found 7 of 8 samples with PB > NPB; although the overall arithmetic mean showed a reverse trend due to the 8th sample. Analyst C found all 6 samples with NPB > PB . The large discrepancy between these two analysts (the
' , ' ~4
'

' ·;
BUFFERED DILUTION WATER 267
TABLE 2. Ana(ysis of variance determinations for 82 milk samples
Sum of Mean Significant with
Line Source of variation df squares square F P<0.05 P<O.Ol
A Analysts 8 366.226 45.7782 3.44 yes yes
B Samples/ analysts 73 972.063 13 .3 159 914 yes yes
c Treatment (phosphate versus no phosphate) I 0.020427 0.020427 1.40 no no
D Treatment x analysts 8 1.02921 0.128651 8.84 yes yes
E Treatment x samples / analysts 73 1.39636 0.019128 1.31 no no
F Between replicates/ samples 164 2.38750 0.014558 1.63 yes yes
G Between petri dishes 328 2.93500 0.008948
Total 655 1346.06
F-values were derived from the ratios of the mean squares of lines A/ B, B/ F, C/ F , DI F, El F, FIG.
TABLE 3. Analysis of variance of V(lliances between duplicate petri dish es for 82 milk samples
Sum of Mean Significant with
Line Source of var iation df squares square F-ratio P < 0.05 P<O.Ol
A Analysts 8 6171.82 77 1.478 1.58 no no
B Samples/ analysts 73 36144 .2 495.126 1.40 yes no
c Treatment 1 50.5766 50.5766 0 .54 no no
D Treatment x analysts 8 730.255 91.2819 0 .22 no no
E Treatment x samples/ analysts 73 31071.4 425.636 1.20 no no
F Between replicates/ samples 166 58894.8 354.788
Tota l 327 133063.1418
F-values were derived from the ratios of the mean squares of lines A/ B, B/ F , C/ F. DI F, El F.
other seven analysts showed a more random distribution
of differences) indicated either chance differences or
some personal, geographical , or other bias. The analysis
of variance is designed to determine the true · nature of
such differences. The analysis of data of Table 1,
transformed to natural logs, is shown in Table 2. There
was, as expected, a highly significant difference between
milk samples (line 8). There was also a highly significant
(P < 0.01) difference between analysts (line A) which
might have been due to the particular samples analyzed.
There was no significant difference between NP8 and PB (line C). There was a highly significant interaction
(P < 0.01) between treatments and analysts (line D). This
I probably accounts for the apparent significant difference
obtained between NPB and P8 with the nonparametric
and t-tests when applied to the data of Table 1 (these
tests do not detect interaction effects). There was no
evidence that the higher means obtained using NP8 were
different from PB. The test for interaction between
phosphate treatment and samples within individual
analysts (line E) was not significant at the 5 o/o level.
Replicates of the same milk sample (line F) were
significantly more variable than the variability between
petri dishes of the same replicate (line G).
Test for reproducibility
A single degree-of-freedom variance between petri
dishes was calculated for each replication of each
sample. These differences were examined by analysis of
variance. The results are summarized in Table 3. The
only difference in reproducibility was in samples within
analysts (line 8) which showed a difference with P < 0.05
but not with P < 0.01. In other words variances between
milk samples were different and were not associated with
any particular analyst. It was interesting to note that in
this study there was no difference in analyst
reproducibility, although we had previously (6) found one
analyst to have a significantly better reproducibility. This
analyst did not participate in this current study.
DISCUSSION
The results we obtained, as reported here, do not
indicate any advantage for using phosphate buffer in the
dilution blanks. There was some evidence from the less
powerful statistical methods used that the counts were
higher without phosphate. It is possible, though, that
where fmiher dilutions are necessary, some advantage
might accrue from the use of phosphate. Under most
conditions, only one dilution of w-z is made for raw milk .
Our results are based on this dilution.
Wagenaar and Jezeski (10) studied the survival of
Pseudomonas putrefaciens in distilled water and in water
buffered with gelatin phosphate (0.2o/o gelatin, 0.725o/o
NaH 2P0 4 • H 20) and 0.37o/o Na 2HPOJ. They reported
differences in survival of several strains in distilled water
and in the case of the most resistant strain, found that
gelatin phosphate greatly improved survival with
phosphate being the active component. the best
phosphate concentration was 2 o/o with progressively less
survival at 1 and 0.5% Standard Methods, however,
recommends a phosphate concentration of only about
0.04 o/o. Athe1ion (2) found some evidence that increasing
dilutions of 12-day stored pasteurized milk resulted in
lack of growth of psychrotrophic bacteria presumably
because of a need for phosphate (carried over by the milk
at low dilutions) as a growth stimu lant. He indicated,
however, that in general the psychrotrophic bacteria were
not noticeably affected by the lack of phosphate in the
dilution water. Watrous (private communication, 1973)

268 HUHTANEN ET AL.
indicated that the bacterial counts on stored processed
dairy products such as pasteurized milk might be
influenced by the presence or absence of phosphate.
Other workers produced evidence that demineralized or
distilled water decreases survival of pure cultures of
Escherichia coli (4) and Streptococcus faecalis R (8) .
It is apparent from our studies that the present use of
phosphate in raw milk dilution blanks for the standard
plate count is of no value in increasing the counts of
bacteria or increasing reproducibility. It is possible that a
dilution fluid similar in composition to the minerals of
milk would be of more value for standard plate counts of
the bacteria in dairy products . Peptone water should also
be evaluated as a possible diluent for raw milk bacteria.
Studies of such diluents are contemplated by our
subcommittee.
REFERENCES
l. American Public Health Association . 1972. Standard methods for
the examination of dairy products , 13th ed. American Public
Health Association, Inc., New York, New York .
2. Atherton, H. V. 1953. Some physical, chemical, and bacteriologi
cal changes in market milk during prolonged periods of refriger-
ated storage. Thesis , The Pennsylvania State College, State Col
lege, Pa.
3. Butterfield , C. T. 1932. The selection of a dilution water for bac
teriological examinations. J. Bacteriol. 23:355-368.
4. Carlucci, A. F., and D. Pramer. 1960. An evaluation of factqrs
affecting the surviva l of Escherichia coli in sea water. II. Salinity,
pH , and nutrients. Appl. Microbiol. 8:247-250.
5. Hays, W. L. 1963. Statistics. Holt , Rinehart and Winston, Inc .,
New York , New York .
6. Huhtanen , C. N., A. R. Brazis, W. L. Arledge, E. W. Cook, C. B.
Donnelly, R. E. Ginn , J . N. Murphy,_ H. E. Randolph , E. L. Sing,
and D. I. Thompson. 1970. Effect of dilution bottle mixing meth
ods on plate counts of raw-milk bacteria . J . Milk Food Techno!.
33:269-273.
7. Mohlman , F. W., G. P. Edwards , and G. Swope. 1928. Technic
and significance of the biochemical oxygen demand determina
tion. Ind. Eng. Chern . 20:242-246 .
8. Price , S. A. , and L. Gare. 1959. A source of error in microbiologi
cal assays attributable to a bacterial inhibitor in distilled water.
Nature 183:838;840.
9. Theriault, E. J. , P. D. McNamee , and C. T. Butterfield . 1931. Ex
perimental studies of natural purification in polluted water. V. Se
lection of dilution waters for use in oxygen-demand tests. Pub .
Health Report 46:1084-1116 .
10. Wagenaar , R. 0., and J. J . Jezeski. 1952. The influence of the type
of diluent on the growth and survival of Pseudomonas putrefa
ciens. J. Dairy Sci. 35:738-754.
-
" ,
'

'
269
J. Milk Food Tee/mol. Vol. 38, No. 5, Pages 269-274 (May, /975) Copyri ght © 1975, International Association of Milk, Food, and Environmental Sanitarians
Starters and Bacteriophages in Lactic Acid Casein Manufacture
I. Mixed Stra in Starters
T. D. THOMAS and R. J. LOWRIE
New Zealan d Daily Research Institute, Palmers ton North
New Zealand
(Received for publication September 16, 1974)
ABSTRACT
The bacteriological composition and ac id producing activity of
mixed stra in starters used for commercial lactic acid casein
manufacture were investigated. Rates of acid production by mixed
starters from eight New Zealand casein factor ies were similar under
standard laboratory conditions. Streptococcus cremoris was the
predomin ant species comprising some 70-90o/o of total bacteria in a ll
but one mixed casein starter. Most isolates in a random selection of 160
individual S. cremoris colonies took longer than the parent mixed
starter to coagu late autoclaved skimmilk at 22 C. More than half
required 2-3 days and some up to 7 days of incubation, in contrast to
the 17-20 h required by the mixed starters. Only 20o/o of the S. cremoris
isolates had the coagulation times and reached maximum cell dens ities
characteristic of the parent mixed cultu res. T he slow-coagul ating
isolates grew to only low population densities in milk although acid
production continued in stationary- phase cultures . The maximum cell
density and rate of acid production could be increased by culturing
together with a fast-coagulat ing strain, by addition of hydrolysed milk
proteins or amino ac ids. Whey samples from the casein precipitation
silos of eight commercial factories were examined for bacteriophage.
Viru lent phages were foundin all samples .
Lactic casein manufacture has been a significant
portion of total dairy processing in New Zealand for nearly 20 years, about 40,000 tons being produced in the 1972/73 season . Manufacture commences with a large
scale lactic acid fermentation of skimmilk to precipitate the casein. The resulting coagulum is heated and the curd, which then separates from the whey, is washed, dried , and ground to give powdered casein. The starters
inoculated into the silos to initiate the fermentation have been selected arbitrarily . In most instances, mixed
starters obtained from commercial supply houses as freeze-dried powders have proved to be adequate even though they were specifically formulated for cheesemaking. These starters generally comprise several strains of
Streptococcus cremoris, Streptococcus lactis, Streptococ
cus diacetilactis, and L euconostoc species although their exact composition is unknown and may vary on
subculture (1 3). The only requirement of starter bacteria in lactic
'caseinmaking is acid production. Instances of slow acid production by starters occur periodically in factories. However, unlike cheesemaking, slow acid production in caseinmaking rarely causes acute processing difficulties which jeopardize manufacture and total starter failure may be overcome by addition of mineral acid.
Consequently, in most instances the reasons for the
reduced starter activity are not determined. The variety of bacteria present in mixed starters has precluded
evaluation of the significance of phage. When a defined multiple starter system was used in a commercial factory, virulent phages were found usually within a few days of
introduction of the component organism (17). In
addit ion, the starters appeared to be more vulnerable to phage attack during casein manufacture than in
cheesemaking. This study was undertaken to investigate the
properties of mixed casein starters and to determine the
reasons why most factories can use these starters for extended periods without obvious slow coagulation of the milk .
MATERIALS AND METHODS
FactOIJI samples
Mixed starters were samples of freshly inoculated bulk starter milk.
Samples were kept at 0 C for up to 24 h during transport to the
Institute, then incubated at 22 C. After coagulation, cultures were
transferred (I o/o) into autoclaved reconstituted sk immilk (RSM , 9.5 "1o
tota l solids), frozen using a solid C0 2-eth anol freezing mixture and
stored at - 75 C. Inoculated cultures were thawed rapidly, incubated at
22 C overnight and subcul tured (0 .5o/o inoculum) daily in autoclaved
RSM five times before use . Whey samples were obta ined after centrifugation (30,000 x g for 1
min) of coagulated milk from factory mother cultures, bulk starter
vessels and casein precipitation silos.
Phage detection
Strains AM 2 , R6, Z8 (S. cremoris), H1 and ML8 (S. lactis) were
selec ted as potential indicators of phages in whey from casein factories .
None of the five stra ins was sensitive to a common phage when tested
against the phages of the Insti tute's collection. An add itiona l 15 S.
cremoris isolates derived from several mixed starters (I 7) were also
tested to ensure that a wide range of organisms were investigated as
possible hosts. Samples of factory whey (0.05 ml) were added to culture tubes
containing 10 ml autoclaved R5M . Each tube was inoculated (I o/o) with
one of the 20 indicator cultures and incubated at 22 C overnight . This
step was included to increase the titer of any phages present and reduce
the likelihood of non-specitic phage-associated lysin reactions (10).
Whey preparations from these cultures were spotted undiluted and at
decimal di lu tions on lawns of the indicator organisms prepared by soft
agar overlay on M 16 agar plates containing 5 mM calcium
borogluconate (7) .
Coagulation time The time (h) required by a starter (0 .1 % inoculum) to lower the pH of

270 THOMAS AND LOWRIE
RSM to 4 .7 at 22 C was referred to as the coagulation time . Starters with coagulation times of less than 24 h (termed " fast-coagu lating" starters) were grown in pasteurized (62.5 C for 30 min) RSM . All other isolates (termed "slow-coagulating" starters) were grown in autoclaved RSM. The cultures used for inoculation were grown in autoclaved RSM (0.1% inoculum, 22 C, 24 h) and determinations of coagulation times were done using RSM prepared from a standard batch of low-heat spray dried skimmilk powder.
Routine colony counts
The blender treatment described by Martley (9) reduced streptococcal chains in culture samples to uniform size, mainly diplococci . Samples were diluted in 1/10 strength M16 broth (7)
and plated on an agar medium which differentiates S. cremoris from other streptococci (12). Plates were incubated at 30 C for 48 h aerobically, or in a So/o (v/v) C02-air mixture. In some experiments cultures were plated on milk agar (autoclaved RSM solidified with 1% Davis New Zealand agar) .
Composition of mixed strain cultures
Freshly coagulated cultures of mixed starters were plated on the differential agar at dilutions giving about SO colonies per plate. The proportion of S. cremoris organisms in a total of 500 colonies (about 10 plates) was determined for each starter. Individ ualS. cremoris colonies from each mixed starter were inoculated into autoclaved RSM. Subjectivity in selecting colonies was eliminated by plating at a dilution giving approximately 10 colonies per plate and isolating every visible S. cremoris colony on each plate. At least two plates were required for each mixed starter to obtain 20 S. cremoris colonies.
D!fjerentiation of S. cremoris isolates
The individual components of cultures comprised of S. cremoris isolates 170 and 364 were distinguished by their consistently different response to incubation in C02-air mixtures when plated on differential agar (12). Isolate 170 failed to give visible colonies unless plates were incubated in an atmosphere enriched with C02 (15), whereas isolate 364 grew equally well in either normal or C02-enriched air. Colonies of S. cremoris isolates 186 and 366 showed consistent differences in both size and yellow color intensity when plated on differential agar and incubated in a normal atmosphere .
Materials
Trypticase (pancreatic digest of casein) and Lactalysate (pancreatic digest of lactalbumin) were products of Baltimore Biological Laboratories. Trypsin (type III , 2 x crystallized), glycine and the L-isomers of alanine, arginine, aspartic acid, cystine, glutamic acid, histidine, isoleucine, leucine, lysine, methionine, phenylalanine, proline, serine, theronine, tryptophan, tyrosine and valine were obtained from Sigma.
RESULTS
Use of mixed starters in casein factories
Important differences were found between starter propagation techniques used in casein factories and those employed in New Zealand cheese factories. In casein factories mother cultures were usually prepared by transferring coagulated culture (1-So/o) into heat-treated (100 C for 1 h) skimmilk. Following incubation for 24 h at ambient temperature these cultures were inoculated (0.1 -0.So/o) into pasteurized skimmilk contained in bulk starter vessels. After coagulation at 22-26 C, bulk starter was inoculated into pasteurized skimmilk in the main coagulation silos (Table 1). Neither mother cultures nor bulk starters were prepared with aseptic precautions. No measures were taken to prevent airborne phage contamination and manipulations were carried out in the main factory. In contrast, starter cultures for
TABLE 1. M ixed starter actiVIty in commercial casein factories: sunzmcuy of daily records over 90 consecutive days in the period No· vember 1972-March 1973
Starter Temperature Mean Incubation inoculum at inoculation processing required
Factory (%) (C) pH ± SDa (h)
A 0.1 -o.s 22-24 4 .59 ± 0 .23 16 - 18 B 1.0 22 - 24 4.52 ± 0.06 10 - 14 c 0.02-().2 22-24 4.56 ± 0.08 14 - 17 D O.DJ-().04 1 23 - 27 4.50 ± 0.10 18 - 20 E o.2 -o.s 23 - 26 4.51 ± 0.09 16 - 17 F 0.05-{).J 26 4.42 ± 0.11 16 - 18 G 0.5 - 1.5 23 - 25 4.33 ± 0.08 18 - 19
astandard deviation .
cheesemaking are maintained aseptically and phage is excluded from both mother cultures and bulk starter cultures.
The factors influencing rate of acid development in silo milk varied considerably between factories. Volume of starter inocu lum and milk temperature were adjusted to give convenient coagulation times (Table 1) . Starter activity was recorded over a 3-month period at eight factories (Table 1). Unacceptably slow coagulation occurred at two factories on a total of 8 days although coagulum formation in some silos was normal on these days. The slow coagulation was attributed, therefore, to inhibitory substances in the milk. There was a progressive decrease in rate of acid production by mixed starters in six of the eight casein factories . When this slowing of acid development caused inconvenience, replacement starters were prepared, usually from the freeze-dried powder used initially.
Phages in factory whey
Virulent phages, capable of producing plaques on lawns of sensitive hosts, were present in whey samples from all factories (Table 2). These phages also prevented
TABLE 2. Presence of phages in whey from lactic casein factories
Strain or isolate Factory tested a A B D E F G H
AM2 + + ++ + H, + ++ + ++ ++ + ++ ML8 + R, + z, + 114 + 134 + + + + 158 ++ + 168 + + + + + + 170 + + + + + 172 + + 184 186 + + + + 188 + + ++ ++ ++ 224 ++ 240 ++ 242 ++ ++ 266 272 ++ 290 ++ + ++
a++ plaque formation. + zone of incomplete lysis . - no visible reaction with undiluted whey.
,

'
....
STARTERS AND PHAGES IN LACTIC CASEINMAKING 27 1
coagu lation of milk cultures of the appropriate indicator
organism. Other phage reactions however, appeared as zones of incomplete lysis on lawns and acid production
by the indicator strains was not eliminated entirely under
simulated caseinmakingconditions. The phage reactions
given by whey samples from the mother culture, bulk sta rter , and coagulation silos of a given factory were all
similar .
Acid production by mixed starters
Mixed starters obtained from different factories had
similar coagulation times under standard laboratory conditions (Table 3) . The initial rate of acid production
TABLE 3. Activity ofS . cre moris isolates fro m mixed start ers
Mixed slar'ler Number of isolates and coagulation Percent days at 22 C to coagulate
Factory t ime(h) S. cremoris milk
Days 1 2 3 4 5 7
B 17 92 9 6 2 2 0 17 86 2 18 E 17 88 2 16 I 1 F 19 36 11 2 3 2 2 G 18 68 3 2 8 4 2 H 18 75 4 3 5 3 4 1 I 20 70 2 14 2 I 1 J 18 79 3 8 2 1 6
was similar to that observed with single strains but acid
development in most mixed cultures consistently stopped at a higher pH va lue (4.5-4.6 rather than 4.2-4.3). Typical data are given in Fig. 1. The change in rate of acid
7.0
6.0
pH
5.0
4.5 ~
--------------~--------
4.0 l.Py\r'-------0 8 18
TIME (h)
28
Figu re I . Acid production by starters (0.1% inoculum of24-h culture at 22 Cl in pasteurized RSM at 22 C. S. cremor is 242. (~); mixed
starter f1·om .f{lctOIJ' E. (0): and mixed starter E in pasteurized RSM
containing 0.2% T!J•pticase. (• ).
production corresponding to that in fast -coagulating single strain cultures nea r pH 4.6, occurred in mixed
sta rters near pH 4.7 (Fig. 1) . Therefore in order that
coagulation times recorded for mixed and single strain
cu ltures reflected comparable stages in overall acid
development. this higher pH value was adopted as the
end-point in obtaining coagulation times of mixed
starters. In commercial practice , coagulation of the milk
generally occurs several hours before the coagulum is "cooked" so that a reduction in the rate of acid
production may not affect processing.
Composition of mixed starters
After five subcu ltures in the laboratory, coagulated mixed starter cultures contained about 5 x 10⁸ colony forming units (cfu)/ ml. In all but one of the mixed
starters examined, 70-90% of the total bacteria were S. cremoris (Table 3). T he remainder were identified only as acid producing streptococci.
IndividualS. cremoris colonies were isolated and these
req uired from 1 to 7 days to coagulate autoclaved sk immilk at 22 C (Table 3). Only 2-4 of the 20 colonies isolated from each of six mixed starters coagulated milk
as rapidly as the corresponding parent culture, and less than ha lf of the isolates from the other two mixed starters
were as fast as the parent cultures. Most of the remaining isolates required 2-3 days incubation to coagulate mi lk,
some even requiring up to 7 days. It appeared therefore, that mixed starters were
comprised largely of slow-coagulating S . cremoris organisms. The procedure of plating, selecting, and
characterizing 20 colonies was repeated using nine single stra in cu ltures known to have fast-coagulating times. All 180 isolates coagulated milk within 24 h at 22 C thus eliminating the possibility that slow-coagu lating
organisms were artifacts produced by plating on differential agar . In addition , colonies selected from milk aga r plates of mixed starters B, D, and E (90% S. cremoris) gave a distribution of coagulation times similar to that found with the isolates from differential agar. The
overall S. cremoris composition of mixed starters and range of activity of component organisms did not show large daily fluctuations because data similar to that
recorded in Table 3 were obta ined with bulk starter samples direct from factories and after subcu lturing six,
seven and eight t imes.
Properties of slow-coagu lating S . cremoris organisms
Growth and acid production at 22 C in autoclaved RSM cultures of a typical slow-coagulating S. cremoris
isolate is shown in Fig. 2. The doubling time during
logarithmic growth was about 1.8 h. The cu lture reached the stationary phase and a plate count of 7 x 10⁷ cfu / ml after one day but acid production continued slowly un til coagu lation occurred after 6 days . This pattern of growth and ac id production was characteristic of all slow-coagulating isolates examin ed and remained unchanged after prolonged subculture. A 100-fold increase in t he inoculum (0 .01 to 1 o/o) caused no obvious change in the coagulation time of S. cremoris 366 and

272 THOMAS AND LOWRIE
7.0
I
I ;4
. / 7
__ _ _!__...
..-
"' .... z ::I
~~------------~-------------L~J05
28
Figure 2 . Growth (broken lines ) and acid production (unbroken lines) at 22 C in autoc/aved RSM cultures (0.5% iuoculum) ofS. cremoris 366. Control, 0 ; plus 0.2% Trypticase, •; plus amino acids (0.5 mgl ml of each of / 8 amino acids), fj. ; plus 0.2 ,_.gl ml tyrpsin , D .
raising the incubation temperature from 22 C to 30 C decreased the coagulation time from 6 to 3 days.
The preponderance of slow-coagulating organisms in mixed starters indicated that growth stimulatory interactions between strains may occur in milk culture. Combinations of fast- and slow-coagulating isolates had coagulation times characteristic of fast-coagulating organisms (Table 4). Investigations of pairs of fast and
TABLE 4. Stimulatory interactions at 22 C in pasteurized RSM between fast - and slow-coagulating S. cremoris isolates
Isolate(% inoculum") Incubation clu per ml x 10·7
Fast Slow (h) pH Fast
170(0.1) 17 4 .7 68 364 (1.0) IS 6.1
170 (0.1) + 364 (1 .0) IS 4.7 21 170 (0 .01) 22 4 .7 62
364 (0.1) 20 6.2 170 (0.01) + 364 (0.1) 20 4.7 II 186 (0.1) 19 4 .7 59
366 (0.5) 18 6.2 186 (0.1) + 366 (0.5) 18 4.7 43
a Parent cultures: fast -coagulating isolate 6 x JOB cfu / ml slow-coagulating isolate 1 x JOB cfu / ml.
Slow
4.6 46
5. 1 45
6.2 36
slow isolates, which could be distinguished from each other in samples of combined cultures, showed that rapid coagulation was not solely due to growth and acid production by the fast component. From Table 4 it can be seen that in the presence of a fast strain, the slow-coagulating isolates multiplied in the same time to a population density 10 times greater than that reached when cultured individually. There was a corresponding increase in overall acid production and hence a shortened coagulation time. Various combinations of up to eight slow-coagulating isolates originating from
different mixed starters were grown together in milk. All cultures had extended coagulation times which were similar to those of the individual components.
In RSM containing 0.2% (w/ v) Trypticase cultures of all 124 colonies isolated, which normally required 2-7 • days to coagulate milk (Table 3), coagulated in less than 24 h at 22 C. Trypticase addition boosted cell densities as .. well as overall acid production to levels comparable with ' fast-coagulating organisms (Fig. 2). Addition of a mixture of 18 amino acids also shotiened coagulation times . The 18 amino acids added individually had no apparent effect . The extent of stimulation obtained by supplementation with either Trypticase (0.2 %, w/v) or amino acid mixture (0.5 mg/ ml of each amino acid) was approximately equivalent (Fig. 2). Addition of larger amounts did not further enhance growth and acid production. Lactalysate supplementation (1.0%, w/ v) of RSM gave greater stimulation of slow-coagulating isolates than observed with saturating levelsofTrypticase or amino acid mixture. The coagulation time of cremoris 366 in RSM containing the optimum quantity of Lactalysate (1.0%, w/ v) was 2 h less than the shortest period found with Trypticase addition. Addition of trypsin to pasteurized RSM also shortened coagulation times of slow organisms (Fig. 2). The optimum amount of trypsin was 0.2 11g/ ml, concentrations above 0.5 11g/ ml reducing the rate of acid production .
Enhancement of growth and acid development by Trypticase supplementation ofRSM was not restricted to slow-coagulating isolates. Acid production by mixed starters increased and lower final pH values were reached (Fig. 1). In addition, there were 1-2 h reductions in the coagulation times of fast single strains.
DISCUSSION
Virulent phages were detected in whey samples from each of eight lactic casein factories located throughout the principal dairy manufacturing areas of New Zealand. Of the 20 potential indicator organisms used in the screening of whey samples, five strains (AM 2, H 1, ML 8,
R 6 and Z~ were representatives of different patterns of phage susceptibility amongst cheese starters . No phages in the Institute's collection attacked the remaining 15 test organisms which were recent isolates from mixed starter cultures (1 7). Therefore, when lytic reactions were observed on several of the diverse selection of indicator organisms , whey samples probably contained a number of different phages rather than a single phage type which attacked a broad range of hosts with varying efficiency. Crawford and Galloway (2) in a study of Scottish cheese factories found that phage was normally present in mixed starter cultures.
Phages are widespread in the factory environment and with no· aseptic precautions in the starter hand ling procedures, cultures must repeatedly become contaminated by phages. Thomas and Lowrie (1 7) showed that regular addition of whey from previous manufacture to otherwise aseptically handled mother cultures enabled a
'
I
·~
' -
STARTERS AND PHAGES IN LACTIC CASEINMAKING 273
mixture of four S. cremoris isolates to be used daily for
commercial caseinmaking over a complete dairying
season without acid production failure due to phage. There is presumably a constant selection for organisms
able to grow in the presence of phage. Continual phage contamination, causing the development of 'phagetolerant' variants during growth of mother cultures and bulk statiers, may be required for the prolonged use of
mixed starters without obvious instances of slow coagulation in the casein precipitation silos.
Mixed starters for analysis of bacterial composition
were obtained from casein factories as samples of freshly inoculated bulk starter milk. After coagulation , these
cultures should consist of the organisms that grow
actively during caseinmaking. These organisms were
found to be predominantly S. cremoris even though the original powdered cultures initially contained several
different species of bacteria. A similar dominance by S. cremoris was found in a European study of 70 mixed
starters from cheese and butter factories (8). The S. cremoris component must be best able to survive phage
attack and adapt to the rigorous conditions of culture used in factories.
Examination of the acid producing activity of individual S. cremoris isolates from the mixed casein
starters showed that most were slow-coagulating organisms. About 80 % of the randomly selected S. cremoris colonies had much longer coagulation times than the parent mixed starters . Garvie (4) mixed a slow
variant of S. cremoris 924 with the fast parent strain in
milk culture and found that a balance between the two cell types was established after several subcultures with
the slow variant comprising about 95 % of the population.
This balance was independent of the initial ratio of fast and slow cells . Like the combination cultures of fast and slow variants of S. cremoris 924 the mixed casein starters
I had acid producing activities similar to those of their fast-coagulating minority components. Slow- and fast-coagulating isolates from casein starters had similar
growth rates but, in milk, slow isolates reached only lO o/o
of the normal maximum population density. Acid production continued in stationary-phase cultures until coagulation eventually occurred several days later.
Therefore , slow coagulation resulted from growth limitation at low cell densities and not because of a reduced growth rate . Similar observations have been
made with slow variants derived from S. lactis C2 (1).
Addition of amino acids or protein hydrolysate to milk increased the maximum cell density and rate of acid
production of slow-coagulating isolates to levels characteristic of the fast-coagulating organisms and the
parent mixed starters. This suggests a proteinase defitiency in slow-coagulating isolates from mixed casein starters. Milk contains small amounts of free amino acids
and peptides (3. 14) which appear to permit only limited growth of these organisms. Accumulation of slow variants in milk cultures of lactic streptococci and their stimulation by addition of protein hydrolysates is well
known (1 , 5, 6) . Slow variants appear to be deficient in a
cell wall-bound proteinase due to loss of an extra-chromosomal element (1 1).
When paired in milk culture, both fast- and
slow-coagulating organisms grew to similar population densities , suggesting that the fast organism supplied
amino acids or peptides for growth of the proteinase-deficient organism. This interaction may be a
consequence of proteinase localization near the surface of the bacterial cell wall (I 6) , since the products released
by this enzyme may diffuse into the surrounding
medium. All mixed casein starters contained fast-coagulating S. cremoris organisms capable of
stimulating growth of slow organisms. This stimulation
may allow the dominance of mixed starters by organisms which , on isolation, grew to only limited population densities in milk.
Mixed casein starters usually stopped producing acid
at pH 4.5-4.6 , whereas typical single strain cultures fell to pH 4.2-4 .3 under the same conditions. This difference has consid erable practical significance since in lactic caseinmaking the higher pH va lues are preferred because
excessively low coagulum pH has detrimental effects both in the processing and properties of the product. S.
lactis cell wall proteinase activity declined rapidly as the assay pH was dropped below 6 (16) suggesting that the
ability of fast -coagulating organisms to hydrolyze proteins in milk decreases as the pH falls . In mixed
cultures, containing predominantly proteinase-deficient organisms , cell division may be prevented at higher pH
values through nitrogen limitation thus accounting for
the higher final pH of coagulated mixed cultures. Lower final pH va lues from addition of protein hydrolysate to these mixed starters supports this explanation. Thus a
preponderance of proteinase-deficient organisms in mixed casein starters may fortuitously produce a coagulum near the preferred pH value for processing as well as minim al loss of casein yield from starter proteolys is .
ACKNOWLEDGMENT
Grateful ac knowled gment is mad e to Miss R. M . A. Thomas and
Miss P. Crombie fo r exce ll ent technical ass istance and to Dr. R . C.
Lawrence for va luable sugges tions a nd discussions .
REFERENCES
I. Citti . J. E .. W. E. Sa ndine, and P. R. Elliker. 1965. Comparison of
slow and fast ac id -producing Streptococcus lactis. J . Da iry Sci .
48: 14-1 8 .
2. Crawford. R. J. M .. a nd J. H. Galloway, 1962. Bacteriophage con
tamina tion of mixed -s tra in cultures in cheesemaking. 16th Intern .
Dairy Cong . B: 785-790.
3. Deutsch . A .. a nd E. G. Sa muelsson. 1959. Amino acids a nd low
molecul a r weight a mino-acid derivatives in cow's milk . 15th
Intern . Da iry Congr . 3: 1650-1652. 4. Garvie . E. I. 1959. Some observations on slow a nd fast acid-pro
ducing va ri a nts of stra ins of S treptococcus cremoris and Str. lac/is
used as cheese sta r ters . J. Da iry Res. 26: 227-237.
S. Ga rvie. E . I.. a nd L. A. Ma bbi tt. 1956 . Acid production in milk by starter cultures-the e ffect of peptone and other stimulatory sub
sta nces . J . Dairy Res . 23 :305-3 14.
274 THOMAS AND LOWRIE
6. Harriman, L. A. , and B. W. Hammer. 1931. Variations in the
coagu latio n and proteolys is of mi lk by Streptococws lac tis. J.
Dairy Sci. 14:40-49.
7. Lowrie, R. J ., and L. E. Pearce. 197 1. The plating efficiency of bac
teriophages of lactic st reptococci . N.Z. J. Dairy Sci. Techno!. 6:
166-171.
8. Liibcnau-Nest le . R .. and H. Mair-Waldburg. 1966. Untersuchun
gen llbcr die bakteriologische Zusammensetzung von Sliureweck
ern. 17th Intern. Dairy Congr. C:321-327 . (Dairy Sci. Abst. 28:
570.)
9. Martlcy. F. G . 1972. The effect of cell numbers in st reptococcal
chains on plate-counting. N.Z. J. Dairy Sci. Techno!. 7:7-11.
10 . Oram, J.D., and B. Reiter. 1965. Phage-associated lys ins affect
ing group N and group D streptococci. J. Gen. M icrobiol. 40:57-70.
II. Pearce, L. E., N. A. Skipper, and B.D .W. Jarvis. 1974. Proteinase
activity in slow lactic acid-producing variants of Streptococcus
lac/is. Appl. Microbial. 27:933-937.
12. Reddy , M.S., E. R. Vedamuthu. C. J. Washam. and G. W. Rein
bold. 1969. Differential agar medium for sepa rating Streptococ
cus lac tis and Streptococcus cremoris. Appl. Microbial. 18:755-
759. 13. Reddy. M.S .. E. R. Vedamuthu, C. J. Washam, and G. W . ~ein
bold. 1972. Associative growth studies in three-strain mixtures of
lactic streptococci . Appl. Microbial. 24: 953-957.
14. Schwartz, D. P. , and M. J. Pallansch. 1962. lndentitication of
some nitrogenous constituents of cow's milk by ion excha nge and
paper chromatography. J. Agr. Food Chem. 10:86-89.
15. Thomas , T. D. 1973. Agar medium for differentiation of Strept
ococws cremoris from other bact~ria. N.Z. J. Dairy Sci. Techno!.
8:70-71. 16. Thomas. T. D .. B. D. W. Jarvis. and N. A. Skipper. 1974. Localiza
tion of proteinase(s) near the cell surface of Streptococcus lactis.
J. Bacterial. 118:329-333.
17. Thomas. T. D .. and R. J. Lowrie. 1975. Starters and bacterio
phages in lactic acid casein manufacture. II. Development of a
controlled starter system. J. Milk Food Techno!. 38:60n press).
'
.. I
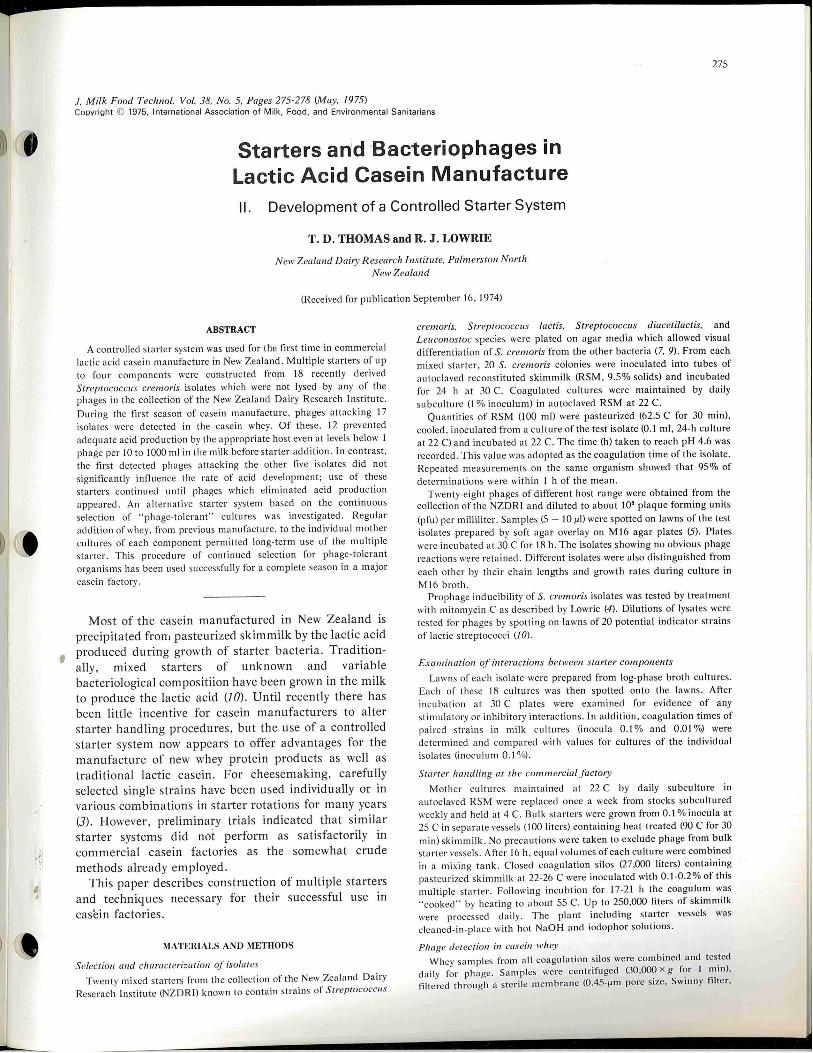
I
·~
' '
275
J. Milk Food Techno/. Vol. 38, No. 5, Pages 275-278 (May, 1975) Copyright © 1975, International Association of Milk, Food, and Environmental Sanitarians
Starters and ·Bacteriophages in Lactic Acid Casein Manufacture
II. Development of a Controlled Starter System
T. D. THOMAS and R. J. LOWRIE
Ne111 Zealand Daity R esearch Institute. Palmerston Notth Ne111 Zealand
(Received for publication September 16 , 1974)
ABSTRACT
A controlled sta rter system was used for the first time in commercial
lactic ac id casein manufacture in New Zealand. Multiple starters of up
to four components were constructed from 18 recently derived
Streptococcus cremoris isolates which were not lysed by any of the
phages in the collection of the New Zealand Dairy Research Institute.
During the first season of casein manufacture. phages attacking 17
isolates were detected in the casein whey. Of these, 12 prevented
adequate acid production by the appropriate host even at leve ls below I
phage per 10 to 1000 ml in the milk before starter addition. In contrast ,
the first detected phages attack ing the other five isolates did not
significantly influence the rate of acid development; use of these
sta rters continued until phages which eliminated acid production
appeared . An alternative sta rter system based on the con tinuous
se lection of " phage-tolerant" cultures was invest igated. Regular
addition of whey, from previous manufacture , to the individual mother
cultures of each component permitted long-term use of the multiple
sta rter . This procedure of continued selection for phage-tolerant
organisms has been used successfu ll y for a complete season in a major
casein factory.
Most of the casein manufactured in New Zealand is
precipitated frorn pasteurized skim milk by the lactic acid
1 produced during growth of starter bacteria. Tradition
ally, mixed starters of unknown and variable
bacteriological compositiion have been grown in the milk
to produce the lactic acid (10). Until recently there has
been little incentive for casein manufacturers to alter
starter handling procedures , but the use of a controlled
starter system now appears to offer advantages for the
manufacture of new whey protein products as well as
traditional lactic casein. For cheesemaking, carefully
selected single strains have been used individually or in
various combinations in starter rotations for many years
(3). However, preliminary trials indicated that similar
starter systems did not perform as satisfactorily in
commercial casein factories as the somewhat crude
methods already employed. This paper describes construction of multiple starters
and techniques necessary for their successful use in
casein factories.
MATERIALS AND METHODS
SelPction and characterizMion of isolates
Twenty mixed starters from the collect ion of the New Zea land Dairy
Reserach Institute (NZD RI) known to contain strai ns of Streptococcus
cremoris. Streptococcus /actis. Streptococcus diacetilact is. and
Leuconostoc species were plated on agar media which allowed visual
differentiation of S. cremoris from the other bacteria (7. 9). From each
mixed starter , 20 S. cremoris colonies were inocu lated into tubes of
autoclaved reconstituted skimmilk (RSM, 9.5% solids) and incubated
for 24 h at 30 C. Coagulated cultures were maintained by daily
subculture (I% inoculum) in autoclaved RSM at 22 C.
Quantities of RSM (100 ml) were pasteurized (62 .5 C for 30 min).
cooled, inoculated from a culture of the test isolate (0.1 ml , 24-h culture
at 22 C) and incubated at 22 C. The time (h) taken to reach pH 4.6 was
recorded. This va lue was adopted as the coagulation time of the isolate.
Repeated measurements on the same organism showed that 95% of
determinations were within 1 h of the mean.
Twenty-eight phages of different host range were obtained from the
collection of the NZDRI and diluted to about 108 plaque forming units
(pfu) per milliliter. Samples (5 - 10 fJI) were spotted on lawns of the test
iso lates prepared by soft agar overlay on M16 agar plates (5). Plates
were incubated at 30 C for 18 h . The isolates showing no obvious phage
reactions were reta ined . Different isolates were also disti nguished from
each other by their chain lengths and growth rates during cu lture in
Ml6 broth. Prophage inducibility of S. cremoris isolates was tested by treatment
with mitomycin Cas described by Lowrie (4). Dilutions of lysates were
tested for phages by spotting on lawns of 20 potential indicator strains
of lactic streptococci (I 0).
Examination of interactions bet111een starter components
Lawns of eac h isolate were prepared from log-phase broth cultures.
Each of these 18 cultures was then spotted onto the lawns. After
incubation at 30 C plates were exam ined for evidence of any
st imul atory or inhibitory interactions. In addition, coagulation times of
paired strains in milk cultures (inocula 0.1% and 0.01 %) were
determined and compared with values for cultures of the individual
isolates (inoc ulum 0.1 %).
Starter handling at the commercialfactoty
Mother cultures maintained at 22 C by daily subculture in
autoclaved RSM were replaced once a week from stocks subcultured
weekly and held at 4 C. Bulk starters were grown from 0.1 % inocula at
25 C in separate vessels (100 liters) containing heat-trea ted (90 C for 30
min) skimmilk. No precautions were taken to exclude phage from bulk
starter vesse ls. After 16 h, equa l volumes of each culture were combined
in a mixing tank. Closed coagulation si los (27,000 liters) containing
pasteurized sk im milk at 22-26 C were inoculated with 0.1-0.2 % of this
multiple starter. Following incubtion for 17-21 h the coagulum was
"cooked" by heating to about 55 C. Up to 250,000 liters of skirnmi lk
were processed daily. The plant including starter vessels was
cleaned-in-place with hot NaOH and iodophor solutions.
Phage d etect.iou in casein wh ey
Whey samples from all coagulation silos were combined and tested
daily for phage. Samples were centrifuged (30,000 x g for I min).
filtered through a steri le membrane (0 .45-flrn pore size, Swinny Iiller.

276 THOMAS AND LOWRIE
Millipore ·Corp.) and spotted undiluted and at several dilutions on
lawns of the components of the multiple starter. When lytic zones or
plaques were observed the sensitive culture was withdrawn from the
starter system and replaced by a culture which gave n_o obvious reaction
with the phage .
Determination of ''phage-sensitivity·· of" starters
Newly isolated phages were puritied using standard procuedures. A
measure of the .sensitivity of a host organism to a specitic phage was
derived from the maximum initial phage level which allowed
coagulation within I h of the time required by the control culture. Since
plaque assays were often unreliable (see text), approximate ph age levels
in cultures and whey samples were de termined by the dilution
end-point method (/).
Development of ''plzage-ioleran( ' cultures
Autoclaved RSM cultures (inoculum 0.1 %) were infected with 1-10
particles/ ml of the appropriate. phage isolated from -the factory whey.
Cultures wen; incubated at 22 C until coagulation occurred and then
maintained by daily subculture at 22 C. The coagulation times of these
cultures were determined at intervals for up to 30 subcultures and whey
samples tested for the presence of phages.
RESULTS
Properties ojS cremoris isolates
Eighteen -distinguishable isolates were obtained which
had coagulation times of 16-20 h. Different isolates showed no evidence of any interactions when growing together either in milk or on agar plates. Treatment
with mitomycin C induced complete lysis of isolates 186 and 240, suggesting that they may be lysogenic, but
lysates gave no signs of lytic reactions when spotted on lawns _ prepared from a broad range of possible indicators.
Use of multiple starters for caseinmaking
Changes in proportions of component bacteria during
growth of the multiple starter could not be determined since there were no techniques allowing adequate
differentiation of S. cremoris isolates. A balance of the individual starters in the coagulation silos was ensured
by growing cultures in separate bulk starter vessels. Although increasing the number of phage-unrelated organisms in the multiple starter reduces the effect when any one is eliminated by phage, operating more than four ·
buik starter vessels was impractical. Therefore multiple starters with four components were used. The effect on the coagulation time when component organisms were lysed by phage was assessed in the laboratory. Lysis of one starter made no detectable difference but the lysis of two
or three staters together increased coagulation times by 1-2 h depending on the particular phage and its initial level.
Phages attacking 17 of the 18 different isolates appeared during the first season of manufacture. No
phage was detected for isolate 114 which was used
continuously in caseinmaking over two seasons . Usually a phage was isolated within one week of the starter being
introduced although some organisms remained free of
detectable phage for up to 9 weeks (fable 1). Derivatives
of isolates 176 and 266 were obtained which were not
TABLE I. S. cremoris isolates used in multiple starters and the days
(in brackets) of use before detection of phage
114 a, 170 ( 5), 186 (1 7), 242 ( 3), 318 ( 3),
134 (51), 172 ( 2), 188 ( 6) , 266 ( 2), 320 ( 6)
158 (40), 176 ( 5) , 224 ( 5), 272 ( 5),
168 (63) 184 (29) 240 (22) • 290 ( 8)
aNo phage detected .
lysed by their respective phages isolated from factory whey. These derivatives (318 and 320, respectively) were reintroduced but different phages which caused complete lysis were isolated within one week (fable 1).
For 12 of the phages detected, addition of 1-10 particles to a freshly inoculated 100-ml culture of the appropriate
host stopped acid production before the pH fell to 4.6. These host strains were classified as having a phage sensitivity of less than 10-1 phage/ ml (Table 2).
TABLE 2. '"Phage-sensitivity" of S. cremoris isolates under typical
caseinmaking conditions
Group Isolate Maximum titer
Phage-sensitivity• recorded (phage/mil
134, 168, 172 J76, J84 , 188 [ 266 , 272 , 3J8 ( <10"1 10'0- JO" 320 ! 242 , 290 / J- JO
JS8 170 186 224 240
104 - J05
101 - J02
102 - 103
>J05
>106 .
JOIO_ JO"
· 109 - JOIO 106 - JO' JOB - 109 JOB - J09 J09 - JOIO
aM aximum initia l titer (phage / ml) allowing normal coagulation time (± 1 h). bAcid production by group A strains eliminated by phage. CAcid production by group B strains not eliminated by phage.
Despite the often rapid appearance of phages , the rate
of acid production by these multiple starters was regular
and the limited incidents of slow coagulation were not due to phage attack. A multiple starter consisting of isolates 114, 134, 158, and 240 gave regular acid
production when used in small-scale casein manufacture at NZDRI. In contrast to the commerical factory , no phages were isolated from NZDRI casein whey during
two seasons of manufacture thus emphasizing the importance of evaluating experimental starter systems in
commercial factories where phages seem more likely to appear.
The first phages isolated for starters 158, 170, 186, 224, and 240 did not eliminate acid production under caseinmaking conditions and whey samples of high titer ,
determined by the dilution end-point method , gave zones of incomplete lysis when spotted on lawns. The coagulation times of the first three starters were
unaffected until the initial titer of added phage reached a relatively high level (fable 2) while acid production by
isolates224 and 240 was not measurably influenced even when the phage present at inoculation exceeded 1Q5/ ml.
Initial titers of 1/ ml of the phages attacking isolates 158 and 240 yielded 108 phage/ ml in the coagulated culture
'

'
'
4 "
STARTERS AND PHAGES IN LACTIC CASEINMAKING 277
(inoculum 0.1% in pasteurized RSM at 22 C) , a phage
multiplication factor under simulated caseinmaking
conditions of 108. In contrast the remaining 12 phages
had multiplication factors of more than 1011 . The isolates
with low phage multiplication factors were re-introduced
into the multiple starter system at the casein factory even
though phages were known to be present. However,
phages which could eliminate acid production were
isolated for these statiers between 2 and 7 months after
their re-introduction.
A similar progression of phages possessing successively
higher multiplication rates was also found when the
isolate S. cremoris 166 was introduced into cheese
factories. The first phages isolated from the whey
samples of eight cheese factories were used to determine
the _ "phage-sensitivity" (the highest initial phage level
permitting normal acid production) of isolate 166 under
caseinmaking conditions. The sensitivity to three phages
was less than 10-1 phage/ mi. his level was more than 10 5
phage/ml for the other five phages.
Use of continuously selected "phage-toleran(' starters
Cultures tolerant to the phages which prevented
adequate acid development were readily prepared in the
laboratory for nine of the 12 isolates listed in group A
(Table 2). After several subcultures the coagulation times
reached constant values which were about 2 h greater
than the parent cultures (Table 3). After subculturing 30
TABLE 3. Selectionof "phage-toleram" cultures and the change of'
coagulation time with subculture · ·
Coagulation t ime (h)a Parent
Phage-tolerant culture Culture
umber of Isolate subcultures 3 7 It 30
168 > 24 19 21 19 20(+)b 18
172 > 24 21 22 20 20(+) 19
176 > 24 > 24 > 24 21 20(- ) 18
184 > 24 21 20 19 19(+) 20
188 > 24 > 24 21 20 21(- ) 18
240 23 21 20 20 20(+) 20
242 22 23 23 22 22(+) 18
266 > 24 21 22 20 19(+) 16
272 > 24 22 23 22 21(- ) 20
290 >24 22 21 20 21(+ ) 20
3 T ime (h) to reach pH 4.6 in pasteurized RSM at 22 C (inoculum 0.1 %).
b(+) Original phage present, (- )original phage not detectable .
times, most cultures still contained the original phage
(Table 3). Phage were not detected in some cultures when
tested in either mid-logarithmic growth or after
coagulation. Whey frori1 these cultures was added to
freshly inoculated cultures of the parent starter. After
appropriate incubation, phage tests still gave negative
results. Phage-tolerant cultures of isolates 134, 318, and
320 with a satisfactory rate of acid production could not
b~ prepared. Substantial changes in starter handling at the casein
factory were made to capitalize on these findings .
Filter sterilized whey, from previous manufacture , was
added to each mother culture daily to continuously select
for organisms able to produce acid in the presence of
phages . In ·addition, the four mother cultures (selected
from S. cremoris isolates 114, 158, 170, 186, and 224)
were inoculated into a single bulk starter vessel. The
coagulation times of starters subjected to this continued
sele'ction process were compared with the origin·aJ parent
cultures. Over 3 months the coagulation times had
increased by about 3 h. Regular monthly replacement of
factory cultures from frozen stocks of the original isolates
limited this increase to less than 2 h. Raising the
temperature of the skimmilk at inoculation compensated
for this reduction in starter activity.
DISCUSSION
Most studies of lactic streptococci have concerned
their use as starters in cheesemaking where the
requirement for fast acid producers at temperatures of
30-40 C severely restricts the number of strains available.
In casein manufacture the requirements of the culture
are less rigorous and a much greater range of strains
produce acid at an acceptable rate. Whitehead and
Hunter (1 I) instituted rotations of phage-unrelated single
strain starters for cheesemaking to prevent . slow acid
production caused by phage attack. The system depends
on excluding phage from the bulk starter vessel and
limiting the initial level of infection and rate of
multiplicationin the cheese vat, principles of starter
handling which have not changed to the present day (3).
In caseinmaking, complete control of starters would
require excluding phage from both the bulk starter vessel
and the coagulation tanks but this is impractical under
commercial conditions. Starters in casein manufacture
are more vulnerable to phage attack than in
cheesemaking. Whereas the rennet gel affords protection
from phage attack in cheese manufacture (6), there is no
rennet gel in lactic caseinmaking. In addition the cells
undergo twice as many doublings during casein
manufacture thereby allowing more cycles of phage
replication and hence an increased likelihood of total
lysis before sufficient acid has been produced.
A multiple starter system comprised of S. cremoris
isolates with no known phages failed because phages
capable of eliminating acid production appeared at high
frequency. f he origin of these phages is speculative.
Some were presumably selected from the factory
environment or the niilk supply while others may have
arisen as host range mutants or from host-controlled
modifications. A multiple starter consisting of the
isolates with apparently high phage-tolerance was tested.
This initial phage-tolerance may have been due to poor
phage absorption by the host or a low multiplication
efficiency of the phage. The gradual appearance of more
virulent phages capable of eliminating acid production
also rendered this statier system impractical.
Reiter (8) suggested that the lysogenic strains present
in a mixed culture obtained from ·a Scottish cheese
factory conferred on the culture additional protection
from phage attack thus permitting its use for long
periods. Lysogeny appears to be relativP.Iy widespt·ead

278 THOMAS AND LOWRIE
amongst the single strains isolated as cheese starters (4)
and of the 18 casein starter isolates tested, two were
inducible suggesting possible lysogenicity. However,
phages appeared which eliminated acid production by
these starters. Such results are not unexpected since it is
well established that lysogenic immunity is confined to
infection by the same or very closely related phages (2).
A system based on continuous selection of
phage-tolerant starters was found to be the only practical
means of using starters in a controlled manner for
caseinmaking. Such cultures were produced readily in
the laboratory by adding low levels of virulent phages to
cultures of the respective hosts. In most instances
cultures still contained the original phages after
subculturing 30 times. These cultures presum ably
comprised the relatively stable balance of susceptible and
resistant bacteria typical of classical pseudolysogeny (2).
At the factory regular addition of whey, from previous
manufacture, to mother cultures caused a continuous
selection of phage tolerant starters . although the rates of
acid production by the individual cultures decreased
slightly, overall acid production by the multiple starter
was kept constant for an entire manufacturing season by
slight adjustment of manufacturing conditions and
periodic renewal of cultures .
ACKNOWLEDGMENT
Grateful ack nowledgment is made to the Ma nag~r and staff of the
Waitakaru ru Branch of the New Zealand Co-operative Dairy Company
Ltd . for co-operation in this work , to Miss R. M. A. Thomas and Miss
P. Crombie for exce llent technical ass istance, and to Drs. R. C.
Lawrence and L. E. Pearce for valuable suggestions and discussions.
REFERENCES
I. Adams, M. H. I 959 . Bacteriophages . Interscience Publishers Inc. ,
New York . 2. Hayes, W. 1968. The genetics of bacteria and their viruses. 2nd ed.
Blackwell, Oxford. 3. Lawrence. R. C.. and L. E. Pearce. 1972. Cheese starters under
control. Dairy Ind . 37:73-78.
4. Lowrie , R. J. 1974. Lysogenic strains of group N lactic streptococci .
Appl. Microbiol. 27:2 10-2 17.
5. Lowrie , R. J. , and L. E. Pearce. 1971. The plating efficiency of bac
teriophages of lactic streptococci. N. Z. J. Dairy Sci. Techno!. 6:
166-171.
6. Meanwell , L. J ., and N. Thompson. 1959. The influence of rennet
on bacteriophage infection in the cheese vat. J . Appl. Bacteriol. 22:
281 -286. 7. Reddy. M.S. , E. R. Vedamuthu, C. J. Washam, and G. W. Rein
bold . 1969. differential aga r medium for separating Streptococcus
lactis and Streptococcus cremoris. Appl. Microbiol. 18:755-759.
8 . Reiter , B. 1973. Some thoughts on cheese starters . J. Soc. Dairy
Techno!. 26:3-15. 1
9. Thomas , T. D. 1973. Agar medium for d ifferentiation of Strepto·
coccus cremoris from other bacteria. N.Z.J . Dairy Sci. techno!.
8:70-71.
10. Thomas , T. D ., and R. J. Lowrie. 1975. Starters and bacterio
phages in lactic acid casein manufacture. I. Mixed strain starters.
J. Milk Food Techno!. 38: II. Whitehead. H. R., and G. J. E. Hunter. 1947. Bacteriophage in
cheese manufacture. Contamination from farm equipment. J .
Dairy Res. 15:112-120.

' •' \
279
J. Milk Food Techno/. Vol. 38. No. 5, Pages 279-280 (May, 1975)
Copyright © 1975, International Association of Milk, Food, and Environmental Sanitarians
~ ~e~ea~~~ ~~te
Productivity of Boiled and Autoclaved
Violet Red Bile Agar
JANE P. JENSEN and W. J. HAUSLER, Jr.
State Hygienic Laboratory, University oflowa
Iowa City, Iowa 52242
(Received for publication September 25, 1974)
ABSTRACT
Violet Red Bile (VRB) Agar which was boiled had significantly
greater productivity than did autoclaved VRB Agar when a 4-h
Esche1ichia coli culture was enumerated. There was no significant
difference between the boiled and autoclaved medium when a 16-r.
culture was exam ined.
The 13th Edition of Standard Methods for the Exami
nation of Dairy Products (SMEDP) states in Chapter 4
that Violet Red Bile (VRB) Agar may be used after
boiling for 2 min. It further states that VRB .... "can be
autoclaved without serious impairment of productivity"
(1).
Since the philosophy of SMEDP editors has been to
recommend only one method rather than alternative
procedures , and since the statement regarding
preparation of VRB either by boiling or autoclaving is
apparently without documentation , this study was
undertaken to determine the preferable method.
MATERIALS AND METHODS
Culture
I Escherichia coli ATCC 25922, used throughout the experiment , was
ma intained on Brain Heart In fusion slants and transferred weekl y. For
use, 9 ml of Nutrient Broth (Difco) was inoculated from the slant and
incubated at 35 C for 20 h .
,\ low form cul ture fl ask containing I liter of Nutrient Broth,
adjusted to 35 C, was then inoculated with 1 ml of the 20-h seed culture
and rotated on a mechanical shaker at 100 rpm . Incubator facilities
were not adequate to allow incubation of the low form flask at a
temperature other than 35 C. Samples were taken after 4 and 16 h of
incuba tion (predetermined to represent mid-log and mid-stationary
ph ases of growth).
A known pure culture was used for this study rather than a natural
source, such as raw milk , to make the procedure entirely
reproduceable.
M edia
VRB and Sta ndard Plate Count (SPC) agars were both manufactured
by Difco. VRB was prepared according to manufacturer's instructions
and sterili zed either by boiling for 2 min, as described in Chapter 4,
13th Edition SMEDP (!),or by autoc laving at 121 C for 15 min. SPC
Agar was prepared according to manufacturer's instructions and
autoc laved at 121 C for 15 min . All media were prepared fresh the day
of use.
Procedure
The 4- and 16-h cultures were diluted to a working level in phosphate
buffered dilution water prepared according to 13th Edition of SMEDP.
The cultu re was plated in replicates of 20 plates each for VRB-boiled ,
VRB-autoclaved ,a nd SPC agars. Plates were incubated at 32 C for
18-24 h and en umerated using a Quebec Darkfield Colony Counter.
The pl ating scheme a nd sta tistical analysis were done as described in
sect ions 4 .86 and 4 .87 of the 13th Ed ition of SMEDP.
RESULTS
The procedure was done on two separate occasions,
Triall and Trial 2, and results are presented in Tables 1
and 2. For each trial, the 4-h culture exhibited signifi
cantly greater yields on the VRB -boiled than on the
VRB-autoclaved medium. The SPC Agar was included to
give some indication of culture yield on a non-selective
TABLE I. Comparison of yield of VRB-boiled, VRB -autocla ved, and SPC agars when tested with E. coli A TCO 25922
4-h Cu lture 16-h Culture
VRB agar VRBagar
Boiled Autoclaved SPC agar Boiled Autoclaved SPC agar
Trial!
f!:..9f rep licates 20 20 20 20 20 20
X plate count (X 106) 30 1.4 275.85 294.7 48 .3 46.1 49.8
Range (x 106) 268-334 239-323 270-33 1 37-59 34-61 39.65
"v 15.53 22.32 19.74 5.71 7.06 7.27
Triat2
J0f replicates 20 20 20 20 20 20
X pl ate count (X (06) 303.4 270.9 309.6 49.9 47.2 58.9
Range (x 106) 253-334 227-298 285-357
d 18.3 16.9 16.3
37-63 37-59 41 -66
7.0 6.6 6.6

280 JENSEN AND HAUSLER
TABLE 2. t- Values for differences in productivity between VRBboiled. VRB-autoclaved, and SPC agars
Trial! Tria12 4- h Culture 16-h Culture 4-h Cult ure 16-h Culture
VRB-boiled versus VRB-autoclaved 4.194a
SPC versus VRB-boiled 1.192 SPC versus VRB-autoclaved 2.82
2.03 0.72 1.64
a A t-value grea ter than 2.70 is significant .
S.83 1.13 7.37
1.26 4.21 5.65
medium. The VRB-boiled and SPC counts were comparable for both trials for the 4-h culture, but the difference in productivity between SPC and VRB-autoclaved agars was significant, indicating that the VRB-autoclaved medium is significantly more inhibitory to a young culture than either VRB-boiled or SPC agars.
For the 16 h mid-stationary culture, no significant differences in productivity were noted between VRB-autoclaved and VRB-boiled agars in either trial. In one trial, the SPC count was significantly greater 'Yhen compared to results obtained with VRB when prepared either way, but the two VRB results were comparable.
Consequently, it appears that autoclaved VRB is significantly inhibitory to young, actively growing cultures , whereas there seems to be no effect on a more mature culture. Therefore , it is. recommended that VRB agar be boiled for 2 min rather than autoclaved before use.
REFERENCE-
I. Hausler , W . J. , Jr. (ed) . 1972. Standard methods for the examination of dairy products, 13th ed. American Public Health Association , Washington , D.C.
;
'

' ·' )
28 1
J. Milk Food Techno/. Vol. 38, No. 5, Pages 281-284 (May, 1975) Copyright © 1975, International Association of Milk, Food, and Environmental Sanitarians
Characterization of Waste Loads from Unit Processes of a Commercial Potato Canning Operation
WAYNE A. BOUGH
Departm ent ofFood Science University o.f"Georgia College ofAgriculture Experiment Stations
Georgia Station, Experiment, Georgia 30212
(Received for publication August 26, 1974)
ABSTRACT
Characterization of waste loads from uni t processes in a commercial potato canning operation revealed that the lye peeler and reel washer which removed the peel accounted for approximately 95% of the total load of tota l sol ids , suspended solids, volatile solids , COD, and BOD, and for 46 "1o of the total wastewater flow. The total loads of suspended solids, COD, BOD, and wastewater from this relatively large plant were 65.2 Jb/ ton , 88.4 lb/ ton, 54.7 lb / ton, and 2,950 gal/ton ofraw product processed respectively. The BOD and wastewater loads from this plant were significantly Jess than those reported previously for a smaller operation. Results on unit waste loads serve to better define the standard raw waste load from potato canning as the sum of the unit processes.
Characterization studies of liquid wastes from potato processing generally report the load of suspended solids, biochemical oxygen demand (BOD), and wastewater for the composite effluent (8,-10). Studies by Weckel et al. (I I) and the Environmental Protection Agency (EPA) (5) include additional data on waste loads from unit operations. Weckel et al. (I I) found that lye blanching and abrasion peeling accounted for 86 o/o of the total load of suspended solids, 98o/oofthe BOD, 97o/o of the COD,
1and 82 o/o of the wastewater flow (I 1). The effluent guidelines study conducted by EPA (5) includes data on wet caustic peeling of potatoes which should be applicable to canned as well as to frozen and dehydrated potatoes. Significant differences exist in the total BOD loads reported by Weckel et al. (II) and those reported by EPA (5) and others (8-10). The value of 186 lb BOD/ ton obtained by Weckel et al. (I I) is over three times as great as other reported BOD loads from potato processing. These differences in waste load per ton of raw product may be due to differences in the size of processing operation as noted by Bough (I) and Bough and Badenhop (2) for pimienton canning wastes. Since the results of Weckel et al. (I I) are the only published detailed data known to this author on waste loads of unit processes in potato canning, clarification of these differences is important.
Previous reports have dealt with the characterization (1, 2) and treatment of vegetable canning wastes including the application of polymeric flocculating agents to canning wastes from pimientos (3). Emphasis was placed on segregation and separate treatment of concentrated unit processing wastes which contain a
major portion of the total waste load . Such studies have been extended to potato wastes to determine the contribution of each unit effluent to the total waste load and to identify concentrated sources of wastes. The investigations included detailed data on waste loads from unit operations of a potato canning process substantially larger than that reported by Weckel et al. (II). The data are presented here to he\p clarify earlier differences.
EXPERIMENTAL
A flow diagram of the unit operations and effluents sampled in the commercial potato canning operation is shown in Fig. I. The styles
UNIT PROCESSING OPERATIONS
Dirt Wash
1
EFFLUENTS
___ __,.,.....,.... A ~ Screen
LyePeeler ~
Re! Washer ~. _.. 8
t t Final Reel Washer c
1 t Grading & Cleaning D
t Fillers
t Seamers ~! t t F ~Screen
Retorts
Figure 1. Flow diagram of unit processing operations and ejjluents in a com mercial potato camrery line
canned at this plant were whole, diced, and sliced white potatoes. The effluent from the washing operation (A) was separate from the other unit operations. Potatoes were washed in a reel washer and conveyed by belt to a large immersion chamber for lye application. Most of the peel was removed by the abrasive action of the first reel washer. Lye which drained from the app lication chamber and the peel residue and effluent from the first reel washer entered a common floor drain (effluent B). The product was conveyed by belt through another reel washer (effluent C), over tables for hand grad ing and cleaning (effluent D), and into

282 BOUGH
Hand-Pack fillers. Effluents from fillers and can seamers entered a common floor drain (effluent E). Effluents B through E combined to form a composite flow (effluent F) which was sampled for composition , but the location of the only ava ilable sampling site under a dock precluded the determination of its flow rate before it was mixed with processing wastes from other vegetables. Thus, the total wastewater flow for potato canning was estimated by the summation of the wastewater flows from the unit processes.
The flow rate of eF.Iuent A was determined by measuring the rate of till of a container of known volume. Effluents B, C, and D were measured with a trapezoidal weir as described previously {1) . Effluent E was measured by a floating block method described by Mercer (7). The daily flow rates were divided by daily production rates to express flow as gallons of wastewater per ton of raw product.
Time-composite samples of each effluent were taken on different days by collecting 600 ml every 30 min ove r a 2·h period . Each sample was passed through a 20-mesh sc reen. Five different samples of each effluent were analyzed. Analyses were begun within 15 min of collection and were done in duplicate as previously described {I). Cooling water was discharged separately from processing wastes and was not included in this study.
Results obtained on concentrations of waste components, flow rates, and production rates were used to calculate waste loadings as pounds of waste component per ton of raw product.
RESULTS AND DISCUSSION
Concentrations of waste components in potato canning wastes as determined in this study are shown in Table 1. Effluent A from the reel washer used to remove soil and debris contained per liter, 682 mg fixed solids, 1,488 mg suspended solids, 1,443 mg COD, and 485 mg BOD. The most concentrated effluent issued from the lye chamber and the reel washer which removed the peel. It contained, per liter, 3,482 mg fixed solids, 5,504 mg suspended solids, 7,481 mg COD, and 4,648 mg BOD. Effluents C-E were much less concentrated, particularly the grading and cleaning washwater. These dilute
TABLE 1. Characterization of wastes from canning of potatoes
A B Dirt Lye Peeler &
Parameter Wash Reel Washer
Total Solids, mg/ 1 2,191 ± 382a 10,978 ± 570 Fixed Solids, mg/ 1 682 ± 296 3,482 ± 1,286 Volatile Solids, mg/ 1 1,518 ± 220 7,496 ± 518 Suspended Solids, mg/ 1 1,488 ± 421 5,504 ± 1,328 Dissolved Solids, mg/ 1 702 ± 153 4,963 ± 2,518 Settleable Solids, mill 26 ± 8 137 ± 3 pH 6.6 ± 0.5 12.5 ± 0.3 Total Alkalinity , mg/ 1 36 ± 5 4,619 ± 1,219 COD,mg/ 1 I ,443 ± 167 7,481 ± 932 BOD5,mg/ 1 485 ± 181 4,648 ± 906
wastewaters could perhaps by recycled in a countercurrent manner to the first two reel washers which remove soil and peel.
Effluent F was a composite of effluents B-E; effluent A from the dirt wash in the receiving shed did not combine with these wastes but was eventually mixed with wastes from other vegetables . The analytical results on effluent F are shown in Table 1 for comparison to the results obtained by summation of the unit waste loads in all the unit effluents. These total waste ·Joad figures are shown in the last line of Table 2. For comparison with Table 1 results , waste load data (lb / ton) are converted to concentration data (lb /gal) by dividing by wastewater flow data (gal/ton). The lb /gal expression of concentration is then converted by dividing by 8.345 x 10⁻⁶ into the more common mg/ 1 expression. For example, the total COD load shown in Table 2 is 88.4 lb / ton. When converted to mg/ 1, the apparent COD concentration in the total effluent was 3,590 mg/ 1. This value compares favorably with the analytical value of 2,780 ± 821 shown in Table 1 for the COD of the 1 composite of effluents B-E. The calculated value for the BOD concentration in the final effluent was 2,222 mg/ 1 and the value shown in Table 1 for the composite of effluents B-E is 2,216 ± 339 mg/ 1. These comparisons indicate validity in determining total waste loads by summation of unit loadings as was done in this study.
While the composite effluent characterized in Table 1 does not contain the dirt wash effluent, it is still considerably more concentrated than the composite analyses reported by Weckel et al. (JJ). They reported the concentrations of total solids , suspended solids, COD, and BOD in wastewater from a potato canning operation to be , per liter, 607 mg, 32 mg, 280 mg, and 186 mg, respectively. Corresponding results in this study were,
c D E F(B·E) Final Reel Grading&
Washer Cleaning Closing Composite
404 ± 68 336 ± 81 449 ± 94 4,046 ± 478 78 ± 19 103 ± 41 170 ± 60 I ,014 ± 329
321 ± 51 233 ±56 280 ± 61 3,028 ± 150 84 ± 24 22 ± 19 29 ± 28 1,856 ± 515
320 ± 72 311 ± 85 420 ± 105 2,188 ± 40 3.3± 1.4 0.4 ± 0.5 0.2 ± 0.3 70 6.8 ± 0.7 6.4 ± 0.6 6.1 ± 0.3 12.0 ± 0.2
40 ± 12 36 ± 7 36 ± 10 1,275 ± 293 205 ± 60 84 ± 26 110 ± 39 2,780 ± 821 165 ± 32 82 ± 19 96 ± 27 2.216 ± 339
aThe mean values and standard deviations shown were obtained by averaging the results from five time-composite samples of each unit effluent analyzed in duplicate .
TABLE 2. The production of waste components per ton of raw potatoes canned
Total Suspended Volatile Waste solids solids solids COD BOD water
Uniteffiuent (lb/ ton) (lb/ton) (lb/ ton) (lb/ ton) (lb/ ton) (gal/ton)
A . Dirt wash 3.7 2.5 2.5 2.4 0.8 200 B. Lye peeler & reel washers 123.7 62 .0 84.5 84 .3 52.4 1350 C. Final reel washer 2.2 0 .5 1.7 1.1 0.9 650 D. Grading & cleaning 1.1 0.1 0.7 0.3 0.3 375 E. Closing 1.4 0.1 0.9 0.3 0.3 375
Total, A-E 132.1 65.2 90 .3 88.4 54.7 2950
' ,. I

I
·' l
CHARACTERISTICS OF POTATO WASTES 283
per liter, 4,046 mg, 1,856 mg, 2,780 mg, and 2,216 mg.
These differences are in part due to the larger volume of
water usage (3,576 gal/ton) by the plant studied by
Weckel et al. (II) in comparison to the plant
characterized in this study which was 2,950 gal/ton as
shown in Table 2. The calculations shown in Table 2 indicate that
approximately 95%ofthe total load of waste components
was found in effluent B from the lye peeler and first reel
washer. These wastes were contained in 1,350 gal of
wastewater per ton of raw potatoes processed which
accounted for 46% of the total wastewater load. These
results are in close agreement with those of W eckel et a!.
who found 86-98o/o of the waste components were
produced by lye blanching and abrasion peeling (I 1).
The recent EPA Effluent Guidelines survey on apples,
citrus, and potatoes included data on unit processes for
frozen and dehydrated potatoes (5) . Even though the unit
processes are different for canned potatoes, EPA's data
on waste load from the wet caustic peeling operation
should be similar to the same unit operation in potato
canning. The reported loads for suspended solids , BOD,
and wastewater were, per ton , 57.2 lb, 40.41 lb , and 719
gal , respectively (5). Thus, EPA's data on suspended
solids and BOD from lye peeling are comparable to those
shown in Table 2: 62.0 and 52.4 lb / ton, respectively. The
wastewater load shown in Table 2 for the lye chamber
and reel washers , 1350 gal/ton, is greater than the figure
of 719 gal / ton given in the EPA report but less than the
2,935 gal / ton calculated from the data of Weckel et al.
(I I) for the sum of lye blanching, tumble peelers, and
abrasion peeling or the 1,561 gal/ton given for lye
blanchers and tumble peelers alone. The total or composite waste load of BOD reported by
Weckel et al. (II) of 186 lb / ton was greater than the 54.7
lb / ton shown in Table 2 or the values of 22.1 and 45.8
lb / ton given in the EPA report (5). These comparisons
I along with other literature data are shown in Table 3.
TABLE 3. A comparison of composite waste loads reported for
canned. j 1"0zen. and dehy drated potatoes
Susp. solids BOD Wastewater Product (lb/ ton) (lb/ ton) (gal/ton) Reference
White potatoes so 80 4,000 Rose et al. (9)
White potatoes 53 47 3,400 NCA(8)
Pota toes 52 so 3,070 Schmidt et al. (10)
Canned potatoes 32 186 3,576 Weckel et al. (I I)
Frozen potatoes 38.8 45.8 2,710 EPA (5)
Dehydrated pota toes 17.2 22.1 2,100 EPA (5)
All product styles 31.8 36.2 2,460 EPA (5)
Canned potatoes 65 .2 54.7 2,950 This study
The data reported by NCA (8) , Rose et al. (9), and by
Schmidt et al. (I 0) are in close agreement with the total
loads, per ton, of 65.2 lb suspended solids, 54.7 lb BOD,
a'lld 2950 gal wastewater reported in the present study. Thus , the results reported here on unit operations help to
define the standard raw waste load in terms of unit
processes for potato canning operations that are typical
ofthose surveyed by NCA, Rose et al. , and Schmidt et al. (8-I 0) .
The difference in the results of Weckel et al. (!I)
shown in Table 3 in comparison to this study may be due
to the size of processing operation. It is noted that the
production rate reported by Weckel et al. was
approximately one-half of the average rate observed in
the present study. In a previous study of pimiento wastes ,
a plant processing at approximately lfJ the rate of
another produced , per ton , 6.4 lb suspended solids , 66.5
lb BOD , 140.1 lb COD, and 611 7 gal of wastewater (2).
Corresponding values for the larger plant were 3.2 , 35.4,
60.2, and 4840 (1). Thus , the waste load per ton of
product was approximately twice as great from the
smaller operation . In the case of the smaller potato
canning operation characterized in the study of Weckel
et al. (II) , the BOD load was 186 lb/ ton and the
wastewater load was 3,576 gal / ton. Corresponding values
in the present study were 54.7 lb / ton and 2,950 gal / ton,
respectively. Thus, the larger plants were able to process
with a greater efficiency for product packed and
generated fewer wastes per ton of raw product than the
smaller operations. Such "economies-of-scale" are
important considerations in the design of processing
plants and in the promulgation of effluent standards to
regulate the discharge of wastes. The cost of waste
treatment per ton of raw product will usually be higher
for a small processor than for a larger plant because of
proportionally greater generation of wastes and
wastewater per ton. The potato canning operation analyzed in this study
employed a conventional "wet" caustic method for
peeling which involved immersion in a hot lye bath and
removal of the peel by the abrasive action of reel washers.
Thus , lye and peel residue entered the wastewater
stream. A new process, called "dry" caustic because the peel residue is removed by rubber rolls or disks, segre
gates peel wastes as a thick sludge and uses a minimum
of wash water (6). Based on commercial scale
comparisons , Cyr (4) found that "wet" peeling required
about four times as much water, produced 4.5 times as
much BOD per ton of raw potatoes , and 3.75 times as
much dry solid material to be dewatered per ton as did
"dry" caustic peeling. Thus, the plant surveyed here can
consider a process change from "wet" to "dry" caustic
peeling as a means of reducing wastes from potato
processing. Such changes could become necessary as
production volume expands to reduce the hydraulic and
waste load on their biological treatment system.
REFERENCES
1. Bough, W . A. 1973 . Characterization of waste efflu ents from a
commercia l pimiento canning operation . J. Milk Food Techno!.
36:371-374. 2. Bough. W. A., and A. F. Baden hop . 1974. A comparison of roast
ing vs lye peeling of pimientos for generation of wastes and quality
of canned products . J. Food Sci. (In press). 3. Bough . W. A., and A. L. Shewfelt . 1973. Trea tment of concentrat
ed pimiento wastes wi th polymeric floccula ting agents. J. Milk
Food Techno!. 36 :6 19-624 . 4. Cyr , J. W. 197 1. Progress report: study of dry caustic vs conven
tion al caustic peeling and the effect on was te disposal. Proc . Sec
ond Nat!. Symp. on Food Processing Was tes. Superintendent of

284 BOUGH
Documents , U.S. Government Printing Office, Washington , D. C.
p. 129-136. 5. Environmental Protection Agency . 1974. Development document
for eftluent limitations guidelines and new source performan~~:
standards for the apple, citrus, and potato processing segment of
the canned and preserved fruits and vegetables point source cate
gory . EPA-440/ l -74-027a. Superintendent of Documents, U.S.
Government Printing Office, Washington , D.C.
6. Graham , R. P., C. C. Huxsoll, M. R. Hart , M. L. Weaver , and A.
I. Morgan , Jr. 196 1. " Dry" caustic peeling of potatoes. Food Tech
no!. 23:61-67. 7. Mercer , W. A. 1965. A guide for waste management in the food
processing industries. National Canners Association, Berkeley,
Ca li f. 8. National Canners Association. 1971. Liquid wastes from canning
and freezing fruits and vegetables. Water Pollution Control Re-
search Series, 12060 EDK 08/71. Superintendent of Documents,
Washington , D.C.
9. Rose, W. W., W. A. Mercer, A. Katsuyama, R. W. Sternberg, G.
V. Brauner, N. A. Olson, and K. G. Weckel. 1971. Production anp
disposal practices for liquid wastes from cannery and freezing
fruits and vegetables . Proc. Second Nat!. Symp. on Food Process
ing Wastes. Superintendent of Documents, U.S. Government
Printing Office, Washington, D.C. p. 109-127.
10. Schmidt , C. J. , E. T. Conrad , and T. D. Wright . 1973. Characteri
zation of waste effiuent from processing of 18 fruit and vegetable
commodities . Paper No. 164. 33rd. Annual Mtg. Institute of Food
Technologists, Miami Beach, Fla.
II. Weckel, K. G. , R. S. Rambo, H. Veloso, and J. H. von Elbe. 1968.
Vegetable canning process wastes. Univ. of Wisconsin , College of
Agr. and Life Sciences Research Report 38 .
New Plastic Components
PLASTIC CONVEYOR COMPONENTS for material
handling systems are detailed in a new catalog available
from Norton Company's Plastic Component Operations .
The use of self-lubricated engineering plastics in the
manufacture of Norton conveyor components is cited as
the reason for the products' low friction and excellent
wear characteristics. In many applications the product
may be operated without external lubrication.
;. I
'

' ·~
285
J. Milk Food Techno/. Vol. 38, No. 5, Pages 285-300 (May, 1975) Copyright © 1975, International Association of Milk, Food, and Environmental Sanitarians
Exposure of Man to Mercury. A Review 1'2
I. Environmenta l Contamination and Biochemical Relationships
A. G. HUGUNIN and R. L. BRADLEY, Jr.
Depattm ent ofFood Science University of Wisconsin, Madison, Wisconsin 53706
(Received for publication November 13 , 1974)
ABSTRACT
Mercury is naturally concentrated in geographical belts, but
geologica l cycling has distributed the element in all strata of the earth.
Natural concentrations of mercury are approximately 100 ppb in soil,
0.06 ppb in fresh water , 0.01-0.30 ppb in sea water, and 0.003-0.009 l'g/ m3 in air . Concentrations vary, being highest near mineral deposits.
The concentration of mercury in some areas has been significantly
increased by human carelessness. An epidemic among Japanese fishing
tamilies, death of Swedish wildlife, and discovery of elevated mercury levels in American fish focused attention on this problem. The
discovery that certain species are capable of methylating inorgan ic
mercury indicates pollution with any chemical form of mercury is dangerous.
Alkylmercurials are the most dangerous form of mercury in the
environment. Alkylmercurials are absorbed from the gastrointestinal
tract , diffuse across the blood-brain carrier , and pass through the
placental membrane in significantly higher proportions than other
mercu ry compou nds. The whole body hal f- life of methyl mercury in
humans is 76 ± 3 days compared to half-lives of 37 ± 3 days for men
and 48 ± 5 days for women observed for mercuric sa lts. Not readily
broken down , sufficient concentrations of methyl mercury can cause
irreversible damage to the central nervous system . Renal damage
usua lly results from high levels of aryl- or alkoxyalkylmercuria ls and inorganic mercury; however , vapors of elemented mercury can damage
the centra l nervous system. Organic mercury compounds cause
chromosome chan·ges, but the medical implications resulting from
levels of mercury in food are unknown. The concentration of mercury in
I red blood cells and hair is indicative of the exposure to alkylmercurials . On a group basis, blood and urine concentrations of mercury may corrrelate with recent exposure to mercury.
INTRODUCTION AND HISTORICAL DEVELOPMENT
Even though mercury is a natural element, present since the formation of the earth and known to man since prehistoric times, a great concern over its toxicity has suddenly developed during the past 20 years . The first awareness of potential danger of mercury stems from an incident that occurred near Minamata Bay in Japan. In 1953, several families in the area suffered from a mysterious neurological illness which by late 1956 had reached epidemic proportions. Several departments in Kumamoto University investigated this disease which affected the peripheral nervous system, cerebellum, heat'ing, vision , and less frequently , pyramidal tracts. Progressive brain damage was indicated in servere cases. Forty-one of 111 reported cases were fatal, and most
'Contribution .fi'0/11 the College of Agricultural aud Life Sciences. 'Part II of this review will appear in the next issue of this Joumal. Heferences cited in both parts are listed at the end of Part II.
survivors were incapacitated to various degrees . In 1959,
McAlpine and Araki (159, 160) reported that the cause of the disease was unknown , however, two facts had been established: first , that a relationship existed between fish consumption and occurrence of the disease, and second,
that the fish responsible for the disease were caught in Minamata Bay. At that time, the causative agent appeared to be a toxic chemical which was added to the bay with the effluent from a nearby fertilizer plant. The authors stated that magnesium, selenium and thallium were the chemicals which had received the most attention, however, the similarities of symptoms to those noted by Hunter et a!. (ill) for methyl mercury poisoning had been recognized . In 1968, the Kumamoto University study group published a complete report on the disease expressing agreement that the toxic agent was methyl mercury. The mercury had drained into the bay with the effluent from an acetaldehyde plant , in which it was used as a catalyst, and was absorbed and concentrated in the tissues of fish and shellfish (142).
This somewhat detailed description of the incident serves to emphasize the limited knowledge of mercury which existed at the time, particularly with regard to the organic mercury compounds which have chemical and biological properties highly different from inorganic mercury compounds or elemental mercury. The danger of organic mercury became more evident in 1962 when the Minamata incident was repeated. In Niigata , Japan , along the lower Agano River, 26 cases and 5 deaths were documented officially as methyl mercury poisoning. The source was again fish and shellfish which concentrated mercury discharged by a chemical plant into the river (1 13, 228).
In the 1960s , Swedish scientists became concerned with environmental pollution by mercury when it was noted that wildlife contained lethal levels of mercury. Investigating the cause for decreases in wild bird populations , Johnels and Westermark (123) found the mercury level in feathers of museum specimens markedly increased after 1940. This increase coincided with the introduction of methyl mercury seed dressings and abruptly dropped after a ban was imposed on alkyl mercury seed dressings. Borg et a!. (25) found lethal levels of mercury in a high percentage of animals found dead in the countryside in which poisoning was

286 HUGUNIN AND BRADLEY
suspected. Included were pheasants, partridges , pigeons, finches , and corvine birds as well as their predators; eagles, hawks , falcons, owls, foxes, martens, and polecats. Westoo (252) stated that Westermark et al. (247) were the first to report that Swedish fish contained elevated levels of mercury which Westi:io (249) identified as methyl mercury in 1966. In view of the Japanese experiences, the Swedish government adopted a limit of 1.0 ppm mercury in fish which were to be sold.
Canadian scientists became concerned over the widespread use of mercury in their country in the late 1960s, however, concern in North America finally reached a peak in 1970. At this time, Fimreite et al. (70)
reported that fish taken from Lakes Erie and St. Clair contained significant quantities of mercury. In the following months, the FDA seized several lots of fish which contained high concentrations of mercury. Lakes which showed significant mercury pollution were closed to commercial and sport fishing, and reports of high levels of mercury in wildlife were published.
The public fear which was precipitated by headlines such as that in the National Enquirer, November 29, 1970, "Everyone in U.S. Is Being Poisoned by Mercury," have greatly hurt many areas of the food industry (I 36).
At the time, many of the answers needed to reduce the near panic were not available. Numerous studies which have been conducted recently should aid in assessing the extent of the mercury problem. It is the intent of this review to present some of the information available, thereby arresting some unfounded fears and aid in identification of problems which exist. Topics to be
r
GSC
EAST PACIFI C RI SE +(H•gh merc ur y co nt ent:!
1n sed•men t s) T
covered are: (a) the natural levels of mercury; (b) man's uses of mercury and their impact on the environment; (c) the types of mercury compounds , their biotransformation and the differences in metabolic and toxicologic effect of the various forms; (d) the level of mercury in foods; (e) FDA regulations on mercury and regulations for other countries; and (j) methods of analysis for mercury.
NATURALLEVELSOFMERCURY
The average concentration of mercury in the earth 's crust is about 0.5 ppm, and it ranks 62nd from the top or 19th from the bottom on the list in abundance of elements in the earth (240). Most of the mercury is concentrated in geographical belts of the earth which are shown in Fig. 1. Mercury can exist in any of three oxidation states in nature: the metallic state (Hg)0
, the binuclear state (Hg-Hg)+2 in which there is a covalent bond between the two atoms, or the mercuric state (Hg)+2 • The red mercuric sulfide, cinnabar, is the principal commercial source of mercury and it contains 86.2% mercury. Cinnabar is found in small veins or pockets in limestone, calcareous shales, sandstone, serpentine, chert, andesite, basalt, and rhyolite, most generally in areas of volcanic activity (126).
The deposits are generally found within a few hundred feet of the surface.
Ehmann and Lovering (61) reported the mercury concentration ofthe earth 's deep crust and upper mantel is 0 .78 to 1.48 ppm. Day (55) stated that mercury reaches the surface by a process other than weathering. Since
Pn ncipal mercur1 cepos1ts and prospec ts .
Mercur ;{erous ~e l ts. .
Figure 1. Generalized map showing the the mercuriferous belts of the earth. From Jonasson and Boyle, ref erence 125.
,
;. I
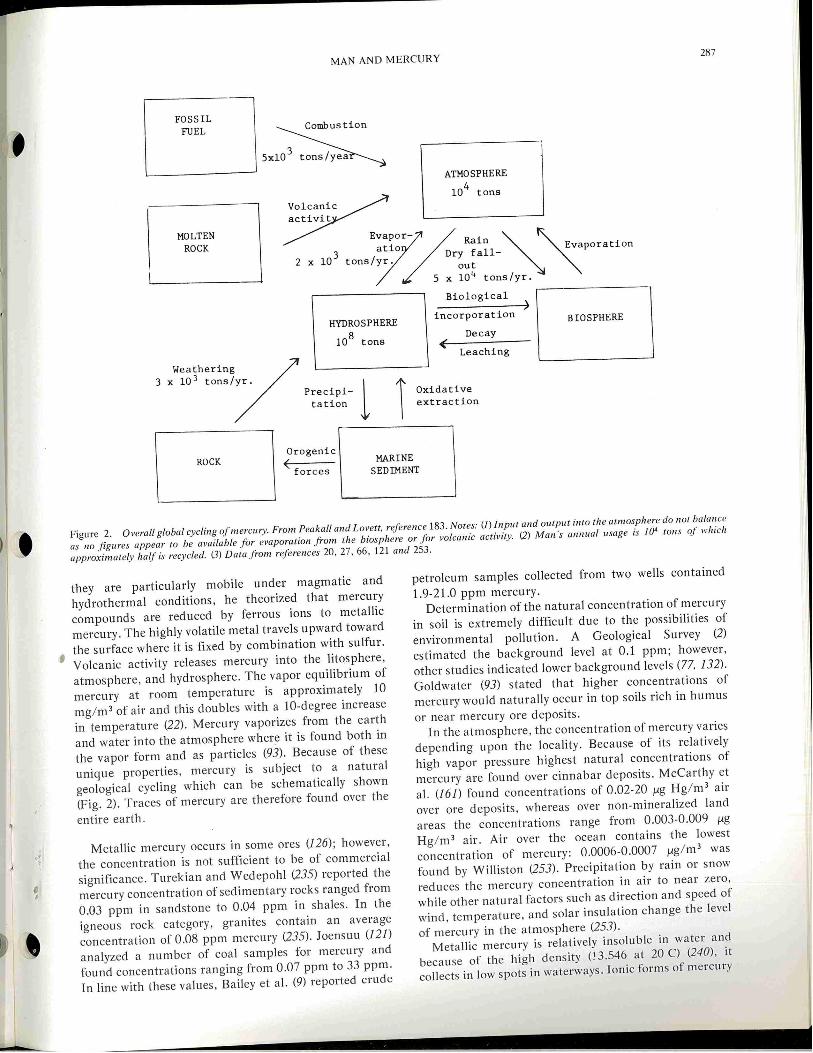
' ·' )
I
MAN AND MERCURY 287
FOSSIL FUEL ~stion
5xl03 tons/y~
ATMOSPHERE
104
tons
MOLTEN ROCK E~~i~~-D ~~~l-~~vaporation
tons/yr. ry out
5 x 10 4 tons/yr.
HYDROSPHERE
108
tons
Bio logical
incorporation
Decay
Leaching
BIOSPHERE
l 1 Oxidative extraction
Orogenic ROCK
forces MARINE
SEDIMENT
Figure 2. Overall global cycling ofmercUIJ'· From Peakall and Lovett, r~ference 183. Notes:(!) Input and output into the atmosphere do nor balance
as no figures appear to be available fo r evaporation from the biosphere or for volcanic activity. {2) Man 's annual usage is 10' tons of which
approximately half is recycled. (3) Data from references 20, 27, 66, 121 and 253.
they are particularly mobile under magmatic and
hydrothermal cond itions, he theorized that mercury
compounds are reduced by ferrous ions to metallic
mercury. The highly volatile metal travels upward toward
the surface where it is fixed by combination with su lfur.
Volcanic activity releases mercury into the litosphere,
atmosphere, and hydrosphere. The vapor equil ibrium of
mercury at room temperature is approximately 10
mg/ m 3 of air and this doubles with a 10-degree increase
in temperature (22) . Mercury vaporizes from the earth
and water into the atmosphere where it is found both in
the vapor form and as particles (93). Because of these
unique properties , mercury is subject to a natural
geological cycling which can be schematically shown
(Fig. 2) . Traces of mercury are therefore found over the
entire eatih.
Metallic mercury occurs in some ores (126); however,
the concentration is not sufficient to be of commercial
significance. Turekian and Wedepohl (235) reported the
mercury concentration of sedimentary rocks ranged from
0.03 ppm in sandstone to 0.04 ppm in shales. In the
igneous rock category, gran ites contain an average
concentration of 0.08 ppm mercury (235). Joensuu (121)
ana lyzed a number of coal samples for mercury and
found concentrations ranging from 0.07 ppm to 33 ppm.
In line with these values, Bailey et al. (9) reported crude
petroleum samples collected from two wells contained
1.9-21.0 ppm mercury.
Determination of the natural concentration of mercury
in soil is extremely difficu lt due to the possibilities of
environmental pollution. A Geological Survey (2)
estimated the background level at 0.1 ppm; however ,
other studies indicated lower background levels (77, 132).
Goldwater (93) stated that higher concentrations of
mercury would naturally occur in top soils rich in humus
or near mercury ore deposits.
In the atmosphere , the concentration of mercury varies
depending upon the locality. Because of its relatively
high vapor pressure highest natural concentrations of
mercury are found over cinnabar deposits. McCarthy et
al. (161) fo und concentrations of 0.02-20 J-Ig Hg/ m 3 a ir
over ore deposits, whereas over non-mineralized land
areas the concentrations range from 0 .003-0.009 J-Ig
Hg/ m 3 a ir. Air over the ocean contains the lowest
concentration of mercury: 0.0006-0.0007 J1gl m 3 was
found by Williston (253) . Precipitation by rain or snow
reduces the mercury concentration in air to near zero,
while other natural factors such as direction and speed of
wind, temperature, and solar insulation change the level
of mercury in the atmosphere (253) .
Metallic mercury is relatively insoluble in water and
because of the high density (!3 .546 at 20 C) (240) , it
collects in low spots in waterways. Ionic forms of mercury

288 HUGUNIN AND BRADLEY
are soluble in water , the degree depending on the acidity of the water ·and the presence of complexing ions . Wershaw (246) analyzed ground water samples from 73 areas of the United States and found 83 o/o contained Jess than 1 ppb mercury, whereas only 2 samples had levels in excess of 5 ppb. These were ·in areas ·of mercury ore deposits and the concentration was a high as 80 ppb (246). Klein (132) analyzed 67 samples of water from ponds, lakes, and rivers in Northeastern United States and reported background levels were approximately 0.055 ppb when environmental pollution had not occurred. Joensuu (121) estimated the amount of mercury released into waterways by natural weathering. Basing his calculations on the amount of sodium and mercury present in the litosphere and the rate at which sodium is reached by weathering, Joensuu reported a maximum of 20.9 x 10⁴ kg of mercury may be carried to sea each year . In sea water, Burton and Leatherland (34)
found 0.014-0.021 ppb mercury in samples collected off the coast of England. Leatherland et al. (144) reported that in the Northeastern Atlantic, surface water contained 0.013-0.018 ppb mercury, the concentration decreasing with depth . Klein and Goldberg (133) found higher concentrations of mercury deeper off the coast of Japan. Values they reported were from 0.10 ppb at surface and 0.15-0.27 ppb at lower depths (133) .
MAN'S USE OF MERCURY AND
ENVIRONMENTAL CONTAMINATION
For centuries , man's use of mercury was limited to cosmetics and medicine. In 1557, Bartolome de Medina devised a process by which silver was recovered by amalgamation (202). Since that time, uses for mercury have increased and in 1971 over 10.5 x 10⁶ kg of mercury were produced to meet demands (36). Increasing amounts of mercury are being recovered , repurified , and sold as secondary mercury. Many processes for reclaiming mercury from mercury boilers, electrical apparatus , dental amalgams, batteries, and sludge from processes using mercury as a catalyst have been developed (126). In 1971 over 5.8 x 10⁵ kg of mercury on
UNITED STATES PERCENTAGE OF WORLD PRODUCTION
UNITED STATES CONSUMPTION/\ ,'\ ll / '-J \
.: \ I \ /'/Vt·----./ \_ J ,.
I
' 1970 1975
Figure 3. Trends in production. consumption. and prices o.f'mercury in the U.S. From references 36 and 185.
the U.S. market were secondary mercury (36). The difference between total mercury and secondary mercury sold is indicative of the losses of mercury which occur in the environment. Mercury pollution is unique fro m mai'\Y other types of pollution in that the total earth concentration is not being changed; rather the problem occurs from redistribution of the mercury or changing it into a more toxic form. Thus , it is important to consider these aspects with regard to the production and uses of mercury to determine present day risks.
The trends in production, consumption, and prices of mercury in the U.S. are shown in Figure 3.
Production
An extensive discussion of methods of producing mercury are beyond the scope of this review. Readers desiring further information on production of mercury should consult the publication by H. R. Jones (126), from which much of the following was taken. In the United States most mercury is extracted from the ore by a directly heated pyrometallurgical process. After crushing, ore is heated in retorts or furnaces to liberate the mercury as vapors. The vapors, after passing through dust collectors, are cooled by a condenser system and the liquid mercury is collected. Although the recovery from this process averages between 95-98 %, only 1.24-12.4 g of mercury are obtained per kilogram of ore (126). The primary source of pollution in processing mercury is condenser stack emissions which range from 74 .2-244 mg per kg of ore processed (238).
Uses
The largest users of mercury and trends in mercury consumption are shown in Table 1. The new public
TABLE 1. Mercury consumed in the United States, by use (10 3Kg)
Use 19551 19652 19683 19703 19723
Agriculture• 255 107 11 8 62.4 63.3
Amalgamation 7.47 17.1 9.20 7.55 N/ A Catalysts 25. 1 31.9 66.0 77. 1 27.6 Dental preparations 70.3 119 106 78 .8 103 Electrical apparatus 442 589 677 550 536 Electrolytic preparat ion of
chlor ine and caustic soda 107 302 602 517 397
General laboratory use 33.6 97.4 68.6 62.3 20.5 Ind ustri al and control
instruments 343 350 275 167 225 Paint
Ant ifouling 25.0 8.79 13.5 6.83 1.10 Mildew-proofing N/ A 260 351 350 282
Paper and pulp manufacture N/ A 21.3 14 .4 7.79 0 .34
Pharmaceuticals 54.4 112 14 .6 23.8 19.9 Other5 609 620 285 202 147 Tota l known uses 1971 2635 2600 2112 1823 Total unknown uses 7.82 0.76 Grand tota l6 1971 2635 2600 2119.82 1823 .76
N/ A values not availab le from these references. 'Data from reference 185 including portion listed as redistilled. ' Data from reference 65 including portion listed as redistilled. 3Data from reference 36. ' Includes fungicides and bactericides for industrial purposes . ' Includes that portion listed as miscellaneous uses fo r redistilled mer-cury in references 185 and 65. 6Discrepancies due to rounding off of above va l\les.
,
1 , ,.

MAN AND MERCURY 289
awareness of mercury pollution has had some effects on
the uses of mercury. Unfortunately , a more recent survey
is not available . The electrical industry, the largest consumer, utilizes
over one-half of its consumption in the production of
batteries (97). Other electrical products utilizing
significant quantities of mercury are fluorescent lamps
and high intensity discharge lamps , rectifiers , oscillators,
and power control switches (97). Recycling of most of
these items is impractical except for industries utilizing
large quantities with volume turnovers. For this reason,
much of the mercury is added to the environment with
trash. Projections for mercury use in the year 2000 range
from 8.6 x 10⁵-13 .8 x 105 kg; the broad range reflects
both the continued demand for mercury batteries and a
shift to the rechargeable nickel-cadmium batteries (97).
Use of mercury cells for production of chlorine gas
accounted for over 23 o/o of the mercury .consumed in the
U.S. in 1971 (36). The chlorine production process (238)
involves a cell with two sections. The first section, the
electrolyzer , uses mercury as a flowing cathode which
flows co-currently with a salt solution such as sodium
chloride. When a high current is applied between the
carbon or metal anode and the mercury cathode,
chlorine gas is formed at the anode and alkali amalgam
at the cathode. The amalgam is separated and passed
into the second section, the decomposer , where the
amalgam becomes the anode to a short circuited graphite
cathode. Then , the amalgam is converted back to
mercury and alkali metal hydroxide with the production
of hydrogen gas. Caustic soda produced by this process
may contain up to 7 ppm mercury (57). The
Environmental Protection Agency bulletin (238)
identifies significant losses of mercury into the
environment (up to 0.91 g Hg/ kg of C1 2) which may
occur from chloralkali production but new processes
1 have been developed which drastically reduce these
emissions. An increasing percentage of chlorine also is
being produced by the diaphragm process. Although the
caustic produced by this process is of a lower grade, no
mercury emtss10ns are produced. In spite of
improvements, pollution still is significant in chlor-alkali
production. Cammarota (36) indicated that 27.2o/o of the
8.45 x 10⁹ kg of chlorine produced was from mercury
cells and 153 mg of mercury were lost in the production
of a kilogram of chlorine; therefore, over 4.25 x 10 5 kg of
mercury were lost in the production of chlorine and
alkali . Greenspoon (97) projected the need for 2.07 x 10⁶
kg of mercury for chlor-ilikali production in 2000. This
could be excessive based on improved recovery and
increased use of diaphragm cells. The bactericidal and fungicidal properties of many
mercury compounds have resulted in their use in paint
and paper industries and in agriculture. The paint
industry is the third largest user of mercury.
Incorporation of phenyl mercury compounds into
water-based paints inhibits mildew formation on painted
surfaces as wel l as prolonging shelf life of paint in the
can . At the Wisconsin Department of Natural Resources
hearing one manufacturer reported that the amount of
phenyl mercury added per gallon ranged from 0.45 g Hg
for interior water-based paint to 3.41 g Hg for exterior
alkyd based paint (216). Sibbett et a!. (206) reported
significant concentrations of mercury were found in the
atmosphere of a room freshly painted with paint
containing a mercurial fungicide. Goldberg and Shapero
(90) reported the health hazard of such emissions were
minimal. Marine paints contain mercurous compounds
as antifouling agents which prevent slime buildup and
marine growth on painted surfaces. Small concentrations
of this mercury are released into the water (I 02).
Extensive research is being conducted to find
non-mercurial preservatives for paints , however
non-mercurial compounds· have not been as effective on
the basis of shelf and surface life. The mercury
requirements of the paint industry in the year of 2000
may reach 5.5-6 .9 x 105 kg (97). Slime formation in paper and pulp machinery results
in production of inferior paper. Although highly
effective, use of mercury-based slimicides has been
largely discontinued in recent years as a result of the
Federal Food and Drug Administration action (35)
precluding the use for paper used in food packaging.
Moreover , the concomitant development of other
satisfactory slimicides has reduced this need.
Replacement of mercury slimicides has aided in
pollution control since approximately one-half of the
mercury used passed out of the mill with the effluent
whereas the other half bound to the paper fibers also
polluted the environment at disposal (35) . The pulping
process utilizes large quantities of caustic soda and
chlorine, both of which may contain mercury residues if
produced by the mercury cell process. Agricultural consumption of mercury is low in
comparison to some other industries, however, special
consideration is warranted because the mercury is
applied directly to the environment. Mercurial
compounds , which have a broad spectrum of fungal
control , are unequaled by any other preparations used as seed dressings on barley, beans , corn, cotton, flax, millet ,
milo, oats, peanuts, peas , rice, rye , safflower, sorghum ,
soybeans, sugar beets , and wheat. Novick (I 80) listed the
mercury-containing pesticides licensed by the Depart
ment of Agriculture in 196 7 and also identified those
subsequently restricted in use or prohibited. Worf (255)
stated that use of these dressings had declined as a result
of development of varieties of grain resistant to many
funga l diseases. Also, environmental pollution by
mercurial seed dressings may not be significant since
common application rates would contribute only 1.8 g
per hectare , which is much less than background levels.
Sand et a!. (204) reported that of 93 soil samples
analyzed, the mean concentration of mercury was 114
ppb where mercury-treated seeds had not been used
whereas a higher mea n of 195 ppb mercury was found in
soi l where mercury-dressed seeds had been used.
---·--

290 HUGUNIN AND BRADLEY
Mercurial fungicides are used also as sprays on fruit
trees and tomato plants before development of the fruit.
ln potato production, mercurial compounds have been
used for both soil treatment of foliage sprays (J 80).
Inoue and Aomine (I /2) reported that the absorption of
phenyl mercury acetate by clay mineral soils was subject
to the law of cation exchange. Absorption was greatly
reduced at or greater than pH 7 as well as below pH 5
due to the reduction of phenylmercuric ions or the
increase of hydronium ions . Montmorillonite gave the
highest absorption rate followed by Allophane and
Kaolinite types of soils.
The highest rates of application of mercurial
fungicides most likely are for turf management. Eckert
(60) stated that mercury fungicides have been used for
years on golf courses. Non-mercurial fungicides are now
replacing the mercury compounds to control summer
diseases , but no effective alternatives have been found to
control winter fungus diseases referred to collectively as
snow mold. An inorganic mercurial fungicide containing
60% HgCl and 30% HgC1 2 offers broad spectrum
activity and residual effectiveness; phenylmercuric
acetate is also used. Commonly applied only to the golf
course greens, approximately 2.04 x 10³ kg on an
elemental basis of mercury compounds are applied
annually to 182.1 hectares of greens in the State of
Wisconsin (60). Of this, slightly over 2% was organic
mercury and the remainder inorganic mercury
compounds. Also, Novick (180) reported tha many
commercial fertilizers, herbicides, and fungicides for use
on home lawns contain mercury compounds.
General laboratory uses of mercury are extensive.
Cooke and Beitel (48) stated that approximately 5.9 x 10³
kg of mercury per year are lost by Canadian hospital
laboratories through such uses as HgC1 2 for fixing tissue
samples. Common uses of mercury compounds in food
analysis laboratories given by Bradley (28) are mercuric
chloride to preserve milk samples, mercuric sulfate or
oxide in Kjeldahl nitrogen determinations, and mercuric
sulfate in chemical oxygen demand determinations.
Medicinal uses of mercury are for pharmaceuticals,
cosmetic preparations, and dental preparations. Mercury
was once used to treat syphilis, as an aphrodisiac, and as
a means of prolonging life (57). Use of organomercurial
compounds as diuretics continues, but they are being
replaced by non-mercurial compounds. Organomercur-
ials under such trade names as Mercurochrome<R), Mer
thiolate<R), Mercresin<R), and Metaphen<R) are still very
popular antiseptics. Mercurials are frequently used in
sterilizing solutions for medical instruments and are
often incorporated into pharmaceuticals and cosmetics
to control microbial growth. It is interesting that in 1971,
more mercury was used in dental preparatious than in
agriculture. Mercury is used in an amalgam with a
silver-tin alloy and has proven more satisfactory with
regard to relative permanence, compressive strength,
abrasion resistance and ease of handling than other
materials tested (126). With regard to pollution, dental
preparations are trapped in the mouth of the patient;
however, nearly all of the merucry utilized for other
medical purposes eventually is added to the waterways
through the sewer system.
Mercury is used for many other very diverse purposes,
a number of which may contribute to envrionmental
pollution . Bailey and Smith (8) estimate that there are
almost 3,000 distinct applications of mercury. Uses of
mercury may not be the only activity of man which
contributes to environmental pollution by mercury.
Joensuu (121) concluded that the burning of fossil fuels,
which are relatively low in mercury content, released
approximately 2.72 x 10⁶ kg of mercury into the
atmosphere annually due to the large quantities burned.
Weiss et al. (244) analyzed permanent snow-fields in
Greenland for mercury and thus were able to assess
changes in atmospheric mercury concentrations over the
past 2700 years . Using reliable techniques to date the
various strata sampled, it was concluded that activities of 1
man have had an impact on the environment. They
estimated the major sources of atmospheric pollution
would be: natural runoff into waterways, 3.8 x 10⁶ kg per
year; chloroalkali production , 3x 10⁶ kg per year, heating
of limestone and shale containing mercury in the
production of cement, 1 x 10⁵ kg per year; burning fossil
fuels, 1.6 x 10⁶ kg per year; and from natural earth
degassing, 2.5 x 10⁷-1.5 x 10⁸ kg per year. On the basis of
these estimates, Weiss et al. concluded that alteration of
terrestrial surfaces increases exposure of crust materials ,
and may be the greatest source of mercury pollution.
These levels of mercury pollution , however, are too low to
significantly affect the mercury content of mixed layers
ofthe ocean. Miller et al. 164 gave support to this theory
by their findings that museum specimens of tuna and
swordfish dating back to 1878 had similar concentrations
of mercury as those recently caught. Numerous other
reports have concluded that ocean levels of mercury have
not changed significantly.
Mercury pollution has resulted in elevated
concentrations of the element in several isolated areas.
Kitamura (131) reported that a maximum concentration
of2010 ppm mercury (wet weight) was found in sediment
of Minamata Bay near the drainage channel of a
chemical plant and the concentration dropped sharply as
a function of the distance from the effluent outlet. Konrad
(I 35) reported deposits of mercury in Wisconsin
waterways: 684 ppm (dry weight) in bottom sediment just
below the outfall of a chlorine-caustic soda plant with
concentrations decreasing to 12 ppm one mile
downstream; 11.5 ppm (dry weight) in bottom sediment
below a city sewage treatment plant accepting waste from
manufacturers of electrical batteries . Background levels
ranged from 0.01 -0.15 ppm Hg in bottom sediments.
Numerous incidents of fish kills have been attributed to
environmental contamination by mercury. Turney (236)
reported an incident in Michigan in which the discharge
of phenylmercuric acetate, used as a mildew inhibitor by
'
, , .. I
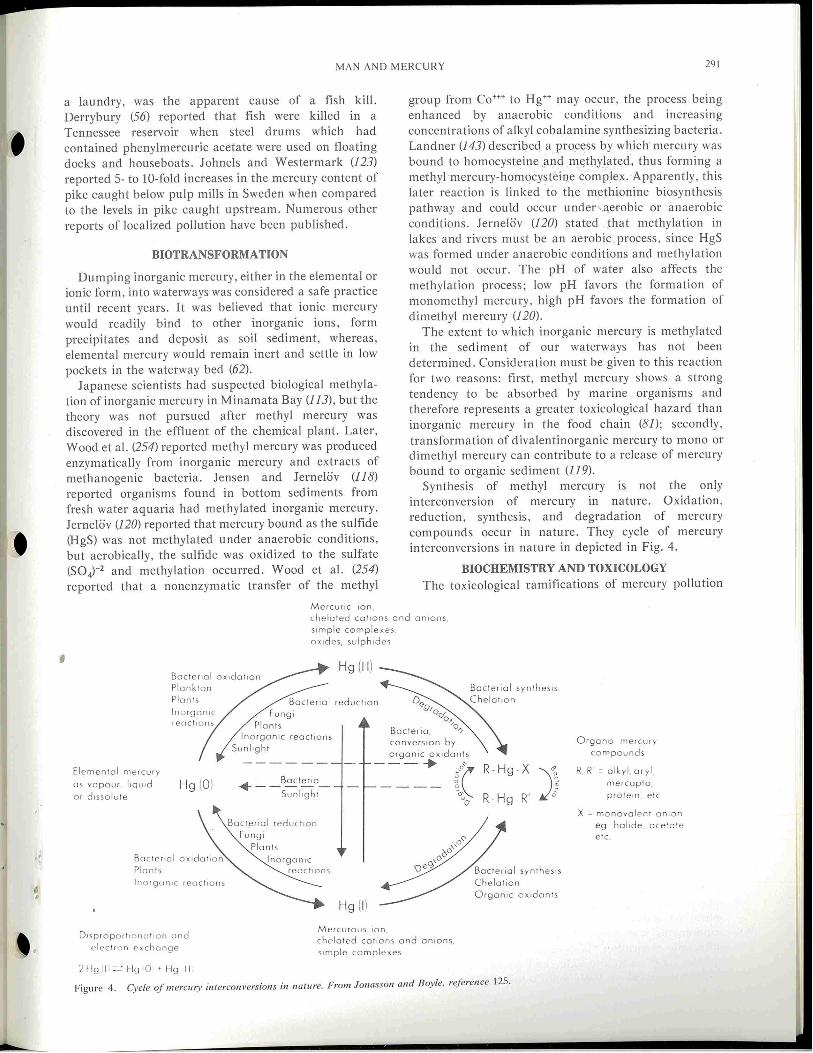
'
I
·~
' -
'
MAN AND MERCURY 291
a laundry, was the apparent cause of a fish kill.
Derrybury (56) reported that fish were killed in a
Tennessee reservoir when steel drums which had
contained phenylmercuric acetate were used on floating
docks and houseboats. Johnels and Westermark (123)
reported 5- to 10-fold increases in the mercury content of
pike caught below pulp mills in Sweden when compared
to the levels in pike caught upstream. Numerous other
reports of localized pollution have been published.
BIOTRANSFORMATION
Dumping inorganic mercury, either in the elemental or
ionic form, into waterways was considered a safe practice
until recent years. It was believed that ionic mercury
would readily bind to other inorganic ions, form
precipitates and deposit as soil sediment, whereas,
elemental mercury would remain inert and settle in low
pockets in the waterway bed (62).
Japanese scientists had suspected biological methyla
tion of inorganic mercury in Minamata Bay (113), but the
theory was not pursued after methyl mercury was
discovered in the effluent of the chemical plant. Later,
Wood et al. (254) reported methyl mercury was produced
enzymatically from inorganic mercury and extracts of
methanogenic bacteria. Jensen and Jerneli:iv (118)
reported organisms found in bottom sediments from
fresh water aquaria had methylated inorganic mercury.
Jerneli:iv (120) reported that mercury bound as the sulfide
(HgS) was not methylated under anaerobic conditions,
but aerobically, the sulfide was oxidized to the sulfate
(SO,J-2 and methylation occurred. Wood et al. (254)
reported that a nonenzymatic transfer of the methyl
Mercuric io n,
group from Co••• to Hg•• may occur , the process being
enhanced by anaerobic conditions and increasing
concentrations of a lkyl cobalamine synthesizing bacteria.
Landner (143) describeq a process by which· mercury was
bound to homocysteine _and m~thylated, thus forming a
methyl mercury-homocysteine complex . Apparently, this
later reaction is linked to th.e methionine biosynthesis
pathway and could occur under , qerobic or anaerobic
conditions. Jerneli:iv (1 20) stated that methylation in
lakes and rivers must be an aerobic process , since HgS
was formed under anaerobic conditions and methylation
would not occur. The pH of water also affects the
methylation process; low pH favors the formation of
monomethyl mercury, high pH favors the formation of dimethyl mercury (120).
The extent to which inorganic mercury is methylated
in the sediment of our waterways has not been
determined . Consideration must be given to this reaction
for two reasons: first , methyl mercury shows a strong
tendency to be absorbed by marine organisms and
therefore represents a greater toxicological hazard than
inorganic mercury in the food chain (81); secondly ,
transformation of divalentinorganic mercury to mono or dimethyl mercury can contribute to a release of mercury
bound to organic sediment (119).
Synthesis of methyl mercury is not the only interconversion of mercury in nature . Oxidation ,
reduction, synthesis, and degradation of mercury
compounds occur in nature. They cycle of mercury
interconversions in nature in depicted in Fig. 4.
BIOCHEMISTRY AND TOXICOLOGY
The toxicological ramifications of mercury pollution
cheloted COtiOnS and OniOnS,
simple complexes,
ox1d es, sulph 1des
Boc t er~ol o x ldor1on Hg (I I)
Elemental m ercur y
os vopour. l•qu1d
0 1 dJSsolute
Pion Is
Plankton Plants
lno rg a n 1c
Hg (Ol
lno rgon rc reoctrons
D1sproportrnnoi10n nnd electJ o n exc hange
?lig ' l · ....: H\J rO • Hg II
Bo cte no l reduct1on
Fung i Plants
Inorganic reo cl1on s
Sunl1g ht
De 9r0 0:
o/ . 'a
Bacter~o , "> convers ion by
o rgan ic ox •donts ---+
.., __ Bo c t~a
Sunl lght
Hg (I)
Mercu rous io n,
chcloted cations and onions,
Simple complexes
R-Hg -X )} R-Hg -R'
Organ ic ox1 dant s
Figure 4. Cycle of m ercrll)' interconversions in nature. From Jonasson and Boyle. reference 125.
Orgon o mercury
co mpou nds
R. R' =al kyl, a r y l .
me•copto,
p ro tem, etc
X = mo novalent on.on
eg holrde. oce'o•e ere.

lit
292 HUGUNIN AND BRADLEY
have been the subject of numerous investigations. Ancient authors such as Hippocrates, Pliny, Galen, and
Avicenna reported mercury compounds were toxic, yet only recently the differences of the metabolism and
toxicology of various mercury compounds have been
understood . To.discuss the biochemistry and toxicology of mercury, it is necessary to consider four classes of mercury compounds: elemental mercury, Hg0; inorganic
mercury salts, Hg+2 and Hgt2; aryl mercurials, C6H 5-Hg; alkoxyalkyl mercurials, R-0-Hg+; and alkyl mercurials, R-Hg (R represents a short-length hydrocarbon chain).
An understanding of the differences in the metabolism and toxicology of these four classes of mercury
compounds is essential to evaluate the mercury residue problem.
Absorption
Mercury compounds may be absorbed by the body through the gastrointestinal tract, respiratory tract, or
skin. The extent of absorption , however, was found to be highly dependent upon the form of mercury involved.
Elemental liquid mercury can be absorbed from the
gastrointestinal tract. Bornmann et al. (26) observed a 10-fold increase in the concentration of mercury in blood
and kidneys ofrats that received metallic mercury orally. The extent of the absorption appears relatively low and the dangers of poisoning from liquid mercury by this route seem slight. Toxic signs were rarely noted in patients who received oral doses of 100 to 500 g of
mercury in the treatment of bowel obstructions (21).
Goldwater (93) stated that a person could probably
swallow 454 g of liquid mercury with no adverse effects. In the ionized form , mercury is absorbed somewhat
more efficiently from the gastrointestinal tract; ingestion
of mercury salts was chosen often as a method of suicide. In studies of humans who had consumed mercuric chloride and showed acute signs, it was estimated that
8% of the dose had been absorbed (215). Accurate
evaluation of absorption rates is difficult following ingestion of acute doses: the corrosive effect of mercuric
chloride undoubtedly changes the permeability of the gastrointestinal wall; vomiting is almost certain to occur within 1 h after mercuric chloride ingestion. Miettinen (I 62) and Rahola et al. (I 94) fed nontoxic doses of
mercuric salt to 10 human volunteers and found only 85 % of the dose excreted in the feces within 4 days. No differences were mentioned for excretion rates from patients who received the mercury in a liver paste
mixture or in an ionic solution . In a study involving mice, Clarkson (42) concluded that an average of less than 2% of the daily intake of mercuric chloride was absorbed.
Studies in which rats were dosed orally with mercuric
acetate indicate that 20% of this compound was absorbed (193). The solubility of inorganic mercury
compounds was generally believed the major factor
affecting absorption. Mercurous compounds are less
soluble than mercuric salts and apparently are less
efficiently absorbed . Viola and Cassano (239) confirmed
the poor absorption of mercurious compounds by autoradiographic studies.
Organic mercurials apparently are absorbed more rapidly from the gastrointestinal tract than are the inorganic salts. Data indicate that between 50-80% of an oral dose of phenyl mercury acetate is absorbed by rats (193).
Alkyl mercury compounds are absorbed in the gastrointestinal tract to an .even greater extent than phenyl mercury compounds. Ekman et al. (63) and Falk
et al. (67) fed low doses of [2°3Hg]methyl mercury to human volunteers and reported almost complete absorption. Clarkson (42) reported an average of 98 o/o of
the methyl mercury was absorbed by rats fed
contaminated diets. Gastrointestinal absorption of mercury is of primary
importance with regard to mercury residues in food s, however, harmful levels of mercury may be absorbed by
laboratory personnel through the respiratory tract or through the skin. 1
The vapor state of elemental mercury is far more dangerous to man than the liquid state because of the higher absorption rate . Being relatively insoluble in
water , vapors of metallic mercury are not absorbed by the mucous membranes , but pass further down the respiratory tract to the alveoli (I 86). Magos (I 56)
reported that nearly 20 % of mercury vapor injected intravenously was exhaled by rats within 30 sec . Kudsk
(138) had human volunteers inhale concentrations of 50-350 }1g mercury vapor/ m3 air and reported 71-88 %
absorption. Shepherd et al. (205) recorded approximately
l01-1g mercury/ m3 air exhaled by human volunteers who had inhaled a concentration of 200 1-1g/ m 3• Methyl mercury compounds are also very volatile and readily
absorbed in the respiratory tract. Mice, which Ostlund (181) exposed to vapors of radioactive dimethyl mercury
for 45 sec, absorbed 50-80% of the total radioactivity.
Since his primary concern was not the percentage of absorption, no indication was given about the extent of
vaporization. Therefore, the 50-80 % absorption may be lower than the actual amount possible.
Mercury compounds in the aerosal or dust form may also enter the respiratory tract. Although quantitative data on absorption of mercury compounds in these states
are not available, it is likely that the extent of penetration is similar to that of other heavy metals. The task group on metal accumulation (186) described pulmonary
absorption of metals and stated that the extent of absorption was dependent upon: size of particles,
solubility of the compound, physical characteristics of the individual , route of inhalation , tidal volume, and respiratory rate.
Absorption of mercury compounds through the skin was studied by Friberg et al. (83) who reported that 6% of a 16 mg mercuric chloride/ ml solution was absorbed
through the skin of guinea pigs in 5 h. Silberberg et al.
(207) were able to trace the penetration of mercuric ions
by electron microscopy when a solution was applied to the
, , .. I
6)

I
c~
MAN AND MERCURY 293
skin. Rates of absorption of methyl mercury compounds through the skin appear similar to those of mercuric chloride (83, 175).
Transport and transformation
Following absorption, mercury is transported by the blood system to various tissues of the body. Distribution of mercury between the components of blood is dependent upon the form in which the mercury exists.
Apparently, vapors of metallic mercury are absorbed preferentially by erythrocytes . Berlin et al. (15) exposed rabbits and monkeys to mercury vapor and found immediately after exposure 67-84o/o of the mercury in blood was associated with the cellular fraction as opposed to the plasma fraction.
In the mercuric form, more than half of the total concentration of mercury was found in the plasma. Berlin and Gibson (16) studied distribution of mercury in blood of rabbits receiving mercuric chloride by infusion. Considerable delay occurred between the time that serum levels of mercury were changed and equilibrium was established. They reported that 50% of the mercury in blood was bound to red corpuscles after equilibrium. In plasma most of the mercury was apparently bound to plasma proteins since no more than 1% of the mercury could be detected in the ultrafiltrate obtained when plasma was passed through a glomular membrane. Takeda et al. (226) reported that 4 days were required for equilibration of mercury between erythrocytes an.d plasma in rats given subcutaneous injections of mercunc solutions.
The aryl and alkyl mercurials are largely bound to the red blood cells. Berlin (14) infused phenylmercuric acetate and methyl mercury dicyandiamide into rabbits and found that about 10% of the phenylmercury and less than 20% of the methyl mercury was in the plasma. Less than 1 %ofthe plasma mercury in either form was found
1 in the ultrafiltrate fraction. When three human volunteers were given an oral dose of radioactive methyl mercury, radioactivity was detected in their blood within 15 min (1). The ratio of mercury in the erythrocytestoplasma was 10:1 and remained constant for the 24 d~ys following consumption. Results of numerous studtes indicate that the erythrocyteto-plasma ratio is different for various species. Reported ranges are 300: 1 in rats; 20:1 in man; and 10:1 in monkeys , cats, and mice (44). Suzuki et al. (220) reported that the blood cells collected from the umbilical cord contained a higher concentration of mercury tl:an did maternal blood , whereas maternal plasma samples were higher in mercury than was plasma collected from the umbilical cord. The authors attributed these variations to the higher hemoglobin content of fetal blood and the. higher coftcentration of thiol radicals in fetal hemoglobtn.
Except for the loss of the anion fraction, most mercury compounds are absorbed into the circulatory system unchanged . Magos (155) reported that vap~rs. of elemental mercury are rapidly oxidized to mercurtc 1ons by blood in vitro . Kudsk reported that an enzyme system
is likely involved in the oxidation, however, the exact process could not be determined (I 39, 140). Some reduction of mercuric ions to elemental mercury in the blood may also occur. Magos (I 55) observed that 0.5 % of added mercuric chloride was volatized from blood samples . Clarkson and Rothstein (46) reported that following injection of mercuric chloride into rats about 4 % of the amount excreted was exhaled .
Aryl and alkoxy mercury compounds are degraded to inorganic mercury in organisms. Miller et al. (I 65) found only 20% of the mercury in the liver and 10 % of the mercury in the kidney was in the organic form 48 h after rats were injected with phenylmercuric acetate. Daniels and Gage (52) reported that when rats were administered r4CJphenylmercuric acetate, about 85% of the radioactivity was detected in the urine within 96 h, whereas only 12% of the mercury was excreted in the urine and 50-60 % was excreted in the feces. Indirectly , breakdown of aryl mercury compounds was also indicated by redistribution of mercury in the animal. As was previously indicated, organic mercury compounds were found in higher concentrations in red blood cells, whereas inorganic mercury ions were associated with the plasma fraction. Studies have shown that when phenylmercury compounds were administered, blood distribution initially resembled that expected of organic mercurials, but later , the distribution became similar to that of inorganic mercury (1 75, 226). Distribution of aryl and alkoxy mercury compounds in tissues and the excretion rates are further indicators of the relatively rapid breakdown of these compounds and will be discussed later.
Methyl mercury is apparently degraded to inorganic mercury in the body, however, the rate is considerably slower than noted for aryl or alkoxy mercurials. After administering methyl mercury to rats, 6-50% of the mercury excreted in the urine was inorganic mercury (86, 178). Methyl mercury apparently can be degraded to inorganic mercury in the liver and kidney of mice (1 77), and liver ofrats (178). Six weeks after injection of methyl mercury in rats, the percentage of mercury remaining in the organic form was reported to be 90% in the liver, spleen , and blood ; 75% in the plasma and brain; and 55% in the kidney (86). The relatively slow excretion rate and the constant distribution of methyl mercury among different organs are fmiher indications of its relative stability (I 75).
Tissue distribution The task group on metal accumulation discussed the
factors which determine the distribution of metals among tissues (186). T hey indicated that most of t~e mercury absorbed by tissues is probably fo~nd 1.n plasma. Mercury contained in er)_'1:hr~cytes most. likely IS
unavailable for direct exchange w1th tissues , but IS one of many pools of mercury in the body a nd is in continuous exchange with plasma. The task group stated th~t the exchange of mercury between plasma and t1ssues undoubtedly involves numerous complex factors, three of
294 HUGUNIN AND BRADLEY
which might be: (a) the fraction of merc ury in the plasma
which is in the diffus ible form and the rate at which
perfusion of tiss ue occurs; (b) permeability of the cell
membrane to the form of mercury in plasma, and (c)
avai labi li ty and turnover rate of suitable membrane and
in tracellul ar ligands for bind ing mercury.
Clarkson (44) reviewed the binding of mercury
compounds to the biologica l tissues and fluids. Stud ies
covered in this review indicate that less than 1 o/o of the
mercury in pl asma is in a diffusib le form. Most evidence
indicates that mercury is bound to th iol groups, however,
ligand groups other than thiols also may be involved in
binding mercury in tissues. A two-point attachment of
mercury, one point through a thiol group and the other
to a nonthiol ligand has been proposed for mercuric ions
(! 28) and organomercuria l molecules (243). A theoretica l
discussion of the t ransfer of mercury from blood to
tissues was reviewed by Clarkson (44). The rate of
equilibration between the nondiffusib le bound mercury
and the diffusible form wi ll affect the tiss ue
concentration . the availab ility of ligands and the strength
of the mercury ligand bond on each side of the cell
membrane will influence the concentration gradient
which is esta blished across the cell membrane. Clarkson
indicated that certain su lthydryl groups show higher
affinit ies for mercury than others. Furthermore, some
evide nce indicates that cells may expend metabolic
energy to concentrate mercury . The mechanism which
se lectively permits some forms of mercury to penetrate
the blood -brain barrier and the placental wall has not
been comp letely resolved (44).
The pattern of distribution of mercury among tissues
va ries depending on the form. Therefore, biotransforma
tion of mercury to d ifferent forms resu lts in a continuous
change in distribution. Inorga nic mercu ry characterisitica lly shows a non uni
form distribution among body tissues. Berlin and
Ullberg (/7) injected mice with a solution of 203HgC1 2
and by autoradiographic techniques , observed the
distribution over a 16-day period. Initially, the high
mercury content of blood indicated intense concentra
tions in highly vascularized organs. In 24 h, mercury
acc umulated in the liver. spleen, bone marrow, and
thymus. then decreased rapidly in the blood, liver ,
spleen. bone marrow and myocardium. However, in the
brain, renal cortex, and testes , the decline in
concentration was much slower. Whi le mercury
appeared in the placenta 24 h after injection, only traces
of mercury were detected in the fetus. Throughout the
entire study, the concentration of mercury was highest in
the renal cortex. This agrees with data showing 85 o/o of
the mercury in rats located in the kidney 15 days after
lllJection with mercuric chloride (200). Similar
distributions were noted in guinea pigs by Nordberg and
Serenius (1 74), rats by Swensson and Ulfvarson (224) ,
and Friberg (78), and quail by Nishimura et al. (1 73).
However in quail , a considerable portion of the mercury
was found in the ova (173) .
Distribution of elementa l mercury, after inhaling
vapors, was similar to that observed for inorganic
mercury salts. Higher concentrations of mercury were
found in the brain, blood, and myoca rdium than were
noted with inorganic sa lts (175) . Magos (155. 156)
attribu ted this to a slight delay in oxidation of mercury
vapor, permitting ditlusion of vapors to occur across the
blood-brain barrier . Berlin et al. (1 5) reported that the
concentration of mercury in the brain of mice inhaling
elemental mercury vapors was 10 times higher than that
following an equiva lent injection of mercuric salt.
Similar va lues were noted in guinea pigs (174).
Phenylmercuric salts are distributed d ifferently than
inorganic mercury sa lts . Berlin and Ullberg (1 8) observed
the following: phenylmercury was retained in the blood
longer ; larger portions were found in the liver and
al imentary tact; more mercury was retained in the
skeletal muscles; and accumulation in the kidney was
slower than noted for inorganic mercury sa lts. Sim ilar to
mercuric chloride, high concentrations of mercury were 1
fo und in the placenta, but only traces could be found in
the fetus . Takeda et a l. (226) reported that distrib ut ion of
phenylmercury in rats , initially after administration, was
sim ilar to that observed for alkyl mercury compound s.
After 8 days , however , the distribution pattern more
closely resembled that observed for mercuric ch loride.
The authors attribu ted the change in distribution pattern
to the rap id breakdown of phenylmercury to inorganic
mercury. Gage (86) reported similar results in rats
injected with phenylmercury acetate. At the end of 6
weeks, the concentration of mercury in the kidney was 90
times higher than in the liver , sp leen, brain, heart, and
blood components. Ellis and Fang (64) studied
distribution of phenylmercury and mercuric ions in rats
for 120 h after a single oral dose. The concentration of
mercury in organs of rats treated with phenylmercury
was higher, reflecting a higher gastrointestinal absorp
tion of the organ ic form . Highest concentrations of
mercury were fo und in the kidneys for both mercury
compounds. Blood levels were 30-40 times higher and
liver 4-5 times higher in the phenylmercury treated rats
tha n in those receiving mercuric chloride. Ulfvarson
(237) noted that the pattern of distribution of mercury
among tissues was dependent upon the dose of
phenylmercury, indicating that a saturation pheno
menon may occur. Following the administration of alkyl mercury
compounds , a relatively even and constant distribution of
mercury among the organs was reported . Berlin and
Ullberg (19) using single intravenou s injections of
f 03Hg]methylmercury dicyandiamide in pregnant mice ,
studied distribution by autoradiography. One hour after
injection , the highest concentration of mercury was
found in blood; however, an accumulation was noted in
the kidney, liver , pancreas, mucosa of the alimentary
tract, and ga llbladder. After 4 h, mercury was detected in
the fet us, colon, a nd muscles , whereas the amount of
;. '

I
·~
' '
MAN AND MERCURY 295
mercury in the liver was at its maximum. Twenty-four hours after injection, mercury was distributed uniformly through the body and fetus, except the centra~rvous system that contained a lesser amount and the bony skeleton in which mercury was not evident. During the
following IS days, the concentration of mercury decreased in all organs except the brain and spina l cord , where the concentration doubled. At day I6 , the concentration of mercury in the brain was exceeded only by that in the renal cortex and colonic mucosa. Hirota (I 09), as reported by Kojima and Fujita (134) , noted similar distribution of mercury in rats given a single intramuscular injection of methyl mercury, except that the concentration of mercury in the brain was always less than that found in liver, kidney, or blood within 40 days of injection. Maximum brain concentrations were reached at approximately 15 days.
Friberg (78) administered IO daily injections of methyl mercury dicyandiamide and mercuric chloride to rats and studied the distribution. Blood, spleen, liver , and kidney ofrats receiving methyl mercury contained more uniform concentrations of mercury , while the concentration of mercury in brain was IO times higher than found in the rats receiving mercuric chloride. However, the liver of methylmercury treated rats had a mercury concentration tive times higher than the brain.
It became apparent that large differences exist between species with reference to concentration of meth yl mercury across the blood-brain barrier. After equilibration, the ratio of concentration of mercury in blood-to-brain approached 20 for ra ts (78. 86. 222),
.5-1.5 for mice (177, 219) and cats (131) and 6.5 for pigs (191) . Nordberg and Skerfving (175) estimated the blood -to-brain ratios for mercury concentrations in man at 0.1-0.2.
It is not known whether such dramatic differences
1 ex ist between species in the ability to transport methyl mercury across the placental membrane. Suzuki et al. (220) reported that higher concentrations of mercury were found in the blood cells of umbilical cord in humans than were present in the maternal blood cells. Matsumoto et al. (158) reported the presence of higher concentrations of mecury in brains of feta l rats than their mothers which had received methyl mercury chloride.
Takeda et al. (226) studied distribution of other alkyl mercury compounds in rats . Rats treated with ethyl and n-butyl mercury showed mercury distribution patterns similar to those noted for methyl mercury. however , increasing the chain length of the alkyl group resulted in a decrease in the brain-to-plasma ratio for mercury concentration. Platonow reported similar distribution for ethyl (190) and methyl mercury (191) given to pigs.
Ellis and Fang (64) studied the intracellular distribution of phenylmercury and mercuric ions in rat kidney and liver. Whereas concentration differences between the two organs were only slight , several differences were noted between the two forms of mercury . When the concentration of 1.11ercury in the cell fractions was based
/ on moles of mercury p~ milligram of nitrogen. the differences were as follows: (a) binding of phenylmercury was greater than inorganic mercury in a ll fractions, nuclear , mitochondria. microsomal. and so luble, (b) the Tate of accumulation was faster for phenylmercury in most fractions, whi le elimination was equally as fast, (c) the level of mecury in the fraction s. particularly the nuclear and soluble, remained quite constant over the 120-h study period.
Norseth (176) reported intracellular distribution patterns for mercuric chloride, meth yl mercury dicyandiamide, and methoxyethylmercury in rat liver. Concentration of mercury after injection of mercuric chloride increased during a 4-day period in the
mitochondrial and lysosomal fractions, and remained relatively constant in the microsomal fraction. Of the three mercurials used, the smallest percentage of mercury in the mitrochondria occurred with methyl mercury , the largest with mercuric chloride. Approxi mately 25.9% of methyl mercury was associated with the microsomes , compared to 12.5 % of mercuric chloride and I8.7% of methoxyethylmercury. Approximately 25% of mercuric chloride was associated with the lysosomes compared to I8 % of methoxyethylmercury and 7o/o of methyl mercury. Concentration of mercury in the nuclear and soluble fractions was not determined.
Excretion of m ercury Inorganic mercury is excreted by the kidney , liver in
bile, intestinal mucosa, sweat glands, and sa livary glands with the major routes of excretion in urine and feces (82). Rothstein and Hayes (200) reported that for S-7 days after rats were injected with Hg(NO:J 2, a high concentration of mercury was found in the feces; however , after I 5-30% of the dose had been excreted by this route , there was a sharp decrease in the mercury
...__ content of the feces. The remaining mercury was primarily excreted in urine. A total of 4 7-7 1% of the tota l dose was excreted by the two routes within 52 days. The change in the route of excretion apparently resulted from the change of tissue distribution of mercury. High fecal excretion occurred during the rapid decrease in all tissues with the exception of the kidney. By the I 5th day . 86 % of the remaining body burden of mercury was concentrated in the kidney, Prickett et a!. (193) noted similar excretion patterns of mercury from rats injected with mercuric acetate. Miettinen (162) and Ra hola et al. (194) gave an ora l dose of 203Hg+2 to 10 human volunteers and studied the retention and excretion. Eighty-five percent of the dose was found in the feces collected during the tirst 5 d ays. The biological half-life of the I 5% of th e remaining mercury after 5 days as determined by whole-body measurements , was 37 ± 3 days for men a nd 48 ± 5 days for women. These ha lf-lives correlate with the biological half-life of mercury remaining after the first phase of excretion in the study reported by Rothstein and Hayes (200), a nd therefore. the excretion rates of inorga nic mercury apparently are simil a r for
man and rat.

296 HUGUNIN AND BRADLEY
Because of the varying turnover rate of inorganic mercury in different body tissues , it is generally believed that the danger of repeated doses of mercury may be underestimated using calculations based on whole body biological half-life of mercury. To evaluate the danger for critical organs, it is best to consider the half-life of mercury on the basis of body compartments. Cember (38) developed a theoretical four-compartment model consisting of: (a) a long term compartment , the kidney; (b) a short term compartment, the liver; (c) a tissue compartment, the rest of the body, and (d) an excretion reservoir. By assuming first order kinetics and using parameters established from studies of rats injected with mercuric nitrate , he solved different equations describing the turnover of mercury in each compartment. The model proved reasonably -- representative of the elimination rate observed in rats injected with mercuric chloride (38).
The elimination rate of mercury from the kidney is dependent upon the dose; excretion rates increased directly with dose. This phenomenon may be the result of an increase rate of turnover of kidney cells resulting from the toxic effect of mercury (188).
Hayes and Rothstein (I 07) reported that excretion of mercury by rats which had inhaled mercury vapors was very similar to that noted previously when solutions of mercuric salts were injected. High concentrations of mercury were initially present in the lung, but within 15 days, the level diminished to a level found in other tissues . Gage (85) studied the effect of continuous and intermittent exposure to mercury vapors on excretion rates in the rat. Whereas, continuous exposure resulted in the constant daily excretion, intermittent exposure produced fluctuating daily excretions with peak excretions occurring on days when exposure had not occurred. The authors concluded that a delay occurs between exposure and excretion , and urine levels of mercury do not readily diminish after exposure ceases .
Ellis and Fang (64) reported that the excretion rate for phenylmercuric acetate in rats was similar to that observed for mercuric acetate once maximum accumulation of mercury in the kidney had occurred. Gage (86) studied the forms of mercury in the excrement of rats receiving one injection of phenylmercury acetate subcutaneously. Percentages of organic mercury in the urine were about 100, slightly less than 50, and approximately So/o for the first, second , and third days , respectively. The feces contained a relatively low percentage of organic mercury , even on the first day.
Cember and Donagi (39) reported that elimination of phenylmercury with respect to route and rate is dependent upon the dose. Larger doses resulted in a higher proportion of the mercury being excreted in the feces and higher total excretion per day . Most studies indicated that 67o/o of the dose of phenylmercury excreted by rats is contained in the feces (64, 86, 193, 226) . Correlation of the results of different reports is
complicated by variations of dose , length of exposure, and time of sample collections.
Excretion of alkoxymercury appears similar to th f t of arylmercury compounds. Daniel et al. (53) thoroughly investigated the excretion of methoxyethylmercury in rats and showed rapid metabolism to ethylene and inorganic mercury with a half-life of 1 day. Excretion shortly after administration reflected a high concentration of organic mercury in the urine , however, after a few days urinary mercury was in the inorganic form . Bile samples collected contained a high proportion of organic mercury , however , feces contained only inorganic mercury. Because the feces content was less than expected on the basis of bilary excretions , resorption and metabolism must occur in the intestine.
Swensson and Ulfvarson (223) compared the excretion rates of four forms of mercury in Leghorn cocks. Ten days after injection, the percentages of the initial doses remaining in the body were lO o/o for methoxyethylmercury, 20 o/o for phenylmercury, 40 o/o for mercuric nitrate , I and 80o/o for methyl mercury.
Little methyl mercury is excreted from the body by the lungs (181). The urine contained 20o/o of the mercury excreted by rats during the 10-day period following a single injected dose; however, less than 30 o/o of the injected dose was excreted during this time period (178). In humans , urinary excretion seems even less significant. Aberg et al. (1) reported that less than 10o/o of the mercury excreted within 49 days was found in the urine Miettinen et al. (I 63) found less than 0.5 o/o of the excretion during the first 10 days occurred in the urine, however, by day 100, the mercury content of urine was approximatley 1/4 that of the feces. In both studies, the mercury content of urine increased during the sampling period (1 , 163). The biological half-life of methyl mercury determined by whole body measurements of humans was 76 ± 3 days (163) .
The major route of excretion of methyl mercury is the feces (1 , 14, 78, 86, 163, 178). Norseth and Clarkson conducted in-depth studies of the intestinal excretion of methyl mercury. Approximately SOo/o of the mercury in the feces is in the inorganic form (I 77, 178, 179). Norseth and Clarkson (I 79) reported that sam pies collected from the upper part of the small intestine contained significantly lower relative amounts of inorganic mercury in rats. In this report , they indicated that total excretion of mercury per day in the bile greatly exceeded the fecal excretion , and that the bile is the major source of mercury in the small intestine . Approximately 77o/o of the mercury in the bile exists in the form of a methyl mercury cysteine complex which is rapidly absorbed in the intestine and none in excreted. Mercury which is excreted in feces reportedly arises from exfoliation of intestinal cells , pancreatic excretions , gastric content, plasma catabolism, and the non-cysteine bound mercury compounds in the bile. Biotransformation of protein-bound methyl mercury to inorganic mercury
, , ;. '

'
' ·~
MAN AND MERCURY 297
apparently occurs in the cecum or colon, possibly by
microbial action. Accelerated excretion of methyl mercury has been
accomplished by feeding rats reduced hair (225) and
mice thiol containing resins (47). Both materials have a
high capacity to bind mercury compounds, and because
no absorption of resin or hair occurs from the
gastrointestinal tract, absorption of the mercury is
markedly decreased.
Takeda et al. (226) indicate that ethyl and n-butyl
mercury demonstrated excretion patterns similar to
methyl mercury. Dimethyl mercury, however, has a
considerably different excretion pattern. Ostlund (181)
reported that 80-90% of a dose of dimethyl mercury was
exhaled by mice within 6 h, whereas the remainder was
metabolized to monoethymercury.
Indices of exposure
Numerous attempts have been made to identify a body
component which could easily be assayed for mercury
concentration and would serve as a valid index of the
extent of exposure. The major criterion for such an index
would be that the mercury concentration of that
component was proportional to the mercury content of
the critical organs or tissues of the body. This
relationship should hold during both the period of
accumulation and the period following exposure. Special
attention has been given to blood, urine, feces, and hair
as indices of exposure to mercury.
Difficulty has been encountered in identifying an
index of exposure for inorganic mercury , or those forms
of mercury which are rapidly broken down in the body.
As discussed earlier, tissue distribution of these
mercurials changes with time. Highest concentrations of
mercury accumulate in the kidney. The biological
Cons umers of Mercury
Individuals who have died from
mercury poisoning.
japanese with observed symptoms of
poisoning from fish consumption
(Niigata) .
Swedish grou p in whic h chromosome
breakage was observed.
Finnish people who consumed large
amounts of fis h and had no symptoms.
Swedes in polluted area who
cons umed large amounts o ffi sh and
had no s ymptoms.
U. S. ''Weight Watchers" who consumed
large amoun ts of tuna
Normal consumption- a segment of the
Sw ed ish popu la tion .
*
• l
half-time of inorganic mercury in the kidney is longer
than reported for other body organisms and tissues and
this may account for the observed poor correlations of
blood and kidney concentrations of mercury (I 86).
Mercury in the urine reportedly correlates with the levels
in blood, but is not necessarily indicative of the
concentration in the kidney (16, 213). Goldwater (91) and
Smith et al. (213) reported that a correlation between
exposure to mercury vapors and blood and urine mercury
levels exists on a group basis in spite of individual
discrepancies. Brown and Kulkarni (30) received
numerous reports showing the concentration of mercury
in the urine and blood of factory workers exposed to
mercury and others (30, 79) showed large daily
fluctuations in mercury concentrations in urine. The
international committee which met to establish the
Maximum Allowable Concentration (MAC Committee)
of mercury considered use of urine and blood as indices.
The concentration of mercury in urine may aid in
diagnosis of mercury poisoning, and indicate exposure to
air concentrations of mercury when used on a group
basis (80). Also a positive correlation between exposure
and mercury levels in blood was probably on a group
basis. Based on reports of distribution and excretion of
inorganic mercury compounds, it seems reasonable to
conclude that blood and urine levels of mercury would
serve primarily as an indicator of recent exposure and
not necessarily kidney concentrations (82).
Alkylmercury compounds are more uniformly
distributed through the body than other mercury
compounds and excretion rates of alkylmercury
compounds from the various body tissues are relatively
uniform. For these reasons , greater success has been
obtained in locating indices of exposure for alkylmercury
compounds. ..
'*Isolated case in which low level found . 0 0.2 0.4 0.6 0.8 LO
PL----r----"' ... 12 1.4 Level of M ethyl Mercury
(in Parts Per Million) .. + in Red Blood C e lls Chromo-some Fetal Damage O vert Symptoms Fatal
Damage (Estimate) May Occur
Figure S. R elation of m ethy l m erClll)•levels in blood to physical hazard. Originally appeared in "Mercury in Man ... by Neville Grant. Environment.
Vol. 13. No.4. pp. 2-15. Copyright © Committee for E n vironmental information, 1971.

298 HUG UN IN AND BRADLEY
The concentration of mercury in urine is of little value as an index of exposure to alkylmercury compounds. Lundgren and Swensson (154) studied workers exposed to alkylmercury compounds and reported that while under exposure, mercury was present in the urine , however , shortly after cessation of exposure, mercury
could not be detected in the urine. Friberg et al. (81) and Kurland (141) reported that blood levels of mercury are a good indicator of the accumulation of alkyl mercury in the brain . Mercury concentration in red blood cells is probably most indicative of alkylmercury exposure; however , whole blood levels can be used if it is possible to exclude exposure to other forms of mercury (1 86). Figure
5 was presented by Grant (96) to summarize the relationship of methyl mercury levels in blood to physical hazard . A strong correlation between mercury levels of blood and hair during regular, continuous exposure was reported with hair levels approximately 300 times higher than blood levels (81). Work which was done in our laboratory showed a high correlation between methyl mercury content of diets and mercury levels in hair of guinea pigs. A correlation was also found between hair levels of mercury and mercury concentration of the optical cortex of the cerebrum. One advantage of hair as an index of exposure is that by clipping sections, it is possible to determine periods of previous exposure.
With reference to safe levels for indices of exposure, the MAC Committee (80) stated 10 1-1g Hg per 100 ml whole blood should not be exceeded. The Joint
FAO/ WHO Expert Committee on food additives (69)
reported that the lowest mercury levels at the onset of neurological symptoms of mercury poisoning were 50 1-1gl g hair and 0.4 1-1gl g red blood cells.
Toxicology
Two concepts are of importance in the study of mercury toxicology: (a) the critical concentration, and (b) the critical organ. The critical concentration is reach ed when undesirable functional changes occur in the cell. The critical organ is that organ in which a critical concentration is first reached and may not necessarily be the organ which accumulates the greatest concentration (186).
Elementa l mercury in the liquid state is not extremely toxic. As discussed previously, this is primarily a result of low absorption . The most danger of elemental mercury is encountered with the vapor state. Readily absorbed by the lungs, vapors of elemental mercury penetrate the blood-brain barrier. For vapors of elemental mecury , the critical organ may be either the central and peripheral nervous system or the kidney (1 86) .
In the ionic form, inorganic mercury does not readily penetrate the blood-brain barrier, and thus the concentration of mercury in the central nervous system is not likely to reach the critical concentration. The kidney is the critical organ for inorganic mercury ions (I 86) .
The reaction of mercuric ions with thiol groups appears
to be the major cause of intoxication for mercury vapors or mercuric sa lts (80). Changes in membrane
permeability, as well as interferences with enzyme activity, can occur as a result of the binding of mercuric ions to these ligands.
Rothstein (199) stated that almost every toxic action of mercurials is to some extent attributed to an interaction
with su lfl1ydryl groups to form a complex known as a mercaptide. Because proteins contain sulfuydryl groups, they are the primary target for mercurial interaction and the consequent toxicological effects . Factors which may
determine the probability of mercurial-sulfuydryl interaction are: (a) the presence of neighboring groups on the protein molecules which have an attractive or repulsive effect; (b) steric hindrance for mercurials with large organic portions; (c) protein configurations which may shield sulfuydryl groups and (d) properties of the medium among which would be pH and presence of anions. A thorough review of the effects of mercury on enzymes was presented by Webb (241).
The symptoms of poisoning by inorganic mercury were reported by Bidstrup ()1). Acute - doses cause gastroenteritis, abdominal pain, nausea, vomiting, and I bloody diarrhea. Within a few days, gingivitis and stomatitis may develop, particularly if the patient maintains a low standard of oral hygiene. Excessive salivation, a metallic taste, swollen salivary glands, and ulcerated lips and cheeks may develop. Acute doses of mercury vapor are likely to cause a tightness in the chest making breathing difficult. Severe kidney injury leading to anuria and uremia are noted in acute causes of inorganic mercury poisoning. Tremors and delerium, resulting from damage to the central nervous system can result from exposure to acute or chronic doses of mercury vapors.
Numerous studies have been done to determine dose-response relationships, however, additional research is still needed in this area. The MAC Committee (80) relied heavily on the studies by Neal et al. (169. 170)
to determine the safe levels of mercury vapor. These studies indicated that exposure to 0.1 mg mercury vapor/ m3 air would not cause poisoning. The MAC Committee (80) acknowledged that Russian studies had found typical symptoms of mercury poisoning in workers exposed to 0.1 to 0.3 mg mecury/ m 3 air but concluded the symptoms were nonspecific.
The LD 50 level of mercuric mercury received by intraperitoneal injection in mice is 7-13 mg/ kg (221).
Davies and Kennedy (54) reported that a subcutaneous injection of0 .75 mg of mercuric chloride/kg body weight caused kidney damage in rats , Fitzhugh et a l. (76) gave oral doses of 40 and 160 ppm Hg•• to rats for 1 year and detected changes in the kidneys. The mercury concentrations in the kidneys were 16 and 49 1-1gl g wet weight, respectively (76).
Phenyl- and methoxyethylmercury compounds are readily degraded in the body, as discussed previously. Because of this decomposition, the toxicology of the aryl and alkoxy mercury compounds is similar to inorganic mercury. Little information is available on the toxicity of
.. '

' ·~
'
MAN AND MERCURY 299
these two classes of mercury compounds. For example,
no serious toxic symptoms were reported for humans who
consumed approximately 100 mg of phenylmercuric
nitrate (23, 242). Fitzhugh et a!. (76) fed diets containing
2.5 ppm phenylmercuric acetate to rats for 1 year and
noticed only minor lesions in the kidney; however,
pronounced kidney lesions occurred in rats fed a diet
· containing 10.0 ppm phenylmercury for 1 year.
Tryphonas and Nielsen (234) found symptoms of
poisoning including lesions of the gastrointestinal tract, kidney, and liver in pigs fed 2.28-4.56 mg Hg as
phenylmercuric acetate/ kg/ day for 14-63 days.
Goldwater (94) stated that 5 ppm phenylmercuric acetate
in diets of rats resulted in senile changes in organs after 1
year; the changes rapidly regressed after feeding of
mercury ceased . Alkylmercury compounds have presented the greatest
toxicological danger to man, particularly with reference
to residue levels in foods . The problem encountered in
Japan was discussed previously. In Iraq and Pakistan,
hundreds of people became ill and many died when grain
treated with methyl and ethyl mercury compounds was
consumed , rather than being used for seed as was
intended (10, 103, 117). In New Mexico, a family of seven
consumed pork from pigs fed methyl mercury
dicyandiamide (panogen) treated seed grain. Three
children in the family evidenced severe brain damage (51,
214).
The critical organ for alkylmercury poisoning is the
central nervous system (186) . The MAC Committee (80)
Constr ic tion or visual field
Disturbance {superfic ial or
I sensa tion deep
r ~diad~c~oki nesis l 10 w nung
A tax ia I in buuoning
l in finger-ringer, finger-nose tests
. Romberg's sign
Impai rment or speech
Impairment of hearing
Impa irment or gait
Tremor
Muscular rigidi ty
Ball ism
Chorea
A thetosis
Contracture
T d {
exaggera ted en on
Reflex weak
Pathologic reflexes
Hen:i plegia
Sali va tion
Sweating
Slight mental distu rbance
~0 • 100
~3'
93 5
93l
88 ~ !
853
o2 ' 75 s
Figure 6. Freq,;ency of the occurrence of various symptoms and signs
in Minamata disease. From Tokuomi, reference 233 .
concluded from numerous studies that mercury
concentrations of 10 ~gig in brain tissue were indicative
of irreversible injury or death. Using a half-life of
mercury in man of 70 days and a 15% distribution of the
alkylmercury in the brain , the Committee concluded that
an intake of 1 mg of alkylmercury per day would lead to
toxic concentrations of mercury in the brain. The fetus
can be of primary importance in cases of pregnancy.
Several reports discussed earlier indicated that higher
concentrations of mercury were found in fetal tissue in
comparison to the concentrations found in the maternal
tissues.
Tokuomi (233) thoroughly discussed the symptoms
and signs of methyl mercury poisoning. A listing of the
clinical features and frequency of their occurrence in 34
patients from the Minamata area is shown in Fig. 6.
Harada (104) described the symptoms and signs ot
congenital methyl mercury poisoning which were
presented in Table 2. Harada also reported that retarda-
TABLE 2. Frequency at the first interview of occurrence of various
symptoms and signs in minamata disease (o/o)1
Post-natal
Symptoms Congenital Children Adults
Mental disturbance 100 100 70.6 Disturbance in coordination - 100 100 80-90 Disturbance in gait 100 100 82.3 Disturbance of speech 100 94.3 88.2 Disturbance of hearing 4.5 66 .7 85.3 Constriction of visual field ? 100 100 Impairment of chewing and swallowing 100 88 .9 94.1 Enhanced tendon reflex 81.8 72.2 38.2 Pathological reflexes 54.4 so 11.8 Involuntary movement 72.7 38.9 26 .5-75.5 Primitive reflexes 72.7 0 0 Superficial sensation * * 100 Salivation 77.2 55.6 23 .5 Forced laughing 27.2 28 .6
N.B. * : Not clear but all patients had sensation of pain. 'Reference 104.
tion of physical development, abnormal pneumoen
cephlograms (PEG) and abnormal electroencephlograms
tEEG) were detected for patients who developed
poisoning symptoms during early infancy. Takeuchi
(227) stated that fetal methyl mercury poisoning could be
distinguished from non-fetal poisoning because signs of
underdeveloped and malformed central nervous systems
were apparent in prenatal poisoning. Autopsies revealed
a tendency for the lesions of the brain to be more
localized in adults poisoned by methyl mercury, whereas ,
in the fetal and infantile brains, lesions are more diffuse
(227) . Atrophy of the brain with compensatory increases '
in fluid are macroscopically noticeable. In other parts of
the body a reduction of red bone · marrow, fatty
degeneration of the liver, and erosion of the duodenum were reported (227). A discussion of microscopic changes in sections of the brain is included in this report by
Takeuchi and will not be covered herein. A latency period of one to several weeks occurs

300 HUG UN IN AND BRADLEY
between administration of alkylmercury compounds and
development of symptoms of poisoning (178, 183).
Whereas, the latency period may represent the time
required for breakdown of alkylmercury compounds and
then the toxic action would result from the mercuric ion
(43, 44); however, most data do not support this theory.
Norseth and Clarkson (I 78) were unable to detect any
significant breakdown of methyl mercury in the brain of
rats during a 30-day period following intravenous
injections . A more plausible explanation for the latency
period is that alkylmercury compounds interfere with
certain biochemical processes for which the effect is not
immediately evident (256).
Pathological symptoms of alkylmercury poisoning
have been documented to a greater extent than the
biochemical effects which cause these symptoms. Many
studies have indicated that methyl mercury may alter
the protein synthesizing processes of the body. Yoshino,
Mozai and Nakao (256) studied the incorporation of
[U- 14C]leucine into brain proteins in brain cortical slices
taken from rats which had been injected with methyl
mercury thioacetamide. These authors reported a 43 %
reductio~. in protein synthesis in these brain slices
obtained from animals which , with respect to
neurological symptoms, were in the latent period of
intoxication. Oxygen consumption and aerobic lactic
acid formation by brain tissue slices decreased, however,
not before the animal had developed neurological
symptoms of methyl mercury poisoning. Likewise,
succinic dehydrogenase activity of brain homogenates
appeared normal until neurological symptoms
developed and at this point there was a decrease in
enzymatic activity. Brubaker et a!. (31) injected labeled
amino acids into rats which received injections of methyl
mercury during the two preceding days . Twenty minutes
after receiving the amino acids, the animals were
sacrificed and the amount of labeled amino acids
incorporated into proteins in liver was determined. Rats
treated with methyl mercury incorporated more of the
amino acids into protein than the untreated rats . In
another paper (153) , the 2-day treatment with methyl
mercury was reported to proliferate the rough
endoplasmic reticulum and decrease the amount of
smooth endoplasmic reticulum of liver. A depression of
the cytochrome P 450, cytochrome b 5, and aminopyrine
dimethylase activity was noted in the liver microsomal
fractions obtained from rats treated with methyl
mercury. In contrast, Pekkanen and Salminen, 1972,
(I 84) reported an increase in cytochrome P 450 and
NADPH-cytochrome C red uctase activity in mice livers
seven days after the animals were injected with methyl
mercury nitrate .
In work done at the University of Wisconsin, effects of
mercury compounds on RNA synthesis was studied. In
rats given methyl mercury, a decrease in the RNA
content was observed in spinal ganglion neurons and an
increase in the RNA content of the anterior horn
motorneurons of the spinal chord (40). Decreased
synthesis of RNA by spinal ganglia after methyl mercury
intoxication was confirmed in mice which were injected
with PH]urid ine (41). A significant decrease in the
incorporation of the labeled uridine was noted (41) . ,
An interesting, and possibly significant, discovery is
the reported decrease in the toxic response noted
when selenium was fed in a diet with methyl mercury.
Iwata and Okamoto (I 16) , as reported by Kojima and
Fujita (134), found selenium reduced the toxic effect of
methyl mercury. Ganther et af. (87) repotied that rats
receiving methyl mercury in the drinking water survived
longer on basal diets supplemented with 0.5 ppm
selenium than rats receiving the same diet without added
selenium . These authors also found that Japanese quail
fed 20 ppm methyl mercury in diets containing 17 o/o tuna
survived longer than quail fed the same level of methyl mercury in a corn-soya diet (87, 88). The selenium
content of the diet containing tuna was 0.49 ppm. Potter
and Matrone (I 92) verified the protective effect of
selenite against the toxicity of methyl mercury and also
mercuric chloride. They reported that selenite prevented I
the methyl mercury-induced reduction of liver size and
the mercuric chloride- induced increase in liver size in
rats. Selenite increased retention of mercury in the
tissues regardless of the form of mercury fed . Ganther
and Sunde (88) reported that their data indicated that
tuna accumulate selenium concurrently with mercury in
a 1:1 molar ratio. Whereas, the mechanism of protection
by selenium is unknown, Ganther et a!. stated that
natural factors of protection such as with selenium
should be considered when conducting toxicity studies
(88).
Effects of mercury on chromosomes
Ramel (196) and Fiskesjo (74) repotied that changes
in chromosomes of onion were induced by alkyl- ,
alkoxyalkyl -, and arylmercury compounds. Changes
repmied were C-mitosis , polyploidy, and aneuploidy,
with chromosome fragmentation occurring with phenyl
and methyl n~rcury . Ramel (198) observed nondisjunc
tion of the ~ chromosome in Drosophila eggs after
treatment with organic mercury compounds. Fiskesjo
(75) reported on in vitro studies with human leukocytes in
wh ich C-m itotic effects occurred in a medium
containing methyl mercury at a concentration of
1-10 X w-5 M. Skerfving et a!. (209) compared the
incidence of chromosome breakage in lymphocyte cells
with the concentration of mercury in the blood of persons
eating varying quantities of fish. A statistically
significant correlation was found between the number of
lymphocyte cells with chromosome breaks or structural
rearrangements and the mercury concentration of the
red blood cells; however , no significant correlations
existed between chromatid breaks, aneuploid or
polyploid cells, or endore duplications and the mercury
concentration of the red blood cells. Ramel (197) stated
that the levels of mercury in food are sufficiently high to
cause genetic effects in humans while the medical
implications of these effects are unknown.
I
•' 1
' I
301
J. Milk Food Tee/mol. Vol. 38, No. 5, Pages 301-303 (May, 1975) Copyright © 1975, International Association of Milk, Food, and Environmental Sanitarians
Report of the Committee on Food Equipment Sanitary Standards, 1973-1974
The IAMFES Committee on Food Equipment Sanitary Standards,
known hereafter as the Committee, is charged with the responsibility of
cooperating with other interested health organizations and related
industries in the formulation of sanitary standards and educational
materials for the fabrication , installation, and operation of food
equipment and to present to the membership those standards and
educational materials which the Committee recommends be endorsed
by the Association . The purpose of this cooperative program is to aid industry in
improving the design, construction , and installation of equi pment so
that it will lead to easy cleaning a nd proper functioning when placed
into service in food estab lishments. It is the Committee's further
purpose to cooperate with industry in the preparation of standards or
guidelines which public health agencies will accept, thereby securing
uniformity in the manufacture and nationwide acceptance of such
equipment. The following report will outline the Committee's activities during
the past year in working with two health and industry organizations
(National Sanitation Foundation 's Joint Committee on Food
Equipment Standards and the National Automatic Merchandising
Association 's Automatic Merchandising Health-Industry Council) and
progress in meeting its purposes and objectives. It is expected these
organizations will be the two groups that the Committee will work with
during the coming year.
NATIONAL SANITATION FOUNDATION (NSF)
The Committee was represented at the J 974 meeting of the National
Sanitation Foundation 's Joint Committee on Food Equ ipment
Standards , where action was taken on several proposals; and before
the meeting, the Committee reviewed and submitted comments on each
draft of these proposals. Since the meeting, the Committee has also
reviewed and submitted comments on proposed changes to standards.
The Foundation staff is to be commended for sett ing aside the first
half-day for a meeting of the public health representatives for them to
1review with the Foundation matters of mutual interest. This enabled
the public health group to develop a productive and a uniform
approach to agenda items and to expedite activities during the meeting
of the Joint Committee.
Basic Criteria C-2 for special devices and equipm ent
The National San itation Foundation's criteria and standards to date
have been limited for the most part to sanitary considerations. This
position , in the opinion of a major restaurant chain sanitarian, has
created problems for the users of NSF approved equipment,
particularly in the area of durability of materia ls and finis hes of food
equipment . Accord ing to Foundation staff, it is extremely difficult and
time consuming to test the durability of materials and finishes , because
of the many variables in use and wear and the extent of preventive
maintenance done on eq uipment . At the request of the Joint
Committee, the NSF staff has made plans to develop a questionnaire
and forward same to public hea lth representatives throughout the
country inquiring into the extent of the durability problem and
soliciting recommendations for a workable solution .
During the 1973 meeting of the Joint Committee, the NSF staff was
reque~ted to determine the feasibi li ty and advisability of developing a
standard on backflow prevention equipment , such as vacuum breakers
and other anti-s iphon devices, for use with food serv ice equipment. The
Foundation staff adv ised the Joint Committee that. based upon a
preliminary study during the past year , the development of such a
standard is not considered feasible at this time. The staff further
reported that this matter may be resolved through work of the
ANSI-A-40 Committee, which has begun to develop a National
Plumbing Code.
Standard No. 3-Commercial spray type dishwashing machines
The proposed revision to NSF Standard No. 3 was given a
preliminary review for content only, since the Joint Committee
members were not given sufficient time before the Joint Committee
meeting to receive input from their respective Committees . This
proposal along with suggestions offered by the Joint Committee is being
referred back to the Standards Task Committee; and after the Task
Committee has reviewed and accepted the proposal, it will be submitted
to this Committee and others of the Joint Committee for final review,
and comment or acceptance. A major change to Standard No. 3, and one recommended by this
Committee and accepted by the Joint Committee, provides that all final
rinse spray arms (as well as wash water arms) shall be readily removable
(without the use of any tools) for deliming and descaling and similar
maintanance .
Standard No. 8-Commercial powered food preparation equipment
The proposed comprehensive revision to NSF Standard No. 8 was
thoroughl y reviewed by the Joint Committee. It was the consensus of
the Joint Committee that some minor differences in construction and
mater ial requirements existed between the proposal and USDA
requ irements for meat and poultry processing equipment. Nevertheless,
with the except ion of resolving these differences, the proposed revision
to Standard No.8, as modified during the meeting, was accepted by the
Joint Committee; copies of this revised Standard may be obtained from
the Fou ndation. One of the significant improvements made in the NSF Standards
during this meeting of the Joint Committee was the deletion of Section
3.041 of NSF Standard No. 8, pertaining to specifications for soft
solder. In add ition to deleting any reference to soft solder in Standard
No.8, the Joint Committee also concurred that similar revisions would
be made to C-2 and the other food equipment standards as they are
reprinted.
Standard No. 18-Food and beverage dispensing equipment manual
At the recommendation of the Joint Committee, condiment
dispensers will now be listed by NSF as non-refrigerated , mechanically
refrigerated , or non-mechanically refrigerated; and any dispensers
mechanically refrigerated shall be required to meet the performance
requirements of NSF Standard No. 7-Re.frigerators and Storage
Freezers. The guidelines developed by the NSF staff for cup stops on
dispensing equipment were also reviewed by the Joint Committee and
approved. These guidelines permit cup stops on beverage dispensers if
the cup rim contact sutface does not exceed '12'' in width a nd if the
act ivating motion of the dispensing lever is in the horizontal plane.
Standard No. 25- Vending machines .for food and beverages
The continuing potential problem of carbonation backflow into
copper lines or equipment of vending machines was again discussed by
the Joint Committee . It was reported during the meeting that vending
machines, with the exception of one manufacturer's equipment, had air
gaps and no copper in the machine upstrea m of the carbona tor. It was the consensus of the public health representatives of the Joint
Committee that all copper tubing should be removed from post mix
carbonation beverage machines. Consequently, the NSF staff was
instructed to poll the members of the NSF Standard No. 25 Task
Com mittee in regard to amending the Standard to permit only an air gap and to proh ibit a ll copper tubing in such vendtng machtnes.
The subject of coin-operated office coffee machines was also
reviewed, and the Foundation Staff reported that the Standard No. 25
Task Committee has met during the past year and recommended a
II·
,. It
li
il
'I
302
revision to NSF Standard No. 25 to include these machines. This
Committee will be asked in the near future to review work of the Task
Comm ittee a nd to submi t comments on the Task Committee's
proposal.
Sta ndard No. 29-Detergent and chemical feeders
The Joint Com mittee reviewed a proposal to amend Standard No. 29.
to include a new Section 4.07 entitled "Performance Test" establ ishing
speci fi cat ions for testing Feeders. The proposal further included
another new Section 4.08 , entit led "Hydrostatic Tests for Feeders with
Water Connectors ." The Committee has studied these proposed
rev isions and, believing the criteria for the test as well as the test period
to be inadequate , recommended that this proposal be re-submitted to
the Standards Task Committee for further study.
Standard No. 33-Commercia/ cooking equipment exhaust systems
Standard No. 33 has provided reasonably adeq uate specifications for
construction of open faced and slot-type hoods . However , Section 5.03,
entitled "Other Types of Hoods" has not provided the same degree of
specificity. This Comm ittee has studied a proposal to delete the last
phrase of this Sect ion. which, in the opinion of some members of this
Committee, wou ld further weaken the Standard; it has submitted
recommend ations to the Found at ion to review this pot1ion of the
Standard within the next year with the intent of providing adequate
specificity for manufacturers for such equipment and for sanitarians
who are charged with eva luat ing the adequacy of such equipment in the
field.
Plans forji1ture standards
The Joint Committee briefly reviewed the fourth draft of a proposed
NSF Standard for supplemental flooring for food services, processing
and transp011ation applications; this Comm ittee has submitted its
recommendation for this type of flooring to the Foundation for
forwarding to the Standards Task Committee for Supplemental
Flooring. It is anticipated that within the next year the Committee will
have the opportunity to review another draft of this proposal.
The NSF staffrepot1ed that a proposed standard for Foam Cups and
Cont ainers was progressing satisfactorily. Phase I (development of
testing equ ipment) has been completed and Phase II (testing of existing
cups) is nearly completed. It is anti cipated that this Commi ttee will
have an opportunity to review the the recommendations of the Task
Committee within the next year.
At the recommendation of this Committee, the Joint Committee
reviewed the need for sanitation requirements for drinking fountains.
The Join t Committee agreed that the NSF should contact the American
Refrigeration Institute rega rding their requirements for drinking
fountains , and explore the feasibility of developing a n NSF Standard
for Drinking Fountains. Currently, drinking founta ins, in general, are
difticult to c lean and do not adequately protect the consumer from
contaminat ion and, as reported in the literature, provide only about the
same degree of protection to the consumer as the common drinking
cup.
NATIONAL AUTOMATIC MERCHANDISING ASSOCIATION
The National Automatic Merchandising Association 's Automatic
Merchandising Health-Industry Council (AM HI C) held its 19th annual
meeting during October, 1973, and thi s Association and other public
health organizations and the affected industries were represented and
participated in AMHlC's discussion.
Ca rbonation backflow
The members of AMHIC, after severa l years of studying the potential
carbonation backtlow problem and reviewing reported outbreaks of
copper poisoning due to carbonation backflow in vending marchines ,
agreed to a proposal to eliminate copper tubing in the interna l
ca rbonated water supply system downstream from the incoming water
supply a ir gap of pos t mix beverage vending machines manufactured or
re-manufactured on or after January 1, 1975. This significant step to
protect the consumer was approved by AMHIC on the basis that
app licat ion to re-manu factured machines needed further stud y and
that app lica tion to newly manufactured post mix beverage vending
machines wou ld be contingent upon the avai lab ili ty of materials. This
significant change was considered by industry and public health
representatives of AMHIC as being a major step in safeguarding the
health of the consumer.
lmemallighting
This Committee and others have recognized that ve nding machines
frequent ly are located in areas without adequate lighting for cleaning
the interior of the vending machines and felt that each vending
machine shou ld be equipped with lighting sufficiently adequate to
enab le the routeman to effectively service and clean the machine . Even
though the merits of adequate lighting were discussed with all the
members of AMH IC, no action was taken at this meeting , pend ing
further study of this matter.
/ cemakers for vending machines
The NAMA staff and members of AMHIC reported that some
icemaker manufacturers have developed effective and efficient
automated cleaning systems for their equipment being used in vending
machines. Based upon the discussion , AMHIC recommended that
NAMA initiate a study to determ ine the effectiveness of recently
developed automatic icemaker cleaning systems as they relate to ice
quality for the purpose of developing specifications for incl usion in the
Evaluation Manual. A furthe r recommendation was that a target date
of July I . 1974, be estab lished for initiation of this project. 1 According to a recent report from the NAMA staff, a tentative
protocol to do this study is being developed and se lected manufacturers
have been asked to participate in final izing the proposed protocol. It is
ant icipated that the study wou ld include a test machine that has been
in operation for 50,000 vends or more, rather than using a new
machine.
Organization plan and procedures
The AMH IC Organization Plan and Procedures was tentatively
revised during the 1973 AM HIC Meeting, with final approva l to be
made later in the year. The proposed revisions concern voting
procedures, membership , visitors and guests, and a few other minor
changes. A copy of the revised Organization Plan and Procedures may
be obta ined from the National Automatic Merchandising Association.
Seal of approval program
After about 2 years of studying the advisabi lity and feasibility of
NAMA implementing a Seal of Approval Plan under the Vending
Machine Evaluation Program and reviewing the pros and cons, the
members of AMHIC accepted a recommendation by NAMA not to
press for a Sea l of Approval Program at this time. However, a sizeable
num ber accepted NAMA's recommendat ion with the understanding
that explorations on the feas ibil ity and advisabi lity of such an approva l
plan would be continued.
Administrative policies for vending machine evaluation program
The ad ministrat ive policies for carrying out the Vending Machine
Evaluation Program were amended to (I) requ ire on and after January
l , 1974, the annua l re-evaluation of all certified machines still in
production ; (2) require the first eva lu ation of vending machines of a
new man ufacturer app licant be cond ucted at the manufacturing plant
or headquatiers; (3) encourage eva luation agencies to make factory
eva luat ions in all cases; and (4) require models made on a contract
basis to be eva lu ated under each nameplate for which a Letter of
Compliance is requested. In addition, AM HIC requested NAMA to urge each manufacturer to
post one or more model numbers on the machine front or interior , visi
ble to inspection and vending operations personnel and that NAMA re
port the results to AMHIC during theyear with the goa l of making such
posting a mandatory req uirement of Eva lu ation Manu al.
Arthur J. Nolan Public Health A ward
The AMHI C Organization Plan and Procedures was further
amended to incorporate a suggestion of this Committee to specify that
the Nolan Award Committee be composed of the immediate past three
surviving award recipients of which the most recent recipient would
serve as the Chairm an of the Committee.
1 , ;. I
' '
I
·~
Standard for coin-operated special dispensers
Accordi ng to the NAMA staff, some manufacturers of small
office- type dispensing machines have requested NAMA evaluation
under the Standard for Coin-Operated Special Dispensers of machines
which utilize internal chocolate whipping devices. When AMHIC
developed this Standard , the members , in genera l, had in mind using
plain water and hot black coffee as acceptable liquid products to be
dispensed through these machines. However, the Stand ard did not
necessarily limit special dispensers to these two liquid products. In fact ,
AMHIC has used bacterial supportive criteria to include or exclude
internal products and systems.
To assist in developing and assuring adequate safeguards , this
Committee has submitted comments to the NAMA staff recommending
that additiona l microb iological studies be made to determine the
feasibi li ty and acceptabi lity of amending this Standard to permit the
use of other food product systems, such as those for chocolate drinks,
soups , tea , or carbonated beverages. Furthermore, AMHIC is currently
exploring the advisability of submitting suggestions to FDA/ PHS to
encourage these regulatory agencies to recognize the specific aspects of
the so-called mini-venders and to include these considerations in any
proposed amendments to the USPHS Food and Beverage Vending
Code.
Educational materials
With the assistance of this Committee and other members of the
Automatic Merchandising Health Industry Council, the National
Automatic Merchand ising Association has revised two safety bulletins,
entitled Microwave Oven Safety and Copper Poisoning Prevention.
Both of these bu lletins, which were published recently, provide much
useful information to members of industry and regulatory agencies.
The bulletin on Copper Poisoning Prevention has been developed and
upd ated to aid in prevention of carbonation backflow into copper
systems in those machines which were manufactured before January 1,
1975. It is believed that application of the principles and
recommendations of this Bulletin can greatly reduce , if not prevent ,
carbonation backflow in vending machines being a source of
foodborne illness d ue to copper poisoning. These bulletins may be
obtai ned by members of public health agencies and organizations from
the National Automatic Merchandising Association.
303
RECOMMENDATIONS
I . The Association reaffirms its support of the National Sanitation
Foundation and the National Automatic Merchandising Association
and continues to work with these two organizations in developing
acceptable standards and educational mate ri als for the food industry
and public health . 2. The Association urges all sanitarians to obtain a complete set of
the National Sanitation Foundation's Food Equipment Standards and
Criteria and a copy of the National Automatic Merchandising
Association-Automatic Merchandising Health-Industry Council's
Vending Machine Evaluation Manual and related educational
materials; to evalu ate each piece of food equipment and vend ing
machine in the field to determine compliance with the applicable
sanitation guidel ines (construction and installation specifications); and
to let this Committee and the appropriate evaluation agency know of
any manufacturer, installer, or operator failing to comply with these
guidelines . 3. The Association urges all sanitarians and regulatory agencies to
support the work of the Association's Committee, submit suggestions
for developi ng new guidelines and for amending same, and subscribe,
by law or administrative policy, to the principles represented by the
Standards , Criteria, and Evaluation Manual for Food Equipment and
Vending Machines. This report of the Committee on Food Equipment Sanitary
Standards is respectfully submitted by:
Karl K. Jones, Chairm an , Purdue University, Student Hospita l, West
Lafayette, Indiana
Arthur L. Banks , Department of Health , Education, and Welfare,
Brooklyn, New York
Robett R. D alton, Michigan Department of Public Health , Lansing,
Michigan
Carl Henderson, State Department of Health and Social Services,
Santa Fe, New Mexico
Howard Hutchings, South Dakota Department of Health , Pierre, South
Dakota
0. Donald Moore, Food & Drug Administration , Atlanta , Georgia
W. Joel Simpson, Pennsylvania Department of Environmental Re
sources, Harrisburg , Pennsylvania
Harold Wainess, Harold Wainess and Associates, Northfield , Illinois

304
PROGRAM
Sixty-Second Annual Meeting International Association of
Milk, Food and Environmental Sanitarians, Inc. In cooperation with
Ontario Milk and Food Sanitarians Assn. and University ofGuelph, Food Science Department
August 10-14, 1975
Royal York Hotel Toronto, Ontario
REGISTRATION
Sunday, August 10-1 :00 p.m.-8:00p.m. Monday, August 11-8:00 a.m .-8:00p.m. Tuesday, August 12-8:00 a.m.-5:00p.m .
Wednesday, August 13-8:00 a.m.-5:00p.m. Thursday, August 14-8:00 a.m .-12 :00 Noon
REGISTRATION FEE-$10.00 Banquet-$15.00
1. Finance: John Wilson 2. Reception: Jim Cave 3. Door Prizes: Gord Johnson 4. Publicity & Photo: Glen Ward 5. Special Events: Doug Varnell 6. Visual Aids: Les Latchford 7. Entertainment: Cyril Duitschaever
Steven Lewis 8. Ladies' Activities: Mrs. Nancy Raithby 9. Transportation: Art W . Lord
10. R egistration: M. A. (Vic) Amer 11. Speakers Hospitality: Phil Glass
'
Ladies Registration-$5.00 Students-No charge for Registration
National Mastitis Council Registration-$1.00 12. Program & Meeting Room Arrangements: George
IAMFES OFFICERS
President: Parnell J. Skulborstad, Oak Brook , Illinois President-Elect: Harold E. Thompson , Jr., Fairfax, VA First Vice President: Henry V. Atherton, Burlington ,
Vermont Second Vice President: David D. Fry, Orlando, Florida Secretary-Treasurer: Richard P. March , Ithaca , New
York
EXECUTIVE BOARD
Parnell J. Skulborstad Harold E. Thompson Walter F. Wilson Henry V. Atherton
Earl 0. Wright Richard P. March
David D. Fry
JOURNAL OF MILK AND FOOD TECHNOLOGY
Editor: Elmer H. Marth, Madison , Wisconsin Managing Editor: Earl 0. Wright, Ames , Iowa
ONT ARlO MILK AND FOOD SANITARIANS ASSOCIATION CHAIRMEN, LOCAL ARRANGEMENTS COMMITTEES
General Chairman: William Kempa Co-Chairmen: William Harley
Dr. AI Myhr
Hazlewood
ONT ARlO MILK AND FOOD SANITARIANS ASS'N.
President: Bill Kempa First vice-President: John Wilson Secretary: George Hazlewood Treasurer: Bob Tiffin
IAMFES PROGRAM COMMITTEE
Harold E. Thompson - Chairman Henry V. Atherton Richard P . March David D. Fry Erwin Gadd
CHAIRMEN OF LOCAL
ARRANGEMENTS COMMITTEE
General Chairman: Bill Kempa Co-Chairmen: Bill Harley-A! N. Myhr R egistration, Advance & R egular: M. A. (Vic) Amer Finance: John H. Wilson Visual Aids: Les Latchford Publicity: Glen Ward Door Prizes: W. Gord Johnson Entertainment: Cyril L. Duitschaever-Steven Lewis Ladies' Activities: Nancy Raithby R eception: James Cave Photographer: Glen G. Ward and Dietrich Wolfram
;

'
I ..
' .. l
'
'
PROGRAM 305
Speakers Hospitality: Phil Glass Transportation: Art W. Lord
Special Events: Doug J. Varnell
Meeting Room Arrangements: George I. Hazlewood
AFFILIATE COUNCIL OFFICERS
Chairman: Erwin P. Gadd Secretary: Leon Townsend
AFFILIATE REPRESENTATIVES
Representative: Affiliate:
Jerry Williams Arizona
Robert Coe Illinois
Wayne Baragry California
Gordon A. Allen Connecticut
Jay Boosinger Florida
Jack Palmer Idaho
Paul Meyers Indiana
H. E. Hansen Iowa
Gerald Jones Kansas
Leon Townsend Kentucky
James Szyda Michigan
Roy E. Ginn Minnesota
Jimmy W. Bray Mississippi
Ervin P. Gadd Missouri
R. P. March New York
G. Hazlewood Ontario
Marvin Beach Ontario-Eastern Branch
Floyd Bodyfelt Oregon
Gerald Shick Pennsylvania
Frank Yatckoske Rocky Mountain
Maury Dunbar Rhode Island
Howard Hutchings South Dakota
W. H. Gill Virginia
L. 0. Luedecke Washington
Don Raffel Wisconsin
Walter Wilson Executive Board
Earl 0. Wright Executive Board
SUNDAY, AUGUST10, 1975
1:00- 8:00 p.m.-Registration-Convention Floor Foyer
1:30- 5:30 p.m.--Executive Board - Confederation
Room No . 3 6:00- 7:00 p.m.-Early Bird Reception-York Room
8:00-11:00 p.m.-Executive Board - Confederation
Room No.3
MONDAY, AUGUSTll, 1975
8:00 a.m.-8:00p .m. Convention Floor Foyer
Special Meetings
9:00 a.m.-12:00 Noon-Executive Board-Confedera-tion Room No. 3
1. Report on Local Arrangement
2. Report of Executive Secretary 3. Report of Sanitarians Joint Council
1:00- 3:00 p .m.-Affiliate Council-Manitoba Room
1. International Program 2. Discussion of Association Awards
3. Affiliate Input to Journal of Milk
and Food Technology 4. Discussion of possible IAMFES
and NEHA Merger 5. Future Meeting Location Recom
mendations 6. Election of Affiliate Council Offi
cers 7. Other Petiinent Topics
1:30- 5:00 p.m.-Executive Board - Confederation
Room No.3 1. Report of Journal Management
Committee 2. Regular Agenda 3. Committee Chairmen 4. Report of Affiliate Council
5. Meet with Past Presidents
1:30- 5:00 p.m.-Individual Committee Meetings
3:00- 5:00 p.m.-Farm Methods Committee-Tudor
Room 6:00- 7:00 p.m.-Reception-Concert Hall
(Individual committee meetings are open to all registrants)
TUESDAY, AUGUST 12,1975
8:00 a.m.-5:00 p .m.-REGISTRATION Convention Floor Foyer
8:00 a.m.-9:00 a.m.-Executive Board Confederation Room No.3
Morning- General Session
Grand Ballroom
Harold E. Thompson-Presiding
9:30 a.m.-INVOCATION-William Harley
9:35 a.m .-ADDRESS OF WELCOME David Crombie, Mayor of Toronto
Honorable William A. Stewart, Provincial
Representative 10:15 a.m.-PRESIDENTIAL ADDRESS-Parnell
Skulborstad 10:45 a.m.-A . B. Morrison, Ph .D.-Keynote Speaker
11:45 a.m.-Election Results, 1975
Afternoon- Milk Sanitation Section
Grand Ballroom
David Fry-Presiding
1:30 p.m.-DOOR PRIZE DRAWING ·
1:40 p .m.-BEHAVIOR OF ENTEROBACTER SPE
CIES IN SKIM MILK DURING FER
MENTATION BY LACTIC ACID BACTERIA. J. L. Rutzinski and E. H. Marth .
2:00 p.m.-AN EXAMINATION OF METHODS FOR ASSESSING POST PASTEURIZATION CONTAMINATION. Guenter Blankenagel
306 PROGRAM
2:40 p.m.-EFFECT OF MEDIUM, DILUTION
FLUID AND INCUBATION TEMPERA
TURE ON ENUMERATION OF BAC
TERIA IN GRADE A AND MANUFAC
TURING GRADE MILK. Chamras Sang
hirum and B. E. Langlois.
3:00 p.m.-DETERMINING SANITARY STATUS
OF FARM MILK PIPELINES USING
THE RINSE-FILTER PROCEDURE. R.
W. Scroggins and R. T . Marshall.
3:20 p.m.-Milk Break
3:35 p.m.-PROPOSED NEW MICROBIOLOGICAL
STANDARDS FOR CHEESE. D. L. Col
lins-Thorn pson
4:05 p.m.-NORTHEAST DAIRY PRACTICES
COUNCIL. Richard P. March
4:45 p.m.-CORRELATION OF THE MILK QUALI
TY (MQG) WITH THE WISCONSIN
MASTITIS TEST (WMT). R. Kevin Chum
ney and Dick H. Kleyn.
Afternoon- Food Sanitation Section
Ontario room
Henry Atherton-Presiding
1:30 p.m.-DOOR PRIZE DRAWING
1:40 p.m.-BACTERIOLOGICAL QUALITY OF
HAMBURGER AT THE RET AIL LEVEL.
C. L. Duitschaever.
2:00 p.m.-MICROBIOLOGICAL STANDARDS
FOR MEAT IN CANADA. H. Pivnick.
3:30 p.m.-REMOVAL OF BISULFITE FROM
SHRIMP BY HYPOCHLORITE RINSES.
K. E. Weingatiner, F. W. Knapp and J. A.
Kroburger. 3:20 p.m.-Milk Break
3:35 p.m.-MICROBIOLOGY OF THE WILD RICE
FERMENTATION. J. F. Frank, E. H.
Marth , R. C. Lindsay, and D. B. Lund.
3:55 p.m .-NATIONAL SANITATION TRAINING
PROGRAM. Richard J. Davies .
4:35 p.m.-POTENTIAL FOR AFLATOXIN PRO
DUCTION ON SMOKED MULLET. B. Y.
Farhat and J. A. Koburger.
TUESDAY EVENING, AUGUST 12, 1975
7:30-9:30 p.m.-EVENING DISCUSSION GROUPS
7:30 p.m.-FOOD SANITATION-Algonquin Room
William F. Bower-Moderator
C. L. Duitschaever H. Pivnich David E. Hartley Richard J. Davies
7:30 p.m.-MILK-Territories Room
Richard P. March-Moderator
E . L. Collins-Thompson
R. L. Richter Robeti Zaii H. E. Thompson
7:30 p.m.-ENVIRONMENTALSANITATION-Mani-
toba Room Walter Wilson-Moderator
J. B. Derbyshire Larry J. Gordon John B. Robinson
9:30-11:00 p.m.-Wine and Cheese Party
WEDNESDAY, AUGUST 13,1975- Grand Ballroom
8:00-5:00 p.m.-REGISTRATION-Convention Floor
Foyer
Parnell J. Skulborstad-Presiding
8:30 a.m.-DOOR PRIZE DRAWING
8:45 a.m .-In Defense of Food Packaging-A. R.
Chadsey 9:15 a .m.-Water and Waste Management-Everett M.
Biggs 10:00 a.m.-Milk Break
10:15 a .m.-DOOR PRIZE DRAWING
10:20 a.m.-ANNUAL BUSINESS MEETING
1. Report of Executive Secretary
2. Report of Secretary-Treasurer
3. Committee Reports 4. 3-A Symbol Council Reports
5. Report of Resolutions Committee
6. Report of Affiliate Council
7. Old Business 8. New Business 9. Election of Officers Ivan Parkin-Parlimentarian
Afternoon- Milk Sanitation Section
Grand Ballroom
William Harley-Presiding
1:30 p.m.-DOOR PRIZE DRAWING
1:40 p.m.-RECOVERY OF COMPOUNDS RE
SPONSIBLE FOR LIGHT-INDUCED
FLAVOR IN MILK BY LYOPHILIZA
TION. J.D. White and A. H. Duthie.
2:00 p.m .-FEDERAL REGULATION FOR GRADE
A MILK AND MILK PRODUCTS. H. E.
Thompson.
2:40 p.m.-RESUMED FEEDING OF APPLE POM
ACE IN THE DAIRY REGIMEN. R. H.
Walter. 3:00 p.m.-EFFICACY OF CHEMICAL CLEANERS
AND SANITIZERS. J. K. Roh, R. L. Brad
ley , Jr . and D. B. Lund.
3:20 p.m.-Milk Break
3:35 p.m.-FIELD STUDIES OF BULK MILK
TRANSPORT WASHING SYSTEMS.
R. L. Richter.
4:05 p.m.-DETERGENTS AND SANITIZERS AS
POSSIBLE CONTAMINANTS IN MILK.
Robert R. Zall .
,
, , ~· '

.... ----------------------------------------
'
( . '
PROGRA M 307
Afternoon- Food Industry Sanitation Section Tudor Room
Phil Glass-Presiding
1:30 p.m.-DOOR PRIZE DRAWING
1:40 p.m.-HEAT INACTIVATION OF CONIDIA
PRODUCED BY TOXIGENIC ASPER
GILLI. M.P. Doyle and E. H. Marth.
2:00 p.m.-THE FEDERAL FOOD SERVICE PRO-
GRAM. William F. Bower. 2:40 p.m.-THE NORMAL FLORA OF ROCK
SHRIMP: SICYONIA BREVIROSTRIS.
A. R. Norden and J. A. Koburger.
3:00 p.m.-MICROBIOLOGICAL EVALUATION OF
RETAIL GROUND BEEF: CENTRAL
IZED VERSUS TRADITIONAL PREPA
RATION. J. G. Shoup , J. L. Oblinger and
J. A. Koburger. 3:20 p.m.-Milk Break 3:35 p.m.-NUTRITION IN CANADA. Margaret
Cheney. 4:05 p.m.-RECENT TRENDS IN FOOD AND BEV
ERAGE VENDING. David E. Hartley.
4:45 p.m.-FOOD POISONING OCCURRING IN
CANADA DURING 1973. E. Todd .
Afternoon- Environmental Sanitation Section
George Hazlewood-Presiding
1:30 p.m.-DOOR PRIZE DRAWING 1:40 p.m.-INFLUENCE OF LOCATION AND SUB
STRATE ON LEVELS OF TRACE AND
HEAVY METALS IN MUSHROOMS
AND THEIR HEALTH SIGNIFICANCE. Amer EI-Ahraf and Rudi Mattoni.
2:00 p.m.-INTEGRATING FOOD PRODUCTION
AND PROCESSING INTO NATURE'S
GEOCHEMICAL CYCLES . John B. Robinson
2:40 p.m.-SENSITIVITY OF GUINEA PIGS AND
FETUSES TO DIETS CONTAINING
ADDED METHYL MERCURY AND
SELENIUM. A. G. Hugunin, R . L. Bradley,
Jr. and W. E. Ribelin. 3:00 p.m.-PERSISTENCE OF ENTERIC ORGAN
ISMS IN SOIL AND ON VEGETABLES
SPRAY IRRIGATED WITH EFFLUENT
AND SLUDGE. Joseph Lovett , Brenda
Boutin and Jan M. Bisha. 3:20 p.m.-Milk Break 3:35p.m.-FATEOF ANIMAL VIRUSES IN EFFLU
ENT FROM LIQUID FARM WASTES. J.
B. Derbyshire . 4:05 p.m.-ORGANIZATION OF ENVIRONMEN
TAL PROGRAMS AT STATE LEVEL.
Larry J. Gordon V ARlO US ENVIRONMENTAL STRUC
TURES IN CALIFORNIA HEALTH
AGENCIES. Walter F. Wilson.
4:45 p.m.-SURVIVAL OF FOOT-AND-MOUTH
DISEASE VIRUS IN CASEIN PRO
DUCE FROM INFECTED COW'S MILK.
H. R. Cunliffe and J. H. Blackwell.
WEDNESDAY EVENING, AUGUST 13, 1975
6:00-7:00 p.m.-RECEPTION-Foyer and Room B
7:00 p.m .-ANNUAL A WARDS BANQUET-Ball
room P. J. Skulborstad , President, Presiding INVOCATION-Ivan E. Parkin INTRODUCTIONS PRESENTATION OF AWARDS Walter F. Wilson , Chairman
1. Past Presidents Award 2. Citation Award 3. Honorary Life Membership 4. C. B. Shogren Memorial Award 5. Sanitarians Award
Sponsored by: Klenzade Products, Inc ., Division Economics Laboratories Pennwalt Chemical, Inc ., Diversey Corporation, Inc .
6. Industry and /or Education Award Sponsored by:
Milking Machine Manufacturers Council of the Farm and Industrial Equipment Institute
INSTALLATION OF OFFICERS ENTERTAINMENT
THURSDAY, AUGUST 14, 1975
8:00 a.m.-12:00 Noon-Registration-NATIONAL
MASTITIS COUNCIL Convention Floor Foyer
7: 30 a.m.-EXECUTIVE BOARD-Confederation
Room #3-Breakfast Meeting
NATIONAL MASTITIS COUNCIL 1975 Regional Meeting
Roof Garden
PROGRAM
Dr. D. A. Barnum, Presiding
8:30 GREETINGS-N.M.C. President
8:35 WELCOME-Ron. W. A. Stewart , Minis
ter of Agriculture and Food, Province of
Ontario THEME-Mastitis: The Picture in Ontario
8:50 PERSPECTIVE (a) Ontario Milk Marketing System
George McLaughlin

308 PROGRAM
9:05 (b) Role ofthe Ontario Ministry of Agriculture & Food
Dr. J. A. Meiser GROUND COLOUR
9:15 (a) Ontario Central Milk Testing Labora-tory
Dr. J. A. Meiser 9:25 (b) Herd Milk Quality as affected by Masti-
tis Dr . J. A. Meiser
10:00 BREAK 10:15 SOME ADDED COLOUR
Automated Cell Counting and More Dr . F. H. S. Newbould
10:45 COMPLETING THE PICTURE Eastern Ontario Milk Improvement Pro
gram. A total management concept. Dr. Geo. Fisher
11:15 OVERPAINTING OR PICTURES TO COME The future-Dr. F. C. Nelson,
12:00 Noon LUNCHEON Break
1:30
2:00 2:30
3:00 3:30
4:00 5:00 5:15
Afternoon Session
Dr. K. A. McEwen, Presiding
The Veterinary Practitioner's Function: Convincing the farmer to help himself. Dr. R. K. Lothrop, Mycoplasma Mastitis-Louise Ruhnke, High Bacteria counts in farm bulk tanksStrep. agalactiae the culprit. Dr. F . C. Nelson, Dr. G. Fisher Dr. T. Rothmel BREAK Mastitis Eradication-A Dream? Dr. F. H. S.NewbouW General Discussion Adjourn NMC Board Meeting-British Columbia Room
ENTERTAINMENT MEN AND WOMEN
SUNDAY, AUGUST10, 1975
6:00-7:00 p.m.-RECEPTION-York Room
MONDAY, AUGUSTll, 1975
6:00-7:00 p.m .-RECEPTION-Concert Hall
TUESDAY, AUGUST12, 1975
9:30-J 1:00 p.m.-WINE AND CHEESE PARTY
WEDNESI)AY, AUGUST 13,1975
6:00-7:00 p.m.- RECEPTION-Foyer and Room B 7:00 p.m.-BANQUET & ENTERTAINMENT
LADIES HOSPITALITY ROOM
MONDAY-WEDNESDAY, AUGUSTll-13, 1975 9:00 a.m.-5 p.m.York Room
ENTERTAINMENT FOR THE LADIES
TUESDAY, AUGUST 12, 1975
9:30 a.m. Coffee and pastries Information on Convention and Toronto. Introduction of Hostesses.
10:45 a.m . Ladies meet at York St. entrance of Royal York Hotel for bus to the R.C.Y.C, (Royal Canadian Yacht Club), this club is one of the leading Yacht Clubs on the North American continent.
11:00 a.m. Bus leaves hotel for R.C.Y.C. dock. 11:15 a.m. R.C.Y.C. ferry leaves for this island club. 11:30 a.m. R.C.Y.C. ferry arrives at island. Ladies are
free to tour gardens and boat areas. 12:00 Noon Luncheon.
1:15 p .m. 1:30 p.m . 1:45 p.m.
2:15p.m.
3:30p.m. 4:00p.m .
9:00a.m. 9:30a.m.
10:00 a.m. 12:00 p.m.
12:30 p.m.
Sponsored by Ontario Ministry of Agriculture and Food Ladies leave club house for dock. Ferry returns ladies to mainland. Arrive at main land . Bus takes lad ies to Ontario Place. Arrive at Ontario Place. Nominal admission charge. Ladies will have approximate-ly one hour to tour on their own. A tour by a small train is available. Bus leaves for hotel. Arrival at hotel.
WEDNESDAY, AUGUST13, 1975
COFFEE AND PASTRIES DEPART FOR CITY HALL TOUR VIA THE SUBWAY TOUR OF CITY HALL-1-1 1/ 2 hrs. LEAVE FOR LUNCH ED'S WAREHOUSE, 266 KING ST. WEST LUNCH, ED'S WAREHOUSE
Afternoon is free for shopping
Committee for Ladies
Mrs. J. W. Raithby, (Nancy) Mrs. W. Kempa (Nada) 49 Anglesey Blvd. 1058 Runningbrook Dr. Islington, Ont. Mississauga, Ont.
Mrs. V. Jensen , (Joan) 100 Munro Blvd ., Toronto, Ont.
Mrs. A. Myhr (Lillias) Rosedale Ave., Guelph, Ont.
Mrs. G. Hazlewood, (Elizabeth) 1037 Royal York Rd., Toronto, Ont.
-
'

'
' -
'
309
Association Affairs AFFILIATES OF
International Assn. of Milk, Food and Environmental Sanitarians
ARIZONA ASSOCIATION OF MI LK , FOOD AND ENVIRONMENTAL SANITARIANS
Pres., George H. Parker -------------------------Phoenix Sec'y., Jerry W ill iams, 7536 West Acome Dr.,
Peoria, Ariz . 85346
ASSOCIATED ILLINOIS MILK, FOOD, AND ENVIRONMENTAL SANITARIANS
Pres. , Harold McAvoy-- ----------------------Springfield Pres. -Elect, George Muck --------------------- Rockford First Vice-Pres., Charles Price------------------Chicago Sec. Vice-Pres., Lewis Schu ltz-------------Springfield Sec'y,-Treas. , Robert Coe -----------Rt. 1, Box 149A,
Hinckley 60520 Sgt. at Arms, George Sikorski -- ---------------Chicago
Auditors: John Bowden ---------------------------------Rockford Floyd Keller ------------------- ----------------Maywood
CALIFORNIA ASSOCIATION OF DAIRY AND MILK SANITARIANS
Pres., Ron McLaughlin --------------- -------- -- ---Fresno Firs t Vice-Pres.,
Hugh H. Bement ------ -- -------------- ---- ---LaMirada Sec.- Vice-Pres.,
Fred I. Robins ------------------- --------San Francisco Sec 'y.-Treas., Wayne Baragry, 6651 Lessie Lane,
Riverside, Ca .. 92503
CONNECTICUT ASSOCIAT ION OF DAIRY AND FOOD SANITARIANS
Pres., Henry Wilson ---- -----------------------Collinsville Vice Pres., Carl Jekanowski --------------Wethersfield Sec'y., Gordon A. Allen , Room 283, Dept. of
Agric ., State Office Bu ilding --Hartford, Ct. 06115 Treas., Walter F. Dillman, Room 281, Dept. of
Agric. , State Office Building --Hartford, Ct. 061 15 Asst. Treas., Lester Hankin ----------------New Haven Board of Governors:
E. Thompson -------------------------- ------- --Hartford W. Dillman ------ ------- ---- -------- -- --------- --Hartford G. VanWormer ------------------------------ -Simsbury B. Cosenza ------------------------ ------------ -- ---Storrs W . Bryant --------- -- -- -- -- -------------------Newington P. Vozzola------------------- --------------West Granby W . Ullmann ---- ---------------------------------Hartford J. Redys ---------- ---- ---------------------------Hartford H . Hall -------- -----------------------------------Stratford E. Johnson-------------------------------------- Hartford J . Marshaii-------------------------- -- ------M iddletown
FLORIDA A SSOCIATION OF MILK AND FOOD SAN ITAR IANS
Pres., Dr. Ron richter --- ----------------------Gainesville Pres.-Eiect, Jay B. Boosinger--------------Ta llahassee Sec 'y.-Treas., To be appointed Board of Directors:
Tom Hart ----- -------------------------------- Fort Myers Bill Brown -----------------------------------------Tampa Ken Smith ------------------------------------Gainesvil'd R. F. Jolley ------------------------------St . Petersburg Margaret Reis -----------------------------------Orlando G. Gomez------------------- ----.---------Ft . Lauderdale
IDA HO ENVIRONMENTA L HEALT H ASSOCIATION
Pres., Stephan E. Bastian ----------------------- Preston Vice-Pres. , Harold R. Hyer ------------------------- Boise
Sec 'y.-Treas., Jack Palmer, 412 West Pacific, , Blackfoot, Idaho 83221
INDIANA ASSOC IATI ON OF SANITARIANS
Pres., Pau l Welch ----------------------------Terre Haute Pres. -Elect, Thomas Atk inson---------------Richmond Firs t Vice Pres.,
Thomas Dorsey---------------------------- Indianapolis Second Vice Pres.,
Rick Lopez----------------------------------------Muncie
Secretary, Paul Meyers, Indiana State Board of Hea lth, 1330 W . Mich . St. , Indianapolis, Ind. 46207
Treasurer, Richard W. Harlow----------------Lafayette
IOWA ASSOCIATION OF MILK , FOOD AND ENVIRONMENTAL SANITARIANS, INC.
Pres., John Halbach ----- ------------ ---------Cedar Falls Pres. -Elect, Chris Singelstad-------------Cedar Rapids First Vice-Pres.
Erwin Johnson ---- -------------- -- -------Cedar Rapids Second Vice-Pres.
Cletus Freiburger -- ---------------------------Dubuque Sec'y.- Treas., H. E. Hansen, State Health
Department, Robert Lucas Building, Des Moines, Iowa 50319
Faculty Advisor, Dr. William LaGrange ---------Ames Advisor, Earl 0 . W righ t -----------------------------Ames Immediate Past-Pres., D. H. Wilke ----------Dubuque
KANSAS ASSOCIATION OF ENVIRONMENTALISTS
Pres., George Garrison ---------------------------Topeka First Vice-Pres. , Don Bechtel ----------- ----Manhattan Second Vice-Pres., Jim Pyles-- -----------------Topeka Secretary-Treas., Gerald Jones, 123 N. Wash., El
Dorado, Kansas 67042
Each 2 V2 lb . high-pressure Flys-Off Aerosol gives the killing powe r of over 17 gallons of oi l base spray and without the oil.
KENTUCKY ASSOCIATION O F MILK , FOOD AND ENVIRONMENTAL SANITARIANS, INC.
Pres. , Bruce K. Lane-- --------------------------Louisville Pres. -Elect, James Spillman ------------- -----Louisvi lle Vice-Pres., Harry A . Marsh- -------------- --- -Lexington Sec 'y.- Treas., David E. Atkinson ------------Frankfort Directors:
Max A . Weaver, Western Region -----------Murray David Adams, M id-Western Region -Madisonvi lle Berford Turner, Eastern Region----------Covington
MICHIGAN ENVIRONMENTAL HEALTH ASSOCIATION
Past Pres. , James Shifflet---------- ------Grand Rapids Pres., Raymond Jurczyk ------- -------------East Tawas Pres.-Eiect, Philip Kirkwood --------------- Battle Creek Secretary, James Szyda, Ottawa County Health
Dept ., County Bldg ., Grand Haven, Mich. 49417 Tres., Michael Vanden Heuvei ---- ----------Muskegon Board of Directors:
Charles R. Newell --- ----------------------------Durand James P. Robertson ---------------------Grand Blanc Oscar B. Boyea--------------------- ------------- Pontiac K. Durwood lank------- ----- --- --------------Charlotte Michael D. Farnsworth --------- ---------------Monroe Thomas Nagel -------------------- ---- -------------- Ionia
3 seco nds tre ats a milk house 18 ' x 13' x 10' 8 seconds trea ts a mi lk parlor 30 ' x 18' x12' Saves time , built-in power, Non-flammable
Lack of oil prevents cows fro m slipp ing in milking parlo r
A SK FOR FL YS-OFF

310
MINNESOTA SANITARIANS ASSOCIATION AFFAIRS
Pres .. Dr. Edmund A. Zottola -------------Minneapolis Vice-Pres., Mr. Edward A. Kaeder ----------Stillwater Sec'y.- Treas., M r. Roy E. Ginn, Dairy Qua li ty Con-
trol Institute, Inc ., 2353 North Rice Street, St . Paul, M innesota 55108
Directors: Mr. Douglas E. Belanger ----------------Minneapolis Mr. Arnold 0. Ellingson ------------------Fergus Falls Mr. James H. Francis -------------------------St. Pau l Mr. Harold A. Johnson ------------------Minneapolis Mr. Walter H. Jopke ---------------------Minneapolis Mr. lng H. Lein ----------------------------Minneapolis Mr. Hugh Munns -------------------------------S t. Paul Mr. James A. Rolloff ------------------------New Ulm Mr. Charles B. Schneider ---------------Minneapolis
MISSISSIPPI ASSOCIATION OF SANITARIANS
Sec'y.- Treas. , Jimmy W. Bray, 202 N. Robinson St., Senatofia, M iss. 38668 INa Up-To-Date List Available)
MISSOURI ASSOCIATION OF MILK AND FOOD SANITARIANS
Pres., Harold Bengsch -----------------------Springfield First Vice-Pres., Gera ld Burns -------------Kansas City Second Vice-Pres., Mike Sanford-----------Columbia Sec'y.- Treas., Ervin P. Gadd, Bureau of Milk, Food
and Drug Control Mo. Div. of Health, Jefferson City 65101
NEW YORK ASSOCIAT ION OF MI LK AN D FOO D SAN ITARIA NS
Pres. , John G. Burke------------ -------------Watertown Pres. -E/ect, Maurice A. Guerrette --------------Albany Past-Pres., David K. Bandler----------------------lthaca Sec.- Treas., R. P. March, 118 Stocking Hall, Cornell
University, Ithaca, N.Y. 14850 Directors:
Donald A. Brownell----------------------- Harpu rsvi lle Will iam Y. Perez ---------------------------------Albany A lbert J. Lahr --------------------------------Rochester
ONTA RIO A SSOCIATION OF MILK A ND FOOD SANITAR IA NS
Pres., Mr. W. Harley -------------------------------Harley Vice-Pres., Mr. W. Kempa---- ------------------Toronto Sec., Mr. G. Hazlewood-------------------------Toronto Tres., Mr. Bob Tiffin , 87 Siebert Avenue, Kitchener,
Ontario Directors:
Dr. M.A. Amer----------------------------------Guelph C. L. Duitschaever ------------------------------Guelph C. L. Lewis ------------------------------------K itchener John Wilson---------- ------------- --------------Simcoe
Ambassador at Large, Mr. Herman Cauther, --Barrie Editor News & Views, Glen Ward -------------Toronto
ONTAR IO M ILK AND FOOD SANITAR IA NS EASTERN BRA NCH
Pres., A. E. Brasseur ------------------------P iantagenet Past Pres. , Gordon Mitchell -------------------Cornwall First Vice-Pres., Dr. Gerald Martin Terrace Vaudreuil Second Vice-Pres., Jack Nicoi--------------------Perth Treas., Ken Burnett ---------------------------Kemptville Sec., Marvin Beach, 7 Vista Circle, Kemptville, On-
tario Directors:
Grant Cameron ----------------------------------Ontario A heal Meillieur-----------------------------------Ontario
OREGON ASSOC IATION OF MILK AND FOOD SANITARIANS
Pres., Loren Edlund---------- -----------------------Salem Vice-Pres., Glenn Briody------------------------Portland Sec'y.-Treas. , Floyd Bodyfelt, Wiegand Hall 240,
Dept. of Food Science, Oregon State Univ., Corvallis, Oregon 97331
Directors: Virgil N. Simmons--------------------------------Salem Terry Sutton ---------------------------------Milwaukee Jim Eyre-------------------------------------------Eugene Gabe LeChevallier-- ---------------------Lake Oswego
Auditors: Rod Johnson -----------------------------------Portland Robert Vogel--------------------------------------Talent
PENNSYLVA NIA DAIRY SANITARIA NS ASSOCIATION
Pres., John Boore-------------------------------Grantville Pres. -Elect, George Manseii -----------Conneaut Lake Vice Pres. , Dam M. Breiner ------------------Christiana
Past Pres., Bernard E. Hinish -----------------Curryvi lle Sec.- Treas., Gerald Shick , A.D. #2, Box 304C, Lat
robe 15650 Association Advisers: Stephen Spencer, Sidney
Barnard, Dr. Samuel Guss, George H. Watrous, George W. Fouse
Executive Committee: Association Officers and appoi nted representatives of regional associations
ROCKY MOUNTAIN ASSOCIATION OF MILK FOOD AND ENVIRONMENTAL SANITARIANS Pres., John Nussbaumer ------------------------- Denver Pres. -Elect, Darrell Deane ---- -- -------- La ramie, Wyo. Sec'y. -Treas. , Frank Yatckoske, 3150 West 25th
Avenue, Denver, Colorado 80211 Directors:
Helen Hovers ---------------------------------- ---Aurora Carl Yeager-----------------------------------Longmont
RH OD E ISLAN D DAIRY A ND FOOD SANITA RI A NS
Pres., Richard Chambers--------------------Providence Sec'y., Maury Dunbar ---------------Foster, R.I. 02825 Treas., Vincent Mattera, R. I. Dept. of Health, 2843
South County Trail, East Greenwich, R.I. 02818
SOUTH DAKOTA A SSOCIATIO N OF SANITARIA NS
Pres. , Robert Wermers -----------------------Rapid City Vice-Pres. , Ed Michalewicz ------------------Brookings Sec'y. -Treas. , Howard Hutchings, Div. San. Eng.
State Dept. Health. Pierre, S.D. 57501 Directors:
Wayne Balsma----------------------------- -----Mitchell Casper Twiss --------------------------------Pine Ridge
VIRGINIA ASSOCIATION OF SANITARIANS AND DAIRY FIELDMAN
Pres., J. 0. Gunter ----- - - -----------------------Evingto~ First Vice- Pres. , J . C. Bussey----------------------------Second Vice-Pres. , M . R. Cooper ----------Broadway Past Pres., V. M. Yeary ---------------------------Mation International Rep. , J . G. Hampton ---------------Galax Sec'y. -Treas., W. H. Gill , 6702 Van Bu ren Ave.,
Richmond, Va. 23226
WASHINGTON ASSOCIAT ION OF MILK SANITARIANS
Pres., Fred Froese---------------------------Mose's Lake Pres. -Elect, Clayton R. Gustafson ---------Vancouver lmm. Past Pres., James L. Shoemake---------Seattle Sec'y.- Treas., Dr. L. 0 . Luedecke, 312 True Street,
Pullman Directors:
Southwest Section, Chairman Harry Gleason -------------------------------Chehalis
Northwest Section, Cha irman Bill Brewer -------------------------------------Seattle
Southeast Section, Chairman Joe Su iter --------------------------- ----------Yak ima
Northeast Section, Cha irma n John Ca llen------------------------------------Calbert
WI SCO NSIN ASSOCI A T ION OF MI LK A N D FOOD SANITARIA NS
Pres., Elmer Marth -------------------------------Madison 1 Pres. -Elect, Clifford Mack ---------------Prairie du Sac 1st Vice-Pres. , Leonard Rudi----- ---------- -- -Appleton 2nd Vice-Pres., Harlin Fiene ------------------Sauk City Sec'y.- Treas. , Don Raffel, 4702 University Avenue,
Madison, Wisconsin 53705
Registered for use both on animals and indoors. NEW, scientific way is a lmost o il-free. Non-flammable. No motor or electric cord necessary. Trouble-free ... no moving parts when operating. A few seconds fog will c lear the flies from many cows waiting in holding or loafing shed .
Guaranteed Ejjectiue or Money Back
Ask for Barn-Fogger Today
., ,

' '
I
·~
3 11
Association Affairs
The Iowa Affiliate Honors Seven at Their Annual Meeting
The annual meeting was held in Ames, Iowa at the
Ramada Inn on March 24, 1975. This year a joint
meeting was conducted with the Iowa Environmental
Health Association. William Schlenker of Waterloo was
awarded the DR. M.P. BAKER AWARD accompanied
by a $50.00 savings bond for being the outstanding
sanitarian of the year.
Mr. Schlenker graduated from Iowa State University
with a degree in dairy industry in 1973. He has been
involved in quality control in the Iowa dairy industry
since his graduation. He is a charter member and past
president of the Iowa Affiliate and presently is manager
President John Halbach awards William Schlenker the M . P.
BAKER AWARD while Mrs. Schlenker looks on .
of American Milk Producers , Inc., Cedar Valley
Division, Waterloo. Mr. Schlenker was cited for his
outstanding leadership in the field of dairy sanitation.
Six were awarded the twenty year award given by the
Association. They were H. E. Hansen, Des Moines ; Don
Jaeger , Marshalltown ; Grover Seeberger, Mason City;
Wilbur Nielsen , Independence; Earl 0. Wright, Ames
and Harold Whitcomb , Sumner, Iowa.
TWENTY YEAR AWARD
Left to Right - E. Wright, H. Hansen, D. Jaeger, G. Seeberger
and W . Nielsen.
The Iowa affiliate conducts two meetings a year. The
next meeting of the affiliate will be held in November
1975 .
Notice to Membership
Constitution Amendment
The Executive Board recommends that the
Constitution be amended as follows:
ARTICLE IV- Section 1. Insert the words "and Sec
cretary-Treasure" following the words
"Second Vice-President" in line 4. De
lete the "and" in lines 4 and 5. Add the
words "and Second Vice-President"
following the words "First Vice-Presi
dent" in line 5. Delete the words "sec
ond Vice-President and" from lines 5
and 6.
ARTICLE VII-Section 1. Change the words "Secre
tary-Treasure" to the words "Executive
Secretary."
By-Laws Amendment
By-Laws amended as follows:
ARTICLE II -Section B. Change the wording of
"Secretary-Treasure" to "Executive
Secretary." Delete the word "an" and
replace with the word "the." Change
the wording of "Executive-Secretary"
to "Secretary-Treas ure. "
This is being done to bring the Constitution and
By-Laws up to date . This will also provide for the
Secretary-Treasure to advance on the Executive Board ~s
the other board members have in the past. If thts
amendment is voted favorable, elections will be changed
to electing only a Secretary-Treasure each year instead ~f a Second Vice-President and Secretary-Trea~ure. This
will be presented to the membership for actwn at the
annual meeting in August at the Royal York Hotel ,
Toronto, Ontario, Canada.

312
News and Events
Environmental Health Week
Left to Right - Bruce Lane, President-Elect; Dr. James Hartley, President; Governor Julian Carroll and Leon Townsend, Secretary-Treasurer.
At the request of the Kentucky Association of Milk, Food and Environmental Sanitarians Governor Julian M. Carroll proclaimed the week of February 23-March 1, 1975, " Environmental Health Week in Kentucky."
In connection with the proclamation the Kentucky Association of Milk, Food and Environmental Sanitarians, Inc. held its annual Educational Conference for Fieldmen and Sanitarians at Stouffer's Inn, Louisville, Kentucky.
Approximately 350 county and state sanitarians, administrators, health officers and milk and food industry fieldmen , plant managers, related service company personnel and university personnel were in attendance.
Customs Information
Tips for members and friends who will be attending the annual meeting in Toronto.
Carry with you the following: 1. Birth Certificate or a Naturalized Citizenship Certifi
cate. 2. A brochure or program details about the 62nd An
nual Meeting. 3. Local U.S. Customs Office should be contacted for
latest information about the amount and type of duty free purchases that can be made in Canada.
In addition, for those travelling by air we are going to inform the Toronto International Airport about the details or our meeting in order that Customs clearance can be expedited .
Mr. Clarence Davis (left) and Miss Debbie Newslow proudly receive the prestigious NEIL C. ANGEVINE SUPERIOR QUALITY AWARD on behalf ofT. G. Lee Foods, Orlando, Florida from Dr . C. Bronson Lane, Secretary of the American Cultured Dairy Products Institute (ACDPI) . This annual award - initiated at the recent Kultures and Kurds Klinic in Garland, Texas-consists of an engraved plaque and revolving trophy which are awarded to the dairy plant w ith the highest cumulative score for all cultured products analyzed at the annual ACDPI training schools. This year's event drew 130 delegates from twenty-two states, Mexico, and Puerto Rico.
Certificates of merit for quality products were awarded to the following organizations: Anderson-Erickson, Des Moines, Iowa (lemon yogurt) ; Safeway Stores-Dairy Division, Garland, Texas (strawberry yogurt and all categories yogurt); Mid-America Dairymen, Minneapolis, Minnesota (plain yogurt); Kroger Co. , Fort Worth, Texas (buttermilk); Smith Dairy Products Co., Orrville, Ohio (sour cream); Superior Dairies, Austin, Texas (cottage cheese) .
Index To Advertisers
Babson Bros. -------------------------------------- --Back Cover The Haynes Mfg. Company --- ------ -- ---Inside Back Cover Klenzade ------------------------- -----------Inside Front Cover National Sanitation Foundation ---------------------------254 Whitmire Research Laboratories , Inc. ---------- ---309, 310
Classified Ads
For Sale
Single Service milk sample tubes. For further information and a catalogue please write , Dairy Technology, Inc., P.O. Box 101, Eugene, Oregon 97401.
~· '
'
'
I
·~
·•
U.S. P. LIQUID PETROLATUM SPRAY U.S.P. UNITED STAHS PHARMACEUTICAl STANDARDS
CONTAINS NO ANIMAl OA VEGETABLE FATS. ABSOLUTELY NEUTRAL. Will NOT TURN RANCID- CONTAMINATE OR TAINT WHEN IN CONTACT WITH FOOD PRODUCTS.
SANITARY- P,URE
ODORLESS -TASTELESS
' NON-TOXIC
Tim fiKe Uti.lt-eih HAYNES-SPRAY O~MMMUJ~: SANITARY VAl YES HOMOGENIZER PISTONS - RINGS SANITARY SEAlS & PARTS CAPPER SliDES & PARTS POSITIVE PUMP PARIS GlASS & PAPER FilliNG MACHINE PARTS end for All OTHER SAN ITARY MACHINE PARTS wh;,h 0'<
cleaned doily.
Tke JKIUWut HAYNES -SPRAY Jftetluul ~ .£ultlticcdUm C!mh~ MCitk Uw Jftitk 0~ ruul C!Jde R~ by Uw U. S. P.w& Heattk Sewiu
The Haynes-Spray eliminates the danger of contamination which is
possible by old fash io ned lubricating methods . Spreading lubricants by the use of the finger method may entirely destroy previous bactericidal treatmen t of equipment.
PACKED 6-12 oz . CANS PER CARTON SHIPPING WEIGHT - 7 LBS
THE HAYNES MANUFACTURING COMPANY 4180 LORAIN AVENUE • CLEVELAND, OHIO 44113
Gasket Co lor . • • st;ghtly off-white
*MADE FROM
TEFLON® "Tke Soplmfiwted GMket" THE IDEAL UNION SEAL FOR
BOTH VACUUM AND PRESSURE LINES
SNAP·TITE self-centering gaskets of TEFLON are designed for all standard bevel seat sa nitary fittings. They SNAP into p lace provid· ing self-alignment and ease of assembly and disassembly. HAYNES SNAP-TITES of TEFLON are unaffected by cleaning solu· lions, steam and solvents. They wil l not embrittle at temperatures as low as minus 200° F. and are impervious to heat up to 500 ° F.
' fOR A FiniNG GASKET THAT WILL OUT-PERFORM ALL OTHERS."
S~ecify ..• HAYNES SNAP· TITES of TEFLON e TfFLON ACCEPTED SAFE FOR USE ON FOOD & PROCESSING
EQUIPMENT 8Y U. $. FOOD AND DRUG ADMINISTRATION
• Gaskots mode of DuPont TEFlON <ll TFE-FlUOROCARBON RESINS
THE HAYNES MANUFACTURING COMPANY 4180 LORAIN AVENUE • CLEVELAND, OHIO 44113
SNAP INTO FITTINGS
LEAK-PREVENTING NEOPRENE GASKET lor Sanitary Fittings
ekd t4e4e $NA"P!]'I~E rtetuaa~ Tight joints, no leaks, na shrinkage
Sanitary, unaffected by heat or fats
Non·porous, no seams or crevices
Odorless, polished surfaces, ea•ily cleaned
Withstand sterilization
Time-saving, easy to a5S&mble Self-centering
No •ticking to fittings
Eliminate line block. Help overcome line vibrations
Long life, use over ond over
Available fo r J", JYJ", 2", 2!.-S:" and 3" fittings.
Pocked 100 to the box. Order through your dairy supply house.
THE HAYNES MANUFACTURING CO. 4180 loroin Avenu\' • Cleveland 13, Ohio
A· HEAVY, DUTY SANITARY LUBRICANT .-. ·,-
tn bolh SPRAY AND TUBE
All lubri ·Film ingredients are
approved additives and can be
safely utilized as a lubricant for
food processing equipment when
used in compliance with existing
food additive regulations.
ESPECIALLY DEVELOPED FOR LUBRICATION OF FOOD
PROCESSING AND PACKAGING EQUIPMENT
For Use in Dairies - Ice Cream Plants- Breweries
Beverage Plants- Bakeries- Canneries- Packing Plants
SANITARY • NON TOXIC • ODORLESS • TASTELESS SPRAY- PACKED 6- 16 OZ. CANS PER CARTON TUBES- PACKED 12- 4 OZ. TUBES PER CARTON
. THE HAYNES MANUFACTl!RING CO. ClEVElAND , OHIO 44113

Dairy authorities speak out on better
cow milk ing
Dr . Chris Woe lfel , Extension Dairy Spec ialis t University of Ve rmont , Carrigan Hall Burlington , Vermont 05401
The basics of milking equipment barns . These may be at curb level or stay the same regardless of herd size . under the platform. However, when In talking with dairymen , the question tie-stall barns are being constructed, is often raised as to what type of they should have a slope of 1 -1.5 milking system should be installed . inches/10ft . toward the milk receiv-The answer is that it should be a sys- ing area . Th is will allow the pipeline tern which will produce minimum to be installed at both a lower level vacuum fluctuation at the teat end , and at the same level for each stall. fast milking , maximum cow comfort Weigh-jar parlors and bucket milkers and high quality milk in the bulk fall in between low-line and high-line tank . This is easier said than done! system s with regard to the criteria My first preference in milking systems mentioned above. Short tube buckets is a low-line parlor , and my last pref- or large capacity claws generally have erence is a high-line parlor, or around- less fluctuation than small claw , long the-barn pipeline. There is absolutely tube bucket milkers . no excuse for the installation of a Weigh-jars which are installed so high-line parlor (milk transferred di- that the milk entry into the jar is rectly from the cow through the equal to or lower than the bottom of cluster and into an overhead line) , the c law , or lowest point of the both from the standpoint of vacuum connecting milk hose, will simulate a fluctuation and milk quality . low-line . Most weigh-jar installations
The effect of high-lines on milk are set too high by either necessity quality as measured by Acid Degree when center weigh-jars are installed , values (ADV) is presented in Table 1 . or for the convenience of the operator . ADV's measure free fatty acids in Anytime milk can be moved away milk which are one of the causes of from the claw by gravity, vacuum rancidity and increase with air agita- fluctuation is minimal, particularly tion which occurs when milk is when compared to lift ing milk into a moved from the cow to an overhead high-line.
Table 1 - Acid Degree Value Compiirlsoo betw"" systems
1968 - 1972 1972- 1973
No. Average No. Average System Tested
Low-line parlor 20 Buckets 222 Weigh-Jar Parlor 78 High-line Parlor 46 Around-the-barn pipeline 180
milk line. Let me point out that I realize the practical conside ration of around-the-barn pipelines in easing the milking chore , and the only way in which pipelines can be installed in most tie-stall barns.
I would hope that the day will come when low-line installations will be approved and practical in tie-stall
ADV Tested ADV
0.84 6 0.88 0.80 80 0.88
0.74 28 0.93
0.99 18 1.07
1.11 100 1.25
Milk hoses on a low-line should be as short as possible. Remember , milk is lifted as solid column against a differential in pressure created by air entry into the claw . This causes a reduced vacuum at the teat end each time a column of milk moves into the milk line , and an increase to line vacuum when the milk clears the
hose . It should be noted that a higher vacuum is necessary for a high-line system versus a low-line , to get the same job done due to milk lift . When overmilking occurs, a cow milked using a high-line system , is exposed to a higher vacuum.
Components in any milking system should include adequate claw capacity and narrow bore liners and shells . Inflations are the most important part of milking equipment and should be changed before reaching 1500 milkings and preferably at 1200 for moulded liners . Stretch liners should be changed around 900 milkings. If you notice a change in milking speed or cow comfort when new liners are installed , you waited too long .
Vacuum pump capacity for bucket units should be 4-6 cfm/un it , preferably the high figure . Pipeline systems are open systems and the capacity of the vacuum pump should be 8-10 cfm I unit (per New Zealand method). When using a vacuum recorder on a pipeline system with the vacuum measured at the teat end, the air reserve should be such that when a unit is dropped or kicked off by a cow , the system will have enough reserve so that a drop in vacuum is small, if any, on the other units.
Another area in which progress is being made , is in vacuum regulators . With sensitive regulators having fast response time , vacuum fluctuation can be minimized on the main vacuum and milk lines . Unstable vacuum in the main lines is magnified at the teat end . Adequate-sized vacuum and milk lines are assumed for the purposes of this discussion and recommendations can be obtained through the National Mastitis Council or the 3M Standards , available through your milking equipment dealer.
When looking at systems, two things should always be kept in mind : (1) buy equipment where quality equipment and service is the " by-word"; (2) when looking at a system , go to a dairyman already using it , and if possible , do some actual milking .
You 're a step ahead with Surge URGE Babson Bros. Co., 2100 S. York Rd., Oak Brook, Illinois 6052 1
This is one ot a series ot topics deve loped by noted Da i ry authori ties . Fo r a complete set write tor a tree booklet.
,
, , \ .. '