Midea Group (000333 CH) - CMBIS Research
13
CMB International Securities | Equity Research | Company Update PLEASE READ THE ANALYST CERTIFICATION AND IMPORTANT DISCLOSURES ON LAST PAGE ACCESS KEY TO OUR REPORTS ON BLOOMBERG: CMBR China Home Appliance Sector Walter Woo (852) 3761 8776 [email protected] Stock Data Mkt Cap (RMB mn) 376,158 Avg 3 mths t/o (RMB mn) 1,368.19 52w High/Low (RMB) 56.35/34.10 Total Issued Shares (mn) 6,938.9 Source: Bloomberg Shareholding Structure Midea Holding 31.91% Ownership via stock connect 16.23% China Securities Finance Corp 2.86% Mr. Fang Hong Bo 1.98% Employees incentive scheme 1.18% Free float 45.84% Source: HKEx Share Performance Absolute Relative 1-mth 6.2% 3.5% 3-mth 10.4% 11.5% 6-mth 14.0% 22.9% 12-mth 34.5% 35.9% Source: Bloomberg 12-mth Price Performance Source: Bloomberg Auditor: PricewaterhouseCoopers Related Reports Midea Group (000333 CH) : Diversified portfolio with effective incentives – 28 Jun 2019 35 40 45 50 55 Sep-18 Nov-18 Jan-19 Mar-19 May-19 Jul-19 Stock HSI BUY (Maintain) Target Price RMB64.96 (Previous TP RMB62.65) Up/Downside +19.8% Current Price RMB54.21 1 9 Sep 2019 (RMB) Midea reported exceptional market shares gain in 1H19, thanks to its technology break-through in A.C and multi-brand strategy. Given a better raw material price and currency trend, we are more positive on 2H19E NP growth. Hence, we maintain BUY and raised TP to RMB 64.96, based on 16x FY20E P/E (rolled over from 18x FY19E), or 1.1x PEG. 1H19 net profit up 17%, slight beat. Midea’s net profit rose 17% YoY to RMB 15.2bn, inline with CMBI and 2% above BBG’s est. Sales growth was 8%, inline. The beat was aided mainly by robust GP margin expansion, jumping by 2.3ppt to 29.5% in 1H19 (vs 27.2% in 1H18), thanks to: 1) falling raw material costs (copper -6%, aluminum -5% and steel -8%, etc), Midea benefited more vs peers due to its high self-production rate, 2) favorable FX (CNY -5% YTD), and 3) Midea’s multi-brand strategy (launch of high-end positioned COLMO in Oct 2018 and Midea PRO series in Mar 2019, internet brand BUGU/ 布谷 in Mar 2019 and brand targeting youth WAHIN/华凌 in 2019). However, due to greater A&P and R&D expenses, NP margin only increased by 0.8ppt to 9.9%. Exceptional achievement (esp. on A.C.) in 1H19. Despite a ~4% drop in A.C industry sales, Midea’s A.C sales surged by ~12% YoY in 1H19 (market share climbed to 27%/30% on offline/inline in 1H19, vs 25%/23% in 2018). We attribute such impressive results to its innovations (e.g. more products equipped with the “windless” technology, winning the 2019 AWE Epland Gold Award). Washing machines/ Refrigerator/ small appliances sales growth were ~6%/~10%/~low-single digit in 1H19, vs industry growth of ~3%/ ~-1%/ ~5%. Prudent sales and rosy margins for 2H19E. The Company targets a 5-10% sales growth in FY19E and expects a GP margin expansion plus a faster growth for net profit. A.C. sales growth slowed down to ~10% in Jul/Aug 2019, according to management. However, in our view, that should not be a worry as margin should continue to improve given softening raw material prices and highly healthy level of channel inventory, at ~5-6mn units (vs industry’s ~20- 30mn). Also, we see potential upsides from export business’s GP margin since CNY had already further depreciated vs USD in 2H19E. KUKA sales missed in 1H19 but management suggested a better 2H19E, for both sales and EBITDA margin. Maintain BUY and raised TP to RMB 64.96 (20% upside). Our new TP is based on 16x FY20E P/E (rolled over from 18x FY19E). We lifted FY19E/20E/21E’s net profit by 1.9%/1.1%/0.2%, to factor in: 1) better A.C. sales, 2) declining raw material costs and currency rate and 3) greater R&D expenses. The counter now trades at 15x/ 13x FY19E/ 20E P/E with 2.6% forward yield. Earnings Summary (YE 31 Dec) FY17A FY18A FY19E FY20E FY21E Revenue (RMB mn) 240,712 259,665 278,728 309,486 343,792 YoY growth (%) 51.3 7.9 7.3 11.0 11.1 Net income (RMB mn) 17,284 20,231 23,728 27,408 31,786 Diluted EPS (RMB) 2.632 3.051 3.547 4.060 4.662 YoY growth (%) 15.5 15.9 16.2 14.5 14.8 P/E (x) 20.6 17.8 15.3 13.4 11.6 P/B (x) 4.3 3.9 3.3 2.8 2.4 Yield (%) 2.2 2.4 2.6 3.0 3.4 ROE (%) 22.8 23.1 23.6 23.1 22.8 Net gearing (%) 21.6 26.8 11.3 Net cash Net cash Source: Company data, CMBIS estimates Midea Group (000333 CH) Prudent sales and rosy margins for 2H19E
-
Upload
khangminh22 -
Category
Documents
-
view
2 -
download
0
Transcript of Midea Group (000333 CH) - CMBIS Research
CMB International Securities | Equity Research | Company Update
PLEASE READ THE ANALYST CERTIFICATION AND IMPORTANT DISCLOSURES ON LAST PAGE ACCESS KEY TO OUR REPORTS ON BLOOMBERG: CMBR
China Home Appliance Sector
Walter Woo
(852) 3761 8776
Stock Data
Mkt Cap (RMB mn) 376,158
Avg 3 mths t/o (RMB mn) 1,368.19
52w High/Low (RMB) 56.35/34.10
Total Issued Shares (mn) 6,938.9
Source: Bloomberg
Shareholding Structure
Midea Holding 31.91%
Ownership via stock connect 16.23% China Securities Finance Corp 2.86%
Mr. Fang Hong Bo 1.98%
Employees incentive scheme 1.18%
Free float 45.84%
Source: HKEx
Share Performance
Absolute Relative
1-mth 6.2% 3.5%
3-mth 10.4% 11.5%
6-mth 14.0% 22.9%
12-mth 34.5% 35.9%
Source: Bloomberg
12-mth Price Performance
Source: Bloomberg
Auditor: PricewaterhouseCoopers
Related Reports Midea Group (000333 CH) : Diversified
portfolio with effective incentives – 28 Jun
2019
35
40
45
50
55
Sep-18 Nov-18 Jan-19 Mar-19 May-19 Jul-19
Stock HSI(RMB)
BUY (Maintain)
Target Price RMB64.96
(Previous TP RMB62.65)
Up/Downside +19.8%
Current Price RMB54.21
1
9 Sep 2019
(RMB)
Midea reported exceptional market shares gain in 1H19, thanks to its technology break-through in A.C and multi-brand strategy. Given a better raw material price and currency trend, we are more positive on 2H19E NP growth. Hence, we maintain BUY and raised TP to RMB 64.96, based on 16x FY20E P/E (rolled over from 18x FY19E), or 1.1x PEG.
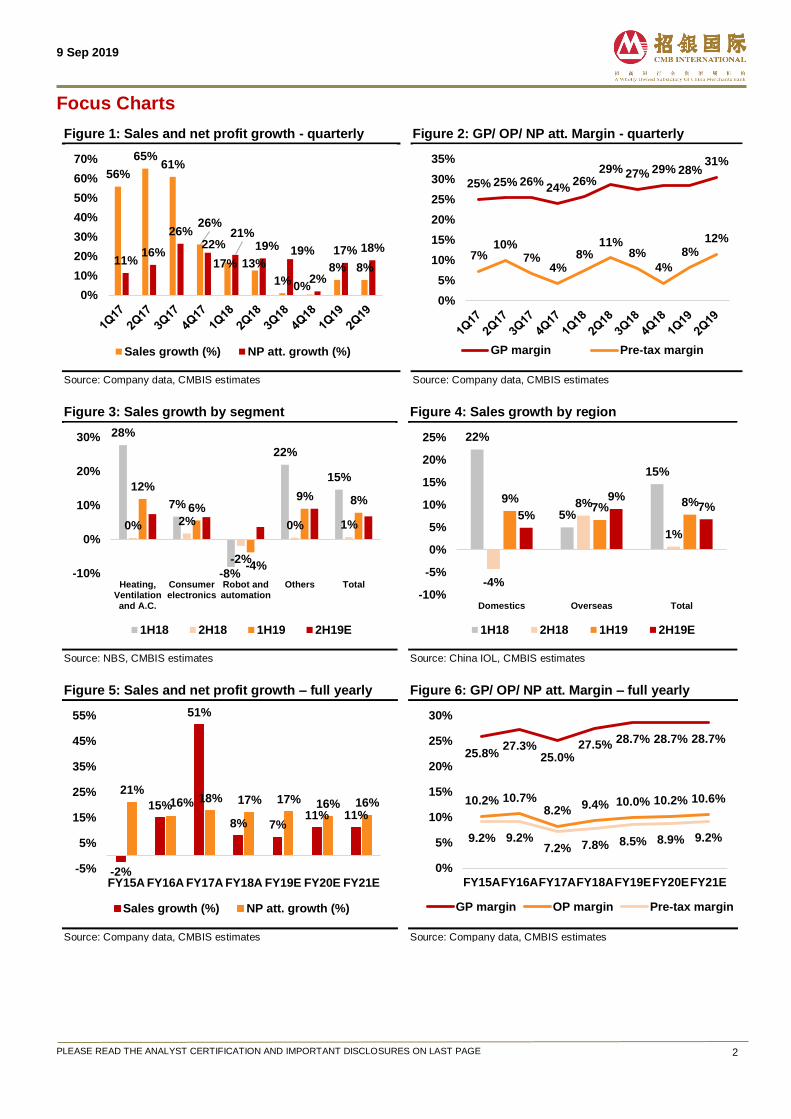
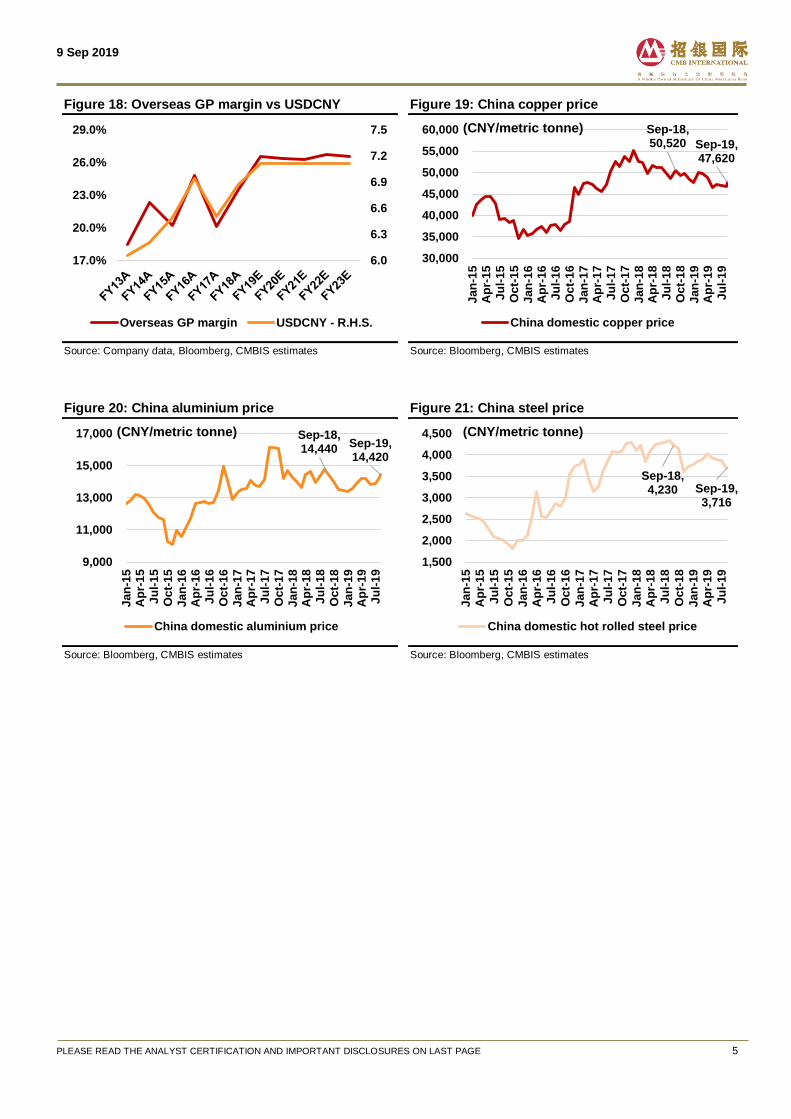
1H19 net profit up 17%, slight beat. Midea’s net profit rose 17% YoY to RMB 15.2bn, inline with CMBI and 2% above BBG’s est. Sales growth was 8%, inline. The beat was aided mainly by robust GP margin expansion, jumping by 2.3ppt to 29.5% in 1H19 (vs 27.2% in 1H18), thanks to: 1) falling raw material costs (copper -6%, aluminum -5% and steel -8%, etc), Midea benefited more vs peers due to its high self-production rate, 2) favorable FX (CNY -5% YTD), and 3) Midea’s multi-brand strategy (launch of high-end positioned COLMO in Oct 2018 and Midea PRO series in Mar 2019, internet brand BUGU/ 布谷 in Mar 2019 and brand targeting youth WAHIN/华凌 in 2019). However, due to greater A&P and R&D expenses, NP margin only increased by 0.8ppt to 9.9%.
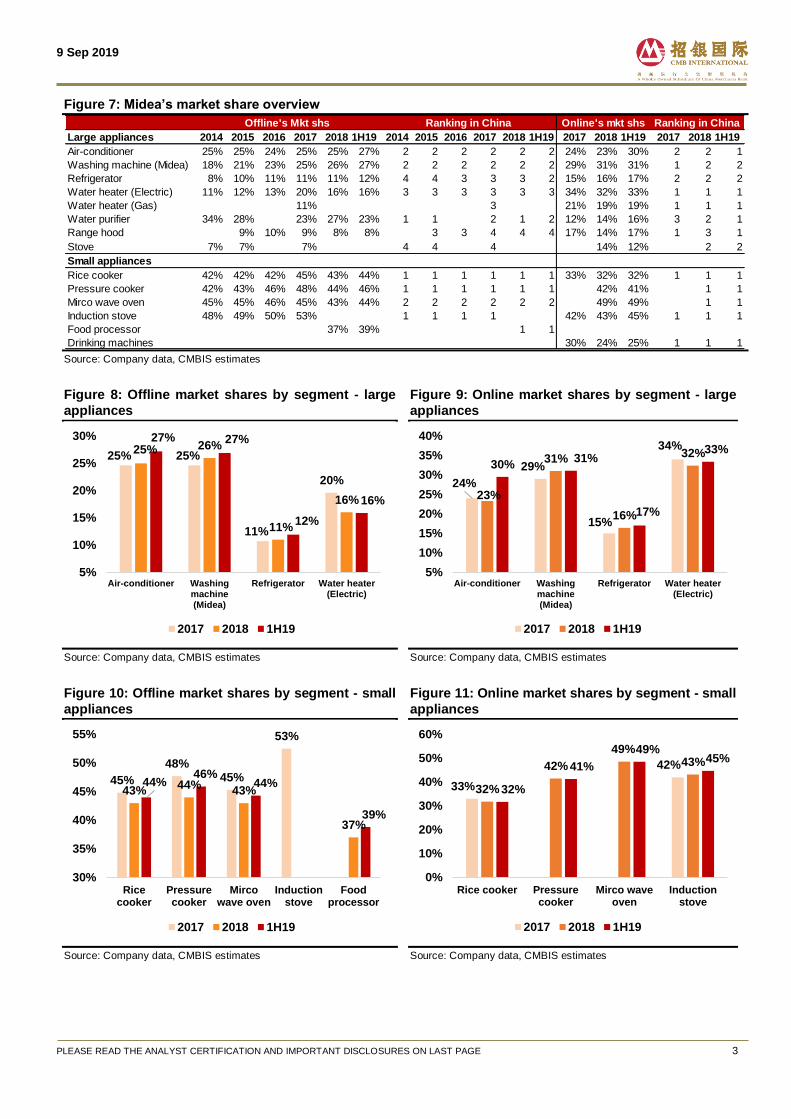
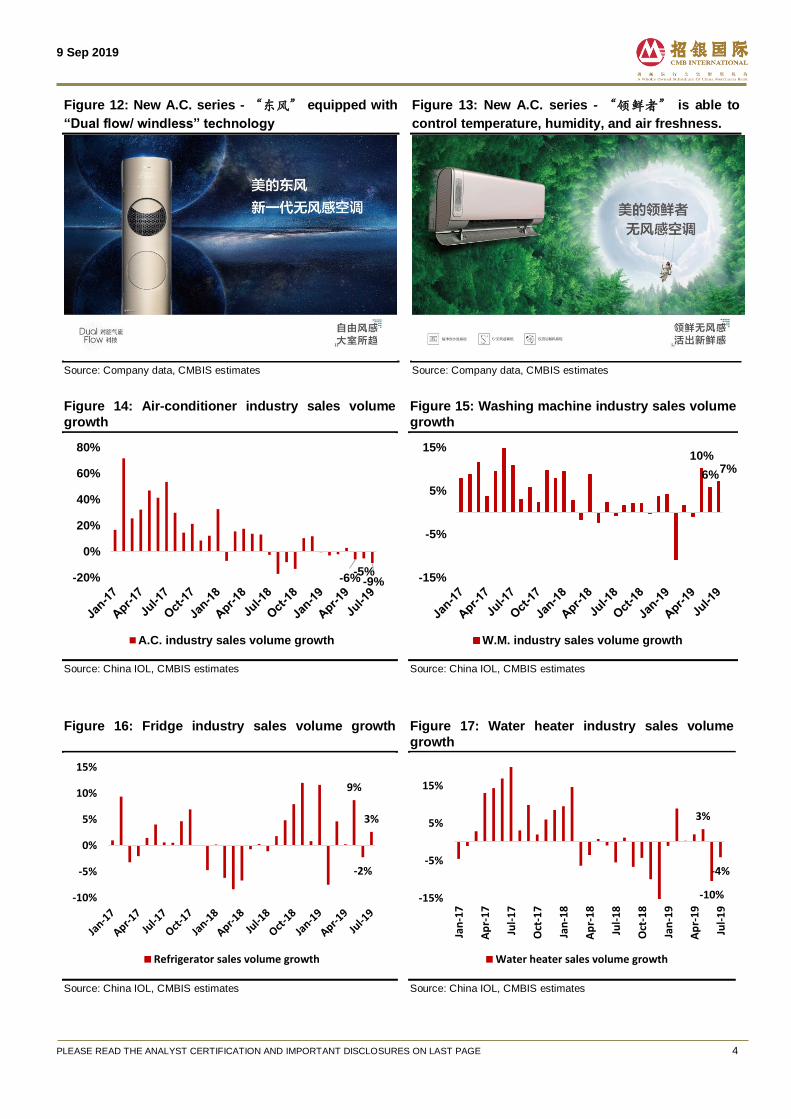
Exceptional achievement (esp. on A.C.) in 1H19. Despite a ~4% drop in A.C industry sales, Midea’s A.C sales surged by ~12% YoY in 1H19 (market share climbed to 27%/30% on offline/inline in 1H19, vs 25%/23% in 2018). We attribute such impressive results to its innovations (e.g. more products equipped with the “windless” technology, winning the 2019 AWE Epland Gold Award). Washing machines/ Refrigerator/ small appliances sales growth were ~6%/~10%/~low-single digit in 1H19, vs industry growth of ~3%/ ~-1%/ ~5%.
Prudent sales and rosy margins for 2H19E. The Company targets a 5-10% sales growth in FY19E and expects a GP margin expansion plus a faster growth for net profit. A.C. sales growth slowed down to ~10% in Jul/Aug 2019, according to management. However, in our view, that should not be a worry as margin should continue to improve given softening raw material prices and highly healthy level of channel inventory, at ~5-6mn units (vs industry’s ~20-30mn). Also, we see potential upsides from export business’s GP margin since CNY had already further depreciated vs USD in 2H19E. KUKA sales missed in 1H19 but management suggested a better 2H19E, for both sales and EBITDA margin.
Maintain BUY and raised TP to RMB 64.96 (20% upside). Our new TP is based on 16x FY20E P/E (rolled over from 18x FY19E). We lifted FY19E/20E/21E’s net profit by 1.9%/1.1%/0.2%, to factor in: 1) better A.C. sales, 2) declining raw material costs and currency rate and 3) greater R&D expenses. The counter now trades at 15x/ 13x FY19E/ 20E P/E with 2.6% forward yield.
Earnings Summary
(YE 31 Dec) FY17A FY18A FY19E FY20E FY21E
Revenue (RMB mn) 240,712 259,665 278,728 309,486 343,792 YoY growth (%) 51.3 7.9 7.3 11.0 11.1 Net income (RMB mn) 17,284 20,231 23,728 27,408 31,786 Diluted EPS (RMB) 2.632 3.051 3.547 4.060 4.662 YoY growth (%) 15.5 15.9 16.2 14.5 14.8 P/E (x) 20.6 17.8 15.3 13.4 11.6 P/B (x) 4.3 3.9 3.3 2.8 2.4 Yield (%) 2.2 2.4 2.6 3.0 3.4 ROE (%) 22.8 23.1 23.6 23.1 22.8 Net gearing (%) 21.6 26.8 11.3 Net cash Net cash
Source: Company data, CMBIS estimates
Midea Group (000333 CH)
Prudent sales and rosy margins for 2H19E
9 Sep 2019
PLEASE READ THE ANALYST CERTIFICATION AND IMPORTANT DISCLOSURES ON LAST PAGE 2
Focus Charts
Figure 1: Sales and net profit growth - quarterly
Source: Company data, CMBIS estimates
Figure 2: GP/ OP/ NP att. Margin - quarterly
Source: Company data, CMBIS estimates
Figure 3: Sales growth by segment
Source: NBS, CMBIS estimates
Figure 4: Sales growth by region
Source: China IOL, CMBIS estimates
Figure 5: Sales and net profit growth – full yearly
Source: Company data, CMBIS estimates
Figure 6: GP/ OP/ NP att. Margin – full yearly
Source: Company data, CMBIS estimates
56%
65%61%
26%
17% 13%
1% 0%
8% 8%11%
16%
26%22%
21%19% 19%
2%
17% 18%
0%
10%
20%
30%
40%
50%
60%
70%
Sales growth (%) NP att. growth (%)
25% 25% 26%24%
26%29% 27% 29% 28%
31%
7%10%
7%4%
8%11%
8%
4%
8%12%
0%
5%
10%
15%
20%
25%
30%
35%
GP margin Pre-tax margin
28%
7%
-8%
22%
15%
0% 2%
-2%
0% 1%
12%
6%
-4%
9% 8%
-10%
0%
10%
20%
30%
Heating,Ventilationand A.C.
Consumerelectronics
Robot andautomation
Others Total
1H18 2H18 1H19 2H19E
22%
5%
15%
-4%
8%
1%
9%7% 8%
5%
9%7%
-10%
-5%
0%
5%
10%
15%
20%
25%
Domestics Overseas Total
1H18 2H18 1H19 2H19E
-2%
15%
51%
8% 7%11% 11%
21%16% 18% 17% 17% 16% 16%
-5%
5%
15%
25%
35%
45%
55%
FY15A FY16A FY17A FY18A FY19E FY20E FY21E
Sales growth (%) NP att. growth (%)
25.8%27.3%
25.0%27.5%
28.7% 28.7% 28.7%
10.2% 10.7%8.2%
9.4% 10.0% 10.2% 10.6%
9.2% 9.2%7.2% 7.8% 8.5% 8.9% 9.2%
0%
5%
10%
15%
20%
25%
30%
FY15AFY16AFY17AFY18AFY19EFY20EFY21E
GP margin OP margin Pre-tax margin
9 Sep 2019
PLEASE READ THE ANALYST CERTIFICATION AND IMPORTANT DISCLOSURES ON LAST PAGE 3
Figure 7: Midea’s market share overview
Source: Company data, CMBIS estimates
Figure 8: Offline market shares by segment - large
appliances
Source: Company data, CMBIS estimates
Figure 9: Online market shares by segment - large
appliances
Source: Company data, CMBIS estimates
Figure 10: Offline market shares by segment - small
appliances
Source: Company data, CMBIS estimates
Figure 11: Online market shares by segment - small
appliances
Source: Company data, CMBIS estimates
Large appliances 2014 2015 2016 2017 2018 1H19 2014 2015 2016 2017 2018 1H19 2017 2018 1H19 2017 2018 1H19
Air-conditioner 25% 25% 24% 25% 25% 27% 2 2 2 2 2 2 24% 23% 30% 2 2 1
Washing machine (Midea) 18% 21% 23% 25% 26% 27% 2 2 2 2 2 2 29% 31% 31% 1 2 2
Refrigerator 8% 10% 11% 11% 11% 12% 4 4 3 3 3 2 15% 16% 17% 2 2 2
Water heater (Electric) 11% 12% 13% 20% 16% 16% 3 3 3 3 3 3 34% 32% 33% 1 1 1
Water heater (Gas) 11% 3 21% 19% 19% 1 1 1
Water purifier 34% 28% 23% 27% 23% 1 1 2 1 2 12% 14% 16% 3 2 1
Range hood 9% 10% 9% 8% 8% 3 3 4 4 4 17% 14% 17% 1 3 1
Stove 7% 7% 7% 4 4 4 14% 12% 2 2
Small appliances
Rice cooker 42% 42% 42% 45% 43% 44% 1 1 1 1 1 1 33% 32% 32% 1 1 1
Pressure cooker 42% 43% 46% 48% 44% 46% 1 1 1 1 1 1 42% 41% 1 1
Mirco wave oven 45% 45% 46% 45% 43% 44% 2 2 2 2 2 2 49% 49% 1 1
Induction stove 48% 49% 50% 53% 1 1 1 1 42% 43% 45% 1 1 1
Food processor 37% 39% 1 1
Drinking machines 30% 24% 25% 1 1 1
Offline's Mkt shs Ranking in China Online's mkt shs Ranking in China
25% 25%
11%
20%
25% 26%
11%
16%
27% 27%
12%
16%
5%
10%
15%
20%
25%
30%
Air-conditioner Washingmachine(Midea)
Refrigerator Water heater(Electric)
2017 2018 1H19
24%
29%
15%
34%
23%
31%
16%
32%30%
31%
17%
33%
5%
10%
15%
20%
25%
30%
35%
40%
Air-conditioner Washingmachine(Midea)
Refrigerator Water heater(Electric)
2017 2018 1H19
45%
48%45%
53%
43%44%
43%
37%
44%46%
44%
39%
30%
35%
40%
45%
50%
55%
Ricecooker
Pressurecooker
Mircowave oven
Inductionstove
Foodprocessor
2017 2018 1H19
33%
42%
32%
42%
49%43%
32%
41%
49%45%
0%
10%
20%
30%
40%
50%
60%
Rice cooker Pressurecooker
Mirco waveoven
Inductionstove
2017 2018 1H19
9 Sep 2019
PLEASE READ THE ANALYST CERTIFICATION AND IMPORTANT DISCLOSURES ON LAST PAGE 4
Figure 12: New A.C. series - “东风” equipped with
“Dual flow/ windless” technology
Source: Company data, CMBIS estimates
Figure 13: New A.C. series - “领鲜者” is able to
control temperature, humidity, and air freshness.
Source: Company data, CMBIS estimates
Figure 14: Air-conditioner industry sales volume
growth
Source: China IOL, CMBIS estimates
Figure 15: Washing machine industry sales volume
growth
Source: China IOL, CMBIS estimates
Figure 16: Fridge industry sales volume growth
Source: China IOL, CMBIS estimates
Figure 17: Water heater industry sales volume
growth
Source: China IOL, CMBIS estimates
-6%-5%
-9%-20%
0%
20%
40%
60%
80%
A.C. industry sales volume growth
10%
6%7%
-15%
-5%
5%
15%
W.M. industry sales volume growth
9%
-2%
3%
-10%
-5%
0%
5%
10%
15%
Refrigerator sales volume growth
3%
-10%
-4%
-15%
-5%
5%
15%
Jan
-17
Ap
r-1
7
Jul-
17
Oct
-17
Jan
-18
Ap
r-1
8
Jul-
18
Oct
-18
Jan
-19
Ap
r-1
9
Jul-
19
Water heater sales volume growth
9 Sep 2019
PLEASE READ THE ANALYST CERTIFICATION AND IMPORTANT DISCLOSURES ON LAST PAGE 5
Figure 18: Overseas GP margin vs USDCNY
Source: Company data, Bloomberg, CMBIS estimates
Figure 19: China copper price
Source: Bloomberg, CMBIS estimates
Figure 20: China aluminium price
Source: Bloomberg, CMBIS estimates
Figure 21: China steel price
Source: Bloomberg, CMBIS estimates
6.0
6.3
6.6
6.9
7.2
7.5
17.0%
20.0%
23.0%
26.0%
29.0%
Overseas GP margin USDCNY - R.H.S.
Sep-18, 50,520 Sep-19,
47,620
30,000
35,000
40,000
45,000
50,000
55,000
60,000
Jan
-15
Ap
r-1
5J
ul-
15
Oc
t-1
5J
an
-16
Ap
r-1
6J
ul-
16
Oc
t-1
6J
an
-17
Ap
r-1
7J
ul-
17
Oc
t-1
7J
an
-18
Ap
r-1
8J
ul-
18
Oc
t-1
8J
an
-19
Ap
r-1
9J
ul-
19
China domestic copper price
(CNY/metric tonne)
Sep-18, 14,440 Sep-19,
14,420
9,000
11,000
13,000
15,000
17,000
Jan
-15
Ap
r-1
5J
ul-
15
Oc
t-1
5J
an
-16
Ap
r-1
6J
ul-
16
Oc
t-1
6J
an
-17
Ap
r-1
7J
ul-
17
Oc
t-1
7J
an
-18
Ap
r-1
8J
ul-
18
Oc
t-1
8J
an
-19
Ap
r-1
9J
ul-
19
China domestic aluminium price
(CNY/metric tonne)
Sep-18, 4,230 Sep-19,
3,716
1,500
2,000
2,500
3,000
3,500
4,000
4,500
Jan
-15
Ap
r-1
5
Ju
l-1
5
Oc
t-1
5
Jan
-16
Ap
r-1
6
Ju
l-1
6
Oc
t-1
6
Jan
-17
Ap
r-1
7
Ju
l-1
7
Oc
t-1
7
Jan
-18
Ap
r-1
8
Ju
l-1
8
Oc
t-1
8
Jan
-19
Ap
r-1
9
Ju
l-1
9
China domestic hot rolled steel price
(CNY/metric tonne)
9 Sep 2019
PLEASE READ THE ANALYST CERTIFICATION AND IMPORTANT DISCLOSURES ON LAST PAGE 6
Results Summary
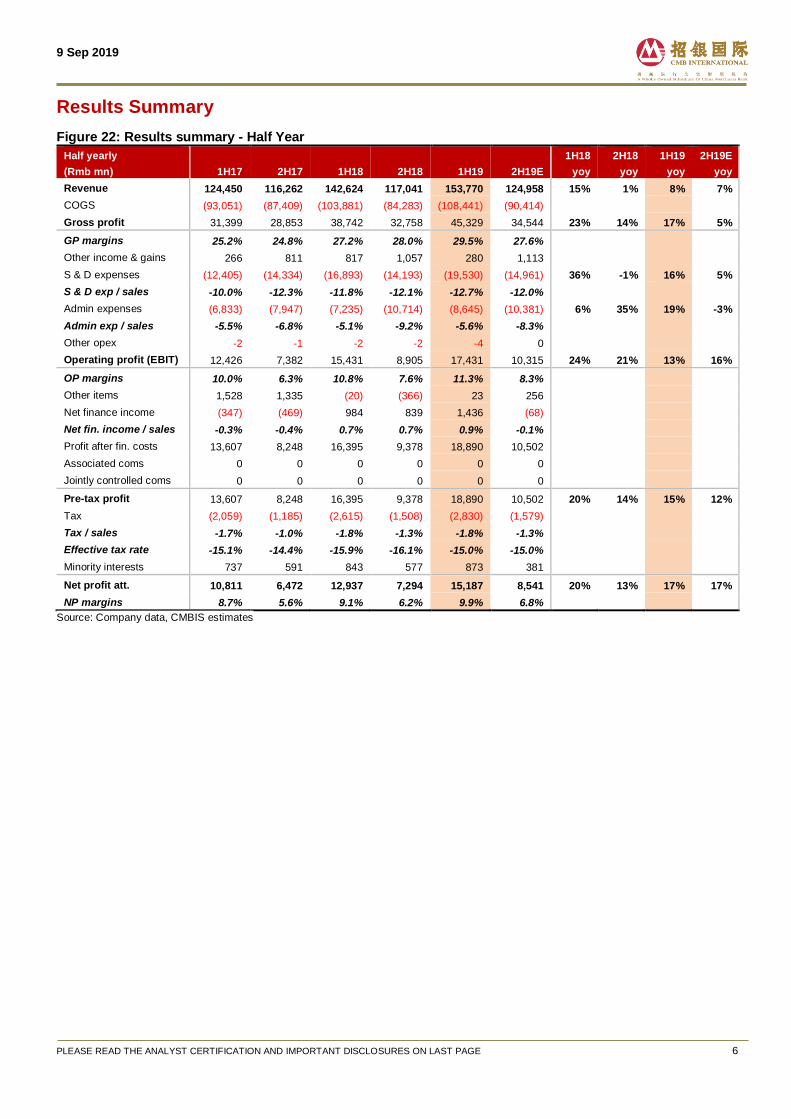
Figure 22: Results summary - Half Year
Half yearly
(Rmb mn) 1H17 2H17 1H18 2H18 1H19 2H19E
1H18
yoy
2H18
yoy
1H19
yoy
2H19E
yoy
Revenue 124,450 116,262 142,624 117,041 153,770 124,958 15% 1% 8% 7%
COGS (93,051) (87,409) (103,881) (84,283) (108,441) (90,414)
Gross profit 31,399 28,853 38,742 32,758 45,329 34,544 23% 14% 17% 5%
GP margins 25.2% 24.8% 27.2% 28.0% 29.5% 27.6%
Other income & gains 266 811 817 1,057 280 1,113
S & D expenses (12,405) (14,334) (16,893) (14,193) (19,530) (14,961) 36% -1% 16% 5%
S & D exp / sales -10.0% -12.3% -11.8% -12.1% -12.7% -12.0%
Admin expenses (6,833) (7,947) (7,235) (10,714) (8,645) (10,381) 6% 35% 19% -3%
Admin exp / sales -5.5% -6.8% -5.1% -9.2% -5.6% -8.3%
Other opex -2 -1 -2 -2 -4 0
Operating profit (EBIT) 12,426 7,382 15,431 8,905 17,431 10,315 24% 21% 13% 16%
OP margins 10.0% 6.3% 10.8% 7.6% 11.3% 8.3%
Other items 1,528 1,335 (20) (366) 23 256
Net finance income (347) (469) 984 839 1,436 (68)
Net fin. income / sales -0.3% -0.4% 0.7% 0.7% 0.9% -0.1%
Profit after fin. costs 13,607 8,248 16,395 9,378 18,890 10,502
Associated coms 0 0 0 0 0 0
Jointly controlled coms 0 0 0 0 0 0
Pre-tax profit 13,607 8,248 16,395 9,378 18,890 10,502 20% 14% 15% 12%
Tax (2,059) (1,185) (2,615) (1,508) (2,830) (1,579)
Tax / sales -1.7% -1.0% -1.8% -1.3% -1.8% -1.3%
Effective tax rate -15.1% -14.4% -15.9% -16.1% -15.0% -15.0%
Minority interests 737 591 843 577 873 381
Net profit att. 10,811 6,472 12,937 7,294 15,187 8,541 20% 13% 17% 17%
NP margins 8.7% 5.6% 9.1% 6.2% 9.9% 6.8% Source: Company data, CMBIS estimates
9 Sep 2019
PLEASE READ THE ANALYST CERTIFICATION AND IMPORTANT DISCLOSURES ON LAST PAGE 7
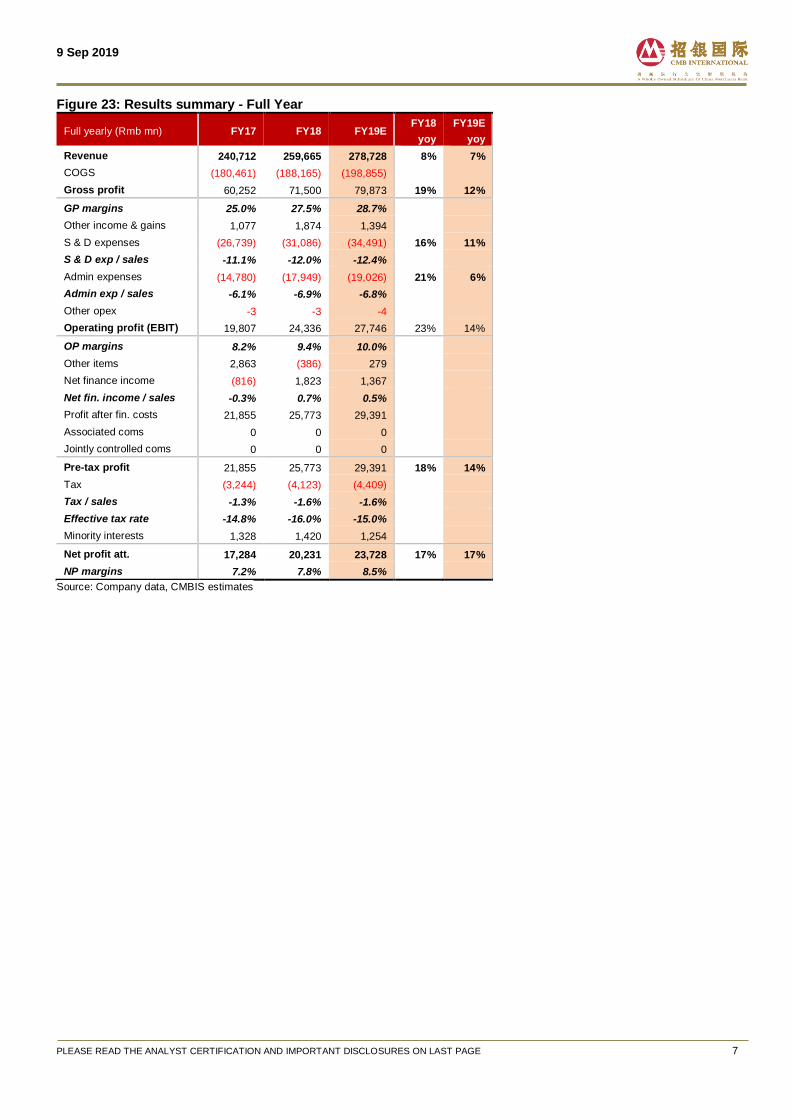
Figure 23: Results summary - Full Year
Full yearly (Rmb mn) FY17 FY18 FY19E FY18
yoy
FY19E
yoy
Revenue 240,712 259,665 278,728 8% 7%
COGS (180,461) (188,165) (198,855)
Gross profit 60,252 71,500 79,873 19% 12%
GP margins 25.0% 27.5% 28.7%
Other income & gains 1,077 1,874 1,394
S & D expenses (26,739) (31,086) (34,491) 16% 11%
S & D exp / sales -11.1% -12.0% -12.4%
Admin expenses (14,780) (17,949) (19,026) 21% 6%
Admin exp / sales -6.1% -6.9% -6.8%
Other opex -3 -3 -4
Operating profit (EBIT) 19,807 24,336 27,746 23% 14%
OP margins 8.2% 9.4% 10.0%
Other items 2,863 (386) 279
Net finance income (816) 1,823 1,367
Net fin. income / sales -0.3% 0.7% 0.5%
Profit after fin. costs 21,855 25,773 29,391
Associated coms 0 0 0
Jointly controlled coms 0 0 0
Pre-tax profit 21,855 25,773 29,391 18% 14%
Tax (3,244) (4,123) (4,409)
Tax / sales -1.3% -1.6% -1.6%
Effective tax rate -14.8% -16.0% -15.0%
Minority interests 1,328 1,420 1,254
Net profit att. 17,284 20,231 23,728 17% 17%
NP margins 7.2% 7.8% 8.5% Source: Company data, CMBIS estimates
9 Sep 2019
PLEASE READ THE ANALYST CERTIFICATION AND IMPORTANT DISCLOSURES ON LAST PAGE 8
Earnings revision
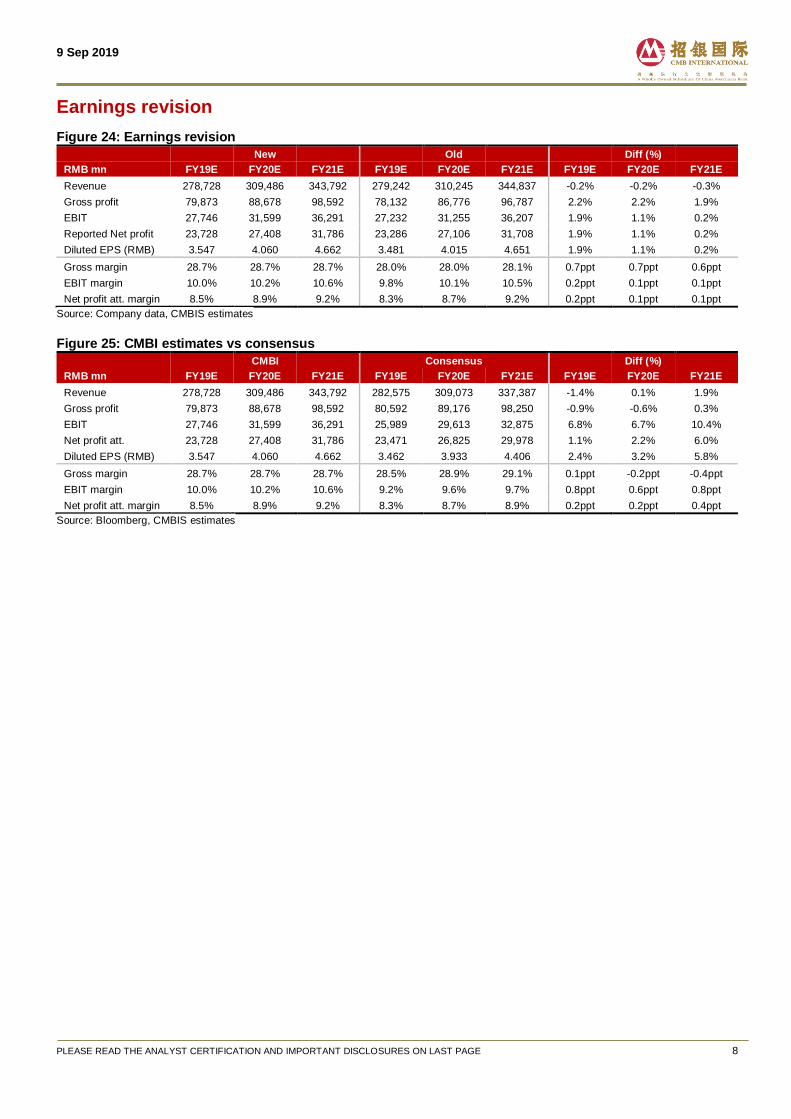
Figure 24: Earnings revision
New Old Diff (%)
RMB mn FY19E FY20E FY21E FY19E FY20E FY21E FY19E FY20E FY21E
Revenue 278,728 309,486 343,792 279,242 310,245 344,837 -0.2% -0.2% -0.3%
Gross profit 79,873 88,678 98,592 78,132 86,776 96,787 2.2% 2.2% 1.9%
EBIT 27,746 31,599 36,291 27,232 31,255 36,207 1.9% 1.1% 0.2%
Reported Net profit 23,728 27,408 31,786 23,286 27,106 31,708 1.9% 1.1% 0.2%
Diluted EPS (RMB) 3.547 4.060 4.662 3.481 4.015 4.651 1.9% 1.1% 0.2%
Gross margin 28.7% 28.7% 28.7% 28.0% 28.0% 28.1% 0.7ppt 0.7ppt 0.6ppt
EBIT margin 10.0% 10.2% 10.6% 9.8% 10.1% 10.5% 0.2ppt 0.1ppt 0.1ppt
Net profit att. margin 8.5% 8.9% 9.2% 8.3% 8.7% 9.2% 0.2ppt 0.1ppt 0.1ppt
Source: Company data, CMBIS estimates
Figure 25: CMBI estimates vs consensus
CMBI Consensus Diff (%)
RMB mn FY19E FY20E FY21E FY19E FY20E FY21E FY19E FY20E FY21E
Revenue 278,728 309,486 343,792 282,575 309,073 337,387 -1.4% 0.1% 1.9%
Gross profit 79,873 88,678 98,592 80,592 89,176 98,250 -0.9% -0.6% 0.3%
EBIT 27,746 31,599 36,291 25,989 29,613 32,875 6.8% 6.7% 10.4%
Net profit att. 23,728 27,408 31,786 23,471 26,825 29,978 1.1% 2.2% 6.0%
Diluted EPS (RMB) 3.547 4.060 4.662 3.462 3.933 4.406 2.4% 3.2% 5.8%
Gross margin 28.7% 28.7% 28.7% 28.5% 28.9% 29.1% 0.1ppt -0.2ppt -0.4ppt
EBIT margin 10.0% 10.2% 10.6% 9.2% 9.6% 9.7% 0.8ppt 0.6ppt 0.8ppt
Net profit att. margin 8.5% 8.9% 9.2% 8.3% 8.7% 8.9% 0.2ppt 0.2ppt 0.4ppt
Source: Bloomberg, CMBIS estimates
9 Sep 2019
PLEASE READ THE ANALYST CERTIFICATION AND IMPORTANT DISCLOSURES ON LAST PAGE 9
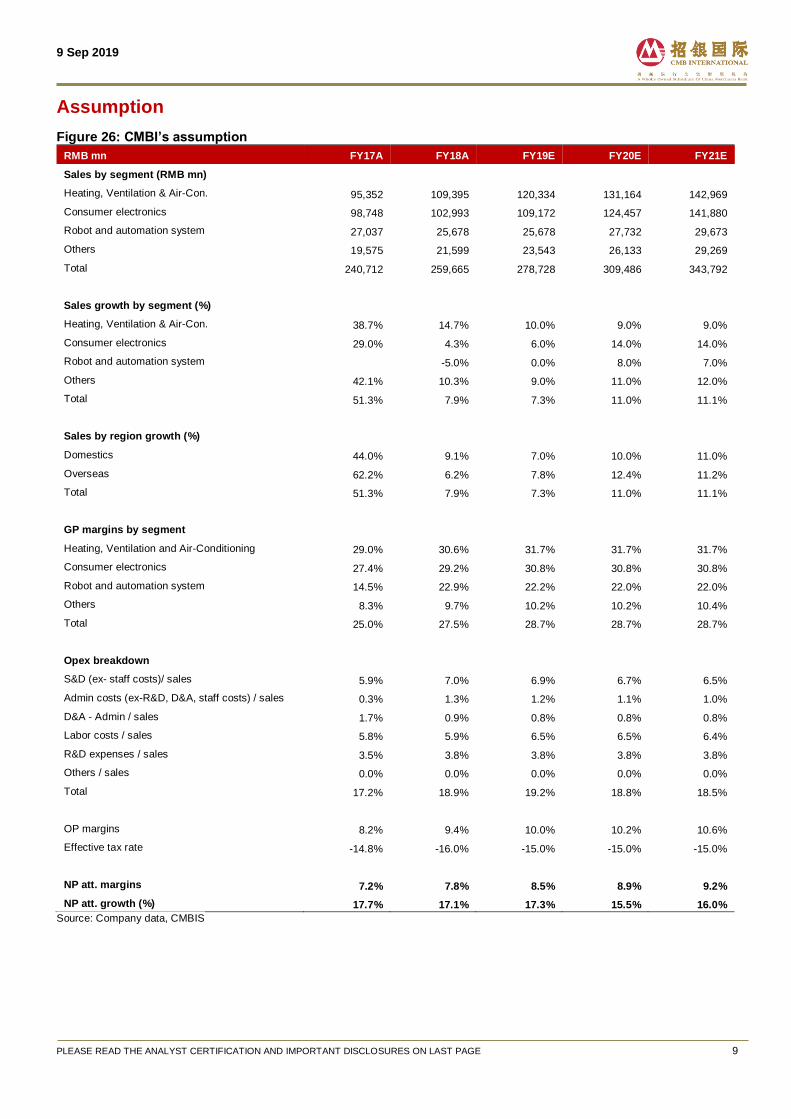
Assumption
Figure 26: CMBI’s assumption
RMB mn FY17A FY18A FY19E FY20E FY21E
Sales by segment (RMB mn)
Heating, Ventilation & Air-Con. 95,352 109,395 120,334 131,164 142,969
Consumer electronics 98,748 102,993 109,172 124,457 141,880
Robot and automation system 27,037 25,678 25,678 27,732 29,673
Others 19,575 21,599 23,543 26,133 29,269
Total 240,712 259,665 278,728 309,486 343,792
Sales growth by segment (%)
Heating, Ventilation & Air-Con. 38.7% 14.7% 10.0% 9.0% 9.0%
Consumer electronics 29.0% 4.3% 6.0% 14.0% 14.0%
Robot and automation system -5.0% 0.0% 8.0% 7.0%
Others 42.1% 10.3% 9.0% 11.0% 12.0%
Total 51.3% 7.9% 7.3% 11.0% 11.1%
Sales by region growth (%)
Domestics 44.0% 9.1% 7.0% 10.0% 11.0%
Overseas 62.2% 6.2% 7.8% 12.4% 11.2%
Total 51.3% 7.9% 7.3% 11.0% 11.1%
GP margins by segment
Heating, Ventilation and Air-Conditioning 29.0% 30.6% 31.7% 31.7% 31.7%
Consumer electronics 27.4% 29.2% 30.8% 30.8% 30.8%
Robot and automation system 14.5% 22.9% 22.2% 22.0% 22.0%
Others 8.3% 9.7% 10.2% 10.2% 10.4%
Total 25.0% 27.5% 28.7% 28.7% 28.7%
Opex breakdown
S&D (ex- staff costs)/ sales 5.9% 7.0% 6.9% 6.7% 6.5%
Admin costs (ex-R&D, D&A, staff costs) / sales 0.3% 1.3% 1.2% 1.1% 1.0%
D&A - Admin / sales 1.7% 0.9% 0.8% 0.8% 0.8%
Labor costs / sales 5.8% 5.9% 6.5% 6.5% 6.4%
R&D expenses / sales 3.5% 3.8% 3.8% 3.8% 3.8%
Others / sales 0.0% 0.0% 0.0% 0.0% 0.0%
Total 17.2% 18.9% 19.2% 18.8% 18.5%
OP margins 8.2% 9.4% 10.0% 10.2% 10.6%
Effective tax rate -14.8% -16.0% -15.0% -15.0% -15.0%
NP att. margins 7.2% 7.8% 8.5% 8.9% 9.2%
NP att. growth (%) 17.7% 17.1% 17.3% 15.5% 16.0%
Source: Company data, CMBIS
9 Sep 2019
PLEASE READ THE ANALYST CERTIFICATION AND IMPORTANT DISCLOSURES ON LAST PAGE 10
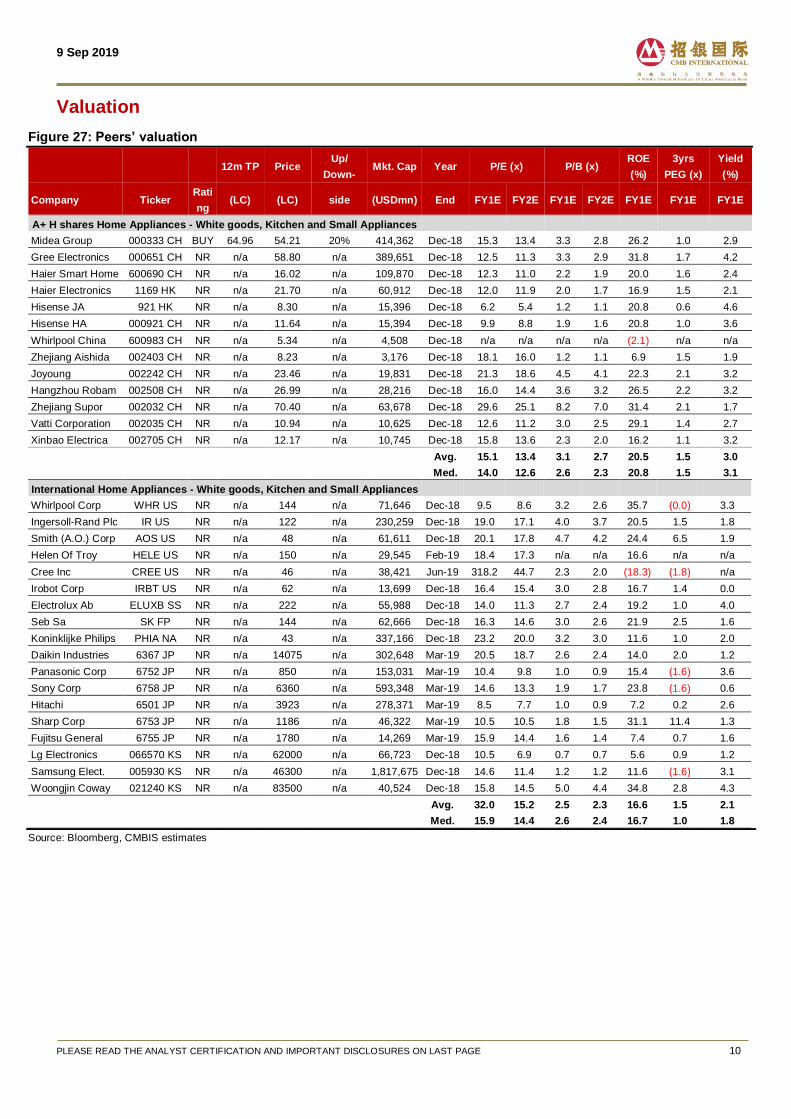
Valuation
Figure 27: Peers’ valuation
12m TP Price Up/
Down- Mkt. Cap Year P/E (x) P/B (x)
ROE
(%)
3yrs
PEG (x)
Yield
(%)
Company Ticker Rati
ng (LC) (LC) side (USDmn) End FY1E FY2E FY1E FY2E FY1E FY1E FY1E
A+ H shares Home Appliances - White goods, Kitchen and Small Appliances
Midea Group 000333 CH BUY 64.96 54.21 20% 414,362 Dec-18 15.3 13.4 3.3 2.8 26.2 1.0 2.9
Gree Electronics 000651 CH NR n/a 58.80 n/a 389,651 Dec-18 12.5 11.3 3.3 2.9 31.8 1.7 4.2
Haier Smart Home 600690 CH NR n/a 16.02 n/a 109,870 Dec-18 12.3 11.0 2.2 1.9 20.0 1.6 2.4
Haier Electronics 1169 HK NR n/a 21.70 n/a 60,912 Dec-18 12.0 11.9 2.0 1.7 16.9 1.5 2.1
Hisense JA 921 HK NR n/a 8.30 n/a 15,396 Dec-18 6.2 5.4 1.2 1.1 20.8 0.6 4.6
Hisense HA 000921 CH NR n/a 11.64 n/a 15,394 Dec-18 9.9 8.8 1.9 1.6 20.8 1.0 3.6
Whirlpool China 600983 CH NR n/a 5.34 n/a 4,508 Dec-18 n/a n/a n/a n/a (2.1) n/a n/a
Zhejiang Aishida 002403 CH NR n/a 8.23 n/a 3,176 Dec-18 18.1 16.0 1.2 1.1 6.9 1.5 1.9
Joyoung 002242 CH NR n/a 23.46 n/a 19,831 Dec-18 21.3 18.6 4.5 4.1 22.3 2.1 3.2
Hangzhou Robam 002508 CH NR n/a 26.99 n/a 28,216 Dec-18 16.0 14.4 3.6 3.2 26.5 2.2 3.2
Zhejiang Supor 002032 CH NR n/a 70.40 n/a 63,678 Dec-18 29.6 25.1 8.2 7.0 31.4 2.1 1.7
Vatti Corporation 002035 CH NR n/a 10.94 n/a 10,625 Dec-18 12.6 11.2 3.0 2.5 29.1 1.4 2.7
Xinbao Electrica 002705 CH NR n/a 12.17 n/a 10,745 Dec-18 15.8 13.6 2.3 2.0 16.2 1.1 3.2
Avg. 15.1 13.4 3.1 2.7 20.5 1.5 3.0
Med. 14.0 12.6 2.6 2.3 20.8 1.5 3.1
International Home Appliances - White goods, Kitchen and Small Appliances
Whirlpool Corp WHR US NR n/a 144 n/a 71,646 Dec-18 9.5 8.6 3.2 2.6 35.7 (0.0) 3.3
Ingersoll-Rand Plc IR US NR n/a 122 n/a 230,259 Dec-18 19.0 17.1 4.0 3.7 20.5 1.5 1.8
Smith (A.O.) Corp AOS US NR n/a 48 n/a 61,611 Dec-18 20.1 17.8 4.7 4.2 24.4 6.5 1.9
Helen Of Troy HELE US NR n/a 150 n/a 29,545 Feb-19 18.4 17.3 n/a n/a 16.6 n/a n/a
Cree Inc CREE US NR n/a 46 n/a 38,421 Jun-19 318.2 44.7 2.3 2.0 (18.3) (1.8) n/a
Irobot Corp IRBT US NR n/a 62 n/a 13,699 Dec-18 16.4 15.4 3.0 2.8 16.7 1.4 0.0
Electrolux Ab ELUXB SS NR n/a 222 n/a 55,988 Dec-18 14.0 11.3 2.7 2.4 19.2 1.0 4.0
Seb Sa SK FP NR n/a 144 n/a 62,666 Dec-18 16.3 14.6 3.0 2.6 21.9 2.5 1.6
Koninklijke Philips PHIA NA NR n/a 43 n/a 337,166 Dec-18 23.2 20.0 3.2 3.0 11.6 1.0 2.0
Daikin Industries 6367 JP NR n/a 14075 n/a 302,648 Mar-19 20.5 18.7 2.6 2.4 14.0 2.0 1.2
Panasonic Corp 6752 JP NR n/a 850 n/a 153,031 Mar-19 10.4 9.8 1.0 0.9 15.4 (1.6) 3.6
Sony Corp 6758 JP NR n/a 6360 n/a 593,348 Mar-19 14.6 13.3 1.9 1.7 23.8 (1.6) 0.6
Hitachi 6501 JP NR n/a 3923 n/a 278,371 Mar-19 8.5 7.7 1.0 0.9 7.2 0.2 2.6
Sharp Corp 6753 JP NR n/a 1186 n/a 46,322 Mar-19 10.5 10.5 1.8 1.5 31.1 11.4 1.3
Fujitsu General 6755 JP NR n/a 1780 n/a 14,269 Mar-19 15.9 14.4 1.6 1.4 7.4 0.7 1.6
Lg Electronics 066570 KS NR n/a 62000 n/a 66,723 Dec-18 10.5 6.9 0.7 0.7 5.6 0.9 1.2
Samsung Elect. 005930 KS NR n/a 46300 n/a 1,817,675 Dec-18 14.6 11.4 1.2 1.2 11.6 (1.6) 3.1
Woongjin Coway 021240 KS NR n/a 83500 n/a 40,524 Dec-18 15.8 14.5 5.0 4.4 34.8 2.8 4.3
Avg. 32.0 15.2 2.5 2.3 16.6 1.5 2.1
Med. 15.9 14.4 2.6 2.4 16.7 1.0 1.8
Source: Bloomberg, CMBIS estimates
9 Sep 2019
PLEASE READ THE ANALYST CERTIFICATION AND IMPORTANT DISCLOSURES ON LAST PAGE 11
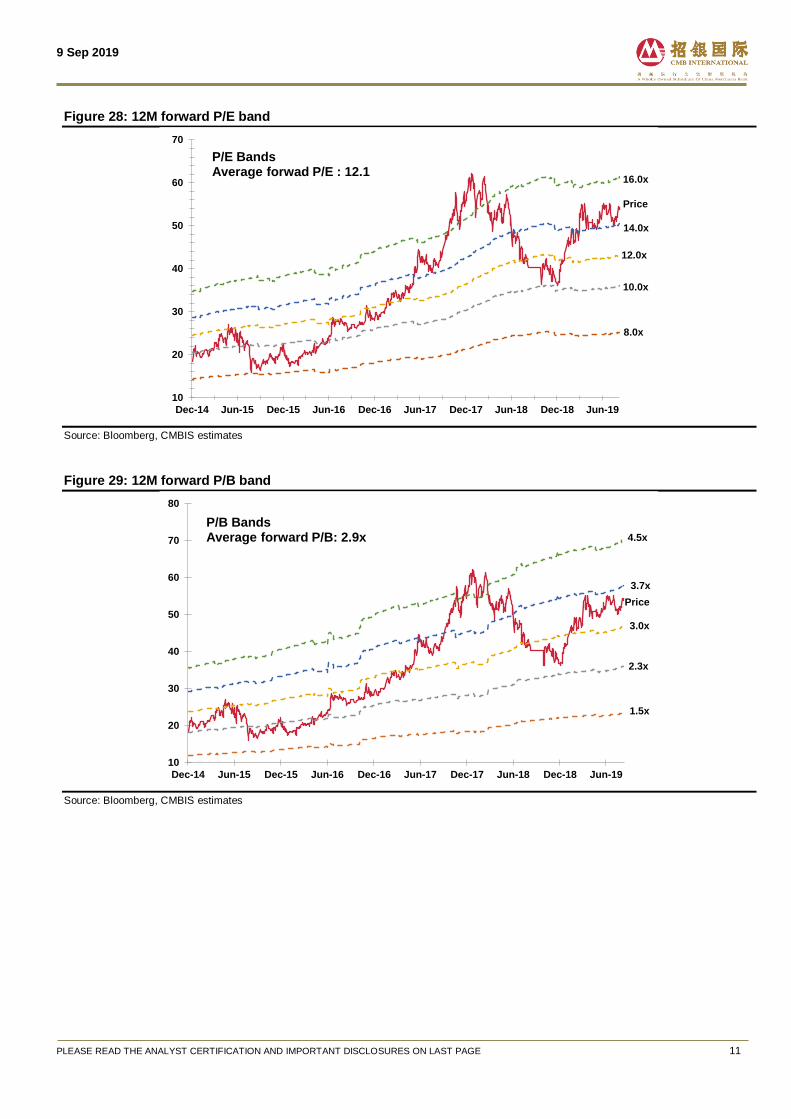
Figure 28: 12M forward P/E band
Source: Bloomberg, CMBIS estimates
Figure 29: 12M forward P/B band
Source: Bloomberg, CMBIS estimates
10
20
30
40
50
60
70
Dec-14 Jun-15 Dec-15 Jun-16 Dec-16 Jun-17 Dec-17 Jun-18 Dec-18 Jun-19
P/E BandsAverage forwad P/E : 12.1
14.0x
12.0x
10.0x
8.0x
Price
16.0x
10
20
30
40
50
60
70
80
Dec-14 Jun-15 Dec-15 Jun-16 Dec-16 Jun-17 Dec-17 Jun-18 Dec-18 Jun-19
P/B BandsAverage forward P/B: 2.9x 4.5x
3.7x
3.0x
2.3x
1.5x
Price
9 Sep 2019
PLEASE READ THE ANALYST CERTIFICATION AND IMPORTANT DISCLOSURES ON LAST PAGE 12
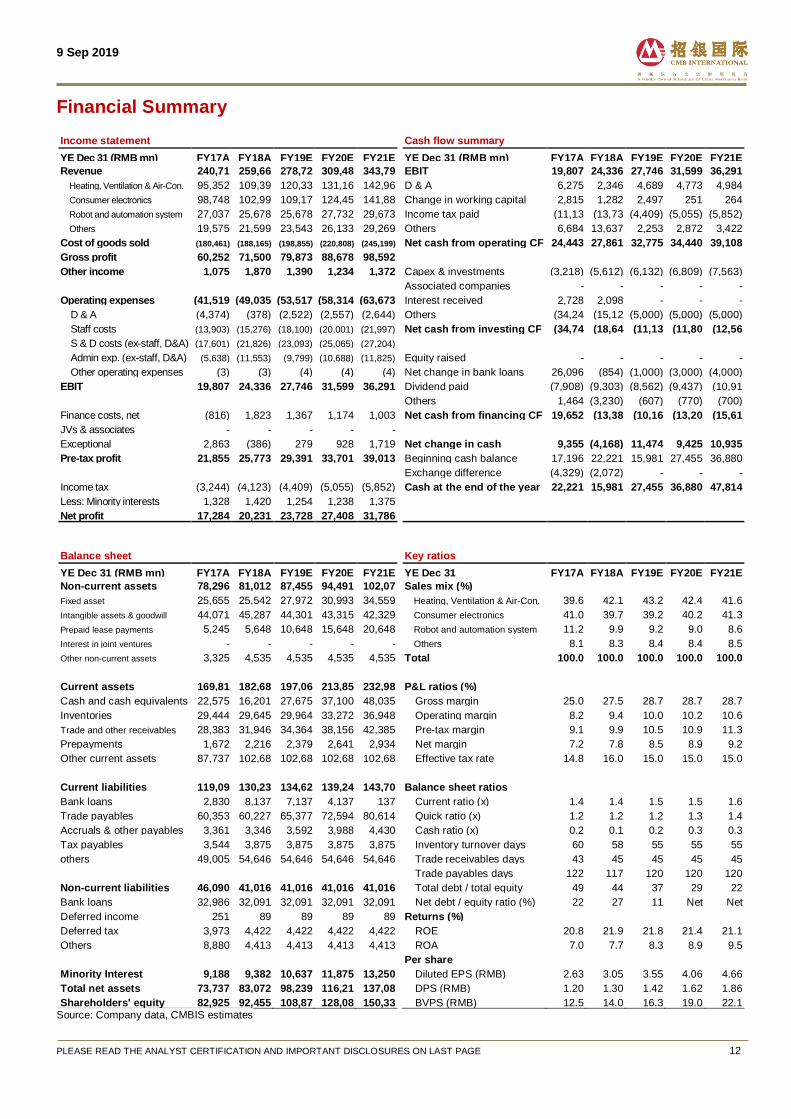
Financial Summary
Income statement Cash flow summary
YE Dec 31 (RMB mn) FY17A FY18A FY19E FY20E FY21E YE Dec 31 (RMB mn) FY17A FY18A FY19E FY20E FY21E
Revenue 240,71
2
259,66
5
278,72
8
309,48
6
343,79
2
EBIT 19,807 24,336 27,746 31,599 36,291
Heating, Ventilation & Air-Con. 95,352 109,39
5
120,33
4
131,16
4
142,96
9
D & A 6,275 2,346 4,689 4,773 4,984
Consumer electronics 98,748 102,99
3
109,17
2
124,45
7
141,88
0
Change in working capital 2,815 1,282 2,497 251 264
Robot and automation system 27,037 25,678 25,678 27,732 29,673 Income tax paid (11,13
9)
(13,73
9)
(4,409) (5,055) (5,852)
Others 19,575 21,599 23,543 26,133 29,269 Others 6,684 13,637 2,253 2,872 3,422
Cost of goods sold (180,461) (188,165) (198,855) (220,808) (245,199) Net cash from operating CF 24,443 27,861 32,775 34,440 39,108
Gross profit 60,252 71,500 79,873 88,678 98,592
Other income 1,075 1,870 1,390 1,234 1,372 Capex & investments (3,218) (5,612) (6,132) (6,809) (7,563)
Associated companies - - - - -
Operating expenses (41,519
)
(49,035
)
(53,517
)
(58,314
)
(63,673
)
Interest received 2,728 2,098 - - -
D & A (4,374) (378) (2,522) (2,557) (2,644) Others (34,24
9)
(15,12
8)
(5,000) (5,000) (5,000)
Staff costs (13,903) (15,276) (18,100) (20,001) (21,997) Net cash from investing CF (34,74
0)
(18,64
2)
(11,13
2)
(11,80
9)
(12,56
3) S & D costs (ex-staff, D&A) (17,601) (21,826) (23,093) (25,065) (27,204)
Admin exp. (ex-staff, D&A) (5,638) (11,553) (9,799) (10,688) (11,825) Equity raised - - - - -
Other operating expenses (3) (3) (4) (4) (4) Net change in bank loans 26,096 (854) (1,000) (3,000) (4,000)
EBIT 19,807 24,336 27,746 31,599 36,291 Dividend paid (7,908) (9,303) (8,562) (9,437) (10,91
1)
Others 1,464 (3,230) (607) (770) (700)
Finance costs, net (816) 1,823 1,367 1,174 1,003 Net cash from financing CF 19,652 (13,38
7)
(10,16
9)
(13,20
6)
(15,61
0) JVs & associates - - - - -
Exceptional 2,863 (386) 279 928 1,719 Net change in cash 9,355 (4,168) 11,474 9,425 10,935
Pre-tax profit 21,855 25,773 29,391 33,701 39,013 Beginning cash balance 17,196 22,221 15,981 27,455 36,880
Exchange difference (4,329) (2,072) - - -
Income tax (3,244) (4,123) (4,409) (5,055) (5,852) Cash at the end of the year 22,221 15,981 27,455 36,880 47,814
Less: Minority interests 1,328 1,420 1,254 1,238 1,375
Net profit 17,284 20,231 23,728 27,408 31,786
Balance sheet Key ratios
YE Dec 31 (RMB mn) FY17A FY18A FY19E FY20E FY21E YE Dec 31 FY17A FY18A FY19E FY20E FY21E
Non-current assets 78,296 81,012 87,455 94,491 102,07
0
Sales mix (%)
Fixed asset 25,655 25,542 27,972 30,993 34,559
Heating, Ventilation & Air-Con. 39.6 42.1 43.2 42.4 41.6
Intangible assets & goodwill 44,071 45,287 44,301 43,315 42,329
Consumer electronics 41.0 39.7 39.2 40.2 41.3
Prepaid lease payments 5,245 5,648 10,648 15,648 20,648
Robot and automation system 11.2 9.9 9.2 9.0 8.6
Interest in joint ventures - - - - -
Others 8.1 8.3 8.4 8.4 8.5
Other non-current assets 3,325 4,535 4,535 4,535 4,535 Total 100.0 100.0 100.0 100.0 100.0
Current assets 169,81
1
182,68
9
197,06
3
213,85
0
232,98
3
P&L ratios (%)
Cash and cash equivalents 22,575 16,201 27,675 37,100 48,035
Gross margin 25.0 27.5 28.7 28.7 28.7
Inventories 29,444 29,645 29,964 33,272 36,948
Operating margin 8.2 9.4 10.0 10.2 10.6
Trade and other receivables 28,383 31,946 34,364 38,156 42,385
Pre-tax margin 9.1 9.9 10.5 10.9 11.3
Prepayments 1,672 2,216 2,379 2,641 2,934
Net margin 7.2 7.8 8.5 8.9 9.2
Other current assets 87,737 102,68
1
102,68
1
102,68
1
102,68
1
Effective tax rate 14.8 16.0 15.0 15.0 15.0
Current liabilities 119,09
2
130,23
1
134,62
7
139,24
1
143,70
2
Balance sheet ratios
Bank loans 2,830 8,137 7,137 4,137 137 Current ratio (x) 1.4 1.4 1.5 1.5 1.6
Trade payables 60,353 60,227 65,377 72,594 80,614 Quick ratio (x) 1.2 1.2 1.2 1.3 1.4
Accruals & other payables 3,361 3,346 3,592 3,988 4,430
Cash ratio (x) 0.2 0.1 0.2 0.3 0.3
Tax payables 3,544 3,875 3,875 3,875 3,875
Inventory turnover days 60 58 55 55 55
others 49,005 54,646 54,646 54,646 54,646
Trade receivables days 43 45 45 45 45
Trade payables days 122 117 120 120 120
Non-current liabilities 46,090 41,016 41,016 41,016 41,016
Total debt / total equity
ratio (%)
49 44 37 29 22
Bank loans 32,986 32,091 32,091 32,091 32,091
Net debt / equity ratio (%) 22 27 11 Net
cash
Net
cash Deferred income 251 89 89 89 89 Returns (%)
Deferred tax 3,973 4,422 4,422 4,422 4,422
ROE 20.8 21.9 21.8 21.4 21.1
Others 8,880 4,413 4,413 4,413 4,413
ROA 7.0 7.7 8.3 8.9 9.5
Per share
Minority Interest 9,188 9,382 10,637 11,875 13,250
Diluted EPS (RMB) 2.63 3.05 3.55 4.06 4.66
Total net assets 73,737 83,072 98,239 116,21
0
137,08
6
DPS (RMB) 1.20 1.30 1.42 1.62 1.86
Shareholders' equity 82,925 92,455 108,87
6
128,08
5
150,33
6
BVPS (RMB) 12.5
9
14.0
4
16.3
7
19.0
7
22.1
6 Source: Company data, CMBIS estimates
9 Sep 2019
PLEASE READ THE ANALYST CERTIFICATION AND IMPORTANT DISCLOSURES ON LAST PAGE 13
Disclosures & Disclaimers
Analyst Certification The research analyst who is primary responsible for the content of this research report, in whole or in part, certifies that with respect to the securities or issuer that the analyst covered in this report: (1) all of the views expressed accurately reflect his or her personal views about the subject securities
or issuer; and (2) no part of his or her compensation was, is, or will be, directly or indirectly, related to the specific views expressed by that analyst in this report. Besides, the analyst confirms that neither the analyst nor his/her associates (as defined in the code of conduct issued by The Hong Kong Securities
and Futures Commission) (1) have dealt in or traded in the stock(s) covered in this research report within 30 calendar days prior to the date of issue of this report; (2) will deal in or trade in the stock(s) covered in this research report 3 business days after the date of issue of this report; (3) serve as an officer of any of the Hong Kong listed companies covered in this report; and (4) have any financial interests in the Hong Kong listed companies
covered in this report.
CMBIS Ratings BUY : Stock with potential return of over 15% over next 12 months HOLD : Stock with potential return of +15% to -10% over next 12 months SELL : Stock with potential loss of over 10% over next 12 months NOT RATED : Stock is not rated by CMBIS
OUTPERFORM : Industry expected to outperform the relevant broad market benchmark over next 12 months MARKET-PERFORM : Industry expected to perform in-line with the relevant broad market benchmark over next 12 months
UNDERPERFORM : Industry expected to underperform the relevant broad market benchmark over next 12 months
CMB International Securities Limited Address: 45/F, Champion Tower, 3 Garden Road, Hong Kong, Tel: (852) 3900 0888 Fax: (852) 3900 0800
CMB International Securities Limited (“CMBIS”) is a wholly owned subsidiary of CMB International Capital Corporation Limited (a wholly owned subsidiary of China Merchants Bank)
Important Disclosures There are risks involved in transacting in any securities. The information contained in this report may not be suitable for the purposes of all investors. CMBIS does not provide individually tailored investment advice. This report has been prepared without regard to the individual investment objectives,
financial position or special requirements. Past performance has no indication of future performance, and actual events may differ materially from that which is contained in the report. The value of, and returns from, any investments are uncertain and are not guaranteed and may fluctuate as a result of their dependence on the performance of underlying assets or other variable market factors. CMBIS recommends that i nvestors should
independently evaluate particular investments and strategies, and encourages investors to consult with a professional financial advisor in order to make their own investment decisions. This report or any information contained herein, have been prepared by the CMBIS, solely for the purpose of supplying information to the clients of
CMBIS or its affiliate(s) to whom it is distributed. This report is not and should not be construed as an offer or solicitat ion to buy or sell any security or any interest in securities or enter into any transaction. Neither CMBIS nor any of its affiliates, shareholders, agents, consultants, directors, officers or employees shall be liable for any loss, damage or expense whatsoever, whether direct or consequential, incurred in relying on the information
contained in this report. Anyone making use of the information contained in this report does so entirely at their own risk. The information and contents contained in this report are based on the analyses and interpretations of information believed to be publicly available and reliable. CMBIS has exerted every effort in its capacity to ensure, but not to guarantee, their accuracy, completeness, t imeliness or correctness.
CMBIS provides the information, advices and forecasts on an "AS IS" basis. The information and contents are subject to change without notice. CMBIS may issue other publications having information and/ or conclusions different from this report. These publications ref lect different assumption, point-of-view and analytical methods when compiling. CMBIS may make investment decisions or take proprietary positions that are inconsistent
with the recommendations or views in this report. CMBIS may have a position, make markets or act as principal or engage in transactions in securities of companies referred to in this report for itself and/or on behalf of its clients from time to time. Investors should assume that CMBIS does or seeks to have investment banking or other business
relationships with the companies in this report. As a result, recipients should be aware that CMBIS may have a conflict of interest that could affect the objectivity of this report and CMBIS will not assume any responsibility in respect thereof. This report is for the use of intended recipients only and this publication, may not be reproduced, reprinted, sold, redistributed or published in whole or in part for any purpose without prior written
consent of CMBIS. Additional information on recommended securities is available upon request.
For recipients of this document in the United Kingdom This report has been provided only to persons (I)falling within Article 19(5) of the Financial Services and Markets Act 2000 (Financial Promotion) Order 2005 (as amended from time to time)(“The Order”) or (II) are persons falling within Article 49(2) (a) to (d) (“High Net Worth Companies,
Unincorporated Associations, etc.,) of the Order, and may not be provided to any other person without the prior written consent of CMBIS. This report is intended for distribution in the United States to "major US institutional investors", as defined in Rule 15a-6 under the US, Securities
Exchange Act of 1934, and may not be furnished to any other person in the United States. Each major US institutional investor that receives a copy of this research report by its acceptance hereof represents and agrees that it shall not distribute or provide this research report to any other person.
For recipients of this document in Singapore This report is distributed in Singapore by CMBI (Singapore) Pte. Limited (CMBISG) (Company Regn. No. 201731928D), an Exempt Financial Adviser as defined in the Financial Advisers Act (Cap. 110) of Singapore and regulated by the Monetary Authority of Singapore. CMBISG may distribute
reports produced by its respective foreign entities, affiliates or other foreign research houses pursuant to an arrangement under Regulation 32C of the Financial Advisers Regulations. Where the report is distributed in Singapore to a person who is not an Accredited Investor, Expert Investor or an Institutional Investor, as defined in the Securities and Futures Act (Cap. 289) of Singapore, CMBISG accepts legal responsibility for the contents
of the report to such persons only to the extent required by law. Singapore recipients should contact CMBISG at +65 6350 4400 for matters arising from, or in connection with the report.

![Ch 6 Trusses[1]](https://static.fdokumen.com/doc/165x107/631285ddb033aaa8b20fad21/ch-6-trusses1.jpg)