Microporosity linked fluid focusing and monazite instability in greenschist facies...
20
(This is a sample cover image for this issue. The actual cover is not yet available at this time.) This article appeared in a journal published by Elsevier. The attached copy is furnished to the author for internal non-commercial research and education use, including for instruction at the authors institution and sharing with colleagues. Other uses, including reproduction and distribution, or selling or licensing copies, or posting to personal, institutional or third party websites are prohibited. In most cases authors are permitted to post their version of the article (e.g. in Word or Tex form) to their personal website or institutional repository. Authors requiring further information regarding Elsevier’s archiving and manuscript policies are encouraged to visit: http://www.elsevier.com/copyright
Transcript of Microporosity linked fluid focusing and monazite instability in greenschist facies...

(This is a sample cover image for this issue. The actual cover is not yet available at this time.)
This article appeared in a journal published by Elsevier. The attachedcopy is furnished to the author for internal non-commercial researchand education use, including for instruction at the authors institution
and sharing with colleagues.
Other uses, including reproduction and distribution, or selling orlicensing copies, or posting to personal, institutional or third party
websites are prohibited.
In most cases authors are permitted to post their version of thearticle (e.g. in Word or Tex form) to their personal website orinstitutional repository. Authors requiring further information
regarding Elsevier’s archiving and manuscript policies areencouraged to visit:
http://www.elsevier.com/copyright

Author's personal copy
Microporosity linked fluid focusing and monazite instabilityin greenschist facies para-conglomerates, western India
S. Rekha a,⇑, A. Bhattacharya a, T.A. Viswanath b
a Department of Geology and Geophysics, Indian Institute of Technology, Kharagpur 721302, Indiab Department of Earth Sciences, Goa University, Taleigao Plateau, Goa 403206, India
Received 20 February 2012; accepted in revised form 29 November 2012; Available online 14 December 2012
Abstract
In a deformed para-conglomerate (western India), monazites occur as discrete grains (50–250 lm long axis) in tonaliteclasts, in the warping chlorite–biotite–calcite schist layers, and as disseminated grains (<5 lm) along with xenotime and hut-tonite forming veins in schist layers. The veins are absent in clasts. Chlorite and biotite defining schistosity in schist layers andin synchronously-formed extensional veins/fractures in clasts are chemically identical. d18O (VSMOW) and d13C (VPDB) incalcite in schistosity, in clasts, and in “beards” in pressure shadow zones around clasts are tightly bracketed, 11.4–12.2& and –3.1 to –3.6& respectively.
Margins of clast-hosted monazites are partly altered to fluorapatite – huttonite ± allanite ± Y-xenotime. By contrast,monazite alteration in schist layers is extensive. In schist layers, rafts of embayed monazite occur in fluorapatite-dominatedcorona studded with idiomorphic huttonite, Y-xenotime ± allanite. Mass balance calculation in a well-defined alteration zonearound monazite in schist layer with P conserved indicate large gain in mass fraction of lower-abundance, less soluble HREEs,Y and Th in the alteration zone was compensated by minor loss in mass fraction of higher abundance elements (LREEs,MREEs) resulting in negligible net mass change. Monazite decomposition was associated with �50% dilation strain. Yb,Th and U abundances in alteration zones around decomposed monazites in schist layer are computed to be manifold higherthan average schists.
The contemporaneous formation of pore microstructures, the chemical homogeneity among ferromagnesian minerals andC–O isotope data in calcite in different textural domains, and results of mass balance calculations are compatible with defor-mation-aided porosity generation, synchronous fluid-mediated advection transport of elements, and dissolution–re-precipita-tion of mica–calcite aggregates at upper crustal conditions, �500 �C, �4 kbar. Monazite instability was induced by strain-focused influx of HREE, Y, Th and U rich fluids from external sources. The better preservation of within-clast monazite rel-ative to the ones in weak-to-shear schist layers is attributed to limited fluid access through fewer porosity networks in activelydeforming clasts.� 2012 Elsevier Ltd. All rights reserved.
1. INTRODUCTION
Monazites [(LREE, Th, U, Pb, Y)PO4] are extensivelyused for U–Pb–Th dating of geologic events (Suzuki andAdachi, 1991; Montel et al., 1996; Suzuki and Kato,2008), and is a key accessory phase for dating of low-T
metamorphic/metasomatic events often undetected by morerobust chronologic methods (Rasmussen et al., 2001;Rasmussen and Muhling, 2007; Janots et al., 2009). Also,monazites (like xenotime) can accommodate large quanti-ties of U, Th and Pb, and therefore, qualify as naturalrepositories for sequestering radioactive nuclear waste(Poitrasson et al., 1996, 2000).
Intra-crystalline element diffusion in monazites is extre-mely sluggish at T < 650 �C (Copeland et al., 1988; Parrish,1990; Mezger et al., 1991; Spear and Parrish, 1996; Dahl,
0016-7037/$ - see front matter � 2012 Elsevier Ltd. All rights reserved.
http://dx.doi.org/10.1016/j.gca.2012.11.044
⇑ Corresponding author.E-mail address: [email protected] (S. Rekha).
www.elsevier.com/locate/gca
Available online at www.sciencedirect.com
Geochimica et Cosmochimica Acta 105 (2013) 187–205

Author's personal copy
1997; Smith and Giletti, 1997; Cocherie et al., 1998; Cherniaket al., 2004). At lower temperature corresponding to greenschistand lower amphibolite facies conditions, monazites grow,decompose and modify their composition by fluid-mediateddissolution–precipitation (Poitrasson et al., 2000; Townsendet al., 2000; Cabella et al., 2001; Rasmussen et al., 2005; Ras-mussen and Muhling, 2007; Budzyn et al., 2010; Janots et al.,2011) and hydrothermal alteration (Rasmussen et al., 2006;Kempe et al., 2008). Hydrothermal studies (600–900 �C, 5–10 kbar) demonstrate fluid composition strongly influencesmonazite stability (Harlov and Hetherington, 2010; Hethering-ton et al., 2010). Therefore, monazite–fluid interaction at low-T(Poitrasson et al., 2000; Rasmussen et al., 2006; Harlov et al.,2008; Harlov and Hetherington, 2010; Hetherington et al.,2010) is crucial for understanding the significance of mona-zite chemical age determinations, as well as the efficiency ofmonazite in sequestering nuclear waste.
In natural rocks, porosity networks and fluid access aresignificant issues that aid in understanding fluid-inducedchemical changes (Brace and Kohlstedt, 1980; Wordenet al., 1990; Finch, 1991; Geraud et al., 1995; Ague, 2011).Strain facilitates porosity generation (Ramsay, 1980) andthereby assists fluid-mediated element transfer via dissolu-tion from zones of high strain to precipitation in low-straindomains along permeable porosity networks (Wordenet al., 1990; Finch, 1991; Ague, 1994, 2011). Since fluid chem-istry is acquired through interaction with mineral ensemblefluids permeate, the source and pathways of migrating fluidmay influence monazite growth and decomposition. In thisstudy, we examine the interplay of strain localization, poros-ity generation, fluid availability and element mobility duringmonazite decomposition. For the purpose, we documentvariably-decomposed monazites in deformed felsic clasts
and in the warping schistosity dominated by chlorite, biotite,quartz and calcite in shear zone-hosted greenschist faciesmeta-greywacke from western India. Combining results ofelectron probe microanalysis, stable isotope analyses, micro-structural relations,and mass balance calculations we demonstrate fluid avail-ability rather than fluid composition influenced monazitedecomposition.
2. GEOLOGICAL BACKGROUND
Greenschist facies para-schists/phyllites inter-layeredwith deformed metamafic and ultramafic rocks in andaround Goa located along the western coast of India(Fig. 1a) is grouped with the Meso/Neo-archean rocks ofthe Western Dharwar Craton (Desai, 2011; and referencestherein). A distinctive suite of deformed polymict and quartzconglomerate horizon (Figs. 1a and b) separates the Neo-archean Goa metasediments from the older Mesoarcheanschists and gneisses to the east and south (Rekha et al.,2012). The Goa metasediments have undergone multipledeformation events of which the second deformation pro-duced the penetrative crenulation cleavage in the rocks (Re-kha et al., 2012). Subsequent deformations produced NW-trending open upright folds and ENE-trending cross folds,but fabrics associated with these deformations are eitherlacking or weakly-developed throughout the area (Rekhaet al., 2012).
3. DEFORMATION MICROSTRUCTURE
The deformed para-conglomerate (Figs. 1b, c and 2)investigated in this study comprises elliptical clasts (long
Fig. 1. (a) Geological map around Panaji (Goa) showing the disposition of lithologic units simplified from geologic map for the State of Goapublished by the Geological Survey of India (1996). Inset map shows the location of Panaji within India. Location of the sample (ZEN-31Cx)investigated in this study is indicated. (b) Field photograph and (c) close up view of the ZEN-31Cx shown.
188 S. Rekha et al. / Geochimica et Cosmochimica Acta 105 (2013) 187–205

Author's personal copy
dimension measuring up to 7 cm) of tonalite (dominant)and minor biotite–quartz schists warped by shape preferredaggregates of chlorite >> biotite, quartz, calcite, pyrite andrare muscovite defining the schist layers. The tonalite clastscomprise medium-sized weakly-strained plagioclase andmodally subordinate K-feldspar grains; recrystallizedquartz grains show high degree of internal stain (undula-tory extinction, sub-grains, and deformation lamellae) andshare un-equilibrated phase boundaries (serrated to plu-mose) with feldspars. Pressure shadow zones around thecompetent clasts comprise inter-layered aggregates of cal-cite and quartz “beards” that thin out and eventually disap-pear within the main mass of enveloping chlorite–biotitedominated schist layers (Fig. 3a). The clasts are traversedby three types of planar fabrics neighboring and nucleatingfrom the enveloping schist layers. The most prominentamong these are a set of close-spaced fabric along clastmargin. The fabric comprising shape-preferred and fine-grained chlorite >> biotite aggregates are parallel to thewarping schistosity (Figs. 3b and 4). In these zones,coarse-grained aggregates of polygonized plagioclase,quartz and K-feldspar in the clast margins show drasticgrain size reduction due to dynamic re-crystallization inquartz and dominantly brittle fracturing in feldspars(Figs. 3b and 4) that also possess weak strain wavy extinc-tion. The fabric dies out inwards within clasts (Figs. 3b and4). The clast interiors are traversed by veins oriented at highangle to the warping schistosity (Figs. 3c–e and 4). The veintips at either end curve parallel to the clast margins. Theveins do not cross cut the warping foliation in the schistoselayer, and instead veins nucleate from the schist layers andextend into clasts. The veins dominated by chlorite, withmodally subordinate biotite and calcite (Fig. 4), are nearorthogonal to the line joining the slightly asymmetric strainshadow zones around clasts (Fig. 4). The veins do not off-set the schistosity prominent along clast margin (cf.Brimhall, 1977). At the clast margin, the mica aggregates
in veins are oriented near-orthogonal to fractures andsub-parallel to the warping foliation (Figs. 3d–e and 4); in-wards in clasts, however, the mica aggregates are randomlyoriented (Figs. 3e and 4) The third type of fabric is a set ofmicro-shears filled with calcite–quartz aggregates. The longdimensions of calcite and quartz in veins are oriented par-allel to the warping schistosity (Fig. 3c). The fabrics apart,patchy chlorite, muscovite and calcite occur frequentlyalong quartz–feldspar phase boundaries and feldspar grainboundaries. Chlorite compositions lie between clinochloreand daphnite end members. XFe in chlorite [0.48–0.53]and in biotite [0.53–0.56] in fractures, shears and disjunctivecleavage within clasts are identical to those in the envelop-ing schist layer, e.g. [0.48–0.51] in chlorite (Fig. 5a) and[0.52–0.56] in biotite (Fig. 5b).
The area fraction of chlorite, biotite and calcite in veinswithin clast obtained from BSE image in Fig. 4 varies be-tween 0.48 and 0.70, 0.13 and 0.21, and 0.17 and 0.34respectively. The mean area fraction (chlorite:biotite:cal-cite = 0.57:0.18:0.25) were multiplied successively by (i)the densities of Mg-Fe chlorite (2.95 g/cm3) and Mg-Fe bio-tite (3.0 g/cm3) corrected for XFe values (Figs. 5a and b)and by the density of calcite (2.71 g/cm3) respectively, andthen with (ii) the mean compositions of the three mineralsthat make up veins. The values were added to obtain meancompositions of within-clast veins per unit area (Fig. 5c).Similarly the composition of the clast per unit area(Fig. 5c) was obtained from the mean plagioclase: quartzarea fraction (0.8:0.2) in the clast (ignoring minor K-feld-spar). The results are compared in Fig. 5c. The Al contentin the clast and in the vein is determined to be identical,consistent with the low solubility of Al at low P–T condi-tions (Burnham et al., 1973; Walther, 1997; Tropper andManning, 2007). By contrast, relative to clasts, veins arehighly enriched in TiO2, MgO and CaO (by 102–103 times),and moderately enriched in FeO, MnO and K2O (101–102
times), whereas SiO2 and Na2O are depleted.
Fig. 2. Back scattered electron (BSE) image (left) and sketch (right) of extra large thin section of ZEN-31Cx. Light shaded layers/veins anddarker-shaded ellipsoidal domains in the BSE image correspond to the schistosity and clasts respectively. Pyrite crystals appear as brightspots. Monazites (circled) are indicated and numbered in the BSE image. Note wispy chlorite–biotite veins and fractures in clasts areexaggerated and serve as visual aid in sketch. Mineral abbreviations are from Kretz (1983), unless specified otherwise.
S. Rekha et al. / Geochimica et Cosmochimica Acta 105 (2013) 187–205 189

Author's personal copy
The standard state molar volumes of clinochlore anddaphnite components in chlorite are 210.90 cm3 mol�1
and 213.40 cm3 mol�1 respectively (Holland and Powell,1998). Corrected for mean XFe
Chl � 0.50 (Fig. 5a) in the
Fig. 3. BSE images (a, d–h) and plane polarized light optical images (b, c) showing deformation microstructures in ZEN-31Cx. (a) Inter-banded calcite and quartz “beards” flanked by warping micaceous layers in strain shadow zone of tonalite clast (top in Fig. 2). (b) Clastmargin (arrow) dissected by warping schistosity; the schistosity along margin decays towards the clast interior. Note (i) augen of fragments ofclast within the schist layer (arrow), and (ii) shear fractures (arrow with bar) nucleating from schist layer. (c) Calcite–quartz filled micro-shearhighly oblique to the warping schistosity. Note long dimension of calcite and quartz in the vein and associated mica are parallel to theschistosity. (d) Trans-granular fracture within clasts nucleating from and at high angle to the warping schistosity (right side of image). Notemica flakes protrude (circled) into plagioclase (dark). Biotite–chlorite aggregates in the fracture are orthogonal to the fracture walls andaligned parallel to the warping schistosity. The biotite–chlorite aggregates in more interior part of the clast are weakly aligned. (e) Chlorite–biotite aggregates in variably oriented trans-granular fractures in clasts have the same orientation, e.g. parallel to the warping schistosity(bottom right). Note mica flakes protrude (circled) into plagioclase (dark). (f) Monazite (Mnz)-xenotime (Xe) veins in chlorite–biotite–calcite–quartz schist layers. The vein for most part is parallel to the foliation or else follows phase boundaries. (g) Aggregates of Y-xenotime (bright)forming monomineralic veins in schist layer occur along quartz–mica phase boundaries and along healed micro-fracture/sub-grain boundaryin quartz lenticle within mica. (h) Bi-mineralic aggregates of Y-xenotime and huttonite (Ht) in schist layer.
190 S. Rekha et al. / Geochimica et Cosmochimica Acta 105 (2013) 187–205

Author's personal copy
sample, the molar volume for chlorite is calculated to be212.15 cm3 mol�1. Similarly using the molar volumes forphlogopite (149.64 cm3 mol�1) and annite (154.32 cm3 -mol�1) end members in biotite (Holland and Powell,1998), the molar volume of biotite in the sample (XFe
Bt -� 0.55; Fig. 5b) is computed to be 152.21 cm3 mol�1. Themolar volume of calcite is 36.89 cm3 mol�1 (Holland andPowell, 1998). Converting the mean mass fraction of chlo-rite:biotite:calcite (0.58:0.18:0.23) in vein into molar ratiosand multiplying by the respective molar volumes, the vol-ume of the three minerals is computed to be 94.02 cm3
per unit area per mole of vein (Table 1). By contrast thestandard state molar volumes of albite and quartz are100.06 cm3 mol�1 and 22.69 cm3 mol�1 respectively (Hol-land and Powell, 1998). The aggregates of plagioclase–quartz (area proportion 0.8:0.2) in the clast yield59.31 cm3 for unit area per mole (Table 1). The calculationssuggest feldspar dissolution and precipitation of mica andcalcite in veins was associated with volume expansion(59%), assuming no strain (Brimhall and Dietrich, 1987).
Monazite occurs within clasts and in the schistose layers(Fig. 2). Monazites (max length: 50–250 lm) in clasts areround to elliptical in shape; margins of these intra-clastmonazites are replaced by fluorapatite, minor huttonite,and rare allanite (Figs. 6a–c). Small grains of chlorite andcalcite occur in and adjacent to the replacement zone. Inthe schist layers, the outline of monazite and monazitedecomposition zone taken together is elongate in shapeand parallel to fabric defining mica aggregates (Figs. 6d–g).
Chlorite and calcite are ubiquitous accessory phases in themonazite alteration zone. In the schist layers, monazitesare almost wholly replaced by polymineralic aggregatesdominated by fluorapatite studded with Y-xenotime, hutton-ite, and rare allanite. Interfaces between monazite alterationzones and mineral aggregates in schist layers are somewhatblurred or diffuse (Figs. 6d and e), unlike clast-hosted mona-zite alteration zones having well-defined boundaries (Figs. 6aand c). Monazite also occurs as small (diameter <5 lm) euhe-dral grains along with xenotime in veins in schist layers(Figs. 3f and g). The monazite–xenotime veins lead up tothe monazite alteration zone (Fig. 3f). Also common in schistlayers are xenotime–huttonite veins (Fig. 3h). Both xenotimeand huttonite occur along sub-grain margins in stretchedquartz grains in chlorite–biotite aggregates and alongquartz–mica phase boundaries (Fig. 3f and g). The veinsare absent within clasts (Figs. 2 and 4). Monazites withinclasts, but adjacent to chlorite–biotite–calcite veins/fracturesand neighboring calcite–quartz “beards” (Figs. 6h–j) are al-tered more compared to the clast-hosted monazites distalfrom fractures/shears/beards (Figs. 6a–c).
4. RESULTS
4.1. Analytical details
Spot analyses of minerals were done using CAMECASX-100 electron microprobe (EMP) analyzer in the Depart-ment of Geology and Geophysics, Indian Institute of Tech-nology, Kharagpur (India). The JEOL JSM 6490 ScanningElectron Microscope in the department was used forobtaining back scattered electron (BSE) images.
Major elements in silicate phases (chlorite, biotite,muscovite and feldspars) were analyzed with beam currentregulated at 15 nA, and the acceleration voltage at 15 kV.The dwell time was set at 10 s at the peak, and at 5 s atthe background. For F calibration with fluorapatite, thespot size was increased to 5 lm to minimize excitation offluorine. For monazite, xenotime, apatite, huttonite andallanite analyses the beam current was regulated at 50 nA,the acceleration voltage was 20 kV, and the raster lengthset to 15 lm. For F, Na and K, 5 lm spot was used to reducemigration/excitation. Longer counting time (40–100 s) wasemployed for Sr, Ba, Y, Th and REEs to improve detectionlimits. Among REEs, Ho has the highest detection limit(2189 ppm), close to Ho abundances in monazites, but muchless compared to other phases. Th has the highest detectionlimit (2242 ppm) among all elements. ZAF matrix correc-tions were made based on the factory supplied PAPSILprogram. On-line corrections for peak interferences includePbMa on YLc2 and YLc3, GdLb on HoLa, DyLa onMnKb, UMb on ThMc and ThM3N4 and BaLa on TiKa.Off-line corrections employed for element interferences are2.199 wt.% La and 3.55 wt.% Pr on 60.22 wt.% Ti, 28.64wt.% Y on 41.66 wt.% Fe, 1.32 wt.% U on 11.64 wt.% K.Details of electron probe microanalyzer settings and acqui-sition information are listed in Table 2. A total of 135 spotswere analyzed for REE bearing minerals (including 56 spotsin monazite), and 174 point analyses were done on silicateminerals, carbonates and ilmenite.
Fig. 4. Enlarged view (BSE image) of clast (bottom-right in Fig. 2)showing contemporaneous microstructures, e.g. strain shadowzone, warping foliation in clast margin (absent in clast interior),and chlorite–biotite–calcite filled extensional fractures in clastinterior (weakly-developed in clast margin). Note patchy occur-rence of calcite. Bright spots are pyrite. Also shown are thelocations of altered monazite grains within the clast. Sketch (top-right) shows relationship between orientations of instantaneousstrain axes (long arrows) and deformation micro-fabrics. Shortarrows show extensional fractures.
S. Rekha et al. / Geochimica et Cosmochimica Acta 105 (2013) 187–205 191

Author's personal copy
4.2. Chemistry of REE-rich minerals
Monazite compositions straddle the 2REE/Y3+M
Th4+ + Ca2+ brabantite/cheralite substitution join, andplot close to the monazite composition (La, Ce, Th)PO4
(Fig. 7). In Th + Si vs. RREE + Y + P plots, clast-hostedmonazite compositions are clustered at low Th + Si andhigh RREE + Y + P values; but compositions of monazitesin veins and schist overlap to a large extent and contain var-iable and high abundances of Th + Si (Fig. 7). Chondrite-normalized (Anders and Grevesse, 1989) REE abundancesof monazites decrease systematically from 105.4 for La to102.5 for Yb (Figs. 8a–c). YCN abundances (104–102) inmonazites are comparable with YbCN, while Th abun-dances are high up to 105–106 times chondrite (Figs. 8a–c). The chondrite-normalized spectra for REE, Y and Thin clast-hosted monazites with partly decomposed margins,strongly embayed monazites in the schist layers, and inveins broadly overlap (Figs. 8a–c). However, relative toaverage vein monazites, mean abundances of monazites inclast and in the schist layers have comparable LREE andsomewhat lower MREE abundances; relative to the veinmonazites, monazites in clasts and schist layers are enrichedin HREE, Y, Th and U by factors of 2–10 (Fig. 8d). In indi-vidual monazite grains, the core to rim abundances ofREEs (barring Ho), Th, Y and U vary within factors of1–6 (Figs. 9a–c).
Allanite is 10 times poorer in LREE abundances com-pared to monazite (Figs. 8a–c). Huttonite and Y-xenotime
Fig. 5. Comparative histogram showing XFe [=Fe/Fe + Mg] variations among chlorite (a) and biotite (b) in veins/fractures within clasts, andin schist layers (Analytical details in Section 4.1). (c) Ratios of element oxide abundances (in wt.%) in chlorite–biotite–calcite veins in clastrelative to tonalite clast in Fig. 4 (see text for details). Mean area fraction of minerals (obtained from three independent measurements) inveins (Fig. 4) is shown. Chart alongside shows major element oxide (in wt.%) in veins and in the clast in Fig. 4. The sum for wt.% oxide in veinis <100 due to presence of structurally held H2O in mica and CO2 in calcite (not shown). See text for details.
Table 1Estimation of volume per unit area per mole of mica–calciteaggregates in clast-hosted vein, and of the clast having the samearea, shown in Fig. 4.
Areafraction
Molefraction
Volume/mole/area
Minerals in veinChlorite 0.57 0.26 54.20Biotite 0.18 0.11 16.31Calcite 0.25 0.64 23.51
Total 1.00 94.02
Minerals inclast
Plagioclase 0.80 0.47 47.36Quartz 0.20 0.53 11.95
Total 1.00 59.31
192 S. Rekha et al. / Geochimica et Cosmochimica Acta 105 (2013) 187–205
Author's personal copy
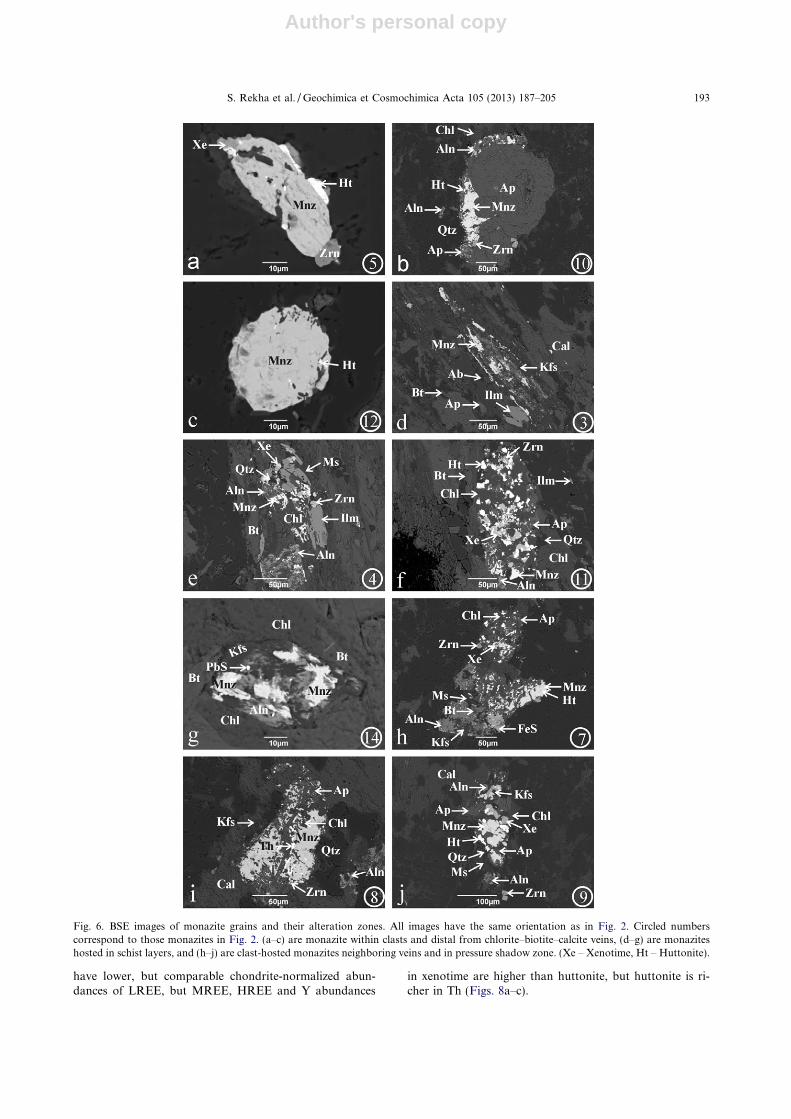
have lower, but comparable chondrite-normalized abun-dances of LREE, but MREE, HREE and Y abundances
in xenotime are higher than huttonite, but huttonite is ri-cher in Th (Figs. 8a–c).
Fig. 6. BSE images of monazite grains and their alteration zones. All images have the same orientation as in Fig. 2. Circled numberscorrespond to those monazites in Fig. 2. (a–c) are monazite within clasts and distal from chlorite–biotite–calcite veins, (d–g) are monaziteshosted in schist layers, and (h–j) are clast-hosted monazites neighboring veins and in pressure shadow zone. (Xe – Xenotime, Ht – Huttonite).
S. Rekha et al. / Geochimica et Cosmochimica Acta 105 (2013) 187–205 193

Author's personal copy
4.3. Composition of the monazite alteration zone
Compositions of monazite and REE-bearing minerals inthe alteration zone around monazite grain 11 (Figs. 6f and10) within schist layers are presented in Table 3. To estimatethe composition of monazite decomposition zone, weadopted the methodology of Finger et al. (1998). First, thearea percentages (Table 4a) of the different minerals in thealteration zone were determined using high-resolution BSEimages, appropriately scaled, and properly sliced so that grayshades (of minerals) outside the alteration zone did not inter-fere with the gray shades of minerals in the alteration zone.The QWIN image processing software was used to determinethe area proportion of minerals. The software identifies dif-ferent gray shades (pixels 1–256) characteristic of differentmineral phases, and enables estimation of area percentageof minerals corresponding to different pixel range. Grainand phase boundary abnormality, and irregularities fromthin section preparation, generate ambiguous gray shades.The area percentage of these ambiguous shades howeverare easily identified (and recorded) by colorations restrictedto grain/phase boundaries or isolated spot within a mineralphase, rather than the mineral interior. Second, the area per-centage (assumed to equal the volume percentage) of theminerals excluding monazite, were converted to weight frac-tion using densities of respective minerals (Table 4a) and sub-sequently multiplied by the mean compositions of individualminerals to obtain the element composition of the monazitedecomposition zone (Table 4b). Finally the non-monazite
components like SiO2, CaO, FeO, MgO, MnO, Al2O3,TiO2, Na2O and K2O were removed, and the remaining ele-ments was re-calculated to 100 to estimate the non-monaziteelement composition of the monazite decomposition zone(Table 4b) (cf. Finger et al., 1998).
The more difficult part of the exercise was to choose a suit-able corona having (a) reasonably large area to enable accu-rate measurement, (b) sharply-defined boundary distinctfrom the surrounding mineral mosaic and unconnected tomonazite ± xenotime veins, and (c) minerals with relativelycoarse size so that these could be easily distinguished fromgrain/phase boundary irregularities. Also monazites in con-tact with large apatite grains are particularly un-suitable be-cause identification of the boundary separating newly grownapatite (from monazite decomposition) from pre-existingapatite is impossible. The clast-hosted monazites do not meetthe requirements because of the small area of decomposition,and the presence of large apatite grains. Prism-shaped coro-nas around monazites in the schist layers typically have ill-defined external boundaries, blurred margins between smallminerals, and often contain apatite. Alteration zone aroundmonazite grain 11 (Fig. 10) in the schist layers was found tobe best suited for the exercise because of the well-definedexternal margin, coarse sizes of grains with well-definedboundaries, and lack of pre-existing apatite.
The P2O5 contents in the corona (33.2 wt.%) and in thedecomposition zone (31.2 wt.%) are close (Table 4b). Butrelative to relict monazite, the decomposition zone is char-acterized by lower LREE and MREE (La2O3 to Gd2O3)
Table 2Electron probe microanalyzer settings and acquisition information for analyses of monazite, allanite, apatite, xenotime and huttonite.
Element Line Crystal Pk time (s) Bg Off1 Bg Off2 Bg. time (s) Bias (V) Detection limit (ppm)
F K a1 TAP 10 �800 800 5 1295 377Na K a1 TAP 10 600 5 1295 315Mg K a1 TAP 10 1200 5 1295 183Al K a1 TAP 10 600 5 1295 230Si K a1 TAP 10 600 5 1295 214P K a1 LPET 10 500 5 1871 313Cl K a1 PET 20 500 10 1295 440K K a1 PET 20 500 10 1291 176Ca K a1 PET 20 �500 500 10 1295 195Ti K a1 PET 20 500 10 1295 324Mn K a1 LIF 10 500 5 1291 863Fe K a1 LIF 10 500 5 1291 1152Sr L a1 PET 60 �1000 1000 30 1295 350Y L a1 TAP 100 600 50 1295 230Ba L a1 LPET 60 500 30 1871 222La L a1 LPET 40 500 20 1871 234Ce L a1 LPET 40 500 20 1871 246Pr L b1 LIF 40 6230 20 1291 1308Nd L b1 LIF 40 1700 20 1291 1583Sm L a1 LIF 40 500 20 1291 922Gd L b1 LIF 40 2000 20 1291 1730Dy L a1 LIF 40 400 20 1291 1049Ho L b1 LIF 40 1170 20 1291 2189Er L a1 LIF 60 �400 500 30 1291 676Yb L a1 LIF 60 �550 550 30 1291 753Pb M a1 LPET 60 �1000 2000 30 1871 506Th M a1 PET 20 600 10 1295 2242U M b1 PET 20 �996 774 10 1295 1475
194 S. Rekha et al. / Geochimica et Cosmochimica Acta 105 (2013) 187–205

Author's personal copy
and higher contents of HREE, Y2O3, ThO2 and UO2 con-tents (Table 4b). Chondrite-normalized plots (Fig. 11) showLREE and MREE abundances of corona are bracketed bymonazite-allanite (higher abundance), and huttonite, xeno-time and apatite. HREE and Y concentrations in corona liebetween xenotime (higher abundance) and monazite, alla-nite, huttonite and apatite. But Th and U abundances arecomparable with those in huttonite. The results obtainedin the study are different from those obtained by Fingeret al. (1998) for amphibolite facies apatite–allanite–epidotecoronas around monazite in the amphibolite facies gneissesof the Granatspitz massif of the Tauern Window, EasternAlps. Finger et al. (1998) estimated element abundancesin monazite and in the alteration zone were closelymatched.
4.4. Mass balance calculations
Several studies highlight element complexes released bymonazite breakdown to be relatively immobile and remainwithin the boundaries of the decomposed monazite (Fingeret al., 1998; Grapes et al., 2005). Other studies (Poitrassonet al., 2000; Kim et al., 2009) explicitly or implicitly advocatemonazite decomposition to be open system phenomenon. In
this section, we attempt to address the problem of open ver-sus closed system behavior of elements during monazitedecomposition. Following Ague (1994) and Bucholz andAgue (2010; equation 1) the net mass change for monazitedecomposition was calculated from the relation
T mass;i ¼ C0i =C0i
� �� 1
� �ð1Þ
Tmass,i is the net mass change (in fraction) using a referencespecies “i” (P2O5 in the present case). C0
i and C0i are the con-centrations of “i” in the precursor (relict monazite) and thealtered rock (monazite decomposition zone). Tmass,i wascalculated to be 0.06 for the corona. Using this value thefractional mass change (sj
i ) of other element oxides “j” werecalculated using equation 2 of Bucholz and Ague (2010)
sji ¼ C0
i =C0i� �
= C0j=C0j
� �� 1
h ið2Þ
C0j and C0j are the concentrations of species “j” in the altered
and the precursor rock. The results of mass balance calcu-lations are depicted in Fig. 12a and b.
The fraction of net mass gain with P conserved in themonazite alteration zone obtained from mass balance calcu-lations (Table 4b, Fig. 12a) is negligible considering uncer-tainties in computing area fractions and adopted density ofminerals. Relative to monazite, the small loss in mass frac-tion of high abundance LREEs and MREEs (La to Gd) inthe alteration zone was compensated by large gain in massfractions of low-abundances of Yb2O3 (2200%), Y2O3
(4250%), ThO2 (1500%) and UO2 (9194%) (Fig. 12b). Appar-ently, elements with smaller ionic radius were enriched in themonazite decomposition zone relative to the LREEs andMREEs with larger ionic radius (Fig. 12b). By implicationcrystal-chemical consideration is likely to have influencedmass fraction changes in the monazite alteration zone.
Brimhall and Dietrich (1987) related concentration (C)to density (q) and strain (e) during mineralogical alterationby the equation
Ci;w
Ci;p
¼ 1
ei;w þ 1
� qp
qw
� ð3Þ
‘i’ is an immobile element species. ‘w’ and ‘p’ stand forweathered product (equivalent to minerals other than mon-azite in the corona) and protolith (equivalent to monazite)respectively. The one-dimensional strain (e) normal to ver-tical flow as in residual enrichment during weathering is de-fined by Brimhall and Dietrich (1987) to be change in lengthby the original length, such that +e indicates dilation strain.The density of the corona (3.66 g/cm3; Table 4a) divided bydensity of monazite (5.15 g/cm3) is 1.41. The concentrationratio of the conserved element P (Table 4b) in monazite cor-ona (10,700 ppm) divided by monazite (10,500 ppm) ingrain-11 is 1.02. The density and concentration ratios corre-spond to e � 0.50 (Fig. 13). By implication, monazite alter-ation was associated with dilational strain consistent withfracture/porosity generation.
Due to difficulty in finding suitable alteration zonesaround monazites, mass fraction calculation could not beperformed for a larger set of coronae. To ascertain if the re-sult obtained from corona-11 (Figs. 12a and b) indicates atrend and not an anomaly, the area proportions of minerals
Fig. 7. (a) Th + Si vs. RREE + Y + P plot of monazites in schistlayers, within clasts, and in veins in schist layers. (b) Enlarged viewof the box in (a).
S. Rekha et al. / Geochimica et Cosmochimica Acta 105 (2013) 187–205 195

Author's personal copy
in the monazite alteration zones (xenotime, huttonite andallanite) that host the bulk of rare earth and actinide groupof elements were estimated for three additional coronae.The REE, Y, Th, U and Pb abundances obtained by mul-tiplying the area proportions of minerals with their averagecompositions are compared with those obtained from coro-na-11 re-calculated using the same method (Fig. 14). Thecomparable abundances of REEs, Y and actinide groupof elements seems to suggest the composition of grain-11alteration zone, barring minor variations, represents a com-mon trend, and not an aberration.
5. DISCUSSION
5.1. P–T of monazite alteration
Metamorphic P–T conditions for greenschist faciesrocks in the neighborhood of Goa are unknown. In ZEN-31Cx, temperatures were estimated using the Al-in-chloritethermometric formulations (Cathelineau, 1988; Jowett,1991), the Ti-in-biotite thermometer (Henry et al., 2005),and the plagioclase-muscovite thermometer proposed byGreen and Usdansky (1986). The Al-in-chlorite thermome-ters produced tightly constrained T values between 340 and
360 �C at P = 5 kbar for chlorite in schistose layers, in veinswithin clasts, and in monazite alteration zones. The plagio-clase–muscovite thermometer of Green and Usdansky(1986) yielded comparable T value, e.g. 390 �C atP = 5 kbar for closed pair analysis of muscovite and plagio-clase at the clast margin. By contrast, the empirical Ti-in-biotite thermometer yielded significantly higher tempera-ture, 640–650 �C (at P = 5 kbar) for biotite in the schistlayer and in veins hosted in clasts.
The Ti-in-biotite temperatures are higher than the exper-imentally-determined maximum stability of chlorite, e.g.530–550 �C for antigorite (Evans et al., 1976) and clinoch-lore + quartz assemblage (Chernosky, 1975, 1978; Flemingand Fawcett, 1976) at P � 5 kbar. The unrealistically highTi-in-biotite T values may be due to the absence of Al-sat-urating phase and graphite in equilibrium with chlorite inZEN-31Cx, a pre-requisite for precise application of thethermometer (Henry et al., 2005). Plagioclases at the clastmargin are typically fractured, but also show weak strainwavy extinction and locally preserve sub-grain rotationre-crystallization along margins. The textural relations indi-cate deformation occurred close to brittle-ductile transitionin plagioclase, e.g. 400–450 �C for deformation in dry andwet conditions (Simpson, 1985; Hirth and Tullis, 1992; Cole
Fig. 8. Chondrite normalized (Anders and Grevesse, 1989) plots of REEs, Y, Th and U of monazites and minerals in the monazite decompositionzones in (a) clasts and (b) schist layers. (c) Comparison of chondrite normalized abundances of REEs, Y, Th and U in monazites in clasts, schistlayers and veins. Detection limits of elements normalized to chondrite values for different elements are shown by short horizontal bars. (d)Average compositions of monazites in clast and in schist layers normalized to the average composition of vein monazite.
196 S. Rekha et al. / Geochimica et Cosmochimica Acta 105 (2013) 187–205

Author's personal copy
et al., 2007). All considered, the equilibrium temperaturefor deformation-metamorphism in ZEN-31Cx appear tolie in the range 450–500 �C bracketed by the thermometricestimates, the temperature for brittle-ductile deformation infeldspar, and the maximum stability of chlorite end-mem-ber components estimated experimentally.
Pressure was estimated using chlorite–biotite–musco-vite–K-feldspar–quartz assemblage based on the reaction
Mg5Al2Si3O10ðOHÞ8ðclinochloreÞ
þ 4KAlSi3O8ðK-feldsparÞ
¼ KMg3AlSi3O10ðOHÞ2ðphlogopiteÞ
þKAl5AlSi3O10ðOHÞ2ðmuscoviteÞ
þ 2KMgAlSi4O10ðOHÞ2ðceladoniteÞ
þ SiO2ðquartzÞ
ðR1Þ
The end-member thermodynamic data for the reactionand equation of state for the geobarometric formulationfor the assemblage (P in bar)
�3909:9
T ðKÞ þ 2:6173þ 0:1804PT ðKÞ ¼ log aMs þ log aPhl þ log aQtz
þ 2 log aCel � log aCln � 4 log aKfs ð4Þ
was obtained by the algebraic addition of the muscovite,clinochlore-absent reaction (reaction 1) and celadonite-ab-sent reaction (reaction 7) proposed by Bucher-Nurminen(1987) such that H2O is eliminated. The scheme for site
Fig. 9. Compositional variations in three monazite grains fromunaltered core to rim (grain numbers same as in Fig. 2) shown bydividing individual spot analyses (numbered) by the monazitecomposition of the innermost spot (not shown) in each grain.
Fig. 10. (a) BSE image showing mineralogical and textural settingof monazite grain 11 (refer Figs. 2 and 6f). (b) BSE image showingdetails of the monazite alteration zone of Grain 11.
S. Rekha et al. / Geochimica et Cosmochimica Acta 105 (2013) 187–205 197

Author's personal copy
Table 3Electron probe microanalytical data and structural formulae of monazite, xenotime and huttonite [all 4 (O, OH, F, Cl) basis], allanite and apatite [both 13 (O, OH, F, Cl) basis] in the alterationzone of monazite grain 11 (Fig. 10b).
Monazite Allanite Apatite Xenotime Huttonite
1 2 3 4 5 6 7 1 2 3 4 1 2 3 1 2 3 1 2 3
SiO2 1.01 0.80 0.36 0.40 1.27 1.00 4.23 30.51 30.74 30.66 31.49 0.14 0.11 0.70 0.45 1.30 0.45 19.38 19.81 19.13TiO2 0.03 0.04 0.03 0.01 0.02 0.00 0.02 0.26 0.27 0.39 0.35 0.00 0.00 0.04 0.00 0.00 0.00 0.02 0.00 0.05Al2O3 0.04 0.07 0.00 0.00 0.09 0.19 0.33 13.88 14.46 15.08 15.40 0.02 0.01 0.11 0.00 0.51 0.00 0.66 0.80 0.69FeO (T) 0.00 0.00 0.00 0.00 0.00 0.31 0.49 13.40 14.42 15.62 16.23 0.30 0.29 0.31 0.37 0.66 0.52 1.01 0.96 1.18MnO 0.00 0.00 0.00 0.00 0.00 0.00 0.00 0.06 0.10 0.18 0.16 0.04 0.01 0.00 0.00 0.00 0.00 0.00 0.00 0.00MgO 0.00 0.00 0.00 0.00 0.00 0.15 0.14 3.46 4.37 2.28 3.97 0.00 0.00 0.05 0.00 0.35 0.00 0.26 0.04 0.08CaO 0.73 0.37 0.14 0.14 1.77 3.91 0.74 5.86 6.08 8.07 7.43 54.42 52.80 55.65 0.11 0.35 0.07 1.72 1.69 1.72Na2O 0.00 0.00 0.00 0.00 0.00 0.00 0.00 0.14 0.12 0.15 0.10 0.02 0.03 0.00 0.01 0.02 0.02 0.00 0.00 0.01K2O 0.03 0.10 0.02 0.04 0.26 0.02 0.04 0.55 0.44 0.14 0.20 0.00 0.12 0.12 0.01 0.01 0.02 0.08 0.05 0.12P2O5 29.82 30.43 30.57 29.67 28.55 29.55 28.41 3.46 2.60 0.07 0.06 41.65 41.88 41.62 33.96 33.06 34.30 1.27 1.31 1.32SrO 0.05 0.03 0.05 0.01 0.04 0.17 0.33 0.20 0.18 0.29 0.24 0.14 0.16 0.12 0.00 0.02 0.00 0.00 0.00 0.00Y2O3 0.31 0.13 0.15 0.17 0.80 0.03 0.06 0.00 0.00 0.00 0.00 0.00 0.00 0.00 41.10 36.68 40.59 1.48 1.87 1.73BaO 0.09 0.07 0.10 0.04 0.02 0.02 0.04 0.07 0.04 0.05 0.05 0.00 0.00 0.00 0.00 0.00 0.00 0.00 0.00 0.00La2O3 14.99 13.95 13.93 12.75 13.75 12.89 11.88 5.57 4.45 4.44 4.20 0.09 0.08 0.00 0.02 0.93 0.04 0.09 0.11 0.13Ce2O3 29.60 29.54 29.64 29.05 27.46 27.01 26.56 12.08 9.38 10.06 9.35 0.11 0.14 0.00 0.06 1.87 0.11 0.27 0.23 0.26Pr2O3 3.06 3.32 3.41 3.56 2.90 3.14 3.11 1.33 1.19 1.13 0.93 0.09 0.14 0.19 0.14 0.40 0.26 0.29 0.30 0.17Nd2O3 11.85 14.19 14.62 15.24 11.31 13.09 12.93 4.92 4.28 3.93 3.73 0.12 0.11 0.00 0.22 0.83 0.19 0.34 0.37 0.46SmO 1.88 2.49 2.76 3.14 1.60 2.58 2.71 0.86 0.62 0.63 0.59 0.03 0.00 0.00 0.42 0.51 0.41 0.15 0.16 0.23Gd2O3 1.41 1.26 1.66 1.80 0.83 1.35 1.55 0.00 0.00 0.00 0.00 0.00 0.04 0.00 2.89 2.91 2.75 0.48 0.59 0.57Dy2O3 0.30 0.23 0.35 0.40 0.26 0.18 0.24 0.00 0.00 0.00 0.00 0.00 0.02 0.00 5.67 5.02 5.60 0.46 0.57 0.57Ho2O3 0.00 0.03 0.01 0.00 0.10 0.00 0.00 0.00 0.07 0.06 0.00 0.02 0.00 0.08 1.17 0.91 1.28 0.03 0.00 0.00Er2O3 0.00 0.00 0.00 0.00 0.03 0.00 0.00 0.00 0.00 0.00 0.00 0.00 0.01 0.02 4.17 3.67 3.97 0.18 0.26 0.15Yb2O3 0.03 0.00 0.06 0.07 0.03 0.04 0.00 0.04 0.00 0.04 0.01 0.00 0.00 0.04 2.73 2.41 2.82 0.02 0.09 0.11ThO2 4.62 0.93 1.18 0.82 4.47 1.31 1.23 0.39 0.24 0.13 0.07 0.05 0.00 0.01 1.22 1.41 1.15 57.71 58.57 56.66UO2 0.02 0.05 0.00 0.03 0.14 0.11 0.00 0.03 0.00 0.00 0.00 0.00 0.00 0.00 0.29 0.29 0.37 8.69 7.84 8.22PbO 0.75 0.13 0.14 0.11 0.56 0.07 0.11 0.03 0.05 0.05 0.03 0.04 0.00 0.00 0.00 1.45 0.00 1.22 1.51 1.17F 0.88 0.84 0.84 0.84 0.92 0.89 0.74 0.12 0.09 0.01 0.00 3.69 3.74 3.87 1.79 1.71 1.76 0.06 0.06 0.06Cl 0.03 0.03 0.05 0.02 0.02 0.03 0.05 0.04 0.10 0.05 0.06 0.03 0.01 0.02 0.00 0.03 0.01 0.03 0.00 0.04
Total 101.53 99.03 100.05 98.31 97.20 98.01 97.87 97.25 94.29 95.27 94.64 100.98 99.69 102.94 96.78 97.30 96.68 95.88 97.20 94.79O„F 0.37 0.35 0.35 0.36 0.39 0.37 0.31 0.05 0.04 0.00 0.00 1.55 1.57 1.63 0.75 0.72 0.74 0.02 0.03 0.03O„Cl 0.01 0.01 0.01 0.00 0.00 0.01 0.01 0.01 0.02 0.01 0.01 0.01 0.00 0.00 0.00 0.01 0.00 0.01 0.00 0.00H2O 0.00 0.00 0.00 0.00 0.00 0.00 0.00 1.49 1.48 1.49 1.53 0.01 0.00 0.00 0.00 0.00 0.00 0.00 0.00 0.00Total 101.15 98.67 99.68 97.95 96.81 97.63 97.55 98.73 95.72 96.74 96.16 99.44 98.11 101.31 96.02 96.57 95.93 95.85 97.17 94.76
Si 0.04 0.03 0.01 0.02 0.05 0.04 0.16 2.93 2.97 3.06 3.05 0.01 0.01 0.06 0.02 0.05 0.02 0.99 0.99 0.98Ti 0.00 0.00 0.00 0.00 0.00 0.00 0.00 0.02 0.02 0.03 0.03 0.00 0.00 0.00 0.00 0.00 0.00 0.00 0.00 0.00Al 0.00 0.00 0.00 0.00 0.00 0.01 0.01 1.57 1.64 1.77 1.76 0.00 0.00 0.01 0.00 0.02 0.00 0.04 0.05 0.04Fe 0.00 0.00 0.00 0.00 0.00 0.01 0.02 1.08 1.16 1.30 1.31 0.02 0.02 0.02 0.01 0.02 0.02 0.04 0.04 0.05Mn 0.00 0.00 0.00 0.00 0.00 0.00 0.00 0.00 0.01 0.02 0.01 0.00 0.00 0.00 0.00 0.00 0.00 0.00 0.00 0.00Mg 0.00 0.00 0.00 0.00 0.00 0.01 0.01 0.49 0.63 0.34 0.57 0.00 0.00 0.01 0.00 0.02 0.00 0.02 0.00 0.01Ca 0.03 0.02 0.01 0.01 0.08 0.16 0.03 0.60 0.63 0.86 0.77 4.94 4.84 4.97 0.00 0.01 0.00 0.09 0.09 0.09
198S
.R
ekh
aet
al./G
eoch
imica
etC
osm
och
imica
Acta
105(2013)
187–205

Author's personal copy
allocation of elements in micas was adopted from Hollandand Powell (1998). For clinochlore, Mg and Al were takento be disordered in M1 and M4 sites. Random on-site mix-ing model for the activity-composition relations wasadopted for muscovite (Ms; KAl2AlSi3O10(OH)2) and cela-donite (Cel; KMg AlSi4O10(OH)2 in muscovite, phlogopite(Phl: KMg3AlSi3O10(OH)2) in biotite, and clinochlore (Cln:Mg5Al2Si3O10(OH)8) in chlorite. Mixing in K-feldspar (Kfs:KAlSi3O8) was taken to be ideal. Using Eq. (4) and compo-sitions of biotite, chlorite and K-feldspar, the pressure valueat T = 500 �C for the assemblage was estimated to be4.2 kbar. The P–T conditions of 450–500 �C, 4.2 kbar issubstantially lower than the blocking T for inter-crystallinediffusion in monazite.
5.2. Microporosity linked mass transfer: evidence from
deformation microstructure
Chlorite–biotite–calcite veins within clasts orientedorthogonal to the stretching axes defined by the slightlyasymmetric pressure shadow zones in clast are extensionalfracture parallel to the instantaneous shortening axis ofthe strain ellipsoid (Fig. 4). Two features suggest the warp-ing foliation along clast margin, the calcite–quartz beards inthe pressure shadow zones, and the extensional fracturesare contemporaneous. First, the warping foliation and theextensional fracture hosted mica–calcite veins do not off-set each other (Figs. 3d, e and 4; cf. Brimhall, 1977). Sec-ond, in the clast margin, the mica aggregates in veins areoriented near-orthogonal to the fracture and parallel tothe stretching axis (Figs. 3d, e and 4). These features implythe two fabrics and the calcite–quartz pressure shadowzones formed concurrently in the same strain field. Theshear-hosted calcite–quartz veins (Fig. 3c) nucleating fromthe schist layer and oriented sub-parallel to the axes ofshortening direction with the long dimensions of calciteand quartz oriented parallel to the warping schistosity areinferred to be have formed concurrently (Fig. 3c).
The fracture-hosted sub-idioblastic chlorite > biotiteaggregates “piercing” into adjacent feldspar in vein wallsof tonalite clasts (Fig. 3d and e) suggests fluid-mediatedgrowth of mica by feldspar–quartz dissolution (Bucholzand Ague, 2010) contemporaneous with deformation. Thelarge chemical differences between clasts and mica–calciteveins (Fig. 5c), the large positive volume change associatedwith feldspar dissolution and precipitation of mica and cal-cite (Putnis, 2009), and the identical composition of micasin veins in clasts and in the schistose layers (Fig. 5a andb) point to existence of inter-connected porosity networks(Ferry and Dipple, 1991; Ague, 1994; Bucholz and Ague,2010) linking the within-clast veins with the warping schis-tose layers (Fig. 2) that facilitated advection transfer of ele-ment in the scale of thin section, and possibly in the rockscale. By analogy, quartz–calcite veins in tonalite clasts(Fig. 3c) and calcite–quartz “beards” in pressure shadowzones around clasts (Fig. 3a) are also examples of fluid-mediated mineral dissolution in high strain zone (normalto the shortening direction), advection transport of Si andCa via micropores, and calcite–quartz precipitation in thelow-strain repositories during active deformation.N
a0.
000.
000.
000.
000.
000.
000.
000.
030.
020.
030.
020.
000.
000.
000.
000.
000.
000.
000.
000.
00K
0.00
0.01
0.00
0.00
0.01
0.00
0.00
0.07
0.05
0.02
0.02
0.00
0.01
0.01
0.00
0.00
0.00
0.00
0.00
0.01
P0.
981.
011.
011.
010.
970.
970.
930.
280.
210.
010.
002.
993.
032.
941.
000.
971.
010.
050.
060.
06S
r0.
000.
000.
000.
000.
000.
000.
010.
010.
010.
020.
010.
010.
010.
010.
000.
000.
000.
000.
000.
00Y
0.01
0.00
0.00
0.00
0.02
0.00
0.00
0.00
0.00
0.00
0.00
0.00
0.00
0.00
0.76
0.68
0.75
0.04
0.05
0.05
Ba
0.00
0.00
0.00
0.00
0.00
0.00
0.00
0.00
0.00
0.00
0.00
0.00
0.00
0.00
0.00
0.00
0.00
0.00
0.00
0.00
La
0.22
0.20
0.20
0.19
0.20
0.19
0.17
0.20
0.16
0.16
0.15
0.00
0.00
0.00
0.00
0.01
0.00
0.00
0.00
0.00
Ce
0.42
0.42
0.43
0.43
0.40
0.38
0.38
0.42
0.33
0.37
0.33
0.00
0.00
0.00
0.00
0.02
0.00
0.01
0.00
0.00
Pr
0.04
0.05
0.05
0.05
0.04
0.04
0.04
0.05
0.04
0.04
0.03
0.00
0.00
0.01
0.00
0.01
0.00
0.01
0.01
0.00
Nd
0.16
0.20
0.20
0.22
0.16
0.18
0.18
0.17
0.15
0.14
0.13
0.00
0.00
0.00
0.00
0.01
0.00
0.01
0.01
0.01
Sm
0.03
0.04
0.04
0.05
0.02
0.04
0.04
0.03
0.02
0.02
0.02
0.00
0.00
0.00
0.01
0.01
0.01
0.00
0.00
0.00
Gd
0.02
0.02
0.02
0.02
0.01
0.02
0.02
0.00
0.00
0.00
0.00
0.00
0.00
0.00
0.03
0.03
0.03
0.01
0.01
0.01
Dy
0.00
0.00
0.00
0.01
0.00
0.00
0.00
0.00
0.00
0.00
0.00
0.00
0.00
0.00
0.06
0.06
0.06
0.01
0.01
0.01
Ho
0.00
0.00
0.00
0.00
0.00
0.00
0.00
0.00
0.00
0.00
0.00
0.00
0.00
0.00
0.01
0.01
0.01
0.00
0.00
0.00
Er
0.00
0.00
0.00
0.00
0.00
0.00
0.00
0.00
0.00
0.00
0.00
0.00
0.00
0.00
0.05
0.04
0.04
0.00
0.00
0.00
Yb
0.00
0.00
0.00
0.00
0.00
0.00
0.00
0.00
0.00
0.00
0.00
0.00
0.00
0.00
0.03
0.03
0.03
0.00
0.00
0.00
Th
0.04
0.01
0.01
0.01
0.04
0.01
0.01
0.01
0.01
0.00
0.00
0.00
0.00
0.00
0.01
0.01
0.01
0.67
0.67
0.66
U0.
000.
000.
000.
000.
000.
000.
000.
000.
000.
000.
000.
000.
000.
000.
000.
000.
000.
100.
090.
09P
b0.
010.
000.
000.
000.
010.
000.
000.
000.
000.
000.
000.
000.
000.
000.
000.
010.
000.
020.
020.
02F
0.11
0.10
0.10
0.11
0.12
0.11
0.09
0.04
0.03
0.00
0.00
0.99
1.01
1.02
0.20
0.19
0.19
0.01
0.01
0.01
Cl
0.00
0.00
0.00
0.00
0.00
0.00
0.00
0.01
0.02
0.01
0.01
0.00
0.00
0.00
0.00
0.00
0.00
0.00
0.00
0.00
OH
0.00
0.00
0.00
0.00
0.00
0.00
0.00
0.96
0.96
0.99
0.99
0.01
0.00
0.00
0.00
0.00
0.00
0.00
0.00
0.00
S. Rekha et al. / Geochimica et Cosmochimica Acta 105 (2013) 187–205 199

Author's personal copy
5.3. Mass transfer and monazite alteration: fluid-mediated
element influx
From a review of available solubility data on monazite-forming elements, Hetherington et al. (2010) suggest Th tobe the least soluble, followed by HREEs and Y less solublethan LREEs (Tropper et al., 2011), and U being the mostsoluble. Taking the solubility hierarchy to be valid, the leastsoluble elements (Th, HREEs) are among the more en-riched elements in the monazite alteration zone.
Aggregates of monazite, xenotime and huttonite form-ing veins precipitated from fluids along healed cracks/frac-tures/grain boundaries in polygonized quartz and alongquartz–mica interfaces in schist layers (Figs. 3f, g), as suchprovide the strongest evidence for high mobility of REEs, Y
and actinides. That some of these veins lead up to monazitealteration zone suggests these elements were transported influids to or from the monazite alteration zone. Efflux or in-flux of REEs, Y and actinides in the proportion the ele-ments occur in monazites leads to neither element gainnor element loss in the monazite alteration zone. Howeverif the fluid was dominated by xenotime and huttonite com-ponents, as the mineralogy of the veins suggest, the massfraction gain in HREEs, Y, Th and U and depletion inLREEs and MREEs in the corona can only be explainedby advection transport of these mobile elements into themonazite alteration zone.
The gain in mass fraction of HREE, Y, Th and U in thecorona may be obtained from local sources, e.g. mineralphases (micas) in the schist layer, or introduced from
Table 4Estimation of (a) area % and weight fraction of minerals (excluding monazite) in the alteration zone in grain 11 (Fig. 10b), and (b)composition (in wt.% element oxide) of the alteration zone, and monazite (data in Table 3).(a)
Mineral Area%(1)
Area%(2)
Area%(3)
Mean area %(from 1–3)
Mean areafraction
Density(g/cm3)
Weight(gm)
Weightfraction
Molecularweight
Mole fractionnormalized to 1
Quartz 7.72 6.81 6.83 7.12 0.07 2.65 0.19 0.05 60.08 0.27Chlorite 45.39 44.48 44.55 44.81 0.45 2.95 1.32 0.36 595.22 0.19Apatite 21.53 22.31 22.77 22.20 0.22 3.20 0.71 0.19 509.12 0.12Allanite 6.64 7.03 6.92 6.86 0.07 3.85 0.26 0.07 614.71 0.04Xenotime 7.19 7.51 7.25 7.32 0.07 4.75 0.35 0.09 183.88 0.16Huttonite11.51 11.89 11.67 11.69 0.12 7.10 0.83 0.23 324.12 0.23
99.98 100.03 99.99 100.00 1.00 3.66 1.00 1.00
(b)
Elementoxide (inwt.%)
Composition of alterationzone for all elements (wtfraction � composition ofminerals)
Composition ofalteration zone(only Mnzcomponents)
Composition ofalteration zone(Mnz componentsnormalized to 100)
Composition ofmean monazite(all elements)
Composition ofmean monazite(only Mnzcomponents)
Composition ofmean monazite (onlyMnz components)normalized to 100
SiO2 11.51 0.00 0.00 1.29 0.00 0.00TiO2 0.05 0.00 0.00 0.02 0.00 0.00Al2O3 2.12 0.00 0.00 0.10 0.00 0.00FeO 2.42 0.00 0.00 0.11 0.00 0.00MnO 0.02 0.00 0.00 0.00 0.00 0.00MgO 0.51 0.00 0.00 0.04 0.00 0.00CaO 19.45 0.00 0.00 1.11 0.00 0.00Na2O 0.02 0.00 0.00 0.00 0.00 0.00K2O 0.10 0.00 0.00 0.07 0.00 0.00P2O5 19.92 19.92 33.27 29.57 29.57 31.20SrO 0.08 0.00 0.00 0.10 0.00 0.00Y2O3 7.03 7.03 11.74 0.24 0.24 0.25BaO 0.01 0.00 0.00 0.05 0.00 0.00La2O3 0.69 0.69 1.15 13.45 13.45 14.19Ce2O3 1.49 1.49 2.49 28.41 28.41 29.97Pr2O3 0.33 0.33 0.55 3.21 3.21 3.39Nd2O3 0.76 0.76 1.27 13.32 13.32 14.05SmO 0.23 0.23 0.38 2.45 2.45 2.59Gd2O3 0.67 0.67 1.13 1.41 1.41 1.49Dy2O3 1.09 1.09 1.81 0.28 0.28 0.30Ho2O3 0.20 0.20 0.33 0.02 0.02 0.02Er2O3 0.71 0.71 1.19 0.00 0.00 0.00Yb2O3 0.46 0.46 0.77 0.03 0.03 0.03ThO2 22.46 22.46 37.53 2.08 2.08 2.19UO2 3.23 3.23 5.40 0.05 0.05 0.05PbO 0.59 0.59 0.98 0.27 0.27 0.28
Total 97.30 59.85 100.00 98.49 94.79 100.00
200 S. Rekha et al. / Geochimica et Cosmochimica Acta 105 (2013) 187–205

Author's personal copy
external sources by advection transport. To test which ofthe two possibilities apply, assuming closed system conser-vation for all elements, the following mass balance relationholds for any reference species ‘i’ (Brimhall and Dietrich,1987; Ague, 1994).
V 0q0C0i ¼ V CqCCC
i ð5Þ
V, q and C are volume, density and concentration respec-tively of reference species ‘i’ in the total volume of schistlayer (designated by superscript ‘0’) and the total volumeof corona (designated by superscript ‘C’). Eq. (5) can bere-arranged as
V C
V 0¼ C0
i
CCi
!� q0
qC
� ð6Þ
The right hand side (RHS) of Eq. (6) can be evaluated bydetermining the densities of the schist layer (q0) and themineral aggregate forming the corona (qC), and the concen-trations of the reference species ‘i’ in the schist layer (C0)and in the alteration zone (CC). The left hand side (LHS)of the equation can be obtained from the ratio of the totalarea of the corona (monazite alteration zones) in the schist
Fig. 12. (a, b) Results of mass balance calculations followingBucholz and Ague (2010) shown. In (b), ionic radii of elements in 9-fold co-ordination (Shannon, 1976) are indicated along thehorizontal axis. Note P is omitted in (b).
Fig. 14. Abundances of selected REEs, Y, Th and U in alterationzones around monazite grains 7, 8 and 9 compared with corona-11(bolder line). Box shows area fractions of allanite, huttonite andxenotime in the three corona, averaged from three independentdeterminations made on each corona.
Fig. 13. Plot of concentration ratio vs. density ratio of monaziteand alteration zone in corona-11 (refer Table 4 for relevant data).Lines of equal strain (e) at +0.5, 0.0 and �0.5 are computed usingequation 6 of Brimhall and Dietrich (1987). P is considered as thereference species. See text for details.
Fig. 11. Chondrite-normalized plots of REEs, Y, Th and U ofestimated composition of the monazite alteration zone (in boldline), and average compositions of decomposed monazite, andother minerals in the alteration zone.
S. Rekha et al. / Geochimica et Cosmochimica Acta 105 (2013) 187–205 201

Author's personal copy
layer (VC) and the area of the schist layer (V0). IfLHS 6 RHS in Eq. (6), it would be rational to suggestHREEs, Th and U in the alteration zone were derived lo-cally in the absence of external element flux, but advectiontransport of the reference species from external source isimplied if LHS > RHS. The line of argument is similar tothe one adopted by Kohn and Malloy (2004) to explain ifLREE and P abundances in rocks are adequate to formmonazite grains.
The LHS in Eq. (6) was computed from the area (V0) ofthe schist layers in Fig. 2 and the cumulative area of coronain all altered monazites (VC) estimated using the QWIN soft-ware. The ratio is a minimum estimate because relics of unal-tered monazite, and aggregates of monazites, thorite andxenotime in veins in schist layers were excluded due to theirsmall sizes, although these excluded phases contribute tothe total HREEs, Th and U concentrations in the schist layer.
Yb (among HREE), Th and U were considered as thereference species. The abundances of these elements in Ar-chean and Early Proterozoic shale typically lie in the range1.5–4 ppm, 3–12 ppm and 1–4 ppm respectively (Fedoet al., 1996; Hayashi et al., 1997; Krogstad et al., 2004;Hessler and Lowe, 2006; Pollack et al., 2009). In the com-putations, the North American Shale Composite (NASC;Gromet et al., 1984) with Yb (3.06 ppm), Th (12.3 ppm),and U (2.66 ppm) was taken to represent the compositionfor the schist layer, C0. For the schist layer density (q0)was taken to be �2.65 g/cm3. Since the compositions ofalteration zone around monazites are comparable(Fig. 14), the estimated concentrations of Yb (1268 ppm),Th (124190 ppm) and U (17874 ppm) in grain-11 were ta-ken to be the representative value for CC
i . For corona den-sity (qC) was computed using the relation (
PqmAm)/
PAm,
where qm and Am are the density and area respectively ofeach mineral in the alteration zone. Using the relation, qC
for grain-11 was computed to be 2.37 g/cm3. This valuewas taken to be representative for all alteration zonesaround monazites in the schist layer.
The LHS in Eq. (6) was computed to be �1.1 � 10�3.The RHS in the equation yielded �7.2 � 10�5 for Th,�1.1 � 10�4 for U and �1.8 � 10�3 for Yb. It is evidentthat the LHS in Eq. (6) is 100 and 10 times respectivelyhigher relative to RHS for Th and U. For Yb, the LHSand the RHS in Eq. (6) are comparable. Since the LHS isa minimum estimate due to neglect of huttonite and Y-xenotime in veins and in unaltered monazite that also con-tain substantial amounts of Yb, i.e. LHS > RHS for Yb, itis inferred that Yb, as with Th and U, were introduced fromexternal sources by fluid-mediated advection transport.
Clearly corona formation involved complex reactioninvolving monazite, silicate minerals, and both locally-de-rived and externally-introduced element species transportedto the alteration zone. A wholesome reaction involvingthese different components is difficult to model. Insteadwe provide a partial reaction with P in monazite conservedamong product phases, e.g. xenotime and apatite, the twophosphate rich phases to explain monazite decomposition.The molar proportion of the product phases (xenotime,huttonite, apatite and allanite) was obtained by dividingthe weight fractions obtained from BSE image in corona-
11 by the respective molecular weights and normalizing to1 (Table. 4a; last column). For modeling the reaction, onlyelements with abundances >0.01 per formula unit in respec-tive phases were considered.
ðLa0:19Ce0:41Nd0:19Th0:02ÞP0:98O4 ðmonaziteÞþ0:22 YðaqÞ þ 0:27 ThðaqÞ þ 1:19 CaðaqÞ þ 0:09 FeðaqÞþ0:04 MgðaqÞ þ 0:13 AlðaqÞ þ fluid
� 0:07ðCe0:36Ca0:71La0:17Nd0:15ÞðFe1:21Mg0:51Al1:68ÞSi3:00O12:5ðOHÞ ðallaniteÞþ0:30 ðY0:73Ce0:01Nd0:01Th0:01ÞP0:99O4 ðxenotimeÞþ0:44 ðTh0:67Nd0:01ÞSi0:99O4 ðhuttoniteÞþ0:23 Ca4:92P2:99O12:5ðOHÞ ðapatiteÞþ0:18 LaðaqÞ þ 0:39 CeðaqÞ þ 0:17 NdðaqÞ
ðR2Þ
It is evident from the reaction (R2) that among REEsand actinide group of elements, Y and Th were added,whereas La, Ce and Nd were removed from the alterationzone, consistent with results of the mass balance calcula-tions. Significantly the ratio of La:Ce:Nd as model aqueousspecies in the right hand side of the reaction (0.18:0.39:0.17)is identical to that in vein monazite (0.19:0.41:0.19). Fe,Mg, Ca, Si and Al were added to the alteration zone for sta-bilizing apatite, allanite and huttonite, but the molar pro-portions in which the mineral phases (calcite, plagioclase,biotite, chlorite, muscovite and quartz) reacted is difficultto assess because some of the elements (say Fe) may be de-rived by dissolution of multiple minerals (say biotite, chlo-rite and muscovite). The molar proportions of silicatephases in the corona and monazite were ignored while for-mulating the reaction because these minerals in the coronaare residual phases. The abundances of these minerals inthe alteration zone are not in the proportion in which theminerals reacted, unlike the product phases that are presentin the proportion they formed, assuming their modal pro-portion was not subsequently modified.
5.4. Monazite preservation
Rounded to sub-rounded monazites in tonalite clasts arelikely to have crystallized at higher T (magmatic?) than inschist layers dominated by chlorite–biotite >> muscovite.Several authors highlight that high-Th monazite is unstableat low-T (Rasmussen and Muhling, 2007; Hetheringtonet al., 2010) and readily decomposes to low-Th monazitewith the release of Ca, Y, Th and U (Rasmussen and Muh-ling, 2007). The abundances of these elements – incompat-ible with the low-T monazite structure – steadily increase inthe reaction zone till saturation limits are reached leading toprecipitation of mineral phases (Rasmussen and Muhling,2007). If so, all other parameters remaining same, high-Tmonazites in clasts having, on an average, higher-Th thanmonazites in schist layers (Fig. 8c) are likely to have decom-posed more extensively than monazites hosted in schist lay-ers. This contradicts the fact that the tonalite-hostedmonazites in the para-conglomerate are less altered com-pared to monazites in the schist layers.
The better preservation (lesser alteration) of monazitewithin clasts may be linked to (a) differences in chemistryof fluids within the tonalite clasts and the schist layers be-cause monazites respond differently to fluid chemistry(Harlov and Hetherington, 2010; Hetherington et al.,
202 S. Rekha et al. / Geochimica et Cosmochimica Acta 105 (2013) 187–205
Author's personal copy
2010), and/or (b) limited fluid access within clasts becauseof fewer permeable porosity networks. To test if fluid com-position were different within clasts and in the schistose lay-ers, calcite in texturally different settings were analyzed ford13C and d18O using DELTA PLUS XP continuous flowisotope ratio mass spectrometer in the Department of Geol-ogy and Geophysics, Indian Institute of Technology, Khar-agpur, India. The accuracy of individual measurement wasbetter than 0.1&.
Calcite from veins in schist layers, in clasts, and in pres-sure shadow zones around clasts were sampled using a New-Wave micromill fitted with Olympus SZ61 opticalmicroscope. Disseminated calcite grains in the schist layerswere segregated by powdering hand-chipped fragments ofthe schist layer. Subsequently the proportion of calcite frac-tion was enriched by repeatedly passing the powder througha 500 ml measuring cylinder followed by decanting water. Fi-nally calcite grains were hand-picked under the microscopefor mass spectrometric analysis of the calcite concentrate.
The d13C (VPDB) and d18O (VSMOW) values in calcite inthe schist layer were determined to be �3.1 and �3.2, and+12.2 and +12.1 respectively. The corresponding valuesfor aggregates of disseminated calcite are �3.6 and �3.7and +12.1 and +11.4 for calcite in pressure shadow zones,and �3.5 and +11.6 for vein calcite in clast (all values in&). The d13C values are primitive, comparable to those re-ported from ocean island basalts (Parello et al., 2000), andmantle xenoliths, carbonatites, diamonds and volcanic exha-lations (Deines, 2002). By contrast the d18O values are typicalfor felsic igneous rocks (Taylor, 1974). The d13C values differby 0.5&, whereas the d18O values lie between 0.8& of eachother. The tightly-bracketed 13C–18O values in calcite in dif-ferent textural settings precipitated concurrently from fluidsintroduced from external sources seem to suggest thatfluids permeating through inter-connected porosity net-works in the deformed para-conglomerate were chemicallyhomogeneous.
The findings however do not preclude the possibilitythat fluids with similar C–O isotope compositions permeat-ing porosity networks in mineralogically different domains(clast and schistosity) to have the same content of dissolvedspecies. Yet the near-identical composition of chlorite andbiotite synchronously formed in texturally and mineralogi-cally different domains when combined with C–O isotopedata in calcite co-precipitated with micas suggest chemicallyuniform fluids permeated the rock. Apparently the betterpreservation of clast-hosted monazites, chemically similarto monazites hosted in schist layers, was due to less avail-ability of fluids permeating demonstrably fewer porositynetworks in the clasts relative to the schistose layers. Inother words, strain partitioning and fluid-focusing inweak-to-shear micaceous layers relative to the more compe-tent clasts induced fluid-mediated greater reactivity amongmonazites in the schist layers.
6. CONCLUDING REMARKS
Corona textures manifest mineralogical reactionsaborted because reactant phases were exhausted or theevolving physico-chemical conditions impeded progress of
corona-forming reaction (Prasad et al., 2005; Nasipuriet al., 2008). An overwhelming number of studies invoke,explicitly or implicitly (Thompson, 1959; Fisher, 1973; Joe-sten, 1977; Rivers and Mengel, 1988; Ashworth and Shep-lev, 1997; Carlson, 2002) that inter-granular fluids arecrucial because mineralogical transformations are frozen-in records of fluid-mediated mass transfer processes (Brim-hall, 1977; Ague, 1994, 2011). The present study demon-strates that in situations where mass transport occurunder the influence of externally-derived fluid flux, micro-scopic porosity networks in mineralogically diverse do-mains determine if minerals will persist as un-reactedphases or attain chemical equilibrium with fluid and dis-solved chemical species and precipitate as stable mineralsif fluid access is unimpeded. Results of mass balance calcu-lations indicate monazite instability was induced by Th, Urich fluids, and therefore monazites may not be robust sinkfor sequestering nuclear waste materials. Since Th, U andYb abundances in monazite alteration zones taken togetherare significantly higher than abundances of these elementsin shale, the HREEs and actinide group of elements weretransported by fluids external to schists. In other words,HREEs, Th and U were extremely mobile at greenschist fa-cies conditions.
ACKNOWLEDGEMENTS
This work was done by R.S. during her tenure as CSIR-UGC(India) Research Fellow in the Department of Geology and Geo-physics, Indian Institute of Technology, Kharagpur. This wokforms a part of the doctoral dissertation of R.S. A.B. acknowledgesthe financial support provided by IIT Kharagpur through CPDAfunds for the work. Special thanks are for Ms. Aloka Dey, analystin the EPMA National Facility IIT Kharagpur, for developing theroutine for analysis for REEs, Y, Th, U and Pb among 28 elementsby CAMECA SX-100 EPMA. All analyses were carried out in theelectron probe micro-analytical National Facility financially sup-ported by the Department of Science and Technology (India). Me-linda and Arpita are thanked for assisting with stable isotopeanalysis. We greatly appreciate the reviews provided by two anon-ymous journal reviewers. The incisive and constructive reviews pro-vided by the reviewers helped to organize our thoughts, andimprove the style and presentation of the manuscript.
REFERENCES
Ague J. J. (1994) Mass transfer during Barrovian metamorphism ofpelites, south-central Connecticut. II: channelized fluid flow andthe growth of staurolite and kyanite. Am. J. Sci. 294, 1061–
1134.
Ague J. J. (2011) Extreme channelization of fluid and the problemof element mobility during Barrovian metamorphism. Am.
Mineral. 96, 333–352.
Anders E. and Grevesse N. (1989) Abundances of the elements:Meteoritic and solar. Geochim. Cosmochim. Acta 53, 197–214.
Ashworth J. R. and Sheplev V. S. (1997) Diffusion modeling ofmetamorphic layered coronas with stability criterion andconsideration of affinity. Geochim. Cosmochim. Acta 61, 3671–
3689.
Brace W. F. and Kohlstedt D. L. (1980) Limits of lithosphericstress imposed by laboratory experiments. J. Geophys. Res. 85,
6248–6252.
S. Rekha et al. / Geochimica et Cosmochimica Acta 105 (2013) 187–205 203

Author's personal copy
Brimhall G. H. (1977) Early fracture-controlled disseminatedmineralization at Butte, Montana. Ecol. Geol. 72, 37–59.
Brimhall G. H. and Dietrich W. E. (1987) Constitutive massbalance relations between chemical composition, volume,density, porosity, and strain in metasomatic hydrochemicalsystems: Results on weathering and pedogenesis. Geochim.
Cosmochim. Acta 51, 567–587.
Bucher-Nurminen K. (1987) A recalibration of the chlorite–biotite–muscovite geobarometer. Contrib. Mineral. Petrol. 96, 519–522.
Bucholz A. E. and Ague J. J. (2010) Fluid flow and Al transportduring quartz-kyanite vein formation, Unst, Shetland Islands,Scotland. J. Met. Geol. 28, 19–39.
Budzyn B., Hetherington C. J., Williams M. L., Jercinovic M. J.and Michalik M. (2010) Fluid-mineral interactions and con-straints on monazite alteration during metamorphism. Mineral.
Mag. 74, 659–681.
Burnham C. W., Ryzhenko B. N. and Schitel D. (1973) Watersolubility of corundum at 500–800 �C and 6 kbar. Geochem. Int.
10, 1374.
Cabella R., Lucchetti G. and Marescotti P. (2001) Authigneicmonazite and xenotime from politic metacherts in pumpellyite-actonilite-facies conditions. Sestri-Voltaggio zone, Central Lig-uria, Italy.. Can. Mineral. 39, 717–727.
Carlson W. D. (2002) Scales of disequilibrium and rates ofequilibration during metamorphism. Am. Mineral. 87, 185–204.
Cathelineau M. (1988) Cation site occupancy in chlorites and illitesas a function of temperature. Clay Mineral. 23, 471–485.
Cherniak D. J., Watson E. B., Grove M. and Harrison T. M.(2004) Pb diffusion in monazite: A combined RBS/SIMS study.Geochim. Cosmochim. Acta 68, 829–840.
Chernosky, Jr., J. V. (1975) The stability of assemblage clinochlore+ quartz at low pressure. Am. Geophys. Union Trans. Abs. 56,
466.
Chernosky, Jr., J. V. (1978) The stability of clinochlore + quartz atlow pressure. Am. Mineral. 63, 73–82.
Cocherie A., Legendre O., Peucat J. J. and Kouamelan A. N.(1998) Geochronology of polygenetic monazites constrained byin-situ electron microprobe Th-U-total lead determinations:Implications for lead behaviour in monazites. Geochim. Cos-
mochim. Acta 62, 2475–2497.
Cole J., Hacker B., Ratschbacher L., Dolan J., Seward G., Frost E.and Frank W. (2007) Localized ductile shear below theseismogenic zone: Structural analysis of an exhumed strike-slipfault, Austrian Alps. J. Geophys. Res. 112, B12304. http://
dx.doi.org/10.1029/2007JB004975.
Copeland P., Parrish R. R. and Harrison T. M. (1988) Identifica-tion of inherited radiogenic Pb in monazite and its implicationsfor U-Pb systematics. Nature 333, 760–763.
Dahl P. S. (1997) A crystal-chemical basis for Pb retention andfission track annealing systematics in U-bearing minerals, withimplications for geochronology. Earth Planet. Sci. Lett. 150,
277–290.
Deines P. (2002) The carbon isotope geochemistry of mantlexenoliths. Earth Sci. Rev. 58, 247–278.
Desai A. G. (2011) The geology of Goa Group: Revisited. J. Geol.
Soc. India 78, 233–242.
Evans B. W., Johannes W., Oterdoom H. and Trommsdorf V.(1976) Stability of chrysotile and antigorite in the serpentinemultisystem. Schweizer. Min. Pet. Mitt. 56, 79–93.
Fedo C. M., Eriksson K. A. and Krogstad E. J. (1996) Geochem-istry of shales from the Archean (3.0 Ga) Buhwa GreenstoneBelt Zimbabwe: implications for provenance and source-areaweathering. Geochim. Cosmochim. Acta 60, 1751–1763.
Ferry J. M. and Dipple G. M. (1991) Fluid flow, mineral reactions,and metasomatism. Geology 19, 211–214.
Finch A. A. (1991) Conversion to nepheline to sodalite during sub-solidus processes in alkaline rocks. Mineral. Mag. 55, 459–463.
Finger F., Broska I., Roberts M. P. and Schermaier A. (1998)Replacement of primary monazite by apatite-allanite-epidotecoronas in an amphibolite facies granite gneiss from the easternAlps. Am. Mineral. 83, 248–258.
Fisher G. W. (1973) Non-equilibrium thermodynamics as a modelfor diffusion controlled metamorphic processes. Am. J. Sci. 273,
897–924.
Fleming P. D. and Fawcett J. J. (1976) Upper stability chlorite +quartz in the system MgO-FeO-Al2O3-SiO2-H2O at 2 kbarwater pressure. Am. Mineral. 61, 1175–1193.
Geraud Y., Caron J. M. and Faure P. (1995) Porosity network of aductile shear zone. J. Struct. Geol. 17, 1757–1769.
Grapes R., Bucher K. and Hoskin P. W. O. (2005) Monazite-epidote reaction in amphibolite grade blackwall rocks. Eur. J.
Mineral. 17, 553–566.
Green D. J. and Usdansky S. L. (1986) Toward a practicalplagioclase-muscovite thermometer. Am. Mineral. 71, 1109–
1117.
Gromet L., Dymek R. F., Haskin L. A. and Korotev R. L. (1984)The “North American shale composite”: Its compilation, majorand trace element characteristics. Geochim. Cosmochim. Acta
48, 2469–2482.
Harlov D. E. and Hetherington C. J. (2010) Partial high-gradealteration of monazite using alkali-bearing fluids: Experimentand nature. Am. Mineral. 95, 1105–1108.
Harlov D. E., Prochazka V., Forster H. J. and Matejka D. (2008)Origin of monazite–xenotime–zircon–fluroapatite assemblagesin the peraluminous Melechov granite massif, Czech Republic.Contrib. Mineral. Petrol. 94, 9–26.
Hayashi K. I., Fujisawa H., Holland H. D. and Ohmoto H. (1997)Geochemistry of �1.9 Ga sedimentary rocks from northeasternLabrador. Canada. Geochim. Cosmochim. Acta 61, 4115–4137.
Henry D. J., Guidotti C. V. and Thompson J. A. (2005) The Ti-saturation surface for low-to-medium pressure metapeliticbiotites: Implications for geothermometry and Ti-substitutionmechanisms. Am. Mineral. 90, 316–328.
Hessler A. M. and Lowe D. R. (2006) Weathering and sedimentgeneration in the Archean: An integrated study of the evolutionof siliciclastic sedimentary rocks of the 3.2 Ga Moodies Group,Barberton Greenstone Belt, South Africa. Precamb. Res. 151,
185–210.
Hetherington C. J., Harlov D. E. and Budzyn B. (2010) Experi-mental metasomatism of monazite and xenotime: mineralstability, REE mobility and fluid composition. Mineral. Petrol.
99, 165–184.
Hirth G. and Tullis J. (1992) Dislocation creep regimes in quartzaggregates. J. Str. Geol. 14, 145–159.
Holland T. J. B. and Powell R. (1998) An internally consistentthermodynamic data set for phases of petrological interest. J.
Petrol. 16, 309–343.
Janots E., Berger A. and Engi M. (2011) Physico-chemical controlon the REE minerals in chloritoid-grade metasediments from asingle outcrop (Central Alps, Switzerland). Lithos 121, 1–11.
Janots E., Engi M., Rubatto D., Berger A., Gregory C. and RahnM. (2009) Metamorphic rates in collisional orogeny from in situallanite and monazite dating. Geology 37, 11–14.
Joesten R. (1977) Evolution of mineral assemblage zoning indiffusion metasomatism. Geochim. Cosmochim. Acta 41, 649–
670.
Jowett E. C. (1991) Fitting iron and magnesium into hydrothermalchlorite geothermometer. GAC/MAC/SEG Joint AnnualMeeting (Toronto, May 27–29, 1991), Program with Abstracts16, A62.
204 S. Rekha et al. / Geochimica et Cosmochimica Acta 105 (2013) 187–205

Author's personal copy
Kempe U., Lehmann B., Wolf D., Rodionov N., Bombach K.,Schwengfelder U. and Dietrich A. (2008) U-Pb SHRIMPgeochronology of Th-poor, hydrothermal monazite: An exam-ple from the Llallagua tin-porphyry deposit, Bolivia. Geochim.
Cosmochim. Acta 72, 4352–4366.
Kim Y., Yi K. and Cho M. (2009) Parageneses of Th–Udistributions among allanite, monazite and xenotime in Barro-vian-type metapelites, Imjingang belt, central Korea. Am.
Mineral. 94, 430–438.
Kohn M. J. and Malloy M. A. (2004) Formation of monazite viaprograde reactions among common silicates: Implications forage determinations. Geochim. Cosmochim. Acta 68, 101–113.
Kretz R. (1983) Symbols for rock-forming minerals. Am. Mineral.
68, 277–279.
Krogstad E. J., Fedo C. M. and Eriksson K. A. (2004) Provenanceages and alteration histories of shales from the Middle ArcheanBuhwa greenstone belt, Zimbabwe: Nd and Pb isotopicevidence. Geochim. Cosmochim. Acta 68, 319–332.
Mezger K., Rawnsley C. M., Bohlen S. R. and Hanson G. N.(1991) U-Pb garnet, sphene, monazite and rutile ages: Impli-cations for the duration of high-grade metamorphism, andcooling histories. Adirondack Mts, New York. J. Geol. 99, 415–
428.
Montel J. M., Foret S., Veschambre M., Nicollet C. and Provost A.(1996) Electron microprobe dating of monazite. Chem. Geol.
131, 37–53.
Nasipuri P., Bhattacharya A. and Das S. (2008) Metamorphicreactions in dry and aluminous granulites: a Perple_X P-T
pseudosection analysis of the influence of effective reactionvolume. Contrib. Mineral. Petrol. 157, 301–311.
Parello F., Allard P., Alessandro W. D., Federico C. and Jean-baptiste P. (2000) Isotope geochemistry of Pantelleria volcanicfluids, Sicily Channel rift: a mantle volatile end-member forvolcanism in southern Europe. Earth Planet. Sci. Lett. 180,
325–339.
Parrish R. R. (1990) U-Pb dating of monazite and its application togeological problems. Can. J. Earth Sci. 27, 1431–1450.
Poitrasson F., Chenery S. and Bland D. J. (1996) Contrastedmonazite hydrothermal alteration mechanisms and their geo-chemical implications. Earth Planet. Sci. Lett. 145, 79–96.
Poitrasson F., Chenery S. and Shephard T. J. (2000) Electronmicroprobe and LA-ICP-MS study of monazite hydrothermalalteration: Implications for U-Th-Pb geochronology andnuclear ceramics. Geochim. Cosmochim. Acta 64, 3283–3297.
Pollack G. D., Krogstad E. J. and Bekker A. (2009) U-Th–Pb–REE systematics of organic-rich shales from the ca. 2.15 GaSengoma Argillite Formation, Botswana: Evidence for oxida-tive continental weathering during the Great Oxidation Event.Chem. Geol. 260, 172–185.
Prasad S., Bhattacharya A., Raith M. and Bhadra S. (2005) Theorigin of orthopyroxene/biotite + plagioclase coronas from theBolangir anorthosite complex (India), and implications forreconstructing P-T paths. Am. Mineral. 90, 291–303.
Putnis A. (2009) Mineral replacement reactions. Rev. Mineral.
Geochem. 70, 87–124.
Ramsay J. G. (1980) The crack-seal mechanism of rock deforma-tion. Nature 284, 135–139.
Rasmussen B. and Muhling J. R. (2007) Monazite begets monazite:evidence for dissolution of detrital monazite and reprecipitationof syntectonic monazite during low-grade regional metamor-phism. Contrib. Mineral. Petrol. 154, 675–689.
Rasmussen B., Fletcher I. R. and McNaughton N. J. (2001) Datinglow-grade metamorphic events by SHRIMP U-Pb analysis ofmonazite in shales. Geology 29, 963–966.
Rasmussen B., Fletcher I. R. and Sheppard S. (2005) Isotopicdating of the migration of a low-grade metamorphic frontduring orogenesis. Geology 33, 773–776.
Rasmussen B., Muhling J. R., Fletcher I. R. and Wingate M. T. D.(2006) In situ SHRIMP U-Pb dating of monazite integratedwith petrology and textures: Does bulk composition controlwhether monazite forms in low-Ca pelitic rocks duringamphibolite facies metamorphism. Geochim. Cosmochim. Acta
70, 3040–3058.
Rekha S., Vishwanath T. A., Bhattacharya A. and Prabhakar N.(2012) Meso/Neoarchean crustal domains along the northKonkan coast, western India: the Western Dharwar Craton andthe Antongil-Masora Block (NE Madagascar) connection.Precam. Res. (in press).
Rivers T. and Mengel F. C. (1988) Contrasting assemblages andpetrogenetic evolution of corona and non-corona gabbros inthe Grenville Province of Western Labrador. Can. J. Earth Sci.
25, 1629–1648.
Shannon R. D. (1976) Revised effective ionic radii and systematicstudies of interatomic distances in halides and chalcogenides.Acta Crystal. 32, 751–767.
Simpson C. (1985) Deformation of granitic rocks across the brittle-ductile transition. J. Str. Geol. 7, 503–511.
Smith H. A. and Giletti B. J. (1997) Lead diffusion in monazite.Geochim. Cosmochim. Acta 61, 1047–1055.
Spear F. S. and Parrish R. (1996) Petrology and petrologic coolingrates of the Valhalla Complex, British Columbia, Canada. J.
Petrol. 37, 733–765.
Suzuki K. and Adachi M. (1991) The chemical Th–U–total Pbisochron ages of zircon and monazite from the gray granite ofthe Hida Terrane, Japan. J. Earth Planet. Sci. 38, 11–38.
Suzuki K. and Kato T. (2008) CHIME dating of monazite,xenotime, zircon and polycrase: Protocol, pitfalls and chemicalcriterion of possibly discordant age data. Gond. Res. 14, 569–
586.
Taylor H. P. (1974) The application of oxygen and hydrogenisotope studies to problems of hydrothermal alteration and oredeposition. Econ. Geol. 69, 843–883.
Thompson J. B. (1959) Local equilibrium in metasomatic pro-cesses. In Researches in Geochemistry (ed. P. H. Abelson).Wiley, New York, pp. 427–457.
Townsend K. J., Miller C. F., D’Andrea J. L., Ayers J. C.,Harrison T. M. and Coath C. D. (2000) Low temperaturereplacement of monazite in the Ireteba Granite, southernNevada; geochronological implications. Chem. Geol. 171, 95–
112.
Tropper P. and Manning C. E. (2007) The solubility of corundumin H2O at high pressure and temperature and its implicationsfor Al mobility in the deep crust and upper mantle. Chem. Geol.
240, 54–60.
Tropper P., Manning C. E. and Harlov D. E. (2011) Solubility ofCePO4 monazite and YPO4 xenotime in H2O and H2O–NaClat 800 �C and 1 GPa: Implications for REE and Y transportduring high-grade metamorphism. Chem. Geol. 282, 58–66.
Walther J. V. (1997) Experimental determination and interpreta-tion of the solubility of corundum in H2O between 350 and 600�C from 0.5 to 2.2 kbar. Geochim. Cosmochim. Acta 61, 4955–
4964.
Worden R. H., Walker F. D. L., Parsons I. and Brown W. L.(1990) Development of microporosity, diffusion channels anddeuteric coarsening in perthitic alkali-feldspar. Contrib. Min-
eral. Petrol. 104, 507–515.
Associate editor: C. Steefel
S. Rekha et al. / Geochimica et Cosmochimica Acta 105 (2013) 187–205 205