Microbial mediation of carbon-cycle feedbacks to climate warming
170
Energy, Ecosystem, and Environmental Change September 22-24, 2010 Beijing, China C H I N A • U S Joint Research Center for Ecosystem and Environmental Change
Transcript of Microbial mediation of carbon-cycle feedbacks to climate warming
Energy, Ecosystem, and Environmental Change
September 22-24, 2010Beijing, China
CHINA
•
USJoint Research Centerfor Ecosystem andEnvironmental Change
Workshop Sponsors:
US National Science FoundationUS Department of EnergyChinese Academy of Sciences

The primary sponsors of the Fourth Annual China-US Workshop of the China-US Joint Research Center for Ecosystem and Environmental Change ( JRCEEC) were the Ministry of Science and Technology of China, the Chinese Academy of Sciences, the Natural Science Foundation of China, the US Department of Energy, the US National Science Foundation, and the US Environmental Protection Agency. The 2010 workshop is hosted in Beijing by the Research Center for Eco-Environmental Sciences (RCEES) of the Chinese Academy of Sciences (CAS). The charter members of JRCEEC are, in the United States, the University of Tennessee (UT)-Oak Ridge National Laboratory Joint Institute for Biological Sciences, and UT’s Institute for a Secure and Sustainable Environment; and in China, the RCEES and the Institute for Geographic Sciences and Natural Resources Research, both arms of the CAS in Beijing. Other partners are the Center for the Environment (C4E) at Purdue University, and the University of Science and Technology of China.
TThe China-US Joint Research Center for Ecosystem and Environmental Change was formed in July 2006 with the signing of a framework agreement between scientists from the University of Tennessee (UT) and
Oak Ridge National Laboratory (ORNL) and researchers from the Chinese Academy of Sciences (CAS). The center organizes annual workshops held reciprocally in China and the United States.
The 2010 workshop on Energy, Ecosystem, and Environmental Change was held September 22-24 in Beijing, China, and was hosted by the Research Cener for Eco-Environmental Sciences of the Chinese Academy of Sciences. This publication presents the proceedings of the fourth workshop, at which researchers shared their recent findings in a supportive environment, reported on fruitful results of five years of collaborative research projects, and forged new pathways for future international research undertakings.
CHINA
•
USJoint Research Centerfor Ecosystem andEnvironmental Change
2010 JRCEEC WORKSHOP Sponsors and Hosts
ENERGY,ECOSYSTEM,ANDENVIRONMENTALCHANGE | 1
Joint Institute for Biological Sciences, The University of Tennessee/Oak Ridge National Laboratory
Institute for a Secure and Sustainable Environment,The University of Tennessee
Institute of Geographic Sciences and Natural Resources Research, Chinese Academy of Sciences
Research Center for Eco-Environmental Sciences, Chinese Academy of Sciences
Center for the Environment,Purdue University
University of Science and Technology of China
Partners of the China-US Joint Research Center for Ecosystem and Environmental Change
2 | ENERGY,ECOSYSTEM,ANDENVIRONMENTALCHANGE
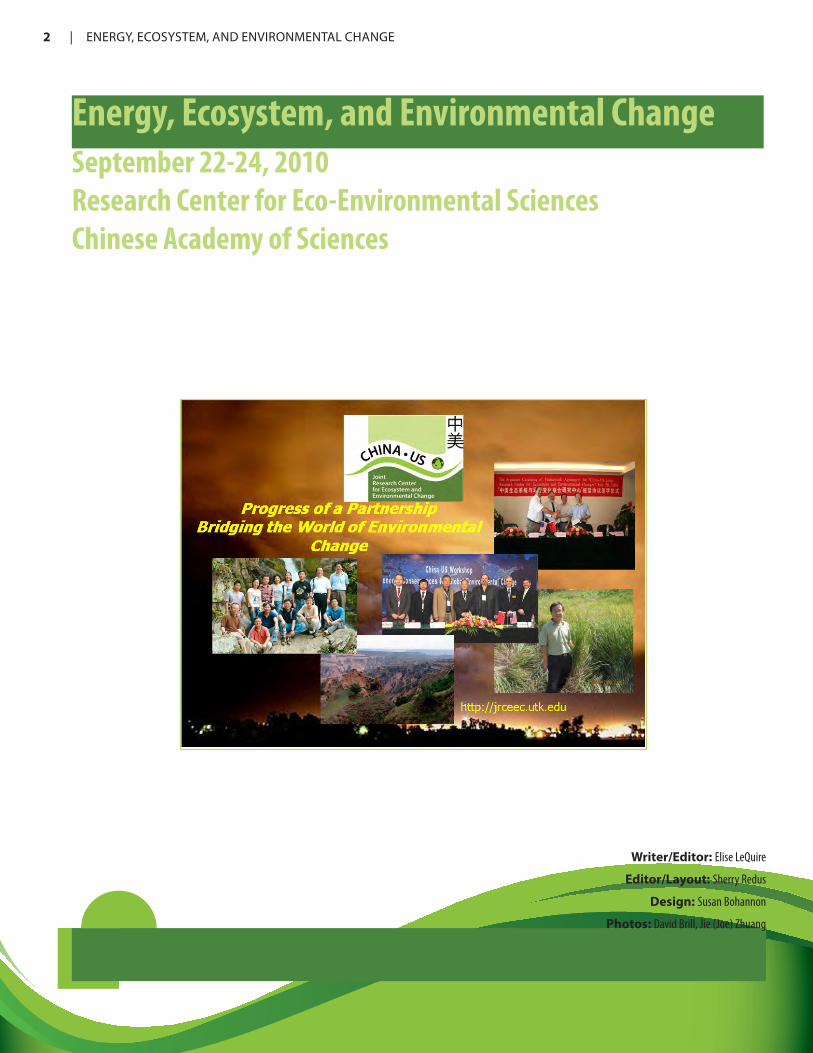
Energy, Ecosystem, and Environmental ChangeSeptember 22-24, 2010Research Center for Eco-Environmental SciencesChinese Academy of Sciences
Writer/Editor: Elise LeQuire
Editor/Layout: Sherry Redus
Design: Susan Bohannon
Photos: David Brill, Jie (Joe) Zhuang

ENERGY,ECOSYSTEM,ANDENVIRONMENTALCHANGE | 3
CHINA
•
USJoint Research Centerfor Ecosystem andEnvironmental Change
The China-US Joint Research Center for Ecosystem and Environmental Change has a mission of communica-tion, cooperation, exchange, and leadership.
The Joint Center’s primary collaborative themes include:
• Ecosystem processes and management,
• Environmental sustainability of bioenergy production,
• Ecological foundations of water resources and quality, and
• Technologies for improvement of eco-environmental sys-tems.
WORKSHOP GOALS AND OBJECTIVES The goals of the China-US 2010 Joint Symposium, Energy, Ecosystem, and Envi-ronmental Change (E3C), are to strengthen and promote China-US research partner-
ships through specific joint research and education initiatives related to clean energy, ecosystem management, and mitigation of environmental damages. The specific themes for the 2010 symposium are:
• Microbial Ecology and Technology: advances in critical re-search and development of microbial ecology and technologies that are used for bioenergy production, bioremediation, and below-ground ecological restoration
• Ecosystem Cycles of Carbon and Nitrogen: coupled cycles of carbon and nitrogen associated with rural and urban ecosys-tems as well as other processes that influence net greenhouse gas (GHG) emissions
• Renewable Energy and Emission Reduction: technologies and deployment strategies for renewable energy production, energy efficiency, and other energy supply options that reduce GHG emissions and maintain ecosystem services
• Environmental Change and Health: environmental health issues such as risk assessment approaches, environmental contamination and remediation, ecotoxicological processes, and waste reduction and treatments.
In addition, the symposium aimed to highlight and strengthen joint programs of research for students and young faculty, ex-plore future avenues of international cooperation, and identify specific collaborative research projects.

4 | TABLEOFCONTENTS TABLEOFCONTENTS | 5
Energy, Ecosystem, and Environmental Change (E3C)by Gary Sayler 12
From Microbes to Man: Environmental Biosensing with Bacterial Bioluminescenceby Gary Sayler 14
Advances on the Carbon Cycle Research of China's Terrestrial Ecosystemsby Guirui Yu and Shenggong Li 16
Funneling Photons: Two Parts Nature and One Part Material Scienceby Barry Bruce 20
Cutting Edge Technologies to Combat Natural Water Quality Crisis: Turning AlgalBlooms into In-situ Resources for Sustainable Ecological Restoration
by Pan Gang 22
The Center for Renewable Carbon: Advancing the Green Economy by Timothy G Rials 28
Hydrogen Production from Phenol: A Two-Step Biological Processby Hanqing Yu 32
Novel Cellulolytic Microorganisms from Terrestrial Geothermal Springsby James Elkins 34
Switchgrass Biotechnology and Modifications for Improved Bioenergy Feedstocksby David Mann 37
Microbial Communities Assessed Using a Clone Library Analysisin Sulfide-Fed Microbial Fuel Cell
by Zhonghua Tong 40
Microbial Mediation of Carbon Cycle Feedbacks to Climate Warmingby Jizhong Zhou 42
Soil Nitrogen Transformation: Agricultural and Environmental Significanceby Xudong Zhang 44
Opening Address & Keynote Speakers
Microbial Ecology and Technology
TABLE OF CONTENTS
4 | TABLEOFCONTENTS TABLEOFCONTENTS | 5
Effects of Temperature, Glucose, and Inorganic Nitrogen Inputs on Carbon and NetNitrogen Mineralization in a Tibetan Alpine Meadow Soil
by Minghua Song 46
The Effect of Biochar on the Paddy Soil in Southern Chinaby Jingyuan Wang 48
Response of Soil Organic Carbon to Soil Relocation from High- to Low Elevation AlongNatural Altitudinal Transect of an Old Temperate Volcanic Forest
by Xinyu Zhang 49
Mechanisms Controlling Soil Organic Matter Dynamics in a Forest Under Elevated CO2 by Timothy Filley 52
Effects of Climate Change and Plantation on the Carbon Budget of Coniferous Forestsin Poyang Lake Basin from 1981 to 2008
by Shaoqiang Wang 56
Nitrogen Cycling and Ammonia Oxidation Microorganisms in Terrestrial Ecosystems as Revealed by Bio-Molecular Techniques
by Jizheng He 58
Precipitation-Use Efficiency Along a 4500-KM Grassland Transectby Zhongmin Hu 60
Effects of Cloudiness Change on Net Ecosystem Exchange, Light-Use Efficiency, and Water-Use Efficiency in Typical Ecosystems of China
by Mi Zhang 61
Microbial Ecology and Technology
Ecosystem Cycles of Carbon and Nitrogen
6 | TABLEOFCONTENTS TABLEOFCONTENTS | 7
Water-Use Efficiency and Nitrogen-Use Efficiency Trends and Impacts of Dominant Species in the Typical Broadleaf Forest Ecosystems Along NSTEC
by Wenping Sheng 63
Assessment of Nitrate Concentration in Groundwater on Typical Terrestrial Ecosystemsof Chinese Ecosystem Research Network during 2004-2009
by Zhiwei Xu 64
Carbon Preservation in Subtropical Paddy Ecosystemsby Jinshui Wu 66
Low Carbon City Development in China: Potential and Challengesby Zhiyun Ouyang 68
Impacts of Ecosystem Services Change on Human Well-being in the Loess Plateau by Lin Zhen 70
Assessment of the Damage Caused by the 2008 Ice Storm on Subtropical Forestin Jiangxi, China
by Huimin Wang and Leilei Shi 72
Assessing the Long-Term Environmental Risk of Trace Elements in Cropland Soils by Weiping Chen 74
Nutrient Cycling Dynamics in Perennial Bioenergy Crops by Jennifer Burks 76
A Study on the Mechanism of Mitigating Methane and Ingredient Benefits ofNo-Tillage in Rice-Duck Complex System
by Huang Huang 78
Mitigating Nitrogen-Induced Greenhouse Gas Emissions by Improving Nitrogen Management in Chinese Croplands
by Yao Huang 80
Greenhouse Gas Emissions and Pelicans: Ecological Accounting in BioenergyCropping Systems
by Sylvie Brouder 82
Soil Respiration and Nitrous Oxide Emissions After the Conversion of Wheat Cropland to Apple Orchard in Loess Plateau, China
by Xiaoke Wang 86
Ecosystem Cycles of Carbon and Nitrogen

6 | TABLEOFCONTENTS TABLEOFCONTENTS | 7
Mitigation of N2O Emissions from Upland Soil by Applying Modified N Fertilizerby Hui Xu 88
Teasing Apart the Influence of Past Land Use and Current Processes on the Controlsof Soil Organic Matter Dynamics and Aggregation in Eastern Deciduous Forests, USA
by Yini Ma 90
Greenhouse Gas Emissions from Forest Fires in Chinaby Chao Fu 92
Renewable Energy Policy and its Potential for Emission Reduction in Chinaby Lei Shen 96
The Global Sustainable Bioenergy Project: Reconciling Large-Scale Bioenergy Production with Social and Environmental Concerns
by Keith Kline 99
Integrated Bioprocessing Technology of Lignocellulose for Production of Ethanolwith Significant Energy Savings and Waste Reduction
by Jie Bao 103
Innovations in Sustainabilityby Pankaj Sharma 105
The Potentials of Next Generation Bio-Jet Fuels: A Multi-Agent Life CycleAssessment Approach
by Fu Zhao 107
Implications of Bioenergy Crop Production on Water Qualityby Indrajeet Chaubey 110
Agroecological Considerations When Growing Biomass by Jeffrey Volenec 113
Establishing a Feedstock Supply Chain for Cellulosic Ethanol in Tennessee by Samuel Jackson 115
Renewable Energy and Emission Reduction
Ecosystem Cycles of Carbon and Nitrogen

8 | TABLEOFCONTENTS TABLEOFCONTENTS | 9
Logistical Challenges of Supplying Biomass for Biopower Productionby Klein Ileleji 118
Forest Resources for Bioenergy in the Southeastern USA: Examples of Modeling toOptimize Bioenergy Plants and to Assess Sustainability
by Yun Wu 122
Optimization of Straw Utilization in China for Greenhouse Gas Mitigationby Fei Lu 124
Renewable Energy and Emission Reduction

8 | TABLEOFCONTENTS TABLEOFCONTENTS | 9
Colloid Transport and Mobilization Under Transient Unsaturated Flow Conditionsby Jie Zhuang 128
PAH-Degrading Mycobacteria: Distribution, Prevalence, and Evolutionby Jennifer DeBruyn 130
Arsenic Remediation and Remobilization in Water Treatment Adsorbentby Chuanyong Jing 133
Robustness of Archaeal Populations in Anaerobic Co-Digestion of Dairy and Poultry Wastes
by Qiang He 135
Preparation of Cationic Wheat Straw and its Application on Anionic Dye Removalby Lifeng Yan 137
Evolutionary Toxicology: Genetic Impacts of Contaminants to Fish and Wildlifeby John Bickham 138
Microbial Genes and Communities Involved in Mercury Transformations by Steven Brown 142
Sorption and Toxicity of Imidazolium-Based Ionic Liquids in the Absence and Presenceof Dissolved Organic Matter
by Jingfu Liu 144
Application of Omic's Approaches to Studying Toxic Algal Blooms in Large Freshwater Lakes
by Steven Wilhelm 146
Mercury Profiles in Sediments of the Pearl River Estuary and the SurroundingCoastal Area of South China
by Jianbo Shi 149
Enhanced Toxicity of Acid-Functionalized Single-Walled Carbon Nanotubes (SWCNTs)and Gene Expression Profiling in Murine Macrophages
by Bin Wan 151
Heterotrophic Bacteria Protect the Marine Cyanobacterium Prochlorococcus fromOxidative Damage
by Erik Zinser 153
Environmental Change and Health

10 | TABLEOFCONTENTS
The Role of Pocket Plasticity in the ERa Modulation by Arg394by Aiqian Zhang 157
Population Dynamics of an Ecologically Important Marine Bacterial Clade (Roseobacter) during an Induced Phytoplankton Bloom
by Alison Buchan 159
Reduction of Atmospheric Dioxins and Furans (PCDD/Fs) during theBeijing 2008 Olympic Games
by Yingming Li 163
Assessment of the Impact of Carboxylated and PEGylated Single-WalledNanotubes (SWNT) in an Anaerobic Environment
by Leila Nyberg 165
Environmental Change and Health

10 | TABLEOFCONTENTS

12 | ENERGY,ECOSYSTEM,ANDENVIRONMENTALCHANGE
by
GarySayler
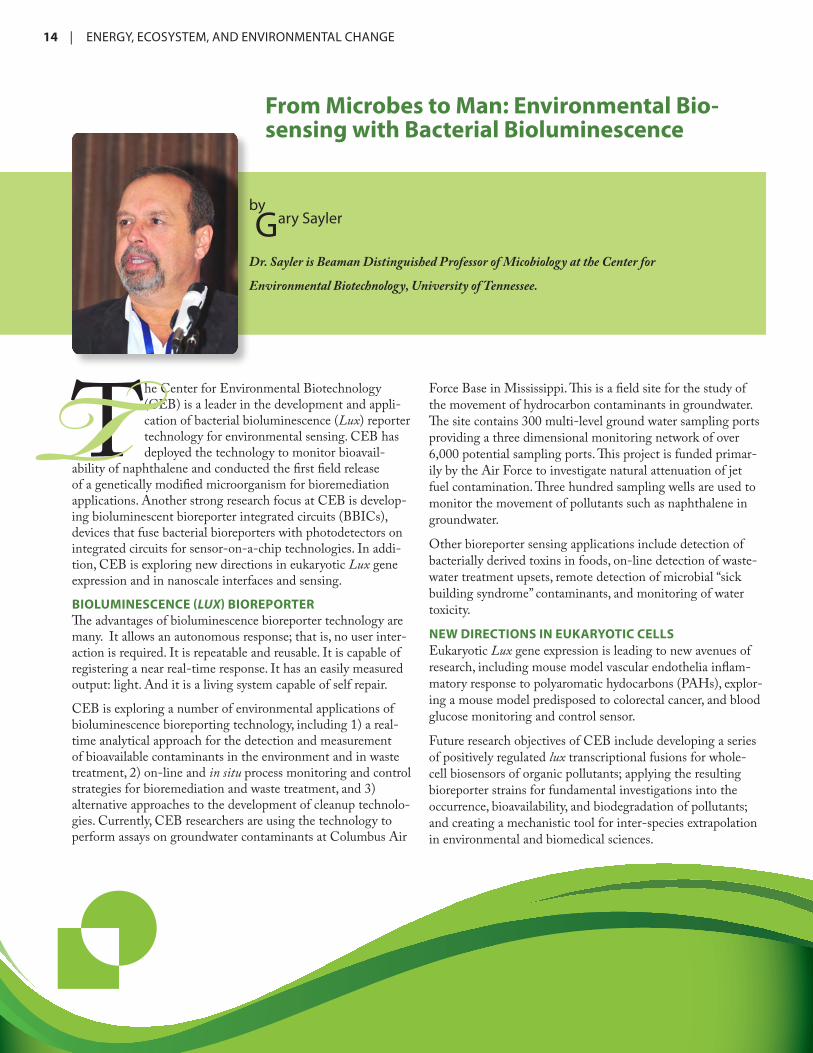
Dr. Sayler is Beaman Distinguished Professor of Micobiology at the Center for Environ-mental Biotechnology, University of Tennessee.
Energy, Ecosystem, and Environmental Change (E3C)
The issues surrounding environmental change strongly influence bioenergy strategies. The United States and China are the largest contribu-tors to global greenhouse gas (GHG) emissions. It is therefore essential that our two countries
work closely together in efforts to reduce emissions.
Between 2001 and 2007, according to the US Department of Energy, most of the anthropogenic emissions of carbon dioxide, 46 percent, was released into the atmosphere, 29 percent was sequestered in terrestrial systems, and 26 percent dissolved in the oceans.
Sources for GHG emissions of carbon dioxide, methane, and nitrous oxide are mixed, with power stations, industrial processes, transportation fuels, and agricultural byproducts representing the lion’s share followed by fossil fuel retrieval, processing, and distribution; residential, commercial, and other sources; land use and biomass burning; and waste disposal and treatment.
The ultimate bioenergy economy strives for carbon neutrality. A key driver in propelling the biofuels industry forward is the successful construction and operation of cellulosic biorefineries to demonstrate the technology and improve the economics.
There are also broader applications of energy bioscience to drive not just carbon sequestration, but also overall environmental sustainability. The rhizosphere interaction, for example, is an untapped resource. It is possible to enhance microbe-root
interactions and alter root content of plants to promote long-term carbon storage in plant biomass and soils. We need to further our understanding of the composition and dynamics of rhizosphere communities and improve the deep storage of stable organic carbon. It is possible to engineer the rhizosphere to improve stress tolerance and nutrient acquisition. Molecular improvements to the enzyme Rubisco, which is important in the fixation of carbon in soil, can also improve carbon seques-tration.
It is also important, however, to look at these improvements from a holistic point of view. When we consider the bioenergy crop switchgrass, for example, we can identify a number of benefits to the environment. Switchgrass, a native perennial, has a deep rooting system, so its root mass is an excellent car-bon sink. In addition to its ability to sequester carbon, looking above ground, we find this grass provides excellent habitat for nesting birds, other wildlife, and invertebrate species. Switch-grass also reduces erosion from surface water flow. It can be grown on marginal lands or rotated with other crops. It helps decrease wind flow and thus slows evaporation, and it is a na-tive perennial.
All things considered, a bioenergy crop like switchgrass helps reach the dual goals of carbon sequestration and environ-mental sustainability. As we improve our understanding of technological and economic improvements to reach the goal of carbon neutrality, we need to keep in mind the broader issues of environmental sustainability.
T

ENERGY,ECOSYSTEM,ANDENVIRONMENTALCHANGE | 13
14 | ENERGY,ECOSYSTEM,ANDENVIRONMENTALCHANGE
by
GarySayler
Dr. Sayler is Beaman Distinguished Professor of Micobiology at the Center for
Environmental Biotechnology, University of Tennessee.
From Microbes to Man: Environmental Bio-sensing with Bacterial Bioluminescence
The Center for Environmental Biotechnology (CEB) is a leader in the development and appli-cation of bacterial bioluminescence (Lux) reporter technology for environmental sensing. CEB has deployed the technology to monitor bioavail-
ability of naphthalene and conducted the first field release of a genetically modified microorganism for bioremediation applications. Another strong research focus at CEB is develop-ing bioluminescent bioreporter integrated circuits (BBICs), devices that fuse bacterial bioreporters with photodetectors on integrated circuits for sensor-on-a-chip technologies. In addi-tion, CEB is exploring new directions in eukaryotic Lux gene expression and in nanoscale interfaces and sensing.
BIOLUMINESCENCE (LUX) BIOREPORTERThe advantages of bioluminescence bioreporter technology are many. It allows an autonomous response; that is, no user inter-action is required. It is repeatable and reusable. It is capable of registering a near real-time response. It has an easily measured output: light. And it is a living system capable of self repair.
CEB is exploring a number of environmental applications of bioluminescence bioreporting technology, including 1) a real-time analytical approach for the detection and measurement of bioavailable contaminants in the environment and in waste treatment, 2) on-line and in situ process monitoring and control strategies for bioremediation and waste treatment, and 3) alternative approaches to the development of cleanup technolo-gies. Currently, CEB researchers are using the technology to perform assays on groundwater contaminants at Columbus Air
Force Base in Mississippi. This is a field site for the study of the movement of hydrocarbon contaminants in groundwater. The site contains 300 multi-level ground water sampling ports providing a three dimensional monitoring network of over 6,000 potential sampling ports. This project is funded primar-ily by the Air Force to investigate natural attenuation of jet fuel contamination. Three hundred sampling wells are used to monitor the movement of pollutants such as naphthalene in groundwater.
Other bioreporter sensing applications include detection of bacterially derived toxins in foods, on-line detection of waste-water treatment upsets, remote detection of microbial “sick building syndrome” contaminants, and monitoring of water toxicity.
NEW DIRECTIONS IN EUKARYOTIC CELLSEukaryotic Lux gene expression is leading to new avenues of research, including mouse model vascular endothelia inflam-matory response to polyaromatic hydocarbons (PAHs), explor-ing a mouse model predisposed to colorectal cancer, and blood glucose monitoring and control sensor.
Future research objectives of CEB include developing a series of positively regulated lux transcriptional fusions for whole-cell biosensors of organic pollutants; applying the resulting bioreporter strains for fundamental investigations into the occurrence, bioavailability, and biodegradation of pollutants; and creating a mechanistic tool for inter-species extrapolation in environmental and biomedical sciences.
T

ENERGY,ECOSYSTEM,ANDENVIRONMENTALCHANGE | 15

16 | ENERGY,ECOSYSTEM,ANDENVIRONMENTALCHANGE
by
GuiruiYuand
ShenggongLi
Dr. Yu is Deputy Director and Professor of Ecosystem Management at the Institute of Geographic Sciences and Natural Resources Research (IGSNRR), Chinese Academy of Sciences (CAS). Dr. Li is Vice-Director and Professor with the Synthesis Research Center, Chinese Ecosystem Research Network, IGSNRR, CAS.
Advances on the Carbon Cycle Research of China's Terrestrial Ecosystems
Over the past several decades, the interest in car-bon (C) sequestration by terrestrial ecosystems and in balancing the global C budget has been increasing. Terrestrial ecosystems account for over 40 percent of the emissions of C from fos-
sil fuels and are one of most important players in reducing the greenhouse effect. As the third largest country in terms of total land coverage, China occupies approximately 6.5 percent of the world’s land area and boasts diverse climates and biomes with latitudinal, longitudinal, and altitudinal gradients or belts.
The Chinese territory stretches about 5,500 km north to south and around 5,000 km east to west. There are tropical, subtropi-cal, temperate, medium temperate, and frigid temperate climate zones from the south of China to the north; and humid, semi-humid, and semiarid to arid areas from the southeast to the northwest. The Tibetan Plateau, also known as the Qinghai-Tibetan (Qingzang) Plateau, is the highest and biggest plateau and is covered by a high-altitude arid steppe interspersed with mountain ranges and large brackish lakes.
C sequestration by terrestrial ecosystems in China plays an im-portant role in balancing and reducing national greenhouse gas (GHG) emissions. Over past two decades, based on inventory data, ecological models, and land-surface flux measurements, many studies have been conducted to quantify the C sequestra-tion potential of China’s terrestrial ecosystems in terms of gross primary productivity (GPP), net primary productivity (NPP), net ecosystem productivity (NEP), and C stock in vegetation and soils.
CARBON SEQUESTRATION OF TERRESTRIALECOSYSTEMSProgress has been made in recent years in exploring the contri-bution of C sequestration of China’s terrestrial ecosystems to reductions in GHG emissions.
Many studies have shown that forests in China are a C sink on average for atmospheric carbon dioxide (CO2). The strength of the sink has strong spatio-temporal variability, and afforestation and reforestation play a critical role in this respect (Fang et al. 2001; Piao et al. 2009). Grassland and agricultural ecosystems act either as a C sink or as a C source that is highly dependent upon location and anthropogenic influences such as grazing, irrigation, and fertilization (Yu et al. 2006).
Wetlands in China possess a large capacity for C sequestra-tion, and the function of wetlands as a C sink has become weak as a consequence of over-exploitation and biodiversity loss (Duan et al. 2008). Land use change over the last two decades due to rapid economic growth, especially industrialization and urbanization, may create a large impact on the functioning and services of China’s terrestrial ecosystems. A great challenge is restoring disturbed and degraded ecosystems (including grass-lands, forests, crop fields, wetlands, etc.) to make them be better able to sequester atmospheric C in the long term. Meanwhile, a critical issue is to discern direct human effects and the impact of climate change on C sequestration. Future study focuses for C cycling include understanding how the C sequestration potential of China’s terrestrial ecosystems will vary in response to climate change and human disturbances and discovering efficient ways to optimize this potential in the upcoming two or three decades.
RESEARCH DIRECTIONS Past and current research in China has focused on 1) the spatio-temporal variability of the C sink and/or source of the main terrestrial ecosystems; 2) the biophysical controlling mechanisms for carbon sink/source variability and uncertainty; 3) the effects of global change and human activities on terres-
O

ENERGY,ECOSYSTEM,ANDENVIRONMENTALCHANGE | 17
trial ecosystem carbon pools and fluxes; and 4) the contribu-tion of the C budget of China’s terrestrial ecosystem to global climate change.
Early C cycle research in the 1990s focused on GPP or NPP of different regions and biomes, the storage and C cycling of typical ecosystems, and vegetation and soil C storage at the regional scale. In the last decade, research has continued and advanced, with a focus on the integrated study of the C cycle at the regional scale, adaptation of the C cycling process to global change, and research on the coupling of ecosystem C, nitrogen, and water and its regional regulation and management (Yu et al. 2010).
An overview of the storage and variation of soil organic carbon (SOC) in China shows that C density decreases from east to west and that a general southward increase is obvious for west-ern China, while carbon density decreases from north to south in eastern China. C density is lower than the world’s mean or-ganic C density in soil. SOC storage is 69.1-100.2 petrograms of C (Pg C), with an average storage of 87.78±9.98 Pg C (Yang et al. 2007). SOC in farmland and forest areas increased by 0.472 and 0.234 Pg, respectively over the period of the 1980s to the 2000s (Xie et al. 2007).
Approximately 51 percent of total cultivated soil surfaces in China have experienced C loss, and the most significant loss has been observed in the eastern part of northern China. Soil inorganic carbon (SIC) has increased 10 percent in irrigated soils in northwestern China. No significant change has been observed in soils in the southern and eastern parts of northeast China. The total loss of SIC in China was approximately 1.6 Pg C due to extensive human activity (Mi et al. 2008).
The location and mechanisms responsible for the carbon sink in northern mid-latitude lands are uncertain. Fang et al. (2001) used an improved method of estimating forest biomass and a 50-year national forest resource inventory in China to estimate changes in the storage of living biomass between 1949 and 1998. Their results suggest that Chinese forests released about 0.68 Pg C between 1949 and 1980, for an annual emission rate of 0.022 Pg C. C storage increased significantly after the late 1970s from 4.38 to 4.75 Pg C by 1998, for a mean accumula-tion rate of 0.021 Pg C per year, mainly due to forest expansion and regrowth. Since the mid-1970s, planted forests (afforesta-tion and reforestation) have sequestered 0.45 Pg C, and the average C density increased from 15.3 to 31.1 megagrams per hectare, while natural forests have lost an additional 0.14 Pg C, suggesting that carbon sequestration through forest man-agement practices addressed in the Kyoto Protocol could help offset industrial CO2 emissions.
A study on C storage of grasslands in China shows increases from the early 1980s to the late 1990s. One report showed that wetland has the highest C density, and also the highest variabil-ity. The C storage of grassland is high due to the large areas of grasslands in China. The total C stock in terrestrial ecosystems is about 111.6 Pg C (Fan et al. 2008).
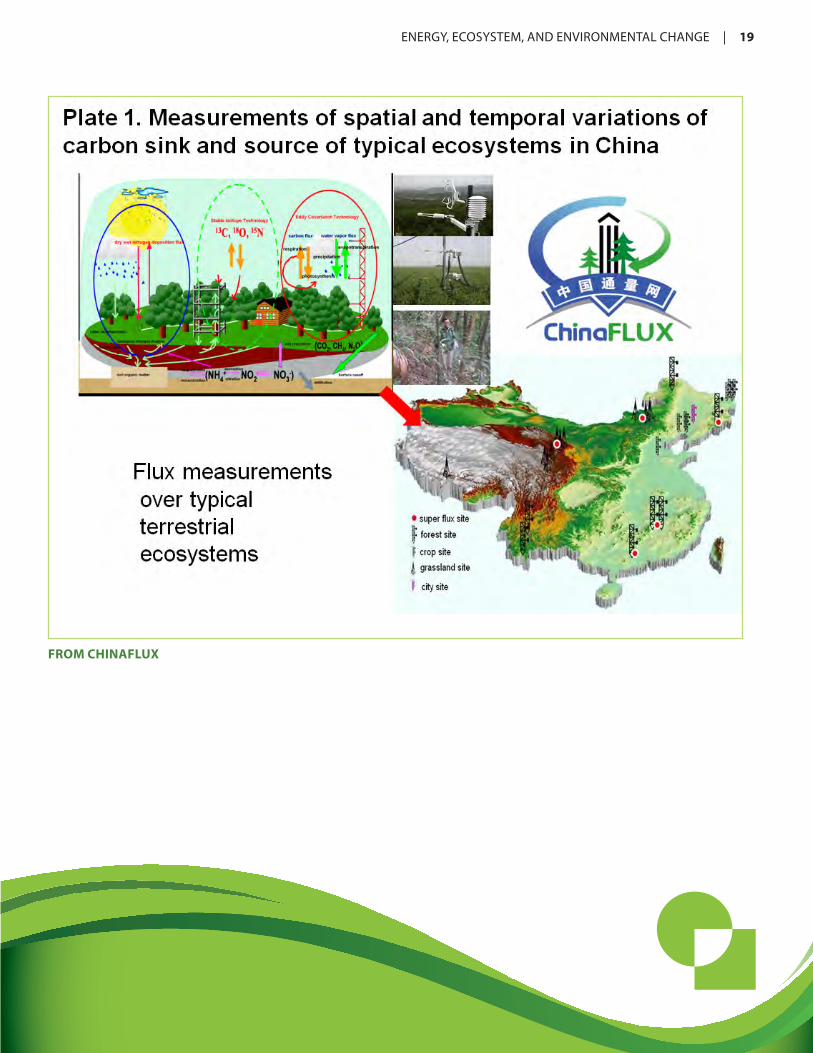
SPATIAL AND TEMPORAL VARIATIONSEddy covariance flux measurements reveal the spatial and tem-poral variations of C sinks and sources of typical ecosystems in China (Plate 1, from ChinaFLUX). • Carbon fluxes of typical ecosystems. Terrestrial C sinks are
distributed in forest ecosystems in eastern China, and the net C uptake of these forest ecosystems decreases from south to north. C sink strength in different types of grassland ecosys-tem in western China is about 1.4-0.6 tons per hectare (t/ha). However, these ecosystems show significant inter-annual variation and even shift from a sink to a source in some years. Annual net C uptake or net emission in grassland ecosys-tems is significantly lower than in forest ecosystems (Fu et al. 2006).
• Biophysical control of C fluxes. Strong solar radiation, which co-varies with temperature, might restrain net C uptake in grassland and forest ecosystems in northern China.
• Control of temperature on NEE. The temperature decides the transition between C emissions and C uptake, and there are differences among temperate grassland and forest ecosystems.
• Carbon fluxes in relation to co-variation in temperature and pre-cipitation. At a larger spatial scale, the C sink function of an ecosystem is decided by temperature and precipitation. The correlation between NEE and temperature is greater than between NEE and precipitation. Excess precipitation may be a restraint on ecosystem C sink function
• Old forests as carbon sinks. The Changbaishan temperate mixed forest (about 150 years old) in northeast China is a C sink (Zhang et al. 2006; Yu et al. 2008). In addition, more than 20 years of measurements of SOC suggest an old subtropical mixed forest in south China is still a carbon sink (Zhou et al. 2006). These studies challenge the hypothesis that old forest ecosystems are carbon neutral.
• Regional carbon budget estimates. Terrestrial ecosystems of China were a C sink from 1981-2000, and the annual average C uptake is about 5-14 percent of global terrestrial ecosystem carbon uptake.
• Carbon sequestration in agricultural soils. From 1980 to 2000, organic C density increased in the top 30 centimeters of agri-cultural soils. With reductions in crop residue removal and extension of no-till practices, it is estimated that from 2000 through 2050, it will be possible to increase C sequestration in soils by 2-2.5 Pg (Sun et al. 2010).
FUTURE ORIENTATION: REGIONAL C MANAGEMENT In the future, China’s research agenda will shift its focus to improve on C accounting and tracking. This will require exten-sive measuring, reporting, verifying, and predicting of C fluxes and stores (C footprints); increasing the use of satellite-based measurements of C processes; accounting for geographic vari-ability and uncertainty in carbon capture and storage or carbon
18 | ENERGY,ECOSYSTEM,ANDENVIRONMENTALCHANGE
capture and sequestration (CSS); and coupling of the cycles of C, N, and water.
We will be applying our knowledge of C cycle processes to practical C management and future prediction by assessing multi-function ecosystem services and their resilience, devis-ing strategies and techniques for enhancing CSS potential and capacity, mitigating and adapting to climate change, and estimating GHG emissions and their footprints, including sec-torial or provincial C budgets. Approaches for GHG emission reductions will include implementing methods for C seques-tration through storage in various pools such as plants, soils, the oceans, and geological repositories; heading for a low-C economy; and performing life-cycle assessments of successes, constraints and challenges for the actions
In 2010, the Chinese Academy of Sciences announced the implementation of one of the “Strategic Priority Research Programs” i.e. “Climate Change: Carbon Budget and Relevant Issues”. This Program is devoted to the regional C budget and its related issues, and is establishing the current status and future trajectory of C sequestration by China’s terrestrial and marine or coastal ecosystems; exploring measures to improve and promote C sequestration potential by ecosystems; con-structing demonstration experiments on C sequestration by various methods and techniques in critical areas; and measur-ing, reporting, verifying, and predicting C fluxes and stores.
REFERENCESDuan XN, Wang XK, Fei L, Ouyang ZY. 2008. Primary evalu-ation of carbon sequestration potential of wetlands in China. Acta Ecologica Sinica 28(2): 463-469.
Fan JW, Zhong HP, Harris W, Yu GR, Wang SQ, Hu ZM, Yue YZ. 2008. Carbon storage in the grasslands of China based on field measurements of above- and below-ground biomass. Climatic Change 86: 375-396.
Fang JY, Chen AP, Peng CH, Zhao SQ, Ci LJ. 2001. Changes in forest biomass carbon storage in China between 1949 and 1998. Science 292: 2320–2322.
Fu YL, Yu GR, Sun XM, Li YN, Wen XF, Zhang LM, Li ZQ, Zhao LA, Hao YB. 2006. Depression of net ecosystem CO2
exchange in semi-arid Leymus chinensis steppe and alpine shrub. Agricultural and Forest Meteorology 137: 234-244.
Mi N, Wang SQ, Liu JY, Yu GR, Zhang WJ, Jobbágy E. 2008. Soil inorganic carbon storage pattern in China. Global Change Biology 14(10): 2380-2387.
Piao SL, Fang JY, Ciais P, Peylin P, Huang Y, Sitch S, Wang T. 2009. The carbon balance of terrestrial ecosystems in China. Nature 458: 1009–1013.
Sun WJ, Huang Y, Zhang W, Yu YQ. 2010. Carbon se-questration and its potential in agricultural soils of China. Global Biogeochemical Cycling 24: GB3001, doi:10.1029/2009GB003484.
Xie ZB, Zhu JG, Liu G, Cadisch G, Hasegawa T, Chen CM, Sun H,. Tang HY, Zeng Q. 2007. Soil organic carbon stocks in China and changes from 1980s to 2000s. Global Change Biol-ogy 13(9): 1989-2007.
Yang YH, Mohammat A, Feng JM, Zhou R, and Fang JY. 2007. Storage, patterns and environmental controls of soil organic carbon in China. Biogeochemistry 84: 131–141.
Yu GR, Li XR, Wang QF, Li SG. 2010. Carbon storage and its spatial pattern of terrestrial ecosystem in China. Journal of Resources and Ecology 1(2): 97-109
Yu GR, Wen XF, Sun XM. 2006. Overview of ChinaFLUX and evaluation of its eddy covariance measurement. Agricul-tural and Forest Meteorology 137: 125–137.
Yu GR, Zhang LM, Sun XM, Fu YL, Wen XF, Wang QF, Li SG, Ren CY, Song X, Liu YF, Han SJ, Yan JH. 2008. Environ-mental controls over carbon exchange of three forest ecosys-tems in eastern China. Global Change Biology 14: 2555–2571.
Zhang LM, Yu GR, Sun XM, Wen XF, Ren CY, Song X, Liu YF, Guan DX, Yan JH, Zhang YP. 2006. Seasonal variations of carbon budgets in typical forests along the eastern forest tran-sect in China. Science in China (Series D) 49 (Supp.II): 47–62.
Zhou GY, Liu SG, Li Z, Zhang DQ, Tang XL, Zhou CY, Yan JH, Mo JM. 2006. Old-growth forests can accumulate carbon in soils. Science 314: 1417.
ENERGY,ECOSYSTEM,ANDENVIRONMENTALCHANGE | 19
FROM CHINAFLUX
20 | ENERGY,ECOSYSTEM,ANDENVIRONMENTALCHANGE
by
BarryD.Bruce
Dr. Bruce is Professor and Associate Director, Sustainable Energy and Education Re-search Center, Department of Biochemistry, Cellular and Molecular Biology, Univer-sity of Tennessee.
Funneling Photons: Two Parts Nature and One Part Material Science
The strategies for harvesting light include those that are biotic and those that are abiotic. An electrical engineer designing a photovoltaic (PV) device or cell would hope to transform photons to generate electrons and thus electricity. That
process is not unlike what nature does in the process of pho-tosynthesis, but,nature does not use wires and does not make electricity. Nature does, however use an electrical current to produce biologically useful forms of energy such as ATP.
At the Sustainable Energy and Education Research Center at the University of Tennessee (UT), we are interested in building new models based on nature’s architecture. This work involves scientists from a host of institutions, including researchers at the Massachusetts Institute of Technology’s Department of Molecular Engineering and Computer Science and Biomedical Engineering, and UT’s Departments of Biochemistry, Cel-lular and Molecular Biology and Chemical and Biomolecular Engineering.
What we call photosynthetic PV in our group is not a biomi-metic or synthetic chemistry. We actually grow plants or algae that may build the biochemical complex that we hope can perform at a level approaching the efficiency of photosynthe-sis. Essentially, we need to harvest more light to increase the optical density. In addition, we must extend the spectrum to capture and use all of the solar spectrum.
Global energy consumption on the planet is large and growing, and we could quickly deplete our available energy supplies from oil, coal, and gas. Renewable sources of energy currently rep-resent a very small fraction of total sources. There is, however, a tremendous amount of solar energy available, approximately a 10,000-fold excess of what we use. By contrast, petroleum, natural gas, and oil represent 85 percent of current energy use, and those sources come from the accumulated yield of the past 4 billion years of photosynthesis. The world’s electrical needs grow faster than other needs, and we will soon need a new source: solar driven PVs
FROM CONVENTIONAL PHOTOVOLTAICTO BIOFACTORIES The currently available PV devices have global limitations on critical metal components, and they are not sustainable from an economic, geological, and geopolitical perspective. However, if we can use the biologically produced components of photo-synthesis, the light reactions of photosynthesis that make up these bio-hybrid devices would have over 37 percent efficiency because of losses due to limited spectral use (51 percent), losses from reflected or transmitted light (4 percent), and from photo-chemical inefficiencies (6 percent).
These limitations raise interesting questions about a sustain-able solution to our growing energy demand. I look at the issue from the perspective of a biologist, and seek solutions from my area of expertise: plant photosynthesis. Could we possibly use plants or algae as self-organizing biofactories to produce the photosynthetic reaction centers that can be used outside the constraints of plant growth and reproduction. If so, we could transform the process from one growth cycle to potentially provide hundreds of photocycles.
Photosynthesis is the major energy conversion scheme on the planet and is the result of more than 3 billion years of evolu-tion. Photosynthesis takes place in special organelles, Chlo-roplasts. The process is orchestrated by the coordination of distinct macromolecular complexes, or reaction centers, each capable of highly efficient light harvesting, charge separation, and electron transport.
The path we are pursuing is to take two technological areas, the biological area and the material science area, and join them to capitalize on the ability of photosynthetic complexes to both harvest light and create a charge separation and to then transfer that charge to an organic or inorganic semiconductor or electri-cal circuit that will create storable electrical energy. This system is a sort of fuel cell that could be used to generate electrical current.
T

ENERGY,ECOSYSTEM,ANDENVIRONMENTALCHANGE | 21
To that end, we hope to create a shortcut. We will not grow the plant to produce brown or black biomass; rather we hope to take what makes a leaf appear green and utilize it directly, not via biomass accumulation past or present, for a new source of sustainable bio-derived energy.
ORGANIC SEMICONDUCTORSWhat we need to show at this point is whether photosynthetic reaction centers can be integrated into solid-state devices such that they preserve their functionality and become coupled elec-tronically to organic semi-conductors. There are two problems to solve. We must be able first to maintain the functionality, and to that end we will need to break new ground in designing these bio-hybrid complexes. Second we must find out whether such a device can be coupled electronically to a series of semi-conductors.
So far we have had some success working with three different organisms. The simplest system is a purple bacteria, Rhodo-bacter sphaeroides. We have also worked with spinach and with a cyanobacterium that is a model for the study of photosynthesis, Thermosynechococcus elongatus. Although the organisms are dif-ferent their photosynthetic strategy is really the same. The idea is to harvest protein complexes from these plants or bacteria, tether the complexes to a solid support, and orient complexes with a uniform charge transfer vector.
We found that the solid state bacterial reaction center does in fact show light-driven PV activity yet with low efficiency. The real goal was to see if these reaction centers could in fact
maintain the photochemistry and be functional if we illuminate them. This is the first time anyone has been able to take a bio-logical system and show it to be photovoltaic. The spinach actu-ally performed better than the two bacteria, proving once again that Popeye was right, spinach can give you power. Due to the complexity of the system, however, this approach does not have good scalability, so the technology is as yet quite limited.
Another question we want to answer is whether we can use the highly efficient light harvesting properties of the self-organized dyes in phycobiliosomes, the light harvesting antennae of cyanobacteria and red algae, to build renewable, non-tracking luminescent solar concentrators. If this is possible, it may al-low very costly third and fourth generation PV material to be conserved and allow concentrators to deliver light energy to a small surface area.
We have already completed studies of the photosynthetic capabilities of spinach. We are currently extending our work on Thermosynechococcus elongatus. In addition to photovoltaics we are also interested in the possibility of incorporating a thermo-stable hydrogenase into the system to allow a sustainable source of light-driven hydrogen production. These are just a few of the pathways we are taking to realize the goal of funneling photons into usable energy.
22 | ENERGY,ECOSYSTEM,ANDENVIRONMENTALCHANGE
by
PanGang
Dr. Pan is a Professor of Environmental Chemistry with the Research Center for
Eco-Environmental Sciences, Chinese Academy of Sciences.
Cutting Edge Technologies to Combat a Natural Water Quality Crisis: Turning Algal Blooms into In-situ Resources for Sustain-able Ecological Restoration
One of the worst symptoms of eutrophication is harmful algal blooms (HABs). When HABs occur, the exchange of sunlight and oxygen stops, dissolved oxygen is depleted, toxins are released, public health is threatened, massive
fish kills occur, aquatic plants die, and drinking water safety is threatened. Effective HAB control remains a difficult scientific challenge. In 2007, Science magazine published two articles just to report the severe HAB problem in Lake Tai in China, without mentioning any solutions. HAB control is also an important strategic goal elsewhere in China.
In 2008, the Chinese government funded a 130 billion RMB (20 billion US$) project on Lake Tai in Jiaingsu Province in eastern China, and in recent years the government has spon-sored other multi-billion dollar projects to restore degraded shallow lakes throughout China. These studies are important for the sustainability of economic and industrial development in this country.
My colleagues and I at the Research Center for Eco-environ-mental Sciences have recently discovered a new technological principle to combat natural water quality crises. Our approach has proven capable of turning HABs into resources or energy for sustainable ecological restoration in shallow lakes. We were able to overcome the difficulties in controlling HABs and eutrophication, improve water quality, and achieve ecological restoration in Lake Tai quickly and efficiently. The novel tech-nology, modified local soil technology, solves all these problems at once. We have demonstrated the success of the technology by engineering field trials at Lake Tai.
OVERCOMING BARRIERS TO HAB CONTROLUntil now, it has been very difficult to control HABs on a large scale. This is because promising HAB control technologies should ideally satisfy several criteria simultaneously. Current technologies, however, can satisfy only part of these criteria, and all of them have limitations. Using chemicals such as algaecides
is not only expensive, but also has adverse effects on biological and ecological systems. Algaecides can also cause the sud-den release of cyanotoxins into the water. Using mechanical methods to harvest algae is safe, but it is expensive and not very efficient. Using biological methods such as fish to eat algae is slow and is not useful for control of eutrophication. Ecologi-cal engineering is so far the best way to control HABs, but it is expensive and slow and therefore cannot be used for emergency treatment of HAB.
HAB is not just a problem of the algae itself, it relates to water and sediments in the entire aquatic environment. No single principle-based technology can cope with such a complex issue. Innovative multi-functional and multi-disciplinary integrated technology is needed in order to meet these criteria. For long-term effects, a HAB control method must also be able to solve the root problem of eutrophication, which is closely related to the issue of ecological restoration in general.
It is well recognized that there are two alternative stable states in shallow lakes: vegetation dominated clean lakes, and algae dominated dirty lakes. The shift between the two states is not reversible. According to a long-term study by Scheffer et al. published in 2002 in Nature, vegetation in Lake Veluwe col-Veluwe col- col-lapsed as total phosphorus (TP) increased over 0.2 parts per million (ppm). To restore the vegetation, one needs to reduce the TP level. But it cannot be restored at the level at which the vegetation collapsed, it can only be restored at a much lower TP levels. It takes 15 years for the water quality to improve significantly (TP less than 0.1 ppm). The key is water quality improvement, which is naturally very slow due to the internal pollution from the sediment even if there is no external pollu-tion.
We have developed a safe and low cost technology that can improve water quality quickly and hence accelerate this process of ecological restoration so that water and sediment quality improvement effects become sustainable.
O

ENERGY,ECOSYSTEM,ANDENVIRONMENTALCHANGE | 23
MODIFIED LOCAL SOIL (MLS) TECHNOLOGYWater and sediment quality are critical for reversing eutrophi-cation and for ecological restoration. It is essential to improve water and sediment quality quickly at a very large scale with low cost technology. Our study aimed to determine whether modified local soil (MLS) can do the job while satisfying these criteria simultaneously. It is easy to see that local soils around a lake are cheap, readily available, and ecologically safe to the lake, but soils usually do not work for HAB removal, for water and sediment quality improvement, or for ecological restora-tion. Therefore we needed to develop new technologies to meet these multiple requirements.
The technology is to use safe and biodegradable natural poly-mers or proteins (such as chitosan) as modifiers to make soil particles with four new functions. First, we want the modified soil particles to flocculate the algae cells so that they can be removed from the water column and sink down to the lake bottom. Second, we hoped the flocs could remove and trans-fer both particulate and dissolved pollutants to the sediment so that water quality could be improved. Third, we wanted to develop a modified soil method that can effectively cover and seal the flocs into the sediment and use them as fertilizers for the growth of submerged vegetation. Finally, after the water and sediment quality are improved, we hoped the seeds of macrophytes, aquatic plants that are essential to a healthy lake, could be carried into the modified soils and restore the lake to a vegetation dominated state.
We wanted to accomplish all four of these functions to switch the lake from an algae dominated state to a lake dominated by submerged vegetation using local soil particles. To that end, we had to modify the soil particles. The technology uses floccula-tion principles that can make soil particles effective in sinking algae cells. We used an O2 nanobubble modified clay method that degrades pollutants and transfers particulate and dissolved pollutants from the water into the sediment. A soil-covering method covers and seals the flocs and prevents re-suspension. A capsulated seeding technique then restores the submerged vegetation in the sediment.
Some of the results of our work have been published (1-11), but many studies are ongoing. A few examples will illustrate some of the progress we have made recently using new technol-ogies to restore the healthy ecological function of shallow lakes.
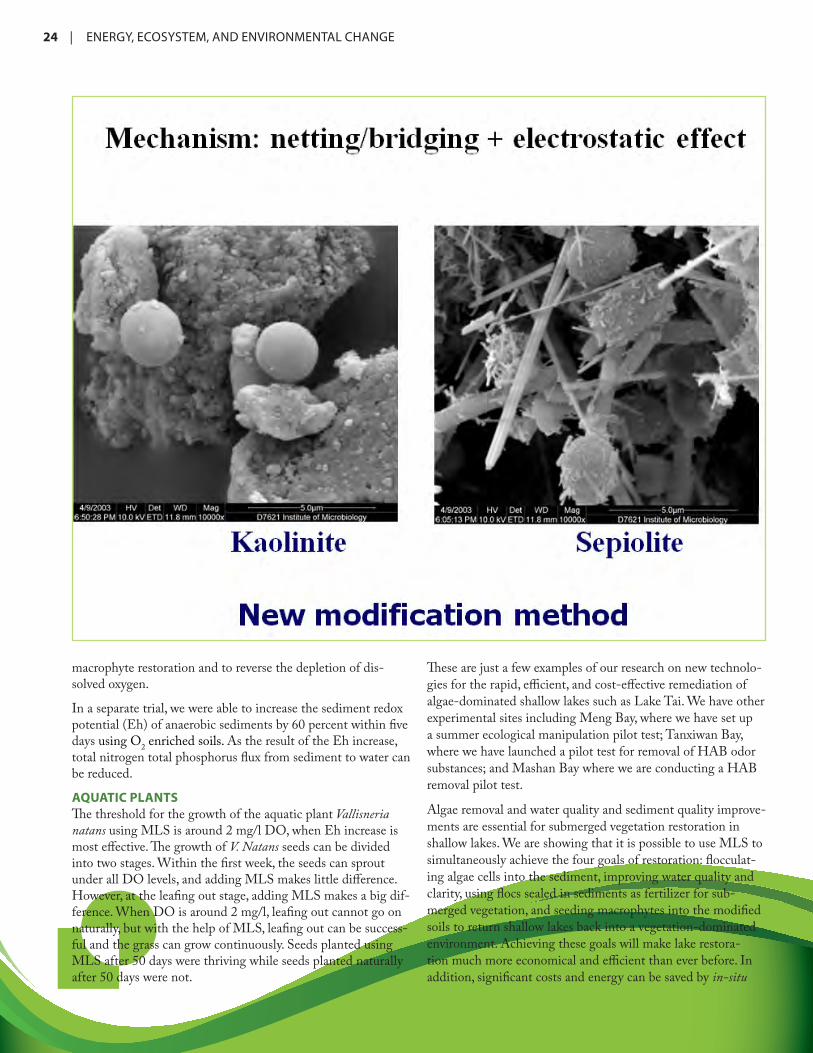
PHYSICAL CHEMICAL FLOCCULATIONWe are beginning to understand the mechanism of physical/chemical flocculation and to classify clays and minerals in freshwater. We studied the flocculation properties of 26 com-mercially available clays. Even at very high load of 700 mil-ligrams per liter (mg/l), most clays are not effective at flocculat-ing cyanobacterial cells, but a few of them can do so without any modification at this load.
We performed clay loading tests using 26 commercially available clays. When the load was reduced to 100 mg/l, the removal efficiency for most clays tested fell below 40 percent,
except sepiolite, which maintained a removal efficiency of about 90 percent. We found that the mechanism for sepiolite to flocculate algae cells is through a netting-bridging effect. This has led us to propose a new modification method using a natural netting and bridging polymer.We found that chitosan modification method can turn most clays and soils into highly effective flocculants for algae removal. When clays and sands that are normally ineffective in flocculating algae are modified by chitosan, they indeed became highly efficient in flocculating algae cells. This can be accomplished using a very low dosage, 11 mg/l. This finding allows us to remove HAB using local soils.
WATER AND SEDIMENT IMPROVEMENTIn order to improve water and sediment quality, we proposed a patented technology by which large amounts of gaseous (O2) nanobubbles can be loaded onto soil/clay porous surfaces without using any chemicals. Such a clay suspension can have a very high O2 content, which is crucial for water quality im-provement. The O2 enriched soils and clays can be purposely delivered to the lake bottom, which is very important for cover-ing and reversing the anoxic conditions of polluted sediment and for decomposing pollutants
To get a rough idea of how much O2 can be loaded onto clays, we did a fish test. When we put the fish into a sealed bottle of water where dissolved oxygen (DO) was very low, the fish died very quickly from lack of O2. When we put a 5 ml suspension of oxygen enriched MLS in the sealed bottle, the fish were still alive after 24 hours. This means there is a substantial amount of O2 contained in the suspension.
Using scanning transmission X-ray microscope (STXM) tech-nology, we were able to prove for the first time that O2 oxygen nanobubbles did exist on clay surfaces. We were able not only to image the nanoscaled bubbles on the clay surfaces; we also proved using the synchrotron spectrum that the red bubbles are oxygen.
In addition, we found that we could remove the algae odor substance geosmin, which is produced by cyanobacteria, using ozone nanobubble clays.
WATER CLARITY IMPROVEMENT We conducted water clarity experiments using samples of pol-luted blackwater from Lake Tai. To one sample we added 0.1 mg/l of the coagulant PAC (poly aluminum chloride) and to another sample 0.06 mg/l of MLS. The PAC sample became slightly more clear, and some sediment formed in the bottom of the samples, but the results using MLS were dramatic. The water was almost completely clear, and all the solids settled as sediment to the bottom.
In another experiment performed in simulated tanks in the laboratory, we wanted to see how modified soils can change the anoxic water-sediment interfaces quickly and help restore submerged macrophytes. We were able to use MLS to induce
24 | ENERGY,ECOSYSTEM,ANDENVIRONMENTALCHANGE
macrophyte restoration and to reverse the depletion of dis-solved oxygen.
In a separate trial, we were able to increase the sediment redox potential (Eh) of anaerobic sediments by 60 percent within five days using O2 enriched soils. As the result of the Eh increase, total nitrogen total phosphorus flux from sediment to water can be reduced.
AQUATIC PLANTSThe threshold for the growth of the aquatic plant Vallisneria natans using MLS is around 2 mg/l DO, when Eh increase is most effective. The growth of V. Natans seeds can be divided into two stages. Within the first week, the seeds can sprout under all DO levels, and adding MLS makes little difference. However, at the leafing out stage, adding MLS makes a big dif-ference. When DO is around 2 mg/l, leafing out cannot go on naturally, but with the help of MLS, leafing out can be success-ful and the grass can grow continuously. Seeds planted using MLS after 50 days were thriving while seeds planted naturally after 50 days were not.
These are just a few examples of our research on new technolo-gies for the rapid, efficient, and cost-effective remediation of algae-dominated shallow lakes such as Lake Tai. We have other experimental sites including Meng Bay, where we have set up a summer ecological manipulation pilot test; Tanxiwan Bay, where we have launched a pilot test for removal of HAB odor substances; and Mashan Bay where we are conducting a HAB removal pilot test.
Algae removal and water quality and sediment quality improve-ments are essential for submerged vegetation restoration in shallow lakes. We are showing that it is possible to use MLS to simultaneously achieve the four goals of restoration: flocculat-ing algae cells into the sediment, improving water quality and clarity, using flocs sealed in sediments as fertilizer for sub-merged vegetation, and seeding macrophytes into the modified soils to return shallow lakes back into a vegetation-dominated environment. Achieving these goals will make lake restora-tion much more economical and efficient than ever before. In addition, significant costs and energy can be saved by in-situ
ENERGY,ECOSYSTEM,ANDENVIRONMENTALCHANGE | 25
transferring abundant nutrients and organic pollutants into sediment and converting them into fertilizers for the growth of submerged macrophytes. Much more work is needed on the long term ecological responses of these new techniques through whole lake experiments.
REFERENCES1. Pan G et al., (2006a) Removal of cyanobacterial blooms in Taihu Lake using local soils. I. Equilibrium and kinetic screening on the flocculation of Microcystis aeruginosa using commercially available clays and minerals, Environ Pollut 141, 195-200
2. Pan, G et al., (2006b) Removal of harmful cyanobacterial blooms in Taihu Lake using local soils. III. Factors affecting the removal efficiency and an in situ field experiment using chitosan-modified local soils, Environ Pollut 141, 206-212
3. Pan, G et al., (2011a) Modified local sands for the mitigation of harmful algal blooms, Harmful Algae, 10, 381-387
4. Pan, G et al., (2011b) In-lake algal bloom removal and sub-Pan, G et al., (2011b) In-lake algal bloom removal and sub-merged vegetation restoration using modified local soils, Ecol Eng. 37(2): 302-308
5. Pan, G., et al., In-situ multilayer sediment control to prevent nutrient release from the sediment using modified local soil technology, Ecol Eng., 2011 (under review)
6. Wang, D., Pan, G., Th e fate of cyanobacteria after fl occula-Wang, D., Pan, G., The fate of cyanobacteria after floccula-tion using modified local soil technology, Hydrobiologia, 2011 (under review)
7. Yan, QY.et al., (2009) Plankton Community Succession in Artificial Systems Subjected to Cyanobacterial Blooms Removal using Chitosan-Modified Soils. Environmental Microbiology, 58(1), 47-55
8. Yan, H., Pan G., Zou, H., Li, X., Chen, H., (2004) Effective removal of microcystins using carbon nanotubes embedded with bacteria, Chinese Science Bulletin, 49(16):1244-1248.
9. Yuan, XZ., Pan, G., Chen, H., Tian, BH., (2009) Phosphorus fixation in lake sediments using LaCl3-modified clays. Ecol Eng., 35, 1599-1602.
10. Zhang ML, Pan G., Yan H. (2010) Microbial biodegradation pathways of Microcystin-RR by bacterium Sphingopyxis sp,J Environ Sci, 22(2), 168-175
11. Zou, H, Pan, G, Chen, H, Yuan, X (2006) Removal of cyanobacterial blooms in Taihu Lake using local soils. II. Ef-fective removal of Microcystis aeruginosa using local soils and sediments modified by chitosan, Environ Pollut 141, 201-205

26 | ENERGY,ECOSYSTEM,ANDENVIRONMENTALCHANGE

Mic
robi
al E
colo
gy
and
Tec
hnol
ogy

28 | ENERGY,ECOSYSTEM,ANDENVIRONMENTALCHANGE
TDr. Rials is the Director of the Center for Renewable Carbon at the University of Tennessee’s Institute of Agriculture.
The Center for Renewable Carbon: Advancing the Green Economy
by Timothy G. Rials
The Center for Renewable Carbon (CRC) at the University of Tennessee’s (UT) Institute of Agri-culture (UTIA) was created in response to an in-tensification of research on bioenergy within the university, corresponding to the expanded global
effort. The name of the center reflects a much broader scope of research at UTIA as we begin to recognize the many similari-ties between agriculture and forest operations. Switchgrass, miscanthus, and other types of agricultural bioenergy crops are lignocellulosic biomass. Chemically, they are very similar to the wood materials we have dealt with in the past at the Tennessee Forest Products Center, one of three centers at UTIA that were consolidated into the CRC in 2010.
Part of the goal in establishing the center is to explore the ex-panding markets for a broader class of lignocellulosic materials, but the central function of CRC is to coordinate all of UTIA’s research and development efforts in the field of renewable carbon systems. The novelty of this market area for bioenergy applications crosses all disciplines and departments of UTIA, from agricultural economics to biosystems engineering to chemistry and materials science.
The work of the CRC spans the chain of supply logistics, from new crop development and genetic engineering, to chemistry directed at improved pretreatment and biochemical treatments, to market development and distribution. The new center will play an important role in educating and developing a new workforce. One of the practical challenges for the bioenergy or biofuels industry is to develop in our region, and in the nation, a trained workforce and to provide information in a format useful to different sectors of the chain. Very few companies in the business of converting biomass to fuels are familiar with the agricultural or the forest sectors. As such, an important task is to help these different partners identify our shared needs and opportunities.
The CRC is a natural extension of the wood products arena. UTIA has invested at least 15 years of research and develop-ment (R&D) in forest biomaterial, including work on the chemistry of lignins. With this newly created center, we want to develop new network opportunities and ways to move beyond incremental steps to quantum leap changes needed for this new industry to emerge.
RENEWABLE CARBON: A NEW DAYRenewable carbon is the structural biomass or non-food component of a plant produced from photosynthesis—ligno-cellulose. Historically, lignocellulose was sourced for materials applications. Today, there is an expanded emphasis on energy, fuels, and chemicals. The convergence of the agricultural and forest sectors is expanding the toolbox for carbon management.
CRC has a multi-faceted vision: to coordinate UTIA’s renew-able carbon systems R&D; spur innovations in process technol-ogy to produce fuels, materials, and chemicals from renewable carbon; support production and conversion system demonstra-tions; educate and train the new workforce; and transfer knowl-edge on renewable carbon technologies to a broad client base.
In its expanded leadership role, CRC is now creating a new lab dedicated to bioenergy, expanding the capacity for R&D of biofuels. This lab will provide a central site for researchers to gather and generate ideas for new research directions. The Bioenergy Science and Technology (BeST) lab is scheduled for occupancy by October 2010. State-of-the-art instrumentation is made possible through partnership with Perkin-Elmer Life Sciences.
CURRENT CRC PROGRAMSFour projects major programs are currently supported by CRC.
The UT Biofuels Initiative is a major effort funded by the State of Tennessee to demonstrate the technical and economic fea-sibility of cellulosic fuels. The initiative involves a partnership between UT, Genera Energy, and DuPont-Danisco Cellulosic Ethanol. This demonstration project targets the practical chal-lenges associated with the logistics of supply chain for new crops and for conversion technologies.
The Sun Grant Initiative is a federally funded, multi-faceted program to accelerate the development of alternative energy from renewable carbon sources. Administered by five universi-ties, including UT, and its partners including the US Depart-ments of Transportation, Agriculture, and Energy, the pro-gram allows regional influence and expands the impact of our research efforts across the region and the nation.
The Wood Utilization Research Grant is a program sponsored by the US Department of Agriculture (USDA) to support research and development innovations in wood and related

ENERGY,ECOSYSTEM,ANDENVIRONMENTALCHANGE | 29
material systems to improve the competitive position of the forest products industry. Fourteen land-grant universities across the nation conduct the program.
The Bioenergy Production and Carbon Cycling program, also coordinated by USDA, aims to assess the effect of land-use history on soil carbon sequestration and below-ground ecology of switchgrass production. In addition, the program is inves-tigating the chemical and physical structure of biochar from different sources, and its impact on productivity.
In addition to these four programs, the CRC runs a competi-tive grants program in the southeastern United States. The Sun Grant Center is a federally funded program targeting research funds to the region’s universities, and is focused on bioenergy/biofuel issues. Our funds are fairly uniformly distributed across several key topics, with about 35 percent dedicated to conver-sion technologies, including biochemical and thermochemical technologies; 30 percent in feedstock preparation, largely in the area of preprocessing; and the remainder devoted to new crop development, sustainable production, and system logistics. Our portfolio as reflected by requests for proposals in 2007 and 2009 is $4.3 million in projects across the region’s land-grant
institutions, and additional proposals are under development for release in January 2011.
The Regional Feedstock Partnership (RFP), a collaboration with the US Department of Energy (DOE) Office of Bio-mass Programs, focuses on sustainable feedstock production for biofuels and bioenergy. Feedstock categories include corn stover, agricultural residues, forest residues, herbaceous crops, and woody crops. One part of this program is assessing the data already available. In the United States, spikes of research interest in the 1970s, 80s, and 90s have generated information, much of which is becoming a bit lost in the literature. The RFP is synthesizing this data and determining where the informa-tion gaps are. This review has allowed us to initiate a series of field trials looking at new germplasm material that has become available, and assessing biomass yield and other ecological and environmental impacts.
A major consideration in the feedstock arena is targeting new information needs for the availability of a sustainable supply of feedstock. One innovation that has resulted from our modeling research work for the SunGrant Initiative and DOE is BioSAT, a new biorefinery site evaluation tool that emphasizes economic

30 | ENERGY,ECOSYSTEM,ANDENVIRONMENTALCHANGE
forces such as transportation networks and resource competi-tion for agricultural and forest biomass. Another program, POLYSYS, is a modeling program that considers land use change as a function of economic considerations. POLYSYS is the standard bearer for land-use allocation models in the agricultural sector. We recently introduced a new module to consider agricultural and forest biomass and simultaneously allow for apples-to-apples analysis of biomass production from both sectors. POLYSYS highlights the convergence of forest and agricultural operations in the realm of bioenergy.
THE BIOFUELS INITIATIVEThe UT Biofuels Initiative is a large-scale demonstration proj-ect with four objectives.
• Build an energy crop supply chain to demonstrate the estab-lishment of a dedicated biomass energy crop supply chain with farmers. For eastern Tennessee, the chosen energy crop is switchgrass.
• Build a strong biofuels and bioproducts R&D program that will establish premier research, development, and deployment capabilities in biofuels and bioproducts.
• Demonstrate the feasibility of a cellulosic ethanol biorefinery to demonstrate the precommercial production of ethanol from switchgrass.
• Move to the commercial scale, which has not been done as yet, to develop a viable, sustainable, long-term path to com-mercialization of cellulosic biofuels in Tennessee. For this program to be considered a success, we must move from the demonstration scale to the commercial scale.
In December 2009, DuPont Danisco Cellulosic Ethanol (DDCE) began operating a cellulosic ethanol biorefinery in collaboration with Genera Energy, a UT company. The plant is located in the 32-acre Niles Ferry Industrial Park in Mon-roe County, Tennessee. Genera Energy owns the facility, and DDCE operates it on a daily basis. The plant is capable of producing 250,000 gallons of ethanol per year; at that volume, the plant is still very much a demonstration-scale R&D facility and a long term R&D investment for UT and DDCE. It is capable of processing multiple feedstocks such as corn cobs and switchgrass. The plant is fully operational and includes a process development unit (PDU) that is essentially a 1:100 scale mockup of the demonstration facility. We now have the capacity to go from the laboratory scale to the pilot, demon-stration, and commercial scales. This facility will generate the commercial information necessary to make decisions about moving from a demonstration to a commercial operation.
From May 2008, when DDCE’s initial baseline information on the cost of enzymes used in production was gathered, through November 2009, costs were cut in half, very real progress to-ward our commercial target for 2012, which is set at 12 percent of initial costs. The CAPEX, the amount of money per gallon required to build the plant, is on the order of $5 to $7 at this
point. The cost of manufacturing has been reduced from $3 per gallon in 2008 to just over $2 in 2009. The project is on track to achieve the 2012 commercial target of $1.50. The engineering data from this line of research will allow engineers to ramp up to the commercial scale, on the order of 40 million gallons per year.
R&D CAPABILITYCRC’s biofuels initiative has created a unique laboratory en-vironment and an opportunity to resolve challenging barriers. It is important to fully utilize this resource by engaging the appropriate skills, maximizing collaborative relationships, and drawing on partnerships. We will provide vital information on switchgrass, a dedicated bioenergy crop we need to know more about. More information on complex questions related to logis-tics and the economic feasibility of cellulosic biofuels is needed to allow development of commercial biorefineries.
With our large planting of switchgrass, 5,000 to 6,000 acres, a major effort targets the uncertain environmental impacts, whether adverse or beneficial. We consider switchgrass benefi-cial compared to corn and some other crops, but information so far is either lacking or inadequate. The CRC and Genera Energy are partnering with Oak Ridge National Laboratory’s (ORNL) Center for BioEnergy Sustainability and its Envi-ronmental Sciences Division, and with the multi-stakeholder Council on Sustainable Biomass Production to more complete-ly assess the environmental and ecological effects of switchgrass. An interdisciplinary research team of engineers, economists, ecologists, and chemists is working to gain new insights into carbon sequestration in switchgrass ecosystems. We are also examining feedstock quality, which can vary depending on site location, cultivar planted, and land-use history.
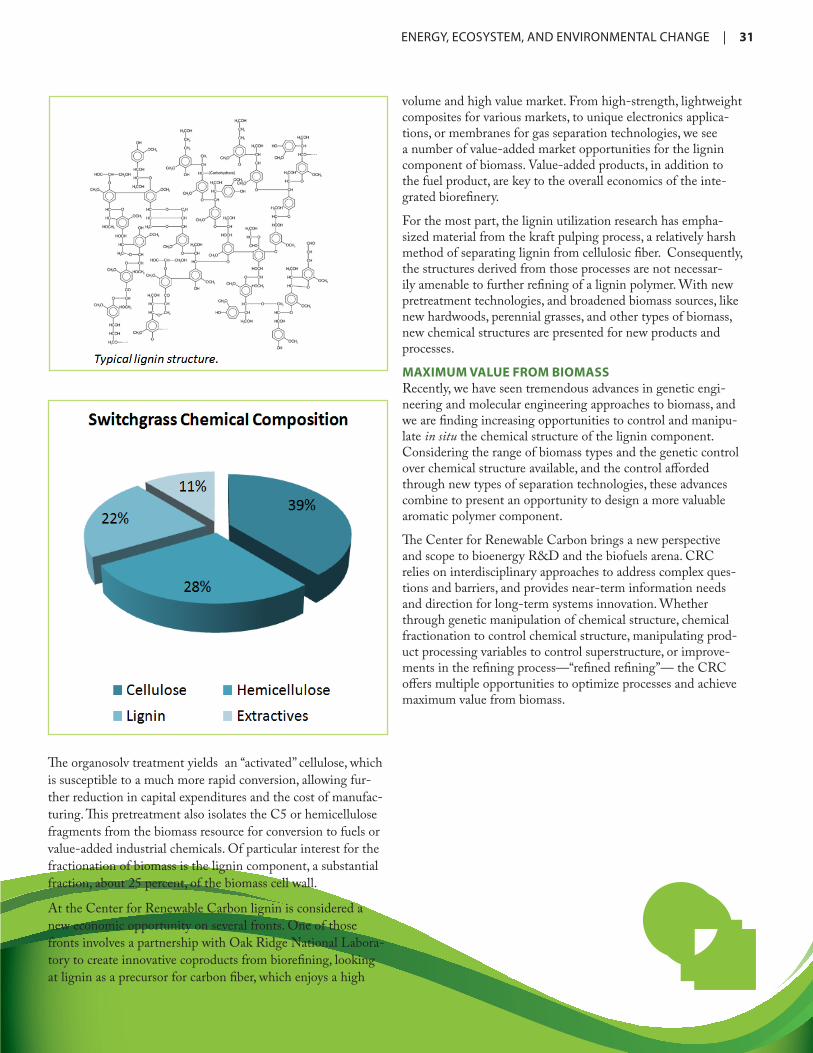
CHEMICAL COMPOSITION OF LIGNIN The biochemical conversion process of switchgrass, miscanthus, wood, and other types of lignocellulosics targets only the sugar or carbohydrate part of the plant, but a significant fraction, about one quarter to one third of the plant, is composed of lig-nin. In the early stages of conversion process research, lignin has been considered primarily as a source of heat and power. Many researchers, however, consider lignin a potentially valuable aromatic chemical resource that also needs to be developed and refined, adding new value streams and new product opportuni-ties to the refinery. This has led to an interest in new kinds of pretreatment technologies.
Currently, many of the treatment systems under evaluation simply consider introducing ground biomass particles into the process at the front end, and collecting ethanol and an aromatic or lignin residue at the back end. CRC researchers are exploring other systems. One would involve, at the front end, fractionat-ing the biomass into individual process streams that can be used for different types of conversion technologies. The technology is essentially an organosolv pulping method that allows us to generate three very pure streams for further conversion.
ENERGY,ECOSYSTEM,ANDENVIRONMENTALCHANGE | 31
The organosolv treatment yields an “activated” cellulose, which is susceptible to a much more rapid conversion, allowing fur-ther reduction in capital expenditures and the cost of manufac-turing. This pretreatment also isolates the C5 or hemicellulose fragments from the biomass resource for conversion to fuels or value-added industrial chemicals. Of particular interest for the fractionation of biomass is the lignin component, a substantial fraction, about 25 percent, of the biomass cell wall.
At the Center for Renewable Carbon lignin is considered a new economic opportunity on several fronts. One of those fronts involves a partnership with Oak Ridge National Labora-tory to create innovative coproducts from biorefining, looking at lignin as a precursor for carbon fiber, which enjoys a high
volume and high value market. From high-strength, lightweight composites for various markets, to unique electronics applica-tions, or membranes for gas separation technologies, we see a number of value-added market opportunities for the lignin component of biomass. Value-added products, in addition to the fuel product, are key to the overall economics of the inte-grated biorefinery.
For the most part, the lignin utilization research has empha-sized material from the kraft pulping process, a relatively harsh method of separating lignin from cellulosic fiber. Consequently, the structures derived from those processes are not necessar-ily amenable to further refining of a lignin polymer. With new pretreatment technologies, and broadened biomass sources, like new hardwoods, perennial grasses, and other types of biomass, new chemical structures are presented for new products and processes.
MAXIMUM VALUE FROM BIOMASS Recently, we have seen tremendous advances in genetic engi-neering and molecular engineering approaches to biomass, and we are finding increasing opportunities to control and manipu-late in situ the chemical structure of the lignin component. Considering the range of biomass types and the genetic control over chemical structure available, and the control afforded through new types of separation technologies, these advances combine to present an opportunity to design a more valuable aromatic polymer component.
The Center for Renewable Carbon brings a new perspective and scope to bioenergy R&D and the biofuels arena. CRC relies on interdisciplinary approaches to address complex ques-tions and barriers, and provides near-term information needs and direction for long-term systems innovation. Whether through genetic manipulation of chemical structure, chemical fractionation to control chemical structure, manipulating prod-uct processing variables to control superstructure, or improve-ments in the refining process—“refined refining”— the CRC offers multiple opportunities to optimize processes and achieve maximum value from biomass.

32 | ENERGY,ECOSYSTEM,ANDENVIRONMENTALCHANGE
Hydrogen Production from Phenol:A Two-Step Biological Process
by Hanqing YuDr. Yu is a Professor of Environmental Engineering at the University of Science and Technology of China.
As we witness the gradual depletion of limited fossil energy resources, hydrogen is emerging as a clean energy alternative with many advantages over other fuels for a number of reasons. The combustion of hydrogen produces no greenhouse
gases, and it has a very high energy yield, 2.75-fold greater than that of hydrocarbon fuels. At present, there are many ways to produce hydrogen. Conventional means such as physiochemi-cal methods are typically costly and energy intensive, and they also cause serious environment pollution. Biological hydrogen production, using renewable resources such as solid waste and wastewater as a substrate, is a more environmentally friendly means to produce hydrogen
We currently have two ways to produce biological hydrogen, photo-fermentation and dark fermentation. Photo-fermen-tation uses photosynthetic bacteria to extract hydrogen from organic acids, but most studies conclude that dark fermentation is a better way to produce hydrogen biologically, using anaero-bic bacteria to convert carbohydrates from protein, lignins, and other organic carbons to hydrogen.
The substrates for biological hydrogen production include sim-ple sugars such as glucose, starch-containing wastes, cellulose containing wastes, and wastewater from the food industry. All the substrates for dark fermentation have a common character-istic: they are rich in biodegradable carbohydrates.
There are many challenges in producing biohydrogen. First we have to determine how to enhance hydrogen yield and increase hydrogen production. There are several ways to increase yield; for example, we can manipulate or recombine microbes using genetic engineering. We can design new types of hydrogen-producing reactors for the treatment of wastewater containing toxic components. Or we can use cheaper raw materials such as carbohydrates as substrates. We are also trying to integrate dark and light hydrogen-producing systems.
Four years ago we published a study based on work in our lab demonstrating that hydrogen yield could be significantly increased compared to dark fermentation alone by combining hydrogen production of anaerobic fermentative bacteria with Rhodopseudomonas capsulata.
PHENOL AS A SUBSTRATEIt is well known that phenol is a potential substrate for the production of biologic hydrogen production. We have chosen to explore the utility of phenol for several reasons. For one, phenol is widely used as an efficient disinfectant because of its toxicity to most microorganisms. It is also a common pollutant in efflu-ents from crude oil refineries, ceramics plants, steel plants, coal conversion processes, and phenolic residue industries. When wastewater-containing phenol is discharged into a receiving body of water, it can endanger fish and humans, even at low concentrations.
At the pretreatment stage there are several ways to treat wastewater rich in phenol. We can use chemical methods, for example with advanced oxidation, an aerobic treatment. There are some advantages, however, to using anaerobic digestion technology as a pretreatment option. It is energy intensive and oxygen free, little excess sludge is produced, and the phenol in wastewater can be converted into biogas containing methane.
In our laboratory we have established a system to convert phe-nol to hydrogen using a two-step biological process. In the first step phenol is anaerobically fermented and converted to benzo-ate. In the second stage, benzoate can be decomposed in the presence of light and bacteria and separated in a gas separation room into pure hydrogen and carbon dioxide. At the same time, this process is an efficient treatment of phenol-rich wastewater.
PREPARATION OF ANAEROBIC SLUDGETo prepare the anaerobic sludge for phenol fermentation, we first use sucrose as the sole source of carbon. Five days later we add a phenol substrate as a source of carbon. The sucrose concentration is gradually reduced and the phenol concentra-tion increased to convert phenol to benzoate, the input for the reactor.
To determine the performance of the reactor, we analyzed conversion rates at different phenol concentrations. Benzo-ate started to accumulate at a high initial phenol level. Phenol removal efficiency declined slightly as benzoate and phenol concentrations increased, and at the same time the hydrogen percentage also decreased. To further enhance the accumulation of benzoate and inhibit production of methane, we added the chemical bromoform. We were thus able to convert all the phe-
A

ENERGY,ECOSYSTEM,ANDENVIRONMENTALCHANGE | 33
nol into benzoate without methane production even at lower phenol concentrations, 420 mg/l.
We also used a simple mathematical model to simulate benzo-ate formation kinetics in the conversion of phenol to benzoate. We used two coefficients, yield coefficient of the anaerobic sludge growth in relation to the mass of phenol consumed, and yield coefficient of the mass of benzoate formed in relation to the mass of phenol consumed. Keeping these coefficients con-stant through phenol degradation, we were able to mathemati-cally convert the results and get two impressions. One equa-tion describes phenol concentration in the reactor; the second describes the benzoate concentration and reaction type. We found the simulated phenol consumption profiles to be in good agreement with the experimental results. Kinetic parameters estimated with the results in a batch reactor could be used to predict formation of benzoate. Similarly, we can predict mea-sured phenol concentration as a function of the reaction type.
FURTHER CONVERSION OF BENZOATEAs benzoate becomes available, the next step is to further convert benzoate to hydrogen. After trying many different mediums for photosynthesis, we finally found that Rhodo-pseudomonas palustris is the best for our research purposes. This photosynthetic bacteria can utilize benzoate originating from the effluent of the phenol-fed acidogenic reactor to produce hydrogen. A benzoate reagent at the same concentration with analytical purity was used as a control.
We used a modified Gompertz model to describe benzoate consumption and hydrogen production. The maximum sub-strate consumption rate and lag time were calculated to be 1.47 mg/h/L at 55.1 hours for the effluent and 1.51 mg/h/L at 22 hours for the control. We found the hydrogen production potential, maximum hydrogen production rate, hydrogen yield, and light conversion efficiency for the effluent to be slightly lower than those for the control.
We also carried out experiments to explore the effects of benzoate concentration. We tested concentrations of benzoate at four levels, 1 millimolar (mM), 5 mM, 10 mM, and 15 mM. We found 5 mM is optimal for hydrogen yield and production rate. We also investigated the impact of pH on production rate and yield and found a pH of 6.8 optimal in this case.
In addition, we compared organic and inorganic nitrogen sources to determine the effect of the light source on yield and production rate of hydrogen. At glutamate and ammonium chloride concentrations of 0.2 g/L the organic nitrogen has a higher yield of hydrogen than from inorganic nitrogen.
In the static state operation of the photo-reactor, we used a re-sponse surface methodology design to find the optimal condi-tion for hydrogen production: a load concentration of benzoate at around 8.9 mM, pH around 6.6, and ammonium chloride concentration about 0.21 g/L.
In further experiments, we found an interesting algae, Monograpidium sp., that can use benzoate to produce hydro-gen. Algae usually use inorganic carbon dioxides and other inorganic carbon sources for growth hydrogen production, but we noticed this algae can use benzoate as a carbon source to produce hydrogen.
In conclusion, we found that phenol was biologically converted to hydrogen by combining anaerobic acidogenic bacteria with photosynthetic microorganisms, bacteria or algae. Phenol degradation and benzoate formation in the acidogenic reactor can be simulated by a very simple mathematical model. The modified Gompertz model appears to be useful for evaluat-ing hydrogen production ability from benzoate by R. palustris. These results suggest that aromatic compounds like phenol can be fermented to produce hydrogen through the two-step biological process developed in our lab.

34 | ENERGY,ECOSYSTEM,ANDENVIRONMENTALCHANGE
Novel Cellulolytic Microorganisms from Terrestrial Geothermal Springs
by James ElkinsDr. Elkins is a Staff Scientist in Molecular Microbial Ecology in the BioSciences Division of Oak Ridge National Laboratory.
The BioEnergy Science Center (BESC) in Oak Ridge, Tennessee, is one of three Department of Energy (DOE) Bioenergy Research Centers in the United States: BESC, led by Oak Ridge Na-tional Laboratory (ORNL); the Joint BioEnergy
Institute headed by Lawrence Berkeley National Laboratory; and the Great Lakes Bioenergy Research Center at Michigan State University.
Much of the existing technology to convert biomass from native plants into liquid products such as ethanol is a multi-step process requiring a cocktail of enzymes that also require pretreatment of biomass and are rather expensive to produce. BESC is working to improve the efficiency of converting lignocellulosics into biofuels, focusing on biomass conversion through consolidated bioprocessing. The concept is to reduce or eliminate pretreatment using modified biomass, switchgrass or Populus for example, that can be directly converted to fuel using engineered organisms that produce enzymes to break down the material and ferment it in one step to produce ethanol or butanol. This technology has the potential to achieve large cost savings over traditional technologies for lignocellulosic fuel production.
CAN THEY STAND THE HEAT? Lee Lynd, a researcher at Dartmouth University and a leader in the area of consolidated bioprocessing has, for several decades, examined a number of model cellulolytic organisms and plotted the optimal growth rate of these microbes. He wanted to know whether microbes that can withstand higher temperatures are more effective at hydrolyzing cellulose. By measuring the growth rate for several of these microorganisms, both aerobic and anaerobic, on crystalline cellulose, he found a linear correlation between growth rate and temperature. The more mesophilic organisms, those that thrive at moderate tem-peratures, have slower growth rates. At very high temperatures, the extremely thermophilic organisms showed growth rates higher than other organisms. One lonely data point in that high temperature range, from 75- 80°C, was the Anaerocellum thermophilium.
With this information in hand, results of which were pub-lished in 2002 in the Microbial and Molecular Biology Reviews, researchers at BESC wanted to discover other organisms in
nature that would tolerate the 75-80 °C range and also display high rates of cellulose solubilization.
We chose to explore Yellowstone National Park, where we already have established agreements and obtained permits to conduct sampling. Yellowstone, with a high density of geo-thermal features and a very complex biological and geochemi-cal diversity, is one of the premier research areas in the world. Pioneering studies have previously revealed the remarkable diversity of archaeal and bacterial species within Yellowstone Park.
During two field trips, in 2007 and 2008, our team sampled a number of different springs within the park, plotting pH and temperature from the different sites, focusing not on acidic but rather on neutral to alkaline environments spanning a wide range of temperatures from 60°C to near the boiling point, which in Yellowstone is about 93°C. Samples were collected under strict anaerobic conditions and shipped back to Oak Ridge.
One focal point of our research was Obsidian Pool, where a number of diversity studies have previously been conducted, and a nearby spring in a peripheral grassy area. Three samples were collected, two from the main pool in October 2007, when it was already snowing, and again in July 2008. The third was also collected in July 2008 from the grassy area. Fall tempera-ture in the pool was 74ºC. Summer temperature in the pool was 80°, and in the grassy area 68°C. All three samples were slightly acidic, around pH 5 or 6. DNA was collected from bacteria and archaea present in the samples.
DIVERSITY INDEXINGOne of the main objectives of this study was to conduct diver-sity indexing to determine the relative abundance of bacterial and archaeal phyla in the Obsidian Pool samples—OB5 at 74ºC and OB3 at 80ºC—and the grassy area samples—OB10 at 68ºC. OB10 proved to be a rich source of these organisms. It contains heat-tolerant grasses adjacent to water near the boiling point, bison defecate in the water, and other kinds of detritus and runoff also flow into the spring and can be a source of cellulosic material. We plotted some of the different groups of organisms and found that bacteria and archaea samples from the Obsidian Pool (OB5 and OB3) were much less diverse
T
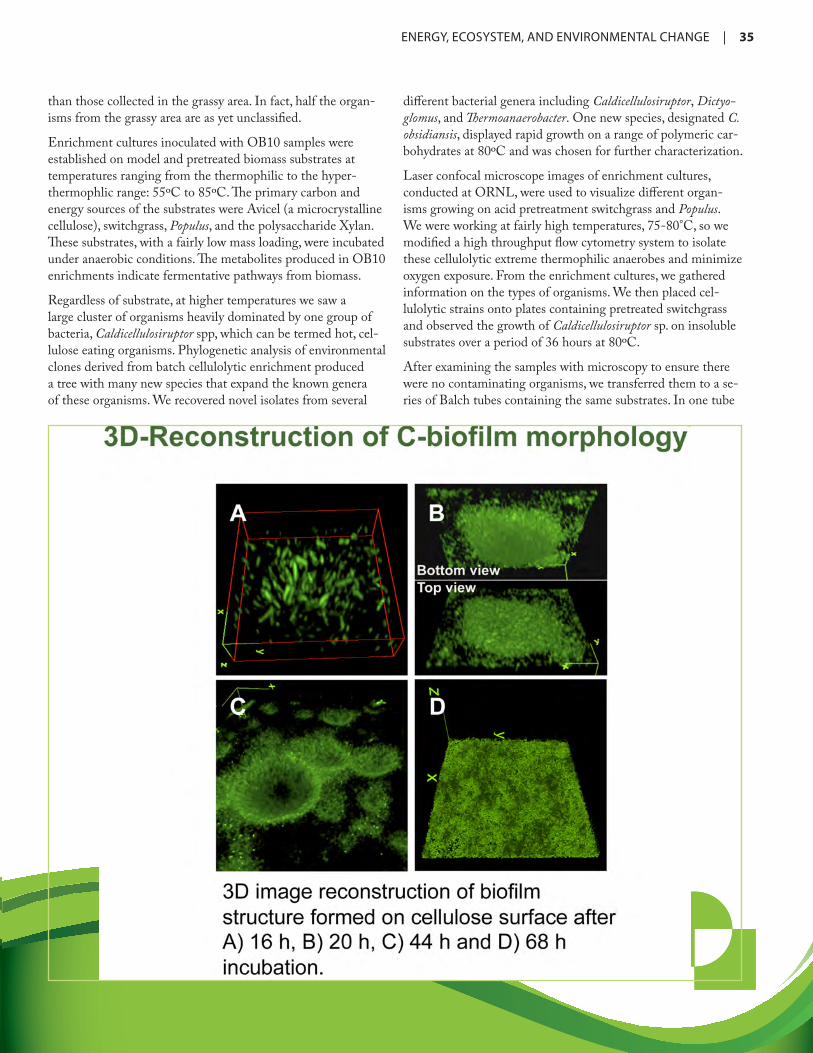
ENERGY,ECOSYSTEM,ANDENVIRONMENTALCHANGE | 35
than those collected in the grassy area. In fact, half the organ-isms from the grassy area are as yet unclassified.
Enrichment cultures inoculated with OB10 samples were established on model and pretreated biomass substrates at temperatures ranging from the thermophilic to the hyper-thermophlic range: 55ºC to 85ºC. The primary carbon and energy sources of the substrates were Avicel (a microcrystalline cellulose), switchgrass, Populus, and the polysaccharide Xylan. These substrates, with a fairly low mass loading, were incubated under anaerobic conditions. The metabolites produced in OB10 enrichments indicate fermentative pathways from biomass.
Regardless of substrate, at higher temperatures we saw a large cluster of organisms heavily dominated by one group of bacteria, Caldicellulosiruptor spp, which can be termed hot, cel-lulose eating organisms. Phylogenetic analysis of environmental clones derived from batch cellulolytic enrichment produced a tree with many new species that expand the known genera of these organisms. We recovered novel isolates from several
different bacterial genera including Caldicellulosiruptor, Dictyo-glomus, and Thermoanaerobacter. One new species, designated C. obsidiansis, displayed rapid growth on a range of polymeric car-bohydrates at 80ºC and was chosen for further characterization.
Laser confocal microscope images of enrichment cultures, conducted at ORNL, were used to visualize different organ-isms growing on acid pretreatment switchgrass and Populus. We were working at fairly high temperatures, 75-80°C, so we modified a high throughput flow cytometry system to isolate these cellulolytic extreme thermophilic anaerobes and minimize oxygen exposure. From the enrichment cultures, we gathered information on the types of organisms. We then placed cel-lulolytic strains onto plates containing pretreated switchgrass and observed the growth of Caldicellulosiruptor sp. on insoluble substrates over a period of 36 hours at 80ºC.
After examining the samples with microscopy to ensure there were no contaminating organisms, we transferred them to a se-ries of Balch tubes containing the same substrates. In one tube

36 | ENERGY,ECOSYSTEM,ANDENVIRONMENTALCHANGE
we found that nearly all the switchgrass had been hydrolyzed. We chose that sample, C. obsidiansis OB47, to characterize in more detail. We subjected this culture to the classic filter paper test. After three days at 80ºC the filter paper was hydrolyzed. Obviously, that organism has a very stable, high-temperature cellulase system for degrading crystalline cellulose.
The Caldicelluosiruptor enzyme system is an example of a cell-free system that includes several multifunctional enzymes. Some of the enzymes from these organisms have been partially characterized. We sequenced the genome of C. obsidiansus and compared it to other organisms with known genetic sequenc-es—C. sacchaolyticus, C. owensensis, and A. thermophilium—to determine several traits of interest, including optimal tempera-ture and pH range, doubling time at optimal conditions, and potential for ethanol production.
A substrate utilization profile for OB47 and related strains indicated that they utilize a wide range of sugars, including glucose, xylose, mannose, arabinose, and galactose. OB47 also ferments C5 and C6 sugars simultaneously. We also conducted controlled growth experiments with OB47 on crystalline cellu-lose (Avicel) using a 5-liter constant batch fermenter at optimal temperature (78ºC). End products were determined using high performance liquid chromatography (HPLC) and gas chroma-tography (GC). We used a total protein assay to determine cell growth. With crystalline cellulose we saw a rapid increase in growth within two days. Similar controlled growth experiments with OB47 on dilute, acid-pretreated switchgrass produced no lactate but a rapid rise in hydrolysis of switchgrass.
Confocal visualization of cellulose surface colonization by C. obsidiansis revealed cellulolytic biofilm morphologies over six time frames from eight to 68 hours. At the shorter periods, between 8 and 16 hours, we saw single cells colonizing the surface. After longer incubation times, the cells formed micro-colonies. Eventually, these small colonies merged into a thin uniform layer of cells on the cellulose surface. A 3-D recreation of biofilm morphology revealed crater-like structures filled with cells.
ANOTHER NEW ISOLATEIn addition to isolates from the Caldicellulosiruptor species group, we examined other organisms from the Obsidian Pool to see what types of trophic interactions or metabolic cooperation might be occurring with these extremely thermophilic organ-isms. One of these we are interested in is Thermodesulfobacte-rium sp (OPB45)—a novel hyperthermophilic, sulfate-reducing bacterium—and its relationship with the cellulolytic extreme thermophile C. obsidiansis. Thermodesulfobacterium is so far the highest- temperature, sulfate-reducing organism known. A true hyperthermophile does not grow at all at 60°C. The optimum temperature for growth of this organism is around 80ºC, and it is known to thrive at temperatures as high as 85ºC. It is an obligate hydrogenetroph; that is, it requires hydrogen as an electronic donor, but it does not use lactate in the process. Instead, its growth is stimulated by acetate.
C. obsidiansis and Thermodesulfobacterium sp. occur in the same environment, occupy overlapping niches, and likely cooperate metabolically in situ. Through co-cultivation, we find that both can be propagated in the same growth medium, and prelimi-nary results indicate improved Avicel hydrolysis through co-cultivation. In addition, ethanol production by C. obsidiansis has been observed for the first time in serum bottles, and hydrogen inhibition likely affects cellulose hydrolysis and end product formation for C. obsidiansis.
Recent efforts at BESC to reduce or eliminate pretreatment of cellulosic biomass have led researchers to explore the fascinat-ing world of extreme thermophiles. In the process, we have developed anaerobic cellulolytic enrichment and high through-put isolation techniques for thermophiles and explored meth-ods and models that allow analysis of cellulolytic biofilms and co-cultures of Caldicellulosiruptor species. In field and laboratory experiments, we have determined that these species occupy an important natural niche in thermal communities, and we are now characterizing at least one new promising isolate in detail. These organisms can be deployed to break down the recalci-trance barriers in cellulosic materials that are candidates for the transformation of native plants into fuels.
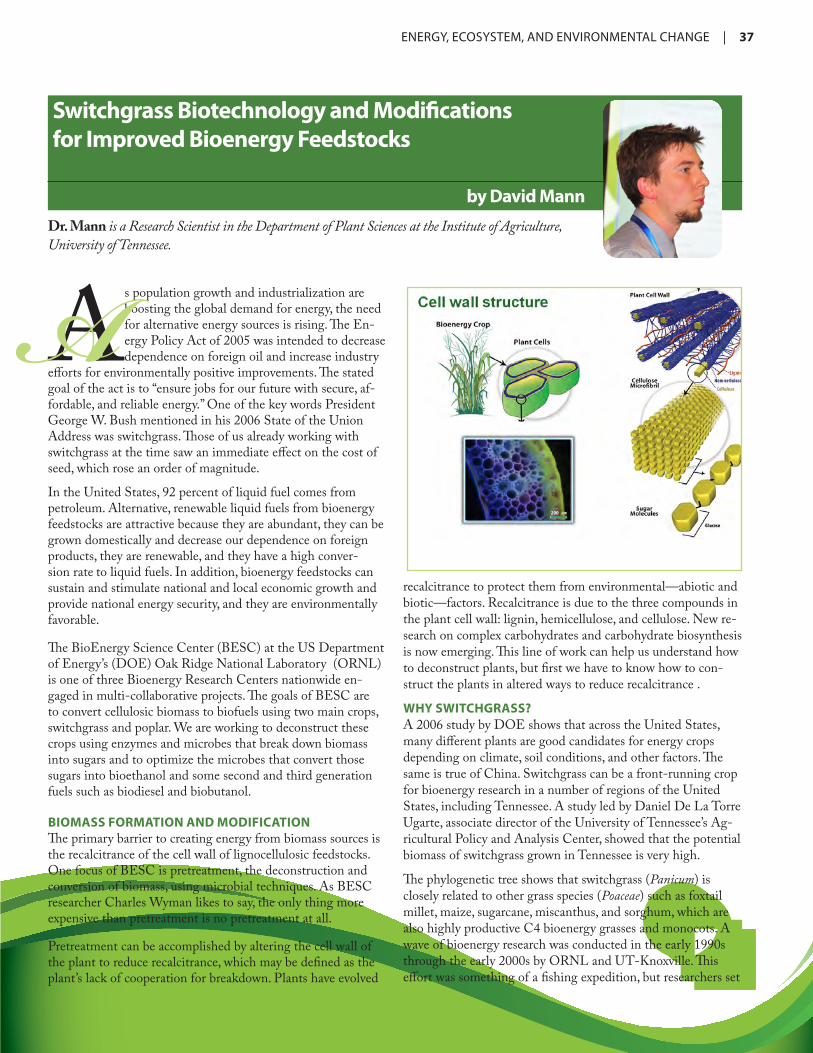
ENERGY,ECOSYSTEM,ANDENVIRONMENTALCHANGE | 37
Switchgrass Biotechnology and Modificationsfor Improved Bioenergy Feedstocks
by David Mann
As population growth and industrialization are boosting the global demand for energy, the need for alternative energy sources is rising. The En-ergy Policy Act of 2005 was intended to decrease dependence on foreign oil and increase industry
efforts for environmentally positive improvements. The stated goal of the act is to “ensure jobs for our future with secure, af-fordable, and reliable energy.” One of the key words President George W. Bush mentioned in his 2006 State of the Union Address was switchgrass. Those of us already working with switchgrass at the time saw an immediate effect on the cost of seed, which rose an order of magnitude.
In the United States, 92 percent of liquid fuel comes from petroleum. Alternative, renewable liquid fuels from bioenergy feedstocks are attractive because they are abundant, they can be grown domestically and decrease our dependence on foreign products, they are renewable, and they have a high conver-sion rate to liquid fuels. In addition, bioenergy feedstocks can sustain and stimulate national and local economic growth and provide national energy security, and they are environmentally favorable.
The BioEnergy Science Center (BESC) at the US Department of Energy’s (DOE) Oak Ridge National Laboratory (ORNL) is one of three Bioenergy Research Centers nationwide en-gaged in multi-collaborative projects. The goals of BESC are to convert cellulosic biomass to biofuels using two main crops, switchgrass and poplar. We are working to deconstruct these crops using enzymes and microbes that break down biomass into sugars and to optimize the microbes that convert those sugars into bioethanol and some second and third generation fuels such as biodiesel and biobutanol.
BIOMASS FORMATION AND MODIFICATIONThe primary barrier to creating energy from biomass sources is the recalcitrance of the cell wall of lignocellulosic feedstocks. One focus of BESC is pretreatment, the deconstruction and conversion of biomass, using microbial techniques. As BESC researcher Charles Wyman likes to say, the only thing more expensive than pretreatment is no pretreatment at all.
Pretreatment can be accomplished by altering the cell wall of the plant to reduce recalcitrance, which may be defined as the plant’s lack of cooperation for breakdown. Plants have evolved
Dr. Mann is a Research Scientist in the Department of Plant Sciences at the Institute of Agriculture, University of Tennessee.
recalcitrance to protect them from environmental—abiotic and biotic—factors. Recalcitrance is due to the three compounds in the plant cell wall: lignin, hemicellulose, and cellulose. New re-search on complex carbohydrates and carbohydrate biosynthesis is now emerging. This line of work can help us understand how to deconstruct plants, but first we have to know how to con-struct the plants in altered ways to reduce recalcitrance .
WHY SWITCHGRASS?A 2006 study by DOE shows that across the United States, many different plants are good candidates for energy crops depending on climate, soil conditions, and other factors. The same is true of China. Switchgrass can be a front-running crop for bioenergy research in a number of regions of the United States, including Tennessee. A study led by Daniel De La Torre Ugarte, associate director of the University of Tennessee’s Ag-ricultural Policy and Analysis Center, showed that the potential biomass of switchgrass grown in Tennessee is very high.
The phylogenetic tree shows that switchgrass (Panicum) is closely related to other grass species (Poaceae) such as foxtail millet, maize, sugarcane, miscanthus, and sorghum, which are also highly productive C4 bioenergy grasses and monocots. A wave of bioenergy research was conducted in the early 1990s through the early 2000s by ORNL and UT-Knoxville. This effort was something of a fishing expedition, but researchers set
A

38 | ENERGY,ECOSYSTEM,ANDENVIRONMENTALCHANGE
out to determine the best species to work with, and switchgrass came out as one of the winners.
This study by DOE pointed to a number of characteristics that make switchgrass a prime bioenergy crop. It has a wide range of growth across the United States, Canada, and Mexico. It is a C4 photosynthetic organism with high levels of biomass. It is a perennial that comes back every year without replant-ing. It has negative greenhouse gas emissions and high carbon sequestration, requires low nutrient inputs, and has high water use efficiency. It also has a high yield and a very high energy output-to-input ratio, a measure of the amount of fossil fuel energy needed to cultivate it compared to the amount of renewable energy that can be extracted. This output-input ratio of 5:1 is based on data from switchgrass grown in the Midwest. Theoretically, the ratio could be as high as 12:1, a very high energy output. Another major advantage is that switchgrass can be grown and harvested using existing farm equipment.
If you look at the root ball of switchgrass, you see its high carbon sequestration potential. Compared to the above ground biomass, the root biomass is extremely large and continues to grow over time. Some plots on UT’s experimental farm
have been monitored for 20 years, and the plant continues to maintain high levels of biomass output. In spring and sum-mer, mineral nutrients are translocated from the rhizomes to the growing shoots above ground. In the fall, at the first killing frost, those nutrients are translocated back below ground to the rhizomes and root biomass as the shoots senesce. In winter, dry shoots are harvested, and the nutrients remain in the rhizomes. That dry matter is then used as lignocellulose to ferment etha-nol.
MODIFICATION OF SWITCHGRASSModifying switchgrass using plant tissue culture and genetic transformation has the potential to improve the commercial viability of crops and give us a better understanding of the cell wall of the plant so we can plan our attack on recalcitrance. To genetically modify switchgrass, we needed to develop a tissue culture system. This was initiated in the late 1990s by a profes-sor in the Department of Plant Sciences at UT, Bob V. Conger, in a process that takes about four months to move from the plant in the greenhouse to a tissue culture and finally regenera-tion into another plant. The immature, non-emerged inflores-cences, or flowers, from the top internodes are collected from the greenhouse and then sterilized and dissected. After two weeks , pieces of the inflorescences are plated onto a medium in which the hormones available in the plant medium are altered,
inducing proliferation of callus. Calli are undifferentiated cell types highly amenable to transformation.
After four weeks in the dark, the established callus is subjected to Agrobacterium-mediated transformation via somatic embryo-genesis using Alamo-2 or ST1, bacterial species that invade the plant and insert transfer DNA containing genes of interest. Af-ter two months, new plants are regenerated from the callus, and the plants containing the stable transformation of the genes of interest are grown in media within the lab. After 30 days on selection, plants regenerated, placed on rooting medium, and returned to the greenhouse where they can be screened pheno-typically and chemotypically for traits of interest.
Within BESC there is a switchgrass transformation pipeline. Cell biologists who want to learn about the cell wall can pro-pose their targeted genes of interest, genes they want to either over express or knock down in the plant. When those genes are accepted by the transformation pipeline committee, they are inserted into vector constructs. We then perform transient or stable transformation assays, analyze the cell wall, and charac-terize the plants. This helps determine the potential for further research.
All commercially available vectors involved in plant transfor-mation are typically designed for dicots rather than monocots, and most of the vectors in the literature are optimized for dicot species. These use different promoters, different terminators, and different selection agents than monocots such as switch-grass and rice. A number of vector systems have been optimized for rice. We first had to devise a vector system optimized not just for rice, but also for switchgass. We had to develop mono-cot elements and in some cases create a common vector back-bone or template for all genes of interest so the plants could be compared one to the other. Most of the traits of interest we are introducing for recalcitrance are decreased lignin, increased cellulose production, and increased or decreased hemicellu-lose, and more specifically modifying the hemicellulosic genes, which are known to reduce recalcitrance. Other important traits for genetic improvements include herbicide resistance, drought tolerance, increased biomass per acre, cold tolerance, and nitrogen use efficiency.
We have also developed in our lab three DNA cassettes in the vector constructs. These contain a promoter, a gene of inter-est, and a terminator. The cassettes available in each vector are 1) the antibiotic or selection marker, which kills the non-transformed tissue, 2) the visual marker that allows us to detect transformed tissue, and 3) the trait of interest which gives the plant the desired phenotype.
STABLE TRANSFORMATIONDuring the stable transformation process there is a high num-ber of what we call escapes. These are plants that regenerate from the callus tissue but do not contain a gene of interest. Es-capes are a major problem for systems like switchgrass that are not fully developed and have not been fully optimized. With the visual marker, we can look at the tissue that transforms cal-

ENERGY,ECOSYSTEM,ANDENVIRONMENTALCHANGE | 39
lus tissue and, based on the florescence that is present, separate that tissue out knowing it is in fact stably transformed. Then we regenerate from there. Most importantly, we can determine the trait of interest that gives the plant its desired phenotype.
The vector set is called pANIC, based on the scientific name of switchgrass, Panicum virgatum. At present, we have about 32 vectors available, all containing different selection agents, different reporter genes, and potentially different promoters. In the process we developed some of our own promoters because of the lack of information in the literature and added switch-grass promoters to these vectors.
In our lab, we have also developed an improved medium for producing embryogenic callus and regenerating switchgrass plants. The new tissue culture system, LP9, can increase the vi-ability and longevity of callus in switchgrass Alamo 2 compared to results derived from previous culture systems reported in the literature. This callus, Type II, makes it possible to regenerate callus from inflorescences rather than the tillers, —shoots from an axillary bud at the base of a stem—shortening the time to produce whole transgenic plants by about one month. These traits will streamline transformation experiments in switch-grass.
Another concern with transgenic plants is that, as you reduce the recalcitrance of switchgrass, specifically the lignin biosyn-thetic pathway, the plants will potentially fall over. The trans-genic plants we are developing, however, stand up and look just as healthy as the control, wild type, plants. We are currently analyzing about 20 transgenic plants containing our gene of
interest, which is a transcription factor. If we compare the wild type plant and the transgenic plant, the hypothetical phenotype has less lignin, creating shorter tillers and a higher tillering rate, and potentially higher biomass yields. In fact, just last week I looked at these plants in the growth chamber, the transgenic on one side and wild type on the other. The transgenic plants are much smaller with many more tillers than the wild type. We plan to send these out to the National Renewable Energy Laboratory soon for analysis.
Collaborative work with the Noble Foundation, BESC, and ORNL has shown that knocking down one gene in the lignin biosynthetic pathway led to a 25 percent increase in etha-nol yields. This work shows proof of principle that if we can transgenically modify a single gene, we will reap great beneficial effects for the downstream process, a major advance that is very relevant to the field of bioenergy. These promising results will be published soon.
The BESC Switchgrass Transformation Group at UT Knox-ville, in cooperation with the Noble Foundation, has developed the technology to enable high-throughput switchgrass transfor-mation by creating vectors, transient expression tools, a tissue culture system, and a transformation system. We have currently about 40 to 50 genes, 10 of which have been stably trans-formed to switchgrass, at different stages in the transformation pipeline. We have altered cell wall biosynthesis, modified lignin biosynthesis pathways, and shown a direct relevant effect on ethanol production. We see a future that is wide open and are excited about the results we are getting and the direction in which we are headed.

40 | ENERGY,ECOSYSTEM,ANDENVIRONMENTALCHANGE
Dr. Tong is an Assistant Professor in the Department of Chemistry at the University of Science and Technology of China.
Microbial Communities Assessed Using a Clone Library Analysis in Sulfide-Fed Microbial Fuel Cell
by Zhonghua Tong
There are two major challenges raised by increasing population in the 21st century: environmental pol-lution and energy shortage. Wastewater is often discharged into bodies of water without being fully treated, and accidental spillage of some con-
taminants to the water system and the atmosphere often occurs. Mass production of vehicles has increased tailpipe emissions, and the consumption of fuel has heightened the worldwide energy shortage.
Increasingly, people are seeking clean energy solutions and turning to alternative sources such as wind farms, solar power, and biofuel facilities to alleviate these problems. Many re-searchers have focused on sustainable or renewable processes to make ethanol from biomass such as plant tissues. At the Uni-versity of Science and Technology of China (USTC), we have been developing another sustainable approach to clean energy, the microbial fuel cell (MFC). MFCs use bacteria to oxidize organic or inorganic matter and generate electricity at the same time. We have recently discovered that electricity generation can be coupled with sulfide oxidation in an MFC, accomplish-ing the dual roles of dealing with contaminated wastewater and at the same time generating electricity.
MFC CONSTRUCTION AND OPERATIONIn our work, an MFC was constructed to enrich a microbial consortium that could harvest electricity from sulfide oxida-tion. In the anode chamber of the MFC, fuels or substrates are
oxidized and the electrons delivered to a cathode chamber. Pro-tons pass through a proton exchange membrane to the cathode chamber, and the protons and electrons are converted by oxygen to produce water. At the same time, sulfides are oxidized to various sulfur species.
Different substrates can be used in MFCs, including a variety of organic compounds such as acetates, complex organics from wastewater, and plant residues. Our objectives at USTC are to investigate electricity production based on sulfide oxidation in MFCs, assess the role of microorganisms in this process, and analyze the role of microoganisms in the community structure within the MFC. Sulfur compounds such as hydrogen sul-fide are hazardous to human health. These compounds can be removed by precipitation or by chemical or biological oxidation at the same time as electricity is generated.
In our MFC reactor, which has a single chamber configuration, an air cathode is connected to carbon paper with a platinum film coating. The anode is plain carbon paper. First we intro-duce the anode into the anodic chamber and inoculate it with aerobic sludge. The reactor is filled with wastewater containing sodium sulfide, and the medium in the chamber is purged with nitric acid to remove the oxygen.
Our electrochemical analysis of the enrichment process in the first batch after inoculation showed the electric current density plummeted quickly from about 75 mA/m2 to almost zero within 25 hours. By amending sodium sulfide, the current density could be maximized again at the same level and then stabilized above 17 mA/m2 after 25-h cultivation.
For the fifth and sixth batch cycle, the current density reached the same maximum level, but the following decreasing process lasted much longer. The polarization curves showed that the maximum power density of 13 mV/m2 could be achieved when the current voltage reached 96 mA/m2.
ELECTRICITY GENERATION UNDER MICROBIAL CATALYSISOur electrochemical analysis demonstrated that microbial catalysis was involved in electricity output.
Various microbial communities have been shown to be involved in the process of sulfide oxidation. It is essential to elucidate the microbial communities and their roles in the process of sulfide
T

ENERGY,ECOSYSTEM,ANDENVIRONMENTALCHANGE | 41
conversion and electricity generation. In our research, we used both anode-attached and planktonic communities.
• Under microbial catalysis, sulfide oxidation generated a high and persistent current. Both the anode-attached and plank-tonic bacteria were responsible for power generation.
• Our microbial community analysis consisted of a 16S rRNA gene clone library construction. The DNA was extracted, and 16S rRNA gene fragments were amplified and cloned using the pGEM-T vector system. For each community, 100 clones were selected and the plasmid DNA isolated for the sequencing.
• In the phylogenetic distribution of sequences, the planktonic community showed a higher diversity than the anode-at-tached community.
• The diversity comparison showed significant differences between the planktonic and anode-attached communities.
In summary, microbial catalysis with sulfide oxidation gener-ated a high and persistent current. Both the anode-attached and planktonic bacteria were responsible for power genera-tion, and the planktonic community showed a higher diversity than the anode-attached community. Future work is needed to determine the specific contribution of bacteria to the oxidation of sulfide compounds.
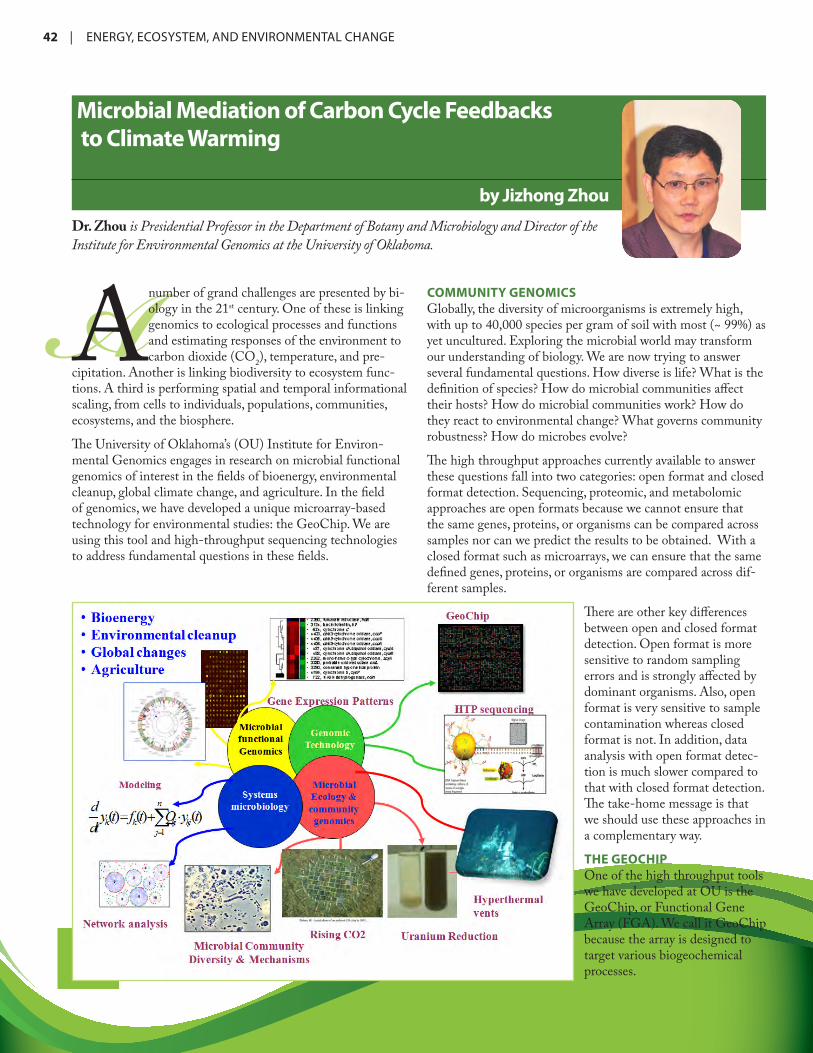
42 | ENERGY,ECOSYSTEM,ANDENVIRONMENTALCHANGE
Microbial Mediation of Carbon Cycle Feedbacks to Climate Warming
by Jizhong Zhou
Dr. Zhou is Presidential Professor in the Department of Botany and Microbiology and Director of the Institute for Environmental Genomics at the University of Oklahoma.AA number of grand challenges are presented by bi-
ology in the 21st century. One of these is linking genomics to ecological processes and functions and estimating responses of the environment to carbon dioxide (CO2), temperature, and pre-
cipitation. Another is linking biodiversity to ecosystem func-tions. A third is performing spatial and temporal informational scaling, from cells to individuals, populations, communities, ecosystems, and the biosphere.
The University of Oklahoma’s (OU) Institute for Environ-mental Genomics engages in research on microbial functional genomics of interest in the fields of bioenergy, environmental cleanup, global climate change, and agriculture. In the field of genomics, we have developed a unique microarray-based technology for environmental studies: the GeoChip. We are using this tool and high-throughput sequencing technologies to address fundamental questions in these fields.
COMMUNITY GENOMICSGlobally, the diversity of microorganisms is extremely high, with up to 40,000 species per gram of soil with most (~ 99%) as yet uncultured. Exploring the microbial world may transform our understanding of biology. We are now trying to answer several fundamental questions. How diverse is life? What is the definition of species? How do microbial communities affect their hosts? How do microbial communities work? How do they react to environmental change? What governs community robustness? How do microbes evolve?
The high throughput approaches currently available to answer these questions fall into two categories: open format and closed format detection. Sequencing, proteomic, and metabolomic approaches are open formats because we cannot ensure that the same genes, proteins, or organisms can be compared across samples nor can we predict the results to be obtained. With a closed format such as microarrays, we can ensure that the same defined genes, proteins, or organisms are compared across dif-ferent samples.
There are other key differences between open and closed format detection. Open format is more sensitive to random sampling errors and is strongly affected by dominant organisms. Also, open format is very sensitive to sample contamination whereas closed format is not. In addition, data analysis with open format detec-tion is much slower compared to that with closed format detection. The take-home message is that we should use these approaches in a complementary way.
THE GEOCHIPOne of the high throughput tools we have developed at OU is the GeoChip, or Functional Gene Array (FGA). We call it GeoChip because the array is designed to target various biogeochemical processes.

ENERGY,ECOSYSTEM,ANDENVIRONMENTALCHANGE | 43
The GeoChip links community structure to functions. When our paper “GeoChip: a comprehensive microarray for investi-gating biogeochemical, ecological and environmental processes” was published by the International Society for Microbial Ecol-ogy in 2007, the paper drew national attention. The GeoChip was later ranked by R & D magazine among the most out-standing 100 technological innovations and breakthroughs of 2009. The National Science Foundation’s National Ecological Observation Network (NEON) Roadmap and the National Academy of Sciences Metagenomics Report cited the GeoChip as the only high throughput metagenomics tool for linking community structure to community functions.
The main advantages of GeoChip compared to other approach-es are a) its ability to detect functional potential and activity of microbial communities, b) its higher resolution down to the species-strain level, and c) its quantitative nature without poly-merase chain reaction (PCR) amplification involved. GeoChip 4.0, the most recent version, allows categorization of more than 500 gene functions, including carbon, nitrogen, sulfur and phosphorus cycling, antibiotic resistance, contaminant degrada-tion, metal reduction and resistance, stress response, virulence, bacterial phage-mediated lysis. GeoChip also establishes universal standards for data comparison across different experi-ments and time scales.
With GeoChip we have analyzed many samples per year. Main applications include analysis of environmental samples from groundwater, aquatic systems, soils, extreme environments, bioreactors, bioleaching systems, and human microbiomes.
• Groundwater: monitoring bioremediation processes and impacts of contaminants on microbial communities
• Soil: the effects of plant diversity and climate change on soil microbial communities in grasslands, spatial scaling of forest soils, tilling versus no tilling on agricultural soils, oil-contam-inated soils, and arsenic-contaminated soils
• Aquatic systems: marine and river sediments, coral mucus
• Extreme environments: hydrothermal vents, acid mine drain-age, deep-sea basalt, and hypersaline lakes
• Bioreactors: wastewater treatment, biohydrogen production, and microbial fuel cells
• Human microbiomes: oral and gut microbiomes
The GeoChip was also deployed in the aftermath of the BP oil spill to elucidate the enrichment of indigenous oil-degrading bacteria in deep-sea oil plumes. Ordination plots produced from principal-component analysis (PCA) of geochemical data for all the monitoring samples demonstrated that the overall geochemical pattern was considerably different between the plume and non-plume samples. Detrended correspondence analysis (DCA) of the normalized signal intensity data for plume samples and non-plume samples showed that the oil spill significantly affected the microbial community structure.
ADDRESSING THE GRAND QUESTIONS IN SCIENCEOne of the most challenging issues today is whether rising atmospheric carbon dioxide will have positive or negative feedbacks. GeoChip can be useful to facilitate addressing such grand scientific questions.
As we know, the concentration of CO2 in the atmosphere has increased from 320 parts per million (ppm) in 1960 to 370 ppm right now. As a result, the global increase in temperature is about 0.6 ºC. This increase of CO2 and temperature could stimulate plant growth and photosynthesis and thus decrease the concentration of atmospheric CO2, which results in a negative feedback. However, increasing CO2 and temperature could also stimulate the decomposition of soil organic matter, which will increase the concentration of CO2 in the atmo-sphere, a positive feedback. It is not clear whether the feedback is negative or positive because there are many things we do not know. The impact of elevated CO2 on above ground plants is well studied, but it is not clear how CO2 and temperature affect belowground processes such as nitrification, nitrogen fixation, denitrification, and soil organic matter decomposition.
At OU we are conducting a 10-year study on 24 plots at a grassland under different regimens of clipping and warming. Based on GeoChip results, we can look at individual functional genes in detail. The genes involved in carbon fixation are highly abundant. If this can be translated into carbon fixation, more carbon could be fixed. This could be a good indication in terms of negative feedback to climate warming.
GeoChip can also be used to determine the effects of elevated CO2 on soil microbial communities. At our experimental site at OU, DCA analysis revealed that the communities under elevated CO2 are well separated from ambient CO2, suggest-ing that CO2 has significant effects on microbial community structure. Based on the functional genes, we can look at how different genes respond to CO2. The genes involved in cellulose degradation increase significantly, but lignin degradation does not. No changes in lignin degradation could favor the stabil-ity of recalcitrant carbon in soils. In addition, nitrogen fixation genes were substantially increased, and there were few changes in other nitrogen related processes.
Measuring nitrogen fixation using an isotope approach, we found more nitrogen was fixed at elevated CO2 than at ambi-ent CO2. This has important implications for global change modeling; if the feedback is dependent on microbial commu-nity structure, global change models must consider microbial community structure as a part of the model.
GeoChip is a generic tool for microbial community analysis. We have used GeoChip to analyze microbial community struc-ture from many different environments, such as groundwaters, soils, marine sediments, hydrothermal vents, bioreactors and bioleaching systems. All have worked very well and demon-strated that GeoChip is a powerful tool for studying microbial functional community structure.
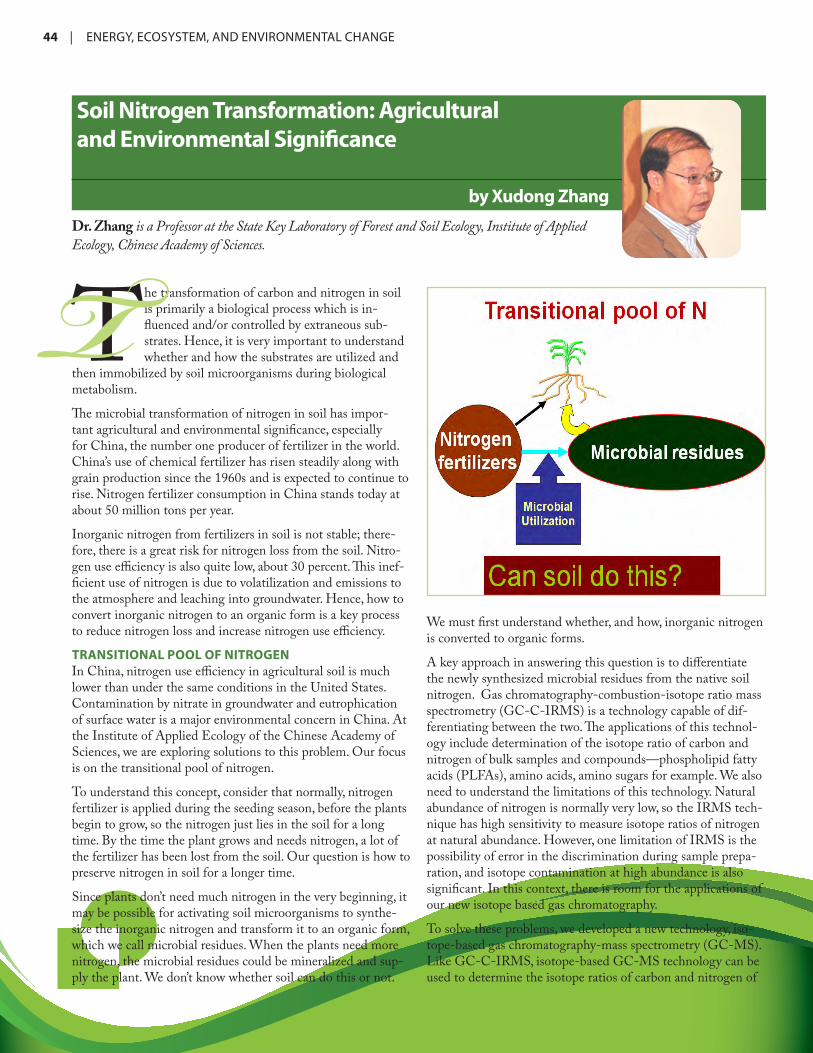
44 | ENERGY,ECOSYSTEM,ANDENVIRONMENTALCHANGE
Soil Nitrogen Transformation: Agriculturaland Environmental Significance
by Xudong ZhangDr. Zhang is a Professor at the State Key Laboratory of Forest and Soil Ecology, Institute of Applied Ecology, Chinese Academy of Sciences.
The transformation of carbon and nitrogen in soil is primarily a biological process which is in-fluenced and/or controlled by extraneous sub-strates. Hence, it is very important to understand whether and how the substrates are utilized and
then immobilized by soil microorganisms during biological metabolism.
The microbial transformation of nitrogen in soil has impor-tant agricultural and environmental significance, especially for China, the number one producer of fertilizer in the world. China’s use of chemical fertilizer has risen steadily along with grain production since the 1960s and is expected to continue to rise. Nitrogen fertilizer consumption in China stands today at about 50 million tons per year.
Inorganic nitrogen from fertilizers in soil is not stable; there-fore, there is a great risk for nitrogen loss from the soil. Nitro-gen use efficiency is also quite low, about 30 percent. This inef-ficient use of nitrogen is due to volatilization and emissions to the atmosphere and leaching into groundwater. Hence, how to convert inorganic nitrogen to an organic form is a key process to reduce nitrogen loss and increase nitrogen use efficiency.
TRANSITIONAL POOL OF NITROGENIn China, nitrogen use efficiency in agricultural soil is much lower than under the same conditions in the United States. Contamination by nitrate in groundwater and eutrophication of surface water is a major environmental concern in China. At the Institute of Applied Ecology of the Chinese Academy of Sciences, we are exploring solutions to this problem. Our focus is on the transitional pool of nitrogen.
To understand this concept, consider that normally, nitrogen fertilizer is applied during the seeding season, before the plants begin to grow, so the nitrogen just lies in the soil for a long time. By the time the plant grows and needs nitrogen, a lot of the fertilizer has been lost from the soil. Our question is how to preserve nitrogen in soil for a longer time.
Since plants don’t need much nitrogen in the very beginning, it may be possible for activating soil microorganisms to synthe-size the inorganic nitrogen and transform it to an organic form, which we call microbial residues. When the plants need more nitrogen, the microbial residues could be mineralized and sup-ply the plant. We don’t know whether soil can do this or not.
We must first understand whether, and how, inorganic nitrogen is converted to organic forms.
A key approach in answering this question is to differentiate the newly synthesized microbial residues from the native soil nitrogen. Gas chromatography-combustion-isotope ratio mass spectrometry (GC-C-IRMS) is a technology capable of dif-ferentiating between the two. The applications of this technol-ogy include determination of the isotope ratio of carbon and nitrogen of bulk samples and compounds—phospholipid fatty acids (PLFAs), amino acids, amino sugars for example. We also need to understand the limitations of this technology. Natural abundance of nitrogen is normally very low, so the IRMS tech-nique has high sensitivity to measure isotope ratios of nitrogen at natural abundance. However, one limitation of IRMS is the possibility of error in the discrimination during sample prepa-ration, and isotope contamination at high abundance is also significant. In this context, there is room for the applications of our new isotope based gas chromatography.
To solve these problems, we developed a new technology, iso-tope-based gas chromatography-mass spectrometry (GC-MS). Like GC-C-IRMS, isotope-based GC-MS technology can be used to determine the isotope ratios of carbon and nitrogen of
T

ENERGY,ECOSYSTEM,ANDENVIRONMENTALCHANGE | 45
certain compounds such as PLFAs, amino acids, amino sugars, and neutral sugars. It has excellent resolution of gas chro-matography, better than GC-C-IRMS. GC-MS also has no memory effect; that is, no matter the amount of isotope in the compound, nitrogen determination is not affected. In addition, this technology is simple and inexpensive to operate, and it can perform multiple analyses. But, the sensitivity depends on the composition of the sample and the instrument used..
AMINO SUGARSThe transitional pool of nitrogen in soil can be used to further understand the processes of nitrogen transformation in soil. As important constituents of the microbial cell wall, amino sugars are not only the storage pool for the immobilized carbon and nitrogen, but also reliable microbial residue biomarkers of different populations due to their heterogeneous origins: fungi and bacteria.
We identified three amino sugars and examined the microbial processes of each: glucosamine, galactosamine, and muramic acid. Muramic acid, a componenent of the peptidoglycan, or murein, in the bacterial cell wall, originates exclusively from bacteria. Glucosamine in soil is mainly in the form of chitin in fungal cell walls. Because amino sugars in soil mainly con-tain dead microbial residues, theoretically they can reflect the changes in the community structure of microorganisms over time.
We tracked the microbial transformation process over time in two types of soil, molli-sol and oxisol, using these three amino sugars. We compared the incorporation of nitrogen into microbial residues, the amino acids, by manipulating the ratio of carbon to nitro-gen (C/N). In soils, different microorganisms have different ratios of C/N. For soil fungi, the C/N ratio is on average 30:1, for bacteria around 10:1. By raising the C/N ratio from 10:1 to 30:1, it is possible affect the transitional pool of nitrogen in soils because the available nitrogen controls enzymatic activity.
Conversion of inorganic fertilizer to the organic form is necessary to provide adequate available nitrogen pools to growing plants. By under-standing what controls enzyme activity we may be able to ac-tivate the process and increase
the level of available nitrogen when the plant most needs it. By varying the C/N ratio of inorganic nitrogen from low (5:1) to medium (10:1) to high (30:1), we were able to track changes in enzyme activity. For all three enzymes, the lower the C/N ratio, the higher the activity of the enzymes. The higher the C/N ratio the more organic nitrogen will be synthesized in the process. The C/N ratio must be high enough and amino sugars abundant enough to provide a transitional pool.
In practical terms, these results indicate that we should change tillage practices in China. Traditional tillage involves removing the above ground residuals after harvest, which means the soil organic material is not returned to soil, resulting in a low C/N ratio. If we change the soil tillage system and return the plant residues to the soil, we can improve the efficiency of nitrogen use. A better understanding of the production, stabilization, and turnover of amino sugars can be achieved by differentiating the newly synthesized microbial residues from the native portions. Using our recently developed isotope-based GC-MS spec-trometry method to obtain measured results, we show that this method offers a new opportunity to study the transformation dynamics of the ‘new’ and ‘old’ soil microbial residues.

46 | ENERGY,ECOSYSTEM,ANDENVIRONMENTALCHANGE
Dr. Song is an Associate Professor at the Key Laboratory of Ecosystem Network Observation and Modeling, Institute of Geographic Sciences and Natural Resources Research, Chinese Academy of Sciences.
Soil temperature and soil carbon (C) or nitrogen (N) content are important factors that influence decom-position. Therefore, understanding the sensitivity of organic C and N mineralization to these factors is crucial. Global changes lead to increases in tempera-
ture, changes in atmospheric carbon dioxide (CO2) concentra-tions, and atmospheric N deposition. All these changes can affect various soil processes. Knowledge about how these factors affect soil organic matter decomposition is useful for the reli-able prediction of C dynamics under future climate scenarios.
GLOBAL CHANGE AND SOIL PROCESSES Net C and N mineralization have often been studied together due to the closely related processes. The connection between C and net N mineralization is reflected in most N mineralization models, which assume constant C/N ratios of the microorgan-isms or variation of C/N ratios within certain limits. Other models are based on empirical relationships between net N and C mineralization.
Net N mineralization is the result of two opposing processes: gross N mineralization and gross N immobilization. Therefore, net N mineralization is difficult to predict. In a great number of decomposing litter materials, two distinct phases can be distin-guished. A period of N accumulation is followed by a period of net N release. The duration and magnitude of N accumulation depends on the C/N ratio of the substrate.
Correlation between net N mineralization and CO2 production was found to be positive, negative, or no correlation. Murphy et al. (2003) have suggested that the relationship between min-eralized N and respiration largely depends on the C/N ratio of the decomposing pool and the efficiency of microbial C use.
Basic stoichiometric decomposition theory predicts that eco-systems will store more C if increasing atmospheric CO2 leads to greater substrate C/N (Hessen et al., 2004), while increasing N availability would decrease soil C storage (Mack et al., 2004). The common idea is that N additions caused the old soil or-ganic matter decomposition due to enhanced microbial activity (e.g. Kuzyakov et al., 2000).
However, some studies showed that N addition resulted in a decline in decomposition: CO2 evolution decreased follow-ing N fertilization (Westerman and Tucker, 1974; Wang et al., 2004). To what extent external labile C or N regulated the cor-
relation between N mineralization and CO2 efflux is a question that needs to be answered.
TIBETAN ALPINE MEADOW SOIL IN THE LABSoil samples were collected from an experimental trial at the Haibei Research Station of Alpine Meadow Ecosystem, Chi-nese Academy of Sciences, located in the northeastern region of the Qinghai-Tibet Plateau (37°32´N, 101°15´E). The average altitude is 3240 meters above sea level, annual precipitation is 618 millimeters per year, mean annual temperature is -1.7 °C, and the soil type is classified as Mat Cry-gelic Cambisols corresponding to Gelic Cambisol. The study area is dominated by Kobresia humilis Serg (Cyperaeae). Common species include grasses such as Stipa aliena, Elymus nutans Griseb, herbs such as Saussurea superba Anth. and Gentiana straminea Maxim. Total surface vegetative cover is more than 95 percent. Rooting depth is shallow, with more than 90 percent of root mass concentrated within the upper 15 centimeters (cm) of the soil layer.
The characteristics of the top 10 cm of soil at the study site were analyzed to determine pH, bulk density, C/N ratio, soil organic carbon (SOC), total soil N, microbial biomass of N, dissolved organic nitrogen (DON), extractable inorganic N, the C/N ratio of soil microbes, and the C/N ratio of senesced plants. Two 2-factorial experimental designs were applied in the laboratory using additions of glucose and ammonium sulfate to sieved and oven-dried soil samples at temperatures ranging from 5, 15, and 25ºC. The CO2 that evolved from the soil was measured at 1, 4, 7, 14, 21, and 28 days.
A General Linear Model was used to examine the effects of temperature and the external additive C or N on CO2 respira-tion and net N mineralization. Regression analysis was used to analyze the relationship between cumulative CO2-C emissions and external addition of C doses, and to analyze the relation-ship of CO2-C respiration to net nitrogen mineralization for non-amended and N or C amended soil respectively. One-way ANOVA was used to test the effects of external C or N addi-tion on temperature sensitivity of carbon mineralization (Q10).
The results showed that
• External N addition had no significant effect on CO2 emis-sion and net N mineralization. However, external C addition significantly increased CO2 emissions and microbial immobi-lization, especially for the high C dose.
Effects of Temperature, Glucose, and Inorganic Nitrogen Inputs on Carbon and Net Nitrogen Mineralization in a Tibetan Alpine Meadow Soil
by Minghua Song
S
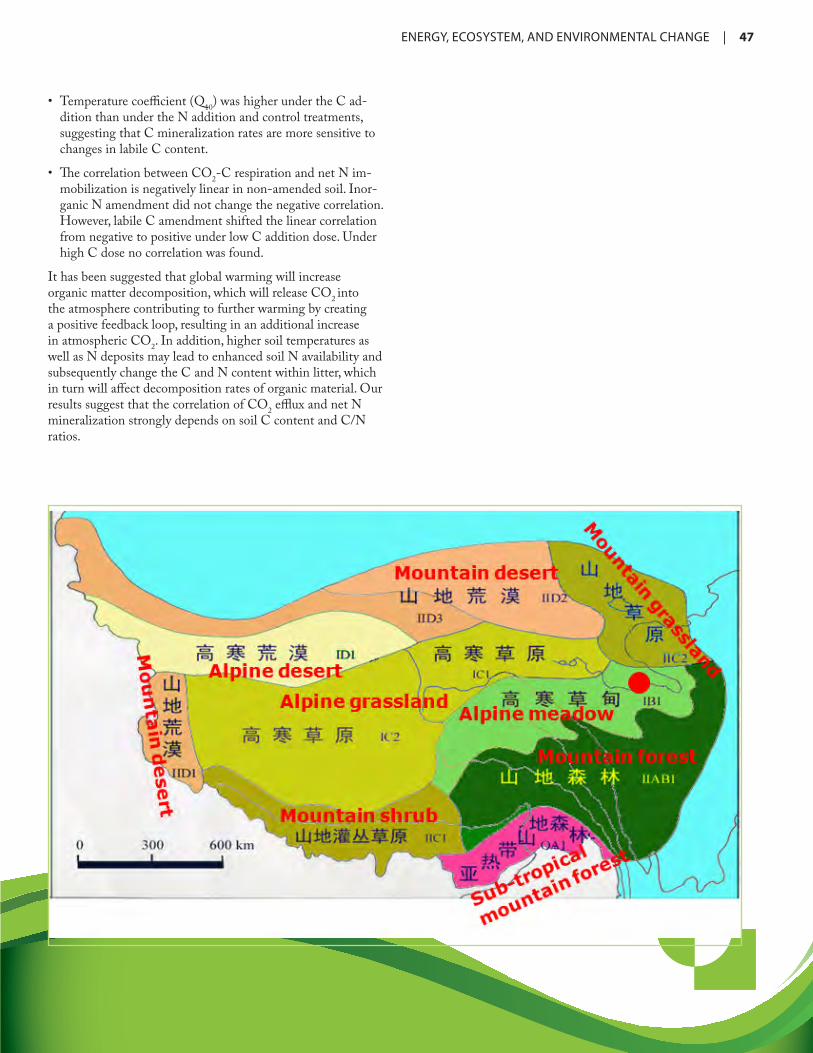
ENERGY,ECOSYSTEM,ANDENVIRONMENTALCHANGE | 47
• Temperature coefficient (Q10) was higher under the C ad-dition than under the N addition and control treatments, suggesting that C mineralization rates are more sensitive to changes in labile C content.
• The correlation between CO2-C respiration and net N im-mobilization is negatively linear in non-amended soil. Inor-ganic N amendment did not change the negative correlation. However, labile C amendment shifted the linear correlation from negative to positive under low C addition dose. Under high C dose no correlation was found.
It has been suggested that global warming will increase organic matter decomposition, which will release CO2 into the atmosphere contributing to further warming by creating a positive feedback loop, resulting in an additional increase in atmospheric CO2. In addition, higher soil temperatures as well as N deposits may lead to enhanced soil N availability and subsequently change the C and N content within litter, which in turn will affect decomposition rates of organic material. Our results suggest that the correlation of CO2 efflux and net N mineralization strongly depends on soil C content and C/N ratios.

48 | ENERGY,ECOSYSTEM,ANDENVIRONMENTALCHANGE
The Effect of Biochar on the Paddy Soilin Southern China
by Jingyuan WangDr. Wang is an Assistant Researcher with the Institute of Geographic Sciences and Natural Resources Research, Chinese Academy of Sciences.
Finding ways to store carbon dioxide (CO2) in carbon sinks is a top priority in discussions about global warming. The carbon in charred organic mat-ter decomposes fairly rapidly over time, while the carbon in charred matter remains relatively stable
after several years. Biochar, therefore, is one potential solution to the search for a stable carbon sink.
Carbon sequestration by photosynthesis is carbon neutral, whereas sequestration of the carbon in biochar is carbon nega-tive; that is, it reduces carbon emissions from biomass. At the Institute of Geographical Sciences and Natural Resources Re-search, we are examining the effect of biochar as a soil amend-ment and its effects on plant elements and biomass.
BIOCHAR EFFECTSChina has a long history, more than 1500 years, of producing charcoal as a fuel, but not as a soil amendment. The biochar for our experiment was produced at Qianyanzhou ecological station in southern China through a very simple process of heating wood in a kiln. The biochar productivity of wood fired in the kiln at 450ºC is about 33 percent.
To study the effects of biochar input on paddy soil, biochar was added to rice paddy fields. We used 30 plots (3 x 3 meters) which were fertilized in three plot replicates per treatment with a control, biochar, straw, inorganic fertilizer, biochar plus inor-ganic fertilizer, and biochar plus straw. The biochar and straw were applied at two levels, 3,000 kilograms (kg) per hectare and 6,000 kg per hectare.
In the course of the study, one growing season, we found that
• biochar apparently did not enhance soil pH, but it is possible that continuous use of biochar could enhance pH,
• addition of biochar changed the carbon content but did not change the nitrogen and phosphorous content of soil,
• biochar enhanced the carbon/nitrogen (C/N) ratio, but straw did not,
• the increase in yield on the plot with biochar and inorganic fertilizer was due to an increase in the number of tillers (shoots), not from the weight of a single grain of rice,
• the major differences in biomass are from the stem and leaf, not the root biomass,
• the major influence of biochar is on the root carbon content,
• the leaf is the major source of nitrogen, and the addition of biochar had no effect on nitrogen content of the plant,
• the root is the major source of phosphorous,
• biochar plus inorganic fertilizer increased overall biomass,
• biochar plus straw increased total C and total N,
• addition of biochar had a significant effect on tiller number and soil C/N ratios,
• biochar plus fertilizer can significantly increase biomass, and the agricultural ecosystem may sequester more carbon through biochar addition.
From these results we conclude that after one growing season, soil carbon increased in the plot with straw and biochar, and the pH of the soil increased slightly with biochar and straw. The plot with biochar plus inorganic fertilizer had the highest yield. The yield of the plot with biochar was higher than that of the control. Overall, we found that biochar can enhance soil carbon content and also decrease the use of inorganic fertilizer.
Lehman, 2007, Nature
F
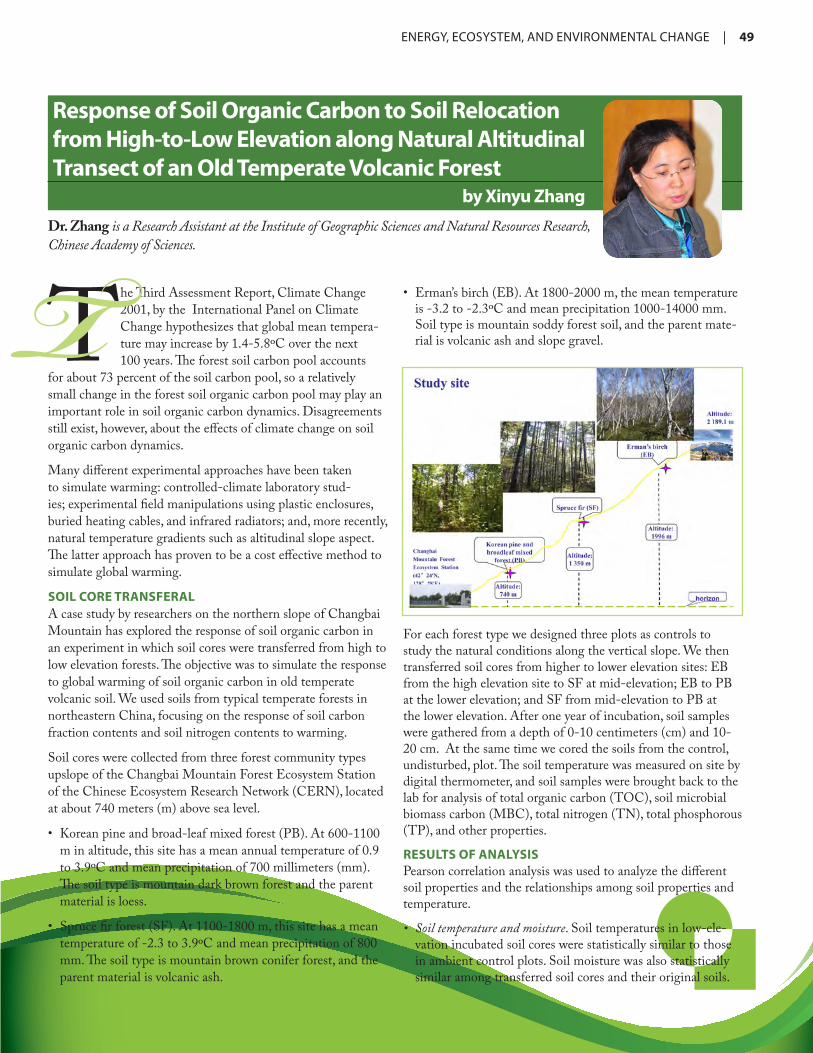
ENERGY,ECOSYSTEM,ANDENVIRONMENTALCHANGE | 49
For each forest type we designed three plots as controls to study the natural conditions along the vertical slope. We then transferred soil cores from higher to lower elevation sites: EB from the high elevation site to SF at mid-elevation; EB to PB at the lower elevation; and SF from mid-elevation to PB at the lower elevation. After one year of incubation, soil samples were gathered from a depth of 0-10 centimeters (cm) and 10-20 cm. At the same time we cored the soils from the control, undisturbed, plot. The soil temperature was measured on site by digital thermometer, and soil samples were brought back to the lab for analysis of total organic carbon (TOC), soil microbial biomass carbon (MBC), total nitrogen (TN), total phosphorous (TP), and other properties.
RESULTS OF ANALYSISPearson correlation analysis was used to analyze the different soil properties and the relationships among soil properties and temperature.
• Soil temperature and moisture. Soil temperatures in low-ele-vation incubated soil cores were statistically similar to those in ambient control plots. Soil moisture was also statistically similar among transferred soil cores and their original soils.
Response of Soil Organic Carbon to Soil Relocation from High-to-Low Elevation along Natural Altitudinal Transect of an Old Temperate Volcanic Forest
by Xinyu Zhang
The Third Assessment Report, Climate Change 2001, by the International Panel on Climate Change hypothesizes that global mean tempera-ture may increase by 1.4-5.8ºC over the next 100 years. The forest soil carbon pool accounts
for about 73 percent of the soil carbon pool, so a relatively small change in the forest soil organic carbon pool may play an important role in soil organic carbon dynamics. Disagreements still exist, however, about the effects of climate change on soil organic carbon dynamics.
Many different experimental approaches have been taken to simulate warming: controlled-climate laboratory stud-ies; experimental field manipulations using plastic enclosures, buried heating cables, and infrared radiators; and, more recently, natural temperature gradients such as altitudinal slope aspect. The latter approach has proven to be a cost effective method to simulate global warming.
SOIL CORE TRANSFERAL A case study by researchers on the northern slope of Changbai Mountain has explored the response of soil organic carbon in an experiment in which soil cores were transferred from high to low elevation forests. The objective was to simulate the response to global warming of soil organic carbon in old temperate volcanic soil. We used soils from typical temperate forests in northeastern China, focusing on the response of soil carbon fraction contents and soil nitrogen contents to warming.
Soil cores were collected from three forest community types upslope of the Changbai Mountain Forest Ecosystem Station of the Chinese Ecosystem Research Network (CERN), located at about 740 meters (m) above sea level.
• Korean pine and broad-leaf mixed forest (PB). At 600-1100 m in altitude, this site has a mean annual temperature of 0.9 to 3.9ºC and mean precipitation of 700 millimeters (mm). The soil type is mountain dark brown forest and the parent material is loess.
• Spruce fir forest (SF). At 1100-1800 m, this site has a mean temperature of -2.3 to 3.9ºC and mean precipitation of 800 mm. The soil type is mountain brown conifer forest, and the parent material is volcanic ash.
Dr. Zhang is a Research Assistant at the Institute of Geographic Sciences and Natural Resources Research, Chinese Academy of Sciences.
• Erman’s birch (EB). At 1800-2000 m, the mean temperature is -3.2 to -2.3ºC and mean precipitation 1000-14000 mm. Soil type is mountain soddy forest soil, and the parent mate-rial is volcanic ash and slope gravel. T
50 | ENERGY,ECOSYSTEM,ANDENVIRONMENTALCHANGE
As expected, the soil-core relocation caused a significant increase in soil temperature but had no significant effect on soil moisture.
• Soil TOC, TN, and TP densities of 0-20 cm layers. Soil nutrient densities were affected both by soil nutrient contents and soil bulk densities. In general, the densities of soil TOC, TN, and TP were largest in the lower altitude PB forest, moderate in high altitude EB forest, and smallest in the moderate altitude SF forest.
• Soil TOC contents. The TOC contents decreased from higher to lower elevation sites. Samples from a depth of 0-10 cm had significantly higher mean SOC contents than from 10-20 cm. Soil relocation significantly decreased SOC contents, and SOC was negatively related to soil temperature but positively related to soil moisture.
• Soil labile organic contents (LOC). Under natural conditions the contents of LOC were largest in the high-elevation EB forest, moderate in mid-elevation SF forest, and smallest in low-elevation PB forest. After one year of incubation, soil relocation increased LOC.
• Soil dissolved organic contents (DOC) and dissolved inorganic carbon (DIC) contents. Under natural conditions the contents of DOC were largest in the high-elevation EB forest, mod-erate in mid-elevation SF forest, and smallest in the low-elevation PB forest. Soil relocation increased DOC contents.
• Soil microbial biomass carbon (MBC) contents. There were no significant differences of MBC among the three forest soils. Soil relocation downslope increased MBC.
• Soil dissolved nitrogen contents. Under natural conditions the contents of available nitrogen were largest in the high-elevation EB forest, moderate in mid-elevation SF forest, and smallest in the low-elevation PB forest. Soil relocation in-creased available nitrogen contents and increased the nitrate concentration in EB.
• Soil organic carbon δ13C values. The soil samples were significantly enriched in the isotopic signature δ 13C (-26.4~-25.2 ‰) relative to the litters (-29.6~-28.3 ‰). The δ13C values in the soils were enriched downward through the soil layers in the three forest types.
• Soil organic carbon δ13C values in particle-sized fractions. In general, soil δ13C values increased by 1.1 ‰ with decreasing particle size from >63 microns (μm) to <63 μm fractions.
The results showed that under natural conditions the contents of TOC were largest in EB, moderate in SF, and smallest in PB. Pearson correlation analysis demonstrates that TOC content was positively related to soil moisture. After one year incuba-tion, soil relocation significantly decreased TOC contents and decreased δ13C values especially in <63 μm size fractions. The results may suggest that climatic warming may accelerate the decomposition of old soil carbon in fine size fractions.
See: Zhang, Xin-Yu; Meng, Xian-Jing; Fan, Jin-Juan; Gao, Lu-Peng; and Sun, Xiao-Mina. Soil Total Organic Carbon, δ13C Values and Their Responses to the Soil Core Transferring Experiment from High- to Low-elevation Forest along Natural Altitudinal Transect of Old Temperate Volcanic Forest Soils. Proceedings of the International Congress on Environmental Modelling and Software, July 5-8, 2010, Ottawa, Canada.
REFERENCES:IPCC. Intergovernmental panel on climate change, Climate change 2001: The scientific basis. In: J.T. Houghton, et al, (eds). Contribution of working group I to the third assessment report of the IPCC. Cambridge: Cambridge University Press, 2001.
Hart SC, Perry DA. Transferring soils from high- to low- el-evation forests increases nitrogen cycling rates: climate change implications. Global Change Biology, 1999,5, 3-32.
Hart SC. Potential impacts of climate change on nitrogen transformations and greenhouse gas fluxes in forests: a soil transfer study. Global Change Biology, 2006, 12, 1032-1046.
Changbai Mountain Forest Ecosystem Research Station. http://derndis.cern.ac.cn/subsiteList.ist.jsp.
Xu XK, Inubushi K, Sakamoto K. Effect of vegetations and temperature on microbial biomass carbon and metabolic quo-tients of temperate volcanic forest soils. Geoderma, 2006, 136, 310-319.
Bird MI, Veenendaal EM, Lloyd JJ. Soil carbon inventories and d13C along a moisture gradient in Botswana. Global Change Biology, 2004, 10: 342-349

Ecos
yste
m C
ycle
s of
C
arbo
n an
d N
itrog
en
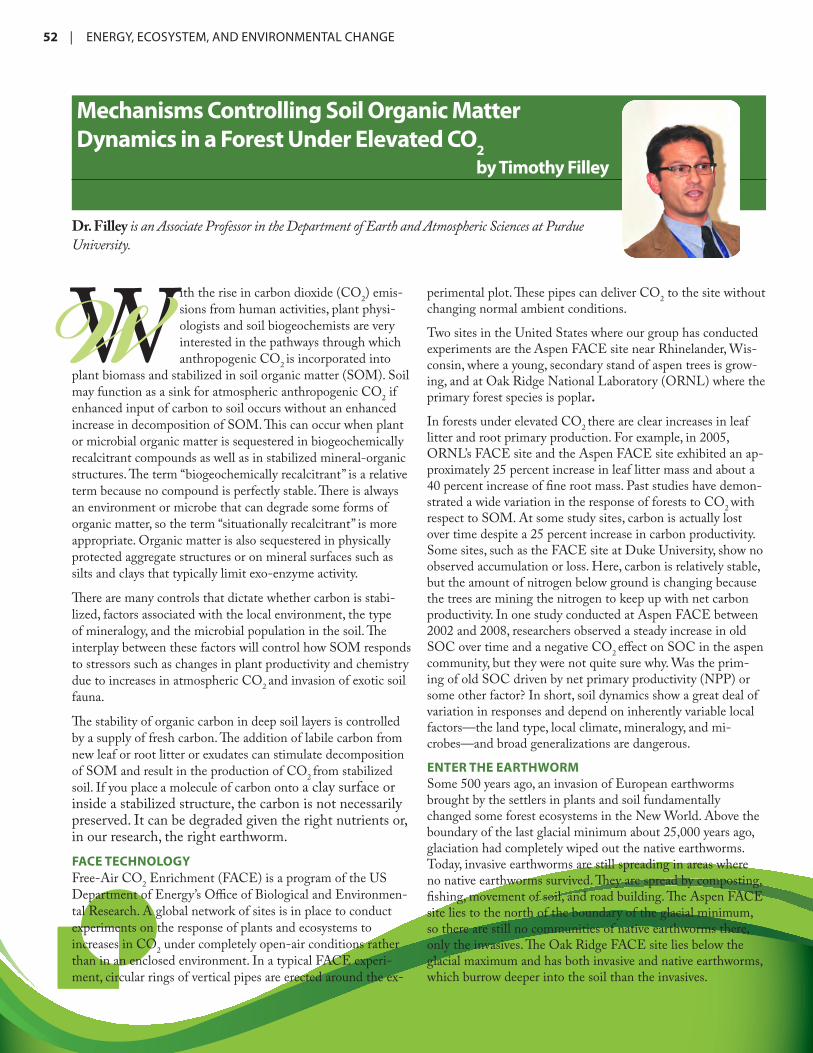
52 | ENERGY,ECOSYSTEM,ANDENVIRONMENTALCHANGE
Dr. Filley is an Associate Professor in the Department of Earth and Atmospheric Sciences at Purdue University.
Mechanisms Controlling Soil Organic MatterDynamics in a Forest Under Elevated CO2
by Timothy Filley
With the rise in carbon dioxide (CO2) emis-sions from human activities, plant physi-ologists and soil biogeochemists are very interested in the pathways through which anthropogenic CO2 is incorporated into
plant biomass and stabilized in soil organic matter (SOM). Soil may function as a sink for atmospheric anthropogenic CO2 if enhanced input of carbon to soil occurs without an enhanced increase in decomposition of SOM. This can occur when plant or microbial organic matter is sequestered in biogeochemically recalcitrant compounds as well as in stabilized mineral-organic structures. The term “biogeochemically recalcitrant” is a relative term because no compound is perfectly stable. There is always an environment or microbe that can degrade some forms of organic matter, so the term “situationally recalcitrant” is more appropriate. Organic matter is also sequestered in physically protected aggregate structures or on mineral surfaces such as silts and clays that typically limit exo-enzyme activity.
There are many controls that dictate whether carbon is stabi-lized, factors associated with the local environment, the type of mineralogy, and the microbial population in the soil. The interplay between these factors will control how SOM responds to stressors such as changes in plant productivity and chemistry due to increases in atmospheric CO2 and invasion of exotic soil fauna.
The stability of organic carbon in deep soil layers is controlled by a supply of fresh carbon. The addition of labile carbon from new leaf or root litter or exudates can stimulate decomposition of SOM and result in the production of CO2 from stabilized soil. If you place a molecule of carbon onto a clay surface or inside a stabilized structure, the carbon is not necessarily preserved. It can be degraded given the right nutrients or, in our research, the right earthworm. FACE TECHNOLOGYFree-Air CO2 Enrichment (FACE) is a program of the US Department of Energy’s Office of Biological and Environmen-tal Research. A global network of sites is in place to conduct experiments on the response of plants and ecosystems to increases in CO2 under completely open-air conditions rather than in an enclosed environment. In a typical FACE experi-ment, circular rings of vertical pipes are erected around the ex-
perimental plot. These pipes can deliver CO2 to the site without changing normal ambient conditions.
Two sites in the United States where our group has conducted experiments are the Aspen FACE site near Rhinelander, Wis-consin, where a young, secondary stand of aspen trees is grow-ing, and at Oak Ridge National Laboratory (ORNL) where the primary forest species is poplar.
In forests under elevated CO2 there are clear increases in leaf litter and root primary production. For example, in 2005, ORNL’s FACE site and the Aspen FACE site exhibited an ap-proximately 25 percent increase in leaf litter mass and about a 40 percent increase of fine root mass. Past studies have demon-strated a wide variation in the response of forests to CO2 with respect to SOM. At some study sites, carbon is actually lost over time despite a 25 percent increase in carbon productivity. Some sites, such as the FACE site at Duke University, show no observed accumulation or loss. Here, carbon is relatively stable, but the amount of nitrogen below ground is changing because the trees are mining the nitrogen to keep up with net carbon productivity. In one study conducted at Aspen FACE between 2002 and 2008, researchers observed a steady increase in old SOC over time and a negative CO2 effect on SOC in the aspen community, but they were not quite sure why. Was the prim-ing of old SOC driven by net primary productivity (NPP) or some other factor? In short, soil dynamics show a great deal of variation in responses and depend on inherently variable local factors—the land type, local climate, mineralogy, and mi-crobes—and broad generalizations are dangerous.
ENTER THE EARTHWORMSome 500 years ago, an invasion of European earthworms brought by the settlers in plants and soil fundamentally changed some forest ecosystems in the New World. Above the boundary of the last glacial minimum about 25,000 years ago, glaciation had completely wiped out the native earthworms. Today, invasive earthworms are still spreading in areas where no native earthworms survived. They are spread by composting, fishing, movement of soil, and road building. The Aspen FACE site lies to the north of the boundary of the glacial minimum, so there are still no communities of native earthworms there, only the invasives. The Oak Ridge FACE site lies below the glacial maximum and has both invasive and native earthworms, which burrow deeper into the soil than the invasives.
W
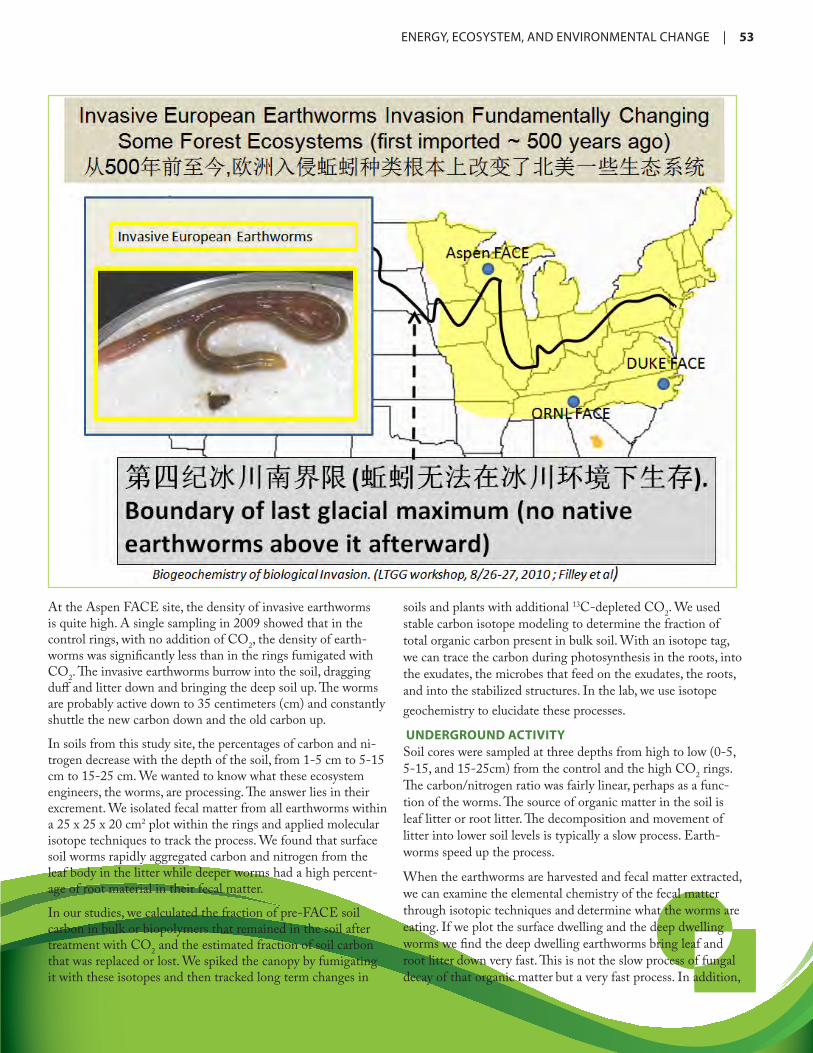
ENERGY,ECOSYSTEM,ANDENVIRONMENTALCHANGE | 53
At the Aspen FACE site, the density of invasive earthworms is quite high. A single sampling in 2009 showed that in the control rings, with no addition of CO2, the density of earth-worms was significantly less than in the rings fumigated with CO2. The invasive earthworms burrow into the soil, dragging duff and litter down and bringing the deep soil up. The worms are probably active down to 35 centimeters (cm) and constantly shuttle the new carbon down and the old carbon up.
In soils from this study site, the percentages of carbon and ni-trogen decrease with the depth of the soil, from 1-5 cm to 5-15 cm to 15-25 cm. We wanted to know what these ecosystem engineers, the worms, are processing. The answer lies in their excrement. We isolated fecal matter from all earthworms within a 25 x 25 x 20 cm2 plot within the rings and applied molecular isotope techniques to track the process. We found that surface soil worms rapidly aggregated carbon and nitrogen from the leaf body in the litter while deeper worms had a high percent-age of root material in their fecal matter.
In our studies, we calculated the fraction of pre-FACE soil carbon in bulk or biopolymers that remained in the soil after treatment with CO2 and the estimated fraction of soil carbon that was replaced or lost. We spiked the canopy by fumigating it with these isotopes and then tracked long term changes in
soils and plants with additional 13C-depleted CO2. We used stable carbon isotope modeling to determine the fraction of total organic carbon present in bulk soil. With an isotope tag, we can trace the carbon during photosynthesis in the roots, into the exudates, the microbes that feed on the exudates, the roots, and into the stabilized structures. In the lab, we use isotope geochemistry to elucidate these processes.
UNDERGROUND ACTIVITYSoil cores were sampled at three depths from high to low (0-5, 5-15, and 15-25cm) from the control and the high CO2 rings. The carbon/nitrogen ratio was fairly linear, perhaps as a func-tion of the worms. The source of organic matter in the soil is leaf litter or root litter. The decomposition and movement of litter into lower soil levels is typically a slow process. Earth-worms speed up the process.
When the earthworms are harvested and fecal matter extracted, we can examine the elemental chemistry of the fecal matter through isotopic techniques and determine what the worms are eating. If we plot the surface dwelling and the deep dwelling worms we find the deep dwelling earthworms bring leaf and root litter down very fast. This is not the slow process of fungal decay of that organic matter but a very fast process. In addition,

54 | ENERGY,ECOSYSTEM,ANDENVIRONMENTALCHANGE
earthworms are not just bringing organic matter down in a one-directional fashion. They also bring up old carbon. Carbon moves up and down through soil layers. We wanted to know what the source of the carbon is, whether from leaf tissue or root tissue. We can determine the source using plant biochem-istry in the soil and fecal matter.
Lignin is the second most abundant biopolymer in terrestrial plants and contributes significantly to the organic carbon input into soils. Cutin is a polyester embedded within cuticular waxes to form the cuticle, which covers the aerial parts of vascular plants and helps minimize the loss of water. Suberin is found in plant roots and is a main constituent of cork. By using com-pound specific stable isotope analysis (CSIA), we can deter-
mine the molecular composition of earthworm fecal matter and plot those chemicals to obtain a clear signature or fingerprint showing whether the source is leaf tissue, root tissue, or petiole tissue. Examination of the fecal matter from these organisms shows that the deeper invasive earthworms have shifted to a root diet, but they pass the material up through the soil and pull the soil chemistry towards the roots faster than happens through a simple process of decomposition without this active eating process.
We also wanted to know whether the earthworms are pro-cessing and stabilizing degraded carbon or fresh carbon. The lignin offers an answer to that question. When we extract lignin, it breaks into oxidized fragments and reduced frag-

ENERGY,ECOSYSTEM,ANDENVIRONMENTALCHANGE | 55
ments. The ratio of those fragments can tell us whether the carbon is degraded or fresh. For the deep dwelling earthworms, isotope calculation from oldest to newest carbon in low and high CO2 concentrations shows that 50 percent of their cuticle compounds, but only 10 percent of root tissue, is pre-FACE experiment. These worms are selectively processing, pelletizing, and aggregating suberin. The opposite is true for surface worms. Selective partitioning gives a chemical trajectory of the soil based upon the species in the soil.
We found the same processes at work on the Oak Ridge FACE site, where deep earthworms, shallow earthworms, and scarab beetles co-exist. Shallow worms and scarab beetles feed on and pelletize nearly 100 percent of the fine roots, while the deeper dwelling earthworms pull the leaf litter towards the root and mix it chemically within the deeper soils.
This line of research shows that invasive earthworms are a potentially significant and unaccounted for factor in carbon dynamics in North American FACE experiments. Earthworm activity may be responsible for dilution of carbon in shallow soil with “old” carbon or the movement of young carbon from the surface to deeper soil levels, thus masking or removing ap-parent SOC gains. CSIA forensics on earthworm fecal matter demonstrate the dynamic nature of lignin and substituted fatty acids from cutin and suberin mixing and turnover as well as feeding habits. These processes promote selective stabilization of root and leaf tissue in soils.

56 | ENERGY,ECOSYSTEM,ANDENVIRONMENTALCHANGE
Effects of Climate Change and Plantation on the Carbon Budget of Coniferous Forests in Poyang Lake Basin from 1981 to 2008
by Shaoqiang WangDr. Wang is a Professor at the Key Laboratory of Ecosystem Observation and Modeling, Institute of Geographic Sciences and Natural Resources Research Laboratory, Chinese Academy of Sciences.
The Poyang Lake Basin is the largest freshwater lake in China. It is located in Jiangxi Province, which has a population of 43 million and a total area of 166,900 square kilometers (km2). The Poy-ang Lake Basin occupies 97 percent of the total
land of the province. Total forest land coverage is 63 percent, with 2.91 million hectares of Masson pine, 0.57 million hect-ares of slash pine, and 2.49 million hectares of China fir. The coniferous forest occupies 56 percent of the total forest area in Jiangxi Province.
The Qianyanzhou Experimental Station (QYZ) was established in 1984 by the Institute of Geographic Sciences and Natural Resources Research (IGSNRR) to implement ecological res-toration projects, which are having large effects on the carbon cycle and carbon transport in Poyang Lake Basin. In 1985, for-est recovery was about 30 percent. By 2005 forest recovery had increased to 63 percent.
In this study we used a PnET-CN model to explore the water, carbon, and nitrogen dynamics for forest ecosystems in Poyang Lake Basin. The PnET-CN model is a generalized, lump–pa-rameter model developed by the Complex System Research Center at the University of New Hampshire. The original model was designed to simultaneously estimate water and
carbon fluxes of the canopy. After several improvements PnET-CN contains modules of carbon, nitrogen, and water and is a simple model applicable to all terrestrial ecosystem types.
DATA ANALYSIS We gathered forest plot data from 1990 to 2004, eddy flux observation data from 2003 to 2007 at the QYZ station, and climate data from 22 meteorological stations from 1981 to 2008. In addition, we used forest inventory statistical data from 1989 to 2005 for the whole province and land use data based on remote sensing in 2000. We extrapolated the annual forest spatial distribution pattern based on the forest inventory, land use patterns, and administrative boundaries, and some pub-lished reports and papers using spatial random distribution techniques. All input from spatial datasets for potential regional restoration are at 1-km resolution and output results are at 1-year temporal resolution for potential regional restoration.
There are 25 modules included in the PnET model, including gross photosynthesis, foliar respiration, carbon allocation to different parts of the plants, precipitation, and other processes. In our calibrations we included an observational data plot inventory for biomass, soil, eddy flux, and meteorological data at the experimental station from 1990 to 2007; plot inventory data for the carbon content of different plant parts, leaf, litter, root, woody biomass, and leaf nitrogen content for coniferous trees from 1992 to 1994, including Slash pine, Masson pine and China fir; soil respiration measurements taken from 2003 to 2007; net primary production (NPP) derived from tree rings from 2006 to 2007; gross primary production (GPP) derived from net ecosystem exchange (NEE) observation at the QYZ experimental station from 2003 to 2004; and meteorological data.
VALIDATION OF THE MODELUsing the GPP derived from NEE measurements, we show that the PnET-CN model can explain the variation of GPP of coniferous forest in the plot scale at a single station. Using soil respiration and other data to calibrate with the model, and by optimizing and modifying some parameters of the PnET-CN model according to coniferous forest inventory data and other measurements, we find that the model is well in agreement with GPP derived from NEE measurements from 2005 to 2007 and that the optimized PnET-CN model can represent the seasonal changes of GPP. The simulation model, however,
T
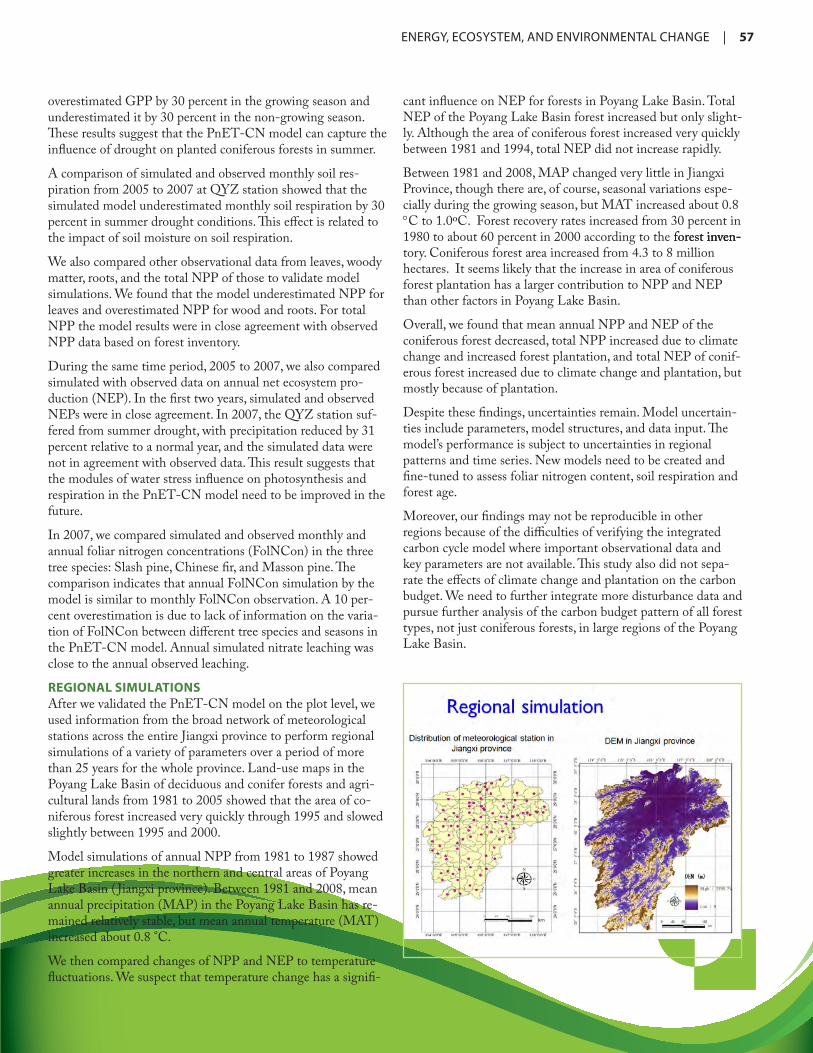
ENERGY,ECOSYSTEM,ANDENVIRONMENTALCHANGE | 57
overestimated GPP by 30 percent in the growing season and underestimated it by 30 percent in the non-growing season. These results suggest that the PnET-CN model can capture the influence of drought on planted coniferous forests in summer.
A comparison of simulated and observed monthly soil res-piration from 2005 to 2007 at QYZ station showed that the simulated model underestimated monthly soil respiration by 30 percent in summer drought conditions. This effect is related to the impact of soil moisture on soil respiration.
We also compared other observational data from leaves, woody matter, roots, and the total NPP of those to validate model simulations. We found that the model underestimated NPP for leaves and overestimated NPP for wood and roots. For total NPP the model results were in close agreement with observed NPP data based on forest inventory.
During the same time period, 2005 to 2007, we also compared simulated with observed data on annual net ecosystem pro-duction (NEP). In the first two years, simulated and observed NEPs were in close agreement. In 2007, the QYZ station suf-fered from summer drought, with precipitation reduced by 31 percent relative to a normal year, and the simulated data were not in agreement with observed data. This result suggests that the modules of water stress influence on photosynthesis and respiration in the PnET-CN model need to be improved in the future.
In 2007, we compared simulated and observed monthly and annual foliar nitrogen concentrations (FolNCon) in the three tree species: Slash pine, Chinese fir, and Masson pine. The comparison indicates that annual FolNCon simulation by the model is similar to monthly FolNCon observation. A 10 per-cent overestimation is due to lack of information on the varia-tion of FolNCon between different tree species and seasons in the PnET-CN model. Annual simulated nitrate leaching was close to the annual observed leaching.
REGIONAL SIMULATIONSAfter we validated the PnET-CN model on the plot level, we used information from the broad network of meteorological stations across the entire Jiangxi province to perform regional simulations of a variety of parameters over a period of more than 25 years for the whole province. Land-use maps in the Poyang Lake Basin of deciduous and conifer forests and agri-cultural lands from 1981 to 2005 showed that the area of co-niferous forest increased very quickly through 1995 and slowed slightly between 1995 and 2000.
Model simulations of annual NPP from 1981 to 1987 showed greater increases in the northern and central areas of Poyang Lake Basin ( Jiangxi province). Between 1981 and 2008, mean annual precipitation (MAP) in the Poyang Lake Basin has re-mained relatively stable, but mean annual temperature (MAT) increased about 0.8 °C.
We then compared changes of NPP and NEP to temperature fluctuations. We suspect that temperature change has a signifi-
cant influence on NEP for forests in Poyang Lake Basin. Total NEP of the Poyang Lake Basin forest increased but only slight-ly. Although the area of coniferous forest increased very quickly between 1981 and 1994, total NEP did not increase rapidly.
Between 1981 and 2008, MAP changed very little in Jiangxi Province, though there are, of course, seasonal variations espe-cially during the growing season, but MAT increased about 0.8 °C to 1.0ºC. Forest recovery rates increased from 30 percent in 1980 to about 60 percent in 2000 according to the forest inven-forest inven- inven-tory. Coniferous forest area increased from 4.3 to 8 million hectares. It seems likely that the increase in area of coniferous forest plantation has a larger contribution to NPP and NEP than other factors in Poyang Lake Basin.
Overall, we found that mean annual NPP and NEP of the coniferous forest decreased, total NPP increased due to climate change and increased forest plantation, and total NEP of conif-erous forest increased due to climate change and plantation, but mostly because of plantation.
Despite these findings, uncertainties remain. Model uncertain-ties include parameters, model structures, and data input. The model’s performance is subject to uncertainties in regional patterns and time series. New models need to be created and fine-tuned to assess foliar nitrogen content, soil respiration and forest age.
Moreover, our findings may not be reproducible in other regions because of the difficulties of verifying the integrated carbon cycle model where important observational data and key parameters are not available. This study also did not sepa-rate the effects of climate change and plantation on the carbon budget. We need to further integrate more disturbance data and pursue further analysis of the carbon budget pattern of all forest types, not just coniferous forests, in large regions of the Poyang Lake Basin.
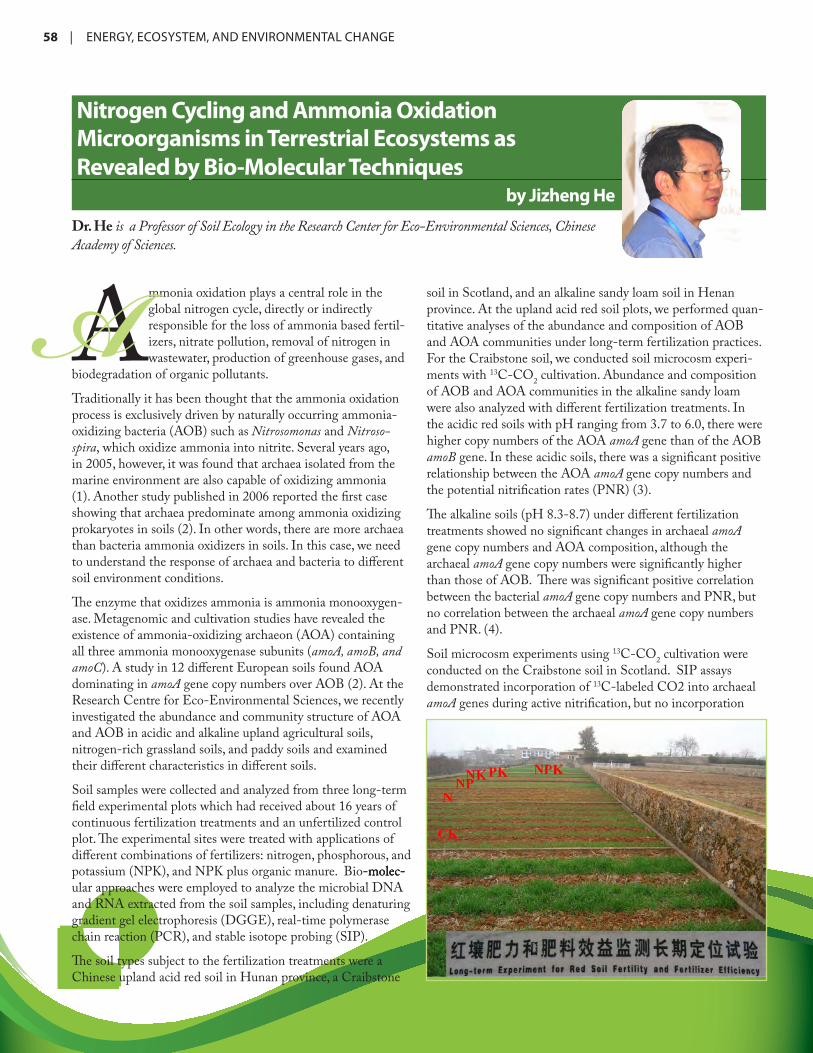
58 | ENERGY,ECOSYSTEM,ANDENVIRONMENTALCHANGE
Nitrogen Cycling and Ammonia OxidationMicroorganisms in Terrestrial Ecosystems asRevealed by Bio-Molecular Techniques
by Jizheng He
Ammonia oxidation plays a central role in the global nitrogen cycle, directly or indirectly responsible for the loss of ammonia based fertil-izers, nitrate pollution, removal of nitrogen in wastewater, production of greenhouse gases, and
biodegradation of organic pollutants.
Traditionally it has been thought that the ammonia oxidation process is exclusively driven by naturally occurring ammonia-oxidizing bacteria (AOB) such as Nitrosomonas and Nitroso-spira, which oxidize ammonia into nitrite. Several years ago, in 2005, however, it was found that archaea isolated from the marine environment are also capable of oxidizing ammonia (1). Another study published in 2006 reported the first case showing that archaea predominate among ammonia oxidizing prokaryotes in soils (2). In other words, there are more archaea than bacteria ammonia oxidizers in soils. In this case, we need to understand the response of archaea and bacteria to different soil environment conditions.
The enzyme that oxidizes ammonia is ammonia monooxygen-ase. Metagenomic and cultivation studies have revealed the existence of ammonia-oxidizing archaeon (AOA) containing all three ammonia monooxygenase subunits (amoA, amoB, and amoC). A study in 12 different European soils found AOA dominating in amoA gene copy numbers over AOB (2). At the Research Centre for Eco-Environmental Sciences, we recently investigated the abundance and community structure of AOA and AOB in acidic and alkaline upland agricultural soils, nitrogen-rich grassland soils, and paddy soils and examined their different characteristics in different soils.
Soil samples were collected and analyzed from three long-term field experimental plots which had received about 16 years of continuous fertilization treatments and an unfertilized control plot. The experimental sites were treated with applications of different combinations of fertilizers: nitrogen, phosphorous, and potassium (NPK), and NPK plus organic manure. Bio-molec--molec-molec-ular approaches were employed to analyze the microbial DNA and RNA extracted from the soil samples, including denaturing gradient gel electrophoresis (DGGE), real-time polymerase chain reaction (PCR), and stable isotope probing (SIP).
The soil types subject to the fertilization treatments were a Chinese upland acid red soil in Hunan province, a Craibstone
soil in Scotland, and an alkaline sandy loam soil in Henan province. At the upland acid red soil plots, we performed quan-titative analyses of the abundance and composition of AOB and AOA communities under long-term fertilization practices. For the Craibstone soil, we conducted soil microcosm experi-ments with 13C-CO2 cultivation. Abundance and composition of AOB and AOA communities in the alkaline sandy loam were also analyzed with different fertilization treatments. In the acidic red soils with pH ranging from 3.7 to 6.0, there were higher copy numbers of the AOA amoA gene than of the AOB amoB gene. In these acidic soils, there was a significant positive relationship between the AOA amoA gene copy numbers and the potential nitrification rates (PNR) (3).
The alkaline soils (pH 8.3-8.7) under different fertilization treatments showed no significant changes in archaeal amoA gene copy numbers and AOA composition, although the archaeal amoA gene copy numbers were significantly higher than those of AOB. There was significant positive correlation between the bacterial amoA gene copy numbers and PNR, but no correlation between the archaeal amoA gene copy numbers and PNR. (4).
Soil microcosm experiments using 13C-CO2 cultivation were conducted on the Craibstone soil in Scotland. SIP assays demonstrated incorporation of 13C-labeled CO2 into archaeal amoA genes during active nitrification, but no incorporation
Dr. He is a Professor of Soil Ecology in the Research Center for Eco-Environmental Sciences, Chinese Academy of Sciences.A
ENERGY,ECOSYSTEM,ANDENVIRONMENTALCHANGE | 59
into bacterial amoA genes. CO2 fixation was accompanied by significant increases in the abundance of archaeal amoA genes, but no detectable increase in the abundance of equivalent functional genes in bacteria. Ammonia oxidation in this soil is due to the activity and growth of autotrophic archaeal ammonia oxidizers (5).
In our research we also analyzed an experiment conducted on high-nitrogen pasture soil in a grazed pasture system in New Zealand. The study by H.J. Di et al., published in 2009 in Nature Geoscience, found that the nitrification rate is driven by bacteria, not archaea. Moreover, in these soils, nitrate leach-ing losses and nitrous oxide emissions are related to AOB, not AOA, populations (6).
From our analyses of these different soils, we conclude that, in general, AOA were more abundant than AOB in most of the studied soils. Quantitative and phylogenetic analyses of the amoA gene fragments showed that AOA composition and abundance may respond to fertilization treatments and contrib-ute to soil nitrification, depending on soil characteristics and nitrogen loading levels. SIP assay demonstrated the incorpora-tion of 13C-labeled CO2 into archaeal amoA genes during active nitrification, and thus contribution to ammonia oxidation in some soils. These results suggest that AOA are the numerically dominant ammonia oxidizers over AOB in most soils. AOA may be actively involved in the nitrification of acidic soils but not in alkaline and nitrogen-rich pH neutral soils.
Nitrification processes and nitrifying microbes are now subject to a significant reevaluation and greater research attention. Bio-molecular approaches are a useful tool in soil microbial ecology
analyses and can play a significant role in the reevaluation of the role of ammonia oxidizing microorganisms in terrestrial ecosystems.
REFERENCES(1) Könneke M, Bernhard AE, de la Torre JR, Walker CB, Waterbury JB, Stahl DA. (2005). Isolation of an autotrophic ammonia-oxidizing marine archaeon. Nature 437: 543-546.
(2) Leininger S, Urich T, Schloter M, Schwark L, Qi J, Nicol GW, Prosser JI, Schuster SC, Schleper C. (2006). Archaea predominate among ammonia-oxidizing prokaryotes in soils. Nature 442: 806-809.
(3) He JZ, Shen JP, Zhang LM, Zhu YG, Zheng YM, Xu MG, Di HJ (2007). Quantitative analyses of the abundance and composition of ammonia-oxidizing bacteria and ammonia-oxidizing archaea of a Chinese upland red soil under long-term fertilization practices. Environ Microbiol 9: 2364-2374.
(4) Shen JP, Zhang LM, Zhu YG, Zhang JB, He JZ. (2008). Abundance and composition of ammonia-oxidizing bacteria and ammonia-oxidizing archaea communities of an alkaline sandy loam. Environ Microbiol 10: 1601-1611.
(5) Zhang LM, Offre PR, He JZ, Verhamme DT, Nicol GW, Prosser JI. (2010). Autotrophic ammonia oxidation by soil thaumarchaea. Proc Natl Acad Sci USA 107: 17240-17245.
(6) Di HJ, Cameron KC, Shen JP, Winefield CS, O’Callaghan M, Bowatte S, He JZ. (2009). Nitrification driven by bacteria and not archaea in nitrogen-rich grassland soils. Nat Geosci 2: 621-624.

60 | ENERGY,ECOSYSTEM,ANDENVIRONMENTALCHANGE
Precipitation-Use Efficiency along a 4500-KM Grassland Transect
by Zhongmin HuDr. Hu is an Assistant Professor at the Key Laboratory of Ecosystem Network Observation and Modeling, Institute of Geographic Sciences and Natural Resources Research, Chinese Academy of Sciences.
A key climatic factor controlling primary produc-tivity for most grassland ecosystems is precipita-tion. Clarifying how precipitation affects vegeta-tion productivity in grasslands is critical for predicting the impact of global climate change
on the functioning of these systems. Precipitation use efficiency (PUE) is a useful index for improved understanding of the relationship between precipitation and vegetation productiv-ity. Previous studies have sought to improve our knowledge of the structure and function of China’s grassland, but few have documented spatial and temporal variations in PUE across the wide variety of grassland types, from temperate grasslands to high altitude alpine grasslands.
THE CHINA GRASSLAND TRANSECT STUDYIn this study, we collected data on 580 study sites from four data sources using field surveys and in situ observations. The study area on the China Grassland Transect (CGT) extends about 4500 km from Hailaer on the Inner Mongolian Plateau in northeastern China to Pulan in the southwestern region of the Qinghai-Tibetan Plateau. The CGT contains most of China’s grassland types.
MAIN RESULTSBoth of the two datasets indicted that aboveground net pri-mary productivity (ANPP) was positively correlated with mean annual precipitation (MAP) and that it increased exponentially with the increase of MAP (p<0.001), implying an increasing PUE with increasing MAP. However, many previous reports showed linear relationships between MAP and ANPP along environmental gradients, suggesting constant spatial PUEs. By contrast, some found that PUE decreased with the increase of MAP (a typical example is the popular Miami model). By integrating these inconsistent reports, we further proposed a conceptual model describing the relationship between ANPP (or NPP) and MAP, with a logistic function at the scale of the continent and above (Fig. 1).
A widely accepted theory in recent years named ‘common spa-tial maximum PUE’, was proposed by Huxman et al. in 2004 in Nature magazine. By taking the slopes of the relationship between ANPP and annual precipitation (PTT) as PUE, they investigated spatial variations in PUE across 14 terrestrial eco-systems in nine biomes located throughout North and South America. They found that all sites converged to a common
maximum PUE during the driest years. However, the “slope” indicates the sensitivity of ANPP to changes in annual precipi-tation, which may lead to incorrect conclusions when it is used as PUE (Verón et al., 2005). Furthermore, the “slope” approach is based on the assumption that PUE was highest in the dri-est year and lowest in the wettest year. The maximum PUE showed large spatial variation along the transect, illustrating no common maximum PUE. In addition, the maximum PUE did not occur in the driest year in most cases. Therefore, our study suggests that the view of common maximum PUE should be regarded with caution.
CONCLUSIONSOur study illustrates that the maximum PUE varied greatly across sites along the CGT, which runs counter to the pre-vailing view that a common maximum PUE exists across the ecosystems situated along a precipitation gradient. Based on the results of our study as well as previous reports, we proposed a conceptual model to describe the relationship between MAP and ANPP (or NPP), with a logistic form function. This ap-proach might mark an improvement over the Miami model.
See: Precipitation-use efficiency along a 4500-km grassland transect. Hu Zhongmin, Yu Guirui, Fan Jiangwen, Zhong Huaping, Wang Shaoqiang, and Li Shenggong. Global Ecology and Biogeography (2010) 19, 842-851.
Fig. 1 Our conceptual model (dash line) describing the relationship between MAP and ANPP (or NPP) at continent and above spatial scales. The solid line illustrates the Miami mode.
A
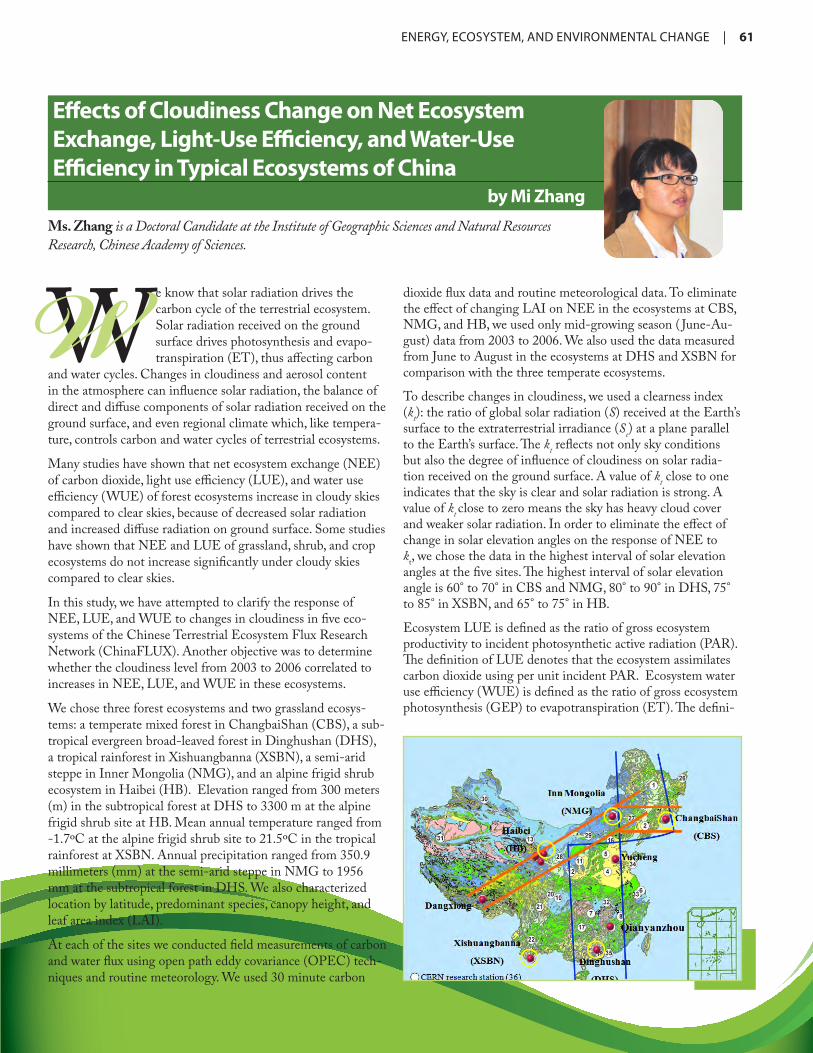
ENERGY,ECOSYSTEM,ANDENVIRONMENTALCHANGE | 61
dioxide flux data and routine meteorological data. To eliminate the effect of changing LAI on NEE in the ecosystems at CBS, NMG, and HB, we used only mid-growing season ( June-Au-gust) data from 2003 to 2006. We also used the data measured from June to August in the ecosystems at DHS and XSBN for comparison with the three temperate ecosystems.
To describe changes in cloudiness, we used a clearness index (kt): the ratio of global solar radiation (S) received at the Earth’s surface to the extraterrestrial irradiance (Se) at a plane parallel to the Earth’s surface. The kt reflects not only sky conditions but also the degree of influence of cloudiness on solar radia-tion received on the ground surface. A value of kt close to one indicates that the sky is clear and solar radiation is strong. A value of kt close to zero means the sky has heavy cloud cover and weaker solar radiation. In order to eliminate the effect of change in solar elevation angles on the response of NEE to kt, we chose the data in the highest interval of solar elevation angles at the five sites. The highest interval of solar elevation angle is 60° to 70° in CBS and NMG, 80° to 90° in DHS, 75° to 85° in XSBN, and 65° to 75° in HB.
Ecosystem LUE is defined as the ratio of gross ecosystem productivity to incident photosynthetic active radiation (PAR). The definition of LUE denotes that the ecosystem assimilates carbon dioxide using per unit incident PAR. Ecosystem water use efficiency (WUE) is defined as the ratio of gross ecosystem photosynthesis (GEP) to evapotranspiration (ET). The defini-
Effects of Cloudiness Change on Net Ecosystem Exchange, Light-Use Efficiency, and Water-Use Efficiency in Typical Ecosystems of China
by Mi ZhangMs. Zhang is a Doctoral Candidate at the Institute of Geographic Sciences and Natural Resources Research, Chinese Academy of Sciences.
We know that solar radiation drives the carbon cycle of the terrestrial ecosystem. Solar radiation received on the ground surface drives photosynthesis and evapo-transpiration (ET), thus affecting carbon
and water cycles. Changes in cloudiness and aerosol content in the atmosphere can influence solar radiation, the balance of direct and diffuse components of solar radiation received on the ground surface, and even regional climate which, like tempera-ture, controls carbon and water cycles of terrestrial ecosystems.
Many studies have shown that net ecosystem exchange (NEE) of carbon dioxide, light use efficiency (LUE), and water use efficiency (WUE) of forest ecosystems increase in cloudy skies compared to clear skies, because of decreased solar radiation and increased diffuse radiation on ground surface. Some studies have shown that NEE and LUE of grassland, shrub, and crop ecosystems do not increase significantly under cloudy skies compared to clear skies.
In this study, we have attempted to clarify the response of NEE, LUE, and WUE to changes in cloudiness in five eco-systems of the Chinese Terrestrial Ecosystem Flux Research Network (ChinaFLUX). Another objective was to determine whether the cloudiness level from 2003 to 2006 correlated to increases in NEE, LUE, and WUE in these ecosystems.
We chose three forest ecosystems and two grassland ecosys-tems: a temperate mixed forest in ChangbaiShan (CBS), a sub-tropical evergreen broad-leaved forest in Dinghushan (DHS), a tropical rainforest in Xishuangbanna (XSBN), a semi-arid steppe in Inner Mongolia (NMG), and an alpine frigid shrub ecosystem in Haibei (HB). Elevation ranged from 300 meters (m) in the subtropical forest at DHS to 3300 m at the alpine frigid shrub site at HB. Mean annual temperature ranged from -1.7ºC at the alpine frigid shrub site to 21.5ºC in the tropical rainforest at XSBN. Annual precipitation ranged from 350.9 millimeters (mm) at the semi-arid steppe in NMG to 1956 mm at the subtropical forest in DHS. We also characterized location by latitude, predominant species, canopy height, and leaf area index (LAI).
At each of the sites we conducted field measurements of carbon and water flux using open path eddy covariance (OPEC) tech-niques and routine meteorology. We used 30 minute carbon
W

62 | ENERGY,ECOSYSTEM,ANDENVIRONMENTALCHANGE
tion of WUE reflects a trade-off between water loss and carbon dioxide gain and quantifies the coupling between carbon and water cycles at the ecosystem level.
Our results showed a) the seasonal variation of environmental variables, b) the frequency distribution of the clearness index value in the five ecosystems, and c) the change in NEE, LUE, and WUE with the clearness index. Histograms of the clear-ness index (kt) value for solar elevation angle >20° at the five sites during the mid-growing season from 2003 to 2006 show that the peaks of the kt value (0.6-0.8) in the three temperate ecosystems were larger than 0.5, particularly for HB, but the peaks of the kt value (0.2-0.4) in the subtropical and tropical ecosystem were lower than 0.5.
To correlate changes of NEE, LUE, and WUE with the clear-ness index, we established a relationship between NEE and the clearness index (kt) for the highest interval of solar elevation angles at the five sites during the mid-growing season in 2005. We found that a) when the value of kt was about 0.5, the NEE reached its maximum at CBS, DHS, and HB, b) under clear skies, NEE of XSBN tended to saturation, and c) at NMG, net carbon uptake became net carbon emissions under clear skies in the drought year 2005.
Overall, except at the tropical rainforest XSBN site, WUE at the other four sites decreased significantly under clear skies compared to cloudy skies. Cloudy sky conditions with a kt value
ranging between 0.4-0.6 can enhance the NEE, LUE, and WUE of temperate ecosystems (CBS, NMG, and HB) and a subtropical forest ecosystem (DHS) from June to August. For the tropical rainforest ecosystem at XSBN, although the LUE was larger under cloudy sky conditions than under clear sky conditions, the NEE and WUE did not significantly decrease under clear sky conditions from June to August.
These results suggest that the pattern of cloudiness in northern and southern China during 2003 to 2006 in the five ecosystems was not the best condition for net carbon uptake. This study highlights the importance of the cloudiness factor in predicting net carbon absorption and the water cycle in the Asian mon-soon region under climate change.
SEE :Zhang M., Yu G.R., Zhuang J., Randy G., Fu Y.L., Sun X.M., Zhang L.M., Wen X.F., Wang Q.F., Han S.J., Yan J.H., Zhang Y.P., Wang Y.F., Li Y.N.. 2011. Effects of Cloudiness change on Net Ecosystem Exchange, Light Use Efficiency, and Water Use Efficiency in Typical Ecosystems of China. Agricultural and Forest Meteorology, doi:10.1016/j.agrformet.2011.01.011.
Zhang M., Yu G.R., Zhang L.M., Sun X.M., Wen X.F., Han S.J., Yan J.H.. 2010. Impact of cloudiness on net ecosystem ex-. 2010. Impact of cloudiness on net ecosystem ex-change of carbon dioxide in different types of forest ecosystems in China. Biogeosciences, 7: 711-722.
ENERGY,ECOSYSTEM,ANDENVIRONMENTALCHANGE | 63
Water-Use Efficiency and Nitrogen-Use Efficiency Trends and Impacts of Dominant Species in the Typical Broadleaf Forest Ecosystems along NSTEC
by Wenping ShengDr. Sheng is a Postdoctoral Fellow in the Institute of Geographic Sciences and Natural Resources Research, Chinese Academy of Sciences.
The latest assessment report, “Climate Change 2007,” by the International Panel on Climate Change describes a scenario of global climate change based on rising temperatures and chang-ing precipitation patterns that have been observed
all around the globe. Surface warming is especially significant in eastern China.
Atmospheric nitrogen deposition has also risen in recent years because of increased emissions from industrial development and agricultural activities. The carbon cycle and natural terres-trial ecosystems are likely affected by these increases in nitrogen deposition. Carbon cycling is restricted by water and nitrogen from the atmospheric environment to the soil environment, and water and nitrogen therefore may have a significant impact on carbon cycling.
Water use efficiency (WUE) and nitrogen use efficiency (NUE) are important physiological and ecological indexes that affect environmental resources. These indexes can help in under-standing the potential impacts of carbon, water, and nitrogen coupled cycling on climate change. Controlled experimental studies have shown that WUE and NUE could be affected by various climate and nutrient conditions. Irrigation, for example, has been shown to decrease WUE, high application of nitrogen enhances WUE, and water limitation and high nitrogen ap-plication reduce NUE.
The majority of those studies focus on impacts on grassland and artificial, plantation, forests. In our research, we wanted to determine a) whether there is any evidence that WUE or NUE could adapt to global change in natural forest ecosystems, b) what are the most important factors in controlling WUE and NUE, and c) whether there is a tradeoff between NUE and WUE along the resources gradient.
THE NORTH-SOUTH TRANSECTOur study was conducted at nine research sites on the North-South Transect of Eastern China (NSTEC). This area includes all the main forest types in China: cold-temperate coniferous forest, temperate mixed forest, warm-temperate deciduous broadleaf forest, and tropical monsoon rain forest.
We examined WUE and NUE using the isotope and stoi-chiometry method, which has been widely used in studies on forest and grassland ecosystems. Foliar and soil samples were
collected from July to August 2008. After pretreatment, carbon and nitrogen concentration and carbon-13 were simultane-ously determined by an online elemental analyzer coupled to an isotope ratio mass spectrometer (MAT253).
We found that foliar carbon-13 is highest in the warm-tem-perate deciduous broad-leaved forest and lowest in the tropical monsoon rainforest. For the foliar carbon/nitrogen ratio (C/N), we found higher C/N ratios in the two tropical forest ecosys-tems and lower C/N ratios in temperate forest ecosystems.
The latitudinal distribution of foliar carbon-13 followed a parabolic pattern along the latitudinal gradient, while foliar C/N decreased at higher latitudes. Foliar carbon-13 also fol-lowed a parabolic pattern as mean annual temperature (MAT) increased, while foliar C/N increased with MAT. Foliar carbon-13 decreased as mean annual precipitation (MAP) increased, while foliar C/N increased as MAP increased. Foliar carbon-13 and C/N ratios also varied with changes in soil nu-trient factors: nitrogen and phosphorous concentrations.
Overall, our results showed that there is a tradeoff between carbon-13 and C/N ratios. Forest vegetation WUE showed a parabola pattern, and vegetation NUE decreased as latitude increased along the NSTEC. Vegetation WUE and NUE were affected by both climate factors and soil nutrient conditions. MAP, soil total phosphorus, and MAT could explain 75.6 percent of changes in WUE, while MAP and soil total nitrogen could explain 81.7 percent of changes in NUE. We found that the correlation between WUE and NUE was stronger with shortages of soil phosphorous than of soil nitrogen. The trad-eoff between NUE and WUE in the dominant species reflects the ability of trees to maximize resource use efficiency in forest ecosystems along NSTEC.
SEE:Wenping Sheng, Shujiel Ren, Guirui Yu, and Huajun Fang. 2011. Patterns and driving factors of WUE and NUE in natural forest ecosystems along the North-South Transect of Eastern China. J. Geogr. Sci. 21(14): 651-665.
T
64 | ENERGY,ECOSYSTEM,ANDENVIRONMENTALCHANGE
Assessment of Nitrate Concentration in Groundwater on Typical Terrestrial Ecosystems of Chinese Ecosystem Research Network during 2004-2009
by Zhiwei XuMs. Xu is a Master’s Student at the Northeast Normal University and a Visiting Graduate Student in the Institute of Geographic Sciences and Natural Resources Research, Chinese Academy of Sciences.
The problem of nitrate pollution in groundwater is worldwide. Researchers with the Chinese Ecosys-tem Research Network (CERN) have established long-term monitoring indices for water quality of terrestrial ecosystems—including groundwa-
ter, surface water, precipitation, and soil water in agricultural systems—at ecological field stations within the CERN net-work. In order to provide a framework for the management of groundwater, I have analyzed the temporal and spatial variation of groundwater nitrate and the factors that influence its occur-rence using monitoring data of total nitrogen (TN) and nitrate-nitrogen (nitrate-N) at 31 ecosystems within the network from 2004-2009.
TN was monitored by alkaline conversion of a dispelling ultraviolet spectrophotometer. Nitrate-N was monitored by ion chromatography or phenol disulfonic acid spectrophotometry.
An analysis of the mean concentration of nitrate-N showed variations across the typical ecosystems that were sampled, from highest to lowest: agricultural, oasis, urban, grass, and for-est. The World Health Organization has established a standard for nitrate-N in drinking water at 10 milligrams per liter L (-1) (10 mg L(-1) ). According to this standard, the nitrate-N con-centration of the agricultural and oasis ecosystems exceeded the standard with different temporal frequencies, with the highest concentration at one station exceeding the standard by nearly 85 percent. The highest nitrate-N concentration of an urban
ecosystem groundwater was 22.65 mg L (-1), with a 31.25 percent exceedance frequency. The lowest value was in the forest ecosystem, with a range from 0.02 mg L (-1) to 1.04 mg L (-1).
The phenomenon of nitrate-N pollution of groundwater mainly occurred in the agricultural, oasis, and urban ecosystems. Ag-ricultural, oasis, and grassland ecosystems had obvious spatial variation trends, but there were no obvious spatial variation trends in the forest ecosystem. The groundwater nitrate-N concentration of agricultural and urban ecosystems also had obvious temporal variations. Generally, groundwater nitrate-N had the highest value in summer and winter, but no temporal variation was found in the forest ecosystem.
In sum, this study showed that the phenomenon of nitrate-N pollution of groundwater occurred mainly in the agricultural, oasis, and urban ecosystems. The contamination risk areas were primarily distributed in the northwestern oasis and desert area, the North China Plain, and the southern agricultural area. For these ecosystems, the nitrate-N concentration had the highest value in summer season.
Nitrate pollution of groundwater in China, especially in urban and agricultural regions, is a growing health concern for people and livestock as well. Understanding the spatial and temporal variations in the occurrence of this phenomenon, due in part to increased use of fertilizer in agriculture and the use of urban wastewater as a fertilizer, can help determine a course of action to mitigate the threat of groundwater contamination.
T
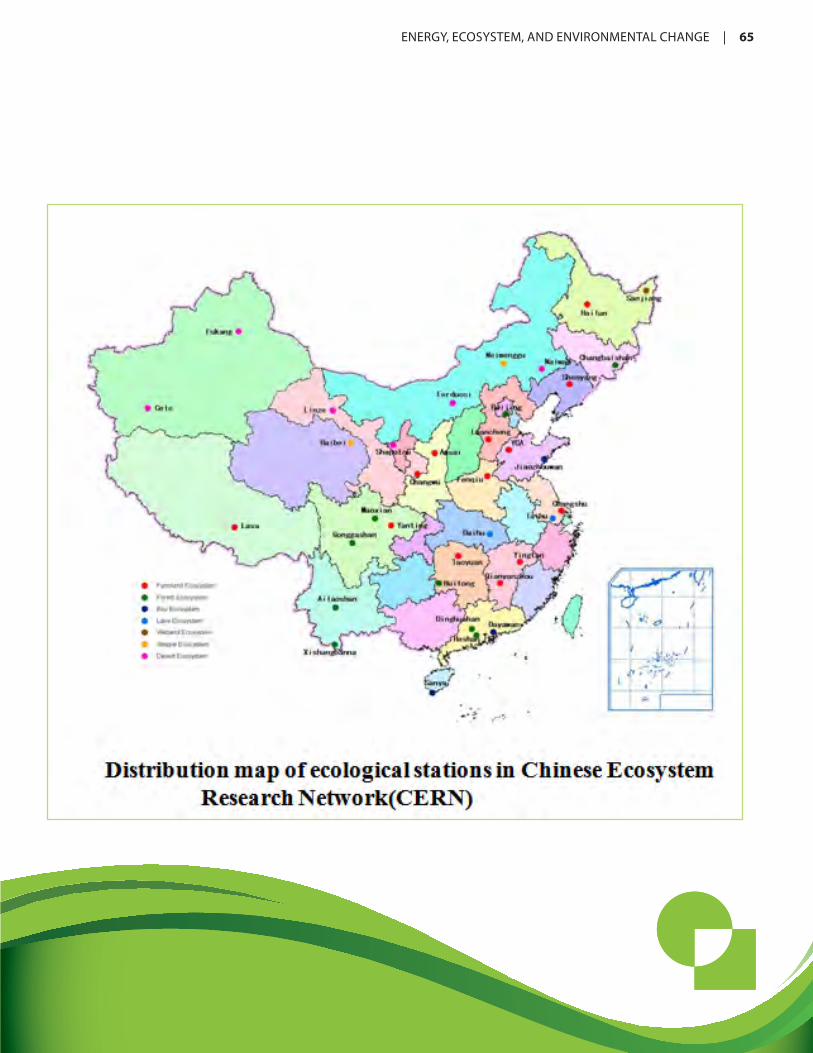
ENERGY,ECOSYSTEM,ANDENVIRONMENTALCHANGE | 65

66 | ENERGY,ECOSYSTEM,ANDENVIRONMENTALCHANGE
Carbon Preservation in SubtropicalPaddy Ecosystems
by Jinshui WuDr. Wu is a Professor with the Key Laboratory of Agro-Ecological Processes in Subtropical Regions at the Institute of Subtropical Agriculture, Chinese Academy of Sciences.
Rice cultivation globally covers a total area of about 153 million hectares according to the Food and Agriculture Organization of the United Nations, and the Intergovernmental Panel on Climate Change has found that paddy soils are a global
carbon sink. Rattan Lal, the director of the School of En-vironment and Natural Resources at Ohio State University, has reported that rice cropping systems in China lead to the enhanced accumulation of soil organic carbon (SOC).
The subtropical region of China encompasses a total area of 2.2 million square kilometers (km2) with 23 million hectares of paddy fields. Previous studies on SOC changes in subtropical paddy ecosystems in China were based on data gathered from occasional investigations after 1990 and compared to data from the second National Soil Survey in China in 1980. In these studies, the numbers and positions of sites, data selection, mea-sures of sampling, and SOC analysis differed from time to time. In our research at the Institute of Subtropical Agriculture, we have attempted to validate these studies using field trials under conditions of real farming practices.
We specifically wanted to determine a) whether the trend of increases in SOC observed with field experiments reflects real conditions in paddy ecosystems in subtropical China, b) whether C input from rice ecosystems is sufficient to support long-term sequestration of organic C in paddy soils, and c) whether paddy soils developed with biochemical amendments such as fertilizer are conducive to organic C sequestration.
SURVEY AND FIELD INVESTIGATIONSFirst, we conducted a landscape scale investigation to deter-mine which of four different ecosystems has the highest SOC accumulation from lowest to highest elevation: lowland paddy soil at 35-45 meters (m) above sea level, low hill at 81-122 m, high hill at 201-395 m, and Karst mountain at 202-450 m. Our land use survey involved soil sampling and data analysis of all four ecosystems with different types of land use. On the low-hill landscape, for example, we gathered hundreds of soil samples at a depth of 1-20 centimeters (cm) on four types of land-use systems: paddy, arable, orchard, and woodland.
Second, we conducted time span investigations of the dis-tribution of SOC on the landscape scale (1979-2003), field experiments on eight sites (1986-present), and farming field
observation (1990-present) on 56 sites from lowest to highest elevation.
Third, we conducted field observations of C flux over time, from 2003-2008, in a subtropical paddy ecosystem at the Taoyuan experimental station of the China Ecosystem Re-search Network (CERN) using open and closed chambers and eddy co-variance techniques.
Fourth, we conducted studies on biological processes in paddy soils, including site and turnover of microbial biomass, mineral-ization of organic matter, and microbial assimilation of atmo-spheric CO2.
Landscape scale investigation: The landscape scale investigation of SOC content of soils showed
• at the lowland landscape unit, SOC content of paddy soil was higher than on the upland sites,
• at the low-hill landscape unit, SOC content was highest on paddy soil, followed by upland, woodland, and orchard soils,
• at the high-hill landscape unit, SOC content was likewise highest on paddy soil followed by upland, woodland, and orchard soils, and
• at the Karst-mountain landscape unit SOC content was highest on paddy soil followed by upland and woodland soils.
Surprisingly we found that even in an unfertilized paddy field control site, the C content remained relatively stable, and there was only a slight increase in SOC content on the fertilized paddy field site. This is possibly due to the use of irrigation from lake water containing soil sediments on both fertilized and unfertilized paddy fields.
Time span investigation: Our time span investigation of SOC on experimental sites in Hunan Province at three intervals be-tween 1979 and 2003 showed a marked increase of SOC at the low-hill landscape unit paddy soil and a slight increase on up-land soil. In the initial sampling, there were no fertilizer inputs. In the 1980s, chemical fertilizers were introduced, doubling rice productivity. More recently, newer varieties such as hybrid rice have been planted, and rice productivity has continued to rise. Today, “super rice” hybrids are being planted, with projected further increases in productivity. Increased yield results in an increase in total biomass, thereby increasing carbon input from
R
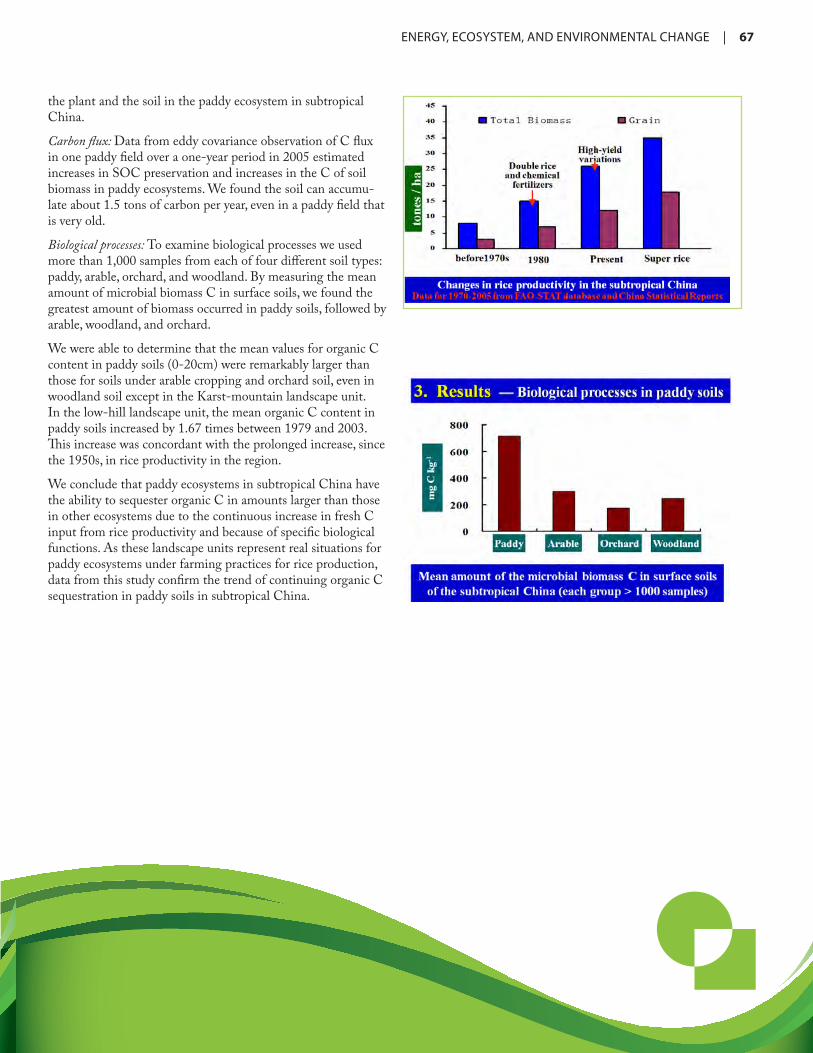
ENERGY,ECOSYSTEM,ANDENVIRONMENTALCHANGE | 67
the plant and the soil in the paddy ecosystem in subtropical China.
Carbon flux: Data from eddy covariance observation of C flux in one paddy field over a one-year period in 2005 estimated increases in SOC preservation and increases in the C of soil biomass in paddy ecosystems. We found the soil can accumu-late about 1.5 tons of carbon per year, even in a paddy field that is very old.
Biological processes: To examine biological processes we used more than 1,000 samples from each of four different soil types: paddy, arable, orchard, and woodland. By measuring the mean amount of microbial biomass C in surface soils, we found the greatest amount of biomass occurred in paddy soils, followed by arable, woodland, and orchard.
We were able to determine that the mean values for organic C content in paddy soils (0-20cm) were remarkably larger than those for soils under arable cropping and orchard soil, even in woodland soil except in the Karst-mountain landscape unit. In the low-hill landscape unit, the mean organic C content in paddy soils increased by 1.67 times between 1979 and 2003. This increase was concordant with the prolonged increase, since the 1950s, in rice productivity in the region.
We conclude that paddy ecosystems in subtropical China have the ability to sequester organic C in amounts larger than those in other ecosystems due to the continuous increase in fresh C input from rice productivity and because of specific biological functions. As these landscape units represent real situations for paddy ecosystems under farming practices for rice production, data from this study confirm the trend of continuing organic C sequestration in paddy soils in subtropical China.

68 | ENERGY,ECOSYSTEM,ANDENVIRONMENTALCHANGE
Low Carbon City Development in China:Potentials and Challenges
by Zhiyun OuyangDr. Ouyang is a Professor with the State Key Laboratory of Urban and Regional Ecology, Research Center for Eco-Environmental Sciences, Chinese Academy of Sciences.
China is urbanizing at a very rapid pace. In 1949, the urbanization rate was 7.3 percent. By 2009 the rate had increased to nearly 50 percent. Ac-cording to some research, by 2020, 60 percent of the population, or more than 100 million people,
will live in cities.
The 287 cities in China occupy 13 percent of the land mass and are home to 48 percent of the population. The gross domestic product of cities represents 70 percent of the national total. Urban populations consume nearly 60 percent of all electricity and water and 75 percent of all natural and liquid gas. Annual consumption of energy is more than half of the total consump-tion of the country. For that reason, carbon emissions in cities are a major concern.
With increased urbanization, the ratio of automobiles to population is increasing at a rate of 10 percent per year. China is the biggest car producing and car consuming country in the world, even larger than the United States according to re-cent estimates. Along with the rise in the number of vehicles, resource and energy consumption has increased rapidly, and the efficiency of energy consumption is very low.
We have investigated 100 Chinese cities to determine trends in urbanization and urban carbon consumption and emissions, and are exploring the possibility for technological support to create low-carbon cities for China in the future.
CARBON CONSUMPTION AND EMISSIONS Urban emissions are a major greenhouse source of greenhouse gases, accounting for 87 percent of the global total. Per capita urban carbon emissions (CO2) in China have reached 3.59 tons per year, and are seven times higher than emissions in rural China.
Statistics collected from 35 cities in China show that about 18 percent of China’s population live in these cities, but emis-sions of CO2 are about 40 percent of total emissions, with a per capita rate more than twice that of the rest of the popula-tion. In Beijing, a primarily industrial city, total annual end-use consumption of CO2 between 1995 and 2005 doubled. The industrial sector accounted for 53 to 68 percent and the service sector 15 to 30 percent of the total.
On the scale of the family, the basic social unit in the city, the main sources of carbon consumption are food and energy, and carbon consumption in urban households is on the rise. Per capita carbon consumption is about 6.8 tons per year. For the urban family unit, indirect carbon emissions are much higher than direct carbon emissions. Socio-economic factors such as different income levels also have an effect on carbon consump-tion and emissions. More highly educated people and higher income families have higher levels of carbon consumption and emissions.
The per capita carbon footprint from food consumption is also higher for higher income families than for lower income families. Higher income families may eat as much or more food than lower income families, but for lower income families the food strategy is different, as the consumption of meat, milk, and eggs is greater in higher income families.
About 17 million people live in residential buildings in Beijing, and with a current population of more than 22 million, the city will need to increase the number of apartment buildings avail-able for occupation.
LOW-CARBON CITIES OF THE FUTURE
China’s experiences in creating low-carbon city structures, or green buildings, for the 2008 Olympic Games, the 2010 Shanghai World Expo, and the 2010 Asian Games serve as
C

ENERGY,ECOSYSTEM,ANDENVIRONMENTALCHANGE | 69
models for low-carbon city management and eco-city planning and design. These efforts can guide development of low-carbon urban development in many Chinese cities and communities. The low-carbon or no-carbon eco-city is currently an important and emerging concept in China’s urban development move-ment. By creating low-carbon city functional zones, encourag-ing the use of renewable energy in new development, encourag-ing a low-carbon infrastructure, rebuilding older cities, using low-carbon and green materials, and promoting low-carbon behaviors, China can reduce the overall carbon footprint of the urban life style.
Development of low carbon cities will be one of the most important paths to reduction of national carbon emissions. In recent years, low carbon cities have been recognized as key to
such reductions by China’s people, governments, and enter-prises. In addition to developing more efficient energy, resi-dential, and industrial structures, changes must also be made in consumption behavior.
Many cities, such as Shanghai, Beijing, and Shenzhen have made proposals for developing low carbon cities. The Shanghai Chongming eco-city and Sino-Singapore Tianjin eco-city plan to develop low carbon technology for zero carbon emissions. China faces great challenges for low-carbon city development, such as lack of low-carbon technology, financial support, and governmental stimulation. Science and technology support-ing low-carbon city planning, construction, and management should be a high priority in urban development.

70 | ENERGY,ECOSYSTEM,ANDENVIRONMENTALCHANGE
Impacts of Ecosystem Services Change on Human Well-being in the Loess Plateau
by Lin Zhen
The Chinese government launched the Slope Land Conversion Program (SLCP) about 12 years ago to convert highly erodible cropland on steep slopes to forest and grassland. This conversion has resulted in significant changes in land use and
raised questions about the effects of the SLCP on ecosystem services and the impact of ecosystem services on human well-being.
To address these questions, researchers at the Institute of Geographic Sciences and Natural Resources Research have been working on the Jinghe watershed of the Loess Plateau since 2003. The watershed is located in three provinces in the middle and upper reaches of the Yellow River Basin —Shaanxi (downstream), Gansu (midstream), and Ningxia (upstream). The natural conditions in study area are harsh; water is scarce and soil erosion common. This watershed is one of the most important contributors to soil sedimentation in the Yellow River. Economically the area is less developed agriculturally than most regions of China, income is relatively low, and it suffers from social insecurity in terms of housing, education, infrastructure, and development.
HOUSEHOLD SURVEYFor our primary data collection, we conducted a household survey in four villages, moving from downstream to upstream. Our aim was to collect basic information about the participants’ awareness of changes in ecosystem services and the effects of those changes on the well-being of local farmers. Results from the poorest village of the four, Guyuan, were of particular interest. Low educational attainment is typical in rural Guyuan. Survey participants between the ages of 41 and 50, however, have high awareness of environmental change.
Ecosystem service changes were ranked according to their relative importance from the farmers’ perspective. Based on a ranking of the rate of recognition of ecosystem services, es-sential provisioning services such as fresh water, food, and fresh air ranked highest. Land-based work opportunities were also recognized as important supporting services. Key ecosystem services such as food, fuelwood, and land-based work opportu-nities decreased significantly after the implementation of the SLCP. Farmers faced with the loss of farmland and some land-based jobs also recognize that climate change and slope-land conversion are two main drivers of these trends.
The survey solicited information on the interactions between ecosystem change and human well-being, including food supply, fuelwood supply, land-based work opportunities, and water conservation. Of these, two very important indicators emerged as key elements of human well-being: food supply and fuelwood availability. Changes in food supply directly affect food security, which depends on access to the basic materials for subsistence and nutrient diversity. Fuelwood supply and security fluctuate according to changes in energy structure and resources accessibility and depend on the extent and intensity of fuelwood collection. Respondents also expressed awareness that energy consumption for heating and food preparation contributes to emissions of carbon dioxide (CO2).
Food provision and consumption: From the 1980s to 2000, the area of cropland in Guyuan has been reduced substantially due to the SLCP. Cereal yield, however, has increased thanks to higher inputs for production. As a result, from 2000 into the foreseeable future, cereal demand can be met satisfactorily. Since food security is important in China as a whole and in Guyuan as well, we calculated the quality, not just the quan-tity, of food produced—the utility function. We measured the utility function in terms of nutrition impacts from consump-tion patterns. We found that in 35 percent of households, real consumption utility is below the maximum, so there is room for improvement in the quality of food produced, even for wealthy households.
Structual changes in fuelwood consumption: Our household survey data showed that the energy structure in Guyuan is quite dif-ferent than the structure at the national level. From 1999 to 2009, the main source of energy changed from bioenergy to coal. This move away from fuelwood consumption is caused by the area’s low development status. Changes in the structure of energy consumption, of course, affect CO2 emissions. We found increases in CO2 emissions per unit of energy produced, but energy consumption per household and CO2 emissions overall decreased slightly.
An important factor for changes in fuelwood consumption is accessibility. We found differences in the intensity of fuelwood collection related to the distance from each of the villages to the fuel wood source area. The village with relatively more fuel-relatively more fuel-fuel-wood consumption collects its wood more closely to home than
Dr. Zhen is Deputy Director of the Department of Ecology and Bioenergy Resources, Institute of Geographic Sciences and Natural Resources Research, Chinese Academy of Sciences.T

ENERGY,ECOSYSTEM,ANDENVIRONMENTALCHANGE | 71
the others. Because this is a mountainous area, distance really matters in terms of consumption patterns.
PERCEPTION OF WELL-BEINGA number of factors affect the well-being of people in the study area. From our survey we found that resources secu-rity—food and water—are considered the most important factors for human well-being, followed by income. Just three years earlier, income was perceived as the most important factor. Not only is the Chinese government stressing the im-portance of resource security; the local people also realize its importance. Moreover, survey respondents place high value on the consumption of vegetables, just below the importance of income. This trend indicates that people understand that the quality, not just quantity, of food consumption matters.
At the regional level, we found that the spatial pattern and variation of different types of ecosystems are diversified, reflecting changes in land use between 1995 and 2005. Eco-system services are closely linked to changes in land use, food supply, fuelwood supply, water conservation, employment availability, and income. Human well-being is primarily based on the supply of ecosystem services and consumption. In the SLCP, food, fuel, and income security are protected. The risk of land-based unemployment increased, but the concurrent increase in income from off-farm work offset the negative consequences of land-based unemployment.
In general, human well-being improved in Guyuan between 1995 and 2005, with 75 percent of the improvement due to increases in productivity and 24 percent due to the SLCP. Clearly, there is a causal link between ecosystem services and
human well-being. From this we may infer that arable land continues to contribute a great deal to human well-being. More than half of the income in Guyuan comes from arable land, which provides work opportunities and food supply. Land converted to grasslands results in benefits from improvements to the energy supply and water conservation.
THE YELLOW RIVER BASINIn addition to our research at the local and regional level, we are examining data at a broader scale to see whether research findings in the smaller area reflect changes in the larger area. In the Yellow River Basin, food and fuel consumption are likewise key indicators of well-being. Between 1995 and 2008, production of food, oil plants, and meat increased, especially in Henan, Gansu, and Inner Mongolia, as did overall nutri-tion. At the same time, while there was no significant change in the spatial pattern of fuelwood supply, the consumption of fuelwood decreased due to changes in the energy structure. Fu-elwood security patterns showed no significant change, and the needs of fuelwood consumption can be satisfied in most of the regions, though Shandong, Henan, middle Shaanxi, and Gansu are deficit areas.
Research programs worldwide are finding that future consump-tion pattern changes will replace human population growth as key factors affecting ecosystem services. In the future, we will need to better understand the impact of human activities such as consumption on environmental services. Furthermore, we need to understand the mechanism of interaction between changing ecosystem services and human well-being and the conflicts and tradeoffs of different ecosystem services.

72 | ENERGY,ECOSYSTEM,ANDENVIRONMENTALCHANGE
Assessment of the Damage Caused by the 2008 Ice Storm on Subtropical Forest in Jiangxi, China
by Huimin Wang and Leilei Shi
An unexpected ice storm hit southern China in early 2008,and caused significant losses of standing timber and heavy damage to forest ecosystems, accounting for more than 30 billion RMB worth of damages, especially in subtropical
regions such as Jiangxi and Hunan provinces. After the ice storm, a number of researchers began field investigations to evaluate the damage. As we know, field investigations are limited to small areas. To analyze the situation at a wider scale, our research group used satellite and environmental data to evaluate the damage caused by the storm, analyze the spatial variation of forest damage, and tease apart the effects of local topography and forest type.
We chose Jiangxi Province located in southeastern China as our study site. Its boundaries are formed by mountains on three sides, and the Poyang Lake Basin lies to the north. Forest cov-ers more than 60 percent of the province, and elevation ranges from 1 meter (m) to 2,200 m.
Four types of data were used for our study: MODIS-EVI (Moderate Resolution Imaging Spectroradiometer-Enhanced Vegetation Index) data at a spatial resolution of 250 m, DEM (Digital Elevation Model) data at a spatial resolution of 90 m, forest maps, and records of land use cover of Jiangxi Province. Digital change analysis was conducted to evaluate the ice storm damage with pre-storm images (2001 to 2007 EVI data) and the post-storm images (2008 EVI data). In our analysis, EVI (Enhanced Vegetation Index) stands for the mean EVI of the Jiangxi forest after the 2008 storm, and △EVI stands for the mean EVI of the forest from 2001 through 2007. We employed a generalized linear model that incorporated in situ measurements to separate forest damage from natural variations in canopy reflectance. We used information on forest types determined from land cover and forest maps; information on elevation categories, slope, and aspect gathered through DEM; and a comparison of EVI and △EVI indexes.
For the statistical analysis, we used a paired t-test to exam-ine the difference between EVI and △EVI of all used pixels between the two images. We compared EVI and △EVI among aspects (traditional eight classes), elevation categories, and different vegetation types using one-way analysis of variance
(ANOVA) followed by Bonferroni post-hoc multiple comparisons.
Our results show that the mean EVI of Jiangxi forest across all pixels was 0.28±0.042 (mean±S.D.), and it decreased significantly by 0.05 to 0.23±0.051 after the ice storm (paired t-test p < 0.001). The de-crease in EVI may appear trivial, but the relationship between EVI and directly measured forest attributes is not linear. EVI tends to saturate at a high leaf area index, so what looks like a relatively small change from the canopy reflectance may reflect a much larger change on the ground.
We also found significant differences in EVI among different elevation categories. At higher elevations, the EVI losses curve had a parabola trend, with an inflection point around elevation 700m. The spatial pattern of decreased EVI after the ice storm can be understood in light of the topographical sheltering ef-fect. There were significant differences in EVI among different aspects (one-way ANOVA p < 0.001). The loss of EVI was lesser on the southern slopes and gradually intensified to the northeast, northwest, and north slopes. The largest EVI losses occurred at the deeper slope.
The results display a region-scale (northeast to southwest) gradient in damage. The difference in EVI reduction between the south and north slope showed a decreasing trend with increasing elevation from 9 m to 700 m, and tended to zero at elevations higher than 700m. We also found that the reduction in EVI by the ice storm is quite similar for mixed coniferous forest (0.037) and native hardwood forests (0.039), but is high-est for pure coniferous forests (0.045).
Our analysis of remote sensing data showed that a) the ice storm caused abrupt decreases in EVI in the Jiangxi forest, b) ice storms can have a homogenizing effect on vegetation cover, c) the damages to the forest were obviously affected by topogra-phy conditions, and d) the artificial pure coniferous forests were most vulnerable to disturbance by the ice storm.
These results are a bit different than those of field investiga-tions. We found in general that forest damage is related to elevation and forest type. In order to improve the accuracy of the results, it is necessary to use long-term series remote sens-ing data coupled with field investigation data.
Dr. Wang is a Professor with the Institute of Geographic Sciences and Natural Resources Research (IGSNRR) and Leader of the Qianyanzhou Ecological Station, Chinese Academy of Sciences. Ms. Shi is a Doctoral Candidate at IGNSRR. A
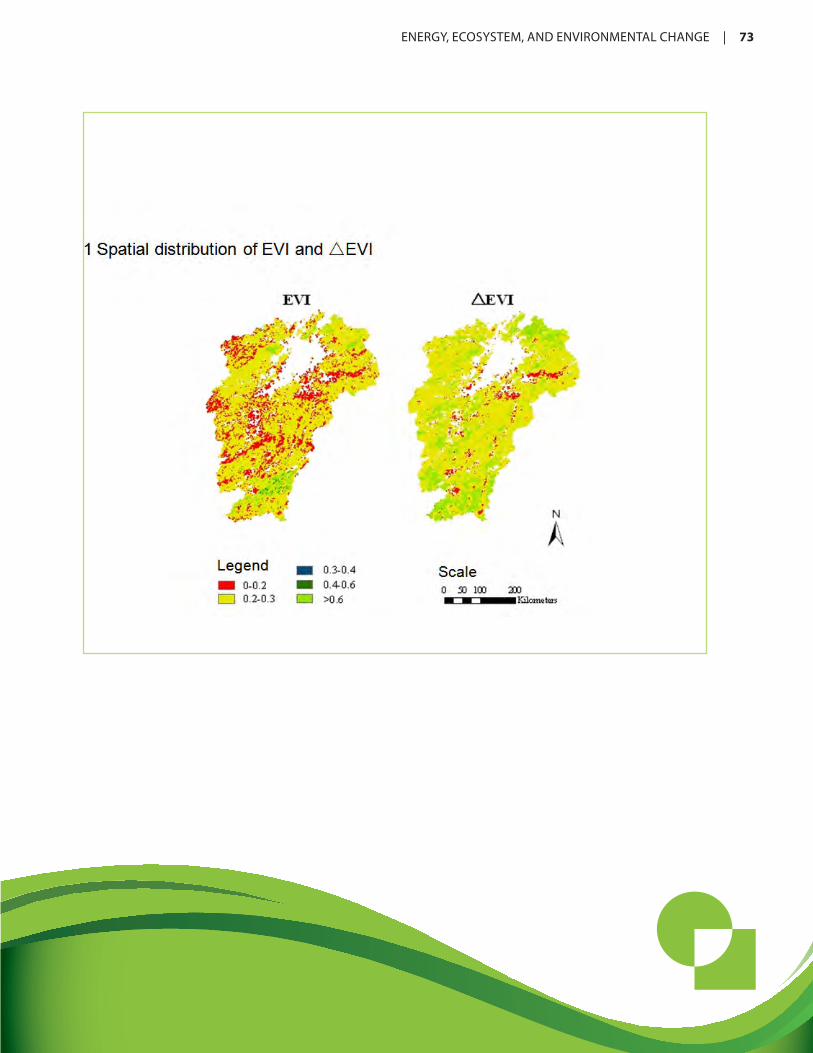
ENERGY,ECOSYSTEM,ANDENVIRONMENTALCHANGE | 73
74 | ENERGY,ECOSYSTEM,ANDENVIRONMENTALCHANGE
Assessing the Long-Term Environmental Risk of Trace Elements in Cropland Soils
by Weiping Chen
Trace elements are present in natural systems in small concentrations, generally less than 0.1 percent, and are subject to spatial and temporal changes. If concentrations are high enough, trace elements can be toxic to living organisms, includ-
ing plants, animals, and humans.
Trace elements such as arsenic (As), cadmium (Cd), and lead (Pb) have many different sources, natural and anthropogenic. Natural sources include parental material such as bedrock, atmospheric fallout, volcanic eruptions, wildfires, and ocean spray. Anthropogenic sources include mineral extraction and enrichment, industrial and urban emission sources, agricultural production, waste disposal and accidental spills, and hydrologi-cal events.
Trace elements can be transferred to the food chain via the soil-plant-human pathway or the soil-plant-animal pathway. The presence of trace elements in soil can lead to loss of soil fertility, and trace elements are potential sources of groundwater pol-lution. At low intensity over the long term, changes of trace elements in soil are not readily detectable by routine sampling and measurements.
Cd is often present in phosphate fertilizer. A 100 kilogram (kg) application of phosphate fertilizer per hectare may contain a concentration of cadmium of 20 milligrams (mg) per kg. The total input of cadmium per acre could approach 2 grams (g) per hectare, increasing the background concentration of cadmium (0.20 mg/kg) by about 0.001 mg/kg. At that rate, it would take about 200 years to double the concentration of cadmium. That amount of change is difficult to detect through routine sam-pling. Moreover, the toxic impacts at that level are not really noticeable.
A major challenge in monitoring such small concentrations is that changes are determined by a number of non-linear interac-tion processes such as absorption/desorption, precipitation/dissolution, plant uptake and removal, residue reincorporation/mineralization, solute transport, and external inputs.
To improve detection of trace elements in the soil, we need a mathematical model that a) accounts for processes and reac-tions, b) tracks the balance of mass, c) projects long-term changes, and d) evaluates the impacts of alternative man-agement processes. To that end, at the Research Center for
Eco-Environmental Sciences we have developed a Soil Trace Element Model (STEM).
STEMThe starting point for STEM is similar to the one-dimensional conservation law, which takes into account the total soil content and flux of the trace element. The model structure comprises four phases: the mineral phase, the solution phase, the absorbed phase, and the organic phase. The phases are linked to external inputs and plant uptake. With this model we can determine the interaction between different chemical phases and track the transport of trace elements through the system and uptake of trace elements by plants.
We created two computer-based programs that can be used to model transport and uptake of trace elements. The STEM Single Layer Model allows the user to enter a number of vari-ables including the specific element in question, soil properties, the simulation period, plant uptake information, and initial trace element content. With the STEM Profile Distribution Model, the user enters information on soil properties, initial conditions, inputs, boundary fluxes, plant growth and uptake, and root water uptake.
TESTING THE MODELWe tested these models on soil samples from California croplands in seven major vegetable production regions across the state and compared them to California Benchmark Soils, which were identified and sampled in 1967 as a baseline of soils containing little or no fertilizer inputs and sampled again in 2001. In those 35 years, As content was slightly depleted, while Cd and Pb content was slightly higher. We then tracked trace element content in cropland soils of As, Cd, and Pb and ran a model simulation using these parameters: initial trace element pools of soil, soil properties, plant uptake, reaction constants, and trace element inputs from atmospheric fallout, irrigation, and phosphate fertilizers. Using the accumulation of As and Cd as default parameters, we ran a simulation of projected changes over a 100-year period. The model projected little change in As—input is nearly equal to output—but for Cd, the input is much greater than the output, so in 100 years the level of Cd almost doubled.
Dr. Chen is a Professor at the Research Center for Eco-Environmental Sciences through the 100 Talents Program of the Chinese Academy of Sciences.
T

ENERGY,ECOSYSTEM,ANDENVIRONMENTALCHANGE | 75
SETTING STANDARDSAs we know, phosphate in fertilizer is one of the major sources for Cd in soils, and the Cd content of fertilizer is subject to regulation. Different countries and states have different ranges for standards, and the California standards are stricter than for some states, but with the standard set at about 200 mg/kg of Cd it is probably not strict enough. In Europe, for example, the standard is about 20 mg/kg.
We used this model to project accumulation of Cd under cur-rent regulations and to propose regulation standards to curb ac-cumulation of this element over time using current regulations for the states of Washington, California, and Oregon.
All the evaluations are determined by what we call risk based concentration. These calculations are based on the particular fertilizer product formulation, the ratio of NPK (nitrogen, phosphorus, potassium). The As, Cd, and Pb content in fertil-izer materials can vary widely, and application rates vary by crop and soil type. The metal levels in soil can be estimated for the range of 50-100 years. The metal uptake by plants, food ingestion rates for various crops, and established acceptable
metal levels (toxicity) in the diet can be estimated. From this information, we can back calculate to an acceptable upper limit of a specific metal in the fertilizer product, i.e. a risk-based concentration.
We have also compared two common means of estimating the fate and transport of As, Cd, and Pb in California croplands, the soil solution partition coefficient (k-D) and the plant uptake factors (PUF) to determine which method is a better predictor of trace element content. Our uncertainty analysis was based on a Monte Carlo simulation. We found wide ranges in the distribution of k-D for the three elements. Our PUF analysis of three different crop types—vegetable, root, and grain—yielded results more consistent with our own STEM model projections.
In the future, we need to update the model and modify it to be suitable for measuring organic pollutants, connect the model with a geographic information system, and apply the model to a case study of Beijing, a more complicated situation with a greater number of variables.
76 | ENERGY,ECOSYSTEM,ANDENVIRONMENTALCHANGE
Ms. Burks is a Graduate Research Assistant and Doctoral Candidate in the Ecological Sciences and Engineering Program in the Department of Agronomy, Purdue University.
Several different species of perennial grasses are considered potential candidates for bioenergy crops, including big bluestem-dominated prairie grass (Andropogon gerardii), switchgrass (Panicum vir-gatum), and Miscanthus (Miscanthus x. giganteus).
Prairie grass and switchgrass are both native to the United States, while Miscanthus originates in Japan and has only been recently studied as a biofuel crop in the United States. My research in the Department of Agronomy at Purdue University aims to compare the attributes of these three species to deter-mine which may be most sustainable for bioenergy purposes.
A candidate for a biofuel crop needs to have certain traits. Most importantly, the plant should yield high biomass; that is the economic driver for biofuel crops. Second, the crop should have low invasiveness potential. We work with Miscanthus giganteus primarily because it is a sterile hybrid with low potential to become invasive. Third, biofuel crops need to have a low input to output ratio, so when we assess these different crops we look at fertilizer input, the amount of management required to grow it, and the amount of fossil fuel that goes into producing these crops. Our outputs need to be large to decrease that ratio. Fi-nally, we must assess the plant’s nitrogen use efficiency (NUE) and water use efficiency (WUE).
All three of these crops are C4 grasses and thus inherently have a higher NUE than C3 crops. In addition, Miscanthus is the only one of the three crops that is a cold tolerant C4 perennial; that is, it can emerge earlier in the spring and grow later in the fall than other C4 grasses and therefore is also more light ef-ficient than other crops.
FIELD STATION RESEARCHIn my experimental design, the plots are all located at Pur-due’s Water Quality Field Station northwest of the campus in northern Indiana. The experiment itself is a randomized complete block design with four replicates within each block. This two-year study, which began in 2009, assesses yield and nutrient dynamics within each of the species. Sampling began in April 2009 with sampling once a month from April through September and once again in December to get a picture of how the plants fare over winter. I sampled aboveground biomass and belowground tissues. The three belowground tissues include stem bases, which begin an inch belowground and span the soil surface to a couple of inches aboveground, rhizomes, and roots.
Within the large plots I set up nitrogen micro-plots to assess the responses of different species to nitrogen rates.
Yield results. Two considerations in the yield results are level of establishment of each of the species and fertilizer rates. The prairie grass is very well established, having been planted at the field station in 1992. It receives no nitrogen fertilizer, so it is fairly stable in its yield results. The switchgrass was planted in 2007, so it is still in the establishment phase. The Miscanthus was planted in 2008 and is also in the establishment phase. It has been reported in the literature that Miscanthus generally becomes uniform and encloses its canopy by the end of the third year; as of fall 2010 we are at that point, so my results in 2009 and 2010 reflect some change due to the level of estab-lishment. The fertilizer rates are also a consideration in terms of yield. The prairie grass gets no nitrogen fertilizer whereas Miscanthus and switchgrass each receive 50 pounds of nitrogen per acre in early May.
• Aboveground yield. Maximum biomass yields occur in August. In August 2009, top growth yields were about 16 dry tons per hectare, and 38 dry tons in 2010. Mischanthus biomass more than doubled in those two years. The prairie grass did not produce much biomass, while switchgrass, due to its early establishment, was intermediate in yield.
• Belowground yield. Since data for August 2010 were not yet available, I compared the July data with the August data for aboveground growth. While Miscanthus produced the most aboveground yield, it produced the least amount of belowground yield. This suggests Miscanthus puts most of its efforts into producing aboveground biomass. Prairie grass did not produce much aboveground biomass, but produced the largest amount of belowground biomass.
• Belowground yield per tissue (stems, roots, and rhizomes). Miscanthus did not produce many roots at all. Prairie grass was dominant over switchgrass in belowground root produc-tion and rhizome yield. Miscanthus and switchgrass yielded nearly the same amount of rhizomes. There were no large differences in stem-based average yields among the three species or between the two years.
Overall, the aboveground results showed significant differences in yield by species and by year. Belowground yields from all three tissues, from lowest to highest, were Miscanthus, switch-
SNutrient Cycling Dynamics inPerennial Bioenergy Crops
by Jennifer Burks
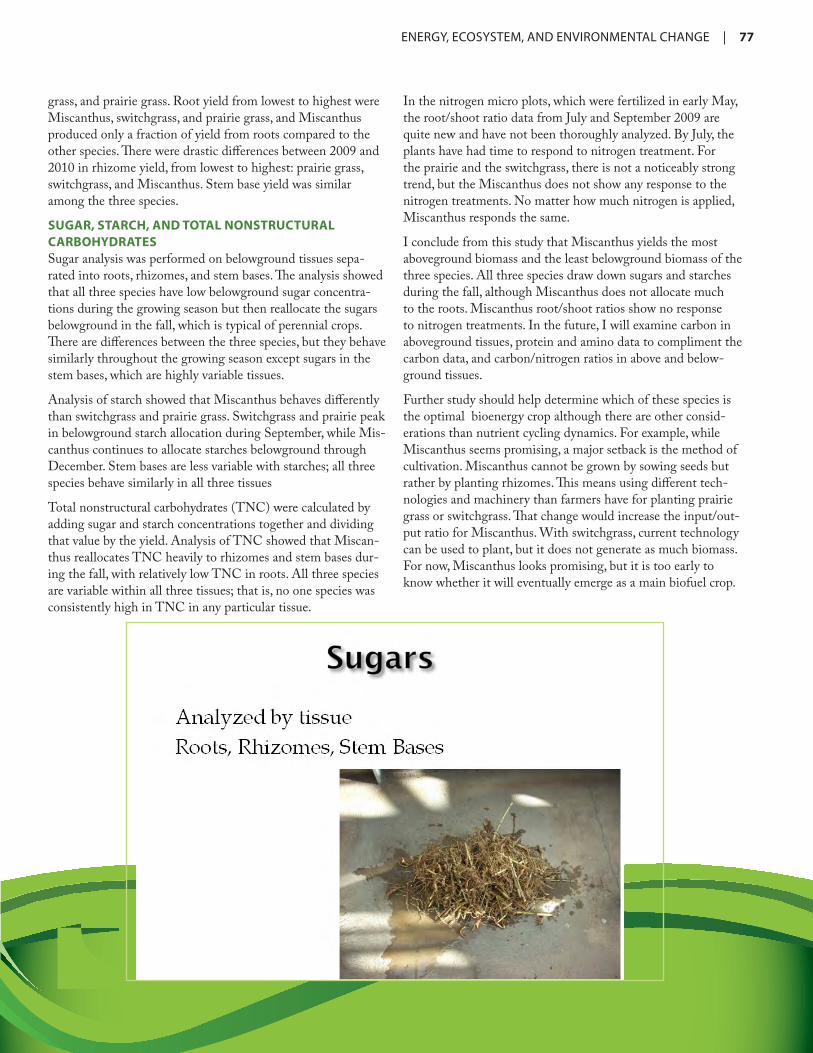
ENERGY,ECOSYSTEM,ANDENVIRONMENTALCHANGE | 77
grass, and prairie grass. Root yield from lowest to highest were Miscanthus, switchgrass, and prairie grass, and Miscanthus produced only a fraction of yield from roots compared to the other species. There were drastic differences between 2009 and 2010 in rhizome yield, from lowest to highest: prairie grass, switchgrass, and Miscanthus. Stem base yield was similar among the three species.
SUGAR, STARCH, AND TOTAL NONSTRUCTURALCARBOHYDRATESSugar analysis was performed on belowground tissues sepa-rated into roots, rhizomes, and stem bases. The analysis showed that all three species have low belowground sugar concentra-tions during the growing season but then reallocate the sugars belowground in the fall, which is typical of perennial crops. There are differences between the three species, but they behave similarly throughout the growing season except sugars in the stem bases, which are highly variable tissues.
Analysis of starch showed that Miscanthus behaves differently than switchgrass and prairie grass. Switchgrass and prairie peak in belowground starch allocation during September, while Mis-canthus continues to allocate starches belowground through December. Stem bases are less variable with starches; all three species behave similarly in all three tissues
Total nonstructural carbohydrates (TNC) were calculated by adding sugar and starch concentrations together and dividing that value by the yield. Analysis of TNC showed that Miscan-thus reallocates TNC heavily to rhizomes and stem bases dur-ing the fall, with relatively low TNC in roots. All three species are variable within all three tissues; that is, no one species was consistently high in TNC in any particular tissue.
In the nitrogen micro plots, which were fertilized in early May, the root/shoot ratio data from July and September 2009 are quite new and have not been thoroughly analyzed. By July, the plants have had time to respond to nitrogen treatment. For the prairie and the switchgrass, there is not a noticeably strong trend, but the Miscanthus does not show any response to the nitrogen treatments. No matter how much nitrogen is applied, Miscanthus responds the same.
I conclude from this study that Miscanthus yields the most aboveground biomass and the least belowground biomass of the three species. All three species draw down sugars and starches during the fall, although Miscanthus does not allocate much to the roots. Miscanthus root/shoot ratios show no response to nitrogen treatments. In the future, I will examine carbon in aboveground tissues, protein and amino data to compliment the carbon data, and carbon/nitrogen ratios in above and below-ground tissues.
Further study should help determine which of these species is the optimal bioenergy crop although there are other consid-erations than nutrient cycling dynamics. For example, while Miscanthus seems promising, a major setback is the method of cultivation. Miscanthus cannot be grown by sowing seeds but rather by planting rhizomes. This means using different tech-nologies and machinery than farmers have for planting prairie grass or switchgrass. That change would increase the input/out-put ratio for Miscanthus. With switchgrass, current technology can be used to plant, but it does not generate as much biomass. For now, Miscanthus looks promising, but it is too early to know whether it will eventually emerge as a main biofuel crop.
78 | ENERGY,ECOSYSTEM,ANDENVIRONMENTALCHANGE
A Study on the Mechanism of Mitigating Methane and Ingredient Benefits of No Tillage in Rice-Duck Complex System
by Huang Huang
Farmers in China have a long tradition of combin-ing cultivation of rice with the production of ducks, a tradition that has recently been revived for a number of reasons. Ducks are effective at ridding the rice paddies of insect pests, but recent research
is demonstrating that combined rice-duck farming can also contribute to the mitigation of methane gas—the second most important greenhouse gas after carbon dioxide—reduce the use of pesticides, and increase income to farmers from the pro-duction of duck meat and eggs in addition to rice in the dual system.
The new rice-duck complex system is based on the mutualistic, symbiotic relationship of rice and ducks, joined with a new no-tillage technique in paddy fields. In order to provide the sci-entific and theoretical foundation for an ecological assessment and to encourage popularization of the system, my colleagues and I have conducted experiments to characterize methane emissions and the physical and chemical characteristics of soil, soil microbes, soil enzymes, and rice growth characteristics.
METHANE EMISSIONSIn our study of the methane emission dynamics of a no-tillage rice-duck complex system, we tracked the daily variation dynamics of methane emissions and found that daily emissions, which peak during daytime, were consistent with changes in air temperature. In the morning, when the air temperature was lower, so were methane emissions. As air temperature increased, methane emissions also increased gradually. At about 12:00 to 14: 00, emissions reached a climax, and then declined until dawn, when emissions were lowest.
Three methods of cultivation with and without ducks were tested: No-tillage Cast-transplanted with Duck treatment (NCD), No-tillage Cast-transplanted without Duck treatment (NCND), and Conventional-tillage Cast-transplanted with-out Duck treatment (CCND). In the NCD system, dissolved oxygen was greatly increased, by 38.4 percent to 44.7 percent compared to the NCND and the CCND systems. The increase in dissolved oxygen was helpful to the oxidation of methane.
We also tracked the seasonal variation dynamics of methane emissions. In the wetlands system during the late rice growth period, emissions were lower at the early tillering stage. At the full tillering stage, emissions reached their peak. Later, as the
rice grew, emissions of methane were reduced. After the boot-ing stage, methane emissions continued to decline. The average methane emissions trend was: NCD < NCND < CCND.
After introducing ducks, at the full tillering stage, methane emissions from the NCD and the NCND were 23.6 mil-ligrams per square meter per hectare (mg/m2·h) and 30.5mg/m2·h respectively, which shows that raising ducks reduces total methane emissions by 22.3 percent in the no-tillage-based paddy field. After the full tillering stage, the difference between them declines gradually. These results showed that raising ducks in the paddy field reduced methane emissions mainly at the full tillering stage, which was usually the climax period of emis-sions.
When we followed total methane emissions from the no-tillage-based rice-duck complex system during the entire rice growth period, we found that the effect of raising ducks on the methane emissions climax period was most obvious. Compared with the CCND and the NCND, the emissions per square meter of the NCD were reduced 4.723g and 2.333g respec-tively, with a reduced ratio of 40.5 percent and 25.2 percent respectively.
We also examined the effect of soil redox characteristics on methane emissions from the no-tillage-based rice-duck com-plex system. The redox potential of the NCD system was higher than that of the NCND, but there was no correlation between the redox potential of the NCD and that of the CCND system.
The Fe2+ content of the CCND was obviously higher than that of the NCD and the NCND. The reductive degree of the CCND was stronger than that of the NCD and the NCND.
In the no-tillage-based rice-duck complex system, there was an obvious negative correlation between the redox potential and total reducer, active reducer, and Fe2+. There was also an obvious negative correlation between the redox potential and methane emissions (correlative coefficient=-0.5232).
SOIL CHARACTERISTICS This study showed that after one season of no-tillage and raising ducks, the dust depth (capacity) in the 0 ~ 5 cm dust layer was reduced 0.013g/cm3 compared with the CCND. The soil non-capillary porosity of the NCD system increased 3.13 percent in the 0 ~ 5 cm dust layer, and increased 1.05 percent in
Dr. Huang is s Professor in the College of Agronomy, Hunan Agricultural University.
F
ENERGY,ECOSYSTEM,ANDENVIRONMENTALCHANGE | 79
5 ~ 15cm dust layer. It can be concluded that no-tillage protects the soil structure and increases the proportion of air in soil.
Through chemical analysis of no-tillage-based rice-duck sys-tem, we found that no-tillage combined with raising ducks was useful in increasing organic carbon and nitrogen, but had little effect on phosphorus and potassium.
SOIL MICROBESIn our study of soil microbe floristic distributions of the three paddy field systems, we found an obvious distribution trend in the three levels of microbe content units. The higher the level of microbes, the greater the soil microbe floristic distribution. Especially in the 0-5cm dust layer, the microbe amounts in the NCD system were greater than in the same layer of the other two systems. Although the upper layer had higher amounts of microbes and the lower layer lower amounts, the amount of each microbe and total amount of all kinds of microbes were both greater than those of the same layer of the other two sys-tems. The sequence was NCD > NCND > CCND.
The selection of culture medium in culture cuvettes also had an effect on methane production. Methane production from the NCD with carbinol and acetic sodium as the medium was 42.6 and 45.3 times greater than in a neutral medium? Thus an acetic sodium was selected as the growth medium for methane cultivation.
The amount of methane bacterium of paddy field systems also changed at different stages of growth. During the early period
of rice growth, the level of soil methane bacterium was com-paratively low; as the rice grew, methane bacterium increased greatly. Compared with the early tillering stage, it was evident that the soil methane bacterium increased at the full tiller-ing stage, reached its maximum at the booting stage, and then declined. In the three systems, methane bacterium amounts during the late period of rice growth were all greater than those of the early period of growth.
In addition, in all three systems, methane bacterium was slightly different. The methane bacterium in the NCD system was dramatically lower than that in the NCND and CCND systems. At the booting stage, it was further reduced, and dur-ing the late period, it was slightly reduced, but less obviously than at the ear bearing stage. Soil microbe biomass of no-till-age-based rice-duck complex system declined from the upper to lower soil layer. In the three systems, the microbe biomass sequence was: NCD > NCND > CCND.
The results of this study provide solid evidence that the dual rice-duck, no-tillage system reduces the production of methane gas compared to other systems. Other benefits include the pro-duction of chemical free rice, lowering the cost of cultivation by reducing pesticide use, and the possibility of increasing profits for farmers in a sustainable way. In the future, this information may encourage more farmers to adopt a new technique that has, in fact, a long history in China.
80 | ENERGY,ECOSYSTEM,ANDENVIRONMENTALCHANGE
Mitigating Nitrogen-Induced Greenhouse Gas Emissions by Improving Nitrogen Management in Chinese Croplands
by Yao Huang
With a population of 1.32 billion people as of 2007, China accounts for approximately 22 percent of the global total popula-tion. Agricultural land occupies about 130 million hectares, 7 percent of the world’s
arable land area. China has three different cropping systems. In northeastern China, the system is generally a single crop-ping system, with one harvest over a one year cycle. In eastern and central China, we typically have double cropping systems combining rice and other crops, and in southern China we have a triple cropping system, usually with rice followed by rice and then vegetable crops in the winter. The total harvest area is 150 million hectares.
About 92 percent of nitrous oxide emissions in China come from agriculture, and synthetic nitrogen consumption ac-counted for about one third of the total use in 2007. Indus-trial production and transport of synthetic nitrogen is energy intensive, releasing large amounts of carbon dioxide into the atmosphere. The partial factor productivity for nitrogen fertil-izer, i.e. the unit of grain produced per unit of nitrogen applica-tion, has decreased significantly in China since the early 1970s. Because of this decline in productivity, we need to understand a) the nitrogen use efficiency (NUE) of synthetic nitrogen, b) how much nitrous oxide and carbon dioxide emissions could be reduced if NUE is improved, and c) where to place priorities on the mitigation of nitrous oxide and carbon dioxide.
ESTIMATING NUETo estimate NUE, we used statistical models established by Xiao-Tang Ju and colleagues and reported in the Proceedings of the National Academy of Sciences in 2009. Ju et al. derived NUE for rice and wheat in northern China and for wheat and maize in southern China. Their estimation of NUE is based on a formula to calculate nitrogen input and output using the crop grain yield, the amount of nitrogen taken up by aboveground crop biomass to produce one ton of grain in fields, the relative contribution of indigenous soil nutrients to crop yield (Ps), and the application rate of synthetic nitrogen.
The difficult factor to determine is the Ps. We surveyed pub-lished databases on the spatial distribution of field experiments in mainland China, examining 146 publications representing 266 field experiments and measurements during the period 1990-2000. Based on these data sets we developed statistic
models for Ps and compared observed Ps against the computed Ps for three crops—rice, wheat, and maize—and estimated the percentage of over application of synthetic nitrogen using five NUE scenarios: 30, 35, 40, 45, and 50 percent. Once we had estimated the excess amount of nitrogen application, we were able to estimate emissions of nitrous oxide from the cropland.
We also estimated carbon dioxide emissions associated with industrial production and transport of synthetic nitrogen. With the information on carbon dioxide emissions and data on the over application of synthetic nitrogen, we were able to estimate the mitigation potential of nitrous oxide emissions. Our data sources included county level cultivation areas, grain yield, and application rates of synthetic nitrogen on rice, wheat, maize, and three other crops. Estimates of nitrogen use and NUE for rice, wheat, and maize indicate that the area-weighted mean for rice is 191 kilograms per hectare (kg/ha) and greater than 250 kg/ha for 23 percent of the rice area. For wheat, the area-rated mean was 190 kg/ha and greater than 250 kg/ha for 24 percent of the wheat area. For maize the area-weighted mean rate was 187 kg/ha and greater than 250 kg/ha in 21 percent of the maize cultivated area.
We also estimated NUE for six crops: rapeseed, soy, and cot-ton in addition to rice, wheat, and maize. For the rice, wheat, maize, cotton, and rapeseed crops, the average NUE is about 30 percent, and somewhat higher for soybeans, about 40 percent.
Using this data, we estimated the over-application of nitrogen. For rice, wheat, and maize, NUE improved significantly at an application rate of nitrogen 30 percent lower than current us-age. At this rate, we could save about 2 million tons of nitro-gen per year just for these three crops. If the NUE could be increased up to 50 percent, we could save some 6 million tons of synthetic nitrogen fertilizer per year.
Over-application of synthetic nitrogen occurs primarily in central and eastern China and to a lesser degree in southern China. The potential for mitigation of nitrous oxide emissions varies according to crop type. There is a greater mitigation po-tential for wheat and maize cultivation than for rice, but for all six crops there is significant potential to decrease nitrous oxide emissions and realize savings in nitrogen. In addition, if we improve NUE to 30 percent, we could save some 3.2 million tons of nitrogen per year, and if one day we can improve NUE
Dr. Huang is a Professor at the Institute of Atmospheric Physics, Chinese Academy of Sciences; an Adjunct Professor at Nanjing Agricultural University; and an Affiliate Professor at Auburn University.W

ENERGY,ECOSYSTEM,ANDENVIRONMENTALCHANGE | 81
up to 50 percent, which would be more difficult to accomplish, the nitrogen saving would amount to 7.7 million tons per year.
We also estimated the mitigation potential by province within China. In the provinces of Jiaingsu, Hunan, Shandgong, Sich-uan, and Hebei, the vegetation potential is higher than in other provinces, so in these seven provinces the mitigation potential accounts for about half of the total national mitigation poten-tial.
Our research has demonstrated that NUE is generally lower in China, about 30 percent, than in developed countries, where NUE is about 42 percent. Improving NUE in areas where the estimated NUE is lower than 30-50 percent could save 3.4 to 7.7 million tons of synthetic nitrogen per year. Direct nitrous oxide emissions from croplands together with carbon dioxide emissions from industrial production and transport of synthetic nitrogen could be reduced by 32 to 74 teragrams of carbon dioxide equivalent per year. Therefore, mitigation efforts in Jiangsu, Hunan, Shandong, Sichuan, Hubei, Anhui and Hebei provinces should be given top priority.
The question is, how can we go about improving NUE for mit-igating nitrogen-induced greenhouse gas emissions in China? We have several technologies available. First is matching the temporal and spatial nitrogen supply with plant demand. In ad-dition, we can apply nitrogen fertilizer at or near the plant root; balance nitrogen, phosphorous, and potassium fertilizer ap-plication; and use nitrification inhibitors and controlled release of nitrogen fertilizer.
We have several means to accomplish these goals through the assistance of the government, scientists, local extension agen-cies, and the news media. We can increase investments in gov-ernment-sponsored public sector research. Scientists can play an important role by recommending improvements in nitrogen management practices to local extension agencies and farmers. The responsibility of scientists and local extension agencies is to train and educate farmers in nutrient management. Finally, we need to use all the media—newspaper, television, and radio—to raise public awareness of environmental protection for the benefit of all the people.
82 | ENERGY,ECOSYSTEM,ANDENVIRONMENTALCHANGE
Greenhouse Gas Emissions and Pelicans: Ecological Accounting in Bioenergy Cropping Systems
by Sylvie Brouder
Spring and summer of 2010 brought British Petro-leum a bit of a problem in the Gulf of Mexico: one of the biggest oil spills on record at its Deepwater Horizon rig. The spill caused a great deal of environ-mental damage. That same summer, while running
errands in my car using BP gas, I heard a discussion on the radio about the damages. The report was essentially about ecological accounting, and the reporter raised a very interesting question: How much is a pelican worth?
The reporter had called various people and asked them to put a dollar price on a pelican. He asked zoo keepers how much they might budget to buy pelicans for a display. He called wildlife experts. He called some citizens and asked them how much they would be willing to pay to have a pelican in the backyard. Some people said 30 dollars, some said nothing, some said a pelican has no price. It is invaluable.
It turns out the US Environmental Protection Agency (EPA) has already answered this question. After about 10 years of studying the issue, EPA determined that the price of a pelican is a pelican. No matter the cost, BP has to replace every pelican. Two things struck me in this discussion. For one, EPA spent a lot of money at the taxpayers’ expense to come up with that equation. In addition, given my research focus is on carbon (C) and nitrogen (N) cycling, I find the answer is not that simple. For ecosystems services linked to C and N and the agricultural system losses of C and N gasses or solutes, neither the attribu-tion of responsibility nor the managements to effectively re-verse losses with mass balance rigor is well defined or perceived as in any way practical.
THE NEW MATH: FOR WHAT IT’S WORTHThe question boils down to a problem of equivalency. The new math of ecological accounting seeks to find valuation among versus within ecosystem attributes. Simply put, there is no such thing as having everything and this is especially true for agriculture—one cannot have high yielding crops with no envi-ronmental impact. There are choices. To make those choices, we must improve our understanding of how to value a water qual-ity improvement versus an air quality improvement as ecosys-tem air and water attributes exist in delicate equilibrium.
Turning to bioenergy crops and their array of potential pro-visioning versus other ecosystem services, the initial thinking
was pretty simplistic. We assumed that the choice of the energy source could be determined using a simple equation based on a life cycle analysis (LCA) of C footprints and the net energy balance. Basically, if the net energy balance of a certain crop A is greater than the net energy balance of petroleum, and if the C emitted when we grow crop A is less than that from fossil fuels from petroleum, then we choose crop A; that is an energy choice. However, we have now evolved to a perspective that is much more complex; at a minimum, the United States now advocates for the choice of an energy source reflecting net en-ergy balance plus energy self sufficiency. Furthermore, we want to achieve the global optimization of all the ecosystem services involved with a particular crop.
ENERGY SELF-SUFFICIENCY AND ECOSYSTEMSUSTAINABILITYAs long as the predominant source of energy is petroleum, the United States will not be energy self sufficient. That fact alone changes the equation. Specifically, we may be willing to consider nationally produced Crop A as an energy source even if it has a lower net energy balance than internation-ally produced petroleum. Crop A would still need to have a net energy balance greater than 0, but policy could be used to make it economically favorable for citizens to choose Crop A over foreign oil. Likewise, policy can be used to create incen-tives to make choices that meet added criteria specifically for sustainability, but these additional criteria make for an even more complicated equation where historically non-monetized but valued ecosystem attributes are traded with commodities. Under this scenario, we would need to consider the full array of potential tradeoffs including tensions between food and fuel crops and indirect land use change. We would need to be able to weigh non-provisioning ecosystem benefits and assess the value of all goods and services provided by Crop A in the context of any alternative crop. Certainly, in creating a formula for net ecosystem sustainability (NES), we must include even more factors in the equation, factors that are difficult to value. Yet to compare the NES among candidate bioenergy crops, we require a system of equivalencies that does not exist. At present, we have no math to equate such factors as C sequestration, greenhouse gas (GHG) emissions, air quality, water quality, biodiversity, wildlife habitat, recreation, and so on.
Dr. Brouder is a Professor in the Agronomy Department, Purdue University, and Director of Purdue’s Water Quality Field Station.S

ENERGY,ECOSYSTEM,ANDENVIRONMENTALCHANGE | 83
NET ECOSYSTEM SUSTAINABILITY (NES) EQUATIONHow then can we determine whether crop A is better than an alternative crop after weighing the costs and benefits of ecosys-tem services versus the yield of goods and services? The scien-tific literature is replete with demonstrations of the tremendous extent to which each of these ecosystem services can vary in space and time. The net ecosystem service benefit of a particular crop will be a function of genetics, which are constantly chang-ing and improving; management, which is constantly changing and improving; and environment, which is highly variable and changing. Climate change in itself is partially a function of what we choose to grow in the first place, so there is an inher-ent feedback that makes it very complicated to understand.
Let us explore a little further the challenge of solving for the NES equation for a specific candidate biomass crop. In 2004, Heaton et al. identified a number of crop characteristics for an ideotype or ideal crop in the environmental perspective. In addition to producing large quantities of biomass, this ideotype would contain a number of additional beneficial traits includ-ing the ability to store C in the soil and both high nutrient and water use efficiencies.
In their analysis, Heaton et al. compared three crops: maize, Miscanthus, and short rotation tree (coppice) plantations but the extent of the comparison was strictly qualitative and il-lustrates the critical need for quantification in the comparisons. The analysis shows maize scoring high on two attributes – the crop has high water use efficiency, and it uses existing equip-ment to cultivate. Miscanthus scores high on several other cri-teria, and coppice lies somewhere in the middle. Thus, in theory, Miscanthus performs better on most counts implying that Miscanthus is a better choice from perspectives of both farm management efficiency and natural resource protection. Yet is this really true and are all necessary factors considered? Crop management impacts on GHG emissions, nutrient loss from leaching, biodiversity, habitat, and water filtration are not listed but are clearly important factors in a NES equation. Further, the magnitude of a deficit in a single attribute could outweigh multiple benefits across other traits from each of these crops. True comparative valuation requires quantitative data across all contributing traits and not just an assessment of trait presence or absence. In the final analysis, it’s the net sum of these char-acteristics that counts.
FOCUS ON CARBON AND NITROGENAt present, few would argue that we do not have enough quantitative information to solve a comprehensive NES equa-tion. However, what if we just focus on C and N? We have a long history of studying C and N in agricultural systems, and we have available a number of empirical studies, models, and model simulations designed specifically to track C and N pools and transformations in agro-ecosystems. We know that N is frequently the most limiting mineral nutrient to crop produc-tivity and the addition of fertilizer N drives high yields. We also understand a great deal about agriculture’s impacts on water quality, C sequestration, GHG emissions, and global climate
change mediated by N and N management. Finally, N and C are the focus of existing, albeit separate, crediting models. These crediting models are proceeding on parallel tracks. Credit-ing and policy associated with N have been related to water quality; C crediting has been related to global climate change and GHG emissions. These models have primarily proceeded through separate agencies or separate arms within the same agency.
LCA CORNERSTONECarbon, nitrogen, and water balances are the cornerstone of LCA from the field to the landscape-scale system. A number of problems arise, however, in trying to apply a mass balance anal-ysis to the C and N pools and processes depicted in Figure 1. First, there is almost no data on novel bioenergy crops to weigh one ecosystem service against another. For example, Somer-ville et al. (2010) found that Miscanthus yielded substantially more biomass per hectare than maize, but with only a fraction of the N fertilizer requirement. However, the N fertilizer rates reported are based on just one field study of Miscanuthus, and underpinning data are too sparse to be considered conclusive. Indeed, a 10-year study conducted in England which compared total input/output balances for Miscanthus suggests N fertil-izer rates may need to be substantially higher than suggested by Somerville et al. A comprehensive assessment of agronomic inputs and outputs which included fertilizer, aerial N deposi-tion, crop N removal, and N leaching losses showed negative system N balance for N applied at a rate of 60 kilograms per hectare (kg/ha). Certainly, for perennials such as Miscanthus, long-term study sequences are prerequisite to understanding what happens to an ecosystem service like soil organic C.
An overarching problem is that there are very few multi-factor, long-term comparative studies. Such studies are essential to assessing ecosystem service valuation. At Purdue University, we are conducting a long-term multi-factoral study comparing a native prairie grass system with no fertilizer to various maize-based systems under different management practices. We si-
Figure 1

84 | ENERGY,ECOSYSTEM,ANDENVIRONMENTALCHANGE
multaneously assess the outcomes in terms of GHG emissions and leaching losses, yield of aboveground dry matter, and car-bon/nitrogen (C/N) ratios in the soil and in aboveground dry matter. We have hypothesized we will find both tensions/trad-eoffs and co-benefits among C and N ecosystem services. We are finding that prairie grass with no fertilizer application has a very low annual yield of dry matter. Crops that receive fertilizer tend to have a lower C/N ratio in both plant tissue and in the soil surrounding the root system, whereas prairie grass systems has a fairly high C/N ratios. Among crop managements, N lost via leaching in treatments receiving spring manure applica-tions is lower than with fall manure application. But the spring application of fertilizer, which is optimal to prevent nitrate leaching, actually causes GHG emissions to increase compared to a fall application. In sum, if you try to manage for water quality you may wind up with a greater negative impact on air quality. The choice, water quality or air quality, is not an easy one. Long-term studies are needed on multiple environments because the nature of the benefit may not be evident in short-term studies.
There are multiple pathways for N loss from leaching and emis-sions to the atmosphere. A meta-analysis of these pathways shows that what we know is very limited. We do know that N uptake scales with biomass. The more aboveground biomass you want to grow in a plant, the more N a plant must acquire from the soil. Consequently, higher biomass production may increase N inputs to systems that do not have sufficient endogenous N. Long-term studies in multiple environments are also needed on C sequestration because the nature of the benefit may not be evident in short-term studies.
Finally, to maximize utility, long-term studies must be con-ducted with standardized protocols and measures and data made broadly available to the scientific community. At present, the lack of standardized measures and data repositories where data are preserved and available for reuse is a major limitation in the development of NES equations. What you measure, and when, where, and how the measurements are made are critical to the integrity of the measurement value. Scaling is also an important issue. Do the same things matter across scales, for example from the field to the landscape scale? In this context, the air versus water quality dilemma arises, since water quality problems are realized at the watershed scale, while air qual-ity problems are realized globally. Regardless, raw data are rarely preserved and curated the way a book or journal article is curated. For the most part, researchers do not share raw data because they don’t want people playing with raw numbers they don’t understand.
DATA, DATA, DATAWhen people discuss bioenergy crop production, they often say that what matters is yield and yield alone. But for LCA and ecosystem service valuation, what we need is data. We need more data on more systems so that we can start weighing some of the tradeoffs and present the results to those in a position to write policy using that information.
How do we get more data? The United States has invested in a network of observatories in natural settings to document what climate change is doing to natural settings. We have not in-vested in parallel observatories to look at managed ecosystems. From my perspective, this is a huge gap. We need to establish integrated field networks in our major agro-ecosystem zones and follow standard experimental methods and protocols so that we can quantify what is happening across temperature and moisture gradients, key drivers of variation in ecosystem service production.
We need an array of field sites, new and existing, with standard-ized methods for a) measuring and monitoring system fluxes of C, N, and water; b) gathering metadata, and c) preserving data to make it accessible to the broader research community including biophysical/climate change and economic model-ers. These observatories should be linked together and employ better methods to preserve, aggregate, and re-analyze data from disparate experiments. To feed the ecosystem services equa-tion in a cost effective way, we need data preservation, curation, searchability, and retrievability.
There are several barriers to ensuring quality database availabil-ity for environmental accounting, including money, mechanics, and motivation. To break the money barrier we will need to change the way researchers and stakeholders perceive value. To break the mechanics barrier to database availability, we need to standardize measurement and data management practices. Breaking the motivation obstacle in the United States will require a shift toward competitive federal funding and other mechanisms that require data management plans. Ideally, fur-ther down the road, we will have ecological observatories linked internationally with common research and educational goals and approaches. Cyber infrastructure is certainly not the limita-tion. Several projects are currently in their infancy but have the goal of an international array of research sites using the same benchmark treatments and offering the potential to integrate the development of scientific knowledge on productivity of major staple crops across major agro-ecozones in the United States, China South America, etc.
At Purdue University, we have developed a model structure for research on maize. Our vision integrates the human or societal dimensions and knowledge domains, including technical and stakeholder input. The human dimensions should be under-pinned by a data network aggregating existing field data and historical data models. This information should be preserved in a data network, or digital data repository. Using this hub technology, we can calculate outcomes based on knowledge products, learning tools, collaborative research, and best farm-ing practices.
For each biofuel crop candidate, not just for maize, we need to establish such a vision and models for mitigation and adapta-tion to climate change. In the final analysis, integrated model-ing systems and improved data management systems will allow
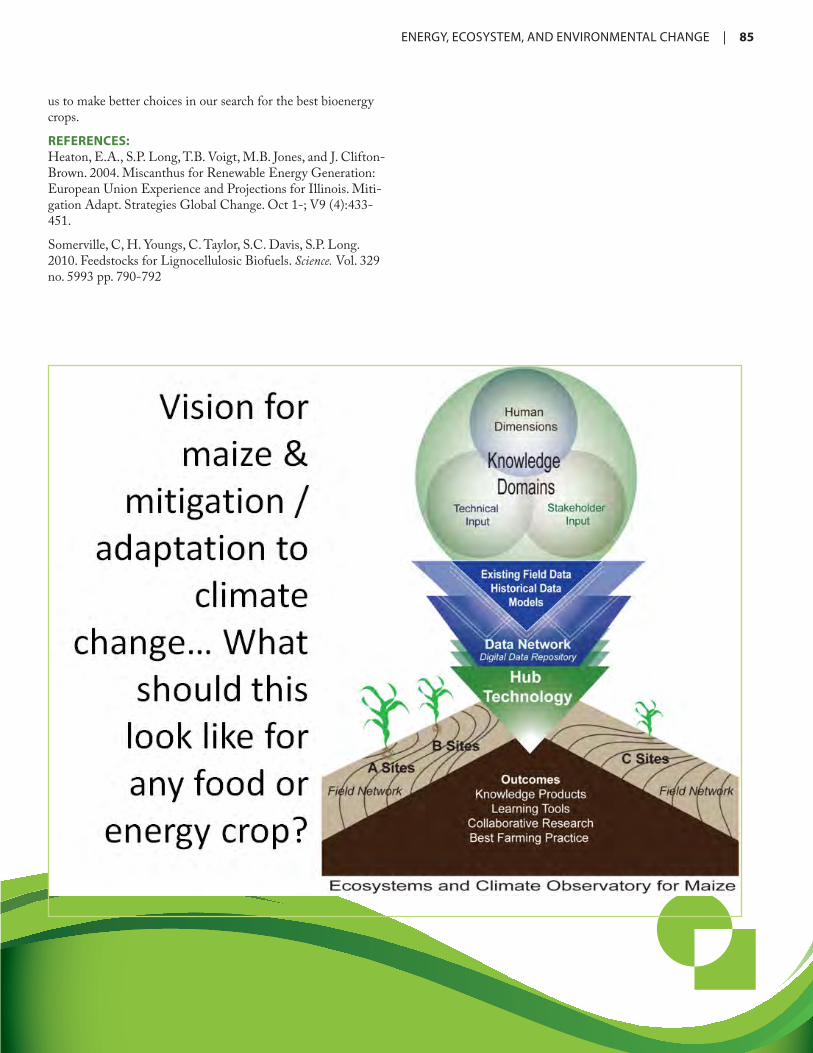
ENERGY,ECOSYSTEM,ANDENVIRONMENTALCHANGE | 85
us to make better choices in our search for the best bioenergy crops.
REFERENCES: Heaton, E.A., S.P. Long, T.B. Voigt, M.B. Jones, and J. Clifton-Brown. 2004. Miscanthus for Renewable Energy Generation: European Union Experience and Projections for Illinois. Miti-gation Adapt. Strategies Global Change. Oct 1-; V9 (4):433-451.
Somerville, C, H. Youngs, C. Taylor, S.C. Davis, S.P. Long. 2010. Feedstocks for Lignocellulosic Biofuels. Science. Vol. 329 no. 5993 pp. 790-792

86 | ENERGY,ECOSYSTEM,ANDENVIRONMENTALCHANGE
Soil Respiration and Nitrous Oxide Emissions After the Conversion of Wheat Cropland to Apple Orchard in Loess Plateau, China
by Xiaoke Wang
Change in land use is a major driver for emissions of the greenhouse gasses carbon dioxide and ni-trous oxide. According to recent estimates by the Intergovernmental Panel on Climate Change, the terrestrial ecosystem released 1.6 billion tons
of carbon in the 1990s due to land use change. In the global carbon budget, the source of carbon due to land use change has the largest uncertainties.
The amount of carbon released per year from land use change varies from country to country. In tropical regions, land use change represents a carbon source, while in temperate regions such as China and the United States, land use change repre-sents a carbon sink. Recent estimates of land use change in China (2000-2005) showed that 1.68 million hectares (ha) of land were converted into built-up land uses such as residential and industrial, followed next by conversion of grassland to ar-able land, and then by conversion of arable land to woodland and grassland, one result of a national project called “Green for Green” that encourages reforestation for existing arable land.
LOESS PLATEAU STUDY
Different parts of the country, of course, have different kinds of land use change. On the Loess Plateau, cropland has been converted to apple orchards because of the high income they generate. In 1986, 48.4 percent of the land was cropland, but by 2004 only 17.8 percent was crop-land, while orchard land increased from 1.7 to 29 percent.
The climate of the study site has a mean temperature of 9.0°C, and annual rainfall is 565 millimeters (mm). In our study, we compared soil pH, carbon, and nitro-gen measured in wheat fields and apple orchards. We found that in the soil layer from 1-10 centimeters (cm), soil organic carbon (SOC) in cropland is less than in orchard land, but in the deeper soil layer, from 10-20 cm, SOC is higher in cropland than in the orchards. We also found that pH is slightly higher in the
upper soil layer but slightly lower in deeper layer soil in the orchard. Total nitrogen was slightly higher in both soil layers of wheat fields.
Productivity measured in tons per hectare (ha) for one year, 2007, was 53 percent less in orchard than in cropland, and or-ganic matter returned to the soil in orchard land was 66 percent less than in cropland. In cropland, nitrogen (N) input from fertilization application was about 138 kilograms (kg)/N/ha, and in orchard land about 314 kg/N/ha.
In 2007 we installed an automated chamber system to measure soil respiration, with three chambers in the cropland and three chambers in the orchard land, and measured at 30-minute in-tervals. In orchard land, there were small seasonal variations in soil respiration—higher in summer and fall and lower in spring and winter. In cropland we found a similar seasonal pattern in soil respiration with large variation significantly stimulated by conventional tillage.
Our data also showed that soil temperature at a depth of 10 cm is very similar, while soil moisture in the orchard land was sig-nificantly greater than in cropland. Soil respiration in cropland
Dr. Wang is a Researcher with the Center for Eco-Environmental Sciences, Chinese Academy of Sciences.
C

ENERGY,ECOSYSTEM,ANDENVIRONMENTALCHANGE | 87
was about double that of orchard land. We also analyzed soil temperature and moisture sensitivities to soil respiration. Soil temperature accounted for 48 percent of the variation in soil respiration in the cropland, but in the orchard land temperature accounted for 71 percent of the variation in soil respiration. The two variables, soil temperature and soil moisture, accounted for more than 70 percent of the seasonal variation in soil respira-tion.
We also studied the effect of tillage on soil respiration in cropland using data from the wheat fields. We measured air temperature, soil moisture, and soil CO2 efflux in a period of 37 days before and 37 days after tillage. Temperature was nearly the same, but soil moisture increased after tillage. Soil respiration doubled after tillage demonstrating that tillage is a very important factor that influences soil respiration. After tillage, soil temperature sensitivity and soil moisture sensitivity increased significantly.
Our study of nitrous oxide emissions was conducted simulta-neously in the cropland and the apple orchard. At the orchard sites we took into consideration the timing of fertilization—
March and June—and the influence of trees on emissions. Soil temperature and soil moisture at the time of measurement were nearly the same for the two land uses. There were some emis-sion peaks corresponding to the freeze/thaw cycle, fertilization, and tillage in the wheat cropland. Those three factors were the main cause of nitrous oxide emissions in cropland.
In calculating the annual nitrous oxide emissions, we found emissions from orchard land only very slightly higher than from cropland. Correlation studies between nitrous oxide emis-sions and environmental variables showed that air temperature and soil temperature are major drivers of nitrous oxide emis-sions.
The results of our studies showed that, overall, soil carbon and nitrogen contents were similar in cropland and orchard land. Soil nitrous oxide emission was higher in orchard land than in cropland due to nitrogen fertilizer and was strongly influ-enced by pulses such as the freezing/thaw cycle, fertilizer usage, and tillage. We conclude that the conversion from cropland to orchard will increase greenhouse gas emissions because of increased fertilizer application and greater disturbances.
88 | ENERGY,ECOSYSTEM,ANDENVIRONMENTALCHANGE
Mitigation of N2O Emissions from Upland Soil by Applying Modified Nitrogen Fertilizer
by Hui Xu
One of the major greenhouse gases is nitrous oxide (N2O), which has a large global warming potential (300 times of carbon dioxide over a time horizon of 100 years). Nitrogen input to agricultural fields in the form of fertilizer
is a significant source for the increasing concentration of atmospheric N2O. Therefore, there is a great need to develop options to mitigate N2O emissions from the fertilized soils.
China is one of the largest consumers of nitrogen fertilizer. It was reported that about 27.4 percent of the world’s to-tal nitrogen fertilizer was consumed in China. Most of that consumption occurs in the agricultural regions of eastern and southeastern China. Various options to mitigate N2O emissions from fertilized fields have been tested, but only a few of them are practically adoptable. The use of inhibitors for nitrifica-tion and urease activities, for example, is a promising option. However, there are limited in situ studies concerning the reduc-tion of N2O emission by adding these inhibitors in developing countries, such as China.
We have conducted a study in an upland field with a crop of maize. The experimental site was located in the countryside not far from the city of Shenyang in Northeastern China. The modified nitrogen fertilizer, which is commercially available,
was produced by a company that belongs to the Institute of Applied Ecology, Chinese Academy of Sciences, and contained additives of a nitrification inhibitor dicyandiamide (DCD) and a urease inhibitor hydroquinone (Table 1).
The total amount of modified fertilizer was applied at one time as the basal fertilizer. The fertilizer urea, as the control, was ap-plied at two times. The first time, two thirds of the fertilizer was applied as basal fertilizer. The second time, the other one third of fertilizer was applied as top dressing fertilizer. Crop yield obtained by using the modified fertilizer can be increased about 10 percent or, at the same rate of application, result in a 20 percent reduction in the amount of fertilizer used to maintain the same yield obtained without the additive.
We used a closed chamber-gas chromatograph method to measure the flux of N2O from soil. Each plot (30 square meters) was separated by a distance of 1.0 m, and there were four replicates (plots) for each treatment. Maize was planted with a row spacing of 56 centimeters (cm) and a space between individual plants of 40 cm. The chambers (56 cm in length, 28 cm in width, and 40 cm in height) were inserted into soil to the depth of 20 cm. N2O flux was measured every 2-8 days during the cultivation period.
Dr. Xu is Deputy Director of the Key Laboratory of Terrestrial Ecological Processes and Professor of the Institute of Applied Ecology, Chinese Academy of Sciences.
Table 1. The fertilizers used in the different treatments in f ield experiment
O

ENERGY,ECOSYSTEM,ANDENVIRONMENTALCHANGE | 89
Seasonal variation of N2O flux of these plots was measured between May and November in 2005 and 2006. The total N2O emissions from these plots in year 2005 and 2006 are shown in Fig. 1 and 2. The total N2O emission from these plots in years 2005 and 2006 are shown in Figure 3. Addition of the nitrifica-tion inhibitor, DCD, reduced the seasonal N2O emission rates by 54 percent on average, while application of additives, both nitrification inhibitor and urease inhibitors, reduced N2O emis-sion by 44 percent. There were no significant differences in crop yield among the different treatments as measured by tons of dry seed produced.
The price of conventional urea fertilizer in China is about 2,300 RMB per ton, while the cost of urea fertilizer with additives is a bit higher, about 2,600 RMB per ton. At an application rate of 150 kilograms per hectare (kg/ha), the cost increase for the amended fertilizer is 90 RMB ($13 per hectare). Maize yield with the modified fertilizer is about 10 percent greater than that with the conventional fertilizer. The increased yield results in an 800 RMB/ha ($120/ha) cost benefit. Conventional fertil-izer is sometimes added two or three times during the grow-ing season, but the modified fertilizer is applied only one time during spring, which brings labor costs down. The savings from reduced labor costs were estimated at about 240 RMB ($36/ha). The net savings of using fertilizer with additives was about 950 RMB/ha.
In 2009 we tried two different inhibitors, the nitrification inhibitor 3,4-dimethylpyrazole phosphate (DMPP) and the urease inhibitor N-(n-butyl) thiophosphoric triamide (NBPT). N2O emissions were deceased by 33 percent with the nitrifi-cation inhibitor DMPP, but with the urease inhibitor NBPT emissions were not significantly decreased.
The results of this suite of experiments show that the addition of a fertilizer additive containing the nitrification inhibitor(s) reduced significantly the N2O emission. The cost analysis indicates the benefits of labor cost reduction and maize yield increases. The result suggests that application of these tested fertilizer additives is a promising option to mitigate N2O emis-sion from upland crop fields in Northeast of China.
Figure 3. The total N2O emission from these plots in years 2005 and 2006

90 | ENERGY,ECOSYSTEM,ANDENVIRONMENTALCHANGE
Teasing Apart the Influence of Past Land Use and Current Processes on the Controls of Soil Organic Matter Dynamics and Aggregation in Eastern Deciduous Forests, USA
by Yini Ma
For the global carbon cycle, the size of the soil carbon pool is greater than that of total vegetation plus the atmosphere combined. Therefore, any small change of the carbon flux from the soil or into the soil may change the potential balance of carbon
sink and source from the soil carbon cycle. In addition, how stable the carbon pool is plays a more important role in the soil carbon cycle than the size of the pool. That is why we need to study the soil organic matter (SOM) stabilization process based on physical and chemical protections.
If you look at soil structure through a microscope, you find four mechanisms that contribute to the stabilization of SOM. First, SOM binds carbon with silt or clay and prevents degradation by soil microorganisms. Second, SOM micro-aggregates, which also prevents degradation of soil microbes, perhaps because of a lack of water or oxygen or some other thing. Third, some SOM may be biochemically recalcitrant based on chemical charac-teristics such as lignin or some other chemical. Finally, some SOM is not protected by any of these mechanisms, so it will be quickly degraded by soil microbes.
A TYPICAL NORTHEASTERN DECIDUOUS FORESTA common forest ecosystem state in the northeastern United States is mixed land use combining agriculture and forest. Also common in this ecosystem is the presence of invasive Euro-
Ms. Ma is a Doctoral Candidate in the Department of Earth and Atmospheric Science, Purdue University.
pean earthworms. Collaborators from Purdue University, Johns Hopkins University, and the Smithsonian Environmental Re-search Center (SERC) maintain experimental field sites at the SERC in Edgewater in eastern Maryland. At this field site we find different types of forest, young, old, and mature, from 50 to more than 200 years old. These represent the different succes-sional stages since abandonment of agriculture.
In these forests we also find different earthworm biomass and earthworm activity. For the younger forests, about 50 to 70 years old, we find the highest earthworm activity, but in the mature forest, which is more than 200 years old, we have found no evidence of earthworm activity for the past decade. Other environmental conditions like temperature and moisture are the same, and the dominant species is the same, poplar. In the mature forest without any earthworm activity, there is a clear boundary between the organic layer at the top of the soil and the deeper soil, but in the younger forest with high earthworm activity, the organic matter is carried into the deep soil, and there are no boundaries between layers.
Our research poses three questions. First, how long would the signature from past land use stay in SOM and in what format? Second, would past land use and invertebrate activity influ-ence SOM distribution and stabilization and, if so, how? Third, can we separate the influence from past land use from current invertebrate processes?
To answer those questions, we are taking multidisciplinary approaches for a field study and a mesocosm incubation study. Our methods include a carbon/nitrogen (C/N) elemental analysis and stable isotope natural abundance and labeling experiments.
WHAT ISOTOPES TELL USThere are two stable isotopes of carbon (C), C-12 and C-13. About 99 percent of carbon is C-12, and only 1 percent is carbon-13. In natural biogeochemical cycling, there is a natural process for stable isotopes called fractionation. C3 plants such as wheat, for example, have more C-12, while C4 plants such as corn have less C-12. Historically, the 13C in soil organic matter get enriched as they become older. To measure the difference of biogeochemical cycling and the fractionation process we use the isotope ratio mass spectrometer (IRMS) technique. With the help of the stable isotope, we can read the memory of soil.
F
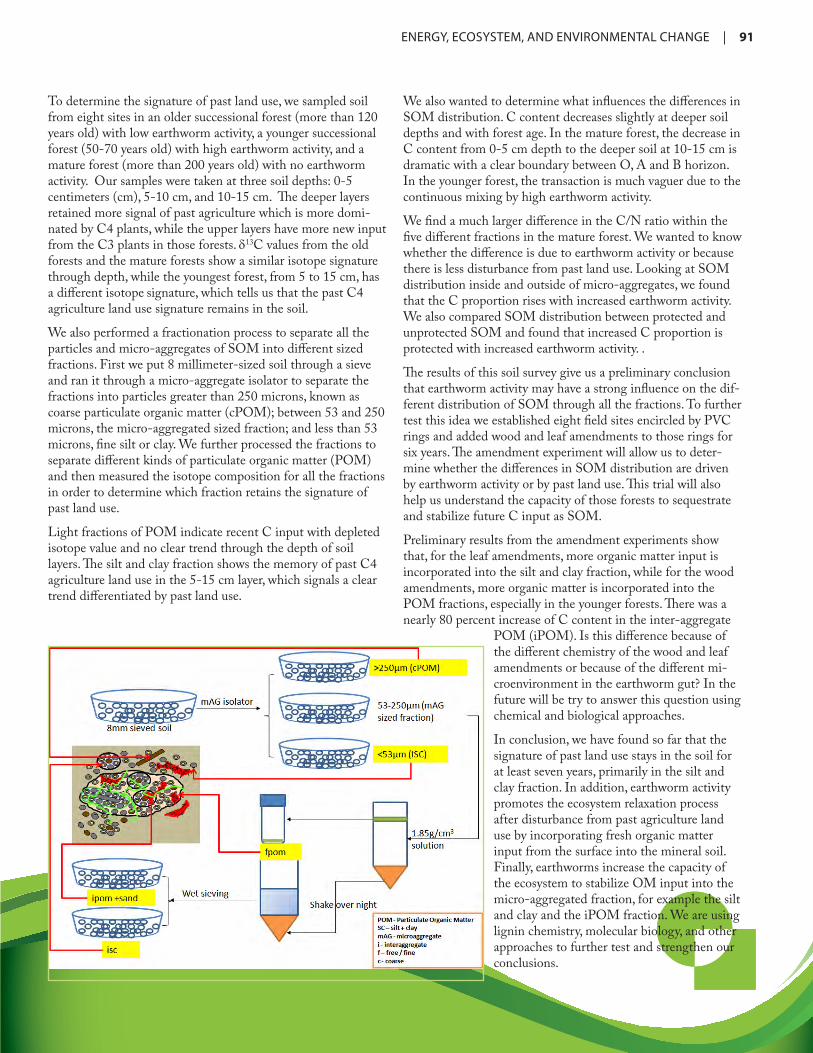
ENERGY,ECOSYSTEM,ANDENVIRONMENTALCHANGE | 91
To determine the signature of past land use, we sampled soil from eight sites in an older successional forest (more than 120 years old) with low earthworm activity, a younger successional forest (50-70 years old) with high earthworm activity, and a mature forest (more than 200 years old) with no earthworm activity. Our samples were taken at three soil depths: 0-5 centimeters (cm), 5-10 cm, and 10-15 cm. The deeper layers retained more signal of past agriculture which is more domi-nated by C4 plants, while the upper layers have more new input from the C3 plants in those forests. d13C values from the old forests and the mature forests show a similar isotope signature through depth, while the youngest forest, from 5 to 15 cm, has a different isotope signature, which tells us that the past C4 agriculture land use signature remains in the soil.
We also performed a fractionation process to separate all the particles and micro-aggregates of SOM into different sized fractions. First we put 8 millimeter-sized soil through a sieve and ran it through a micro-aggregate isolator to separate the fractions into particles greater than 250 microns, known as coarse particulate organic matter (cPOM); between 53 and 250 microns, the micro-aggregated sized fraction; and less than 53 microns, fine silt or clay. We further processed the fractions to separate different kinds of particulate organic matter (POM) and then measured the isotope composition for all the fractions in order to determine which fraction retains the signature of past land use.
Light fractions of POM indicate recent C input with depleted isotope value and no clear trend through the depth of soil layers. The silt and clay fraction shows the memory of past C4 agriculture land use in the 5-15 cm layer, which signals a clear trend differentiated by past land use.
We also wanted to determine what influences the differences in SOM distribution. C content decreases slightly at deeper soil depths and with forest age. In the mature forest, the decrease in C content from 0-5 cm depth to the deeper soil at 10-15 cm is dramatic with a clear boundary between O, A and B horizon. In the younger forest, the transaction is much vaguer due to the continuous mixing by high earthworm activity.
We find a much larger difference in the C/N ratio within the five different fractions in the mature forest. We wanted to know whether the difference is due to earthworm activity or because there is less disturbance from past land use. Looking at SOM distribution inside and outside of micro-aggregates, we found that the C proportion rises with increased earthworm activity. We also compared SOM distribution between protected and unprotected SOM and found that increased C proportion is protected with increased earthworm activity. .
The results of this soil survey give us a preliminary conclusion that earthworm activity may have a strong influence on the dif-ferent distribution of SOM through all the fractions. To further test this idea we established eight field sites encircled by PVC rings and added wood and leaf amendments to those rings for six years. The amendment experiment will allow us to deter-mine whether the differences in SOM distribution are driven by earthworm activity or by past land use. This trial will also help us understand the capacity of those forests to sequestrate and stabilize future C input as SOM.
Preliminary results from the amendment experiments show that, for the leaf amendments, more organic matter input is incorporated into the silt and clay fraction, while for the wood amendments, more organic matter is incorporated into the POM fractions, especially in the younger forests. There was a nearly 80 percent increase of C content in the inter-aggregate
POM (iPOM). Is this difference because of the different chemistry of the wood and leaf amendments or because of the different mi-croenvironment in the earthworm gut? In the future will be try to answer this question using chemical and biological approaches.
In conclusion, we have found so far that the signature of past land use stays in the soil for at least seven years, primarily in the silt and clay fraction. In addition, earthworm activity promotes the ecosystem relaxation process after disturbance from past agriculture land use by incorporating fresh organic matter input from the surface into the mineral soil. Finally, earthworms increase the capacity of the ecosystem to stabilize OM input into the micro-aggregated fraction, for example the silt and clay and the iPOM fraction. We are using lignin chemistry, molecular biology, and other approaches to further test and strengthen our conclusions.
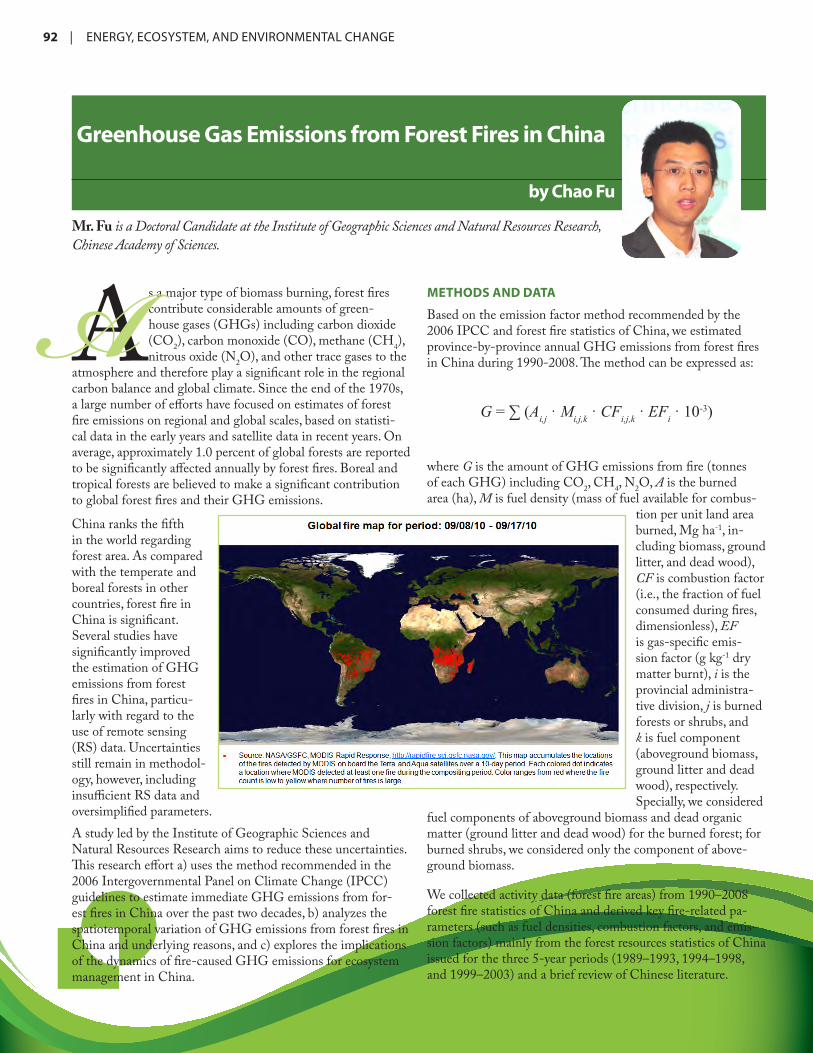
92 | ENERGY,ECOSYSTEM,ANDENVIRONMENTALCHANGE
Greenhouse Gas Emissions from Forest Fires in China
by Chao Fu
As a major type of biomass burning, forest fires contribute considerable amounts of green-house gases (GHGs) including carbon dioxide (CO2), carbon monoxide (CO), methane (CH4), nitrous oxide (N2O), and other trace gases to the
atmosphere and therefore play a significant role in the regional carbon balance and global climate. Since the end of the 1970s, a large number of efforts have focused on estimates of forest fire emissions on regional and global scales, based on statisti-cal data in the early years and satellite data in recent years. On average, approximately 1.0 percent of global forests are reported to be significantly affected annually by forest fires. Boreal and tropical forests are believed to make a significant contribution to global forest fires and their GHG emissions.
China ranks the fifth in the world regarding forest area. As compared with the temperate and boreal forests in other countries, forest fire in China is significant. Several studies have significantly improved the estimation of GHG emissions from forest fires in China, particu-larly with regard to the use of remote sensing (RS) data. Uncertainties still remain in methodol-ogy, however, including insufficient RS data and oversimplified parameters.A study led by the Institute of Geographic Sciences and Natural Resources Research aims to reduce these uncertainties. This research effort a) uses the method recommended in the 2006 Intergovernmental Panel on Climate Change (IPCC) guidelines to estimate immediate GHG emissions from for-est fires in China over the past two decades, b) analyzes the spatiotemporal variation of GHG emissions from forest fires in China and underlying reasons, and c) explores the implications of the dynamics of fire-caused GHG emissions for ecosystem management in China.
METHODS AND DATA
Based on the emission factor method recommended by the 2006 IPCC and forest fire statistics of China, we estimated province-by-province annual GHG emissions from forest fires in China during 1990-2008. The method can be expressed as:
G = ∑ (Ai,j · Mi,j,k · CFi,j,k · EFi · 10-3)
where G is the amount of GHG emissions from fire (tonnes of each GHG) including CO2, CH4, N2O, A is the burned area (ha), M is fuel density (mass of fuel available for combus-
tion per unit land area burned, Mg ha-1, in-cluding biomass, ground litter, and dead wood), CF is combustion factor (i.e., the fraction of fuel consumed during fires, dimensionless), EF is gas-specific emis-sion factor (g kg-1 dry matter burnt), i is the provincial administra-tive division, j is burned forests or shrubs, and k is fuel component (aboveground biomass, ground litter and dead wood), respectively. Specially, we considered
fuel components of aboveground biomass and dead organic matter (ground litter and dead wood) for the burned forest; for burned shrubs, we considered only the component of above-ground biomass.
We collected activity data (forest fire areas) from 1990–2008 forest fire statistics of China and derived key fire-related pa-rameters (such as fuel densities, combustion factors, and emis-sion factors) mainly from the forest resources statistics of China issued for the three 5-year periods (1989–1993, 1994–1998, and 1999–2003) and a brief review of Chinese literature.
Mr. Fu is a Doctoral Candidate at the Institute of Geographic Sciences and Natural Resources Research, Chinese Academy of Sciences.A

ENERGY,ECOSYSTEM,ANDENVIRONMENTALCHANGE | 93
TRENDS AND SPATIAL DISTRIBUTION Between 1990 and 2008, there is a general upward trend of fire affected areas, and a striking upward trend in the total number of fires. The total GHG emission was calculated according to GWP (Global Warming Potential) on the level of 100 years, that is, 1 CH4-equivalent(eq.) = 25 CO2-eq., 1 N2O-eq. = 298 CO2-eq. GHG emissions from forest fires in China exhibited a downward and then upward trend in last two decades. The average annual GHG emission was 8.606 Tg CO2-eq. during the period 1990–2008. Specifically, it was 5.741 Tg CO2-eq. during 1990–2000 and 12.544 Tg CO2-eq. during 2001–2008. This trend mainly resulted from the excessive GHG emissions in the years 1991, 2003, and 2006.
There was a relatively stable trend of annual emission densities of GHGs from forest fires in China, which averaged 35.0 Mg CO2-eq. ha-1 during 1990–2008. According to our estimates, annual emission intensities of burned forests and burned shrubs were 59.7 Mg CO2-eq. ha-1 and 15.4 Mg CO2-eq. ha-1, respec-tively, during 1990–2008. On the national scale, changes in the areas of burned forestlands and burned shrublands resulted in the fluctuation of GHG emission densities from forest fires.
We also analyzed the variations of average annual GHG emis-sions during 2001–2008 compared to those during 1990–2000 by province. Since 2001, the average annual GHG emissions from forest fires in most provinces had decreased, while those in Inner Mongolia and Heilongjiang significantly increased. Considering the slight increase in forest biomass density in most regions of China, the reduced fire areas and emissions suggest the effectiveness of fire control in forest ecosystems in most regions. The increases in average annual GHG emis-sions and average emission densities in Inner Mongolia and Heilongjiang since 2001 were attributable to the substantial increase in annual fire-affected areas, which resulted from the increase in large and extremely large fires.
In the northeast of Inner Mongolia and the west of Heilongji-ang, where Daxing’anling Forest Reserve is situated, forests are extremely susceptible to fires. A Natural Forest Conser-vation Program has been continuously implemented in the
Daxing’anling Forest Reserve since 1998 to reduce forestry production. As a result, the possibility of human-caused fires has decreased. The increase in GHG emissions from forest fires in these two provinces is thus due primarily to extreme me-teorological conditions, which changed the fire regime of the forests. Nevertheless, the cause-and-effect relationship between forest fires and global climate change in Daxing’anling forest area needs further study.
A comparison of satellite and statistical data of forest fire area reveals disparities in the estimates of burned area, which is the main source of the uncertainty of results. We inferred that the statistical results of forest fires may better reflect the influence of human activities on forest fires, and the remote sensing data should be geographically validated in future applications.
IMPLICATIONSFrom the perspective of GHG emissions, this study has impor-tant implications for ecosystem fire management in China. • Ecosystem management can play a significant role in miti-
gating GHG emissions from forest fires. Measures, such as prescribed burning, thinning, and establishment of buffer zones (or defensible space), can effectively reduce GHG emissions and emission densities during forest fires.
• Strengthening of fire control and monitoring in forests can reduce the ratio of burned forest area to fire-affected area, leading to decreases in total GHG emissions.
• Fire control and monitoring should be strengthened in particular years as predicted by the relations of fire frequency and weather pattern (such as hot and dry years). This, how-ever, needs long-term study.
• Ecosystem preservation policy should have an explicit fire management component.
In a word, a comprehensive management system that integrates fire monitoring, control, and research is needed in China at the national scale. Criteria for sustainable forest fire management should be region/climate-specific if possible.

94 | ENERGY,ECOSYSTEM,ANDENVIRONMENTALCHANGE

Rene
wab
le E
nerg
y an
d
Emis
sion
Red
uctio
n
96 | ENERGY,ECOSYSTEM,ANDENVIRONMENTALCHANGE
Renewable Energy Policy and its Potential for Emission Reduction in China
by Lei Shen
China is the second largest consumer of energy and the largest importer of oil globally, and growth in demand is well above expectations. As a result, there are shortages in generation capac-ity and transportation bottlenecks.
Energy consumption is expected to double by 2020. The transportation market is exploding, and the energy intensity per unit of gross domestic product is high. Energy efficiency is improving, but not fast enough. In addition, environmental degradation has become the focus of national attention, and remediation has been set as a high priority. The director of the United Nations Environmental Programme has said that China’s economic goals are “environmentally unachievable” due to resource constraints. The Chinese government recently announced a massive capacity expansion program to meet growing energy demand while reducing the impact of growth on the environment.
CAPACITY EXPANSIONChina is still highly dependent on coal, which represents 70 percent of the country’s energy mix. Oil and gas resources are limited. The Chinese government is looking to diversify the en-ergy supply for economic, environmental, and security reasons.
There is a huge need for new energy resources to feed economic growth and ensure economic security. This effort will require diversification from traditional fossil fuels. In addition, there is increasing environmental awareness in China and concern over the country’s contribution to global climate change. At the same time, China’s central government has resolved to eradicate poverty, realize all-around well-being, and ensure food security. To meet these diverse goals, the county needs increasing local-ization of world class, renewable energy technology capabilities, especially wind and photovoltaic (PV) power.
There are a number of clean and renewable energy technolo-gies available, including solar thermal, solar PV, geothermal, wind, biomass power, and biofuels, and the global forecast for renewable energy in the medium term—by 2020—projects steady demand for these alternative technologies. Globally, the market growth for solar PV projects between 2003 and 2013 is projected to rise from 39 million RMB in 2003 to 255 million RMB in 2013 ($1.00 = 8.27 RMB), and market growth for
wind power is expected to rise from 62 million RMB to 394 million RMB.
RENEWABLE ENERGY IN CHINAThe National Development and Reform Commission (NDRC) of China has created an energy bureau to include renewable energy in the national energy strategy. The goal is to increase renewable energy capacity to 100 gigawatts (GW) by 2020, about 10 percent of total capacity, including 20 GW from wind, 50 GW from small hydro, 1-2 GW from solar PV, 15 GW from biomass, and 14 GW from other sources.
China already has a large and well developed hydro capacity, which continues to growth. The National People’s Congress has agreed to issue a renewable energy promotion law. A draft is being developed by the Center for Renewable Energy Devel-opment, Tsinghua University, and other partners under NDRC leadership.
WIND POWERAt the international level, wind power is the fastest growing, grid-connected, electricity generating resource, accounting for more than 25 percent per year for the last 10 years. At the end of 2003, there were 40 GWs of total global installed capacity, and wind is expected to be an important contributor to the North American and European electricity supply. Germany, for example, produces about 5 percent per year of its electricity with wind, and Denmark about 20 percent.
In China, 567 megawatts (MW) of wind power capacity were installed by the end of 2003. The total potential for on-shore wind energy resources in China is greater than 253,000 MW. Concession Projects have been won for 600 MW of wind power during 2003 and 2004. China’s new renewable energy law and policy support have set off an investment rush similar to what Germany, Spain and some other countries have expe-rienced.
SOLAR PHOTOVOLTAICInternationally, solar PV has grown at a rate of about 30 per-cent for the last 10 years. Total sales last year were about 500 MW, but this is expected to double every 2.5 years. Shell and BP are leaders in solar PV, as they view this technology as an important and profitable technology during the 21st century. Industry focus is now on driving costs down via mass produc-tion and improved technologies.
Dr. Shen is a Resource Economist, Secretary General of the China Society of Natural Resources, and Deputy Director of the Department of Natural Resources and Environmental Security with the Institute of Geographic Sciences and Natural Resources Research, Chinese Academy of Sciences. C
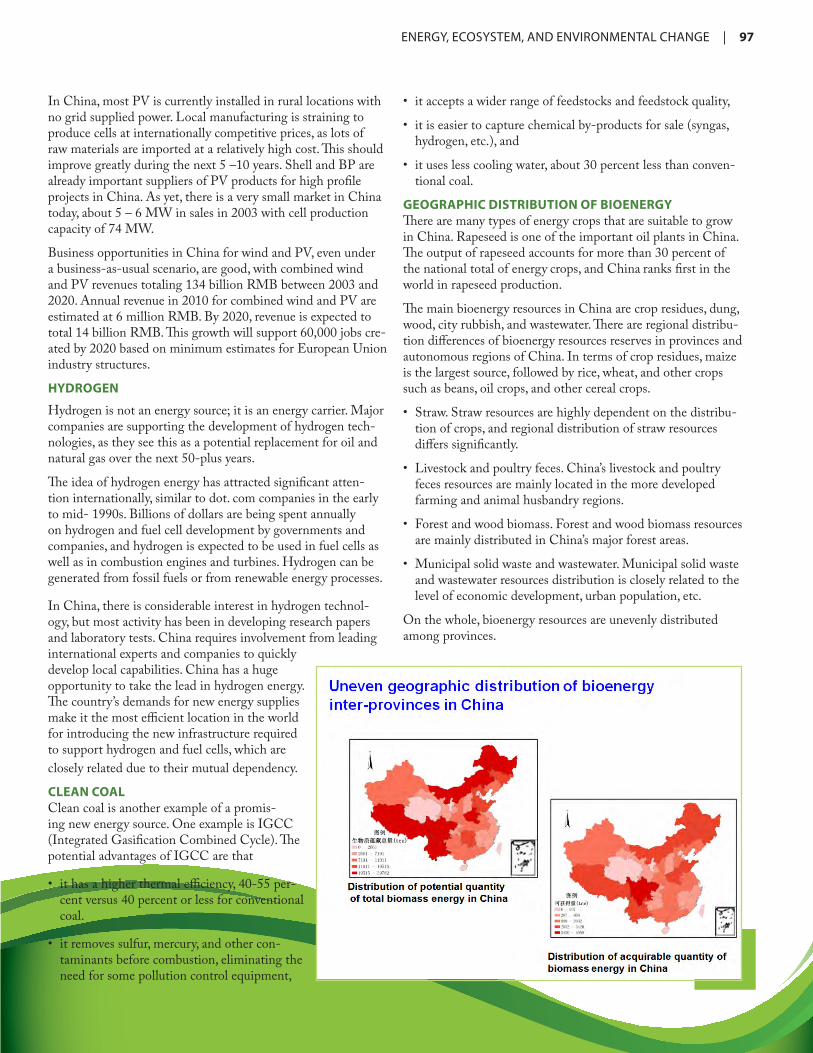
ENERGY,ECOSYSTEM,ANDENVIRONMENTALCHANGE | 97
In China, most PV is currently installed in rural locations with no grid supplied power. Local manufacturing is straining to produce cells at internationally competitive prices, as lots of raw materials are imported at a relatively high cost. This should improve greatly during the next 5 –10 years. Shell and BP are already important suppliers of PV products for high profile projects in China. As yet, there is a very small market in China today, about 5 – 6 MW in sales in 2003 with cell production capacity of 74 MW.
Business opportunities in China for wind and PV, even under a business-as-usual scenario, are good, with combined wind and PV revenues totaling 134 billion RMB between 2003 and 2020. Annual revenue in 2010 for combined wind and PV are estimated at 6 million RMB. By 2020, revenue is expected to total 14 billion RMB. This growth will support 60,000 jobs cre-ated by 2020 based on minimum estimates for European Union industry structures.
HYDROGEN
Hydrogen is not an energy source; it is an energy carrier. Major companies are supporting the development of hydrogen tech-nologies, as they see this as a potential replacement for oil and natural gas over the next 50-plus years.
The idea of hydrogen energy has attracted significant atten-tion internationally, similar to dot. com companies in the early to mid- 1990s. Billions of dollars are being spent annually on hydrogen and fuel cell development by governments and companies, and hydrogen is expected to be used in fuel cells as well as in combustion engines and turbines. Hydrogen can be generated from fossil fuels or from renewable energy processes.
In China, there is considerable interest in hydrogen technol-ogy, but most activity has been in developing research papers and laboratory tests. China requires involvement from leading international experts and companies to quickly develop local capabilities. China has a huge opportunity to take the lead in hydrogen energy. The country’s demands for new energy supplies make it the most efficient location in the world for introducing the new infrastructure required to support hydrogen and fuel cells, which are closely related due to their mutual dependency.
CLEAN COALClean coal is another example of a promis-ing new energy source. One example is IGCC (Integrated Gasification Combined Cycle). The potential advantages of IGCC are that
• it has a higher thermal efficiency, 40-55 per-cent versus 40 percent or less for conventional coal.
• it removes sulfur, mercury, and other con-taminants before combustion, eliminating the need for some pollution control equipment,
• it accepts a wider range of feedstocks and feedstock quality,
• it is easier to capture chemical by-products for sale (syngas, hydrogen, etc.), and
• it uses less cooling water, about 30 percent less than conven-tional coal.
GEOGRAPHIC DISTRIBUTION OF BIOENERGYThere are many types of energy crops that are suitable to grow in China. Rapeseed is one of the important oil plants in China. The output of rapeseed accounts for more than 30 percent of the national total of energy crops, and China ranks first in the world in rapeseed production.
The main bioenergy resources in China are crop residues, dung, wood, city rubbish, and wastewater. There are regional distribu-tion differences of bioenergy resources reserves in provinces and autonomous regions of China. In terms of crop residues, maize is the largest source, followed by rice, wheat, and other crops such as beans, oil crops, and other cereal crops.
• Straw. Straw resources are highly dependent on the distribu-tion of crops, and regional distribution of straw resources differs significantly.
• Livestock and poultry feces. China’s livestock and poultry feces resources are mainly located in the more developed farming and animal husbandry regions.
• Forest and wood biomass. Forest and wood biomass resources are mainly distributed in China’s major forest areas.
• Municipal solid waste and wastewater. Municipal solid waste and wastewater resources distribution is closely related to the level of economic development, urban population, etc.
On the whole, bioenergy resources are unevenly distributed among provinces.
98 | ENERGY,ECOSYSTEM,ANDENVIRONMENTALCHANGE
Bioenergy is a vital provider of energy demands in remote areas of China where it plays a crucial role in meeting their demands for energy. The western and central areas have a significant potential capacity for bioenergy. These areas require relatively lower energy than the eastern area, but they are the most pros-perous bioenergy producing regions in the country.
MARKET STATUSThere are three technological approaches to bioenergy: green, red, and white. Green biotechnology is agricultural, red biotechnology is pharmaceuticals and medicine, and white bio-technology is industrial uses. At present, bioenergy resources in China are used mainly by conventional combustion technolo-gies. Biomass gasification, biomass liquefaction, and biomass power generation technologies are gradually being developed. Currently the main technologies developed and in use are etha-nol fuel technology and bio-oil technology.
Much of industrial biotechnology focuses on converting biomass into bioenergy, biochemicals, biomaterials, etc. Many assume the biomass will be there when needed in plentiful amounts at reasonable prices. This has not been the case for bio-electricity. Agricultural and forestry wastes have become scarce and expensive. Moreover, in India and China, biomass power plants are closed or running at partial capacity because of the lack of biomass
POTENTIAL FOR EMISSIONS REDUCTIONSA comparison of energy crops shows great variations in yield as measured in dry metric tons per hectare. Giant King Grass, which has the highest mass, energy, and financial yields, is grown in tropical and subtropical regions with two or more harvests per year. Switchgrass and Miscanthus are grown in temperate regions. Jatropha and Palm Oil are grown in tropi-cal and subtropical regions. The grasses are suitable for direct combustion, bio-methane production, and cellulosic biofuels such as ethanol. Jatropha and Palm Oil are used for bio-diesel. All of these biomass crops are needed.
Biomass is a low carbon fuel. Biomass energy is solar energy and carbon dioxide (CO2) captured in plants by photosynthesis. Burning biomass or biofuels simply recycles the CO2 stored by the plant. Biomass is carbon neutral except that fertilizer, har-vesting, and transportation costs contribute a certain amount of CO2.
In comparing biomass, solar, and wind, there are differences in addition to cost among them. Photovoltaic technologies depend on sufficient sunlight and therefore need backup on the grid. Likewise, wind technologies relying on intermittent winds need grid backup. Biomass and coal technologies can operate 24/7. Vinod Khosla, co-founder of Sun Microsystems, recently said that “without a significant decline in the cost of storage, the intermittency and unreliability of wind and PV prevents them from meeting the needs of base-load power generation.”
In comparing costs, coal is the cheapest fuel. Most electricity is produced from coal, but so are CO2 and other pollutants. Bio-mass is next cheapest, and it has near zero net CO2 emissions. In addition to generating electricity, biomass also produces cel-lulosic biofuels. Natural gas is next cheapest and is the cleanest fossil fuel. Oil is by far the most expensive.
Using the total exploitable annual capacity of bioenergy, China can reach the goals set by the NDRC for 2010 to substantially reduce emissions of CO2 for 2010 using crop stalks, livestock and poultry manure, firewood and wood bioenergy, and munici-pal solid waste and wastewater.
In sum, China has rich bioenergy resources and great develop-ment potential to utilize them. The geographical distribution and quantity of bioenergy resources depend mainly on the rela-tionship between agricultural zones and the climate conditions. Bioenergy, which is in its growth stage, has many advantages; the costs are feasible and the yields are high, it is a low-carbon fuel, and it has great potential for CO2 remissions reductions.

ENERGY,ECOSYSTEM,ANDENVIRONMENTALCHANGE | 99
The Global Sustainable Bioenergy Project: Reconciling Large-Scale Bioenergy Production with Social and Environmental Concerns
by Keith Kline on behalf of the GSB Organizing CommitteeMr. Kline is a Senior Researcher in the Climate Change Science Institute and Center for Bioenergy Sustainability, Environmental Sciences Division, Oak Ridge National Laboratory. Keith has been an active participant in the development of the Global Sustainable Bioenergy Project.
The Global Sustainable Bioenergy (GSB) Project was initiated in 2009 by a group of researchers from across the globe with a common objective of providing guidance with respect to the feasibility and desirability of sustainable, bioenergy futures.
Lee Lynd, a distinguished professor in Environmental Engi-neering Design at Dartmouth College who was active in GSB formation, likes to refer to the project as an effort to gracefully reconcile large-scale bioenergy production with other compet-ing demands. To date, the GSB initiative has held five conti-nental conventions to discuss global sustainability and identify potential collaborators. Each convention concluded with a reso-lution by the participants that summarized their perspective on the potential of bioenergy to make significant contributions while acknowledging region-specific opportunities, constraints, needs and priorities.
This presentation is based in large part on a project overview (see the GSB website for links to this and other presentations from continental conventions: http://engineering.dartmouth.edu/gsbproject/) in which Dr. Lynd frames the issues in a broad historical perspective. Major societal transformations have oc-curred as humans went from a hunting and gathering society, to a pre-industrial agricultural society, to the present: the pre-sustainable, industrial age. Twice in history, major changes in the resources used by humanity have resulted in transfor-mative changes in day-to-day life and societal organization, appropriately called revolutions: the agricultural revolution that occurred slowly between 4000 and 2000 BC, and the industrial revolution about 1750 AD, which also moved fairly slowly around the world. At the time of the agricultural revolution, the world’s population of groups of hunter/gatherers was small, about 50 million people. The transition took place over a long time frame, measured in millennia. During the preindustrial agricultural revolution, people gathered into farms and villages, and the transition occurred over several centuries. During the current, pre-sustainable industrial age, society is organized at the scale of cities, countries, and states.
Today, with the world’s population at about 7 billion people organized societally at the global scale, there are abundant indications that a third revolution is required, a sustainability revolution. This revolution is the defining challenge of our time. There are more people, less time, and therefore larger risks for
humanity than at any previous time in history. Therefore, it is critical to start now and try to make the sustainability trans-formation as smooth and painless as possible. This revolution is not just about bioenergy, it is about human welfare and the fate of future generations on our planet. THE SUSTAINABILITY REVOLUTIONOur circumstances are changing radically. In the past there were relatively few resource constraints and plenty of resource capital compared to human demands. We now appear to be racing to exhaust our natural resource capital. In the future, there will be multiple and increasing constraints on resources we currently take for granted.
Big systemic challenges require big systemic solutions. Viable paths to a more sustainable world will require large, multiple, complementary—and currently improbable—changes. Because our current trends are not sustainable, we will need to embrace the improbable. Business as usual cannot persist; it is not a re-alistic baseline. The first step in realizing currently improbable futures is to show that they are possible.
To fulfill human needs, sustainable resources such as sunlight, wind, ocean/hydro, nuclear, geothermal, and minerals can be converted into primary and secondary intermediates. Primary intermediates are biomass and electricity. Secondary interme-diates are livestock, organic biofuels, hydrogen, and batteries. Human needs include food, electrical energy, heat, transporta-tion, and organic and inorganic materials. The only foreseeable source for sustainable food, fuels, and materials from organic bases is biomass. Biomass therefore plays a central and essential role in a sustainable world.
There are other reasons for interest in bioenergy.
• Economic security and rural economic development: Bioen-ergy production could provide needed new markets for rural communities in both the developed and developing world.
• Energy security: Capacity for much more diversified and broadly distributed resources compared to dwindling fossil energy supplies.
• Cellulosic biomass is particularly promising among bio-energy feedstocks due to a) its potential for low cost and multiple scales, small to large; b) its environmental advan-
T

100 | ENERGY,ECOSYSTEM,ANDENVIRONMENTALCHANGE
tages in reducing waste, increasing utilization, and improving sustainability.
• Potential to significantly lower greenhouse gas emissions (GHG): Bioenergy production and utilization cycles begin with removing CO2 from the atmosphere. Properly managed and produced, bioenergy feedstock offers significant reduc-tions in GHG emissions compared with fossil fuel alterna-tives.
Notwithstanding the potential, realization of large-scale cel-lulosic bioenergy production is impeded by two key factors: 1) the recalcitrance of cellulosic biomass, or difficulty of convert-ing cellulosic biomass to reactive intermediates such as sugars or syn-gas, issues that can be addressed by improved processing technology; and 2) land use concerns, which are wide ranging and include competition with food supplies, carbon emissions and habitat loss from clearing of wild lands, sustainability of production systems, and the question whether we can produce enough biomass to meaningfully affect “mega challenges.” The second point, land use concerns, is the focus of the GSB project.
GLOBAL BIOENERGY POTENTIALThe first question we ask is whether biofuel production is com-patible with other land uses and social requirements for food security and environmental services. Africa has 12 times the land area of India with similar quality of land and 30 percent fewer people. Yet India feeds itself, and Africa does not. The green revolution largely bypassed Africa due to serious organi-zational and institutional weaknesses.
There are strong and popular negative assessments about the potential for bioenergy. In 2007, a United Nations’ special rap-porteur, Jean Ziegler, said that it is “a crime against humanity to convert agricultural productive soil into soil . . . which will be burned for biofuel.” However, for every negative argument there is an alternative perspective, pointing out, for example, that it is a crime to keep people impoverished by not providing them access to markets and the opportunities to use extensive fallow lands to produce multi-purpose crops including bioen-ergy.
When considering food security (and the social, institutional, and poverty-related issues that largely govern food insecurity), we must ask if, when, and how the development of biofuels could be part of the solution rather than part of the problem. This requires a deep understanding of the true nature of the problem which in turn is context-specific (time and place). However, generally speaking, wealthy people have access to food, and hungry people lack monetary wealth. In many places, food insecurity is a problem of poverty, distribution, and rural development. Years of development experience suggest that solutions involve better governance and better education, particularly related to sustainable agricultural practices, efficient use of land, soil, and water resources. Biofuels “done right” can improve rural employment, rural markets, and build capacities for improving land management over time.
On the other hand, there is also potential for bioenergy to be “done wrong” and to become integrated with underlying problems of corruption, inequality, and disenfranchisement of rural poor. On the positive side, bioenergy policies have helped bring more attention and transparency to many historic nega-tive practices. And some countries are using bioenergy to help create incentives to make improvements in rural productive sectors that previously relied on less sustainable practices and industries ranging from sugar to palm oil.
Factors that contribute to food insecurity were described by Roger Thurow and Scott Kilman in their book, “Enough: Why the World’s Poor Starve in an Age of Plenty.” This is one of several sources that note that as much as 40-50 percent of all the edible food grown in the world ends up as waste rather than dinner. Yet we have almost a billion people undernour-ished on Earth today. In addition to poverty, lack of marketable skills, low currency value, market failures, poorly developed ag-ricultural infrastructure and volatile food prices, food insecurity has also been exacerbated by “food aid.” Decades of food dona-tions have undermined local incentives for production based on highly subsidized foreign imports. Economic analyses of the effects of bioenergy on food security to date have mostly been conducted quickly in response to a crisis and relied on models and unverified assumptions. The issue of food security merits more comprehensive study and systematic analysis of data to identify the interactions of the various market incentives and influences of diversification of products and markets on investment incentives and price volatility. Rocio Diaz-Chavez and colleagues recently published a study on food security and bioenergy, concluding that “bioenergy is not only compatible with food production; it can also benefit agriculture in Africa.”
The case of sugar cane in Brazil has been widely cited as a model for sustainable bioenergy. This first generation bioenergy crop has been highlighted as a good model in Brazil, but it may not work everywhere since sugar cane’s range is limited. Moreover, it is not the crop per se, e.g. sugar cane in itself, that provides a solution. Studies have shown that sugar cane biofuels in some contexts could consume more energy than is produced from the ethanol, depending on how the crop is grown and processed. It is important to understand the details of how operations have been able to achieve very high efficiencies and flexibility in markets and products.
There is currently an emphasis on second generation bioen-ergy crops such as cellulosic biomass. Research is underway to achieve a lower cost conversion. Algae is also in the spotlight as a potential bioenergy crop, but for now, there is little data available for any commercial scale operations and bringing costs down will be difficult and depend largely on non-fuel co-products. Different approaches will be more or less appropriate depending on context. There is interest in developing land-use plans and systems approaches whereby land productivity and environmental services can be improved simultaneously at a landscape scale, based on better management and rotations of diverse crops for multiple uses and markets.
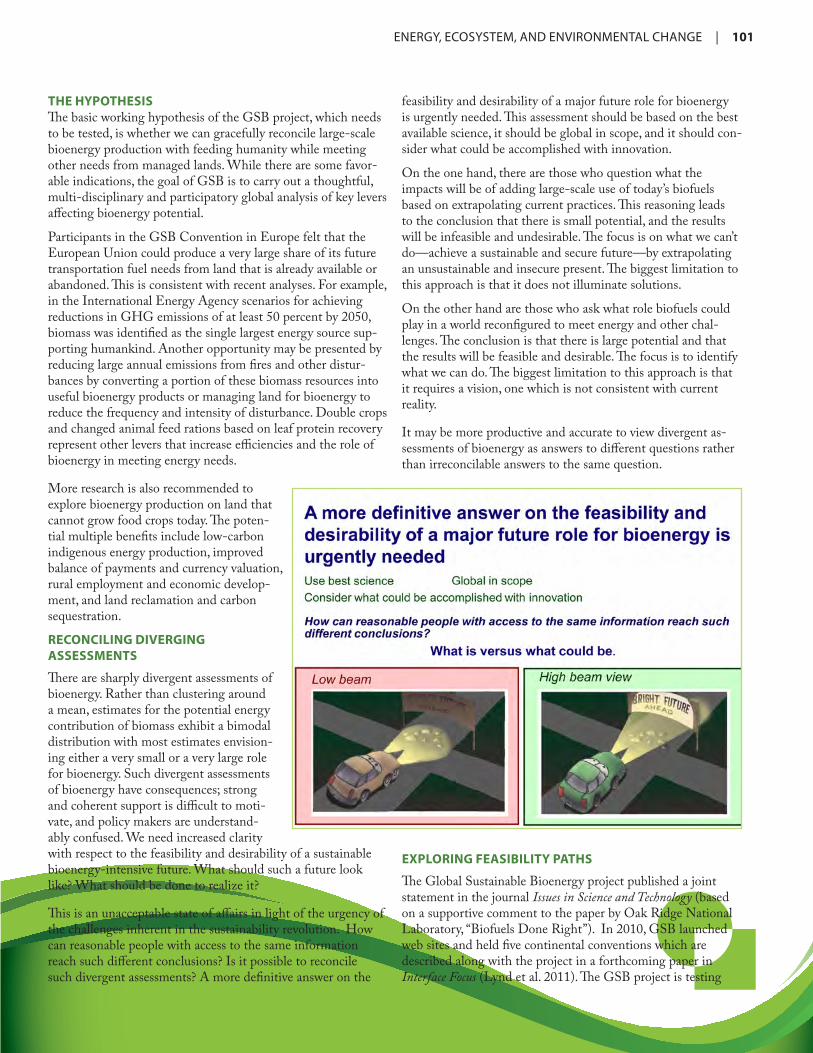
ENERGY,ECOSYSTEM,ANDENVIRONMENTALCHANGE | 101
THE HYPOTHESISThe basic working hypothesis of the GSB project, which needs to be tested, is whether we can gracefully reconcile large-scale bioenergy production with feeding humanity while meeting other needs from managed lands. While there are some favor-able indications, the goal of GSB is to carry out a thoughtful, multi-disciplinary and participatory global analysis of key levers affecting bioenergy potential.
Participants in the GSB Convention in Europe felt that the European Union could produce a very large share of its future transportation fuel needs from land that is already available or abandoned. This is consistent with recent analyses. For example, in the International Energy Agency scenarios for achieving reductions in GHG emissions of at least 50 percent by 2050, biomass was identified as the single largest energy source sup-porting humankind. Another opportunity may be presented by reducing large annual emissions from fires and other distur-bances by converting a portion of these biomass resources into useful bioenergy products or managing land for bioenergy to reduce the frequency and intensity of disturbance. Double crops and changed animal feed rations based on leaf protein recovery represent other levers that increase efficiencies and the role of bioenergy in meeting energy needs.
More research is also recommended to explore bioenergy production on land that cannot grow food crops today. The poten-tial multiple benefits include low-carbon indigenous energy production, improved balance of payments and currency valuation, rural employment and economic develop-ment, and land reclamation and carbon sequestration.
RECONCILING DIVERGINGASSESSMENTS
There are sharply divergent assessments of bioenergy. Rather than clustering around a mean, estimates for the potential energy contribution of biomass exhibit a bimodal distribution with most estimates envision-ing either a very small or a very large role for bioenergy. Such divergent assessments of bioenergy have consequences; strong and coherent support is difficult to moti-vate, and policy makers are understand-ably confused. We need increased clarity with respect to the feasibility and desirability of a sustainable bioenergy-intensive future. What should such a future look like? What should be done to realize it?
This is an unacceptable state of affairs in light of the urgency of the challenges inherent in the sustainability revolution. How can reasonable people with access to the same information reach such different conclusions? Is it possible to reconcile such divergent assessments? A more definitive answer on the
feasibility and desirability of a major future role for bioenergy is urgently needed. This assessment should be based on the best available science, it should be global in scope, and it should con-sider what could be accomplished with innovation.
On the one hand, there are those who question what the impacts will be of adding large-scale use of today’s biofuels based on extrapolating current practices. This reasoning leads to the conclusion that there is small potential, and the results will be infeasible and undesirable. The focus is on what we can’t do—achieve a sustainable and secure future—by extrapolating an unsustainable and insecure present. The biggest limitation to this approach is that it does not illuminate solutions.
On the other hand are those who ask what role biofuels could play in a world reconfigured to meet energy and other chal-lenges. The conclusion is that there is large potential and that the results will be feasible and desirable. The focus is to identify what we can do. The biggest limitation to this approach is that it requires a vision, one which is not consistent with current reality.
It may be more productive and accurate to view divergent as-sessments of bioenergy as answers to different questions rather than irreconcilable answers to the same question.
EXPLORING FEASIBILITY PATHS
The Global Sustainable Bioenergy project published a joint statement in the journal Issues in Science and Technology (based on a supportive comment to the paper by Oak Ridge National Laboratory, “Biofuels Done Right”). In 2010, GSB launched web sites and held five continental conventions which are described along with the project in a forthcoming paper in Interface Focus (Lynd et al. 2011). The GSB project is testing
102 | ENERGY,ECOSYSTEM,ANDENVIRONMENTALCHANGE
its working hypothesis and developing a vision for the future. Constraints include climate, which changes over time, and geographical and biophysical (non-management) determinants of soil quality. We maintain that resource quality must be main-tained or improved.
The vision is unconstrained by current trends and practices in land use, management, and ownership; production efficiency of food and bioenergy; and utilization efficiency of bioenergy. Many current trends are not consistent with paths toward a more sustainable future. In the context of a specified world view, GSB wants to ensure broad access to modern energy services and foster a willingness to innovate and change toward a more sustainable world. A sustainable bioenergy vision is responsive to the most pressing needs of poverty alleviation, economic development, food security, and ecosystem services. The vision incorporates local understanding of needs and aspi-rations, regional diversity, and a fundamental understanding of bioenergy feedstocks, conversion systems, and new technology.
The GSB hopes to focus efforts on key levers while complet-ing a comprehensive, global, and forward-looking analysis. In terms of resources issues, we seek a more definitive answer to the physical possibility of producing bioenergy on much larger scales consistent with our working hypothesis. Our analysis addresses not only if the working hypothesis can be confirmed but also how, anticipating that there may be multiple paths. The GSB is focused on consideration of transition paths and policy informed by global analysis. The project is not focused on processing technology and advocacy.
Bioenergy is only one of many components needed for a sustainable future. There is no single solution, no “silver bullet” that will work in all situations. However, energy efficiency and conservation—the principals of reduce, reuse, recycle—should always be considered at the top of the list.
In conclusion, the GSB maintains that large-scale biofuel production is possible by improving productivity on previously cleared and disturbed lands without disrupting food production or provoking indirect land use change. Moreover, double crops,
animal feed ration adjustments, and yields are three major “le-vers” to increase bioenergy production along with environmen-tal benefits. Effective levers create opportunities for productive collaborations between farmers, bioenergy producers, govern-ment agencies, and environmental interests in the United States, China, and elsewhere. The GSB Project welcomes contributions and participation form interested stakeholders in China and around the globe.
ENDNOTESAcknowledgements: The Center for Bioenergy Sustainability (CBES) and related research at Oak Ridge National Labora-tory (ORNL) are supported by the U.S. Department of Energy (DOE) under the Office of the Biomass Program and by U-T Battelle, LLC using the Lab-Directed R&D fund. Oak Ridge National Laboratory is managed by the UT-Battelle, LLC, for DOE under contract DE-AC05-00OR22725. This presentation made on behalf of GSB was made based on the contributions from GSB organizing committee members including Lee Rybeck Lynd, Thayer School of Engineering, Dartmouth College and Mascoma Corp.; Tom L. Richard, Pennsylvania State University; Carlos Enrique de Brito Cruz and Luis Alberto Cortez, FAPESP, Sao Paulo, Brazil; Andre Faaij, Copernicus Institute, Utrecht University, Netherlands; Jon Foley and John Sheehan, University of Minnesota; Jose Goldemberg, University of Sao Paulo, Brazil; Nathanael Greene, Natural Resources Defense Council; Reinhold Mann, Brookhaven National Lab; Ramlan Aziz, Universiti Teknologi Malaysia; Patricia Osseweijer, Delft University of Technology, Netherlands; August Temu and Miyuki Iiyama, World Agro-forestry Centre, Nairobi; Emile van Zyl and Annie Chimphan-go, University of Stellenbosch, South Africa; Jeremy Woods, Imperial College, London.
The GSB project is described in more detail in: Lynd L. R., et al.2011. A global conversation about energy from biomass: the continental conventions of the global sustainable bioenergy project. Interface Focus 1, 271–279. doi:10.1098/rsfs.2010.0047 (doi:10.1098/rsfs.2010.0047)

ENERGY,ECOSYSTEM,ANDENVIRONMENTALCHANGE | 103
Integrated Bioprocessing Technology of Lignocellulose for Production of Ethanol with Significant Energy Savings and Waste Reduction
by Jie Bao
Massive amounts of water and steam are consumed in the production of cellulosic ethanol, resulting in significant increases in energy costs, wastewater discharge, and overall production costs. At the State Key
Laboratory of Bioreactor Engineering of China, we have investigated experimentally and computationally a processing strategy with extremely low usage of water and steam. The goal is to cut the costs of cellulosic ethanol at the scale of industrial plants. The technology provides a simple and efficient process option for industrial application.
To reduce the costs of cellulosic ethanol production, it is neces-sary to reduce material costs, energy costs, and environmental costs during the process of converting biomass to the final products through fermentation and pretreatment. Material costs include feedstock and enzymes used to produce ethanol and chemical co-products. Energy costs are incurred during distillation, pretreatment, and simultaneous saccharification and fermentation (SSF). Environmental costs result from the treat-ment of waste water and solids residue.
PRETREATMENTWe have developed a new dilute sulfuric acid pretreatment of lignocellulose with extremely low water and steam usage. This dry pretreatment method focused on two important, but rarely acknowledged, operation parameters, the bioreactor filling ratio and the solid/liquid presoaking ratio. Other operation parameters can also be optimized during pretreatment. The treatment results in zero waste water emissions with no aque-ous, acid-containing water generation during the pretreatment operation, which significantly reduces the burden of treating large amounts of waste water. Hot steam usage is significantly reduced. Half of the pretreated material is dry solids matter, which means that the SSF process can be carried out with a high solids loading and low water usage.
BIODETOXIFICATIONThe harsh pretreatment of lignocellulose produces toxic com-pounds. To convert the pretreated lignocellulose to ethanol, a detoxification process is required. We have for the first time identified a kerosene fungus strain, Amorphotheca resinae ZN1, from the microbial community growing on pretreated corn stover material and characterized the growth behaviors of the strain. An efficient biological detoxification method to remove
the inhibitors in the pretreated lignocellulosic feedstock was developed and compared to the SSF of the pretreated corn stover materials using the dilute sulfuric acid pretreated corn. We also applied the method to different crop residues including corn stover, wheat straw, rice straw, cotton stalk, and rape straw.
SSFUnder the strong stress of high solids loading, high viscosity, and high inhibitors, we found that a) increasing the etha-nol titer in the fermentation broth is crucially important, b) increasing solids loading could significantly increase the mixing energy consumption, especially at extremely high solid loading and low enzyme dosage, c) extremely high solids, high viscosity, and high ethanol titer are associated with a significant reduc-tion of energy and wastewater costs.
With the newly developed bioprocessing technology of ligno-cellulose, process performance was improved significantly in the following aspects:
• Pretreatment: Extremely low water and steam usage in the dilute acid pretreatment of lignocellulose, with water and steam savings of 90 percent and zero generation of waste water comparied to the common dilute acid pretreatment.
• Detoxification: Biodetoxification of toxins generated from lignocellulose pretreatment using the newly isolated fungus Amorphotheca resinae ZN1 with zero energy cost and zero waste water generation
• SSF: High solids loading, high viscosity, and high inhibitors for high ethanol titer (7% w/w) with low stirring energy cost and zero fresh water usage
With the newly developed bioprocessing technology of ligno-cellulose, process performance will be improved significantly. There are significant reductions in the use of fresh water and generation of waste water in the pretreatment, detoxification, and SSF stages. Steam usage in the pretreatment and distilla-tion stages, and waste water usage in the pretreatment, detoxi-fication, and distillation stages, are significantly reduced. These improvements reduce overall costs of cellulosic ethanol pro-duction as a direct result of the new integrated bioprocessing technology for lignocellulose biomass. We are currently taking this new process technology from the laboratory to the indus-trial scale to the large-scale demonstration plant. A biorefinery
Dr. Bao is the Director of the Center for Biomass Energy Technology and Deputy Director of the State Key Laboratory of Bioreactor Engineering at East China University of Science and Technology.M
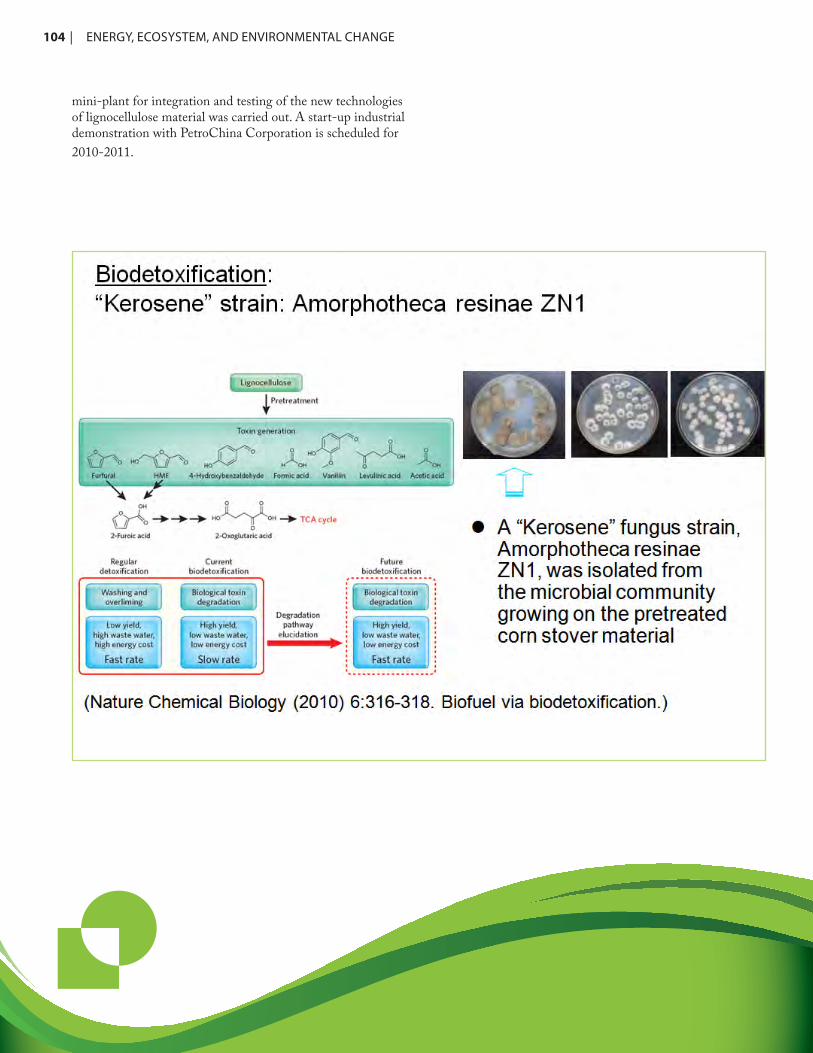
104 | ENERGY,ECOSYSTEM,ANDENVIRONMENTALCHANGE
mini-plant for integration and testing of the new technologies of lignocellulose material was carried out. A start-up industrial demonstration with PetroChina Corporation is scheduled for 2010-2011.
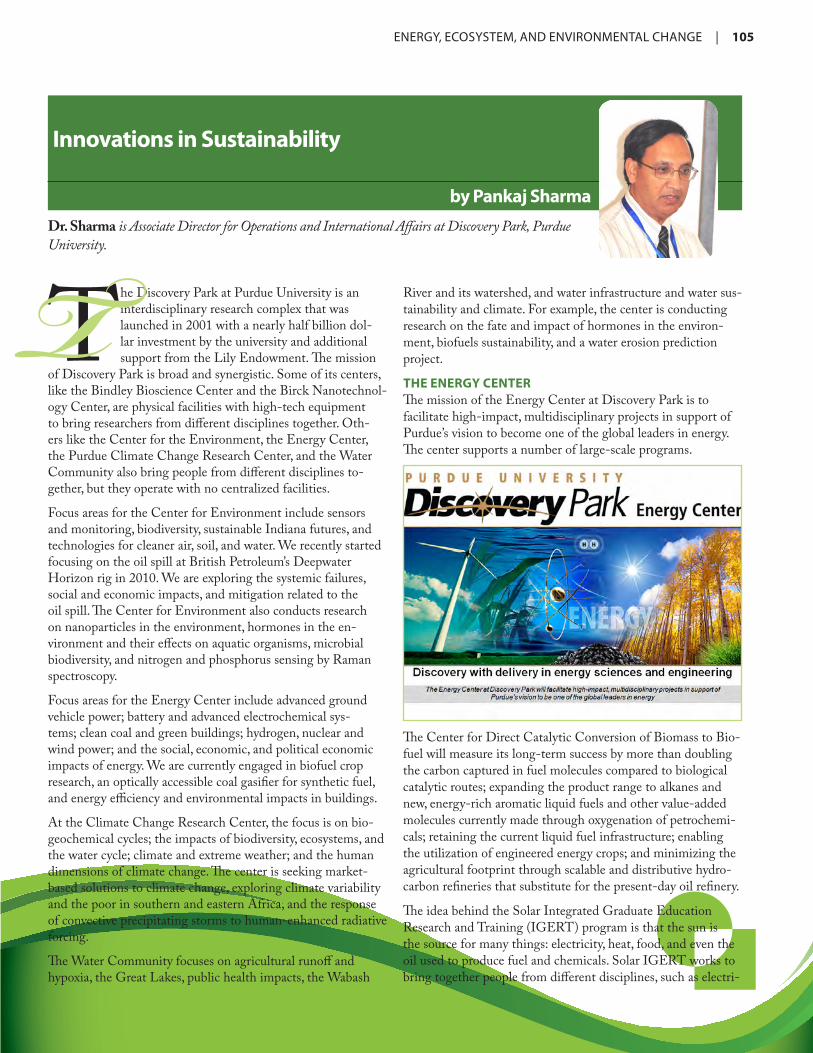
ENERGY,ECOSYSTEM,ANDENVIRONMENTALCHANGE | 105
Innovations in Sustainability
by Pankaj Sharma
River and its watershed, and water infrastructure and water sus-tainability and climate. For example, the center is conducting research on the fate and impact of hormones in the environ-ment, biofuels sustainability, and a water erosion prediction project.
THE ENERGY CENTERThe mission of the Energy Center at Discovery Park is to facilitate high-impact, multidisciplinary projects in support of Purdue’s vision to become one of the global leaders in energy. The center supports a number of large-scale programs.
The Discovery Park at Purdue University is an interdisciplinary research complex that was launched in 2001 with a nearly half billion dol-lar investment by the university and additional support from the Lily Endowment. The mission
of Discovery Park is broad and synergistic. Some of its centers, like the Bindley Bioscience Center and the Birck Nanotechnol-ogy Center, are physical facilities with high-tech equipment to bring researchers from different disciplines together. Oth-ers like the Center for the Environment, the Energy Center, the Purdue Climate Change Research Center, and the Water Community also bring people from different disciplines to-gether, but they operate with no centralized facilities.
Focus areas for the Center for Environment include sensors and monitoring, biodiversity, sustainable Indiana futures, and technologies for cleaner air, soil, and water. We recently started focusing on the oil spill at British Petroleum’s Deepwater Horizon rig in 2010. We are exploring the systemic failures, social and economic impacts, and mitigation related to the oil spill. The Center for Environment also conducts research on nanoparticles in the environment, hormones in the en-vironment and their effects on aquatic organisms, microbial biodiversity, and nitrogen and phosphorus sensing by Raman spectroscopy.
Focus areas for the Energy Center include advanced ground vehicle power; battery and advanced electrochemical sys-tems; clean coal and green buildings; hydrogen, nuclear and wind power; and the social, economic, and political economic impacts of energy. We are currently engaged in biofuel crop research, an optically accessible coal gasifier for synthetic fuel, and energy efficiency and environmental impacts in buildings.
At the Climate Change Research Center, the focus is on bio-geochemical cycles; the impacts of biodiversity, ecosystems, and the water cycle; climate and extreme weather; and the human dimensions of climate change. The center is seeking market-based solutions to climate change, exploring climate variability and the poor in southern and eastern Africa, and the response of convective precipitating storms to human-enhanced radiative forcing.
The Water Community focuses on agricultural runoff and hypoxia, the Great Lakes, public health impacts, the Wabash
Dr. Sharma is Associate Director for Operations and International Affairs at Discovery Park, Purdue University.T
The Center for Direct Catalytic Conversion of Biomass to Bio-fuel will measure its long-term success by more than doubling the carbon captured in fuel molecules compared to biological catalytic routes; expanding the product range to alkanes and new, energy-rich aromatic liquid fuels and other value-added molecules currently made through oxygenation of petrochemi-cals; retaining the current liquid fuel infrastructure; enabling the utilization of engineered energy crops; and minimizing the agricultural footprint through scalable and distributive hydro-carbon refineries that substitute for the present-day oil refinery.
The idea behind the Solar Integrated Graduate Education Research and Training (IGERT) program is that the sun is the source for many things: electricity, heat, food, and even the oil used to produce fuel and chemicals. Solar IGERT works to bring together people from different disciplines, such as electri-
106 | ENERGY,ECOSYSTEM,ANDENVIRONMENTALCHANGE
cal, mechanical, and agricultural engineering; chemistry and economics; and to provide training to graduate students across the university and create the next generation of energy scien-tists and engineers in multidisciplinary research.
One program of the Energy Center, funded in part by the Semiconductor Research Corporation, focuses on photovoltaic cells. There are six thrust areas for the photovoltaic program: the process and the materials scale, the device scale, and the characterization of the material, reliability, and systems. This program seeks to develop a software platform that will provide the modeling of process/device/reliability systems. The idea is to simulate the behavior of a photovoltaic device before fabrica-tion and evaluate the performance, cost, reliability, and manu-facturing challenges of producing solar cells.
The Electrical Vehicles program focuses more on the education side. This program, funded by the Indiana Advanced Vehicle Training and Education Consortium, aims to develop degree and certificate programs and produce web enabled courses. We have established a Smart Energy Hub partnership with other corporations, developed education models for the secondary schools, and formed an Electric Vehicle Grand Prix. In April 2010 we conducted a student competition for electric go-carts. By 2011, we want to expand this into a university-wide compe-tition and by 2012 a national competition.
INNOVATIONS AT PURDUEIn addition to the large programs underway at Purdue, the university is also tackling challenges to create new technologies that can be brought to the marketplace in the future with the assistance of start-up companies involved in the research.
Smart Wind. One of the challenges of harnessing wind en-ergy is that wind is highly variable. The cost of maintaining a wind turbine is very high compared to the cost of installation. Most conventional blades for wind turbines are flat, and there is a need to design efficient, cost effective, and reliable wind turbines. We have designed a curved blade that responds to dif-ferent forces when wind conditions change.
A professor of mechanical engineering, Douglas Adams, has launched an initiative to embed sensors into turbine blades. The force exerted on the blade can be monitored using computa-tional software, and the data analyzed continuously. Adams is trying to optimize sensor locations to determine deflection and distributed loading across the wind turbine rotor blade. This in-novation allows detection of early damage on the blades them-selves, improves reliability and reduces failures, and saves costs in maintenance and service interruption in the wind turbine.
Hydrogen on demand. One of the challenges related to hydro-gen as a fuel is its highly explosive nature and the difficulty of transporting and transferring it at high pressure. There is a need
for safe storage for an indefinite time. In addition, it is desir-able to produce hydrogen when you need it rather than store it indefinitely in a hydrogen gas state. An electrical engineer, Jerry Woodall, has created an alloy with 95 percent aluminum and 5 percent gallium. The alloy reacts with water to produce hydrogen gas. The gallium serves only as a catalyst and is not consumed in the reaction. The alloy can be used for industrial purposes or can be recycled back to aluminum. This innovation eliminates the necessity to store or transport hydrogen.
Yeast-based cellulosic ethanol. There are many different types of sugars, glucose, xylose, mannose, and galactose, for example. Cost-effective and efficient ethanol production from lignocel-lulosic materials requires fermentation of sugars. The wild type Saccharomyces cerevisiae strain rapidly ferments hexoses, but not the pentoses xylose and L-arabinose.
A chemical engineer at Purdue, Nancy Ho, has developed a gnetically engineered recombinant S. cerevisiae yeast to ef-ficiently ferment xylose and L-arabinose to ethanol. This yeast reduces the inhibitory effect of acetic acid by increasing the pH of media and achieves an improved yield, from 40 to 70 percent, for ethanol production from five sugars: glucose, galactose, mannose, xylose, and arabinose. This innovation will help develop cost-effective cellulosic ethanol from biomass as feedstock; produce other green chemicals/co-products from cellulosic biomass for the paper, fabric, and detergent industry; and provide an option to US farmers to co-produce cellulosic ethanol from corn.
Hydrogen fuel cell. One of Purdue’s chemical engineers, Arvind Varma, has been working to improve hydrogen fuel cells for cars. The improved efficiency of fuel cells will help meet US Department of Energy requirements that available hydrogen in fuel cell cars be more than 5.5 percent of the system weight and that vehicles be driven 350 miles before refueling. The improved technology can also be used to produce hydrogen for fuel cells to recharge batteries in portable electronics, notebook computers, cell phones and personal digital assistants, digital cameras, and handheld medical diagnostic devices and defibril-lators.
These are just a few of the major challenges and innovations that Purdue University is tackling. We support large programs to foster discovery, learning, and engagement; several major research centers; initiatives in environment, energy, climate, and water, biomass to biofuel, electric vehicles, and solar/pho-tovoltaics; and innovations in wind energy, fermentation, and hydrogen-production and storage. We want to see better, faster, and cheaper solutions to these multiple challenges. In the final analysis, market forces will determine our success.

ENERGY,ECOSYSTEM,ANDENVIRONMENTALCHANGE | 107
The Potentials of Next Generation Bio-Jet Fuels: A Multi-Agent Life Cycle Assessment Approach
by Fu ZhaoDr. Zhao is an Assistant Professor in the School of Mechanical Engineering and the Division of Environmental and Ecological Engineering at Purdue University, and the Director of the Sustainable Product Engineering Research (SuPER) Laboratory.
The aviation industry has set a goal to achieve car-bon neutral operations by 2020 and a 50 percent reduction of greenhouse gas (GHG) emissions by 2050 compared to the 2005 level. To reduce its carbon footprint, the industry has been seriously
considering jet fuels derived from bio-based feedstocks, or bio-jet fuels. The particular focus here is on bio-jet fuels from sources that do not compete with food production and water supply and that will not cause land use change.
Life Cycle Analysis (LCA) provides a sound basis to evaluate the overall environmental impacts of bio-jet fuels. However, LCA does not cover the economic and social aspects of the system in question. It is usually assumed that all stakeholders involved in all the life cycle stages have common interests and thus are cooperative. In reality, stakeholders have conflicting interests. Leaving the motivations and interests of these stake-holders out of consideration might be acceptable for technol-ogy evaluation but seriously limits the application of LCA to support policy making.
INDUSTRY TARGETAccording to the US Environmental Protection Agency’s 2010 Greenhouse Gas Emissions Inventory Report, emissions of carbon dioxide, methane, and nitrous oxide by the aviation industry, including commercial and other aircraft, represents a small but significant percentage of overall greenhouse gas emissions. Realistically, to achieve the goal of emissions reduc-tions with alternative fuels, the industry must factor in other important considerations such as fuel availability, fuel security, and fuel price.
The carbon footprint of typical jet fuel is greater than that of gasoline and somewhat less than that of diesel, and its com-position is different from that of gasoline and diesel fuel. The aromatic components of jet fuel account for up to 25 percent by weight. The industry needs replacement or “drop in” fuels, that is, fuels compatible with the current transportation infrastruc-ture. Traditional jet fuel consists of 70 to 85 percent paraffins, less than 25 percent aromatics, and less than 5 percent olefins. We already have methods to produce paraffins from biological feedstocks, plant oils, that are mixed at a 50 percent ratio with conventional fuel and are currently being used in engine testing and test flights.
Synthetic paraffin kerosene (SPK) can be produced with the same class of paraffinic compounds, whether the starting mate-rial is lignocellulosic biomass or bio-derived oil. For lignocel-lulosic biomass feedstock, gasification is followed by Fischer-Tropsch synthesis. The feedstock is first converted to syngas in a gasifier using air, oxygen, or steam as gasifying medium. The raw syngas has contaminants such as particulates, tar, ammo-nia, hydrogen sulfide, and hydrogen cyanide which have to be removed, along with carbon dioxide. The cleaned syngas is then conditioned to adjust H2:CO to about 2:1 through water-gas shifting reaction before being fed into a synthesis reactor. Using cobalt or iron based catalysts, a mixture of CO and H2 is con-verted to hydrocarbons of certain carbon chain length (called syncrude), which are in turn cracked into jet fuels and other co-products. For bio-derived oils, hydrotreating and hydro-cracking processes are used. Natural oils contain oxygen and have highe molecular weight than paraffins in jet fuels. The first reaction removes the oxygen to create a product consisting of waxy paraffins in the diesel range. The second reaction “cracks” the diesel paraffins to smaller, highly branched molecules. The end product is the same as molecules already present in aviation fuel and is the same no matter the starting oil.
MULTI-AGENT LCATo determine whether aviation fuel derived from bio-derived oil is actually greener than traditional aviation fuel, we need to perform a complete life cycle analysis (LCA). A common anal-ogy used to explain LCA is the choice consumers often make at the checkout line: paper or plastic. To answer this question, one has to compare the environmental impacts associated with paper bags or plastic sacks through their entire life cycle. This is not trivial even for such a simple case. To make a conclu-sion based on scientific evidence one needs to include all the lifecycle stages from raw materials all the way to the end of life treatment and disposal. Only after this can one make a claim or conclusion which is better.
For ground transportation we have a state-of-the-art LCA model for alternative fuels and vehicles developed by Argonne National Laboratory, i.e. the GREET model (Greenhouse Gases, Regulated Emissions, and Energy in Transportation). The GREET model is used to compare alternative fuels for ve-hicle technologies from conventional spark-ignition engines to
T
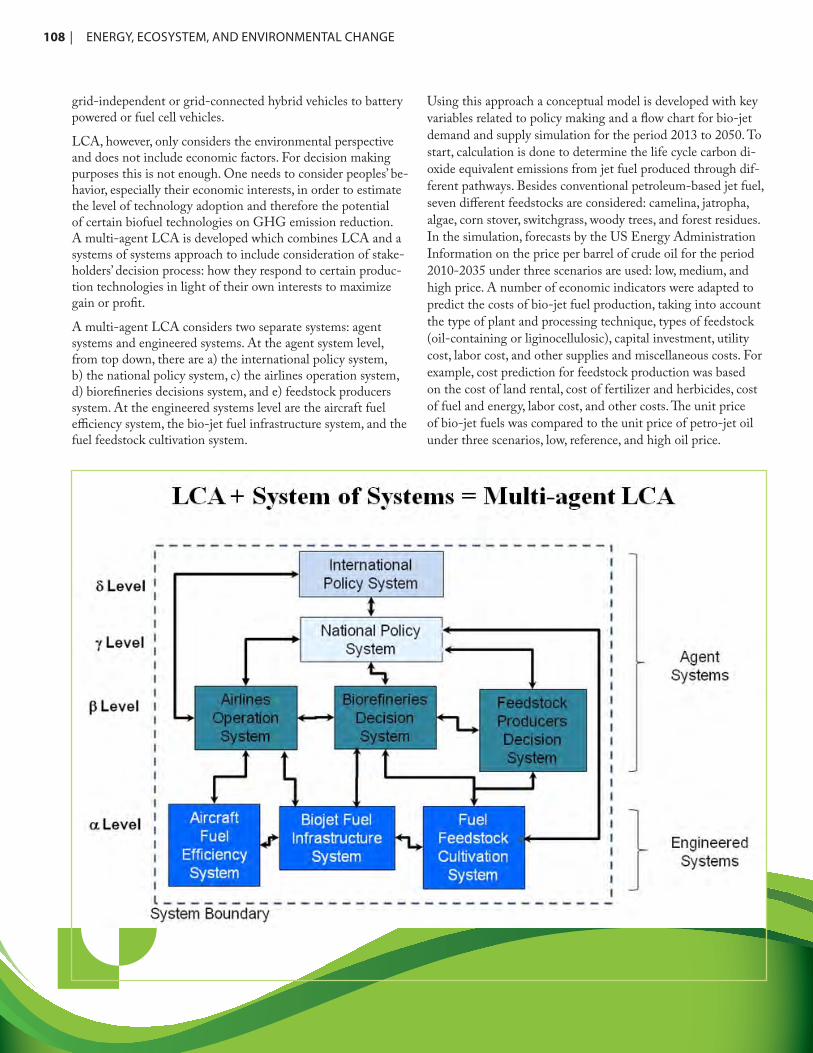
108 | ENERGY,ECOSYSTEM,ANDENVIRONMENTALCHANGE
grid-independent or grid-connected hybrid vehicles to battery powered or fuel cell vehicles.
LCA, however, only considers the environmental perspective and does not include economic factors. For decision making purposes this is not enough. One needs to consider peoples’ be-havior, especially their economic interests, in order to estimate the level of technology adoption and therefore the potential of certain biofuel technologies on GHG emission reduction. A multi-agent LCA is developed which combines LCA and a systems of systems approach to include consideration of stake-holders’ decision process: how they respond to certain produc-tion technologies in light of their own interests to maximize gain or profit.
A multi-agent LCA considers two separate systems: agent systems and engineered systems. At the agent system level, from top down, there are a) the international policy system, b) the national policy system, c) the airlines operation system, d) biorefineries decisions system, and e) feedstock producers system. At the engineered systems level are the aircraft fuel efficiency system, the bio-jet fuel infrastructure system, and the fuel feedstock cultivation system.
Using this approach a conceptual model is developed with key variables related to policy making and a flow chart for bio-jet demand and supply simulation for the period 2013 to 2050. To start, calculation is done to determine the life cycle carbon di-oxide equivalent emissions from jet fuel produced through dif-ferent pathways. Besides conventional petroleum-based jet fuel, seven different feedstocks are considered: camelina, jatropha, algae, corn stover, switchgrass, woody trees, and forest residues. In the simulation, forecasts by the US Energy Administration Information on the price per barrel of crude oil for the period 2010-2035 under three scenarios are used: low, medium, and high price. A number of economic indicators were adapted to predict the costs of bio-jet fuel production, taking into account the type of plant and processing technique, types of feedstock (oil-containing or liginocellulosic), capital investment, utility cost, labor cost, and other supplies and miscellaneous costs. For example, cost prediction for feedstock production was based on the cost of land rental, cost of fertilizer and herbicides, cost of fuel and energy, labor cost, and other costs. The unit price of bio-jet fuels was compared to the unit price of petro-jet oil under three scenarios, low, reference, and high oil price.
ENERGY,ECOSYSTEM,ANDENVIRONMENTALCHANGE | 109
In this multi-agent LCA we have determined that
• For bio-jet fuels, lignocellulosic feedstock derived fuels have lower life cycle GHG emissions than those from oil-contain-ing feedstock.
• Camelina to bio-jet seems to be the most economically viable pathway, while algae seems to be the most expensive one.
• The blending ratio is a major constraint due to the “drop-in” requirement.
• All agents will benefit, with biorefineries being the biggest winner.
• Subsidies are necessary, especially in a low oil price scenario.
• Bio-jet fuels alone are not sufficient to meet the 2050 target for reductions in GHG emissions by the aviation industry.
Here we demonstrated the utility of a multi-agent LCA to provide a more realistic estimation of the potential of new tech-nologies than a simple LCA can provide. These findings may prove useful in informing policy discussions, determining the future of bio-jet fuel production, and weighing the benefits of subsidies to encourage conversion of land to the production of feedstocks for bio-jet fuel.
Another important factor or constraint is effect of land avail-ability, the amount of land available for feedstock produc-tion, over time. Three key variables in this calculation are the allocation of land to bio-jet fuel production, the rate of acreage increase before reaching the maximum of land allocated to a feedstock, and the initial acreage of allocated land. Bio-jet fuel production will compete with production of biofuel for other transportation products, so it is assumed that these two industries are facing the same pressure, and that the adoption rate of bio-jet fuel will be similar. The rate of acreage increase is important because of the time delay as the farmer learns how to grow a certain feedstock; that may take two years or longer.
Emission trajectories were generated under multiple oil price scenarios, different level of land availability (for a base case 20 percent of available land is dedicated to bio-jet feedstock), different farmer profit margin (20 percent of total production cost in the base case), and different aviation demand growth rate (2.25 percent in the base case). Outcomes in terms of the effects on farmer profit, airline savings from avoiding carbon penalties, and policy interventions in the form of subsidies were also investigated. A sensitivity analysis was also performed us-ing the Spearman correlation index with regard to the change in the weighted average of unit life cycle emissions for the case of oil-containing feedstock.
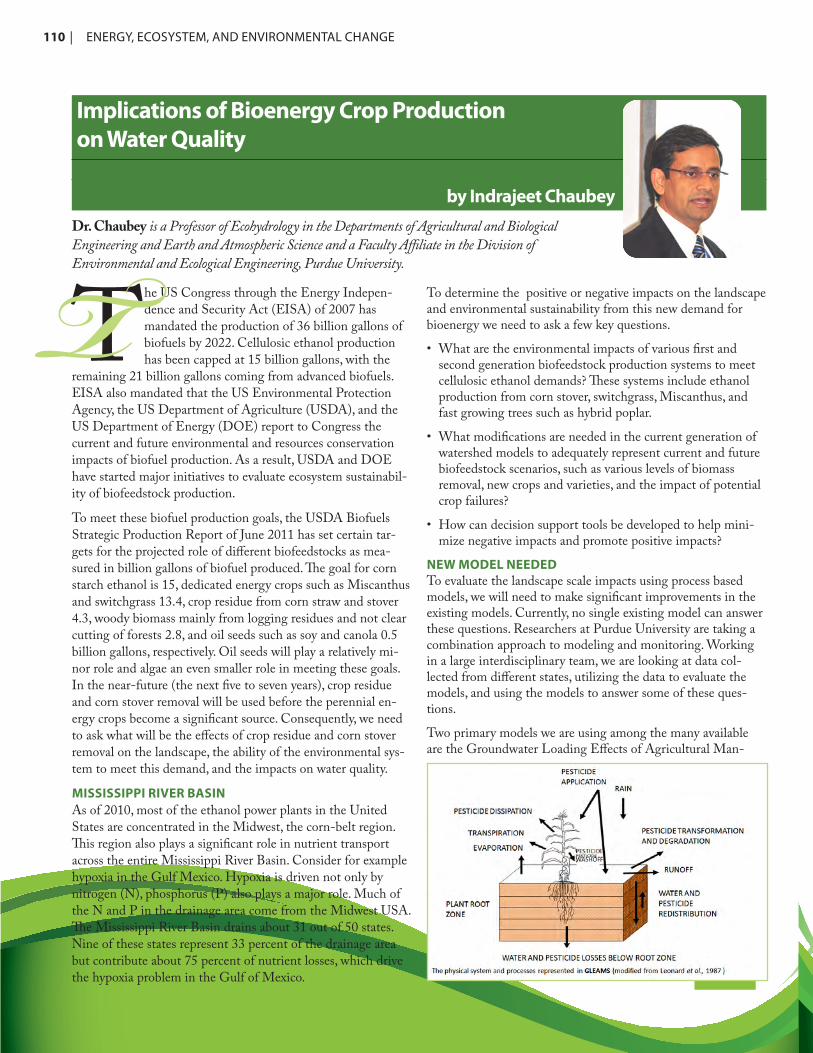
110 | ENERGY,ECOSYSTEM,ANDENVIRONMENTALCHANGE
Implications of Bioenergy Crop Productionon Water Quality
by Indrajeet Chaubey
The US Congress through the Energy Indepen-dence and Security Act (EISA) of 2007 has mandated the production of 36 billion gallons of biofuels by 2022. Cellulosic ethanol production has been capped at 15 billion gallons, with the
remaining 21 billion gallons coming from advanced biofuels. EISA also mandated that the US Environmental Protection Agency, the US Department of Agriculture (USDA), and the US Department of Energy (DOE) report to Congress the current and future environmental and resources conservation impacts of biofuel production. As a result, USDA and DOE have started major initiatives to evaluate ecosystem sustainabil-ity of biofeedstock production.
To meet these biofuel production goals, the USDA Biofuels Strategic Production Report of June 2011 has set certain tar-gets for the projected role of different biofeedstocks as mea-sured in billion gallons of biofuel produced. The goal for corn starch ethanol is 15, dedicated energy crops such as Miscanthus and switchgrass 13.4, crop residue from corn straw and stover 4.3, woody biomass mainly from logging residues and not clear cutting of forests 2.8, and oil seeds such as soy and canola 0.5 billion gallons, respectively. Oil seeds will play a relatively mi-nor role and algae an even smaller role in meeting these goals. In the near-future (the next five to seven years), crop residue and corn stover removal will be used before the perennial en-ergy crops become a significant source. Consequently, we need to ask what will be the effects of crop residue and corn stover removal on the landscape, the ability of the environmental sys-tem to meet this demand, and the impacts on water quality.
MISSISSIPPI RIVER BASINAs of 2010, most of the ethanol power plants in the United States are concentrated in the Midwest, the corn-belt region. This region also plays a significant role in nutrient transport across the entire Mississippi River Basin. Consider for example hypoxia in the Gulf Mexico. Hypoxia is driven not only by nitrogen (N), phosphorus (P) also plays a major role. Much of the N and P in the drainage area come from the Midwest USA. The Mississippi River Basin drains about 31 out of 50 states. Nine of these states represent 33 percent of the drainage area but contribute about 75 percent of nutrient losses, which drive the hypoxia problem in the Gulf of Mexico.
To determine the positive or negative impacts on the landscape and environmental sustainability from this new demand for bioenergy we need to ask a few key questions.
• What are the environmental impacts of various first and second generation biofeedstock production systems to meet cellulosic ethanol demands? These systems include ethanol production from corn stover, switchgrass, Miscanthus, and fast growing trees such as hybrid poplar.
• What modifications are needed in the current generation of watershed models to adequately represent current and future biofeedstock scenarios, such as various levels of biomass removal, new crops and varieties, and the impact of potential crop failures?
• How can decision support tools be developed to help mini-mize negative impacts and promote positive impacts?
NEW MODEL NEEDEDTo evaluate the landscape scale impacts using process based models, we will need to make significant improvements in the existing models. Currently, no single existing model can answer these questions. Researchers at Purdue University are taking a combination approach to modeling and monitoring. Working in a large interdisciplinary team, we are looking at data col-lected from different states, utilizing the data to evaluate the models, and using the models to answer some of these ques-tions.
Two primary models we are using among the many available are the Groundwater Loading Effects of Agricultural Man-
Dr. Chaubey is a Professor of Ecohydrology in the Departments of Agricultural and Biological Engineering and Earth and Atmospheric Science and a Faculty Affiliate in the Division of Environmental and Ecological Engineering, Purdue University.T

ENERGY,ECOSYSTEM,ANDENVIRONMENTALCHANGE | 111
agement Systems (GLEAMS) model and the Soil and Water Assessment Tool (SWAT) model. The GLEAMS model is a field scale water quality model that looks at all scales rang-ing from the field and farm to the watershed scale. GLEAMS looks at different hydrologic, nutrient, sediment, and pesticide processes. It analyzes the inputs, the types of plants and crops grown in the field, soil properties in different depth zones, and soil heterogeneity across a field. The model can then be used to determine the fate and transport of sediment, nutrients, and pesticides in the field.
To go from the field to the watershed scale, we use the SWAT model. This is perhaps the most widely used watershed scale model in the United States and in many other countries in the world. The SWAT model divides a watershed into sub-water-sheds which are further divided based on common land use and soil types into hydrologic response units (HRUs), which are the building blocks of the SWAT model. In order to simulate the flow in the watershed, the model takes into account tempera-ture, precipitation, and various land management practices such as crop rotation, tillage, and fertilizer application, inputs pro-vided at a HRU level. The model then simulates the streamflow and various water quality parameters at various locations in the watershed for the time period of simulation. The SWAT model can be run to assess the impacts of land use, land management, and climate variability on scales ranging from daily to many years.
WATERSHED SCALE IMPACTSIn projects funded by the USDA and DOE, we are looking at watershed scale impacts at two sites, a primary site in the Wildcat Creek Basin of Indiana, and another in the St. Joseph River Basin located in Indiana, Michigan and Ohio. The two watersheds drain in different directions. Wildcat Creek eventu-ally drains to the Gulf of Mexico via the Mississippi River Ba-sin, whereas the St. Joseph River Basin flows to Lake Erie, one of the Great Lakes. Both basins support row cropping in the form of corn and soy bean rotation, and both have some forest cover, ranging from 9 percent in the Wildcat Creek Basin to 13 percent in the St. Joseph River Basin. Pasture coverage in both basins is roughly equivalent. These similar conditions allow us to look at different bioenergy scenarios. The two basins differ in the amount of urban area, which is higher in the St. Joseph area. Wetlands covering about 8 percent of the watershed are also present in the St. Jones River Basin but not in the Wildcat Creek Basin.
One question we want to answer concerns the acceptable rate for removal of unprocessed agriculture residue. Previous stud-ies on stover availability assumed 100 percent removal. This is unlikely to happen on owner cultivated fields, but we don’t know about the potential removal on leased fields, and the jury is still out on how much residue to remove. This is an important question now, because what happens in the near future, the next 5-7 years, can have important implications for N and P cycling as well as for hydrologic processes. There are tradeoffs to consider in the removal of residual material. Removal of the
residue left on the ground may result in faster warming of soils in the springtime. In addition, removal of the biomass decreases soil organic carbon and results in faster loss of soil moisture. Altogether, residue removal can affect N and P mineralization and cause an increase in soil erosion from surface runoff.
At the field,scale we can predict water quality impacts result-ing from three levels of residue removal, i.e., removal rates of 38, 52, and 70 percent compared to a baseline with no residue removed. Water quality impacts are measured in terms of soil losses as tons per hectare. Three different soils are dominant in the St. Johns River basin: Blount silt loam, Hoytville clay, and Oshtemo sand.
In one scenario we projected results from conventional tillage: fall chisel and spring disk. The trend of increasing erosion losses with corn residue removal was consistent across the different soil texture classes. As expected, slope was a factor in control-ling annual erosion losses. Hoytville Clay with a relatively flat slope of 1 percent slope had the lowest estimated erosion losses. Within soils, erosion losses for stover removal scenarios were not significantly greater than the baseline of no residue removed. Soil loss tolerance is the maximum rate of annual soil erosion that can be permitted without significant agronomic consequences. It is evident that with increased removal of residue, soil erosion will increase slightly.
Erosion on no-till land is another story. Residue removal is still going to increase the soil losses, but the increase will be statistically significant. No-till systems increase soil aggregate stability, organic matter, and infiltration rates thereby reducing the potential of particle detachment by rainfall and reducing erosion rates.
Comparatively, trends in erosion losses were more dramatic for no-till management. Erosion losses were significantly higher for all stover removal scenarios. Even with high levels of residue removal, however, erosion in no-till systems will be less than with conventional tillage, so no-till is an environmentally better option.
For conventional tillage at the field scale with residue removal, even though erosion losses slightly increased with stover re-moval, P losses will be less, primarily because P is incorporated roughly 10 cm below the surface, while erosion takes place primarily from the top 1 cm of the soil. With no-till systems, however, total P losses will increase, because P is not incor-porated into the soil but is applied on the surface, making it readily available for transport with surface runoff and erosion. Therefore, even with the smallest residue removal rate, the losses are going to be significantly greater across all three soil types.
With conventional tillage, broad spectrum fungicides are com-monly applied. Estimated annual losses showed an increas-ing trend of fungicide losses with corn stover removal rates primarily as a function of the amount of erosion. However,

112 | ENERGY,ECOSYSTEM,ANDENVIRONMENTALCHANGE
leaching losses from pesticide absorbed into the sediment were negligible.
We used the SWAT model to compare simulated sediment yield with actual field measurements at the watershed scale for the Wildcat Creek Basin over a 15 year period (1991-2005) to make sure that the model simulates the watershed response correctly. Comparing measured and simulated amounts of sediment yield, we found good correlation at both daily and monthly scales, which gives us confidence that the model repre-sents watershed processes reasonably well. We then modeled nitrate losses with crop residue removed and found a similar trend, flow decreases slightly, and sediment loss increases slightly, but the extent of nutrient loss at the watershed scale will be much smaller due to the aggregation over a large area of many land uses and land types. Organic matter will increase slightly, and organic N and P will increase slightly. This research is still a work in progress.
We are also currently developing Web-based decision support tools, a suite of interfaces that allow us to enter data from a specific watershed under various field management conditions and get outputs both in graphical and tabular forms. In addi-
tion, we have recently received funding for a project to evaluate sustainability in terms of impacts on soil erosion, water quality, water quantity, biomass, crop production, and profitability as well as aquatic biodiversity. We will take a baseline using the SWAT model and see what happens with various future climate change and bioenergy crop production scenarios. This will help to design a watershed management system to meet bio-feedstock goals while ensuring that the system is sustain-able from the hydrology, water quality, and ecosystem services point of view.
We are now collecting field scale data to improve these models. The idea is to optimize crop production in the landscape and to determine selection and location of different food and energy crops in a watershed. This will help meet energy demand with the least negative impact on the environment, while optimizing multiple objectives such as water quality benefits, mass pro-duction costs, cost of biomass production, and crop ecosystem services. When we find potentially negative impacts, we can then seek to implement best management practices to reduce those negative impacts.
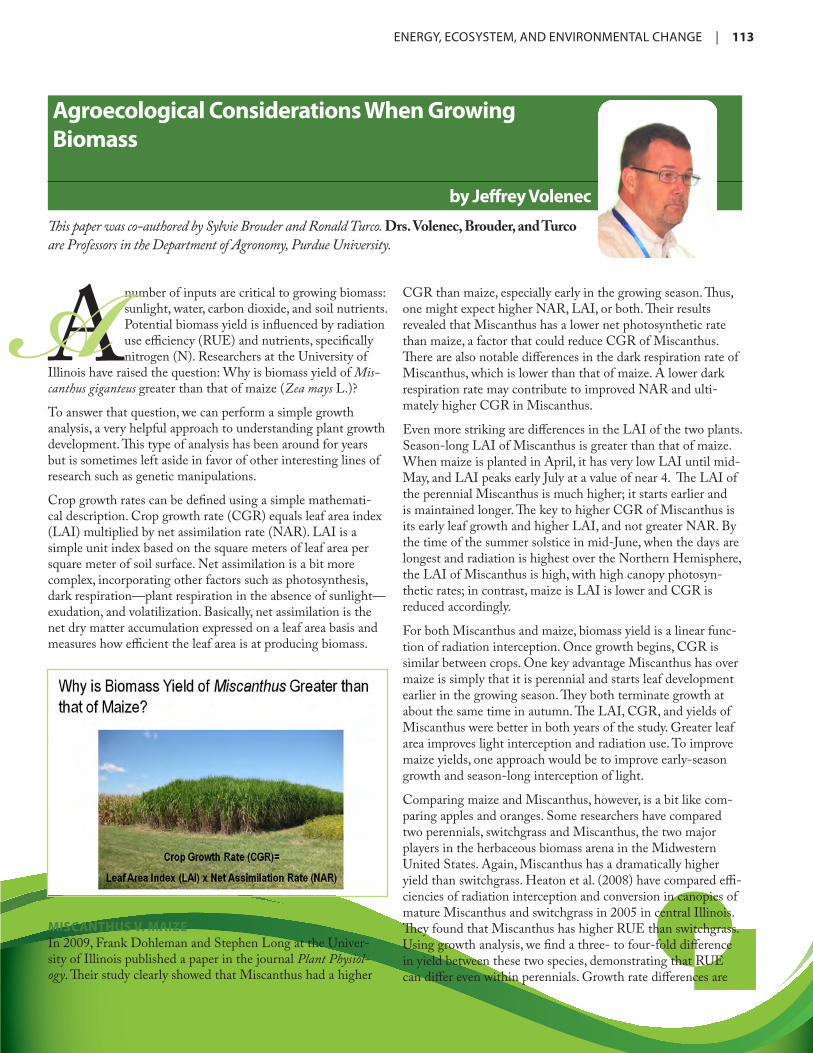
ENERGY,ECOSYSTEM,ANDENVIRONMENTALCHANGE | 113
Agroecological Considerations When Growing Biomass
by Jeffrey Volenec
A number of inputs are critical to growing biomass: sunlight, water, carbon dioxide, and soil nutrients. Potential biomass yield is influenced by radiation use efficiency (RUE) and nutrients, specifically nitrogen (N). Researchers at the University of
Illinois have raised the question: Why is biomass yield of Mis-canthus giganteus greater than that of maize (Zea mays L.)?
To answer that question, we can perform a simple growth analysis, a very helpful approach to understanding plant growth development. This type of analysis has been around for years but is sometimes left aside in favor of other interesting lines of research such as genetic manipulations.
Crop growth rates can be defined using a simple mathemati-cal description. Crop growth rate (CGR) equals leaf area index (LAI) multiplied by net assimilation rate (NAR). LAI is a simple unit index based on the square meters of leaf area per square meter of soil surface. Net assimilation is a bit more complex, incorporating other factors such as photosynthesis, dark respiration—plant respiration in the absence of sunlight—exudation, and volatilization. Basically, net assimilation is the net dry matter accumulation expressed on a leaf area basis and measures how efficient the leaf area is at producing biomass.
MISCANTHUS V. MAIZEIn 2009, Frank Dohleman and Stephen Long at the Univer-sity of Illinois published a paper in the journal Plant Physiol-ogy. Their study clearly showed that Miscanthus had a higher
CGR than maize, especially early in the growing season. Thus, one might expect higher NAR, LAI, or both. Their results revealed that Miscanthus has a lower net photosynthetic rate than maize, a factor that could reduce CGR of Miscanthus. There are also notable differences in the dark respiration rate of Miscanthus, which is lower than that of maize. A lower dark respiration rate may contribute to improved NAR and ulti-mately higher CGR in Miscanthus.
Even more striking are differences in the LAI of the two plants. Season-long LAI of Miscanthus is greater than that of maize. When maize is planted in April, it has very low LAI until mid-May, and LAI peaks early July at a value of near 4. The LAI of the perennial Miscanthus is much higher; it starts earlier and is maintained longer. The key to higher CGR of Miscanthus is its early leaf growth and higher LAI, and not greater NAR. By the time of the summer solstice in mid-June, when the days are longest and radiation is highest over the Northern Hemisphere, the LAI of Miscanthus is high, with high canopy photosyn-thetic rates; in contrast, maize is LAI is lower and CGR is reduced accordingly.
For both Miscanthus and maize, biomass yield is a linear func-tion of radiation interception. Once growth begins, CGR is similar between crops. One key advantage Miscanthus has over maize is simply that it is perennial and starts leaf development earlier in the growing season. They both terminate growth at about the same time in autumn. The LAI, CGR, and yields of Miscanthus were better in both years of the study. Greater leaf area improves light interception and radiation use. To improve maize yields, one approach would be to improve early-season growth and season-long interception of light.
Comparing maize and Miscanthus, however, is a bit like com-paring apples and oranges. Some researchers have compared two perennials, switchgrass and Miscanthus, the two major players in the herbaceous biomass arena in the Midwestern United States. Again, Miscanthus has a dramatically higher yield than switchgrass. Heaton et al. (2008) have compared effi-ciencies of radiation interception and conversion in canopies of mature Miscanthus and switchgrass in 2005 in central Illinois. They found that Miscanthus has higher RUE than switchgrass. Using growth analysis, we find a three- to four-fold difference in yield between these two species, demonstrating that RUE can differ even within perennials. Growth rate differences are
This paper was co-authored by Sylvie Brouder and Ronald Turco. Drs. Volenec, Brouder, and Turco are Professors in the Department of Agronomy, Purdue University. A
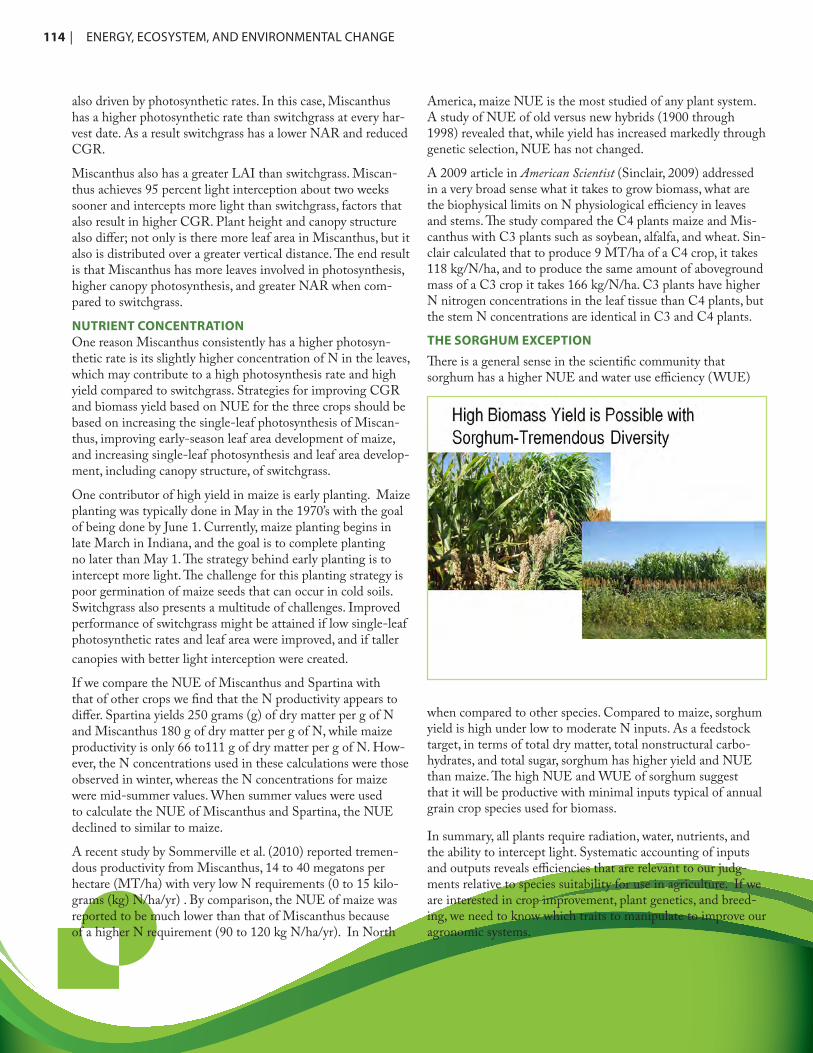
114 | ENERGY,ECOSYSTEM,ANDENVIRONMENTALCHANGE
also driven by photosynthetic rates. In this case, Miscanthus has a higher photosynthetic rate than switchgrass at every har-vest date. As a result switchgrass has a lower NAR and reduced CGR.
Miscanthus also has a greater LAI than switchgrass. Miscan-thus achieves 95 percent light interception about two weeks sooner and intercepts more light than switchgrass, factors that also result in higher CGR. Plant height and canopy structure also differ; not only is there more leaf area in Miscanthus, but it also is distributed over a greater vertical distance. The end result is that Miscanthus has more leaves involved in photosynthesis, higher canopy photosynthesis, and greater NAR when com-pared to switchgrass.
NUTRIENT CONCENTRATIONOne reason Miscanthus consistently has a higher photosyn-thetic rate is its slightly higher concentration of N in the leaves, which may contribute to a high photosynthesis rate and high yield compared to switchgrass. Strategies for improving CGR and biomass yield based on NUE for the three crops should be based on increasing the single-leaf photosynthesis of Miscan-thus, improving early-season leaf area development of maize, and increasing single-leaf photosynthesis and leaf area develop-ment, including canopy structure, of switchgrass.
One contributor of high yield in maize is early planting. Maize planting was typically done in May in the 1970’s with the goal of being done by June 1. Currently, maize planting begins in late March in Indiana, and the goal is to complete planting no later than May 1. The strategy behind early planting is to intercept more light. The challenge for this planting strategy is poor germination of maize seeds that can occur in cold soils. Switchgrass also presents a multitude of challenges. Improved performance of switchgrass might be attained if low single-leaf photosynthetic rates and leaf area were improved, and if taller canopies with better light interception were created.
If we compare the NUE of Miscanthus and Spartina with that of other crops we find that the N productivity appears to differ. Spartina yields 250 grams (g) of dry matter per g of N and Miscanthus 180 g of dry matter per g of N, while maize productivity is only 66 to111 g of dry matter per g of N. How-ever, the N concentrations used in these calculations were those observed in winter, whereas the N concentrations for maize were mid-summer values. When summer values were used to calculate the NUE of Miscanthus and Spartina, the NUE declined to similar to maize.
A recent study by Sommerville et al. (2010) reported tremen-dous productivity from Miscanthus, 14 to 40 megatons per hectare (MT/ha) with very low N requirements (0 to 15 kilo-grams (kg) N/ha/yr) . By comparison, the NUE of maize was reported to be much lower than that of Miscanthus because of a higher N requirement (90 to 120 kg N/ha/yr). In North
America, maize NUE is the most studied of any plant system. A study of NUE of old versus new hybrids (1900 through 1998) revealed that, while yield has increased markedly through genetic selection, NUE has not changed.
A 2009 article in American Scientist (Sinclair, 2009) addressed in a very broad sense what it takes to grow biomass, what are the biophysical limits on N physiological efficiency in leaves and stems. The study compared the C4 plants maize and Mis-canthus with C3 plants such as soybean, alfalfa, and wheat. Sin-clair calculated that to produce 9 MT/ha of a C4 crop, it takes 118 kg/N/ha, and to produce the same amount of aboveground mass of a C3 crop it takes 166 kg/N/ha. C3 plants have higher N nitrogen concentrations in the leaf tissue than C4 plants, but the stem N concentrations are identical in C3 and C4 plants.
THE SORGHUM EXCEPTION
There is a general sense in the scientific community that sorghum has a higher NUE and water use efficiency (WUE)
when compared to other species. Compared to maize, sorghum yield is high under low to moderate N inputs. As a feedstock target, in terms of total dry matter, total nonstructural carbo-hydrates, and total sugar, sorghum has higher yield and NUE than maize. The high NUE and WUE of sorghum suggest that it will be productive with minimal inputs typical of annual grain crop species used for biomass.
In summary, all plants require radiation, water, nutrients, and the ability to intercept light. Systematic accounting of inputs and outputs reveals efficiencies that are relevant to our judg-ments relative to species suitability for use in agriculture. If we are interested in crop improvement, plant genetics, and breed-ing, we need to know which traits to manipulate to improve our agronomic systems.
ENERGY,ECOSYSTEM,ANDENVIRONMENTALCHANGE | 115
Establishing a Feedstock Supply Chain forCellulosic Ethanol in Tennessee
by Samuel Jackson
The Tennessee Biofuels Initiative, which began in 2007, is specifically aimed at positioning the state as a leader in biomass (cellulosic) based bioenergy. The state of Tennessee, the Institute of Agricul-ture at the University of Tennessee (UT), Genera
Energy LLC (Genera), and other partners are cooperating on an effort underway to develop the cellulosic ethanol industry in Tennessee. One key component of success in this endeavor is supply chain management, providing quality feedstock to an end user, whether the goal is to produce ethanol, biopower, or other bioproducts.
Successful production of cellulosic biofuels requires three key elements: a sustainable feedstock supply, consistent feedstock quality, and a cost-effective supply chain. Some cellulosic ethanol refineries are projected to cost $150 - $300 million. Investors in these refineries must be assured of a sustainable feedstock supply. In addition, it is essential that all the biomass in a particular area can be efficiently collected to supply a biore-finery on an annual basis. That feedstock must be consistent in terms of quality, that is, in chemical and structural composition.
To achieve these goals, coordination and research are needed in crop development, farm production, harvesting and storage, transportation and logistics, feedstock quality, and environmen-tal factors. In the final analysis, we have to ensure that produc-ers of biomass earn a profit while, at the same time, the end product is economical to the consumer.
SWITCHGRASS, AN ENERGY CROPSwitchgrass is a bioenergy crop well suited to the Southeast. Currently, in Tennessee, six to 10 tons of switchgrass can be produced per acre, with a potential for greater than 12 tons/acre with basic plant improvement. Switchgrass is a warm season, native, perennial grass that tolerates poor soils, flooding, and drought. It is highly resistant to many pests and diseases and requires low use of chemicals or fertilizers. It takes three years to establish, and weed control in the early establishment stage is critical to its success. Switchgrass, which works with existing farm equipment and infrastructure, has been a focus of research at UT for more than 20 years. However, this initiative seeks to move switchgrass from research to commercialization. To do that, private farmers must be involved.
With farmers and a new crop, there is a chicken or an egg problem. Which comes first? A farmer is not going to produce a crop for which there is no market. Likewise a biorefinery or end user is not going to construct a facility without assurance of an established feedstock. To produce switchgrass, farmers received incentive production contracts three years in length with a payment of $450/acre per year. Seed and technical sup-port was also provided. UT and Genera are currently contract-ing with local farmers to produce 5,100 acres of switchgrass per year. Nearly 3,000 acres were harvested in 2009, and in 2010, 2,000 more acres were harvested, including 1,000 acres of im-proved varieties. Fully mature switchgrass is yielding 8 dry tons per acre in Tennessee.
LOGISTICSGenera and DuPont Danisco Cellulosic Ethanol LLC con-structed and are now operating a pilot-scale biorefinery in Ten-nessee. This is a 250 thousand gallon per year facility currently running on corncob as a feedstock and will gradually convert to switchgrass in 2011. Some of the feedstock production effort focuses on supplying that facility, but a greater portion is dem-onstrating at a large commercial-scale feedstock production and logistics for a variety of markets
Feedstock composition and quality is driven by genetics and production systems. However, feedstock composition/quality can be significantly affected by logistics, storage, and handling of material. Careful management of supply chains can address many feedstock quality concerns
PLANTING AND HARVESTINGOne way to enhance production systems and control produc-tion cost on the farm is through logistics, beginning with equipment used for planting and harvesting. Switchgrass is often planted with no-till planting equipment and no-till seed drills. Most of this equipment used locally is just a little over 2 meters wide, requiring many passes across the field. In 2010, a large air seeder was demonstrated, planting in swaths 10 meters wide. A farmer could plant one field in about a third of the time it would have otherwise taken and thus reduce operational costs.
Harvesting an energy crop like switchgrass also has its chal-lenges and advantages. Switchgrass harvesting can be accom-plished with existing equipment that the farmer is familiar
Dr. Jackson is a Research Assistant Professor in the Center for Renewable Carbon, Institute of Agriculture, University of Tennessee, and Vice President, Feedstock Operations, Genera Energy LLC.
T
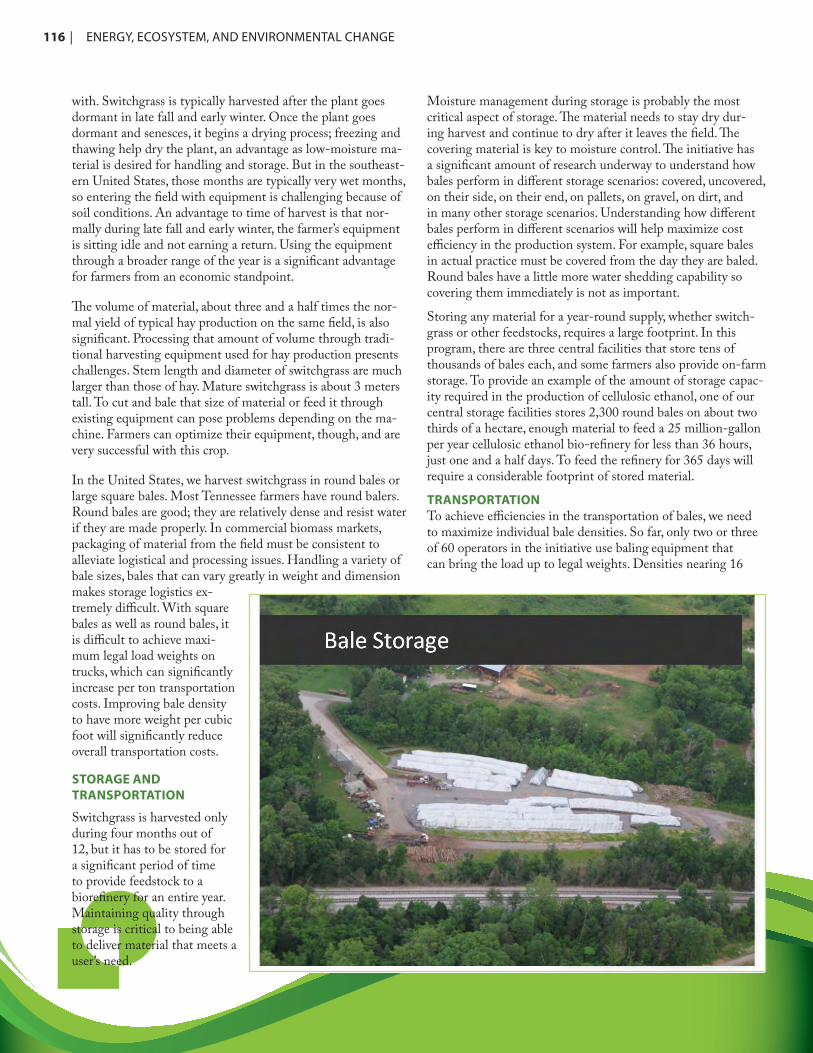
116 | ENERGY,ECOSYSTEM,ANDENVIRONMENTALCHANGE
with. Switchgrass is typically harvested after the plant goes dormant in late fall and early winter. Once the plant goes dormant and senesces, it begins a drying process; freezing and thawing help dry the plant, an advantage as low-moisture ma-terial is desired for handling and storage. But in the southeast-ern United States, those months are typically very wet months, so entering the field with equipment is challenging because of soil conditions. An advantage to time of harvest is that nor-mally during late fall and early winter, the farmer’s equipment is sitting idle and not earning a return. Using the equipment through a broader range of the year is a significant advantage for farmers from an economic standpoint.
The volume of material, about three and a half times the nor-mal yield of typical hay production on the same field, is also significant. Processing that amount of volume through tradi-tional harvesting equipment used for hay production presents challenges. Stem length and diameter of switchgrass are much larger than those of hay. Mature switchgrass is about 3 meters tall. To cut and bale that size of material or feed it through existing equipment can pose problems depending on the ma-chine. Farmers can optimize their equipment, though, and are very successful with this crop.
In the United States, we harvest switchgrass in round bales or large square bales. Most Tennessee farmers have round balers. Round bales are good; they are relatively dense and resist water if they are made properly. In commercial biomass markets, packaging of material from the field must be consistent to alleviate logistical and processing issues. Handling a variety of bale sizes, bales that can vary greatly in weight and dimension makes storage logistics ex-tremely difficult. With square bales as well as round bales, it is difficult to achieve maxi-mum legal load weights on trucks, which can significantly increase per ton transportation costs. Improving bale density to have more weight per cubic foot will significantly reduce overall transportation costs.
STORAGE ANDTRANSPORTATION
Switchgrass is harvested only during four months out of 12, but it has to be stored for a significant period of time to provide feedstock to a biorefinery for an entire year. Maintaining quality through storage is critical to being able to deliver material that meets a user’s need.
Moisture management during storage is probably the most critical aspect of storage. The material needs to stay dry dur-ing harvest and continue to dry after it leaves the field. The covering material is key to moisture control. The initiative has a significant amount of research underway to understand how bales perform in different storage scenarios: covered, uncovered, on their side, on their end, on pallets, on gravel, on dirt, and in many other storage scenarios. Understanding how different bales perform in different scenarios will help maximize cost efficiency in the production system. For example, square bales in actual practice must be covered from the day they are baled. Round bales have a little more water shedding capability so covering them immediately is not as important.
Storing any material for a year-round supply, whether switch-grass or other feedstocks, requires a large footprint. In this program, there are three central facilities that store tens of thousands of bales each, and some farmers also provide on-farm storage. To provide an example of the amount of storage capac-ity required in the production of cellulosic ethanol, one of our central storage facilities stores 2,300 round bales on about two thirds of a hectare, enough material to feed a 25 million-gallon per year cellulosic ethanol bio-refinery for less than 36 hours, just one and a half days. To feed the refinery for 365 days will require a considerable footprint of stored material.
TRANSPORTATIONTo achieve efficiencies in the transportation of bales, we need to maximize individual bale densities. So far, only two or three of 60 operators in the initiative use baling equipment that can bring the load up to legal weights. Densities nearing 16
ENERGY,ECOSYSTEM,ANDENVIRONMENTALCHANGE | 117
pounds per cubic foot in round bales will achieve these weights. Getting to that point presents a challenge for most farmers, though. Another important consideration in transporting ma-terial is road safety while hauling. In Tennessee and most other states, there are specific regulations for hauling agricultural commodities on state highways, and the federal government has its own regulations for federal highways. Tennessee has an exemption that allows agricultural material such as hay bales to be hauled at a wider width (10 feet instead of 8 feet wide), so an operator can stack two bales wide per truck and remain within legal limits. This is an exemption put into place decades ago to allow farmers to move hay bales, but there is a difference between a farmer moving 100 round bales per year for his own use and a biorefinery moving 500,000 or more bales per year. Similarly, many rural agricultural roads are not always in the best condition, with bridges that have low weight limits and other issues such as wear and tear on substandard roads.
IMPROVED LOGISTIC There is significant labor involved in bale feedstock systems. Moving individual bales is required at almost every step, creat-ing a very labor intensive operation. The US Department of Energy has recently granted funding for work on high tonnage logistics related to switchgrass. The project objectives are 1) to develop an appropriately-scaled bulk-based switchgrass harvest, handling, storage, compaction, transport, and off-load system to supply a demonstration biorefinery; 2) to determine switch-grass handling efficiencies of the bulk system and identify areas to improve efficiencies with respect to equipment investments and operators; and 3) to determine switchgrass quality associ-ated with the bulk system compared to the current bale system based on ethanol production and potential.
This study seeks to develop a field logistic system where the operator bypasses baling altogether, and to process material in the field. We can do this using a forage harvester, a machine that chops the material into relatively small particle lengths, theoretically smaller than an inch. The chopped material is then blown into a wagon that can be automatically unloaded. From that point on, the handling of the material is automated using conveyers and pneumatic systems. The material can be stored in silos or piles. This process will offer significant advantages, such as reduced preprocessing costs and higher rates of throughput at harvest, so we can process more tons per hour. One challenge in this approach is that the material is not very dense, so the
project is evaluating compaction technology in the field and at the collection point. This system has tremendous potential in the long term compared to bales. The project will collect data over the next several years to evaluate the potential and to determine if it can be economically implemented.
Fibrous material like switchgrass creates many challenges to automated handling. At some point we need to process the crop into finely chopped material, about as fine as flour in some cases. That is not an insignificant feat in terms of energy input, a process requiring inexpensive conveyances and grind-ers. Because of their physical properties, grain and commodity crops flow very well through systems. This is not the case with switchgrass. To achieve enhanced efficiencies in processing, the intiative is focused on reducing energy inputs for preprocessing, improving flowability and conveyances, and increasing densifi-cation.
ENHANCED PROCESSING CAPABILITIESIn July 2010, Genera, along with several partners, began constructing a commercial scale processing facility called the Biomass Innovation Park. This is a world-class research and development campus that integrates all aspects of the bio-mass supply chain. The park include silos for the high tonnage logistics project, and a full processing line for material, a line that includes grinders, hammermills, and other equipment. The facility will be able to bring in bales or chopped switchgrass, grind it to a finer particle size, store it, and then pull it out of storage and hammer mill it down to a finished product size. As markets develop, it will be able to add new technologies such as pelletization or other densification techniques. The site can also serve as a demonstration facility for other technologies such as small scale gasification and fast pyrolysis.
CONCLUSION The primary goal of the Tennessee Biofuels Initiative is to develop a model for commercial biomass supply chains in Tennessee and the region. By focusing on improved efficien-cies in harvesting, transport, and storage logistics, we can reduce supply chain costs while maintaining the structural and chemical quality of the material. Critical research and develop-ment is still needed. For this endeavor to be successful we must collaborate across the supply chain from the farmer through the end user to supply simple solutions for bioenergy producers and biomass producers.
118 | ENERGY,ECOSYSTEM,ANDENVIRONMENTALCHANGE
Logistical Challenges of Supplying Biomassfor Biopower Production
by Klein Ileleji
The production of biopower in China and the United States shares many differences and some similarities. One common challenge is biomass feedstock supply and handling. Despite the dif-ferences, the two countries have a great deal of
information to share, especially in terms of the logistical chal-lenges of supplying biomass for biomass production. Recent efforts in joint collaborative research on biomass logistics between Purdue University and Zhejiang University will help both countries take advantage of abundant opportunities.
The Chinese government is encouraging the development of biomass power generation plants that use 100 percent biomass combustion or gasification systems, while policy in the United States promotes co-firing with coal. China is planning to grow its capacity from 2,000 megawatts (MW) in 2005 to about 15,000 MW in 2030. In China, power is sold to consumers through the National Grid Company, which pays a premium for power from biomass. When China’s power plants were being built, however, there was no planning for the logistical challenges or consideration of biomass availability. As a result of poor supply logistics planning, many power plants that were built either shut down, lost money, or were unable to purchase enough biomass to continue operations.
The scenario in the United States is quite different. In 1994, the US Department of Energy’s (DOE) Office of Biomass Program and the National Electric Technology Lab (NETL) instituted a co-firing study at several national laboratories. At that time, the emphasis was on the use of biomass as an op-portunistic fuel co-fired with the primary fuel coal. While the DOE studies compared diverse feedstocks in terms of efficien-cies, emissions, and other technical considerations, one issue that was omitted was the logistics involved in supplying plants. Despite all the co-firing tests conducted at utility plants by NETL, when the program ended in 2004, most of the plants that participated in the studies had ceased to use co-firing. Nevertheless, there were many lessons learned from the DOE co-firing projects. Co-firing was proven to be technically suc-cessful. Useful technical information was developed so that biomass co-firing can be implemented in utility scale boilers. The availability and cost of biomass compared to cheap coal is critical to decisions on co-firing. In addition, the studies found
that there is general industry uncertainty about the future of co-firing.
If you look at a map of the United States showing renewable electricity standards state by state, you find that many of the states with such standards are in the West and a few in the East. If you look at a map of the potential availability of peren-nial energy crops, however, it is evident that those crops are best suited to the Midwest and the South. Shipping biomass great distances is cost prohibitive. You have to produce the power or fuel near where you produce feedstocks. Good policies promot-ing renewable energy are worthless if there is not a good supply of biomass.
CHALLENGES WITH LOGISTICSThe supply challenges with biomass in the United States are numerous. We have limited understanding of biomass feed-stock supply for commercial fuel or power production. There is a lack of feedstock supply chain infrastructure. Handling and conversion systems are not robust and flexible enough to handle different feedstocks. Feedstock storage and handling have not been adequately studied and integrated with conver-sion systems. Studies have not really integrated farm-gate-to-reactor delivery of the conversion chain. Monitoring for quality is challenging. And market uncertainties are very high.
China, which is investing in large-scale biomass power plants using rice straw and husks and other types of biomass, likewise faces logistical challenges. The first power plant we studied in China was built in Jiangsu and commissioned in 2007. In that case, the challenges included a lack of handling infrastructure for large-scale biomass utilization, a lack of fundamental solids handling research with biomass feedstocks, and the fact that feedstock resources are highly uncertain.
Handling of feedstock is a major cause for concern. The conventional pathway for corn stover delivery with current technology, for instance, first requires collection—cutting and shredding, windrowing, and baling; i.e. the use of multiply operations to harvest corn stover. Then the bales must be trans-ported by truck. By the time you factor in the costs incurred at the biorefinery, the economies of scale are offset by increased transportation costs. The larger the plant, the longer the truck-ing distance and hence, the higher the cost per ton for corn stover delivered in bales.
Dr. Ileleji is an Associate Professor and Extension Engineer in Agricultural and Biological Engineering at Purdue University.T

ENERGY,ECOSYSTEM,ANDENVIRONMENTALCHANGE | 119
Map from Union of Concerned Scientists website
increase bulk density of chopped biomass by compacting it into ever smaller particles and by further densifying into briquettes, cubes, and pellets. One way to look at the issue is to consider the average daily requirements of truckloads of biomass—corn, pellets, or bales—delivered to an ethanol plant. The denser the load, the fewer deliveries are needed. If we can densify the feed-stock and bring it down to the level of corn, we can improve transportation efficiency and also make the feedstock more compatible with existing grain bulk handling systems. Instead of saying densification is expensive, we should think about re-engineering densification systems to make them more efficient.
MODELING APPROACHIn order to understand the inbound logistics of biomass feed-stock delivered to a biorefinery, the Biomass Feedstock Logis-tics Simulator (BmFLS) was developed. The primary model blocks of the BmFLS are a bale generator module, a feedstock storage and loading module, a feedstock transport module,
The problem with biomass is actually accessibility to, not avail-ability of, feedstocks. The challenge then is clearly to determine how we can cost-effectively access from the field the vast and variable amount of available biomass across the landscape and deliver it to the biorefinery reactor year round.
In a conventional system there are multiple pathways of biomass supply, from production to storage to transportation to the elevator where the material is cleaned, sorted, graded, blended, and compacted for bulk transport. After value-added products are extracted, the upgraded feedstock is then trans-ported by rail or truck to the biorefinery. These pathways need to be integrated to optimize logistics. For example, it may be more efficient to co-locate power plants near the biorefinery.
A key part of the solution is densification, the increase of energy density per volume of material. Until recently there was not enough fundamental research in densification, so early on it was not considered a viable option. It is possible today to

120 | ENERGY,ECOSYSTEM,ANDENVIRONMENTALCHANGE
and a feedstock unloading module for the final delivery at the biorefinery. The essence is to understand what the unit costs are and then try to optimize the system. The unit load that moves serially through the blocks is modeled as a truckload—39 bales, with each bale weighing 900 lb, and about 17.5 dry tons per truck. We performed feedstock analyses for a plant in Indi-ana with varying capacities comparing corn stover availability versus distance of the supply from the plant. One of the first things we need to understand is where the bottlenecks are in the system, and find ways to optimize those systems in terms of logistics. Model validation, however, is problematic, especially with no commercial existing logistics supply chain currently in place.
In another study on biomass logistics in China, the develop-ment of an optimized biomass feedstock logistics pathway for a power plant currently under construction was investigated. The objectives were 1) to develop a discrete-event model to simulate feedstock logistics of a 100 percent biomass power plant, 2) to simulate realistic supply events with stochastic scenarios and conduct a sensitivity analysis, and 3) to optimize the feedstock supply pathway to reach the lowest logistics cost and meet a reliable year-round demand. The difference between our studies in China and in the United States is that in the US model-ing, we modeled logistics around an imaginary ethanol plant.
In China, the plants are under construction and the logistics system had already been planned. In this case, we needed to conduct further research to optimize the existing system.
Fortunately, we have a plant in China that we can work with. This power plant in Zhanjiang City, Guangdong Province, is the largest of its kind in China. Its location offers many advantages. It is very close to existing highways and a river, and transmission lines are close by. Feedstocks such as eucalyptus, sugar cane, and others are abundant.
Two feedstock supply models have been proposed. The first, which was proposed by the power plant, would include six newly built intermediate storages and indirect transport of feedstock to power plant. Our proposal would have on-field processing, lumber mills which function as storage, and direct transportation to power plant.
DIFFERENT LOGISTICSThe logistical differences between China and the United States are considerable. In China, the farms are smaller and more la-bor intensive. Feedstock variability could be high, and there are high uncertainties in feedstock estimation. Moreover, planning has often been poor, and logistics research is not yet developed. The United States has larger farms with mechanized systems and fewer uncertainties in feedstock estimation. Many biomass
Map from Source: Robert Perlack. Oak-Ridge National Laboratory, U.S. Department of Energy, AETC, Feb. 14, 2006

ENERGY,ECOSYSTEM,ANDENVIRONMENTALCHANGE | 121
producing states, however, lack research to inform decision making. Logistics research is just now becoming the focus of funding agencies, but logistics research still remains under funded
Despite the differences, both countries have much to gain from ongoing collaborative research. In the last four or five years, I have been working on student and faculty exchanges with Zhe-jiang University. Qinhui Wang is now my major collaborator. Dr. Wang has a flourishing research group focused on circulat-ing fluidized bed boiler technologies for both biomass and coal. My first student, Cedric Ogden, is about to finish his doctorate on the behavior of switchgrass particular flow and the flow behavior of biomass in hoppers. Our US students have benefit-ted from this type of collaboration. Cedric, for example, got to visit a power plant and see firsthand some of the real, rather than hypothetical, challenges. I hope he will consider applying for a National Science Foundation international fellowship to
return to China as a National Scholar with Dr. Wang’s group. I am also co-advising with Dr. Wang a student from Zhejiang University, working on the logistics of the plant at Zhanjiang City. I gave him my model and he just took off with it. One of my master’s students, Isaac Serbin, spent three months working on the optimization of sweet sorghum logistics pathways.
I hope these collaborative projects, which involve about nine universities in the United States and Europe, will continue for the next two years. The program has given me an opportunity to see real systems being built in China. One of the purposes of our coming to China for the China-US Joint Symposium E3C was to meet with other researchers and expand this col-laboration. In the future, I would like to pursue other grants to encourage partnerships for international research and education and bring on board even more Chinese and American universi-ties to work together on these issues.
122 | ENERGY,ECOSYSTEM,ANDENVIRONMENTALCHANGE
Forest Resources for Bioenergy in the Southeastern USA: Examples of Modeling to Optimize Bioenergy Plants and to Assess Sustainability
by Yun Wu
With the development of forest based bioenergy, concerns on forest resource sustainability have led scientists to examine forest land use change and forest markets. In order to avoid the unintended conse-
quences resulting from the first generation of bioenergy fuels, implementation of second generation biofuels has been carried out with caution. Sustainability is emphasized as the solution. The possibly negative impacts from biofuel can be minimized under a sustainable forest management and utilization scheme.
Three issues receive considerable attention in the literature, 1) the classic debate on the competition between food/feed/fiber and fuel production, 2) the multiple biomass-to-biofuel pathways currently available or available in the near future, from which various feedstocks can be selected to produce biofuel, and 3) the need for a static calibration model linked to a dynamic model for better estimates of market forces.
To better understand the issues quantitatively, I focus on two modeling efforts. First, I collaborated with the International Institute for Applied Systems Analysis in Austria to update the spatial model BEWHERE. In the second effort, which is my dissertation topic, I worked on an integrated multi-feedstock modeling system with Gbadebo Oladosu in the Environmental Sciences Division at Oak Ridge National Laboratory.
SPATIALLY EXPLICIT LOGISTIC MODEL It is widely recognized that both bioenergy plants and con-verted forest biorefineries are able to produce biofuel, but they use different amounts of biomass input and are operated in dif-ferent types of facilities. In addition, the competition between pulp mills and energy plants for wood input and the cellulosic biofuel market is very important for biofuel production decision making. In order to reflect this competition, the mixed integer programming model BeWhere, which was used in a study by the Austrian researcher Sylvain Leduc to determine the optimal location of a new bioenergy plant, is extended to include the biofuel potential from pulp mills.
The full supply chain costs include the costs for biomass har-vesting; production operation; investment in plants, mills, and gas stations; handling and delivery of biofuel at the gas station; and transportation of biomass and biofuel. The supply of bio-mass comes from forest wood harvests, wood imports, sawmill
co-products, and converted pulp mill by-products. The biomass supply satisfies the demand from pulp and paper mills, bioen-ergy plants, and private households. The energy supply can be met from fossil fuel, biofuel imports, new bioenergy plants, and converted pulp mills.
The new model can be used to plan the optimal locations and numbers of new bioenergy plants, and/or converted pulp mills, and/or new gas stations by minimizing the costs of the entire supply chain, under a biofuel mix target and carbon prices. The competition between biofuel and fossil fuel is also explored in the model. At any given fossil fuel price, the system chooses the most economical way to satisfy energy demand. It is also possible to mandate a biofuel standard and see how it changes the average cost of producing biofuel. Furthermore, it calculates the optimal supply of forest biomass flow to consumers, such as new production plants, existing pulp mills, residential regions, and the average overall cost of the entire supply chain. Thus the implications of bioenergy production on forest resource sustainability can be studied as well.
INTEGRATED MULTI-FEEDSTOCK MODELING SYSTEM This modeling effort aims to examine forest resource sus-tainability as a result of changes in bioenergy related policy, demand pattern, and technology. It does not try to solve all the issues associated with bioenergy development at one time. Instead, it provides insights into the bioenergy implications on the forest resource market and sustainability. In addition, my work generates critical variables that can be used for policy and environmental assessment.
The methodology involves mainly three models, POLYSYS, multi-feedstock model (MFM), and Sub-Regional Timber Supply Model (SRTS). Both POLYSYS and SRTS are ready to execute new runs, whereas the calibration model MFM is developed in this study to link the other two models and reflect biofuel production/cost functions. All the equations in MFM are calibrated to the simulation output of a demand-run to meet the requirements of the Energy Independence and Secu-rity Act of 2007 and also bio-electricity and biodiesel targets as specified in POLYSYS. With the calibration results, the different types of biofuel and their corresponding feedstocks are allocated for each year so they represent the resources needed to produce enough biofuel to reach the RFS target, including corn, corn stover, switchgrass, poplar, forest biomass, and others.
Ms. Wu is a Research Associate at the Bioenergy Program, Environmental Sciences Division, Oak Ridge National Laboratory, and a Doctoral Candidate in the Forestry Department, North Carolina State University. W
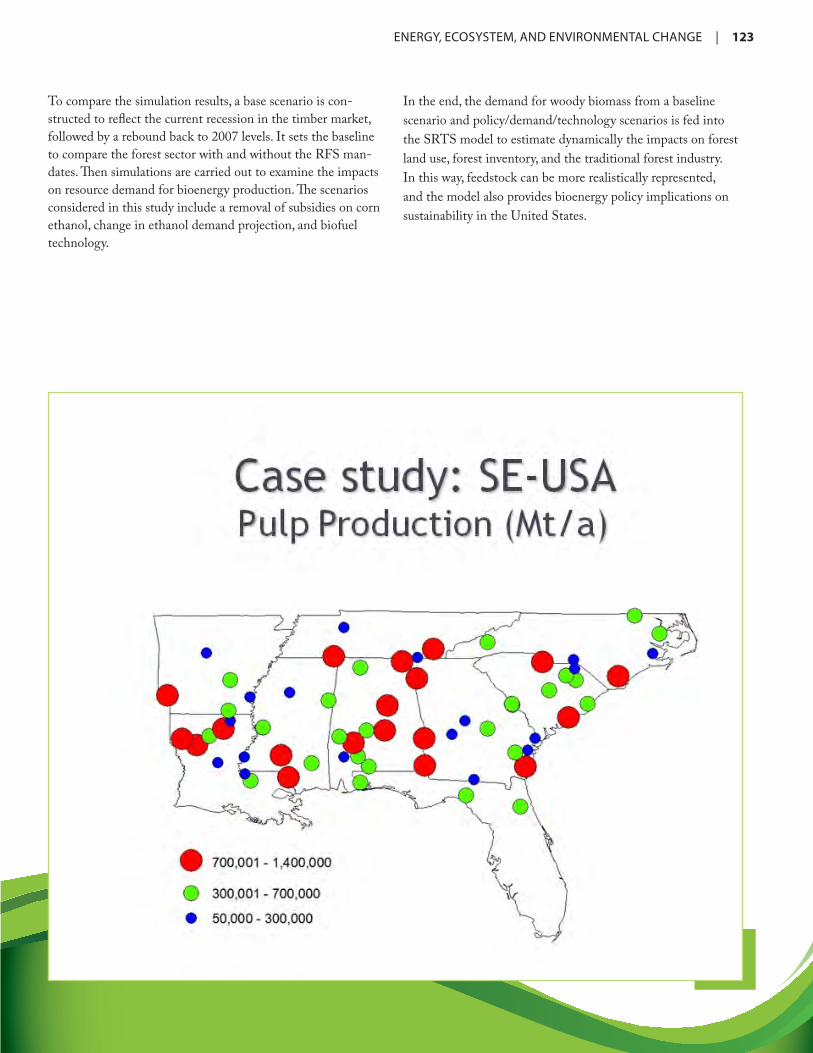
ENERGY,ECOSYSTEM,ANDENVIRONMENTALCHANGE | 123
To compare the simulation results, a base scenario is con-structed to reflect the current recession in the timber market, followed by a rebound back to 2007 levels. It sets the baseline to compare the forest sector with and without the RFS man-dates. Then simulations are carried out to examine the impacts on resource demand for bioenergy production. The scenarios considered in this study include a removal of subsidies on corn ethanol, change in ethanol demand projection, and biofuel technology.
In the end, the demand for woody biomass from a baseline scenario and policy/demand/technology scenarios is fed into the SRTS model to estimate dynamically the impacts on forest land use, forest inventory, and the traditional forest industry. In this way, feedstock can be more realistically represented, and the model also provides bioenergy policy implications on sustainability in the United States.

124 | ENERGY,ECOSYSTEM,ANDENVIRONMENTALCHANGE
Optimization of Straw Utilization in China for Greenhouse Gas Mitigation
by Fei Lu
Since the 1980s, with the rise of crop yields, millions of tons of straw are produced every year in China as an agricultural byproduct. Many farmers want to save the expense of handling this straw and sow the next crop in a timely fashion, so they burn the straw
in the field. Each year, more than 100 million tons of straw are burned, resulting in increased risk of fire, air pollution, traffic accidents, and greenhouse gas (GHG) emissions.
The Chinese government has made great progress in recent years in prohibiting straw burning and popularizing techniques to optimize the utilization of straw and at the same time pro-vide opportunities to mitigate GHG emissions.
One straw treatment or utilization alone such as returning straw to the field or using it to produce bioenergy does not improve net mitigation potential. Straw contains large amounts of carbon and nitrogen, which will never vanish. Different treatments of straw will result in widely varying levels of GHG emissions. Some treatments, however, may demonstrate GHG mitigation potential when compared with current practices (Lu, et al., 2010a). Researchers in the State Key Laboratory of Ur-. Researchers in the State Key Laboratory of Ur-ban and Regional Ecology are comparing the potential effects of returning straw to the land with the potential of using straw to produce bioenergy.
STRAW RETURNFirst we set out to determine the potential of soil carbon sequestration and net mitigation over time of returning straw to the land. We gathered 117 pairs of long term experimental data gathered from four cultural regions in China. We found a significant linear relationship between soil carbon sequestration rates and the amount of straw returned in all four regions (Lu, et al., 2009).
In China the total amount of straw production is 620 million tons per year. About 50 percent of this straw is used as forage, industrial feedstock, or inefficiently burned household fuels. In this study we focused just on the 330 million tons of straw that is returned to or burned in the field. We used two scenarios, one the actual rate at which straw was returned to the field in 2005, and a second scenario under which straw return is fully popularized, or adopted by farmers. The results showed that full popularization of returning straw to the field instead of burning
Dr. Lu is an Assistant Research Professor in the State Key Laboratory of Urban and Regional Ecology, Research Center for Eco-Environmental Sciences, Chinese Academy of Sciences.
it would raise soil carbon sequestration by 13 million tons of carbon (TgC) per year.
Straw burning and straw return is related to several processes of GHG mitigation, emissions, and sequestration. We used a Straw Return and Burning Model (SRBM; Lu, et al., 2010a) with six components to determine the global warming potential of the emissions, mitigation, and sequestration to obtain the total effective GHG emissions of each scenario and the net mitigation potential of implementing straw return.
We assumed that the nitrogen in the straw would replace the same amount of synthetic nitrogen fertilizer, so the nitrogen in-put in the two scenarios is the same. Then we took into account direct nitrous oxide (methane) emissions. We also modeled the additional machinery used for straw return, the amount of soil carbon sequestration, methane emissions from paddy fields, and emissions from straw burning. These inputs are used to esti-mate the total GHG emissions and net mitigation potential of returning straw.
The results of the SRBM modeling show that due to counter-action of GHG leakage, especially methane emissions from rice paddies, the net mitigation rate of 15 provinces in the southern part of China would be lower than soil carbon sequestration rates. Straw return in Fujian, Jiangxi, Hunan and Guangdong provinces would lead to an increase in GHG emissions. The total net mitigation potential of the other 27 provinces was equivalent to 0.687 percent of the annual carbon emissions from fossil fuel combustion in 2005(Lu, et al., 2010b).
STRAW FOR BIOENERGYWe also used the SRBM to answer questions related to the use of straw as bioenergy. One question is whether straw return is the best way to mitigate GHG emissions and second, how can we deal with the straw in the rice paddies in the southern part of China? To answer those questions we weighed the advan-tages and drawbacks of three uses of straw: burning, returning to the soil, and using straw for bioenergy. If we think of these scenarios as the three sides of a triangle, we can imagine the three axes, the bioenergy axis, the burning axis, and the return axis. At the extreme of each scenario, we can model the effects of the percentage of each utilization along a continuum from 0.0 to 100 percent. We can then forecast the effects of differ-ent percentages, for example straw return at 30 percent, straw
S
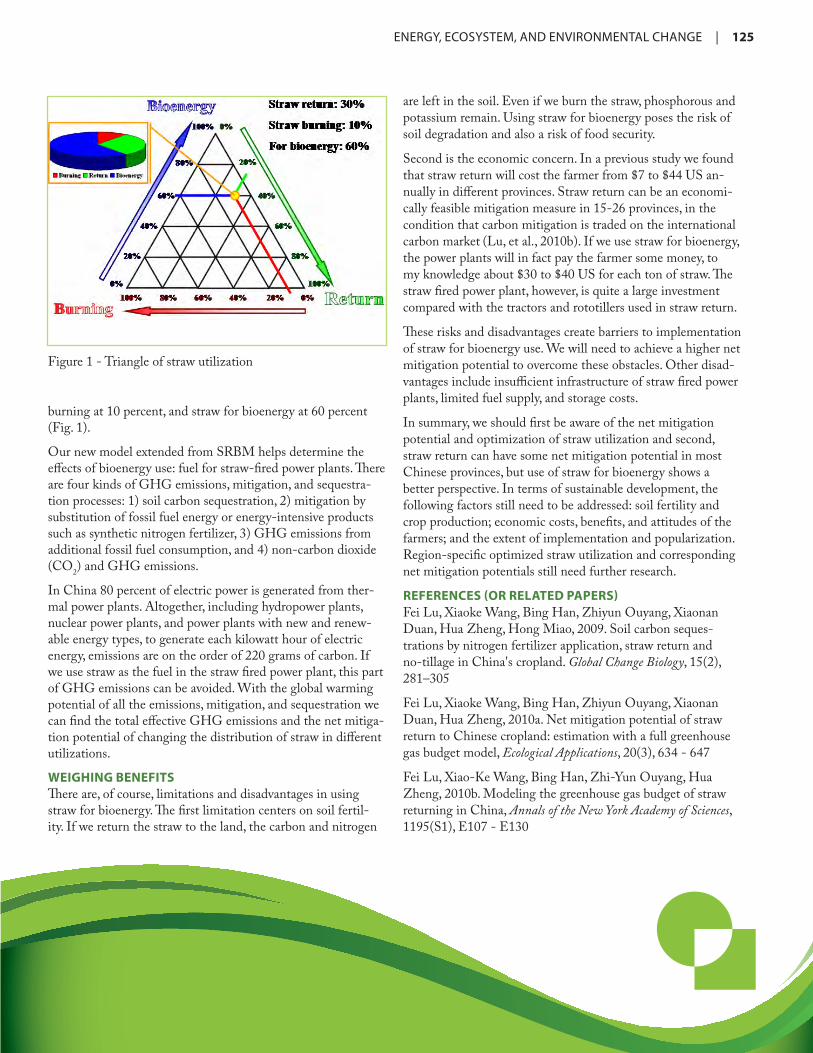
ENERGY,ECOSYSTEM,ANDENVIRONMENTALCHANGE | 125
burning at 10 percent, and straw for bioenergy at 60 percent (Fig. 1).
Our new model extended from SRBM helps determine the effects of bioenergy use: fuel for straw-fired power plants. There are four kinds of GHG emissions, mitigation, and sequestra-tion processes: 1) soil carbon sequestration, 2) mitigation by substitution of fossil fuel energy or energy-intensive products such as synthetic nitrogen fertilizer, 3) GHG emissions from additional fossil fuel consumption, and 4) non-carbon dioxide (CO2) and GHG emissions.
In China 80 percent of electric power is generated from ther-mal power plants. Altogether, including hydropower plants, nuclear power plants, and power plants with new and renew-able energy types, to generate each kilowatt hour of electric energy, emissions are on the order of 220 grams of carbon. If we use straw as the fuel in the straw fired power plant, this part of GHG emissions can be avoided. With the global warming potential of all the emissions, mitigation, and sequestration we can find the total effective GHG emissions and the net mitiga-tion potential of changing the distribution of straw in different utilizations.
WEIGHING BENEFITSThere are, of course, limitations and disadvantages in using straw for bioenergy. The first limitation centers on soil fertil-ity. If we return the straw to the land, the carbon and nitrogen
are left in the soil. Even if we burn the straw, phosphorous and potassium remain. Using straw for bioenergy poses the risk of soil degradation and also a risk of food security.
Second is the economic concern. In a previous study we found that straw return will cost the farmer from $7 to $44 US an-nually in different provinces. Straw return can be an economi-cally feasible mitigation measure in 15-26 provinces, in the condition that carbon mitigation is traded on the international carbon market (Lu, et al., 2010b). If we use straw for bioenergy, the power plants will in fact pay the farmer some money, to my knowledge about $30 to $40 US for each ton of straw. The straw fired power plant, however, is quite a large investment compared with the tractors and rototillers used in straw return.
These risks and disadvantages create barriers to implementation of straw for bioenergy use. We will need to achieve a higher net mitigation potential to overcome these obstacles. Other disad-vantages include insufficient infrastructure of straw fired power plants, limited fuel supply, and storage costs.
In summary, we should first be aware of the net mitigation potential and optimization of straw utilization and second, straw return can have some net mitigation potential in most Chinese provinces, but use of straw for bioenergy shows a better perspective. In terms of sustainable development, the following factors still need to be addressed: soil fertility and crop production; economic costs, benefits, and attitudes of the farmers; and the extent of implementation and popularization. Region-specific optimized straw utilization and corresponding net mitigation potentials still need further research.
REFERENCES (OR RELATED PAPERS)Fei Lu, Xiaoke Wang, Bing Han, Zhiyun Ouyang, Xiaonan Duan, Hua Zheng, Hong Miao, 2009. Soil carbon seques-trations by nitrogen fertilizer application, straw return and no-tillage in China's cropland. Global Change Biology, 15(2), 281–305
Fei Lu, Xiaoke Wang, Bing Han, Zhiyun Ouyang, Xiaonan Duan, Hua Zheng, 2010a. Net mitigation potential of straw return to Chinese cropland: estimation with a full greenhouse gas budget model, Ecological Applications, 20(3), 634 - 647
Fei Lu, Xiao-Ke Wang, Bing Han, Zhi-Yun Ouyang, Hua Zheng, 2010b. Modeling the greenhouse gas budget of straw returning in China, Annals of the New York Academy of Sciences, 1195(S1), E107 - E130
Figure 1 - Triangle of straw utilization

126 | ENERGY,ECOSYSTEM,ANDENVIRONMENTALCHANGE

Envi
ronm
enta
l Cha
nge
and
Hea
lth

128 | ENERGY,ECOSYSTEM,ANDENVIRONMENTALCHANGE
Colloid Transport and Mobilization Under Transient Unsaturated Flow Conditions
by Jie Zhuang
On a global scale, flooding has been much in the news in recent years. As we know, flood water is definitely not clear water, it is very dirty. The cloudiness in floodwater is mostly due to colloi-dal particles (smaller than two micrometers in
diameter), and those tiny particles usually contain a large con-centration of contaminants. My research on colloid transport and mobilization under transient unsaturated flow conditions addresses two major issues, the significance of colloid transport, and the factors that control colloid transport. In addition, I have been working on some basic methods for the study of col-loid transport in the laboratory. In the past three years, we have made good progress on these laboratory techniques. Many contaminants such as pathogens, metals, and low-solu-bility organics are colloidal particles or are sorbed on colloids. We need to understand how these contaminated colloids are transported through water or soil systems and how they are fil-trated through these systems. In the case of riverbank filtration, we need to know 1) the distance between surface water and groundwater; 2) how subsurface soils and sediment can filter the particle contaminants, for example viruses, bacteria and protozoa; 3) and whether the aquifer sediments can filtrate pathogens and reduce contaminant transport. For risk assessment, we need to understand the maximum distance that col-loidal contaminants travel from surface water to ground water level.
Aside from understanding the natural systems at work in filtra-tion, some research has addressed the use of nanoparticles, engineered colloids that can be used for sub-surface remediation of contamina-tion by toxic substances. In recent years, this method has been used on some biodegradable materials to coat the surface of iron nanopar-ticles and increase the transport
of the nanoparticles away from the location of injection. One problem with this approach is that, although we can control the transport of the material, there are other factors that compli-cate the process, including changes in geochemistry and liquid chemistry.
There are four categories of factors that control the transport of colloids:
• solution chemistry: ionic strength, chemical composition, and pH;
• hydrological conditions: soil water content, flow rate, and flow pattern;
• properties of soil and sediments: geochemical heterogeneity, grain size, structure, and pores;
• colloid properties: surface chemistry, particle size, and ag-gregation.
If we look at an illustration of natural soil, we can see how complicated the transport issue is. Soil has a layered structure
Dr. Zhuang is a Research Director for the Institute for a Secure and Sustainable Environment and a Research Associate Professor in the Department of Biosystems Engineering and Soil Science at the University of Tennessee. He is also the coordinator of the China-U.S. Joint Research Center for Ecosystem and Environmental Change.O

ENERGY,ECOSYSTEM,ANDENVIRONMENTALCHANGE | 129
so the liquid that contains colloids does not actually move forward in uniform concentration and across the entire affected zone. It may preferentially flow horizontally and vertically.
The dominant mechanisms that control colloid transport are 1) attachment at the solid-water interface including mineral chemistry, roughness, and surface area; 2) film straining via water-film thickness (pore water saturation) and continuity, and air-water-solid interfaces; and 3) mechanical straining, which depends on pore geometry, pore size, and pore continuity. Moreover, colloid transport is very different in fine-textured soil than in coarse-textured soil.
LABORATORY APPROACHESIn the past 30 years or so, more than 2,000 papers have been published on colloid transport. Of those, 80 percent included only steady-state flow conditions, which do not effectively represent natural vadose zones, where transient flows such as infiltration and drainage tend to dominate. These systems can-not meet the requirement for complicated research on colloid transport.
In our laboratory, we have developed a one-dimensional (1-D) non-steady state flow system to detect colloid transport under water-unsaturated flow conditions. With a vertical column system, we pump an input solution into a soil column from the top of the column, which is connected to a vacuum chamber at the bottom of the column. By adjusting the pressure inside the chamber, we can control the soil water content and flow condi-tions very well. Meanwhile we use a gamma-ray attenuation system to detect the water content as it changes at different depths of the soil column. With the horizontal column system, we can quantify colloid transport driven by capillary forces, detect colloid distribution along the column and its relation to water distribution, and estimate colloid transport speed. Assisted with an existing hydraulic modeling technique, this horizontal column approach provides a very useful method to investigate colloid transport and mobilization under various flow conditions.
A natural system, however, is actually a 3-D system; water does not move in one direction but in three directions. The systems we designed at the University of Tennessee include a 2-D non-steady state flow system, and a 3-D non-steady state flow system. The 2-D system can be used to conduct unsaturated transient transport experiments in a wide range of soil water content. Further, the 2-D system allows us to label colloids
with radioactive tracers, such as cerium-141, and then use a gamma-ray system to collect energy information for water and colloids and trace water movement and colloid movement in water-unsaturated porous media. The 3-D system is used to examine an undisturbed soil core. We have applied this system to Hanford sediments, soil collected from a nuclear waste site in Hanford, Washington.
IMPLICATIONS OF FINDINGSIn general, we have found increased transport under non-steady state, transient flow conditions compared with the steady state flow conditions. In studying the coupled effect of ionic strength and flow rate/water content, we observe that a high flow rate can overcome electrostatic attachment. In addition, the remo-bilization of colloids due to water redistribution/drainage is the result of a capillary effect induced by the dimensional change of water film.
Transient flow can exert greater impact on colloid transport under preferential flow condition and in heterogeneous porous media than under uniform flow and soil conditions. This impact can be observed using our 2-D and 3-D transport systems in the laboratory. Our studies indicate that transport is facilitated by low liquid surface tension. Decreasing solution surface tension increases colloid mobility, but slows down travel. This effect is related to electrostatic forces, capillary forces, pore water configuration (unsaturated), and liquid mobility. The surface tension effect is much more significant at lower than higher ionic strengths. Colloid retained in the soil decreases exponentially with travel distance. This effect is related to water distribution, soil texture (mechanical straining), and geochemi-cal heterogeneity. The decay of colloid mass with travel distance is strengthened by increasing ionic strength and surface tension of liquid.
Our recent research on colloid retention, transport, and re-mobilization under transient unsaturated flow conditions in engineered systems is of primary importance for the assessment and prediction of the fate and migration in natural systems of colloidal contaminants such as viruses, pathogenic bacteria, protozoans, nano-/micro-sized industry particles, and toxic chemicals sorbed to mobile mineral colloids. However, further studies are needed to clarify the roles of soil organic matter, pore-controlled diffusion, and biofilm in controlling the flux of colloidal contaminants under alternating drying and wetting cycles.

130 | ENERGY,ECOSYSTEM,ANDENVIRONMENTALCHANGE
PAH-Degrading Mycobacteria: Distribution, Prevalence, and Evolution
by Jennifer DeBruyn
We know that polycyclic aromatic hydrocar-bons (PAHs) are widespread and persistent environmental contaminants. While there are many natural sources of PAHs such as forest fires, the ones we tend to be con-
cerned about are from anthropogenic sources such as coal tar and creosote-type contaminants. Sixteen of these compounds have been designated by the US Environmental Protection Agency as priority pollutants. A major challenge with PAHs is that they are recalcitrant in the environment due to their low aqueous solubility. Environmental concerns include document-ed toxic, mutagenic, and carcinogenic effects. PAHs have also been linked with cardiovascular disease. Microbial degradation is a primary route of attenuation and removal of PAHs from the environment. Due to their environmental recalcitrance, however, PAHs may be sequestered in sediments and resist biodegradation.
PAH-DEGRADING MYCOBACTERIAMicrobial degradation represents one of the primary means of attenuation and removal of PAH compounds from aerobic environments. Many bacteria have been characterized that can biodegrade PAHs. One particular group of these falls into the genus Mycobacterium. This genus contains some of the more infamous pathogenic species such as M. tuberculosis, however our research focuses on nonpathogenic Mycobacteria common in soils and sediments. They are of interest for some of their metabolic characteristics. In particular they can degrade high molecular weight PAHs (compounds with four or five ben-zene rings). For a long time these high molecular weight PAH compounds were thought not to be biodegradable so when the first Mycobacterium was identified that could remove PAHs, it was an important discovery. It was thought that perhaps its hydrophobic cell wall might help in accessing poorly bioavail-able PAHs; there is evidence that Mycobacterium cells can attach themselves to the surface of anthracene, giving them a special adaptation for accessing some of these chemicals in the environment.
The best characterized species of PAH-degrading Mycobacteri-um is M. vanbaalennii PYR-1. This strain was isolated in 1988 from a coal tar-contaminated soil. Its degradation pathways
are well characterized: Major degradation occurs via initial dihydroxylation by a pyrene dioxygenase (NidAB). Secondary detoxification occurs via initial dihydroxylation by an alternate pyrene dioxygenase (NidA3B3).
Other PAH-degrading Mycobacteria have been isolated from a wide variety of soils and sediments. This leads us to wonder: if these organisms have such a unique metabolism with respect to high molecular weight PAHs, what is their distribution and abundance in contaminated sediments and how do they relate to other PAH degrading organisms?
To answer such questions about PAH degrading organisms, we can use PAH dioxygenase genes as biomarkers for PAH-degrading populations. These genes work well as biomarkers because dioxygenases are substrate specific, so pyrene dioxygen-ase is indicative of populations that are using pyrene. We also know that the dioxygenases are related to PAH concentrations. A number of studies have related quantities of biomarkers to actual PAH concentrations and PAH degradation activity. In my research I have designed real time quantitative polymerase chain reaction (PCR) assays to target particular groups of PAH degrading organisms. One of these is a pyrene dioxygenase (DO) gene, nidA.
PAH-DEGRADING MYCOBACTERIA IN CHATTANOOGA CREEK AND LAKE ERIEChattanooga Creek in Tennessee is one of two sites where we are using these quantitative PCR assays. The other is a site at Lake Erie.
These represent two different contamination profiles: Chat-tanooga Creek site is a heavily contaminated creek that empties into the Tennessee River. It contains very high levels of con-tamination from coal tar and mixed industrial waste. Nonaque-ous- based liquid creosote is still visible in the sediment and floating on the surface. Lake Erie is the smallest of the Great Lakes. It lies on the border between Canada and the United States. Lake Erie receives input from a variety of industrial activities and has lower levels of contamination than Chatta-nooga Creek.
We used quantitative PCR assays to look for biomarkers of high molecular weight PAH biodegradation (Mycobacterium
This paper was co-authored by Gary Sayler. Dr. DeBruyn is an Assistant Professor in the Department of Biosystems Engineering and Soil Science, University of Tennessee (UT). Dr. Sayler is the Director of the Center for Environmental Biotechnology and the UT-Oak Ridge National Laboratory Joint Institute for Biological Sciences. W
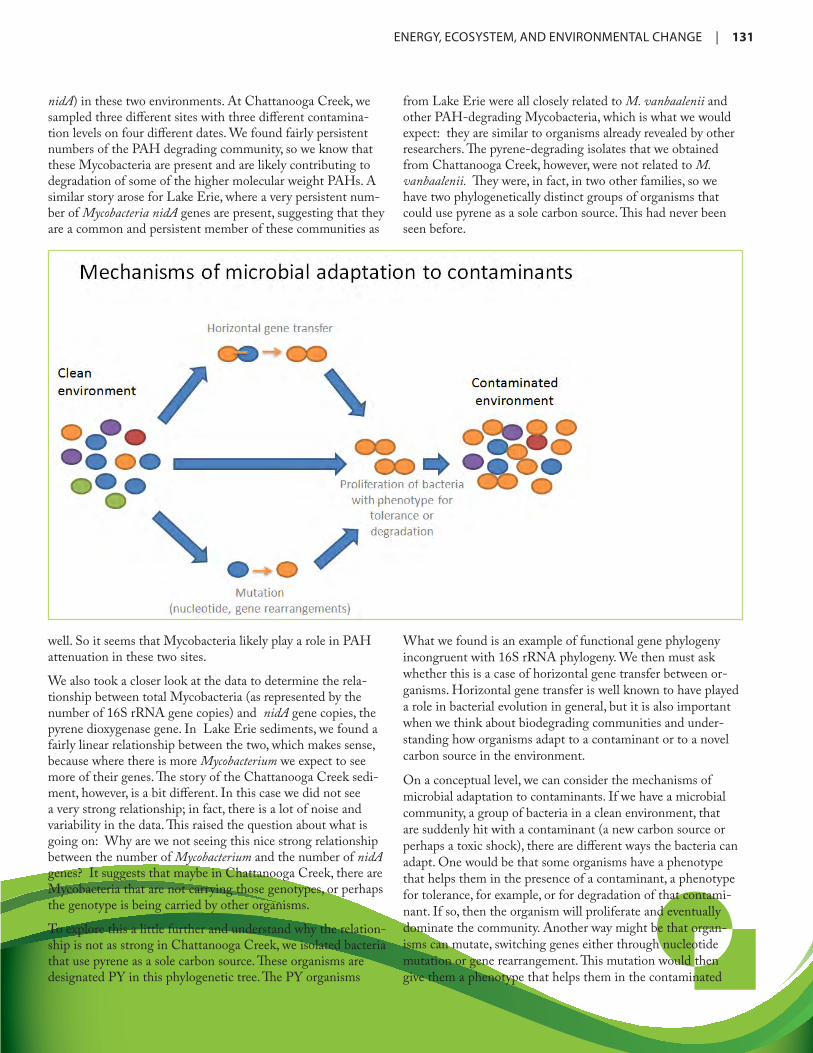
ENERGY,ECOSYSTEM,ANDENVIRONMENTALCHANGE | 131
nidA) in these two environments. At Chattanooga Creek, we sampled three different sites with three different contamina-tion levels on four different dates. We found fairly persistent numbers of the PAH degrading community, so we know that these Mycobacteria are present and are likely contributing to degradation of some of the higher molecular weight PAHs. A similar story arose for Lake Erie, where a very persistent num-ber of Mycobacteria nidA genes are present, suggesting that they are a common and persistent member of these communities as
from Lake Erie were all closely related to M. vanbaalenii and other PAH-degrading Mycobacteria, which is what we would expect: they are similar to organisms already revealed by other researchers. The pyrene-degrading isolates that we obtained from Chattanooga Creek, however, were not related to M. vanbaalenii. They were, in fact, in two other families, so we have two phylogenetically distinct groups of organisms that could use pyrene as a sole carbon source. This had never been seen before.
well. So it seems that Mycobacteria likely play a role in PAH attenuation in these two sites.
We also took a closer look at the data to determine the rela-tionship between total Mycobacteria (as represented by the number of 16S rRNA gene copies) and nidA gene copies, the pyrene dioxygenase gene. In Lake Erie sediments, we found a fairly linear relationship between the two, which makes sense, because where there is more Mycobacterium we expect to see more of their genes. The story of the Chattanooga Creek sedi-ment, however, is a bit different. In this case we did not see a very strong relationship; in fact, there is a lot of noise and variability in the data. This raised the question about what is going on: Why are we not seeing this nice strong relationship between the number of Mycobacterium and the number of nidA genes? It suggests that maybe in Chattanooga Creek, there are Mycobacteria that are not carrying those genotypes, or perhaps the genotype is being carried by other organisms.
To explore this a little further and understand why the relation-ship is not as strong in Chattanooga Creek, we isolated bacteria that use pyrene as a sole carbon source. These organisms are designated PY in this phylogenetic tree. The PY organisms
What we found is an example of functional gene phylogeny incongruent with 16S rRNA phylogeny. We then must ask whether this is a case of horizontal gene transfer between or-ganisms. Horizontal gene transfer is well known to have played a role in bacterial evolution in general, but it is also important when we think about biodegrading communities and under-standing how organisms adapt to a contaminant or to a novel carbon source in the environment.
On a conceptual level, we can consider the mechanisms of microbial adaptation to contaminants. If we have a microbial community, a group of bacteria in a clean environment, that are suddenly hit with a contaminant (a new carbon source or perhaps a toxic shock), there are different ways the bacteria can adapt. One would be that some organisms have a phenotype that helps them in the presence of a contaminant, a phenotype for tolerance, for example, or for degradation of that contami-nant. If so, then the organism will proliferate and eventually dominate the community. Another way might be that organ-isms can mutate, switching genes either through nucleotide mutation or gene rearrangement. This mutation would then give them a phenotype that helps them in the contaminated

132 | ENERGY,ECOSYSTEM,ANDENVIRONMENTALCHANGE
environment. Another way adaptation can occur is through horizontal gene transfer, where an organism with a desirable phenotype transfers it to another organism.
The concept that organisms can share phenotypes, can share functions between each other to give them a selective advan-tage in a contaminated environment, is not new. Many other examples of horizontal gene transfer or mobile genetic ele-ments containing biodegradation genes have been identified in a variety of organisms. This mechanism has been well studied for other systems but so far not in the case of high molecular weight PAHs for Mycobacterium.
COMPARATIVE GENOMICS OF FIVE PAH-DEGRADING MYCOBACTERIA
We used comparative genomics of five characterized Mycobac-terium spp. that are known to degrade high molecular weight PAHs to identify possible mobile genomic elements. There were several pieces of evidence suggesting that horizontal gene transfer of PAH degradation genes has occurred in Mycobacte-ria. First, we observed the presence of mobile genetic element genes such as transposases and integrases localized with the clusters of PAH degradation genes. Second, we see variations in genomic localization: these genes are localized in different regions of the genome in different strains, and in some strains, these genes appear on plasmids as well. Third, we observed homology between these regions enriched in PAH-biodegra-
dative genes; these regions were highly similar compared to the rest of the genome in terms of both nucleotide similarity and synteny (conservation of gene order). And finally, deviation in the nucleotide content in terms of percentage of guanine-cytosine (GC) of these regions compared to the rest of the genome suggests they were, at some point, acquired through horizontal gene transfer. None of these pieces of evidence in and of themselves would necessarily suggest mobility, but when you take all these clues together, the results seem to point to the fact that horizontal gene transfer of these PAH degradation gene clusters occurred in Mycobacterium.
In summary, we know that PAH-degrading Mycobacteria are prevalent and persistent in contaminated sediments. In addition, non-Mycobacteria pyrene-degrading isolates from Chattanooga Creek reveal other genera that can degrade high molecular weight PAHs and suggest horizontal gene transfer between families. Evidence from comparative genomics shows that genomic regions encoding PAH biodegradation pathways likely have been horizontally transferred between Mycobacte-ria. This provides insight into the evolution of biodegradation pathways and an explanation for the broad distribution and prevalence of Mycobacteria in contaminated environments. Ultimately this research has implications for our understanding of how microbial communities adapt to contaminants and how they can acquire new biodegradative functions.
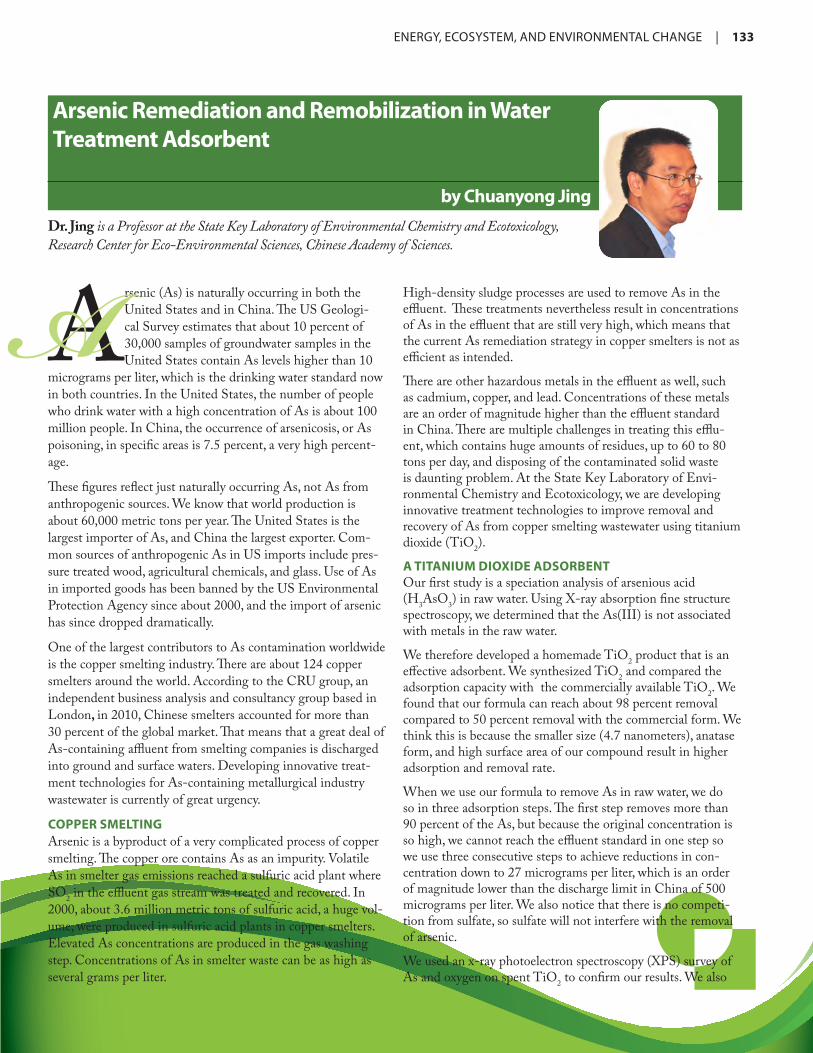
ENERGY,ECOSYSTEM,ANDENVIRONMENTALCHANGE | 133
Arsenic Remediation and Remobilization in Water Treatment Adsorbent
by Chuanyong Jing
Arsenic (As) is naturally occurring in both the United States and in China. The US Geologi-cal Survey estimates that about 10 percent of 30,000 samples of groundwater samples in the United States contain As levels higher than 10
micrograms per liter, which is the drinking water standard now in both countries. In the United States, the number of people who drink water with a high concentration of As is about 100 million people. In China, the occurrence of arsenicosis, or As poisoning, in specific areas is 7.5 percent, a very high percent-age.
These figures reflect just naturally occurring As, not As from anthropogenic sources. We know that world production is about 60,000 metric tons per year. The United States is the largest importer of As, and China the largest exporter. Com-mon sources of anthropogenic As in US imports include pres-sure treated wood, agricultural chemicals, and glass. Use of As in imported goods has been banned by the US Environmental Protection Agency since about 2000, and the import of arsenic has since dropped dramatically.
One of the largest contributors to As contamination worldwide is the copper smelting industry. There are about 124 copper smelters around the world. According to the CRU group, an independent business analysis and consultancy group based in London, in 2010, Chinese smelters accounted for more than 30 percent of the global market. That means that a great deal of As-containing affluent from smelting companies is discharged into ground and surface waters. Developing innovative treat-ment technologies for As-containing metallurgical industry wastewater is currently of great urgency.
COPPER SMELTINGArsenic is a byproduct of a very complicated process of copper smelting. The copper ore contains As as an impurity. Volatile As in smelter gas emissions reached a sulfuric acid plant where SO2 in the effluent gas stream was treated and recovered. In 2000, about 3.6 million metric tons of sulfuric acid, a huge vol-ume, were produced in sulfuric acid plants in copper smelters. Elevated As concentrations are produced in the gas washing step. Concentrations of As in smelter waste can be as high as several grams per liter.
High-density sludge processes are used to remove As in the effluent. These treatments nevertheless result in concentrations of As in the effluent that are still very high, which means that the current As remediation strategy in copper smelters is not as efficient as intended.
There are other hazardous metals in the effluent as well, such as cadmium, copper, and lead. Concentrations of these metals are an order of magnitude higher than the effluent standard in China. There are multiple challenges in treating this efflu-ent, which contains huge amounts of residues, up to 60 to 80 tons per day, and disposing of the contaminated solid waste is daunting problem. At the State Key Laboratory of Envi-ronmental Chemistry and Ecotoxicology, we are developing innovative treatment technologies to improve removal and recovery of As from copper smelting wastewater using titanium dioxide (TiO2).
A TITANIUM DIOXIDE ADSORBENTOur first study is a speciation analysis of arsenious acid (H3AsO3) in raw water. Using X-ray absorption fine structure spectroscopy, we determined that the As(III) is not associated with metals in the raw water.
We therefore developed a homemade TiO2 product that is an effective adsorbent. We synthesized TiO2 and compared the adsorption capacity with the commercially available TiO2. We found that our formula can reach about 98 percent removal compared to 50 percent removal with the commercial form. We think this is because the smaller size (4.7 nanometers), anatase form, and high surface area of our compound result in higher adsorption and removal rate.
When we use our formula to remove As in raw water, we do so in three adsorption steps. The first step removes more than 90 percent of the As, but because the original concentration is so high, we cannot reach the effluent standard in one step so we use three consecutive steps to achieve reductions in con-centration down to 27 micrograms per liter, which is an order of magnitude lower than the discharge limit in China of 500 micrograms per liter. We also notice that there is no competi-tion from sulfate, so sulfate will not interfere with the removal of arsenic.
We used an x-ray photoelectron spectroscopy (XPS) survey of As and oxygen on spent TiO2 to confirm our results. We also
Dr. Jing is a Professor at the State Key Laboratory of Environmental Chemistry and Ecotoxicology, Research Center for Eco-Environmental Sciences, Chinese Academy of Sciences.A

134 | ENERGY,ECOSYSTEM,ANDENVIRONMENTALCHANGE
examined the pH effects to determine the optimum dosage for As removal. As we increased the pH to neutral, we found that using 30 grams/liter of TiO2 we can achieve more than 90 percent As removal at pH 6-7. An additional kinetics study showed that As removal follows pseudo-second order adsorption kinetics. In less than 10 minutes most of the As is adsorbed and reaches equilibrium, which means we only need small reactors to reach adsorption capacity very fast.
After adsorptive removal of arsenic from wastewater, we then used sodium hydroxide (NaOH) to recover the arsenic and regenerate TiO2. After the TiO2 regeneration process, As was recovered by thermo vaporization and subsequent precipitation of sodium arsenite.
This new “zero” sludge process could be used for As remedia-tion for acidic metallurgical industries using TiO2 for As adsorptive removal from wastewater, and subsequent spent adsorbent regeneration and As recovery using NaOH.

ENERGY,ECOSYSTEM,ANDENVIRONMENTALCHANGE | 135
Robustness of Archael Populations in Anaerobic Co-Digestion of Dairy and Poultry Wastes
by Qiang He
Animal agriculture in the United States is valued at more than $100 billion annually, and the ani-mals produce an estimated 13 trillion pounds of waste. That represents more than 300 times more waste than the amount of domestic wastewater
processed in US municipal wastewater plants. The natural, aero-bic decomposition of livestock manure releases large quantities of pathogens, excess nutrients, organic matter, solids, methane, ammonia, and odorants. Disposing of these large amounts of manure is getting more expensive as the cost of land rises, so alternative ways of dealing with the waste are being explored, particularly in Europe and to a lesser extent in the United States and China.
Milk producing animals drink lots of liquids and produce very dilute manure, which is collected in a pit or pond. Dealing with this waste is essentially an engineering problem. The current practice of dealing with dairy waste is to try to land apply it on the farm, but on many farms today the soil has become saturated with repeated application of manure. As the amount of waste accumulates, some dairy operations are disposing of waste off site, a costly solution to waste disposal.
ANAEROBIC CO-DIGESTIONLivestock waste material is composed of complex polymers: cellulose, other polysaccharides, and proteins. It can be fer-mented into products such as acetate, fatty acids, ethanol, hydrogen, and carbon dioxide. These products can be further converted into methane by methanogenesis. Methane released without control contributes to greenhouse gas (GHG) emis-sions. If we can harvest this methane we can use it as an energy source, converting waste into energy and at the same time reducing GHG emissions.
There are typically two processes to treat domestic and agricul-tural waste, aerobic and anaerobic digestion. Anaerobic diges-tion has several advantages over aerobic digestion, including lower operating costs, no need for costly additions of oxygen to the waste, lower production of sludge and thereby lower costs of disposal, and a higher level of pathogen destruction. In addition, anaerobic digestion produces methane as a renewable energy in a controlled environment.
There is, however, a problem with using dairy manure to pro-duce methane gas. The manure from dairy cows is very dilute
compared to that from beef cattle and from other livestock such as poultry. Using diary manure alone is not economically viable because of the amount of energy required to produce methane, including the heat necessary to bring the substrate to about 35° C to maintain efficiency.
In Europe, there is a system to separate organic from inorganic solid waste, so the organic fraction of the municipal waste could be used as supplement in anaerobic digestion. In the United States, no such system exists, but we do have a separate source of agricultural waste, poultry waste, that can be used to increase the efficiency of anaerobic digestion via co-digestion. Unlike dairy manure, poultry waste is concentrated with a lot of organic matter and relatively low moisture content. In ad-dition, dairy farms are often located close to poultry farms. If we combine these two waste streams, combining dairy waste with only 2.3 percent of total solids with poultry waste with 5.7 percent total solids, we can supplement dairy waste with a higher concentration of organic compounds. Co-digestion can therefore enhance the economic feasibility of using waste to generate methane.
One problem with poultry waste is its high content of organic nitrogen, which is converted into ammonia. Ammonia is toxic, especially to microorganisms that enhance production of meth-ane, the methanogens. The addition of dairy waste reduces the production of ammonia and can make the process feasible.
In our laboratory we have compared the performance of anaerobic co-digestors with control digestors using just dairy waste. By supplementing dilute dairy waste with poultry waste for anaerobic co-digestion we were able to increase the organic loading rate by 50 percent, resulting in improved biogas pro-duction. Elevated ammonia derived from poultry waste in the co-digestors did not lead to process inhibition at the organic loadings tested, demonstrating the feasibility of the anaerobic co-digestion of dairy and poultry wastes for improved treat-ment efficiency. We also found that the production of methane in the anaerobic co-digestors was stable following increases in organic loading and despite higher ammonia levels. To deter-mine the cause for this stability, we examined the population of the archaeal community in the co-digestor.
The stability of the anaerobic co-digestion process was linked to the robust archaeal microbial community, which remained
Dr. He is an Assistant Professor in the Department of Civil and Environmental Engineering, University of Tennessee.A
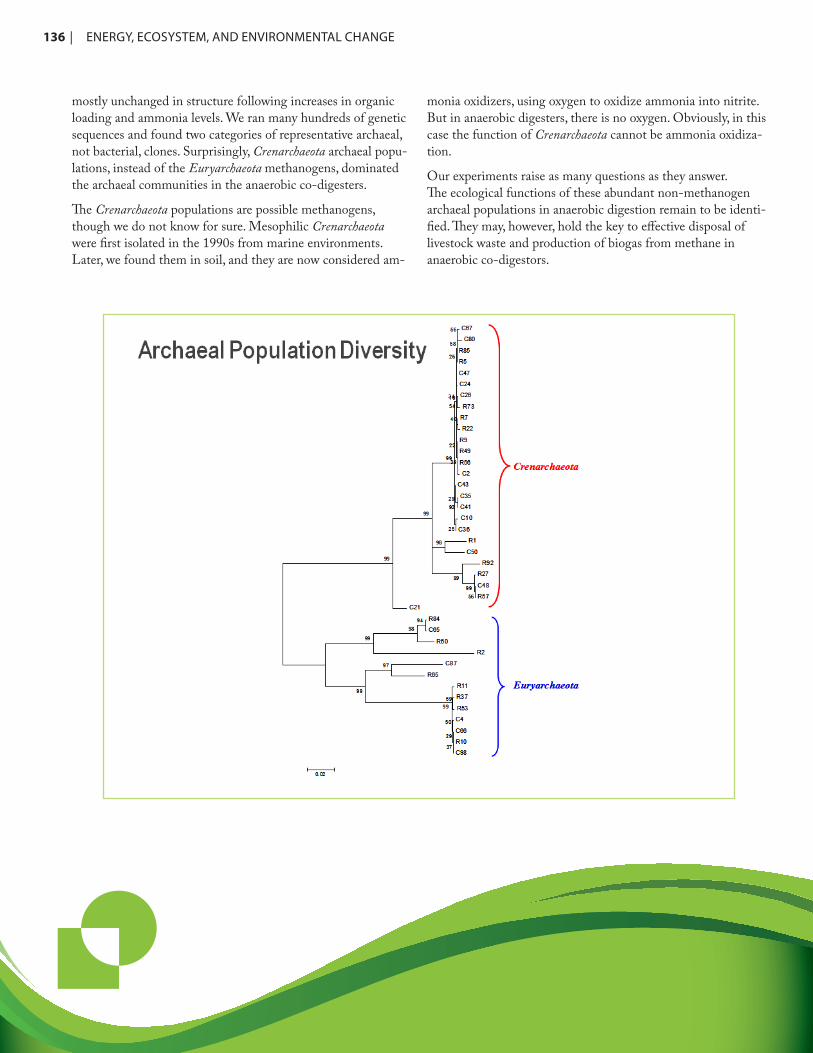
136 | ENERGY,ECOSYSTEM,ANDENVIRONMENTALCHANGE
mostly unchanged in structure following increases in organic loading and ammonia levels. We ran many hundreds of genetic sequences and found two categories of representative archaeal, not bacterial, clones. Surprisingly, Crenarchaeota archaeal popu-lations, instead of the Euryarchaeota methanogens, dominated the archaeal communities in the anaerobic co-digesters.
The Crenarchaeota populations are possible methanogens, though we do not know for sure. Mesophilic Crenarchaeota were first isolated in the 1990s from marine environments. Later, we found them in soil, and they are now considered am-
monia oxidizers, using oxygen to oxidize ammonia into nitrite. But in anaerobic digesters, there is no oxygen. Obviously, in this case the function of Crenarchaeota cannot be ammonia oxidiza-tion.
Our experiments raise as many questions as they answer. The ecological functions of these abundant non-methanogen archaeal populations in anaerobic digestion remain to be identi-fied. They may, however, hold the key to effective disposal of livestock waste and production of biogas from methane in anaerobic co-digestors.

ENERGY,ECOSYSTEM,ANDENVIRONMENTALCHANGE | 137
Preparation of Cationic Wheat Straw and its Application on Anionic Dye Removal
by Lifeng Yan
Research interests in our group at the Department of Chemical Physics at the University of Science and Technology of China have included conver-sion of biomass, green chemistry, and polymeric chemistry and physics. Recently we have pursued
novel polymeric materials of biomass or cellulose. We find that new polymeric materials from waste matter such as straw are potentially useful in the treatment of wastewater containing industrial dyes.
China is a major producer of dyes with industrial applications. Many of these dyes, such as Orange II, Acid Red 18, and Acid Blue 92 are negatively charged. It is considered difficult, if not impossible, to remove these negatively charged dyes from wastewater. We have therefore developed a process to prepare cationic wheat straw for the removal of anionic dyes from an aqueous solution.
The process involves two steps: pretreatment of straw to remove most of the lignin and the quaternization of the residual straw. In the pretreatment stage, wheat straw was delignified by
refluxing under atmospheric pressure in a 90 percent acetic acid (AcOH) aqueous solution that contained 4 percent sulfuric acid (H2SO4). The wheat straw residue was then quaternized by adding the treated residual straw without any drying into an aqueous solution of a quartenary ammonium compound EPTMAC and stirring for a certain time.
We also further examined the synthesis and flocculation behavior of cationic cellulose and prepared a cationic cellulose hydrogel for dye removal. Our results show that waste straw and cellulose could be used as feedstocks for treatment of wastewater containing industrial dyes. Furthermore, the dye removal ability of the cationic straw and cellulose hydrogel is higher than that of activated carbon. We find that cationic cel-lulose is a candidate for flocculation to remove and potentially recover residual dyes.
See: Yan, Lifeng; Yang, Fan; Jia, Lin. Preparation of Cationic Wheat Straw and its Application on Anionic Dye Removal. 2009. Journal of Biobased Materials and Bioenergy 3 (2), 205-212.
Dr. Yan is an Associate Professor in the Department of Chemical Physics at the University of Science and Technology of China and Vice-director of the Anhui Province Key Laboratory of Biomass Clean Energy. R
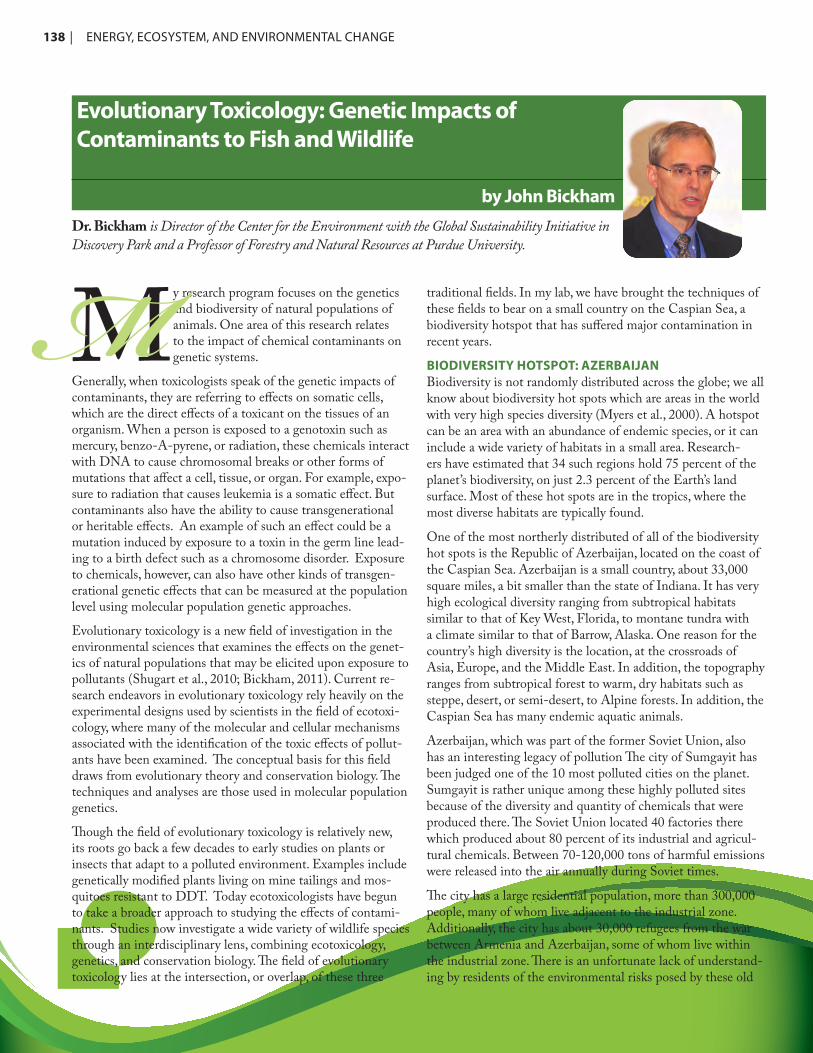
138 | ENERGY,ECOSYSTEM,ANDENVIRONMENTALCHANGE
Evolutionary Toxicology: Genetic Impacts of Contaminants to Fish and Wildlife
by John BickhamDr. Bickham is Director of the Center for the Environment with the Global Sustainability Initiative in Discovery Park and a Professor of Forestry and Natural Resources at Purdue University.
My research program focuses on the genetics and biodiversity of natural populations of animals. One area of this research relates to the impact of chemical contaminants on genetic systems.
Generally, when toxicologists speak of the genetic impacts of contaminants, they are referring to effects on somatic cells, which are the direct effects of a toxicant on the tissues of an organism. When a person is exposed to a genotoxin such as mercury, benzo-A-pyrene, or radiation, these chemicals interact with DNA to cause chromosomal breaks or other forms of mutations that affect a cell, tissue, or organ. For example, expo-sure to radiation that causes leukemia is a somatic effect. But contaminants also have the ability to cause transgenerational or heritable effects. An example of such an effect could be a mutation induced by exposure to a toxin in the germ line lead-ing to a birth defect such as a chromosome disorder. Exposure to chemicals, however, can also have other kinds of transgen-erational genetic effects that can be measured at the population level using molecular population genetic approaches.
Evolutionary toxicology is a new field of investigation in the environmental sciences that examines the effects on the genet-ics of natural populations that may be elicited upon exposure to pollutants (Shugart et al., 2010; Bickham, 2011). Current re-search endeavors in evolutionary toxicology rely heavily on the experimental designs used by scientists in the field of ecotoxi-cology, where many of the molecular and cellular mechanisms associated with the identification of the toxic effects of pollut-ants have been examined. The conceptual basis for this field draws from evolutionary theory and conservation biology. The techniques and analyses are those used in molecular population genetics.
Though the field of evolutionary toxicology is relatively new, its roots go back a few decades to early studies on plants or insects that adapt to a polluted environment. Examples include genetically modified plants living on mine tailings and mos-quitoes resistant to DDT. Today ecotoxicologists have begun to take a broader approach to studying the effects of contami-nants. Studies now investigate a wide variety of wildlife species through an interdisciplinary lens, combining ecotoxicology, genetics, and conservation biology. The field of evolutionary toxicology lies at the intersection, or overlap, of these three
traditional fields. In my lab, we have brought the techniques of these fields to bear on a small country on the Caspian Sea, a biodiversity hotspot that has suffered major contamination in recent years.
BIODIVERSITY HOTSPOT: AZERBAIJANBiodiversity is not randomly distributed across the globe; we all know about biodiversity hot spots which are areas in the world with very high species diversity (Myers et al., 2000). A hotspot can be an area with an abundance of endemic species, or it can include a wide variety of habitats in a small area. Research-ers have estimated that 34 such regions hold 75 percent of the planet’s biodiversity, on just 2.3 percent of the Earth’s land surface. Most of these hot spots are in the tropics, where the most diverse habitats are typically found.
One of the most northerly distributed of all of the biodiversity hot spots is the Republic of Azerbaijan, located on the coast of the Caspian Sea. Azerbaijan is a small country, about 33,000 square miles, a bit smaller than the state of Indiana. It has very high ecological diversity ranging from subtropical habitats similar to that of Key West, Florida, to montane tundra with a climate similar to that of Barrow, Alaska. One reason for the country’s high diversity is the location, at the crossroads of Asia, Europe, and the Middle East. In addition, the topography ranges from subtropical forest to warm, dry habitats such as steppe, desert, or semi-desert, to Alpine forests. In addition, the Caspian Sea has many endemic aquatic animals.
Azerbaijan, which was part of the former Soviet Union, also has an interesting legacy of pollution The city of Sumgayit has been judged one of the 10 most polluted cities on the planet. Sumgayit is rather unique among these highly polluted sites because of the diversity and quantity of chemicals that were produced there. The Soviet Union located 40 factories there which produced about 80 percent of its industrial and agricul-tural chemicals. Between 70-120,000 tons of harmful emissions were released into the air annually during Soviet times.
The city has a large residential population, more than 300,000 people, many of whom live adjacent to the industrial zone. Additionally, the city has about 30,000 refugees from the war between Armenia and Azerbaijan, some of whom live within the industrial zone. There is an unfortunate lack of understand-ing by residents of the environmental risks posed by these old
M
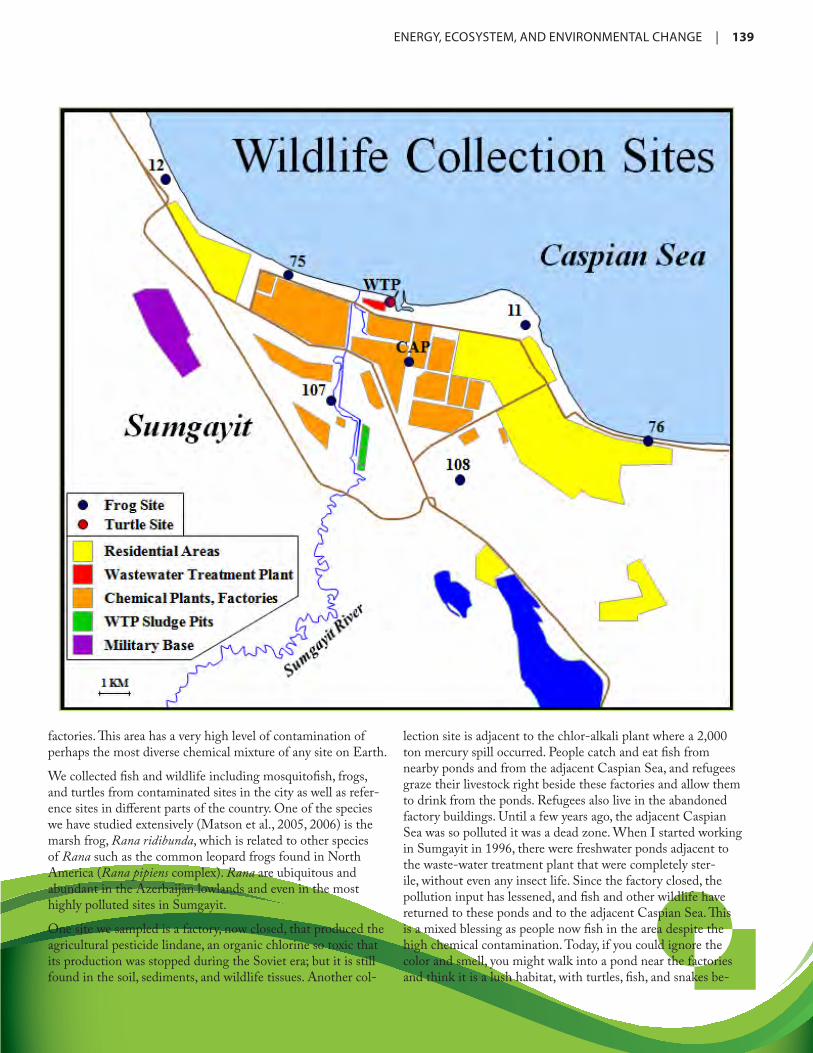
ENERGY,ECOSYSTEM,ANDENVIRONMENTALCHANGE | 139
factories. This area has a very high level of contamination of perhaps the most diverse chemical mixture of any site on Earth.
We collected fish and wildlife including mosquitofish, frogs, and turtles from contaminated sites in the city as well as refer-ence sites in different parts of the country. One of the species we have studied extensively (Matson et al., 2005, 2006) is the marsh frog, Rana ridibunda, which is related to other species of Rana such as the common leopard frogs found in North America (Rana pipiens complex). Rana are ubiquitous and abundant in the Azerbaijan lowlands and even in the most highly polluted sites in Sumgayit.
One site we sampled is a factory, now closed, that produced the agricultural pesticide lindane, an organic chlorine so toxic that its production was stopped during the Soviet era; but it is still found in the soil, sediments, and wildlife tissues. Another col-
lection site is adjacent to the chlor-alkali plant where a 2,000 ton mercury spill occurred. People catch and eat fish from nearby ponds and from the adjacent Caspian Sea, and refugees graze their livestock right beside these factories and allow them to drink from the ponds. Refugees also live in the abandoned factory buildings. Until a few years ago, the adjacent Caspian Sea was so polluted it was a dead zone. When I started working in Sumgayit in 1996, there were freshwater ponds adjacent to the waste-water treatment plant that were completely ster-ile, without even any insect life. Since the factory closed, the pollution input has lessened, and fish and other wildlife have returned to these ponds and to the adjacent Caspian Sea. This is a mixed blessing as people now fish in the area despite the high chemical contamination. Today, if you could ignore the color and smell, you might walk into a pond near the factories and think it is a lush habitat, with turtles, fish, and snakes be-
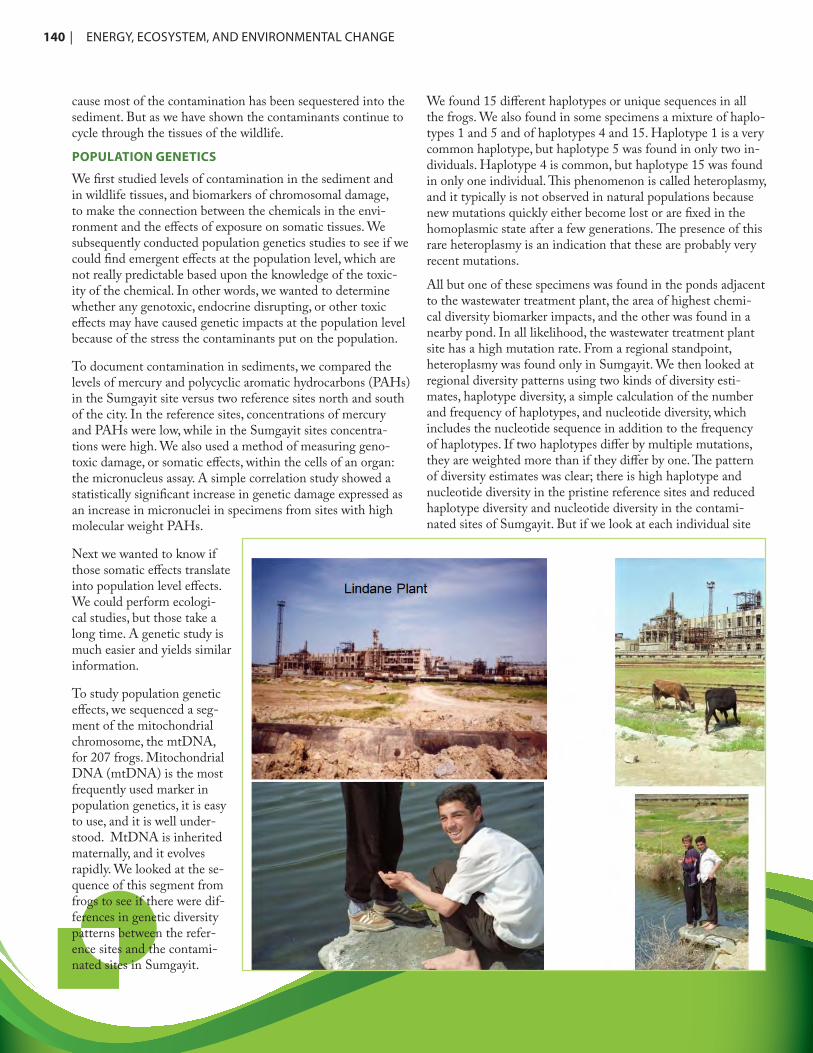
140 | ENERGY,ECOSYSTEM,ANDENVIRONMENTALCHANGE
cause most of the contamination has been sequestered into the sediment. But as we have shown the contaminants continue to cycle through the tissues of the wildlife.
POPULATION GENETICS
We first studied levels of contamination in the sediment and in wildlife tissues, and biomarkers of chromosomal damage, to make the connection between the chemicals in the envi-ronment and the effects of exposure on somatic tissues. We subsequently conducted population genetics studies to see if we could find emergent effects at the population level, which are not really predictable based upon the knowledge of the toxic-ity of the chemical. In other words, we wanted to determine whether any genotoxic, endocrine disrupting, or other toxic effects may have caused genetic impacts at the population level because of the stress the contaminants put on the population.
To document contamination in sediments, we compared the levels of mercury and polycyclic aromatic hydrocarbons (PAHs) in the Sumgayit site versus two reference sites north and south of the city. In the reference sites, concentrations of mercury and PAHs were low, while in the Sumgayit sites concentra-tions were high. We also used a method of measuring geno-toxic damage, or somatic effects, within the cells of an organ: the micronucleus assay. A simple correlation study showed a statistically significant increase in genetic damage expressed as an increase in micronuclei in specimens from sites with high molecular weight PAHs.
Next we wanted to know if those somatic effects translate into population level effects. We could perform ecologi-cal studies, but those take a long time. A genetic study is much easier and yields similar information.
To study population genetic effects, we sequenced a seg-ment of the mitochondrial chromosome, the mtDNA, for 207 frogs. Mitochondrial DNA (mtDNA) is the most frequently used marker in population genetics, it is easy to use, and it is well under-stood. MtDNA is inherited maternally, and it evolves rapidly. We looked at the se-quence of this segment from frogs to see if there were dif-ferences in genetic diversity patterns between the refer-ence sites and the contami-nated sites in Sumgayit.
We found 15 different haplotypes or unique sequences in all the frogs. We also found in some specimens a mixture of haplo-types 1 and 5 and of haplotypes 4 and 15. Haplotype 1 is a very common haplotype, but haplotype 5 was found in only two in-dividuals. Haplotype 4 is common, but haplotype 15 was found in only one individual. This phenomenon is called heteroplasmy, and it typically is not observed in natural populations because new mutations quickly either become lost or are fixed in the homoplasmic state after a few generations. The presence of this rare heteroplasmy is an indication that these are probably very recent mutations.
All but one of these specimens was found in the ponds adjacent to the wastewater treatment plant, the area of highest chemi-cal diversity biomarker impacts, and the other was found in a nearby pond. In all likelihood, the wastewater treatment plant site has a high mutation rate. From a regional standpoint, heteroplasmy was found only in Sumgayit. We then looked at regional diversity patterns using two kinds of diversity esti-mates, haplotype diversity, a simple calculation of the number and frequency of haplotypes, and nucleotide diversity, which includes the nucleotide sequence in addition to the frequency of haplotypes. If two haplotypes differ by multiple mutations, they are weighted more than if they differ by one. The pattern of diversity estimates was clear; there is high haplotype and nucleotide diversity in the pristine reference sites and reduced haplotype diversity and nucleotide diversity in the contami-nated sites of Sumgayit. But if we look at each individual site

ENERGY,ECOSYSTEM,ANDENVIRONMENTALCHANGE | 141
more closely, we get a little bit different picture. Again, we find high haplotype diversity in the pristine sites and lower diversity in the Sumgayit sites except for the wastewater treatment plant which has high haplotype diversity. We think that the genera-tion of new mutations partially compensated for the loss of mutations that happened as a result of a probable population bottleneck. Haplotype diversity is high at the wastewater treat-ment plant, but nucleotide diversity is not so high, because a new mutation is only one step away from its ancestor. There is, therefore, little nucleotide diversity in the wastewater treatment plant.
We also looked at patterns of migration using the distribution of haplotypes, or genetic markers, from the two reference sites and the contaminated sites at Sumgayit. This approach is more effective and quicker than putting radio collars on frogs to determine movement patterns. Haplotype 1, the most common haplotype, is common in Sumgayit and in the reference site to the south but is found in only one animal in the northern site. This indicates migration back and forth, but we don’t yet know in which direction, or if the migration is one way or both ways. Another haplotype, 6, is common in the northern site and in Sumgayit but is not present in the southern reference site. This pattern tells us that Sumgayit is acting as a sink. Gene flow from the south into Sumgayit (haplotype 1) does not go farther north, and gene flow from the north into Sumgayit (haplotype 6) does not penetrate farther south. We think this is probably because of reduced reproductive success as a result of chemical stress in Sumgayit. Excess reproduction in the northern and southern reference areas allows for migration into Sumgayit, but reduced reproduction caused by contaminant exposure makes Sumgayit an ecological sink.
To summarize, our biodiversity studies of marsh frogs in Azer-baijan used genetics to investigate the relationship between diversity and contaminant exposure. We found reduced genetic variability that is likely the result of a bottleneck; that is, when these chemical factories were built, there was probably tre-mendous stress and reduction in population size, which is now rebounding to some degree. We also found evidence of de novo
mutations in the form of heteroplasmic individuals only in Sumgayit, and there predominantly at the most polluted site: the ponds adjacent to the waste-water treatment plant. And fi-nally, there is evidence from gene flow patterns that Sumgayit is an ecological sink. Taken together, these genetic patterns give a clear picture of this highly contaminated environment serving as an area of high genotoxicity and population stress that has clearly led to evolutionary or population genetic changes in resident wildlife populations. Impacts to the vulnerable human refugee population co-inhabiting this area are not yet under-stood.
LITERATURE CITEDBickham, J. W. The four cornerstones of Evolutionary Toxicol-ogy. 2011. Ecotoxicology 20:497–502.
Matson, C. W., G. Palatnikov, T. J. McDonald, R. L. Autenri-eth, K. C. Donnelly, T. A. Anderson, J. E. Canas, A. Islamza-deh and J. W. Bickham. 2005. Patterns of Genotoxicity and Contaminant Exposure: evidence of Genomic Instability in the Marsh Frogs (Rana ridibunda) of Sumgayit, Azerbaijan. Envi-ronmental Toxicology and Chemistry 24:2055-2064.
Matson, C. W., M. M. Lambert, T. J. McDonald, R. L. Auten-rieth, K. C. Donnelly, A. Islamzadeh, D. I. Politov, and J. W. Bickham. 2006. Evolutionary Toxicology and Population genetic effects of chronic contaminant exposure on marsh frogs (Rana ridibunda) in Sumgayit, Azerbaijan. Environmental Health Perspectives 114:547-552.
Myers, N., R. A. Mittermeier, C. G. Mittermeier, G. A. B. da Fonseca, and J. Kent. 2000. Biodiversity hotspots for conserva-tion priorities. Nature 403: 853-858.
Shugart, L. R., C. W. Theodorakis, and J. W. Bickham. 2010. Evolutionary toxicology. Pp. 320-362. In: Molecular Approaches in Natural Resource Conservation and Management. DeWoody, J. A., J. W. Bickham, C. H. Michler, K. M. Nichols, O. E. Rhodes, and K. E. Woeste (eds.). Cambridge University Press, New York, 374 pp.
142 | ENERGY,ECOSYSTEM,ANDENVIRONMENTALCHANGE
Microbial Genes and Communities Involved in Mercury Transformations
by Steven Brown
Research and development conducted in Oak Ridge, Tennessee, was critical in the development of the first atomic bomb during World War II. The national research and production complex that was created to build the bomb engaged some
of the world’s best scientific and engineering talent. After the war ended, this complex provided the foundation for the US Department of Energy’s network of national laboratories.
For Oak Ridge National Laboratory (ORNL), the post-war mission was to continue nuclear energy R&D and to address large-scale fundamental scientific questions. One question scientists at ORNL are pursuing is how to deal with the toxic legacy of mercury, which was used in the lithium enrichment process at the Y-12 plant. In the 1950s, large amounts of mer-cury were released on site and are still present in surface water and groundwater and in shallow soils (Brooks et al.)
One site with high concentrations of mercury is East Fork Poplar Creek downstream of Y-12. The US Environmental Protection Agency, which is concerned about the ecological risks of mercury, has established water criteria based on the concentration of mercury in fish tissue, and the state of Ten-nessee has recently lowered the level that triggers an advisory that fish should not be consumed by people. One perplexing trend we have noticed in this creek is that, even though inputs of mercury have declined in the past few decades, mercury is still accumulating in the fish, and there is still mercury in some of the sediments in the creek. As a result, there is an advisory against eating fish or drinking water from the creek. This leads us to ask some fundamental science questions.
MERCURY TRANSFORMATIONThe element mercury (Hg) is in itself highly toxic. When Hg occurs in aqueous systems, however, it is transformed into an even more toxic form, methylmercury (MeHg). MeHg, a potent neurotoxin, is biomagnified up the food chain and crosses the blood-brain barrier. MeHg poisoning is irreversible. A science focus area of the Surface Biogeochemical Research (SBR) program at ORNL is elucidating the mechanisms for Hg transformation using molecular modeling and microbial community dynamics. (See http://www.est.ornl.gov/programs/rsfa/overview.shtml for more details.) Since elimination of inorganic Hg is not possible, alternative strategies that reduce methylation in situ may be the only way to reach tissue con-centration targets in fish. Basic research is needed on mercury
methylation/demethylation at the sediment/water interface and particularly in understanding what limits MeHg production.
There are critical knowledge gaps in our scientific understand-ing of these processes. We are addressing a number of these gaps including
• oxidation, reduction, and species transformation
• dominant chemical species and bioavailability
• abiotic /biotic methylation and demethylation
• biochemical pathways for methylation and demethylation
• coupled biogeochemical reactions
• surface catalyzed and photochemical reactions.
We have designed a strategy for understanding contaminant transformation and environmental behavior of mercury. This is a new science that is leading to fundamental understanding of contaminant transformation. Field and geochemistry studies are focused on mercury transformation in the field, includ-ing the sediment-water interface, dominant chemical species, microbial abundance, and microbial community dynamics. In addition, we are exploring molecular dynamics and speciation and mechanisms such as coupled microbial and geochemical reactions to gain an understanding of contaminant association and reaction.
We are also looking at contamination across the Oak Ridge Reservation, including Hg in water, sediment, and biota in streams. The source sites are industrial use areas where Hg is found in contaminated soils, buildings, the storm drain network, sediments, and ground and surface water. One focus area is site geochemistry and its influence on the microbial community. We are continuing to determine specific influences of contamination on the microbial community using revised functional gene arrays, real-time quantitative polymerase chain reaction (qPCR), and 16S ribosomal DNA with the 454 se-quencing system using universal bacterial and archaeal primers.
Another line of research is aimed at determining the predomi-nant forms of Hg and MeHg in situ. We have found that the amount of particulate (complexed) Hg (II) increases with in-creasing distance from the source. This is similar to the decrease in Hg (II) and concomitant increase in MeHg. Modeling indicates that MeHg is predominately complexed with dis-
Dr. Brown is a Staff Scientist in the Biosciences Division, Oak Ridge National Laboratory.R

ENERGY,ECOSYSTEM,ANDENVIRONMENTALCHANGE | 143
solved organic matter, and a high log K suggests high complex stability once formed.
We have also worked with model microorganisms such as D. desulfuricans and have recently sequenced the entire ND132 genome (Brown et al., Gilmour et al.). This organism is a strong mercury methylate bacteria that can contribute to methylation and demethylation. Surprisingly, we found that there are no mercuric reductase (mer) genes in the microorganism. We are examining the possibility of a novel method of Hg transport into the cell, and we are looking closer at the biochemistry behind demethylation and trying to develop a genetic approach to answer these questions. We hope in due course to discover the genes for mercury methylation.
Despite the number of questions remaining in our understand-ing of microbial genes involved in mercury transformation, we are making progress in closing critical information gaps remaining in terms of the ways MeHg is generated and the fate of mercury in the environment.
SEE:Brooks, S.C. and G.R. Southworth. 2011. History of mercury use and environmental contamination at the Oak Ridge Y-12
Plant. Environmental Pollution 159:219-228. (doi:10.1016/j.envpol.2010.09.009).
Brown, S. D., C. C. Gilmour, A.M. Kucken, J. D. Wall, D. A. Elias, M. Podar, O. Chertkov, B. Held, D. C. Bruce, J. C. Detter, R. Tapia, C. S. Han, L. A. Goodwin, J.-F. Cheng, S. Pitluck, T. Woyke, N. Mikhailova, N. N. Ivanova, J. Han, S. Lucas, A. L. Lapidus , M. L. Land, L. J. Hauser, and A. V. Palumbo. Ge-nome Sequence of Mercury-Methylating Desulfovibrio desulfu-ricans ND132. J. Bacteriol. 2011 193: 2078–2079.
Gilmour C.C., D.A. Elias., A.M. Kucken A.M., S.D Brown, A.V. Palumbo, C.W. Schadt, J.D. Wall. Sulfate-Reducing Bacterium Desulfovibrio desulfuricans ND132 as a Model for Understanding Bacterial Mercury Methylation. Appl Environ Microbiol 2011, 77(12):3938-3951.
ACKNOWLEDGMENTS: This research was supported by the Office of Biological and Environmental Research (OBER), Office of Science, U.S. Department of Energy (DOE), as part of the Mercury Science Focus Area Program at Oak Ridge National Laboratory (ORNL). ORNLis managed by UT-Battelle, LLC, for the U.S. Department of Energy under contract DE-AC05-00OR22725.

144 | ENERGY,ECOSYSTEM,ANDENVIRONMENTALCHANGE
Sorption and Toxicity of Imidazolium-Based Ionic Liquids in the Absence and Presence of Dissolved Organic Matter
by Jingfu Liu
Organic salts composed of organic cations and organic/inorganic anions with melting points below 100ºC are called ionic liquids (ILs). ILs have special properties that make them useful in a variety of industrial and electrochemi-
cal applications. Although ILs are considered green solvents mainly due to their lack of vapor pressure, it is likely that ILs will be introduced into the environment through water.
Experiments have shown that ILs exhibit toxicities with differ-ent levels of biological complexity. Researchers are becoming more concerned about the potential environmental impacts of these chemicals. Currently, most toxicological studies focus on the effects of individual ILs, though a few have considered the influence of the coexisting environmental matrix. Most ILs have relatively high water solubility so they can be transferred into the environment through water and transported into sediments or soils. Once they make their way into water and sediments, they can be absorbed in dissolved organic matter (DOM). Eventually, ILs can be taken up by fish and other wildlife. Studies have shown that ILs have acute toxic effects on zebrafish (Vibrio fischeri) and other toxic effects have been documented using species of bacteria, algae, and snails.
It is still unclear how strongly ILs associate with DOM like humic acid and whether DOM affects the toxicity of ILs.
SORPTION TO DISSOLVED ORGANIC MATTERBecause we know that DOM affects the toxicity of many chemicals, in the State Key Laboratory of Environmental Chemistry and Ecotoxicology we have studied the sorption of imidazolium-based ILs in DOM. It is well known that freely dissolved ILs are bioavailable, but ILs associated with DOM are not bioavailable. To determine how strongly ILs are associ-ated with DOM, we measured the freely dissolved IL concen-IL concen- concen-tration and used an equation to find the partition coefficient (KDOC) of IL to DOM. KDOC is obtained by measuring the frac-tion of freely dissolved IL at varied concentrations of DOM.
In water solutions, some cations of the ILs can associate with DOM, but some of the ILs are truly dissolved. To measure the
freely dissolved ILs we designed a hollow fiber supported liquid membrane, extracted and then measured the concentration of the freely dissolved ILs. As the concentration of humic acid increased, the concentration of freely dissolved ILs decreased. This strong association of ILs to DOM suggests that the per-cent of DOM affects the toxicity of ILs.
EVALUATION OF TOXICITYIn further research, we compared the effects of ILs with and without DOM on three systems to determine the cytotoxicity, genotoxicity, and acute toxicity of both solutions. Cytotoxicity was evaluated using the HepG2 cell line. Without the presence of DOM, cell viability decreases with increasing concentra-tion of ILs, which suggests these two ILs are toxic for the cells. When we added humic acid into the system, the toxicity of the ILs decreased.
We tested genotoxicity using an SOS/umu assay. The induction ratio increased with the concentration of the ILs, indicating some genotoxicity to the test substance. Adding humic acid into the system decreased the induction ratio, suggesting that a higher percent of DOM reduced the toxicity of the ILs.
We evaluated acute toxicity using a Medaka, or Japanese killfish, model and found that both ILs are toxic. When we added humic acid into this system, the toxicity decreased at first, but further increases in concentration of humic acid led to an increase in the death rate of the fish. The relationship of concentration of DOM to death rate remains unclear and is a topic for further research.
ENVIRONMENTAL IMPLICATIONSOur studies indicate that both IL solutions are strongly associ-ated with DOM and, as is true with many hydrophobic organic contaminants, DOM alters the transportation, degradation, and bioavailability of imidazolium-based ILs. DOM markedly re-duced the toxicity of imidazolium-based ILs. This effect should be considered in assessment of the environmental risk of ILs to aquatic environments. Most currently available toxicological data has not considered the effects of the environmental matrix, and care should be taken when using these data.
Dr. Liu is a Professor at the State Key Laboratory of Environmental Chemistry and Ecotoxicology and the Research Center for Eco-Environmental Sciences, Chinese Academy of Sciences.O
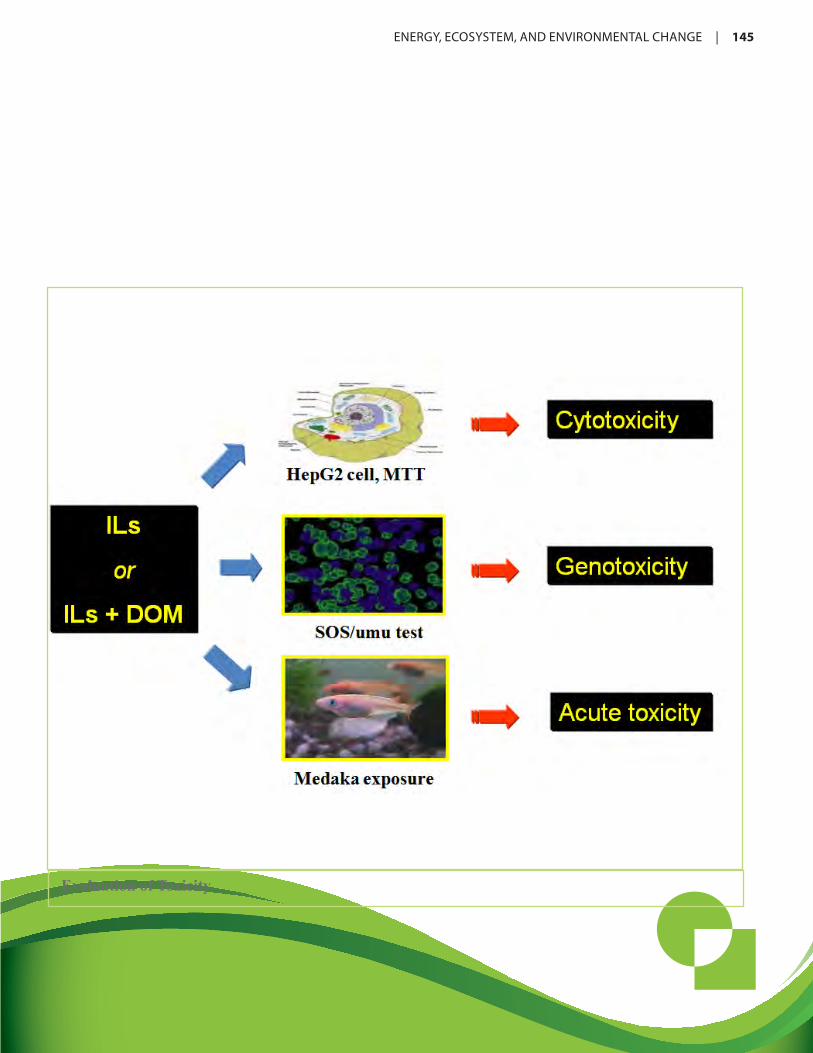
ENERGY,ECOSYSTEM,ANDENVIRONMENTALCHANGE | 145
Evaluation of Toxicity

146 | ENERGY,ECOSYSTEM,ANDENVIRONMENTALCHANGE
Application of Omic's Approaches to Studying Toxic Algal Blooms in Large Freshwater Lakes
by Steven Wilhelm
Over the last decade, researchers have been trying to understand the massive toxic algal blooms in aquatic systems that are increasing on a global basis. Lake Tai, which is located near the Chinese cities of Wuxi, Suzhou, and Shanghai,
is one example of a lake with major toxic algal blooms. The population of the region is about 40 million people, and about 8 to 12 million use water directly from the lake for drinking, industry, agriculture, and waste disposal.
There are many reasons we see toxic algal blooms in systems like this, such as eutrophication driven by nutrient loading. We know less about why we have certain types of algae and such large blooms, however, and understanding this is one goal of our research.
In North America, toxic cyanobacterial blooms are occurring with greater frequency in many regions, including western Canada and the Great Lakes. In 2008, my colleagues and I in the Aquatic Microbial Ecology Research Group at the Univer-
sity of Tennessee (UT) posed a question to the US National Science Foundation: Can we use Lake Tai in China as a model for toxic blooms that we expect to see in the United States in the next 10-20 years?
LAKE ERIE STUDYOur study site in the United States is Lake Erie, one of the Laurentian Great Lakes, and an area with a great deal of ag-ricultural activity and industrial development. The Laurentian
Great Lakes are the largest fresh water res-ervoir in the world. They contain 85 percent of all the freshwater in North America and 20 percent of all the drinking water on the planet; it is a very valuable resource.
Lake Erie is the 12th largest lake in the world, about six times the size of Lake Tai. This lake has a number of idiosyncrasies. Because of seasonal cycles, it is both the warmest and the coldest of the Great Lakes. It is the shallow-est and the most affected by humans of all the Great Lakes. Lake Erie also has a long history of pollution, and over the last few decades we have cleaned up this pollution. However, even as we clean up Lake Erie, we are seeing algal blooms occurring. While only a couple of decades ago we predicted that we would see these blooms in about 20 years, the blooms in North America are happening now.
HARMFUL ALGAL BLOOMSThe organism that causes many algal blooms is the bacteria Microcystis, a globally distrib-uted harmful algal bloom (HAB) species. Recurring problems in the Great Lakes have
been noted since about 1995. This species is most notorious for producing a secondary metabolite known as microcystin, which has hepatotoxic effects. It also produces an as-of-yet unidenti-fied secondary metabolite with endocrine disrupting effects.
One of the major concerns is that Microcystis blooms to massive scales causing disruption of food webs and water column phys-iochemistry. It is also very sensitive to climate change, thermal discharge, and nutrient loading. It grows best at temperatures over 25°. Most Lake Erie temperatures are historically between
Dr. Wilhelm is a Professor of Microbiology with the University of Tennessee
O

ENERGY,ECOSYSTEM,ANDENVIRONMENTALCHANGE | 147
22-24ºC in summer. For that reason, we need to be very careful not to raise water temperature through human activities such as loading warmer water into lakes.
In our group we use phylogenetic and quantitative probes to provide molecular signatures of the microbes that are present. Over the last decade our group has been developing molecu-lar probes to look at the diversity of these potentially toxic organisms in the environment and to quantify them. We have developed two polymerase chain reaction (PCR) probes that allow us to distinguish between all the cyanobacteria, all the Microcystis, and all the potentially toxic Microcystis, the ones that carry the gene to allow it to make the toxin.
To do proper ecological studies, we need to be able to go out into the en-vironment and count the toxic cells in the mixture of all organisms we see in the microbial community. One of our group’s Ph.D. students has conducted a real-time quantitative PCR (qPCR) analysis in Lake Erie between 2003 and 2005 at different stations and has quantified the number of cells per liter for cyanobacteria, total Microcystis, and toxic Microcystis. The survey showed that 1) the relative abundance of Mi-crocystis is variable in summer months, 2) Microcystis forms up to 50 percent of the total cyanobacterial population, and 3) toxic Microcystis forms 10 percent of the total cyanobacterial population. The take home message is that only about 10 percent of the cells have the ability to produce toxins. We don’t actually know why the cells make the toxin. These tools now give us an opportunity to understand why the cells are making the toxin and what environmental fac-tors may be driving toxin production.
If we try to correlate cyanobacteria, total Microcystis, and toxic Microcystis with a number of different environmental metrics like temperature, chlorophyll, and different nutrient concentra-tions, we find that the factors that correlate with the presence of cells do not correlate with the presence of the toxin. Toxin and cells correlate with different environmental parameters, and there is a disconnect between bloom formation and the regulation of toxin production. As such, from the management perspective, minimizing bloom formation may not be helpful in managing toxin production. This is a critical insight because it tells us that we need to look at the cells more closely to see why toxins are produced.
MESSAGES FROM LAKE TAI
In May 2009, we conducted a one-day survey of the entire Lake Tai, which is 2,400 square kilometers in surface area. We
sampled toxin distribution at 10 stations in 8-10 hours, moving fairly quickly in a small boat. We measured concentrations of the toxin Microcystin and estimated biomass using chlorophyll as a proxy for phytoplankton. We found there is a gradient from north to south, with more biomass and microcystin in the northern compared to the southern parts. We used this spatial variability to probe further and start to understand the mecha-nisms underlying the differences. As we did in Lake Erie, we
conducted a full survey of nutrients and physiochemical, or environmental, conditions. We wanted to examine factors that correlate with cell abundance, cell biomass, and toxin in the lake.
As we found in Lake Erie, the correlations between nitrogen, phosphate, and cyanobacteria are fairly strong, but the relation-ships between the concentration of toxins and these factors are not very strong. Once again, there is a disconnect between toxin production and biomass production.
We also wanted to understand the greater community, not just what the Microcystis is doing but what the other cells are do-ing and whether these cells are linked to toxic blooms. As we show in our paper from the journal Harmful Algae in 2011, we conducted a richness and diversity estimation by sequencing 16S rDNA from Lake Tai and found much more diversity than previously observed, including Proteobacteria, Actinobacteria, Bacteroides, and Chlamydiae. Further testing at UT’s Center for Environmental Biotechnology suggests linkages to fecal source microbes, but not human microbes. Our working hypothesis is that these microbes come from poultry farms and rendering plants near the northern part of the lake, or perhaps from the

148 | ENERGY,ECOSYSTEM,ANDENVIRONMENTALCHANGE
use of “poultry manure” as fertilizers by local farmers. High concentrations of ammonia tend to confirm the hypothesis.
To understand the relationships between the organisms, the en-vironmental conditions, and toxicity, we looked at the microbial communities at different sites here to see how related they are by examining the relationships in water column chemistry at the different stations and the concentrations of toxin. We found the most toxic stations have the most similar environmental conditions and microbial communities, whether or not cyano-bacteria is included. This implies that there is some give and take between the blooms and the microbial community, but we don’t know exactly what is driving the relationship.
We have also begun performing metagenomic analysis of toxic Microsystis blooms in Lake Erie and Lake Tai. We also sent samples to the Joint Institute for Biological Sciences at Oak Ridge National Laboratory for titanium pyrosequencing. We were able to reconstruct almost all the genome of Microcystis from Lake Erie and about 75 percent of the genome from Lake Tai. Further metagenomic analyses using the MEGAN com-puter program allowed us to sort genes regardless of where they come from by their functions. We found that most functions are conserved in the two lake systems although the organisms that carry out these functions may be different.
MEGAN analysis of microbial communities associated with blooms also allows for the reconstruction of the phylogenetic tree based on the most likely organism that these genes are coming from. In some areas, we see over representation of
groups of different bacteria in one of the two lakes. We don’t know whether these groups are more lake and environmentally sensitive.
There are also functions in our lab cultures that are not repre-sented in the field. In addition to metagenomics analysis, we are using whole cell proteomics and metaproteomics to look at all the active biochemical pathways within communities. We then compare lab cultures with field populations and compare Microsystis as well as the co-occurring heterotrophic organisms.
With the new and the old tools available to us today, our research group has made some progress in understanding the production of toxins from HABs. During blooms we see major shifts not only in the HAB genes and proteins, but also in the genes of co-occurring organisms. During a bloom event, Micro-cystis may up-regulate nucleotide transport and metabolism as well as DNA repair and replication activities.
We still don’t completely understand why toxic blooms occur. Are they a function of the organism itself, or a function of co-occurring organisms allowing it to bloom or promoting it? The answer is likely somewhere in between but we hope over the next few years to draw closer to an answer.
Our next goals are to develop approaches needed to study the “core” metagenomes and metaproteomes, address the pathways active in Microcystis that are not active in the rest of the com-munity, and find ways to work with Microcystis under non-bloom conditions, when biomass is limiting, and to compare to bloom conditions.
ENERGY,ECOSYSTEM,ANDENVIRONMENTALCHANGE | 149
Mercury Profiles in Sediments of the Pearl River Estuary and the Surrounding Coastal Area of South China
by Jianbo Shi
Mercury is a toxic element that has led to serious health effects and deaths around the world. As a result, since the 1960s, mercury has been widely studied. Not only is mercury toxic, it also bio-accumulates in
organisms. Mercury is persistent in the environment, and it can be transported long distances.
In December 2002, the United Nations Environment Pro-gramme (UNEP) published a global assessment of mercury in the environment. UNEP reported that in the last century the deposition rate has increased by 1.5 to 3 times due to increased anthropogenic emissions from industrial, agricultural, medici-nal, and domestic uses.
In 2009, UNEP suggested developing a legally binding instru-ment on mercury (Minamata Convention on Mercury). More than 140 countries have agreed to sign this convention, which is proposed to be signed in 2013. By then many countries, es-pecially China, will face many challenges to minimize use and emissions of mercury.
Globally, China is considered the largest contributor of atmospheric mercury emissions. It was estimated that China released about 700 tons of mercury to the atmosphere in 2003. Between 1990 and 2000, mercury emissions in Europe and North America have decreased, but in Asia emissions still increased significantly.
In China, coal accounts for about 70 percent of energy con-sumption, and coal combustion is the most important source of mercury emissions to the air. Coal combustion in China is estimated to double by the year 2025, so we can expect that mercury emissions will also continue to increase in the future if no measures are taken.
China faces special challenges if it is to achieve reductions in mercury emissions. Currently, data on the production, con-sumption, and emissions of mercury is very limited and a more detailed advisory is urgently needed. China needs better studies of mercury emissions from coal combustion and strict regulations. Safer alternatives and cleaner technologies must be developed and effectively implemented.
GATHERING DATA: THE PEARL RIVER ESTUARYOf the many challenges China faces, the first, data collection, is very urgent. We have to know our contamination status before we can take measures to control emissions. That is one focus of our research at the Research Center for Eco-Environmental Sciences. We are studying mercury contamination in several areas, including the Bohai Sea, the East China Sea, and the South China Sea. We chose these areas because they are among the most industrialized and urbanized regions in China, they are all important reservoirs of environmental pollutants, and they are important pathways for transport of land mercury to the marine system.
The Pearl River Estuary (PRE) is created by the inflow of the Pearl River to the South China Sea. The area, which includes Hong Kong, Macao, and part of Guangdong Province, is one of the most highly industrialized and urbanized areas in China. During the last 20-30 years the region has developed very quickly, resulting in high levels of contamination. The estuary covers an area of more than 8,000 km2. In 2002 exports from the PRD (Pearl River Delta) region accounted for about 35 percent of China’s total exports.
In our study we examined total mercury in surface sediment samples from the PRE and found distributions ranging from 1.5 to 201 ng/g and an average concentration of about 54 ng/g. Normally, background levels of mercury in marine sediment are under 100 ng/g. Comparing our information with published data from various areas around the world, we see levels in the PRE are lower than in San Francisco Bay and in the Seine Es-tuary in France, but higher than in the East China Sea. Though the average concentration of total mercury is not very high, some sites in the area are very contaminated.
Not surprisingly, we found that mercury concentrations de-creased with the distance from the estuary to the open sea. At first we assumed that the outflow of the Pearl River may be the main source of mercury, but in fact we found that in most samples from the end of the Pearl River, total mercury con-centrations were not very high. We did, however, find two hot spots in the mouth and northwest of the estuary. From this data we estimated that mercury from this area comes mainly from the discharge of coastal cities and is also influenced by circula-tion currents of the estuary.
Dr. Shi is an Associate Professor at the Research Center for Eco-Environmental Sciences, Chinese Academy of Sciences.M

150 | ENERGY,ECOSYSTEM,ANDENVIRONMENTALCHANGE
We also examined the vertical distribution of mercury in two sediment cores taken from these hot spots and found that mercury concentrations decreased with increasing depth of the cores. Examining these sediment cores is a technique that allows us to track mercury concentrations over time. In the first core, mercury concentrations were relatively higher in the upper 45 centimeters (cm), corresponding to the period from 1972 to the present. In the second core, mercury concentra-tions were significantly higher in the upper 10 cm, correspond-ing to the period after the 1980s. Overall, in the past two to three decades, mercury concentrations significantly increased. In order to identify the influence of anthropogenic inputs, we also calculated the influx of mercury in these cores and found significant increases in the last 100 years.
Results of our data survey showed overall that concentrations of mercury decreased with distance from the estuary to the open sea. We assume that anthropogenic emissions from the PRE region are the main sources of mercuy in this region. By using the core sediment dating technique, we conclude that historical changes in the concentrations and influxes of mercury reflect industrial development and urbanization of this region in South China.
Spatial distribution of Hg in surface sediments
ENERGY,ECOSYSTEM,ANDENVIRONMENTALCHANGE | 151
Enhanced Toxicity of Acid-Functionalized Single-Walled Carbon Nanotubes (SWCNTs) and Gene Expression Profiling in Murine Macrophages
by Bin Wan
Materials that are 100 nanometers (nm) or smaller in one dimension are called nano-materials. A nanometer is one billionth of a meter and is used to measure materials as small as, or smaller than, atoms and mole-
cules. Nano-materials have very high reactivity because of their high specific surface area and strong diffusion capability.
Carbon nanotubes are being created and manufactured at an increasingly rapid pace in experimental and industrial sectors because of their applications in the electronics, automobile, aerospace, and defense industries. The estimated market size of carbon nanotubes in 2014 is projected to exceed $1 billion. In recent years, new applications have emerged such as energy storage, special clothing, medical applications, and sporting goods. With this increase in production and consumption of carbon nano-materials, people are beginning to be concerned about the environmental and health problems associated with these materials.
Nano-materials have a variety of morphologies. Of particular interest in the field of nanontechnology are multi-walled car-bon nanotubes (CNT) and single-walled CNTs. My research focus is on the toxicity of single-walled CNTs (SWCNTs).
Nano-materials have very different behavior and totally dif-ferent toxicity profiles than bulk materials. At the tissue level, SWCNTs can induce pulmonary fibrosis, mesothelioma, and granuloma. At the cellular level, SWCNTs cause direct damage to cell membranes including macrophages in cells, they can in-duce the production of reactive oxygen species (ROS), and they can also induce cytokine production and affect the immune response of animals.
EXPLORING TOXICITY There are currently a few problems in conjunction with experimental studies on the environmental health concerns of CNTs. The first is aggregation. In testing systems, CNTs tend to aggregate into bundles and are not well dispersed in a solution. As researchers find ways to fabricate well dispersed CNT solutions, which have numerous potential applications, they are creating solutions with potentially significant toxicity. The second problem is contamination of the residue during the production of CNTs. The toxic effects of SWCNTs are often tangled with the toxic effects of metal residues that are known
ROS inducers. The third problem is that SWCNTs are known to interfere with some biochemical assays. Essentially, carbon nanotubes can absorb formazon crystals on their surface and cause false positive results in a cell viability assay.
Solutions for these problems have been widely explored. There are two known methods to improve the dispersion of SWCNTs in solution, PEGylation and DNA/protein wrapping, both of which can increase dispersion but can not deplete the metal residuals in the SWCNT. Another, and probably one of the most promising, solutions to the dispersion and purification problem is acid oxidation/functionalization (AF), but for now this approach is poorly understood. Acid functionalization of SWCNTs can improve the dispersion of CNTs in aqueous solution, but it can also increase their cytotoxicity. We want to know how acid oxidation/functionalization influences the toxicity of SWCNTs and what the toxic mechanism underly-ing these effects might be, excluding the influence of metal residues.
We used several approaches to explore acid oxidation/function-alization First we used acid oxidation to treat SWCNTs and divided them into three samples. In the first samples, we used standard spectroscopy approaches (TEM, FT-IR, and zeta potential) to determine the chemical change of these carbon nanotubes. In the second samples, we used fluorescence labeling of the AF-SWCNTs to track carbon nanotubes in the cells. With the third sample we studied the cytotoxicity and gene expression profile changes induced by carbon nanotubes in murine macrophages to try understand the toxic mechanisms involved.
Global gene expression profiling of cells reveals that 1) AF-SWCNT can inhibit the biogenesis of ribosome and gene expression machinery; 2) AF-SWCNT can inhibit mito-chondria function and may induce ROS net production and neuro-degenerative diseases such as Parkinson’s and Hunting-ton’s disease; 3) AF-SWCNT can inhibit Caspase pathway and proteasome functions, resulting in necrotic-like cell death; 4) AF-SWCNT can significantly induce inflammatory cytokine production and promote inflammatory response.
In sum, cytotoxicity and global gene expression analyses re-vealed that enhanced toxicity may be due to the disruption of a few processes including ribosomal biogenesis, mitochondria
Dr. Wan is a Research Associate Professor at the Research Center for Eco-Environmental Sciences, Chinese Academy of Sciences.
M

152 | ENERGY,ECOSYSTEM,ANDENVIRONMENTALCHANGE
respiration, inflammatory cytokines and chemokines, cell cycle/apoptosis inhibition, and proteasome pathway. These findings confirm that the efforts to increase dispersion of SWCNTs to improve and expand the applications of nano-materials such as SWCNTS will likely result in more toxic forms of these materials.
REFERENCE:Ping-Xuan Dong, Bin Wan, and Liang-Hong Guo. In vitro toxicity of acid-functionalized single-walled carbon nano-walled carbon nano-alled carbon nano- nano-nano-tubes: Effects on murine macrophages and gene expres-sion profiling. Nanotoxicology 2011; Early Online, DOI: 10.3109/17435390.2011.573101.
ENERGY,ECOSYSTEM,ANDENVIRONMENTALCHANGE | 153
Heterotrophic Bacteria Protect the Marine Cyanobacterium Prochlorococcus from Oxidative Damage
by Erik Zinser
The primary focus of my research group in the Department of Microbiology is the relationship of physiology to the ecological distributions of genetically different lineages, or the relationships between physiology, ecology, and the forces of
selection. One specific organism that has captured our attention lately is Prochlorococcus, or Pro as we like to call it. We are par-ticularly interested in how this marine cyanobacterium interacts with other microbes in the environment.
If you look at a plate of media, Pro appear as little green dots. What you can’t see is that the plate is covered with heterotro-phic bacteria, which allow Pro to grow thanks to an interaction between the two organisms. The heterotrophic bacteria protect the phototrophic cells from oxidative damage.
In the field of marine microbiology, Pro was discovered in the late 1980s by a technique called flow cytometry (FCM). FCM allows us to look at properties of individual cells or particles. The cells pass down in a narrow stream to a laser that allows us to see the different properties of the cells. The cells we are par-ticularly interested in are forward light scattered; the amount of light that gets scattered by the cell gives an idea of how big the cells are. We can also look at fluorescence of particles. Red fluorescence is a detector of chlorophyll, and FCM is a particu-larly useful way to enumerate phytoplankton, taking advantage of the fluorescence property of chlorophyll.
DISCOVERING PRO Shipboard flow cytometry was originally used to quantify different types of phytoplankton or algae in the ocean such as the diatoms. Synechococcus is a cyanobacterium, which is a lot smaller than most eukaryotic phytoplankton and has much less chlorophyll. The original flow cytometers were not sensitive enough to view smaller organisms, so researchers developed a specialized version that gave a view of an entire population of Synechococcus. To the great surprise of researchers, they also discovered a brand new population of cells that had never been noticed before. Those cells were Pro, and there were many more of them than the other organisms like Synechococcus.
Pro is a tiny photosynthetic cell, about a half a micron in diameter, with very low chlorophyll. This brand new organism appeared to be very abundant, and when scientists went all around the oceans, to their amazement they found that Pro is
perhaps the most abundant photosynthetic organism, not only in the ocean but on Earth. It seems to be restricted by tempera-ture as it dominates in the ocean between latitudes 40ºN and 40ºS. In some cases, more than half of all chlorophyll in certain regions of the ocean is due to Pro.
Pro is most abundant in the open ocean, low chlorophyll areas with very low nutrient environments. It is found where light is able to penetrate about between 0-200 meters in depth. This is in contrast to its sister genus Synechococcus, which does not penetrate as deeply. We want to understand why Pro is so good at living in these nutrient poor environments, all the way down to the base of the euphotic, or sunlit, zone.
Pro has a couple of adaptations that help make it a low-nutrient specialist. For one, it has a much smaller cell size with a greater surface to volume ratio, an advantage for scavenging not only nutrients but also light. It has a reduced genome size down to 1.7 millions of base pairs (Mbp) for some of them, which gives it a reduced nitrogen and phosphorus quota per cell. This is very important for living in a low nutrient environment. It also has an altered light harvesting complex, allowing it to specialize in blue light, which penetrates all the way down to the base of the euphotic zone
We have discovered that, even though Pro is highly abundant in the oceans, it does not grow well in a pure (axenic) culture. Using the Pro MIT9215 strain and a high starting inoculum of about 1 million cells per milliliter, the organism grows just fine, but after a series of dilutions it has a hard time growing. With even further dilution of the inoculum, it does not grow at all. On the other hand if you reintroduce a contaminant such as Alteromonas sp. to the culture, there is a dramatic improvement of growth of Pro MIT9215 at dilute concentrations. The het-erotrophs help Pro grow at even extremely low concentrations of inoculum, such as 1 cell ml-1.
To determine the role of heterotrophs in Pro growth, we tried different kinds of heterotrophs and different kinds of Pro. Every strain of Pro we tried to grow can be helped by at least one heterotroph, and all the heterotrophs seem able to help at least one strain of Pro. It is a fairly generalized phenomenon, suggesting that a lot of marine heterotrophs help Pro grow, and that there is not a specific symbiosis per se, but rather a general phenomenon at the cell level.
Dr. Zinser is an Assistant Professor in the Department of Microbiology, University of Tennessee.
T
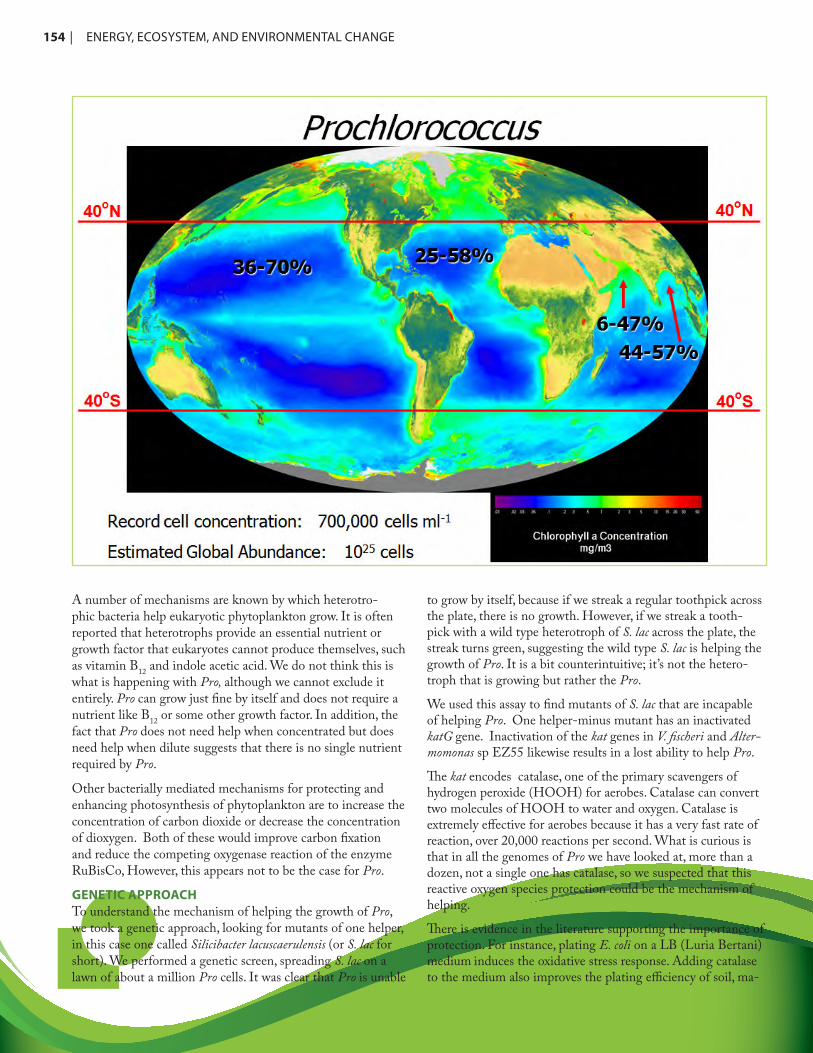
154 | ENERGY,ECOSYSTEM,ANDENVIRONMENTALCHANGE
A number of mechanisms are known by which heterotro-phic bacteria help eukaryotic phytoplankton grow. It is often reported that heterotrophs provide an essential nutrient or growth factor that eukaryotes cannot produce themselves, such as vitamin B12 and indole acetic acid. We do not think this is what is happening with Pro, although we cannot exclude it entirely. Pro can grow just fine by itself and does not require a nutrient like B12 or some other growth factor. In addition, the fact that Pro does not need help when concentrated but does need help when dilute suggests that there is no single nutrient required by Pro.
Other bacterially mediated mechanisms for protecting and enhancing photosynthesis of phytoplankton are to increase the concentration of carbon dioxide or decrease the concentration of dioxygen. Both of these would improve carbon fixation and reduce the competing oxygenase reaction of the enzyme RuBisCo, However, this appears not to be the case for Pro.
GENETIC APPROACHTo understand the mechanism of helping the growth of Pro, we took a genetic approach, looking for mutants of one helper, in this case one called Silicibacter lacuscaerulensis (or S. lac for short). We performed a genetic screen, spreading S. lac on a lawn of about a million Pro cells. It was clear that Pro is unable
to grow by itself, because if we streak a regular toothpick across the plate, there is no growth. However, if we streak a tooth-pick with a wild type heterotroph of S. lac across the plate, the streak turns green, suggesting the wild type S. lac is helping the growth of Pro. It is a bit counterintuitive; it’s not the hetero-troph that is growing but rather the Pro.
We used this assay to find mutants of S. lac that are incapable of helping Pro. One helper-minus mutant has an inactivated katG gene. Inactivation of the kat genes in V. fischeri and Alter-momonas sp EZ55 likewise results in a lost ability to help Pro.
The kat encodes catalase, one of the primary scavengers of hydrogen peroxide (HOOH) for aerobes. Catalase can convert two molecules of HOOH to water and oxygen. Catalase is extremely effective for aerobes because it has a very fast rate of reaction, over 20,000 reactions per second. What is curious is that in all the genomes of Pro we have looked at, more than a dozen, not a single one has catalase, so we suspected that this reactive oxygen species protection could be the mechanism of helping.
There is evidence in the literature supporting the importance of protection. For instance, plating E. coli on a LB (Luria Bertani) medium induces the oxidative stress response. Adding catalase to the medium also improves the plating efficiency of soil, ma-

ENERGY,ECOSYSTEM,ANDENVIRONMENTALCHANGE | 155
rine, and atmospheric heterotrophs, but no one has investigated how this mechanism might affect phytoplankton. Catalase in-activation has also been linked to the viable but non-culturable state in Vibrio species.
If we compare these findings to the degradation rate of Pro we see dramatic differences. Using a particular strain of Pro called MIT 9215, starting at a low cell inoculum, the Pro starts to grow a little bit and to degrade the HOOH a little bit, but then it just dies out, and the HOOH stays the same. Starting with a higher concentration of Pro, it eventually degrades HOOH, but it takes 50 days instead of one day. The Pro is much less able to deal with HOOH than a helper strain such as EZ55.
The most definitive evidence that heterotrophs are helping Pro by removing HOOH is an experiment in which we take a regular medium and autoclave it. The autoclaved medium generates about 200 nanomolar (nM) HOOH. If we inoculate Pro in this medium, its is unable to grow well at all. However, if we pre-inoculate the autoclaved medium with the EZ55 helper, the Pro is able to grow just fine. Interestingly, after pre-inocu-lation with EZ55, we can then remove it by filtration, and then an inoculum of Pro will grow just as well. We assume that the heterotroph is preconditioning the media in this case. However, if take that preconditioned medium and add HOOH back at
the original value, 200 nM, the Pro is no longer able to grow. We conclude that whatever the heterotrophs are doing apart from degrading HOOH is not sufficient to help Pro. HOOH is very membrane-permeable, so if a cell is protecting itself, it is also protecting its neighbor by degrading HOOH. The hetero-troph EZ55 protects Pro nearly as well as it protects itself.
Other researchers studying cell cultures have discovered that the biological buffer HEPES can generate HOOH when exposed it to light. We tried a number of different buffers to see which ones do or do not generate HOOH. We found that TAPS buffer did not generate much HOOH. By vary-ing the amount of TAPS and HEPES, we can adjust the amount of HOOH accumulated over time. Dousing Pro with high concentration of HOOH is lethal. When we gradually increased HOOH, using HEPES, we found that slowly ac-cumulating HOOH is just as lethal as instantaneous peroxide shock. However, Pro cells in the TAPS buffer do not gener-ate HOOH. If you add helper heterotrophs to the HEPES-buffered medium, HOOH levels remain low enough that Pro is able to survive and grow.
PRO IN THE NATURAL ENVIRONMENTOf course, laboratory phenomena may not necessarily reflect those in the natural environment. We therefore wanted to know
156 | ENERGY,ECOSYSTEM,ANDENVIRONMENTALCHANGE
what concentrations of HOOH might be present in the ocean. In winter 2007, we took a cruise in the Pacific Ocean near Hawaii and Australia to look at HOOH levels as a function of depth and latitude. We found that most HOOH is generated in the mixed layer near the surface, because the primary source of HOOH is photochemical production, either as rain falls or in the water itself interacting with salt organic carbon. We think this effect is due to protection the heterotrophs provide in the upper, mixed layer and less so at lower depths. If the sun is the primary source of HOOH then microbes are the primary sink. This has been known at least since 1997. If you take raw seawater with microbes in it and put it in the dark, you see a rapid decline of HOOH. But if you filter certain frac-tions of the microbes from the seawater, HOOH degradation is increased. If you get rid of all the bacteria and other living organisms, there is no more degradation of HOOH.
We also wanted to know how important the heterotrophs are in keeping Pro healthy at the surface of the ocean. Would Pro survive in a marine environment with no other microbe around to help? We designed an experiment to answer that ques-tion. We took samples of water from the Atlantic and Pacific Oceans. We placed some of the bottles of seawater in the dark and found no change in HOOH, but when we exposed the bottled water to the equivalent of light and ultraviolet light at 5 meters depth we saw a dramatic increase in HOOH. Basi-cally, the microbial sink is moving HOOH from the upper to the lower depths of the ocean. It seems the heterotrophs keep HOOH levels low enough that Pro is able to grow just fine.
To understand the physiology of Pro and what is causing death in these cells, we started to look at the efficiency of Pro photo-synthesis. If we put Pro in a very low concentration of HOOH, whether or not helpers are present, the Pro has good photo-synthetic efficiency. If we then expose Pro to a lethal level of
HOOH in the absence of any other microbes, there is a rapid drop off in photosynthetic efficiency. This suggests that Pro has trouble photosynthesizing under this stress. If we then add back EZ55, the photosynthetic efficiency is unaffected by the HOOH. Again, the heterotrophs are protecting the photosyn-thesis of Pro. This may be explained by the cell envelope. If we look at scanning electron microscope images of controlled Pro cells exposed at a high concentration of HOOH over 24 hours, we see dramatic damage to the cells, massive holes in the cell envelope, and debris from damage caused by oxidative stress.
To summarize, we have found that many heterotrophs can help Pro grow in liquid and solid media. Removal of HOOH is involved in the helping mechanism, which occurs at ecologi-cally relevant concentrations of Pro, heterotroph, and HOOH. This process occurs in the middle of the oceans. Pro’s photosys-tems are susceptible to peroxide damage but can be protected by heterotrophic bacteria. We are finally starting to learn more about the protective mechanism.
Our findings raise a number of intriguing issues. Neither Pro, the most abundant photosynthetic organism in the oceans, nor the SAR11 bacteria, the most abundant heterotroph in the oceans, has catalases, suggesting they are relying on much less abundant organisms in the ocean to protect them from oxida-tive stress. That is a finding we did not expect.
Everybody knows that microbes don’t live in isolation. Our project helps reinforce the idea that microbes can cross-protect each other, especially against chemical stressors. When we con-sider microbial stress and what it means to the ecology of the organism, we have to consider the entire microbial community and its ability to protect itself in cooperation with all the other microbes in the environment.
ENERGY,ECOSYSTEM,ANDENVIRONMENTALCHANGE | 157
The Role of Pocket Plasticity in the ERa Modulation by Arg394
by Aiqian Zhang
Though we all enjoy the many benefits of economic development, we also suffer from many kinds of pollution discharged into the air and water. These contaminants are known to have adverse effects on human health, though we do not always
understand the mechanisms of these effects. By some reports, more than 50 percent of human diseases may be related to environmental contaminants.
Data from China indicate that as the county was enjoying rapid economic development during the 1970s to 1980s, cancer mor-tality increased. No one is quite sure why, but there are some clues. All pollutants have different health effects, and many are known to increase the risk of reproductive changes and of cancer. Reports from the 1980s to 1990s have linked the rapid development of village industries to increases in cancer mor-tality. One such example is found in a city of northern China where a large wastewater storage facility was built. This storage facility drained into a canal and ultimately into a lake. At the same time, cancer mortality increased steadily.
BACKGROUNDBreast cancer is the most common malignant tumor among women and accounts for 18 percent (58,000/year) of all cancer deaths. It has been reported that estrogen receptor (ER) is expressed in approximately 70 to 80 percent of breast cancers, which has a direct relationship with pathological changes of cancer cells. The presence of ER is one of the strongest prog-nostic factors in breast cancer, and ER status has a clear impact on patient management. Consequently, numerous modalities of endocrine therapy, primarily aimed at estrogen deprivation with a comparable spectra of activity, have been developed. The main action mechanism of these cytostatic agents is suggested to be the blocking division of estrogen-dependent tumor cells. Tamoxifen is the principal and most frequently used agent. However, estradiol derivatives are also potential ER agonists or antagonists. Some estradiol derivatives have been reported to have an ER effect, including various residues or sidechains. Such estrogenic activities are involved in hormone synthesis, secretion, transportation, binding, and degradation, which cause emergence of genital variation as well as endocrine system disorders in fish, birds, reptiles, and mammals.
Estrogens regulate many biological functions through two ER subtypes, ER alpha and ER beta, as well as differential
interaction of the ligand-receptor complexes with promoters and co-regulator proteins. It is interesting to note that ligands modulate nuclear receptor activity by binding to their ligand-binding domains and stabilizing conformations, which leads to either transcriptional activation or repression. The model-ing of ligand-receptor binding interaction by computer-aided simulation methods continues to receive considerable attention. In particular, one of the principal objectives of binding simula-tion is to discover accurate binding modes and obtain stabilized ligand-protein complex conformation. It is generally accepted that, for a binding modeling procedure to work reliably, the protein flexibility needs to be considered.
Sivanesan et al. (2005) introduced a molecular dynamics-based docking approach to investigate the influence on the high-throughput virtual screening of small molecules against flexible ligand binding pockets. The authors found that only 17 of the ligand-binding domain residues contributed to the overall flex-ibility of the binding pocket and 32 compounds were identified to bind better to the flexible ligand-binding pockets compared to the crystal structure. Similarly, a protein sidechain refine-ment stage was introduced to allow flexibility of the protein-binding site. Recently, Monte Carlo sidechain sampling has been applied to assess the flexibility of protein binding pockets, based upon proof-of-principle calculations of six proteins.
Furthermore, the ligand-binding pocket is somewhat flexible, and binding affinities can be measured over a 10-million-fold range. The flexible active site of ER has the capability to ac-commodate different kinds of ligands, and the pocket confor-mation can be modified to adapt to diverse ligands. However, these induced fit effects have not been well determined by experiment.
RECENT FINDINGSMy colleagues and I have recently tried to discover the po-tential flexible residues of ER by molecular flexible docking. Subsequently, determination of ER activity by in vitro bioassay was performed to assess the binding affinity to ER. In the past few decades, many in vitro experiments have been developed, of which the recombined yeast screen has shown many advan-tages. Therefore, genetically modified yeast cells are used for estrogen activity measurement by transcription activation of reporter genes. At present, yeast estrogen bioassays are based on the expression vector encoding the human ER and Lac Z re-
Dr. Zhang is the Principal Investigator Director of the Theoretical Environmental Chemistry Group at the State Key Laboratory of Environmental Chemistry and Ecotoxicity, Research Center of Eco-Environmental Sciences, Chinese Academy of Sciences.T
158 | ENERGY,ECOSYSTEM,ANDENVIRONMENTALCHANGE
porter vector gene. This reporter gene encodes β-galactosidase, which can be easily quantified. The chemicals discussed here are estradiol derivatives, among which E2 was used as a posi-tive control. They not only represent different types of natural chemicals to probe the pocket flexibility, but also cover activi-ties ranging from weakly positive to strongly positive.
Estradiol derivatives, with similar structures as estradiol (E2) or estradiol metabolites, have been recognized to have detrimental health effects on wildlife and humans. However, data at the molecular level about interactions of these compounds with biological targets are still lacking. Herein, a flexible docking approach was used to characterize the molecular interaction of nine estradiol derivatives with estrogen receptor alpha (ER) in the ligand-binding domain. All ligands were docked in the buried hydrophobic cavity of the steroid hormone pocket. In addition, the plasticity of an active site was also identified by reversing amino acid arginine 394 for better ligand-receptor binding affinity. Finally, bioassays based on genetically modi-fied yeast strains were used to validate the quality of molecular
simulation because of their rapidity and high sensitivity. The experimental findings about logarithm values of the median effective concentration (EC50) value had a linear correlation with computational binding affinity from molecular docking, which described a pattern of interaction between estradiol derivatives and ER. The estrogenic activity of all compounds, although more or less lower than E2, was proved to possess high severe environmental risks. Considering the sidechain flexibility in the ligand binding pocket, 17-ethylestradiol-3-cyclopentylether was reported to correlate highly significantly with known induced fit conformational changes based upon proof-of-principle calculations on human ER with the pres-ervation of a strong salt bridge between glutamic acid 353 and arginine 394.
EXCERPTS FROM:Yunsong Mu, Sufen Peng, Aiqian Zhang, Liansheng Wang. 2011. Role of pocket plasticity in the modulation of estrogen receptor alpha by key residue arginine 394. Environmental Toxicology and Chemistry 30 (2): 330-336.

ENERGY,ECOSYSTEM,ANDENVIRONMENTALCHANGE | 159
Population Dynamics of an Ecologically Important Marine Bacterial Clade (Roseobacter) during an Induced Phytoplankton Bloom
by Alison Buchan
On a global scale, the Roseobactor clade is an important group of organisms in the ma-rine environment. Our research group at the University of Tennessee (UT) has monitored and determined the abundance of the specific
phylogenetic types within the clade in the marine environment and then during an induced phytoplankton bloom.
The marine system is responsible for fixing half of the carbon dioxide that is fixed on a global basis, with the majority of primary production (carbon fixation) in marine systems being mediated by microbes. Of that total, half of the carbon is trans-formed by heterotrophic marine bacteria. In other words, 25 percent of all of the carbon that is fixed on earth is processed
through heterotrophic (organisms that cannot fix carbon and are dependent on organic carbon for growth) marine microbes.
For many years, we did not know who those microbes were in large part due to the difficulty of culturing these organ-isms in the in the lab. When people began to look at microbial diversity using culture-independent approaches, primarily the analysis of phylogenetically relevant genes, it was realized that often the most abundant organisms in natural environments were not well represented by microbes in culture. Molecular-based approaches were used to identify what we now consider to be the major marine microbial clades, which are taxonomi-cally cohesive groups. Looking at just the bacteria, of the nine major marine bacterial groups, eight are heterotrophic and the ninth includes the marine phytoplankton. Of interest to my
Dr. Buchan is an Assistant Professor of Microbiology at the University of Tennessee (UT) and a Faculty Member of the UT-Oak Ridge National Laboratory Graduate Program in Genome Science and Technology, and the UT Center for Environmental Biotechnology.O
160 | ENERGY,ECOSYSTEM,ANDENVIRONMENTALCHANGE
research group is the Roseobacter clade. Scientists assume that the dominance of heterotrophic prokaryotic groups such as Ro-seobacter likely results from their competence in using labile, or easily broken down, dissolved organic matter (DOM) derived from marine primary producers.
ROSEOBACTER ABUNDANCECulture-independent approaches show that Roseobacters comprise 25 percent of bacteria in coastal environments and 10 percent of bacteria in ocean surface waters. Research on microbial abundance in different marine environments gives a broader picture of the lineage distributions. In almost all ma-rine environments we find Roseobacter representation, in the open ocean and in coastal environments, including salt marshes. They are found in sea ice at the poles and near hydrothermal vents in the deep sea. They are associated with coral reefs and with sea grass.
We also find a correlation between Roseobacter abundance and proximity to different types of higher marine eukaryotes such as sponges, cuddle fish, macro algae, and oysters. In one case, Roseobacter was found to be a symbiont of a marine dinoflagellate, a flagellated protist. Other Roseobacters may be potentially probiotic in aquaculture facilities because some of them produce secondary metabolites with antimicrobial activity. Roseobacter abundance is often correlated with phytoplankton abundance. In environments with increased phytoplankton abundance, we tend to find increased Roseobacter abundance.
A phytoplankton of particular interest is the coccolithophore Emiliana huxleyi. These eukaryotic phytoplankton have calcite shells that decorate the outside of their soft bodies. Because they refract light, calcium carbonate-containing shells make E. huxlyei blooms, which sometimes form naturally in marine en-vironments, visible from space. In contrast to some other types of blooms, these are naturally occurring blooms that develop in response to seasonal chemical and physical conditions that in-duce their growth. E. huxylei blooms draw down large amounts of carbon because, at the end of a bloom, the calcium carbonate containing shells can settle to the sea floor. Basically they are drawing carbon out of surface water and providing long term storage of that carbon.
Dimethylsulfoniopropionate (DMSP) is an important organic sulfur produced by E. huxleyi and some other marine primary producers that can be metabolized by some heterotrophic ma-rine microbes. From studies of cultured heterotrophic marine bacteria, we know there are two competing pathways for the transformation of DMSP. One is the demethylation pathway in which the carbon and sulfur contained in DMSP are incorpo-rated into microbial biomass. The other pathway, the cleavage pathway, results in the formation of the climatically active gas dimethyl sulfide (DMS) and acrylate. In this second pathway, the carbon that is tied up in DMSP can be used to generate biomass, but the majority of the carbon and sulfur are often lost as the volatile gas DMS. This is important from a climate standpoint because if DMS escapes into the atmosphere, it can
be abiotically oxidized to form hygroscopic sulfur compounds that serve as cloud-condensing nuclei and result in the forma-tion of clouds, increasing the scattering or reflection of light. While DMS production is of particular interest to climate scientists, we know little of the factors that influence which of the two competing pathways is preferred in any given environ-mental situation. However, current estimates predict DMSP can account for 15 percent or more of the carbon demand for local microbial communities and 90 percent or more of sulfur demand. Furthermore, previous work by other researchers has demonstrated that Roseobacters are one of the major consum-ers of DMSP in natural environments. We used a culture-independent approach called micro-autoradiography coupled with 16S ribosomal (r)RNA gene fluorescent in situ hybridiza-tion (MicroFish) to demonstrate that Roseobacters assimilate DMSP in seawater and likely have a higher affinity for DMSP than other bacterioplankton.
Unlike most dominant marine microbial lineages, several representative Roseobacters, can be readily cultured. These are particularly valuable cultures to help us address questions about ecologically important marine bacteria. From the cultivated strains, we have obtained a number of genome sequences that provide clues to physiologies or traits that likely contribute to the overall success of these organisms in the ocean environ-ment. With respect to climate change or ecosystem processes, the genome sequences of several of the Roseobacters suggest that these organisms may be able to oxidize carbon monoxide, a much more potent greenhouse gas than carbon dioxide. Only by obtaining the genome sequence of these organisms were we able to validate that activity.
ROSEOBACTER DIVERSITYNot all Roseobacters are created equal; there is tremendous functional diversity among cultivated strains. In terms of DMSP transformation as it relates to phytoplankton, we know from the genome sequences of Roseobacter that specific strains can have either one of two aforementioned pathways for DMSP breakdown or, in some cases, both competing pathways. This phenomenon is just a hint at the variation present in the genomes of Roseobacter. Looking at all the currently avail-able Roseobacter genomes, we find a tremendous amount of functional diversity among clade members. In fact, it is hard to pinpoint a specific physiological trait that necessarily defines the lineage.
The genome sequences of cultured strains available give us a general idea as to what these organisms are doing in the envi-ronment, but are these cultured strains representative of natural populations of the organisms in the environment? The answer is yes and no; it depends on the phylotype. In some cases, certain phylotypes are well represented by cultured organisms. When we use culture-independent surveys, we see that some organ-isms are closely related to those found in the environment. Conversely, with other phylotypes, we know that these are prevalent in the environment, but we have few or no cultured representatives.
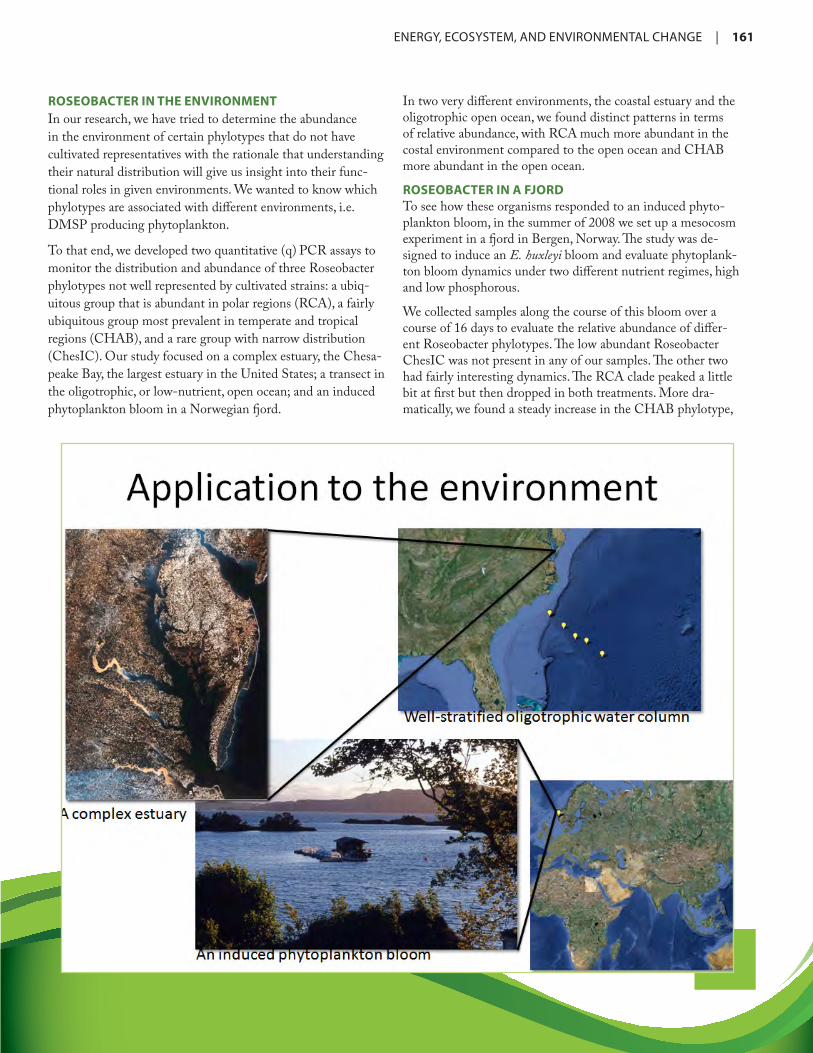
ENERGY,ECOSYSTEM,ANDENVIRONMENTALCHANGE | 161
ROSEOBACTER IN THE ENVIRONMENTIn our research, we have tried to determine the abundance in the environment of certain phylotypes that do not have cultivated representatives with the rationale that understanding their natural distribution will give us insight into their func-tional roles in given environments. We wanted to know which phylotypes are associated with different environments, i.e. DMSP producing phytoplankton.
To that end, we developed two quantitative (q) PCR assays to monitor the distribution and abundance of three Roseobacter phylotypes not well represented by cultivated strains: a ubiq-uitous group that is abundant in polar regions (RCA), a fairly ubiquitous group most prevalent in temperate and tropical regions (CHAB), and a rare group with narrow distribution (ChesIC). Our study focused on a complex estuary, the Chesa-peake Bay, the largest estuary in the United States; a transect in the oligotrophic, or low-nutrient, open ocean; and an induced phytoplankton bloom in a Norwegian fjord.
In two very different environments, the coastal estuary and the oligotrophic open ocean, we found distinct patterns in terms of relative abundance, with RCA much more abundant in the costal environment compared to the open ocean and CHAB more abundant in the open ocean.
ROSEOBACTER IN A FJORDTo see how these organisms responded to an induced phyto-plankton bloom, in the summer of 2008 we set up a mesocosm experiment in a fjord in Bergen, Norway. The study was de-signed to induce an E. huxleyi bloom and evaluate phytoplank-ton bloom dynamics under two different nutrient regimes, high and low phosphorous.
We collected samples along the course of this bloom over a course of 16 days to evaluate the relative abundance of differ-ent Roseobacter phylotypes. The low abundant Roseobacter ChesIC was not present in any of our samples. The other two had fairly interesting dynamics. The RCA clade peaked a little bit at first but then dropped in both treatments. More dra-matically, we found a steady increase in the CHAB phylotype,
162 | ENERGY,ECOSYSTEM,ANDENVIRONMENTALCHANGE
which went from being rare members of the microbial commu-nity in the absence of the nutrient treatment to becoming very abundant with the nutrient addition.
When we tried to identify a correlation between the abundance of these two different Roseobacter phylotypes and phytoplank-ton abundance, we noticed that for both treatments, RCA was negatively correlated with the abundance of a certain phyto-planktoner, Synechococcus, but CHAB was positively correlated with the abundance of the phytoplankton coccolithophore.
We also found a previously unrecognized positive association between E. huxleyi and the CHAB phylotype, suggesting that DMSP may be an important carbon and sulfur source for these organisms. In addition, we noted a previously unrecognized negative relationship between RCA and a certain phytoplank-toner, Synechococcus. This finding leads us to wonder whether there is competition between these two phylotypes for nutri-ents. Drilling down a little deeper into the Roseobacter clade helps us recognize that this is a very heterogenous group. We have learned that it is not appropriate to make generalizations about what these organisms do as a large group; rather it is more important to look more specifically at certain phylotypes.
In collaboration with Steven Wilhelm, head of the Aquatic Microbial Ecology Research Group at UT, we then did pyro-sequencing of a small region of the 16S rRNA gene to get a better picture of total microbial diversity. One challenge for us is that automated classifying of partial 16S rRNA gene se-quences provides poor phylogenetic resolution. A student in my lab performed a manual analysis and was able to obtain much greater phylogenetic resolution of these sequences. We were able to establish a strong relationship between pyrosequencing and qPCR assays, confirming that the two phylotypes we were targeting, RCA and CHAB, are the most abundant Roseobacter phylotypes in this mesocosm study.
In summary, marine heterotrophic Roseobacter are extremely abundant in the marine environment, and they are physiologi-cally versatile. We also know that some abundant Roseobacter phylotypes are poorly represented by cultivated strains. Our lab is trying to elucidate what these organisms might be doing in the environment. The first step toward accomplishing that goal was to develop qPCR primer sets that allow us to determine their abundance. We saw very clearly that the distribution and dynamics of specific Roseobacter phylotypes indeed indicate that certain phylotypes are adapted to certain environmental niches.

ENERGY,ECOSYSTEM,ANDENVIRONMENTALCHANGE | 163
Reduction of Atmospheric Dioxins and Furans (PCDD/Fs) during the Beijing 2008 Olympic Games
by Yingming Li
The chemical structure of dioxins—polychlorinated dibenzodioxins and dibenzofurans (PCDD/Fs)—makes them highly toxic, causing cancer even at very low concentration levels. Accord-ing to the international toxic equivalency factor
(TEF) established by the World Health Organization, the most toxic form of dioxin is 2,3,7,8-tetrachlorodibenzo-p-dioxin (TCDD).
These toxins are very persistent and very slow to degrade. They can be transported long distances and are ubiquitous around the globe. In addition, they bioaccumulate in the environment via the food web.
PCDD/Fs have never been produced purposely but have been associated with a number of human activities and combus-tion processes. Sources include solid waste incineration, high
Dr. Li is an Assistant Professor in the Research Center for Eco-Environmental Sciences, Chinese Academy of Science.T

164 | ENERGY,ECOSYSTEM,ANDENVIRONMENTALCHANGE
temperature processes, as a by-product from the manufacture of chlorine-related chemicals, motor vehicles, and other sources.
My research focuses on PCDD/Fs in the air. Atmospheric transport is a major pathway for the transfer of PCDD/Fs to terrestrial and aquatic ecosystems, and inhalation of PCDD/Fs through the atmosphere is the direct exposure pathway of daily dioxin intakes for humans.
PCDD/F MONITORING Current monitoring data is still scarce in China, but recent air monitoring of PCDD/Fs in mainland China has been conducted in several megacities. Results from this monitor-ing show dioxin levels were comparable or slightly higher than other urban locations around the world.
A number of emission control measures are available:
• optimizing industry structures including moving or closing heavily polluting enterprises
• modifying coal-fired facilities to use natural gas
• applying new vehicle emission standards
• implementing temporary vehicle restriction measures.
The question is whether or not these emission control measures can reduce PCDD/Fs in the atmosphere.
The aims of my research are to investigate current contamina-tion levels and temporal trends of PCDD/Fs in the atmosphere of Beijing and to assess the effectiveness of emission control measures on reducing PCDD/Fs in the air during the Beijing 2008 Olympic Games.
Three urban sites and one rural site were sampled periodically during late summer, July and August, for four consecutive years, 2007 through 2010. A comparison of toxic equivalent (TEQ) values among a number of other sites around the world, includ-ing the Great Lakes in the United States, the United King-dom, and Japan, showed that concentrations in Beijing were comparable to other urban areas.
The concentration profiles showed no significant differ-ences between rural and urban sites in China. A combustion “fingerprint” showed PCDF concentrations were greater than PCDDs. Three congeners dominated the concentra-tions profiles:(OCDD, octachlorodibenzofuran (OCDF), and 1234678- heptachlorodibenzofuran (HpCDF).
The TEQ profile indicated 23478-PeCDF was the single dominant contributor. The most abundant congeners (OCDD, OCDF) of the total PCDD/Fs concentrations did not corre-spond to higher TEQ contributions.
Temporal trends of PCDD/F concentrations showed signifi-cant declines through summer 2008 followed by a gradual rise in concentrations in 2009 and 2010, though concentrations remained lower than 2006 levels.
Temperature can also influence concentration levels. When looking at the temperature effect in this study, two distinct re-lationships between temperature and PCDD/F concentrations were found. There is a strong correlation for the period before and during the Olympic Games and no significant regression for the short period after the Olympic Games.
These results indicate that temperature variation was not re-sponsible for the PCDD/Fs increase after the Olympic Games. A plausible explanation would therefore be that increased emissions from traffic vehicles and other industrial or anthro-pogenic activities after the Olympics Games are responsible for elevated PCDD/F concentrations.
SEE:Yingming Li, Thanh Wang, Pu Wang, Lei Ding, Xiaomin Li, Yawei Wang, Qinghua Zhang, An Li, and Guibin Jiang. 2011. Reduction of Atmospheric Polychlorinated Dibenzo-p-Dioxins and Dibenzofurans (PCDD/Fs) during the 2008 Beijing Olympic Games. Environmental Science and Technology 45: 3304-3309.
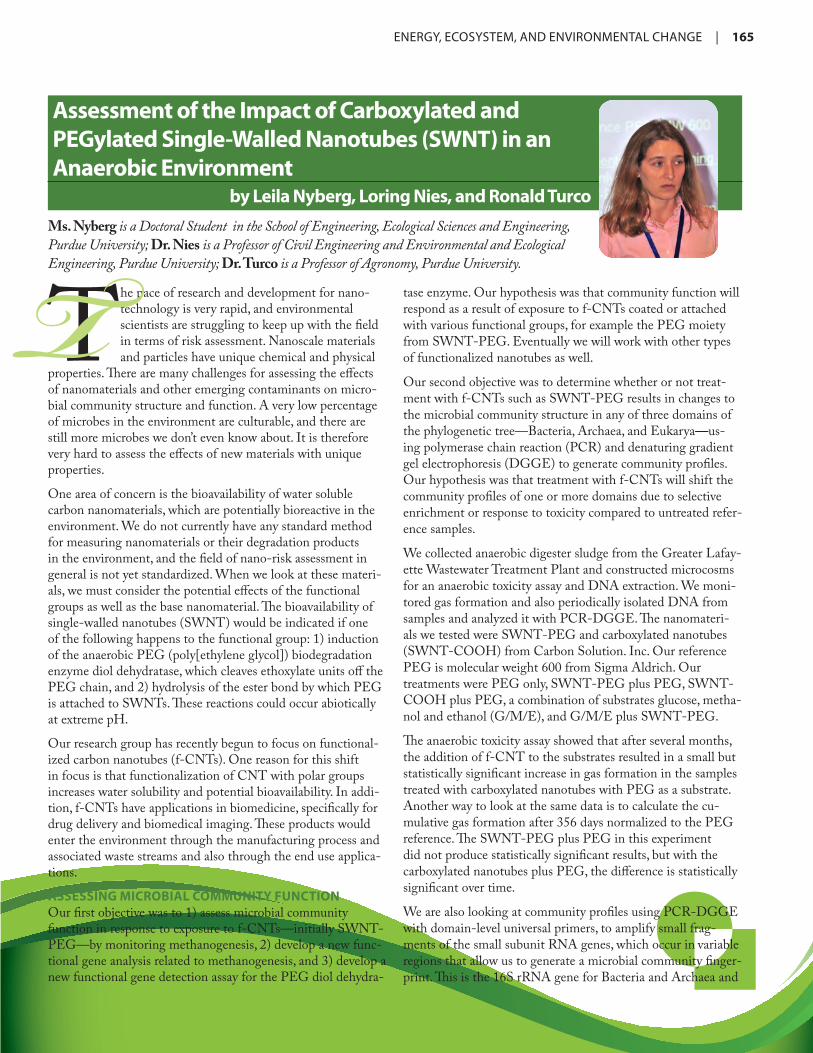
ENERGY,ECOSYSTEM,ANDENVIRONMENTALCHANGE | 165
Assessment of the Impact of Carboxylated and PEGylated Single-Walled Nanotubes (SWNT) in an Anaerobic Environment
by Leila Nyberg, Loring Nies, and Ronald Turco
The pace of research and development for nano-technology is very rapid, and environmental scientists are struggling to keep up with the field in terms of risk assessment. Nanoscale materials and particles have unique chemical and physical
properties. There are many challenges for assessing the effects of nanomaterials and other emerging contaminants on micro-bial community structure and function. A very low percentage of microbes in the environment are culturable, and there are still more microbes we don’t even know about. It is therefore very hard to assess the effects of new materials with unique properties.
One area of concern is the bioavailability of water soluble carbon nanomaterials, which are potentially bioreactive in the environment. We do not currently have any standard method for measuring nanomaterials or their degradation products in the environment, and the field of nano-risk assessment in general is not yet standardized. When we look at these materi-als, we must consider the potential effects of the functional groups as well as the base nanomaterial. The bioavailability of single-walled nanotubes (SWNT) would be indicated if one of the following happens to the functional group: 1) induction of the anaerobic PEG (poly[ethylene glycol]) biodegradation enzyme diol dehydratase, which cleaves ethoxylate units off the PEG chain, and 2) hydrolysis of the ester bond by which PEG is attached to SWNTs. These reactions could occur abiotically at extreme pH.
Our research group has recently begun to focus on functional-ized carbon nanotubes (f-CNTs). One reason for this shift in focus is that functionalization of CNT with polar groups increases water solubility and potential bioavailability. In addi-tion, f-CNTs have applications in biomedicine, specifically for drug delivery and biomedical imaging. These products would enter the environment through the manufacturing process and associated waste streams and also through the end use applica-tions.
ASSESSING MICROBIAL COMMUNITY FUNCTIONOur first objective was to 1) assess microbial community function in response to exposure to f-CNTs—initially SWNT-PEG—by monitoring methanogenesis, 2) develop a new func-tional gene analysis related to methanogenesis, and 3) develop a new functional gene detection assay for the PEG diol dehydra-
tase enzyme. Our hypothesis was that community function will respond as a result of exposure to f-CNTs coated or attached with various functional groups, for example the PEG moiety from SWNT-PEG. Eventually we will work with other types of functionalized nanotubes as well.
Our second objective was to determine whether or not treat-ment with f-CNTs such as SWNT-PEG results in changes to the microbial community structure in any of three domains of the phylogenetic tree—Bacteria, Archaea, and Eukarya—us-ing polymerase chain reaction (PCR) and denaturing gradient gel electrophoresis (DGGE) to generate community profiles. Our hypothesis was that treatment with f-CNTs will shift the community profiles of one or more domains due to selective enrichment or response to toxicity compared to untreated refer-ence samples.
We collected anaerobic digester sludge from the Greater Lafay-ette Wastewater Treatment Plant and constructed microcosms for an anaerobic toxicity assay and DNA extraction. We moni-tored gas formation and also periodically isolated DNA from samples and analyzed it with PCR-DGGE. The nanomateri-als we tested were SWNT-PEG and carboxylated nanotubes (SWNT-COOH) from Carbon Solution. Inc. Our reference PEG is molecular weight 600 from Sigma Aldrich. Our treatments were PEG only, SWNT-PEG plus PEG, SWNT-COOH plus PEG, a combination of substrates glucose, metha-nol and ethanol (G/M/E), and G/M/E plus SWNT-PEG.
The anaerobic toxicity assay showed that after several months, the addition of f-CNT to the substrates resulted in a small but statistically significant increase in gas formation in the samples treated with carboxylated nanotubes with PEG as a substrate. Another way to look at the same data is to calculate the cu-mulative gas formation after 356 days normalized to the PEG reference. The SWNT-PEG plus PEG in this experiment did not produce statistically significant results, but with the carboxylated nanotubes plus PEG, the difference is statistically significant over time.
We are also looking at community profiles using PCR-DGGE with domain-level universal primers, to amplify small frag-ments of the small subunit RNA genes, which occur in variable regions that allow us to generate a microbial community finger-print. This is the 16S rRNA gene for Bacteria and Archaea and
Ms. Nyberg is a Doctoral Student in the School of Engineering, Ecological Sciences and Engineering, Purdue University; Dr. Nies is a Professor of Civil Engineering and Environmental and Ecological Engineering, Purdue University; Dr. Turco is a Professor of Agronomy, Purdue University.T
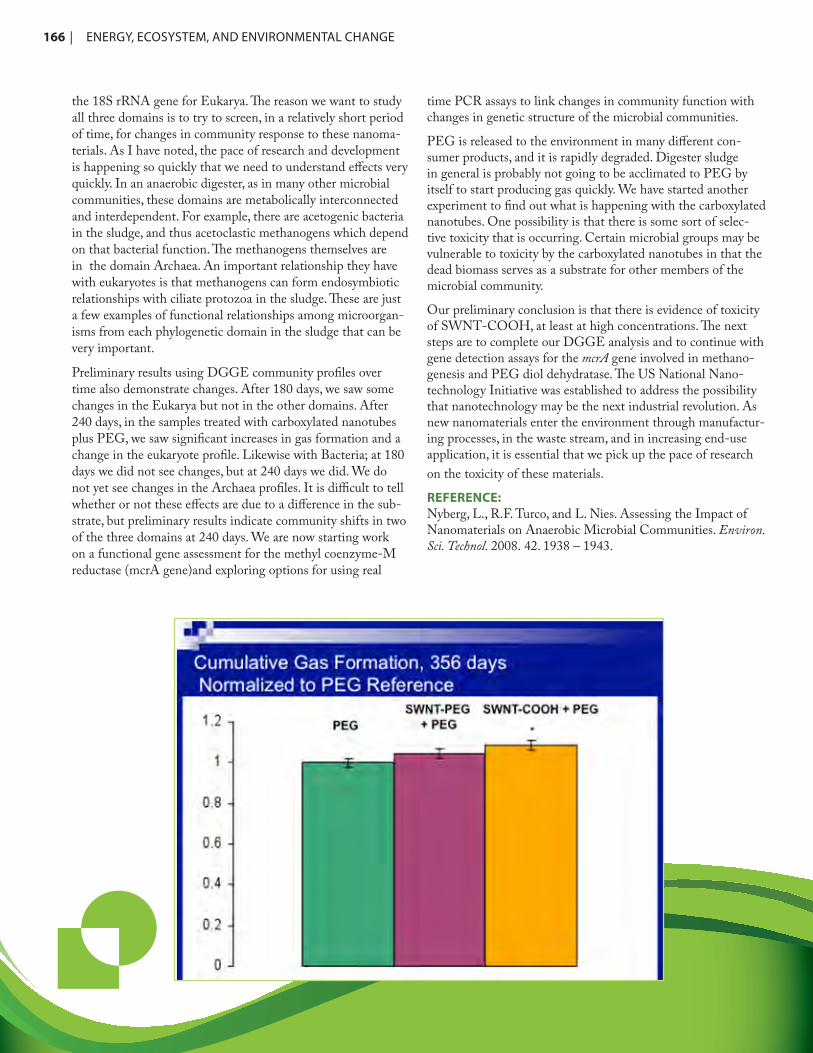
166 | ENERGY,ECOSYSTEM,ANDENVIRONMENTALCHANGE
the 18S rRNA gene for Eukarya. The reason we want to study all three domains is to try to screen, in a relatively short period of time, for changes in community response to these nanoma-terials. As I have noted, the pace of research and development is happening so quickly that we need to understand effects very quickly. In an anaerobic digester, as in many other microbial communities, these domains are metabolically interconnected and interdependent. For example, there are acetogenic bacteria in the sludge, and thus acetoclastic methanogens which depend on that bacterial function. The methanogens themselves are in the domain Archaea. An important relationship they have with eukaryotes is that methanogens can form endosymbiotic relationships with ciliate protozoa in the sludge. These are just a few examples of functional relationships among microorgan-isms from each phylogenetic domain in the sludge that can be very important.
Preliminary results using DGGE community profiles over time also demonstrate changes. After 180 days, we saw some changes in the Eukarya but not in the other domains. After 240 days, in the samples treated with carboxylated nanotubes plus PEG, we saw significant increases in gas formation and a change in the eukaryote profile. Likewise with Bacteria; at 180 days we did not see changes, but at 240 days we did. We do not yet see changes in the Archaea profiles. It is difficult to tell whether or not these effects are due to a difference in the sub-strate, but preliminary results indicate community shifts in two of the three domains at 240 days. We are now starting work on a functional gene assessment for the methyl coenzyme-M reductase (mcrA gene)and exploring options for using real
time PCR assays to link changes in community function with changes in genetic structure of the microbial communities.
PEG is released to the environment in many different con-sumer products, and it is rapidly degraded. Digester sludge in general is probably not going to be acclimated to PEG by itself to start producing gas quickly. We have started another experiment to find out what is happening with the carboxylated nanotubes. One possibility is that there is some sort of selec-tive toxicity that is occurring. Certain microbial groups may be vulnerable to toxicity by the carboxylated nanotubes in that the dead biomass serves as a substrate for other members of the microbial community.
Our preliminary conclusion is that there is evidence of toxicity of SWNT-COOH, at least at high concentrations. The next steps are to complete our DGGE analysis and to continue with gene detection assays for the mcrA gene involved in methano-genesis and PEG diol dehydratase. The US National Nano-technology Initiative was established to address the possibility that nanotechnology may be the next industrial revolution. As new nanomaterials enter the environment through manufactur-ing processes, in the waste stream, and in increasing end-use application, it is essential that we pick up the pace of research on the toxicity of these materials.
REFERENCE: Nyberg, L., R.F. Turco, and L. Nies. Assessing the Impact of Nanomaterials on Anaerobic Microbial Communities. Environ. Sci. Technol. 2008. 42. 1938 – 1943.
The primary sponsors of the Fourth Annual China-US Workshop of the China-US Joint Research Center for Ecosystem and Environmental Change ( JRCEEC) were the Ministry of Science and Technology of China, the Chinese Academy of Sciences, the Natural Science Foundation of China, the US Department of Energy, the US National Science Foundation, and the US Environmental Protection Agency. The 2010 workshop is hosted in Beijing by the Research Center for Eco-Environmental Sciences (RCEES) of the Chinese Academy of Sciences (CAS). The charter members of JRCEEC are, in the United States, the University of Tennessee (UT)-Oak Ridge National Laboratory Joint Institute for Biological Sciences, and UT’s Institute for a Secure and Sustainable Environment; and in China, the RCEES and the Institute for Geographic Sciences and Natural Resources Research, both arms of the CAS in Beijing. Other partners are the Center for the Environment (C4E) at Purdue University, and the University of Science and Technology of China.
TThe China-US Joint Research Center for Ecosystem and Environmental Change was formed in July 2006 with the signing of a framework agreement between scientists from the University of Tennessee (UT) and
Oak Ridge National Laboratory (ORNL) and researchers from the Chinese Academy of Sciences (CAS). The center organizes annual workshops held reciprocally in China and the United States.
The 2010 workshop on Energy, Ecosystem, and Environmental Change was held September 22-24 in Beijing, China, and was hosted by the Research Cener for Eco-Environmental Sciences of the Chinese Academy of Sciences. This publication presents the proceedings of the fourth workshop, at which researchers shared their recent findings in a supportive environment, reported on fruitful results of five years of collaborative research projects, and forged new pathways for future international research undertakings.
CHINA
•
USJoint Research Centerfor Ecosystem andEnvironmental Change
2010 JRCEEC WORKSHOP Sponsors and Hosts
Energy, Ecosystem, and Environmental Change
September 22-24, 2010Beijing, China
CHINA
•
USJoint Research Centerfor Ecosystem andEnvironmental Change
Workshop Sponsors:
US National Science FoundationUS Department of EnergyChinese Academy of SciencesNatural Science Foundation of ChinaMinistry of Science and Technology of ChinaUS Environmental Protection Agency