Micro-Behavioral Accidental Click Detection System for ... - MDPI
18
sensors Article Micro-Behavioral Accidental Click Detection System for Preventing Slip-Based Human Error Abdulaziz Almehmadi Citation: Almehmadi, A. Micro-Behavioral Accidental Click Detection System for Preventing Slip-Based Human Error. Sensors 2021, 21, 8209. https://doi.org/ 10.3390/s21248209 Academic Editor: Naveen Chilamkurti Received: 13 November 2021 Accepted: 7 December 2021 Published: 8 December 2021 Publisher’s Note: MDPI stays neutral with regard to jurisdictional claims in published maps and institutional affil- iations. Copyright: © 2021 by the author. Licensee MDPI, Basel, Switzerland. This article is an open access article distributed under the terms and conditions of the Creative Commons Attribution (CC BY) license (https:// creativecommons.org/licenses/by/ 4.0/). SNCS Research Center, Department of IT, Faculty of Computing and IT, University of Tabuk, Tabuk 71491, Saudi Arabia; [email protected] Abstract: Accidentally clicking on a link is a type of human error known as a slip in which a user unintentionally performs an unintended task. The risk magnitude is the probability of occurrences of such error with a possible substantial effect to which even experienced individuals are susceptible. Phishing attacks take advantage of slip-based human error by attacking psychological aspects of the users that lead to unintentionally clicking on phishing links. Such actions may lead to installing tracking software, downloading malware or viruses, or stealing private, sensitive information, to list a few. Therefore, a system is needed that detects whether a click on a link is intentional or unintentional and, if unintentional, can then prevent it. This paper proposes a micro-behavioral accidental click detection system (ACDS) to prevent slip-based human error. A within-subject- based experiment was conducted with 20 participants to test the potential of the proposed system. The results reveal the statistical significance between the two cases of intentional vs. unintentional clicks using a smartphone. Random tree, random forest, and support vector machine classifiers were used, exhibiting 82.6%, 87.2%, and 91.6% accuracy in detecting unintentional clicks, respectively. Keywords: human error detection; system design; accidental click detection; smartphone sensors; security; artificial intelligence 1. Introduction Over 95% of successful cyberattacks are the result of the weakest security chain link, human error, according to Cybint [1] and the IBM Cyber Security Intelligence Index Report [2]. Human error ‘is a generic term that involves all those instances where a planned activity fails to achieve its intended outcome’ [3]. Human error may result from inadequate security awareness, negligence, or health factors, including psychological or emotional effects, among other reasons [3]. These factors increase the likelihood of human error, especially if several factors align to cause the error. However, even without most human error factors, a chance of unintentional error among even experienced individuals still exists. According to [4], unintentional human error, known as slip-based error according to [3], in the human error model, occurs on average one to three times per hour. If an error is related to installing malware or clicking on a phishing link, the effect can be catastrophic. Phishing attacks have been developed to take advantage of slip-based errors for finan- cial reasons. Slip-based human error occurs when a user commits a task unintentionally, resulting from an unintentional click, touch on a screen, or manipulated script forcing the user to click or touch a malicious link. According to the IMC Group, since the start of COVID-19, the FBI reported an increase of 300% in cyberattacks and phishing attacks [5], all of which provide clickbait for users, taking advantage of the pandemic. Over 18 million phishing emails are sent per day, according to Business Insider [6]. According to Symantec [7], out of every 4200 emails, one email results in a successful phishing attack, and according to CSO Online [8], phishing attacks account for over 80% of reported incidents that cost over $17,500 per minute. Sensors 2021, 21, 8209. https://doi.org/10.3390/s21248209 https://www.mdpi.com/journal/sensors
-
Upload
khangminh22 -
Category
Documents
-
view
0 -
download
0
Transcript of Micro-Behavioral Accidental Click Detection System for ... - MDPI

sensors
Article
Micro-Behavioral Accidental Click Detection System forPreventing Slip-Based Human Error
Abdulaziz Almehmadi
Citation: Almehmadi, A.
Micro-Behavioral Accidental Click
Detection System for Preventing
Slip-Based Human Error. Sensors
2021, 21, 8209. https://doi.org/
10.3390/s21248209
Academic Editor:
Naveen Chilamkurti
Received: 13 November 2021
Accepted: 7 December 2021
Published: 8 December 2021
Publisher’s Note: MDPI stays neutral
with regard to jurisdictional claims in
published maps and institutional affil-
iations.
Copyright: © 2021 by the author.
Licensee MDPI, Basel, Switzerland.
This article is an open access article
distributed under the terms and
conditions of the Creative Commons
Attribution (CC BY) license (https://
creativecommons.org/licenses/by/
4.0/).
SNCS Research Center, Department of IT, Faculty of Computing and IT, University of Tabuk,Tabuk 71491, Saudi Arabia; [email protected]
Abstract: Accidentally clicking on a link is a type of human error known as a slip in which a userunintentionally performs an unintended task. The risk magnitude is the probability of occurrences ofsuch error with a possible substantial effect to which even experienced individuals are susceptible.Phishing attacks take advantage of slip-based human error by attacking psychological aspects ofthe users that lead to unintentionally clicking on phishing links. Such actions may lead to installingtracking software, downloading malware or viruses, or stealing private, sensitive information,to list a few. Therefore, a system is needed that detects whether a click on a link is intentional orunintentional and, if unintentional, can then prevent it. This paper proposes a micro-behavioralaccidental click detection system (ACDS) to prevent slip-based human error. A within-subject-based experiment was conducted with 20 participants to test the potential of the proposed system.The results reveal the statistical significance between the two cases of intentional vs. unintentionalclicks using a smartphone. Random tree, random forest, and support vector machine classifiers wereused, exhibiting 82.6%, 87.2%, and 91.6% accuracy in detecting unintentional clicks, respectively.
Keywords: human error detection; system design; accidental click detection; smartphone sensors;security; artificial intelligence
1. Introduction
Over 95% of successful cyberattacks are the result of the weakest security chainlink, human error, according to Cybint [1] and the IBM Cyber Security Intelligence IndexReport [2]. Human error ‘is a generic term that involves all those instances where a plannedactivity fails to achieve its intended outcome’ [3]. Human error may result from inadequatesecurity awareness, negligence, or health factors, including psychological or emotionaleffects, among other reasons [3]. These factors increase the likelihood of human error,especially if several factors align to cause the error.
However, even without most human error factors, a chance of unintentional erroramong even experienced individuals still exists. According to [4], unintentional humanerror, known as slip-based error according to [3], in the human error model, occurs onaverage one to three times per hour. If an error is related to installing malware or clickingon a phishing link, the effect can be catastrophic.
Phishing attacks have been developed to take advantage of slip-based errors for finan-cial reasons. Slip-based human error occurs when a user commits a task unintentionally,resulting from an unintentional click, touch on a screen, or manipulated script forcing theuser to click or touch a malicious link.
According to the IMC Group, since the start of COVID-19, the FBI reported an increaseof 300% in cyberattacks and phishing attacks [5], all of which provide clickbait for users,taking advantage of the pandemic. Over 18 million phishing emails are sent per day,according to Business Insider [6]. According to Symantec [7], out of every 4200 emails, oneemail results in a successful phishing attack, and according to CSO Online [8], phishingattacks account for over 80% of reported incidents that cost over $17,500 per minute.
Sensors 2021, 21, 8209. https://doi.org/10.3390/s21248209 https://www.mdpi.com/journal/sensors

Sensors 2021, 21, 8209 2 of 18
Proofpoint reported that 88% of organizations were subject to phishing attacks in 2020 dueto remote work forced by the pandemic [9]. Accidentally clicking on these phishing linksregardless of the cause leads to human error consequences. Some are minor, and others arecatastrophic, resulting in the loss of millions of dollars and public embarrassment.
As phishing attacks become more advanced and exploit slip-based human errors, it hasbecome prominent for countermeasures to be put into place to safeguard organizationalassets. Therefore, demand exists for a system that detects whether a click on a link isunintentional or intentional.
This paper proposes an accidental click detection system (ACDS), a micro-behavioralbased ACDS, in which the system collects information from sensors presented on a smart-phone before, during, and after a click to determine whether the click is unintentional orintentional and then proceed with or revert the action.
This paper presents the following contributions:
1. A proposed micro-behavioral measurement before, during, and after link clicks toprevent phishing attacks;
2. A system capable of detecting unintentional clicks on links by analyzing micro-behavior;3. A classification model differentiating whether a click on a link is unintentional
or intentional;4. Validation of the capability of the proposed system.
The scope of this paper is detecting an unintentional click or touch on a link presentedon a smartphone screen where the user knows that the click is an unintentional, slip-basederror, yet the click is still made. The smartphone environment is chosen due to the vastcapabilities of smartphones and because most phishing attacks result from unintentionallyclicking on a phishing email on a smartphone. According to Wandera [10], 87% of successfulphishing attacks occur on smartphones.
The remainder of this paper is organized as follows. The background and literaturereview on slip-based human error detection is presented in Section 2. The hypothesesand objectives are provided in Section 3. The ACDS design is revealed and described inSection 4. The methodology, experimental design and procedures, and data analysis arediscussed in Section 5. The results are provided in Section 6. Finally, the conclusion andfuture work are presented in Section 7.
2. Background and Literature Review2.1. Human Error
Human error has been studied for many decades in various fields, including psy-chology [3,11] and information security [12–14], and researchers continue to discover newaspects related to errors and suggest new solutions as technology advances. Some sug-gested solutions take advantage of psychological theories and discoveries to reduce, limit,detect, and prevent errors. Some are best practices and policies, and others are technicalcountermeasures. Together, they form a strong solution to the human error problem.
However, as human error may result from many possibilities due to the broad natureof errors, researchers target the human error problem according to Reason’s model ofhuman error [3]. The model states that errors can be either unintentional or intentional,where unintentional human error can be a result of lapses of memory, related to forgettingto do something or how to do it (e.g., forgetting to close a port on the firewall) or slipsof action related to not performing an intended action (e.g., unintentionally clicking ona phishing link). Both types are considered skill-based errors. According to Reason’smodel, intentional errors can be rule- and knowledge-based mistakes, where a user actsintentionally but performs the action wrongly due to a lack of knowledge. Alternatively,the errors can be violations in which a user does not follow the guidelines or policies andacts without care or commits sabotage, a form of insider threat. Therefore, most researchwork has targeted intentional or unintentional human error to prevent it.

Sensors 2021, 21, 8209 3 of 18
2.2. Intentional-Based Human Error
Various studies have been conducted to detect intentional-based human error, ei-ther knowledge-based error or violations. The authors in [15] proposed an intentionalknowledge-based human error detection system by analyzing eye-gaze behavior whilecompleting the sensitive task of configuring a firewall to determine whether a user is anexpert at the task and possesses enough knowledge. The authors analyzed eye fixations,dwells, and saccades in an experimental setting and reported that experts exhibited less ofeach behavior while completing a task than inexpert users. The system reported 99.74%accuracy in detecting the human error likelihood using the KStar classifier, which could bea valuable solution to prevent human errors before they happen.
Furthermore, the authors in [16] proposed a human-computer interface (HCI) pro-jected technique to identify knowledge-based human error resulting from low situationalawareness in complex processes. The proposed user interface reconfiguration considers theprojected future system state. If the current state is not what is projected, the interface alertsthe user to correct the expected error. Unfortunately, no system results have been reported.
The authors in [17] took a different approach by designing a system that anticipateshuman error by collecting periodic information from questionnaires, which determines theknowledge level of the user at a specific time. The system analyses the collected data andpredicts whether a human error is likely. However, no system results have been reported.
For violation-based human error, when a user intentionally performs a task (e.g.,clicking on a phishing link knowing it will cause harm), a form of insider threat, theauthors in [18] proposed monitoring the physiological signals of an individual whileperforming a task. They reported that a signal deviation happens once a user starts aviolation, where the ECG and GSR rates increase, and the skin temperature decreasessuddenly. The system reported a violation detection accuracy of 100% using the nearestneighbor classifier on an experiment with 15 subjects.
Furthermore, the authors in [19] proposed the intent-based access control system andpatent [20], allowing the detection of the user’s intent, the execution probability, and themotivation for the malicious intent. The system reported an accuracy of 100% for intentdetection by analyzing the user’s brain signals using an electroencephalogram (EEG) withvisual stimuli.
The authors in [21] further proposed a novel system and patent [22] to examinethe usage of head micromovement to detect malicious intent using visual stimuli andreported an accuracy of 100% intention detection with a lower accuracy (70%) in motivationdetection compared with the analysis of EEG signals to detect a user’s motivation for anintended action.
The authors in [23] designed a system to detect intentional malicious driving byanalyzing the driver’s behavior from data exported from an OBD-II sensor placed onthe vehicle. They reported 99.95% accuracy using random tree and forest classifiers todistinguish between normal and malicious driving. Furthermore, violation-based humanerror has been researched with high detection accuracy using facial recognition [24] andbaseline anomaly detection [25] based on predefined scenarios at 93% accuracy and usingan artificial immune system [26] with 86.34% detection accuracy. Most intentional humanerror, whether knowledge-based or violations, can be detected with high accuracy andmitigated using previously designed and tested systems in conjunction with insider threatmechanisms and guidelines, including the Insider Threat Mitigation Guide by CyberSecurity Infrastructure Security Agency released in 2020 [27].
2.3. Unintentional-Based Human Error
Some work has been conducted to detect unintentional human error, whether lapses orslips, from a technical point of view. Reason’s model states that lapses result from memoryfailure or omitting items, where a user says, “I forgot!” in response to an error, whereasslips are unintentional actions resulting from attention failure, distraction, or manipulation,

Sensors 2021, 21, 8209 4 of 18
where a user says, “I did not mean to do it” in response to an error. Slips include pressingthe wrong key or clicking on a phishing link, to list a few.
Solutions to lapses include segregation of duties where two or more users mustapprove the action to be performed (e.g., configuring a firewall) and an automated checklist,where errors can be detected if the users fall out of sequence or forget a step in a process.Intelligent helper machines can also reduce lapse-based errors. Actions are monitoredautomatically and corrected if they are mistakes.
The authors in [28] investigated a lapse-based error by analyzing EEG signals duringtactile human-machine interaction. The authors reported a change in EEG signals when auser forgets to perform an action, and the experiment analysis reports a 68.2% accuracyin differentiating between correct and error actions in 360 to 510 ms. As lapse-basedhuman error may result from an illness (e.g., Alzheimer’s disease), among other relatedhealth issues, detecting lapses is challenging without multiple sensors placed on the user(e.g., EEG sensors). Therefore, most research has focused on the system expectations of anormal and correct procedure to detect a lapse-based error, which includes errors made bymedical doctors, pilots, and astronauts. Moreover, over 60% of errors result from humanerror [29,30].
In slip-based human error, most intentional, knowledge-based errors or violationswould not be detected. Even lapse-based human error solutions would not detect slips.The user can be a qualified expert who has performed an action thousands of times yet canstill make an error. Attention detection systems may assist in detecting slip errors.
The authors in [31] studied a numerical entry human-based error with bank employees,using human behavior modeling, EEG analysis, data mining, and linear discriminantanalysis (LDA). They detected the unintentional error with 67.84% accuracy using EEGdata only, 64.42% accuracy using behavior modeling data only, and 74.84% using both EEGand behavior modeling data.
Furthermore, the authors in [32] designed a game for grasping and pushing a ball todetect whether a user intentionally or unintentionally missed the ball. They used acousticphonetic data while playing the game and separated the prior and post actions of graspingand punching the ball. They input the data into C45 and ID3 algorithms and reportedaccuracy measures of 62% and 46%, respectively.
Because most unintentional-based human error involves a human movement, oftenhand movement, the authors in [33] investigated the ability to differentiate between inten-tional and unintentional hand movement, which can help detect unintentional clicks. Theauthors ran an experiment on seven individuals and collected EEG data. Then, they inputthe data into an optimized LDA algorithm using particle swarm optimization, achieving86.4% accuracy in differentiating between intentional and unintentional hand movement.
The authors in [34] used eye movement and pupil features to detect unintentional hu-man error resulting from mental workload while performing several tasks. They achieved84.5% accuracy on average using the random forest classifier among the 25 participants inthe experiment.
Furthermore, Google [35] developed three solutions to detect unintentional clicks ontheir ads on different platforms, and all seem to reduce unintentional ad clicks. The firstsolution is to introduce a delay before the ad can be clickable. The second is to disallowapp icon clicks on ads, and the third is to revert any corner ad image clicks. Usually, whenusers are confident about their clicks/selections, the click is executed on or around thecenter of the image/link, not the edge or corner, which reduces unintentional ad clicks by50%, according to Google [35]. Table 1 summarizes the human error per category and typeand lists the method and accuracy for each detection. The detection accuracy dramaticallydeclines when detecting unintentional human error, whether lapses or slips, compared tointentional human error, whether knowledge-based or violations.
Although related work demonstrates promising results in detecting slip-based andgeneral human error, no previous work has provided a solution targeting slip-based er-rors on smartphones using micro-behavior movements before, during, and after the error,

Sensors 2021, 21, 8209 5 of 18
considering the error context. Therefore, due to the importance of detecting unintentionalhuman error and detecting and preventing slip-based human error, especially in smart-phones, this paper proposes a micro-behavioral-based unintentional ACDS projected tominimize the human error of an unintentional click on a phishing link on a smartphone.The next section provides the hypotheses and objectives for the design and evaluation ofthe proposed ACDS.
Table 1. Human error categories and detection accuracy.
Error Category Error Type Method Accuracy Ref.
Intentional
Knowledge-based Eye gaze using KStar 99.74% [15]Human Computer Interface N/A [16]
Questionnaire N/A [17]
Violations
ECG, GSR, and temp. using nearest neighbor 100% [18]EEG using SVM 100% [19,20]
OBD-II using [21,22]head micromovement using 100% [23]OBD-II using random forest 99.95% [28]
Unintentional
Lapses EEG-based 68.2% [28]
SlipsTheoretical approach N/A [29,30]
EEG-based using LDA 86.4% [33]Eye movement using random forest 84.5% [34]
3. Hypotheses and Objectives
Attackers present sophisticated methods to gain access to system resources. Some arepsychological to subconsciously deceive a user to unintentionally click on malicious links, aslip-based human error. Attackers take advantage of and sometimes cause attention failure,using distraction and manipulation to gain access. Thus, it is important to develop thefollowing hypotheses to model unintentional vs intentional clicks or touches on a link on asmartphone to combat this threat because 87% of successful attacks target smartphones,which possess various sensors allowing human behavior modeling [36–40].
3.1. Hypotheses
Main hypothesis:
Hypothesis 1. Unintentional clicks can be detected and reversed by analyzing the micro-behaviorof the user before, during, and after the click.
The rationale behind this central hypothesis is derived from the human factor theoryof unintentional causation [41,42], which states that slip-based human error can result froman inappropriate response or activity. The ability to detect unintentional hand movement,which reached over 87% accuracy when analyzing EEG signals [33], supports this hypoth-esis. Thus, EEG signals differ in intended vs unintended hand movement. While EEGsignals related to unintentional hand movement differ, according to the main hypothesis,a different hand movement behavior measured at the micro-level could be sensed by thevarious equipped smartphone sensors.
Therefore, to support the main hypothesis, it is important to develop the follow-ing hypothesis:
Hypothesis 2. Hand micro-behavior before, during, and after a click exhibits a statistical differencebetween unintentional and intentional clicks.
To investigate the ability to detect unintentional vs intentional clicks, it is necessaryto investigate whether a statistical difference exists between unintentional and inten-
Sensors 2021, 21, 8209 6 of 18
tional clicks, and if so, this supports the creation of a behavioral model, supporting thecentral hypothesis.
3.2. Objectives
The developed quantitative objectives are as follows:
1. To design the ACDS where micro-behavior before, during, and after a click arecollected and analyzed to determine whether to revert or continue with the operation.
2. To investigate the statistical difference between unintentional and intentional clicks.3. To provide a model to classify whether the micro-behavior of a click is unintentional
or intentional.4. To evaluate the capability of the ACDS in detecting unintentional clicks in a real-
life scenario.
4. Accidental Click Detection System Design
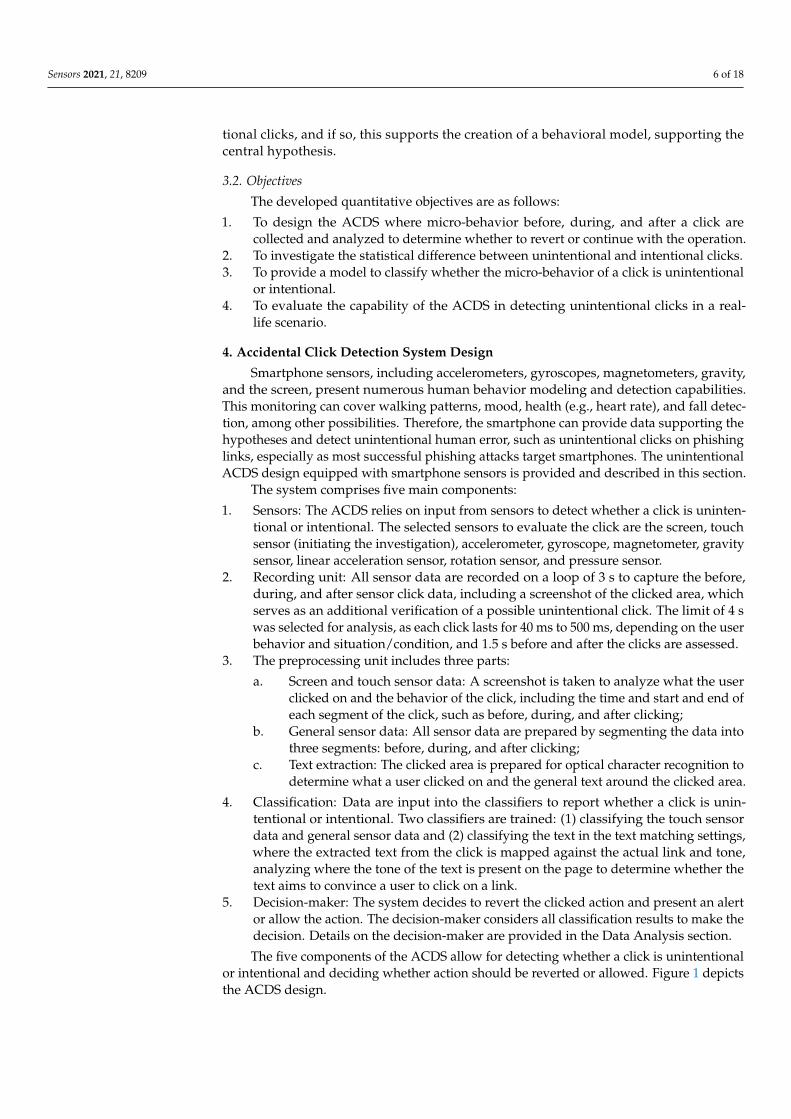
Smartphone sensors, including accelerometers, gyroscopes, magnetometers, gravity,and the screen, present numerous human behavior modeling and detection capabilities.This monitoring can cover walking patterns, mood, health (e.g., heart rate), and fall detec-tion, among other possibilities. Therefore, the smartphone can provide data supporting thehypotheses and detect unintentional human error, such as unintentional clicks on phishinglinks, especially as most successful phishing attacks target smartphones. The unintentionalACDS design equipped with smartphone sensors is provided and described in this section.
The system comprises five main components:
1. Sensors: The ACDS relies on input from sensors to detect whether a click is uninten-tional or intentional. The selected sensors to evaluate the click are the screen, touchsensor (initiating the investigation), accelerometer, gyroscope, magnetometer, gravitysensor, linear acceleration sensor, rotation sensor, and pressure sensor.
2. Recording unit: All sensor data are recorded on a loop of 3 s to capture the before,during, and after sensor click data, including a screenshot of the clicked area, whichserves as an additional verification of a possible unintentional click. The limit of 4 swas selected for analysis, as each click lasts for 40 ms to 500 ms, depending on the userbehavior and situation/condition, and 1.5 s before and after the clicks are assessed.
3. The preprocessing unit includes three parts:
a. Screen and touch sensor data: A screenshot is taken to analyze what the userclicked on and the behavior of the click, including the time and start and end ofeach segment of the click, such as before, during, and after clicking;
b. General sensor data: All sensor data are prepared by segmenting the data intothree segments: before, during, and after clicking;
c. Text extraction: The clicked area is prepared for optical character recognition todetermine what a user clicked on and the general text around the clicked area.
4. Classification: Data are input into the classifiers to report whether a click is unin-tentional or intentional. Two classifiers are trained: (1) classifying the touch sensordata and general sensor data and (2) classifying the text in the text matching settings,where the extracted text from the click is mapped against the actual link and tone,analyzing where the tone of the text is present on the page to determine whether thetext aims to convince a user to click on a link.
5. Decision-maker: The system decides to revert the clicked action and present an alertor allow the action. The decision-maker considers all classification results to make thedecision. Details on the decision-maker are provided in the Data Analysis section.
The five components of the ACDS allow for detecting whether a click is unintentionalor intentional and deciding whether action should be reverted or allowed. Figure 1 depictsthe ACDS design.

Sensors 2021, 21, 8209 7 of 18
Sensors 2021, 21, x FOR PEER REVIEW 7 of 20
user behavior and situation/condition, and 1.5 s before and after the clicks are as‐
sessed.
3. The preprocessing unit includes three parts:
a. Screen and touch sensor data: A screenshot is taken to analyze what the user
clicked on and the behavior of the click, including the time and start and end of
each segment of the click, such as before, during, and after clicking;
b. General sensor data: All sensor data are prepared by segmenting the data into
three segments: before, during, and after clicking;
c. Text extraction: The clicked area is prepared for optical character recognition to
determine what a user clicked on and the general text around the clicked area.
4. Classification: Data are input into the classifiers to report whether a click is uninten‐
tional or intentional. Two classifiers are trained: (1) classifying the touch sensor data
and general sensor data and (2) classifying the text in the text matching settings,
where the extracted text from the click is mapped against the actual link and tone,
analyzing where the tone of the text is present on the page to determine whether the
text aims to convince a user to click on a link.
5. Decision‐maker: The system decides to revert the clicked action and present an alert
or allow the action. The decision‐maker considers all classification results to make
the decision. Details on the decision‐maker are provided in the Data Analysis section.
The five components of the ACDS allow for detecting whether a click is unintentional
or intentional and deciding whether action should be reverted or allowed. Figure 1 depicts
the ACDS design.
Figure 1. Accidental click detection system (ACDS) design.
5. Methodology, Experimental Design, and Data Analysis
5.1. Methodology
Human error data can be collected by observation, error reporting, or systemized
data collection [43]. The best option in this research context is systemized data collection,
especially in determining human micro‐behavior as a possible metric in reaction to unin‐
tentional vs intentional clicks. Therefore, the methodology employs human experimenta‐
tion while collecting micro‐movements from smartphone sensors. The following sections
provide details on the experimental design, procedure, and discussions to provide a train‐
ing dataset. Random tree, random forest, and support vector machine (SVM) classifiers
were analyzed using the decision‐making component of the ACDS to test and validate
whether the findings support the hypotheses.
Figure 1. Accidental click detection system (ACDS) design.
5. Methodology, Experimental Design, and Data Analysis5.1. Methodology
Human error data can be collected by observation, error reporting, or systemizeddata collection [43]. The best option in this research context is systemized data collection,especially in determining human micro-behavior as a possible metric in reaction to uninten-tional vs intentional clicks. Therefore, the methodology employs human experimentationwhile collecting micro-movements from smartphone sensors. The following sections pro-vide details on the experimental design, procedure, and discussions to provide a trainingdataset. Random tree, random forest, and support vector machine (SVM) classifiers wereanalyzed using the decision-making component of the ACDS to test and validate whetherthe findings support the hypotheses.
5.2. Experiment
The experiment has a within-subject design where each participant faces scenariosthat lead to unintentional and intentional clicks. The sensor data were collected, and themicro-behaviors were recorded for analysis by the ACDS. Future research directions mayalso be highlighted.
5.2.1. Experiment Goal
The experiment goal is to provide a dataset, dataset 1, of human micro-behaviorin the settings of unintentional and intentional clicks or touches on a smartphone. Thedataset was trained using the random tree, random forest, and SVM classifiers in the threecomponents of the preprocessing phase: touch sensor data, sensor data, and text. Then, areal-life dataset, dataset 2, of other participants was generated while making unintentionaland intentional clicks or touches. This second dataset was used to test the capabilities ofthe ACDS in differentiating between the two cases and report the system accuracy. The firstdataset was used to train the ACDS to learn how to differentiate between the two cases,and the second dataset was used to evaluate the ACDS.
5.2.2. Subjects
In a controlled setting, 20 male and female participants between 19 and 45 years oldparticipated in the experiment. No participant had an essential tremor illness, leading toinvoluntary rhythmical shaking, and all participants were right-handed. The participantswere recruited using flyers and emails to participate in the experiment. The flyer/emailstated that participants are needed to play a game on a smartphone. Participants whofinish the game with the highest score were awarded a gift card. The rationale behind theprize was to influence participants to play with the closest attention, as attention plays asignificant role in slip-based human error.

Sensors 2021, 21, 8209 8 of 18
5.2.3. Procedure
Participants started by signing a consent form detailing that they would be playing agame of attention, where all behavioral data would be collected for analysis. After signingthe consent form, participants were individually provided with a Samsung Note 5 (Tabuk,Saudi Arabia) with the game app installed and launched. Participants were requested toclick on start to start the game, starting the data recording and creating the first dataset fortraining the classification algorithm.
The recorded data include the following:
1. Accelerometer, units: m/s2,2. Gyroscope, units: rad/s,3. Magnetometer, units: µT,4. Gravity, units: m/s2,5. Linear acceleration, units: m/s2,6. Rotation sensor, units: quaternion,7. Time, units: ms,8. Touch sensor, and9. Screen.
Each sensor was set at 100 samples/s, which was the maximum possible using aSamsung Note 5. All x, y, and z coordinates were captured.
5.2.4. Game Design
The game was designed as follows. A participant must click on the text for a color ifthe correct color is presented but not the color name/word and must click on the whitespace below the text of the color if the color is wrong. The selected correct colors are blue,pink, black, and red but not any other colors, including green, purple, grey, or orange. Eachword is written in a different color, sometimes similar and sometimes different from a color,to cause the possibility of unintentional clicks. Figure 2 depicts an example of the correctand wrong choices used in the game. Each color name is centered on the screen for easyand consistent reach. The game follows the Stroop effect [44–46], a neuropsychological testthat challenges the brain with two different kinds of stimuli: color and name of the color,serving the need to induce unintentional clicks.
Sensors 2021, 21, x FOR PEER REVIEW 9 of 20
Each word is written in a different color, sometimes similar and sometimes different from
a color, to cause the possibility of unintentional clicks. Figure 2 depicts an example of the
correct and wrong choices used in the game. Each color name is centered on the screen for
easy and consistent reach. The game follows the Stroop effect [44–46], a neuropsycholog‐
ical test that challenges the brain with two different kinds of stimuli: color and name of
the color, serving the need to induce unintentional clicks.
Figure 2. Example of correct and wrong cases.
Each session includes trials and confirmations following each trial. Each trial lasts for
more than 3 s per trial, but less than 4 s. The participant must click during this 1.5 s on the
screen. If a click is not performed, the trial is discarded, and a new trial is initiated. After
a click on the screen, when the fingertip is lifted, a delay of 1.5 s is triggered to capture the
post effect. Each participant completed 60 trials. After each trial, participants were asked
to click on the screen and choose whether their selection was thought to be correct, wrong,
or unsure for verification purposes, which was the confirmation.
The confirmation also serves as an intentional click class for the dataset because each
click is an intended click, providing 60 confirmations. The duration for the confirmation
step after each trial was set with no time limit and served as a necessary gap between trials
to ensure each collected data point is related to the trial and that no overlap can occur.
Therefore, each session lasted 180 s plus the time taken for each click and the time taken
in each confirmation step. Figure 3 depicts the flow of the experiment.
Figure 3. Flow design of the game.
Out of the 60 possible selections, 50% were marked as wrong selections if they were
made, and 50% were marked as correct selections if they were made. The rationale behind
the 60 selections, each in 3 s or more, is to have enough data in the dataset for analysis.
The rationale behind the 3 s or more per trial is to invoke a fast response that a participant
may get right intentionally or wrong unintentionally, similar to the experiment done by
[47], where a participant was stimulated and requested to move the mouse right or left in
a specific time to capture the mouse dynamics. In this experiment, all participants used
their right hand in two settings:
Figure 2. Example of correct and wrong cases.
Each session includes trials and confirmations following each trial. Each trial lasts formore than 3 s per trial, but less than 4 s. The participant must click during this 1.5 s on thescreen. If a click is not performed, the trial is discarded, and a new trial is initiated. After aclick on the screen, when the fingertip is lifted, a delay of 1.5 s is triggered to capture thepost effect. Each participant completed 60 trials. After each trial, participants were askedto click on the screen and choose whether their selection was thought to be correct, wrong,or unsure for verification purposes, which was the confirmation.

Sensors 2021, 21, 8209 9 of 18
The confirmation also serves as an intentional click class for the dataset because eachclick is an intended click, providing 60 confirmations. The duration for the confirmationstep after each trial was set with no time limit and served as a necessary gap between trialsto ensure each collected data point is related to the trial and that no overlap can occur.Therefore, each session lasted 180 s plus the time taken for each click and the time taken ineach confirmation step. Figure 3 depicts the flow of the experiment.
Sensors 2021, 21, x FOR PEER REVIEW 9 of 20
Each word is written in a different color, sometimes similar and sometimes different from
a color, to cause the possibility of unintentional clicks. Figure 2 depicts an example of the
correct and wrong choices used in the game. Each color name is centered on the screen for
easy and consistent reach. The game follows the Stroop effect [44–46], a neuropsycholog‐
ical test that challenges the brain with two different kinds of stimuli: color and name of
the color, serving the need to induce unintentional clicks.
Figure 2. Example of correct and wrong cases.
Each session includes trials and confirmations following each trial. Each trial lasts for
more than 3 s per trial, but less than 4 s. The participant must click during this 1.5 s on the
screen. If a click is not performed, the trial is discarded, and a new trial is initiated. After
a click on the screen, when the fingertip is lifted, a delay of 1.5 s is triggered to capture the
post effect. Each participant completed 60 trials. After each trial, participants were asked
to click on the screen and choose whether their selection was thought to be correct, wrong,
or unsure for verification purposes, which was the confirmation.
The confirmation also serves as an intentional click class for the dataset because each
click is an intended click, providing 60 confirmations. The duration for the confirmation
step after each trial was set with no time limit and served as a necessary gap between trials
to ensure each collected data point is related to the trial and that no overlap can occur.
Therefore, each session lasted 180 s plus the time taken for each click and the time taken
in each confirmation step. Figure 3 depicts the flow of the experiment.
Figure 3. Flow design of the game.
Out of the 60 possible selections, 50% were marked as wrong selections if they were
made, and 50% were marked as correct selections if they were made. The rationale behind
the 60 selections, each in 3 s or more, is to have enough data in the dataset for analysis.
The rationale behind the 3 s or more per trial is to invoke a fast response that a participant
may get right intentionally or wrong unintentionally, similar to the experiment done by
[47], where a participant was stimulated and requested to move the mouse right or left in
a specific time to capture the mouse dynamics. In this experiment, all participants used
their right hand in two settings:
Figure 3. Flow design of the game.
Out of the 60 possible selections, 50% were marked as wrong selections if they weremade, and 50% were marked as correct selections if they were made. The rationale behindthe 60 selections, each in 3 s or more, is to have enough data in the dataset for analysis. Therationale behind the 3 s or more per trial is to invoke a fast response that a participant mayget right intentionally or wrong unintentionally, similar to the experiment done by [47],where a participant was stimulated and requested to move the mouse right or left in aspecific time to capture the mouse dynamics. In this experiment, all participants used theirright hand in two settings:
1. Holding the smartphone and making selections with the right hand;2. Holding the smartphone with the left hand and making selections with the right hand.
The rationale behind the two settings is to investigate the influence of the usage styleon the ACDS. To avoid the influence of one setting following the other, 10 participantsstarted with the first setting followed by the second setting, and the other 10 participantsstarted with the second setting followed by the first setting. The rationale behind givingtwo groups of participants different starting settings is to remove the influence of the trialof the first setting on the trial of the second setting, known as the matrix box for a factorialdesign experiment [48].
Therefore, it is concluded with 10 participants in both the first and second settingsto evaluate whether any influence on the ACDS occurred and a dataset of 20 participantsmaking several unintentional and intentional clicks per session for two sessions wasobtained, providing 2400 trials and 2400 intentional clicks to confirm the results after eachsession. There was no guarantee that an unintentional click would be made from the first2400 clicks; thus, each selection was followed by the user stating whether it was selected bymistake to determine an unintentional click. Each correct click followed by a confirmationof a correct click was considered an intentional click. All other clicks were omitted, as onewould not know whether they were made by mistake. An additional trial was added sothat each participant completed 60 trials per session to compensate for clicks not made.
A difference exists between the number of correctly clicked colors and the 2400 in-tentional clicks in the confirmation section related to the time factor, attention level, andstress level. The ACDS uses the difference to differentiate between the two intentionalgroups, i.e., confirmed intentional clicks and hesitant intentional clicks. The selection a usermakes is recorded in the database and marks the number of correct vs wrong selectionsand whether the confirmation step after each trial matches the correct result of selection.The total wrong and correct selections are reported in the analysis section, as they serve asthe training dataset for the classifier.
5.2.5. Form Design
The second dataset was created to use as a new untrained dataset to validate thecapability of the ACDS by requesting participants who finished playing the game to

Sensors 2021, 21, 8209 10 of 18
complete an electronic form on the smartphone. The form also allowed the investigator tocontact the participant with the highest game score. Participants entered two data typesin each section on the three-section form and clicked next to move to the second section.The data include name, gender, date of birth, phone number, a short biography, and email.Participants must click next to move to the next page and click submit on the last pageto submit the data. However, the next button was red and on the left, whereas the clearbutton was green and on the right in the first form section. This setup is the opposite ofthe typical design and may cause an unintentional error that would clear the data fromthe form. The second form section after completion shows no buttons. Once the usersenter their date of birth and phone number, they are expected to click on the white spaceunder the fields. A hyperlink in white was placed there, which would open a new page ifclicked, simulating an error. Then, the next button appears under the form. Finally, afterthe participants entered their biographies and emails, they could click on the submit buttonto submit the data. The first two unintentional forms were designed to cause a slip-basederror, and the final form recorded an intentional click. The 20 participants completed theform with three sections, comprising 40 possible unintentional clicks and 20 intentionalclicks. A total of 10 participants used one hand, while another 10 participants used twohands. Figure 4 depicts the three-section form design. Table 2 provides a summary of thetwo datasets.
Sensors 2021, 21, x FOR PEER REVIEW 11 of 20
Figure 4. Flow design of the form.
Table 2. Training and evaluation datasets.
Dataset Dataset 1 Dataset 2
Goal Training Evaluation
Method game forms
Number of clicks 2400 40
Number of Intentional clicks 2400 20
Duration 180 s + click duration
and confirmation Open
Trials
120 trials per participant
+ 120 confirmations per
user
60
5.3. Data Analysis
After collecting the data from the 20 participants for Dataset 1 on the game for train‐
ing the ACDS and for Dataset 2 on the form for evaluating the ACDS in both settings (one
or both hands), Dataset 1 comprised 240 trials and Dataset 2 comprised 60 trials. The data
were converted to CSV format for analysis following the ACDS preprocessing component.
The dataset comprises all sensor data, a screenshot of where a click was made, and a
timestamp in milliseconds. Each trial had 3 s or more of recording: 1.5 s before the start of
the click, 1.5 s after the click, and a few milliseconds were recorded while the click was
made, which is the duration of the touch on the screen.
The first step is labeling the data in Datasets 1 and 2 for unintentional and intentional
clicks. The labeling in Dataset 1 is to train the ACDS, and the labeling in Dataset 2 is to
evaluate the ACDS. Each confirmation (correct, wrong, or unsure) in Dataset 1 was ex‐
tracted and mapped to the stream of trials to achieve this step, where the color was correct,
and a user clicked on it or on wrong or clicked under the color name on the empty space.
If the user clicked correctly while making the correct click, the trial was marked as a suc‐
cessful intended click. If the user clicked on wrong while making a wrong click, the trial
was marked as a successful unintentional click. The analysis indicates that, out of the 240
trials, 89 were confirmed unintentional clicks, 42 with one hand and 47 with two hands,
and 104 were confirmed intentional clicks, 61 with one hand and 43 with two hands. The
remaining trials were removed, such as when a user stated a correct click while making a
wrong click, stated a wrong click while making a correct click, or stated that they were
unsure. Dataset 1 also includes 120 trials of the confirmation of intentional clicks. Table 3
summarizes the successfully collected data of unintentional vs intentional clicks for Da‐
taset 1, and Table 4 summarizes the collected data on intentional clicks in the confirmation
vs. during gameplay.
Figure 4. Flow design of the form.
Table 2. Training and evaluation datasets.
Dataset Dataset 1 Dataset 2
Goal Training EvaluationMethod game forms
Number of clicks 2400 40Number of Intentional clicks 2400 20
Duration 180 s + click duration and confirmation Open
Trials 120 trials per participant + 120 confirmationsper user 60
5.3. Data Analysis
After collecting the data from the 20 participants for Dataset 1 on the game for trainingthe ACDS and for Dataset 2 on the form for evaluating the ACDS in both settings (one orboth hands), Dataset 1 comprised 240 trials and Dataset 2 comprised 60 trials. The datawere converted to CSV format for analysis following the ACDS preprocessing component.The dataset comprises all sensor data, a screenshot of where a click was made, and atimestamp in milliseconds. Each trial had 3 s or more of recording: 1.5 s before the startof the click, 1.5 s after the click, and a few milliseconds were recorded while the click wasmade, which is the duration of the touch on the screen.
The first step is labeling the data in Datasets 1 and 2 for unintentional and intentionalclicks. The labeling in Dataset 1 is to train the ACDS, and the labeling in Dataset 2 isto evaluate the ACDS. Each confirmation (correct, wrong, or unsure) in Dataset 1 wasextracted and mapped to the stream of trials to achieve this step, where the color wascorrect, and a user clicked on it or on wrong or clicked under the color name on the emptyspace. If the user clicked correctly while making the correct click, the trial was markedas a successful intended click. If the user clicked on wrong while making a wrong click,the trial was marked as a successful unintentional click. The analysis indicates that, out

Sensors 2021, 21, 8209 11 of 18
of the 240 trials, 89 were confirmed unintentional clicks, 42 with one hand and 47 withtwo hands, and 104 were confirmed intentional clicks, 61 with one hand and 43 with twohands. The remaining trials were removed, such as when a user stated a correct clickwhile making a wrong click, stated a wrong click while making a correct click, or statedthat they were unsure. Dataset 1 also includes 120 trials of the confirmation of intentionalclicks. Table 3 summarizes the successfully collected data of unintentional vs intentionalclicks for Dataset 1, and Table 4 summarizes the collected data on intentional clicks in theconfirmation vs. during gameplay.
Table 3. Collected data on unintentional vs intentional clicks for Dataset 1.
Condition Dataset 1 Dataset 2
1 hand intentional 42 201 hand unintentional 61 102 hands intentional 47 20
2 hands unintentional 43 10Total trials 193 60
Total samples 19,300 6000
Table 4. Collected data on intentional clicks in the confirmation vs the game for Dataset 1.
Dataset Dataset 1
1 hand intentional confirmation 601 hand intentional game 42
2 hands intentional confirmation 602 hands intentional game 47
Total trials 209Total samples 20,900
Dataset 2 has 60 trials, 40 for unintentional clicks and 20 for intentional clicks aftersubmitting the form. All trials were determined to be valid, with no noise in the data, toevaluate the ACDS. When making the intentional or unintentional click, each trial wasextracted following the exact method applied in Dataset 1. Each trial was for 3 s or more,including 1.5 s before the click, 1.5 s after the click, and the milliseconds during the touchon the screen, taking advantage of the touch sensor to locate each trial in both datasets.Figure 5 depicts an illustration of a sample trial.
Sensors 2021, 21, x FOR PEER REVIEW 12 of 20
Table 3. Collected data on unintentional vs intentional clicks for Dataset 1.
Condition Dataset 1 Dataset 2
1 hand intentional 42 20
1 hand unintentional 61 10
2 hands intentional 47 20
2 hands unintentional 43 10
Total trials 193 60
Total samples 19,300 6000
Table 4. Collected data on intentional clicks in the confirmation vs the game for Dataset 1.
Dataset Dataset 1
1 hand intentional confirmation 60
1 hand intentional game 42
2 hands intentional confirmation 60
2 hands intentional game 47
Total trials 209
Total samples 20,900
Dataset 2 has 60 trials, 40 for unintentional clicks and 20 for intentional clicks after
submitting the form. All trials were determined to be valid, with no noise in the data, to
evaluate the ACDS. When making the intentional or unintentional click, each trial was
extracted following the exact method applied in Dataset 1. Each trial was for 3 s or more,
including 1.5 s before the click, 1.5 s after the click, and the milliseconds during the touch
on the screen, taking advantage of the touch sensor to locate each trial in both datasets.
Figure 5 depicts an illustration of a sample trial.
Figure 5. Illustration of a sample trial.
After constructing the datasets and labeling each trial, intentional vs unintentional in
both datasets and intentional in the conformation vs gameplay, further data preprocessing
was performed on the touch and sensor data, touch duration, accelerometer, gyroscope,
magnetometer, gravity, linear acceleration, rotation sensor, and pressure sensor. Each sen‐
sor data point in the trial was divided into three, before, during, and after a click, provid‐
ing 24 features for training the ACDS classifiers plus the standard deviation calculated per
segment per participant (25 features).
However, before training the classifiers, data were normalized and smoothed. Then,
the principal component analysis was applied for dimensionality reduction. Next, feature
selection was performed using wrapper subset selection using the random tree, random
forest, and SVM classifiers to select the best features per classifier. Three classification
Figure 5. Illustration of a sample trial.
After constructing the datasets and labeling each trial, intentional vs unintentional inboth datasets and intentional in the conformation vs gameplay, further data preprocessingwas performed on the touch and sensor data, touch duration, accelerometer, gyroscope,magnetometer, gravity, linear acceleration, rotation sensor, and pressure sensor. Each sensordata point in the trial was divided into three, before, during, and after a click, providing

Sensors 2021, 21, 8209 12 of 18
24 features for training the ACDS classifiers plus the standard deviation calculated persegment per participant (25 features).
However, before training the classifiers, data were normalized and smoothed. Then,the principal component analysis was applied for dimensionality reduction. Next, featureselection was performed using wrapper subset selection using the random tree, randomforest, and SVM classifiers to select the best features per classifier. Three classificationmodels were created for the intentional vs unintentional trials and three classificationmodels for the intentional trials in the conformation vs gameplay for the one-hand and two-hand settings, a total of 12 classifiers. The following section reports the classifier accuracy.
Furthermore, for the recorded images, the screenshots of the center of the click wereanalyzed. Optical character recognition was applied to extract the text on a page. Twomethods were used on the extracted text, matching the text with the link and extractingthe text tone on the screen. If a text contained a link, the link was matched to the extractedtext. If the text and link matched or did not match, a trust score was assigned from 0 to 1,depending on the link type, such as short links, known phishing websites, and so on. Forthe tone analysis of the text on the screen, the IBM Tone Analyser API [49] and Geoflx [50],a chrome extension that detects text sentiment on a web page, were used to extract the tone.If the tone was negative or positive, a trust score was assigned from 0 to 1, depending onthe tone strength.
Finally, the decision-making component decides whether a click was unintentionalor intentional based on the classification results, text matching, and text tone results. Thedecision-maker assigns a weight value for each of the three components and can be tweakedas needed. Text analysis was only performed on Dataset 2 to possibly improve the ACDS.Figure 6 depicts the ACDS algorithm for detecting unintentional vs intentional clicks, andthe next section provides the ACDS results.
Sensors 2021, 21, x FOR PEER REVIEW 13 of 20
models were created for the intentional vs unintentional trials and three classification
models for the intentional trials in the conformation vs gameplay for the one‐hand and
two‐hand settings, a total of 12 classifiers. The following section reports the classifier ac‐
curacy.
Furthermore, for the recorded images, the screenshots of the center of the click were
analyzed. Optical character recognition was applied to extract the text on a page. Two
methods were used on the extracted text, matching the text with the link and extracting
the text tone on the screen. If a text contained a link, the link was matched to the extracted
text. If the text and link matched or did not match, a trust score was assigned from 0 to 1,
depending on the link type, such as short links, known phishing websites, and so on. For
the tone analysis of the text on the screen, the IBM Tone Analyser API [49] and Geoflx
[50], a chrome extension that detects text sentiment on a web page, were used to extract
the tone. If the tone was negative or positive, a trust score was assigned from 0 to 1, de‐
pending on the tone strength.
Finally, the decision‐making component decides whether a click was unintentional
or intentional based on the classification results, text matching, and text tone results. The
decision‐maker assigns a weight value for each of the three components and can be
tweaked as needed. Text analysis was only performed on Dataset 2 to possibly improve
the ACDS. Figure 6 depicts the ACDS algorithm for detecting unintentional vs intentional
clicks, and the next section provides the ACDS results.
Figure 6. ACDS data analysis algorithm. Figure 6. ACDS data analysis algorithm.

Sensors 2021, 21, 8209 13 of 18
6. Results6.1. ACDS Results
Objectives 2, 3, and 4 are achieved in this section, and the hypotheses are tested. Theclassification results are reported in each condition (one hand and two hands) to classifyunintentional vs intentional clicks and intentional clicks in confirmation vs gameplay andreport on the capability of the ACDS.
First, to achieve Objective 2 and to investigate the statistical difference betweenunintentional and intentional clicks, a t-test was applied before a click during unintentionalvs intentional clicks. The signal gradually increases in fluctuation in intentional-basedclicks while remaining almost flat in unintentional-based clicks, p < 0.042. Furthermore, at-test was applied during the unintentional vs intentional clicks, finding p < 0.001 when thesignal deviates significantly for a brief period in intentional-based clicks while fluctuatingat lower power for a longer period during unintentional-based clicks. Finally, a t-test wasapplied after a click for the unintentional vs intentional clicks, finding that p < 0.02 whenthe signal returns to the prior click signal fluctuation behavior, whereas the signal continuesto fluctuate at high power in unintentional-based clicks compared to the prior stage. Theresults support the hypothesis that hand micro-behavior before, during, and after a clickexhibit a statistical difference between unintentional and intentional clicks. The statisticaldifference exhibited similar results in both scenarios (one-hand and two-hand settings).In the two-hand setting, the fluctuations in the during and post stages were significantlyhigher: p < 0.01 in the prior stage, p < 0.001 in during stage, and p < 0.007 in the post stage.
Twelve classifiers were created when training the ACDS: six in the one-hand settingand six in the two-hand setting. The six classifiers in each setting were divided betweenunintentional and intentional-based clicks and intentional clicks in confirmation vs game-play. The three classifiers per condition were the random tree, random forest, and SVMclassifiers. Table 5 lists the classification results of the 12 classifiers. All were trained byDataset 1 while applying 10-fold cross-validation.
Table 5. Classification results on Dataset 1 for training.
Dataset Random Tree Random Forest SVM
Hand settings 1 2 1 2 1 2Intent vs. unintended clicks 89.7% 91.6% 92.3% 91.6% 92.3% 92.2%
Intent in confirmation vs. gameplay 57.1% 59.4% 63.3% 59.4% 63.3% 76.6%
The results reveal that the SVM was the best classifier for detecting unintentionalvs intentional clicks, achieving 95.1% in the one-hand setting and 97.2% in the two-handsetting. This result achieves the third objective to provide a classification model for whetherthe micro-behavior of a click is unintentional or intentional. The results indicate low butpromising accuracy when differentiating between intentional clicks in the confirmationpage and intentional clicks in the gameplay. The best classification accuracy reached 76.6%using the SVM classifier.
The classification models were applied on Dataset 2 while completing a form toevaluate the capability of the ACDS. In addition, 20 unintentional clicks and 10 intentionalclicks were made, once using one hand and once using two hands. The classification resultsare presented in Table 6.
Table 6. Classification results on Dataset 2 for evaluation.
Dataset Random Tree Random Forest SVM
Hand settings 1 2 1 2 1 2Intent vs. unintended clicks 80.1% 82.6% 82.1% 82.6% 86.5% 91.6%
The results demonstrate that the SVM classifier performs best in detecting uninten-tional vs intentional clicks, with 86.5% in the one-hand setting and 91.6% in the two-hand

Sensors 2021, 21, 8209 14 of 18
setting. The results achieve the last objective, to evaluate the capability of the ACDS indetecting unintentional clicks in a real-life scenario and support the main hypothesis thatunintentional clicks can be detected and reversed by analyzing the micro-behavior of theuser’s response before, during, and after the click.
For Dataset 2, both link matching and tone analysis reported high-risk results with atrust level close to zero, as in the first form, the text cancel was green, and in the secondform, there was no text but a white background hyperlink. Opening a new web page on anempty screen after clicking on white space or the cancel button is a phishing approach thatthe system was manually trained to detect. Each condition can be selected to either blockthe action, revert, and show an alert or continue the operation.
6.2. Discussion
To better evaluate the proposed ACDS system, two datasets were constructed, one fortraining and testing the classifier for the two conditions, i.e., intentional vs. accidental clicks,and one for evaluating the classifiers on a different dataset that the classifiers never learnedfrom, a more realistic approach for verifying the accuracy of the classifiers. The classificationaccuracy verification used was 10-fold cross validation as a validation approach instead ofseparating the dataset to 60% training and 40% testing, as cross validation provides theaverage of training and testing various dataset scenarios and report the average results,which is a less biased approach. The testing of the classifiers on newly generated datasetshould result in less classification accuracy; however, the resulted accuracy results are lessbiased and more realistic when compared to training and testing on the same dataset.
However, further dataset creation is desired to reduce bias and return a comprehensiveaccuracy reporting, that is by increasing the population in the experiment, with differentdemographics, and using different smartphones equipped with different sensors or sensorsmanufacturers to conclude the optimal classification accuracy reporting.
The ACDS system when compared to the literature shows higher acceptability, accessi-bility, and accuracy. Even though using EEG signals and eye movement show the ability todetect slip-based human error with an accuracy of 86.4% [33] and 84.5% [34], respectively,the applications may be limited, as they require either special equipment to be placed onone’s scalp to capture the EEG signals that are susceptible to noise given the low amplitudeEEG signals have, measured in the micro volt, or require a live stream capture from acamera at all times. Therefore, utilizing the sensors that a typical smartphone already hasin order to detect slip-based human error may be a better accepted solution to the generalpublic. Micro-behavior analysis provides more acceptability and accessibility to the userand require no additional sensors to provide a slip-based human error detection systemespecially in day-to-day smartphone usage. The ACDS also reports a higher accuracy whencompared to existing slip-based human error detection of an 86.5% using one hand and91.6% when using two hands an increase in accuracy of ~+0.1%–+5.2% when compared toEEG-based solution and ~+2%–+7.1% when compared to an eye movement-based solution.
6.3. Limitations
The ACDS system shows some limitations that relate to delay and power consumption.The duration for data collection and analysis to obtain classification results after a clickwas 5 s, which is a delay the user must accept until the analysis speed can be increased, assmartphone technology continues to improve. The system can provide an alert after a clickif the system detects an unintentional click and can present an alert that a link address willopen so that the user can choose to continue or revert the action.
The current system consumes 5.5 mA/s, excluding classification and screen powerconsumption; therefore, it should not be running all the time. Other metrics where a systemstarts or stops the recording can be proposed in the future to optimize the system andbenefit from its capabilities.
The acceptability of the ACDS has not been fully evaluated, but it is expected thatthe acceptability would be low in day-to-day life unless the system activates only when

Sensors 2021, 21, 8209 15 of 18
opening a chatting application or email because most phishing attackers use email orchat options.
One drawback of the system is detecting whether a click is aimed to open a new linkor type in a box. All clicks were manually omitted to fill in the form; however, a metric todetect whether a new page would open is required for the ACDS to function better.
The present results reveal the potential of the ACDS in detecting unintentional clicksand differentiating them from intentional clicks; however, the current study has not beentested in day-to-day life. Thus, some false positives or negatives are expected. The systemcan be improved to learn from those mistakes over time to reduce false positives andnegatives. Furthermore, the system may take advantage of user behavior modeling todetect intentional vs unintentional clicks, as they may vary by the user or by the user’scurrent condition, such as walking or running.
If a user does not know that they made an unintentional click, the ACDS will not beable to detect it as it heavily relies on the user’s behavior where a user notices that theyclicked by mistake or a function on the screen appears that was not expected. It is said thatno one can detect a liar if the one telling the lie does not know they are lying. This sameapplies to slip-based human error. If the user does not know they are making an accidentalclick, no behavior response will happen and the ACDS system will not be able to detect theaccidental click. Usually, a user realizes they are making the accidental error prior, during,and mostly after the error is made, which is why the ACDS system needs to be able todetect the accidental click after the click was made.
One major limitation of the ACDS system is the delay in analysis, especially post-click,when it lasts 1.5 s at least. This is a tradeoff between accuracy/security and convenience,where if the post click analysis is removed, the acceptability and convenance improvesbut the classification accuracy degreases suddenly by 17.1–21.82% from the three testedclassifiers. One possible solution is to consider the context of the click as if the click was ona website the user never visited before or from an email the user does not know. This maytrigger the need to analyzing the post click or not, which may assist in reducing the delay.
7. Conclusions and Future Work
Human error takes different shapes and has multiple causes, which are abused byattackers to gain access and launch successful attacks. One of the human error types is aslip-based human error, in which a user makes a mistake because of insufficient attention,distraction, or manipulation. Phishing attacks, a form of deceiving the user to click on alink or download an infected attachment, have increased in number over the past years.
Phishing attacks use psychological concepts in the text to influence users to click ona link or download an attachment. Some are time-triggered based on specific events orexpectations, and others are random to gain as much access as possible. Other phishingattacks force users to click on a link by having the whole page as a clickable link, byfollowing the curser, by substituting an intended button location, or even by changingthe text on the intended button to deceive the user. Most cases are detectable by the userbefore, during, or sometimes after the click is made, where the expected reaction does notmeet the intentions.
Furthermore, smartphone use has increased, and employees rely heavily on thecomputational power they provide to perform day-to-day tasks. As smartphones possesssensitive information, a successful phishing attack may provide access to a company’ssensitive information, such as passwords or trade secrets, to list a few. An unintentionalclick is not necessarily just on links but can also be when pushing a code to production,sending a message, confirming a transaction, or a bank transfer. An unintentional click maylead to any of these cases. Because of the ease of use of smartphones and the sophisticationof phishing attacks, an unintentional click or touch on a phishing link may lead to asuccessful attack.
Therefore, an ACDS was designed that takes advantage of the capabilities of smart-phones (where most phishing attacks occur) to model unintentional vs intentional clicks.

Sensors 2021, 21, 8209 16 of 18
The system was trained based on data collected in a controlled experiment and evaluatedthe system using a real-life scenario of completing a form. The results support the capabili-ties of the proposed system, reaching 82.6%, 87.2%, and 91.6% accuracy using the randomtree, random forest, and SVM, respectively. Furthermore, link matching and tone analysisof the text presented on a screen improved the system. The system assigns a risk factorif any link does not match the text a user clicked on or if the text tone on the screen isclassified as influencing the user to click on a link, all of which are phishing strategies.
Future work may improve the system using various other classification algorithms,including deep learning to gain better accuracy results and test the system in real-lifescenarios for a longer period where users report whether a click was unintentional orintentional. In addition, developing a model in which a user is expected to make anunintentional click to activate the ACDS beforehand to detect whether it occurs mayimprove the user experience, as the current system consumes power and is not userfriendly due to the 5-s wait for every click. Furthermore, applying the regret theory [51],which states that regret is a behavioral response to an error, may improve the ACDS bydetecting regret if a click is made.
Finally, studying human error probability, which is the number of errors divided bythe number of opportunities for an error to occur, may assist in predicting an error. Otherfactors that cause an error can also be considered, such as detecting that a user has lowattention or is being manipulated or distracted, to improve the ACDS.
Funding: This research was funded by the Sensor Networks and Cellular System (SNCS) ResearchCenter under Grant 1442-002.
Institutional Review Board Statement: Not applicable.
Informed Consent Statement: Not applicable.
Data Availability Statement: The data presented in this study are available on request from thecorresponding author.
Acknowledgments: The author would like to thank the Sensor Networks and Cellular Systems(SNCS) Research Center for their support.
Conflicts of Interest: The author declares no conflict of interest.
References1. Milkovich, D. 15 Alarming Cyber Security Facts and Stats; Cybint Solutions: New York, NY, USA, 2020; Available online: https:
//www.cybintsolutions.com/cyber-security-facts-stats/ (accessed on 10 August 2021).2. Analysis of Cyber Attack and Incident Data from IBM’s Worldwide Security Operations. In IBM Security Services 2014 Cyber
Security Intelligence Index; IBM Global Technology Services: Armonk, NY, USA, 2014; Available online: https://i.crn.com/sites/default/files/ckfinderimages/userfiles/images/crn/custom/IBMSecurityServices2014.PDF (accessed on 13 August 2021).
3. Reason, J. Human Error; Cambridge University Press: Cambridge, UK, 1990.4. Practical Error Management for Any Workplace, Global Safety Trainers. Available online: https://globalsafetytrainers.com/
practical-error-management-for-any-workplace/ (accessed on 10 August 2021).5. Walter, J. COVID-19 News: FBI Reports 300% Increase in Reported Cybercrimes; IMC Group: Denver, CO, USA, 2020; Available online:
https://www.imcgrupo.com/covid-19-news-fbi-reports-300-increase-in-reported-cybercrimes/ (accessed on 17 August 2021).6. Sonnemaker, T. Google Blocked an Average of 18 Million Daily Malicious Coronavirus Messages to Gmail Users in the Past Week as
Hackers Try to Capitalize on Fear and Less Secure Remote-Work Setups; Business Insider: New York, NY, USA, 2020; Available online:https://www.businessinsider.com/google-says-gmail-blocked-18-million-coronavirus-phishing-emails-2020-4. (accessed on21 August 2021).
7. Threat Hunter Team. Threat Landscape Trends—Q1 2020; Symantec: San Jose, CA, USA, 2020; Available online: https://symantec-enterprise-blogs.security.com/blogs/threat-intelligence/threat-landscape-q1-2020. (accessed on 10 August 2021).
8. Fruhlinger, J. Top Cybersecurity Facts, Figures and Statistics; CSO Online: Avon, CT, USA, 2020. Available online: https://www.csoonline.com/article/3634869/top-cybersecurity-statistics-trends-and-facts.html (accessed on 19 August 2021).
9. The State of Phish 2020, ProofPoint 2020 Annual Report. Available online: https://www.proofpoint.com/sites/default/files/gtd-pfpt-uk-tr-state-of-the-phish-2020-a4_final.pdf (accessed on 15 August 2021).
10. Phishing Statistics: The 29 Latest Phishing Stats to Know in 2020; The SSL Store: St. Petersburg, FL, USA, April 2020; Availableonline: https://www.thesslstore.com/blog/phishing-statistics-latest-phishing-stats-to-know/ (accessed on 10 July 2021).

Sensors 2021, 21, 8209 17 of 18
11. Park, K. (Ed.) Chapter 2—Psychology of Human Error. In Advances in Human Factors/Ergonomics; Elsevier: Amsterdam,The Netherlands, 1987; Volume 7, pp. 13–78. [CrossRef]
12. Evans, M.; He, Y.; Luo, C.; Yevseyeva, I.; Janicke, H.; Maglaras, L.A. Employee Perspective on Information Security RelatedHuman Error in Healthcare: Proactive Use of IS-CHEC in Questionnaire Form. IEEE Access 2019, 7, 102087–102101. [CrossRef]
13. Lee, M. Securing the human to protect the system: Human factors in cyber security. In Proceedings of the 7th IET InternationalConference on System Safety, Incorporating the Cyber Security Conference, Edinburgh, UK, 15–18 October 2012; pp. 1–5.[CrossRef]
14. Basin, D.; Radomirovic, S.; Schmid, L. Modeling Human Errors in Security Protocols. In Proceedings of the 2016 IEEE 29thComputer Security Foundations Symposium (CSF), Lisbon, Portugal, 27 June–1 July 2016; pp. 325–340. [CrossRef]
15. Kilik, O.; Almehmadi, A.; El-Khatib, K. Eye Gaze-Based Human Error Prevention System: Experts vs Non-Experts. In Proceedingsof the 13th International Conference on Security of Information and Networks (SIN 2020), Merkez, Turkey, 4–7 November 2020;Association for Computing Machinery: New York, NY, USA, 2020. Article 27. pp. 1–7. [CrossRef]
16. Weyers, B.; Burkolter, D.; Kluge, A.; Luther, W. User-Centered Interface Reconfiguration for Error Reduction in Human-ComputerInteraction. In Proceedings of the 2010 Third International Conference on Advances in Human-Oriented and PersonalizedMechanisms, Technologies and Services, Nice, France, 22–27 August 2010; pp. 52–55. [CrossRef]
17. Lee, H.-C.; Jang, T.-I.; Moon, K. Anticipating human errors from periodic big survey data in nuclear power plants. In Proceedingsof the 2017 IEEE International Conference on Big Data (Big Data), Boston, MA, USA, 11–14 December 2017; pp. 4777–4778.[CrossRef]
18. Almehmadi, A.; El-Khatib, K. On the Possibility of Insider Threat Detection Using Physiological Signal Monitoring. In Pro-ceedings of the 7th International Conference on Security of Information and Networks (SIN 14), Glasgow Scotland, UK,9–11 September 2014; Association for Computing Machinery: New York, NY, USA, 2014; pp. 223–230. [CrossRef]
19. Almehmadi, A.; El-Khatib, K. On the Possibility of Insider Threat Prevention Using Intent-Based Access Control (IBAC). IEEESyst. J. 2017, 11, 373–384. [CrossRef]
20. Almehmadi, A.; El-Khatib, K. Device and Method for Providing Intent-based Access Control. U.S. Patent No. 9,703,952,11 July 2017.
21. Almehmadi, A. Micromovement Behavior as an Intention Detection Measurement for Preventing Insider Threats. IEEE Access2018, 6, 40626–40637. [CrossRef]
22. Almehmadi, A. Systems and Methods for Providing Behavioral Based Intention Detection. U.S. Patent No. 10,559,145, 11 February 2020.23. Yardy, K.; Almehmadi, A.; El-Khatib, K. Detecting Malicious Driving with Machine Learning. In Proceedings of the 2019 IEEE
Wireless Communications and Networking Conference (WCNC), Marrakesh, Morocco, 15–18 April 2019; pp. 1–6. [CrossRef]24. Sarma, M.S.; Srinivas, Y.; Abhiram, M.; Ullala, L.; Prasanthi, M.S.; Rao, J.R. Insider Threat Detection with Face Recognition and
KNN User Classification. In Proceedings of the 2017 IEEE International Conference on Cloud Computing in Emerging Markets(CCEM), Bangalore, India, 1–3 November 2017; pp. 39–44. [CrossRef]
25. Yang, G.; Cai, L.; Yu, A.; Meng, D. A General and Expandable Insider Threat Detection System Using Baseline AnomalyDetection and Scenario-Driven Alarm Filters. In Proceedings of the 17th IEEE International Conference On Trust, SecurityAnd Privacy In Computing And Communications/12th IEEE International Conference On Big Data Science And Engineering(TrustCom/BigDataSE), New York, NY, USA, 1–3 August 2018; pp. 763–773. [CrossRef]
26. Igbe, O.; Saadawi, T. Insider Threat Detection using an Artificial Immune system Algorithm. In Proceedings of the 9thIEEE Annual Ubiquitous Computing, Electronics & Mobile Communication Conference (UEMCON), New York, NY, USA,8–10 November 2018; pp. 297–302. [CrossRef]
27. Insider Threat Mitigation Guide; Cybersecurity and Infrastructure Security Agency (CISA): Pittsburgh, PA, USA, November 2020.Available online: https://www.cisa.gov/sites/default/files/publications/Insider%20Threat%20Mitigation%20Guide_Final_508.pdf (accessed on 12 August 2021).
28. Lehne, M.; Ihme, K.; Brouwer, A.-M.; van Erp, J.B.; Zander, T.O. Error-related EEG patterns during tactile human-machineinteraction. In Proceedings of the 3rd International Conference on Affective Computing and Intelligent Interaction and Workshops,Amsterdam, The Netherlands, 10–12 September 2009; pp. 1–9. [CrossRef]
29. Sagi, A.; Sabo, A.; Kuljic, B.; Szakall, T.; Sagi, A.; Sabo, A. Intelligent system and human factor caused medical errors.In Proceedings of the IEEE 11th International Symposium on Intelligent Systems and Informatics (SISY), Subotica, Serbia,26–28 September 2013; pp. 245–248. [CrossRef]
30. Columbia Space Shuttle Accident Was Human Error of Judgment’ Business Standard. 2017. Available online: https://www.business-standard.com/article/pti-stories/columbia-space-shuttle-accident-was-human-error-of-judgment-g-117021601240_1.html (accessed on 6 July 2021).
31. Lin, C.-J.; Wu, C.; Chaovalitwongse, W.A. Integrating Human Behavior Modeling and Data Mining Techniques to Predict HumanErrors in Numerical Typing. IEEE Trans. Hum.-Mach. Syst. 2014, 45, 39–50. [CrossRef]
32. Harui, K.; Oka, N.; Yamada, Y. Distinguishing Intentional Actions from Accidental Actions. In Proceedings of the 4nd InternationalConference on Development and Learning, Osaka, Japan, 19–21 July 2005; p. 169. [CrossRef]
33. Wang, X.; Wang, J.; Bi, L.; Fei, W. EEG-Based Recognition Method of Intentional and Unintentional Hand Movement. InProceedings of the Chinese Automation Congress (CAC), Hangzhou, China, 22–24 November 2019; pp. 5480–5484. [CrossRef]

Sensors 2021, 21, 8209 18 of 18
34. Takabi, H.; Hashem, Y.; Dantu, R. Prediction of human error using eye movements patterns for unintentional insider threatdetection. In Proceedings of the IEEE 4th International Conference on Identity, Security, and Behavior Analysis (ISBA), Singapore,11–12 January 2018; pp. 1–8. [CrossRef]
35. Whitney, M. Stop Paying for Accidental Mobile Clicks! 3 Ways Google Has Improved Click Quality’ Word Stream. Availableonline: https://www.wordstream.com/blog/ws/2015/07/06/mobile-clicks#:~:text=As%20many%20as%2050%25%20of,%2Drates%20thinking%2C%20%E2%80%9CWow! (accessed on 21 August 2021).
36. Dandachi, G.; El Hassan, B.; El Husseini, A. A novel identification/verification model using smartphone’s sensors and userbehavior. In Proceedings of the 2nd International Conference on Advances in Biomedical Engineering, Tripoli, Lebanon,11–13 September 2013; pp. 235–238. [CrossRef]
37. Buriro, A.; Crispo, B.; Zhauniarovich, Y. Please hold on: Unobtrusive user authentication using smartphone’s built-in sensors.In Proceedings of the IEEE International Conference on Identity, Security and Behavior Analysis (ISBA), New Delhi, India,22–24 February 2017; pp. 1–8. [CrossRef]
38. Datta, T.; Manousakis, K. Using SVM for user profiling for autonomous smartphone authentication. In Proceedings of the IEEEMIT Undergraduate Research Technology Conference (URTC), Cambridge, MA, USA, 7–8 November 2016; pp. 1–5. [CrossRef]
39. Cheng, N.; Chen, S.; Pathak, P.; Mohapatra, P. Long-Term Privacy Profiling through Smartphone Sensors. In Proceedings of theIEEE 12th International Conference on Mobile Ad Hoc and Sensor Systems, Dallas, TX, USA, 19–22 October 2015; pp. 639–644.[CrossRef]
40. Kadri, N.; Ellouze, A.; Ksantini, M. Recommendation system for human physical activities using smartphones. In Proceedings ofthe 2nd International Conference on Computer and Information Sciences (ICCIS), Sakaka, Saudi Arabia, 13–15 October 2020;pp. 1–4. [CrossRef]
41. Meister, D. The nature of human error. In Proceedings of the IEEE Global Telecommunications Conference, 1989, and Exhibition’Communications Technology for the 1990s and Beyond’, Dallas, TX, USA, 27–30 November 1989; Volume 2, pp. 783–786.[CrossRef]
42. Goetsch, D. Theories of Accidental Causation. In Occupational Safety and Health, 7th ed.; Brown, S., Ed.; Pearson: San Antonio,TX, USA, 2019.
43. Clarke, D. Human error data collection. In Proceedings of the IEEE Colloquium on Role of the Operator in the Safety of theNuclear Industry, London, UK, 3 May 1995; pp. 5/1–5/3. [CrossRef]
44. Li, C.; Yun, D.; Lee, D.; Jeong, M. EEG analysis for cognitive interference effects in a Stroop task. In Proceedings of the 11thInternational Conference on Control, Automation and Systems, Gyeonggi-do, Korea, 26–29 October 2011; pp. 348–351.
45. Jahani, S.; Berivanlou, N.H.; Rahimpour, A.; Setarehdan, S.K. Attention level quantification during a modified stroop color wordexperiment: An fNIRS based study. In Proceedings of the 22nd Iranian Conference on Biomedical Engineering (ICBME), Tehran,Iran, 25–27 November 2015; pp. 99–103. [CrossRef]
46. De Paula, G.; Valentim, P.; Seixas, F.; Santana, R.; Muchaluat-Saade, D. Sensory Effects in Cognitive Exercises for Elderly Users:Stroop Game. In Proceedings of the IEEE 33rd International Symposium on Computer-Based Medical Systems (CBMS), Rochester,MN, USA, 28–30 July 2020; pp. 132–137. [CrossRef]
47. Monaro, M.; Gamberini, L.; Sartori, G. The detection of faked identity using unexpected questions and mouse dynamics.PLoS ONE 2017, 12, e0177851. [CrossRef] [PubMed]
48. Trochim, W. Research Methods Knowledge Base. Conjointly. Available online: https://conjointly.com/kb/factorial-designs/(accessed on 28 June 2021).
49. IBM. Tone Analyzer. Available online: https://cloud.ibm.com/apidocs/tone-analyzer (accessed on 20 April 2021).50. Geoflx Chrome Extension. Available online: https://chrome.google.com/webstore/detail/geoflx/hofhehnoimnjlolljflpmjocgcohbdhn
(accessed on 1 May 2021).51. Bell, D.E. Regret in Decision Making under Uncertainty. Oper. Res. 1982, 30, 961–981. Available online: http://www.jstor.org/
stable/170353 (accessed on 15 August 2021). [CrossRef]