MFS SERIES TRUST I Form N-CSRS Filed 2022-04-19
398
Business Address 111 HUNTINGTON AVENUE 21ST FLOOR BOSTON MA 02199 18006372929 Mailing Address 111 HUNTINGTON AVENUE 21ST FLOOR BOSTON MA 02199 SECURITIES AND EXCHANGE COMMISSION FORM N-CSRS Certified semi-annual shareholder report of registered management investment companies filed on Form N-CSR Filing Date: 2022-04-19 | Period of Report: 2022-02-28 SEC Accession No. 0001193125-22-109281 (HTML Version on secdatabase.com) FILER MFS SERIES TRUST I CIK:798244| IRS No.: 000000000 | State of Incorp.:MA | Fiscal Year End: 1130 Type: N-CSRS | Act: 40 | File No.: 811-04777 | Film No.: 22834678 Copyright © 2022 www.secdatabase.com . All Rights Reserved. Please Consider the Environment Before Printing This Document
-
Upload
khangminh22 -
Category
Documents
-
view
0 -
download
0
Transcript of MFS SERIES TRUST I Form N-CSRS Filed 2022-04-19

Business Address111 HUNTINGTON AVENUE21ST FLOORBOSTON MA 0219918006372929
Mailing Address111 HUNTINGTON AVENUE21ST FLOORBOSTON MA 02199
SECURITIES AND EXCHANGE COMMISSION
FORM N-CSRSCertified semi-annual shareholder report of registered management investment companies filed
on Form N-CSR
Filing Date: 2022-04-19 | Period of Report: 2022-02-28SEC Accession No. 0001193125-22-109281
(HTML Version on secdatabase.com)
FILERMFS SERIES TRUST ICIK:798244| IRS No.: 000000000 | State of Incorp.:MA | Fiscal Year End: 1130Type: N-CSRS | Act: 40 | File No.: 811-04777 | Film No.: 22834678
Copyright © 2022 www.secdatabase.com. All Rights Reserved.Please Consider the Environment Before Printing This Document

UNITED STATESSECURITIES AND EXCHANGE COMMISSION
Washington, D.C. 20549
FORM N-CSR
CERTIFIED SHAREHOLDER REPORT OFREGISTERED MANAGEMENT INVESTMENT COMPANIES
Investment Company Act file number 811-04777
MFS SERIES TRUST I(Exact name of registrant as specified in charter)
111 Huntington Avenue, Boston, Massachusetts 02199(Address of principal executive offices) (Zip code)
Christopher R. BohaneMassachusetts Financial Services Company
111 Huntington AvenueBoston, Massachusetts 02199
(Name and address of agents for service)
Registrant�s telephone number, including area code: (617) 954-5000
Date of fiscal year end: August 31
Date of reporting period: February 28, 2022
Copyright © 2022 www.secdatabase.com. All Rights Reserved.Please Consider the Environment Before Printing This Document

ITEM 1. REPORTS TO STOCKHOLDERS.
1(a):
Copyright © 2022 www.secdatabase.com. All Rights Reserved.Please Consider the Environment Before Printing This Document

Semiannual ReportFebruary 28, 2022
MFS® Core Equity Fund
RGI-SEM
Copyright © 2022 www.secdatabase.com. All Rights Reserved.Please Consider the Environment Before Printing This Document

Copyright © 2022 www.secdatabase.com. All Rights Reserved.Please Consider the Environment Before Printing This Document

Letter from the Chair and CEO
Portfolio composition
Expense table
Portfolio of investments
Statement of assets and liabilities
Statement of operations
Statements of changes in net assets
Financial highlights
Notes to financial statements
Proxy voting policies and information
Quarterly portfolio disclosure
Further information
Information about fund contracts and legal claims
Provision of financial reports and summary prospectuses
Contact information
MFS® Core Equity Fund
CONTENTS
1
2
3
5
14
16
17
18
27
38
38
38
38
38
back cover
The report is prepared for the general information of shareholders. It is authorized for distribution toprospective investors only when preceded or accompanied by a current prospectus.
NOT FDIC INSURED • MAY LOSE VALUE • NO BANK GUARANTEE
Copyright © 2022 www.secdatabase.com. All Rights Reserved.Please Consider the Environment Before Printing This Document

Table of Contents
Copyright © 2022 www.secdatabase.com. All Rights Reserved.Please Consider the Environment Before Printing This Document

Table of Contents
LETTER FROM THE CHAIR AND CEO
Dear Shareholders:
As a result of Russia’s invasion of Ukraine, the danger of wider geopolitical conflict has risen to a level not seen in decades, and thiscomes as sanctions aimed at countering Russia’s actions are exacerbating already mounting inflation. Consequently, at a time whenglobal growth faces multiple headwinds, central banks have been presented with the challenge of reining in rising prices without tippingeconomies into recession. The US Federal Reserve recently raised rates for the first time since 2018 and indicated that it is likely totighten policy much more over the coming year. Meanwhile, the unsettled geopolitical backdrop and prospect of tighter financialconditions has led to increased volatility.
There are, however, encouraging signs for the markets. The Omicron wave of the coronavirusis receding outside Asia, unemployment is low, and there are signs that some global supplychain bottlenecks are beginning to ease, though events in Ukraine could hamper theseadvances. Additionally, easier Chinese monetary policy and the record pace of corporate stockbuybacks are supportive elements, albeit amid an otherwise turbulent investment environment.
It is important to have a deep understanding of company fundamentals during times of market transition, and we have built our globalresearch platform to do just that.
At MFS®, we put our clients’ assets to work responsibly by carefully navigating the increasing complexity of global markets andeconomies. Guided by our commitment to long-term investing, we tune out the noise and try to uncover what we believe are the best,most durable investment opportunities in the market. Our unique global investment platform combines collective expertise, long-termdiscipline, and thoughtful risk management to create sustainable value for investors over time.
Respectfully,
Michael W. RobergeChair and Chief Executive OfficerMFS Investment Management
April 14, 2022
The opinions expressed in this letter are subject to change and may not be relied upon for investment advice. No forecasts can beguaranteed.
Copyright © 2022 www.secdatabase.com. All Rights Reserved.Please Consider the Environment Before Printing This Document

1
Copyright © 2022 www.secdatabase.com. All Rights Reserved.Please Consider the Environment Before Printing This Document

Table of Contents
PORTFOLIO COMPOSITION
(k) The sectors set forth above and the associated portfolio composition are based on MFS’ own custom sector classification methodology.
(s) Includes securities sold short.
Cash & Cash Equivalents includes any cash, investments in money market funds, short-term securities, and other assets less liabilities. Please see theStatement of Assets and Liabilities for additional information related to the fund’s cash position and other assets and liabilities.
Percentages are based on net assets as of February 28, 2022.
The portfolio is actively managed and current holdings may be different.
2
Portfolio structure
Top ten holdings
Apple, Inc. 6.4%
Microsoft Corp. 6.0%
Alphabet, Inc., “A” 4.6%
Amazon.com, Inc. 3.6%
Visa, Inc., “A” 1.6%
JPMorgan Chase & Co. 1.5%
Johnson & Johnson 1.4%
Chevron Corp. 1.3%
Merck & Co., Inc. 1.2%
Truist Financial Corp. 1.2%
Global equity sectors (k)
Technology 31.8%
Financial Services 14.6%
Health Care (s) 14.3%
Capital Goods 13.4%
Consumer Cyclicals 12.2%
Energy 6.2%
Consumer Staples 4.4%
Telecommunications/Cable Television (s) 2.3%
Copyright © 2022 www.secdatabase.com. All Rights Reserved.Please Consider the Environment Before Printing This Document

Table of Contents
EXPENSE TABLEFund expenses borne by the shareholders during the period,September 1, 2021 through February 28, 2022
As a shareholder of the fund, you incur two types of costs: (1) transaction costs, including sales charges (loads) on certain purchase orredemption payments, and (2) ongoing costs, including management fees; distribution and service (12b-1) fees; and other fundexpenses. This example is intended to help you understand your ongoing costs (in dollars) of investing in the fund and to compare thesecosts with the ongoing costs of investing in other mutual funds.
The example is based on an investment of $1,000 invested at the beginning of the period and held for the entire period September 1,2021 through February 28, 2022.
Actual Expenses
The first line for each share class in the following table provides information about actual account values and actual expenses. You mayuse the information in this line, together with the amount you invested, to estimate the expenses that you paid over the period. Simplydivide your account value by $1,000 (for example, an $8,600 account value divided by $1,000 = 8.6), then multiply the result by thenumber in the first line under the heading entitled “Expenses Paid During Period” to estimate the expenses you paid on your accountduring this period.
Hypothetical Example for Comparison Purposes
The second line for each share class in the following table provides information about hypothetical account values and hypotheticalexpenses based on the fund’s actual expense ratio and an assumed rate of return of 5% per year before expenses, which is not thefund’s actual return. The hypothetical account values and expenses may not be used to estimate the actual ending account balance orexpenses you paid for the period. You may use this information to compare the ongoing costs of investing in the fund and other funds. Todo so, compare this 5% hypothetical example with the 5% hypothetical examples that appear in the shareholder reports of the otherfunds.
Please note that the expenses shown in the table are meant to highlight your ongoing costs only and do not reflect any transactionalcosts, such as sales charges (loads). Therefore, the second line for each share class in the table is useful in comparing ongoing costsonly, and will not help you determine the relative total costs of owning different funds. In addition, if these transactional costs wereincluded, your costs would have been higher.
3
Copyright © 2022 www.secdatabase.com. All Rights Reserved.Please Consider the Environment Before Printing This Document

Table of Contents
Expense Table - continued
ShareClass
AnnualizedExpense
Ratio
BeginningAccount Value
9/01/21
EndingAccount Value
2/28/22
ExpensesPaid DuringPeriod (p)
9/01/21-2/28/22
Actual 0.90% $1,000.00 $953.31 $4.36A
Hypothetical (h) 0.90% $1,000.00 $1,020.33 $4.51
Actual 1.65% $1,000.00 $949.85 $7.98B
Hypothetical (h) 1.65% $1,000.00 $1,016.61 $8.25
Actual 1.65% $1,000.00 $949.78 $7.98C
Hypothetical (h) 1.65% $1,000.00 $1,016.61 $8.25
Actual 0.65% $1,000.00 $954.34 $3.15I
Hypothetical (h) 0.65% $1,000.00 $1,021.57 $3.26
Actual 1.65% $1,000.00 $949.86 $7.98R1
Hypothetical (h) 1.65% $1,000.00 $1,016.61 $8.25
Actual 1.13% $1,000.00 $952.17 $5.47R2
Hypothetical (h) 1.13% $1,000.00 $1,019.19 $5.66
Actual 0.90% $1,000.00 $953.35 $4.36R3
Hypothetical (h) 0.90% $1,000.00 $1,020.33 $4.51
Actual 0.65% $1,000.00 $954.51 $3.15R4
Hypothetical (h) 0.65% $1,000.00 $1,021.57 $3.26
Actual 0.57% $1,000.00 $954.88 $2.76R6
Hypothetical (h) 0.57% $1,000.00 $1,021.97 $2.86
(h) 5% class return per year before expenses.
(p) “Expenses Paid During Period” are equal to each class’s annualized expense ratio, as shown above, multiplied by the average account value overthe period, multiplied by 181/365 (to reflect the one-half year period). Expenses paid do not include any applicable sales charges (loads). Ifthese transaction costs had been included, your costs would have been higher.
Notes to Expense Table
Expense ratios include 0.02% of investment related expenses from short sales (See Note 2 of the Notes to Financial Statements).
Each class with a Rule 12b-1 service fee is subject to a rebate of a portion of such fee. Such rebates are included in the expense ratiosabove. For Class R2 shares, this rebate reduced the expense ratio above by 0.01%. See Note 3 in the Notes to Financial Statements foradditional information.
4
Copyright © 2022 www.secdatabase.com. All Rights Reserved.Please Consider the Environment Before Printing This Document

Table of Contents
PORTFOLIO OF INVESTMENTS2/28/22 (unaudited)
The Portfolio of Investments is a complete list of all securities owned by your fund. It is categorized by broad-based asset classes.
Issuer Shares/Par Value ($)
Common Stocks – 99.6%
Aerospace & Defense – 2.7%
CACI International, Inc., “A” (a) 22,725 $ 6,358,228Curtiss-Wright Corp. 77,440 11,423,949General Dynamics Corp. 43,983 10,311,814Honeywell International, Inc. 193,994 36,810,362Howmet Aerospace, Inc. 524,938 18,855,773L3Harris Technologies, Inc. 33,840 8,538,170Leidos Holdings, Inc. 69,162 7,043,458Northrop Grumman Corp. 35,310 15,611,963Parsons Corp. (a) 145,721 5,050,690Raytheon Technologies Corp. 413,911 42,508,660
$ 162,513,067
Alcoholic Beverages – 0.3%
Constellation Brands, Inc., “A” 72,137 $ 15,554,180
Apparel Manufacturers – 0.5%
NIKE, Inc., “B” 121,113 $ 16,537,980Skechers USA, Inc., “A” (a) 256,707 11,803,388
$ 28,341,368
Automotive – 1.1%
Aptiv PLC (a) 153,348 $ 19,849,365LKQ Corp. 760,021 35,682,986Magna International, Inc. 142,834 10,608,281
$ 66,140,632
Biotechnology – 1.3%
Adaptive Biotechnologies Corp. (a) 287,090 $ 4,142,709Biogen, Inc. (a) 72,527 15,303,922Illumina, Inc. (a) 33,182 10,837,241Oxford Nanopore Technologies PLC (a) 377,802 2,328,845Vertex Pharmaceuticals, Inc. (a) 208,266 47,905,345
$ 80,518,062
Broadcasting – 1.4%
Discovery Communications, Inc., “C” (a) 930,399 $ 26,023,260Walt Disney Co. (a) 399,042 59,241,775
$ 85,265,035
5
Copyright © 2022 www.secdatabase.com. All Rights Reserved.Please Consider the Environment Before Printing This Document

Table of Contents
Portfolio of Investments (unaudited) – continued
Issuer Shares/Par Value ($)
Common Stocks – continued
Brokerage & Asset Managers – 2.0%
Charles Schwab Corp. 408,611 $ 34,511,285CME Group, Inc. 111,410 26,351,807Invesco Ltd. 556,407 11,818,085KKR & Co., Inc. 199,517 11,994,962Raymond James Financial, Inc. 303,554 33,284,696
$ 117,960,835
Business Services – 3.4%
Accenture PLC, “A” 125,752 $ 39,740,147Amdocs Ltd. 181,699 14,299,711Clarivate PLC (a) 1,753,462 26,266,861Cognizant Technology Solutions Corp., “A” 308,109 26,537,428Fidelity National Information Services, Inc. 209,505 19,951,161Fiserv, Inc. (a) 219,380 21,426,845Global Payments, Inc. 131,789 17,578,017PayPal Holdings, Inc. (a) 201,704 22,576,729Thoughtworks Holding, Inc. (a) 640,035 14,631,200
$ 203,008,099
Cable TV – 0.1%
Cable One, Inc. 3,127 $ 4,480,522
Chemicals – 0.5%
Element Solutions, Inc. 848,097 $ 20,846,224FMC Corp. 77,378 9,072,571
$ 29,918,795
Computer Software – 10.0%
Adobe Systems, Inc. (a) 146,617 $ 68,569,839Atlassian Corp. PLC, “A” (a) 133,002 40,661,372Avalara, Inc. (a) 120,926 12,565,421Black Knight, Inc. (a) 158,797 8,922,803Cadence Design Systems, Inc. (a) 312,245 47,283,260Microsoft Corp. (s) 1,202,089 359,172,172Ping Identity Holding Corp. (a) 280,979 5,911,798salesforce.com, inc. (a) 275,789 58,061,858
$ 601,148,523
Computer Software - Systems – 8.5%
Apple, Inc. (s) 2,329,216 $ 384,600,146Block, Inc., “A” (a) 118,357 15,090,517NICE Systems Ltd., ADR (a) 88,607 20,047,334Rapid7, Inc. (a) 166,060 17,180,568ServiceNow, Inc. (a) 93,315 54,115,235
Copyright © 2022 www.secdatabase.com. All Rights Reserved.Please Consider the Environment Before Printing This Document

6
Copyright © 2022 www.secdatabase.com. All Rights Reserved.Please Consider the Environment Before Printing This Document
Table of Contents
Portfolio of Investments (unaudited) – continued
Issuer Shares/Par Value ($)
Common Stocks – continued
Computer Software - Systems – continued
Zebra Technologies Corp., “A” (a) 45,057 $ 18,623,860
$ 509,657,660
Construction – 1.4%
AvalonBay Communities, Inc., REIT 79,043 $ 18,858,869AZEK Co., Inc. (a) 482,841 14,238,981Masco Corp. 340,740 19,095,070Otis Worldwide Corp. 130,201 10,198,644Sherwin-Williams Co. 31,535 8,297,805Vulcan Materials Co. 90,803 16,476,204
$ 87,165,573
Consumer Products – 1.3%
Colgate-Palmolive Co. 305,419 $ 23,501,992International Flavors & Fragrances, Inc. 70,522 9,379,426Kimberly-Clark Corp. 144,048 18,747,847Procter & Gamble Co. 183,871 28,663,650
$ 80,292,915
Consumer Services – 0.7%
Booking Holdings, Inc. (a) 6,880 $ 14,945,080Bright Horizons Family Solutions, Inc. (a) 109,855 14,351,457Grand Canyon Education, Inc. (a) 119,846 10,406,228
$ 39,702,765
Containers – 0.2%
Ball Corp. 157,274 $ 14,113,769
Electrical Equipment – 1.3%
AMETEK, Inc. 53,533 $ 6,948,048Amphenol Corp., “A” 83,512 6,347,747Fortive Corp. 86,042 5,571,220Johnson Controls International PLC 357,158 23,200,984nVent Electric PLC 175,351 5,949,659Sensata Technologies Holding PLC (a) 446,511 25,857,452TE Connectivity Ltd. 50,011 7,123,067
$ 80,998,177
Electronics – 5.0%
Advanced Micro Devices (a) 339,799 $ 41,910,809Analog Devices, Inc. 153,753 24,645,068Applied Materials, Inc. 306,376 41,115,659Broadcom, Inc. 99,330 58,350,415Intel Corp. 504,637 24,071,185Lam Research Corp. 48,831 27,411,282
Copyright © 2022 www.secdatabase.com. All Rights Reserved.Please Consider the Environment Before Printing This Document

7
Copyright © 2022 www.secdatabase.com. All Rights Reserved.Please Consider the Environment Before Printing This Document

Table of Contents
Portfolio of Investments (unaudited) – continued
Issuer Shares/Par Value ($)
Common Stocks – continued
Electronics – continued
Monolithic Power Systems, Inc. 33,658 $ 15,438,925NXP Semiconductors N.V. 176,770 33,607,512Texas Instruments, Inc. 207,813 35,326,132
$ 301,876,987
Energy - Independent – 1.3%
ConocoPhillips 331,585 $ 31,454,153Diamondback Energy, Inc. 129,391 17,868,897Hess Corp. 178,154 18,004,244Valero Energy Corp. 155,757 13,007,267
$ 80,334,561
Energy - Integrated – 1.3%
Chevron Corp. 534,925 $ 77,029,200
Energy - Renewables – 0.2%
Generac Holdings, Inc. (a) 33,521 $ 10,574,870
Engineering - Construction – 0.2%
APi Group, Inc. (a) 584,266 $ 12,602,618
Entertainment – 0.1%
Vivid Seats, Inc., “A” 366,149 $ 4,276,620
Food & Beverages – 2.4%
Archer Daniels Midland Co. 265,548 $ 20,832,241Coca-Cola Co. 161,250 10,036,200Coca-Cola Europacific Partners PLC 153,293 7,850,135Hostess Brands, Inc. (a) 198,799 4,282,130J.M. Smucker Co. 66,285 8,931,904Mondelez International, Inc. 568,907 37,252,030Oatly Group AB, ADR (a) 760,634 5,134,279PepsiCo, Inc. 300,461 49,197,484
$ 143,516,403
Food & Drug Stores – 0.4%
Wal-Mart Stores, Inc. 197,270 $ 26,663,013
Forest & Paper Products – 0.4%
Rayonier, Inc., REIT 661,348 $ 26,255,516
Gaming & Lodging – 0.6%
International Game Technology PLC 452,315 $ 13,849,885Las Vegas Sands Corp. (a) 81,532 3,494,462Marriott International, Inc., “A” (a) 95,905 16,317,277
$ 33,661,624
8
Copyright © 2022 www.secdatabase.com. All Rights Reserved.Please Consider the Environment Before Printing This Document

Copyright © 2022 www.secdatabase.com. All Rights Reserved.Please Consider the Environment Before Printing This Document

Table of Contents
Portfolio of Investments (unaudited) – continued
Issuer Shares/Par Value ($)
Common Stocks – continued
General Merchandise – 1.0%
Dollar General Corp. 165,475 $ 32,820,312Dollar Tree, Inc. (a) 211,280 30,018,662
$ 62,838,974
Health Maintenance Organizations – 1.6%
Cigna Corp. 275,859 $ 65,593,753Humana, Inc. 75,067 32,603,099
$ 98,196,852
Insurance – 3.4%
Aon PLC 222,489 $ 64,997,937Arthur J. Gallagher & Co. 213,264 33,736,232Chubb Ltd. 184,508 37,573,209Hartford Financial Services Group, Inc. 255,096 17,724,070MetLife, Inc. 245,700 16,597,035Primerica, Inc. 85,800 11,144,562Reinsurance Group of America, Inc. 113,199 12,549,241Voya Financial, Inc. 180,733 12,172,368
$ 206,494,654
Internet – 4.6%
Alphabet, Inc., “A” (a)(s) 102,124 $ 275,851,221
Leisure & Toys – 0.7%
Electronic Arts, Inc. 261,925 $ 34,073,824Roblox Corp., “A” (a) 151,125 7,793,516
$ 41,867,340
Machinery & Tools – 2.4%
Eaton Corp. PLC 231,594 $ 35,732,638IDEX Corp. 27,762 5,327,528Ingersoll Rand, Inc. 443,870 22,424,312PACCAR, Inc. 325,990 29,929,142Regal Rexnord Corp. 100,669 16,142,274Roper Technologies, Inc. 79,598 35,677,416
$ 145,233,310
Major Banks – 3.2%
JPMorgan Chase & Co. 647,074 $ 91,755,093Morgan Stanley 475,437 43,141,154PNC Financial Services Group, Inc. 294,588 58,696,659
$ 193,592,906
9
Copyright © 2022 www.secdatabase.com. All Rights Reserved.Please Consider the Environment Before Printing This Document

Table of Contents
Portfolio of Investments (unaudited) – continued
Issuer Shares/Par Value ($)
Common Stocks – continued
Medical & Health Technology & Services – 1.6%
ICON PLC (a) 105,848 $ 25,192,883McKesson Corp. 204,141 56,130,609Syneos Health, Inc. (a) 205,862 16,304,270
$ 97,627,762
Medical Equipment – 5.2%
Align Technology, Inc. (a) 20,307 $ 10,386,218Becton, Dickinson and Co. 205,631 55,783,578Boston Scientific Corp. (a)(s) 1,200,013 53,004,574Envista Holdings Corp. (a) 299,757 14,388,336Maravai Lifesciences Holdings, Inc., “A” (a) 1,163,884 45,472,948Medtronic PLC 482,896 50,699,251Quidel Corp. (a) 135,786 14,364,801STERIS PLC 112,270 26,944,800Thermo Fisher Scientific, Inc. 81,302 44,228,288
$ 315,272,794
Natural Gas - Pipeline – 0.4%
Cheniere Energy, Inc. 85,178 $ 11,320,156Enterprise Products Partners LP 442,898 10,815,569
$ 22,135,725
Network & Telecom – 0.5%
Equinix, Inc., REIT 40,403 $ 28,675,221
Oil Services – 0.4%
Cactus, Inc., “A” 231,929 $ 11,749,523Schlumberger Ltd. 352,982 13,851,014
$ 25,600,537
Other Banks & Diversified Financials – 4.7%
Bank OZK 197,553 $ 9,288,942First Interstate BancSystem, Inc. 388,520 15,773,912Moody's Corp. 65,344 21,042,728Northern Trust Corp. 140,769 16,033,589Signature Bank 55,638 19,188,990SLM Corp. 898,930 17,708,921Truist Financial Corp. 1,145,348 71,263,552United Community Bank, Inc. 391,504 15,135,545Visa, Inc., “A” 443,857 95,926,375
$ 281,362,554
10
Copyright © 2022 www.secdatabase.com. All Rights Reserved.Please Consider the Environment Before Printing This Document

Copyright © 2022 www.secdatabase.com. All Rights Reserved.Please Consider the Environment Before Printing This Document

Table of Contents
Portfolio of Investments (unaudited) – continued
Issuer Shares/Par Value ($)
Common Stocks – continued
Pharmaceuticals – 4.7%
Eli Lilly & Co. 207,495 $ 51,863,375Johnson & Johnson 518,795 85,378,093Merck & Co., Inc. 955,468 73,169,739Organon & Co. 662,126 24,717,164Zoetis, Inc. 255,603 49,497,521
$ 284,625,892
Pollution Control – 0.3%
GFL Environmental, Inc. 677,469 $ 19,815,968
Printing & Publishing – 0.1%
Warner Music Group Corp. 150,623 $ 5,455,565
Railroad & Shipping – 1.2%
Canadian Pacific Railway Ltd. 675,114 $ 47,447,012CSX Corp. 785,789 26,646,105
$ 74,093,117
Real Estate – 1.3%
Broadstone Net Lease, Inc., REIT 558,957 $ 12,107,009Empire State Realty Trust, REIT, “A” 1,388,076 13,131,199Extra Space Storage, Inc., REIT 83,046 15,625,105Innovative Industrial Properties, Inc., REIT 38,112 7,182,587STORE Capital Corp., REIT 728,605 22,382,746Sun Communities, Inc., REIT 41,315 7,478,015
$ 77,906,661
Restaurants – 1.3%
Starbucks Corp. 574,549 $ 52,737,853Wendy's Co. 1,239,286 28,181,363
$ 80,919,216
Specialty Chemicals – 1.5%
Air Products & Chemicals, Inc. 51,967 $ 12,279,802Ashland Global Holdings, Inc. 162,590 15,003,805Avient Corp. 266,170 13,944,646Axalta Coating Systems Ltd. (a) 472,035 12,763,826Chemours Co. 158,308 4,369,301Diversey Holdings Ltd. (a) 1,363,813 13,051,691DuPont de Nemours, Inc. 225,591 17,453,976
$ 88,867,047
11
Copyright © 2022 www.secdatabase.com. All Rights Reserved.Please Consider the Environment Before Printing This Document

Table of Contents
Portfolio of Investments (unaudited) – continued
Issuer Shares/Par Value ($)
Common Stocks – continued
Specialty Stores – 5.4%
Amazon.com, Inc. (a)(s) 70,518 $ 216,579,113Burlington Stores, Inc. (a) 44,772 10,113,547Home Depot, Inc. 224,468 70,893,728Ross Stores, Inc. 308,735 28,215,292
$ 325,801,680
Telecommunications - Wireless – 2.2%
Liberty Broadband Corp. (a) 232,593 $ 34,121,393SBA Communications Corp., REIT 118,871 36,064,273T-Mobile US, Inc. (a) 515,772 63,548,268
$ 133,733,934
Telephone Services – 0.2%
Altice USA, Inc., “A” (a) 833,304 $ 9,632,994
Tobacco – 0.5%
Philip Morris International, Inc. 276,316 $ 27,927,258
Utilities - Electric Power – 2.6%
American Electric Power Co., Inc. 132,209 $ 11,984,746CenterPoint Energy, Inc. 671,754 18,372,472Constellation Energy 98,530 4,530,409Dominion Energy, Inc. 108,444 8,624,551Duke Energy Corp. 137,555 13,811,898Evergy, Inc. 169,270 10,564,141Exelon Corp. 295,590 12,580,310NextEra Energy, Inc. 424,281 33,208,474PG&E Corp. (a) 1,479,589 16,822,927Pinnacle West Capital Corp. 29,798 2,110,592Southern Co. 183,223 11,867,354Xcel Energy, Inc. 188,157 12,668,611
$ 157,146,485
Total Common Stocks (Identified Cost, $4,349,896,117) $6,004,247,056
Investment Companies (h) – 0.7%
Money Market Funds – 0.7%
MFS Institutional Money Market Portfolio, 0.06% (v) (Identified Cost, $43,675,433) 43,675,881 $ 43,675,881
Securities Sold Short – (0.4)%
Medical & Health Technology & Services – (0.3)%
Healthcare Services Group, Inc. (923,682) $ (14,612,649)
12
Copyright © 2022 www.secdatabase.com. All Rights Reserved.Please Consider the Environment Before Printing This Document

Table of Contents
Portfolio of Investments (unaudited) – continued
Issuer Shares/Par Value ($)
Securities Sold Short – continued
Telecommunications - Wireless – (0.1)%
Crown Castle International Corp., REIT (44,300) $ (7,379,937)
Total Securities Sold Short (Proceeds Received, $29,571,636) $ (21,992,586)
Other Assets, Less Liabilities – 0.1% 6,284,937
Net Assets – 100.0% $6,032,215,288
(a) Non-income producing security.(h) An affiliated issuer, which may be considered one in which the fund owns 5% or more of the outstanding voting securities, or a company which is
under common control. At period end, the aggregate values of the fund's investments in affiliated issuers and in unaffiliated issuers were$43,675,881 and $6,004,247,056, respectively.
(s) Security or a portion of the security was pledged to cover collateral requirements for securities sold short.(v) Affiliated issuer that is available only to investment companies managed by MFS. The rate quoted for the MFS Institutional Money Market
Portfolio is the annualized seven-day yield of the fund at period end.
The following abbreviations are used in this report and are defined:ADR American Depositary ReceiptREIT Real Estate Investment Trust
At February 28, 2022, the fund had cash collateral of $390,903 and other liquid securities with an aggregate value of $68,596,701 to cover any collateralor margin obligations for securities sold short. Restricted cash and/or deposits with brokers in the Statement of Assets and Liabilities are comprised ofcash collateral.
See Notes to Financial Statements
13
Copyright © 2022 www.secdatabase.com. All Rights Reserved.Please Consider the Environment Before Printing This Document

Table of Contents
Financial Statements
STATEMENT OF ASSETS AND LIABILITIESAt 2/28/22 (unaudited)
This statement represents your fund’s balance sheet, which details the assets and liabilities comprising the total value of the fund.
Assets
Investments in unaffiliated issuers, at value (identified cost, $4,349,896,117) $6,004,247,056Investments in affiliated issuers, at value (identified cost, $43,675,433) 43,675,881Cash 974,558Deposits with brokers for
Securities sold short 390,903Receivables for
Fund shares sold 11,894,520Dividends 6,926,931
Other assets 77,685
Total assets $6,068,187,534
Liabilities
Payables forDividends on securities sold short $195,128Securities sold short, at value (proceeds received, $29,571,636) 21,992,586Investments purchased 974,558Fund shares reacquired 11,347,418
Payable to affiliatesInvestment adviser 333,008Administrative services fee 6,392Shareholder servicing costs 881,894Distribution and service fees 81,929
Payable for independent Trustees' compensation 17,315Accrued expenses and other liabilities 142,018
Total liabilities $35,972,246
Net assets $6,032,215,288
Net assets consist of
Paid-in capital $4,192,545,666Total distributable earnings (loss) 1,839,669,622
Net assets $6,032,215,288
Shares of beneficial interest outstanding 133,110,029
14
Copyright © 2022 www.secdatabase.com. All Rights Reserved.Please Consider the Environment Before Printing This Document

Table of Contents
Statement of Assets and Liabilities (unaudited) – continued
Net assetsShares
outstandingNet asset value
per share (a)Class A $2,350,503,518 53,618,913 $43.84Class B 20,074,373 539,636 37.20Class C 125,180,124 3,423,294 36.57Class I 1,495,716,421 31,902,178 46.88Class R1 3,653,841 99,762 36.63Class R2 19,394,507 455,462 42.58Class R3 70,379,469 1,610,564 43.70Class R4 39,943,108 901,123 44.33Class R6 1,907,369,927 40,559,097 47.03
(a) Maximum offering price per share was equal to the net asset value per share for all share classes, except for Class A, for which the maximumoffering price per share was $46.51 [100 / 94.25 x $43.84]. On sales of $50,000 or more, the maximum offering price of Class A shares is reduced. Acontingent deferred sales charge may be imposed on redemptions of Class A, Class B, and Class C shares. Redemption price per share was equalto the net asset value per share for Classes I, R1, R2, R3, R4, and R6.
See Notes to Financial Statements
15
Copyright © 2022 www.secdatabase.com. All Rights Reserved.Please Consider the Environment Before Printing This Document

Table of Contents
Financial Statements
STATEMENT OF OPERATIONSSix months ended 2/28/22 (unaudited)
This statement describes how much your fund earned in investment income and accrued in expenses. It also describes any gains and/or losses generatedby fund operations.
Net investment income (loss)
IncomeDividends $35,983,615Other 127,517Dividends from affiliated issuers 22,465Income on securities loaned 1,114Foreign taxes withheld (77,627)
Total investment income $36,057,084
ExpensesManagement fee $16,004,699Distribution and service fees 3,988,614Shareholder servicing costs 2,105,154Administrative services fee 283,563Independent Trustees' compensation 37,163Custodian fee 63,634Shareholder communications 115,429Audit and tax fees 30,077Legal fees 14,217Dividend and interest expense on securities sold short 629,461Interest expense and fees 10,197Miscellaneous 181,328
Total expenses $23,463,536
Reduction of expenses by investment adviser and distributor (423,499)
Net expenses $23,040,037
Net investment income (loss) $13,017,047
Realized and unrealized gain (loss)
Realized gain (loss) (identified cost basis)Unaffiliated issuers $181,043,626Foreign currency 1,608
Net realized gain (loss) $181,045,234
Change in unrealized appreciation or depreciationUnaffiliated issuers $(493,327,073)Affiliated issuers 1Securities sold short 10,612,748
Net unrealized gain (loss) $(482,714,324)
Net realized and unrealized gain (loss) $(301,669,090)
Change in net assets from operations $(288,652,043)
See Notes to Financial Statements
Copyright © 2022 www.secdatabase.com. All Rights Reserved.Please Consider the Environment Before Printing This Document

16
Copyright © 2022 www.secdatabase.com. All Rights Reserved.Please Consider the Environment Before Printing This Document

Table of Contents
Financial Statements
STATEMENTS OF CHANGES IN NET ASSETSThese statements describe the increases and/or decreases in net assets resulting from operations, any distributions, and any shareholder transactions.
Six months ended Year ended2/28/22
(unaudited)8/31/21
Change in net assetsFrom operations
Net investment income (loss) $13,017,047 $17,954,451Net realized gain (loss) 181,045,234 442,763,411Net unrealized gain (loss) (482,714,324) 914,363,857
Change in net assets from operations $(288,652,043) $1,375,081,719
Total distributions to shareholders $(433,307,610) $(74,503,092)
Change in net assets from fund share transactions $660,147,756 $413,702,147
Total change in net assets $(61,811,897) $1,714,280,774
Net assets
At beginning of period 6,094,027,185 4,379,746,411At end of period $6,032,215,288 $6,094,027,185
See Notes to Financial Statements
17
Copyright © 2022 www.secdatabase.com. All Rights Reserved.Please Consider the Environment Before Printing This Document

Table of Contents
Financial Statements
FINANCIAL HIGHLIGHTSThe financial highlights table is intended to help you understand the fund's financial performance for the semiannual period and the past5 fiscal years. Certain information reflects financial results for a single fund share. The total returns in the table represent the rate that aninvestor would have earned (or lost) on an investment in the fund share class (assuming reinvestment of all distributions) held for theentire period.
Class ASix months
ended Year ended
2/28/22(unaudited)
8/31/21 8/31/20 8/31/19 8/31/18 8/31/17
Net asset value, beginning of period $49.38 $38.41 $32.45 $34.18 $30.46 $26.72
Income (loss) from investment operations
Net investment income (loss) (d) $0.07 $0.09 $0.19 $0.20 $0.20 $0.18(c)Net realized and unrealized gain (loss) (2.15) 11.50 6.41 1.05 5.63 4.53
Total from investment operations $(2.08) $11.59 $6.60 $1.25 $5.83 $4.71
Less distributions declared to shareholders
From net investment income $(0.08) $(0.15) $(0.15) $(0.16) $(0.17) $(0.16)From net realized gain (3.39) (0.47) (0.49) (2.82) (1.94) (0.81)
Total distributions declared to shareholders $(3.46) $(0.62) $(0.64) $(2.98) $(2.11) $(0.97)
Net asset value, end of period (x) $43.84 $49.38 $38.41 $32.45 $34.18 $30.46
Total return (%) (r)(s)(t)(x) (4.67)(n) 30.57 20.59 4.94 19.89 18.11(c)
Ratios (%) (to average net assets)and Supplemental data:
Expenses before expense reductions 0.91(a) 0.94 0.97 1.00 1.00 1.03(c)Expenses after expense reductions 0.90(a) 0.92 0.96 0.98 0.99 1.01(c)Net investment income (loss) 0.28(a) 0.22 0.56 0.65 0.62 0.63(c)Portfolio turnover 14(n) 38 46 39 42 46Net assets at end of period (000 omitted) $2,350,504 $2,462,032 $1,960,597 $1,373,524 $1,184,976 $992,736
Supplemental Ratios (%):
Ratios of expenses to average net assets afterexpense reductions excluding short sale expensesand interest expense and fees 0.88(a) 0.90 0.93 0.96 0.97 1.00(c)
See Notes to Financial Statements
18
Copyright © 2022 www.secdatabase.com. All Rights Reserved.Please Consider the Environment Before Printing This Document

Table of Contents
Financial Highlights – continued
Class BSix months
ended Year ended
2/28/22(unaudited)
8/31/21 8/31/20 8/31/19 8/31/18 8/31/17
Net asset value, beginning of period $42.49 $33.24 $28.23 $30.19 $27.17 $23.96
Income (loss) from investment operations
Net investment income (loss) (d) $(0.10) $(0.19) $(0.05) $(0.03) $(0.04) $(0.03)(c)Net realized and unrealized gain (loss) (1.80) 9.91 5.55 0.89 5.00 4.05
Total from investment operations $(1.90) $9.72 $5.50 $0.86 $4.96 $4.02
Less distributions declared to shareholders
From net investment income $— $— $— $— $— $—From net realized gain (3.39) (0.47) (0.49) (2.82) (1.94) (0.81)
Total distributions declared to shareholders $(3.39) $(0.47) $(0.49) $(2.82) $(1.94) $(0.81)
Net asset value, end of period (x) $37.20 $42.49 $33.24 $28.23 $30.19 $27.17
Total return (%) (r)(s)(t)(x) (5.02)(n) 29.58 19.69 4.16 19.01 17.21(c)
Ratios (%) (to average net assets)and Supplemental data:
Expenses before expense reductions 1.66(a) 1.69 1.72 1.75 1.75 1.78(c)Expenses after expense reductions 1.65(a) 1.67 1.71 1.73 1.74 1.77(c)Net investment income (loss) (0.48)(a) (0.53) (0.18) (0.11) (0.14) (0.12)(c)Portfolio turnover 14(n) 38 46 39 42 46Net assets at end of period (000 omitted) $20,074 $24,861 $25,018 $22,759 $26,993 $27,139
Supplemental Ratios (%):
Ratios of expenses to average net assets after expense reductionsexcluding short sale expenses and interest expense and fees 1.63(a) 1.65 1.68 1.71 1.72 1.75(c)
See Notes to Financial Statements
19
Copyright © 2022 www.secdatabase.com. All Rights Reserved.Please Consider the Environment Before Printing This Document

Table of Contents
Financial Highlights – continued
Class CSix months
ended Year ended
2/28/22(unaudited)
8/31/21 8/31/20 8/31/19 8/31/18 8/31/17
Net asset value, beginning of period $41.83 $32.72 $27.86 $29.84 $26.88 $23.71
Income (loss) from investment operations
Net investment income (loss) (d) $(0.09) $(0.19) $(0.05) $(0.03) $(0.05) $(0.03)(c)Net realized and unrealized gain (loss) (1.78) 9.77 5.46 0.87 4.95 4.01
Total from investment operations $(1.87) $9.58 $5.41 $0.84 $4.90 $3.98
Less distributions declared to shareholders
From net investment income $— $— $(0.06) $— $— $—From net realized gain (3.39) (0.47) (0.49) (2.82) (1.94) (0.81)
Total distributions declared to shareholders $(3.39) $(0.47) $(0.55) $(2.82) $(1.94) $(0.81)
Net asset value, end of period (x) $36.57 $41.83 $32.72 $27.86 $29.84 $26.88
Total return (%) (r)(s)(t)(x) (5.02)(n) 29.62 19.66 4.14 18.98 17.22(c)
Ratios (%) (to average net assets)and Supplemental data:
Expenses before expense reductions 1.66(a) 1.69 1.72 1.75 1.75 1.78(c)Expenses after expense reductions 1.65(a) 1.67 1.71 1.74 1.74 1.77(c)Net investment income (loss) (0.47)(a) (0.53) (0.18) (0.10) (0.17) (0.12)(c)Portfolio turnover 14(n) 38 46 39 42 46Net assets at end of period (000 omitted) $125,180 $140,242 $128,709 $72,093 $56,413 $89,946
Supplemental Ratios (%):
Ratios of expenses to average net assets after expensereductions excluding short sale expenses and interest expenseand fees 1.63(a) 1.65 1.69 1.71 1.72 1.75(c)
See Notes to Financial Statements
20
Copyright © 2022 www.secdatabase.com. All Rights Reserved.Please Consider the Environment Before Printing This Document

Table of Contents
Financial Highlights – continued
Class ISix months
ended Year ended
2/28/22(unaudited)
8/31/21 8/31/20 8/31/19 8/31/18 8/31/17
Net asset value, beginning of period $52.62 $40.87 $34.47 $36.12 $32.07 $28.10
Income (loss) from investment operations
Net investment income (loss) (d) $0.13 $0.22 $0.29 $0.30 $0.30 $0.26(c)Net realized and unrealized gain (loss) (2.30) 12.24 6.82 1.11 5.93 4.76
Total from investment operations $(2.17) $12.46 $7.11 $1.41 $6.23 $5.02
Less distributions declared to shareholders
From net investment income $(0.18) $(0.24) $(0.22) $(0.24) $(0.24) $(0.24)From net realized gain (3.39) (0.47) (0.49) (2.82) (1.94) (0.81)
Total distributions declared to shareholders $(3.57) $(0.71) $(0.71) $(3.06) $(2.18) $(1.05)
Net asset value, end of period (x) $46.88 $52.62 $40.87 $34.47 $36.12 $32.07
Total return (%) (r)(s)(t)(x) (4.57)(n) 30.91 20.89 5.17 20.21 18.38(c)
Ratios (%) (to average net assets)and Supplemental data:
Expenses before expense reductions 0.66(a) 0.68 0.72 0.75 0.75 0.78(c)Expenses after expense reductions 0.65(a) 0.67 0.71 0.74 0.74 0.77(c)Net investment income (loss) 0.53(a) 0.47 0.81 0.90 0.88 0.88(c)Portfolio turnover 14(n) 38 46 39 42 46Net assets at end of period (000 omitted) $1,495,716 $1,416,134 $841,296 $467,860 $246,779 $122,055
Supplemental Ratios (%):
Ratios of expenses to average net assets after expensereductions excluding short sale expenses and interestexpense and fees 0.63(a) 0.65 0.69 0.72 0.73 0.75(c)
See Notes to Financial Statements
21
Copyright © 2022 www.secdatabase.com. All Rights Reserved.Please Consider the Environment Before Printing This Document

Table of Contents
Financial Highlights – continued
Class R1Six months
ended Year ended
2/28/22(unaudited)
8/31/21 8/31/20 8/31/19 8/31/18 8/31/17
Net asset value, beginning of period $41.89 $32.77 $27.84 $29.82 $26.86 $23.70
Income (loss) from investment operations
Net investment income (loss) (d) $(0.09) $(0.19) $(0.06) $(0.03) $(0.04) $(0.03)(c)Net realized and unrealized gain (loss) (1.78) 9.78 5.48 0.87 4.94 4.00
Total from investment operations $(1.87) $9.59 $5.42 $0.84 $4.90 $3.97
Less distributions declared to shareholders
From net investment income $— $— $— $— $— $—From net realized gain (3.39) (0.47) (0.49) (2.82) (1.94) (0.81)
Total distributions declared to shareholders $(3.39) $(0.47) $(0.49) $(2.82) $(1.94) $(0.81)
Net asset value, end of period (x) $36.63 $41.89 $32.77 $27.84 $29.82 $26.86
Total return (%) (r)(s)(t)(x) (5.01)(n) 29.60 19.68 4.14 19.00 17.19(c)
Ratios (%) (to average net assets)and Supplemental data:
Expenses before expense reductions 1.66(a) 1.69 1.72 1.75 1.75 1.78(c)Expenses after expense reductions 1.65(a) 1.67 1.71 1.74 1.74 1.77(c)Net investment income (loss) (0.47)(a) (0.53) (0.20) (0.11) (0.14) (0.13)(c)Portfolio turnover 14(n) 38 46 39 42 46Net assets at end of period (000 omitted) $3,654 $3,791 $3,816 $3,186 $3,448 $3,103
Supplemental Ratios (%):
Ratios of expenses to average net assets after expense reductionsexcluding short sale expenses and interest expense and fees 1.63(a) 1.65 1.69 1.71 1.73 1.75(c)
See Notes to Financial Statements
22
Copyright © 2022 www.secdatabase.com. All Rights Reserved.Please Consider the Environment Before Printing This Document

Table of Contents
Financial Highlights – continued
Class R2Six months
ended Year ended
2/28/22(unaudited)
8/31/21 8/31/20 8/31/19 8/31/18 8/31/17
Net asset value, beginning of period $48.04 $37.40 $31.61 $33.33 $29.75 $26.12
Income (loss) from investment operations
Net investment income (loss) (d) $0.01 $(0.01) $0.10 $0.12 $0.11 $0.10(c)Net realized and unrealized gain (loss) (2.08) 11.20 6.24 1.02 5.50 4.43
Total from investment operations $(2.07) $11.19 $6.34 $1.14 $5.61 $4.53
Less distributions declared to shareholders
From net investment income $— $(0.08) $(0.06) $(0.04) $(0.09) $(0.09)From net realized gain (3.39) (0.47) (0.49) (2.82) (1.94) (0.81)
Total distributions declared to shareholders $(3.39) $(0.55) $(0.55) $(2.86) $(2.03) $(0.90)
Net asset value, end of period (x) $42.58 $48.04 $37.40 $31.61 $33.33 $29.75
Total return (%) (r)(s)(t)(x) (4.78)(n) 30.27 20.28 4.66 19.61 17.80(c)
Ratios (%) (to average net assets)and Supplemental data:
Expenses before expense reductions 1.16(a) 1.19 1.22 1.25 1.25 1.28(c)Expenses after expense reductions 1.13(a) 1.16 1.20 1.23 1.24 1.27(c)Net investment income (loss) 0.04(a) (0.02) 0.31 0.39 0.35 0.38(c)Portfolio turnover 14(n) 38 46 39 42 46Net assets at end of period (000 omitted) $19,395 $21,214 $17,335 $13,416 $15,202 $16,508
Supplemental Ratios (%):
Ratios of expenses to average net assets after expense reductionsexcluding short sale expenses and interest expense and fees 1.11(a) 1.14 1.17 1.20 1.22 1.25(c)
See Notes to Financial Statements
23
Copyright © 2022 www.secdatabase.com. All Rights Reserved.Please Consider the Environment Before Printing This Document

Table of Contents
Financial Highlights – continued
Class R3Six months
ended Year ended
2/28/22(unaudited)
8/31/21 8/31/20 8/31/19 8/31/18 8/31/17
Net asset value, beginning of period $49.22 $38.29 $32.36 $34.11 $30.33 $26.61
Income (loss) from investment operations
Net investment income (loss) (d) $0.06 $0.09 $0.19 $0.20 $0.20 $0.17(c)Net realized and unrealized gain (loss) (2.13) 11.47 6.38 1.04 5.61 4.52
Total from investment operations $(2.07) $11.56 $6.57 $1.24 $5.81 $4.69
Less distributions declared to shareholders
From net investment income $(0.06) $(0.16) $(0.15) $(0.17) $(0.09) $(0.16)From net realized gain (3.39) (0.47) (0.49) (2.82) (1.94) (0.81)
Total distributions declared to shareholders $(3.45) $(0.63) $(0.64) $(2.99) $(2.03) $(0.97)
Net asset value, end of period (x) $43.70 $49.22 $38.29 $32.36 $34.11 $30.33
Total return (%) (r)(s)(t)(x) (4.66)(n) 30.59 20.56 4.91 19.91 18.10(c)
Ratios (%) (to average net assets)and Supplemental data:
Expenses before expense reductions 0.91(a) 0.94 0.97 1.00 1.00 1.02(c)Expenses after expense reductions 0.90(a) 0.92 0.96 0.99 0.99 1.02(c)Net investment income (loss) 0.28(a) 0.22 0.56 0.64 0.61 0.62(c)Portfolio turnover 14(n) 38 46 39 42 46Net assets at end of period (000 omitted) $70,379 $77,453 $63,347 $42,199 $34,916 $28,075
Supplemental Ratios (%):
Ratios of expenses to average net assets after expense reductionsexcluding short sale expenses and interest expense and fees 0.88(a) 0.90 0.94 0.96 0.98 1.00(c)
See Notes to Financial Statements
24
Copyright © 2022 www.secdatabase.com. All Rights Reserved.Please Consider the Environment Before Printing This Document

Table of Contents
Financial Highlights – continued
Class R4Six months
ended Year ended
2/28/22(unaudited)
8/31/21 8/31/20 8/31/19 8/31/18 8/31/17
Net asset value, beginning of period $49.93 $38.81 $32.76 $34.48 $30.71 $26.93
Income (loss) from investment operations
Net investment income (loss) (d) $0.13 $0.20 $0.27 $0.28 $0.28 $0.25(c)Net realized and unrealized gain (loss) (2.17) 11.63 6.48 1.05 5.67 4.57
Total from investment operations $(2.04) $11.83 $6.75 $1.33 $5.95 $4.82
Less distributions declared to shareholders
From net investment income $(0.17) $(0.24) $(0.21) $(0.23) $(0.24) $(0.23)From net realized gain (3.39) (0.47) (0.49) (2.82) (1.94) (0.81)
Total distributions declared to shareholders $(3.56) $(0.71) $(0.70) $(3.05) $(2.18) $(1.04)
Net asset value, end of period (x) $44.33 $49.93 $38.81 $32.76 $34.48 $30.71
Total return (%) (r)(s)(t)(x) (4.55)(n) 30.92 20.88 5.18 20.18 18.40(c)
Ratios (%) (to average net assets)and Supplemental data:
Expenses before expense reductions 0.66(a) 0.69 0.72 0.75 0.75 0.78(c)Expenses after expense reductions 0.65(a) 0.67 0.71 0.74 0.74 0.77(c)Net investment income (loss) 0.53(a) 0.47 0.80 0.89 0.86 0.87(c)Portfolio turnover 14(n) 38 46 39 42 46Net assets at end of period (000 omitted) $39,943 $42,883 $35,770 $29,218 $27,707 $22,494
Supplemental Ratios (%):
Ratios of expenses to average net assets after expense reductionsexcluding short sale expenses and interest expense and fees 0.63(a) 0.65 0.69 0.71 0.73 0.76(c)
See Notes to Financial Statements
25
Copyright © 2022 www.secdatabase.com. All Rights Reserved.Please Consider the Environment Before Printing This Document

Table of Contents
Financial Highlights – continued
Class R6Six months
ended Year ended
2/28/22(unaudited)
8/31/21 8/31/20 8/31/19 8/31/18 8/31/17
Net asset value, beginning of period $52.78 $40.98 $34.55 $36.18 $32.12 $28.13
Income (loss) from investment operations
Net investment income (loss) (d) $0.15 $0.25 $0.32 $0.32 $0.32 $0.29(c)Net realized and unrealized gain (loss) (2.30) 12.29 6.83 1.13 5.95 4.77
Total from investment operations $(2.15) $12.54 $7.15 $1.45 $6.27 $5.06
Less distributions declared to shareholders
From net investment income $(0.22) $(0.27) $(0.23) $(0.26) $(0.27) $(0.26)From net realized gain (3.39) (0.47) (0.49) (2.82) (1.94) (0.81)
Total distributions declared to shareholders $(3.60) $(0.74) $(0.72) $(3.08) $(2.21) $(1.07)
Net asset value, end of period (x) $47.03 $52.78 $40.98 $34.55 $36.18 $32.12
Total return (%) (r)(s)(t)(x) (4.51)(n) 31.03 20.98 5.28 20.29 18.49(c)
Ratios (%) (to average net assets)and Supplemental data:
Expenses before expense reductions 0.58(a) 0.60 0.64 0.67 0.67 0.69(c)Expenses after expense reductions 0.57(a) 0.59 0.63 0.66 0.66 0.68(c)Net investment income (loss) 0.61(a) 0.56 0.89 0.98 0.95 0.97(c)Portfolio turnover 14(n) 38 46 39 42 46Net assets at end of period (000 omitted) $1,907,370 $1,905,417 $1,303,858 $783,340 $577,588 $393,153
Supplemental Ratios (%):
Ratios of expenses to average net assets after expensereductions excluding short sale expenses and interestexpense and fees 0.55(a) 0.57 0.60 0.63 0.65 0.66(c)
(a) Annualized.(c) Amount reflects a one-time reimbursement of expenses by the custodian (or former custodian) without which net investment income and
performance would be lower and expenses would be higher.(d) Per share data is based on average shares outstanding.(n) Not annualized.(r) Certain expenses have been reduced without which performance would have been lower.(s) From time to time the fund may receive proceeds from litigation settlements, without which performance would be lower. Excluding the effect of the
proceeds received from a non-recurring litigation settlement against Household International, Inc., the total return for the year ended August 31, 2017would have been lower by approximately 0.85%.
(t) Total returns do not include any applicable sales charges.(x) The net asset values and total returns have been calculated on net assets which include adjustments made in accordance with U.S. generally
accepted accounting principles required at period end for financial reporting purposes.
See Notes to Financial Statements
26
Copyright © 2022 www.secdatabase.com. All Rights Reserved.Please Consider the Environment Before Printing This Document

Table of Contents
NOTES TO FINANCIAL STATEMENTS(unaudited)
(1) Business and OrganizationMFS Core Equity Fund (the fund) is a diversified series of MFS Series Trust I (the trust). The trust is organized as a Massachusettsbusiness trust and is registered under the Investment Company Act of 1940, as amended, as an open-end management investmentcompany.
The fund is an investment company and accordingly follows the investment company accounting and reporting guidance of the FinancialAccounting Standards Board (FASB) Accounting Standards Codification Topic 946 Financial Services - Investment Companies.
(2) Significant Accounting PoliciesGeneral — The preparation of financial statements in conformity with U.S. generally accepted accounting principles requiresmanagement to make estimates and assumptions that affect the reported amounts of assets and liabilities, and disclosure ofcontingent assets and liabilities at the date of the financial statements and the reported amounts of increases and decreases innet assets from operations during the reporting period. Actual results could differ from those estimates. In the preparation ofthese financial statements, management has evaluated subsequent events occurring after the date of the fund’s Statement ofAssets and Liabilities through the date that the financial statements were issued.Balance Sheet Offsetting — The fund's accounting policy with respect to balance sheet offsetting is that, absent an event ofdefault by the counterparty or a termination of the agreement, the International Swaps and Derivatives Association (ISDA)Master Agreement, or similar agreement, does not result in an offset of reported amounts of financial assets and financialliabilities in the Statement of Assets and Liabilities across transactions between the fund and the applicable counterparty. Thefund's right to setoff may be restricted or prohibited by the bankruptcy or insolvency laws of the particular jurisdiction to whicha specific master netting agreement counterparty is subject. Balance sheet offsetting disclosures, to the extent applicable tothe fund, have been included in the fund’s Significant Accounting Policies note under the captions for each of the fund’s in-scope financial instruments and transactions.Investment Valuations — Equity securities, including restricted equity securities and equity securities sold short, are generallyvalued at the last sale or official closing price on their primary market or exchange as provided by a third-party pricing service.Equity securities, for which there were no sales reported that day, are generally valued at the last quoted daily bid quotation ontheir primary market or exchange as provided by a third-party pricing service. Equity securities sold short, for which there wereno sales reported that day, are generally valued at the last quoted daily ask quotation on their primary market or exchange asprovided by a third-party pricing service. Short-term instruments with a maturity at issuance of 60 days or less may be valuedat amortized cost, which approximates market value. Open-end investment companies are generally valued at net asset valueper share. Securities and other assets generally valued on the basis of information from a third-party pricing service may alsobe valued at a broker/dealer bid quotation. In determining values, third-party pricing services can utilize both transaction dataand market information such as yield, quality, coupon rate,
27
Copyright © 2022 www.secdatabase.com. All Rights Reserved.Please Consider the Environment Before Printing This Document

Table of Contents
Notes to Financial Statements (unaudited) - continued
maturity, type of issue, trading characteristics, and other market data. The values of foreign securities and other assets and liabilitiesexpressed in foreign currencies are converted to U.S. dollars using the mean of bid and asked prices for rates provided by a third-partypricing service.
The Board of Trustees has delegated primary responsibility for determining or causing to be determined the value of the fund’sinvestments (including any fair valuation) to the adviser pursuant to valuation policies and procedures approved by the Board. If theadviser determines that reliable market quotations are not readily available, investments are valued at fair value as determined in goodfaith by the adviser in accordance with such procedures under the oversight of the Board of Trustees. Under the fund’s valuation policiesand procedures, market quotations are not considered to be readily available for most types of debt instruments and floating rate loansand many types of derivatives. These investments are generally valued at fair value based on information from third-party pricingservices. In addition, investments may be valued at fair value if the adviser determines that an investment’s value has been materiallyaffected by events occurring after the close of the exchange or market on which the investment is principally traded (such as foreignexchange or market) and prior to the determination of the fund’s net asset value, or after the halt of trading of a specific security wheretrading does not resume prior to the close of the exchange or market on which the security is principally traded. Events that occur afterforeign markets close (such as developments in foreign markets and significant movements in the U.S. markets) and prior to thedetermination of the fund’s net asset value may be deemed to have a material effect on the value of securities traded in foreign markets.Accordingly, the fund’s foreign equity securities may often be valued at fair value. The adviser generally relies on third-party pricingservices or other information (such as the correlation with price movements of similar securities in the same or other markets; the type,cost and investment characteristics of the security; the business and financial condition of the issuer; and trading and other market data)to assist in determining whether to fair value and at what value to fair value an investment. The value of an investment for purposes ofcalculating the fund’s net asset value can differ depending on the source and method used to determine value. When fair valuation isused, the value of an investment used to determine the fund’s net asset value may differ from quoted or published prices for the sameinvestment. There can be no assurance that the fund could obtain the fair value assigned to an investment if it were to sell the investmentat the same time at which the fund determines its net asset value per share.
Various inputs are used in determining the value of the fund's assets or liabilities. These inputs are categorized into three broad levels. Incertain cases, the inputs used to measure fair value may fall into different levels of the fair value hierarchy. In such cases, an investment'slevel within the fair value hierarchy is based on the lowest level of input that is significant to the fair value measurement. The fund'sassessment of the significance of a particular input to the fair value measurement in its entirety requires judgment, and considers factorsspecific to the investment. Level 1 includes unadjusted quoted prices in active markets for identical assets or liabilities. Level 2 includesother significant observable market-based inputs (including quoted prices for similar securities, interest rates, prepayment speed, andcredit risk). Level 3 includes unobservable inputs, which may include the adviser's own assumptions in determining the fair value ofinvestments. The following is a summary of the levels used as of February 28, 2022 in valuing the fund's assets and liabilities:
28
Copyright © 2022 www.secdatabase.com. All Rights Reserved.Please Consider the Environment Before Printing This Document

Table of Contents
Notes to Financial Statements (unaudited) - continued
Financial Instruments Level 1 Level 2 Level 3 TotalEquity Securities $6,004,247,056 $— $— $6,004,247,056Mutual Funds 43,675,881 — — 43,675,881
Total $6,047,922,937 $— $— $6,047,922,937Securities Sold Short $(21,992,586) $— $— $(21,992,586)
For further information regarding security characteristics, see the Portfolio of Investments.
Foreign Currency Translation — Purchases and sales of foreign investments, income, and expenses are converted into U.S.dollars based upon currency exchange rates prevailing on the respective dates of such transactions or on the reporting datefor foreign denominated receivables and payables. Gains and losses attributable to foreign currency exchange rates on salesof securities are recorded for financial statement purposes as net realized gains and losses on investments. Gains and lossesattributable to foreign exchange rate movements on receivables, payables, income and expenses are recorded for financialstatement purposes as foreign currency transaction gains and losses. That portion of both realized and unrealized gains andlosses on investments that results from fluctuations in foreign currency exchange rates is not separately disclosed.Short Sales — The fund entered into short sales whereby it sells a security it does not own in anticipation of a decline in thevalue of that security. The fund will realize a gain if the security price decreases and a loss if the security price increasesbetween the date of the short sale and the date on which the fund replaces the borrowed security. Losses from short sales canexceed the proceeds of the security sold; and they can also exceed the potential loss from an ordinary buy and sell transaction.The amount of any premium, dividends, or interest the fund may be required to pay in connection with a short sale will berecognized as a fund expense. During the six months ended February 28, 2022, this expense amounted to $629,461. The fundsegregates cash or marketable securities in an amount that, when combined with the amount of proceeds from the short saledeposited with the broker, at least equals the current market value of the security sold short.Security Loans — Under its Securities Lending Agency Agreement with the fund, State Street Bank and Trust Company, aslending agent, loans the securities of the fund to certain qualified institutions (the “Borrowers”) approved by the fund. Securityloans can be terminated at the discretion of either the lending agent or the fund and the related securities must be returnedwithin the earlier of the standard trade settlement period for such securities or within three business days. The loans arecollateralized by cash and/or U.S. Treasury and federal agency obligations in an amount typically at least equal to the marketvalue of the securities loaned. On loans collateralized by cash, the cash collateral is invested in a money market fund. Themarket value of the loaned securities is determined at the close of business of the fund and any additional required collateral isdelivered to the fund on the next business day. The lending agent provides the fund with indemnification against Borrowerdefault. In the event of Borrower default, the lending agent will, for the benefit of the fund, either purchase securities identicalto those loaned or, when such purchase is commercially impracticable, pay the fund the market value of the loaned securities.In return, the lending agent assumes the fund's rights to the related collateral. If the collateral value is less than the cost topurchase identical securities, the lending agent is responsible for the shortfall, but only
29
Copyright © 2022 www.secdatabase.com. All Rights Reserved.Please Consider the Environment Before Printing This Document

Table of Contents
Notes to Financial Statements (unaudited) - continued
to the extent that such shortfall is not due to a decline in collateral value resulting from collateral reinvestment for which the fund bearsthe risk of loss. A portion of the income generated upon investment of the collateral is remitted to the Borrowers, and the remainder isallocated between the fund and the lending agent. On loans collateralized by U.S. Treasury and/or federal agency obligations, a fee isreceived from the Borrower, and is allocated between the fund and the lending agent. Income from securities lending is separatelyreported in the Statement of Operations. The dividend and interest income earned on the securities loaned is accounted for in the samemanner as other dividend and interest income. At February 28, 2022, there were no securities on loan or collateral outstanding.
Indemnifications — Under the fund's organizational documents, its officers and Trustees may be indemnified against certainliabilities and expenses arising out of the performance of their duties to the fund. Additionally, in the normal course ofbusiness, the fund enters into agreements with service providers that may contain indemnification clauses. The fund'smaximum exposure under these agreements is unknown as this would involve future claims that may be made against the fundthat have not yet occurred.Investment Transactions and Income — Investment transactions are recorded on the trade date. Dividends received in cash arerecorded on the ex-dividend date. Certain dividends from foreign securities will be recorded when the fund is informed of thedividend if such information is obtained subsequent to the ex-dividend date. Dividend payments received in additionalsecurities are recorded on the ex-dividend date in an amount equal to the value of the security on such date. In determining thenet gain or loss on securities sold, the cost of securities is determined on the identified cost basis.The fund may receive proceeds from litigation settlements. Any proceeds received from litigation involving portfolio holdings are reflectedin the Statement of Operations in realized gain/loss if the security has been disposed of by the fund or in unrealized gain/loss if thesecurity is still held by the fund. Any other proceeds from litigation not related to portfolio holdings are reflected as other income in theStatement of Operations.
Tax Matters and Distributions — The fund intends to qualify as a regulated investment company, as defined under SubchapterM of the Internal Revenue Code, and to distribute all of its taxable income, including realized capital gains. As a result, noprovision for federal income tax is required. The fund’s federal tax returns, when filed, will remain subject to examination by theInternal Revenue Service for a three year period. Management has analyzed the fund’s tax positions taken on federal and statetax returns for all open tax years and does not believe that there are any uncertain tax positions that require recognition of a taxliability. Foreign taxes, if any, have been accrued by the fund in the accompanying financial statements in accordance with theapplicable foreign tax law. Foreign income taxes may be withheld by certain countries in which the fund invests. Additionally,capital gains realized by the fund on securities issued in or by certain foreign countries may be subject to capital gains taximposed by those countries.Distributions to shareholders are recorded on the ex-dividend date. Income and capital gain distributions are determined in accordancewith income tax regulations, which may differ from U.S. generally accepted accounting principles. Certain capital accounts in the financialstatements are periodically adjusted for permanent differences in order
30
Copyright © 2022 www.secdatabase.com. All Rights Reserved.Please Consider the Environment Before Printing This Document

Table of Contents
Notes to Financial Statements (unaudited) - continued
to reflect their tax character. These adjustments have no impact on net assets or net asset value per share. Temporary differences whicharise from recognizing certain items of income, expense, gain or loss in different periods for financial statement and tax purposes willreverse at some time in the future.
Book/tax differences primarily relate to wash sale loss deferrals, treating a portion of the proceeds from redemptions as a distribution fortax purposes, and partnership adjustments.
The tax character of distributions made during the current period will be determined at fiscal year end. The tax character of distributionsdeclared to shareholders for the last fiscal year is as follows:
Year ended8/31/21
Ordinary income (including any short-term capital gains) $21,997,904Long-term capital gains 52,505,188
Total distributions $74,503,092
The federal tax cost and the tax basis components of distributable earnings were as follows:
As of 2/28/22Cost of investments $4,408,874,478
Gross appreciation 1,789,690,771Gross depreciation (150,642,312)
Net unrealized appreciation (depreciation) $1,639,048,459As of 8/31/21Undistributed ordinary income 182,423,257Undistributed long-term capital gain 245,998,837Other temporary differences 3,865,348Net unrealized appreciation (depreciation) 2,129,341,833
Multiple Classes of Shares of Beneficial Interest — The fund offers multiple classes of shares, which differ in their respectivedistribution and service fees. The fund's income, realized and unrealized gain (loss), and common expenses are allocated toshareholders based on the daily net assets of each class. Dividends are declared separately for each class. Differences in pershare dividend rates are generally due to differences in separate class expenses. Class B and Class C shares will convert to
31
Copyright © 2022 www.secdatabase.com. All Rights Reserved.Please Consider the Environment Before Printing This Document
Table of Contents
Notes to Financial Statements (unaudited) - continued
Class A shares approximately eight years after purchase. The fund’s distributions declared to shareholders as reported in the Statementsof Changes in Net Assets are presented by class as follows:
Six monthsended2/28/22
Yearended8/31/21
Class A $172,852,603 $30,040,189Class B 1,835,488 331,454Class C 11,222,207 1,808,146Class I 102,395,888 15,698,076Class R1 303,682 46,383Class R2 1,478,984 249,807Class R3 5,462,151 1,071,678Class R4 2,852,391 669,489Class R6 134,904,216 24,587,870
Total $433,307,610 $74,503,092
(3) Transactions with AffiliatesInvestment Adviser — The fund has an investment advisory agreement with MFS to provide overall investment managementand related administrative services and facilities to the fund. The management fee is computed daily and paid monthly at thefollowing annual rates based on the fund's average daily net assets:
Up to $500 million 0.65%In excess of $500 million and up to $2.5 billion 0.55%In excess of $2.5 billion and up to $5 billion 0.50%In excess of $5 billion and up to $10 billion 0.47%In excess of $10 billion 0.45%
MFS has agreed in writing to reduce its management fee by a specified amount if certain MFS mutual fund assets exceed thresholdsagreed to by MFS and the fund's Board of Trustees. For the six months ended February 28, 2022, this management fee reductionamounted to $420,983, which is included in the reduction of total expenses in the Statement of Operations. The management feeincurred for the six months ended February 28, 2022 was equivalent to an annual effective rate of 0.51% of the fund's average daily netassets.
Distributor — MFS Fund Distributors, Inc. (MFD), a wholly-owned subsidiary of MFS, as distributor, received $203,185 for the sixmonths ended February 28, 2022, as its portion of the initial sales charge on sales of Class A shares of the fund.The Board of Trustees has adopted a distribution plan for certain share classes pursuant to Rule 12b-1 of the Investment Company Act of1940.
The fund's distribution plan provides that the fund will pay MFD for services provided by MFD and financial intermediaries in connectionwith the distribution and servicing of certain share classes. One component of the plan is a distribution fee paid to MFD and anothercomponent of the plan is a service fee paid to MFD. MFD may subsequently pay all, or a portion, of the distribution and/or service fees tofinancial intermediaries.
32
Copyright © 2022 www.secdatabase.com. All Rights Reserved.Please Consider the Environment Before Printing This Document

Table of Contents
Notes to Financial Statements (unaudited) - continued
Distribution Plan Fee Table:
DistributionFee Rate (d)
ServiceFee Rate (d)
TotalDistribution
Plan (d)
AnnualEffectiveRate (e)
Distributionand Service
Fee
Class A — 0.25% 0.25% 0.25% $ 3,033,786
Class B 0.75% 0.25% 1.00% 1.00% 113,687
Class C 0.75% 0.25% 1.00% 1.00% 676,618
Class R1 0.75% 0.25% 1.00% 1.00% 18,867
Class R2 0.25% 0.25% 0.50% 0.49% 50,898
Class R3 — 0.25% 0.25% 0.25% 94,758
Total Distribution and ServiceFees $3,988,614
(d) In accordance with the distribution plan for certain classes, the fund pays distribution and/or service fees equal to these annual percentage rates ofeach class’s average daily net assets. The distribution and service fee rates disclosed by class represent the current rates in effect at the endof the reporting period. Any rate changes, if applicable, are detailed below.
(e) The annual effective rates represent actual fees incurred under the distribution plan for the six months ended February 28, 2022 based on eachclass's average daily net assets. MFD has voluntarily agreed to rebate a portion of each class's 0.25% service fee attributable to accounts forwhich there is no financial intermediary specified on the account except for accounts attributable to MFS or its affiliates' seed money. For thesix months ended February 28, 2022, this rebate amounted to $1,030, $2, $18, and $1,466 for Class A, Class B, Class C, and Class R2,respectively, and is included in the reduction of total expenses in the Statement of Operations.
Certain Class A shares are subject to a contingent deferred sales charge (CDSC) in the event of a shareholder redemption within 18months of purchase. Class B shares are subject to a CDSC in the event of a shareholder redemption within six years of purchase. ClassC shares are subject to a CDSC in the event of a shareholder redemption within 12 months of purchase. All contingent deferred salescharges are paid to MFD and during the six months ended February 28, 2022, were as follows:
AmountClass A $14,167Class B 3,811Class C 4,145
Shareholder Servicing Agent — MFS Service Center, Inc. (MFSC), a wholly-owned subsidiary of MFS, receives a fee from thefund for its services as shareholder servicing agent calculated as a percentage of the average daily net assets of the fund asdetermined periodically under the supervision of the fund's Board of Trustees. For the six months ended February 28, 2022, thefee was $260,072, which equated to 0.0085% annually of the fund's average daily net assets. MFSC also receivesreimbursement from the fund for out-of-pocket expenses, sub-accounting and other shareholder servicing costs which may bepaid to affiliated and unaffiliated service providers. Class R6 shares do not incur sub-accounting fees. For the six monthsended February 28, 2022, these out-of-pocket expenses, sub-accounting and other shareholder servicing costs amounted to$1,845,082.
33
Copyright © 2022 www.secdatabase.com. All Rights Reserved.Please Consider the Environment Before Printing This Document

Table of Contents
Notes to Financial Statements (unaudited) - continued
Administrator — MFS provides certain financial, legal, shareholder communications, compliance, and other administrativeservices to the fund. Under an administrative services agreement, the fund reimburses MFS the costs incurred to provide theseservices. The fund is charged an annual fixed amount of $17,500 plus a fee based on average daily net assets. Theadministrative services fee incurred for the six months ended February 28, 2022 was equivalent to an annual effective rate of0.0093% of the fund's average daily net assets.Trustees’ and Officers’ Compensation — The fund pays compensation to independent Trustees in the form of a retainer,attendance fees, and additional compensation to Board and Committee chairpersons. The fund does not pay compensationdirectly to Trustees or officers of the fund who are also officers of the investment adviser, all of whom receive remunerationfrom MFS for their services to the fund. Certain officers and Trustees of the fund are officers or directors of MFS, MFD, andMFSC.Prior to December 31, 2001, the fund had an unfunded defined benefit plan (“DB plan”) for independent Trustees. As of December 31,2001, the Board took action to terminate the DB plan with respect to then-current and any future independent Trustees, such that the DBplan covers only certain of those former independent Trustees who retired on or before December 31, 2001. The DB plan resulted in anet decrease in pension expense of $342 and is included in “Independent Trustees’ compensation” in the Statement of Operations for thesix months ended February 28, 2022. The liability for deferred retirement benefits payable to those former independent Trustees underthe DB plan amounted to $3,084 at February 28, 2022, and is included in “Payable for independent Trustees’ compensation” in theStatement of Assets and Liabilities.
Other — The fund invests in the MFS Institutional Money Market Portfolio which is managed by MFS and seeks current incomeconsistent with preservation of capital and liquidity. This money market fund does not pay a management fee to MFS but doesincur investment and operating costs.The adviser has voluntarily undertaken to reimburse the fund from its own resources on a quarterly basis for the cost of investmentresearch embedded in the cost of the fund’s securities trades. This agreement may be rescinded at any time. For the six months endedFebruary 28, 2022, this reimbursement amounted to $124,231, which is included in “Other” income in the Statement of Operations.
(4) Portfolio SecuritiesFor the six months ended February 28, 2022, purchases and sales of investments, other than short sales, and short-term obligations,aggregated $1,157,904,923 and $860,368,845, respectively.
34
Copyright © 2022 www.secdatabase.com. All Rights Reserved.Please Consider the Environment Before Printing This Document

Table of Contents
Notes to Financial Statements (unaudited) - continued
(5) Shares of Beneficial InterestThe fund's Declaration of Trust permits the Trustees to issue an unlimited number of full and fractional shares of beneficial interest.Transactions in fund shares were as follows:
Six months ended2/28/22
Year ended8/31/21
Shares Amount Shares Amount
Shares sold
Class A 3,538,079 $166,245,367 9,211,619 $393,647,217
Class B 3,851 156,241 11,050 402,439
Class C 249,318 10,079,285 685,105 24,071,525
Class I 7,617,168 381,169,758 11,744,494 537,407,557
Class R1 17,536 685,048 14,117 505,091
Class R2 58,104 2,654,503 116,552 4,749,423
Class R3 190,857 8,718,306 424,323 17,624,848
Class R4 101,725 4,784,604 164,900 6,980,564
Class R6 5,660,877 287,550,003 12,032,991 545,382,832
17,437,515 $862,043,115 34,405,151 $1,530,771,496
Shares issued to shareholdersin reinvestment of distributions
Class A 3,562,980 $167,210,640 724,146 $28,994,825
Class B 45,078 1,798,152 9,268 321,121
Class C 267,931 10,505,565 49,935 1,703,281
Class I 1,818,846 91,233,292 348,791 14,855,003
Class R1 7,733 303,682 1,358 46,383
Class R2 32,394 1,477,502 6,393 249,513
Class R3 116,763 5,462,151 26,846 1,071,678
Class R4 59,453 2,819,255 16,273 657,586
Class R6 2,641,838 132,884,430 556,640 23,768,523
8,553,016 $413,694,669 1,739,650 $71,667,913
Shares reacquired
Class A (3,343,611) $(157,630,306) (11,122,341) $(453,678,972)
Class B (94,339) (3,777,340) (188,005) (6,835,400)
Class C (446,787) (17,563,189) (1,315,610) (46,164,817)
Class I (4,447,757) (220,576,855) (5,763,622) (260,966,836)
Class R1 (16,016) (630,302) (41,418) (1,451,025)
Class R2 (76,619) (3,478,078) (144,822) (5,992,608)
Class R3 (270,629) (12,353,605) (531,877) (22,914,796)
Class R4 (118,974) (5,719,154) (243,901) (10,478,244)
Class R6 (3,847,011) (193,861,199) (8,303,149) (380,254,564)
(12,661,743) $(615,590,028) (27,654,745) $(1,188,737,262)
35
Copyright © 2022 www.secdatabase.com. All Rights Reserved.Please Consider the Environment Before Printing This Document

Table of Contents
Notes to Financial Statements (unaudited) - continued
Six months ended2/28/22
Year ended8/31/21
Shares Amount Shares Amount
Net change
Class A 3,757,448 $175,825,701 (1,186,576) $(31,036,930)
Class B (45,410) (1,822,947) (167,687) (6,111,840)
Class C 70,462 3,021,661 (580,570) (20,390,011)
Class I 4,988,257 251,826,195 6,329,663 291,295,724
Class R1 9,253 358,428 (25,943) (899,551)
Class R2 13,879 653,927 (21,877) (993,672)
Class R3 36,991 1,826,852 (80,708) (4,218,270)
Class R4 42,204 1,884,705 (62,728) (2,840,094)
Class R6 4,455,704 226,573,234 4,286,482 188,896,791
13,328,788 $660,147,756 8,490,056 $413,702,147
Effective June 1, 2019, purchases of the fund’s Class B shares are closed to new and existing investors subject to certain exceptions.Please see the fund’s prospectus for details.
(6) Line of CreditThe fund and certain other funds managed by MFS participate in a $1.25 billion unsecured committed line of credit of which $1 billion isreserved for use by the fund and certain other MFS U.S. funds. The line of credit is provided by a syndicate of banks under a creditagreement. Borrowings may be made for temporary financing needs. Interest is charged to each fund, based on its borrowings, generallyat a rate equal to the highest of one month LIBOR, the Federal Funds Effective Rate and the Overnight Bank Funding Rate, plus anagreed upon spread. A commitment fee, based on the average daily, unused portion of the committed line of credit, is allocated amongthe participating funds. In addition, the fund and other funds managed by MFS have established unsecured uncommitted borrowingarrangements with certain banks for temporary financing needs. Interest is charged to each fund, based on its borrowings, at rates equalto customary reference rates plus an agreed upon spread. For the six months ended February 28, 2022, the fund’s commitment fee andinterest expense were $10,197 and $0, respectively, and are included in “Interest expense and fees” in the Statement of Operations.
(7) Investments in Affiliated IssuersAn affiliated issuer may be considered one in which the fund owns 5% or more of the outstanding voting securities, or a company whichis under common control. For the purposes of this report, the following were affiliated issuers:
Affiliated IssuersBeginning
Value PurchasesSales
Proceeds
RealizedGain
(Loss)
Change inUnrealized
Appreciation orDepreciation
EndingValue
MFS Institutional Money MarketPortfolio $91,616,920 $546,009,502 $593,950,542 $— $1 $43,675,881
36
Copyright © 2022 www.secdatabase.com. All Rights Reserved.Please Consider the Environment Before Printing This Document

Table of Contents
Notes to Financial Statements (unaudited) - continued
Affiliated IssuersDividend
IncomeCapital Gain
Distributions
MFS Institutional Money Market Portfolio $22,465 $—
(8) Impacts of COVID-19The pandemic related to the global spread of novel coronavirus disease (COVID-19), which was first detected in December 2019, hasresulted in significant disruptions to global business activity and the global economy, as well as the economies of individual countries, thefinancial performance of individual companies and sectors, and the securities and commodities markets in general. Multiple surges incases globally, the availability and widespread adoption of vaccines, and the emergence of variant strains of the virus continue to createuncertainty as to the future and long-term impacts resulting from the pandemic including impacts to the prices and liquidity of the fund'sinvestments and the fund's performance.
(9) LIBOR TransitionCertain of the fund's investments, including investments in certain debt instruments and derivatives (if any), as well as borrowings by thefund and certain other contractual arrangements of the fund, may be based on the London Interbank Offered Rate (“LIBOR”). In 2017, theregulatory authority that oversees financial services firms in the United Kingdom announced plans to transition away from LIBOR by theend of 2021. In March 2021, the administrator of LIBOR announced the extension of the publication of the more commonly used U.S.dollar LIBOR settings to the end of June 2023. Although the full impacts of the transition away from LIBOR are not fully known, thetransition may result in, among other things, an increase in volatility or illiquidity of the markets for instruments that currently rely onLIBOR to determine interest rates and this could have an adverse impact on the fund's performance. With respect to the fund'saccounting for investments, including investments in certain debt instruments and derivatives, as well as borrowings by the fund and anyother contractual arrangements of the fund that undergo reference rate-related modifications as a result of the transition, managementwill rely upon the relief provided by FASB Codification Topic 848 – Reference Rate Reform (Topic 848). The guidance in Topic 848permits the fund to account for those modified contracts as a continuation of the existing contracts. Management is still evaluating theimpact to the fund of the June 30, 2023 planned discontinuation of the more commonly used U.S. dollar LIBOR settings.
(10) Russia and Ukraine ConflictThe market disruptions, which began in late February 2022, associated with geopolitical events related to the conflict between Russiaand Ukraine may adversely affect the value of the fund’s assets and thus the fund’s performance. Management continues to monitorthese events and to evaluate the related impacts, if any, to the fund.
37
Copyright © 2022 www.secdatabase.com. All Rights Reserved.Please Consider the Environment Before Printing This Document

Table of Contents
PROXY VOTING POLICIES AND INFORMATION
MFS votes proxies on behalf of the fund pursuant to proxy voting policies and procedures that are available without charge, uponrequest, by calling 1-800-225-2606, by visiting mfs.com/proxyvoting, or by visiting the SEC’s Web site at http://www.sec.gov.
Information regarding how the fund voted proxies relating to portfolio securities during the most recent twelve-month period ended June30 is available by August 31 of each year without charge by visiting mfs.com/proxyvoting, or by visiting the SEC’s Web site athttp://www.sec.gov.
QUARTERLY PORTFOLIO DISCLOSURE
The fund files a complete schedule of portfolio holdings with the SEC for the first and third quarters of each fiscal year as an exhibit to itsreports on Form N-PORT. The fund's Form N-PORT reports are available on the SEC's Web site at http://www.sec.gov. A shareholdercan obtain the portfolio holdings report for the first and third quarters of the fund's fiscal year at mfs.com/openendfunds by choosing thefund's name and then scrolling to the “Resources” section and clicking on the “Prospectus and Reports” tab.
FURTHER INFORMATION
From time to time, MFS may post important information about the fund or the MFS Funds on the MFS Web site (mfs.com). Thisinformation is available at https://www.mfs.com/announcements or at mfs.com/openendfunds by choosing the fund’s name and thenscrolling to the “Resources” section and clicking on the “Announcements” tab, if any.
INFORMATION ABOUT FUND CONTRACTS AND LEGAL CLAIMS
The fund has entered into contractual arrangements with an investment adviser, administrator, distributor, shareholder servicing agent,529 program manager (if applicable), and custodian who each provide services to the fund. Unless expressly stated otherwise,shareholders are not parties to, or intended beneficiaries of these contractual arrangements, and these contractual arrangements are notintended to create any shareholder right to enforce them against the service providers or to seek any remedy under them against theservice providers, either directly or on behalf of the fund.
Under the Trust’s By-Laws and Declaration of Trust, any claims asserted against or on behalf of the MFS Funds, including claims againstTrustees and Officers, must be brought in state and federal courts located within the Commonwealth of Massachusetts.
PROVISION OF FINANCIAL REPORTS AND SUMMARY PROSPECTUSES
The fund produces financial reports every six months and updates its summary prospectus and prospectus annually. To avoid sendingduplicate copies of materials to households, only one copy of the fund’s annual and semiannual report and summary prospectus may bemailed to shareholders having the same last name and residential address on the fund’s records. However, any shareholder may contactMFSC (please see back cover for address and telephone number) to request that copies of these reports and summary prospectuses besent personally to that shareholder.
38
Copyright © 2022 www.secdatabase.com. All Rights Reserved.Please Consider the Environment Before Printing This Document

Table of Contents
Copyright © 2022 www.secdatabase.com. All Rights Reserved.Please Consider the Environment Before Printing This Document

Table of Contents
Copyright © 2022 www.secdatabase.com. All Rights Reserved.Please Consider the Environment Before Printing This Document

Table of Contents
Copyright © 2022 www.secdatabase.com. All Rights Reserved.Please Consider the Environment Before Printing This Document

Table of Contents
Copyright © 2022 www.secdatabase.com. All Rights Reserved.Please Consider the Environment Before Printing This Document

Table of Contents
Copyright © 2022 www.secdatabase.com. All Rights Reserved.Please Consider the Environment Before Printing This Document

Table of Contents
Save paper with eDelivery.
MFS® will send you prospectuses,reports, and proxies directly via e-mailso you will get information faster withless mailbox clutter.
To sign up:
CONTACTWEB SITEmfs.com
MFS TALK1-800-637-825524 hours a day
ACCOUNT SERVICE AND LITERATURE
Copyright © 2022 www.secdatabase.com. All Rights Reserved.Please Consider the Environment Before Printing This Document

1. Go to mfs.com.
2. Log in via MFS® Access.3. Select eDelivery.
If you own your MFS fund shares through a financial
institution or a retirement plan, MFS® TALK, MFS®
Access, or eDelivery may not be available to you.
Shareholders1-800-225-2606
Financial advisors1-800-343-2829
Retirement plan services1-800-637-1255
MAILING ADDRESSMFS Service Center, Inc.P.O. Box 219341Kansas City, MO 64121-9341
OVERNIGHT MAILMFS Service Center, Inc.Suite 219341430 W 7th StreetKansas City, MO 64105-1407
Copyright © 2022 www.secdatabase.com. All Rights Reserved.Please Consider the Environment Before Printing This Document

Semiannual ReportFebruary 28, 2022
MFS® Low Volatility GlobalEquity Fund
LVO-SEM
Copyright © 2022 www.secdatabase.com. All Rights Reserved.Please Consider the Environment Before Printing This Document

Copyright © 2022 www.secdatabase.com. All Rights Reserved.Please Consider the Environment Before Printing This Document

Letter from the Chair and CEO
Portfolio composition
Expense table
Portfolio of investments
Statement of assets and liabilities
Statement of operations
Statements of changes in net assets
Financial highlights
Notes to financial statements
Proxy voting policies and information
Quarterly portfolio disclosure
Further information
Information about fund contracts and legal claims
Provision of financial reports and summary prospectuses
Contact information
MFS® Low Volatility GlobalEquity Fund
CONTENTS
1
2
4
6
11
13
14
15
24
35
35
35
35
35
back cover
The report is prepared for the general information of shareholders. It is authorized for distribution toprospective investors only when preceded or accompanied by a current prospectus.
NOT FDIC INSURED • MAY LOSE VALUE • NO BANK GUARANTEE
Copyright © 2022 www.secdatabase.com. All Rights Reserved.Please Consider the Environment Before Printing This Document

Table of Contents
Copyright © 2022 www.secdatabase.com. All Rights Reserved.Please Consider the Environment Before Printing This Document

Table of Contents
LETTER FROM THE CHAIR AND CEO
Dear Shareholders:
As a result of Russia’s invasion of Ukraine, the danger of wider geopolitical conflict has risen to a level not seen in decades, and thiscomes as sanctions aimed at countering Russia’s actions are exacerbating already mounting inflation. Consequently, at a time whenglobal growth faces multiple headwinds, central banks have been presented with the challenge of reining in rising prices without tippingeconomies into recession. The US Federal Reserve recently raised rates for the first time since 2018 and indicated that it is likely totighten policy much more over the coming year. Meanwhile, the unsettled geopolitical backdrop and prospect of tighter financialconditions has led to increased volatility.
There are, however, encouraging signs for the markets. The Omicron wave of the coronavirusis receding outside Asia, unemployment is low, and there are signs that some global supplychain bottlenecks are beginning to ease, though events in Ukraine could hamper theseadvances. Additionally, easier Chinese monetary policy and the record pace of corporate stockbuybacks are supportive elements, albeit amid an otherwise turbulent investment environment.
It is important to have a deep understanding of company fundamentals during times of market transition, and we have built our globalresearch platform to do just that.
At MFS®, we put our clients’ assets to work responsibly by carefully navigating the increasing complexity of global markets andeconomies. Guided by our commitment to long-term investing, we tune out the noise and try to uncover what we believe are the best,most durable investment opportunities in the market. Our unique global investment platform combines collective expertise, long-termdiscipline, and thoughtful risk management to create sustainable value for investors over time.
Respectfully,
Michael W. RobergeChair and Chief Executive OfficerMFS Investment Management
April 14, 2022
The opinions expressed in this letter are subject to change and may not be relied upon for investment advice. No forecasts can beguaranteed.
Copyright © 2022 www.secdatabase.com. All Rights Reserved.Please Consider the Environment Before Printing This Document

1
Copyright © 2022 www.secdatabase.com. All Rights Reserved.Please Consider the Environment Before Printing This Document
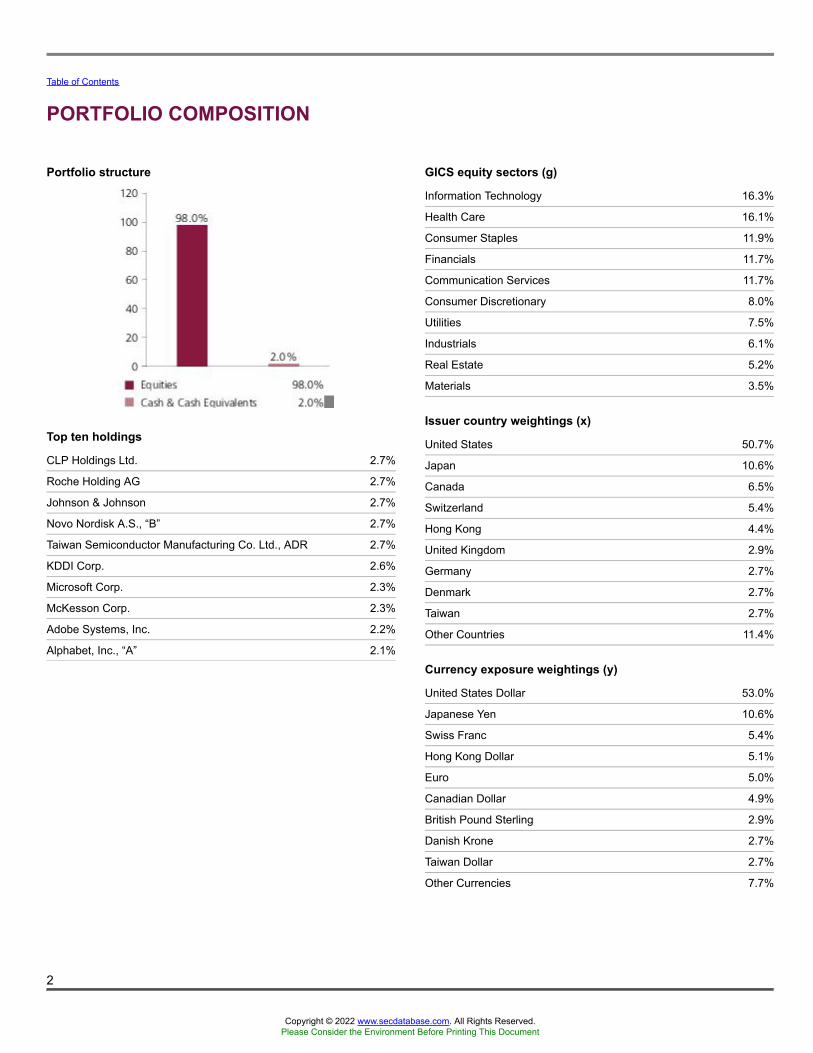
Table of Contents
PORTFOLIO COMPOSITION
2
Portfolio structure
Top ten holdings
CLP Holdings Ltd. 2.7%
Roche Holding AG 2.7%
Johnson & Johnson 2.7%
Novo Nordisk A.S., “B” 2.7%
Taiwan Semiconductor Manufacturing Co. Ltd., ADR 2.7%
KDDI Corp. 2.6%
Microsoft Corp. 2.3%
McKesson Corp. 2.3%
Adobe Systems, Inc. 2.2%
Alphabet, Inc., “A” 2.1%
GICS equity sectors (g)
Information Technology 16.3%
Health Care 16.1%
Consumer Staples 11.9%
Financials 11.7%
Communication Services 11.7%
Consumer Discretionary 8.0%
Utilities 7.5%
Industrials 6.1%
Real Estate 5.2%
Materials 3.5%
Issuer country weightings (x)
United States 50.7%
Japan 10.6%
Canada 6.5%
Switzerland 5.4%
Hong Kong 4.4%
United Kingdom 2.9%
Germany 2.7%
Denmark 2.7%
Taiwan 2.7%
Other Countries 11.4%
Currency exposure weightings (y)
United States Dollar 53.0%
Japanese Yen 10.6%
Swiss Franc 5.4%
Hong Kong Dollar 5.1%
Euro 5.0%
Canadian Dollar 4.9%
British Pound Sterling 2.9%
Danish Krone 2.7%
Taiwan Dollar 2.7%
Other Currencies 7.7%
Copyright © 2022 www.secdatabase.com. All Rights Reserved.Please Consider the Environment Before Printing This Document

Table of Contents
Portfolio Composition - continued
(g) The Global Industry Classification Standard (GICS®) was developed by and/or is the exclusive property of MSCI, Inc. and S&P Global MarketIntelligence Inc. (“S&P Global Market Intelligence”). GICS is a service mark of MSCI and S&P Global Market Intelligence and has beenlicensed for use by MFS. MFS has applied its own internal sector/industry classification methodology for equity securities and non-equitysecurities that are unclassified by GICS.
(x) Represents the portfolio’s exposure to issuer countries as a percentage of a portfolio’s net assets. For purposes of this presentation, United Statesincludes Cash & Cash Equivalents.
(y) Represents the portfolio’s exposure to a particular currency as a percentage of a portfolio's net assets. For purposes of this presentation, UnitedStates Dollar includes Cash & Cash Equivalents.
Cash & Cash Equivalents includes any cash, investments in money market funds, short-term securities, and other assets less liabilities. Please see theStatement of Assets and Liabilities for additional information related to the fund’s cash position and other assets and liabilities.
Percentages are based on net assets as of February 28, 2022.
The portfolio is actively managed and current holdings may be different.
3
Copyright © 2022 www.secdatabase.com. All Rights Reserved.Please Consider the Environment Before Printing This Document

Table of Contents
EXPENSE TABLEFund expenses borne by the shareholders during the period,September 1, 2021 through February 28, 2022
As a shareholder of the fund, you incur two types of costs: (1) transaction costs, including sales charges (loads) on certain purchase orredemption payments, and (2) ongoing costs, including management fees; distribution and service (12b-1) fees; and other fundexpenses. This example is intended to help you understand your ongoing costs (in dollars) of investing in the fund and to compare thesecosts with the ongoing costs of investing in other mutual funds.
The example is based on an investment of $1,000 invested at the beginning of the period and held for the entire period September 1,2021 through February 28, 2022.
Actual Expenses
The first line for each share class in the following table provides information about actual account values and actual expenses. You mayuse the information in this line, together with the amount you invested, to estimate the expenses that you paid over the period. Simplydivide your account value by $1,000 (for example, an $8,600 account value divided by $1,000 = 8.6), then multiply the result by thenumber in the first line under the heading entitled “Expenses Paid During Period” to estimate the expenses you paid on your accountduring this period.
Hypothetical Example for Comparison Purposes
The second line for each share class in the following table provides information about hypothetical account values and hypotheticalexpenses based on the fund’s actual expense ratio and an assumed rate of return of 5% per year before expenses, which is not thefund’s actual return. The hypothetical account values and expenses may not be used to estimate the actual ending account balance orexpenses you paid for the period. You may use this information to compare the ongoing costs of investing in the fund and other funds. Todo so, compare this 5% hypothetical example with the 5% hypothetical examples that appear in the shareholder reports of the otherfunds.
Please note that the expenses shown in the table are meant to highlight your ongoing costs only and do not reflect any transactionalcosts, such as sales charges (loads). Therefore, the second line for each share class in the table is useful in comparing ongoing costsonly, and will not help you determine the relative total costs of owning different funds. In addition, if these transactional costs wereincluded, your costs would have been higher.
4
Copyright © 2022 www.secdatabase.com. All Rights Reserved.Please Consider the Environment Before Printing This Document

Table of Contents
Expense Table - continued
ShareClass
AnnualizedExpense
Ratio
BeginningAccount Value
9/01/21
EndingAccount Value
2/28/22
ExpensesPaid DuringPeriod (p)
9/01/21-2/28/22
Actual 0.99% $1,000.00 $970.52 $4.84A
Hypothetical (h) 0.99% $1,000.00 $1,019.89 $4.96
Actual 1.74% $1,000.00 $967.23 $8.49B
Hypothetical (h) 1.74% $1,000.00 $1,016.17 $8.70
Actual 1.74% $1,000.00 $967.13 $8.49C
Hypothetical (h) 1.74% $1,000.00 $1,016.17 $8.70
Actual 0.74% $1,000.00 $971.74 $3.62I
Hypothetical (h) 0.74% $1,000.00 $1,021.12 $3.71
Actual 1.74% $1,000.00 $967.43 $8.49R1
Hypothetical (h) 1.74% $1,000.00 $1,016.17 $8.70
Actual 1.24% $1,000.00 $968.88 $6.05R2
Hypothetical (h) 1.24% $1,000.00 $1,018.65 $6.21
Actual 0.99% $1,000.00 $970.56 $4.84R3
Hypothetical (h) 0.99% $1,000.00 $1,019.89 $4.96
Actual 0.74% $1,000.00 $971.74 $3.62R4
Hypothetical (h) 0.74% $1,000.00 $1,021.12 $3.71
Actual 0.66% $1,000.00 $972.03 $3.23R6
Hypothetical (h) 0.66% $1,000.00 $1,021.52 $3.31
(h) 5% class return per year before expenses.
(p) “Expenses Paid During Period” are equal to each class’s annualized expense ratio, as shown above, multiplied by the average account value overthe period, multiplied by 181/365 (to reflect the one-half year period). Expenses paid do not include any applicable sales charges (loads). Ifthese transaction costs had been included, your costs would have been higher.
5
Copyright © 2022 www.secdatabase.com. All Rights Reserved.Please Consider the Environment Before Printing This Document

Table of Contents
PORTFOLIO OF INVESTMENTS2/28/22 (unaudited)
The Portfolio of Investments is a complete list of all securities owned by your fund. It is categorized by broad-based asset classes.
Issuer Shares/Par Value ($)
Common Stocks – 97.1%
Aerospace & Defense – 0.6%
Singapore Technologies Engineering Ltd. 482,000 $ 1,358,147
Automotive – 0.4%
Bridgestone Corp. 24,800 $ 1,024,121
Biotechnology – 0.7%
Vertex Pharmaceuticals, Inc. (a) 7,446 $ 1,712,729
Brokerage & Asset Managers – 0.8%
ASX Ltd. 19,043 $ 1,153,132
IG Group Holdings PLC 80,947 848,634
$ 2,001,766
Business Services – 1.9%
Dropbox, Inc. (a) 116,824 $ 2,650,736Fiserv, Inc. (a) 8,788 858,324
Sohgo Security Services Co. Ltd. 25,200 909,763
$ 4,418,823
Cable TV – 0.8%
Charter Communications, Inc., “A” (a) 1,615 $ 971,875
Comcast Corp., “A” 18,496 864,873
$ 1,836,748
Computer Software – 4.9%
Adobe Systems, Inc. (a) 11,238 $ 5,255,788Microsoft Corp. 18,415 5,502,218
Oracle Corp. 12,110 919,996
$ 11,678,002
Computer Software - Systems – 4.8%
Constellation Software, Inc. 2,681 $ 4,518,379Fujitsu Ltd. 14,900 2,181,103Hitachi Ltd. 28,300 1,395,759NICE Systems Ltd., ADR (a) 9,193 2,079,916
Venture Corp. Ltd. 94,300 1,219,355
$ 11,394,512
Construction – 1.2%
AvalonBay Communities, Inc., REIT 7,951 $ 1,897,029
Otis Worldwide Corp. 12,897 1,010,222
$ 2,907,251
6
Copyright © 2022 www.secdatabase.com. All Rights Reserved.Please Consider the Environment Before Printing This Document

Table of Contents
Portfolio of Investments (unaudited) – continued
Issuer Shares/Par Value ($)
Common Stocks – continued
Consumer Products – 2.2%
Colgate-Palmolive Co. 25,116 $ 1,932,676Kimberly-Clark Corp. 14,769 1,922,186Procter & Gamble Co. 9,508 1,482,202
$ 5,337,064
Electronics – 3.8%
Kyocera Corp. 46,700 $ 2,682,243Taiwan Semiconductor Manufacturing Co. Ltd., ADR 59,491 6,366,132
$ 9,048,375
Food & Beverages – 5.9%
General Mills, Inc. 53,419 $ 3,602,043J.M. Smucker Co. 8,248 1,111,418Mondelez International, Inc. 33,468 2,191,485Nestle S.A. 29,273 3,823,269PepsiCo, Inc. 20,621 3,376,482
$ 14,104,697
Food & Drug Stores – 2.8%
Seven & I Holdings Co. Ltd. 54,700 $ 2,667,353Sundrug Co. Ltd. 38,600 1,047,554Tesco PLC 308,320 1,198,439Wal-Mart Stores, Inc. 13,453 1,818,307
$ 6,731,653
General Merchandise – 2.7%
B&M European Value Retail S.A. 310,904 $ 2,524,989Dollar General Corp. 14,806 2,936,622Dollarama, Inc. 20,514 1,060,093
$ 6,521,704
Insurance – 3.9%
Everest Re Group Ltd. 14,993 $ 4,471,212Fairfax Financial Holdings Ltd. 3,800 1,842,138Samsung Fire & Marine Insurance Co. Ltd. 9,686 1,547,922Zurich Insurance Group AG 3,358 1,543,706
$ 9,404,978
Internet – 3.5%
Alphabet, Inc., “A” (a) 1,817 $ 4,907,971Alphabet, Inc., “C” (a) 379 1,022,474Gartner, Inc. (a) 8,959 2,512,283
$ 8,442,728
7
Copyright © 2022 www.secdatabase.com. All Rights Reserved.Please Consider the Environment Before Printing This Document

Copyright © 2022 www.secdatabase.com. All Rights Reserved.Please Consider the Environment Before Printing This Document

Table of Contents
Portfolio of Investments (unaudited) – continued
Issuer Shares/Par Value ($)
Common Stocks – continued
Leisure & Toys – 3.3%
DeNA Co. Ltd. 57,900 $ 891,356Electronic Arts, Inc. 31,044 4,038,514Nintendo Co. Ltd. 2,800 1,415,561SEGA SAMMY Holdings, Inc. 77,100 1,411,576
$ 7,757,007
Machinery & Tools – 1.0%
Eaton Corp. PLC 14,883 $ 2,296,298
Major Banks – 5.0%
Bank of Nova Scotia 16,962 $ 1,227,031BOC Hong Kong Holdings Ltd. 1,065,500 3,826,119DBS Group Holdings Ltd. 111,100 2,788,454JPMorgan Chase & Co. 19,679 2,790,482Royal Bank of Canada 12,318 1,360,154
$ 11,992,240
Medical & Health Technology & Services – 2.7%
McKesson Corp. 19,677 $ 5,410,388Quest Diagnostics, Inc. 7,279 955,514
$ 6,365,902
Medical Equipment – 2.1%
Becton, Dickinson and Co. 4,935 $ 1,338,767Koninklijke Philips N.V. 26,842 913,130Medtronic PLC 14,083 1,478,574Terumo Corp. 35,600 1,154,626
$ 4,885,097
Metals & Mining – 0.5%
Rio Tinto PLC 14,988 $ 1,164,362
Natural Gas - Distribution – 1.3%
Italgas S.p.A. 494,418 $ 3,203,127
Other Banks & Diversified Financials – 1.9%
China Merchants Bank Co. Ltd. 211,000 $ 1,780,586U.S. Bancorp 47,581 2,690,230
$ 4,470,816
Pharmaceuticals – 10.7%
Eli Lilly & Co. 9,336 $ 2,333,533Johnson & Johnson 39,019 6,421,357Merck & Co., Inc. 36,826 2,820,135Novartis AG 12,301 1,077,595
8
Copyright © 2022 www.secdatabase.com. All Rights Reserved.Please Consider the Environment Before Printing This Document

Table of Contents
Portfolio of Investments (unaudited) – continued
Issuer Shares/Par Value ($)
Common Stocks – continued
Pharmaceuticals – continued
Novo Nordisk A.S., “B” 62,238 $ 6,400,202Roche Holding AG 16,889 6,442,718
$ 25,495,540
Pollution Control – 0.9%
Republic Services, Inc. 18,593 $ 2,236,366
Precious Metals & Minerals – 1.8%
Franco-Nevada Corp. 29,202 $ 4,300,470
Railroad & Shipping – 1.1%
Canadian Pacific Railway Ltd. 18,008 $ 1,265,602Sankyu, Inc. 35,500 1,233,836
$ 2,499,438
Real Estate – 4.4%
Extra Space Storage, Inc., REIT 4,978 $ 936,611Grand City Properties S.A. 119,881 2,625,155Life Storage, Inc., REIT 19,170 2,426,730Public Storage, Inc., REIT 6,042 2,145,031Sun Communities, Inc., REIT 12,699 2,298,519
$ 10,432,046
Restaurants – 3.4%
McDonald's Corp. 11,053 $ 2,705,443Starbucks Corp. 40,384 3,706,847Yum China Holdings, Inc. 30,890 1,606,898
$ 8,019,188
Specialty Chemicals – 1.2%
Symrise AG 23,758 $ 2,837,016
Specialty Stores – 0.9%
AutoZone, Inc. (a) 593 $ 1,104,990Target Corp. 5,264 1,051,590
$ 2,156,580
Telecommunications - Wireless – 5.2%
Advanced Info Service Public Co. Ltd. 628,800 $ 4,406,892KDDI Corp. 188,500 6,166,602PLDT, Inc. 50,410 1,768,824
$ 12,342,318
Telephone Services – 0.6%
Orange S.A. 114,044 $ 1,382,806
9
Copyright © 2022 www.secdatabase.com. All Rights Reserved.Please Consider the Environment Before Printing This Document

Table of Contents
Portfolio of Investments (unaudited) – continued
Issuer Shares/Par Value ($)
Common Stocks – continued
Tobacco – 0.9%
British American Tobacco PLC 27,541 $ 1,205,002Japan Tobacco, Inc. 52,800 975,637
$ 2,180,639
Trucking – 1.2%
Knight-Swift Transportation Holdings, Inc. 28,157 $ 1,533,993United Parcel Service, Inc., “B” 6,138 1,291,558
$ 2,825,551
Utilities - Electric Power – 6.1%
American Electric Power Co., Inc. 24,542 $ 2,224,732CLP Holdings Ltd. 641,000 6,525,165Duke Energy Corp. 9,318 935,620E.ON SE 79,315 1,077,677Evergy, Inc. 17,414 1,086,808Xcel Energy, Inc. 41,212 2,774,804
$ 14,624,806
Total Common Stocks (Identified Cost, $181,678,760) $ 231,390,911
Preferred Stocks – 0.9%
Computer Software - Systems – 0.9%
Samsung Electronics Co. Ltd. (Identified Cost, $2,414,713) 37,090 $ 2,042,816
Investment Companies (h) – 0.3%
Money Market Funds – 0.3%
MFS Institutional Money Market Portfolio, 0.06% (v) (Identified Cost, $609,573) 609,573 $ 609,573
Other Assets, Less Liabilities – 1.7% 4,142,847
Net Assets – 100.0% $ 238,186,147
(a) Non-income producing security.(h) An affiliated issuer, which may be considered one in which the fund owns 5% or more of the outstanding voting securities, or a company which is
under common control. At period end, the aggregate values of the fund's investments in affiliated issuers and in unaffiliated issuers were$609,573 and $233,433,727, respectively.
(v) Affiliated issuer that is available only to investment companies managed by MFS. The rate quoted for the MFS Institutional Money MarketPortfolio is the annualized seven-day yield of the fund at period end.
The following abbreviations are used in this report and are defined:ADR American Depositary ReceiptREIT Real Estate Investment Trust
See Notes to Financial Statements
10
Copyright © 2022 www.secdatabase.com. All Rights Reserved.Please Consider the Environment Before Printing This Document

Table of Contents
Financial Statements
STATEMENT OF ASSETS AND LIABILITIESAt 2/28/22 (unaudited)
This statement represents your fund’s balance sheet, which details the assets and liabilities comprising the total value of the fund.
Assets
Investments in unaffiliated issuers, at value (identified cost, $184,093,473) $233,433,727Investments in affiliated issuers, at value (identified cost, $609,573) 609,573Receivables for
Fund shares sold 3,918,896Dividends 698,863
Other assets 43,093
Total assets $238,704,152
Liabilities
Payables forInvestments purchased $3,506Fund shares reacquired 294,081
Payable to affiliatesInvestment adviser 5,967Administrative services fee 461Shareholder servicing costs 21,647Distribution and service fees 1,080
Payable for independent Trustees' compensation 999Deferred country tax expense payable 126,232Accrued expenses and other liabilities 64,032
Total liabilities $518,005
Net assets $238,186,147
Net assets consist of
Paid-in capital $187,277,010Total distributable earnings (loss) 50,909,137
Net assets $238,186,147
Shares of beneficial interest outstanding 15,628,036
11
Copyright © 2022 www.secdatabase.com. All Rights Reserved.Please Consider the Environment Before Printing This Document

Table of Contents
Statement of Assets and Liabilities (unaudited) – continued
Net assetsShares
outstandingNet asset value
per share (a)Class A $24,846,073 1,630,051 $15.24Class B 458,053 30,328 15.10Class C 3,047,172 202,084 15.08Class I 125,096,896 8,203,360 15.25Class R1 146,630 9,667 15.17Class R2 146,015 9,578 15.24Class R3 95,344 6,247 15.26Class R4 89,345 5,858 15.25Class R6 84,260,619 5,530,863 15.23
(a) Maximum offering price per share was equal to the net asset value per share for all share classes, except for Class A, for which the maximumoffering price per share was $16.17 [100 / 94.25 x $15.24]. On sales of $50,000 or more, the maximum offering price of Class A shares is reduced. Acontingent deferred sales charge may be imposed on redemptions of Class A, Class B, and Class C shares. Redemption price per share was equalto the net asset value per share for Classes I, R1, R2, R3, R4, and R6.
See Notes to Financial Statements
12
Copyright © 2022 www.secdatabase.com. All Rights Reserved.Please Consider the Environment Before Printing This Document

Table of Contents
Financial Statements
STATEMENT OF OPERATIONSSix months ended 2/28/22 (unaudited)
This statement describes how much your fund earned in investment income and accrued in expenses. It also describes any gains and/or losses generatedby fund operations.
Net investment income (loss)
IncomeDividends $1,978,160Other 4,248Income on securities loaned 1,144Dividends from affiliated issuers 334Foreign taxes withheld (100,822)
Total investment income $1,883,064
ExpensesManagement fee $619,742Distribution and service fees 50,506Shareholder servicing costs 62,035Administrative services fee 20,279Independent Trustees' compensation 2,507Custodian fee 29,728Shareholder communications 7,715Audit and tax fees 28,864Legal fees 592Registration fees 62,365Miscellaneous 18,347
Total expenses $902,680
Reduction of expenses by investment adviser (54,357)
Net expenses $848,323
Net investment income (loss) $1,034,741
Realized and unrealized gain (loss)
Realized gain (loss) (identified cost basis)Unaffiliated issuers (net of $6,198 country tax) $10,865,351Foreign currency (33,925)
Net realized gain (loss) $10,831,426
Change in unrealized appreciation or depreciationUnaffiliated issuers (net of $101,393 increase in deferred country tax) $(18,107,096)Translation of assets and liabilities in foreign currencies (9,048)
Net unrealized gain (loss) $(18,116,144)
Net realized and unrealized gain (loss) $(7,284,718)
Change in net assets from operations $(6,249,977)
See Notes to Financial Statements
Copyright © 2022 www.secdatabase.com. All Rights Reserved.Please Consider the Environment Before Printing This Document

13
Copyright © 2022 www.secdatabase.com. All Rights Reserved.Please Consider the Environment Before Printing This Document

Table of Contents
Financial Statements
STATEMENTS OF CHANGES IN NET ASSETSThese statements describe the increases and/or decreases in net assets resulting from operations, any distributions, and any shareholder transactions.
Six months ended Year ended2/28/22
(unaudited)8/31/21
Change in net assetsFrom operations
Net investment income (loss) $1,034,741 $2,951,227Net realized gain (loss) 10,831,426 19,921,730Net unrealized gain (loss) (18,116,144) 20,604,441
Change in net assets from operations $(6,249,977) $43,477,398
Total distributions to shareholders $(18,718,617) $(3,422,711)
Change in net assets from fund share transactions $35,419,960 $(31,397,844)
Total change in net assets $10,451,366 $8,656,843
Net assets
At beginning of period 227,734,781 219,077,938At end of period $238,186,147 $227,734,781
See Notes to Financial Statements
14
Copyright © 2022 www.secdatabase.com. All Rights Reserved.Please Consider the Environment Before Printing This Document

Table of Contents
Financial Statements
FINANCIAL HIGHLIGHTSThe financial highlights table is intended to help you understand the fund's financial performance for the semiannual period and the past5 fiscal years. Certain information reflects financial results for a single fund share. The total returns in the table represent the rate that aninvestor would have earned (or lost) on an investment in the fund share class (assuming reinvestment of all distributions) held for theentire period.
Class ASix months
ended Year ended
2/28/22(unaudited)
8/31/21 8/31/20 8/31/19 8/31/18 8/31/17
Net asset value, beginning of period $17.04 $14.18 $13.92 $13.73 $12.82 $11.87
Income (loss) from investment operations
Net investment income (loss) (d) $0.06 $0.17 $0.23 $0.25 $0.23 $0.19Net realized and unrealized gain (loss) (0.51) 2.90 0.39 0.56 0.92 0.91
Total from investment operations $(0.45) $3.07 $0.62 $0.81 $1.15 $1.10
Less distributions declared to shareholders
From net investment income $(0.06) $(0.21) $(0.27) $(0.23) $(0.24) $(0.15)From net realized gain (1.29) — (0.09) (0.39) — —
Total distributions declared to shareholders $(1.35) $(0.21) $(0.36) $(0.62) $(0.24) $(0.15)
Net asset value, end of period (x) $15.24 $17.04 $14.18 $13.92 $13.73 $12.82
Total return (%) (r)(s)(t)(x) (2.95)(n) 21.83 4.60 6.38 9.09 9.36
Ratios (%) (to average net assets)and Supplemental data:
Expenses before expense reductions 1.04(a) 1.04 1.05 1.05 1.06 1.23Expenses after expense reductions 0.99(a) 0.99 0.99 0.98 0.97 1.17Net investment income (loss) 0.69(a)(l) 1.14 1.68 1.86 1.75 1.55Portfolio turnover 24(n) 36 43 65 41 24Net assets at end of period (000 omitted) $24,846 $25,815 $23,494 $19,981 $9,102 $9,215
See Notes to Financial Statements
15
Copyright © 2022 www.secdatabase.com. All Rights Reserved.Please Consider the Environment Before Printing This Document

Table of Contents
Financial Highlights – continued
Class BSix months
ended Year ended
2/28/22(unaudited)
8/31/21 8/31/20 8/31/19 8/31/18 8/31/17
Net asset value, beginning of period $16.90 $14.08 $13.82 $13.63 $12.73 $11.79
Income (loss) from investment operations
Net investment income (loss) (d) $(0.01) $0.06 $0.12 $0.14 $0.13 $0.09Net realized and unrealized gain (loss) (0.49) 2.86 0.40 0.57 0.91 0.91
Total from investment operations $(0.50) $2.92 $0.52 $0.71 $1.04 $1.00
Less distributions declared to shareholders
From net investment income $(0.01) $(0.10) $(0.17) $(0.13) $(0.14) $(0.06)From net realized gain (1.29) — (0.09) (0.39) — —
Total distributions declared to shareholders $(1.30) $(0.10) $(0.26) $(0.52) $(0.14) $(0.06)
Net asset value, end of period (x) $15.10 $16.90 $14.08 $13.82 $13.63 $12.73
Total return (%) (r)(s)(t)(x) (3.28)(n) 20.88 3.81 5.60 8.25 8.48
Ratios (%) (to average net assets)and Supplemental data:
Expenses before expense reductions 1.79(a) 1.78 1.80 1.79 1.81 1.98Expenses after expense reductions 1.74(a) 1.74 1.75 1.74 1.74 1.96Net investment income (loss) (0.06)(a)(l) 0.40 0.88 1.03 1.02 0.73Portfolio turnover 24(n) 36 43 65 41 24Net assets at end of period (000 omitted) $458 $475 $410 $410 $380 $350
See Notes to Financial Statements
16
Copyright © 2022 www.secdatabase.com. All Rights Reserved.Please Consider the Environment Before Printing This Document

Table of Contents
Financial Highlights – continued
Class CSix months
ended Year ended
2/28/22(unaudited)
8/31/21 8/31/20 8/31/19 8/31/18 8/31/17
Net asset value, beginning of period $16.88 $14.05 $13.80 $13.62 $12.71 $11.78
Income (loss) from investment operations
Net investment income (loss) (d) $(0.00)(w) $0.06 $0.12 $0.14 $0.13 $0.09Net realized and unrealized gain (loss) (0.50) 2.88 0.39 0.57 0.92 0.91
Total from investment operations $(0.50) $2.94 $0.51 $0.71 $1.05 $1.00
Less distributions declared to shareholders
From net investment income $(0.01) $(0.11) $(0.17) $(0.14) $(0.14) $(0.07)From net realized gain (1.29) — (0.09) (0.39) — —
Total distributions declared to shareholders $(1.30) $(0.11) $(0.26) $(0.53) $(0.14) $(0.07)
Net asset value, end of period (x) $15.08 $16.88 $14.05 $13.80 $13.62 $12.71
Total return (%) (r)(s)(t)(x) (3.29)(n) 21.00 3.77 5.57 8.28 8.49
Ratios (%) (to average net assets)and Supplemental data:
Expenses before expense reductions 1.79(a) 1.79 1.80 1.80 1.81 1.98Expenses after expense reductions 1.74(a) 1.74 1.75 1.74 1.74 1.96Net investment income (loss) (0.06)(a)(l) 0.39 0.90 1.02 1.01 0.76Portfolio turnover 24(n) 36 43 65 41 24Net assets at end of period (000 omitted) $3,047 $3,133 $3,261 $2,876 $1,773 $1,924
See Notes to Financial Statements
17
Copyright © 2022 www.secdatabase.com. All Rights Reserved.Please Consider the Environment Before Printing This Document

Table of Contents
Financial Highlights – continued
Class ISix months
ended Year ended
2/28/22(unaudited)
8/31/21 8/31/20 8/31/19 8/31/18 8/31/17
Net asset value, beginning of period $17.05 $14.18 $13.92 $13.73 $12.82 $11.87
Income (loss) from investment operations
Net investment income (loss) (d) $0.07 $0.21 $0.26 $0.28 $0.27 $0.23Net realized and unrealized gain (loss) (0.50) 2.90 0.39 0.56 0.91 0.90
Total from investment operations $(0.43) $3.11 $0.65 $0.84 $1.18 $1.13
Less distributions declared to shareholders
From net investment income $(0.08) $(0.24) $(0.30) $(0.26) $(0.27) $(0.18)From net realized gain (1.29) — (0.09) (0.39) — —
Total distributions declared to shareholders $(1.37) $(0.24) $(0.39) $(0.65) $(0.27) $(0.18)
Net asset value, end of period (x) $15.25 $17.05 $14.18 $13.92 $13.73 $12.82
Total return (%) (r)(s)(t)(x) (2.83)(n) 22.21 4.85 6.61 9.34 9.59
Ratios (%) (to average net assets)and Supplemental data:
Expenses before expense reductions 0.79(a) 0.79 0.80 0.79 0.81 0.94Expenses after expense reductions 0.74(a) 0.74 0.75 0.74 0.74 0.90Net investment income (loss) 0.92(a)(l) 1.38 1.88 2.09 2.03 1.87Portfolio turnover 24(n) 36 43 65 41 24Net assets at end of period (000 omitted) $125,097 $102,723 $106,849 $118,907 $114,259 $97,952
See Notes to Financial Statements
18
Copyright © 2022 www.secdatabase.com. All Rights Reserved.Please Consider the Environment Before Printing This Document

Table of Contents
Financial Highlights – continued
Class R1Six months
ended Year ended
2/28/22(unaudited)
8/31/21 8/31/20 8/31/19 8/31/18 8/31/17
Net asset value, beginning of period $16.97 $14.13 $13.88 $13.69 $12.78 $11.84
Income (loss) from investment operations
Net investment income (loss) (d) $(0.01) $0.06 $0.12 $0.14 $0.14 $0.09Net realized and unrealized gain (loss) (0.49) 2.89 0.39 0.58 0.91 0.91
Total from investment operations $(0.50) $2.95 $0.51 $0.72 $1.05 $1.00
Less distributions declared to shareholders
From net investment income $(0.01) $(0.11) $(0.17) $(0.14) $(0.14) $(0.06)From net realized gain (1.29) — (0.09) (0.39) — —
Total distributions declared to shareholders $(1.30) $(0.11) $(0.26) $(0.53) $(0.14) $(0.06)
Net asset value, end of period (x) $15.17 $16.97 $14.13 $13.88 $13.69 $12.78
Total return (%) (r)(s)(t)(x) (3.26)(n) 20.96 3.74 5.61 8.29 8.47
Ratios (%) (to average net assets)and Supplemental data:
Expenses before expense reductions 1.79(a) 1.78 1.80 1.79 1.81 1.98Expenses after expense reductions 1.74(a) 1.74 1.75 1.74 1.74 1.96Net investment income (loss) (0.06)(a)(l) 0.40 0.90 1.03 1.03 0.75Portfolio turnover 24(n) 36 43 65 41 24Net assets at end of period (000 omitted) $147 $149 $109 $96 $74 $68
See Notes to Financial Statements
19
Copyright © 2022 www.secdatabase.com. All Rights Reserved.Please Consider the Environment Before Printing This Document
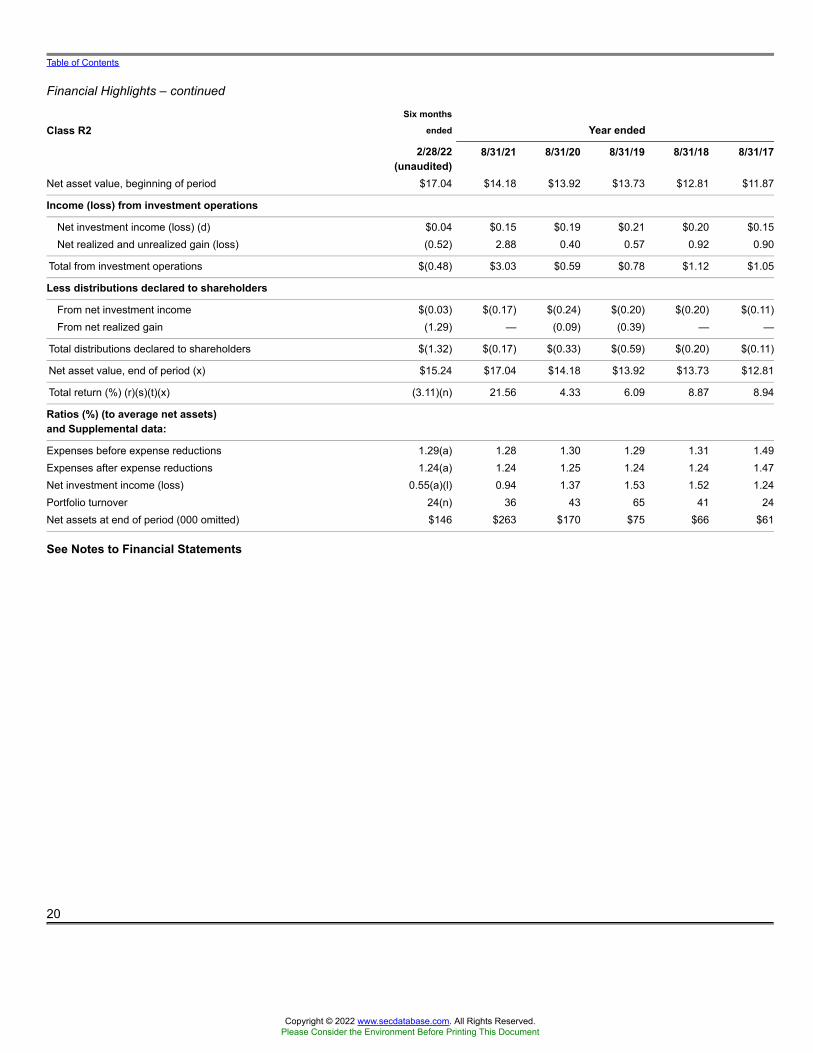
Table of Contents
Financial Highlights – continued
Class R2Six months
ended Year ended
2/28/22(unaudited)
8/31/21 8/31/20 8/31/19 8/31/18 8/31/17
Net asset value, beginning of period $17.04 $14.18 $13.92 $13.73 $12.81 $11.87
Income (loss) from investment operations
Net investment income (loss) (d) $0.04 $0.15 $0.19 $0.21 $0.20 $0.15Net realized and unrealized gain (loss) (0.52) 2.88 0.40 0.57 0.92 0.90
Total from investment operations $(0.48) $3.03 $0.59 $0.78 $1.12 $1.05
Less distributions declared to shareholders
From net investment income $(0.03) $(0.17) $(0.24) $(0.20) $(0.20) $(0.11)From net realized gain (1.29) — (0.09) (0.39) — —
Total distributions declared to shareholders $(1.32) $(0.17) $(0.33) $(0.59) $(0.20) $(0.11)
Net asset value, end of period (x) $15.24 $17.04 $14.18 $13.92 $13.73 $12.81
Total return (%) (r)(s)(t)(x) (3.11)(n) 21.56 4.33 6.09 8.87 8.94
Ratios (%) (to average net assets)and Supplemental data:
Expenses before expense reductions 1.29(a) 1.28 1.30 1.29 1.31 1.49Expenses after expense reductions 1.24(a) 1.24 1.25 1.24 1.24 1.47Net investment income (loss) 0.55(a)(l) 0.94 1.37 1.53 1.52 1.24Portfolio turnover 24(n) 36 43 65 41 24Net assets at end of period (000 omitted) $146 $263 $170 $75 $66 $61
See Notes to Financial Statements
20
Copyright © 2022 www.secdatabase.com. All Rights Reserved.Please Consider the Environment Before Printing This Document

Table of Contents
Financial Highlights – continued
Class R3Six months
ended Year ended
2/28/22(unaudited)
8/31/21 8/31/20 8/31/19 8/31/18 8/31/17
Net asset value, beginning of period $17.06 $14.20 $13.94 $13.74 $12.82 $11.88
Income (loss) from investment operations
Net investment income (loss) (d) $0.06 $0.18 $0.23 $0.24 $0.22 $0.19Net realized and unrealized gain (loss) (0.51) 2.89 0.39 0.58 0.93 0.90
Total from investment operations $(0.45) $3.07 $0.62 $0.82 $1.15 $1.09
Less distributions declared to shareholders
From net investment income $(0.06) $(0.21) $(0.27) $(0.23) $(0.23) $(0.15)From net realized gain (1.29) — (0.09) (0.39) — —
Total distributions declared to shareholders $(1.35) $(0.21) $(0.36) $(0.62) $(0.23) $(0.15)
Net asset value, end of period (x) $15.26 $17.06 $14.20 $13.94 $13.74 $12.82
Total return (%) (r)(s)(t)(x) (2.94)(n) 21.81 4.58 6.42 9.11 9.24
Ratios (%) (to average net assets)and Supplemental data:
Expenses before expense reductions 1.04(a) 1.04 1.05 1.04 1.05 1.21Expenses after expense reductions 0.99(a) 0.99 1.00 0.99 0.99 1.18Net investment income (loss) 0.68(a)(l) 1.15 1.65 1.78 1.69 1.55Portfolio turnover 24(n) 36 43 65 41 24Net assets at end of period (000 omitted) $95 $98 $79 $71 $67 $151
See Notes to Financial Statements
21
Copyright © 2022 www.secdatabase.com. All Rights Reserved.Please Consider the Environment Before Printing This Document

Table of Contents
Financial Highlights – continued
Class R4Six months
ended Year ended
2/28/22(unaudited)
8/31/21 8/31/20 8/31/19 8/31/18 8/31/17
Net asset value, beginning of period $17.05 $14.18 $13.92 $13.73 $12.82 $11.87
Income (loss) from investment operations
Net investment income (loss) (d) $0.08 $0.21 $0.26 $0.27 $0.27 $0.21Net realized and unrealized gain (loss) (0.51) 2.90 0.39 0.57 0.91 0.92
Total from investment operations $(0.43) $3.11 $0.65 $0.84 $1.18 $1.13
Less distributions declared to shareholders
From net investment income $(0.08) $(0.24) $(0.30) $(0.26) $(0.27) $(0.18)From net realized gain (1.29) — (0.09) (0.39) — —
Total distributions declared to shareholders $(1.37) $(0.24) $(0.39) $(0.65) $(0.27) $(0.18)
Net asset value, end of period (x) $15.25 $17.05 $14.18 $13.92 $13.73 $12.82
Total return (%) (r)(s)(t)(x) (2.83)(n) 22.21 4.85 6.61 9.34 9.58
Ratios (%) (to average net assets)and Supplemental data:
Expenses before expense reductions 0.79(a) 0.79 0.81 0.79 0.81 0.98Expenses after expense reductions 0.74(a) 0.74 0.75 0.74 0.74 0.96Net investment income (loss) 0.93(a)(l) 1.40 1.89 2.03 2.02 1.74Portfolio turnover 24(n) 36 43 65 41 24Net assets at end of period (000 omitted) $89 $92 $75 $72 $67 $62
See Notes to Financial Statements
22
Copyright © 2022 www.secdatabase.com. All Rights Reserved.Please Consider the Environment Before Printing This Document

Table of Contents
Financial Highlights – continued
Class R6Six months
ended Year ended
2/28/22(unaudited)
8/31/21 8/31/20 8/31/19 8/31/18 8/31/17
Net asset value, beginning of period $17.03 $14.17 $13.91 $13.72 $12.81 $11.86
Income (loss) from investment operations
Net investment income (loss) (d) $0.08 $0.22 $0.27 $0.28 $0.27 $0.21Net realized and unrealized gain (loss) (0.50) 2.90 0.40 0.57 0.92 0.92
Total from investment operations $(0.42) $3.12 $0.67 $0.85 $1.19 $1.13
Less distributions declared to shareholders
From net investment income $(0.09) $(0.26) $(0.32) $(0.27) $(0.28) $(0.18)From net realized gain (1.29) — (0.09) (0.39) — —
Total distributions declared to shareholders $(1.38) $(0.26) $(0.41) $(0.66) $(0.28) $(0.18)
Net asset value, end of period (x) $15.23 $17.03 $14.17 $13.91 $13.72 $12.81
Total return (%) (r)(s)(t)(x) (2.80)(n) 22.25 4.94 6.68 9.42 9.63
Ratios (%) (to average net assets)and Supplemental data:
Expenses before expense reductions 0.71(a) 0.71 0.73 0.72 0.74 0.94Expenses after expense reductions 0.66(a) 0.67 0.67 0.67 0.67 0.92Net investment income (loss) 1.02(a)(l) 1.44 2.01 2.11 2.08 1.77Portfolio turnover 24(n) 36 43 65 41 24Net assets at end of period (000 omitted) $84,261 $94,987 $84,631 $76,901 $69,385 $68,569
(a) Annualized.(d) Per share data is based on average shares outstanding.(l) Recognition of net investment income by the fund may be affected by the timing of the declaration of dividends by companies in which the fund
invests and the actual annual net investment income ratio may differ.(n) Not annualized.(r) Certain expenses have been reduced without which performance would have been lower.(s) From time to time the fund may receive proceeds from litigation settlements, without which performance would be lower.(t) Total returns do not include any applicable sales charges.(w) Per share amount was less than $0.01.(x) The net asset values and total returns have been calculated on net assets which include adjustments made in accordance with U.S. generally
accepted accounting principles required at period end for financial reporting purposes.
See Notes to Financial Statements
23
Copyright © 2022 www.secdatabase.com. All Rights Reserved.Please Consider the Environment Before Printing This Document

Table of Contents
NOTES TO FINANCIAL STATEMENTS(unaudited)
(1) Business and OrganizationMFS Low Volatility Global Equity Fund (the fund) is a diversified series of MFS Series Trust I (the trust). The trust is organized as aMassachusetts business trust and is registered under the Investment Company Act of 1940, as amended, as an open-end managementinvestment company.
The fund is an investment company and accordingly follows the investment company accounting and reporting guidance of the FinancialAccounting Standards Board (FASB) Accounting Standards Codification Topic 946 Financial Services - Investment Companies.
(2) Significant Accounting PoliciesGeneral — The preparation of financial statements in conformity with U.S. generally accepted accounting principles requiresmanagement to make estimates and assumptions that affect the reported amounts of assets and liabilities, and disclosure ofcontingent assets and liabilities at the date of the financial statements and the reported amounts of increases and decreases innet assets from operations during the reporting period. Actual results could differ from those estimates. In the preparation ofthese financial statements, management has evaluated subsequent events occurring after the date of the fund’s Statement ofAssets and Liabilities through the date that the financial statements were issued. The fund invests in foreign securities.Investments in foreign securities are vulnerable to the effects of changes in the relative values of the local currency and theU.S. dollar and to the effects of changes in each country’s market, economic, industrial, political, regulatory, geopolitical,environmental, public health, and other conditions.Balance Sheet Offsetting — The fund's accounting policy with respect to balance sheet offsetting is that, absent an event ofdefault by the counterparty or a termination of the agreement, the International Swaps and Derivatives Association (ISDA)Master Agreement, or similar agreement, does not result in an offset of reported amounts of financial assets and financialliabilities in the Statement of Assets and Liabilities across transactions between the fund and the applicable counterparty. Thefund's right to setoff may be restricted or prohibited by the bankruptcy or insolvency laws of the particular jurisdiction to whicha specific master netting agreement counterparty is subject. Balance sheet offsetting disclosures, to the extent applicable tothe fund, have been included in the fund’s Significant Accounting Policies note under the captions for each of the fund’s in-scope financial instruments and transactions.Investment Valuations — Equity securities, including restricted equity securities, are generally valued at the last sale or officialclosing price on their primary market or exchange as provided by a third-party pricing service. Equity securities, for whichthere were no sales reported that day, are generally valued at the last quoted daily bid quotation on their primary market orexchange as provided by a third-party pricing service. Short-term instruments with a maturity at issuance of 60 days or lessmay be valued at amortized cost, which approximates market value. Open-end investment companies are generally valued atnet asset value per share. Securities and other assets generally valued on the basis of information from a third-party pricingservice may also be valued at a broker/dealer bid quotation. In determining values, third-party pricing services can utilize bothtransaction data and market information such as yield, quality, coupon rate, maturity, type of issue, trading characteristics, andother market data. The
24
Copyright © 2022 www.secdatabase.com. All Rights Reserved.Please Consider the Environment Before Printing This Document

Table of Contents
Notes to Financial Statements (unaudited) - continued
values of foreign securities and other assets and liabilities expressed in foreign currencies are converted to U.S. dollars using the meanof bid and asked prices for rates provided by a third-party pricing service.
The Board of Trustees has delegated primary responsibility for determining or causing to be determined the value of the fund’sinvestments (including any fair valuation) to the adviser pursuant to valuation policies and procedures approved by the Board. If theadviser determines that reliable market quotations are not readily available, investments are valued at fair value as determined in goodfaith by the adviser in accordance with such procedures under the oversight of the Board of Trustees. Under the fund’s valuation policiesand procedures, market quotations are not considered to be readily available for most types of debt instruments and floating rate loansand many types of derivatives. These investments are generally valued at fair value based on information from third-party pricingservices. In addition, investments may be valued at fair value if the adviser determines that an investment’s value has been materiallyaffected by events occurring after the close of the exchange or market on which the investment is principally traded (such as foreignexchange or market) and prior to the determination of the fund’s net asset value, or after the halt of trading of a specific security wheretrading does not resume prior to the close of the exchange or market on which the security is principally traded. Events that occur afterforeign markets close (such as developments in foreign markets and significant movements in the U.S. markets) and prior to thedetermination of the fund’s net asset value may be deemed to have a material effect on the value of securities traded in foreign markets.Accordingly, the fund’s foreign equity securities may often be valued at fair value. The adviser generally relies on third-party pricingservices or other information (such as the correlation with price movements of similar securities in the same or other markets; the type,cost and investment characteristics of the security; the business and financial condition of the issuer; and trading and other market data)to assist in determining whether to fair value and at what value to fair value an investment. The value of an investment for purposes ofcalculating the fund’s net asset value can differ depending on the source and method used to determine value. When fair valuation isused, the value of an investment used to determine the fund’s net asset value may differ from quoted or published prices for the sameinvestment. There can be no assurance that the fund could obtain the fair value assigned to an investment if it were to sell the investmentat the same time at which the fund determines its net asset value per share.
Various inputs are used in determining the value of the fund's assets or liabilities. These inputs are categorized into three broad levels. Incertain cases, the inputs used to measure fair value may fall into different levels of the fair value hierarchy. In such cases, an investment'slevel within the fair value hierarchy is based on the lowest level of input that is significant to the fair value measurement. The fund'sassessment of the significance of a particular input to the fair value measurement in its entirety requires judgment, and considers factorsspecific to the investment. Level 1 includes unadjusted quoted prices in active markets for identical assets or liabilities. Level 2 includesother significant observable market-based inputs (including quoted prices for similar securities, interest rates, prepayment speed, andcredit risk). Level 3 includes unobservable inputs, which may include the adviser's own assumptions in determining the fair value ofinvestments. The following is a summary of the levels used as of February 28, 2022 in valuing the fund's assets and liabilities:
25
Copyright © 2022 www.secdatabase.com. All Rights Reserved.Please Consider the Environment Before Printing This Document
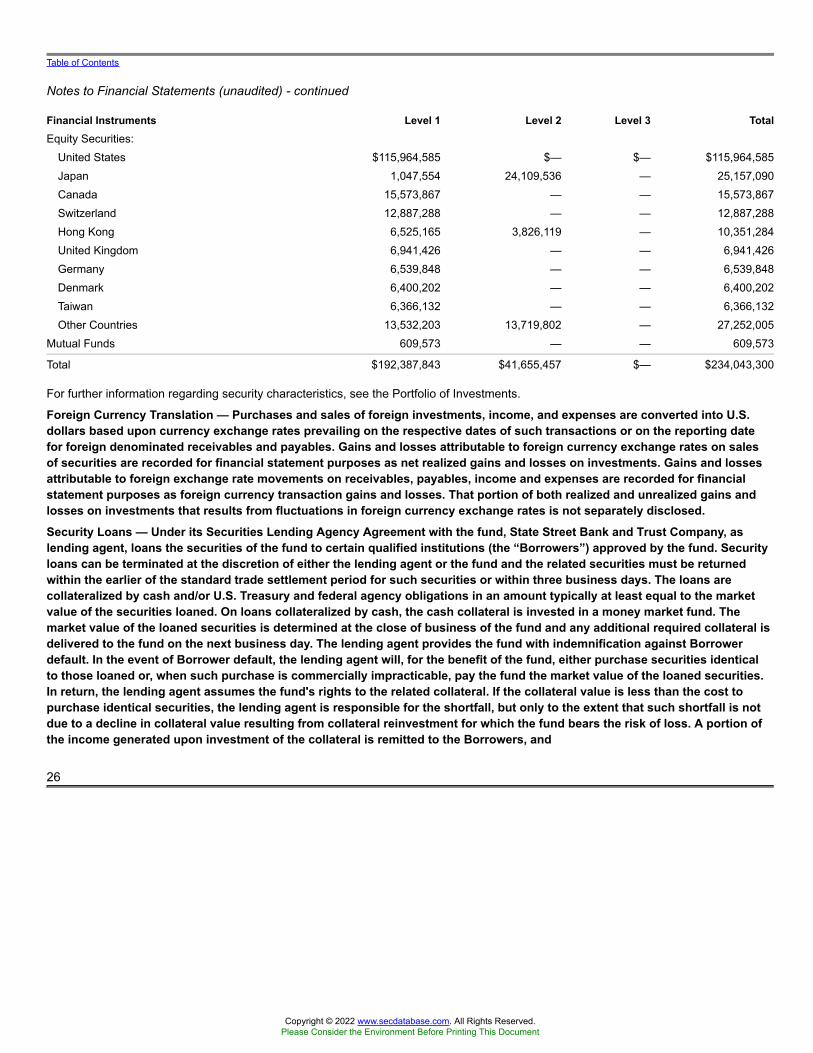
Table of Contents
Notes to Financial Statements (unaudited) - continued
Financial Instruments Level 1 Level 2 Level 3 TotalEquity Securities:
United States $115,964,585 $— $— $115,964,585Japan 1,047,554 24,109,536 — 25,157,090Canada 15,573,867 — — 15,573,867Switzerland 12,887,288 — — 12,887,288Hong Kong 6,525,165 3,826,119 — 10,351,284United Kingdom 6,941,426 — — 6,941,426Germany 6,539,848 — — 6,539,848Denmark 6,400,202 — — 6,400,202Taiwan 6,366,132 — — 6,366,132Other Countries 13,532,203 13,719,802 — 27,252,005
Mutual Funds 609,573 — — 609,573
Total $192,387,843 $41,655,457 $— $234,043,300
For further information regarding security characteristics, see the Portfolio of Investments.
Foreign Currency Translation — Purchases and sales of foreign investments, income, and expenses are converted into U.S.dollars based upon currency exchange rates prevailing on the respective dates of such transactions or on the reporting datefor foreign denominated receivables and payables. Gains and losses attributable to foreign currency exchange rates on salesof securities are recorded for financial statement purposes as net realized gains and losses on investments. Gains and lossesattributable to foreign exchange rate movements on receivables, payables, income and expenses are recorded for financialstatement purposes as foreign currency transaction gains and losses. That portion of both realized and unrealized gains andlosses on investments that results from fluctuations in foreign currency exchange rates is not separately disclosed.Security Loans — Under its Securities Lending Agency Agreement with the fund, State Street Bank and Trust Company, aslending agent, loans the securities of the fund to certain qualified institutions (the “Borrowers”) approved by the fund. Securityloans can be terminated at the discretion of either the lending agent or the fund and the related securities must be returnedwithin the earlier of the standard trade settlement period for such securities or within three business days. The loans arecollateralized by cash and/or U.S. Treasury and federal agency obligations in an amount typically at least equal to the marketvalue of the securities loaned. On loans collateralized by cash, the cash collateral is invested in a money market fund. Themarket value of the loaned securities is determined at the close of business of the fund and any additional required collateral isdelivered to the fund on the next business day. The lending agent provides the fund with indemnification against Borrowerdefault. In the event of Borrower default, the lending agent will, for the benefit of the fund, either purchase securities identicalto those loaned or, when such purchase is commercially impracticable, pay the fund the market value of the loaned securities.In return, the lending agent assumes the fund's rights to the related collateral. If the collateral value is less than the cost topurchase identical securities, the lending agent is responsible for the shortfall, but only to the extent that such shortfall is notdue to a decline in collateral value resulting from collateral reinvestment for which the fund bears the risk of loss. A portion ofthe income generated upon investment of the collateral is remitted to the Borrowers, and
26
Copyright © 2022 www.secdatabase.com. All Rights Reserved.Please Consider the Environment Before Printing This Document

Table of Contents
Notes to Financial Statements (unaudited) - continued
the remainder is allocated between the fund and the lending agent. On loans collateralized by U.S. Treasury and/or federal agencyobligations, a fee is received from the Borrower, and is allocated between the fund and the lending agent. Income from securities lendingis separately reported in the Statement of Operations. The dividend and interest income earned on the securities loaned is accounted forin the same manner as other dividend and interest income. At February 28, 2022, there were no securities on loan or collateraloutstanding.
Indemnifications — Under the fund's organizational documents, its officers and Trustees may be indemnified against certainliabilities and expenses arising out of the performance of their duties to the fund. Additionally, in the normal course ofbusiness, the fund enters into agreements with service providers that may contain indemnification clauses. The fund'smaximum exposure under these agreements is unknown as this would involve future claims that may be made against the fundthat have not yet occurred.Investment Transactions and Income — Investment transactions are recorded on the trade date. Dividends received in cash arerecorded on the ex-dividend date. Certain dividends from foreign securities will be recorded when the fund is informed of thedividend if such information is obtained subsequent to the ex-dividend date. Dividend payments received in additionalsecurities are recorded on the ex-dividend date in an amount equal to the value of the security on such date. In determining thenet gain or loss on securities sold, the cost of securities is determined on the identified cost basis.The fund may receive proceeds from litigation settlements. Any proceeds received from litigation involving portfolio holdings are reflectedin the Statement of Operations in realized gain/loss if the security has been disposed of by the fund or in unrealized gain/loss if thesecurity is still held by the fund. Any other proceeds from litigation not related to portfolio holdings are reflected as other income in theStatement of Operations.
Tax Matters and Distributions — The fund intends to qualify as a regulated investment company, as defined under SubchapterM of the Internal Revenue Code, and to distribute all of its taxable income, including realized capital gains. As a result, noprovision for federal income tax is required. The fund’s federal tax returns, when filed, will remain subject to examination by theInternal Revenue Service for a three year period. Management has analyzed the fund’s tax positions taken on federal and statetax returns for all open tax years and does not believe that there are any uncertain tax positions that require recognition of a taxliability. Foreign taxes, if any, have been accrued by the fund in the accompanying financial statements in accordance with theapplicable foreign tax law. Foreign income taxes may be withheld by certain countries in which the fund invests. Additionally,capital gains realized by the fund on securities issued in or by certain foreign countries may be subject to capital gains taximposed by those countries.Distributions to shareholders are recorded on the ex-dividend date. Income and capital gain distributions are determined in accordancewith income tax regulations, which may differ from U.S. generally accepted accounting principles. Certain capital accounts in the financialstatements are periodically adjusted for permanent differences in order to reflect their tax character. These adjustments have no impacton net assets or net
27
Copyright © 2022 www.secdatabase.com. All Rights Reserved.Please Consider the Environment Before Printing This Document

Table of Contents
Notes to Financial Statements (unaudited) - continued
asset value per share. Temporary differences which arise from recognizing certain items of income, expense, gain or loss in differentperiods for financial statement and tax purposes will reverse at some time in the future.
Book/tax differences primarily relate to passive foreign investment companies, wash sale loss deferrals, and treating a portion of theproceeds from redemptions as a distribution for tax purposes.
The tax character of distributions made during the current period will be determined at fiscal year end. The tax character of distributionsdeclared to shareholders for the last fiscal year is as follows:
Year ended8/31/21
Ordinary income (including any short-term capital gains) $3,422,711
The federal tax cost and the tax basis components of distributable earnings were as follows:
As of 2/28/22Cost of investments $186,856,224
Gross appreciation 51,300,134Gross depreciation (4,113,058)
Net unrealized appreciation (depreciation) $ 47,187,076As of 8/31/21Undistributed ordinary income 375,421Undistributed long-term capital gain 10,296,568Other temporary differences (37,303)Net unrealized appreciation (depreciation) 65,243,045
The aggregate cost above includes prior fiscal year end tax adjustments, if applicable.
Multiple Classes of Shares of Beneficial Interest — The fund offers multiple classes of shares, which differ in their respectivedistribution and service fees. The fund's income, realized and unrealized gain (loss), and common expenses are allocated toshareholders based on the daily net assets of each class. Dividends are declared separately for each class. Differences in pershare dividend rates are generally due to differences in separate class expenses. Class B and Class C shares will convert to
28
Copyright © 2022 www.secdatabase.com. All Rights Reserved.Please Consider the Environment Before Printing This Document

Table of Contents
Notes to Financial Statements (unaudited) - continued
Class A shares approximately eight years after purchase. The fund’s distributions declared to shareholders as reported in the Statementsof Changes in Net Assets are presented by class as follows:
Six monthsended2/28/22
Yearended8/31/21
Class A $2,027,442 $320,694Class B 36,515 2,976Class C 249,639 22,960Class I 8,568,369 1,628,467Class R1 11,493 904Class R2 12,006 2,441Class R3 7,774 1,170Class R4 7,405 1,303Class R6 7,797,974 1,441,796
Total $18,718,617 $3,422,711
(3) Transactions with AffiliatesInvestment Adviser — The fund has an investment advisory agreement with MFS to provide overall investment managementand related administrative services and facilities to the fund. The management fee is computed daily and paid monthly at thefollowing annual rates based on the fund's average daily net assets:
Up to $1 billion 0.55%In excess of $1 billion and up to $2.5 billion 0.525%In excess of $2.5 billion 0.50%
MFS has agreed in writing to reduce its management fee by a specified amount if certain MFS mutual fund assets exceed thresholdsagreed to by MFS and the fund's Board of Trustees. For the six months ended February 28, 2022, this management fee reductionamounted to $15,486, which is included in the reduction of total expenses in the Statement of Operations. The management fee incurredfor the six months ended February 28, 2022 was equivalent to an annual effective rate of 0.54% of the fund's average daily net assets.
The investment adviser has agreed in writing to pay a portion of the fund’s total annual operating expenses, excluding interest, taxes,extraordinary expenses, brokerage and transaction costs, and investment-related expenses, such that total fund operating expenses donot exceed the following rates annually of each class’s average daily net assets:
Classes
A B C I R1 R2 R3 R4 R60.99% 1.74% 1.74% 0.74% 1.74% 1.24% 0.99% 0.74% 0.68%
This written agreement will continue until modified by the fund’s Board of Trustees, but such agreement will continue at least untilDecember 31, 2022. For the six months ended February 28, 2022, this reduction amounted to $38,871, which is included in the reductionof total expenses in the Statement of Operations.
29
Copyright © 2022 www.secdatabase.com. All Rights Reserved.Please Consider the Environment Before Printing This Document

Table of Contents
Notes to Financial Statements (unaudited) - continued
Distributor — MFS Fund Distributors, Inc. (MFD), a wholly-owned subsidiary of MFS, as distributor, received $3,252 for the sixmonths ended February 28, 2022, as its portion of the initial sales charge on sales of Class A shares of the fund.The Board of Trustees has adopted a distribution plan for certain share classes pursuant to Rule 12b-1 of the Investment Company Act of1940.
The fund's distribution plan provides that the fund will pay MFD for services provided by MFD and financial intermediaries in connectionwith the distribution and servicing of certain share classes. One component of the plan is a distribution fee paid to MFD and anothercomponent of the plan is a service fee paid to MFD. MFD may subsequently pay all, or a portion, of the distribution and/or service fees tofinancial intermediaries.
Distribution Plan Fee Table:
DistributionFee Rate (d)
ServiceFee Rate (d)
TotalDistribution
Plan (d)
AnnualEffectiveRate (e)
Distributionand Service
Fee
Class A — 0.25% 0.25% 0.25% $ 31,459
Class B 0.75% 0.25% 1.00% 1.00% 2,334
Class C 0.75% 0.25% 1.00% 1.00% 15,397
Class R1 0.75% 0.25% 1.00% 1.00% 737
Class R2 0.25% 0.25% 0.50% 0.50% 458
Class R3 — 0.25% 0.25% 0.25% 121
Total Distribution and ServiceFees $50,506
(d) In accordance with the distribution plan for certain classes, the fund pays distribution and/or service fees equal to these annual percentage rates ofeach class’s average daily net assets. The distribution and service fee rates disclosed by class represent the current rates in effect at the endof the reporting period. Any rate changes, if applicable, are detailed below.
(e) The annual effective rates represent actual fees incurred under the distribution plan for the six months ended February 28, 2022 based on eachclass's average daily net assets. MFD has voluntarily agreed to rebate a portion of each class's 0.25% service fee attributable to accounts forwhich there is no financial intermediary specified on the account except for accounts attributable to MFS or its affiliates' seed money. Therewere no service fee rebates for the six months ended February 28, 2022.
Certain Class A shares are subject to a contingent deferred sales charge (CDSC) in the event of a shareholder redemption within 18months of purchase. Class B shares are subject to a CDSC in the event of a shareholder redemption within six years of purchase. ClassC shares are subject to a CDSC in the event of a shareholder redemption within 12 months of purchase. All contingent deferred salescharges are paid to MFD and during the six months ended February 28, 2022, were as follows:
AmountClass A $496Class B —Class C 592
Shareholder Servicing Agent — MFS Service Center, Inc. (MFSC), a wholly-owned subsidiary of MFS, receives a fee from thefund for its services as shareholder servicing agent calculated as a percentage of the average daily net assets of the fund asdetermined periodically under the supervision of the fund's Board of Trustees. For the
30
Copyright © 2022 www.secdatabase.com. All Rights Reserved.Please Consider the Environment Before Printing This Document

Table of Contents
Notes to Financial Statements (unaudited) - continued
six months ended February 28, 2022, the fee was $3,587, which equated to 0.0032% annually of the fund's average daily net assets.MFSC also receives reimbursement from the fund for out-of-pocket expenses, sub-accounting and other shareholder servicing costswhich may be paid to affiliated and unaffiliated service providers. Class R6 shares do not incur sub-accounting fees. For the six monthsended February 28, 2022, these out-of-pocket expenses, sub-accounting and other shareholder servicing costs amounted to $58,448.
Administrator — MFS provides certain financial, legal, shareholder communications, compliance, and other administrativeservices to the fund. Under an administrative services agreement, the fund reimburses MFS the costs incurred to provide theseservices. The fund is charged an annual fixed amount of $17,500 plus a fee based on average daily net assets. Theadministrative services fee incurred for the six months ended February 28, 2022 was equivalent to an annual effective rate of0.0180% of the fund's average daily net assets.Trustees’ and Officers’ Compensation — The fund pays compensation to independent Trustees in the form of a retainer,attendance fees, and additional compensation to Board and Committee chairpersons. The fund does not pay compensationdirectly to Trustees or officers of the fund who are also officers of the investment adviser, all of whom receive remunerationfrom MFS for their services to the fund. Certain officers and Trustees of the fund are officers or directors of MFS, MFD, andMFSC.Other — The fund invests in the MFS Institutional Money Market Portfolio which is managed by MFS and seeks current incomeconsistent with preservation of capital and liquidity. This money market fund does not pay a management fee to MFS but doesincur investment and operating costs.At February 28, 2022, MFS held approximately 57%, 59%, and 92% of the outstanding shares of Class R1, Class R2, and Class R3,respectively, and 100% of the outstanding shares of Class R4.
The adviser has voluntarily undertaken to reimburse the fund from its own resources on a quarterly basis for the cost of investmentresearch embedded in the cost of the fund’s securities trades. This agreement may be rescinded at any time. For the six months endedFebruary 28, 2022, this reimbursement amounted to $4,248, which is included in “Other” income in the Statement of Operations.
(4) Portfolio SecuritiesFor the six months ended February 28, 2022, purchases and sales of investments, other than short-term obligations, aggregated$69,156,883 and $55,168,802, respectively.
31
Copyright © 2022 www.secdatabase.com. All Rights Reserved.Please Consider the Environment Before Printing This Document

Table of Contents
Notes to Financial Statements (unaudited) - continued
(5) Shares of Beneficial InterestThe fund's Declaration of Trust permits the Trustees to issue an unlimited number of full and fractional shares of beneficial interest.Transactions in fund shares were as follows:
Six months ended2/28/22
Year ended8/31/21
Shares Amount Shares Amount
Shares sold
Class A 102,875 $1,660,051 238,665 $3,677,447
Class B 19 296 63 1,000
Class C 14,311 238,131 39,969 589,206
Class I 2,602,753 40,643,281 1,328,671 20,430,896
Class R1 178 2,874 1,001 14,668
Class R2 298 5,067 3,664 55,033
Class R3 21 321 61 965
Class R6 294,492 4,928,548 1,210,679 18,635,799
3,014,947 $47,478,569 2,822,773 $43,405,014
Shares issued to shareholdersin reinvestment of distributions
Class A 127,633 $2,027,442 21,522 $320,507
Class B 2,319 36,515 201 2,976
Class C 15,885 249,639 1,554 22,794
Class I 454,144 7,214,294 90,681 1,348,772
Class R1 727 11,493 61 904
Class R2 755 12,006 162 2,441
Class R3 489 7,774 78 1,170
Class R4 466 7,405 87 1,303
Class R6 481,047 7,634,976 93,082 1,384,402
1,083,465 $17,201,544 207,428 $3,085,269
Shares reacquired
Class A (115,630) $(1,895,809) (402,341) $(6,090,235)
Class B (135) (2,152) (1,256) (18,832)
Class C (13,743) (221,411) (87,888) (1,322,033)
Class I (880,036) (14,084,868) (2,926,885) (44,656,104)
Class R1 (6) (104) (5) (70)
Class R2 (6,892) (116,988) (377) (6,259)
Class R3 (1) (10) (1) (17)
Class R6 (822,875) (12,938,811) (1,698,825) (25,794,577)
(1,839,318) $(29,260,153) (5,117,578) $(77,888,127)
32
Copyright © 2022 www.secdatabase.com. All Rights Reserved.Please Consider the Environment Before Printing This Document
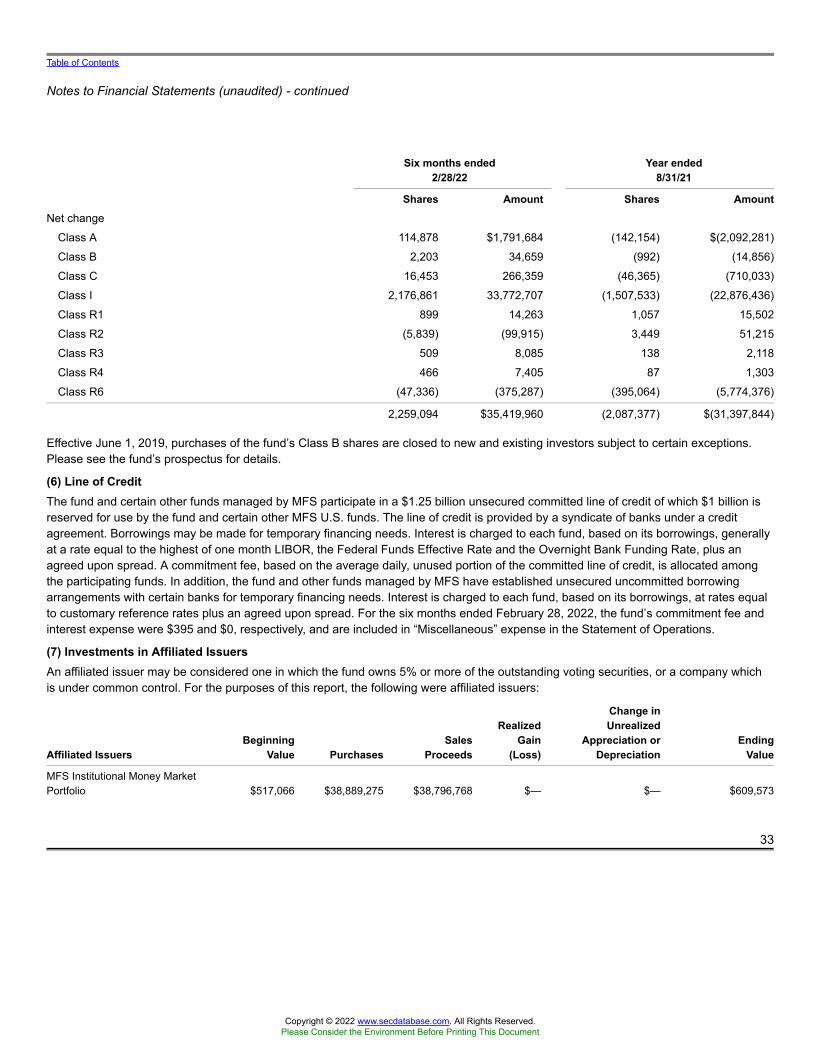
Table of Contents
Notes to Financial Statements (unaudited) - continued
Six months ended2/28/22
Year ended8/31/21
Shares Amount Shares Amount
Net change
Class A 114,878 $1,791,684 (142,154) $(2,092,281)
Class B 2,203 34,659 (992) (14,856)
Class C 16,453 266,359 (46,365) (710,033)
Class I 2,176,861 33,772,707 (1,507,533) (22,876,436)
Class R1 899 14,263 1,057 15,502
Class R2 (5,839) (99,915) 3,449 51,215
Class R3 509 8,085 138 2,118
Class R4 466 7,405 87 1,303
Class R6 (47,336) (375,287) (395,064) (5,774,376)
2,259,094 $35,419,960 (2,087,377) $(31,397,844)
Effective June 1, 2019, purchases of the fund’s Class B shares are closed to new and existing investors subject to certain exceptions.Please see the fund’s prospectus for details.
(6) Line of CreditThe fund and certain other funds managed by MFS participate in a $1.25 billion unsecured committed line of credit of which $1 billion isreserved for use by the fund and certain other MFS U.S. funds. The line of credit is provided by a syndicate of banks under a creditagreement. Borrowings may be made for temporary financing needs. Interest is charged to each fund, based on its borrowings, generallyat a rate equal to the highest of one month LIBOR, the Federal Funds Effective Rate and the Overnight Bank Funding Rate, plus anagreed upon spread. A commitment fee, based on the average daily, unused portion of the committed line of credit, is allocated amongthe participating funds. In addition, the fund and other funds managed by MFS have established unsecured uncommitted borrowingarrangements with certain banks for temporary financing needs. Interest is charged to each fund, based on its borrowings, at rates equalto customary reference rates plus an agreed upon spread. For the six months ended February 28, 2022, the fund’s commitment fee andinterest expense were $395 and $0, respectively, and are included in “Miscellaneous” expense in the Statement of Operations.
(7) Investments in Affiliated IssuersAn affiliated issuer may be considered one in which the fund owns 5% or more of the outstanding voting securities, or a company whichis under common control. For the purposes of this report, the following were affiliated issuers:
Affiliated IssuersBeginning
Value PurchasesSales
Proceeds
RealizedGain
(Loss)
Change inUnrealized
Appreciation orDepreciation
EndingValue
MFS Institutional Money MarketPortfolio $517,066 $38,889,275 $38,796,768 $— $— $609,573
33
Copyright © 2022 www.secdatabase.com. All Rights Reserved.Please Consider the Environment Before Printing This Document

Table of Contents
Notes to Financial Statements (unaudited) - continued
Affiliated IssuersDividend
IncomeCapital Gain
Distributions
MFS Institutional Money Market Portfolio $334 $—
(8) Impacts of COVID-19The pandemic related to the global spread of novel coronavirus disease (COVID-19), which was first detected in December 2019, hasresulted in significant disruptions to global business activity and the global economy, as well as the economies of individual countries, thefinancial performance of individual companies and sectors, and the securities and commodities markets in general. Multiple surges incases globally, the availability and widespread adoption of vaccines, and the emergence of variant strains of the virus continue to createuncertainty as to the future and long-term impacts resulting from the pandemic including impacts to the prices and liquidity of the fund'sinvestments and the fund's performance.
(9) LIBOR TransitionCertain of the fund's investments, including investments in certain debt instruments and derivatives (if any), as well as borrowings by thefund and certain other contractual arrangements of the fund, may be based on the London Interbank Offered Rate (“LIBOR”). In 2017, theregulatory authority that oversees financial services firms in the United Kingdom announced plans to transition away from LIBOR by theend of 2021. In March 2021, the administrator of LIBOR announced the extension of the publication of the more commonly used U.S.dollar LIBOR settings to the end of June 2023. Although the full impacts of the transition away from LIBOR are not fully known, thetransition may result in, among other things, an increase in volatility or illiquidity of the markets for instruments that currently rely onLIBOR to determine interest rates and this could have an adverse impact on the fund's performance. With respect to the fund'saccounting for investments, including investments in certain debt instruments and derivatives, as well as borrowings by the fund and anyother contractual arrangements of the fund that undergo reference rate-related modifications as a result of the transition, managementwill rely upon the relief provided by FASB Codification Topic 848 – Reference Rate Reform (Topic 848). The guidance in Topic 848permits the fund to account for those modified contracts as a continuation of the existing contracts. Management is still evaluating theimpact to the fund of the June 30, 2023 planned discontinuation of the more commonly used U.S. dollar LIBOR settings.
(10) Russia and Ukraine ConflictThe market disruptions, which began in late February 2022, associated with geopolitical events related to the conflict between Russiaand Ukraine may adversely affect the value of the fund’s assets and thus the fund’s performance. Management continues to monitorthese events and to evaluate the related impacts, if any, to the fund.
34
Copyright © 2022 www.secdatabase.com. All Rights Reserved.Please Consider the Environment Before Printing This Document

Table of Contents
PROXY VOTING POLICIES AND INFORMATION
MFS votes proxies on behalf of the fund pursuant to proxy voting policies and procedures that are available without charge, uponrequest, by calling 1-800-225-2606, by visiting mfs.com/proxyvoting, or by visiting the SEC’s Web site at http://www.sec.gov.
Information regarding how the fund voted proxies relating to portfolio securities during the most recent twelve-month period ended June30 is available by August 31 of each year without charge by visiting mfs.com/proxyvoting, or by visiting the SEC’s Web site athttp://www.sec.gov.
QUARTERLY PORTFOLIO DISCLOSURE
The fund files a complete schedule of portfolio holdings with the SEC for the first and third quarters of each fiscal year as an exhibit to itsreports on Form N-PORT. The fund's Form N-PORT reports are available on the SEC's Web site at http://www.sec.gov. A shareholdercan obtain the portfolio holdings report for the first and third quarters of the fund's fiscal year at mfs.com/openendfunds by choosing thefund's name and then scrolling to the “Resources” section and clicking on the “Prospectus and Reports” tab.
FURTHER INFORMATION
From time to time, MFS may post important information about the fund or the MFS Funds on the MFS Web site (mfs.com). Thisinformation is available at https://www.mfs.com/announcements or at mfs.com/openendfunds by choosing the fund’s name and thenscrolling to the “Resources” section and clicking on the “Announcements” tab, if any.
INFORMATION ABOUT FUND CONTRACTS AND LEGAL CLAIMS
The fund has entered into contractual arrangements with an investment adviser, administrator, distributor, shareholder servicing agent,529 program manager (if applicable), and custodian who each provide services to the fund. Unless expressly stated otherwise,shareholders are not parties to, or intended beneficiaries of these contractual arrangements, and these contractual arrangements are notintended to create any shareholder right to enforce them against the service providers or to seek any remedy under them against theservice providers, either directly or on behalf of the fund.
Under the Trust’s By-Laws and Declaration of Trust, any claims asserted against or on behalf of the MFS Funds, including claims againstTrustees and Officers, must be brought in state and federal courts located within the Commonwealth of Massachusetts.
PROVISION OF FINANCIAL REPORTS AND SUMMARY PROSPECTUSES
The fund produces financial reports every six months and updates its summary prospectus and prospectus annually. To avoid sendingduplicate copies of materials to households, only one copy of the fund’s annual and semiannual report and summary prospectus may bemailed to shareholders having the same last name and residential address on the fund’s records. However, any shareholder may contactMFSC (please see back cover for address and telephone number) to request that copies of these reports and summary prospectuses besent personally to that shareholder.
35
Copyright © 2022 www.secdatabase.com. All Rights Reserved.Please Consider the Environment Before Printing This Document

Table of Contents
Save paper with eDelivery.
MFS® will send you prospectuses,reports, and proxies directly via e-mailso you will get information faster withless mailbox clutter.
To sign up:
CONTACTWEB SITEmfs.com
MFS TALK1-800-637-825524 hours a day
ACCOUNT SERVICE AND LITERATURE
Copyright © 2022 www.secdatabase.com. All Rights Reserved.Please Consider the Environment Before Printing This Document

1. Go to mfs.com.
2. Log in via MFS® Access.3. Select eDelivery.
If you own your MFS fund shares through a financial
institution or a retirement plan, MFS® TALK, MFS®
Access, or eDelivery may not be available to you.
Shareholders1-800-225-2606
Financial advisors1-800-343-2829
Retirement plan services1-800-637-1255
MAILING ADDRESSMFS Service Center, Inc.P.O. Box 219341Kansas City, MO 64121-9341
OVERNIGHT MAILMFS Service Center, Inc.Suite 219341430 W 7th StreetKansas City, MO 64105-1407
Copyright © 2022 www.secdatabase.com. All Rights Reserved.Please Consider the Environment Before Printing This Document

Semiannual ReportFebruary 28, 2022
MFS® Low VolatilityEquity Fund
LVU-SEM
Copyright © 2022 www.secdatabase.com. All Rights Reserved.Please Consider the Environment Before Printing This Document

Copyright © 2022 www.secdatabase.com. All Rights Reserved.Please Consider the Environment Before Printing This Document

Letter from the Chair and CEO
Portfolio composition
Expense table
Portfolio of investments
Statement of assets and liabilities
Statement of operations
Statements of changes in net assets
Financial highlights
Notes to financial statements
Proxy voting policies and information
Quarterly portfolio disclosure
Further information
Information about fund contracts and legal claims
Provision of financial reports and summary prospectuses
Contact information
MFS® Low VolatilityEquity Fund
CONTENTS
1
2
3
5
10
12
13
14
23
33
33
33
33
33
back cover
The report is prepared for the general information of shareholders. It is authorized for distribution toprospective investors only when preceded or accompanied by a current prospectus.
NOT FDIC INSURED • MAY LOSE VALUE • NO BANK GUARANTEE
Copyright © 2022 www.secdatabase.com. All Rights Reserved.Please Consider the Environment Before Printing This Document

Table of Contents
Copyright © 2022 www.secdatabase.com. All Rights Reserved.Please Consider the Environment Before Printing This Document

Table of Contents
LETTER FROM THE CHAIR AND CEO
Dear Shareholders:
As a result of Russia’s invasion of Ukraine, the danger of wider geopolitical conflict has risen to a level not seen in decades, and thiscomes as sanctions aimed at countering Russia’s actions are exacerbating already mounting inflation. Consequently, at a time whenglobal growth faces multiple headwinds, central banks have been presented with the challenge of reining in rising prices without tippingeconomies into recession. The US Federal Reserve recently raised rates for the first time since 2018 and indicated that it is likely totighten policy much more over the coming year. Meanwhile, the unsettled geopolitical backdrop and prospect of tighter financialconditions has led to increased volatility.
There are, however, encouraging signs for the markets. The Omicron wave of the coronavirusis receding outside Asia, unemployment is low, and there are signs that some global supplychain bottlenecks are beginning to ease, though events in Ukraine could hamper theseadvances. Additionally, easier Chinese monetary policy and the record pace of corporate stockbuybacks are supportive elements, albeit amid an otherwise turbulent investment environment.
It is important to have a deep understanding of company fundamentals during times of market transition, and we have built our globalresearch platform to do just that.
At MFS®, we put our clients’ assets to work responsibly by carefully navigating the increasing complexity of global markets andeconomies. Guided by our commitment to long-term investing, we tune out the noise and try to uncover what we believe are the best,most durable investment opportunities in the market. Our unique global investment platform combines collective expertise, long-termdiscipline, and thoughtful risk management to create sustainable value for investors over time.
Respectfully,
Michael W. RobergeChair and Chief Executive OfficerMFS Investment Management
April 14, 2022
The opinions expressed in this letter are subject to change and may not be relied upon for investment advice. No forecasts can beguaranteed.
Copyright © 2022 www.secdatabase.com. All Rights Reserved.Please Consider the Environment Before Printing This Document

1
Copyright © 2022 www.secdatabase.com. All Rights Reserved.Please Consider the Environment Before Printing This Document

Table of Contents
PORTFOLIO COMPOSITION
(g) The Global Industry Classification Standard (GICS®) was developed by and/or is the exclusive property of MSCI, Inc. and S&P Global MarketIntelligence Inc. (“S&P Global Market Intelligence”). GICS is a service mark of MSCI and S&P Global Market Intelligence and has beenlicensed for use by MFS. MFS has applied its own internal sector/industry classification methodology for equity securities and non-equitysecurities that are unclassified by GICS.
Cash & Cash Equivalents includes any cash, investments in money market funds, short-term securities, and other assets less liabilities. Please see theStatement of Assets and Liabilities for additional information related to the fund’s cash position and other assets and liabilities.
Percentages are based on net assets as of February 28, 2022.
The portfolio is actively managed and current holdings may be different.
2
Portfolio structure
Top ten holdings
Microsoft Corp. 3.7%
Alphabet, Inc., “A” 3.6%
Eli Lilly & Co. 3.1%
Johnson & Johnson 2.7%
Accenture PLC, “A” 2.6%
Adobe Systems, Inc. 2.5%
PepsiCo, Inc. 2.2%
Everest Re Group Ltd. 2.1%
Amdocs Ltd. 2.1%
Target Corp. 2.1%
GICS equity sectors (g)
Information Technology 22.2%
Health Care 16.8%
Industrials 12.7%
Consumer Staples 10.9%
Communication Services 10.7%
Utilities 7.3%
Consumer Discretionary 6.8%
Financials 6.7%
Real Estate 3.3%
Materials 2.2%
Copyright © 2022 www.secdatabase.com. All Rights Reserved.Please Consider the Environment Before Printing This Document

Table of Contents
EXPENSE TABLEFund expenses borne by the shareholders during the period,September 1, 2021 through February 28, 2022
As a shareholder of the fund, you incur two types of costs: (1) transaction costs, including sales charges (loads) on certain purchase orredemption payments, and (2) ongoing costs, including management fees; distribution and service (12b-1) fees; and other fundexpenses. This example is intended to help you understand your ongoing costs (in dollars) of investing in the fund and to compare thesecosts with the ongoing costs of investing in other mutual funds.
The example is based on an investment of $1,000 invested at the beginning of the period and held for the entire period September 1,2021 through February 28, 2022.
Actual Expenses
The first line for each share class in the following table provides information about actual account values and actual expenses. You mayuse the information in this line, together with the amount you invested, to estimate the expenses that you paid over the period. Simplydivide your account value by $1,000 (for example, an $8,600 account value divided by $1,000 = 8.6), then multiply the result by thenumber in the first line under the heading entitled “Expenses Paid During Period” to estimate the expenses you paid on your accountduring this period.
Hypothetical Example for Comparison Purposes
The second line for each share class in the following table provides information about hypothetical account values and hypotheticalexpenses based on the fund’s actual expense ratio and an assumed rate of return of 5% per year before expenses, which is not thefund’s actual return. The hypothetical account values and expenses may not be used to estimate the actual ending account balance orexpenses you paid for the period. You may use this information to compare the ongoing costs of investing in the fund and other funds. Todo so, compare this 5% hypothetical example with the 5% hypothetical examples that appear in the shareholder reports of the otherfunds.
Please note that the expenses shown in the table are meant to highlight your ongoing costs only and do not reflect any transactionalcosts, such as sales charges (loads). Therefore, the second line for each share class in the table is useful in comparing ongoing costsonly, and will not help you determine the relative total costs of owning different funds. In addition, if these transactional costs wereincluded, your costs would have been higher.
3
Copyright © 2022 www.secdatabase.com. All Rights Reserved.Please Consider the Environment Before Printing This Document

Table of Contents
Expense Table - continued
ShareClass
AnnualizedExpense
Ratio
BeginningAccount Value
9/01/21
EndingAccount Value
2/28/22
ExpensesPaid DuringPeriod (p)
9/01/21-2/28/22
Actual 0.89% $1,000.00 $943.20 $4.29A
Hypothetical (h) 0.89% $1,000.00 $1,020.38 $4.46
Actual 1.64% $1,000.00 $939.99 $7.89B
Hypothetical (h) 1.64% $1,000.00 $1,016.66 $8.20
Actual 1.64% $1,000.00 $939.74 $7.89C
Hypothetical (h) 1.64% $1,000.00 $1,016.66 $8.20
Actual 0.64% $1,000.00 $944.45 $3.09I
Hypothetical (h) 0.64% $1,000.00 $1,021.62 $3.21
Actual 1.64% $1,000.00 $940.10 $7.89R1
Hypothetical (h) 1.64% $1,000.00 $1,016.66 $8.20
Actual 1.14% $1,000.00 $941.93 $5.49R2
Hypothetical (h) 1.14% $1,000.00 $1,019.14 $5.71
Actual 0.89% $1,000.00 $943.38 $4.29R3
Hypothetical (h) 0.89% $1,000.00 $1,020.38 $4.46
Actual 0.64% $1,000.00 $944.45 $3.09R4
Hypothetical (h) 0.64% $1,000.00 $1,021.62 $3.21
Actual 0.55% $1,000.00 $944.87 $2.65R6
Hypothetical (h) 0.55% $1,000.00 $1,022.07 $2.76
(h) 5% class return per year before expenses.
(p) “Expenses Paid During Period” are equal to each class’s annualized expense ratio, as shown above, multiplied by the average account value overthe period, multiplied by 181/365 (to reflect the one-half year period). Expenses paid do not include any applicable sales charges (loads). Ifthese transaction costs had been included, your costs would have been higher.
4
Copyright © 2022 www.secdatabase.com. All Rights Reserved.Please Consider the Environment Before Printing This Document

Table of Contents
PORTFOLIO OF INVESTMENTS2/28/22 (unaudited)
The Portfolio of Investments is a complete list of all securities owned by your fund. It is categorized by broad-based asset classes.
Issuer Shares/Par Value ($)
Common Stocks – 99.6%
Aerospace & Defense – 1.3%
CACI International, Inc., “A” (a) 16,076 $ 4,497,904Honeywell International, Inc. 14,078 2,671,301
$ 7,169,205
Business Services – 6.7%
Accenture PLC, “A” 43,396 $ 13,714,004Amdocs Ltd. 141,618 11,145,337Fidelity National Information Services, Inc. 27,473 2,616,254Fiserv, Inc. (a) 26,058 2,545,085FleetCor Technologies, Inc. (a) 15,132 3,543,914Verisk Analytics, Inc., “A” 12,241 2,170,819
$ 35,735,413
Cable TV – 2.9%
Cable One, Inc. 3,600 $ 5,158,260Charter Communications, Inc., “A” (a) 11,127 6,696,006Comcast Corp., “A” 80,612 3,769,417
$ 15,623,683
Computer Software – 7.8%
Adobe Systems, Inc. (a) 28,061 $ 13,123,568Cadence Design Systems, Inc. (a) 18,943 2,868,539Intuit, Inc. 12,589 5,971,844Microsoft Corp. 66,293 19,807,685
$ 41,771,636
Computer Software - Systems – 1.0%
Apple, Inc. 31,635 $ 5,223,571
Construction – 0.6%
AvalonBay Communities, Inc., REIT 12,770 $ 3,046,794
Consumer Products – 2.7%
Colgate-Palmolive Co. 63,708 $ 4,902,330Procter & Gamble Co. 60,138 9,374,913
$ 14,277,243
Electrical Equipment – 3.2%
AMETEK, Inc. 19,796 $ 2,569,323Emerson Electric Co. 24,299 2,257,863Johnson Controls International PLC 69,130 4,490,685
5
Copyright © 2022 www.secdatabase.com. All Rights Reserved.Please Consider the Environment Before Printing This Document

Table of Contents
Portfolio of Investments (unaudited) – continued
Issuer Shares/Par Value ($)
Common Stocks – continued
Electrical Equipment – continued
TE Connectivity Ltd. 52,833 $ 7,525,004
$ 16,842,875
Electronics – 1.4%
Texas Instruments, Inc. 45,317 $ 7,703,437
Food & Beverages – 5.1%
General Mills, Inc. 106,012 $ 7,148,389Ingredion, Inc. 26,113 2,317,268J.M. Smucker Co. 18,169 2,448,273Mondelez International, Inc. 51,306 3,359,517PepsiCo, Inc. 72,303 11,838,893
$ 27,112,340
Food & Drug Stores – 2.5%
Kroger Co. 105,539 $ 4,939,225Wal-Mart Stores, Inc. 62,923 8,504,673
$ 13,443,898
General Merchandise – 0.7%
Costco Wholesale Corp. 6,882 $ 3,573,479
Health Maintenance Organizations – 0.5%
UnitedHealth Group, Inc. 5,174 $ 2,462,151
Insurance – 5.6%
Aon PLC 20,661 $ 6,035,905Assurant, Inc. 21,200 3,597,852Chubb Ltd. 29,059 5,917,575Everest Re Group Ltd. 37,420 11,159,392MetLife, Inc. 49,337 3,332,714
$ 30,043,438
Internet – 5.1%
Alphabet, Inc., “A” (a) 7,132 $ 19,264,530Alphabet, Inc., “C” (a) 2,958 7,980,152
$ 27,244,682
Leisure & Toys – 0.5%
Electronic Arts, Inc. 22,042 $ 2,867,444
Machinery & Tools – 2.2%
Eaton Corp. PLC 60,890 $ 9,394,718Roper Technologies, Inc. 5,169 2,316,849
$ 11,711,567
6
Copyright © 2022 www.secdatabase.com. All Rights Reserved.Please Consider the Environment Before Printing This Document

Table of Contents
Portfolio of Investments (unaudited) – continued
Issuer Shares/Par Value ($)
Common Stocks – continued
Medical & Health Technology & Services – 1.8%
Charles River Laboratories International, Inc. (a) 11,393 $ 3,317,186McKesson Corp. 22,667 6,232,518
$ 9,549,704
Medical Equipment – 5.3%
Abbott Laboratories 18,870 $ 2,276,099Danaher Corp. 19,542 5,362,520Medtronic PLC 72,538 7,615,765STERIS PLC 41,588 9,981,120Thermo Fisher Scientific, Inc. 5,438 2,958,272
$ 28,193,776
Network & Telecom – 0.9%
Motorola Solutions, Inc. 22,880 $ 5,043,438
Other Banks & Diversified Financials – 4.4%
Mastercard, Inc., “A” 27,201 $ 9,814,665S&P Global, Inc. 7,579 2,847,430U.S. Bancorp 47,771 2,700,972Visa, Inc., “A” 37,990 8,210,399
$ 23,573,466
Pharmaceuticals – 9.3%
Eli Lilly & Co. 67,189 $ 16,793,891Johnson & Johnson 86,443 14,225,924Merck & Co., Inc. 88,873 6,805,894Pfizer, Inc. 163,161 7,658,777Zoetis, Inc. 20,987 4,064,133
$ 49,548,619
Pollution Control – 4.0%
Republic Services, Inc. 77,156 $ 9,280,324Waste Connections, Inc. 58,556 7,231,081Waste Management, Inc. 33,471 4,833,212
$ 21,344,617
Precious Metals & Minerals – 1.2%
Newmont Corp. 92,806 $ 6,143,757
Real Estate – 2.7%
Extra Space Storage, Inc., REIT 16,715 $ 3,144,927Public Storage, Inc., REIT 15,967 5,668,604STAG Industrial, Inc., REIT 82,885 3,229,200Sun Communities, Inc., REIT 13,499 2,443,319
$ 14,486,050
Copyright © 2022 www.secdatabase.com. All Rights Reserved.Please Consider the Environment Before Printing This Document

7
Copyright © 2022 www.secdatabase.com. All Rights Reserved.Please Consider the Environment Before Printing This Document

Table of Contents
Portfolio of Investments (unaudited) – continued
Issuer Shares/Par Value ($)
Common Stocks – continued
Restaurants – 2.0%
McDonald's Corp. 13,940 $ 3,412,094Starbucks Corp. 76,707 7,040,935
$ 10,453,029
Specialty Chemicals – 1.0%
Ashland Global Holdings, Inc. 25,224 $ 2,327,671Ecolab, Inc. 17,646 3,110,284
$ 5,437,955
Specialty Stores – 4.8%
Amazon.com, Inc. (a) 2,733 $ 8,393,754AutoZone, Inc. (a) 2,061 3,840,447Home Depot, Inc. 8,093 2,556,012Target Corp. 55,629 11,113,005
$ 25,903,218
Telecommunications - Wireless – 1.6%
T-Mobile US, Inc. (a) 71,350 $ 8,791,034
Telephone Services – 0.5%
Verizon Communications, Inc. 51,131 $ 2,744,201
Trucking – 3.1%
Expeditors International of Washington, Inc. 27,548 $ 2,847,361J.B. Hunt Transport Services, Inc. 14,350 2,912,046Landstar System, Inc. 19,615 3,028,752Old Dominion Freight Line, Inc. 23,920 7,511,598
$ 16,299,757
Utilities - Electric Power – 7.2%
American Electric Power Co., Inc. 42,458 $ 3,848,818DTE Energy Co. 31,312 3,807,226Duke Energy Corp. 44,477 4,465,936Evergy, Inc. 46,447 2,898,757Exelon Corp. 175,807 7,482,346NextEra Energy, Inc. 90,178 7,058,232Sempra Energy 23,733 3,422,773Xcel Energy, Inc. 84,841 5,712,344
$ 38,696,432
Total Common Stocks (Identified Cost, $381,291,243) $532,061,909
8
Copyright © 2022 www.secdatabase.com. All Rights Reserved.Please Consider the Environment Before Printing This Document

Table of Contents
Portfolio of Investments (unaudited) – continued
Issuer Shares/Par Value ($)
Investment Companies (h) – 0.3%
Money Market Funds – 0.3%
MFS Institutional Money Market Portfolio, 0.06% (v) (Identified Cost, $1,772,061) 1,772,061 $ 1,772,061
Other Assets, Less Liabilities – 0.1% 571,834
Net Assets – 100.0% $534,405,804
(a) Non-income producing security.(h) An affiliated issuer, which may be considered one in which the fund owns 5% or more of the outstanding voting securities, or a company which is
under common control. At period end, the aggregate values of the fund's investments in affiliated issuers and in unaffiliated issuers were$1,772,061 and $532,061,909, respectively.
(v) Affiliated issuer that is available only to investment companies managed by MFS. The rate quoted for the MFS Institutional Money MarketPortfolio is the annualized seven-day yield of the fund at period end.
The following abbreviations are used in this report and are defined:REIT Real Estate Investment Trust
See Notes to Financial Statements
9
Copyright © 2022 www.secdatabase.com. All Rights Reserved.Please Consider the Environment Before Printing This Document

Table of Contents
Financial Statements
STATEMENT OF ASSETS AND LIABILITIESAt 2/28/22 (unaudited)
This statement represents your fund’s balance sheet, which details the assets and liabilities comprising the total value of the fund.
Assets
Investments in unaffiliated issuers, at value (identified cost, $381,291,243) $532,061,909Investments in affiliated issuers, at value (identified cost, $1,772,061) 1,772,061Receivables for
Fund shares sold 688,524Dividends 769,709
Other assets 52,383
Total assets $535,344,586
Liabilities
Payables forFund shares reacquired $760,861
Payable to affiliatesInvestment adviser 14,218Administrative services fee 898Shareholder servicing costs 98,900Distribution and service fees 7,888
Payable for independent Trustees' compensation 1,807Accrued expenses and other liabilities 54,210
Total liabilities $938,782
Net assets $534,405,804
Net assets consist of
Paid-in capital $360,144,527Total distributable earnings (loss) 174,261,277
Net assets $534,405,804
Shares of beneficial interest outstanding 26,379,369
10
Copyright © 2022 www.secdatabase.com. All Rights Reserved.Please Consider the Environment Before Printing This Document

Table of Contents
Statement of Assets and Liabilities (unaudited) – continued
Net assetsShares
outstandingNet asset value
per share (a)Class A $162,711,588 8,038,198 $20.24Class B 2,199,526 109,053 20.17Class C 29,124,391 1,450,143 20.08Class I 259,594,194 12,803,121 20.28Class R1 542,009 26,825 20.21Class R2 505,322 24,854 20.33Class R3 702,226 34,567 20.32Class R4 100,593 4,957 20.29Class R6 78,925,955 3,887,651 20.30
(a) Maximum offering price per share was equal to the net asset value per share for all share classes, except for Class A, for which the maximumoffering price per share was $21.47 [100 / 94.25 x $20.24]. On sales of $50,000 or more, the maximum offering price of Class A shares is reduced. Acontingent deferred sales charge may be imposed on redemptions of Class A, Class B, and Class C shares. Redemption price per share was equalto the net asset value per share for Classes I, R1, R2, R3, R4, and R6.
See Notes to Financial Statements
11
Copyright © 2022 www.secdatabase.com. All Rights Reserved.Please Consider the Environment Before Printing This Document

Table of Contents
Financial Statements
STATEMENT OF OPERATIONSSix months ended 2/28/22 (unaudited)
This statement describes how much your fund earned in investment income and accrued in expenses. It also describes any gains and/or losses generatedby fund operations.
Net investment income (loss)
IncomeDividends $4,037,718Other 1,800Dividends from affiliated issuers 867Foreign taxes withheld (2,556)
Total investment income $4,037,829
ExpensesManagement fee $1,506,854Distribution and service fees 384,957Shareholder servicing costs 256,047Administrative services fee 45,174Independent Trustees' compensation 4,758Custodian fee 18,970Shareholder communications 22,915Audit and tax fees 26,404Legal fees 1,620Miscellaneous 94,861
Total expenses $2,362,560
Reduction of expenses by investment adviser and distributor (80,438)
Net expenses $2,282,122
Net investment income (loss) $1,755,707
Realized and unrealized gain (loss)
Realized gain (loss) (identified cost basis)Unaffiliated issuers $35,738,430Foreign currency (15)
Net realized gain (loss) $35,738,415
Change in unrealized appreciation or depreciationUnaffiliated issuers $(72,587,928)Translation of assets and liabilities in foreign currencies (7)
Net unrealized gain (loss) $(72,587,935)
Net realized and unrealized gain (loss) $(36,849,520)
Change in net assets from operations $(35,093,813)
See Notes to Financial Statements
12
Copyright © 2022 www.secdatabase.com. All Rights Reserved.Please Consider the Environment Before Printing This Document

Copyright © 2022 www.secdatabase.com. All Rights Reserved.Please Consider the Environment Before Printing This Document

Table of Contents
Financial Statements
STATEMENTS OF CHANGES IN NET ASSETSThese statements describe the increases and/or decreases in net assets resulting from operations, any distributions, and any shareholder transactions.
Six months ended Year ended2/28/22
(unaudited)8/31/21
Change in net assetsFrom operations
Net investment income (loss) $1,755,707 $5,312,280Net realized gain (loss) 35,738,415 45,239,789Net unrealized gain (loss) (72,587,935) 112,943,592
Change in net assets from operations $(35,093,813) $163,495,661
Total distributions to shareholders $(29,477,281) $(6,341,771)
Change in net assets from fund share transactions $(29,604,754) $(240,280,530)
Total change in net assets $(94,175,848) $(83,126,640)
Net assets
At beginning of period 628,581,652 711,708,292At end of period $534,405,804 $628,581,652
See Notes to Financial Statements
13
Copyright © 2022 www.secdatabase.com. All Rights Reserved.Please Consider the Environment Before Printing This Document

Table of Contents
Financial Statements
FINANCIAL HIGHLIGHTSThe financial highlights table is intended to help you understand the fund's financial performance for the semiannual period and the past5 fiscal years. Certain information reflects financial results for a single fund share. The total returns in the table represent the rate that aninvestor would have earned (or lost) on an investment in the fund share class (assuming reinvestment of all distributions) held for theentire period.
Class ASix months
ended Year ended
2/28/22(unaudited)
8/31/21 8/31/20 8/31/19 8/31/18 8/31/17
Net asset value, beginning of period $22.51 $17.32 $16.28 $15.05 $13.77 $12.56
Income (loss) from investment operations
Net investment income (loss) (d) $0.05 $0.14 $0.18 $0.18 $0.18 $0.16Net realized and unrealized gain (loss) (1.26) 5.22 1.04 1.68 1.47 1.23
Total from investment operations $(1.21) $5.36 $1.22 $1.86 $1.65 $1.39
Less distributions declared to shareholders
From net investment income $(0.05) $(0.17) $(0.16) $(0.17) $(0.18) $(0.15)From net realized gain (1.01) — (0.02) (0.46) (0.19) (0.03)
Total distributions declared to shareholders $(1.06) $(0.17) $(0.18) $(0.63) $(0.37) $(0.18)
Net asset value, end of period (x) $20.24 $22.51 $17.32 $16.28 $15.05 $13.77
Total return (%) (r)(s)(t)(x) (5.68)(n) 31.16 7.64 13.23 12.14 11.18
Ratios (%) (to average net assets)and Supplemental data:
Expenses before expense reductions 0.92(a) 0.92 0.92 1.05 1.16 1.33Expenses after expense reductions 0.89(a) 0.89 0.89 0.89 0.88 1.16Net investment income (loss) 0.45(a)(l) 0.71 1.11 1.22 1.25 1.19Portfolio turnover 20(n) 20 34 28 30 36Net assets at end of period (000 omitted) $162,712 $171,216 $135,199 $85,022 $41,177 $39,568
See Notes to Financial Statements
14
Copyright © 2022 www.secdatabase.com. All Rights Reserved.Please Consider the Environment Before Printing This Document

Table of Contents
Financial Highlights – continued
Class BSix months
ended Year ended
2/28/22(unaudited)
8/31/21 8/31/20 8/31/19 8/31/18 8/31/17
Net asset value, beginning of period $22.46 $17.29 $16.25 $15.02 $13.74 $12.53
Income (loss) from investment operations
Net investment income (loss) (d) $(0.03) $(0.01) $0.06 $0.07 $0.07 $0.06Net realized and unrealized gain (loss) (1.25) 5.22 1.03 1.68 1.47 1.23
Total from investment operations $(1.28) $5.21 $1.09 $1.75 $1.54 $1.29
Less distributions declared to shareholders
From net investment income $— $(0.04) $(0.03) $(0.06) $(0.07) $(0.05)From net realized gain (1.01) — (0.02) (0.46) (0.19) (0.03)
Total distributions declared to shareholders $(1.01) $(0.04) $(0.05) $(0.52) $(0.26) $(0.08)
Net asset value, end of period (x) $20.17 $22.46 $17.29 $16.25 $15.02 $13.74
Total return (%) (r)(s)(t)(x) (6.00)(n) 30.19 6.77 12.41 11.32 10.36
Ratios (%) (to average net assets)and Supplemental data:
Expenses before expense reductions 1.67(a) 1.67 1.67 1.81 1.91 2.08Expenses after expense reductions 1.64(a) 1.64 1.64 1.64 1.64 1.92Net investment income (loss) (0.30)(a)(l) (0.04) 0.35 0.48 0.50 0.43Portfolio turnover 20(n) 20 34 28 30 36Net assets at end of period (000 omitted) $2,200 $2,511 $2,198 $2,558 $2,211 $2,081
See Notes to Financial Statements
15
Copyright © 2022 www.secdatabase.com. All Rights Reserved.Please Consider the Environment Before Printing This Document

Table of Contents
Financial Highlights – continued
Class CSix months
ended Year ended
2/28/22(unaudited)
8/31/21 8/31/20 8/31/19 8/31/18 8/31/17
Net asset value, beginning of period $22.37 $17.22 $16.20 $14.98 $13.70 $12.50
Income (loss) from investment operations
Net investment income (loss) (d) $(0.03) $(0.01) $0.06 $0.07 $0.07 $0.06Net realized and unrealized gain (loss) (1.25) 5.20 1.03 1.67 1.48 1.23
Total from investment operations $(1.28) $5.19 $1.09 $1.74 $1.55 $1.29
Less distributions declared to shareholders
From net investment income $— $(0.04) $(0.05) $(0.06) $(0.08) $(0.06)From net realized gain (1.01) — (0.02) (0.46) (0.19) (0.03)
Total distributions declared to shareholders $(1.01) $(0.04) $(0.07) $(0.52) $(0.27) $(0.09)
Net asset value, end of period (x) $20.08 $22.37 $17.22 $16.20 $14.98 $13.70
Total return (%) (r)(s)(t)(x) (6.03)(n) 30.20 6.75 12.40 11.36 10.36
Ratios (%) (to average net assets)and Supplemental data:
Expenses before expense reductions 1.67(a) 1.67 1.67 1.81 1.91 2.08Expenses after expense reductions 1.64(a) 1.64 1.64 1.64 1.64 1.92Net investment income (loss) (0.30)(a)(l) (0.03) 0.35 0.47 0.50 0.43Portfolio turnover 20(n) 20 34 28 30 36Net assets at end of period (000 omitted) $29,124 $32,839 $29,429 $21,859 $13,942 $12,422
See Notes to Financial Statements
16
Copyright © 2022 www.secdatabase.com. All Rights Reserved.Please Consider the Environment Before Printing This Document

Table of Contents
Financial Highlights – continued
Class ISix months
ended Year ended
2/28/22(unaudited)
8/31/21 8/31/20 8/31/19 8/31/18 8/31/17
Net asset value, beginning of period $22.55 $17.34 $16.31 $15.07 $13.78 $12.57
Income (loss) from investment operations
Net investment income (loss) (d) $0.08 $0.19 $0.22 $0.23 $0.21 $0.19Net realized and unrealized gain (loss) (1.26) 5.23 1.03 1.68 1.49 1.23
Total from investment operations $(1.18) $5.42 $1.25 $1.91 $1.70 $1.42
Less distributions declared to shareholders
From net investment income $(0.08) $(0.21) $(0.20) $(0.21) $(0.22) $(0.18)From net realized gain (1.01) — (0.02) (0.46) (0.19) (0.03)
Total distributions declared to shareholders $(1.09) $(0.21) $(0.22) $(0.67) $(0.41) $(0.21)
Net asset value, end of period (x) $20.28 $22.55 $17.34 $16.31 $15.07 $13.78
Total return (%) (r)(s)(t)(x) (5.56)(n) 31.55 7.82 13.55 12.49 11.44
Ratios (%) (to average net assets)and Supplemental data:
Expenses before expense reductions 0.67(a) 0.67 0.67 0.78 0.91 1.07Expenses after expense reductions 0.64(a) 0.64 0.64 0.64 0.64 0.92Net investment income (loss) 0.70(a)(l) 0.99 1.35 1.46 1.50 1.47Portfolio turnover 20(n) 20 34 28 30 36Net assets at end of period (000 omitted) $259,594 $335,165 $464,428 $246,245 $30,751 $21,814
See Notes to Financial Statements
17
Copyright © 2022 www.secdatabase.com. All Rights Reserved.Please Consider the Environment Before Printing This Document

Table of Contents
Financial Highlights – continued
Class R1Six months
ended Year ended
2/28/22(unaudited)
8/31/21 8/31/20 8/31/19 8/31/18 8/31/17
Net asset value, beginning of period $22.50 $17.33 $16.29 $15.06 $13.77 $12.57
Income (loss) from investment operations
Net investment income (loss) (d) $(0.03) $(0.01) $0.05 $0.07 $0.07 $0.05Net realized and unrealized gain (loss) (1.25) 5.23 1.05 1.68 1.48 1.24
Total from investment operations $(1.28) $5.22 $1.10 $1.75 $1.55 $1.29
Less distributions declared to shareholders
From net investment income $— $(0.05) $(0.04) $(0.06) $(0.07) $(0.06)From net realized gain (1.01) — (0.02) (0.46) (0.19) (0.03)
Total distributions declared to shareholders $(1.01) $(0.05) $(0.06) $(0.52) $(0.26) $(0.09)
Net asset value, end of period (x) $20.21 $22.50 $17.33 $16.29 $15.06 $13.77
Total return (%) (r)(s)(t)(x) (5.99)(n) 30.18 6.79 12.37 11.36 10.33
Ratios (%) (to average net assets)and Supplemental data:
Expenses before expense reductions 1.67(a) 1.67 1.67 1.81 1.91 2.07Expenses after expense reductions 1.64(a) 1.64 1.64 1.64 1.64 1.91Net investment income (loss) (0.31)(a)(l) (0.07) 0.34 0.48 0.49 0.41Portfolio turnover 20(n) 20 34 28 30 36Net assets at end of period (000 omitted) $542 $683 $340 $164 $136 $108
See Notes to Financial Statements
18
Copyright © 2022 www.secdatabase.com. All Rights Reserved.Please Consider the Environment Before Printing This Document

Table of Contents
Financial Highlights – continued
Class R2Six months
ended Year ended
2/28/22(unaudited)
8/31/21 8/31/20 8/31/19 8/31/18 8/31/17
Net asset value, beginning of period $22.61 $17.39 $16.36 $15.12 $13.83 $12.61
Income (loss) from investment operations
Net investment income (loss) (d) $0.02 $0.09 $0.14 $0.15 $0.14 $0.12Net realized and unrealized gain (loss) (1.26) 5.25 1.04 1.68 1.49 1.25
Total from investment operations $(1.24) $5.34 $1.18 $1.83 $1.63 $1.37
Less distributions declared to shareholders
From net investment income $(0.03) $(0.12) $(0.13) $(0.13) $(0.15) $(0.12)From net realized gain (1.01) — (0.02) (0.46) (0.19) (0.03)
Total distributions declared to shareholders $(1.04) $(0.12) $(0.15) $(0.59) $(0.34) $(0.15)
Net asset value, end of period (x) $20.33 $22.61 $17.39 $16.36 $15.12 $13.83
Total return (%) (r)(s)(t)(x) (5.81)(n) 30.88 7.29 12.94 11.93 10.93
Ratios (%) (to average net assets)and Supplemental data:
Expenses before expense reductions 1.17(a) 1.17 1.17 1.30 1.42 1.58Expenses after expense reductions 1.14(a) 1.14 1.14 1.14 1.14 1.42Net investment income (loss) 0.19(a)(l) 0.45 0.86 0.98 1.01 0.91Portfolio turnover 20(n) 20 34 28 30 36Net assets at end of period (000 omitted) $505 $742 $531 $368 $156 $74
See Notes to Financial Statements
19
Copyright © 2022 www.secdatabase.com. All Rights Reserved.Please Consider the Environment Before Printing This Document

Table of Contents
Financial Highlights – continued
Class R3Six months
ended Year ended
2/28/22(unaudited)
8/31/21 8/31/20 8/31/19 8/31/18 8/31/17
Net asset value, beginning of period $22.59 $17.38 $16.34 $15.10 $13.81 $12.59
Income (loss) from investment operations
Net investment income (loss) (d) $0.05 $0.14 $0.18 $0.19 $0.18 $0.15Net realized and unrealized gain (loss) (1.26) 5.24 1.05 1.68 1.48 1.25
Total from investment operations $(1.21) $5.38 $1.23 $1.87 $1.66 $1.40
Less distributions declared to shareholders
From net investment income $(0.05) $(0.17) $(0.17) $(0.17) $(0.18) $(0.15)From net realized gain (1.01) — (0.02) (0.46) (0.19) (0.03)
Total distributions declared to shareholders $(1.06) $(0.17) $(0.19) $(0.63) $(0.37) $(0.18)
Net asset value, end of period (x) $20.32 $22.59 $17.38 $16.34 $15.10 $13.81
Total return (%) (r)(s)(t)(x) (5.66)(n) 31.17 7.65 13.24 12.18 11.22
Ratios (%) (to average net assets)and Supplemental data:
Expenses before expense reductions 0.92(a) 0.92 0.93 1.05 1.16 1.33Expenses after expense reductions 0.89(a) 0.89 0.89 0.89 0.89 1.17Net investment income (loss) 0.46(a)(l) 0.70 1.15 1.22 1.25 1.18Portfolio turnover 20(n) 20 34 28 30 36Net assets at end of period (000 omitted) $702 $786 $573 $100 $67 $59
See Notes to Financial Statements
20
Copyright © 2022 www.secdatabase.com. All Rights Reserved.Please Consider the Environment Before Printing This Document

Table of Contents
Financial Highlights – continued
Class R4Six months
ended Year ended
2/28/22(unaudited)
8/31/21 8/31/20 8/31/19 8/31/18 8/31/17
Net asset value, beginning of period $22.56 $17.36 $16.32 $15.08 $13.79 $12.58
Income (loss) from investment operations
Net investment income (loss) (d) $0.08 $0.18 $0.22 $0.22 $0.21 $0.19Net realized and unrealized gain (loss) (1.26) 5.23 1.04 1.69 1.49 1.23
Total from investment operations $(1.18) $5.41 $1.26 $1.91 $1.70 $1.42
Less distributions declared to shareholders
From net investment income $(0.08) $(0.21) $(0.20) $(0.21) $(0.22) $(0.18)From net realized gain (1.01) — (0.02) (0.46) (0.19) (0.03)
Total distributions declared to shareholders $(1.09) $(0.21) $(0.22) $(0.67) $(0.41) $(0.21)
Net asset value, end of period (x) $20.29 $22.56 $17.36 $16.32 $15.08 $13.79
Total return (%) (r)(s)(t)(x) (5.56)(n) 31.47 7.87 13.53 12.48 11.42
Ratios (%) (to average net assets)and Supplemental data:
Expenses before expense reductions 0.67(a) 0.66 0.67 0.81 0.91 1.08Expenses after expense reductions 0.64(a) 0.64 0.64 0.64 0.64 0.92Net investment income (loss) 0.70(a)(l) 0.96 1.35 1.48 1.50 1.42Portfolio turnover 20(n) 20 34 28 30 36Net assets at end of period (000 omitted) $101 $107 $81 $75 $66 $59
See Notes to Financial Statements
21
Copyright © 2022 www.secdatabase.com. All Rights Reserved.Please Consider the Environment Before Printing This Document

Table of Contents
Financial Highlights – continued
Class R6Six months
ended Year ended
2/28/22(unaudited)
8/31/21 8/31/20 8/31/19 8/31/18 8/31/17
Net asset value, beginning of period $22.57 $17.37 $16.32 $15.09 $13.80 $12.58
Income (loss) from investment operations
Net investment income (loss) (d) $0.09 $0.20 $0.23 $0.23 $0.23 $0.18Net realized and unrealized gain (loss) (1.26) 5.23 1.05 1.68 1.48 1.27
Total from investment operations $(1.17) $5.43 $1.28 $1.91 $1.71 $1.45
Less distributions declared to shareholders
From net investment income $(0.09) $(0.23) $(0.21) $(0.22) $(0.23) $(0.20)From net realized gain (1.01) — (0.02) (0.46) (0.19) (0.03)
Total distributions declared to shareholders $(1.10) $(0.23) $(0.23) $(0.68) $(0.42) $(0.23)
Net asset value, end of period (x) $20.30 $22.57 $17.37 $16.32 $15.09 $13.80
Total return (%) (r)(s)(t)(x) (5.51)(n) 31.57 8.02 13.56 12.57 11.61
Ratios (%) (to average net assets)and Supplemental data:
Expenses before expense reductions 0.58(a) 0.58 0.59 0.71 0.82 0.97Expenses after expense reductions 0.55(a) 0.55 0.56 0.56 0.54 0.78Net investment income (loss) 0.79(a)(l) 1.06 1.45 1.53 1.60 1.38Portfolio turnover 20(n) 20 34 28 30 36Net assets at end of period (000 omitted) $78,926 $84,532 $78,929 $31,283 $8,632 $6,515
(a) Annualized.(d) Per share data is based on average shares outstanding.(l) The net investment income ratio does not vary by the class specific expense differential because of the timing of sales of fund shares and the
allocation of fund level income at such time.(n) Not annualized.(r) Certain expenses have been reduced without which performance would have been lower.(s) From time to time the fund may receive proceeds from litigation settlements, without which performance would be lower.(t) Total returns do not include any applicable sales charges.(x) The net asset values and total returns have been calculated on net assets which include adjustments made in accordance with U.S. generally
accepted accounting principles required at period end for financial reporting purposes.
See Notes to Financial Statements
22
Copyright © 2022 www.secdatabase.com. All Rights Reserved.Please Consider the Environment Before Printing This Document

Table of Contents
NOTES TO FINANCIAL STATEMENTS(unaudited)
(1) Business and OrganizationMFS Low Volatility Equity Fund (the fund) is a diversified series of MFS Series Trust I (the trust). The trust is organized as aMassachusetts business trust and is registered under the Investment Company Act of 1940, as amended, as an open-end managementinvestment company.
The fund is an investment company and accordingly follows the investment company accounting and reporting guidance of the FinancialAccounting Standards Board (FASB) Accounting Standards Codification Topic 946 Financial Services - Investment Companies.
(2) Significant Accounting PoliciesGeneral — The preparation of financial statements in conformity with U.S. generally accepted accounting principles requiresmanagement to make estimates and assumptions that affect the reported amounts of assets and liabilities, and disclosure ofcontingent assets and liabilities at the date of the financial statements and the reported amounts of increases and decreases innet assets from operations during the reporting period. Actual results could differ from those estimates. In the preparation ofthese financial statements, management has evaluated subsequent events occurring after the date of the fund’s Statement ofAssets and Liabilities through the date that the financial statements were issued.Balance Sheet Offsetting — The fund's accounting policy with respect to balance sheet offsetting is that, absent an event ofdefault by the counterparty or a termination of the agreement, the International Swaps and Derivatives Association (ISDA)Master Agreement, or similar agreement, does not result in an offset of reported amounts of financial assets and financialliabilities in the Statement of Assets and Liabilities across transactions between the fund and the applicable counterparty. Thefund's right to setoff may be restricted or prohibited by the bankruptcy or insolvency laws of the particular jurisdiction to whicha specific master netting agreement counterparty is subject. Balance sheet offsetting disclosures, to the extent applicable tothe fund, have been included in the fund’s Significant Accounting Policies note under the captions for each of the fund’s in-scope financial instruments and transactions.Investment Valuations — Equity securities, including restricted equity securities, are generally valued at the last sale or officialclosing price on their primary market or exchange as provided by a third-party pricing service. Equity securities, for whichthere were no sales reported that day, are generally valued at the last quoted daily bid quotation on their primary market orexchange as provided by a third-party pricing service. Short-term instruments with a maturity at issuance of 60 days or lessmay be valued at amortized cost, which approximates market value. Open-end investment companies are generally valued atnet asset value per share. Securities and other assets generally valued on the basis of information from a third-party pricingservice may also be valued at a broker/dealer bid quotation. In determining values, third-party pricing services can utilize bothtransaction data and market information such as yield, quality, coupon rate, maturity, type of issue, trading characteristics, andother market data.The Board of Trustees has delegated primary responsibility for determining or causing to be determined the value of the fund’sinvestments (including any fair valuation) to the adviser pursuant to valuation policies and procedures approved by the Board. If the
23
Copyright © 2022 www.secdatabase.com. All Rights Reserved.Please Consider the Environment Before Printing This Document

Table of Contents
Notes to Financial Statements (unaudited) - continued
adviser determines that reliable market quotations are not readily available, investments are valued at fair value as determined in goodfaith by the adviser in accordance with such procedures under the oversight of the Board of Trustees. Under the fund’s valuation policiesand procedures, market quotations are not considered to be readily available for most types of debt instruments and floating rate loansand many types of derivatives. These investments are generally valued at fair value based on information from third-party pricingservices. In addition, investments may be valued at fair value if the adviser determines that an investment’s value has been materiallyaffected by events occurring after the close of the exchange or market on which the investment is principally traded (such as foreignexchange or market) and prior to the determination of the fund’s net asset value, or after the halt of trading of a specific security wheretrading does not resume prior to the close of the exchange or market on which the security is principally traded. Events that occur afterforeign markets close (such as developments in foreign markets and significant movements in the U.S. markets) and prior to thedetermination of the fund’s net asset value may be deemed to have a material effect on the value of securities traded in foreign markets.Accordingly, the fund’s foreign equity securities may often be valued at fair value. The adviser generally relies on third-party pricingservices or other information (such as the correlation with price movements of similar securities in the same or other markets; the type,cost and investment characteristics of the security; the business and financial condition of the issuer; and trading and other market data)to assist in determining whether to fair value and at what value to fair value an investment. The value of an investment for purposes ofcalculating the fund’s net asset value can differ depending on the source and method used to determine value. When fair valuation isused, the value of an investment used to determine the fund’s net asset value may differ from quoted or published prices for the sameinvestment. There can be no assurance that the fund could obtain the fair value assigned to an investment if it were to sell the investmentat the same time at which the fund determines its net asset value per share.
Various inputs are used in determining the value of the fund's assets or liabilities. These inputs are categorized into three broad levels. Incertain cases, the inputs used to measure fair value may fall into different levels of the fair value hierarchy. In such cases, an investment'slevel within the fair value hierarchy is based on the lowest level of input that is significant to the fair value measurement. The fund'sassessment of the significance of a particular input to the fair value measurement in its entirety requires judgment, and considers factorsspecific to the investment. Level 1 includes unadjusted quoted prices in active markets for identical assets or liabilities. Level 2 includesother significant observable market-based inputs (including quoted prices for similar securities, interest rates, prepayment speed, andcredit risk). Level 3 includes unobservable inputs, which may include the adviser's own assumptions in determining the fair value ofinvestments. The following is a summary of the levels used as of February 28, 2022 in valuing the fund's assets and liabilities:
Financial Instruments Level 1 Level 2 Level 3 TotalEquity Securities $532,061,909 $— $— $532,061,909Mutual Funds 1,772,061 — — 1,772,061
Total $533,833,970 $— $— $533,833,970
For further information regarding security characteristics, see the Portfolio of Investments.
24
Copyright © 2022 www.secdatabase.com. All Rights Reserved.Please Consider the Environment Before Printing This Document

Table of Contents
Notes to Financial Statements (unaudited) - continued
Indemnifications — Under the fund's organizational documents, its officers and Trustees may be indemnified against certainliabilities and expenses arising out of the performance of their duties to the fund. Additionally, in the normal course ofbusiness, the fund enters into agreements with service providers that may contain indemnification clauses. The fund'smaximum exposure under these agreements is unknown as this would involve future claims that may be made against the fundthat have not yet occurred.Investment Transactions and Income — Investment transactions are recorded on the trade date. Dividends received in cash arerecorded on the ex-dividend date. Certain dividends from foreign securities will be recorded when the fund is informed of thedividend if such information is obtained subsequent to the ex-dividend date. Dividend payments received in additionalsecurities are recorded on the ex-dividend date in an amount equal to the value of the security on such date. In determining thenet gain or loss on securities sold, the cost of securities is determined on the identified cost basis.The fund may receive proceeds from litigation settlements. Any proceeds received from litigation involving portfolio holdings are reflectedin the Statement of Operations in realized gain/loss if the security has been disposed of by the fund or in unrealized gain/loss if thesecurity is still held by the fund. Any other proceeds from litigation not related to portfolio holdings are reflected as other income in theStatement of Operations.
Tax Matters and Distributions — The fund intends to qualify as a regulated investment company, as defined under SubchapterM of the Internal Revenue Code, and to distribute all of its taxable income, including realized capital gains. As a result, noprovision for federal income tax is required. The fund’s federal tax returns, when filed, will remain subject to examination by theInternal Revenue Service for a three year period. Management has analyzed the fund’s tax positions taken on federal and statetax returns for all open tax years and does not believe that there are any uncertain tax positions that require recognition of a taxliability. Foreign taxes, if any, have been accrued by the fund in the accompanying financial statements in accordance with theapplicable foreign tax law. Foreign income taxes may be withheld by certain countries in which the fund invests. Additionally,capital gains realized by the fund on securities issued in or by certain foreign countries may be subject to capital gains taximposed by those countries.Distributions to shareholders are recorded on the ex-dividend date. Income and capital gain distributions are determined in accordancewith income tax regulations, which may differ from U.S. generally accepted accounting principles. Certain capital accounts in the financialstatements are periodically adjusted for permanent differences in order to reflect their tax character. These adjustments have no impacton net assets or net asset value per share. Temporary differences which arise from recognizing certain items of income, expense, gain orloss in different periods for financial statement and tax purposes will reverse at some time in the future.
Book/tax differences primarily relate to wash sale loss deferrals and treating a portion of the proceeds from redemptions as a distributionfor tax purposes.
25
Copyright © 2022 www.secdatabase.com. All Rights Reserved.Please Consider the Environment Before Printing This Document

Table of Contents
Notes to Financial Statements (unaudited) - continued
The tax character of distributions made during the current period will be determined at fiscal year end. The tax character of distributionsdeclared to shareholders for the last fiscal year is as follows:
Year ended8/31/21
Ordinary income (including any short-term capital gains) $6,341,771
The federal tax cost and the tax basis components of distributable earnings were as follows:
As of 2/28/22Cost of investments $387,186,047
Gross appreciation 151,167,858Gross depreciation (4,519,935)
Net unrealized appreciation (depreciation) $146,647,923As of 8/31/21Undistributed ordinary income 418,493Undistributed long-term capital gain 19,034,760Other temporary differences 7Net unrealized appreciation (depreciation) 219,379,111
The aggregate cost above includes prior fiscal year end tax adjustments, if applicable.
Multiple Classes of Shares of Beneficial Interest — The fund offers multiple classes of shares, which differ in their respectivedistribution and service fees. The fund's income, realized and unrealized gain (loss), and common expenses are allocated toshareholders based on the daily net assets of each class. Dividends are declared separately for each class. Differences in pershare dividend rates are generally due to differences in separate class expenses. Class B and Class C shares will convert toClass A shares approximately eight years after purchase. The fund’s distributions declared to shareholders as reported in theStatements of Changes in Net Assets are presented by class as follows:
Six monthsended2/28/22
Yearended8/31/21
Class A $8,193,614 $1,273,579Class B 112,446 4,711Class C 1,444,870 67,219Class I 15,543,537 4,015,188Class R1 29,927 1,078Class R2 35,914 3,771Class R3 35,889 5,668Class R4 5,168 1,005Class R6 4,075,916 969,552
Total $29,477,281 $6,341,771
26
Copyright © 2022 www.secdatabase.com. All Rights Reserved.Please Consider the Environment Before Printing This Document

Table of Contents
Notes to Financial Statements (unaudited) - continued
(3) Transactions with AffiliatesInvestment Adviser — The fund has an investment advisory agreement with MFS to provide overall investment managementand related administrative services and facilities to the fund. The management fee is computed daily and paid monthly at thefollowing annual rates based on the fund's average daily net assets:
Up to $1 billion 0.50%In excess of $1 billion and up to $2.5 billion 0.475%In excess of $2.5 billion 0.45%
MFS has agreed in writing to reduce its management fee by a specified amount if certain MFS mutual fund assets exceed thresholdsagreed to by MFS and the fund's Board of Trustees. For the six months ended February 28, 2022, this management fee reductionamounted to $41,403, which is included in the reduction of total expenses in the Statement of Operations. The management fee incurredfor the six months ended February 28, 2022 was equivalent to an annual effective rate of 0.49% of the fund's average daily net assets.
The investment adviser has agreed in writing to pay a portion of the fund’s total annual operating expenses, excluding interest, taxes,extraordinary expenses, brokerage and transaction costs, and investment-related expenses, such that total fund operating expenses donot exceed the following rates annually of each class’s average daily net assets:
Classes
A B C I R1 R2 R3 R4 R60.89% 1.64% 1.64% 0.64% 1.64% 1.14% 0.89% 0.64% 0.57%
This written agreement will continue until modified by the fund’s Board of Trustees, but such agreement will continue at least untilDecember 31, 2022. For the six months ended February 28, 2022, this reduction amounted to $39,003, which is included in the reductionof total expenses in the Statement of Operations.
Distributor — MFS Fund Distributors, Inc. (MFD), a wholly-owned subsidiary of MFS, as distributor, received $26,496 for the sixmonths ended February 28, 2022, as its portion of the initial sales charge on sales of Class A shares of the fund.The Board of Trustees has adopted a distribution plan for certain share classes pursuant to Rule 12b-1 of the Investment Company Act of1940.
The fund's distribution plan provides that the fund will pay MFD for services provided by MFD and financial intermediaries in connectionwith the distribution and servicing of certain share classes. One component of the plan is a distribution fee paid to MFD and anothercomponent of the plan is a service fee paid to MFD. MFD may subsequently pay all, or a portion, of the distribution and/or service fees tofinancial intermediaries.
27
Copyright © 2022 www.secdatabase.com. All Rights Reserved.Please Consider the Environment Before Printing This Document

Table of Contents
Notes to Financial Statements (unaudited) - continued
Distribution Plan Fee Table:
DistributionFee Rate (d)
ServiceFee Rate (d)
TotalDistribution
Plan (d)
AnnualEffectiveRate (e)
Distributionand Service
Fee
Class A — 0.25% 0.25% 0.25% $ 210,649
Class B 0.75% 0.25% 1.00% 1.00% 12,045
Class C 0.75% 0.25% 1.00% 1.00% 156,401
Class R1 0.75% 0.25% 1.00% 1.00% 3,179
Class R2 0.25% 0.25% 0.50% 0.50% 1,740
Class R3 — 0.25% 0.25% 0.25% 943
Total Distribution and ServiceFees $384,957
(d) In accordance with the distribution plan for certain classes, the fund pays distribution and/or service fees equal to these annual percentage rates ofeach class’s average daily net assets. The distribution and service fee rates disclosed by class represent the current rates in effect at the endof the reporting period. Any rate changes, if applicable, are detailed below.
(e) The annual effective rates represent actual fees incurred under the distribution plan for the six months ended February 28, 2022 based on eachclass's average daily net assets. MFD has voluntarily agreed to rebate a portion of each class's 0.25% service fee attributable to accounts forwhich there is no financial intermediary specified on the account except for accounts attributable to MFS or its affiliates' seed money. For thesix months ended February 28, 2022, this rebate amounted to $26 and $6 for Class A and Class C, respectively, and is included in thereduction of total expenses in the Statement of Operations.
Certain Class A shares are subject to a contingent deferred sales charge (CDSC) in the event of a shareholder redemption within 18months of purchase. Class B shares are subject to a CDSC in the event of a shareholder redemption within six years of purchase. ClassC shares are subject to a CDSC in the event of a shareholder redemption within 12 months of purchase. All contingent deferred salescharges are paid to MFD and during the six months ended February 28, 2022, were as follows:
AmountClass A $198Class B 519Class C 715
Shareholder Servicing Agent — MFS Service Center, Inc. (MFSC), a wholly-owned subsidiary of MFS, receives a fee from thefund for its services as shareholder servicing agent calculated as a percentage of the average daily net assets of the fund asdetermined periodically under the supervision of the fund's Board of Trustees. For the six months ended February 28, 2022, thefee was $12,275, which equated to 0.0041% annually of the fund's average daily net assets. MFSC also receives reimbursementfrom the fund for out-of-pocket expenses, sub-accounting and other shareholder servicing costs which may be paid to affiliatedand unaffiliated service providers. Class R6 shares do not incur sub-accounting fees. For the six months ended February 28,2022, these out-of-pocket expenses, sub-accounting and other shareholder servicing costs amounted to $243,772.Administrator — MFS provides certain financial, legal, shareholder communications, compliance, and other administrativeservices to the fund. Under an administrative services agreement, the fund reimburses MFS the costs incurred to provide these
28
Copyright © 2022 www.secdatabase.com. All Rights Reserved.Please Consider the Environment Before Printing This Document
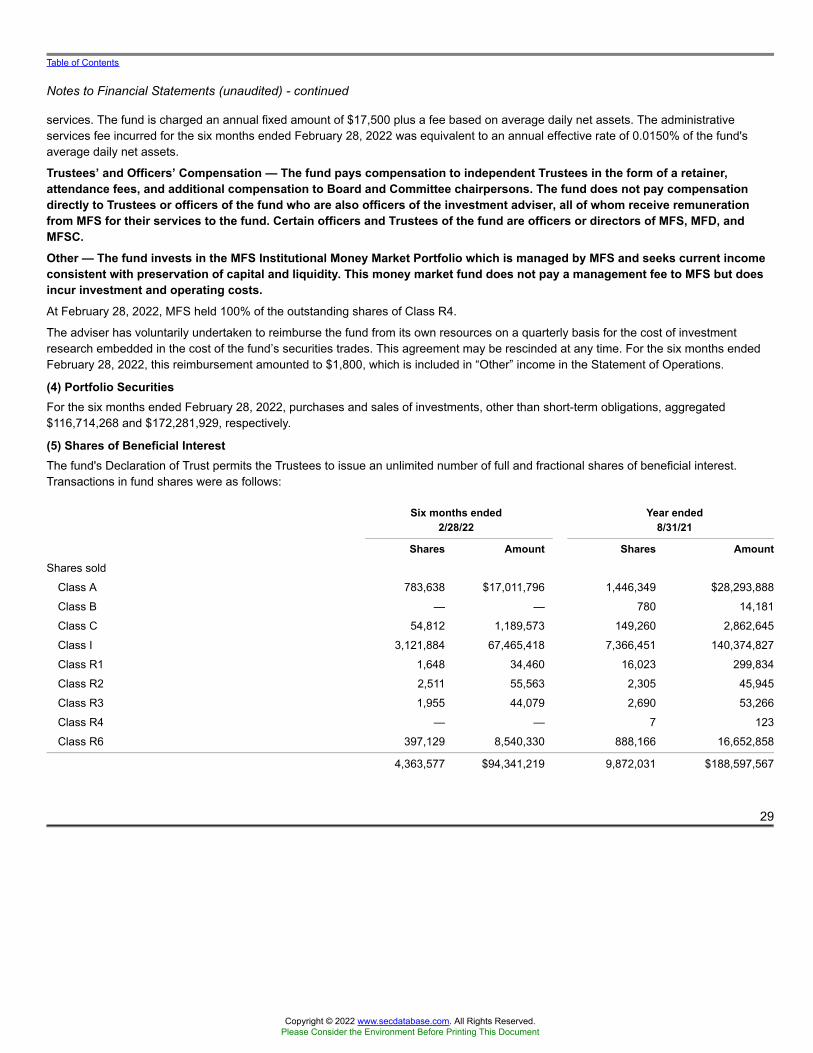
Table of Contents
Notes to Financial Statements (unaudited) - continued
services. The fund is charged an annual fixed amount of $17,500 plus a fee based on average daily net assets. The administrativeservices fee incurred for the six months ended February 28, 2022 was equivalent to an annual effective rate of 0.0150% of the fund'saverage daily net assets.
Trustees’ and Officers’ Compensation — The fund pays compensation to independent Trustees in the form of a retainer,attendance fees, and additional compensation to Board and Committee chairpersons. The fund does not pay compensationdirectly to Trustees or officers of the fund who are also officers of the investment adviser, all of whom receive remunerationfrom MFS for their services to the fund. Certain officers and Trustees of the fund are officers or directors of MFS, MFD, andMFSC.Other — The fund invests in the MFS Institutional Money Market Portfolio which is managed by MFS and seeks current incomeconsistent with preservation of capital and liquidity. This money market fund does not pay a management fee to MFS but doesincur investment and operating costs.At February 28, 2022, MFS held 100% of the outstanding shares of Class R4.
The adviser has voluntarily undertaken to reimburse the fund from its own resources on a quarterly basis for the cost of investmentresearch embedded in the cost of the fund’s securities trades. This agreement may be rescinded at any time. For the six months endedFebruary 28, 2022, this reimbursement amounted to $1,800, which is included in “Other” income in the Statement of Operations.
(4) Portfolio SecuritiesFor the six months ended February 28, 2022, purchases and sales of investments, other than short-term obligations, aggregated$116,714,268 and $172,281,929, respectively.
(5) Shares of Beneficial InterestThe fund's Declaration of Trust permits the Trustees to issue an unlimited number of full and fractional shares of beneficial interest.Transactions in fund shares were as follows:
Six months ended2/28/22
Year ended8/31/21
Shares Amount Shares Amount
Shares sold
Class A 783,638 $17,011,796 1,446,349 $28,293,888
Class B — — 780 14,181
Class C 54,812 1,189,573 149,260 2,862,645
Class I 3,121,884 67,465,418 7,366,451 140,374,827
Class R1 1,648 34,460 16,023 299,834
Class R2 2,511 55,563 2,305 45,945
Class R3 1,955 44,079 2,690 53,266
Class R4 — — 7 123
Class R6 397,129 8,540,330 888,166 16,652,858
4,363,577 $94,341,219 9,872,031 $188,597,567
29
Copyright © 2022 www.secdatabase.com. All Rights Reserved.Please Consider the Environment Before Printing This Document

Table of Contents
Notes to Financial Statements (unaudited) - continued
Six months ended2/28/22
Year ended8/31/21
Shares Amount Shares Amount
Shares issued to shareholdersin reinvestment of distributions
Class A 376,146 $8,186,925 69,426 $1,272,856
Class B 5,179 112,446 263 4,711
Class C 66,811 1,444,445 3,757 67,173
Class I 489,938 10,675,179 222,072 4,012,372
Class R1 1,376 29,927 60 1,078
Class R2 1,643 35,914 205 3,771
Class R3 1,644 35,889 307 5,668
Class R4 228 4,996 55 1,005
Class R6 183,567 4,003,424 51,135 939,815
1,126,532 $24,529,145 347,280 $6,308,449
Shares reacquired
Class A (727,633) $(15,681,893) (1,715,939) $(32,744,101)
Class B (7,918) (166,575) (16,332) (302,187)
Class C (139,283) (2,989,066) (393,734) (7,379,328)
Class I (5,674,901) (119,655,431) (19,501,281) (361,829,953)
Class R1 (6,559) (135,178) (5,334) (102,212)
Class R2 (12,145) (252,852) (209) (4,462)
Class R3 (3,826) (85,016) (1,200) (23,867)
Class R6 (438,108) (9,509,107) (1,739,204) (32,800,436)
(7,010,373) $(148,475,118) (23,373,233) $(435,186,546)
Net change
Class A 432,151 $9,516,828 (200,164) $(3,177,357)
Class B (2,739) (54,129) (15,289) (283,295)
Class C (17,660) (355,048) (240,717) (4,449,510)
Class I (2,063,079) (41,514,834) (11,912,758) (217,442,754)
Class R1 (3,535) (70,791) 10,749 198,700
Class R2 (7,991) (161,375) 2,301 45,254
Class R3 (227) (5,048) 1,797 35,067
Class R4 228 4,996 62 1,128
Class R6 142,588 3,034,647 (799,903) (15,207,763)
(1,520,264) $(29,604,754) (13,153,922) $(240,280,530)
Effective June 1, 2019, purchases of the fund’s Class B shares are closed to new and existing investors subject to certain exceptions.Please see the fund’s prospectus for details.
30
Copyright © 2022 www.secdatabase.com. All Rights Reserved.Please Consider the Environment Before Printing This Document

Table of Contents
Notes to Financial Statements (unaudited) - continued
(6) Line of CreditThe fund and certain other funds managed by MFS participate in a $1.25 billion unsecured committed line of credit of which $1 billion isreserved for use by the fund and certain other MFS U.S. funds. The line of credit is provided by a syndicate of banks under a creditagreement. Borrowings may be made for temporary financing needs. Interest is charged to each fund, based on its borrowings, generallyat a rate equal to the highest of one month LIBOR, the Federal Funds Effective Rate and the Overnight Bank Funding Rate, plus anagreed upon spread. A commitment fee, based on the average daily, unused portion of the committed line of credit, is allocated amongthe participating funds. In addition, the fund and other funds managed by MFS have established unsecured uncommitted borrowingarrangements with certain banks for temporary financing needs. Interest is charged to each fund, based on its borrowings, at rates equalto customary reference rates plus an agreed upon spread. For the six months ended February 28, 2022, the fund’s commitment fee andinterest expense were $1,034 and $0, respectively, and are included in “Miscellaneous” expense in the Statement of Operations.
(7) Investments in Affiliated IssuersAn affiliated issuer may be considered one in which the fund owns 5% or more of the outstanding voting securities, or a company whichis under common control. For the purposes of this report, the following were affiliated issuers:
Affiliated IssuersBeginning
Value PurchasesSales
Proceeds
RealizedGain
(Loss)
Change inUnrealized
Appreciation orDepreciation
EndingValue
MFS Institutional Money MarketPortfolio $6,858,031 $63,230,076 $68,316,046 $— $— $1,772,061
Affiliated IssuersDividend
IncomeCapital Gain
Distributions
MFS Institutional Money Market Portfolio $867 $—
(8) Impacts of COVID-19The pandemic related to the global spread of novel coronavirus disease (COVID-19), which was first detected in December 2019, hasresulted in significant disruptions to global business activity and the global economy, as well as the economies of individual countries, thefinancial performance of individual companies and sectors, and the securities and commodities markets in general. Multiple surges incases globally, the availability and widespread adoption of vaccines, and the emergence of variant strains of the virus continue to createuncertainty as to the future and long-term impacts resulting from the pandemic including impacts to the prices and liquidity of the fund'sinvestments and the fund's performance.
(9) LIBOR TransitionCertain of the fund's investments, including investments in certain debt instruments and derivatives (if any), as well as borrowings by thefund and certain other contractual arrangements of the fund, may be based on the London Interbank Offered Rate (“LIBOR”). In 2017, theregulatory authority that oversees financial services firms in the
31
Copyright © 2022 www.secdatabase.com. All Rights Reserved.Please Consider the Environment Before Printing This Document

Table of Contents
Notes to Financial Statements (unaudited) - continued
United Kingdom announced plans to transition away from LIBOR by the end of 2021. In March 2021, the administrator of LIBORannounced the extension of the publication of the more commonly used U.S. dollar LIBOR settings to the end of June 2023. Although thefull impacts of the transition away from LIBOR are not fully known, the transition may result in, among other things, an increase involatility or illiquidity of the markets for instruments that currently rely on LIBOR to determine interest rates and this could have anadverse impact on the fund's performance. With respect to the fund's accounting for investments, including investments in certain debtinstruments and derivatives, as well as borrowings by the fund and any other contractual arrangements of the fund that undergoreference rate-related modifications as a result of the transition, management will rely upon the relief provided by FASB Codification Topic848 – Reference Rate Reform (Topic 848). The guidance in Topic 848 permits the fund to account for those modified contracts as acontinuation of the existing contracts. Management is still evaluating the impact to the fund of the June 30, 2023 planned discontinuationof the more commonly used U.S. dollar LIBOR settings.
(10) Russia and Ukraine ConflictThe market disruptions, which began in late February 2022, associated with geopolitical events related to the conflict between Russiaand Ukraine may adversely affect the value of the fund’s assets and thus the fund’s performance. Management continues to monitorthese events and to evaluate the related impacts, if any, to the fund.
32
Copyright © 2022 www.secdatabase.com. All Rights Reserved.Please Consider the Environment Before Printing This Document

Table of Contents
PROXY VOTING POLICIES AND INFORMATION
MFS votes proxies on behalf of the fund pursuant to proxy voting policies and procedures that are available without charge, uponrequest, by calling 1-800-225-2606, by visiting mfs.com/proxyvoting, or by visiting the SEC’s Web site at http://www.sec.gov.
Information regarding how the fund voted proxies relating to portfolio securities during the most recent twelve-month period ended June30 is available by August 31 of each year without charge by visiting mfs.com/proxyvoting, or by visiting the SEC’s Web site athttp://www.sec.gov.
QUARTERLY PORTFOLIO DISCLOSURE
The fund files a complete schedule of portfolio holdings with the SEC for the first and third quarters of each fiscal year as an exhibit to itsreports on Form N-PORT. The fund's Form N-PORT reports are available on the SEC's Web site at http://www.sec.gov. A shareholdercan obtain the portfolio holdings report for the first and third quarters of the fund's fiscal year at mfs.com/openendfunds by choosing thefund's name and then scrolling to the “Resources” section and clicking on the “Prospectus and Reports” tab.
FURTHER INFORMATION
From time to time, MFS may post important information about the fund or the MFS Funds on the MFS Web site (mfs.com). Thisinformation is available at https://www.mfs.com/announcements or at mfs.com/openendfunds by choosing the fund’s name and thenscrolling to the “Resources” section and clicking on the “Announcements” tab, if any.
INFORMATION ABOUT FUND CONTRACTS AND LEGAL CLAIMS
The fund has entered into contractual arrangements with an investment adviser, administrator, distributor, shareholder servicing agent,529 program manager (if applicable), and custodian who each provide services to the fund. Unless expressly stated otherwise,shareholders are not parties to, or intended beneficiaries of these contractual arrangements, and these contractual arrangements are notintended to create any shareholder right to enforce them against the service providers or to seek any remedy under them against theservice providers, either directly or on behalf of the fund.
Under the Trust’s By-Laws and Declaration of Trust, any claims asserted against or on behalf of the MFS Funds, including claims againstTrustees and Officers, must be brought in state and federal courts located within the Commonwealth of Massachusetts.
PROVISION OF FINANCIAL REPORTS AND SUMMARY PROSPECTUSES
The fund produces financial reports every six months and updates its summary prospectus and prospectus annually. To avoid sendingduplicate copies of materials to households, only one copy of the fund’s annual and semiannual report and summary prospectus may bemailed to shareholders having the same last name and residential address on the fund’s records. However, any shareholder may contactMFSC (please see back cover for address and telephone number) to request that copies of these reports and summary prospectuses besent personally to that shareholder.
33
Copyright © 2022 www.secdatabase.com. All Rights Reserved.Please Consider the Environment Before Printing This Document

Table of Contents
Copyright © 2022 www.secdatabase.com. All Rights Reserved.Please Consider the Environment Before Printing This Document

Table of Contents
Copyright © 2022 www.secdatabase.com. All Rights Reserved.Please Consider the Environment Before Printing This Document

Table of Contents
Save paper with eDelivery.
MFS® will send you prospectuses,reports, and proxies directly via e-mailso you will get information faster withless mailbox clutter.
To sign up:
CONTACTWEB SITEmfs.com
MFS TALK1-800-637-825524 hours a day
ACCOUNT SERVICE AND LITERATURE
Copyright © 2022 www.secdatabase.com. All Rights Reserved.Please Consider the Environment Before Printing This Document

1. Go to mfs.com.
2. Log in via MFS® Access.3. Select eDelivery.
If you own your MFS fund shares through a financial
institution or a retirement plan, MFS® TALK, MFS®
Access, or eDelivery may not be available to you.
Shareholders1-800-225-2606
Financial advisors1-800-343-2829
Retirement plan services1-800-637-1255
MAILING ADDRESSMFS Service Center, Inc.P.O. Box 219341Kansas City, MO 64121-9341
OVERNIGHT MAILMFS Service Center, Inc.Suite 219341430 W 7th StreetKansas City, MO 64105-1407
Copyright © 2022 www.secdatabase.com. All Rights Reserved.Please Consider the Environment Before Printing This Document

Semiannual ReportFebruary 28, 2022
MFS® New Discovery Fund
NDF-SEM
Copyright © 2022 www.secdatabase.com. All Rights Reserved.Please Consider the Environment Before Printing This Document

Copyright © 2022 www.secdatabase.com. All Rights Reserved.Please Consider the Environment Before Printing This Document

Letter from the Chair and CEO
Portfolio composition
Expense table
Portfolio of investments
Statement of assets and liabilities
Statement of operations
Statements of changes in net assets
Financial highlights
Notes to financial statements
Proxy voting policies and information
Quarterly portfolio disclosure
Further information
Information about fund contracts and legal claims
Provision of financial reports and summary prospectuses
Contact information
MFS® New Discovery Fund
CONTENTS
1
2
3
5
10
12
13
14
20
32
32
32
32
32
back cover
The report is prepared for the general information of shareholders. It is authorized for distribution toprospective investors only when preceded or accompanied by a current prospectus.
NOT FDIC INSURED • MAY LOSE VALUE • NO BANK GUARANTEE
Copyright © 2022 www.secdatabase.com. All Rights Reserved.Please Consider the Environment Before Printing This Document

Table of Contents
Copyright © 2022 www.secdatabase.com. All Rights Reserved.Please Consider the Environment Before Printing This Document

Table of Contents
LETTER FROM THE CHAIR AND CEO
Dear Shareholders:
As a result of Russia’s invasion of Ukraine, the danger of wider geopolitical conflict has risen to a level not seen in decades, and thiscomes as sanctions aimed at countering Russia’s actions are exacerbating already mounting inflation. Consequently, at a time whenglobal growth faces multiple headwinds, central banks have been presented with the challenge of reining in rising prices without tippingeconomies into recession. The US Federal Reserve recently raised rates for the first time since 2018 and indicated that it is likely totighten policy much more over the coming year. Meanwhile, the unsettled geopolitical backdrop and prospect of tighter financialconditions has led to increased volatility.
There are, however, encouraging signs for the markets. The Omicron wave of the coronavirusis receding outside Asia, unemployment is low, and there are signs that some global supplychain bottlenecks are beginning to ease, though events in Ukraine could hamper theseadvances. Additionally, easier Chinese monetary policy and the record pace of corporate stockbuybacks are supportive elements, albeit amid an otherwise turbulent investment environment.
It is important to have a deep understanding of company fundamentals during times of market transition, and we have built our globalresearch platform to do just that.
At MFS®, we put our clients’ assets to work responsibly by carefully navigating the increasing complexity of global markets andeconomies. Guided by our commitment to long-term investing, we tune out the noise and try to uncover what we believe are the best,most durable investment opportunities in the market. Our unique global investment platform combines collective expertise, long-termdiscipline, and thoughtful risk management to create sustainable value for investors over time.
Respectfully,
Michael W. RobergeChair and Chief Executive OfficerMFS Investment Management
April 14, 2022
The opinions expressed in this letter are subject to change and may not be relied upon for investment advice. No forecasts can beguaranteed.
Copyright © 2022 www.secdatabase.com. All Rights Reserved.Please Consider the Environment Before Printing This Document

1
Copyright © 2022 www.secdatabase.com. All Rights Reserved.Please Consider the Environment Before Printing This Document

Table of Contents
PORTFOLIO COMPOSITION
(g) The Global Industry Classification Standard (GICS®) was developed by and/or is the exclusive property of MSCI, Inc. and S&P Global MarketIntelligence Inc. (“S&P Global Market Intelligence”). GICS is a service mark of MSCI and S&P Global Market Intelligence and has beenlicensed for use by MFS. MFS has applied its own internal sector/industry classification methodology for equity securities and non-equitysecurities that are unclassified by GICS.
Cash & Cash Equivalents includes any cash, investments in money market funds, short-term securities, and other assets less liabilities. Please see theStatement of Assets and Liabilities for additional information related to the fund’s cash position and other assets and liabilities.
Percentages are based on net assets as of February 28, 2022.
The portfolio is actively managed and current holdings may be different.
2
Portfolio structure
Top ten holdings
CACI International, Inc., “A” 2.3%
Leslie's, Inc. 2.2%
AZEK Co., Inc. 2.0%
Sensata Technologies Holding PLC 1.9%
Element Solutions, Inc. 1.9%
Rapid7, Inc. 1.8%
ExlService Holdings, Inc. 1.8%
Skechers USA, Inc., “A” 1.8%
Q2 Holdings, Inc. 1.8%
WNS (Holdings) Ltd., ADR 1.8%
GICS equity sectors (g)
Information Technology 29.4%
Industrials 18.7%
Health Care 14.8%
Consumer Discretionary 11.8%
Financials 9.4%
Materials 4.9%
Real Estate 3.2%
Communication Services 2.5%
Consumer Staples 1.3%
Copyright © 2022 www.secdatabase.com. All Rights Reserved.Please Consider the Environment Before Printing This Document

Table of Contents
EXPENSE TABLEFund expenses borne by the shareholders during the period,September 1, 2021 through February 28, 2022
As a shareholder of the fund, you incur two types of costs: (1) transaction costs, including sales charges (loads) on certain purchase orredemption payments, and (2) ongoing costs, including management fees; distribution and service (12b-1) fees; and other fundexpenses. This example is intended to help you understand your ongoing costs (in dollars) of investing in the fund and to compare thesecosts with the ongoing costs of investing in other mutual funds.
The example is based on an investment of $1,000 invested at the beginning of the period and held for the entire period September 1,2021 through February 28, 2022.
Actual Expenses
The first line for each share class in the following table provides information about actual account values and actual expenses. You mayuse the information in this line, together with the amount you invested, to estimate the expenses that you paid over the period. Simplydivide your account value by $1,000 (for example, an $8,600 account value divided by $1,000 = 8.6), then multiply the result by thenumber in the first line under the heading entitled “Expenses Paid During Period” to estimate the expenses you paid on your accountduring this period.
Hypothetical Example for Comparison Purposes
The second line for each share class in the following table provides information about hypothetical account values and hypotheticalexpenses based on the fund’s actual expense ratio and an assumed rate of return of 5% per year before expenses, which is not thefund’s actual return. The hypothetical account values and expenses may not be used to estimate the actual ending account balance orexpenses you paid for the period. You may use this information to compare the ongoing costs of investing in the fund and other funds. Todo so, compare this 5% hypothetical example with the 5% hypothetical examples that appear in the shareholder reports of the otherfunds.
Please note that the expenses shown in the table are meant to highlight your ongoing costs only and do not reflect any transactionalcosts, such as sales charges (loads). Therefore, the second line for each share class in the table is useful in comparing ongoing costsonly, and will not help you determine the relative total costs of owning different funds. In addition, if these transactional costs wereincluded, your costs would have been higher.
3
Copyright © 2022 www.secdatabase.com. All Rights Reserved.Please Consider the Environment Before Printing This Document

Table of Contents
Expense Table - continued
ShareClass
AnnualizedExpense
Ratio
BeginningAccount Value
9/01/21
EndingAccount Value
2/28/22
ExpensesPaid DuringPeriod (p)
9/01/21-2/28/22
Actual 1.21% $1,000.00 $771.78 $5.32A
Hypothetical (h) 1.21% $1,000.00 $1,018.79 $6.06
Actual 1.96% $1,000.00 $769.00 $8.60B
Hypothetical (h) 1.96% $1,000.00 $1,015.08 $9.79
Actual 1.96% $1,000.00 $768.68 $8.60C
Hypothetical (h) 1.96% $1,000.00 $1,015.08 $9.79
Actual 0.96% $1,000.00 $772.91 $4.22I
Hypothetical (h) 0.96% $1,000.00 $1,020.03 $4.81
Actual 1.96% $1,000.00 $768.94 $8.60R1
Hypothetical (h) 1.96% $1,000.00 $1,015.08 $9.79
Actual 1.46% $1,000.00 $770.86 $6.41R2
Hypothetical (h) 1.46% $1,000.00 $1,017.55 $7.30
Actual 1.21% $1,000.00 $771.86 $5.32R3
Hypothetical (h) 1.21% $1,000.00 $1,018.79 $6.06
Actual 0.96% $1,000.00 $772.71 $4.22R4
Hypothetical (h) 0.96% $1,000.00 $1,020.03 $4.81
Actual 0.86% $1,000.00 $773.09 $3.78R6
Hypothetical (h) 0.86% $1,000.00 $1,020.53 $4.31
(h) 5% class return per year before expenses.
(p) “Expenses Paid During Period” are equal to each class’s annualized expense ratio, as shown above, multiplied by the average account value overthe period, multiplied by 181/365 (to reflect the one-half year period). Expenses paid do not include any applicable sales charges (loads). Ifthese transaction costs had been included, your costs would have been higher.
4
Copyright © 2022 www.secdatabase.com. All Rights Reserved.Please Consider the Environment Before Printing This Document

Table of Contents
PORTFOLIO OF INVESTMENTS2/28/22 (unaudited)
The Portfolio of Investments is a complete list of all securities owned by your fund. It is categorized by broad-based asset classes.
Issuer Shares/Par Value ($)
Common Stocks – 96.0%
Aerospace & Defense – 2.3%
CACI International, Inc., “A” (a) 228,755 $ 64,003,361
Airlines – 1.6%
JetBlue Airways Corp. (a) 3,007,107 $ 45,918,524
Apparel Manufacturers – 2.3%
Allbirds, Inc., “A” (a)(l) 780,566 $ 6,150,860On Holding AG (a) 320,192 7,796,675Skechers USA, Inc., “A” (a) 1,113,419 51,195,006
$ 65,142,541
Automotive – 2.1%
Methode Electronics, Inc. 606,984 $ 27,702,750Visteon Corp. (a) 269,178 32,347,120
$ 60,049,870
Biotechnology – 4.0%
Abcam PLC (a) 1,384,373 $ 23,028,498Adaptive Biotechnologies Corp. (a) 560,901 8,093,802AlloVir, Inc. (a) 533,582 4,802,238BioAtla, Inc. (a) 339,507 2,200,005BioXcel Therapeutics, Inc. (a) 290,670 5,322,168Immunocore Holdings PLC, ADR (a) 233,584 5,162,206Lyell Immunopharma, Inc. (a) 676,627 4,898,780MaxCyte, Inc. (a) 1,288,896 8,970,716Neurocrine Biosciences, Inc. (a) 149,559 13,440,867Olink Holding AB (a) 331,902 5,672,205Oxford Nanopore Technologies PLC (a) 810,747 4,997,602Prelude Therapeutics, Inc. (a) 327,699 2,893,582Recursion Pharmaceuticals, Inc. (a) 919,677 10,070,463Sana Biotechnology, Inc. (a) 522,248 3,373,722Twist Bioscience Corp. (a) 192,241 10,753,962
$ 113,680,816
Brokerage & Asset Managers – 4.5%
Focus Financial Partners, “A” (a) 714,131 $ 35,735,115GCM Grosvenor, Inc. (l) 853,809 8,529,552GCM Grosvenor, Inc. (PIPE) (a) 1,262,527 12,612,645Hamilton Lane, Inc., “A” 554,629 43,316,525WisdomTree Investments, Inc. 4,691,376 26,412,447
$ 126,606,284
Copyright © 2022 www.secdatabase.com. All Rights Reserved.Please Consider the Environment Before Printing This Document

5
Copyright © 2022 www.secdatabase.com. All Rights Reserved.Please Consider the Environment Before Printing This Document

Table of Contents
Portfolio of Investments (unaudited) – continued
Issuer Shares/Par Value ($)
Common Stocks – continued
Business Services – 12.8%
Endava PLC, ADR (a) 185,459 $ 24,699,430EVO Payments, Inc., “A” (a) 1,984,478 47,845,765ExlService Holdings, Inc. (a) 425,726 51,423,443Keywords Studios PLC 1,119,468 36,252,649LegalZoom.com, Inc. (a) 1,297,451 20,253,210Payoneer Global, Inc. (a) 3,950,468 19,041,256Remitly Global, Inc. (a) 2,211,340 24,214,173TaskUs, Inc., “A” (a) 1,088,736 31,268,498Thoughtworks Holding, Inc. (a) 1,595,900 36,482,274TriNet Group, Inc. (a) 223,431 19,507,761WNS (Holdings) Ltd., ADR (a) 612,077 50,575,922
$ 361,564,381
Chemicals – 3.2%
Element Solutions, Inc. 2,184,900 $ 53,704,842Ingevity Corp. (a) 540,329 36,866,648
$ 90,571,490
Computer Software – 9.8%
Alkami Technology, Inc. (a) 1,620,458 $ 25,538,418Avalara, Inc. (a) 215,439 22,386,267Definitive Healthcare Corp. (a) 586,759 13,565,868DoubleVerify Holdings, Inc. (a) 959,433 26,528,322Everbridge, Inc. (a) 496,732 19,630,849Expensify, Inc., “A” (a) 525,814 10,779,187nCino, Inc. (a) 408,022 18,740,450Open Lending Corp., “A” (a) 1,832,841 38,178,078Pagerduty, Inc. (a) 423,682 14,328,925Paycor HCM, Inc. (a) 1,674,901 47,014,471Paylocity Holding Corp. (a) 81,386 17,289,642Procore Technologies, Inc. (a) 343,653 22,402,739
$ 276,383,216
Computer Software - Systems – 5.5%
Five9, Inc. (a) 220,722 $ 24,279,420Nuvei Corp. (a) 520,178 28,240,464Q2 Holdings, Inc. (a) 781,272 50,821,744Rapid7, Inc. (a) 504,114 52,155,634
$ 155,497,262
Construction – 2.5%
AZEK Co., Inc. (a) 1,885,267 $ 55,596,524Trex Co., Inc. (a) 156,354 14,359,551
$ 69,956,075
Copyright © 2022 www.secdatabase.com. All Rights Reserved.Please Consider the Environment Before Printing This Document

6
Copyright © 2022 www.secdatabase.com. All Rights Reserved.Please Consider the Environment Before Printing This Document

Table of Contents
Portfolio of Investments (unaudited) – continued
Issuer Shares/Par Value ($)
Common Stocks – continued
Consumer Services – 2.7%
Boyd Group Services, Inc. 146,887 $ 19,175,852Bright Horizons Family Solutions, Inc. (a) 176,750 23,090,620European Wax Center, Inc., “A” (a) 563,489 14,013,971F45 Training Holdings, Inc. (a) 1,326,660 20,404,031
$ 76,684,474
Electrical Equipment – 3.8%
Advanced Drainage Systems, Inc. 273,096 $ 31,875,765Littlefuse, Inc. 76,187 19,672,245Sensata Technologies Holding PLC (a) 935,170 54,155,695
$ 105,703,705
Electronics – 1.6%
Advanced Energy Industries, Inc. 528,538 $ 45,374,987
Energy - Renewables – 0.9%
Shoals Technologies Group, Inc. (a) 1,509,800 $ 23,869,938
Entertainment – 2.0%
Manchester United PLC, “A” 2,243,774 $ 30,178,761Vivid Seats, Inc., “A” 2,260,643 26,404,310
$ 56,583,071
Food & Beverages – 1.3%
Duckhorn Portfolio, Inc. (a) 1,218,856 $ 23,913,954Oatly Group AB, ADR (a) 2,066,025 13,945,669
$ 37,859,623
Gaming & Lodging – 1.6%
Genius Sports Ltd. (a) 2,578,078 $ 14,566,141Penn National Gaming, Inc. (a) 594,870 30,546,574
$ 45,112,715
Leisure & Toys – 2.4%
Corsair Gaming, Inc. (a)(l) 852,966 $ 19,686,455Malibu Boats, Inc., “A” (a) 668,077 46,544,925
$ 66,231,380
Machinery & Tools – 2.1%
Hydrofarm Holdings Group, Inc. (a) 1,054,122 $ 21,345,970Ritchie Bros. Auctioneers, Inc. 716,486 37,529,537
$ 58,875,507
7
Copyright © 2022 www.secdatabase.com. All Rights Reserved.Please Consider the Environment Before Printing This Document

Table of Contents
Portfolio of Investments (unaudited) – continued
Issuer Shares/Par Value ($)
Common Stocks – continued
Medical & Health Technology & Services – 4.1%
Certara, Inc. (a) 1,512,388 $ 38,323,912Guardant Health, Inc. (a) 133,553 8,850,557HealthEquity, Inc. (a) 503,178 27,025,690Syneos Health, Inc. (a) 519,723 41,162,062
$ 115,362,221
Medical Equipment – 4.3%
Gerresheimer AG 437,126 $ 31,613,217Maravai Lifesciences Holdings, Inc., “A” (a) 730,189 28,528,484Nevro Corp. (a) 225,091 16,139,025OptiNose, Inc. (a)(l) 1,188,905 3,483,492Outset Medical, Inc. (a) 324,853 14,283,786PROCEPT BioRobotics Corp. (a) 630,226 15,743,045Silk Road Medical, Inc. (a) 266,473 9,894,143
$ 119,685,192
Other Banks & Diversified Financials – 3.5%
First Interstate BancSystem, Inc. 901,861 $ 36,615,557Prosperity Bancshares, Inc. 492,281 36,655,243United Community Bank, Inc. 685,233 26,491,108
$ 99,761,908
Pharmaceuticals – 1.8%
Annexon, Inc. (a) 495,468 $ 2,405,497Collegium Pharmaceutical, Inc. (a) 519,893 10,122,317Harmony Biosciences Holdings (a) 395,767 15,814,849SpringWorks Therapeutics, Inc. (a) 265,143 15,004,443Turning Point Therapeutics, Inc. (a) 250,379 7,926,999
$ 51,274,105
Pollution Control – 0.9%
GFL Environmental, Inc. 873,718 $ 25,556,251
Real Estate – 3.2%
Big Yellow Group PLC, REIT 1,051,190 $ 19,953,931Innovative Industrial Properties, Inc., REIT 131,887 24,855,424STAG Industrial, Inc., REIT 1,184,306 46,140,562
$ 90,949,917
Specialty Chemicals – 1.7%
Axalta Coating Systems Ltd. (a) 1,769,195 $ 47,839,033
8
Copyright © 2022 www.secdatabase.com. All Rights Reserved.Please Consider the Environment Before Printing This Document

Table of Contents
Portfolio of Investments (unaudited) – continued
Issuer Shares/Par Value ($)
Common Stocks – continued
Specialty Stores – 4.8%
ACV Auctions, Inc. (a) 2,620,125 $ 34,559,449Leslie's, Inc. (a) 2,883,120 61,439,287Petco Health & Wellness Co., Inc. (a) 1,583,469 27,742,377Vroom, Inc. (a) 1,668,015 10,141,531
$ 133,882,644
Trucking – 2.7%
CryoPort, Inc. (a) 514,203 $ 17,652,589Knight-Swift Transportation Holdings, Inc. 785,839 42,812,509Schneider National, Inc. 636,094 16,614,775
$ 77,079,873
Total Common Stocks (Identified Cost, $2,834,710,862) $2,707,060,364
Investment Companies (h) – 3.6%
Money Market Funds – 3.6%
MFS Institutional Money Market Portfolio, 0.06% (v) (Identified Cost, $101,864,100) 101,868,651 $ 101,868,650
Collateral for Securities Loaned – 0.2%
State Street Navigator Securities Lending Government Money Market Portfolio, 0.06% (j)(Identified Cost, $3,482,704) 3,482,704 $ 3,482,704
Other Assets, Less Liabilities – 0.2% 6,790,199
Net Assets – 100.0% $2,819,201,917
(a) Non-income producing security.(h) An affiliated issuer, which may be considered one in which the fund owns 5% or more of the outstanding voting securities, or a company which is
under common control. At period end, the aggregate values of the fund's investments in affiliated issuers and in unaffiliated issuers were$101,868,650 and $2,710,543,068, respectively.
(j) The rate quoted is the annualized seven-day yield of the fund at period end.(l) A portion of this security is on loan. See Note 2 for additional information.(v) Affiliated issuer that is available only to investment companies managed by MFS. The rate quoted for the MFS Institutional Money Market
Portfolio is the annualized seven-day yield of the fund at period end.
The following abbreviations are used in this report and are defined:ADR American Depositary ReceiptPIPE Private Investment in Public EquityREIT Real Estate Investment Trust
See Notes to Financial Statements
9
Copyright © 2022 www.secdatabase.com. All Rights Reserved.Please Consider the Environment Before Printing This Document

Table of Contents
Financial Statements
STATEMENT OF ASSETS AND LIABILITIESAt 2/28/22 (unaudited)
This statement represents your fund’s balance sheet, which details the assets and liabilities comprising the total value of the fund.
Assets
Investments in unaffiliated issuers, at value, including $4,870,644 of securities on loan (identified cost, $2,838,193,566) $2,710,543,068Investments in affiliated issuers, at value (identified cost, $101,864,100) 101,868,650Foreign currency, at value (identified cost, $2,652,368) 2,652,369Receivables for
Investments sold 11,468,171Fund shares sold 8,090,217Interest and dividends 1,422,056
Other assets 62,545
Total assets $2,836,107,076
Liabilities
Payables forInvestments purchased $8,073,740Fund shares reacquired 4,432,558
Collateral for securities loaned, at value (c) 3,482,704Payable to affiliates
Investment adviser 247,246Administrative services fee 4,192Shareholder servicing costs 487,344Distribution and service fees 34,549
Payable for independent Trustees' compensation 8,282Accrued expenses and other liabilities 134,544
Total liabilities $16,905,159
Net assets $2,819,201,917
Net assets consist of
Paid-in capital $2,943,052,082Total distributable earnings (loss) (123,850,165)
Net assets $2,819,201,917
Shares of beneficial interest outstanding 101,146,189
(c) Non-cash collateral is not included.
10
Copyright © 2022 www.secdatabase.com. All Rights Reserved.Please Consider the Environment Before Printing This Document

Table of Contents
Statement of Assets and Liabilities (unaudited) – continued
Net assetsShares
outstandingNet asset value
per share (a)Class A $900,846,344 35,890,718 $25.10Class B 10,134,842 662,536 15.30Class C 38,441,519 2,500,627 15.37Class I 467,160,832 15,344,716 30.44Class R1 4,065,728 270,747 15.02Class R2 23,281,541 1,058,737 21.99Class R3 131,980,535 5,271,352 25.04Class R4 21,918,953 785,601 27.90Class R6 1,221,371,623 39,361,155 31.03
(a) Maximum offering price per share was equal to the net asset value per share for all share classes, except for Class A, for which the maximumoffering price per share was $26.63 [100 / 94.25 x $25.10]. On sales of $50,000 or more, the maximum offering price of Class A shares is reduced. Acontingent deferred sales charge may be imposed on redemptions of Class A, Class B, and Class C shares. Redemption price per share was equalto the net asset value per share for Classes I, R1, R2, R3, R4, and R6.
See Notes to Financial Statements
11
Copyright © 2022 www.secdatabase.com. All Rights Reserved.Please Consider the Environment Before Printing This Document

Table of Contents
Financial Statements
STATEMENT OF OPERATIONSSix months ended 2/28/22 (unaudited)
This statement describes how much your fund earned in investment income and accrued in expenses. It also describes any gains and/or losses generatedby fund operations.
Net investment income (loss)
IncomeDividends $6,486,324Other 282,873Income on securities loaned 130,088Dividends from affiliated issuers 31,068Foreign taxes withheld (115,035)
Total investment income $6,815,318
ExpensesManagement fee $12,825,621Distribution and service fees 1,929,217Shareholder servicing costs 1,157,048Administrative services fee 211,858Independent Trustees' compensation 20,525Custodian fee 72,144Shareholder communications 98,980Audit and tax fees 30,160Legal fees 7,816Miscellaneous 148,296
Total expenses $16,501,665
Reduction of expenses by investment adviser and distributor (215,318)
Net expenses $16,286,347
Net investment income (loss) $(9,471,029)
Realized and unrealized gain (loss)
Realized gain (loss) (identified cost basis)Unaffiliated issuers $105,917,284Foreign currency 12,565
Net realized gain (loss) $105,929,849
Change in unrealized appreciation or depreciationUnaffiliated issuers $(889,146,525)Translation of assets and liabilities in foreign currencies (8,565)
Net unrealized gain (loss) $(889,155,090)
Net realized and unrealized gain (loss) $(783,225,241)
Change in net assets from operations $(792,696,270)
See Notes to Financial Statements
Copyright © 2022 www.secdatabase.com. All Rights Reserved.Please Consider the Environment Before Printing This Document

12
Copyright © 2022 www.secdatabase.com. All Rights Reserved.Please Consider the Environment Before Printing This Document

Table of Contents
Financial Statements
STATEMENTS OF CHANGES IN NET ASSETSThese statements describe the increases and/or decreases in net assets resulting from operations, any distributions, and any shareholder transactions.
Six months ended Year ended2/28/22
(unaudited)8/31/21
Change in net assetsFrom operations
Net investment income (loss) $(9,471,029) $(13,180,424)Net realized gain (loss) 105,929,849 684,764,185Net unrealized gain (loss) (889,155,090) 200,559,116
Change in net assets from operations $(792,696,270) $872,142,877
Total distributions to shareholders $(586,440,707) $(245,280,652)
Change in net assets from fund share transactions $837,270,698 $654,561,520
Total change in net assets $(541,866,279) $1,281,423,745
Net assets
At beginning of period 3,361,068,196 2,079,644,451At end of period $2,819,201,917 $3,361,068,196
See Notes to Financial Statements
13
Copyright © 2022 www.secdatabase.com. All Rights Reserved.Please Consider the Environment Before Printing This Document

Table of Contents
Financial Statements
FINANCIAL HIGHLIGHTSThe financial highlights table is intended to help you understand the fund's financial performance for the semiannual period and the past5 fiscal years. Certain information reflects financial results for a single fund share. The total returns in the table represent the rate that aninvestor would have earned (or lost) on an investment in the fund share class (assuming reinvestment of all distributions) held for theentire period.
Class ASix months
ended Year ended
2/28/22(unaudited)
8/31/21 8/31/20 8/31/19 8/31/18 8/31/17
Net asset value, beginning of period $40.53 $32.45 $27.56 $33.30 $27.27 $24.11
Income (loss) from investment operations
Net investment income (loss) (d) $(0.13) $(0.23) $(0.18) $(0.19) $(0.23) $(0.18)(c)Net realized and unrealized gain (loss) (7.90) 12.20 7.31 0.06(g) 9.07 3.92
Total from investment operations $(8.03) $11.97 $7.13 $(0.13) $8.84 $3.74
Less distributions declared to shareholders
From net realized gain $(7.40) $(3.89) $(2.24) $(5.61) $(2.81) $(0.58)
Net asset value, end of period (x) $25.10 $40.53 $32.45 $27.56 $33.30 $27.27
Total return (%) (r)(s)(t)(x) (22.82)(n) 39.23 27.51 3.49 34.98 15.83(c)
Ratios (%) (to average net assets)and Supplemental data:
Expenses before expense reductions 1.23(a) 1.23 1.29 1.30 1.33 1.35(c)Expenses after expense reductions 1.21(a) 1.22 1.27 1.29 1.31 1.33(c)Net investment income (loss) (0.78)(a) (0.63) (0.66) (0.70) (0.80) (0.70)(c)Portfolio turnover 31(n) 71 64 69 67 53Net assets at end of period (000 omitted) $900,846 $1,171,166 $755,202 $549,660 $525,698 $394,878
See Notes to Financial Statements
14
Copyright © 2022 www.secdatabase.com. All Rights Reserved.Please Consider the Environment Before Printing This Document
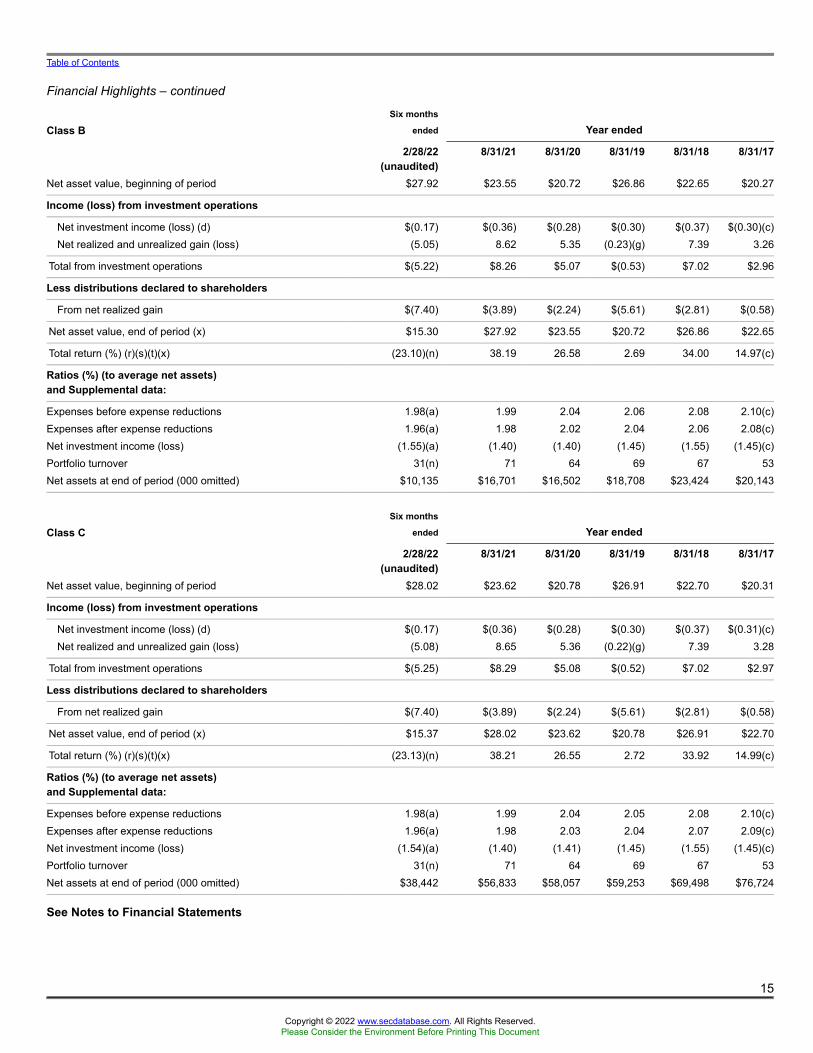
Table of Contents
Financial Highlights – continued
Class BSix months
ended Year ended
2/28/22(unaudited)
8/31/21 8/31/20 8/31/19 8/31/18 8/31/17
Net asset value, beginning of period $27.92 $23.55 $20.72 $26.86 $22.65 $20.27
Income (loss) from investment operations
Net investment income (loss) (d) $(0.17) $(0.36) $(0.28) $(0.30) $(0.37) $(0.30)(c)Net realized and unrealized gain (loss) (5.05) 8.62 5.35 (0.23)(g) 7.39 3.26
Total from investment operations $(5.22) $8.26 $5.07 $(0.53) $7.02 $2.96
Less distributions declared to shareholders
From net realized gain $(7.40) $(3.89) $(2.24) $(5.61) $(2.81) $(0.58)
Net asset value, end of period (x) $15.30 $27.92 $23.55 $20.72 $26.86 $22.65
Total return (%) (r)(s)(t)(x) (23.10)(n) 38.19 26.58 2.69 34.00 14.97(c)
Ratios (%) (to average net assets)and Supplemental data:
Expenses before expense reductions 1.98(a) 1.99 2.04 2.06 2.08 2.10(c)Expenses after expense reductions 1.96(a) 1.98 2.02 2.04 2.06 2.08(c)Net investment income (loss) (1.55)(a) (1.40) (1.40) (1.45) (1.55) (1.45)(c)Portfolio turnover 31(n) 71 64 69 67 53Net assets at end of period (000 omitted) $10,135 $16,701 $16,502 $18,708 $23,424 $20,143
Class CSix months
ended Year ended
2/28/22(unaudited)
8/31/21 8/31/20 8/31/19 8/31/18 8/31/17
Net asset value, beginning of period $28.02 $23.62 $20.78 $26.91 $22.70 $20.31
Income (loss) from investment operations
Net investment income (loss) (d) $(0.17) $(0.36) $(0.28) $(0.30) $(0.37) $(0.31)(c)Net realized and unrealized gain (loss) (5.08) 8.65 5.36 (0.22)(g) 7.39 3.28
Total from investment operations $(5.25) $8.29 $5.08 $(0.52) $7.02 $2.97
Less distributions declared to shareholders
From net realized gain $(7.40) $(3.89) $(2.24) $(5.61) $(2.81) $(0.58)
Net asset value, end of period (x) $15.37 $28.02 $23.62 $20.78 $26.91 $22.70
Total return (%) (r)(s)(t)(x) (23.13)(n) 38.21 26.55 2.72 33.92 14.99(c)
Ratios (%) (to average net assets)and Supplemental data:
Expenses before expense reductions 1.98(a) 1.99 2.04 2.05 2.08 2.10(c)Expenses after expense reductions 1.96(a) 1.98 2.03 2.04 2.07 2.09(c)Net investment income (loss) (1.54)(a) (1.40) (1.41) (1.45) (1.55) (1.45)(c)Portfolio turnover 31(n) 71 64 69 67 53Net assets at end of period (000 omitted) $38,442 $56,833 $58,057 $59,253 $69,498 $76,724
See Notes to Financial Statements
15
Copyright © 2022 www.secdatabase.com. All Rights Reserved.Please Consider the Environment Before Printing This Document

Table of Contents
Financial Highlights – continued
Class ISix months
ended Year ended
2/28/22(unaudited)
8/31/21 8/31/20 8/31/19 8/31/18 8/31/17
Net asset value, beginning of period $47.41 $37.30 $31.29 $36.82 $29.81 $26.24
Income (loss) from investment operations
Net investment income (loss) (d) $(0.11) $(0.16) $(0.14) $(0.14) $(0.18) $(0.12)(c)Net realized and unrealized gain (loss) (9.46) 14.16 8.39 0.22(g) 10.00 4.27
Total from investment operations $(9.57) $14.00 $8.25 $0.08 $9.82 $4.15
Less distributions declared to shareholders
From net realized gain $(7.40) $(3.89) $(2.24) $(5.61) $(2.81) $(0.58)
Net asset value, end of period (x) $30.44 $47.41 $37.30 $31.29 $36.82 $29.81
Total return (%) (r)(s)(t)(x) (22.75)(n) 39.60 27.83 3.76 35.31 16.12(c)
Ratios (%) (to average net assets)and Supplemental data:
Expenses before expense reductions 0.97(a) 0.98 1.04 1.05 1.08 1.10(c)Expenses after expense reductions 0.96(a) 0.97 1.03 1.05 1.07 1.09(c)Net investment income (loss) (0.54)(a) (0.37) (0.43) (0.45) (0.55) (0.45)(c)Portfolio turnover 31(n) 71 64 69 67 53Net assets at end of period (000 omitted) $467,161 $621,379 $331,177 $164,593 $180,591 $106,459
Class R1Six months
ended Year ended
2/28/22(unaudited)
8/31/21 8/31/20 8/31/19 8/31/18 8/31/17
Net asset value, beginning of period $27.56 $23.29 $20.51 $26.66 $22.50 $20.15
Income (loss) from investment operations
Net investment income (loss) (d) $(0.16) $(0.35) $(0.28) $(0.30) $(0.37) $(0.30)(c)Net realized and unrealized gain (loss) (4.98) 8.51 5.30 (0.24)(g) 7.34 3.23
Total from investment operations $(5.14) $8.16 $5.02 $(0.54) $6.97 $2.93
Less distributions declared to shareholders
From net realized gain $(7.40) $(3.89) $(2.24) $(5.61) $(2.81) $(0.58)
Net asset value, end of period (x) $15.02 $27.56 $23.29 $20.51 $26.66 $22.50
Total return (%) (r)(s)(t)(x) (23.11)(n) 38.20 26.61 2.67 34.01 14.91(c)
Ratios (%) (to average net assets)and Supplemental data:
Expenses before expense reductions 1.98(a) 1.99 2.04 2.05 2.08 2.10(c)Expenses after expense reductions 1.96(a) 1.97 2.03 2.05 2.07 2.09(c)Net investment income (loss) (1.53)(a) (1.39) (1.41) (1.45) (1.55) (1.45)(c)Portfolio turnover 31(n) 71 64 69 67 53Net assets at end of period (000 omitted) $4,066 $5,923 $4,946 $4,652 $5,342 $4,377
See Notes to Financial Statements
16
Copyright © 2022 www.secdatabase.com. All Rights Reserved.Please Consider the Environment Before Printing This Document

Table of Contents
Financial Highlights – continued
Class R2Six months
ended Year ended
2/28/22(unaudited)
8/31/21 8/31/20 8/31/19 8/31/18 8/31/17
Net asset value, beginning of period $36.54 $29.65 $25.42 $31.31 $25.85 $22.95
Income (loss) from investment operations
Net investment income (loss) (d) $(0.15) $(0.30) $(0.23) $(0.24) $(0.29) $(0.23)(c)Net realized and unrealized gain (loss) (7.00) 11.08 6.70 (0.04)(g) 8.56 3.71
Total from investment operations $(7.15) $10.78 $6.47 $(0.28) $8.27 $3.48
Less distributions declared to shareholders
From net realized gain $(7.40) $(3.89) $(2.24) $(5.61) $(2.81) $(0.58)
Net asset value, end of period (x) $21.99 $36.54 $29.65 $25.42 $31.31 $25.85
Total return (%) (r)(s)(t)(x) (22.91)(n) 38.89 27.21 3.19 34.68 15.50(c)
Ratios (%) (to average net assets)and Supplemental data:
Expenses before expense reductions 1.48(a) 1.49 1.54 1.56 1.58 1.60(c)Expenses after expense reductions 1.46(a) 1.47 1.53 1.54 1.57 1.59(c)Net investment income (loss) (1.04)(a) (0.89) (0.90) (0.95) (1.05) (0.95)(c)Portfolio turnover 31(n) 71 64 69 67 53Net assets at end of period (000 omitted) $23,282 $34,688 $30,149 $32,381 $36,272 $29,130
Class R3Six months
ended Year ended
2/28/22(unaudited)
8/31/21 8/31/20 8/31/19 8/31/18 8/31/17
Net asset value, beginning of period $40.45 $32.39 $27.51 $33.26 $27.24 $24.09
Income (loss) from investment operations
Net investment income (loss) (d) $(0.13) $(0.22) $(0.18) $(0.19) $(0.24) $(0.17)(c)Net realized and unrealized gain (loss) (7.88) 12.17 7.30 0.05(g) 9.07 3.90
Total from investment operations $(8.01) $11.95 $7.12 $(0.14) $8.83 $3.73
Less distributions declared to shareholders
From net realized gain $(7.40) $(3.89) $(2.24) $(5.61) $(2.81) $(0.58)
Net asset value, end of period (x) $25.04 $40.45 $32.39 $27.51 $33.26 $27.24
Total return (%) (r)(s)(t)(x) (22.81)(n) 39.24 27.52 3.45 34.98 15.81(c)
Ratios (%) (to average net assets)and Supplemental data:
Expenses before expense reductions 1.23(a) 1.23 1.29 1.30 1.33 1.35(c)Expenses after expense reductions 1.21(a) 1.22 1.28 1.30 1.32 1.34(c)Net investment income (loss) (0.78)(a) (0.61) (0.67) (0.70) (0.80) (0.70)(c)Portfolio turnover 31(n) 71 64 69 67 53Net assets at end of period (000 omitted) $131,981 $178,005 $71,489 $52,559 $50,895 $42,346
See Notes to Financial Statements
17
Copyright © 2022 www.secdatabase.com. All Rights Reserved.Please Consider the Environment Before Printing This Document

Table of Contents
Financial Highlights – continued
Class R4Six months
ended Year ended
2/28/22(unaudited)
8/31/21 8/31/20 8/31/19 8/31/18 8/31/17
Net asset value, beginning of period $44.11 $34.94 $29.44 $35.05 $28.48 $25.09
Income (loss) from investment operations
Net investment income (loss) (d) $(0.09) $(0.15) $(0.13) $(0.13) $(0.15) $(0.12)(c)Net realized and unrealized gain (loss) (8.72) 13.21 7.87 0.13(g) 9.53 4.09
Total from investment operations $(8.81) $13.06 $7.74 $0.00(w) $9.38 $3.97
Less distributions declared to shareholders
From net realized gain $(7.40) $(3.89) $(2.24) $(5.61) $(2.81) $(0.58)
Net asset value, end of period (x) $27.90 $44.11 $34.94 $29.44 $35.05 $28.48
Total return (%) (r)(s)(t)(x) (22.73)(n) 39.58 27.84 3.72 35.42 16.14(c)
Ratios (%) (to average net assets)and Supplemental data:
Expenses before expense reductions 0.97(a) 0.99 1.04 1.05 1.08 1.10(c)Expenses after expense reductions 0.96(a) 0.97 1.03 1.05 1.07 1.09(c)Net investment income (loss) (0.53)(a) (0.37) (0.43) (0.45) (0.51) (0.45)(c)Portfolio turnover 31(n) 71 64 69 67 53Net assets at end of period (000 omitted) $21,919 $27,863 $16,509 $8,384 $10,612 $83,186
Class R6Six months
ended Year ended
2/28/22(unaudited)
8/31/21 8/31/20 8/31/19 8/31/18 8/31/17
Net asset value, beginning of period $48.14 $37.79 $31.64 $37.13 $30.01 $26.38
Income (loss) from investment operations
Net investment income (loss) (d) $(0.08) $(0.12) $(0.10) $(0.11) $(0.14) $(0.09)(c)Net realized and unrealized gain (loss) (9.63) 14.36 8.49 0.23(g) 10.07 4.30
Total from investment operations $(9.71) $14.24 $8.39 $0.12 $9.93 $4.21
Less distributions declared to shareholders
From net realized gain $(7.40) $(3.89) $(2.24) $(5.61) $(2.81) $(0.58)
Net asset value, end of period (x) $31.03 $48.14 $37.79 $31.64 $37.13 $30.01
Total return (%) (r)(s)(t)(x) (22.69)(n) 39.73 27.97 3.85 35.45 16.26(c)
Ratios (%) (to average net assets)and Supplemental data:
Expenses before expense reductions 0.87(a) 0.89 0.94 0.96 0.97 0.98(c)Expenses after expense reductions 0.86(a) 0.88 0.92 0.95 0.96 0.97(c)Net investment income (loss) (0.40)(a) (0.28) (0.32) (0.35) (0.44) (0.34)(c)Portfolio turnover 31(n) 71 64 69 67 53Net assets at end of period (000 omitted) $1,221,372 $1,248,511 $795,613 $541,266 $477,818 $385,440
See Notes to Financial Statements
Copyright © 2022 www.secdatabase.com. All Rights Reserved.Please Consider the Environment Before Printing This Document

18
Copyright © 2022 www.secdatabase.com. All Rights Reserved.Please Consider the Environment Before Printing This Document

Table of Contents
Financial Highlights – continued
(a) Annualized.(c) Amount reflects a one-time reimbursement of expenses by the custodian (or former custodian) without which net investment income and
performance would be lower and expenses would be higher.(d) Per share data is based on average shares outstanding.(g) The per share amount varies from the net realized and unrealized gain/loss for the period because of the timing of sales of fund shares
and the per share amount of realized and unrealized gains and losses at such time.(n) Not annualized.(r) Certain expenses have been reduced without which performance would have been lower.(s) From time to time the fund may receive proceeds from litigation settlements, without which performance would be lower.(t) Total returns do not include any applicable sales charges.(w) Per share amount was less than $0.01.(x) The net asset values and total returns have been calculated on net assets which include adjustments made in accordance with U.S.
generally accepted accounting principles required at period end for financial reporting purposes.
See Notes to Financial Statements
19
Copyright © 2022 www.secdatabase.com. All Rights Reserved.Please Consider the Environment Before Printing This Document

Table of Contents
NOTES TO FINANCIAL STATEMENTS(unaudited)
(1) Business and OrganizationMFS New Discovery Fund (the fund) is a diversified series of MFS Series Trust I (the trust). The trust is organized as a Massachusettsbusiness trust and is registered under the Investment Company Act of 1940, as amended, as an open-end management investmentcompany.
The fund is an investment company and accordingly follows the investment company accounting and reporting guidance of the FinancialAccounting Standards Board (FASB) Accounting Standards Codification Topic 946 Financial Services - Investment Companies.
(2) Significant Accounting PoliciesGeneral — The preparation of financial statements in conformity with U.S. generally accepted accounting principles requiresmanagement to make estimates and assumptions that affect the reported amounts of assets and liabilities, and disclosure ofcontingent assets and liabilities at the date of the financial statements and the reported amounts of increases and decreases innet assets from operations during the reporting period. Actual results could differ from those estimates. In the preparation ofthese financial statements, management has evaluated subsequent events occurring after the date of the fund’s Statement ofAssets and Liabilities through the date that the financial statements were issued. The fund will generally focus on securities ofsmall size companies which may be more volatile than those of larger companies. The fund invests in foreign securities.Investments in foreign securities are vulnerable to the effects of changes in the relative values of the local currency and theU.S. dollar and to the effects of changes in each country’s market, economic, industrial, political, regulatory, geopolitical,environmental, public health, and other conditions.Balance Sheet Offsetting — The fund's accounting policy with respect to balance sheet offsetting is that, absent an event ofdefault by the counterparty or a termination of the agreement, the International Swaps and Derivatives Association (ISDA)Master Agreement, or similar agreement, does not result in an offset of reported amounts of financial assets and financialliabilities in the Statement of Assets and Liabilities across transactions between the fund and the applicable counterparty. Thefund's right to setoff may be restricted or prohibited by the bankruptcy or insolvency laws of the particular jurisdiction to whicha specific master netting agreement counterparty is subject. Balance sheet offsetting disclosures, to the extent applicable tothe fund, have been included in the fund’s Significant Accounting Policies note under the captions for each of the fund’s in-scope financial instruments and transactions.Investment Valuations — Equity securities, including restricted equity securities, are generally valued at the last sale or officialclosing price on their primary market or exchange as provided by a third-party pricing service. Equity securities, for whichthere were no sales reported that day, are generally valued at the last quoted daily bid quotation on their primary market orexchange as provided by a third-party pricing service. Short-term instruments with a maturity at issuance of 60 days or lessmay be valued at amortized cost, which approximates market value. Open-end investment companies are generally valued atnet asset value per share. Securities and other assets generally valued on the basis of information from a third-party pricingservice may also be valued at a broker/dealer bid quotation. In determining values, third-party pricing services can utilize bothtransaction data and market information such as yield, quality,
20
Copyright © 2022 www.secdatabase.com. All Rights Reserved.Please Consider the Environment Before Printing This Document

Table of Contents
Notes to Financial Statements (unaudited) - continued
coupon rate, maturity, type of issue, trading characteristics, and other market data. The values of foreign securities and other assets andliabilities expressed in foreign currencies are converted to U.S. dollars using the mean of bid and asked prices for rates provided by athird-party pricing service.
The Board of Trustees has delegated primary responsibility for determining or causing to be determined the value of the fund’sinvestments (including any fair valuation) to the adviser pursuant to valuation policies and procedures approved by the Board. If theadviser determines that reliable market quotations are not readily available, investments are valued at fair value as determined in goodfaith by the adviser in accordance with such procedures under the oversight of the Board of Trustees. Under the fund’s valuation policiesand procedures, market quotations are not considered to be readily available for most types of debt instruments and floating rate loansand many types of derivatives. These investments are generally valued at fair value based on information from third-party pricingservices. In addition, investments may be valued at fair value if the adviser determines that an investment’s value has been materiallyaffected by events occurring after the close of the exchange or market on which the investment is principally traded (such as foreignexchange or market) and prior to the determination of the fund’s net asset value, or after the halt of trading of a specific security wheretrading does not resume prior to the close of the exchange or market on which the security is principally traded. Events that occur afterforeign markets close (such as developments in foreign markets and significant movements in the U.S. markets) and prior to thedetermination of the fund’s net asset value may be deemed to have a material effect on the value of securities traded in foreign markets.Accordingly, the fund’s foreign equity securities may often be valued at fair value. The adviser generally relies on third-party pricingservices or other information (such as the correlation with price movements of similar securities in the same or other markets; the type,cost and investment characteristics of the security; the business and financial condition of the issuer; and trading and other market data)to assist in determining whether to fair value and at what value to fair value an investment. The value of an investment for purposes ofcalculating the fund’s net asset value can differ depending on the source and method used to determine value. When fair valuation isused, the value of an investment used to determine the fund’s net asset value may differ from quoted or published prices for the sameinvestment. There can be no assurance that the fund could obtain the fair value assigned to an investment if it were to sell the investmentat the same time at which the fund determines its net asset value per share.
Various inputs are used in determining the value of the fund's assets or liabilities. These inputs are categorized into three broad levels. Incertain cases, the inputs used to measure fair value may fall into different levels of the fair value hierarchy. In such cases, an investment'slevel within the fair value hierarchy is based on the lowest level of input that is significant to the fair value measurement. The fund'sassessment of the significance of a particular input to the fair value measurement in its entirety requires judgment, and considers factorsspecific to the investment. Level 1 includes unadjusted quoted prices in active markets for identical assets or liabilities. Level 2 includesother significant observable market-based inputs (including quoted prices for similar securities, interest rates, prepayment speed, andcredit risk). Level 3 includes unobservable inputs, which may include the adviser's own assumptions in determining the fair value ofinvestments. The following is a summary of the levels used as of February 28, 2022 in valuing the fund's assets and liabilities:
21
Copyright © 2022 www.secdatabase.com. All Rights Reserved.Please Consider the Environment Before Printing This Document

Table of Contents
Notes to Financial Statements (unaudited) - continued
Financial Instruments Level 1 Level 2 Level 3 TotalEquity Securities:
United States $2,298,179,880 $12,612,645 $— $2,310,792,525United Kingdom 158,839,218 — — 158,839,218Canada 110,502,104 — — 110,502,104India 50,575,922 — — 50,575,922Germany 31,613,217 — — 31,613,217Philippines 31,268,498 — — 31,268,498Switzerland 7,796,675 — — 7,796,675Sweden 5,672,205 — — 5,672,205
Mutual Funds 105,351,354 — — 105,351,354
Total $2,799,799,073 $12,612,645 $— $2,812,411,718
For further information regarding security characteristics, see the Portfolio of Investments.
Foreign Currency Translation — Purchases and sales of foreign investments, income, and expenses are converted into U.S.dollars based upon currency exchange rates prevailing on the respective dates of such transactions or on the reporting datefor foreign denominated receivables and payables. Gains and losses attributable to foreign currency exchange rates on salesof securities are recorded for financial statement purposes as net realized gains and losses on investments. Gains and lossesattributable to foreign exchange rate movements on receivables, payables, income and expenses are recorded for financialstatement purposes as foreign currency transaction gains and losses. That portion of both realized and unrealized gains andlosses on investments that results from fluctuations in foreign currency exchange rates is not separately disclosed.Security Loans — Under its Securities Lending Agency Agreement with the fund, State Street Bank and Trust Company, aslending agent, loans the securities of the fund to certain qualified institutions (the “Borrowers”) approved by the fund. Securityloans can be terminated at the discretion of either the lending agent or the fund and the related securities must be returnedwithin the earlier of the standard trade settlement period for such securities or within three business days. The loans arecollateralized by cash and/or U.S. Treasury and federal agency obligations in an amount typically at least equal to the marketvalue of the securities loaned. On loans collateralized by cash, the cash collateral is invested in a money market fund. Themarket value of the loaned securities is determined at the close of business of the fund and any additional required collateral isdelivered to the fund on the next business day. The lending agent provides the fund with indemnification against Borrowerdefault. In the event of Borrower default, the lending agent will, for the benefit of the fund, either purchase securities identicalto those loaned or, when such purchase is commercially impracticable, pay the fund the market value of the loaned securities.In return, the lending agent assumes the fund's rights to the related collateral. If the collateral value is less than the cost topurchase identical securities, the lending agent is responsible for the shortfall, but only to the extent that such shortfall is notdue to a decline in collateral value resulting from collateral reinvestment for which the fund bears the risk of loss. At periodend, the fund had investment securities on loan, all of which were classified as equity securities in the fund's Portfolio ofInvestments, with a fair value of $4,870,644. The fair value of the fund's investment securities on loan and a related liability of$3,482,704 for cash
22
Copyright © 2022 www.secdatabase.com. All Rights Reserved.Please Consider the Environment Before Printing This Document

Table of Contents
Notes to Financial Statements (unaudited) - continued
collateral received on securities loaned are both presented gross in the Statement of Assets and Liabilities. Additionally, these loans werecollateralized by U.S. Treasury Obligations of $1,499,815 held by the lending agent. The collateral on securities loaned exceeded thevalue of securities on loan at period end. The liability for cash collateral for securities loaned is carried at fair value, which is categorizedas level 2 within the fair value hierarchy. A portion of the income generated upon investment of the collateral is remitted to the Borrowers,and the remainder is allocated between the fund and the lending agent. On loans collateralized by U.S. Treasury and/or federal agencyobligations, a fee is received from the Borrower, and is allocated between the fund and the lending agent. Income from securities lendingis separately reported in the Statement of Operations. The dividend and interest income earned on the securities loaned is accounted forin the same manner as other dividend and interest income.
Indemnifications — Under the fund's organizational documents, its officers and Trustees may be indemnified against certainliabilities and expenses arising out of the performance of their duties to the fund. Additionally, in the normal course ofbusiness, the fund enters into agreements with service providers that may contain indemnification clauses. The fund'smaximum exposure under these agreements is unknown as this would involve future claims that may be made against the fundthat have not yet occurred.Investment Transactions and Income — Investment transactions are recorded on the trade date. Dividends received in cash arerecorded on the ex-dividend date. Certain dividends from foreign securities will be recorded when the fund is informed of thedividend if such information is obtained subsequent to the ex-dividend date. Dividend payments received in additionalsecurities are recorded on the ex-dividend date in an amount equal to the value of the security on such date. In determining thenet gain or loss on securities sold, the cost of securities is determined on the identified cost basis.The fund may receive proceeds from litigation settlements. Any proceeds received from litigation involving portfolio holdings are reflectedin the Statement of Operations in realized gain/loss if the security has been disposed of by the fund or in unrealized gain/loss if thesecurity is still held by the fund. Any other proceeds from litigation not related to portfolio holdings are reflected as other income in theStatement of Operations.
Tax Matters and Distributions — The fund intends to qualify as a regulated investment company, as defined under SubchapterM of the Internal Revenue Code, and to distribute all of its taxable income, including realized capital gains. As a result, noprovision for federal income tax is required. The fund’s federal tax returns, when filed, will remain subject to examination by theInternal Revenue Service for a three year period. Management has analyzed the fund’s tax positions taken on federal and statetax returns for all open tax years and does not believe that there are any uncertain tax positions that require recognition of a taxliability. Foreign taxes, if any, have been accrued by the fund in the accompanying financial statements in accordance with theapplicable foreign tax law. Foreign income taxes may be withheld by certain countries in which the fund invests. Additionally,capital gains realized by the fund on securities issued in or by certain foreign countries may be subject to capital gains taximposed by those countries.
23
Copyright © 2022 www.secdatabase.com. All Rights Reserved.Please Consider the Environment Before Printing This Document

Table of Contents
Notes to Financial Statements (unaudited) - continued
Distributions to shareholders are recorded on the ex-dividend date. Income and capital gain distributions are determined in accordancewith income tax regulations, which may differ from U.S. generally accepted accounting principles. Certain capital accounts in the financialstatements are periodically adjusted for permanent differences in order to reflect their tax character. These adjustments have no impacton net assets or net asset value per share. Temporary differences which arise from recognizing certain items of income, expense, gain orloss in different periods for financial statement and tax purposes will reverse at some time in the future.
Book/tax differences primarily relate to wash sale loss deferrals and treating a portion of the proceeds from redemptions as a distributionfor tax purposes.
The tax character of distributions made during the current period will be determined at fiscal year end. The tax character of distributionsdeclared to shareholders for the last fiscal year is as follows:
Year ended8/31/21
Ordinary income (including any short-term capital gains) $102,280,212Long-term capital gains 143,000,440
Total distributions $245,280,652
The federal tax cost and the tax basis components of distributable earnings were as follows:
As of 2/28/22Cost of investments $2,949,421,838
Gross appreciation 355,866,939Gross depreciation (492,877,059)
Net unrealized appreciation (depreciation) $ (137,010,120)As of 8/31/21Undistributed ordinary income 241,781,136Undistributed long-term capital gain 261,359,755Other temporary differences 9,516Net unrealized appreciation (depreciation) 752,136,405
The aggregate cost above includes prior fiscal year end tax adjustments, if applicable.
Multiple Classes of Shares of Beneficial Interest — The fund offers multiple classes of shares, which differ in their respectivedistribution and service fees. The fund's income, realized and unrealized gain (loss), and common expenses are allocated toshareholders based on the daily net assets of each class. Dividends are declared separately for each class. Differences in pershare dividend rates are generally due to differences in separate class expenses. Class B and Class C shares will convert to
24
Copyright © 2022 www.secdatabase.com. All Rights Reserved.Please Consider the Environment Before Printing This Document
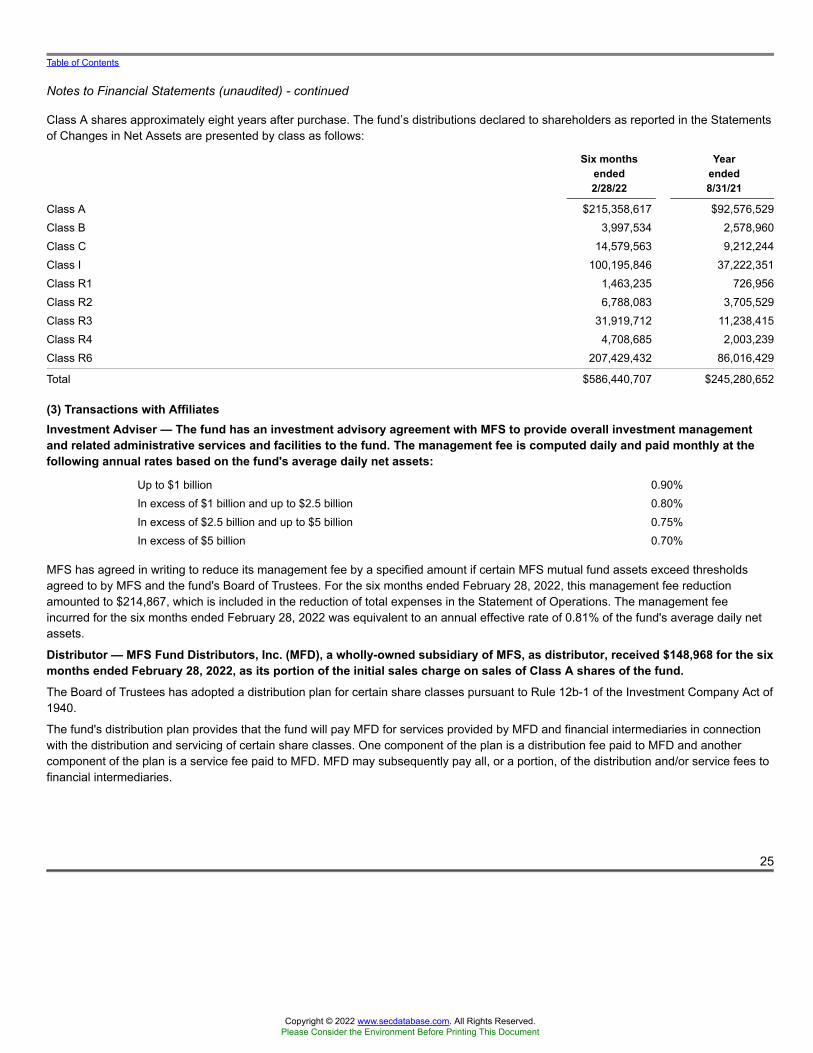
Table of Contents
Notes to Financial Statements (unaudited) - continued
Class A shares approximately eight years after purchase. The fund’s distributions declared to shareholders as reported in the Statementsof Changes in Net Assets are presented by class as follows:
Six monthsended2/28/22
Yearended8/31/21
Class A $215,358,617 $92,576,529Class B 3,997,534 2,578,960Class C 14,579,563 9,212,244Class I 100,195,846 37,222,351Class R1 1,463,235 726,956Class R2 6,788,083 3,705,529Class R3 31,919,712 11,238,415Class R4 4,708,685 2,003,239Class R6 207,429,432 86,016,429
Total $586,440,707 $245,280,652
(3) Transactions with AffiliatesInvestment Adviser — The fund has an investment advisory agreement with MFS to provide overall investment managementand related administrative services and facilities to the fund. The management fee is computed daily and paid monthly at thefollowing annual rates based on the fund's average daily net assets:
Up to $1 billion 0.90%In excess of $1 billion and up to $2.5 billion 0.80%In excess of $2.5 billion and up to $5 billion 0.75%In excess of $5 billion 0.70%
MFS has agreed in writing to reduce its management fee by a specified amount if certain MFS mutual fund assets exceed thresholdsagreed to by MFS and the fund's Board of Trustees. For the six months ended February 28, 2022, this management fee reductionamounted to $214,867, which is included in the reduction of total expenses in the Statement of Operations. The management feeincurred for the six months ended February 28, 2022 was equivalent to an annual effective rate of 0.81% of the fund's average daily netassets.
Distributor — MFS Fund Distributors, Inc. (MFD), a wholly-owned subsidiary of MFS, as distributor, received $148,968 for the sixmonths ended February 28, 2022, as its portion of the initial sales charge on sales of Class A shares of the fund.The Board of Trustees has adopted a distribution plan for certain share classes pursuant to Rule 12b-1 of the Investment Company Act of1940.
The fund's distribution plan provides that the fund will pay MFD for services provided by MFD and financial intermediaries in connectionwith the distribution and servicing of certain share classes. One component of the plan is a distribution fee paid to MFD and anothercomponent of the plan is a service fee paid to MFD. MFD may subsequently pay all, or a portion, of the distribution and/or service fees tofinancial intermediaries.
25
Copyright © 2022 www.secdatabase.com. All Rights Reserved.Please Consider the Environment Before Printing This Document

Table of Contents
Notes to Financial Statements (unaudited) - continued
Distribution Plan Fee Table:
DistributionFee Rate (d)
ServiceFee Rate (d)
TotalDistribution
Plan (d)
AnnualEffectiveRate (e)
Distributionand Service
Fee
Class A — 0.25% 0.25% 0.25% $ 1,321,568
Class B 0.75% 0.25% 1.00% 1.00% 68,003
Class C 0.75% 0.25% 1.00% 1.00% 244,458
Class R1 0.75% 0.25% 1.00% 1.00% 24,810
Class R2 0.25% 0.25% 0.50% 0.50% 74,402
Class R3 — 0.25% 0.25% 0.25% 195,976
Total Distribution and ServiceFees $1,929,217
(d) In accordance with the distribution plan for certain classes, the fund pays distribution and/or service fees equal to these annual percentage rates ofeach class’s average daily net assets. The distribution and service fee rates disclosed by class represent the current rates in effect at the endof the reporting period. Any rate changes, if applicable, are detailed below.
(e) The annual effective rates represent actual fees incurred under the distribution plan for the six months ended February 28, 2022 based on eachclass's average daily net assets. MFD has voluntarily agreed to rebate a portion of each class's 0.25% service fee attributable to accounts forwhich there is no financial intermediary specified on the account except for accounts attributable to MFS or its affiliates' seed money. For thesix months ended February 28, 2022, this rebate amounted to $285, $5, and $161 for Class A, Class C, and Class R2, respectively, and isincluded in the reduction of total expenses in the Statement of Operations.
Certain Class A shares are subject to a contingent deferred sales charge (CDSC) in the event of a shareholder redemption within 18months of purchase. Class B shares are subject to a CDSC in the event of a shareholder redemption within six years of purchase. ClassC shares are subject to a CDSC in the event of a shareholder redemption within 12 months of purchase. All contingent deferred salescharges are paid to MFD and during the six months ended February 28, 2022, were as follows:
AmountClass A $13,815Class B 1,533Class C 2,551
Shareholder Servicing Agent — MFS Service Center, Inc. (MFSC), a wholly-owned subsidiary of MFS, receives a fee from thefund for its services as shareholder servicing agent calculated as a percentage of the average daily net assets of the fund asdetermined periodically under the supervision of the fund's Board of Trustees. For the six months ended February 28, 2022, thefee was $120,013, which equated to 0.0077% annually of the fund's average daily net assets. MFSC also receivesreimbursement from the fund for out-of-pocket expenses, sub-accounting and other shareholder servicing costs which may bepaid to affiliated and unaffiliated service providers. Class R6 shares do not incur sub-accounting fees. For the six monthsended February 28, 2022, these out-of-pocket expenses, sub-accounting and other shareholder servicing costs amounted to$1,037,035.
26
Copyright © 2022 www.secdatabase.com. All Rights Reserved.Please Consider the Environment Before Printing This Document

Table of Contents
Notes to Financial Statements (unaudited) - continued
Administrator — MFS provides certain financial, legal, shareholder communications, compliance, and other administrativeservices to the fund. Under an administrative services agreement, the fund reimburses MFS the costs incurred to provide theseservices. The fund is charged an annual fixed amount of $17,500 plus a fee based on average daily net assets. Theadministrative services fee incurred for the six months ended February 28, 2022 was equivalent to an annual effective rate of0.0136% of the fund's average daily net assets.Trustees’ and Officers’ Compensation — The fund pays compensation to independent Trustees in the form of a retainer,attendance fees, and additional compensation to Board and Committee chairpersons. The fund does not pay compensationdirectly to Trustees or officers of the fund who are also officers of the investment adviser, all of whom receive remunerationfrom MFS for their services to the fund. Certain officers and Trustees of the fund are officers or directors of MFS, MFD, andMFSC.Other — The fund invests in the MFS Institutional Money Market Portfolio which is managed by MFS and seeks current incomeconsistent with preservation of capital and liquidity. This money market fund does not pay a management fee to MFS but doesincur investment and operating costs.The fund is permitted to engage in purchase and sale transactions with funds and accounts for which MFS serves as investment adviseror sub-adviser (“cross-trades”) pursuant to a policy adopted by the Board of Trustees. This policy has been designed to ensure thatcross-trades conducted by the fund comply with Rule 17a-7 under the Investment Company Act of 1940. During the six months endedFebruary 28, 2022, the fund engaged in purchase transactions pursuant to this policy, which amounted to $5,925,939.
The adviser has voluntarily undertaken to reimburse the fund from its own resources on a quarterly basis for the cost of investmentresearch embedded in the cost of the fund’s securities trades. This agreement may be rescinded at any time. For the six months endedFebruary 28, 2022, this reimbursement amounted to $282,873, which is included in “Other” income in the Statement of Operations.
(4) Portfolio SecuritiesFor the six months ended February 28, 2022, purchases and sales of investments, other than short-term obligations, aggregated$1,176,234,268 and $933,899,376, respectively.
27
Copyright © 2022 www.secdatabase.com. All Rights Reserved.Please Consider the Environment Before Printing This Document

Table of Contents
Notes to Financial Statements (unaudited) - continued
(5) Shares of Beneficial InterestThe fund's Declaration of Trust permits the Trustees to issue an unlimited number of full and fractional shares of beneficial interest.Transactions in fund shares were as follows:
Six months ended2/28/22
Year ended8/31/21
Shares Amount Shares Amount
Shares sold
Class A 3,359,376 $106,688,223 7,106,115 $261,808,137
Class B 4,953 109,466 32,268 829,093
Class C 235,907 5,047,595 433,146 11,169,435
Class I 3,949,590 150,534,554 6,149,518 265,117,227
Class R1 15,850 300,868 37,214 935,098
Class R2 105,339 2,898,287 276,164 9,252,364
Class R3 629,138 18,704,820 2,991,128 107,921,783
Class R4 186,446 6,204,335 351,621 13,821,861
Class R6 10,842,135 395,982,050 8,815,568 383,830,450
19,328,734 $686,470,198 26,192,742 $1,054,685,448
Shares issued to shareholdersin reinvestment of distributions
Class A 6,998,076 $210,222,217 2,657,076 $90,181,174
Class B 214,568 3,935,178 107,147 2,519,035
Class C 762,461 14,052,153 382,598 9,025,492
Class I 2,543,591 92,612,157 847,170 33,564,887
Class R1 81,291 1,463,235 31,334 726,956
Class R2 251,763 6,628,908 118,275 3,626,302
Class R3 1,065,411 31,919,712 331,810 11,238,415
Class R4 135,485 4,521,134 52,565 1,938,081
Class R6 5,467,893 202,858,835 2,042,242 82,118,540
17,520,539 $568,213,529 6,570,217 $234,938,882
Shares reacquired
Class A (3,360,881) $(104,322,810) (4,140,746) $(151,599,181)
Class B (155,145) (3,177,911) (241,968) (6,228,496)
Class C (526,121) (10,401,647) (1,245,222) (31,877,029)
Class I (4,256,206) (154,343,036) (2,767,511) (118,446,634)
Class R1 (41,324) (899,265) (66,023) (1,650,096)
Class R2 (247,545) (6,676,288) (461,956) (15,379,445)
Class R3 (823,427) (25,232,778) (1,129,535) (41,368,610)
Class R4 (167,954) (5,648,829) (245,037) (9,729,753)
Class R6 (2,883,174) (106,710,465) (5,975,879) (258,783,566)
(12,461,777) $(417,413,029) (16,273,877) $(635,062,810)
28
Copyright © 2022 www.secdatabase.com. All Rights Reserved.Please Consider the Environment Before Printing This Document

Table of Contents
Notes to Financial Statements (unaudited) - continued
Six months ended2/28/22
Year ended8/31/21
Shares Amount Shares Amount
Net change
Class A 6,996,571 $212,587,630 5,622,445 $200,390,130
Class B 64,376 866,733 (102,553) (2,880,368)
Class C 472,247 8,698,101 (429,478) (11,682,102)
Class I 2,236,975 88,803,675 4,229,177 180,235,480
Class R1 55,817 864,838 2,525 11,958
Class R2 109,557 2,850,907 (67,517) (2,500,779)
Class R3 871,122 25,391,754 2,193,403 77,791,588
Class R4 153,977 5,076,640 159,149 6,030,189
Class R6 13,426,854 492,130,420 4,881,931 207,165,424
24,387,496 $837,270,698 16,489,082 $654,561,520
The fund is one of several mutual funds in which certain MFS funds may invest. The MFS funds do not invest in the underlying funds forthe purpose of exercising management or control. At the end of the period, the MFS Growth Allocation Fund, the MFS ModerateAllocation Fund, the MFS Aggressive Growth Allocation Fund, and the MFS Conservative Allocation Fund were the owners of record ofapproximately 4%, 4%, 2%, and 1%, respectively, of the value of outstanding voting shares of the fund.In addition, the MFS Lifetime 2020 Fund, the MFS Lifetime 2025 Fund, the MFS Lifetime 2030 Fund, the MFS Lifetime 2035 Fund, theMFS Lifetime 2040 Fund, the MFS Lifetime 2045 Fund, the MFS Lifetime 2050 Fund, the MFS Lifetime 2055 Fund, the MFS Lifetime2060 Fund, the MFS Lifetime 2065 Fund, and the MFS Lifetime Income Fund were each the owners of record of less than 1% of thevalue of outstanding voting shares of the fund.
Effective June 1, 2019, purchases of the fund’s Class B shares are closed to new and existing investors subject to certain exceptions.Please see the fund’s prospectus for details.
(6) Line of CreditThe fund and certain other funds managed by MFS participate in a $1.25 billion unsecured committed line of credit of which $1 billion isreserved for use by the fund and certain other MFS U.S. funds. The line of credit is provided by a syndicate of banks under a creditagreement. Borrowings may be made for temporary financing needs. Interest is charged to each fund, based on its borrowings, generallyat a rate equal to the highest of one month LIBOR, the Federal Funds Effective Rate and the Overnight Bank Funding Rate, plus anagreed upon spread. A commitment fee, based on the average daily, unused portion of the committed line of credit, is allocated amongthe participating funds. In addition, the fund and other funds managed by MFS have established unsecured uncommitted borrowingarrangements with certain banks for temporary financing needs. Interest is charged to each fund, based on its borrowings, at rates equalto customary reference rates plus an agreed upon spread. For the six months ended February 28, 2022, the fund’s commitment fee andinterest expense were $5,502 and $0, respectively, and are included in “Miscellaneous” expense in the Statement of Operations.
29
Copyright © 2022 www.secdatabase.com. All Rights Reserved.Please Consider the Environment Before Printing This Document

Table of Contents
Notes to Financial Statements (unaudited) - continued
(7) Investments in Affiliated IssuersAn affiliated issuer may be considered one in which the fund owns 5% or more of the outstanding voting securities, or a company whichis under common control. For the purposes of this report, the following were affiliated issuers:
Affiliated IssuersBeginning
Value PurchasesSales
Proceeds
RealizedGain
(Loss)
Change inUnrealized
Appreciation orDepreciation
EndingValue
MFS Institutional MoneyMarket Portfolio $122,912,898 $557,781,045 $578,825,293 $— $— $101,868,650
Affiliated IssuersDividend
IncomeCapital Gain
Distributions
MFS Institutional Money Market Portfolio $31,068 $—
(8) Impacts of COVID-19The pandemic related to the global spread of novel coronavirus disease (COVID-19), which was first detected in December 2019, hasresulted in significant disruptions to global business activity and the global economy, as well as the economies of individual countries, thefinancial performance of individual companies and sectors, and the securities and commodities markets in general. Multiple surges incases globally, the availability and widespread adoption of vaccines, and the emergence of variant strains of the virus continue to createuncertainty as to the future and long-term impacts resulting from the pandemic including impacts to the prices and liquidity of the fund'sinvestments and the fund's performance.
(9) LIBOR TransitionCertain of the fund's investments, including investments in certain debt instruments and derivatives (if any), as well as borrowings by thefund and certain other contractual arrangements of the fund, may be based on the London Interbank Offered Rate (“LIBOR”). In 2017, theregulatory authority that oversees financial services firms in the United Kingdom announced plans to transition away from LIBOR by theend of 2021. In March 2021, the administrator of LIBOR announced the extension of the publication of the more commonly used U.S.dollar LIBOR settings to the end of June 2023. Although the full impacts of the transition away from LIBOR are not fully known, thetransition may result in, among other things, an increase in volatility or illiquidity of the markets for instruments that currently rely onLIBOR to determine interest rates and this could have an adverse impact on the fund's performance. With respect to the fund'saccounting for investments, including investments in certain debt instruments and derivatives, as well as borrowings by the fund and anyother contractual arrangements of the fund that undergo reference rate-related modifications as a result of the transition, managementwill rely upon the relief provided by FASB Codification Topic 848 – Reference Rate Reform (Topic 848). The guidance in Topic 848permits the fund to account for those modified contracts as a continuation of the existing contracts. Management is still evaluating theimpact to the fund of the June 30, 2023 planned discontinuation of the more commonly used U.S. dollar LIBOR settings.
30
Copyright © 2022 www.secdatabase.com. All Rights Reserved.Please Consider the Environment Before Printing This Document

Table of Contents
Notes to Financial Statements (unaudited) - continued
(10) Russia and Ukraine ConflictThe market disruptions, which began in late February 2022, associated with geopolitical events related to the conflict between Russiaand Ukraine may adversely affect the value of the fund’s assets and thus the fund’s performance. Management continues to monitorthese events and to evaluate the related impacts, if any, to the fund.
31
Copyright © 2022 www.secdatabase.com. All Rights Reserved.Please Consider the Environment Before Printing This Document
Table of Contents
PROXY VOTING POLICIES AND INFORMATION
MFS votes proxies on behalf of the fund pursuant to proxy voting policies and procedures that are available without charge, uponrequest, by calling 1-800-225-2606, by visiting mfs.com/proxyvoting, or by visiting the SEC’s Web site at http://www.sec.gov.
Information regarding how the fund voted proxies relating to portfolio securities during the most recent twelve-month period ended June30 is available by August 31 of each year without charge by visiting mfs.com/proxyvoting, or by visiting the SEC’s Web site athttp://www.sec.gov.
QUARTERLY PORTFOLIO DISCLOSURE
The fund files a complete schedule of portfolio holdings with the SEC for the first and third quarters of each fiscal year as an exhibit to itsreports on Form N-PORT. The fund's Form N-PORT reports are available on the SEC's Web site at http://www.sec.gov. A shareholdercan obtain the portfolio holdings report for the first and third quarters of the fund's fiscal year at mfs.com/openendfunds by choosing thefund's name and then scrolling to the “Resources” section and clicking on the “Prospectus and Reports” tab.
FURTHER INFORMATION
From time to time, MFS may post important information about the fund or the MFS Funds on the MFS Web site (mfs.com). Thisinformation is available at https://www.mfs.com/announcements or at mfs.com/openendfunds by choosing the fund’s name and thenscrolling to the “Resources” section and clicking on the “Announcements” tab, if any.
INFORMATION ABOUT FUND CONTRACTS AND LEGAL CLAIMS
The fund has entered into contractual arrangements with an investment adviser, administrator, distributor, shareholder servicing agent,529 program manager (if applicable), and custodian who each provide services to the fund. Unless expressly stated otherwise,shareholders are not parties to, or intended beneficiaries of these contractual arrangements, and these contractual arrangements are notintended to create any shareholder right to enforce them against the service providers or to seek any remedy under them against theservice providers, either directly or on behalf of the fund.
Under the Trust’s By-Laws and Declaration of Trust, any claims asserted against or on behalf of the MFS Funds, including claims againstTrustees and Officers, must be brought in state and federal courts located within the Commonwealth of Massachusetts.
PROVISION OF FINANCIAL REPORTS AND SUMMARY PROSPECTUSES
The fund produces financial reports every six months and updates its summary prospectus and prospectus annually. To avoid sendingduplicate copies of materials to households, only one copy of the fund’s annual and semiannual report and summary prospectus may bemailed to shareholders having the same last name and residential address on the fund’s records. However, any shareholder may contactMFSC (please see back cover for address and telephone number) to request that copies of these reports and summary prospectuses besent personally to that shareholder.
32
Copyright © 2022 www.secdatabase.com. All Rights Reserved.Please Consider the Environment Before Printing This Document

Table of Contents
Copyright © 2022 www.secdatabase.com. All Rights Reserved.Please Consider the Environment Before Printing This Document

Table of Contents
Copyright © 2022 www.secdatabase.com. All Rights Reserved.Please Consider the Environment Before Printing This Document

Table of Contents
Copyright © 2022 www.secdatabase.com. All Rights Reserved.Please Consider the Environment Before Printing This Document

Table of Contents
Save paper with eDelivery.
MFS® will send you prospectuses,reports, and proxies directly via e-mailso you will get information faster withless mailbox clutter.
To sign up:
CONTACTWEB SITEmfs.com
MFS TALK1-800-637-825524 hours a day
ACCOUNT SERVICE AND LITERATURE
Copyright © 2022 www.secdatabase.com. All Rights Reserved.Please Consider the Environment Before Printing This Document

1. Go to mfs.com.
2. Log in via MFS® Access.3. Select eDelivery.
If you own your MFS fund shares through a financial
institution or a retirement plan, MFS® TALK, MFS®
Access, or eDelivery may not be available to you.
Shareholders1-800-225-2606
Financial advisors1-800-343-2829
Retirement plan services1-800-637-1255
MAILING ADDRESSMFS Service Center, Inc.P.O. Box 219341Kansas City, MO 64121-9341
OVERNIGHT MAILMFS Service Center, Inc.Suite 219341430 W 7th StreetKansas City, MO 64105-1407
Copyright © 2022 www.secdatabase.com. All Rights Reserved.Please Consider the Environment Before Printing This Document

Semiannual ReportFebruary 28, 2022
MFS® ResearchInternational Fund
RIF-SEM
Copyright © 2022 www.secdatabase.com. All Rights Reserved.Please Consider the Environment Before Printing This Document

Copyright © 2022 www.secdatabase.com. All Rights Reserved.Please Consider the Environment Before Printing This Document

Letter from the Chair and CEO
Portfolio composition
Expense table
Portfolio of investments
Statement of assets and liabilities
Statement of operations
Statements of changes in net assets
Financial highlights
Notes to financial statements
Proxy voting policies and information
Quarterly portfolio disclosure
Further information
Information about fund contracts and legal claims
Provision of financial reports and summary prospectuses
Contact information
MFS® ResearchInternational Fund
CONTENTS
1
2
4
6
12
14
15
16
28
40
40
40
40
40
back cover
The report is prepared for the general information of shareholders. It is authorized for distribution toprospective investors only when preceded or accompanied by a current prospectus.
NOT FDIC INSURED • MAY LOSE VALUE • NO BANK GUARANTEE
Copyright © 2022 www.secdatabase.com. All Rights Reserved.Please Consider the Environment Before Printing This Document

Table of Contents
Copyright © 2022 www.secdatabase.com. All Rights Reserved.Please Consider the Environment Before Printing This Document

Table of Contents
LETTER FROM THE CHAIR AND CEO
Dear Shareholders:
As a result of Russia’s invasion of Ukraine, the danger of wider geopolitical conflict has risen to a level not seen in decades, and thiscomes as sanctions aimed at countering Russia’s actions are exacerbating already mounting inflation. Consequently, at a time whenglobal growth faces multiple headwinds, central banks have been presented with the challenge of reining in rising prices without tippingeconomies into recession. The US Federal Reserve recently raised rates for the first time since 2018 and indicated that it is likely totighten policy much more over the coming year. Meanwhile, the unsettled geopolitical backdrop and prospect of tighter financialconditions has led to increased volatility.
There are, however, encouraging signs for the markets. The Omicron wave of the coronavirusis receding outside Asia, unemployment is low, and there are signs that some global supplychain bottlenecks are beginning to ease, though events in Ukraine could hamper theseadvances. Additionally, easier Chinese monetary policy and the record pace of corporate stockbuybacks are supportive elements, albeit amid an otherwise turbulent investment environment.
It is important to have a deep understanding of company fundamentals during times of market transition, and we have built our globalresearch platform to do just that.
At MFS®, we put our clients’ assets to work responsibly by carefully navigating the increasing complexity of global markets andeconomies. Guided by our commitment to long-term investing, we tune out the noise and try to uncover what we believe are the best,most durable investment opportunities in the market. Our unique global investment platform combines collective expertise, long-termdiscipline, and thoughtful risk management to create sustainable value for investors over time.
Respectfully,
Michael W. RobergeChair and Chief Executive OfficerMFS Investment Management
April 14, 2022
The opinions expressed in this letter are subject to change and may not be relied upon for investment advice. No forecasts can beguaranteed.
Copyright © 2022 www.secdatabase.com. All Rights Reserved.Please Consider the Environment Before Printing This Document

1
Copyright © 2022 www.secdatabase.com. All Rights Reserved.Please Consider the Environment Before Printing This Document

Table of Contents
PORTFOLIO COMPOSITION
Portfolio structure
Top ten holdings
Roche Holding AG 3.4%
Nestle S.A. 3.3%
Novo Nordisk A.S., “B” 3.3%
Schneider Electric SE 2.5%
Linde PLC 2.4%
LVMH Moet Hennessy Louis Vuitton SE 2.3%
Aon PLC 1.7%
Hitachi Ltd. 1.6%
UBS Group AG 1.6%
BNP Paribas 1.5%
Global equity sectors (k)
Capital Goods 23.7%
Financial Services 20.4%
Health Care 12.3%
Technology 11.9%
Consumer Cyclicals 10.0%
Consumer Staples 9.3%
Energy 7.5%
Telecommunications/Cable Television 3.1%
Issuer country weightings (x)
Japan 19.3%
Switzerland 13.1%
United Kingdom 12.5%
France 9.1%
Germany 8.7%
United States 8.2%
Hong Kong 4.2%
Netherlands 3.7%
Denmark 3.7%
Other Countries 17.5%
Currency exposure weightings (y)
Euro 29.5%
Japanese Yen 19.3%
Swiss Franc 13.1%
British Pound Sterling 12.9%
Hong Kong Dollar 6.7%
United States Dollar 6.6%
Danish Krone 3.7%
Australian Dollar 2.4%
Canadian Dollar 2.1%
Other Currencies 3.7%
Copyright © 2022 www.secdatabase.com. All Rights Reserved.Please Consider the Environment Before Printing This Document

2
Copyright © 2022 www.secdatabase.com. All Rights Reserved.Please Consider the Environment Before Printing This Document

Table of Contents
Portfolio Composition - continued
(k) The sectors set forth above and the associated portfolio composition are based on MFS’ own custom sector classification methodology.
(o) Less than 0.1%.
(x) Represents the portfolio’s exposure to issuer countries as a percentage of a portfolio’s net assets. For purposes of this presentation, United Statesincludes Cash & Cash Equivalents and Other.
(y) Represents the portfolio’s exposure to a particular currency as a percentage of a portfolio's net assets. For purposes of this presentation, UnitedStates Dollar includes Cash & Cash Equivalents.
Cash & Cash Equivalents includes any cash, investments in money market funds, short-term securities, and other assets less liabilities. Please see theStatement of Assets and Liabilities for additional information related to the fund’s cash position and other assets and liabilities.
Other includes equivalent exposure from currency derivatives and/or any offsets to derivative positions and may be negative.
Percentages are based on net assets as of February 28, 2022.
The portfolio is actively managed and current holdings may be different.
3
Copyright © 2022 www.secdatabase.com. All Rights Reserved.Please Consider the Environment Before Printing This Document

Table of Contents
EXPENSE TABLEFund expenses borne by the shareholders during the period,September 1, 2021 through February 28, 2022
As a shareholder of the fund, you incur two types of costs: (1) transaction costs, including sales charges (loads) on certain purchase orredemption payments, and (2) ongoing costs, including management fees; distribution and service (12b-1) fees; and other fundexpenses. This example is intended to help you understand your ongoing costs (in dollars) of investing in the fund and to compare thesecosts with the ongoing costs of investing in other mutual funds.
The example is based on an investment of $1,000 invested at the beginning of the period and held for the entire period September 1,2021 through February 28, 2022.
Actual Expenses
The first line for each share class in the following table provides information about actual account values and actual expenses. You mayuse the information in this line, together with the amount you invested, to estimate the expenses that you paid over the period. Simplydivide your account value by $1,000 (for example, an $8,600 account value divided by $1,000 = 8.6), then multiply the result by thenumber in the first line under the heading entitled “Expenses Paid During Period” to estimate the expenses you paid on your accountduring this period.
Hypothetical Example for Comparison Purposes
The second line for each share class in the following table provides information about hypothetical account values and hypotheticalexpenses based on the fund’s actual expense ratio and an assumed rate of return of 5% per year before expenses, which is not thefund’s actual return. The hypothetical account values and expenses may not be used to estimate the actual ending account balance orexpenses you paid for the period. You may use this information to compare the ongoing costs of investing in the fund and other funds. Todo so, compare this 5% hypothetical example with the 5% hypothetical examples that appear in the shareholder reports of the otherfunds.
Please note that the expenses shown in the table are meant to highlight your ongoing costs only and do not reflect any transactionalcosts, such as sales charges (loads). Therefore, the second line for each share class in the table is useful in comparing ongoing costsonly, and will not help you determine the relative total costs of owning different funds. In addition, if these transactional costs wereincluded, your costs would have been higher.
4
Copyright © 2022 www.secdatabase.com. All Rights Reserved.Please Consider the Environment Before Printing This Document

Table of Contents
Expense Table - continued
ShareClass
AnnualizedExpense
Ratio
BeginningAccount Value
9/01/21
EndingAccount Value
2/28/22
ExpensesPaid DuringPeriod (p)
9/01/21-2/28/22
Actual 0.99% $1,000.00 $911.79 $4.69A
Hypothetical (h) 0.99% $1,000.00 $1,019.89 $4.96
Actual 1.74% $1,000.00 $908.54 $8.23B
Hypothetical (h) 1.74% $1,000.00 $1,016.17 $8.70
Actual 1.74% $1,000.00 $908.32 $8.23C
Hypothetical (h) 1.74% $1,000.00 $1,016.17 $8.70
Actual 0.74% $1,000.00 $912.60 $3.51I
Hypothetical (h) 0.74% $1,000.00 $1,021.12 $3.71
Actual 1.74% $1,000.00 $908.23 $8.23R1
Hypothetical (h) 1.74% $1,000.00 $1,016.17 $8.70
Actual 1.24% $1,000.00 $910.37 $5.87R2
Hypothetical (h) 1.24% $1,000.00 $1,018.65 $6.21
Actual 0.99% $1,000.00 $911.59 $4.69R3
Hypothetical (h) 0.99% $1,000.00 $1,019.89 $4.96
Actual 0.74% $1,000.00 $913.04 $3.51R4
Hypothetical (h) 0.74% $1,000.00 $1,021.12 $3.71
Actual 0.63% $1,000.00 $913.23 $2.99R6
Hypothetical (h) 0.63% $1,000.00 $1,021.67 $3.16
Actual 1.02% $1,000.00 $911.76 $4.83529A
Hypothetical (h) 1.02% $1,000.00 $1,019.74 $5.11
Actual 1.79% $1,000.00 $908.42 $8.47529B
Hypothetical (h) 1.79% $1,000.00 $1,015.92 $8.95
Actual 1.79% $1,000.00 $908.00 $8.47529C
Hypothetical (h) 1.79% $1,000.00 $1,015.92 $8.95
(h) 5% class return per year before expenses.
(p) “Expenses Paid During Period” are equal to each class’s annualized expense ratio, as shown above, multiplied by the average account value overthe period, multiplied by 181/365 (to reflect the one-half year period). Expenses paid do not include any applicable sales charges (loads). Ifthese transaction costs had been included, your costs would have been higher.
Notes to Expense Table
Each class with a Rule 12b-1 service fee is subject to a rebate of a portion of such fee. Such rebates are included in the expense ratiosabove. For Class 529A shares, this rebate reduced the expense ratio above by 0.02%. See Note 3 in the Notes to Financial Statementsfor additional information.
5
Copyright © 2022 www.secdatabase.com. All Rights Reserved.Please Consider the Environment Before Printing This Document

Table of Contents
PORTFOLIO OF INVESTMENTS2/28/22 (unaudited)
The Portfolio of Investments is a complete list of all securities owned by your fund. It is categorized by broad-based asset classes.
Issuer Shares/Par Value ($)
Common Stocks – 98.2%
Aerospace & Defense – 0.9%
MTU Aero Engines Holding AG 570,362 $ 138,263,839
Airlines – 0.5%
Ryanair Holdings PLC, ADR (a) 744,422 $ 74,226,318
Alcoholic Beverages – 2.0%
Diageo PLC 4,801,104 $ 239,915,437Kirin Holdings Co. Ltd. 5,470,200 90,894,468
$ 330,809,905
Apparel Manufacturers – 4.7%
Adidas AG 767,210 $ 182,412,616Burberry Group PLC 1,961,961 51,060,246Compagnie Financiere Richemont S.A. 1,171,820 159,845,908LVMH Moet Hennessy Louis Vuitton SE 508,485 376,234,497
$ 769,553,267
Automotive – 2.7%
Bridgestone Corp. 2,155,700 $ 89,020,109Continental AG (a) 848,508 73,066,701Koito Manufacturing Co. Ltd. 2,709,800 140,086,366Toyota Industries Corp. 1,874,900 143,142,128
$ 445,315,304
Brokerage & Asset Managers – 2.1%
Euronext N.V. 1,699,870 $ 154,098,380Hong Kong Exchanges & Clearing Ltd. 1,831,900 88,262,753London Stock Exchange Group 1,066,028 94,013,261
$ 336,374,394
Business Services – 0.8%
Nomura Research Institute Ltd. 3,885,000 $ 135,674,318
Computer Software – 2.4%
Cadence Design Systems, Inc. (a) 662,211 $ 100,278,612Naver Corp. 340,504 91,069,801NetEase.com, Inc., ADR 1,997,627 190,453,758
$ 381,802,171
6
Copyright © 2022 www.secdatabase.com. All Rights Reserved.Please Consider the Environment Before Printing This Document

Table of Contents
Portfolio of Investments (unaudited) – continued
Issuer Shares/Par Value ($)
Common Stocks – continued
Computer Software - Systems – 5.4%
Amadeus IT Group S.A. (a) 1,879,141 $ 126,292,758Constellation Software, Inc. 94,850 159,853,867EPAM Systems, Inc. (a) 166,962 34,686,356Fujitsu Ltd. 1,227,200 179,640,955Hitachi Ltd. 5,381,300 265,406,275Samsung Electronics Co. Ltd. 1,751,214 105,657,799
$ 871,538,010
Construction – 1.1%
Techtronic Industries Co. Ltd. 10,830,000 $ 180,405,919
Consumer Products – 1.8%
Kao Corp. 2,039,800 $ 96,110,474Reckitt Benckiser Group PLC 2,260,906 191,716,327
$ 287,826,801
Consumer Services – 0.9%
Carsales.com Ltd. 2,732,604 $ 41,511,212Persol Holdings Co. Ltd. 2,685,700 59,977,110SEEK Ltd. 2,444,663 48,102,662
$ 149,590,984
Electrical Equipment – 3.6%
Legrand S.A. 1,882,296 $ 179,014,631Schneider Electric SE 2,623,420 411,164,112
$ 590,178,743
Electronics – 2.2%
ASML Holding N.V. 19,100 $ 12,825,964Kyocera Corp. 1,668,300 95,819,840NXP Semiconductors N.V. 593,549 112,845,536Taiwan Semiconductor Manufacturing Co. Ltd. 6,513,326 138,681,995
$ 360,173,335
Energy - Independent – 0.6%
Woodside Petroleum Ltd. 4,331,984 $ 91,409,663
Energy - Integrated – 2.9%
Capricorn Energy PLC (a)(l) 23,358,386 $ 69,627,001Eni S.p.A. 11,218,762 173,993,192Galp Energia SGPS S.A., “B” 12,144,768 134,239,515Idemitsu Kosan Co. Ltd. 3,529,000 95,852,058
$ 473,711,766
7
Copyright © 2022 www.secdatabase.com. All Rights Reserved.Please Consider the Environment Before Printing This Document
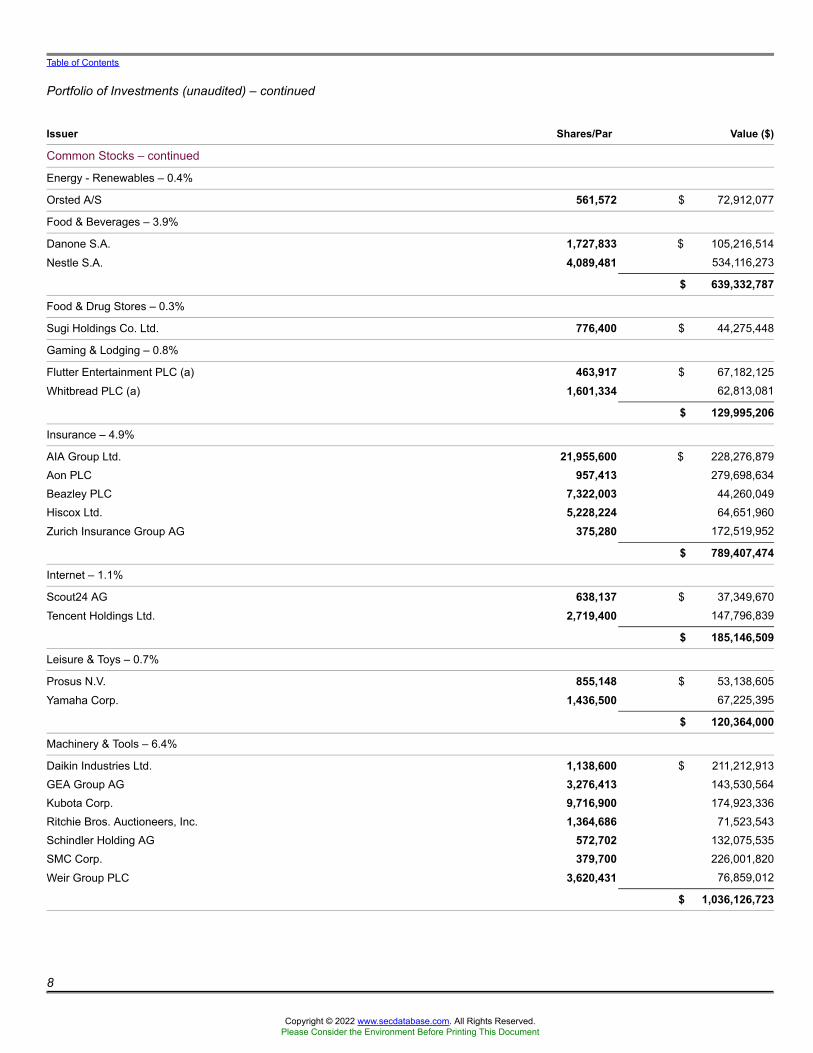
Table of Contents
Portfolio of Investments (unaudited) – continued
Issuer Shares/Par Value ($)
Common Stocks – continued
Energy - Renewables – 0.4%
Orsted A/S 561,572 $ 72,912,077
Food & Beverages – 3.9%
Danone S.A. 1,727,833 $ 105,216,514Nestle S.A. 4,089,481 534,116,273
$ 639,332,787
Food & Drug Stores – 0.3%
Sugi Holdings Co. Ltd. 776,400 $ 44,275,448
Gaming & Lodging – 0.8%
Flutter Entertainment PLC (a) 463,917 $ 67,182,125Whitbread PLC (a) 1,601,334 62,813,081
$ 129,995,206
Insurance – 4.9%
AIA Group Ltd. 21,955,600 $ 228,276,879Aon PLC 957,413 279,698,634Beazley PLC 7,322,003 44,260,049Hiscox Ltd. 5,228,224 64,651,960Zurich Insurance Group AG 375,280 172,519,952
$ 789,407,474
Internet – 1.1%
Scout24 AG 638,137 $ 37,349,670Tencent Holdings Ltd. 2,719,400 147,796,839
$ 185,146,509
Leisure & Toys – 0.7%
Prosus N.V. 855,148 $ 53,138,605Yamaha Corp. 1,436,500 67,225,395
$ 120,364,000
Machinery & Tools – 6.4%
Daikin Industries Ltd. 1,138,600 $ 211,212,913GEA Group AG 3,276,413 143,530,564Kubota Corp. 9,716,900 174,923,336Ritchie Bros. Auctioneers, Inc. 1,364,686 71,523,543Schindler Holding AG 572,702 132,075,535SMC Corp. 379,700 226,001,820Weir Group PLC 3,620,431 76,859,012
$ 1,036,126,723
8
Copyright © 2022 www.secdatabase.com. All Rights Reserved.Please Consider the Environment Before Printing This Document

Table of Contents
Portfolio of Investments (unaudited) – continued
Issuer Shares/Par Value ($)
Common Stocks – continued
Major Banks – 7.1%
Barclays PLC 70,904,971 $ 173,953,712BNP Paribas 4,243,824 249,862,869ING Groep N.V. 11,269,647 132,653,655Mitsubishi UFJ Financial Group, Inc. 17,022,800 105,797,816NatWest Group PLC 76,928,251 237,048,743UBS Group AG 14,012,829 257,994,349
$ 1,157,311,144
Medical Equipment – 3.1%
ConvaTec Group PLC 29,178,486 $ 70,555,168Koninklijke Philips N.V. 4,497,797 153,009,278QIAGEN N.V. (a) 3,806,404 191,203,235Terumo Corp. 2,872,900 93,177,639
$ 507,945,320
Metals & Mining – 1.2%
Glencore PLC 32,270,667 $ 191,411,653
Natural Gas - Distribution – 0.4%
China Resources Gas Group Ltd. 14,946,000 $ 68,565,774
Natural Gas - Pipeline – 1.0%
APA Group 7,893,561 $ 57,822,171TC Energy Corp. 1,908,343 102,531,091
$ 160,353,262
Other Banks & Diversified Financials – 4.0%
AIB Group PLC 24,781,671 $ 65,214,778HDFC Bank Ltd. 9,772,754 185,755,054Julius Baer Group Ltd. 2,169,908 127,293,698Macquarie Group Ltd. 1,128,963 149,127,218Visa, Inc., “A” 568,886 122,947,642
$ 650,338,390
Pharmaceuticals – 9.2%
Bayer AG 1,760,849 $ 101,698,841Kyowa Kirin Co. Ltd. 6,392,000 164,990,609Novo Nordisk A.S., “B” 5,187,051 533,406,828Roche Holding AG 1,462,799 558,020,096Santen Pharmaceutical Co. Ltd. 11,364,200 130,636,553
$ 1,488,752,927
Printing & Publishing – 0.7%
Wolters Kluwer N.V. 1,052,547 $ 107,182,858
9
Copyright © 2022 www.secdatabase.com. All Rights Reserved.Please Consider the Environment Before Printing This Document

Copyright © 2022 www.secdatabase.com. All Rights Reserved.Please Consider the Environment Before Printing This Document

Table of Contents
Portfolio of Investments (unaudited) – continued
Issuer Shares/Par Value ($)
Common Stocks – continued
Real Estate – 2.3%
ESR Cayman Ltd. (a) 27,789,200 $ 85,652,341Grand City Properties S.A. 5,289,372 115,826,703LEG Immobilien SE 1,361,195 175,975,413
$ 377,454,457
Restaurants – 0.8%
Yum China Holdings, Inc. 2,541,614 $ 132,214,760
Specialty Chemicals – 7.8%
Akzo Nobel N.V. 1,553,804 $ 148,087,193Croda International PLC 1,805,202 181,238,470Kansai Paint Co. Ltd. 3,387,800 67,927,164Linde PLC 1,317,990 385,113,609Nitto Denko Corp. 1,911,400 139,458,034Sika AG 566,018 188,857,821Symrise AG 1,318,443 157,439,357
$ 1,268,121,648
Specialty Stores – 0.6%
JD.com, Inc., “A” (a) 142,959 $ 5,146,676Ocado Group PLC (a) 1,785,048 32,878,443ZOZO, Inc. 2,227,900 63,781,740
$ 101,806,859
Telecommunications - Wireless – 2.7%
Advanced Info Service Public Co. Ltd. 11,569,600 $ 81,084,572Cellnex Telecom S.A. 2,059,963 93,867,545KDDI Corp. 5,141,700 168,205,929SoftBank Group Corp. 2,090,700 93,825,591
$ 436,983,637
Telephone Services – 0.5%
Hellenic Telecommunications Organization S.A. 3,790,427 $ 75,650,269
Tobacco – 1.5%
British American Tobacco PLC 5,648,198 $ 247,125,806
Utilities - Electric Power – 2.2%
CLP Holdings Ltd. 8,881,000 $ 90,405,593E.ON SE 7,325,583 99,534,922Iberdrola S.A. 14,610,053 166,763,849
$ 356,704,364
Total Common Stocks (Identified Cost, $12,694,220,693) $15,962,338,089
Copyright © 2022 www.secdatabase.com. All Rights Reserved.Please Consider the Environment Before Printing This Document

10
Copyright © 2022 www.secdatabase.com. All Rights Reserved.Please Consider the Environment Before Printing This Document

Table of Contents
Portfolio of Investments (unaudited) – continued
IssuerStrikePrice
FirstExercise Shares/Par Value ($)
Warrants – 0.0%
Apparel Manufacturers – 0.0%
Compagnie Financiere Richemont S.A. (1 share for 2 warrants,Expiration 12/04/23) (a) (Identified Cost, $18,000) CHF 67.00 11/20/23 2,052,106 $ 1,812,459
Investment Companies (h) – 1.6%
Money Market Funds – 1.6%
MFS Institutional Money Market Portfolio, 0.06% (v) (Identified Cost, $260,022,667) 260,023,175 $ 260,023,175
Collateral for Securities Loaned – 0.0%
State Street Navigator Securities Lending Government Money Market Portfolio, 0.06% (j)(Identified Cost, $440,874) 440,874 $ 440,874
Other Assets, Less Liabilities – 0.2% 32,694,602
Net Assets – 100.0% $16,257,309,199
(a) Non-income producing security.(h) An affiliated issuer, which may be considered one in which the fund owns 5% or more of the outstanding voting securities, or a company which is
under common control. At period end, the aggregate values of the fund's investments in affiliated issuers and in unaffiliated issuers were$260,023,175 and $15,964,591,422, respectively.
(j) The rate quoted is the annualized seven-day yield of the fund at period end.(l) A portion of this security is on loan. See Note 2 for additional information.(v) Affiliated issuer that is available only to investment companies managed by MFS. The rate quoted for the MFS Institutional Money Market
Portfolio is the annualized seven-day yield of the fund at period end.
The following abbreviations are used in this report and are defined:ADR American Depositary ReceiptAbbreviations indicate amounts shown in currencies other than the U.S. dollar. All amounts are stated in U.S. dollars unless otherwise indicated. A list ofabbreviations is shown below:CHF Swiss Franc
See Notes to Financial Statements
11
Copyright © 2022 www.secdatabase.com. All Rights Reserved.Please Consider the Environment Before Printing This Document

Table of Contents
Financial Statements
STATEMENT OF ASSETS AND LIABILITIESAt 2/28/22 (unaudited)
This statement represents your fund’s balance sheet, which details the assets and liabilities comprising the total value of the fund.
Assets
Investments in unaffiliated issuers, at value, including $1,719,874 of securities on loan (identified cost,$12,694,679,567) $15,964,591,422
Investments in affiliated issuers, at value (identified cost, $260,022,667) 260,023,175Foreign currency, at value (identified cost, $9,662,373) 9,662,373Receivables for
Investments sold 31,330,892Fund shares sold 29,944,934Interest and dividends 56,986,696
Other assets 94,493
Total assets $16,352,633,985
Liabilities
Payables forInvestments purchased $81,652,768Fund shares reacquired 4,309,467
Collateral for securities loaned, at value (c) 440,874Payable to affiliates
Investment adviser 1,087,394Administrative services fee 6,392Shareholder servicing costs 736,113Distribution and service fees 28,577Program manager fees 97
Payable for independent Trustees' compensation 19,132Deferred country tax expense payable 6,021,546Accrued expenses and other liabilities 1,022,426
Total liabilities $95,324,786
Net assets $16,257,309,199
Net assets consist of
Paid-in capital $13,120,770,947Total distributable earnings (loss) 3,136,538,252
Net assets $16,257,309,199
Shares of beneficial interest outstanding 728,464,965
(c) Non-cash collateral is not included.
12
Copyright © 2022 www.secdatabase.com. All Rights Reserved.Please Consider the Environment Before Printing This Document

Table of Contents
Statement of Assets and Liabilities (unaudited) – continued
Net assetsShares
outstandingNet asset value
per share (a)Class A $730,730,557 32,673,577 $22.36Class B 1,615,664 74,629 21.65Class C 13,332,094 633,549 21.04Class I 1,724,007,382 74,319,389 23.20Class R1 4,224,411 205,575 20.55Class R2 89,447,451 4,145,924 21.57Class R3 68,128,872 3,079,755 22.12Class R4 78,601,118 3,508,773 22.40Class R6 13,529,379,890 609,001,429 22.22Class 529A 15,942,012 728,327 21.89Class 529B 111,851 5,416 20.65Class 529C 1,787,897 88,622 20.17
(a) Maximum offering price per share was equal to the net asset value per share for all share classes, except for Classes A and 529A, for which themaximum offering prices per share were $23.72 [100 / 94.25 x $22.36] and $23.23 [100 / 94.25 x $21.89], respectively. On sales of $50,000 or more,the maximum offering prices of Class A and Class 529A shares are reduced. A contingent deferred sales charge may be imposed on redemptions ofClass A, Class B, Class C, Class 529B, and Class 529C shares. Redemption price per share was equal to the net asset value per share for ClassesI, R1, R2, R3, R4, R6, and 529A.
See Notes to Financial Statements
13
Copyright © 2022 www.secdatabase.com. All Rights Reserved.Please Consider the Environment Before Printing This Document

Table of Contents
Financial Statements
STATEMENT OF OPERATIONSSix months ended 2/28/22 (unaudited)
This statement describes how much your fund earned in investment income and accrued in expenses. It also describes any gains and/or losses generatedby fund operations.
Net investment income (loss)
IncomeDividends $109,531,206Income on securities loaned 57,129Dividends from affiliated issuers 38,962Interest 5,056Foreign taxes withheld (7,671,532)
Total investment income $101,960,821
ExpensesManagement fee $52,942,416Distribution and service fees 1,456,103Shareholder servicing costs 1,705,135Program manager fees 4,784Administrative services fee 283,563Independent Trustees' compensation 47,892Custodian fee 819,382Shareholder communications 81,671Audit and tax fees 42,435Legal fees 40,813Miscellaneous 211,869
Total expenses $57,636,063
Reduction of expenses by investment adviser and distributor (1,164,532)
Net expenses $56,471,531
Net investment income (loss) $45,489,290
Realized and unrealized gain (loss)
Realized gain (loss) (identified cost basis)Unaffiliated issuers (net of $747,847 country tax) $41,079,028Affiliated issuers 2,746Foreign currency 194,789
Net realized gain (loss) $41,276,563
Change in unrealized appreciation or depreciationUnaffiliated issuers (net of $1,384,220 decrease in deferred country tax) $(1,611,178,246)Affiliated issuers (2,746)Translation of assets and liabilities in foreign currencies (1,045,831)
Net unrealized gain (loss) $(1,612,226,823)
Net realized and unrealized gain (loss) $(1,570,950,260)
Change in net assets from operations $(1,525,460,970)
See Notes to Financial Statements
Copyright © 2022 www.secdatabase.com. All Rights Reserved.Please Consider the Environment Before Printing This Document

14
Copyright © 2022 www.secdatabase.com. All Rights Reserved.Please Consider the Environment Before Printing This Document

Table of Contents
Financial Statements
STATEMENTS OF CHANGES IN NET ASSETSThese statements describe the increases and/or decreases in net assets resulting from operations, any distributions, and any shareholder transactions.
Six months ended Year ended2/28/22
(unaudited)8/31/21
Change in net assetsFrom operations
Net investment income (loss) $45,489,290 $184,500,701Net realized gain (loss) 41,276,563 90,764,359Net unrealized gain (loss) (1,612,226,823) 2,885,281,816
Change in net assets from operations $(1,525,460,970) $3,160,546,876
Total distributions to shareholders $(237,804,624) $(135,001,732)
Change in net assets from fund share transactions $774,706,750 $2,527,692,762
Total change in net assets $(988,558,844) $5,553,237,906
Net assets
At beginning of period 17,245,868,043 11,692,630,137At end of period $16,257,309,199 $17,245,868,043
See Notes to Financial Statements
15
Copyright © 2022 www.secdatabase.com. All Rights Reserved.Please Consider the Environment Before Printing This Document

Table of Contents
Financial Statements
FINANCIAL HIGHLIGHTSThe financial highlights table is intended to help you understand the fund's financial performance for the semiannual period and the past5 fiscal years. Certain information reflects financial results for a single fund share. The total returns in the table represent the rate that aninvestor would have earned (or lost) on an investment in the fund share class (assuming reinvestment of all distributions) held for theentire period.
Class ASix months
ended Year ended
2/28/22(unaudited)
8/31/21 8/31/20 8/31/19 8/31/18 8/31/17
Net asset value, beginning of period $24.78 $20.09 $17.89 $19.19 $18.16 $15.83
Income (loss) from investment operations
Net investment income (loss) (d) $0.03 $0.21 $0.19 $0.32 $0.26 $0.20(c)Net realized and unrealized gain (loss) (2.20) 4.64 2.33 (0.77) 0.97 2.39
Total from investment operations $(2.17) $4.85 $2.52 $(0.45) $1.23 $2.59
Less distributions declared to shareholders
From net investment income $(0.25) $(0.16) $(0.32) $(0.72) $(0.20) $(0.26)From net realized gain — — — (0.13) — —
Total distributions declared to shareholders $(0.25) $(0.16) $(0.32) $(0.85) $(0.20) $(0.26)
Net asset value, end of period (x) $22.36 $24.78 $20.09 $17.89 $19.19 $18.16
Total return (%) (r)(s)(t)(x) (8.82)(n) 24.28 14.19 (1.82) 6.79 16.66(c)
Ratios (%) (to average net assets)and Supplemental data:
Expenses before expense reductions 1.01(a) 1.02 1.07 1.10 1.09 1.12(c)Expenses after expense reductions 0.99(a) 1.00 1.06 1.09 1.08 1.10(c)Net investment income (loss) 0.22(a)(l) 0.93 1.02 1.79 1.37 1.25(c)Portfolio turnover 7(n) 19 22 22 25 33Net assets at end of period (000 omitted) $730,731 $963,468 $772,695 $622,639 $686,128 $693,538
See Notes to Financial Statements
16
Copyright © 2022 www.secdatabase.com. All Rights Reserved.Please Consider the Environment Before Printing This Document

Table of Contents
Financial Highlights – continued
Class BSix months
ended Year ended
2/28/22(unaudited)
8/31/21 8/31/20 8/31/19 8/31/18 8/31/17
Net asset value, beginning of period $23.88 $19.36 $17.23 $18.48 $17.48 $15.21
Income (loss) from investment operations
Net investment income (loss) (d) $(0.06) $0.04 $0.04 $0.16 $0.10 $0.10(c)Net realized and unrealized gain (loss) (2.12) 4.48 2.26 (0.72) 0.95 2.28
Total from investment operations $(2.18) $4.52 $2.30 $(0.56) $1.05 $2.38
Less distributions declared to shareholders
From net investment income $(0.05) $— $(0.17) $(0.56) $(0.05) $(0.11)From net realized gain — — — (0.13) — —
Total distributions declared to shareholders $(0.05) $— $(0.17) $(0.69) $(0.05) $(0.11)
Net asset value, end of period (x) $21.65 $23.88 $19.36 $17.23 $18.48 $17.48
Total return (%) (r)(s)(t)(x) (9.15)(n) 23.35 13.38 (2.63) 6.01 15.77(c)
Ratios (%) (to average net assets)and Supplemental data:
Expenses before expense reductions 1.76(a) 1.77 1.82 1.85 1.84 1.87(c)Expenses after expense reductions 1.74(a) 1.76 1.81 1.84 1.82 1.85(c)Net investment income (loss) (0.49)(a)(l) 0.17 0.21 0.97 0.55 0.61(c)Portfolio turnover 7(n) 19 22 22 25 33Net assets at end of period (000 omitted) $1,616 $2,211 $2,631 $3,347 $4,922 $6,228
See Notes to Financial Statements
17
Copyright © 2022 www.secdatabase.com. All Rights Reserved.Please Consider the Environment Before Printing This Document

Table of Contents
Financial Highlights – continued
Class CSix months
ended Year ended
2/28/22(unaudited)
8/31/21 8/31/20 8/31/19 8/31/18 8/31/17
Net asset value, beginning of period $23.25 $18.85 $16.79 $17.99 $17.03 $14.85
Income (loss) from investment operations
Net investment income (loss) (d) $(0.06) $0.03 $0.04 $0.17 $0.08 $0.10(c)Net realized and unrealized gain (loss) (2.06) 4.37 2.19 (0.70) 0.94 2.21
Total from investment operations $(2.12) $4.40 $2.23 $(0.53) $1.02 $2.31
Less distributions declared to shareholders
From net investment income $(0.09) $— $(0.17) $(0.54) $(0.06) $(0.13)From net realized gain — — — (0.13) — —
Total distributions declared to shareholders $(0.09) $— $(0.17) $(0.67) $(0.06) $(0.13)
Net asset value, end of period (x) $21.04 $23.25 $18.85 $16.79 $17.99 $17.03
Total return (%) (r)(s)(t)(x) (9.17)(n) 23.34 13.36 (2.56) 5.97 15.74(c)
Ratios (%) (to average net assets)and Supplemental data:
Expenses before expense reductions 1.76(a) 1.77 1.82 1.85 1.84 1.87(c)Expenses after expense reductions 1.74(a) 1.75 1.81 1.84 1.83 1.85(c)Net investment income (loss) (0.52)(a)(l) 0.16 0.23 1.05 0.44 0.64(c)Portfolio turnover 7(n) 19 22 22 25 33Net assets at end of period (000 omitted) $13,332 $15,664 $17,620 $22,825 $27,800 $48,570
See Notes to Financial Statements
18
Copyright © 2022 www.secdatabase.com. All Rights Reserved.Please Consider the Environment Before Printing This Document

Table of Contents
Financial Highlights – continued
Class ISix months
ended Year ended
2/28/22(unaudited)
8/31/21 8/31/20 8/31/19 8/31/18 8/31/17
Net asset value, beginning of period $25.74 $20.85 $18.55 $19.87 $18.79 $16.38
Income (loss) from investment operations
Net investment income (loss) (d) $0.06 $0.28 $0.24 $0.37 $0.26 $0.30(c)Net realized and unrealized gain (loss) (2.27) 4.82 2.43 (0.80) 1.06 2.42
Total from investment operations $(2.21) $5.10 $2.67 $(0.43) $1.32 $2.72
Less distributions declared to shareholders
From net investment income $(0.33) $(0.21) $(0.37) $(0.76) $(0.24) $(0.31)From net realized gain — — — (0.13) — —
Total distributions declared to shareholders $(0.33) $(0.21) $(0.37) $(0.89) $(0.24) $(0.31)
Net asset value, end of period (x) $23.20 $25.74 $20.85 $18.55 $19.87 $18.79
Total return (%) (r)(s)(t)(x) (8.70)(n) 24.62 14.48 (1.61) 7.05 16.95(c)
Ratios (%) (to average net assets)and Supplemental data:
Expenses before expense reductions 0.76(a) 0.76 0.82 0.85 0.84 0.87(c)Expenses after expense reductions 0.74(a) 0.75 0.81 0.84 0.83 0.86(c)Net investment income (loss) 0.45(a)(l) 1.21 1.25 2.03 1.31 1.79(c)Portfolio turnover 7(n) 19 22 22 25 33Net assets at end of period (000 omitted) $1,724,007 $1,530,130 $898,821 $593,064 $658,193 $1,099,134
See Notes to Financial Statements
19
Copyright © 2022 www.secdatabase.com. All Rights Reserved.Please Consider the Environment Before Printing This Document

Table of Contents
Financial Highlights – continued
Class R1Six months
ended Year ended
2/28/22(unaudited)
8/31/21 8/31/20 8/31/19 8/31/18 8/31/17
Net asset value, beginning of period $22.75 $18.45 $16.46 $17.72 $16.80 $14.63
Income (loss) from investment operations
Net investment income (loss) (d) $(0.06) $0.05 $0.03 $0.15 $0.11 $0.09(c)Net realized and unrealized gain (loss) (2.02) 4.26 2.17 (0.69) 0.90 2.20
Total from investment operations $(2.08) $4.31 $2.20 $(0.54) $1.01 $2.29
Less distributions declared to shareholders
From net investment income $(0.12) $(0.01) $(0.21) $(0.59) $(0.09) $(0.12)From net realized gain — — — (0.13) — —
Total distributions declared to shareholders $(0.12) $(0.01) $(0.21) $(0.72) $(0.09) $(0.12)
Net asset value, end of period (x) $20.55 $22.75 $18.45 $16.46 $17.72 $16.80
Total return (%) (r)(s)(t)(x) (9.18)(n) 23.39 13.40 (2.62) 5.99 15.79(c)
Ratios (%) (to average net assets)and Supplemental data:
Expenses before expense reductions 1.76(a) 1.76 1.82 1.85 1.84 1.87(c)Expenses after expense reductions 1.74(a) 1.75 1.81 1.84 1.83 1.85(c)Net investment income (loss) (0.53)(a)(l) 0.24 0.19 0.95 0.60 0.61(c)Portfolio turnover 7(n) 19 22 22 25 33Net assets at end of period (000 omitted) $4,224 $3,042 $1,628 $1,751 $2,153 $2,089
See Notes to Financial Statements
20
Copyright © 2022 www.secdatabase.com. All Rights Reserved.Please Consider the Environment Before Printing This Document

Table of Contents
Financial Highlights – continued
Class R2Six months
ended Year ended
2/28/22(unaudited)
8/31/21 8/31/20 8/31/19 8/31/18 8/31/17
Net asset value, beginning of period $23.90 $19.37 $17.25 $18.53 $17.55 $15.31
Income (loss) from investment operations
Net investment income (loss) (d) $(0.00)(w) $0.15 $0.13 $0.26 $0.19 $0.17(c)Net realized and unrealized gain (loss) (2.13) 4.49 2.26 (0.75) 0.95 2.30
Total from investment operations $(2.13) $4.64 $2.39 $(0.49) $1.14 $2.47
Less distributions declared to shareholders
From net investment income $(0.20) $(0.11) $(0.27) $(0.66) $(0.16) $(0.23)From net realized gain — — — (0.13) — —
Total distributions declared to shareholders $(0.20) $(0.11) $(0.27) $(0.79) $(0.16) $(0.23)
Net asset value, end of period (x) $21.57 $23.90 $19.37 $17.25 $18.53 $17.55
Total return (%) (r)(s)(t)(x) (8.96)(n) 24.02 13.95 (2.14) 6.49 16.37(c)
Ratios (%) (to average net assets)and Supplemental data:
Expenses before expense reductions 1.26(a) 1.27 1.32 1.35 1.34 1.37(c)Expenses after expense reductions 1.24(a) 1.25 1.31 1.34 1.33 1.35(c)Net investment income (loss) (0.02)(a)(l) 0.70 0.73 1.51 1.04 1.10(c)Portfolio turnover 7(n) 19 22 22 25 33Net assets at end of period (000 omitted) $89,447 $104,975 $89,943 $98,935 $121,197 $132,988
See Notes to Financial Statements
21
Copyright © 2022 www.secdatabase.com. All Rights Reserved.Please Consider the Environment Before Printing This Document

Table of Contents
Financial Highlights – continued
Class R3Six months
ended Year ended
2/28/22(unaudited)
8/31/21 8/31/20 8/31/19 8/31/18 8/31/17
Net asset value, beginning of period $24.53 $19.88 $17.70 $18.99 $17.98 $15.67
Income (loss) from investment operations
Net investment income (loss) (d) $0.03 $0.21 $0.18 $0.30 $0.25 $0.22(c)Net realized and unrealized gain (loss) (2.18) 4.60 2.32 (0.75) 0.96 2.35
Total from investment operations $(2.15) $4.81 $2.50 $(0.45) $1.21 $2.57
Less distributions declared to shareholders
From net investment income $(0.26) $(0.16) $(0.32) $(0.71) $(0.20) $(0.26)From net realized gain — — — (0.13) — —
Total distributions declared to shareholders $(0.26) $(0.16) $(0.32) $(0.84) $(0.20) $(0.26)
Net asset value, end of period (x) $22.12 $24.53 $19.88 $17.70 $18.99 $17.98
Total return (%) (r)(s)(t)(x) (8.84)(n) 24.30 14.21 (1.83) 6.75 16.67(c)
Ratios (%) (to average net assets)and Supplemental data:
Expenses before expense reductions 1.01(a) 1.02 1.07 1.10 1.09 1.12(c)Expenses after expense reductions 0.99(a) 1.00 1.06 1.09 1.08 1.10(c)Net investment income (loss) 0.22(a)(l) 0.96 0.99 1.73 1.31 1.37(c)Portfolio turnover 7(n) 19 22 22 25 33Net assets at end of period (000 omitted) $68,129 $76,512 $63,920 $61,214 $82,289 $91,653
See Notes to Financial Statements
22
Copyright © 2022 www.secdatabase.com. All Rights Reserved.Please Consider the Environment Before Printing This Document

Table of Contents
Financial Highlights – continued
Class R4Six months
ended Year ended
2/28/22(unaudited)
8/31/21 8/31/20 8/31/19 8/31/18 8/31/17
Net asset value, beginning of period $24.86 $20.15 $17.93 $19.25 $18.21 $15.86
Income (loss) from investment operations
Net investment income (loss) (d) $0.06 $0.29 $0.23 $0.36 $0.30 $0.28(c)Net realized and unrealized gain (loss) (2.20) 4.63 2.35 (0.78) 0.98 2.35
Total from investment operations $(2.14) $4.92 $2.58 $(0.42) $1.28 $2.63
Less distributions declared to shareholders
From net investment income $(0.32) $(0.21) $(0.36) $(0.77) $(0.24) $(0.28)From net realized gain — — — (0.13) — —
Total distributions declared to shareholders $(0.32) $(0.21) $(0.36) $(0.90) $(0.24) $(0.28)
Net asset value, end of period (x) $22.40 $24.86 $20.15 $17.93 $19.25 $18.21
Total return (%) (r)(s)(t)(x) (8.70)(n) 24.58 14.49 (1.65) 7.07 16.92(c)
Ratios (%) (to average net assets)and Supplemental data:
Expenses before expense reductions 0.75(a) 0.76 0.82 0.85 0.84 0.87(c)Expenses after expense reductions 0.74(a) 0.75 0.81 0.84 0.83 0.86(c)Net investment income (loss) 0.48(a)(l) 1.26 1.24 2.04 1.57 1.73(c)Portfolio turnover 7(n) 19 22 22 25 33Net assets at end of period (000 omitted) $78,601 $96,499 $41,619 $54,352 $58,578 $63,884
See Notes to Financial Statements
23
Copyright © 2022 www.secdatabase.com. All Rights Reserved.Please Consider the Environment Before Printing This Document

Table of Contents
Financial Highlights – continued
Class R6Six months
ended Year ended
2/28/22(unaudited)
8/31/21 8/31/20 8/31/19 8/31/18 8/31/17
Net asset value, beginning of period $24.67 $19.99 $17.80 $19.11 $18.10 $15.79
Income (loss) from investment operations
Net investment income (loss) (d) $0.07 $0.29 $0.25 $0.38 $0.34 $0.28(c)Net realized and unrealized gain (loss) (2.17) 4.62 2.33 (0.77) 0.95 2.36
Total from investment operations $(2.10) $4.91 $2.58 $(0.39) $1.29 $2.64
Less distributions declared to shareholders
From net investment income $(0.35) $(0.23) $(0.39) $(0.79) $(0.28) $(0.33)From net realized gain — — — (0.13) — —
Total distributions declared to shareholders $(0.35) $(0.23) $(0.39) $(0.92) $(0.28) $(0.33)
Net asset value, end of period (x) $22.22 $24.67 $19.99 $17.80 $19.11 $18.10
Total return (%) (r)(s)(t)(x) (8.64)(n) 24.74 14.61 (1.48) 7.12 17.07(c)
Ratios (%) (to average net assets)and Supplemental data:
Expenses before expense reductions 0.65(a) 0.67 0.71 0.74 0.74 0.77(c)Expenses after expense reductions 0.63(a) 0.65 0.70 0.73 0.73 0.76(c)Net investment income (loss) 0.57(a)(l) 1.30 1.37 2.18 1.80 1.72(c)Portfolio turnover 7(n) 19 22 22 25 33Net assets at end of period (000 omitted) $13,529,380 $14,433,482 $9,787,763 $7,350,641 $6,756,773 $5,228,377
See Notes to Financial Statements
24
Copyright © 2022 www.secdatabase.com. All Rights Reserved.Please Consider the Environment Before Printing This Document

Table of Contents
Financial Highlights – continued
Class 529ASix months
ended Year ended
2/28/22(unaudited)
8/31/21 8/31/20 8/31/19 8/31/18 8/31/17
Net asset value, beginning of period $24.27 $19.68 $17.52 $18.83 $17.84 $15.61
Income (loss) from investment operations
Net investment income (loss) (d) $0.02 $0.20 $0.17 $0.31 $0.26 $0.23(c)Net realized and unrealized gain (loss) (2.14) 4.54 2.31 (0.77) 0.95 2.31
Total from investment operations $(2.12) $4.74 $2.48 $(0.46) $1.21 $2.54
Less distributions declared to shareholders
From net investment income $(0.26) $(0.15) $(0.32) $(0.72) $(0.22) $(0.31)From net realized gain — — — (0.13) — —
Total distributions declared to shareholders $(0.26) $(0.15) $(0.32) $(0.85) $(0.22) $(0.31)
Net asset value, end of period (x) $21.89 $24.27 $19.68 $17.52 $18.83 $17.84
Total return (%) (r)(s)(t)(x) (8.82)(n) 24.23 14.23 (1.94) 6.78 16.60(c)
Ratios (%) (to average net assets)and Supplemental data:
Expenses before expense reductions 1.06(a) 1.06 1.12 1.15 1.15 1.22(c)Expenses after expense reductions 1.02(a) 1.03 1.09 1.13 1.11 1.13(c)Net investment income (loss) 0.19(a)(l) 0.91 0.96 1.77 1.37 1.39(c)Portfolio turnover 7(n) 19 22 22 25 33Net assets at end of period (000 omitted) $15,942 $17,630 $13,072 $11,805 $12,615 $10,464
See Notes to Financial Statements
25
Copyright © 2022 www.secdatabase.com. All Rights Reserved.Please Consider the Environment Before Printing This Document

Table of Contents
Financial Highlights – continued
Class 529BSix months
ended Year ended
2/28/22(unaudited)
8/31/21 8/31/20 8/31/19 8/31/18 8/31/17
Net asset value, beginning of period $22.78 $18.48 $16.47 $17.72 $16.79 $14.78
Income (loss) from investment operations
Net investment income (loss) (d) $(0.06) $0.03 $0.03 $0.16 $0.10 $0.09(c)Net realized and unrealized gain (loss) (2.02) 4.27 2.16 (0.71) 0.90 2.18
Total from investment operations $(2.08) $4.30 $2.19 $(0.55) $1.00 $2.27
Less distributions declared to shareholders
From net investment income $(0.05) $— $(0.18) $(0.57) $(0.07) $(0.26)From net realized gain — — — (0.13) — —
Total distributions declared to shareholders $(0.05) $— $(0.18) $(0.70) $(0.07) $(0.26)
Net asset value, end of period (x) $20.65 $22.78 $18.48 $16.47 $17.72 $16.79
Total return (%) (r)(s)(t)(x) (9.16)(n) 23.27 13.33 (2.64) 5.94 15.68(c)
Ratios (%) (to average net assets)and Supplemental data:
Expenses before expense reductions 1.80(a) 1.82 1.87 1.90 1.90 1.97(c)Expenses after expense reductions 1.79(a) 1.80 1.86 1.89 1.88 1.90(c)Net investment income (loss) (0.58)(a)(l) 0.15 0.16 1.00 0.56 0.58(c)Portfolio turnover 7(n) 19 22 22 25 33Net assets at end of period (000 omitted) $112 $185 $230 $287 $358 $386
See Notes to Financial Statements
26
Copyright © 2022 www.secdatabase.com. All Rights Reserved.Please Consider the Environment Before Printing This Document

Table of Contents
Financial Highlights – continued
Class 529CSix months
ended Year ended
2/28/22(unaudited)
8/31/21 8/31/20 8/31/19 8/31/18 8/31/17
Net asset value, beginning of period $22.30 $18.10 $16.13 $17.38 $16.51 $14.53
Income (loss) from investment operations
Net investment income (loss) (d) $(0.06) $0.02 $0.03 $0.15 $0.09 $0.10(c)Net realized and unrealized gain (loss) (1.98) 4.19 2.12 (0.69) 0.89 2.15
Total from investment operations $(2.04) $4.21 $2.15 $(0.54) $0.98 $2.25
Less distributions declared to shareholders
From net investment income $(0.09) $(0.01) $(0.18) $(0.58) $(0.11) $(0.27)From net realized gain — — — (0.13) — —
Total distributions declared to shareholders $(0.09) $(0.01) $(0.18) $(0.71) $(0.11) $(0.27)
Net asset value, end of period (x) $20.17 $22.30 $18.10 $16.13 $17.38 $16.51
Total return (%) (r)(s)(t)(x) (9.20)(n) 23.27 13.39 (2.68) 5.93 15.78(c)
Ratios (%) (to average net assets)and Supplemental data:
Expenses before expense reductions 1.81(a) 1.82 1.87 1.90 1.90 1.97(c)Expenses after expense reductions 1.79(a) 1.80 1.85 1.89 1.87 1.89(c)Net investment income (loss) (0.58)(a)(l) 0.08 0.18 0.95 0.53 0.63(c)Portfolio turnover 7(n) 19 22 22 25 33Net assets at end of period (000 omitted) $1,788 $2,071 $2,688 $2,981 $3,572 $3,856
(a) Annualized.(c) Amount reflects a one-time reimbursement of expenses by the custodian (or former custodian) without which net investment income and
performance would be lower and expenses would be higher.(d) Per share data is based on average shares outstanding.(l) Recognition of net investment income by the fund may be affected by the timing of the declaration of dividends by companies in which the fund
invests and the actual annual net investment income ratio may differ.(n) Not annualized.(r) Certain expenses have been reduced without which performance would have been lower.(s) From time to time the fund may receive proceeds from litigation settlements, without which performance would be lower.(t) Total returns do not include any applicable sales charges.(w) Per share amount was less than $0.01.(x) The net asset values and total returns have been calculated on net assets which include adjustments made in accordance with U.S. generally
accepted accounting principles required at period end for financial reporting purposes.
See Notes to Financial Statements
27
Copyright © 2022 www.secdatabase.com. All Rights Reserved.Please Consider the Environment Before Printing This Document

Table of Contents
NOTES TO FINANCIAL STATEMENTS(unaudited)
(1) Business and OrganizationMFS Research International Fund (the fund) is a diversified series of MFS Series Trust I (the trust). The trust is organized as aMassachusetts business trust and is registered under the Investment Company Act of 1940, as amended, as an open-end managementinvestment company.
The fund is an investment company and accordingly follows the investment company accounting and reporting guidance of the FinancialAccounting Standards Board (FASB) Accounting Standards Codification Topic 946 Financial Services - Investment Companies.
(2) Significant Accounting PoliciesGeneral — The preparation of financial statements in conformity with U.S. generally accepted accounting principles requiresmanagement to make estimates and assumptions that affect the reported amounts of assets and liabilities, and disclosure ofcontingent assets and liabilities at the date of the financial statements and the reported amounts of increases and decreases innet assets from operations during the reporting period. Actual results could differ from those estimates. In the preparation ofthese financial statements, management has evaluated subsequent events occurring after the date of the fund’s Statement ofAssets and Liabilities through the date that the financial statements were issued. The fund invests in foreign securities.Investments in foreign securities are vulnerable to the effects of changes in the relative values of the local currency and theU.S. dollar and to the effects of changes in each country’s market, economic, industrial, political, regulatory, geopolitical,environmental, public health, and other conditions.Balance Sheet Offsetting — The fund's accounting policy with respect to balance sheet offsetting is that, absent an event ofdefault by the counterparty or a termination of the agreement, the International Swaps and Derivatives Association (ISDA)Master Agreement, or similar agreement, does not result in an offset of reported amounts of financial assets and financialliabilities in the Statement of Assets and Liabilities across transactions between the fund and the applicable counterparty. Thefund's right to setoff may be restricted or prohibited by the bankruptcy or insolvency laws of the particular jurisdiction to whicha specific master netting agreement counterparty is subject. Balance sheet offsetting disclosures, to the extent applicable tothe fund, have been included in the fund’s Significant Accounting Policies note under the captions for each of the fund’s in-scope financial instruments and transactions.Investment Valuations — Equity securities, including restricted equity securities, are generally valued at the last sale or officialclosing price on their primary market or exchange as provided by a third-party pricing service. Equity securities, for whichthere were no sales reported that day, are generally valued at the last quoted daily bid quotation on their primary market orexchange as provided by a third-party pricing service. Short-term instruments with a maturity at issuance of 60 days or lessmay be valued at amortized cost, which approximates market value. Open-end investment companies are generally valued atnet asset value per share. Securities and other assets generally valued on the basis of information from a third-party pricingservice may also be valued at a broker/dealer bid quotation. In determining values, third-party pricing services can utilize bothtransaction data and market information such as yield, quality, coupon rate, maturity, type of issue, trading characteristics, andother market data. The
28
Copyright © 2022 www.secdatabase.com. All Rights Reserved.Please Consider the Environment Before Printing This Document

Table of Contents
Notes to Financial Statements (unaudited) - continued
values of foreign securities and other assets and liabilities expressed in foreign currencies are converted to U.S. dollars using the meanof bid and asked prices for rates provided by a third-party pricing service.
The Board of Trustees has delegated primary responsibility for determining or causing to be determined the value of the fund’sinvestments (including any fair valuation) to the adviser pursuant to valuation policies and procedures approved by the Board. If theadviser determines that reliable market quotations are not readily available, investments are valued at fair value as determined in goodfaith by the adviser in accordance with such procedures under the oversight of the Board of Trustees. Under the fund’s valuation policiesand procedures, market quotations are not considered to be readily available for most types of debt instruments and floating rate loansand many types of derivatives. These investments are generally valued at fair value based on information from third-party pricingservices. In addition, investments may be valued at fair value if the adviser determines that an investment’s value has been materiallyaffected by events occurring after the close of the exchange or market on which the investment is principally traded (such as foreignexchange or market) and prior to the determination of the fund’s net asset value, or after the halt of trading of a specific security wheretrading does not resume prior to the close of the exchange or market on which the security is principally traded. Events that occur afterforeign markets close (such as developments in foreign markets and significant movements in the U.S. markets) and prior to thedetermination of the fund’s net asset value may be deemed to have a material effect on the value of securities traded in foreign markets.Accordingly, the fund’s foreign equity securities may often be valued at fair value. The adviser generally relies on third-party pricingservices or other information (such as the correlation with price movements of similar securities in the same or other markets; the type,cost and investment characteristics of the security; the business and financial condition of the issuer; and trading and other market data)to assist in determining whether to fair value and at what value to fair value an investment. The value of an investment for purposes ofcalculating the fund’s net asset value can differ depending on the source and method used to determine value. When fair valuation isused, the value of an investment used to determine the fund’s net asset value may differ from quoted or published prices for the sameinvestment. There can be no assurance that the fund could obtain the fair value assigned to an investment if it were to sell the investmentat the same time at which the fund determines its net asset value per share.
Various inputs are used in determining the value of the fund's assets or liabilities. These inputs are categorized into three broad levels. Incertain cases, the inputs used to measure fair value may fall into different levels of the fair value hierarchy. In such cases, an investment'slevel within the fair value hierarchy is based on the lowest level of input that is significant to the fair value measurement. The fund'sassessment of the significance of a particular input to the fair value measurement in its entirety requires judgment, and considers factorsspecific to the investment. Level 1 includes unadjusted quoted prices in active markets for identical assets or liabilities. Level 2 includesother significant observable market-based inputs (including quoted prices for similar securities, interest rates, prepayment speed, andcredit risk). Level 3 includes unobservable inputs, which may include the adviser's own assumptions in determining the fair value ofinvestments. The following is a summary of the levels used as of February 28, 2022 in valuing the fund's assets and liabilities:
29
Copyright © 2022 www.secdatabase.com. All Rights Reserved.Please Consider the Environment Before Printing This Document

Table of Contents
Notes to Financial Statements (unaudited) - continued
Financial Instruments Level 1 Level 2 Level 3 TotalEquity Securities:
Japan $— $3,143,064,088 $— $3,143,064,088Switzerland 2,132,536,091 — — 2,132,536,091United Kingdom 2,029,128,369 — — 2,029,128,369France 1,475,591,003 — — 1,475,591,003Germany 1,416,301,861 — — 1,416,301,861United States 1,035,570,389 — — 1,035,570,389Hong Kong 318,682,472 354,321,013 — 673,003,485Netherlands 606,897,553 — — 606,897,553Denmark 606,318,905 — — 606,318,905Other Countries 1,702,573,142 1,143,165,662 — 2,845,738,804
Mutual Funds 260,464,049 — — 260,464,049
Total $11,584,063,834 $4,640,550,763 $— $16,224,614,597
For further information regarding security characteristics, see the Portfolio of Investments.
Foreign Currency Translation — Purchases and sales of foreign investments, income, and expenses are converted into U.S.dollars based upon currency exchange rates prevailing on the respective dates of such transactions or on the reporting datefor foreign denominated receivables and payables. Gains and losses attributable to foreign currency exchange rates on salesof securities are recorded for financial statement purposes as net realized gains and losses on investments. Gains and lossesattributable to foreign exchange rate movements on receivables, payables, income and expenses are recorded for financialstatement purposes as foreign currency transaction gains and losses. That portion of both realized and unrealized gains andlosses on investments that results from fluctuations in foreign currency exchange rates is not separately disclosed.Security Loans — Under its Securities Lending Agency Agreement with the fund, State Street Bank and Trust Company, aslending agent, loans the securities of the fund to certain qualified institutions (the “Borrowers”) approved by the fund. Securityloans can be terminated at the discretion of either the lending agent or the fund and the related securities must be returnedwithin the earlier of the standard trade settlement period for such securities or within three business days. The loans arecollateralized by cash and/or U.S. Treasury and federal agency obligations in an amount typically at least equal to the marketvalue of the securities loaned. On loans collateralized by cash, the cash collateral is invested in a money market fund. Themarket value of the loaned securities is determined at the close of business of the fund and any additional required collateral isdelivered to the fund on the next business day. The lending agent provides the fund with indemnification against Borrowerdefault. In the event of Borrower default, the lending agent will, for the benefit of the fund, either purchase securities identicalto those loaned or, when such purchase is commercially impracticable, pay the fund the market value of the loaned securities.In return, the lending agent assumes the fund's rights to the related collateral. If the collateral value is less than the cost topurchase identical securities, the lending agent is responsible for the shortfall, but only to the extent that such shortfall is notdue to a decline in collateral value resulting from collateral reinvestment for which the fund bears the risk of loss. At periodend, the fund had investment securities on loan, all of which were classified as equity securities
30
Copyright © 2022 www.secdatabase.com. All Rights Reserved.Please Consider the Environment Before Printing This Document

Table of Contents
Notes to Financial Statements (unaudited) - continued
in the fund's Portfolio of Investments, with a fair value of $1,719,874. The fair value of the fund's investment securities on loan and arelated liability of $440,874 for cash collateral received on securities loaned are both presented gross in the Statement of Assets andLiabilities. Additionally, these loans were collateralized by U.S. Treasury Obligations of $1,316,213 held by the lending agent. Thecollateral on securities loaned exceeded the value of securities on loan at period end. The liability for cash collateral for securities loanedis carried at fair value, which is categorized as level 2 within the fair value hierarchy. A portion of the income generated upon investmentof the collateral is remitted to the Borrowers, and the remainder is allocated between the fund and the lending agent. On loanscollateralized by U.S. Treasury and/or federal agency obligations, a fee is received from the Borrower, and is allocated between the fundand the lending agent. Income from securities lending is separately reported in the Statement of Operations. The dividend and interestincome earned on the securities loaned is accounted for in the same manner as other dividend and interest income.
Indemnifications — Under the fund's organizational documents, its officers and Trustees may be indemnified against certainliabilities and expenses arising out of the performance of their duties to the fund. Additionally, in the normal course ofbusiness, the fund enters into agreements with service providers that may contain indemnification clauses. The fund'smaximum exposure under these agreements is unknown as this would involve future claims that may be made against the fundthat have not yet occurred.Investment Transactions and Income — Investment transactions are recorded on the trade date. Interest income is recorded onthe accrual basis. Dividends received in cash are recorded on the ex-dividend date. Certain dividends from foreign securitieswill be recorded when the fund is informed of the dividend if such information is obtained subsequent to the ex-dividend date.Dividend and interest payments received in additional securities are recorded on the ex-dividend or ex-interest date in anamount equal to the value of the security on such date. In determining the net gain or loss on securities sold, the cost ofsecurities is determined on the identified cost basis.The fund may receive proceeds from litigation settlements. Any proceeds received from litigation involving portfolio holdings are reflectedin the Statement of Operations in realized gain/loss if the security has been disposed of by the fund or in unrealized gain/loss if thesecurity is still held by the fund. Any other proceeds from litigation not related to portfolio holdings are reflected as other income in theStatement of Operations.
Tax Matters and Distributions — The fund intends to qualify as a regulated investment company, as defined under SubchapterM of the Internal Revenue Code, and to distribute all of its taxable income, including realized capital gains. As a result, noprovision for federal income tax is required. The fund’s federal tax returns, when filed, will remain subject to examination by theInternal Revenue Service for a three year period. Management has analyzed the fund’s tax positions taken on federal and statetax returns for all open tax years and does not believe that there are any uncertain tax positions that require recognition of a taxliability. Foreign taxes, if any, have been accrued by the fund in the accompanying financial statements in accordance with theapplicable foreign tax law. Foreign income taxes may be withheld by certain countries in which the fund invests. Additionally,capital gains realized by the fund on securities issued in or by certain foreign countries may be subject to capital gains taximposed by those countries.
31
Copyright © 2022 www.secdatabase.com. All Rights Reserved.Please Consider the Environment Before Printing This Document

Table of Contents
Notes to Financial Statements (unaudited) - continued
Distributions to shareholders are recorded on the ex-dividend date. Income and capital gain distributions are determined in accordancewith income tax regulations, which may differ from U.S. generally accepted accounting principles. Certain capital accounts in the financialstatements are periodically adjusted for permanent differences in order to reflect their tax character. These adjustments have no impacton net assets or net asset value per share. Temporary differences which arise from recognizing certain items of income, expense, gain orloss in different periods for financial statement and tax purposes will reverse at some time in the future.
Book/tax differences primarily relate to passive foreign investment companies and wash sale loss deferrals.
The tax character of distributions made during the current period will be determined at fiscal year end. The tax character of distributionsdeclared to shareholders for the last fiscal year is as follows:
Year ended8/31/21
Ordinary income (including any short-term capital gains) $135,001,732
The federal tax cost and the tax basis components of distributable earnings were as follows:
As of 2/28/22Cost of investments $13,035,073,841
Gross appreciation 3,691,856,733Gross depreciation (502,315,977)
Net unrealized appreciation (depreciation) $ 3,189,540,756As of 8/31/21Undistributed ordinary income 156,144,051Capital loss carryforwards (50,831,739)Other temporary differences (208,667)Net unrealized appreciation (depreciation) 4,794,700,201
The aggregate cost above includes prior fiscal year end tax adjustments, if applicable.
As of August 31, 2021, the fund had capital loss carryforwards available to offset future realized gains. These net capital losses may becarried forward indefinitely and their character is retained as short-term and/or long-term losses. Such losses are characterized asfollows:
Long-Term $(50,831,739)
Multiple Classes of Shares of Beneficial Interest — The fund offers multiple classes of shares, which differ in their respectivedistribution, service, and program manager fees. The fund's income, realized and unrealized gain (loss), and common expensesare allocated to shareholders based on the daily net assets of each class. Dividends are declared separately for each class.Differences in per share dividend rates are generally due to differences in separate class expenses. Class B and Class C shareswill convert to Class A shares approximately eight years after purchase. Class 529B and Class 529C shares will convert toClass 529A shares approximately eight years after purchase. On December 29, 2021, the fund announced that effective on orabout March 21, 2022,
32
Copyright © 2022 www.secdatabase.com. All Rights Reserved.Please Consider the Environment Before Printing This Document

Table of Contents
Notes to Financial Statements (unaudited) - continued
all Class 529B and Class 529C shares will be converted into Class 529A shares. The fund’s distributions declared to shareholders asreported in the Statements of Changes in Net Assets are presented by class as follows:
Six monthsended2/28/22
Yearended8/31/21
Class A $8,307,737 $6,373,940Class B 4,207 —Class C 55,254 —Class I 22,580,996 10,184,538Class R1 15,980 1,070Class R2 851,018 476,506Class R3 809,844 492,210Class R4 1,243,811 503,547Class R6 203,740,590 116,864,930Class 529A 186,947 103,537Class 529B 376 —Class 529C 7,864 1,454
Total $237,804,624 $135,001,732
(3) Transactions with AffiliatesInvestment Adviser — The fund has an investment advisory agreement with MFS to provide overall investment managementand related administrative services and facilities to the fund. The management fee is computed daily and paid monthly at thefollowing annual rates based on the fund's average daily net assets:
Up to $1 billion 0.90%In excess of $1 billion and up to $2 billion 0.80%In excess of $2 billion and up to $5 billion 0.70%In excess of $5 billion and up to $10 billion 0.60%In excess of $10 billion and up to $20 billion 0.55%In excess of $20 billion 0.50%
MFS has agreed in writing to reduce its management fee by a specified amount if certain MFS mutual fund assets exceed thresholdsagreed to by MFS and the fund's Board of Trustees. For the six months ended February 28, 2022, this management fee reductionamounted to $1,162,660, which is included in the reduction of total expenses in the Statement of Operations. The management feeincurred for the six months ended February 28, 2022 was equivalent to an annual effective rate of 0.61% of the fund's average daily netassets.
Distributor — MFS Fund Distributors, Inc. (MFD), a wholly-owned subsidiary of MFS, as distributor, received $35,727 and $2,770for the six months ended February 28, 2022, as its portion of the initial sales charge on sales of Class A and Class 529A sharesof the fund, respectively.The Board of Trustees has adopted a distribution plan for certain share classes pursuant to Rule 12b-1 of the Investment Company Act of1940.
33
Copyright © 2022 www.secdatabase.com. All Rights Reserved.Please Consider the Environment Before Printing This Document

Table of Contents
Notes to Financial Statements (unaudited) - continued
The fund's distribution plan provides that the fund will pay MFD for services provided by MFD and financial intermediaries in connectionwith the distribution and servicing of certain share classes. One component of the plan is a distribution fee paid to MFD and anothercomponent of the plan is a service fee paid to MFD. MFD may subsequently pay all, or a portion, of the distribution and/or service fees tofinancial intermediaries.
Distribution Plan Fee Table:
DistributionFee Rate (d)
ServiceFee Rate (d)
TotalDistribution
Plan (d)
AnnualEffectiveRate (e)
Distributionand Service
Fee
Class A — 0.25% 0.25% 0.25% $ 989,857
Class B 0.75% 0.25% 1.00% 1.00% 9,671
Class C 0.75% 0.25% 1.00% 1.00% 73,312
Class R1 0.75% 0.25% 1.00% 1.00% 14,648
Class R2 0.25% 0.25% 0.50% 0.50% 243,904
Class R3 — 0.25% 0.25% 0.25% 92,724
Class 529A — 0.25% 0.25% 0.23% 21,233
Class 529B 0.75% 0.25% 1.00% 1.00% 855
Class 529C 0.75% 0.25% 1.00% 1.00% 9,899
Total Distribution and ServiceFees $1,456,103
(d) In accordance with the distribution plan for certain classes, the fund pays distribution and/or service fees equal to these annual percentage rates ofeach class’s average daily net assets. The distribution and service fee rates disclosed by class represent the current rates in effect at the endof the reporting period. Any rate changes, if applicable, are detailed below.
(e) The annual effective rates represent actual fees incurred under the distribution plan for the six months ended February 28, 2022 based on eachclass's average daily net assets. MFD has voluntarily agreed to rebate a portion of each class's 0.25% service fee attributable to accounts forwhich there is no financial intermediary specified on the account except for accounts attributable to MFS or its affiliates' seed money. For thesix months ended February 28, 2022, this rebate amounted to $58, $3, $147, $1,646, and $18 for Class A, Class B, Class R2, Class 529A,and Class 529C, respectively, and is included in the reduction of total expenses in the Statement of Operations.
Certain Class A shares are subject to a contingent deferred sales charge (CDSC) in the event of a shareholder redemption within 18months of purchase. Class B and Class 529B shares are subject to a CDSC in the event of a shareholder redemption within six years ofpurchase. Class C and Class 529C shares are subject to a CDSC in the event of a shareholder redemption within 12 months ofpurchase. All contingent deferred sales charges are paid to MFD and during the six months ended February 28, 2022, were as follows:
AmountClass A $7,804Class B 709Class C 252Class 529B 151Class 529C —
34
Copyright © 2022 www.secdatabase.com. All Rights Reserved.Please Consider the Environment Before Printing This Document

Table of Contents
Notes to Financial Statements (unaudited) - continued
The fund has entered into and may from time to time enter into contracts with program managers and other parties which administer thetuition programs through which an investment in the fund’s 529 share classes is made. The fund has entered into an agreement withMFD pursuant to which MFD receives an annual fee of up to 0.05% of the average daily net assets attributable to each 529 share class.The services provided by MFD, or a third party with which MFD contracts, include recordkeeping and tax reporting and account services,as well as services designed to maintain the program’s compliance with the Internal Revenue Code and other regulatory requirements.Program manager fees for the six months ended February 28, 2022, were as follows:
FeeClass 529A $4,246Class 529B 43Class 529C 495
Total Program Manager Fees $4,784
Shareholder Servicing Agent — MFS Service Center, Inc. (MFSC), a wholly-owned subsidiary of MFS, receives a fee from thefund for its services as shareholder servicing agent calculated as a percentage of the average daily net assets of the fund asdetermined periodically under the supervision of the fund's Board of Trustees. For the six months ended February 28, 2022, thefee was $113,014, which equated to 0.0013% annually of the fund's average daily net assets. MFSC also receives reimbursementfrom the fund for out-of-pocket expenses, sub-accounting and other shareholder servicing costs which may be paid to affiliatedand unaffiliated service providers. Class R6 shares do not incur sub-accounting fees. For the six months ended February 28,2022, these out-of-pocket expenses, sub-accounting and other shareholder servicing costs amounted to $1,592,121.Administrator — MFS provides certain financial, legal, shareholder communications, compliance, and other administrativeservices to the fund. Under an administrative services agreement, the fund reimburses MFS the costs incurred to provide theseservices. The fund is charged an annual fixed amount of $17,500 plus a fee based on average daily net assets. Theadministrative services fee incurred for the six months ended February 28, 2022 was equivalent to an annual effective rate of0.0034% of the fund's average daily net assets.Trustees’ and Officers’ Compensation — The fund pays compensation to independent Trustees in the form of a retainer,attendance fees, and additional compensation to Board and Committee chairpersons. The fund does not pay compensationdirectly to Trustees or officers of the fund who are also officers of the investment adviser, all of whom receive remunerationfrom MFS for their services to the fund. Certain officers and Trustees of the fund are officers or directors of MFS, MFD, andMFSC.Other — The fund invests in the MFS Institutional Money Market Portfolio which is managed by MFS and seeks current incomeconsistent with preservation of capital and liquidity. This money market fund does not pay a management fee to MFS but doesincur investment and operating costs.
35
Copyright © 2022 www.secdatabase.com. All Rights Reserved.Please Consider the Environment Before Printing This Document

Table of Contents
Notes to Financial Statements (unaudited) - continued
(4) Portfolio SecuritiesFor the six months ended February 28, 2022, purchases and sales of investments, other than short-term obligations, aggregated$1,609,527,333 and $1,247,592,852, respectively.
(5) Shares of Beneficial InterestThe fund's Declaration of Trust permits the Trustees to issue an unlimited number of full and fractional shares of beneficial interest.Transactions in fund shares were as follows:
Six months ended2/28/22
Year ended8/31/21
Shares Amount Shares Amount
Shares sold
Class A 2,985,898 $71,548,200 7,988,814 $177,803,102
Class B 213 4,704 819 18,247
Class C 43,325 981,323 81,953 1,754,921
Class I 22,337,618 563,468,068 27,732,560 641,832,578
Class R1 86,557 1,810,082 73,014 1,530,968
Class R2 468,544 10,615,180 980,214 21,710,541
Class R3 513,385 12,001,529 970,133 21,215,643
Class R4 242,298 5,800,097 2,630,087 57,931,014
Class R6 26,484,955 628,305,956 111,039,191 2,475,567,361
Class 529A 37,662 878,229 127,430 2,796,879
Class 529B 740 16,396 433 9,509
Class 529C 9,362 203,869 12,771 256,471
53,210,557 $1,295,633,633 151,637,419 $3,402,427,234
Shares issued to shareholdersin reinvestment of distributions
Class A 313,946 $7,619,463 226,334 $4,852,592
Class B 143 3,364 — —
Class C 2,268 51,886 — —
Class I 795,596 20,017,192 403,189 8,958,852
Class R1 715 15,980 54 1,070
Class R2 36,242 849,152 22,928 474,842
Class R3 33,729 809,844 23,207 492,210
Class R4 49,603 1,205,350 22,208 476,800
Class R6 7,918,001 190,744,636 5,117,127 108,943,629
Class 529A 7,774 184,710 4,868 102,228
Class 529B 17 376 — —
Class 529C 356 7,817 75 1,454
9,158,390 $221,509,770 5,819,990 $124,303,677
36
Copyright © 2022 www.secdatabase.com. All Rights Reserved.Please Consider the Environment Before Printing This Document

Table of Contents
Notes to Financial Statements (unaudited) - continued
Six months ended2/28/22
Year ended8/31/21
Shares Amount Shares Amount
Shares reacquired
Class A (9,501,218) $(234,684,156) (7,800,633) $(173,343,749)
Class B (18,322) (423,615) (44,123) (949,284)
Class C (85,712) (1,937,959) (343,142) (7,041,169)
Class I (8,265,686) (205,459,135) (11,790,913) (275,284,618)
Class R1 (15,419) (337,321) (27,583) (567,359)
Class R2 (751,791) (17,214,890) (1,252,832) (27,165,069)
Class R3 (587,076) (13,744,789) (1,089,197) (24,160,347)
Class R4 (664,275) (16,001,587) (836,491) (18,679,345)
Class R6 (10,462,865) (251,228,099) (20,701,755) (468,833,018)
Class 529A (43,536) (1,033,005) (70,237) (1,550,370)
Class 529B (3,440) (73,566) (4,806) (99,768)
Class 529C (13,981) (298,531) (68,530) (1,364,053)
(30,413,321) $(742,436,653) (44,030,242) $(999,038,149)
Net change
Class A (6,201,374) $(155,516,493) 414,515 $9,311,945
Class B (17,966) (415,547) (43,304) (931,037)
Class C (40,119) (904,750) (261,189) (5,286,248)
Class I 14,867,528 378,026,125 16,344,836 375,506,812
Class R1 71,853 1,488,741 45,485 964,679
Class R2 (247,005) (5,750,558) (249,690) (4,979,686)
Class R3 (39,962) (933,416) (95,857) (2,452,494)
Class R4 (372,374) (8,996,140) 1,815,804 39,728,469
Class R6 23,940,091 567,822,493 95,454,563 2,115,677,972
Class 529A 1,900 29,934 62,061 1,348,737
Class 529B (2,683) (56,794) (4,373) (90,259)
Class 529C (4,263) (86,845) (55,684) (1,106,128)
31,955,626 $774,706,750 113,427,167 $2,527,692,762
The fund is one of several mutual funds in which certain MFS funds may invest. The MFS funds do not invest in the underlying funds forthe purpose of exercising management or control. At the end of the period, the MFS International Diversification Fund, the MFS GrowthAllocation Fund, the MFS Moderate Allocation Fund, the MFS Aggressive Growth Allocation Fund, and the MFS Conservative AllocationFund were the owners of record of approximately 63%, 3%, 2%, 1%, and 1%, respectively, of the value of outstanding voting shares ofthe fund. In addition,the MFS Lifetime 2020 Fund, the MFS Lifetime 2025 Fund, the MFS Lifetime 2030 Fund, the MFS Lifetime 2035Fund, the MFS Lifetime 2040 Fund, the MFS Lifetime 2045 Fund,
37
Copyright © 2022 www.secdatabase.com. All Rights Reserved.Please Consider the Environment Before Printing This Document

Table of Contents
Notes to Financial Statements (unaudited) - continued
the MFS Lifetime 2050 Fund, the MFS Lifetime 2055 Fund, the MFS Lifetime 2060 Fund, the MFS Lifetime 2065 Fund, and the MFSLifetime Income Fund, were each the owners of record of less than 1% of the value of outstanding voting shares of the fund.
Effective June 1, 2019, purchases of the fund’s Class B and Class 529B shares are closed to new and existing investors subject tocertain exceptions. On December 29, 2021, the fund announced the termination of the fund's Class 529A, Class 529B, and Class 529Cshares effective on or about June 9, 2022. In connection with the termination, all sales of Class 529B and Class 529C shares will besuspended effective after the close of business on or about March 18, 2022, and Class 529B and Class 529C shares will be convertedinto Class 529A shares of the fund effective on or about March 21, 2022. In addition, effective after the close of business on or about May13, 2022, all sales and redemptions of Class 529A shares will be suspended in anticipation of a complete redemption of Class 529Ashares on or about May 20, 2022. Please see the fund’s prospectus for details.
(6) Line of CreditThe fund and certain other funds managed by MFS participate in a $1.25 billion unsecured committed line of credit of which $1 billion isreserved for use by the fund and certain other MFS U.S. funds. The line of credit is provided by a syndicate of banks under a creditagreement. Borrowings may be made for temporary financing needs. Interest is charged to each fund, based on its borrowings, generallyat a rate equal to the highest of one month LIBOR, the Federal Funds Effective Rate and the Overnight Bank Funding Rate, plus anagreed upon spread. A commitment fee, based on the average daily, unused portion of the committed line of credit, is allocated amongthe participating funds. In addition, the fund and other funds managed by MFS have established unsecured uncommitted borrowingarrangements with certain banks for temporary financing needs. Interest is charged to each fund, based on its borrowings, at rates equalto customary reference rates plus an agreed upon spread. For the six months ended February 28, 2022, the fund’s commitment fee andinterest expense were $29,841 and $0, respectively, and are included in “Miscellaneous” expense in the Statement of Operations.
(7) Investments in Affiliated IssuersAn affiliated issuer may be considered one in which the fund owns 5% or more of the outstanding voting securities, or a company whichis under common control. For the purposes of this report, the following were affiliated issuers:
Affiliated IssuersBeginning
Value PurchasesSales
Proceeds
RealizedGain
(Loss)
Change inUnrealized
Appreciation orDepreciation
EndingValue
MFS Institutional Money MarketPortfolio $241,842,376 $825,924,376 $807,743,577 $2,746 $(2,746) $260,023,175
Affiliated IssuersDividend
IncomeCapital Gain
Distributions
MFS Institutional Money Market Portfolio $38,962 $—
38
Copyright © 2022 www.secdatabase.com. All Rights Reserved.Please Consider the Environment Before Printing This Document

Table of Contents
Notes to Financial Statements (unaudited) - continued
(8) Impacts of COVID-19The pandemic related to the global spread of novel coronavirus disease (COVID-19), which was first detected in December 2019, hasresulted in significant disruptions to global business activity and the global economy, as well as the economies of individual countries, thefinancial performance of individual companies and sectors, and the securities and commodities markets in general. Multiple surges incases globally, the availability and widespread adoption of vaccines, and the emergence of variant strains of the virus continue to createuncertainty as to the future and long-term impacts resulting from the pandemic including impacts to the prices and liquidity of the fund'sinvestments and the fund's performance.
(9) LIBOR TransitionCertain of the fund's investments, including investments in certain debt instruments and derivatives (if any), as well as borrowings by thefund and certain other contractual arrangements of the fund, may be based on the London Interbank Offered Rate (“LIBOR”). In 2017, theregulatory authority that oversees financial services firms in the United Kingdom announced plans to transition away from LIBOR by theend of 2021. In March 2021, the administrator of LIBOR announced the extension of the publication of the more commonly used U.S.dollar LIBOR settings to the end of June 2023. Although the full impacts of the transition away from LIBOR are not fully known, thetransition may result in, among other things, an increase in volatility or illiquidity of the markets for instruments that currently rely onLIBOR to determine interest rates and this could have an adverse impact on the fund's performance. With respect to the fund'saccounting for investments, including investments in certain debt instruments and derivatives, as well as borrowings by the fund and anyother contractual arrangements of the fund that undergo reference rate-related modifications as a result of the transition, managementwill rely upon the relief provided by FASB Codification Topic 848 – Reference Rate Reform (Topic 848). The guidance in Topic 848permits the fund to account for those modified contracts as a continuation of the existing contracts. Management is still evaluating theimpact to the fund of the June 30, 2023 planned discontinuation of the more commonly used U.S. dollar LIBOR settings.
(10) Russia and Ukraine ConflictThe market disruptions, which began in late February 2022, associated with geopolitical events related to the conflict between Russiaand Ukraine may adversely affect the value of the fund’s assets and thus the fund’s performance. Management continues to monitorthese events and to evaluate the related impacts, if any, to the fund.
39
Copyright © 2022 www.secdatabase.com. All Rights Reserved.Please Consider the Environment Before Printing This Document

Table of Contents
PROXY VOTING POLICIES AND INFORMATION
MFS votes proxies on behalf of the fund pursuant to proxy voting policies and procedures that are available without charge, uponrequest, by calling 1-800-225-2606, by visiting mfs.com/proxyvoting, or by visiting the SEC’s Web site at http://www.sec.gov.
Information regarding how the fund voted proxies relating to portfolio securities during the most recent twelve-month period ended June30 is available by August 31 of each year without charge by visiting mfs.com/proxyvoting, or by visiting the SEC’s Web site athttp://www.sec.gov.
QUARTERLY PORTFOLIO DISCLOSURE
The fund files a complete schedule of portfolio holdings with the SEC for the first and third quarters of each fiscal year as an exhibit to itsreports on Form N-PORT. The fund's Form N-PORT reports are available on the SEC's Web site at http://www.sec.gov. A shareholdercan obtain the portfolio holdings report for the first and third quarters of the fund's fiscal year at mfs.com/openendfunds by choosing thefund's name and then scrolling to the “Resources” section and clicking on the “Prospectus and Reports” tab.
FURTHER INFORMATION
From time to time, MFS may post important information about the fund or the MFS Funds on the MFS Web site (mfs.com). Thisinformation is available at https://www.mfs.com/announcements or at mfs.com/openendfunds by choosing the fund’s name and thenscrolling to the “Resources” section and clicking on the “Announcements” tab, if any.
INFORMATION ABOUT FUND CONTRACTS AND LEGAL CLAIMS
The fund has entered into contractual arrangements with an investment adviser, administrator, distributor, shareholder servicing agent,529 program manager (if applicable), and custodian who each provide services to the fund. Unless expressly stated otherwise,shareholders are not parties to, or intended beneficiaries of these contractual arrangements, and these contractual arrangements are notintended to create any shareholder right to enforce them against the service providers or to seek any remedy under them against theservice providers, either directly or on behalf of the fund.
Under the Trust’s By-Laws and Declaration of Trust, any claims asserted against or on behalf of the MFS Funds, including claims againstTrustees and Officers, must be brought in state and federal courts located within the Commonwealth of Massachusetts.
PROVISION OF FINANCIAL REPORTS AND SUMMARY PROSPECTUSES
The fund produces financial reports every six months and updates its summary prospectus and prospectus annually. To avoid sendingduplicate copies of materials to households, only one copy of the fund’s annual and semiannual report and summary prospectus may bemailed to shareholders having the same last name and residential address on the fund’s records. However, any shareholder may contactMFSC (please see back cover for address and telephone number) to request that copies of these reports and summary prospectuses besent personally to that shareholder.
40
Copyright © 2022 www.secdatabase.com. All Rights Reserved.Please Consider the Environment Before Printing This Document

Table of Contents
Copyright © 2022 www.secdatabase.com. All Rights Reserved.Please Consider the Environment Before Printing This Document

Table of Contents
Copyright © 2022 www.secdatabase.com. All Rights Reserved.Please Consider the Environment Before Printing This Document

Table of Contents
Copyright © 2022 www.secdatabase.com. All Rights Reserved.Please Consider the Environment Before Printing This Document

Table of Contents
Save paper with eDelivery.
MFS® will send you prospectuses,reports, and proxies directly via e-mailso you will get information faster withless mailbox clutter.
To sign up:
CONTACTWEB SITEmfs.com
MFS TALK1-800-637-825524 hours a day
ACCOUNT SERVICE AND LITERATURE
Copyright © 2022 www.secdatabase.com. All Rights Reserved.Please Consider the Environment Before Printing This Document

1. Go to mfs.com.
2. Log in via MFS® Access.3. Select eDelivery.
If you own your MFS fund shares through a financial
institution or a retirement plan, MFS® TALK, MFS®
Access, or eDelivery may not be available to you.
Shareholders1-800-225-2606
Financial advisors1-800-343-2829
Retirement plan services1-800-637-1255
MAILING ADDRESSMFS Service Center, Inc.P.O. Box 219341Kansas City, MO 64121-9341
OVERNIGHT MAILMFS Service Center, Inc.Suite 219341430 W 7th StreetKansas City, MO 64105-1407
Copyright © 2022 www.secdatabase.com. All Rights Reserved.Please Consider the Environment Before Printing This Document

Semiannual ReportFebruary 28, 2022
MFS® Technology Fund
SCT-SEM
Copyright © 2022 www.secdatabase.com. All Rights Reserved.Please Consider the Environment Before Printing This Document

Copyright © 2022 www.secdatabase.com. All Rights Reserved.Please Consider the Environment Before Printing This Document
Letter from the Chair and CEO
Portfolio composition
Expense table
Portfolio of investments
Statement of assets and liabilities
Statement of operations
Statements of changes in net assets
Financial highlights
Notes to financial statements
Proxy voting policies and information
Quarterly portfolio disclosure
Further information
Information about fund contracts and legal claims
Provision of financial reports and summary prospectuses
Contact information
MFS® Technology Fund
CONTENTS
1
2
3
5
9
11
12
13
22
34
34
34
34
34
back cover
The report is prepared for the general information of shareholders. It is authorized for distribution toprospective investors only when preceded or accompanied by a current prospectus.
NOT FDIC INSURED • MAY LOSE VALUE • NO BANK GUARANTEE
Copyright © 2022 www.secdatabase.com. All Rights Reserved.Please Consider the Environment Before Printing This Document

Table of Contents
Copyright © 2022 www.secdatabase.com. All Rights Reserved.Please Consider the Environment Before Printing This Document

Table of Contents
LETTER FROM THE CHAIR AND CEO
Dear Shareholders:
As a result of Russia’s invasion of Ukraine, the danger of wider geopolitical conflict has risen to a level not seen in decades, and thiscomes as sanctions aimed at countering Russia’s actions are exacerbating already mounting inflation. Consequently, at a time whenglobal growth faces multiple headwinds, central banks have been presented with the challenge of reining in rising prices without tippingeconomies into recession. The US Federal Reserve recently raised rates for the first time since 2018 and indicated that it is likely totighten policy much more over the coming year. Meanwhile, the unsettled geopolitical backdrop and prospect of tighter financialconditions has led to increased volatility.
There are, however, encouraging signs for the markets. The Omicron wave of the coronavirusis receding outside Asia, unemployment is low, and there are signs that some global supplychain bottlenecks are beginning to ease, though events in Ukraine could hamper theseadvances. Additionally, easier Chinese monetary policy and the record pace of corporate stockbuybacks are supportive elements, albeit amid an otherwise turbulent investment environment.
It is important to have a deep understanding of company fundamentals during times of market transition, and we have built our globalresearch platform to do just that.
At MFS®, we put our clients’ assets to work responsibly by carefully navigating the increasing complexity of global markets andeconomies. Guided by our commitment to long-term investing, we tune out the noise and try to uncover what we believe are the best,most durable investment opportunities in the market. Our unique global investment platform combines collective expertise, long-termdiscipline, and thoughtful risk management to create sustainable value for investors over time.
Respectfully,
Michael W. RobergeChair and Chief Executive OfficerMFS Investment Management
April 14, 2022
The opinions expressed in this letter are subject to change and may not be relied upon for investment advice. No forecasts can beguaranteed.
Copyright © 2022 www.secdatabase.com. All Rights Reserved.Please Consider the Environment Before Printing This Document

1
Copyright © 2022 www.secdatabase.com. All Rights Reserved.Please Consider the Environment Before Printing This Document

Table of Contents
PORTFOLIO COMPOSITION
Cash & Cash Equivalents includes any cash, investments in money market funds, short-term securities, and other assets less liabilities. Please see theStatement of Assets and Liabilities for additional information related to the fund’s cash position and other assets and liabilities.
Percentages are based on net assets as of February 28, 2022.
The portfolio is actively managed and current holdings may be different.
2
Portfolio structure
Top ten holdings
Microsoft Corp. 11.9%
Amazon.com, Inc. 9.8%
Alphabet, Inc., “A” 9.8%
Mastercard, Inc., “A” 4.8%
Adobe Systems, Inc. 3.4%
NVIDIA Corp. 3.4%
Global Payments, Inc. 3.0%
Booking Holdings, Inc. 3.0%
Advanced Micro Devices 2.7%
salesforce.com, inc. 2.2%
Top five industries
Computer Software 23.8%
Business Services 14.4%
Internet 12.8%
Electronics 11.3%
Specialty Stores 10.3%
Copyright © 2022 www.secdatabase.com. All Rights Reserved.Please Consider the Environment Before Printing This Document

Table of Contents
EXPENSE TABLEFund expenses borne by the shareholders during the period,September 1, 2021 through February 28, 2022
As a shareholder of the fund, you incur two types of costs: (1) transaction costs, including sales charges (loads) on certain purchase orredemption payments, and (2) ongoing costs, including management fees; distribution and service (12b-1) fees; and other fundexpenses. This example is intended to help you understand your ongoing costs (in dollars) of investing in the fund and to compare thesecosts with the ongoing costs of investing in other mutual funds.
The example is based on an investment of $1,000 invested at the beginning of the period and held for the entire period September 1,2021 through February 28, 2022.
Actual Expenses
The first line for each share class in the following table provides information about actual account values and actual expenses. You mayuse the information in this line, together with the amount you invested, to estimate the expenses that you paid over the period. Simplydivide your account value by $1,000 (for example, an $8,600 account value divided by $1,000 = 8.6), then multiply the result by thenumber in the first line under the heading entitled “Expenses Paid During Period” to estimate the expenses you paid on your accountduring this period.
Hypothetical Example for Comparison Purposes
The second line for each share class in the following table provides information about hypothetical account values and hypotheticalexpenses based on the fund’s actual expense ratio and an assumed rate of return of 5% per year before expenses, which is not thefund’s actual return. The hypothetical account values and expenses may not be used to estimate the actual ending account balance orexpenses you paid for the period. You may use this information to compare the ongoing costs of investing in the fund and other funds. Todo so, compare this 5% hypothetical example with the 5% hypothetical examples that appear in the shareholder reports of the otherfunds.
Please note that the expenses shown in the table are meant to highlight your ongoing costs only and do not reflect any transactionalcosts, such as sales charges (loads). Therefore, the second line for each share class in the table is useful in comparing ongoing costsonly, and will not help you determine the relative total costs of owning different funds. In addition, if these transactional costs wereincluded, your costs would have been higher.
3
Copyright © 2022 www.secdatabase.com. All Rights Reserved.Please Consider the Environment Before Printing This Document

Table of Contents
Expense Table - continued
ShareClass
AnnualizedExpense
Ratio
BeginningAccount Value
9/01/21
EndingAccount Value
2/28/22
ExpensesPaid DuringPeriod (p)
9/01/21-2/28/22
Actual 1.11% $1,000.00 $841.59 $5.07A
Hypothetical (h) 1.11% $1,000.00 $1,019.29 $5.56
Actual 1.86% $1,000.00 $838.43 $8.48B
Hypothetical (h) 1.86% $1,000.00 $1,015.57 $9.30
Actual 1.86% $1,000.00 $838.33 $8.48C
Hypothetical (h) 1.86% $1,000.00 $1,015.57 $9.30
Actual 0.86% $1,000.00 $842.54 $3.93I
Hypothetical (h) 0.86% $1,000.00 $1,020.53 $4.31
Actual 1.87% $1,000.00 $838.44 $8.52R1
Hypothetical (h) 1.87% $1,000.00 $1,015.52 $9.35
Actual 1.36% $1,000.00 $840.44 $6.21R2
Hypothetical (h) 1.36% $1,000.00 $1,018.05 $6.80
Actual 1.11% $1,000.00 $841.47 $5.07R3
Hypothetical (h) 1.11% $1,000.00 $1,019.29 $5.56
Actual 0.86% $1,000.00 $842.48 $3.93R4
Hypothetical (h) 0.86% $1,000.00 $1,020.53 $4.31
Actual 0.76% $1,000.00 $843.02 $3.47R6
Hypothetical (h) 0.76% $1,000.00 $1,021.03 $3.81
(h) 5% class return per year before expenses.
(p) “Expenses Paid During Period” are equal to each class’s annualized expense ratio, as shown above, multiplied by the average account value overthe period, multiplied by 181/365 (to reflect the one-half year period). Expenses paid do not include any applicable sales charges (loads). Ifthese transaction costs had been included, your costs would have been higher.
4
Copyright © 2022 www.secdatabase.com. All Rights Reserved.Please Consider the Environment Before Printing This Document

Table of Contents
PORTFOLIO OF INVESTMENTS2/28/22 (unaudited)
The Portfolio of Investments is a complete list of all securities owned by your fund. It is categorized by broad-based asset classes.
Issuer Shares/Par Value ($)
Common Stocks – 96.7%
Broadcasting – 0.4%
Netflix, Inc. (a) 19,851 $ 7,831,616
Brokerage & Asset Managers – 2.8%
Charles Schwab Corp. 214,891 $ 18,149,694CME Group, Inc. 62,101 14,688,749Morningstar, Inc. 26,445 7,421,789Tradeweb Markets, Inc. 112,693 9,520,305
$ 49,780,537
Business Services – 14.4%
Accenture PLC, “A” 47,796 $ 15,104,492Clarivate PLC (a) 709,114 10,622,528Endava PLC, ADR (a) 156,988 20,907,662Equifax, Inc. 43,418 9,479,886Fidelity National Information Services, Inc. 312,455 29,755,090FleetCor Technologies, Inc. (a) 92,340 21,626,028Global Payments, Inc. 403,580 53,829,505MSCI, Inc. 15,634 7,843,421Paya, Inc. (a) 1,443,906 9,313,194PayPal Holdings, Inc. (a) 226,912 25,398,260TaskUs, Inc., “A” (a) 186,516 5,356,739Thoughtworks Holding, Inc. (a) 615,130 14,061,872Verisk Analytics, Inc., “A” 67,683 12,002,903WEX, Inc. (a) 146,725 24,724,630
$ 260,026,210
Cable TV – 0.2%
Charter Communications, Inc., “A” (a) 6,367 $ 3,831,533
Computer Software – 23.8%
Adobe Systems, Inc. (a) 133,060 $ 62,229,501Asana, Inc. (a) 20,783 1,138,701Atlassian Corp. PLC, “A” (a) 42,324 12,939,293Autodesk, Inc. (a) 49,481 10,897,201Avalara, Inc. (a) 45,720 4,750,765Black Knight, Inc. (a) 206,970 11,629,644Dun & Bradstreet Holdings, Inc. (a) 461,096 8,557,942Eventbrite, Inc. (a) 65,150 984,416Freshworks, Inc, “A” (a) 99,712 1,826,724Intuit, Inc. 63,872 30,298,961Microsoft Corp. (s) 720,072 215,150,313
Copyright © 2022 www.secdatabase.com. All Rights Reserved.Please Consider the Environment Before Printing This Document

5
Copyright © 2022 www.secdatabase.com. All Rights Reserved.Please Consider the Environment Before Printing This Document

Table of Contents
Portfolio of Investments (unaudited) – continued
Issuer Shares/Par Value ($)
Common Stocks – continued
Computer Software – continued
Paycor HCM, Inc. (a) 301,552 $ 8,464,565Qualtrics International, “A” (a) 135,143 4,098,887RAKUS Co. Ltd. 41,000 696,128RingCentral, Inc. (a) 74,617 9,762,888salesforce.com, inc. (a) 188,053 39,590,798Topicus.com, Inc. (a) 105,492 7,417,315
$ 430,434,042
Computer Software - Systems – 7.5%
Apple, Inc. (s) 128,385 $ 21,198,931Block, Inc., “A” (a) 41,628 5,307,570Constellation Software, Inc. 11,845 19,962,773Descartes Systems Group, Inc. (a) 179,004 12,755,536HubSpot, Inc. (a) 24,125 12,665,625Nuvei Corp. (a) 87,812 4,767,313Q2 Holdings, Inc. (a) 109,947 7,152,052ServiceNow, Inc. (a) 59,451 34,476,824TransUnion 129,823 11,782,736Wix.com Ltd. (a) 57,075 5,226,929
$ 135,296,289
Consumer Services – 3.5%
Booking Holdings, Inc. (a) 24,728 $ 53,715,398Uber Technologies, Inc. (a) 286,498 10,322,523
$ 64,037,921
Electronics – 11.3%
Advanced Micro Devices (a)(s) 395,205 $ 48,744,599KLA Corp. 64,395 22,441,658Lam Research Corp. 50,915 28,581,135Marvell Technology, Inc. 347,789 23,764,422Micron Technology, Inc. 215,584 19,156,794NVIDIA Corp. 253,781 61,884,497
$ 204,573,105
Insurance – 0.9%
Arthur J. Gallagher & Co. 96,620 $ 15,284,318
Internet – 12.8%
Alphabet, Inc., “A” (a)(s) 65,317 $ 176,430,361Match Group, Inc. (a) 34,472 3,843,283Mercadolibre, Inc. (a) 7,466 8,411,569Meta Platforms, Inc., “A” (a) 83,713 17,665,955Pinterest, Inc. (a) 101,343 2,710,925
Copyright © 2022 www.secdatabase.com. All Rights Reserved.Please Consider the Environment Before Printing This Document

6
Copyright © 2022 www.secdatabase.com. All Rights Reserved.Please Consider the Environment Before Printing This Document

Table of Contents
Portfolio of Investments (unaudited) – continued
Issuer Shares/Par Value ($)
Common Stocks – continued
Internet – continued
Tencent Holdings Ltd. 409,300 $ 22,245,071
$ 231,307,164
Leisure & Toys – 1.3%
Activision Blizzard, Inc. 136,800 $ 11,149,200Take-Two Interactive Software, Inc. (a) 78,116 12,654,792
$ 23,803,992
Machinery & Tools – 0.0%
Xometry, Inc., “A” (a)(l) 16,147 $ 789,750
Medical & Health Technology & Services – 0.2%
Guardant Health, Inc. (a) 55,006 $ 3,645,248
Medical Equipment – 0.7%
Bio-Techne Corp. 9,215 $ 3,864,863Maravai Lifesciences Holdings, Inc., “A” (a) 216,905 8,474,478
$ 12,339,341
Other Banks & Diversified Financials – 6.6%
Mastercard, Inc., “A” 240,805 $ 86,887,260Visa, Inc., “A” 145,972 31,547,469
$ 118,434,729
Specialty Stores – 10.3%
Amazon.com, Inc. (a)(s) 57,904 $ 177,838,239Farfetch Ltd., “A” (a) 179,094 3,411,741JD.com, Inc., “A” (a) 19,490 701,661Pinduoduo, Inc., ADR (a) 71,520 3,709,027Sea Ltd., ADR (a) 5,644 821,766
$ 186,482,434
Total Common Stocks (Identified Cost, $969,395,083) $ 1,747,898,229
Investment Companies (h) – 3.3%
Money Market Funds – 3.3%
MFS Institutional Money Market Portfolio, 0.06% (v) (Identified Cost, $58,451,025) 58,451,025 $ 58,451,025
Collateral for Securities Loaned – 0.0%
State Street Navigator Securities Lending Government Money Market Portfolio, 0.06% (j)(Identified Cost, $383,468) 383,468 $ 383,468
Other Assets, Less Liabilities – 0.0% 269,853
Net Assets – 100.0% $ 1,807,002,575
7
Copyright © 2022 www.secdatabase.com. All Rights Reserved.Please Consider the Environment Before Printing This Document

Table of Contents
Portfolio of Investments (unaudited) – continued
(a) Non-income producing security.(h) An affiliated issuer, which may be considered one in which the fund owns 5% or more of the outstanding voting securities, or a company which is
under common control. At period end, the aggregate values of the fund's investments in affiliated issuers and in unaffiliated issuers were$58,451,025 and $1,748,281,697, respectively.
(j) The rate quoted is the annualized seven-day yield of the fund at period end.(l) A portion of this security is on loan. See Note 2 for additional information.(s) Security or a portion of the security was pledged to cover collateral requirements for securities sold short and/or certain derivative transactions.(v) Affiliated issuer that is available only to investment companies managed by MFS. The rate quoted for the MFS Institutional Money Market
Portfolio is the annualized seven-day yield of the fund at period end.
The following abbreviations are used in this report and are defined:ADR American Depositary Receipt
At February 28, 2022, the fund had cash collateral of $57,207 and other liquid securities with an aggregate value of $563,196 to cover any collateral ormargin obligations for securities sold short and certain derivative contracts. Restricted cash and/or deposits with brokers in the Statement of Assets andLiabilities are comprised of cash collateral.
See Notes to Financial Statements
8
Copyright © 2022 www.secdatabase.com. All Rights Reserved.Please Consider the Environment Before Printing This Document

Table of Contents
Financial Statements
STATEMENT OF ASSETS AND LIABILITIESAt 2/28/22 (unaudited)
This statement represents your fund’s balance sheet, which details the assets and liabilities comprising the total value of the fund.
Assets
Investments in unaffiliated issuers, at value, including $394,850 of securities on loan (identified cost, $969,778,551) $1,748,281,697Investments in affiliated issuers, at value (identified cost, $58,451,025) 58,451,025Deposits with brokers for
Securities sold short 57,207Receivables for
Investments sold 1,687,227Fund shares sold 2,392,856Interest and dividends 1,306,583
Other assets 54,162
Total assets $1,812,230,757
Liabilities
Payables forInvestments purchased $1,484,066Fund shares reacquired 2,711,912
Collateral for securities loaned, at value 383,468Payable to affiliates
Investment adviser 140,510Administrative services fee 2,769Shareholder servicing costs 339,328Distribution and service fees 43,564
Payable for independent Trustees' compensation 6,152Accrued expenses and other liabilities 116,413
Total liabilities $5,228,182
Net assets $1,807,002,575
Net assets consist of
Paid-in capital $898,957,765Total distributable earnings (loss) 908,044,810
Net assets $1,807,002,575
Shares of beneficial interest outstanding 31,533,429
9
Copyright © 2022 www.secdatabase.com. All Rights Reserved.Please Consider the Environment Before Printing This Document

Table of Contents
Statement of Assets and Liabilities (unaudited) – continued
Net assetsShares
outstandingNet asset value
per share (a)Class A $710,875,697 12,569,559 $56.56Class B 32,481,179 714,719 45.45Class C 150,670,880 3,324,510 45.32Class I 476,251,422 7,677,525 62.03Class R1 9,088,324 201,078 45.20Class R2 28,635,092 543,691 52.67Class R3 67,627,593 1,196,745 56.51Class R4 33,768,815 562,610 60.02Class R6 297,603,573 4,742,992 62.75
(a) Maximum offering price per share was equal to the net asset value per share for all share classes, except for Class A, for which the maximumoffering price per share was $60.01 [100 / 94.25 x $56.56]. On sales of $50,000 or more, the maximum offering price of Class A shares is reduced. Acontingent deferred sales charge may be imposed on redemptions of Class A, Class B, and Class C shares. Redemption price per share was equalto the net asset value per share for Classes I, R1, R2, R3, R4, and R6.
See Notes to Financial Statements
10
Copyright © 2022 www.secdatabase.com. All Rights Reserved.Please Consider the Environment Before Printing This Document

Table of Contents
Financial Statements
STATEMENT OF OPERATIONSSix months ended 2/28/22 (unaudited)
This statement describes how much your fund earned in investment income and accrued in expenses. It also describes any gains and/or losses generatedby fund operations.
Net investment income (loss)
IncomeDividends $3,247,996Other 51,284Dividends from affiliated issuers 9,625Income on securities loaned 3,848Foreign taxes withheld (3,797)
Total investment income $3,308,956
ExpensesManagement fee $7,765,346Distribution and service fees 2,361,771Shareholder servicing costs 1,038,863Administrative services fee 147,087Independent Trustees' compensation 14,987Custodian fee 59,122Shareholder communications 36,866Audit and tax fees 30,918Legal fees 6,030Miscellaneous 117,288
Total expenses $11,578,278
Reduction of expenses by investment adviser and distributor (147,927)
Net expenses $11,430,351
Net investment income (loss) $(8,121,395)
Realized and unrealized gain (loss)
Realized gain (loss) (identified cost basis)Unaffiliated issuers $191,598,963Foreign currency 6,053
Net realized gain (loss) $191,605,016
Change in unrealized appreciation or depreciationUnaffiliated issuers $(535,256,638)Translation of assets and liabilities in foreign currencies (64)
Net unrealized gain (loss) $(535,256,702)
Net realized and unrealized gain (loss) $(343,651,686)
Change in net assets from operations $(351,773,081)
See Notes to Financial Statements
Copyright © 2022 www.secdatabase.com. All Rights Reserved.Please Consider the Environment Before Printing This Document

11
Copyright © 2022 www.secdatabase.com. All Rights Reserved.Please Consider the Environment Before Printing This Document

Table of Contents
Financial Statements
STATEMENTS OF CHANGES IN NET ASSETSThese statements describe the increases and/or decreases in net assets resulting from operations, any distributions, and any shareholder transactions.
Six months ended Year ended2/28/22
(unaudited)8/31/21
Change in net assetsFrom operations
Net investment income (loss) $(8,121,395) $(17,168,546)Net realized gain (loss) 191,605,016 262,544,681Net unrealized gain (loss) (535,256,702) 206,014,483
Change in net assets from operations $(351,773,081) $451,390,618
Total distributions to shareholders $(249,750,373) $(109,208,449)
Change in net assets from fund share transactions $75,735,026 $(52,798,844)
Total change in net assets $(525,788,428) $289,383,325
Net assets
At beginning of period 2,332,791,003 2,043,407,678At end of period $1,807,002,575 $2,332,791,003
See Notes to Financial Statements
12
Copyright © 2022 www.secdatabase.com. All Rights Reserved.Please Consider the Environment Before Printing This Document

Table of Contents
Financial Statements
FINANCIAL HIGHLIGHTSThe financial highlights table is intended to help you understand the fund's financial performance for the semiannual period and the past5 fiscal years. Certain information reflects financial results for a single fund share. The total returns in the table represent the rate that aninvestor would have earned (or lost) on an investment in the fund share class (assuming reinvestment of all distributions) held for theentire period.
Class ASix months
ended Year ended
2/28/22(unaudited)
8/31/21 8/31/20 8/31/19 8/31/18 8/31/17
Net asset value, beginning of period $75.65 $64.90 $44.73 $45.65 $35.67 $28.27
Income (loss) from investment operations
Net investment income (loss) (d) $(0.27) $(0.57) $(0.35) $(0.27) $(0.26) $(0.19)(c)Net realized and unrealized gain (loss) (10.47) 14.83 21.50 1.24 11.61 8.13
Total from investment operations $(10.74) $14.26 $21.15 $0.97 $11.35 $7.94
Less distributions declared to shareholders
From net realized gain $(8.35) $(3.51) $(0.98) $(1.89) $(1.37) $(0.54)
Net asset value, end of period (x) $56.56 $75.65 $64.90 $44.73 $45.65 $35.67
Total return (%) (r)(s)(t)(x) (15.84)(n) 22.97 48.23 2.97 32.79 28.58(c)
Ratios (%) (to average net assets)and Supplemental data:
Expenses before expense reductions 1.13(a) 1.12 1.18 1.19 1.24 1.24(c)Expenses after expense reductions 1.11(a) 1.11 1.16 1.18 1.22 1.23(c)Net investment income (loss) (0.80)(a) (0.85) (0.71) (0.64) (0.66) (0.63)(c)Portfolio turnover 20(n) 36 46 32 30 43Net assets at end of period (000 omitted) $710,876 $888,416 $745,157 $471,468 $484,477 $359,698
Supplemental Ratios (%):
Ratios of expenses to average net assets after expensereductions excluding short sale expenses and interestexpense and fees N/A 1.11 1.13 1.15 1.16 1.19(c)
See Notes to Financial Statements
13
Copyright © 2022 www.secdatabase.com. All Rights Reserved.Please Consider the Environment Before Printing This Document

Table of Contents
Financial Highlights – continued
Class BSix months
ended Year ended
2/28/22(unaudited)
8/31/21 8/31/20 8/31/19 8/31/18 8/31/17
Net asset value, beginning of period $62.67 $54.73 $38.16 $39.55 $31.31 $25.06
Income (loss) from investment operations
Net investment income (loss) (d) $(0.43) $(0.89) $(0.61) $(0.50) $(0.49) $(0.38)(c)Net realized and unrealized gain (loss) (8.44) 12.34 18.16 1.00 10.10 7.17
Total from investment operations $(8.87) $11.45 $17.55 $0.50 $9.61 $6.79
Less distributions declared to shareholders
From net realized gain $(8.35) $(3.51) $(0.98) $(1.89) $(1.37) $(0.54)
Net asset value, end of period (x) $45.45 $62.67 $54.73 $38.16 $39.55 $31.31
Total return (%) (r)(s)(t)(x) (16.16)(n) 22.06 47.07 2.21 31.77 27.64(c)
Ratios (%) (to average net assets)and Supplemental data:
Expenses before expense reductions 1.88(a) 1.87 1.93 1.94 1.99 1.99(c)Expenses after expense reductions 1.86(a) 1.86 1.92 1.93 1.98 1.98(c)Net investment income (loss) (1.56)(a) (1.59) (1.46) (1.39) (1.41) (1.38)(c)Portfolio turnover 20(n) 36 46 32 30 43Net assets at end of period (000 omitted) $32,481 $44,390 $46,224 $41,017 $45,337 $34,396
Supplemental Ratios (%):
Ratios of expenses to average net assets after expense reductionsexcluding short sale expenses and interest expense and fees N/A 1.86 1.88 1.90 1.92 1.94(c)
See Notes to Financial Statements
14
Copyright © 2022 www.secdatabase.com. All Rights Reserved.Please Consider the Environment Before Printing This Document

Table of Contents
Financial Highlights – continued
Class CSix months
ended Year ended
2/28/22(unaudited)
8/31/21 8/31/20 8/31/19 8/31/18 8/31/17
Net asset value, beginning of period $62.52 $54.61 $38.07 $39.47 $31.24 $25.01
Income (loss) from investment operations
Net investment income (loss) (d) $(0.43) $(0.88) $(0.61) $(0.50) $(0.49) $(0.38)(c)Net realized and unrealized gain (loss) (8.42) 12.30 18.13 0.99 10.09 7.15
Total from investment operations $(8.85) $11.42 $17.52 $0.49 $9.60 $6.77
Less distributions declared to shareholders
From net realized gain $(8.35) $(3.51) $(0.98) $(1.89) $(1.37) $(0.54)
Net asset value, end of period (x) $45.32 $62.52 $54.61 $38.07 $39.47 $31.24
Total return (%) (r)(s)(t)(x) (16.17)(n) 22.06 47.11 2.19 31.81 27.62(c)
Ratios (%) (to average net assets)and Supplemental data:
Expenses before expense reductions 1.88(a) 1.87 1.93 1.94 1.98 1.99(c)Expenses after expense reductions 1.86(a) 1.86 1.92 1.93 1.97 1.98(c)Net investment income (loss) (1.56)(a) (1.59) (1.46) (1.40) (1.41) (1.38)(c)Portfolio turnover 20(n) 36 46 32 30 43Net assets at end of period (000 omitted) $150,671 $194,857 $183,286 $128,817 $128,707 $101,656
Supplemental Ratios (%):
Ratios of expenses to average net assets after expensereductions excluding short sale expenses and interestexpense and fees N/A 1.86 1.88 1.91 1.92 1.94(c)
See Notes to Financial Statements
15
Copyright © 2022 www.secdatabase.com. All Rights Reserved.Please Consider the Environment Before Printing This Document

Table of Contents
Financial Highlights – continued
Class ISix months
ended Year ended
2/28/22(unaudited)
8/31/21 8/31/20 8/31/19 8/31/18 8/31/17
Net asset value, beginning of period $82.06 $69.94 $48.02 $48.74 $37.90 $29.93
Income (loss) from investment operations
Net investment income (loss) (d) $(0.20) $(0.43) $(0.25) $(0.18) $(0.18) $(0.13)(c)Net realized and unrealized gain (loss) (11.48) 16.06 23.15 1.35 12.39 8.64
Total from investment operations $(11.68) $15.63 $22.90 $1.17 $12.21 $8.51
Less distributions declared to shareholders
From net realized gain $(8.35) $(3.51) $(0.98) $(1.89) $(1.37) $(0.54)
Net asset value, end of period (x) $62.03 $82.06 $69.94 $48.02 $48.74 $37.90
Total return (%) (r)(s)(t)(x) (15.75)(n) 23.28 48.57 3.20 33.14 28.91(c)
Ratios (%) (to average net assets)and Supplemental data:
Expenses before expense reductions 0.88(a) 0.87 0.93 0.94 0.99 0.99(c)Expenses after expense reductions 0.86(a) 0.86 0.92 0.93 0.98 0.98(c)Net investment income (loss) (0.55)(a) (0.59) (0.46) (0.40) (0.41) (0.39)(c)Portfolio turnover 20(n) 36 46 32 30 43Net assets at end of period (000 omitted) $476,251 $608,833 $561,531 $315,655 $303,359 $174,275
Supplemental Ratios (%):
Ratios of expenses to average net assets after expensereductions excluding short sale expenses and interestexpense and fees N/A 0.86 0.88 0.91 0.92 0.95(c)
See Notes to Financial Statements
16
Copyright © 2022 www.secdatabase.com. All Rights Reserved.Please Consider the Environment Before Printing This Document

Table of Contents
Financial Highlights – continued
Class R1Six months
ended Year ended
2/28/22(unaudited)
8/31/21 8/31/20 8/31/19 8/31/18 8/31/17
Net asset value, beginning of period $62.37 $54.49 $37.99 $39.39 $31.18 $24.96
Income (loss) from investment operations
Net investment income (loss) (d) $(0.43) $(0.89) $(0.62) $(0.50) $(0.49) $(0.38)(c)Net realized and unrealized gain (loss) (8.39) 12.28 18.10 0.99 10.07 7.14
Total from investment operations $(8.82) $11.39 $17.48 $0.49 $9.58 $6.76
Less distributions declared to shareholders
From net realized gain $(8.35) $(3.51) $(0.98) $(1.89) $(1.37) $(0.54)
Net asset value, end of period (x) $45.20 $62.37 $54.49 $37.99 $39.39 $31.18
Total return (%) (r)(s)(t)(x) (16.16)(n) 22.05 47.10 2.19 31.80 27.63(c)
Ratios (%) (to average net assets)and Supplemental data:
Expenses before expense reductions 1.88(a) 1.87 1.93 1.94 1.99 1.99(c)Expenses after expense reductions 1.87(a) 1.86 1.91 1.93 1.98 1.98(c)Net investment income (loss) (1.55)(a) (1.59) (1.47) (1.40) (1.41) (1.38)(c)Portfolio turnover 20(n) 36 46 32 30 43Net assets at end of period (000 omitted) $9,088 $10,498 $9,882 $5,715 $5,534 $4,256
Supplemental Ratios (%):
Ratios of expenses to average net assets after expense reductionsexcluding short sale expenses and interest expense and fees N/A 1.86 1.88 1.91 1.92 1.95(c)
See Notes to Financial Statements
17
Copyright © 2022 www.secdatabase.com. All Rights Reserved.Please Consider the Environment Before Printing This Document

Table of Contents
Financial Highlights – continued
Class R2Six months
ended Year ended
2/28/22(unaudited)
8/31/21 8/31/20 8/31/19 8/31/18 8/31/17
Net asset value, beginning of period $71.12 $61.36 $42.45 $43.55 $34.17 $27.17
Income (loss) from investment operations
Net investment income (loss) (d) $(0.33) $(0.68) $(0.45) $(0.36) $(0.35) $(0.26)(c)Net realized and unrealized gain (loss) (9.77) 13.95 20.34 1.15 11.10 7.80
Total from investment operations $(10.10) $13.27 $19.89 $0.79 $10.75 $7.54
Less distributions declared to shareholders
From net realized gain $(8.35) $(3.51) $(0.98) $(1.89) $(1.37) $(0.54)
Net asset value, end of period (x) $52.67 $71.12 $61.36 $42.45 $43.55 $34.17
Total return (%) (r)(s)(t)(x) (15.96)(n) 22.67 47.84 2.69 32.46 28.27(c)
Ratios (%) (to average net assets)and Supplemental data:
Expenses before expense reductions 1.38(a) 1.37 1.43 1.44 1.48 1.49(c)Expenses after expense reductions 1.36(a) 1.36 1.42 1.43 1.48 1.49(c)Net investment income (loss) (1.05)(a) (1.09) (0.97) (0.90) (0.91) (0.89)(c)Portfolio turnover 20(n) 36 46 32 30 43Net assets at end of period (000 omitted) $28,635 $37,797 $38,511 $29,339 $28,071 $23,625
Supplemental Ratios (%):
Ratios of expenses to average net assets after expense reductionsexcluding short sale expenses and interest expense and fees N/A 1.36 1.38 1.41 1.42 1.45(c)
See Notes to Financial Statements
18
Copyright © 2022 www.secdatabase.com. All Rights Reserved.Please Consider the Environment Before Printing This Document

Table of Contents
Financial Highlights – continued
Class R3Six months
ended Year ended
2/28/22(unaudited)
8/31/21 8/31/20 8/31/19 8/31/18 8/31/17
Net asset value, beginning of period $75.60 $64.85 $44.71 $45.63 $35.66 $28.26
Income (loss) from investment operations
Net investment income (loss) (d) $(0.27) $(0.56) $(0.35) $(0.27) $(0.27) $(0.20)(c)Net realized and unrealized gain (loss) (10.47) 14.82 21.47 1.24 11.61 8.14
Total from investment operations $(10.74) $14.26 $21.12 $0.97 $11.34 $7.94
Less distributions declared to shareholders
From net realized gain $(8.35) $(3.51) $(0.98) $(1.89) $(1.37) $(0.54)
Net asset value, end of period (x) $56.51 $75.60 $64.85 $44.71 $45.63 $35.66
Total return (%) (r)(s)(t)(x) (15.85)(n) 22.99 48.18 2.97 32.77 28.59(c)
Ratios (%) (to average net assets)and Supplemental data:
Expenses before expense reductions 1.13(a) 1.13 1.18 1.19 1.24 1.24(c)Expenses after expense reductions 1.11(a) 1.11 1.17 1.18 1.23 1.23(c)Net investment income (loss) (0.81)(a) (0.84) (0.71) (0.65) (0.66) (0.65)(c)Portfolio turnover 20(n) 36 46 32 30 43Net assets at end of period (000 omitted) $67,628 $96,784 $109,884 $80,242 $79,534 $53,199
Supplemental Ratios (%):
Ratios of expenses to average net assets after expensereductions excluding short sale expenses and interest expenseand fees N/A 1.11 1.13 1.16 1.17 1.20(c)
See Notes to Financial Statements
19
Copyright © 2022 www.secdatabase.com. All Rights Reserved.Please Consider the Environment Before Printing This Document

Table of Contents
Financial Highlights – continued
Class R4Six months
ended Year ended
2/28/22(unaudited)
8/31/21 8/31/20 8/31/19 8/31/18 8/31/17
Net asset value, beginning of period $79.68 $68.01 $46.72 $47.47 $36.95 $29.19
Income (loss) from investment operations
Net investment income (loss) (d) $(0.20) $(0.42) $(0.24) $(0.17) $(0.17) $(0.13)(c)Net realized and unrealized gain (loss) (11.11) 15.60 22.51 1.31 12.06 8.43
Total from investment operations $(11.31) $15.18 $22.27 $1.14 $11.89 $8.30
Less distributions declared to shareholders
From net realized gain $(8.35) $(3.51) $(0.98) $(1.89) $(1.37) $(0.54)
Net asset value, end of period (x) $60.02 $79.68 $68.01 $46.72 $47.47 $36.95
Total return (%) (r)(s)(t)(x) (15.75)(n) 23.28 48.57 3.22 33.12 28.92(c)
Ratios (%) (to average net assets)and Supplemental data:
Expenses before expense reductions 0.88(a) 0.87 0.93 0.94 0.99 0.99(c)Expenses after expense reductions 0.86(a) 0.86 0.92 0.93 0.98 0.99(c)Net investment income (loss) (0.56)(a) (0.59) (0.47) (0.40) (0.41) (0.39)(c)Portfolio turnover 20(n) 36 46 32 30 43Net assets at end of period (000 omitted) $33,769 $47,324 $32,530 $25,310 $23,004 $14,443
Supplemental Ratios (%):
Ratios of expenses to average net assets after expense reductionsexcluding short sale expenses and interest expense and fees N/A 0.85 0.89 0.91 0.92 0.95(c)
See Notes to Financial Statements
20
Copyright © 2022 www.secdatabase.com. All Rights Reserved.Please Consider the Environment Before Printing This Document

Table of Contents
Financial Highlights – continued
Class R6Six months
ended Year ended
2/28/22(unaudited)
8/31/21 8/31/20 8/31/19 8/31/18 8/31/17
Net asset value, beginning of period $82.87 $70.54 $48.38 $49.03 $38.09 $30.05
Income (loss) from investment operations
Net investment income (loss) (d) $(0.17) $(0.37) $(0.20) $(0.13) $(0.13) $(0.10)(c)Net realized and unrealized gain (loss) (11.60) 16.21 23.34 1.37 12.44 8.68
Total from investment operations $(11.77) $15.84 $23.14 $1.24 $12.31 $8.58
Less distributions declared to shareholders
From net realized gain $(8.35) $(3.51) $(0.98) $(1.89) $(1.37) $(0.54)
Net asset value, end of period (x) $62.75 $82.87 $70.54 $48.38 $49.03 $38.09
Total return (%) (r)(s)(t)(x) (15.70)(n) 23.39 48.71 3.33 33.24 29.03(c)
Ratios (%) (to average net assets)and Supplemental data:
Expenses before expense reductions 0.78(a) 0.78 0.84 0.84 0.89 0.90(c)Expenses after expense reductions 0.76(a) 0.77 0.82 0.83 0.88 0.89(c)Net investment income (loss) (0.46)(a) (0.50) (0.37) (0.30) (0.31) (0.30)(c)Portfolio turnover 20(n) 36 46 32 30 43Net assets at end of period (000 omitted) $297,604 $403,893 $316,404 $168,352 $138,924 $95,534
Supplemental Ratios (%):
Ratios of expenses to average net assets after expensereductions excluding short sale expenses and interestexpense and fees N/A 0.77 0.79 0.81 0.82 0.85(c)
(a) Annualized.(c) Amount reflects a one-time reimbursement of expenses by the custodian (or former custodian) without which net investment income and
performance would be lower and expenses would be higher.(d) Per share data is based on average shares outstanding.(n) Not annualized.(r) Certain expenses have been reduced without which performance would have been lower.(s) From time to time the fund may receive proceeds from litigation settlements, without which performance would be lower.(t) Total returns do not include any applicable sales charges.(x) The net asset values and total returns have been calculated on net assets which include adjustments made in accordance with U.S. generally
accepted accounting principles required at period end for financial reporting purposes.
See Notes to Financial Statements
21
Copyright © 2022 www.secdatabase.com. All Rights Reserved.Please Consider the Environment Before Printing This Document

Table of Contents
NOTES TO FINANCIAL STATEMENTS(unaudited)
(1) Business and OrganizationMFS Technology Fund (the fund) is a non-diversified series of MFS Series Trust I (the trust). The trust is organized as a Massachusettsbusiness trust and is registered under the Investment Company Act of 1940, as amended, as an open-end management investmentcompany.
The fund is an investment company and accordingly follows the investment company accounting and reporting guidance of the FinancialAccounting Standards Board (FASB) Accounting Standards Codification Topic 946 Financial Services - Investment Companies.
(2) Significant Accounting PoliciesGeneral — The preparation of financial statements in conformity with U.S. generally accepted accounting principles requiresmanagement to make estimates and assumptions that affect the reported amounts of assets and liabilities, and disclosure ofcontingent assets and liabilities at the date of the financial statements and the reported amounts of increases and decreases innet assets from operations during the reporting period. Actual results could differ from those estimates. In the preparation ofthese financial statements, management has evaluated subsequent events occurring after the date of the fund’s Statement ofAssets and Liabilities through the date that the financial statements were issued. The fund invests primarily in securities ofissuers in the technology industry. Issuers in a single industry can react similarly to market, currency, political, economic,regulatory, geopolitical, environmental, public health, and other conditions. The value of stocks in the technology sector can bevery volatile due to the rapid pace of product change, technological developments, and other factors.Balance Sheet Offsetting — The fund's accounting policy with respect to balance sheet offsetting is that, absent an event ofdefault by the counterparty or a termination of the agreement, the International Swaps and Derivatives Association (ISDA)Master Agreement, or similar agreement, does not result in an offset of reported amounts of financial assets and financialliabilities in the Statement of Assets and Liabilities across transactions between the fund and the applicable counterparty. Thefund's right to setoff may be restricted or prohibited by the bankruptcy or insolvency laws of the particular jurisdiction to whicha specific master netting agreement counterparty is subject. Balance sheet offsetting disclosures, to the extent applicable tothe fund, have been included in the fund’s Significant Accounting Policies note under the captions for each of the fund’s in-scope financial instruments and transactions.Investment Valuations — Equity securities, including restricted equity securities and equity securities sold short, are generallyvalued at the last sale or official closing price on their primary market or exchange as provided by a third-party pricing service.Equity securities, for which there were no sales reported that day, are generally valued at the last quoted daily bid quotation ontheir primary market or exchange as provided by a third-party pricing service. Equity securities sold short, for which there wereno sales reported that day, are generally valued at the last quoted daily ask quotation on their primary market or exchange asprovided by a third-party pricing service. Short-term instruments with a maturity at issuance of 60 days or less may be valuedat amortized cost, which approximates market value. Open-end investment companies are generally valued at net asset valueper share. Securities and other assets generally valued on the basis of information from a third-party pricing service may alsobe valued at a
22
Copyright © 2022 www.secdatabase.com. All Rights Reserved.Please Consider the Environment Before Printing This Document
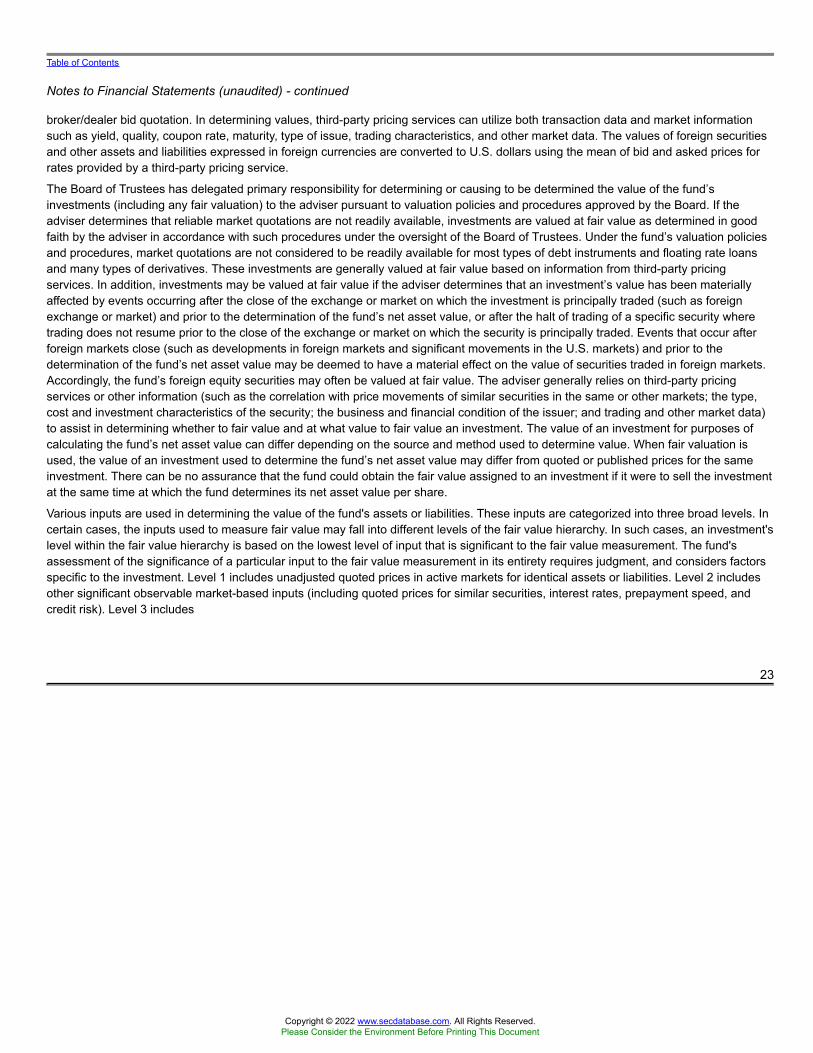
Table of Contents
Notes to Financial Statements (unaudited) - continued
broker/dealer bid quotation. In determining values, third-party pricing services can utilize both transaction data and market informationsuch as yield, quality, coupon rate, maturity, type of issue, trading characteristics, and other market data. The values of foreign securitiesand other assets and liabilities expressed in foreign currencies are converted to U.S. dollars using the mean of bid and asked prices forrates provided by a third-party pricing service.
The Board of Trustees has delegated primary responsibility for determining or causing to be determined the value of the fund’sinvestments (including any fair valuation) to the adviser pursuant to valuation policies and procedures approved by the Board. If theadviser determines that reliable market quotations are not readily available, investments are valued at fair value as determined in goodfaith by the adviser in accordance with such procedures under the oversight of the Board of Trustees. Under the fund’s valuation policiesand procedures, market quotations are not considered to be readily available for most types of debt instruments and floating rate loansand many types of derivatives. These investments are generally valued at fair value based on information from third-party pricingservices. In addition, investments may be valued at fair value if the adviser determines that an investment’s value has been materiallyaffected by events occurring after the close of the exchange or market on which the investment is principally traded (such as foreignexchange or market) and prior to the determination of the fund’s net asset value, or after the halt of trading of a specific security wheretrading does not resume prior to the close of the exchange or market on which the security is principally traded. Events that occur afterforeign markets close (such as developments in foreign markets and significant movements in the U.S. markets) and prior to thedetermination of the fund’s net asset value may be deemed to have a material effect on the value of securities traded in foreign markets.Accordingly, the fund’s foreign equity securities may often be valued at fair value. The adviser generally relies on third-party pricingservices or other information (such as the correlation with price movements of similar securities in the same or other markets; the type,cost and investment characteristics of the security; the business and financial condition of the issuer; and trading and other market data)to assist in determining whether to fair value and at what value to fair value an investment. The value of an investment for purposes ofcalculating the fund’s net asset value can differ depending on the source and method used to determine value. When fair valuation isused, the value of an investment used to determine the fund’s net asset value may differ from quoted or published prices for the sameinvestment. There can be no assurance that the fund could obtain the fair value assigned to an investment if it were to sell the investmentat the same time at which the fund determines its net asset value per share.
Various inputs are used in determining the value of the fund's assets or liabilities. These inputs are categorized into three broad levels. Incertain cases, the inputs used to measure fair value may fall into different levels of the fair value hierarchy. In such cases, an investment'slevel within the fair value hierarchy is based on the lowest level of input that is significant to the fair value measurement. The fund'sassessment of the significance of a particular input to the fair value measurement in its entirety requires judgment, and considers factorsspecific to the investment. Level 1 includes unadjusted quoted prices in active markets for identical assets or liabilities. Level 2 includesother significant observable market-based inputs (including quoted prices for similar securities, interest rates, prepayment speed, andcredit risk). Level 3 includes
23
Copyright © 2022 www.secdatabase.com. All Rights Reserved.Please Consider the Environment Before Printing This Document

Table of Contents
Notes to Financial Statements (unaudited) - continued
unobservable inputs, which may include the adviser's own assumptions in determining the fair value of investments. The following is asummary of the levels used as of February 28, 2022 in valuing the fund's assets and liabilities:
Financial Instruments Level 1 Level 2 Level 3 TotalEquity Securities:
United States $1,629,296,040 $— $— $1,629,296,040Canada 44,902,937 — — 44,902,937United Kingdom 34,941,931 — — 34,941,931China 3,709,027 22,946,732 — 26,655,759Philippines 5,356,739 — — 5,356,739Israel 5,226,929 — — 5,226,929Singapore 821,766 — — 821,766Japan — 696,128 — 696,128
Mutual Funds 58,834,493 — — 58,834,493
Total $1,783,089,862 $23,642,860 $— $1,806,732,722
For further information regarding security characteristics, see the Portfolio of Investments.
Foreign Currency Translation — Purchases and sales of foreign investments, income, and expenses are converted into U.S.dollars based upon currency exchange rates prevailing on the respective dates of such transactions or on the reporting datefor foreign denominated receivables and payables. Gains and losses attributable to foreign currency exchange rates on salesof securities are recorded for financial statement purposes as net realized gains and losses on investments. Gains and lossesattributable to foreign exchange rate movements on receivables, payables, income and expenses are recorded for financialstatement purposes as foreign currency transaction gains and losses. That portion of both realized and unrealized gains andlosses on investments that results from fluctuations in foreign currency exchange rates is not separately disclosed.Short Sales — The fund may enter into short sales whereby it sells a security it does not own in anticipation of a decline in thevalue of that security. The fund will realize a gain if the security price decreases and a loss if the security price increasesbetween the date of the short sale and the date on which the fund replaces the borrowed security. Losses from short sales canexceed the proceeds of the security sold; and they can also exceed the potential loss from an ordinary buy and sell transaction.The amount of any premium, dividends, or interest the fund may be required to pay in connection with a short sale will berecognized as a fund expense. The fund segregates cash or marketable securities in an amount that, when combined with theamount of proceeds from the short sale deposited with the broker, at least equals the current market value of the security soldshort. At February 28, 2022, the fund has yet to enter into such transactions.Security Loans — Under its Securities Lending Agency Agreement with the fund, State Street Bank and Trust Company, aslending agent, loans the securities of the fund to certain qualified institutions (the “Borrowers”) approved by the fund. Securityloans can be terminated at the discretion of either the lending agent or the fund and the related securities must be returnedwithin the earlier of the standard trade settlement period for such securities or within three business days. The loans arecollateralized by cash and/or U.S. Treasury and federal agency obligations in an amount typically at least
24
Copyright © 2022 www.secdatabase.com. All Rights Reserved.Please Consider the Environment Before Printing This Document

Table of Contents
Notes to Financial Statements (unaudited) - continued
equal to the market value of the securities loaned. On loans collateralized by cash, the cash collateral is invested in a money marketfund. The market value of the loaned securities is determined at the close of business of the fund and any additional required collateral isdelivered to the fund on the next business day. The lending agent provides the fund with indemnification against Borrower default. In theevent of Borrower default, the lending agent will, for the benefit of the fund, either purchase securities identical to those loaned or, whensuch purchase is commercially impracticable, pay the fund the market value of the loaned securities. In return, the lending agentassumes the fund's rights to the related collateral. If the collateral value is less than the cost to purchase identical securities, the lendingagent is responsible for the shortfall, but only to the extent that such shortfall is not due to a decline in collateral value resulting fromcollateral reinvestment for which the fund bears the risk of loss. At period end, the fund had investment securities on loan, all of whichwere classified as equity securities in the fund's Portfolio of Investments, with a fair value of $394,850. The fair value of the fund'sinvestment securities on loan and a related liability of $383,468 for cash collateral received on securities loaned are both presented grossin the Statement of Assets and Liabilities. The value of the fund's securities on loan is marked to market daily and daily marketfluctuations could cause the value of loaned securities to be more or less than the value of the collateral received. The value of the fund'ssecurities on loan net of the related collateral is $11,382 at period end. This collateral shortfall was adjusted for the following businessday. The liability for cash collateral for securities loaned is carried at fair value, which is categorized as level 2 within the fair valuehierarchy. A portion of the income generated upon investment of the collateral is remitted to the Borrowers, and the remainder isallocated between the fund and the lending agent. On loans collateralized by U.S. Treasury and/or federal agency obligations, a fee isreceived from the Borrower, and is allocated between the fund and the lending agent. Income from securities lending is separatelyreported in the Statement of Operations. The dividend and interest income earned on the securities loaned is accounted for in the samemanner as other dividend and interest income.
Indemnifications — Under the fund's organizational documents, its officers and Trustees may be indemnified against certainliabilities and expenses arising out of the performance of their duties to the fund. Additionally, in the normal course ofbusiness, the fund enters into agreements with service providers that may contain indemnification clauses. The fund'smaximum exposure under these agreements is unknown as this would involve future claims that may be made against the fundthat have not yet occurred.Investment Transactions and Income — Investment transactions are recorded on the trade date. Dividends received in cash arerecorded on the ex-dividend date. Certain dividends from foreign securities will be recorded when the fund is informed of thedividend if such information is obtained subsequent to the ex-dividend date. Dividend payments received in additionalsecurities are recorded on the ex-dividend date in an amount equal to the value of the security on such date. In determining thenet gain or loss on securities sold, the cost of securities is determined on the identified cost basis.
25
Copyright © 2022 www.secdatabase.com. All Rights Reserved.Please Consider the Environment Before Printing This Document

Table of Contents
Notes to Financial Statements (unaudited) - continued
The fund may receive proceeds from litigation settlements. Any proceeds received from litigation involving portfolio holdings are reflectedin the Statement of Operations in realized gain/loss if the security has been disposed of by the fund or in unrealized gain/loss if thesecurity is still held by the fund. Any other proceeds from litigation not related to portfolio holdings are reflected as other income in theStatement of Operations.
Tax Matters and Distributions — The fund intends to qualify as a regulated investment company, as defined under SubchapterM of the Internal Revenue Code, and to distribute all of its taxable income, including realized capital gains. As a result, noprovision for federal income tax is required. The fund’s federal tax returns, when filed, will remain subject to examination by theInternal Revenue Service for a three year period. Management has analyzed the fund’s tax positions taken on federal and statetax returns for all open tax years and does not believe that there are any uncertain tax positions that require recognition of a taxliability. Foreign taxes, if any, have been accrued by the fund in the accompanying financial statements in accordance with theapplicable foreign tax law. Foreign income taxes may be withheld by certain countries in which the fund invests. Additionally,capital gains realized by the fund on securities issued in or by certain foreign countries may be subject to capital gains taximposed by those countries.Distributions to shareholders are recorded on the ex-dividend date. Income and capital gain distributions are determined in accordancewith income tax regulations, which may differ from U.S. generally accepted accounting principles. Certain capital accounts in the financialstatements are periodically adjusted for permanent differences in order to reflect their tax character. These adjustments have no impacton net assets or net asset value per share. Temporary differences which arise from recognizing certain items of income, expense, gain orloss in different periods for financial statement and tax purposes will reverse at some time in the future.
Book/tax differences primarily relate to wash sale loss deferrals, straddle loss deferrals, and treating a portion of the proceeds fromredemptions as a distribution for tax purposes.
The tax character of distributions made during the current period will be determined at fiscal year end. The tax character of distributionsdeclared to shareholders for the last fiscal year is as follows:
Year ended8/31/21
Long-term capital gains $109,208,449
26
Copyright © 2022 www.secdatabase.com. All Rights Reserved.Please Consider the Environment Before Printing This Document

Table of Contents
Notes to Financial Statements (unaudited) - continued
The federal tax cost and the tax basis components of distributable earnings were as follows:
As of 2/28/22Cost of investments $1,032,800,298
Gross appreciation 847,829,037Gross depreciation (73,896,613)
Net unrealized appreciation (depreciation) $ 773,932,424As of 8/31/21Undistributed ordinary income 64,444,592Undistributed long-term capital gain 135,934,610Net unrealized appreciation (depreciation) 1,309,189,062
The aggregate cost above includes prior fiscal year end tax adjustments, if applicable.
Multiple Classes of Shares of Beneficial Interest — The fund offers multiple classes of shares, which differ in their respectivedistribution and service fees. The fund's income, realized and unrealized gain (loss), and common expenses are allocated toshareholders based on the daily net assets of each class. Dividends are declared separately for each class. Differences in pershare dividend rates are generally due to differences in separate class expenses. Class B and Class C shares will convert toClass A shares approximately eight years after purchase. The fund’s distributions declared to shareholders as reported in theStatements of Changes in Net Assets are presented by class as follows:
Six months ended2/28/22
Year ended8/31/21
Class A $97,004,773 $39,981,871Class B 5,633,192 2,836,401Class C 25,137,122 11,727,115Class I 62,813,302 27,987,681Class R1 1,457,279 660,107Class R2 4,354,112 2,189,374Class R3 9,789,520 6,034,105Class R4 4,407,863 1,741,234Class R6 39,153,210 16,050,561
Total $249,750,373 $109,208,449
(3) Transactions with AffiliatesInvestment Adviser — The fund has an investment advisory agreement with MFS to provide overall investment managementand related administrative services and facilities to the fund. The management fee is computed daily and paid monthly at thefollowing annual rates based on the fund's average daily net assets:
Up to $1 billion 0.75%In excess of $1 billion and up to $2.5 billion 0.70%In excess of $2.5 billion 0.65%
MFS has also agreed in writing to reduce its management fee by a specified amount if certain MFS mutual fund assets exceed thresholdsagreed to by MFS and the fund's Board of Trustees. For the six months ended February 28, 2022, this management fee
27
Copyright © 2022 www.secdatabase.com. All Rights Reserved.Please Consider the Environment Before Printing This Document

Table of Contents
Notes to Financial Statements (unaudited) - continued
reduction amounted to $147,456, which is included in the reduction of total expenses in the Statement of Operations. The managementfee incurred for the six months ended February 28, 2022 was equivalent to an annual effective rate of 0.71% of the fund's average dailynet assets.
Distributor — MFS Fund Distributors, Inc. (MFD), a wholly-owned subsidiary of MFS, as distributor, received $99,562 for the sixmonths ended February 28, 2022, as its portion of the initial sales charge on sales of Class A shares of the fund.The Board of Trustees has adopted a distribution plan for certain share classes pursuant to Rule 12b-1 of the Investment Company Act of1940.
The fund's distribution plan provides that the fund will pay MFD for services provided by MFD and financial intermediaries in connectionwith the distribution and servicing of certain share classes. One component of the plan is a distribution fee paid to MFD and anothercomponent of the plan is a service fee paid to MFD. MFD may subsequently pay all, or a portion, of the distribution and/or service fees tofinancial intermediaries.
Distribution Plan Fee Table:
DistributionFee Rate (d)
ServiceFee Rate (d)
TotalDistribution
Plan (d)
AnnualEffectiveRate (e)
Distributionand Service
Fee
Class A — 0.25% 0.25% 0.25% $ 1,033,935
Class B 0.75% 0.25% 1.00% 1.00% 198,785
Class C 0.75% 0.25% 1.00% 1.00% 887,159
Class R1 0.75% 0.25% 1.00% 1.00% 50,973
Class R2 0.25% 0.25% 0.50% 0.50% 86,564
Class R3 — 0.25% 0.25% 0.25% 104,355
Total Distribution and ServiceFees $2,361,771
(d) In accordance with the distribution plan for certain classes, the fund pays distribution and/or service fees equal to these annual percentage rates ofeach class’s average daily net assets. The distribution and service fee rates disclosed by class represent the current rates in effect at the endof the reporting period. Any rate changes, if applicable, are detailed below.
(e) The annual effective rates represent actual fees incurred under the distribution plan for the six months ended February 28, 2022 based on eachclass's average daily net assets. MFD has voluntarily agreed to rebate a portion of each class's 0.25% service fee attributable to accounts forwhich there is no financial intermediary specified on the account except for accounts attributable to MFS or its affiliates' seed money. For thesix months ended February 28, 2022, this rebate amounted to $464 and $7 for Class A and Class B, respectively, and is included in thereduction of total expenses in the Statement of Operations.
Certain Class A shares are subject to a contingent deferred sales charge (CDSC) in the event of a shareholder redemption within 18months of purchase. Class B shares are subject to a CDSC in the event of a shareholder redemption within six years of
28
Copyright © 2022 www.secdatabase.com. All Rights Reserved.Please Consider the Environment Before Printing This Document

Table of Contents
Notes to Financial Statements (unaudited) - continued
purchase. Class C shares are subject to a CDSC in the event of a shareholder redemption within 12 months of purchase. All contingentdeferred sales charges are paid to MFD and during the six months ended February 28, 2022, were as follows:
AmountClass A $5,676Class B 5,332Class C 4,147
Shareholder Servicing Agent — MFS Service Center, Inc. (MFSC), a wholly-owned subsidiary of MFS, receives a fee from thefund for its services as shareholder servicing agent calculated as a percentage of the average daily net assets of the fund asdetermined periodically under the supervision of the fund's Board of Trustees. For the six months ended February 28, 2022, thefee was $107,453, which equated to 0.0100% annually of the fund's average daily net assets. MFSC also receivesreimbursement from the fund for out-of-pocket expenses, sub-accounting and other shareholder servicing costs which may bepaid to affiliated and unaffiliated service providers. Class R6 shares do not incur sub-accounting fees. For the six monthsended February 28, 2022, these out-of-pocket expenses, sub-accounting and other shareholder servicing costs amounted to$931,410.Administrator — MFS provides certain financial, legal, shareholder communications, compliance, and other administrativeservices to the fund. Under an administrative services agreement, the fund reimburses MFS the costs incurred to provide theseservices. The fund is charged an annual fixed amount of $17,500 plus a fee based on average daily net assets. Theadministrative services fee incurred for the six months ended February 28, 2022 was equivalent to an annual effective rate of0.0137% of the fund's average daily net assets.Trustees’ and Officers’ Compensation — The fund pays compensation to independent Trustees in the form of a retainer,attendance fees, and additional compensation to Board and Committee chairpersons. The fund does not pay compensationdirectly to Trustees or officers of the fund who are also officers of the investment adviser, all of whom receive remunerationfrom MFS for their services to the fund. Certain officers and Trustees of the fund are officers or directors of MFS, MFD, andMFSC.Other — The fund invests in the MFS Institutional Money Market Portfolio which is managed by MFS and seeks current incomeconsistent with preservation of capital and liquidity. This money market fund does not pay a management fee to MFS but doesincur investment and operating costs.The fund is permitted to engage in purchase and sale transactions with funds and accounts for which MFS serves as investment adviseror sub-adviser (“cross-trades”) pursuant to a policy adopted by the Board of Trustees. This policy has been designed to ensure thatcross-trades conducted by the fund comply with Rule 17a-7 under the Investment Company Act of 1940. During the six months endedFebruary 28, 2022, the fund engaged in sale transactions pursuant to this policy, which amounted to $2,505,605. The sales transactionsresulted in net realized gains (losses) of $(2,304,776).
29
Copyright © 2022 www.secdatabase.com. All Rights Reserved.Please Consider the Environment Before Printing This Document

Table of Contents
Notes to Financial Statements (unaudited) - continued
The adviser has voluntarily undertaken to reimburse the fund from its own resources on a quarterly basis for the cost of investmentresearch embedded in the cost of the fund’s securities trades. This agreement may be rescinded at any time. For the six months endedFebruary 28, 2022, this reimbursement amounted to $51,336, which is included in “Other” income in the Statement of Operations.
(4) Portfolio SecuritiesFor the six months ended February 28, 2022, purchases and sales of investments, other than short-term obligations, aggregated$412,161,224 and $630,955,024, respectively.
(5) Shares of Beneficial InterestThe fund's Declaration of Trust permits the Trustees to issue an unlimited number of full and fractional shares of beneficial interest.Transactions in fund shares were as follows:
Six months ended2/28/22
Year ended8/31/21
Shares Amount Shares Amount
Shares sold
Class A 778,284 $52,098,910 2,041,235 $135,528,348
Class B 2,339 128,415 19,385 1,072,422
Class C 120,210 6,502,304 388,800 21,337,233
Class I 822,092 61,111,604 1,964,028 139,976,502
Class R1 33,660 1,786,442 62,331 3,426,469
Class R2 70,406 4,322,583 196,801 12,228,587
Class R3 122,423 8,088,201 553,491 36,617,031
Class R4 63,163 4,397,085 272,966 19,306,122
Class R6 452,420 33,700,406 1,945,342 140,788,322
2,464,997 $172,135,950 7,444,379 $510,281,036
Shares issued to shareholdersin reinvestment of distributions
Class A 1,420,260 $94,362,044 606,720 $38,781,516
Class B 103,866 5,554,746 52,636 2,802,337
Class C 451,349 24,074,933 208,877 11,093,450
Class I 788,615 57,442,721 364,594 25,233,552
Class R1 27,311 1,452,667 12,421 658,166
Class R2 69,869 4,325,571 35,971 2,165,483
Class R3 147,455 9,789,520 94,475 6,034,105
Class R4 54,585 3,847,149 22,758 1,529,365
Class R6 477,615 35,181,103 194,133 13,560,203
3,540,925 $236,030,454 1,592,585 $101,858,177
30
Copyright © 2022 www.secdatabase.com. All Rights Reserved.Please Consider the Environment Before Printing This Document

Table of Contents
Notes to Financial Statements (unaudited) - continued
Six months ended2/28/22
Year ended8/31/21
Shares Amount Shares Amount
Shares reacquired
Class A (1,372,321) $(90,082,702) (2,387,042) $(158,552,829)
Class B (99,800) (5,337,547) (208,269) (11,542,946)
Class C (363,768) (19,725,915) (837,296) (46,360,016)
Class I (1,352,244) (94,900,018) (2,938,120) (211,435,850)
Class R1 (28,200) (1,447,155) (87,800) (4,960,576)
Class R2 (128,061) (7,701,373) (328,957) (20,461,503)
Class R3 (353,378) (23,828,111) (1,062,054) (71,182,913)
Class R4 (149,082) (11,071,701) (180,112) (12,634,502)
Class R6 (1,060,704) (78,336,856) (1,751,522) (127,806,922)
(4,907,558) $(332,431,378) (9,781,172) $(664,938,057)
Net change
Class A 826,223 $56,378,252 260,913 $15,757,035
Class B 6,405 345,614 (136,248) (7,668,187)
Class C 207,791 10,851,322 (239,619) (13,929,333)
Class I 258,463 23,654,307 (609,498) (46,225,796)
Class R1 32,771 1,791,954 (13,048) (875,941)
Class R2 12,214 946,781 (96,185) (6,067,433)
Class R3 (83,500) (5,950,390) (414,088) (28,531,777)
Class R4 (31,334) (2,827,467) 115,612 8,200,985
Class R6 (130,669) (9,455,347) 387,953 26,541,603
1,098,364 $75,735,026 (744,208) $(52,798,844)
Effective June 1, 2019, purchases of the fund’s Class B shares are closed to new and existing investors subject to certain exceptions.Please see the fund’s prospectus for details.
(6) Line of CreditThe fund and certain other funds managed by MFS participate in a $1.25 billion unsecured committed line of credit of which $1 billion isreserved for use by the fund and certain other MFS U.S. funds. The line of credit is provided by a syndicate of banks under a creditagreement. Borrowings may be made for temporary financing needs. Interest is charged to each fund, based on its borrowings, generallyat a rate equal to the highest of one month LIBOR, the Federal Funds Effective Rate and the Overnight Bank Funding Rate, plus anagreed upon spread. A commitment fee, based on the average daily, unused portion of the committed line of credit, is allocated amongthe participating funds. In addition, the fund and other funds managed by MFS have established unsecured uncommitted borrowingarrangements with certain banks for temporary financing needs. Interest is charged to each fund, based on its borrowings,
31
Copyright © 2022 www.secdatabase.com. All Rights Reserved.Please Consider the Environment Before Printing This Document

Table of Contents
Notes to Financial Statements (unaudited) - continued
at rates equal to customary reference rates plus an agreed upon spread. For the six months ended February 28, 2022, the fund’scommitment fee and interest expense were $4,016 and $0, respectively, and are included in “Miscellaneous” expense in the Statement ofOperations.
(7) Investments in Affiliated IssuersAn affiliated issuer may be considered one in which the fund owns 5% or more of the outstanding voting securities, or a company whichis under common control. For the purposes of this report, the following were affiliated issuers:
Affiliated IssuersBeginning
Value PurchasesSales
Proceeds
RealizedGain
(Loss)
Change inUnrealized
Appreciation orDepreciation
EndingValue
MFS Institutional Money MarketPortfolio $16,102,802 $273,478,213 $231,129,990 $— $— $58,451,025
Affiliated IssuersDividend
IncomeCapital Gain
Distributions
MFS Institutional Money Market Portfolio $9,625 $—
(8) Impacts of COVID-19The pandemic related to the global spread of novel coronavirus disease (COVID-19), which was first detected in December 2019, hasresulted in significant disruptions to global business activity and the global economy, as well as the economies of individual countries, thefinancial performance of individual companies and sectors, and the securities and commodities markets in general. Multiple surges incases globally, the availability and widespread adoption of vaccines, and the emergence of variant strains of the virus continue to createuncertainty as to the future and long-term impacts resulting from the pandemic including impacts to the prices and liquidity of the fund'sinvestments and the fund's performance.
(9) LIBOR TransitionCertain of the fund's investments, including investments in certain debt instruments and derivatives (if any), as well as borrowings by thefund and certain other contractual arrangements of the fund, may be based on the London Interbank Offered Rate (“LIBOR”). In 2017, theregulatory authority that oversees financial services firms in the United Kingdom announced plans to transition away from LIBOR by theend of 2021. In March 2021, the administrator of LIBOR announced the extension of the publication of the more commonly used U.S.dollar LIBOR settings to the end of June 2023. Although the full impacts of the transition away from LIBOR are not fully known, thetransition may result in, among other things, an increase in volatility or illiquidity of the markets for instruments that currently rely onLIBOR to determine interest rates and this could have an adverse impact on the fund's performance. With respect to the fund'saccounting for investments, including investments in certain debt instruments and derivatives, as well as borrowings by the fund and anyother contractual arrangements of the fund that undergo reference rate-related modifications as a result of the transition, managementwill rely upon the relief provided by FASB Codification Topic 848 – Reference Rate Reform (Topic 848). The guidance in Topic 848permits the fund
32
Copyright © 2022 www.secdatabase.com. All Rights Reserved.Please Consider the Environment Before Printing This Document

Table of Contents
Notes to Financial Statements (unaudited) - continued
to account for those modified contracts as a continuation of the existing contracts. Management is still evaluating the impact to the fund ofthe June 30, 2023 planned discontinuation of the more commonly used U.S. dollar LIBOR settings.
(10) Russia and Ukraine ConflictThe market disruptions, which began in late February 2022, associated with geopolitical events related to the conflict between Russiaand Ukraine may adversely affect the value of the fund’s assets and thus the fund’s performance. Management continues to monitorthese events and to evaluate the related impacts, if any, to the fund.
33
Copyright © 2022 www.secdatabase.com. All Rights Reserved.Please Consider the Environment Before Printing This Document

Table of Contents
PROXY VOTING POLICIES AND INFORMATION
MFS votes proxies on behalf of the fund pursuant to proxy voting policies and procedures that are available without charge, uponrequest, by calling 1-800-225-2606, by visiting mfs.com/proxyvoting, or by visiting the SEC’s Web site at http://www.sec.gov.
Information regarding how the fund voted proxies relating to portfolio securities during the most recent twelve-month period ended June30 is available by August 31 of each year without charge by visiting mfs.com/proxyvoting, or by visiting the SEC’s Web site athttp://www.sec.gov.
QUARTERLY PORTFOLIO DISCLOSURE
The fund files a complete schedule of portfolio holdings with the SEC for the first and third quarters of each fiscal year as an exhibit to itsreports on Form N-PORT. The fund's Form N-PORT reports are available on the SEC's Web site at http://www.sec.gov. A shareholdercan obtain the portfolio holdings report for the first and third quarters of the fund's fiscal year at mfs.com/openendfunds by choosing thefund's name and then scrolling to the “Resources” section and clicking on the “Prospectus and Reports” tab.
FURTHER INFORMATION
From time to time, MFS may post important information about the fund or the MFS Funds on the MFS Web site (mfs.com). Thisinformation is available at https://www.mfs.com/announcements or at mfs.com/openendfunds by choosing the fund’s name and thenscrolling to the “Resources” section and clicking on the “Announcements” tab, if any.
INFORMATION ABOUT FUND CONTRACTS AND LEGAL CLAIMS
The fund has entered into contractual arrangements with an investment adviser, administrator, distributor, shareholder servicing agent,529 program manager (if applicable), and custodian who each provide services to the fund. Unless expressly stated otherwise,shareholders are not parties to, or intended beneficiaries of these contractual arrangements, and these contractual arrangements are notintended to create any shareholder right to enforce them against the service providers or to seek any remedy under them against theservice providers, either directly or on behalf of the fund.
Under the Trust’s By-Laws and Declaration of Trust, any claims asserted against or on behalf of the MFS Funds, including claims againstTrustees and Officers, must be brought in state and federal courts located within the Commonwealth of Massachusetts.
PROVISION OF FINANCIAL REPORTS AND SUMMARY PROSPECTUSES
The fund produces financial reports every six months and updates its summary prospectus and prospectus annually. To avoid sendingduplicate copies of materials to households, only one copy of the fund’s annual and semiannual report and summary prospectus may bemailed to shareholders having the same last name and residential address on the fund’s records. However, any shareholder may contactMFSC (please see back cover for address and telephone number) to request that copies of these reports and summary prospectuses besent personally to that shareholder.
34
Copyright © 2022 www.secdatabase.com. All Rights Reserved.Please Consider the Environment Before Printing This Document

Table of Contents
Copyright © 2022 www.secdatabase.com. All Rights Reserved.Please Consider the Environment Before Printing This Document

Table of Contents
Save paper with eDelivery.
MFS® will send you prospectuses,reports, and proxies directly via e-mailso you will get information faster withless mailbox clutter.
To sign up:
CONTACTWEB SITEmfs.com
MFS TALK1-800-637-825524 hours a day
ACCOUNT SERVICE AND LITERATURE
Copyright © 2022 www.secdatabase.com. All Rights Reserved.Please Consider the Environment Before Printing This Document

1. Go to mfs.com.
2. Log in via MFS® Access.3. Select eDelivery.
If you own your MFS fund shares through a financial
institution or a retirement plan, MFS® TALK, MFS®
Access, or eDelivery may not be available to you.
Shareholders1-800-225-2606
Financial advisors1-800-343-2829
Retirement plan services1-800-637-1255
MAILING ADDRESSMFS Service Center, Inc.P.O. Box 219341Kansas City, MO 64121-9341
OVERNIGHT MAILMFS Service Center, Inc.Suite 219341430 W 7th StreetKansas City, MO 64105-1407
Copyright © 2022 www.secdatabase.com. All Rights Reserved.Please Consider the Environment Before Printing This Document

Semiannual ReportFebruary 28, 2022
MFS® U.S. Government Cash ReserveFund
LMM-SEM
Copyright © 2022 www.secdatabase.com. All Rights Reserved.Please Consider the Environment Before Printing This Document

Copyright © 2022 www.secdatabase.com. All Rights Reserved.Please Consider the Environment Before Printing This Document

Letter from the Chair and CEO
Portfolio composition
Expense table
Portfolio of investments
Statement of assets and liabilities
Statement of operations
Statements of changes in net assets
Financial highlights
Notes to financial statements
Proxy voting policies and information
Portfolio holdings information
Further information
Information about fund contracts and legal claims
Provision of financial reports and summary prospectuses
Contact information
MFS® U.S. Government Cash Reserve Fund
CONTENTS
1
2
3
5
7
9
10
11
21
31
31
31
31
31
back cover
The report is prepared for the general information of shareholders. It is authorized for distribution toprospective investors only when preceded or accompanied by a current prospectus.
NOT FDIC INSURED • MAY LOSE VALUE • NO BANK GUARANTEE
Copyright © 2022 www.secdatabase.com. All Rights Reserved.Please Consider the Environment Before Printing This Document

Table of Contents
Copyright © 2022 www.secdatabase.com. All Rights Reserved.Please Consider the Environment Before Printing This Document

Table of Contents
LETTER FROM THE CHAIR AND CEO
Dear Shareholders:
As a result of Russia’s invasion of Ukraine, the danger of wider geopolitical conflict has risen to a level not seen in decades, and thiscomes as sanctions aimed at countering Russia’s actions are exacerbating already mounting inflation. Consequently, at a time whenglobal growth faces multiple headwinds, central banks have been presented with the challenge of reining in rising prices without tippingeconomies into recession. The US Federal Reserve recently raised rates for the first time since 2018 and indicated that it is likely totighten policy much more over the coming year. Meanwhile, the unsettled geopolitical backdrop and prospect of tighter financialconditions has led to increased volatility.
There are, however, encouraging signs for the markets. The Omicron wave of the coronavirusis receding outside Asia, unemployment is low, and there are signs that some global supplychain bottlenecks are beginning to ease, though events in Ukraine could hamper theseadvances. Additionally, easier Chinese monetary policy and the record pace of corporate stockbuybacks are supportive elements, albeit amid an otherwise turbulent investment environment.
It is important to have a deep understanding of company fundamentals during times of market transition, and we have built our globalresearch platform to do just that.
At MFS®, we put our clients’ assets to work responsibly by carefully navigating the increasing complexity of global markets andeconomies. Guided by our commitment to long-term investing, we tune out the noise and try to uncover what we believe are the best,most durable investment opportunities in the market. Our unique global investment platform combines collective expertise, long-termdiscipline, and thoughtful risk management to create sustainable value for investors over time.
Respectfully,
Michael W. RobergeChair and Chief Executive OfficerMFS Investment Management
April 14, 2022
The opinions expressed in this letter are subject to change and may not be relied upon for investment advice. No forecasts can beguaranteed.
Copyright © 2022 www.secdatabase.com. All Rights Reserved.Please Consider the Environment Before Printing This Document

1
Copyright © 2022 www.secdatabase.com. All Rights Reserved.Please Consider the Environment Before Printing This Document

Table of Contents
PORTFOLIO COMPOSITION
(a) Ratings are assigned to portfolio securities utilizing ratings from Moody’s, Fitch, and Standard & Poor’s rating agencies and applying the followinghierarchy: If all three agencies provide a rating, the middle rating (after dropping the highest and lowest ratings) is assigned; if two of the threeagencies rate a security, the lower of the two is assigned. Ratings are shown in the S&P scale. All ratings are subject to change. The fund didnot hold unrated securities. The fund is not rated by these agencies.
(u) For purposes of this presentation, accrued interest, where applicable, is included.
Percentages are based on net assets as of February 28, 2022.
The portfolio is actively managed and current holdings may be different.
2
Portfolio structure (u) Composition including fixed income credit quality (a)(u)
A-1+ 52.3%
A-1 47.6%
Other Assets Less Liabilities 0.1%
Maturity breakdown (u)
0 - 7 days 44.3%
8 - 29 days 49.7%
30 - 59 days 5.9%
60 - 89 days 0.0%
Other Assets Less Liabilities 0.1%
Copyright © 2022 www.secdatabase.com. All Rights Reserved.Please Consider the Environment Before Printing This Document

Table of Contents
EXPENSE TABLEFund expenses borne by the shareholders during the period,September 1, 2021 through February 28, 2022
As a shareholder of the fund, you incur two types of costs: (1) transaction costs, including sales charges (loads) on certain purchase orredemption payments, and (2) ongoing costs, including management fees; distribution and service (12b-1) fees; and other fundexpenses. This example is intended to help you understand your ongoing costs (in dollars) of investing in the fund and to compare thesecosts with the ongoing costs of investing in other mutual funds.
The example is based on an investment of $1,000 invested at the beginning of the period and held for the entire period September 1,2021 through February 28, 2022.
Actual Expenses
The first line for each share class in the following table provides information about actual account values and actual expenses. You mayuse the information in this line, together with the amount you invested, to estimate the expenses that you paid over the period. Simplydivide your account value by $1,000 (for example, an $8,600 account value divided by $1,000 = 8.6), then multiply the result by thenumber in the first line under the heading entitled “Expenses Paid During Period” to estimate the expenses you paid on your accountduring this period.
Hypothetical Example for Comparison Purposes
The second line for each share class in the following table provides information about hypothetical account values and hypotheticalexpenses based on the fund’s actual expense ratio and an assumed rate of return of 5% per year before expenses, which is not thefund’s actual return. The hypothetical account values and expenses may not be used to estimate the actual ending account balance orexpenses you paid for the period. You may use this information to compare the ongoing costs of investing in the fund and other funds. Todo so, compare this 5% hypothetical example with the 5% hypothetical examples that appear in the shareholder reports of the otherfunds.
Please note that the expenses shown in the table are meant to highlight your ongoing costs only and do not reflect any transactionalcosts, such as sales charges (loads). Therefore, the second line for each share class in the table is useful in comparing ongoing costsonly, and will not help you determine the relative total costs of owning different funds. In addition, if these transactional costs wereincluded, your costs would have been higher.
3
Copyright © 2022 www.secdatabase.com. All Rights Reserved.Please Consider the Environment Before Printing This Document

Table of Contents
Expense Table - continued
ShareClass
AnnualizedExpense
Ratio
BeginningAccount Value
9/01/21
EndingAccount Value
2/28/22
ExpensesPaid DuringPeriod (p)
9/01/21-2/28/22
Actual 0.04% $1,000.00 $1,000.14 $0.20A
Hypothetical (h) 0.04% $1,000.00 $1,024.60 $0.20
Actual 0.04% $1,000.00 $1,000.14 $0.20B
Hypothetical (h) 0.04% $1,000.00 $1,024.60 $0.20
Actual 0.04% $1,000.00 $1,000.14 $0.20C
Hypothetical (h) 0.04% $1,000.00 $1,024.60 $0.20
Actual 0.04% $1,000.00 $1,000.14 $0.20I
Hypothetical (h) 0.04% $1,000.00 $1,024.60 $0.20
Actual 0.04% $1,000.00 $1,000.14 $0.20R1
Hypothetical (h) 0.04% $1,000.00 $1,024.60 $0.20
Actual 0.04% $1,000.00 $1,000.14 $0.20R2
Hypothetical (h) 0.04% $1,000.00 $1,024.60 $0.20
Actual 0.04% $1,000.00 $1,000.14 $0.20R3
Hypothetical (h) 0.04% $1,000.00 $1,024.60 $0.20
Actual 0.04% $1,000.00 $1,000.14 $0.20R4
Hypothetical (h) 0.04% $1,000.00 $1,024.60 $0.20
Actual 0.04% $1,000.00 $1,000.14 $0.20R6
Hypothetical (h) 0.04% $1,000.00 $1,024.60 $0.20
Actual 0.04% $1,000.00 $1,000.14 $0.20529A
Hypothetical (h) 0.04% $1,000.00 $1,024.60 $0.20
Actual 0.04% $1,000.00 $1,000.14 $0.20529B
Hypothetical (h) 0.04% $1,000.00 $1,024.60 $0.20
Actual 0.04% $1,000.00 $1,000.14 $0.20529C
Hypothetical (h) 0.04% $1,000.00 $1,024.60 $0.20
(h) 5% class return per year before expenses.
(p) “Expenses Paid During Period” are equal to each class’s annualized expense ratio, as shown above, multiplied by the average account value overthe period, multiplied by 181/365 (to reflect the one-half year period). Expenses paid do not include any applicable sales charges (loads). Ifthese transaction costs had been included, your costs would have been higher.
Notes to Expense Table
As more fully disclosed in Note 3 in the Notes to Financial Statements, the expense ratios reported above include additional expensereductions to avoid a negative yield.
4
Copyright © 2022 www.secdatabase.com. All Rights Reserved.Please Consider the Environment Before Printing This Document

Table of Contents
PORTFOLIO OF INVESTMENTS2/28/22 (unaudited)
The Portfolio of Investments is a complete list of all securities owned by your fund. It is categorized by broad-based asset classes.
Issuer Shares/Par Value ($)
U.S. Government Agencies and Equivalents (y) – 86.1%
Fannie Mae, 0.044%, due 3/02/2022 $ 4,402,000 $ 4,401,995Fannie Mae, 0.054%, due 3/09/2022 5,705,000 5,704,933Fannie Mae, 0.046%, due 3/16/2022 1,455,000 1,454,973Fannie Mae, 0.03%, due 3/16/2022 1,448,000 1,447,982Fannie Mae, 0.025%, due 3/23/2022 7,428,000 7,427,887Federal Farm Credit Bank, 0.03%, due 3/03/2022 13,453,000 13,452,978Federal Farm Credit Bank, 0.041%, due 3/16/2022 7,414,000 7,413,876Federal Home Loan Bank, 0.022%, due 3/04/2022 15,075,000 15,074,972Federal Home Loan Bank, 0.03%, due 3/14/2022 5,000,000 4,999,946Federal Home Loan Bank, 0.02%, due 3/23/2022 16,000,000 15,999,804Freddie Mac, 0.041%, due 3/17/2022 14,618,000 14,617,740U.S. Treasury Bill, 0.025%, due 3/01/2022 6,350,000 6,350,000U.S. Treasury Bill, 0.051%, due 3/01/2022 13,895,000 13,895,000U.S. Treasury Bill, 0.025%, due 3/03/2022 6,350,000 6,349,991U.S. Treasury Bill, 0.041%, due 3/03/2022 12,141,000 12,140,973U.S. Treasury Bill, 0.037%, due 3/08/2022 3,721,000 3,720,974U.S. Treasury Bill, 0.046%, due 3/08/2022 7,623,000 7,622,933U.S. Treasury Bill, 0.042%, due 3/10/2022 3,721,000 3,720,962U.S. Treasury Bill, 0.046%, due 3/10/2022 5,030,000 5,029,943U.S. Treasury Bill, 0.01%, due 3/15/2022 12,064,000 12,063,953U.S. Treasury Bill, 0.03%, due 3/15/2022 3,447,000 3,446,960U.S. Treasury Bill, 0.046%, due 3/15/2022 6,562,000 6,561,885U.S. Treasury Bill, 0.023%, due 3/17/2022 4,418,000 4,417,956U.S. Treasury Bill, 0.046%, due 3/17/2022 3,000,000 2,999,940U.S. Treasury Bill, 0.041%, due 3/24/2022 22,723,000 22,722,419U.S. Treasury Bill, 0.051%, due 3/29/2022 15,036,000 15,035,415U.S. Treasury Bill, 0.033%, due 4/05/2022 16,000,000 15,999,495
Total U.S. Government Agencies and Equivalents, at Amortized Cost and Value $234,075,885
5
Copyright © 2022 www.secdatabase.com. All Rights Reserved.Please Consider the Environment Before Printing This Document

Table of Contents
Portfolio of Investments (unaudited) – continued
Issuer Shares/Par Value ($)
Repurchase Agreements – 13.8%
Bank of America Corp. Repurchase Agreement, 0.05%,dated 2/28/2022, due 3/01/2022, total to be received $18,650,026(secured by U.S. Treasury obligations valued at$19,029,282) $ 18,650,000 $ 18,650,000JPMorgan Chase & Co. Repurchase Agreement, 0.05%,dated 2/28/2022, due 3/01/2022, total to be received $18,746,026(secured by U.S. Treasury obligations valued at$19,086,341) 18,746,000 18,746,000
Total Repurchase Agreements, at Cost and Value $ 37,396,000
Other Assets, Less Liabilities – 0.1% 322,596
Net Assets – 100.0% $271,794,481
(y) The rate shown represents an annualized yield at time of purchase.
See Notes to Financial Statements
6
Copyright © 2022 www.secdatabase.com. All Rights Reserved.Please Consider the Environment Before Printing This Document

Table of Contents
Financial Statements
STATEMENT OF ASSETS AND LIABILITIESAt 2/28/22 (unaudited)
This statement represents your fund’s balance sheet, which details the assets and liabilities comprising the total value of the fund.
Assets
Investments in unaffiliated issuers, at cost and value $234,075,885Investments in unaffiliated repurchase agreements, at cost and value 37,396,000Cash 574Receivables for
Fund shares sold 1,338,493Interest 52
Receivable from investment adviser and distributor 78,696Other assets 15,245
Total assets $272,904,945
Liabilities
Payables forFund shares reacquired $1,003,584
Payable to affiliatesAdministrative services fee 518Shareholder servicing costs 65,949Program manager fees 180
Payable for independent Trustees' compensation 4,889Accrued expenses and other liabilities 35,344
Total liabilities $1,110,464
Net assets $271,794,481
Net assets consist of
Paid-in capital $271,803,768Total distributable earnings (loss) (9,287)
Net assets $271,794,481
Shares of beneficial interest outstanding 272,029,286
7
Copyright © 2022 www.secdatabase.com. All Rights Reserved.Please Consider the Environment Before Printing This Document

Table of Contents
Statement of Assets and Liabilities (unaudited) – continued
Net assetsShares
outstandingNet asset value
per shareClass A $137,022,475 137,140,959 $1.00Class B 5,622,086 5,626,875 1.00Class C 29,898,561 29,924,038 1.00Class I 14,954,260 14,967,255 1.00Class R1 8,462,717 8,470,257 1.00Class R2 24,058,425 24,079,178 1.00Class R3 16,046,290 16,060,126 1.00Class R4 2,675,741 2,678,058 1.00Class R6 112,565 112,664 1.00Class 529A 28,163,462 28,187,790 1.00Class 529B 139,048 139,167 1.00Class 529C 4,638,851 4,642,919 1.00
A contingent deferred sales charge may be imposed on redemptions of Class A, Class B, Class C, Class 529B, and Class 529C shares. Redemption priceper share was equal to the net asset value per share for Classes I, R1, R2, R3, R4, R6, and 529A.
See Notes to Financial Statements
8
Copyright © 2022 www.secdatabase.com. All Rights Reserved.Please Consider the Environment Before Printing This Document

Table of Contents
Financial Statements
STATEMENT OF OPERATIONSSix months ended 2/28/22 (unaudited)
This statement describes how much your fund earned in investment income and accrued in expenses. It also describes any gains and/or losses generatedby fund operations.
Net investment income (loss)
IncomeInterest $52,710Other 1,009
Total investment income $53,719
ExpensesManagement fee $508,565Distribution and service fees 481,908Shareholder servicing costs 210,202Program manager fees 8,272Administrative services fee 22,186Independent Trustees' compensation 2,878Custodian fee 9,914Shareholder communications 6,178Audit and tax fees 19,850Legal fees 806Miscellaneous 87,848
Total expenses $1,358,607
Reduction of expenses by investment adviser and distributor (1,304,888)
Net expenses $53,719
Net investment income (loss) $0
Realized gain (loss) (identified cost basis)Unaffiliated issuers $(4,685)
Change in net assets from operations $(4,685)
See Notes to Financial Statements
9
Copyright © 2022 www.secdatabase.com. All Rights Reserved.Please Consider the Environment Before Printing This Document

Table of Contents
Financial Statements
STATEMENTS OF CHANGES IN NET ASSETSThese statements describe the increases and/or decreases in net assets resulting from operations, any distributions, and any shareholder transactions.
Six months ended Year ended2/28/22
(unaudited)8/31/21
Change in net assetsFrom operations
Net investment income (loss) $0 $0Net realized gain (loss) (4,685) 34,722
Change in net assets from operations $(4,685) $34,722
Total distributions to shareholders $(34,935) $—
Change in net assets from fund share transactions $6,579,566 $(36,517,974)
Total change in net assets $6,539,946 $(36,483,252)
Net assets
At beginning of period 265,254,535 301,737,787At end of period $271,794,481 $265,254,535
See Notes to Financial Statements
10
Copyright © 2022 www.secdatabase.com. All Rights Reserved.Please Consider the Environment Before Printing This Document

Table of Contents
Financial Statements
FINANCIAL HIGHLIGHTSThe financial highlights table is intended to help you understand the fund's financial performance for the semiannual period and the past5 fiscal years (or life of a particular share class, if shorter). Certain information reflects financial results for a single fund share. The totalreturns in the table represent the rate that an investor would have earned (or lost) on an investment in the fund share class (assumingreinvestment of all distributions) held for the entire period.
Class ASix months
ended Year ended
2/28/22(unaudited)
8/31/21 8/31/20 8/31/19 8/31/18 8/31/17
Net asset value, beginning of period $1.00 $1.00 $1.00 $1.00 $1.00 $1.00
Income (loss) from investment operations
Net investment income (loss) (d) $0.00 $0.00 $0.00(w) $0.02 $0.01 $0.00(c)(w)Net realized and unrealized gain (loss) (0.00)(w) 0.00(w) 0.00(w) 0.00(w) — (0.00)(w)
Total from investment operations $(0.00)(w) $0.00(w) $0.00(w) $0.02 $0.01 $0.00(w)
Less distributions declared to shareholders
From net investment income $— $— $(0.00)(w) $(0.02) $(0.01) $(0.00)(w)From net realized gain (0.00)(w) — — — — —
Net asset value, end of period $1.00 $1.00 $1.00 $1.00 $1.00 $1.00
Total return (%) (r)(t) 0.01(n) 0.00 0.54 1.58 0.76 0.08(c)
Ratios (%) (to average net assets)and Supplemental data:
Expenses before expense reductions 0.93(a) 0.91 0.96 0.98 0.94 0.91(c)Expenses after expense reductions 0.04(a) 0.05 0.44 0.72 0.68 0.50(c)Net investment income (loss) 0.00(a) 0.00 0.44 1.57 0.76 0.08(c)Net assets at end of period (000 omitted) $137,022 $128,482 $140,426 $99,511 $100,463 $105,859
See Notes to Financial Statements
11
Copyright © 2022 www.secdatabase.com. All Rights Reserved.Please Consider the Environment Before Printing This Document

Table of Contents
Financial Highlights – continued
Class BSix months
ended Year ended
2/28/22(unaudited)
8/31/21 8/31/20 8/31/19 8/31/18 8/31/17
Net asset value, beginning of period $1.00 $1.00 $1.00 $1.00 $1.00 $1.00
Income (loss) from investment operations
Net investment income (loss) (d) $0.00 $0.00 $0.00(w) $0.02 $0.01 $0.00(c)(w)Net realized and unrealized gain (loss) (0.00)(w) 0.00(w) 0.00(w) 0.00(w) — (0.00)(w)
Total from investment operations $(0.00)(w) $0.00(w) $0.00(w) $0.02 $0.01 $0.00(w)
Less distributions declared to shareholders
From net investment income $— $— $(0.00)(w) $(0.02) $(0.01) $(0.00)(w)From net realized gain (0.00)(w) — — — — —
Net asset value, end of period $1.00 $1.00 $1.00 $1.00 $1.00 $1.00
Total return (%) (r)(t) 0.01(n) 0.00 0.54 1.58 0.76 0.08(c)
Ratios (%) (to average net assets)and Supplemental data:
Expenses before expense reductions 1.68(a) 1.66 1.71 1.73 1.69 1.66(c)Expenses after expense reductions 0.04(a) 0.05 0.47 0.72 0.68 0.51(c)Net investment income (loss) 0.00(a) 0.00 0.49 1.57 0.72 0.07(c)Net assets at end of period (000 omitted) $5,622 $6,792 $9,528 $8,977 $11,664 $17,338
See Notes to Financial Statements
12
Copyright © 2022 www.secdatabase.com. All Rights Reserved.Please Consider the Environment Before Printing This Document

Table of Contents
Financial Highlights – continued
Class CSix months
ended Year ended
2/28/22(unaudited)
8/31/21 8/31/20 8/31/19 8/31/18 8/31/17
Net asset value, beginning of period $1.00 $1.00 $1.00 $1.00 $1.00 $1.00
Income (loss) from investment operations
Net investment income (loss) (d) $0.00 $0.00 $0.00(w) $0.02 $0.01 $0.00(c)(w)Net realized and unrealized gain (loss) (0.00)(w) 0.00(w) 0.00(w) 0.00(w) — (0.00)(w)
Total from investment operations $(0.00)(w) $0.00(w) $0.00(w) $0.02 $0.01 $0.00(w)
Less distributions declared to shareholders
From net investment income $— $— $(0.00)(w) $(0.02) $(0.01) $(0.00)(w)From net realized gain (0.00)(w) — — — — —
Net asset value, end of period $1.00 $1.00 $1.00 $1.00 $1.00 $1.00
Total return (%) (r)(t) 0.01(n) 0.00 0.54 1.58 0.76 0.08(c)
Ratios (%) (to average net assets)and Supplemental data:
Expenses before expense reductions 1.68(a) 1.66 1.71 1.73 1.69 1.66(c)Expenses after expense reductions 0.04(a) 0.05 0.40 0.72 0.68 0.50(c)Net investment income (loss) 0.00(a) 0.00 0.37 1.57 0.68 0.07(c)Net assets at end of period (000 omitted) $29,899 $23,748 $34,508 $19,438 $18,451 $38,458
See Notes to Financial Statements
13
Copyright © 2022 www.secdatabase.com. All Rights Reserved.Please Consider the Environment Before Printing This Document

Table of Contents
Financial Highlights – continued
Class ISix months
ended Year ended
2/28/22(unaudited)
8/31/21 8/31/20 8/31/19(i)
Net asset value, beginning of period $1.00 $1.00 $1.00 $1.00
Income (loss) from investment operations
Net investment income (loss) (d) $0.00 $0.00 $0.00(w) $0.02Net realized and unrealized gain (loss) (0.00)(w) 0.00(w) 0.00(w) 0.00(w)
Total from investment operations $(0.00)(w) $0.00(w) $0.00(w) $0.02
Less distributions declared to shareholders
From net investment income $— $— $(0.00)(w) $(0.02)From net realized gain (0.00)(w) — — —
Net asset value, end of period $1.00 $1.00 $1.00 $1.00
Total return (%) (r)(t) 0.01(n) 0.00 0.54 1.52(n)
Ratios (%) (to average net assets)and Supplemental data:
Expenses before expense reductions 0.68(a) 0.65 0.69 0.73(a)Expenses after expense reductions 0.04(a) 0.05 0.23 0.72(a)Net investment income (loss) 0.00(a) 0.00 0.06 1.60(a)Net assets at end of period (000 omitted) $14,954 $12,819 $9,797 $56
Class R1Six months
ended Year ended
2/28/22(unaudited)
8/31/21 8/31/20 8/31/19 8/31/18 8/31/17
Net asset value, beginning of period $1.00 $1.00 $1.00 $1.00 $1.00 $1.00
Income (loss) from investment operations
Net investment income (loss) (d) $0.00 $0.00 $0.00(w) $0.02 $0.01 $0.00(c)(w)Net realized and unrealized gain (loss) (0.00)(w) 0.00(w) 0.00(w) 0.00(w) — (0.00)(w)
Total from investment operations $(0.00)(w) $0.00(w) $0.00(w) $0.02 $0.01 $0.00(w)
Less distributions declared to shareholders
From net investment income $— $— $(0.00)(w) $(0.02) $(0.01) $(0.00)(w)From net realized gain (0.00)(w) — — — — —
Net asset value, end of period $1.00 $1.00 $1.00 $1.00 $1.00 $1.00
Total return (%) (r)(t) 0.01(n) 0.00 0.54 1.57 0.76 0.08(c)
Ratios (%) (to average net assets)and Supplemental data:
Expenses before expense reductions 1.68(a) 1.65 1.71 1.73 1.69 1.66(c)Expenses after expense reductions 0.04(a) 0.05 0.47 0.72 0.68 0.50(c)Net investment income (loss) 0.00(a) 0.00 0.48 1.57 0.72 0.07(c)Net assets at end of period (000 omitted) $8,463 $8,761 $9,209 $7,610 $8,305 $12,236
See Notes to Financial Statements
14
Copyright © 2022 www.secdatabase.com. All Rights Reserved.Please Consider the Environment Before Printing This Document

Table of Contents
Financial Highlights – continued
Class R2Six months
ended Year ended
2/28/22(unaudited)
8/31/21 8/31/20 8/31/19 8/31/18 8/31/17
Net asset value, beginning of period $1.00 $1.00 $1.00 $1.00 $1.00 $1.00
Income (loss) from investment operations
Net investment income (loss) (d) $0.00 $0.00 $0.01 $0.02 $0.01 $0.00(c)(w)Net realized and unrealized gain (loss) (0.00)(w) 0.00(w) 0.00(w) 0.00(w) — (0.00)(w)
Total from investment operations $(0.00)(w) $0.00(w) $0.01 $0.02 $0.01 $0.00(w)
Less distributions declared to shareholders
From net investment income $— $— $(0.01) $(0.02) $(0.01) $(0.00)(w)From net realized gain (0.00)(w) — — — — —
Net asset value, end of period $1.00 $1.00 $1.00 $1.00 $1.00 $1.00
Total return (%) (r)(t) 0.01(n) 0.00 0.54 1.57 0.76 0.08(c)
Ratios (%) (to average net assets)and Supplemental data:
Expenses before expense reductions 1.18(a) 1.16 1.21 1.23 1.19 1.16(c)Expenses after expense reductions 0.04(a) 0.05 0.48 0.72 0.68 0.51(c)Net investment income (loss) 0.00(a) 0.00 0.51 1.57 0.73 0.08(c)Net assets at end of period (000 omitted) $24,058 $26,432 $33,676 $31,672 $34,993 $48,184
See Notes to Financial Statements
15
Copyright © 2022 www.secdatabase.com. All Rights Reserved.Please Consider the Environment Before Printing This Document

Table of Contents
Financial Highlights – continued
Class R3Six months
ended Year ended
2/28/22(unaudited)
8/31/21 8/31/20 8/31/19 8/31/18 8/31/17
Net asset value, beginning of period $1.00 $1.00 $1.00 $1.00 $1.00 $1.00
Income (loss) from investment operations
Net investment income (loss) (d) $0.00 $0.00 $0.00(w) $0.02 $0.01 $0.00(c)(w)Net realized and unrealized gain (loss) (0.00)(w) 0.00(w) 0.00(w) 0.00(w) — (0.00)(w)
Total from investment operations $(0.00)(w) $0.00(w) $0.00(w) $0.02 $0.01 $0.00(w)
Less distributions declared to shareholders
From net investment income $— $— $(0.00)(w) $(0.02) $(0.01) $(0.00)(w)From net realized gain (0.00)(w) — — — — —
Net asset value, end of period $1.00 $1.00 $1.00 $1.00 $1.00 $1.00
Total return (%) (r)(t) 0.01(n) 0.00 0.54 1.57 0.76 0.08(c)
Ratios (%) (to average net assets)and Supplemental data:
Expenses before expense reductions 0.93(a) 0.90 0.96 0.98 0.94 0.91(c)Expenses after expense reductions 0.04(a) 0.05 0.44 0.72 0.68 0.51(c)Net investment income (loss) 0.00(a) 0.00 0.44 1.55 0.73 0.08(c)Net assets at end of period (000 omitted) $16,046 $21,266 $24,536 $16,471 $26,227 $35,196
See Notes to Financial Statements
16
Copyright © 2022 www.secdatabase.com. All Rights Reserved.Please Consider the Environment Before Printing This Document
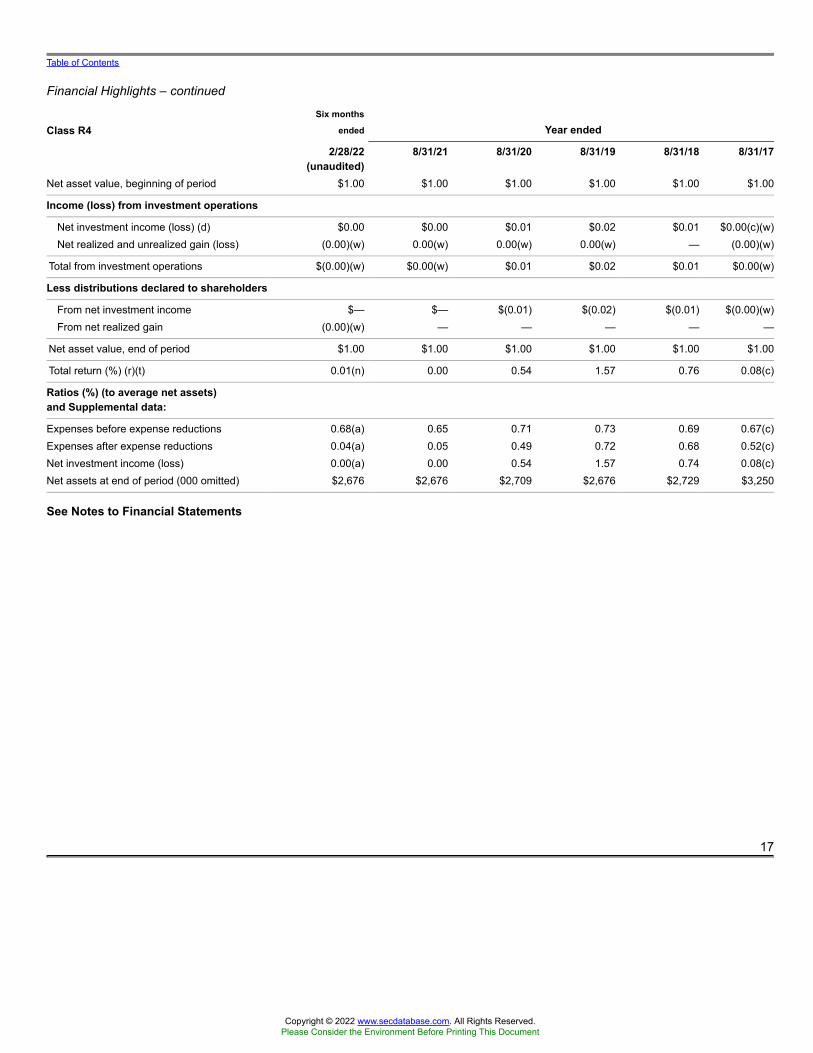
Table of Contents
Financial Highlights – continued
Class R4Six months
ended Year ended
2/28/22(unaudited)
8/31/21 8/31/20 8/31/19 8/31/18 8/31/17
Net asset value, beginning of period $1.00 $1.00 $1.00 $1.00 $1.00 $1.00
Income (loss) from investment operations
Net investment income (loss) (d) $0.00 $0.00 $0.01 $0.02 $0.01 $0.00(c)(w)Net realized and unrealized gain (loss) (0.00)(w) 0.00(w) 0.00(w) 0.00(w) — (0.00)(w)
Total from investment operations $(0.00)(w) $0.00(w) $0.01 $0.02 $0.01 $0.00(w)
Less distributions declared to shareholders
From net investment income $— $— $(0.01) $(0.02) $(0.01) $(0.00)(w)From net realized gain (0.00)(w) — — — — —
Net asset value, end of period $1.00 $1.00 $1.00 $1.00 $1.00 $1.00
Total return (%) (r)(t) 0.01(n) 0.00 0.54 1.57 0.76 0.08(c)
Ratios (%) (to average net assets)and Supplemental data:
Expenses before expense reductions 0.68(a) 0.65 0.71 0.73 0.69 0.67(c)Expenses after expense reductions 0.04(a) 0.05 0.49 0.72 0.68 0.52(c)Net investment income (loss) 0.00(a) 0.00 0.54 1.57 0.74 0.08(c)Net assets at end of period (000 omitted) $2,676 $2,676 $2,709 $2,676 $2,729 $3,250
See Notes to Financial Statements
17
Copyright © 2022 www.secdatabase.com. All Rights Reserved.Please Consider the Environment Before Printing This Document

Table of Contents
Financial Highlights – continued
Class R6Six months
ended Year ended
2/28/22(unaudited)
8/31/21 8/31/20 8/31/19(i)
Net asset value, beginning of period $1.00 $1.00 $1.00 $1.00
Income (loss) from investment operations
Net investment income (loss) (d) $0.00 $0.00 $0.00(w) $0.02Net realized and unrealized gain (loss) (0.00)(w) 0.00(w) 0.00(w) 0.00(w)
Total from investment operations $(0.00)(w) $0.00(w) $0.00(w) $0.02
Less distributions declared to shareholders
From net investment income $— $— $(0.00)(w) $(0.02)From net realized gain (0.00)(w) — — —
Net asset value, end of period $1.00 $1.00 $1.00 $1.00
Total return (%) (r)(t) 0.01(n) 0.00 0.58 1.58(n)
Ratios (%) (to average net assets)and Supplemental data:
Expenses before expense reductions 0.62(a) 0.59 0.65 0.66(a)Expenses after expense reductions 0.04(a) 0.05 0.42 0.65(a)Net investment income (loss) 0.00(a) 0.00 0.46 1.65(a)Net assets at end of period (000 omitted) $113 $113 $113 $54
Class 529ASix months
ended Year ended
2/28/22(unaudited)
8/31/21 8/31/20 8/31/19 8/31/18 8/31/17
Net asset value, beginning of period $1.00 $1.00 $1.00 $1.00 $1.00 $1.00
Income (loss) from investment operations
Net investment income (loss) (d) $0.00 $0.00 $0.00(w) $0.02 $0.01 $0.00(c)(w)Net realized and unrealized gain (loss) (0.00)(w) 0.00(w) 0.00(w) 0.00(w) — (0.00)(w)
Total from investment operations $(0.00)(w) $0.00(w) $0.00(w) $0.02 $0.01 $0.00(w)
Less distributions declared to shareholders
From net investment income $— $— $(0.00)(w) $(0.02) $(0.01) $(0.00)(w)From net realized gain (0.00)(w) — — — — —
Net asset value, end of period $1.00 $1.00 $1.00 $1.00 $1.00 $1.00
Total return (%) (r)(t) 0.01(n) 0.00 0.51 1.53 0.71 0.06(c)
Ratios (%) (to average net assets)and Supplemental data:
Expenses before expense reductions 0.98(a) 0.95 1.01 1.03 1.00 1.01(c)Expenses after expense reductions 0.04(a) 0.05 0.47 0.77 0.73 0.53(c)Net investment income (loss) 0.00(a) 0.00 0.44 1.52 0.73 0.06(c)Net assets at end of period (000 omitted) $28,163 $27,919 $28,695 $19,061 $15,197 $13,208
See Notes to Financial Statements
18
Copyright © 2022 www.secdatabase.com. All Rights Reserved.Please Consider the Environment Before Printing This Document

Table of Contents
Financial Highlights – continued
Class 529BSix months
ended Year ended
2/28/22(unaudited)
8/31/21 8/31/20 8/31/19 8/31/18 8/31/17
Net asset value, beginning of period $1.00 $1.00 $1.00 $1.00 $1.00 $1.00
Income (loss) from investment operations
Net investment income (loss) (d) $0.00 $0.00 $0.01 $0.02 $0.01 $0.00(c)(w)Net realized and unrealized gain (loss) (0.00)(w) 0.00(w) 0.00(w) 0.00(w) — (0.00)(w)
Total from investment operations $(0.00)(w) $0.00(w) $0.01 $0.02 $0.01 $0.00(w)
Less distributions declared to shareholders
From net investment income $— $— $(0.01) $(0.02) $(0.01) $(0.00)(w)From net realized gain (0.00)(w) — — — — —
Net asset value, end of period $1.00 $1.00 $1.00 $1.00 $1.00 $1.00
Total return (%) (r)(t) 0.01(n) 0.00 0.51 1.53 0.71 0.06(c)
Ratios (%) (to average net assets)and Supplemental data:
Expenses before expense reductions 1.73(a) 1.71 1.76 1.78 1.75 1.76(c)Expenses after expense reductions 0.04(a) 0.05 0.53 0.77 0.73 0.53(c)Net investment income (loss) 0.00(a) 0.00 0.53 1.51 0.71 0.06(c)Net assets at end of period (000 omitted) $139 $182 $183 $247 $293 $348
See Notes to Financial Statements
19
Copyright © 2022 www.secdatabase.com. All Rights Reserved.Please Consider the Environment Before Printing This Document

Table of Contents
Financial Highlights – continued
Class 529CSix months
ended Year ended
2/28/22(unaudited)
8/31/21 8/31/20 8/31/19 8/31/18 8/31/17
Net asset value, beginning of period $1.00 $1.00 $1.00 $1.00 $1.00 $1.00
Income (loss) from investment operations
Net investment income (loss) (d) $0.00 $0.00 $0.00(w) $0.02 $0.01 $0.00(c)(w)Net realized and unrealized gain (loss) (0.00)(w) 0.00(w) 0.00(w) 0.00(w) — (0.00)(w)
Total from investment operations $(0.00)(w) $0.00(w) $0.00(w) $0.02 $0.01 $0.00(w)
Less distributions declared to shareholders
From net investment income $— $— $(0.00)(w) $(0.02) $(0.01) $(0.00)(w)From net realized gain (0.00)(w) — — — — —
Net asset value, end of period $1.00 $1.00 $1.00 $1.00 $1.00 $1.00
Total return (%) (r)(t) 0.01(n) 0.00 0.51 1.53 0.71 0.06(c)
Ratios (%) (to average net assets)and Supplemental data:
Expenses before expense reductions 1.73(a) 1.71 1.76 1.78 1.75 1.76(c)Expenses after expense reductions 0.04(a) 0.05 0.49 0.77 0.73 0.54(c)Net investment income (loss) 0.00(a) 0.00 0.46 1.52 0.70 0.06(c)Net assets at end of period (000 omitted) $4,639 $6,062 $8,360 $6,437 $6,419 $6,957
(a) Annualized.(c) Amount reflects a one-time reimbursement of expenses by the custodian (or former custodian) without which net investment income and
performance would be lower and expenses would be higher.(d) Per share data is based on average shares outstanding.(i) For Class I and Class R6, the period is from the class inception, September 18, 2018, through the stated period end.(n) Not annualized.(r) Certain expenses have been reduced without which performance would have been lower.(t) Total returns do not include any applicable sales charges.(w) Per share amount was less than $0.01 and total return or ratio was less than 0.01%, as applicable.
See Notes to Financial Statements
20
Copyright © 2022 www.secdatabase.com. All Rights Reserved.Please Consider the Environment Before Printing This Document
Table of Contents
NOTES TO FINANCIAL STATEMENTS(unaudited)
(1) Business and OrganizationMFS U.S. Government Cash Reserve Fund (the fund) is a diversified series of MFS Series Trust I (the trust). The trust is organized as aMassachusetts business trust and is registered under the Investment Company Act of 1940, as amended, as an open-end managementinvestment company.
The fund is an investment company and accordingly follows the investment company accounting and reporting guidance of the FinancialAccounting Standards Board (FASB) Accounting Standards Codification Topic 946 Financial Services - Investment Companies.
(2) Significant Accounting PoliciesGeneral — The preparation of financial statements in conformity with U.S. generally accepted accounting principles requiresmanagement to make estimates and assumptions that affect the reported amounts of assets and liabilities, and disclosure ofcontingent assets and liabilities at the date of the financial statements and the reported amounts of increases and decreases innet assets from operations during the reporting period. Actual results could differ from those estimates. In the preparation ofthese financial statements, management has evaluated subsequent events occurring after the date of the fund’s Statement ofAssets and Liabilities through the date that the financial statements were issued.Balance Sheet Offsetting — The fund's accounting policy with respect to balance sheet offsetting is that, absent an event ofdefault by the counterparty or a termination of the agreement, the International Swaps and Derivatives Association (ISDA)Master Agreement, or similar agreement, does not result in an offset of reported amounts of financial assets and financialliabilities in the Statement of Assets and Liabilities across transactions between the fund and the applicable counterparty. Thefund's right to setoff may be restricted or prohibited by the bankruptcy or insolvency laws of the particular jurisdiction to whicha specific master netting agreement counterparty is subject. Balance sheet offsetting disclosures, to the extent applicable tothe fund, have been included in the fund’s Significant Accounting Policies note under the captions for each of the fund’s in-scope financial instruments and transactions.Investment Valuations — Pursuant to procedures approved by the Board of Trustees, investments held by the fund aregenerally valued at amortized cost, which approximates market value. Amortized cost involves valuing an instrument at its costas adjusted for amortization of premium or accretion of discount rather than its current market value. The amortized cost valueof an instrument can be different from the market value of an instrument.Various inputs are used in determining the value of the fund's assets or liabilities. These inputs are categorized into three broad levels. Incertain cases, the inputs used to measure fair value may fall into different levels of the fair value hierarchy. In such cases, an investment'slevel within the fair value hierarchy is based on the lowest level of input that is significant to the fair value measurement. The fund'sassessment of the significance of a particular input to the fair value measurement in its entirety requires judgment, and considers factorsspecific to the investment. Level 1 includes unadjusted quoted prices in active markets for identical assets or liabilities. Level 2 includesother significant observable market-based inputs (including quoted prices for similar
21
Copyright © 2022 www.secdatabase.com. All Rights Reserved.Please Consider the Environment Before Printing This Document

Table of Contents
Notes to Financial Statements (unaudited) - continued
securities, interest rates, prepayment speed, and credit risk). Level 3 includes unobservable inputs, which may include the adviser's ownassumptions in determining the fair value of investments. The following is a summary of the levels used as of February 28, 2022 invaluing the fund's assets and liabilities:
Financial Instruments Level 1 Level 2 Level 3 TotalShort-Term Securities $— $271,471,885 $— $271,471,885
For further information regarding security characteristics, see the Portfolio of Investments.
Repurchase Agreements — The fund enters into repurchase agreements under the terms of Master Repurchase Agreementswith approved counterparties. Each repurchase agreement is recorded at cost. The fund requires that the securities collateralin a repurchase transaction be transferred to a custodian. The fund monitors, on a daily basis, the value of the collateral toensure that its value, including accrued interest, is greater than amounts owed to the fund under each such repurchaseagreement. Upon an event of default under a Master Repurchase Agreement, the non-defaulting party may close out alltransactions traded under such agreement and net amounts owed under each transaction to one net amount payable by oneparty to the other. Absent an event of default, the Master Repurchase Agreement does not result in an offset of reportedamounts of assets and liabilities in the Statement of Assets and Liabilities across transactions between the fund and theapplicable counterparty. At February 28, 2022, the fund had investments in repurchase agreements with a gross value of$37,396,000 included in investments in unaffiliated issuers in the Statement of Assets and Liabilities. The value of the relatedcollateral exceeded the value of the repurchase agreements at period end.Indemnifications — Under the fund's organizational documents, its officers and Trustees may be indemnified against certainliabilities and expenses arising out of the performance of their duties to the fund. Additionally, in the normal course ofbusiness, the fund enters into agreements with service providers that may contain indemnification clauses. The fund'smaximum exposure under these agreements is unknown as this would involve future claims that may be made against the fundthat have not yet occurred.Investment Transactions and Income — Investment transactions are recorded on the trade date. Interest income is recorded onthe accrual basis. All premium and discount is amortized or accreted for financial statement purposes in accordance with U.S.generally accepted accounting principles. In determining the net gain or loss on securities sold, the cost of securities isdetermined on the identified cost basis.Tax Matters and Distributions — The fund intends to qualify as a regulated investment company, as defined under SubchapterM of the Internal Revenue Code, and to distribute all of its taxable income, including realized capital gains. As a result, noprovision for federal income tax is required. The fund’s federal tax returns, when filed, will remain subject to examination by theInternal Revenue Service for a three year period. Management has analyzed the fund’s tax positions taken on federal and statetax returns for all open tax years and does not believe that there are any uncertain tax positions that require recognition of a taxliability.Distributions to shareholders are recorded on the ex-dividend date. Income and capital gain distributions are determined in accordancewith income tax regulations, which may differ from U.S. generally accepted accounting principles. Certain capital accounts
22
Copyright © 2022 www.secdatabase.com. All Rights Reserved.Please Consider the Environment Before Printing This Document

Table of Contents
Notes to Financial Statements (unaudited) - continued
in the financial statements are periodically adjusted for permanent differences in order to reflect their tax character. These adjustmentshave no impact on net assets or net asset value per share. Temporary differences which arise from recognizing certain items of income,expense, gain or loss in different periods for financial statement and tax purposes will reverse at some time in the future.
During the year ended August 31, 2021, there were no significant adjustments due to differences between book and tax accounting.
The tax character of distributions made during the current period will be determined at fiscal year end. The fund declared no distributionsfor the year ended August 31, 2021.
The federal tax cost and the tax basis components of distributable earnings were as follows:
As of 2/28/22Cost of investments $271,471,885
As of 8/31/21Undistributed ordinary income 34,282Other temporary differences (3,949)
The aggregate cost above includes prior fiscal year end tax adjustments, if applicable.
Multiple Classes of Shares of Beneficial Interest — The fund offers multiple classes of shares, which differ in their respectivedistribution, service, and program manager fees. The fund's income and common expenses are allocated to shareholdersbased on the value of settled shares outstanding of each class. The fund's realized and unrealized gain (loss) are allocated toshareholders based on the daily net assets of each class. Dividends are declared separately for each class. Differences in pershare dividend rates are generally due to differences in separate class expenses. Class B and Class C shares will convert toClass A shares approximately eight years after purchase. Class 529B and Class 529C shares will convert to Class 529A sharesapproximately eight years after purchase. On December 29, 2021, the fund announced that effective on or about March 21, 2022,all Class 529B and Class 529C shares will be converted into Class 529A shares. The fund’s distributions declared toshareholders as reported in the Statements of Changes in Net Assets are presented by class as follows:
Six months ended2/28/22
Year ended8/31/21
Class A $17,280 $—Class B 819 —Class C 2,445 —Class I 1,794 —Class R1 1,279 —Class R2 3,572 —Class R3 2,638 —Class R4 375 —Class R6 16 —Class 529A 3,979 —Class 529B 18 —Class 529C 720 —
Total $34,935 $—
23
Copyright © 2022 www.secdatabase.com. All Rights Reserved.Please Consider the Environment Before Printing This Document

Table of Contents
Notes to Financial Statements (unaudited) - continued
(3) Transactions with AffiliatesInvestment Adviser — The fund has an investment advisory agreement with MFS to provide overall investment managementand related administrative services and facilities to the fund. The management fee is computed daily and paid monthly at thefollowing annual rates based on the fund's average daily net assets:
Up to $1 billion 0.40%In excess of $1 billion 0.35%
During the six months ended February 28, 2022, MFS voluntarily waived receipt of $417,209 of the fund’s management fee in order toavoid a negative yield. For the six months ended February 28, 2022, this amount is included in the reduction of total expenses in theStatement of Operations. MFS has also agreed in writing to reduce its management fee by a specified amount if certain MFS mutual fundassets exceed thresholds agreed to by MFS and the fund’s Board of Trustees. For the six months ended February 28, 2022, thismanagement fee reduction amounted to $17,468, which is included in the reduction of total expenses in the Statement of Operations. Forthe six months ended February 28, 2022, these waivers had the effect of reducing the management fee by 0.34% of average daily netassets on an annualized basis. The management fee incurred for the six months ended February 28, 2022 was equivalent to an annualeffective rate of 0.06% of the fund’s average daily net assets.
In order to avoid a negative yield for the six months ended February 28, 2022, MFS voluntarily agreed to reduce certain other expensesin the amount of $78,725, which is included in the reduction of total expenses in the Statement of Operations.
The investment adviser has agreed in writing to pay a portion of the fund’s total annual operating expenses, excluding interest, taxes,extraordinary expenses, brokerage and transaction costs, and investment-related expenses, such that total fund operating expenses donot exceed the following rates annually of each class’s average daily net assets:
Classes
A B C I R1 R2 R3 R4 R6 529A 529B 529C0.45% 0.45% 0.45% 0.45% 0.45% 0.45% 0.45% 0.45% 0.37% 0.50% 0.50% 0.50%
This written agreement will continue until modified by the fund’s Board of Trustees, but such agreement will continue at least untilDecember 31, 2022. For the six months ended February 28, 2022, this reduction amounted to $301,306, which is included in thereduction of total expenses in the Statement of Operations.
Distributor — The Board of Trustees has adopted a distribution plan for certain share classes pursuant to Rule 12b-1 of theInvestment Company Act of 1940.The fund’s distribution plan provides that the fund will pay MFS Fund Distributors, Inc. (MFD), a wholly-owned subsidiary of MFS, forservices provided by MFD and financial intermediaries in connection with the distribution and servicing of certain share classes. Onecomponent of the plan is a distribution fee paid to MFD and another component of the plan is a service fee paid to MFD. MFD maysubsequently pay all, or a portion, of the distribution and/or service fees to financial intermediaries.
24
Copyright © 2022 www.secdatabase.com. All Rights Reserved.Please Consider the Environment Before Printing This Document

Table of Contents
Notes to Financial Statements (unaudited) - continued
Distribution Plan Fee Table:
DistributionFee Rate (d)
ServiceFee Rate (d)
TotalDistribution
Plan (d)
AnnualEffectiveRate (e)
Distributionand Service
Fee
Class A — 0.25% 0.25% 0.00% $ 157,349
Class B 0.75% 0.25% 1.00% 0.00% 29,859
Class C 0.75% 0.25% 1.00% 0.00% 103,509
Class R1 0.75% 0.25% 1.00% 0.00% 44,539
Class R2 0.25% 0.25% 0.50% 0.00% 62,414
Class R3 — 0.25% 0.25% 0.00% 23,221
Class 529A — 0.25% 0.25% 0.00% 34,807
Class 529B 0.75% 0.25% 1.00% 0.00% 742
Class 529C 0.75% 0.25% 1.00% 0.00% 25,468
Total Distribution and ServiceFees $481,908
(d) In accordance with the distribution plan for certain classes, the fund pays distribution and/or service fees equal to these annual percentage rates ofeach class’s average daily net assets. The distribution and service fee rates disclosed by class represent the current rates in effect at the endof the reporting period. Any rate changes, if applicable, are detailed below.
(e) The annual effective rates represent actual fees incurred under the distribution plan for the six months ended February 28, 2022 based on eachclass's average daily net assets. MFD has agreed in writing to waive any distribution and/or service fees for Class A, Class B, Class C, ClassR1, Class R2, Class R3, Class 529A, Class 529B, and Class 529C. This written agreement will continue until modified by the fund’s Board ofTrustees, but such agreement will continue until at least December 31, 2022. These reductions, for the six months ended February 28,2022,for Class A, Class B, Class C, Class R1, Class R2, Class R3, Class 529A, Class 529B, and Class 529C amounted to $157,349, $29,859,$103,509, $44,539, $62,414, $23,221, $34,807, $742, and $25,468, respectively, and are included in the reduction of total expenses in theStatement of Operations
Certain Class A shares are subject to a contingent deferred sales charge (CDSC) in the event of a shareholder redemption within 18months of purchase. Class B and Class 529B shares are subject to a CDSC in the event of a shareholder redemption within six years ofpurchase. Class C and Class 529C shares are subject to a CDSC in the event of a shareholder redemption within 12 months ofpurchase. All contingent deferred sales charges are paid to MFD and during the six months ended February 28, 2022, were as follows:
AmountClass A $1,166Class B 2,176Class C 234Class 529B —Class 529C 411
The fund has entered into and may from time to time enter into contracts with program managers and other parties which administer thetuition programs through which an investment in the fund’s 529 share classes is made. The fund has entered into an agreement withMFD pursuant to which MFD receives an annual fee of up to 0.05% of the average daily net assets attributable to each 529 share class.During the
25
Copyright © 2022 www.secdatabase.com. All Rights Reserved.Please Consider the Environment Before Printing This Document

Table of Contents
Notes to Financial Statements (unaudited) - continued
six months ended February 28, 2021, MFS voluntarily agreed to reduce the fund’s program manager fees in the amount of $8,272 inorder to avoid a negative yield for Class 529A, Class 529B, and Class 529C shares. For the six months ended February 28, 2022, thisamount is included in the reduction of total expenses in the Statements of Operations. This voluntary reduction had the effect of reducingthe program manager fee by 0.05% of average daily net assets attributable to each of the Class 529A, Class 529B, and 529C shares onan annualized basis. The program manager fee incurred for the six months ended February 28, 2022, was equivalent to an annualeffective rate of 0.00% of average daily net assets attributable to each of the Class 529A, Class 529B, and 529C shares. The servicesprovided by MFD, or a third party with which MFD contracts, include recordkeeping and tax reporting and account services, as well asservices designed to maintain the program’s compliance with the Internal Revenue Code and other regulatory requirements. Programmanager fees for the six months ended February 28, 2022, were as follows:
Fee WaiverClass 529A $6,962 $6,962Class 529B 37 37Class 529C 1,273 1,273
Total Program Manager Fees and Waivers $8,272 $8,272
Shareholder Servicing Agent — MFS Service Center, Inc. (MFSC), a wholly-owned subsidiary of MFS, receives a fee from thefund for its services as shareholder servicing agent calculated as a percentage of the average daily net assets of the fund asdetermined periodically under the supervision of the fund's Board of Trustees. For the six months ended February 28, 2022, thefee was $85,099, which equated to 0.0669% annually of the fund's average daily net assets. MFSC also receives reimbursementfrom the fund for out-of-pocket expenses, sub-accounting and other shareholder servicing costs which may be paid to affiliatedand unaffiliated service providers. Class R6 shares do not incur sub-accounting fees. For the six months ended February 28,2022, these out-of-pocket expenses, sub-accounting and other shareholder servicing costs amounted to $125,103.Administrator — MFS provides certain financial, legal, shareholder communications, compliance, and other administrativeservices to the fund. Under an administrative services agreement, the fund reimburses MFS the costs incurred to provide theseservices. The fund is charged an annual fixed amount of $17,500 plus a fee based on average daily net assets. Theadministrative services fee incurred for the six months ended February 28, 2022 was equivalent to an annual effective rate of0.0174% of the fund's average daily net assets.Trustees’ and Officers’ Compensation — The fund pays compensation to independent Trustees in the form of a retainer,attendance fees, and additional compensation to Board and Committee chairpersons. The fund does not pay compensationdirectly to Trustees or officers of the fund who are also officers of the investment adviser, all of whom receive remunerationfrom MFS for their services to the fund. Certain officers and Trustees of the fund are officers or directors of MFS, MFD, andMFSC.Prior to December 31, 2001, the fund had an unfunded defined benefit plan (“DB plan”) for independent Trustees. As of December 31,2001, the Board took action to terminate the DB plan with respect to then-current and any future independent
26
Copyright © 2022 www.secdatabase.com. All Rights Reserved.Please Consider the Environment Before Printing This Document

Table of Contents
Notes to Financial Statements (unaudited) - continued
Trustees, such that the DB plan covers only certain of those former independent Trustees who retired on or before December 31, 2001.The DB plan resulted in a pension expense of $110 and is included in “Independent Trustees’ compensation” in the Statement ofOperations for the six months ended February 28, 2022. The liability for deferred retirement benefits payable to those former independentTrustees under the DB plan amounted to $3,735 at February 28, 2022, and is included in “Payable for independent Trustees’compensation” in the Statement of Assets and Liabilities.
Other - On June 18, 2021, MFS redeemed 51,033 shares of Class I for an aggregate amount of $51,033At February 28, 2022, MFS held 100% of the outstanding shares of Class R4.
(4) Shares of Beneficial InterestThe fund's Declaration of Trust permits the Trustees to issue an unlimited number of full and fractional shares of beneficial interest. Thenumber of shares sold, reinvested and reacquired corresponds to the net proceeds from the sale of shares, reinvestment of distributionsand cost of shares reacquired, respectively, since shares are sold and reacquired at $1.00 per share. Transactions in fund shares wereas follows:
Six months ended2/28/22
Year ended8/31/21
Shares sold
Class A 40,527,366 97,787,393
Class B 1,043,465 4,831,542
Class C 17,027,446 19,196,047
Class I 5,704,113 8,377,442
Class R1 2,961,241 6,051,818
Class R2 3,638,571 9,662,586
Class R3 3,137,520 11,062,318
Class R4 — 6,597
Class R6 246 436
Class 529A 5,638,983 13,853,558
Class 529B 27,132 124,416
Class 529C 791,918 3,513,764
80,498,001 174,467,917
27
Copyright © 2022 www.secdatabase.com. All Rights Reserved.Please Consider the Environment Before Printing This Document

Table of Contents
Notes to Financial Statements (unaudited) - continued
Six months ended2/28/22
Year ended8/31/21
Shares issued to shareholders inreinvestment of distributions
Class A 16,728 —
Class B 783 —
Class C 2,430 —
Class I 1,784 —
Class R1 1,279 —
Class R2 3,572 —
Class R3 2,639 —
Class R4 375 —
Class R6 16 —
Class 529A 3,968 —
Class 529B 19 —
Class 529C 719 —
34,312 —
Shares reacquired
Class A (31,980,227) (109,743,581)
Class B (2,214,793) (7,568,950)
Class C (10,871,348) (29,965,240)
Class I (3,567,572) (5,352,725)
Class R1 (3,260,152) (6,499,432)
Class R2 (6,014,577) (16,912,492)
Class R3 (8,362,099) (14,334,675)
Class R4 — (39,756)
Class R6 (234) (549)
Class 529A (5,395,187) (14,630,123)
Class 529B (70,219) (125,318)
Class 529C (2,216,339) (5,813,050)
(73,952,747) (210,985,891)
28
Copyright © 2022 www.secdatabase.com. All Rights Reserved.Please Consider the Environment Before Printing This Document

Table of Contents
Notes to Financial Statements (unaudited) - continued
Six months ended2/28/22
Year ended8/31/21
Net change
Class A 8,563,867 (11,956,188)
Class B (1,170,545) (2,737,408)
Class C 6,158,528 (10,769,193)
Class I 2,138,325 3,024,717
Class R1 (297,632) (447,614)
Class R2 (2,372,434) (7,249,906)
Class R3 (5,221,940) (3,272,357)
Class R4 375 (33,159)
Class R6 28 (113)
Class 529A 247,764 (776,565)
Class 529B (43,068) (902)
Class 529C (1,423,702) (2,299,286)
6,579,566 (36,517,974)
Effective June 1, 2019, purchases of the fund’s Class B and Class 529B shares are closed to new and existing investors subject tocertain exceptions. On December 29, 2021, the fund announced the termination of the fund's Class 529A, Class 529B, and Class 529Cshares effective on or about June 9, 2022. In connection with the termination, all sales of Class 529B and Class 529C shares will besuspended effective after the close of business on or about March 18, 2022, and Class 529B and Class 529C shares will be convertedinto Class 529A shares of the fund effective on or about March 21, 2022. In addition, effective after the close of business on or about May13, 2022, all sales and redemptions of Class 529A shares will be suspended in anticipation of a complete redemption of Class 529Ashares on or about May 20, 2022. Please see the fund’s prospectus for details.
Effective at the close of business on May 29, 2020, purchases of the fund are closed to new and existing investors subject to certainexceptions. Please see the fund's prospectus for details.
(5) Line of CreditThe fund and certain other funds managed by MFS participate in a $1.25 billion unsecured committed line of credit of which $1 billion isreserved for use by the fund and certain other MFS U.S. funds. The line of credit is provided by a syndicate of banks under a creditagreement. Borrowings may be made for temporary financing needs. Interest is charged to each fund, based on its borrowings, generallyat a rate equal to the highest of one month LIBOR, the Federal Funds Effective Rate and the Overnight Bank Funding Rate, plus anagreed upon spread. A commitment fee, based on the average daily, unused portion of the committed line of credit, is allocated amongthe participating funds. In addition, the fund and other funds managed by MFS have established unsecured uncommitted borrowingarrangements with certain banks for temporary financing needs. Interest is charged to each fund, based on its borrowings,
29
Copyright © 2022 www.secdatabase.com. All Rights Reserved.Please Consider the Environment Before Printing This Document

Table of Contents
Notes to Financial Statements (unaudited) - continued
at rates equal to customary reference rates plus an agreed upon spread. For the six months ended February 28, 2022, the fund’scommitment fee and interest expense were $492 and $0, respectively, and are included in “Miscellaneous” expense in the Statement ofOperations.
(6) Impacts of COVID-19The pandemic related to the global spread of novel coronavirus disease (COVID-19), which was first detected in December 2019, hasresulted in significant disruptions to global business activity and the global economy, as well as the economies of individual countries, thefinancial performance of individual companies and sectors, and the securities and commodities markets in general. Multiple surges incases globally, the availability and widespread adoption of vaccines, and the emergence of variant strains of the virus continue to createuncertainty as to the future and long-term impacts resulting from the pandemic including impacts to the prices and liquidity of the fund'sinvestments and the fund's performance.
(7) LIBOR TransitionCertain of the fund's investments, including investments in certain debt instruments and derivatives (if any), as well as borrowings by thefund and certain other contractual arrangements of the fund, may be based on the London Interbank Offered Rate (“LIBOR”). In 2017, theregulatory authority that oversees financial services firms in the United Kingdom announced plans to transition away from LIBOR by theend of 2021. In March 2021, the administrator of LIBOR announced the extension of the publication of the more commonly used U.S.dollar LIBOR settings to the end of June 2023. Although the full impacts of the transition away from LIBOR are not fully known, thetransition may result in, among other things, an increase in volatility or illiquidity of the markets for instruments that currently rely onLIBOR to determine interest rates and this could have an adverse impact on the fund's performance. With respect to the fund'saccounting for investments, including investments in certain debt instruments and derivatives, as well as borrowings by the fund and anyother contractual arrangements of the fund that undergo reference rate-related modifications as a result of the transition, managementwill rely upon the relief provided by FASB Codification Topic 848 – Reference Rate Reform (Topic 848). The guidance in Topic 848permits the fund to account for those modified contracts as a continuation of the existing contracts. Management is still evaluating theimpact to the fund of the June 30, 2023 planned discontinuation of the more commonly used U.S. dollar LIBOR settings.
(8) Russia and Ukraine ConflictThe market disruptions, which began in late February 2022, associated with geopolitical events related to the conflict between Russiaand Ukraine may adversely affect the value of the fund’s assets and thus the fund’s performance. Management continues to monitorthese events and to evaluate the related impacts, if any, to the fund.
30
Copyright © 2022 www.secdatabase.com. All Rights Reserved.Please Consider the Environment Before Printing This Document

Table of Contents
PROXY VOTING POLICIES AND INFORMATION
MFS votes proxies on behalf of the fund pursuant to proxy voting policies and procedures that are available without charge, uponrequest, by calling 1-800-225-2606, by visiting mfs.com/proxyvoting, or by visiting the SEC’s Web site at http://www.sec.gov.
Information regarding how the fund voted proxies relating to portfolio securities during the most recent twelve-month period ended June30 is available by August 31 of each year without charge by visiting mfs.com/proxyvoting, or by visiting the SEC’s Web site athttp://www.sec.gov.
PORTFOLIO HOLDINGS INFORMATION
The fund files monthly portfolio information with the SEC on Form N-MFP. The fund’s Form N-MFP reports are available on the SEC’sWeb site at http://www.sec.gov. A shareholder can also access the fund’s portfolio holdings as of each month end and the fund’s FormN-MFP reports at mfs.com/openendfunds after choosing “Click here for access to Money Market fund reports”.
FURTHER INFORMATION
From time to time, MFS may post important information about the fund or the MFS Funds on the MFS Web site (mfs.com). Thisinformation is available at https://www.mfs.com/announcements or at mfs.com/openendfunds by choosing the fund’s name and thenscrolling to the “Resources” section and clicking on the “Announcements” tab, if any.
INFORMATION ABOUT FUND CONTRACTS AND LEGAL CLAIMS
The fund has entered into contractual arrangements with an investment adviser, administrator, distributor, shareholder servicing agent,529 program manager (if applicable), and custodian who each provide services to the fund. Unless expressly stated otherwise,shareholders are not parties to, or intended beneficiaries of these contractual arrangements, and these contractual arrangements are notintended to create any shareholder right to enforce them against the service providers or to seek any remedy under them against theservice providers, either directly or on behalf of the fund.
Under the Trust’s By-Laws and Declaration of Trust, any claims asserted against or on behalf of the MFS Funds, including claims againstTrustees and Officers, must be brought in state and federal courts located within the Commonwealth of Massachusetts.
PROVISION OF FINANCIAL REPORTS AND SUMMARY PROSPECTUSES
The fund produces financial reports every six months and updates its summary prospectus and prospectus annually. To avoid sendingduplicate copies of materials to households, only one copy of the fund’s annual and semiannual report and summary prospectus may bemailed to shareholders having the same last name and residential address on the fund’s records. However, any shareholder may contactMFSC (please see back cover for address and telephone number) to request that copies of these reports and summary prospectuses besent personally to that shareholder.
31
Copyright © 2022 www.secdatabase.com. All Rights Reserved.Please Consider the Environment Before Printing This Document

Table of Contents
Copyright © 2022 www.secdatabase.com. All Rights Reserved.Please Consider the Environment Before Printing This Document

Table of Contents
Copyright © 2022 www.secdatabase.com. All Rights Reserved.Please Consider the Environment Before Printing This Document

Table of Contents
Copyright © 2022 www.secdatabase.com. All Rights Reserved.Please Consider the Environment Before Printing This Document

Table of Contents
Copyright © 2022 www.secdatabase.com. All Rights Reserved.Please Consider the Environment Before Printing This Document

Table of Contents
Save paper with eDelivery.
MFS® will send you prospectuses,reports, and proxies directly via e-mailso you will get information faster withless mailbox clutter.
To sign up:
CONTACTWEB SITEmfs.com
MFS TALK1-800-637-825524 hours a day
ACCOUNT SERVICE AND LITERATURE
Copyright © 2022 www.secdatabase.com. All Rights Reserved.Please Consider the Environment Before Printing This Document

1. Go to mfs.com.
2. Log in via MFS® Access.3. Select eDelivery.
If you own your MFS fund shares through a financial
institution or a retirement plan, MFS® TALK, MFS®
Access, or eDelivery may not be available to you.
Shareholders1-800-225-2606
Financial advisors1-800-343-2829
Retirement plan services1-800-637-1255
MAILING ADDRESSMFS Service Center, Inc.P.O. Box 219341Kansas City, MO 64121-9341
OVERNIGHT MAILMFS Service Center, Inc.Suite 219341430 W 7th StreetKansas City, MO 64105-1407
Copyright © 2022 www.secdatabase.com. All Rights Reserved.Please Consider the Environment Before Printing This Document

Semiannual ReportFebruary 28, 2022
MFS® Value Fund
EIF-SEM
Copyright © 2022 www.secdatabase.com. All Rights Reserved.Please Consider the Environment Before Printing This Document

Copyright © 2022 www.secdatabase.com. All Rights Reserved.Please Consider the Environment Before Printing This Document
Letter from the Chair and CEO
Portfolio composition
Expense table
Portfolio of investments
Statement of assets and liabilities
Statement of operations
Statements of changes in net assets
Financial highlights
Notes to financial statements
Proxy voting policies and information
Quarterly portfolio disclosure
Further information
Information about fund contracts and legal claims
Provision of financial reports and summary prospectuses
Contact information
MFS® Value Fund
CONTENTS
1
2
3
6
10
12
13
14
26
40
40
40
40
40
back cover
The report is prepared for the general information of shareholders. It is authorized for distribution toprospective investors only when preceded or accompanied by a current prospectus.
NOT FDIC INSURED • MAY LOSE VALUE • NO BANK GUARANTEE
Copyright © 2022 www.secdatabase.com. All Rights Reserved.Please Consider the Environment Before Printing This Document

Table of Contents
Copyright © 2022 www.secdatabase.com. All Rights Reserved.Please Consider the Environment Before Printing This Document

Table of Contents
LETTER FROM THE CHAIR AND CEO
Dear Shareholders:
As a result of Russia’s invasion of Ukraine, the danger of wider geopolitical conflict has risen to a level not seen in decades, and thiscomes as sanctions aimed at countering Russia’s actions are exacerbating already mounting inflation. Consequently, at a time whenglobal growth faces multiple headwinds, central banks have been presented with the challenge of reining in rising prices without tippingeconomies into recession. The US Federal Reserve recently raised rates for the first time since 2018 and indicated that it is likely totighten policy much more over the coming year. Meanwhile, the unsettled geopolitical backdrop and prospect of tighter financialconditions has led to increased volatility.
There are, however, encouraging signs for the markets. The Omicron wave of the coronavirusis receding outside Asia, unemployment is low, and there are signs that some global supplychain bottlenecks are beginning to ease, though events in Ukraine could hamper theseadvances. Additionally, easier Chinese monetary policy and the record pace of corporate stockbuybacks are supportive elements, albeit amid an otherwise turbulent investment environment.
It is important to have a deep understanding of company fundamentals during times of market transition, and we have built our globalresearch platform to do just that.
At MFS®, we put our clients’ assets to work responsibly by carefully navigating the increasing complexity of global markets andeconomies. Guided by our commitment to long-term investing, we tune out the noise and try to uncover what we believe are the best,most durable investment opportunities in the market. Our unique global investment platform combines collective expertise, long-termdiscipline, and thoughtful risk management to create sustainable value for investors over time.
Respectfully,
Michael W. RobergeChair and Chief Executive OfficerMFS Investment Management
April 14, 2022
The opinions expressed in this letter are subject to change and may not be relied upon for investment advice. No forecasts can beguaranteed.
Copyright © 2022 www.secdatabase.com. All Rights Reserved.Please Consider the Environment Before Printing This Document

1
Copyright © 2022 www.secdatabase.com. All Rights Reserved.Please Consider the Environment Before Printing This Document

Table of Contents
PORTFOLIO COMPOSITION
(g) The Global Industry Classification Standard (GICS®) was developed by and/or is the exclusive property of MSCI, Inc. and S&P Global MarketIntelligence Inc. (“S&P Global Market Intelligence”). GICS is a service mark of MSCI and S&P Global Market Intelligence and has beenlicensed for use by MFS. MFS has applied its own internal sector/industry classification methodology for equity securities and non-equitysecurities that are unclassified by GICS.
Cash & Cash Equivalents includes any cash, investments in money market funds, short-term securities, and other assets less liabilities. Please see theStatement of Assets and Liabilities for additional information related to the fund’s cash position and other assets and liabilities.
Percentages are based on net assets as of February 28, 2022.
The portfolio is actively managed and current holdings may be different.
2
Portfolio structure
Top ten holdings
JPMorgan Chase & Co. 3.9%
Johnson & Johnson 3.4%
Aon PLC 2.7%
Comcast Corp., “A” 2.5%
Northrop Grumman Corp. 2.5%
Accenture PLC, “A” 2.3%
Texas Instruments, Inc. 2.3%
Chubb Ltd. 2.3%
Honeywell International, Inc. 2.2%
Cigna Corp. 2.1%
GICS equity sectors (g)
Financials 27.6%
Health Care 18.5%
Industrials 18.1%
Information Technology 7.9%
Consumer Staples 6.8%
Utilities 6.4%
Materials 4.0%
Communication Services 3.2%
Energy 2.8%
Consumer Discretionary 2.6%
Real Estate 0.5%
Copyright © 2022 www.secdatabase.com. All Rights Reserved.Please Consider the Environment Before Printing This Document

Table of Contents
EXPENSE TABLEFund expenses borne by the shareholders during the period,September 1, 2021 through February 28, 2022
As a shareholder of the fund, you incur two types of costs: (1) transaction costs, including sales charges (loads) on certain purchase orredemption payments, and (2) ongoing costs, including management fees; distribution and service (12b-1) fees; and other fundexpenses. This example is intended to help you understand your ongoing costs (in dollars) of investing in the fund and to compare thesecosts with the ongoing costs of investing in other mutual funds.
The example is based on an investment of $1,000 invested at the beginning of the period and held for the entire period September 1,2021 through February 28, 2022.
Actual Expenses
The first line for each share class in the following table provides information about actual account values and actual expenses. You mayuse the information in this line, together with the amount you invested, to estimate the expenses that you paid over the period. Simplydivide your account value by $1,000 (for example, an $8,600 account value divided by $1,000 = 8.6), then multiply the result by thenumber in the first line under the heading entitled “Expenses Paid During Period” to estimate the expenses you paid on your accountduring this period.
Hypothetical Example for Comparison Purposes
The second line for each share class in the following table provides information about hypothetical account values and hypotheticalexpenses based on the fund’s actual expense ratio and an assumed rate of return of 5% per year before expenses, which is not thefund’s actual return. The hypothetical account values and expenses may not be used to estimate the actual ending account balance orexpenses you paid for the period. You may use this information to compare the ongoing costs of investing in the fund and other funds. Todo so, compare this 5% hypothetical example with the 5% hypothetical examples that appear in the shareholder reports of the otherfunds.
Please note that the expenses shown in the table are meant to highlight your ongoing costs only and do not reflect any transactionalcosts, such as sales charges (loads). Therefore, the second line for each share class in the table is useful in comparing ongoing costsonly, and will not help you determine the relative total costs of owning different funds. In addition, if these transactional costs wereincluded, your costs would have been higher.
3
Copyright © 2022 www.secdatabase.com. All Rights Reserved.Please Consider the Environment Before Printing This Document

Table of Contents
Expense Table - continued
ShareClass
AnnualizedExpense
Ratio
BeginningAccount Value
9/01/21
EndingAccount Value
2/28/22
ExpensesPaid DuringPeriod (p)
9/01/21-2/28/22
Actual 0.78% $1,000.00 $976.76 $3.82A
Hypothetical (h) 0.78% $1,000.00 $1,020.93 $3.91
Actual 1.53% $1,000.00 $972.98 $7.48B
Hypothetical (h) 1.53% $1,000.00 $1,017.21 $7.65
Actual 1.53% $1,000.00 $973.10 $7.49C
Hypothetical (h) 1.53% $1,000.00 $1,017.21 $7.65
Actual 0.53% $1,000.00 $977.90 $2.60I
Hypothetical (h) 0.53% $1,000.00 $1,022.17 $2.66
Actual 1.53% $1,000.00 $973.13 $7.49R1
Hypothetical (h) 1.53% $1,000.00 $1,017.21 $7.65
Actual 1.03% $1,000.00 $975.51 $5.05R2
Hypothetical (h) 1.03% $1,000.00 $1,019.69 $5.16
Actual 0.78% $1,000.00 $976.69 $3.82R3
Hypothetical (h) 0.78% $1,000.00 $1,020.93 $3.91
Actual 0.53% $1,000.00 $977.94 $2.60R4
Hypothetical (h) 0.53% $1,000.00 $1,022.17 $2.66
Actual 0.42% $1,000.00 $978.39 $2.06R6
Hypothetical (h) 0.42% $1,000.00 $1,022.71 $2.11
Actual 0.81% $1,000.00 $976.48 $3.97529A
Hypothetical (h) 0.81% $1,000.00 $1,020.78 $4.06
Actual 0.83% $1,000.00 $976.49 $4.07529B
Hypothetical (h) 0.83% $1,000.00 $1,020.68 $4.16
Actual 1.58% $1,000.00 $972.93 $7.73529C
Hypothetical (h) 1.58% $1,000.00 $1,016.96 $7.90
(h) 5% class return per year before expenses.
(p) “Expenses Paid During Period” are equal to each class’s annualized expense ratio, as shown above, multiplied by the average account value overthe period, multiplied by 181/365 (to reflect the one-half year period). Expenses paid do not include any applicable sales charges (loads). Ifthese transaction costs had been included, your costs would have been higher.
Notes to Expense Table
For the period from September 1, 2021 through February 28, 2022, the distribution fee for Class 529B was not imposed. Had thedistribution fee been imposed throughout the entire six month period, the annualized expense ratio, the actual expenses paid during theperiod, and the hypothetical expenses paid during the period would have been approximately 1.58%, $7.74, and $7.90 for Class 529B.See Note 3 in the Notes to Financial Statements for additional information.
4
Copyright © 2022 www.secdatabase.com. All Rights Reserved.Please Consider the Environment Before Printing This Document

Table of Contents
Expense Table - continued
Each class with a Rule 12b-1 service fee is subject to a rebate of a portion of such fee. Such rebates are included in the expense ratiosabove. For Class 529A shares, this rebate reduced the expense ratio above by 0.03%. See Note 3 in the Notes to Financial Statementsfor additional information.
5
Copyright © 2022 www.secdatabase.com. All Rights Reserved.Please Consider the Environment Before Printing This Document

Table of Contents
PORTFOLIO OF INVESTMENTS2/28/22 (unaudited)
The Portfolio of Investments is a complete list of all securities owned by your fund. It is categorized by broad-based asset classes.
Issuer Shares/Par Value ($)
Common Stocks – 98.4%
Aerospace & Defense – 6.5%
Honeywell International, Inc. 7,253,197 $ 1,376,294,131Lockheed Martin Corp. 1,206,466 523,364,951Northrop Grumman Corp. 3,658,688 1,617,652,312Raytheon Technologies Corp. 5,886,214 604,514,178
$ 4,121,825,572
Alcoholic Beverages – 1.5%
Diageo PLC 19,540,269 $ 976,444,622
Brokerage & Asset Managers – 3.4%
BlackRock, Inc. 1,096,910 $ 815,980,380KKR & Co., Inc. 5,942,286 357,250,234NASDAQ, Inc. 5,763,441 986,412,927
$ 2,159,643,541
Business Services – 4.4%
Accenture PLC, “A” 4,660,797 $ 1,472,905,068Equifax, Inc. 3,295,700 719,583,138Fidelity National Information Services, Inc. 5,029,051 478,916,527Fiserv, Inc. (a) 1,243,687 121,470,909
$ 2,792,875,642
Cable TV – 3.2%
Charter Communications, Inc., “A” (a) 718,011 $ 432,084,660Comcast Corp., “A” 34,830,750 1,628,685,870
$ 2,060,770,530
Chemicals – 1.4%
PPG Industries, Inc. 6,782,274 $ 905,094,465
Construction – 3.0%
Masco Corp. 8,023,642 $ 449,644,898Otis Worldwide Corp. 2,517,096 197,164,130Sherwin-Williams Co. 2,473,602 650,878,894Stanley Black & Decker, Inc. 3,636,808 591,708,661
$ 1,889,396,583
Consumer Products – 2.4%
Colgate-Palmolive Co. 5,679,774 $ 437,058,609International Flavors & Fragrances, Inc. 1,921,703 255,586,499Kimberly-Clark Corp. 3,983,813 518,493,262
6
Copyright © 2022 www.secdatabase.com. All Rights Reserved.Please Consider the Environment Before Printing This Document

Table of Contents
Portfolio of Investments (unaudited) – continued
Issuer Shares/Par Value ($)
Common Stocks – continued
Consumer Products – continued
Reckitt Benckiser Group PLC 3,928,162 $ 333,093,366
$ 1,544,231,736
Electrical Equipment – 1.3%
Johnson Controls International PLC 13,000,703 $ 844,525,667
Electronics – 4.6%
Analog Devices, Inc. 2,849,133 $ 456,687,528Intel Corp. 9,054,760 431,912,052NXP Semiconductors N.V. 3,270,724 621,830,047Texas Instruments, Inc. 8,509,121 1,446,465,479
$ 2,956,895,106
Energy - Independent – 2.8%
ConocoPhillips 8,617,941 $ 817,497,883EOG Resources, Inc. 4,526,042 520,132,747Pioneer Natural Resources Co. 1,910,635 457,788,146
$ 1,795,418,776
Food & Beverages – 3.2%
Archer Daniels Midland Co. 3,675,788 $ 288,365,568Nestle S.A. 8,228,697 1,074,728,303PepsiCo, Inc. 4,314,736 706,494,873
$ 2,069,588,744
Gaming & Lodging – 1.0%
Marriott International, Inc., “A” (a) 3,744,300 $ 637,055,202
Health Maintenance Organizations – 2.1%
Cigna Corp. 5,716,570 $ 1,359,286,015
Insurance – 10.3%
Aon PLC 5,928,590 $ 1,731,978,283Chubb Ltd. 7,089,435 1,443,692,543Marsh & McLennan Cos., Inc. 8,679,092 1,348,817,688Progressive Corp. 11,207,795 1,187,241,724Travelers Cos., Inc. 5,189,623 891,732,920
$ 6,603,463,158
Machinery & Tools – 4.7%
Eaton Corp. PLC 6,714,451 $ 1,035,972,645Illinois Tool Works, Inc. 4,686,551 1,013,888,443PACCAR, Inc. 3,677,526 337,633,662Trane Technologies PLC 3,977,467 612,251,495
$ 2,999,746,245
7
Copyright © 2022 www.secdatabase.com. All Rights Reserved.Please Consider the Environment Before Printing This Document

Copyright © 2022 www.secdatabase.com. All Rights Reserved.Please Consider the Environment Before Printing This Document

Table of Contents
Portfolio of Investments (unaudited) – continued
Issuer Shares/Par Value ($)
Common Stocks – continued
Major Banks – 8.3%
Goldman Sachs Group, Inc. 2,084,545 $ 711,434,363JPMorgan Chase & Co. 17,745,574 2,516,322,393Morgan Stanley 13,374,512 1,213,603,219PNC Financial Services Group, Inc. 4,259,975 848,800,019
$ 5,290,159,994
Medical & Health Technology & Services – 1.2%
McKesson Corp. 2,893,200 $ 795,514,272
Medical Equipment – 7.8%
Abbott Laboratories 7,985,777 $ 963,244,422Boston Scientific Corp. (a) 14,347,041 633,708,801Danaher Corp. 3,332,317 914,421,108Medtronic PLC 11,635,741 1,221,636,447Thermo Fisher Scientific, Inc. 2,235,757 1,216,251,808
$ 4,949,262,586
Other Banks & Diversified Financials – 5.6%
American Express Co. 6,166,402 $ 1,199,611,845Citigroup, Inc. 17,946,981 1,062,999,685Moody's Corp. 853,110 274,727,013Truist Financial Corp. 7,696,026 478,846,738U.S. Bancorp 9,938,809 561,940,261
$ 3,578,125,542
Pharmaceuticals – 7.4%
Johnson & Johnson 13,321,193 $ 2,192,268,732Merck & Co., Inc. 12,359,708 946,506,438Pfizer, Inc. 28,887,402 1,355,974,650Roche Holding AG 564,650 215,399,414
$ 4,710,149,234
Railroad & Shipping – 2.6%
Canadian National Railway Co. 3,219,522 $ 399,188,533Union Pacific Corp. 5,016,804 1,233,882,944
$ 1,633,071,477
Real Estate – 0.5%
Public Storage, Inc., REIT 832,182 $ 295,441,254
Specialty Chemicals – 1.1%
DuPont de Nemours, Inc. 9,293,908 $ 719,069,662
Specialty Stores – 1.6%
Lowe's Cos., Inc. 4,701,453 $ 1,039,303,200
8
Copyright © 2022 www.secdatabase.com. All Rights Reserved.Please Consider the Environment Before Printing This Document

Copyright © 2022 www.secdatabase.com. All Rights Reserved.Please Consider the Environment Before Printing This Document

Table of Contents
Portfolio of Investments (unaudited) – continued
Issuer Shares/Par Value ($)
Common Stocks – continued
Utilities - Electric Power – 6.5%
American Electric Power Co., Inc. 5,174,394 $ 469,058,816Dominion Energy, Inc. 12,487,840 993,157,915Duke Energy Corp. 13,032,960 1,308,639,514Southern Co. 16,130,136 1,044,748,909Xcel Energy, Inc. 4,537,437 305,505,633
$ 4,121,110,787
Total Common Stocks (Identified Cost, $33,502,662,476) $62,847,469,612
Investment Companies (h) – 1.4%
Money Market Funds – 1.4%
MFS Institutional Money Market Portfolio, 0.06% (v) (Identified Cost, $901,901,903) 901,901,903 $ 901,901,902
Other Assets, Less Liabilities – 0.2% 144,753,337
Net Assets – 100.0% $63,894,124,851
(a) Non-income producing security.(h) An affiliated issuer, which may be considered one in which the fund owns 5% or more of the outstanding voting securities, or a company which is
under common control. At period end, the aggregate values of the fund's investments in affiliated issuers and in unaffiliated issuers were$901,901,902 and $62,847,469,612, respectively.
(v) Affiliated issuer that is available only to investment companies managed by MFS. The rate quoted for the MFS Institutional Money MarketPortfolio is the annualized seven-day yield of the fund at period end.
The following abbreviations are used in this report and are defined:REIT Real Estate Investment Trust
See Notes to Financial Statements
9
Copyright © 2022 www.secdatabase.com. All Rights Reserved.Please Consider the Environment Before Printing This Document

Table of Contents
Financial Statements
STATEMENT OF ASSETS AND LIABILITIESAt 2/28/22 (unaudited)
This statement represents your fund’s balance sheet, which details the assets and liabilities comprising the total value of the fund.
Assets
Investments in unaffiliated issuers, at value (identified cost, $33,502,662,476) $62,847,469,612Investments in affiliated issuers, at value (identified cost, $901,901,903) 901,901,902Receivables for
Investments sold 60,159,038Fund shares sold 90,286,596Dividends 146,117,593
Other assets 185,822
Total assets $64,046,120,563
Liabilities
Payables forInvestments purchased $66,720,003Fund shares reacquired 71,262,657
Payable to affiliatesInvestment adviser 2,861,831Administrative services fee 6,392Shareholder servicing costs 9,450,483Distribution and service fees 384,804Program manager fees 237
Payable for independent Trustees' compensation 19,153Accrued expenses and other liabilities 1,290,152
Total liabilities $151,995,712
Net assets $63,894,124,851
Net assets consist of
Paid-in capital $33,372,202,545Total distributable earnings (loss) 30,521,922,306
Net assets $63,894,124,851
Shares of beneficial interest outstanding 1,248,880,841
10
Copyright © 2022 www.secdatabase.com. All Rights Reserved.Please Consider the Environment Before Printing This Document

Table of Contents
Statement of Assets and Liabilities (unaudited) – continued
Net assetsShares
outstandingNet asset value
per share (a)Class A $8,106,991,022 158,837,976 $51.04Class B 43,699,563 859,864 50.82Class C 636,373,233 12,629,065 50.39Class I 27,165,119,750 528,814,934 51.37Class R1 18,053,567 361,583 49.93Class R2 357,166,502 7,078,446 50.46Class R3 2,680,018,535 52,742,641 50.81Class R4 2,361,520,554 46,262,882 51.05Class R6 22,481,313,322 440,424,254 51.04Class 529A 39,765,126 786,611 50.55Class 529B 417,299 8,346 50.00Class 529C 3,686,378 74,239 49.66
(a) Maximum offering price per share was equal to the net asset value per share for all share classes, except for Classes A and 529A, for which themaximum offering prices per share were $54.15 [100 / 94.25 x $51.04] and $53.63 [100 / 94.25 x $50.55], respectively. On sales of $50,000 or more,the maximum offering prices of Class A and Class 529A shares are reduced. A contingent deferred sales charge may be imposed on redemptions ofClass A, Class B, Class C, Class 529B, and Class 529C shares. Redemption price per share was equal to the net asset value per share for ClassesI, R1, R2, R3, R4, R6, and 529A.
See Notes to Financial Statements
11
Copyright © 2022 www.secdatabase.com. All Rights Reserved.Please Consider the Environment Before Printing This Document

Table of Contents
Financial Statements
STATEMENT OF OPERATIONSSix months ended 2/28/22 (unaudited)
This statement describes how much your fund earned in investment income and accrued in expenses. It also describes any gains and/or losses generatedby fund operations.
Net investment income (loss)
IncomeDividends $646,418,737Other 243,144Dividends from affiliated issuers 197,529Income on securities loaned 2,052Foreign taxes withheld (921,043)
Total investment income $645,940,419
ExpensesManagement fee $138,238,983Distribution and service fees 18,429,781Shareholder servicing costs 24,640,541Program manager fees 11,087Administrative services fee 283,563Independent Trustees' compensation 48,079Custodian fee 262,815Shareholder communications 871,871Audit and tax fees 150,768Legal fees 159,360Miscellaneous 734,008
Total expenses $183,830,856
Reduction of expenses by investment adviser and distributor (4,482,656)
Net expenses $179,348,200
Net investment income (loss) $466,592,219
Realized and unrealized gain (loss)
Realized gain (loss) (identified cost basis)Unaffiliated issuers $1,397,054,452Foreign currency 406,526
Net realized gain (loss) $1,397,460,978
Change in unrealized appreciation or depreciationUnaffiliated issuers $(3,310,242,655)Affiliated issuers (1)Translation of assets and liabilities in foreign currencies (455,345)
Net unrealized gain (loss) $(3,310,698,001)
Net realized and unrealized gain (loss) $(1,913,237,023)
Change in net assets from operations $(1,446,644,804)
See Notes to Financial Statements
Copyright © 2022 www.secdatabase.com. All Rights Reserved.Please Consider the Environment Before Printing This Document

12
Copyright © 2022 www.secdatabase.com. All Rights Reserved.Please Consider the Environment Before Printing This Document

Table of Contents
Financial Statements
STATEMENTS OF CHANGES IN NET ASSETSThese statements describe the increases and/or decreases in net assets resulting from operations, any distributions, and any shareholder transactions.
Six months ended Year ended2/28/22
(unaudited)8/31/21
Change in net assetsFrom operations
Net investment income (loss) $466,592,219 $841,409,798Net realized gain (loss) 1,397,460,978 1,154,718,165Net unrealized gain (loss) (3,310,698,001) 14,298,325,745
Change in net assets from operations $(1,446,644,804) $16,294,453,708
Total distributions to shareholders $(1,754,968,215) $(1,398,636,931)
Change in net assets from fund share transactions $1,603,300,100 $1,471,547,469
Total change in net assets $(1,598,312,919) $16,367,364,246
Net assets
At beginning of period 65,492,437,770 49,125,073,524At end of period $63,894,124,851 $65,492,437,770
See Notes to Financial Statements
13
Copyright © 2022 www.secdatabase.com. All Rights Reserved.Please Consider the Environment Before Printing This Document

Table of Contents
Financial Statements
FINANCIAL HIGHLIGHTSThe financial highlights table is intended to help you understand the fund's financial performance for the semiannual period and the past5 fiscal years. Certain information reflects financial results for a single fund share. The total returns in the table represent the rate that aninvestor would have earned (or lost) on an investment in the fund share class (assuming reinvestment of all distributions) held for theentire period.
Class ASix months
ended Year ended
2/28/22(unaudited)
8/31/21 8/31/20 8/31/19 8/31/18 8/31/17
Net asset value, beginning of period $53.60 $41.31 $41.31 $40.82 $39.00 $35.93
Income (loss) from investment operations
Net investment income (loss) (d) $0.32 $0.59 $0.63 $0.79 $0.59 $0.66(c)Net realized and unrealized gain (loss) (1.51) 12.77 0.57 1.03 3.04 3.65
Total from investment operations $(1.19) $13.36 $1.20 $1.82 $3.63 $4.31
Less distributions declared to shareholders
From net investment income $(0.31) $(0.60) $(0.65) $(0.79) $(0.60) $(0.62)From net realized gain (1.06) (0.47) (0.55) (0.54) (1.21) (0.62)
Total distributions declared to shareholders $(1.37) $(1.07) $(1.20) $(1.33) $(1.81) $(1.24)
Net asset value, end of period (x) $51.04 $53.60 $41.31 $41.31 $40.82 $39.00
Total return (%) (r)(s)(t)(x) (2.32)(n) 32.85 2.93 4.85 9.42 12.24(c)
Ratios (%) (to average net assets)and Supplemental data:
Expenses before expense reductions 0.80(a) 0.80 0.83 0.83 0.82 0.86(c)Expenses after expense reductions 0.78(a) 0.79 0.82 0.82 0.81 0.84(c)Net investment income (loss) 1.20(a) 1.25 1.56 2.00 1.46 1.77(c)Portfolio turnover 4(n) 8 16 11 11 14Net assets at end of period (000 omitted) $8,106,991 $8,523,158 $6,460,837 $6,520,132 $6,736,296 $6,344,965
See Notes to Financial Statements
14
Copyright © 2022 www.secdatabase.com. All Rights Reserved.Please Consider the Environment Before Printing This Document

Table of Contents
Financial Highlights – continued
Class BSix months
ended Year ended
2/28/22(unaudited)
8/31/21 8/31/20 8/31/19 8/31/18 8/31/17
Net asset value, beginning of period $53.38 $41.12 $41.09 $40.59 $38.76 $35.72
Income (loss) from investment operations
Net investment income (loss) (d) $0.12 $0.23 $0.32 $0.49 $0.28 $0.37(c)Net realized and unrealized gain (loss) (1.51) 12.74 0.58 1.03 3.04 3.64
Total from investment operations $(1.39) $12.97 $0.90 $1.52 $3.32 $4.01
Less distributions declared to shareholders
From net investment income $(0.11) $(0.24) $(0.32) $(0.48) $(0.28) $(0.35)From net realized gain (1.06) (0.47) (0.55) (0.54) (1.21) (0.62)
Total distributions declared to shareholders $(1.17) $(0.71) $(0.87) $(1.02) $(1.49) $(0.97)
Net asset value, end of period (x) $50.82 $53.38 $41.12 $41.09 $40.59 $38.76
Total return (%) (r)(s)(t)(x) (2.70)(n) 31.87 2.15 4.08 8.62 11.40(c)
Ratios (%) (to average net assets)and Supplemental data:
Expenses before expense reductions 1.55(a) 1.55 1.58 1.58 1.57 1.61(c)Expenses after expense reductions 1.53(a) 1.54 1.56 1.57 1.56 1.59(c)Net investment income (loss) 0.44(a) 0.50 0.79 1.24 0.71 0.99(c)Portfolio turnover 4(n) 8 16 11 11 14Net assets at end of period (000 omitted) $43,700 $52,833 $55,897 $84,737 $111,494 $137,361
See Notes to Financial Statements
15
Copyright © 2022 www.secdatabase.com. All Rights Reserved.Please Consider the Environment Before Printing This Document

Table of Contents
Financial Highlights – continued
Class CSix months
ended Year ended
2/28/22(unaudited)
8/31/21 8/31/20 8/31/19 8/31/18 8/31/17
Net asset value, beginning of period $52.94 $40.80 $40.80 $40.31 $38.52 $35.50
Income (loss) from investment operations
Net investment income (loss) (d) $0.12 $0.23 $0.32 $0.49 $0.28 $0.37(c)Net realized and unrealized gain (loss) (1.49) 12.63 0.56 1.03 3.01 3.62
Total from investment operations $(1.37) $12.86 $0.88 $1.52 $3.29 $3.99
Less distributions declared to shareholders
From net investment income $(0.12) $(0.25) $(0.33) $(0.49) $(0.29) $(0.35)From net realized gain (1.06) (0.47) (0.55) (0.54) (1.21) (0.62)
Total distributions declared to shareholders $(1.18) $(0.72) $(0.88) $(1.03) $(1.50) $(0.97)
Net asset value, end of period (x) $50.39 $52.94 $40.80 $40.80 $40.31 $38.52
Total return (%) (r)(s)(t)(x) (2.69)(n) 31.86 2.14 4.10 8.58 11.43(c)
Ratios (%) (to average net assets)and Supplemental data:
Expenses before expense reductions 1.55(a) 1.55 1.58 1.58 1.57 1.61(c)Expenses after expense reductions 1.53(a) 1.54 1.57 1.57 1.56 1.59(c)Net investment income (loss) 0.45(a) 0.50 0.80 1.24 0.71 0.99(c)Portfolio turnover 4(n) 8 16 11 11 14Net assets at end of period (000 omitted) $636,373 $686,442 $650,697 $881,020 $1,050,477 $1,389,685
See Notes to Financial Statements
16
Copyright © 2022 www.secdatabase.com. All Rights Reserved.Please Consider the Environment Before Printing This Document

Table of Contents
Financial Highlights – continued
Class ISix months
ended Year ended
2/28/22(unaudited)
8/31/21 8/31/20 8/31/19 8/31/18 8/31/17
Net asset value, beginning of period $53.94 $41.56 $41.56 $41.06 $39.22 $36.13
Income (loss) from investment operations
Net investment income (loss) (d) $0.38 $0.71 $0.74 $0.90 $0.70 $0.74(c)Net realized and unrealized gain (loss) (1.51) 12.85 0.56 1.02 3.05 3.70
Total from investment operations $(1.13) $13.56 $1.30 $1.92 $3.75 $4.44
Less distributions declared to shareholders
From net investment income $(0.38) $(0.71) $(0.75) $(0.88) $(0.70) $(0.73)From net realized gain (1.06) (0.47) (0.55) (0.54) (1.21) (0.62)
Total distributions declared toshareholders $(1.44) $(1.18) $(1.30) $(1.42) $(1.91) $(1.35)
Net asset value, end of period (x) $51.37 $53.94 $41.56 $41.56 $41.06 $39.22
Total return (%) (r)(s)(t)(x) (2.21)(n) 33.20 3.18 5.11 9.69 12.54(c)
Ratios (%) (to average net assets)and Supplemental data:
Expenses before expense reductions 0.55(a) 0.55 0.58 0.58 0.57 0.61(c)Expenses after expense reductions 0.53(a) 0.54 0.57 0.57 0.57 0.59(c)Net investment income (loss) 1.45(a) 1.50 1.81 2.25 1.72 1.98(c)Portfolio turnover 4(n) 8 16 11 11 14Net assets at end of period (000 omitted) $27,165,120 $27,444,959 $21,027,882 $20,076,773 $20,727,676 $19,624,016
See Notes to Financial Statements
17
Copyright © 2022 www.secdatabase.com. All Rights Reserved.Please Consider the Environment Before Printing This Document

Table of Contents
Financial Highlights – continued
Class R1Six months
ended Year ended
2/28/22(unaudited)
8/31/21 8/31/20 8/31/19 8/31/18 8/31/17
Net asset value, beginning of period $52.47 $40.45 $40.47 $40.01 $38.25 $35.27
Income (loss) from investment operations
Net investment income (loss) (d) $0.12 $0.23 $0.32 $0.48 $0.28 $0.36(c)Net realized and unrealized gain (loss) (1.48) 12.52 0.55 1.02 2.99 3.60
Total from investment operations $(1.36) $12.75 $0.87 $1.50 $3.27 $3.96
Less distributions declared to shareholders
From net investment income $(0.12) $(0.26) $(0.34) $(0.50) $(0.30) $(0.36)From net realized gain (1.06) (0.47) (0.55) (0.54) (1.21) (0.62)
Total distributions declared to shareholders $(1.18) $(0.73) $(0.89) $(1.04) $(1.51) $(0.98)
Net asset value, end of period (x) $49.93 $52.47 $40.45 $40.47 $40.01 $38.25
Total return (%) (r)(s)(t)(x) (2.69)(n) 31.88 2.13 4.08 8.61 11.40(c)
Ratios (%) (to average net assets)and Supplemental data:
Expenses before expense reductions 1.55(a) 1.55 1.58 1.58 1.57 1.61(c)Expenses after expense reductions 1.53(a) 1.54 1.57 1.57 1.56 1.59(c)Net investment income (loss) 0.45(a) 0.50 0.80 1.24 0.72 0.99(c)Portfolio turnover 4(n) 8 16 11 11 14Net assets at end of period (000 omitted) $18,054 $20,580 $18,914 $21,820 $24,791 $26,663
See Notes to Financial Statements
18
Copyright © 2022 www.secdatabase.com. All Rights Reserved.Please Consider the Environment Before Printing This Document

Table of Contents
Financial Highlights – continued
Class R2Six months
ended Year ended
2/28/22(unaudited)
8/31/21 8/31/20 8/31/19 8/31/18 8/31/17
Net asset value, beginning of period $53.01 $40.86 $40.87 $40.39 $38.60 $35.59
Income (loss) from investment operations
Net investment income (loss) (d) $0.25 $0.46 $0.52 $0.68 $0.48 $0.55(c)Net realized and unrealized gain (loss) (1.49) 12.64 0.56 1.03 3.02 3.62
Total from investment operations $(1.24) $13.10 $1.08 $1.71 $3.50 $4.17
Less distributions declared to shareholders
From net investment income $(0.25) $(0.48) $(0.54) $(0.69) $(0.50) $(0.54)From net realized gain (1.06) (0.47) (0.55) (0.54) (1.21) (0.62)
Total distributions declared to shareholders $(1.31) $(0.95) $(1.09) $(1.23) $(1.71) $(1.16)
Net asset value, end of period (x) $50.46 $53.01 $40.86 $40.87 $40.39 $38.60
Total return (%) (r)(s)(t)(x) (2.45)(n) 32.53 2.66 4.60 9.15 11.95(c)
Ratios (%) (to average net assets)and Supplemental data:
Expenses before expense reductions 1.05(a) 1.05 1.08 1.08 1.07 1.11(c)Expenses after expense reductions 1.03(a) 1.04 1.07 1.07 1.07 1.09(c)Net investment income (loss) 0.95(a) 1.00 1.30 1.73 1.21 1.49(c)Portfolio turnover 4(n) 8 16 11 11 14Net assets at end of period (000 omitted) $357,167 $409,939 $359,598 $437,221 $550,200 $614,044
See Notes to Financial Statements
19
Copyright © 2022 www.secdatabase.com. All Rights Reserved.Please Consider the Environment Before Printing This Document

Table of Contents
Financial Highlights – continued
Class R3Six months
ended Year ended
2/28/22(unaudited)
8/31/21 8/31/20 8/31/19 8/31/18 8/31/17
Net asset value, beginning of period $53.37 $41.14 $41.15 $40.66 $38.85 $35.81
Income (loss) from investment operations
Net investment income (loss) (d) $0.32 $0.59 $0.63 $0.79 $0.59 $0.65(c)Net realized and unrealized gain (loss) (1.51) 12.71 0.56 1.03 3.03 3.64
Total from investment operations $(1.19) $13.30 $1.19 $1.82 $3.62 $4.29
Less distributions declared to shareholders
From net investment income $(0.31) $(0.60) $(0.65) $(0.79) $(0.60) $(0.63)From net realized gain (1.06) (0.47) (0.55) (0.54) (1.21) (0.62)
Total distributions declared to shareholders $(1.37) $(1.07) $(1.20) $(1.33) $(1.81) $(1.25)
Net asset value, end of period (x) $50.81 $53.37 $41.14 $41.15 $40.66 $38.85
Total return (%) (r)(s)(t)(x) (2.33)(n) 32.85 2.92 4.87 9.43 12.23(c)
Ratios (%) (to average net assets)and Supplemental data:
Expenses before expense reductions 0.80(a) 0.80 0.83 0.83 0.82 0.86(c)Expenses after expense reductions 0.78(a) 0.79 0.82 0.82 0.82 0.84(c)Net investment income (loss) 1.20(a) 1.25 1.56 1.99 1.47 1.74(c)Portfolio turnover 4(n) 8 16 11 11 14Net assets at end of period (000 omitted) $2,680,019 $2,774,355 $2,036,093 $2,096,743 $2,259,562 $2,030,023
See Notes to Financial Statements
20
Copyright © 2022 www.secdatabase.com. All Rights Reserved.Please Consider the Environment Before Printing This Document

Table of Contents
Financial Highlights – continued
Class R4Six months
ended Year ended
2/28/22(unaudited)
8/31/21 8/31/20 8/31/19 8/31/18 8/31/17
Net asset value, beginning of period $53.61 $41.31 $41.32 $40.82 $39.00 $35.94
Income (loss) from investment operations
Net investment income (loss) (d) $0.38 $0.70 $0.73 $0.89 $0.69 $0.74(c)Net realized and unrealized gain (loss) (1.50) 12.78 0.56 1.03 3.04 3.67
Total from investment operations $(1.12) $13.48 $1.29 $1.92 $3.73 $4.41
Less distributions declared to shareholders
From net investment income $(0.38) $(0.71) $(0.75) $(0.88) $(0.70) $(0.73)From net realized gain (1.06) (0.47) (0.55) (0.54) (1.21) (0.62)
Total distributions declared to shareholders $(1.44) $(1.18) $(1.30) $(1.42) $(1.91) $(1.35)
Net asset value, end of period (x) $51.05 $53.61 $41.31 $41.32 $40.82 $39.00
Total return (%) (r)(s)(t)(x) (2.21)(n) 33.20 3.17 5.14 9.70 12.52(c)
Ratios (%) (to average net assets)and Supplemental data:
Expenses before expense reductions 0.55(a) 0.55 0.58 0.58 0.57 0.61(c)Expenses after expense reductions 0.53(a) 0.54 0.57 0.57 0.57 0.59(c)Net investment income (loss) 1.45(a) 1.50 1.80 2.24 1.72 1.99(c)Portfolio turnover 4(n) 8 16 11 11 14Net assets at end of period (000 omitted) $2,361,521 $2,625,508 $2,323,830 $2,916,674 $3,201,331 $3,060,883
See Notes to Financial Statements
21
Copyright © 2022 www.secdatabase.com. All Rights Reserved.Please Consider the Environment Before Printing This Document

Table of Contents
Financial Highlights – continued
Class R6Six months
ended Year ended
2/28/22(unaudited)
8/31/21 8/31/20 8/31/19 8/31/18 8/31/17
Net asset value, beginning of period $53.60 $41.31 $41.32 $40.83 $39.01 $35.94
Income (loss) from investment operations
Net investment income (loss) (d) $0.41 $0.76 $0.78 $0.93 $0.73 $0.76(c)Net realized and unrealized gain (loss) (1.51) 12.76 0.55 1.02 3.04 3.69
Total from investment operations $(1.10) $13.52 $1.33 $1.95 $3.77 $4.45
Less distributions declared to shareholders
From net investment income $(0.40) $(0.76) $(0.79) $(0.92) $(0.74) $(0.76)From net realized gain (1.06) (0.47) (0.55) (0.54) (1.21) (0.62)
Total distributions declared toshareholders $(1.46) $(1.23) $(1.34) $(1.46) $(1.95) $(1.38)
Net asset value, end of period (x) $51.04 $53.60 $41.31 $41.32 $40.83 $39.01
Total return (%) (r)(s)(t)(x) (2.16)(n) 33.33 3.29 5.22 9.81 12.66(c)
Ratios (%) (to average net assets)and Supplemental data:
Expenses before expense reductions 0.44(a) 0.45 0.47 0.48 0.47 0.51(c)Expenses after expense reductions 0.42(a) 0.44 0.46 0.47 0.47 0.49(c)Net investment income (loss) 1.56(a) 1.60 1.92 2.35 1.83 2.04(c)Portfolio turnover 4(n) 8 16 11 11 14Net assets at end of period (000 omitted) $22,481,313 $22,910,207 $16,158,507 $14,716,194 $13,941,823 $10,957,734
See Notes to Financial Statements
22
Copyright © 2022 www.secdatabase.com. All Rights Reserved.Please Consider the Environment Before Printing This Document

Table of Contents
Financial Highlights – continued
Class 529ASix months
ended Year ended
2/28/22(unaudited)
8/31/21 8/31/20 8/31/19 8/31/18 8/31/17
Net asset value, beginning of period $53.11 $40.94 $40.96 $40.48 $38.69 $35.67
Income (loss) from investment operations
Net investment income (loss) (d) $0.31 $0.57 $0.62 $0.78 $0.58 $0.63(c)Net realized and unrealized gain (loss) (1.50) 12.66 0.55 1.02 3.02 3.64
Total from investment operations $(1.19) $13.23 $1.17 $1.80 $3.60 $4.27
Less distributions declared to shareholders
From net investment income $(0.31) $(0.59) $(0.64) $(0.78) $(0.60) $(0.63)From net realized gain (1.06) (0.47) (0.55) (0.54) (1.21) (0.62)
Total distributions declared to shareholders $(1.37) $(1.06) $(1.19) $(1.32) $(1.81) $(1.25)
Net asset value, end of period (x) $50.55 $53.11 $40.94 $40.96 $40.48 $38.69
Total return (%) (r)(s)(t)(x) (2.35)(n) 32.83 2.89 4.85 9.40 12.21(c)
Ratios (%) (to average net assets)and Supplemental data:
Expenses before expense reductions 0.85(a) 0.85 0.88 0.88 0.89 0.96(c)Expenses after expense reductions 0.81(a) 0.81 0.84 0.84 0.83 0.85(c)Net investment income (loss) 1.18(a) 1.22 1.54 1.98 1.45 1.71(c)Portfolio turnover 4(n) 8 16 11 11 14Net assets at end of period (000 omitted) $39,765 $39,754 $28,038 $27,149 $25,416 $22,490
See Notes to Financial Statements
23
Copyright © 2022 www.secdatabase.com. All Rights Reserved.Please Consider the Environment Before Printing This Document

Table of Contents
Financial Highlights – continued
Class 529BSix months
ended Year ended
2/28/22(unaudited)
8/31/21 8/31/20 8/31/19 8/31/18 8/31/17
Net asset value, beginning of period $52.54 $40.50 $40.46 $40.05 $38.23 $35.27
Income (loss) from investment operations
Net investment income (loss) (d) $0.30 $0.55 $0.57 $0.63 $0.43 $0.47(c)Net realized and unrealized gain (loss) (1.48) 12.53 0.55 1.00 3.00 3.61
Total from investment operations $(1.18) $13.08 $1.12 $1.63 $3.43 $4.08
Less distributions declared to shareholders
From net investment income $(0.30) $(0.57) $(0.53) $(0.68) $(0.40) $(0.50)From net realized gain (1.06) (0.47) (0.55) (0.54) (1.21) (0.62)
Total distributions declared to shareholders $(1.36) $(1.04) $(1.08) $(1.22) $(1.61) $(1.12)
Net asset value, end of period (x) $50.00 $52.54 $40.50 $40.46 $40.05 $38.23
Total return (%) (r)(s)(t)(x) (2.35)(n) 32.82 2.79 4.46 9.05 11.78(c)
Ratios (%) (to average net assets)and Supplemental data:
Expenses before expense reductions 0.85(a) 0.85 0.95 1.22 1.22 1.34(c)Expenses after expense reductions 0.83(a) 0.84 0.94 1.20 1.19 1.26(c)Net investment income (loss) 1.15(a) 1.20 1.42 1.61 1.10 1.28(c)Portfolio turnover 4(n) 8 16 11 11 14Net assets at end of period (000 omitted) $417 $479 $474 $680 $835 $908
See Notes to Financial Statements
24
Copyright © 2022 www.secdatabase.com. All Rights Reserved.Please Consider the Environment Before Printing This Document

Table of Contents
Financial Highlights – continued
Class 529CSix months
ended Year ended
2/28/22(unaudited)
8/31/21 8/31/20 8/31/19 8/31/18 8/31/17
Net asset value, beginning of period $52.19 $40.24 $40.26 $39.81 $38.07 $35.11
Income (loss) from investment operations
Net investment income (loss) (d) $0.10 $0.21 $0.30 $0.46 $0.26 $0.34(c)Net realized and unrealized gain (loss) (1.46) 12.45 0.56 1.01 2.97 3.59
Total from investment operations $(1.36) $12.66 $0.86 $1.47 $3.23 $3.93
Less distributions declared to shareholders
From net investment income $(0.11) $(0.24) $(0.33) $(0.48) $(0.28) $(0.35)From net realized gain (1.06) (0.47) (0.55) (0.54) (1.21) (0.62)
Total distributions declared to shareholders $(1.17) $(0.71) $(0.88) $(1.02) $(1.49) $(0.97)
Net asset value, end of period (x) $49.66 $52.19 $40.24 $40.26 $39.81 $38.07
Total return (%) (r)(s)(t)(x) (2.71)(n) 31.82 2.10 4.04 8.54 11.38(c)
Ratios (%) (to average net assets)and Supplemental data:
Expenses before expense reductions 1.60(a) 1.60 1.63 1.63 1.64 1.71(c)Expenses after expense reductions 1.58(a) 1.59 1.62 1.61 1.61 1.63(c)Net investment income (loss) 0.40(a) 0.45 0.76 1.19 0.67 0.93(c)Portfolio turnover 4(n) 8 16 11 11 14Net assets at end of period (000 omitted) $3,686 $4,224 $4,308 $4,947 $5,320 $5,924
(a) Annualized.(c) Amount reflects a one-time reimbursement of expenses by the custodian (or former custodian) without which net investment income and
performance would be lower and expenses would be higher.(d) Per share data is based on average shares outstanding.(n) Not annualized.(r) Certain expenses have been reduced without which performance would have been lower.(s) From time to time the fund may receive proceeds from litigation settlements, without which performance would be lower.(t) Total returns do not include any applicable sales charges.(x) The net asset values and total returns have been calculated on net assets which include adjustments made in accordance with U.S. generally
accepted accounting principles required at period end for financial reporting purposes.
See Notes to Financial Statements
25
Copyright © 2022 www.secdatabase.com. All Rights Reserved.Please Consider the Environment Before Printing This Document

Table of Contents
NOTES TO FINANCIAL STATEMENTS(unaudited)
(1) Business and OrganizationMFS Value Fund (the fund) is a diversified series of MFS Series Trust I (the trust). The trust is organized as a Massachusetts businesstrust and is registered under the Investment Company Act of 1940, as amended, as an open-end management investment company.
The fund is an investment company and accordingly follows the investment company accounting and reporting guidance of the FinancialAccounting Standards Board (FASB) Accounting Standards Codification Topic 946 Financial Services - Investment Companies.
(2) Significant Accounting PoliciesGeneral - The preparation of financial statements in conformity with U.S. generally accepted accounting principles requiresmanagement to make estimates and assumptions that affect the reported amounts of assets and liabilities, and disclosure ofcontingent assets and liabilities at the date of the financial statements and the reported amounts of increases and decreases innet assets from operations during the reporting period. Actual results could differ from those estimates. In the preparation ofthese financial statements, management has evaluated subsequent events occurring after the date of the fund’s Statement ofAssets and Liabilities through the date that the financial statements were issued.Balance Sheet Offsetting — The fund's accounting policy with respect to balance sheet offsetting is that, absent an event ofdefault by the counterparty or a termination of the agreement, the International Swaps and Derivatives Association (ISDA)Master Agreement, or similar agreement, does not result in an offset of reported amounts of financial assets and financialliabilities in the Statement of Assets and Liabilities across transactions between the fund and the applicable counterparty. Thefund's right to setoff may be restricted or prohibited by the bankruptcy or insolvency laws of the particular jurisdiction to whicha specific master netting agreement counterparty is subject. Balance sheet offsetting disclosures, to the extent applicable tothe fund, have been included in the fund’s Significant Accounting Policies note under the captions for each of the fund’s in-scope financial instruments and transactions.Investment Valuations — Equity securities, including restricted equity securities, are generally valued at the last sale or officialclosing price on their primary market or exchange as provided by a third-party pricing service. Equity securities, for whichthere were no sales reported that day, are generally valued at the last quoted daily bid quotation on their primary market orexchange as provided by a third-party pricing service. Short-term instruments with a maturity at issuance of 60 days or lessmay be valued at amortized cost, which approximates market value. Open-end investment companies are generally valued atnet asset value per share. Securities and other assets generally valued on the basis of information from a third-party pricingservice may also be valued at a broker/dealer bid quotation. In determining values, third-party pricing services can utilize bothtransaction data and market information such as yield, quality, coupon rate, maturity, type of issue, trading characteristics, andother market data. The values of foreign securities and other assets and liabilities expressed in foreign currencies areconverted to U.S. dollars using the mean of bid and asked prices for rates provided by a third-party pricing service.
26
Copyright © 2022 www.secdatabase.com. All Rights Reserved.Please Consider the Environment Before Printing This Document

Table of Contents
Notes to Financial Statements (unaudited) - continued
The Board of Trustees has delegated primary responsibility for determining or causing to be determined the value of the fund’sinvestments (including any fair valuation) to the adviser pursuant to valuation policies and procedures approved by the Board. If theadviser determines that reliable market quotations are not readily available, investments are valued at fair value as determined in goodfaith by the adviser in accordance with such procedures under the oversight of the Board of Trustees. Under the fund’s valuation policiesand procedures, market quotations are not considered to be readily available for most types of debt instruments and floating rate loansand many types of derivatives. These investments are generally valued at fair value based on information from third-party pricingservices. In addition, investments may be valued at fair value if the adviser determines that an investment’s value has been materiallyaffected by events occurring after the close of the exchange or market on which the investment is principally traded (such as foreignexchange or market) and prior to the determination of the fund’s net asset value, or after the halt of trading of a specific security wheretrading does not resume prior to the close of the exchange or market on which the security is principally traded. Events that occur afterforeign markets close (such as developments in foreign markets and significant movements in the U.S. markets) and prior to thedetermination of the fund’s net asset value may be deemed to have a material effect on the value of securities traded in foreign markets.Accordingly, the fund’s foreign equity securities may often be valued at fair value. The adviser generally relies on third-party pricingservices or other information (such as the correlation with price movements of similar securities in the same or other markets; the type,cost and investment characteristics of the security; the business and financial condition of the issuer; and trading and other market data)to assist in determining whether to fair value and at what value to fair value an investment. The value of an investment for purposes ofcalculating the fund’s net asset value can differ depending on the source and method used to determine value. When fair valuation isused, the value of an investment used to determine the fund’s net asset value may differ from quoted or published prices for the sameinvestment. There can be no assurance that the fund could obtain the fair value assigned to an investment if it were to sell the investmentat the same time at which the fund determines its net asset value per share.
Various inputs are used in determining the value of the fund's assets or liabilities. These inputs are categorized into three broad levels. Incertain cases, the inputs used to measure fair value may fall into different levels of the fair value hierarchy. In such cases, an investment'slevel within the fair value hierarchy is based on the lowest level of input that is significant to the fair value measurement. The fund'sassessment of the significance of a particular input to the fair value measurement in its entirety requires judgment, and considers factorsspecific to the investment. Level 1 includes unadjusted quoted prices in active markets for identical assets or liabilities. Level 2 includesother significant observable market-based inputs (including quoted prices for similar securities, interest rates, prepayment speed, andcredit risk). Level 3 includes unobservable inputs, which may include the adviser's own assumptions in determining the fair value ofinvestments. The following is a summary of the levels used as of February 28, 2022 in valuing the fund's assets and liabilities:
Financial Instruments Level 1 Level 2 Level 3 TotalEquity Securities $62,847,469,612 $— $— $62,847,469,612Mutual Funds 901,901,902 — — 901,901,902
Total $63,749,371,514 $— $— $63,749,371,514
27
Copyright © 2022 www.secdatabase.com. All Rights Reserved.Please Consider the Environment Before Printing This Document

Table of Contents
Notes to Financial Statements (unaudited) - continued
For further information regarding security characteristics, see the Portfolio of Investments.
Foreign Currency Translation — Purchases and sales of foreign investments, income, and expenses are converted into U.S.dollars based upon currency exchange rates prevailing on the respective dates of such transactions or on the reporting datefor foreign denominated receivables and payables. Gains and losses attributable to foreign currency exchange rates on salesof securities are recorded for financial statement purposes as net realized gains and losses on investments. Gains and lossesattributable to foreign exchange rate movements on receivables, payables, income and expenses are recorded for financialstatement purposes as foreign currency transaction gains and losses. That portion of both realized and unrealized gains andlosses on investments that results from fluctuations in foreign currency exchange rates is not separately disclosed.Security Loans — Under its Securities Lending Agency Agreement with the fund, State Street Bank and Trust Company, aslending agent, loans the securities of the fund to certain qualified institutions (the “Borrowers”) approved by the fund. Securityloans can be terminated at the discretion of either the lending agent or the fund and the related securities must be returnedwithin the earlier of the standard trade settlement period for such securities or within three business days. The loans arecollateralized by cash and/or U.S. Treasury and federal agency obligations in an amount typically at least equal to the marketvalue of the securities loaned. On loans collateralized by cash, the cash collateral is invested in a money market fund. Themarket value of the loaned securities is determined at the close of business of the fund and any additional required collateral isdelivered to the fund on the next business day. The lending agent provides the fund with indemnification against Borrowerdefault. In the event of Borrower default, the lending agent will, for the benefit of the fund, either purchase securities identicalto those loaned or, when such purchase is commercially impracticable, pay the fund the market value of the loaned securities.In return, the lending agent assumes the fund's rights to the related collateral. If the collateral value is less than the cost topurchase identical securities, the lending agent is responsible for the shortfall, but only to the extent that such shortfall is notdue to a decline in collateral value resulting from collateral reinvestment for which the fund bears the risk of loss. A portion ofthe income generated upon investment of the collateral is remitted to the Borrowers, and the remainder is allocated betweenthe fund and the lending agent. On loans collateralized by U.S. Treasury and/or federal agency obligations, a fee is receivedfrom the Borrower, and is allocated between the fund and the lending agent. Income from securities lending is separatelyreported in the Statement of Operations. The dividend and interest income earned on the securities loaned is accounted for inthe same manner as other dividend and interest income. At February 28, 2022, there were no securities on loan or collateraloutstanding.Indemnifications — Under the fund's organizational documents, its officers and Trustees may be indemnified against certainliabilities and expenses arising out of the performance of their duties to the fund. Additionally, in the normal course ofbusiness, the fund enters into agreements with service providers that may contain indemnification clauses. The fund'smaximum exposure under these agreements is unknown as this would involve future claims that may be made against the fundthat have not yet occurred.
28
Copyright © 2022 www.secdatabase.com. All Rights Reserved.Please Consider the Environment Before Printing This Document

Table of Contents
Notes to Financial Statements (unaudited) - continued
Investment Transactions and Income — Investment transactions are recorded on the trade date. Dividends received in cash arerecorded on the ex-dividend date. Certain dividends from foreign securities will be recorded when the fund is informed of thedividend if such information is obtained subsequent to the ex-dividend date. Dividend payments received in additionalsecurities are recorded on the ex-dividend date in an amount equal to the value of the security on such date. In determining thenet gain or loss on securities sold, the cost of securities is determined on the identified cost basis.The fund may receive proceeds from litigation settlements. Any proceeds received from litigation involving portfolio holdings are reflectedin the Statement of Operations in realized gain/loss if the security has been disposed of by the fund or in unrealized gain/loss if thesecurity is still held by the fund. Any other proceeds from litigation not related to portfolio holdings are reflected as other income in theStatement of Operations.
Tax Matters and Distributions — The fund intends to qualify as a regulated investment company, as defined under SubchapterM of the Internal Revenue Code, and to distribute all of its taxable income, including realized capital gains. As a result, noprovision for federal income tax is required. The fund’s federal tax returns, when filed, will remain subject to examination by theInternal Revenue Service for a three year period. Management has analyzed the fund’s tax positions taken on federal and statetax returns for all open tax years and does not believe that there are any uncertain tax positions that require recognition of a taxliability. Foreign taxes, if any, have been accrued by the fund in the accompanying financial statements in accordance with theapplicable foreign tax law. Foreign income taxes may be withheld by certain countries in which the fund invests. Additionally,capital gains realized by the fund on securities issued in or by certain foreign countries may be subject to capital gains taximposed by those countries.Distributions to shareholders are recorded on the ex-dividend date. Income and capital gain distributions are determined in accordancewith income tax regulations, which may differ from U.S. generally accepted accounting principles. Certain capital accounts in the financialstatements are periodically adjusted for permanent differences in order to reflect their tax character. These adjustments have no impacton net assets or net asset value per share. Temporary differences which arise from recognizing certain items of income, expense, gain orloss in different periods for financial statement and tax purposes will reverse at some time in the future.
Book/tax differences primarily relate to wash sale loss deferrals, treating a portion of the proceeds from redemptions as a distribution fortax purposes, and redemptions in-kind.
29
Copyright © 2022 www.secdatabase.com. All Rights Reserved.Please Consider the Environment Before Printing This Document

Table of Contents
Notes to Financial Statements (unaudited) - continued
The tax character of distributions made during the current period will be determined at fiscal year end. The tax character of distributionsdeclared to shareholders for the last fiscal year is as follows:
Year ended8/31/21
Ordinary income (including any short-term capital gains) $845,025,639Long-term capital gains 553,611,292
Total distributions $1,398,636,931
The federal tax cost and the tax basis components of distributable earnings were as follows:
As of 2/28/22Cost of investments $34,527,779,031
Gross appreciation 29,412,609,119Gross depreciation (191,016,636)
Net unrealized appreciation (depreciation) $29,221,592,483As of 8/31/21Undistributed ordinary income 160,427,763Undistributed long-term capital gain 995,763,961Other temporary differences 1,577,228Net unrealized appreciation (depreciation) 32,565,766,373
The aggregate cost above includes prior fiscal year end tax adjustments, if applicable.
Multiple Classes of Shares of Beneficial Interest — The fund offers multiple classes of shares, which differ in their respectivedistribution, service, and program manager fees. The fund's income, realized and unrealized gain (loss), and common expensesare allocated to shareholders based on the daily net assets of each class. Dividends are declared separately for each class.Differences in per share dividend rates are generally due to differences in separate class expenses. Class B and Class C shareswill convert to Class A shares approximately eight years after purchase. Class 529B and Class 529C shares will convert toClass 529A shares approximately eight years after purchase. On December 29, 2021, the fund announced that effective on orabout March 21, 2022,
30
Copyright © 2022 www.secdatabase.com. All Rights Reserved.Please Consider the Environment Before Printing This Document

Table of Contents
Notes to Financial Statements (unaudited) - continued
all Class 529B and Class 529C shares will be converted into Class 529A shares. The fund’s distributions declared to shareholders asreported in the Statements of Changes in Net Assets are presented by class as follows:
Six monthsended2/28/22
Yearended8/31/21
Class A $212,740,712 $166,686,442Class B 1,076,179 854,581Class C 14,764,763 10,645,760Class I 743,766,315 599,084,638Class R1 432,729 324,628Class R2 9,653,759 7,992,962Class R3 71,988,962 52,802,673Class R4 67,954,534 63,308,969Class R6 631,447,542 496,112,338Class 529A 1,039,124 740,732Class 529B 12,068 11,656Class 529C 91,528 71,552
Total $1,754,968,215 $1,398,636,931
(3) Transactions with AffiliatesInvestment Adviser — The fund has an investment advisory agreement with MFS to provide overall investment managementand related administrative services and facilities to the fund. The management fee is computed daily and paid monthly at thefollowing annual rates based on the fund's average daily net assets:
Up to $7.5 billion 0.60%In excess of $7.5 billion and up to $10 billion 0.53%In excess of $10 billion and up to $20 billion 0.50%In excess of $20 billion and up to $25 billion 0.45%In excess of $25 billion and up to $30 billion 0.42%In excess of $30 billion and up to $35 billion 0.40%In excess of $35 billion and up to $40 billion 0.38%In excess of $40 billion and up to $45 billion 0.36%In excess of $45 billion and up to $50 billion 0.35%In excess of $50 billion and up to $60 billion 0.34%In excess of $60 billion 0.33%
MFS has agreed in writing to reduce its management fee by a specified amount if certain MFS mutual fund assets exceed thresholdsagreed to by MFS and the fund's Board of Trustees. For the six months ended February 28, 2022, this management fee reductionamounted to $4,474,461, which is included in the reduction of total expenses in the Statement of Operations. The management feeincurred for the six months ended February 28, 2022 was equivalent to an annual effective rate of 0.41% of the fund's average daily netassets.
Distributor — MFS Fund Distributors, Inc. (MFD), a wholly-owned subsidiary of MFS, as distributor, received $549,162 and$7,639 for the six months ended February 28, 2022, as its portion of the initial sales charge on sales of Class A and Class 529Ashares of the fund, respectively.
31
Copyright © 2022 www.secdatabase.com. All Rights Reserved.Please Consider the Environment Before Printing This Document

Table of Contents
Notes to Financial Statements (unaudited) - continued
The Board of Trustees has adopted a distribution plan for certain share classes pursuant to Rule 12b-1 of the Investment Company Act of1940.
The fund's distribution plan provides that the fund will pay MFD for services provided by MFD and financial intermediaries in connectionwith the distribution and servicing of certain share classes. One component of the plan is a distribution fee paid to MFD and anothercomponent of the plan is a service fee paid to MFD. MFD may subsequently pay all, or a portion, of the distribution and/or service fees tofinancial intermediaries.
Distribution Plan Fee Table:
DistributionFee Rate (d)
ServiceFee Rate (d)
TotalDistribution
Plan (d)
AnnualEffectiveRate (e)
Distributionand Service
Fee
Class A — 0.25% 0.25% 0.25% $ 10,300,881
Class B 0.75% 0.25% 1.00% 1.00% 243,107
Class C 0.75% 0.25% 1.00% 1.00% 3,300,369
Class R1 0.75% 0.25% 1.00% 1.00% 95,043
Class R2 0.25% 0.25% 0.50% 0.50% 967,038
Class R3 — 0.25% 0.25% 0.25% 3,452,874
Class 529A — 0.25% 0.25% 0.22% 49,851
Class 529B 0.75% 0.25% 1.00% 0.25% 573
Class 529C 0.75% 0.25% 1.00% 1.00% 20,045
Total Distribution and ServiceFees $18,429,781
(d) In accordance with the distribution plan for certain classes, the fund pays distribution and/or service fees equal to these annual percentage rates ofeach class’s average daily net assets. The distribution and service fee rates disclosed by class represent the current rates in effect at the endof the reporting period. Any rate changes, if applicable, are detailed below.
(e) The annual effective rates represent actual fees incurred under the distribution plan for the six months ended February 28, 2022 based on eachclass's average daily net assets. MFD has voluntarily agreed to rebate a portion of each class’s 0.25% service fee attributable to accounts forwhich there is no financial intermediary specified on the account except for accounts attributable to MFS or its affiliates’ seed money. For thesix months ended February 28, 2022, this rebate amounted to $1,994, $21, $50, $447, $21, $5,614, $2, and $46 for Class A, Class B, ClassC, Class R2, Class R3, Class 529A, Class 529B, and Class 529C, respectively, and is included in the reduction of total expenses in theStatement of Operations. For the six months ended February 28, 2022, the 0.75% distribution fee was not imposed for Class 529B shares dueto the sales charge limitations contained in Financial Industry Regulatory Authority (“FINRA”) Rule 2341.
Certain Class A shares are subject to a contingent deferred sales charge (CDSC) in the event of a shareholder redemption within 18months of purchase. Class B and Class 529B shares are subject to a CDSC in the event of a shareholder redemption within six years ofpurchase. Class C and Class 529C shares are subject to a CDSC in the event of
32
Copyright © 2022 www.secdatabase.com. All Rights Reserved.Please Consider the Environment Before Printing This Document

Table of Contents
Notes to Financial Statements (unaudited) - continued
a shareholder redemption within 12 months of purchase. All contingent deferred sales charges are paid to MFD and during the sixmonths ended February 28, 2022, were as follows:
AmountClass A $39,390Class B 9,106Class C 22,091Class 529B —Class 529C 271
The fund has entered into and may from time to time enter into contracts with program managers and other parties which administer thetuition programs through which an investment in the fund’s 529 share classes is made. The fund has entered into an agreement withMFD pursuant to which MFD receives an annual fee of up to 0.05% of the average daily net assets attributable to each 529 share class.The services provided by MFD, or a third party with which MFD contracts, include recordkeeping and tax reporting and account services,as well as services designed to maintain the program’s compliance with the Internal Revenue Code and other regulatory requirements.Program manager fees for the six months ended February 28, 2022, were as follows:
FeeClass 529A $9,970Class 529B 115Class 529C 1,002
Total Program Manager Fees $11,087
Shareholder Servicing Agent — MFS Service Center, Inc. (MFSC), a wholly-owned subsidiary of MFS, receives a fee from thefund for its services as shareholder servicing agent calculated as a percentage of the average daily net assets of the fund asdetermined periodically under the supervision of the fund's Board of Trustees. For the six months ended February 28, 2022, thefee was $894,635, which equated to 0.0027% annually of the fund's average daily net assets. MFSC also receivesreimbursement from the fund for out-of-pocket expenses, sub-accounting and other shareholder servicing costs which may bepaid to affiliated and unaffiliated service providers. Class R6 shares do not incur sub-accounting fees. For the six monthsended February 28, 2022, these out-of-pocket expenses, sub-accounting and other shareholder servicing costs amounted to$23,745,906.Administrator — MFS provides certain financial, legal, shareholder communications, compliance, and other administrativeservices to the fund. Under an administrative services agreement, the fund reimburses MFS the costs incurred to provide theseservices. The fund is charged an annual fixed amount of $17,500 plus a fee based on average daily net assets. Theadministrative services fee incurred for the six months ended February 28, 2022 was equivalent to an annual effective rate of0.0009% of the fund's average daily net assets.Trustees’ and Officers’ Compensation — The fund pays compensation to independent Trustees in the form of a retainer,attendance fees, and additional compensation to Board and Committee chairpersons. The fund does not pay
33
Copyright © 2022 www.secdatabase.com. All Rights Reserved.Please Consider the Environment Before Printing This Document

Table of Contents
Notes to Financial Statements (unaudited) - continued
compensation directly to Trustees or officers of the fund who are also officers of the investment adviser, all of whom receive remunerationfrom MFS for their services to the fund. Certain officers and Trustees of the fund are officers or directors of MFS, MFD, and MFSC.
Other — The fund invests in the MFS Institutional Money Market Portfolio which is managed by MFS and seeks current incomeconsistent with preservation of capital and liquidity. This money market fund does not pay a management fee to MFS but doesincur investment and operating costs.The fund is permitted to engage in purchase and sale transactions with funds and accounts for which MFS serves as investment adviseror sub-adviser (“cross-trades”) pursuant to a policy adopted by the Board of Trustees. This policy has been designed to ensure thatcross-trades conducted by the fund comply with Rule 17a-7 under the Investment Company Act of 1940. During the six months endedFebruary 28, 2022, the fund engaged in purchase and sale transactions pursuant to this policy, which amounted to $53,411,751 and$19,725,963, respectively. The sales transactions resulted in net realized gains (losses) of $7,439,272.
The adviser has voluntarily undertaken to reimburse the fund from its own resources on a quarterly basis for the cost of investmentresearch embedded in the cost of the fund’s securities trades. This agreement may be rescinded at any time. For the six months endedFebruary 28, 2022, this reimbursement amounted to $243,144, which is included in “Other” income in the Statement of Operations.
(4) Portfolio SecuritiesFor the six months ended February 28, 2022, purchases and sales of investments, other than in-kind transactions and short-termobligations, aggregated $2,914,917,703 and $2,706,946,292, respectively.
34
Copyright © 2022 www.secdatabase.com. All Rights Reserved.Please Consider the Environment Before Printing This Document

Table of Contents
Notes to Financial Statements (unaudited) - continued
(5) Shares of Beneficial InterestThe fund's Declaration of Trust permits the Trustees to issue an unlimited number of full and fractional shares of beneficial interest.Transactions in fund shares were as follows:
Six months ended2/28/22
Year ended8/31/21
Shares Amount Shares Amount
Shares sold
Class A 12,515,832 $662,231,196 28,467,122 $1,335,871,741
Class B 7,253 378,585 18,355 874,259
Class C 1,255,456 65,896,027 2,203,360 103,181,176
Class I 58,092,387 3,097,514,346 119,673,145 5,633,928,091
Class R1 33,598 1,743,114 79,348 3,645,867
Class R2 551,628 28,703,219 1,472,853 68,231,472
Class R3 4,610,053 242,923,709 13,882,669 660,290,908
Class R4 4,817,609 256,655,312 13,206,607 626,397,953
Class R6 37,109,580 1,970,553,849 101,272,140 4,774,788,639
Class 529A 57,453 3,005,819 128,819 6,014,946
Class 529B — — 212 8,522
Class 529C 3,711 189,761 14,032 653,864
119,054,560 $6,329,794,937 280,418,662 $13,213,887,438
Shares issued to shareholdersin reinvestment of distributions
Class A 3,242,131 $173,895,341 2,948,136 $132,331,922
Class B 18,840 1,009,110 17,937 793,854
Class C 229,595 12,193,864 201,951 8,884,397
Class I 11,447,498 617,420,061 10,781,776 487,679,647
Class R1 8,222 432,636 7,450 324,625
Class R2 181,182 9,615,810 179,495 7,938,727
Class R3 1,348,164 71,987,037 1,180,319 52,802,507
Class R4 1,240,351 66,469,210 1,378,461 61,719,795
Class R6 10,671,685 571,801,797 10,032,624 451,225,773
Class 529A 19,150 1,017,433 16,317 726,941
Class 529B 230 12,068 266 11,654
Class 529C 1,666 87,208 1,614 69,859
28,408,714 $1,525,941,575 26,746,346 $1,204,509,701
35
Copyright © 2022 www.secdatabase.com. All Rights Reserved.Please Consider the Environment Before Printing This Document

Table of Contents
Notes to Financial Statements (unaudited) - continued
Six months ended2/28/22
Year ended8/31/21
Shares Amount Shares Amount
Shares reacquired
Class A (15,920,656) $(844,392,972) (28,818,719) $(1,350,239,633)
Class B (156,001) (8,181,766) (405,941) (18,801,714)
Class C (1,821,578) (95,132,122) (5,388,848) (245,619,155)
Class I (49,520,155) (2,640,838,812) (127,622,763) (6,059,259,926)
Class R1 (72,431) (3,703,840) (162,150) (7,593,710)
Class R2 (1,387,353) (72,809,767) (2,720,085) (127,175,585)
Class R3 (5,194,518) (274,438,110) (12,579,306) (586,782,535)
Class R4 (8,769,843) (465,573,338) (21,863,125) (1,031,400,326)
Class R6 (34,755,800) (1,844,673,630) (75,057,631) (3,514,148,142)
Class 529A (38,512) (2,022,027) (81,454) (3,800,524)
Class 529B (1,001) (51,261) (3,055) (143,013)
Class 529C (12,080) (618,767) (41,768) (1,885,407)
(117,649,928) $(6,252,436,412) (274,744,845) $(12,946,849,670)
Net change
Class A (162,693) $(8,266,435) 2,596,539 $117,964,030
Class B (129,908) (6,794,071) (369,649) (17,133,601)
Class C (336,527) (17,042,231) (2,983,537) (133,553,582)
Class I 20,019,730 1,074,095,595 2,832,158 62,347,812
Class R1 (30,611) (1,528,090) (75,352) (3,623,218)
Class R2 (654,543) (34,490,738) (1,067,737) (51,005,386)
Class R3 763,699 40,472,636 2,483,682 126,310,880
Class R4 (2,711,883) (142,448,816) (7,278,057) (343,282,578)
Class R6 13,025,465 697,682,016 36,247,133 1,711,866,270
Class 529A 38,091 2,001,225 63,682 2,941,363
Class 529B (771) (39,193) (2,577) (122,837)
Class 529C (6,703) (341,798) (26,122) (1,161,684)
29,813,346 $1,603,300,100 32,420,163 $1,471,547,469
The fund is one of several mutual funds in which certain MFS funds may invest. The MFS funds do not invest in the underlying funds forthe purpose of exercising management or control. At the end of the period, the MFS Growth Allocation Fund was the owner of record ofapproximately 1% of the value of outstanding voting shares of the fund. In addition, the MFS Aggressive Growth Allocation Fund, theMFS Conservative Allocation Fund, the MFS Lifetime 2020 Fund, the MFS Lifetime 2025 Fund, the MFS Lifetime 2030 Fund, the MFSLifetime 2035 Fund, the MFS Lifetime 2040 Fund, the MFS Lifetime 2045 Fund, the MFS Lifetime 2050 Fund, the MFS Lifetime 2055Fund, the MFS Lifetime 2060 Fund, the MFS Lifetime 2065 Fund, the MFS Lifetime Income Fund, the MFS Managed Wealth Fund, andthe MFS Moderate Allocation Fund were each the owners of record of less than 1% of the value of outstanding voting shares of the fund.
36
Copyright © 2022 www.secdatabase.com. All Rights Reserved.Please Consider the Environment Before Printing This Document

Table of Contents
Notes to Financial Statements (unaudited) - continued
Effective June 1, 2019, purchases of the fund’s Class B and Class 529B shares are closed to new and existing investors subject tocertain exceptions. On December 29, 2021, the fund announced the termination of the fund's Class 529A, Class 529B, and Class 529Cshares effective on or about June 9, 2022. In connection with the termination, all sales of Class 529B and Class 529C shares will besuspended effective after the close of business on or about March 18, 2022, and Class 529B and Class 529C shares will be convertedinto Class 529A shares of the fund effective on or about March 21, 2022. In addition, effective after the close of business on or about May13, 2022, all sales and redemptions of Class 529A shares will be suspended in anticipation of a complete redemption of Class 529Ashares on or about May 20, 2022. Please see the fund’s prospectus for details.
(6) Line of CreditThe fund and certain other funds managed by MFS participate in a $1.25 billion unsecured committed line of credit of which $1 billion isreserved for use by the fund and certain other MFS U.S. funds. The line of credit is provided by a syndicate of banks under a creditagreement. Borrowings may be made for temporary financing needs. Interest is charged to each fund, based on its borrowings, generallyat a rate equal to the highest of one month LIBOR, the Federal Funds Effective Rate and the Overnight Bank Funding Rate, plus anagreed upon spread. A commitment fee, based on the average daily, unused portion of the committed line of credit, is allocated amongthe participating funds. In addition, the fund and other funds managed by MFS have established unsecured uncommitted borrowingarrangements with certain banks for temporary financing needs. Interest is charged to each fund, based on its borrowings, at rates equalto customary reference rates plus an agreed upon spread. For the six months ended February 28, 2022, the fund’s commitment fee andinterest expense were $114,073 and $0, respectively, and are included in “Miscellaneous” expense in the Statement of Operations.
(7) Investments in Affiliated IssuersAn affiliated issuer may be considered one in which the fund owns 5% or more of the outstanding voting securities, or a company whichis under common control. For the purposes of this report, the following were affiliated issuers:
Affiliated IssuersBeginning
Value PurchasesSales
Proceeds
RealizedGain
(Loss)
Change inUnrealized
Appreciation orDepreciation
EndingValue
MFS Institutional MoneyMarket Portfolio $658,689,844 $1,696,981,785 $1,453,769,726 $— $(1) $901,901,902
Affiliated IssuersDividend
IncomeCapital Gain
Distributions
MFS Institutional Money Market Portfolio $197,529 $—
(8) Redemptions In-KindOn January 4, 2022, the fund recorded a redemption in-kind of portfolio securities and cash that was valued at $49,200,852. Theredeeming shareholder generally receives a pro rata share of the securities held by the fund. The distribution of such securities
37
Copyright © 2022 www.secdatabase.com. All Rights Reserved.Please Consider the Environment Before Printing This Document
Table of Contents
Notes to Financial Statements (unaudited) - continued
generated a realized gain of $30,272,631 for the fund, which is included in Net realized gain in the Statement of Operations. For taxpurposes, no gains or losses were recognized with respect to the portfolio securities redeemed in-kind.
On February 10, 2022, the fund recorded a redemption in-kind of portfolio securities and cash that was valued at $59,384,918. Theredeeming shareholder generally receives a pro rata share of the securities held by the fund. The distribution of such securitiesgenerated a realized gain of $35,345,961 for the fund, which is included in Net realized gain in the Statement of Operations. For taxpurposes, no gains or losses were recognized with respect to the portfolio securities redeemed in-kind.
(9) Impacts of COVID-19The pandemic related to the global spread of novel coronavirus disease (COVID-19), which was first detected in December 2019, hasresulted in significant disruptions to global business activity and the global economy, as well as the economies of individual countries, thefinancial performance of individual companies and sectors, and the securities and commodities markets in general. Multiple surges incases globally, the availability and widespread adoption of vaccines, and the emergence of variant strains of the virus continue to createuncertainty as to the future and long-term impacts resulting from the pandemic including impacts to the prices and liquidity of the fund'sinvestments and the fund's performance.
(10) LIBOR TransitionCertain of the fund's investments, including investments in certain debt instruments and derivatives (if any), as well as borrowings by thefund and certain other contractual arrangements of the fund, may be based on the London Interbank Offered Rate (“LIBOR”). In 2017, theregulatory authority that oversees financial services firms in the United Kingdom announced plans to transition away from LIBOR by theend of 2021. In March 2021, the administrator of LIBOR announced the extension of the publication of the more commonly used U.S.dollar LIBOR settings to the end of June 2023. Although the full impacts of the transition away from LIBOR are not fully known, thetransition may result in, among other things, an increase in volatility or illiquidity of the markets for instruments that currently rely onLIBOR to determine interest rates and this could have an adverse impact on the fund's performance. With respect to the fund'saccounting for investments, including investments in certain debt instruments and derivatives, as well as borrowings by the fund and anyother contractual arrangements of the fund that undergo reference rate-related modifications as a result of the transition, managementwill rely upon the relief provided by FASB Codification Topic 848 – Reference Rate Reform (Topic 848). The guidance in Topic 848permits the fund to account for those modified contracts as a continuation of the existing contracts. Management is still evaluating theimpact to the fund of the June 30, 2023 planned discontinuation of the more commonly used U.S. dollar LIBOR settings.
(11) Russia and Ukraine ConflictThe market disruptions, which began in late February 2022, associated with geopolitical events related to the conflict between Russiaand Ukraine may adversely affect the value of the fund’s assets and thus the fund’s performance. Management continues to monitorthese events and to evaluate the related impacts, if any, to the fund.
38
Copyright © 2022 www.secdatabase.com. All Rights Reserved.Please Consider the Environment Before Printing This Document

Table of Contents
Notes to Financial Statements (unaudited) - continued
(12) Subsequent EventOn March 31, 2022, the fund recorded redemption proceeds for a distribution in-kind of portfolio securities and cash that were valued at$110,394,792. The redeeming shareholder generally receives a pro rata share of the securities held by the fund. The distribution of suchsecurities generated a realized gain of $65,913,311 for the fund.
39
Copyright © 2022 www.secdatabase.com. All Rights Reserved.Please Consider the Environment Before Printing This Document

Table of Contents
PROXY VOTING POLICIES AND INFORMATION
MFS votes proxies on behalf of the fund pursuant to proxy voting policies and procedures that are available without charge, uponrequest, by calling 1-800-225-2606, by visiting mfs.com/proxyvoting, or by visiting the SEC’s Web site at http://www.sec.gov.
Information regarding how the fund voted proxies relating to portfolio securities during the most recent twelve-month period ended June30 is available by August 31 of each year without charge by visiting mfs.com/proxyvoting, or by visiting the SEC’s Web site athttp://www.sec.gov.
QUARTERLY PORTFOLIO DISCLOSURE
The fund files a complete schedule of portfolio holdings with the SEC for the first and third quarters of each fiscal year as an exhibit to itsreports on Form N-PORT. The fund's Form N-PORT reports are available on the SEC's Web site at http://www.sec.gov. A shareholdercan obtain the portfolio holdings report for the first and third quarters of the fund's fiscal year at mfs.com/openendfunds by choosing thefund's name and then scrolling to the “Resources” section and clicking on the “Prospectus and Reports” tab.
FURTHER INFORMATION
From time to time, MFS may post important information about the fund or the MFS Funds on the MFS Web site (mfs.com). Thisinformation is available at https://www.mfs.com/announcements or at mfs.com/openendfunds by choosing the fund’s name and thenscrolling to the “Resources” section and clicking on the “Announcements” tab, if any.
INFORMATION ABOUT FUND CONTRACTS AND LEGAL CLAIMS
The fund has entered into contractual arrangements with an investment adviser, administrator, distributor, shareholder servicing agent,529 program manager (if applicable), and custodian who each provide services to the fund. Unless expressly stated otherwise,shareholders are not parties to, or intended beneficiaries of these contractual arrangements, and these contractual arrangements are notintended to create any shareholder right to enforce them against the service providers or to seek any remedy under them against theservice providers, either directly or on behalf of the fund.
Under the Trust’s By-Laws and Declaration of Trust, any claims asserted against or on behalf of the MFS Funds, including claims againstTrustees and Officers, must be brought in state and federal courts located within the Commonwealth of Massachusetts.
PROVISION OF FINANCIAL REPORTS AND SUMMARY PROSPECTUSES
The fund produces financial reports every six months and updates its summary prospectus and prospectus annually. To avoid sendingduplicate copies of materials to households, only one copy of the fund’s annual and semiannual report and summary prospectus may bemailed to shareholders having the same last name and residential address on the fund’s records. However, any shareholder may contactMFSC (please see back cover for address and telephone number) to request that copies of these reports and summary prospectuses besent personally to that shareholder.
40
Copyright © 2022 www.secdatabase.com. All Rights Reserved.Please Consider the Environment Before Printing This Document

Table of Contents
Copyright © 2022 www.secdatabase.com. All Rights Reserved.Please Consider the Environment Before Printing This Document

Table of Contents
Copyright © 2022 www.secdatabase.com. All Rights Reserved.Please Consider the Environment Before Printing This Document

Table of Contents
Copyright © 2022 www.secdatabase.com. All Rights Reserved.Please Consider the Environment Before Printing This Document

Table of Contents
Save paper with eDelivery.
MFS® will send you prospectuses,reports, and proxies directly via e-mailso you will get information faster withless mailbox clutter.
To sign up:
CONTACTWEB SITEmfs.com
MFS TALK1-800-637-825524 hours a day
ACCOUNT SERVICE AND LITERATURE
Copyright © 2022 www.secdatabase.com. All Rights Reserved.Please Consider the Environment Before Printing This Document

1. Go to mfs.com.
2. Log in via MFS® Access.3. Select eDelivery.
If you own your MFS fund shares through a financial
institution or a retirement plan, MFS® TALK, MFS®
Access, or eDelivery may not be available to you.
Shareholders1-800-225-2606
Financial advisors1-800-343-2829
Retirement plan services1-800-637-1255
MAILING ADDRESSMFS Service Center, Inc.P.O. Box 219341Kansas City, MO 64121-9341
OVERNIGHT MAILMFS Service Center, Inc.Suite 219341430 W 7th StreetKansas City, MO 64105-1407
Copyright © 2022 www.secdatabase.com. All Rights Reserved.Please Consider the Environment Before Printing This Document

1(b):
Not applicable.
Copyright © 2022 www.secdatabase.com. All Rights Reserved.Please Consider the Environment Before Printing This Document

ITEM 2. CODE OF ETHICS.
During the period covered by this report, the Registrant has not amended any provision in its Code of Ethics (the �Code�) that relates toan element of the Code�s definitions enumerated in paragraph (b) of Item 2 of this Form N-CSR. During the period covered by thisreport, the Registrant did not grant a waiver, including an implicit waiver, from any provision of the Code.
ITEM 3. AUDIT COMMITTEE FINANCIAL EXPERT.
Not applicable for semi-annual reports.
ITEM 4. PRINCIPAL ACCOUNTANT FEES AND SERVICES.
Not applicable for semi-annual reports.
ITEM 5. AUDIT COMMITTEE OF LISTED REGISTRANTS.
Not applicable to the Registrant.
ITEM 6. INVESTMENTS
A schedule of investments for each series of the Registrant is included as part of the report to shareholders of such series under Item1(a) of this Form N-CSR.
ITEM 7. DISCLOSURE OF PROXY VOTING POLICIES AND PROCEDURES FOR CLOSED-END MANAGEMENTINVESTMENT COMPANIES.
Not applicable to the Registrant.
ITEM 8. PORTFOLIO MANAGERS OF CLOSED-END MANAGEMENT INVESTMENT COMPANIES.
Not applicable to the Registrant.
ITEM 9. PURCHASES OF EQUITY SECURITIES BY CLOSED-END MANAGEMENT INVESTMENT COMPANYAND AFFILIATED PURCHASERS.
Not applicable to the Registrant.
Copyright © 2022 www.secdatabase.com. All Rights Reserved.Please Consider the Environment Before Printing This Document

ITEM 10. SUBMISSION OF MATTERS TO A VOTE OF SECURITY HOLDERS.There were no material changes to the procedures by which shareholders may send recommendations to the Board for nominees to theRegistrant�s Board since the Registrant last provided disclosure as to such procedures in response to the requirements of Item 407(c)(2)(iv) of Regulation S-K or this Item.
ITEM 11. CONTROLS AND PROCEDURES.
(a) Based upon their evaluation of the effectiveness of the registrant�s disclosure controls and procedures (as defined in Rule 30a-3(c)under the Investment Company Act of 1940 (the �Act�)) as conducted within 90 days of the filing date of this report on FormN-CSR, the registrant�s principal financial officer and principal executive officer have concluded that those disclosure controlsand procedures provide reasonable assurance that the material information required to be disclosed by the registrant on this reportis recorded, processed, summarized and reported within the time periods specified in the Securities and Exchange Commission�srules and forms.
(b) There were no changes in the registrant�s internal controls over financial reporting (as defined in Rule 30a-3(d) under the Act) thatoccurred during the period covered by the report that have materially affected, or are reasonably likely to materially affect, theregistrant�s internal control over financial reporting.
ITEM 12. DISCLOSURE OF SECURITIES LENDING ACTIVITIES FOR CLOSED-END MANAGEMENTINVESTMENT COMPANIES.
Not applicable to the Registrant.
ITEM 13. EXHIBITS.
(a) File the exhibits listed below as part of this form. Letter or number the exhibits in the sequence indicated.
(1) Any code of ethics, or amendment thereto, that is the subject of the disclosure required by Item 2, to the extent that theregistrant intends to satisfy the Item 2 requirements through filing of an exhibit. Not applicable.
(2) A separate certification for each principal executive officer and principal financial officer of the registrant as required byRule 30a-2(a) under the Act (17 CFR 270.30a-2): Attached hereto as EX-99.302CERT.
(3) Any written solicitation to purchase securities under Rule 23c-1 under the Act (17 CFR 270.23c-1) sent or given during theperiod covered by the report by or on behalf of the registrant to 10 or more persons. Not applicable.
(4) Change in the registrant�s independent public accountant. Not applicable.
Copyright © 2022 www.secdatabase.com. All Rights Reserved.Please Consider the Environment Before Printing This Document

(b) If the report is filed under Section 13(a) or 15(d) of the Exchange Act, provide the certifications required by Rule 30a-2(b) underthe Act (17 CFR 270.30a-2(b)), Rule 13a-14(b) or Rule 15d-14(b) under the Exchange Act (17 CFR 240.13a-14(b) or240.15d-14(b)) and Section 1350 of Chapter 63 of Title 18 of the United States Code (18 U.S.C. 1350) as an exhibit. Acertification furnished pursuant to this paragraph will not be deemed �filed� for the purposes of Section 18 of the Exchange Act(15 U.S.C. 78r), or otherwise subject to the liability of that section. Such certification will not be deemed to be incorporated byreference into any filing under the Securities Act of 1933 or the Exchange Act, except to the extent that the registrant specificallyincorporates it by reference: Attached hereto as EX-99.906CERT.
Copyright © 2022 www.secdatabase.com. All Rights Reserved.Please Consider the Environment Before Printing This Document

Notice
A copy of the Amended and Restated Declaration of Trust, as amended, of the Registrant is on file with the Secretary of State of TheCommonwealth of Massachusetts and notice is hereby given that this instrument is executed on behalf of the Registrant by an officer ofthe Registrant as an officer and not individually and the obligations of or arising out of this instrument are not binding upon any of theTrustees or shareholders individually, but are binding only upon the assets and property of the respective constituent series of theRegistrant.
Copyright © 2022 www.secdatabase.com. All Rights Reserved.Please Consider the Environment Before Printing This Document

SIGNATURES
Pursuant to the requirements of the Securities Exchange Act of 1934 and the Investment Company Act of 1940, the registrant has dulycaused this report to be signed on its behalf by the undersigned, thereunto duly authorized.
(Registrant) MFS SERIES TRUST I
By (Signature and Title)*/S/DAVID L. DILORENZODavid L. DiLorenzo,President
Date: April 14, 2022
Pursuant to the requirements of the Securities Exchange Act of 1934 and the Investment Company Act of 1940, this report has beensigned below by the following persons on behalf of the registrant and in the capacities and on the dates indicated.
By (Signature and Title)* /S/DAVID L. DILORENZODavid L. DiLorenzo,President (PrincipalExecutive Officer)
Date: April 14, 2022
By (Signature and Title)* /S/ JAMES O. YOSTJames O. Yost, Treasurer(Principal Financial Officerand Accounting Officer)
Date: April 14, 2022
* Print name and title of each signing officer under his or her signature.
Copyright © 2022 www.secdatabase.com. All Rights Reserved.Please Consider the Environment Before Printing This Document

EX-99.302CERT
MFS SERIES TRUST I
CERTIFICATION PURSUANT TO SECTION 302 OF THE SARBANES-OXLEY ACT
I, James O. Yost, certify that:
1. I have reviewed this report on Form N-CSR of MFS Series Trust I;
2. Based on my knowledge, this report does not contain any untrue statement of a material fact or omit to state a material factnecessary to make the statements made, in light of the circumstances under which such statements were made, not misleading withrespect to the period covered by this report;
3. Based on my knowledge, the financial statements, and other financial information included in this report, fairly present in allmaterial respects the financial condition, results of operations, changes in net assets, and cash flows (if the financial statements arerequired to include a statement of cash flows) of the registrant as of, and for, the periods presented in this report;
4. The registrant�s other certifying officer and I are responsible for establishing and maintaining disclosure controls and procedures(as defined in Rule 30a-3(c) under the Investment Company Act of 1940) and internal control over financial reporting (as definedin Rule 30a-3(d) under the Investment Company Act of 1940) for the registrant and have:
a. Designed such disclosure controls and procedures, or caused such disclosure controls and procedures to be designed underour supervision, to ensure that material information relating to the registrant, including its consolidated subsidiaries, is madeknown to us by others within those entities, particularly during the period in which this report is being prepared;
b. Designed such internal control over financial reporting, or caused such internal control over financial reporting to bedesigned under our supervision, to provide reasonable assurance regarding the reliability of financial reporting and thepreparation of financial statements for external purposes in accordance with generally accepted accounting principles;
c. Evaluated the effectiveness of the registrant�s disclosure controls and procedures and presented in this report ourconclusions about the effectiveness of the disclosure controls and procedures as of a date within 90 days prior to the filingdate of this report based on such evaluation; and
d. Disclosed in this report any change in the registrant�s internal control over financial reporting that occurred during theperiod covered by the report that has materially affected, or is reasonably likely to materially affect, the registrant�s internalcontrol over financial reporting; and
Copyright © 2022 www.secdatabase.com. All Rights Reserved.Please Consider the Environment Before Printing This Document

5. The registrant�s other certifying officer and I have disclosed to the registrant�s auditors and the audit committee of the registrant�sboard of directors (or persons performing the equivalent functions):
a. All significant deficiencies and material weaknesses in the design or operation of internal control over financial reportingwhich are reasonably likely to adversely affect the registrant�s ability to record, process, summarize, and report financialinformation; and
b. Any fraud, whether or not material, that involves management or other employees who have a significant role in theregistrant�s internal control over financial reporting.
Date: April 14, 2022 /S/ JAMES O. YOSTJames O. YostTreasurer (Principal Financial Officer andAccounting Officer)
Copyright © 2022 www.secdatabase.com. All Rights Reserved.Please Consider the Environment Before Printing This Document

EX-99.302CERT
MFS SERIES TRUST I
CERTIFICATION PURSUANT TO SECTION 302 OF THE SARBANES-OXLEY ACT
I, David L. DiLorenzo, certify that:
1. I have reviewed this report on Form N-CSR of MFS Series Trust I;
2. Based on my knowledge, this report does not contain any untrue statement of a material fact or omit to state a material factnecessary to make the statements made, in light of the circumstances under which such statements were made, not misleading withrespect to the period covered by this report;
3. Based on my knowledge, the financial statements, and other financial information included in this report, fairly present in allmaterial respects the financial condition, results of operations, changes in net assets, and cash flows (if the financial statements arerequired to include a statement of cash flows) of the registrant as of, and for, the periods presented in this report;
4. The registrant�s other certifying officer and I are responsible for establishing and maintaining disclosure controls and procedures(as defined in Rule 30a-3(c) under the Investment Company Act of 1940) and internal control over financial reporting (as definedin Rule 30a-3(d) under the Investment Company Act of 1940) for the registrant and have:
a. Designed such disclosure controls and procedures, or caused such disclosure controls and procedures to be designed underour supervision, to ensure that material information relating to the registrant, including its consolidated subsidiaries, is madeknown to us by others within those entities, particularly during the period in which this report is being prepared;
b. Designed such internal control over financial reporting, or caused such internal control over financial reporting to bedesigned under our supervision, to provide reasonable assurance regarding the reliability of financial reporting and thepreparation of financial statements for external purposes in accordance with generally accepted accounting principles;
c. Evaluated the effectiveness of the registrant�s disclosure controls and procedures and presented in this report ourconclusions about the effectiveness of the disclosure controls and procedures as of a date within 90 days prior to the filingdate of this report based on such evaluation; and
d. Disclosed in this report any change in the registrant�s internal control over financial reporting that occurred during theperiod covered by the report that has materially affected, or is reasonably likely to materially affect, the registrant�s internalcontrol over financial reporting; and
Copyright © 2022 www.secdatabase.com. All Rights Reserved.Please Consider the Environment Before Printing This Document

5. The registrant�s other certifying officer and I have disclosed to the registrant�s auditors and the audit committee of the registrant�sboard of directors (or persons performing the equivalent functions):
a. All significant deficiencies and material weaknesses in the design or operation of internal control over financial reportingwhich are reasonably likely to adversely affect the registrant�s ability to record, process, summarize, and report financialinformation; and
b. Any fraud, whether or not material, that involves management or other employees who have a significant role in theregistrant�s internal control over financial reporting.
Date: April 14, 2022 /S/ DAVID L. DILORENZODavid L. DiLorenzoPresident (Principal Executive Officer)
Copyright © 2022 www.secdatabase.com. All Rights Reserved.Please Consider the Environment Before Printing This Document

EX-99.906CERT
MFS SERIES TRUST I
CERTIFICATION PURSUANT TO SECTION 906 OF THE SARBANES-OXLEY ACT
I, James O. Yost, certify that, to my knowledge:
1. The Form N-CSR (the �Report�) of MFS Series Trust I (the �Registrant�) fully complies for the period covered by the Reportwith the requirements of Section 13(a) or 15(d) of the Securities Exchange Act of 1934; and
2. The information contained in the Report fairly presents, in all material respects, the financial condition and results of operations ofthe Registrant.
Date: April 14, 2022 /S/ JAMES O. YOSTJames O. YostTreasurer (Principal Financial Officer andAccounting Officer)
A signed original of this written statement required by Section 906 has been provided to the Registrant and will be retained bythe Registrant and furnished to the Securities and Exchange Commission or its staff upon request.
Copyright © 2022 www.secdatabase.com. All Rights Reserved.Please Consider the Environment Before Printing This Document

EX-99.906CERT
MFS SERIES TRUST I
CERTIFICATION PURSUANT TO SECTION 906 OF THE SARBANES-OXLEY ACT
I, David L. DiLorenzo, certify that, to my knowledge:
1. The Form N-CSR (the �Report�) of MFS Series Trust I (the �Registrant�) fully complies for the period covered by the Reportwith the requirements of Section 13(a) or 15(d) of the Securities Exchange Act of 1934; and
2. The information contained in the Report fairly presents, in all material respects, the financial condition and results of operations ofthe Registrant.
Date: April 14, 2022 /S/ DAVID L. DILORENZODavid L. DiLorenzoPresident (Principal Executive Officer)
A signed original of this written statement required by Section 906 has been provided to the Registrant and will be retained bythe Registrant and furnished to the Securities and Exchange Commission or its staff upon request.
Copyright © 2022 www.secdatabase.com. All Rights Reserved.Please Consider the Environment Before Printing This Document