Meta-analysis of quantification methods shows that archaea and bacteria have similar abundances in...
10
Meta-Analysis of Quantification Methods Shows that Archaea and Bacteria Have Similar Abundances in the Subseafloor Karen G. Lloyd, a Megan K. May, a,b * Richard T. Kevorkian, a Andrew D. Steen a University of Tennessee, Knoxville, Tennessee, USA a ; DePauw University, Greencastle, Indiana, USA b There is no universally accepted method to quantify bacteria and archaea in seawater and marine sediments, and different meth- ods have produced conflicting results with the same samples. To identify best practices, we compiled data from 65 studies, plus our own measurements, in which bacteria and archaea were quantified with fluorescent in situ hybridization (FISH), catalyzed reporter deposition FISH (CARD-FISH), polyribonucleotide FISH, or quantitative PCR (qPCR). To estimate efficiency, we de- fined “yield” to be the sum of bacteria and archaea counted by these techniques divided by the total number of cells. In seawater, the yield was high (median, 71%) and was similar for FISH, CARD-FISH, and polyribonucleotide FISH. In sediments, only mea- surements by CARD-FISH in which archaeal cells were permeabilized with proteinase K showed high yields (median, 84%). Therefore, the majority of cells in both environments appear to be alive, since they contain intact ribosomes. In sediments, the sum of bacterial and archaeal 16S rRNA gene qPCR counts was not closely related to cell counts, even after accounting for varia- tions in copy numbers per genome. However, qPCR measurements were precise relative to other qPCR measurements made on the same samples. qPCR is therefore a reliable relative quantification method. Inconsistent results for the relative abundance of bacteria versus archaea in deep subsurface sediments were resolved by the removal of CARD-FISH measurements in which ly- sozyme was used to permeabilize archaeal cells and qPCR measurements which used ARCH516 as an archaeal primer or TaqMan probe. Data from best-practice methods showed that archaea and bacteria decreased as the depth in seawater and marine sedi- ments increased, although archaea decreased more slowly. M arine sediments cover 75% of Earth’s surface and are esti- mated to contain 2.9 10 29 microbial cells (1). The majority of these cells bear little phylogenetic resemblance to cultured mi- croorganisms and are likely very energy limited (2). Despite the importance of this vast subsurface biome to biogeochemical cycles and our understanding of biological energy limitation, two basic questions persist: (i) how do we accurately quantify cells from a particular microbial group (e.g., bacteria versus archaea) in the methodologically challenging sediment matrix, and (ii) how many of these individuals are alive? Attempts to answer these questions have produced highly con- flicting results. In an unprecedented interlaboratory comparison beginning in 2001, sediments from Ocean Drilling Program Leg 201 in the Peru Margin were subsampled and quantified in sepa- rate laboratories. As this was the first expedition to obtain verifi- ably uncontaminated samples, many research groups were eager to work on the same samples. Some researchers reported an over- whelming dominance of bacteria over archaea, using catalyzed reporter deposition (CARD) fluorescent in situ hybridization (FISH) (3) and quantitative PCR (qPCR) (3–5). Other researchers used lipid measurements to conclude the existence of an over- whelming dominance of archaea over bacteria (6, 7). A third col- lection of data showed roughly equal numbers of bacteria and archaea using FISH (6), CARD-FISH (8), and metagenomic se- quencing and qPCR (9). The explanation for these inconsistent results must be either that some methods were less accurate or that some methods quantified dead as well as live biomass. It now appears that detrital cell matter contributed to an overestimation of the archaea by lipid analyses (10, 11), so it is unlikely that ar- chaea completely dominate the Peru Margin sediments. Method- ological inaccuracies have been suggested to explain the qPCR discrepancies, since some TaqMan probes or PCR primers are biased against common subsurface archaea (12). However, no study has addressed the discrepancies between the results of FISH and CARD-FISH with the Peru Margin sediments or evaluated the relative accuracies of FISH, CARD-FISH, and qPCR with all ma- rine sediments and seawater. In FISH and CARD-FISH, an oligonucleotide probe with a taxon-specific sequence binds directly to rRNA (13). For FISH, this probe is attached to a fluorophore, allowing probe-positive cells to be counted under a microscope. For CARD-FISH, the probe is bound to a large horseradish peroxidase (HRP) enzyme, which catalyzes the deposition of many fluorescent tyramides, en- hancing the fluorescence intensity. HRP is far too large (40 kDa) to diffuse freely into cells (14), so cells must first be permeabilized by partially degrading their cell walls (15). In another variation, called polyribonucleotide FISH, nearly full-length ribosomal gene amplicons are transcribed to RNA with fluorescently tagged ribo- nucleotides (16). The resulting signals are very bright; however, the probe’s great length makes it difficult to trust the specificity of binding to the target population (17). In principle, each of these FISH methods quantifies only viable cells by imaging intact cells Received 25 June 2013 Accepted 1 October 2013 Published ahead of print 4 October 2013 Address correspondence to Karen G. Lloyd, [email protected]. * Present address: Megan K. May, Woods Hole Oceanographic Institution, Woods Hole, Massachusetts, USA. This work is NSF Center for Dark Energy Biosphere Investigations contribution number 176. Supplemental material for this article may be found at http://dx.doi.org/10.1128 /AEM.02090-13. Copyright © 2013, American Society for Microbiology. All Rights Reserved. doi:10.1128/AEM.02090-13 7790 aem.asm.org Applied and Environmental Microbiology p. 7790 –7799 December 2013 Volume 79 Number 24 on May 6, 2016 by guest http://aem.asm.org/ Downloaded from
Transcript of Meta-analysis of quantification methods shows that archaea and bacteria have similar abundances in...

Meta-Analysis of Quantification Methods Shows that Archaea andBacteria Have Similar Abundances in the Subseafloor
Karen G. Lloyd,a Megan K. May,a,b* Richard T. Kevorkian,a Andrew D. Steena
University of Tennessee, Knoxville, Tennessee, USAa; DePauw University, Greencastle, Indiana, USAb
There is no universally accepted method to quantify bacteria and archaea in seawater and marine sediments, and different meth-ods have produced conflicting results with the same samples. To identify best practices, we compiled data from 65 studies, plusour own measurements, in which bacteria and archaea were quantified with fluorescent in situ hybridization (FISH), catalyzedreporter deposition FISH (CARD-FISH), polyribonucleotide FISH, or quantitative PCR (qPCR). To estimate efficiency, we de-fined “yield” to be the sum of bacteria and archaea counted by these techniques divided by the total number of cells. In seawater,the yield was high (median, 71%) and was similar for FISH, CARD-FISH, and polyribonucleotide FISH. In sediments, only mea-surements by CARD-FISH in which archaeal cells were permeabilized with proteinase K showed high yields (median, 84%).Therefore, the majority of cells in both environments appear to be alive, since they contain intact ribosomes. In sediments, thesum of bacterial and archaeal 16S rRNA gene qPCR counts was not closely related to cell counts, even after accounting for varia-tions in copy numbers per genome. However, qPCR measurements were precise relative to other qPCR measurements made onthe same samples. qPCR is therefore a reliable relative quantification method. Inconsistent results for the relative abundance ofbacteria versus archaea in deep subsurface sediments were resolved by the removal of CARD-FISH measurements in which ly-sozyme was used to permeabilize archaeal cells and qPCR measurements which used ARCH516 as an archaeal primer or TaqManprobe. Data from best-practice methods showed that archaea and bacteria decreased as the depth in seawater and marine sedi-ments increased, although archaea decreased more slowly.
Marine sediments cover �75% of Earth’s surface and are esti-mated to contain 2.9 � 1029 microbial cells (1). The majority
of these cells bear little phylogenetic resemblance to cultured mi-croorganisms and are likely very energy limited (2). Despite theimportance of this vast subsurface biome to biogeochemical cyclesand our understanding of biological energy limitation, two basicquestions persist: (i) how do we accurately quantify cells from aparticular microbial group (e.g., bacteria versus archaea) in themethodologically challenging sediment matrix, and (ii) howmany of these individuals are alive?
Attempts to answer these questions have produced highly con-flicting results. In an unprecedented interlaboratory comparisonbeginning in 2001, sediments from Ocean Drilling Program Leg201 in the Peru Margin were subsampled and quantified in sepa-rate laboratories. As this was the first expedition to obtain verifi-ably uncontaminated samples, many research groups were eagerto work on the same samples. Some researchers reported an over-whelming dominance of bacteria over archaea, using catalyzedreporter deposition (CARD) fluorescent in situ hybridization(FISH) (3) and quantitative PCR (qPCR) (3–5). Other researchersused lipid measurements to conclude the existence of an over-whelming dominance of archaea over bacteria (6, 7). A third col-lection of data showed roughly equal numbers of bacteria andarchaea using FISH (6), CARD-FISH (8), and metagenomic se-quencing and qPCR (9). The explanation for these inconsistentresults must be either that some methods were less accurate or thatsome methods quantified dead as well as live biomass. It nowappears that detrital cell matter contributed to an overestimationof the archaea by lipid analyses (10, 11), so it is unlikely that ar-chaea completely dominate the Peru Margin sediments. Method-ological inaccuracies have been suggested to explain the qPCRdiscrepancies, since some TaqMan probes or PCR primers arebiased against common subsurface archaea (12). However, no
study has addressed the discrepancies between the results of FISHand CARD-FISH with the Peru Margin sediments or evaluated therelative accuracies of FISH, CARD-FISH, and qPCR with all ma-rine sediments and seawater.
In FISH and CARD-FISH, an oligonucleotide probe with ataxon-specific sequence binds directly to rRNA (13). For FISH,this probe is attached to a fluorophore, allowing probe-positivecells to be counted under a microscope. For CARD-FISH, theprobe is bound to a large horseradish peroxidase (HRP) enzyme,which catalyzes the deposition of many fluorescent tyramides, en-hancing the fluorescence intensity. HRP is far too large (�40 kDa)to diffuse freely into cells (14), so cells must first be permeabilizedby partially degrading their cell walls (15). In another variation,called polyribonucleotide FISH, nearly full-length ribosomal geneamplicons are transcribed to RNA with fluorescently tagged ribo-nucleotides (16). The resulting signals are very bright; however,the probe’s great length makes it difficult to trust the specificity ofbinding to the target population (17). In principle, each of theseFISH methods quantifies only viable cells by imaging intact cells
Received 25 June 2013 Accepted 1 October 2013
Published ahead of print 4 October 2013
Address correspondence to Karen G. Lloyd, [email protected].
* Present address: Megan K. May, Woods Hole Oceanographic Institution, WoodsHole, Massachusetts, USA.
This work is NSF Center for Dark Energy Biosphere Investigations contributionnumber 176.
Supplemental material for this article may be found at http://dx.doi.org/10.1128/AEM.02090-13.
Copyright © 2013, American Society for Microbiology. All Rights Reserved.
doi:10.1128/AEM.02090-13
7790 aem.asm.org Applied and Environmental Microbiology p. 7790 –7799 December 2013 Volume 79 Number 24
on May 6, 2016 by guest
http://aem.asm
.org/D
ownloaded from
instead of single molecules, such as DNA or lipids that may bederived from detrital cell debris, and by targeting rRNA, which ispresumed to be degraded rapidly after cell death (18). Measure-ments are biased against any microbial population whose rRNAsequence does not completely match the probe or, in the case ofCARD-FISH, whose cell wall is resistant to the permeabilizationprocedures.
In qPCR, total DNA must be extracted cleanly from marinesediments to minimize the amount of coextracted PCR inhibitorspresent. Primers for the 16S rRNA genes of specific microbial taxaare then used for PCR, while a fluorescence reader tracks the num-ber of amplicons with either a SYBR green double-stranded DNAfluorophore or an oligonucleotide probe containing a TaqManfluorescent molecule. If the DNA extraction and amplification areefficient, the samples are free of detrital DNA, and the primers andTaqMan probe match the expected target sequences, then qPCRmeasurements should be equal to total cell counts multiplied bythe number of copies of 16S rRNA genes in each genome. Whetherglobal qPCR counts are offset from cell counts by the averagegenomic 16S rRNA gene copy number has not been tested in ma-rine sediments.
The high sensitivity of CARD-FISH to cells with low activityand low ribosome content makes it especially noteworthy that fewCARD-FISH studies of deep subsurface sediments (�1 m belowthe seafloor [mbsf]) have found archaea in appreciable quantities(3, 19–22). If accurate, these results provide strong evidence thatthe amount of viable archaea in deep marine sediments is quanti-tatively negligible. If this is true, then the results of DNA and lipidanalyses suggesting that archaea are abundant most likely reflectfindings based on detrital archaeal cell remains.
However, to our knowledge, each study that argued for negli-gible populations of archaea in deep marine sediments (sedimentdepth, �1 m) on the basis of CARD-FISH used the enzyme ly-sozyme to permeabilize archaeal cell walls (3, 4, 19, 21, 22). Ly-sozyme hydrolyzes the �-1,4 glycosidic bond between N-acetyl-muramic acid and N-acetylglucosamine in the peptidoglycan ofGram-negative bacterial cell walls (23). Cell walls of cultured ar-chaea do not contain peptidoglycan. Instead, some archaea have apseudopeptidoglycan cell wall with a �-1,3 glycosidic bond that isnot hydrolyzed by lysozyme (24). Most archaeal cell walls are sur-rounded by a thick S layer of proteins. So, an effective method topermeabilize archaeal cell walls necessarily involves partial diges-tion of this protein layer. Proteinase K degrades a broad spectrumof proteins (25), making it a suitable candidate to permeabilizearchaeal cell walls. Other permeabilization procedures includethose involving Triton X-100, sodium dodecyl sulfate (SDS) pluslysozyme, and lysozyme plus achromopeptidase. Triton X-100and SDS are detergents that interact nonspecifically to disruptproteins. Achromopeptidase hydrolyzes bonds between N-acetyl-muramic acid and the D-amino acids linking adjacent peptidogly-can strands. Achromopeptidase was originally added to environ-mental CARD-FISH preparations to target Gram-positive bacteria(26); archaeal pseudopeptidoglycan’s interstrand L-amino acid pep-tide linkages are not its preferred substrate. Therefore, proteinaseK and, possibly, the detergents appear to be capable of permeabi-lizing the cell walls of cultured archaea, whereas lysozyme andachromopeptidase do not. In direct comparisons of the permea-bilization methods in the same samples, proteinase K producesbetter archaeal CARD-FISH signals than lysozyme in seawater(27) and in pure cultures of archaea (28). However, given that the
cell walls of subsurface archaea are largely uncharacterized, wecannot assume a priori that they cannot be permeabilized by ly-sozyme and achromopeptidase.
We hypothesized that the low CARD-FISH counts of archaealcells in deep subsurface sediments are an artifact of inefficientpermeabilization. We also hypothesized that FISH, CARD-FISH,qPCR, or all three methods provide accurate measurements ofviable cells in marine sediments and seawater. To test these hy-potheses, we compiled data from 65 published studies and ourown data from marine environments. Unfortunately, the accuracyof these methods for counting endogenous cell populations can-not be confidently tested on a known quantity of cells spiked intonatural samples because these cells may not match the diversity ofphysiological states, cell envelope structures, mineral associations,and/or biofilm presence that may occur in the natural commu-nity. Therefore, we define “yield” to be the sum of bacterial plusarchaeal cell counts obtained by FISH or CARD-FISH divided bythe total cell counts obtained using a nonspecific stain for DNA,such as acridine orange (AO), 4=,6-diamidino-2-phenylindole(DAPI), or SYBR green. Accurate quantification methods shouldbe associated with yields close to 1, unless the samples containlarge quantities of intact but non-ribosome-containing (nonvia-ble) cells. We tested whether the latter was likely to be true bydetermining whether yield was environment dependent. We thencompared the precision of cell count-based methodologies to thatof qPCR-based methodologies to suggest which ones might bemore useful in future efforts for absolute and relative quantifica-tions of bacteria and archaea in marine sediments. We did notinclude RNA slot blot, reverse transcription-qPCR (RT-qPCR), ormost probable number (MPN) quantifications in this study be-cause the first two measure total RNA, which is difficult to con-strain relative to cell counts, and the third depends on organismsbeing amenable to common culture methods, which is not oftenthe case in environmental samples.
MATERIALS AND METHODSData were compiled from published studies that included archaeal andbacterial domain-level quantifications in marine water and sedimentsmade with qPCR, FISH, or CARD-FISH (all references and data can befound in the text in the supplemental material and Tables S1 to S3 in thesupplemental material). No studies meeting these criteria were intention-ally excluded from our meta-analysis. For seawater, we included 19 stud-ies with 1,021 data points, and for sediments, we included 50 studies(including this study) with 773 data points; some studies had both seawa-ter and sediment data. A few studies reported only relative quantities ofbacteria and archaea, and so data from those studies were not used indeterminations of absolute quantities or yields. Most studies also had totalcell counts made with a general DNA stain, such as AO, DAPI, or SYBRgreen. In some cases, cell counts were not available from precisely thesame sediment depth as the qPCR, FISH, or CARD-FISH counts. Forthese, cell counts from nearby depths of �0.25 m away at depths under 1mbsf (5 data points), �1 m away at depths under 10 mbsf (34 data points),and �10 m away at deeper depths (147 data points) were used. Few stud-ies included qPCR measurements of total archaea and bacteria in marinewater, so qPCR was evaluated only with sediments. Where possible, datawere obtained via direct contact with the authors or digitally cuttingand pasting numbers from published tables; otherwise, data were ex-tracted by manually measuring data points from printed figures or byusing the freeware WebPlotDigitizer (version 2.5, 2012; http://arohatgi.info/WebPlotDigitizer). Studies where primary data were available fromthe authors were used to determine that data manually extracted fromfigures varied from primary data by �4%. For data newly reported here,
Evaluating Marine Quantitative Methods
December 2013 Volume 79 Number 24 aem.asm.org 7791
on May 6, 2016 by guest
http://aem.asm
.org/D
ownloaded from

samples were obtained from Station H in the White Oak River estuary inNorth Carolina on 2 October 2012, a site that has been previously char-acterized for geochemistry and microbiology (29). CARD-FISH was per-formed following the method of Teira et al. (27). All statistical tests wereperformed using the R package, version 3.0.0 (30). Plots were generatedusing the ggplot2 package (31). Our database is available as supplementalExcel files (see Table S2 in the supplemental material for seawater andTable S3 in the supplemental material for sediments), and an R package toreproduce all our analyses and plots is available from the authors.
RESULTS AND DISCUSSIONEvaluating bacterial and archaeal FISH and CARD-FISH yieldsrelative to total cell counts in seawater. In seawater, 99% of FISHand CARD-FISH measurements were within an order of magni-tude of total cell counts, and the median yield was 71% (interquar-tile range, 59 to 82%) (Fig. 1A). No methodological variation hada large effect size on yield; however, a few methods had small butstatistically significant effects (P � 0.001, analysis of variance[ANOVA]; see Fig. S1 and Table S4 in the supplemental material).Polyribonucleotide FISH improved the median yield by 12 per-centage points over the yields obtained by FISH and CARD-FISH.FISH and CARD-FISH median yields were statistically indistin-guishable from each other, but the CARD-FISH data were lessscattered. Automated counting resulted in slightly higher yields (4percentage points) and less scatter than manual counts. For ar-chaea, methods that used mixed polyribonucleotide probes hadslightly higher yields than methods that used mixed Euryarchaeotaand Crenarchaeota probes, and the yields by the latter methodswere slightly better than those achieved by methods that used theARCH915 probe alone. For bacteria, methods that used mixedpolyribonucleotide probes had slightly higher yields than meth-ods that used EUB338 I or EUB338 I to III; the yields obtained bymethods that used the last two probes were indistinguishable fromeach other. Polyribonucleotide probes span the length of the ribo-some, including universally conserved regions, which could causethem to bind to nontarget taxa. We cannot determine whether thehigh yields obtained by methods using these probes are due to
double counting of bacteria and archaea. Therefore, the bestprobes appear to be Euryarchaeota plus Crenarchaeota probes forarchaea and either EUB338 I or EUB338 I to III for bacteria. Nosignificant difference between AO and DAPI general DNA stainscould be seen. All studies used the same fixative (formaldehydederivatives), and all except two CARD-FISH studies permeabil-ized cell walls with lysozyme for bacteria and proteinase K forarchaea, so the effects of these methods could not be tested ro-bustly. Therefore, it appears that most of the cells in seawaterwhich can be counted with general stains are alive (contain ribo-somes). We found that the yields of the FISH and CARD-FISHmethods in common use are accurate relative to total cell countsand can be relied upon to enumerate bacteria and archaea in en-vironmental samples.
Evaluating bacterial and archaeal FISH and CARD-FISHyields relative to total cell counts in sediments. In contrast, FISHand CARD-FISH yields in marine sediments were highly variable,with median yields of 40% (interquartile range, 12 to 70%) (Fig.1B). It seems reasonable to expect that cell quantifications are lessprecise in marine sediments than in seawater. Large volumes ofseawater can be concentrated on a filter with little attending or-ganic matter or mineral grains to either hide cells (false negatives)or adsorb fluorophore (false positives). This allows very low nat-ural cell densities to be increased to a level high enough to countprecisely. In sediments, no such concentration is possible, sincefilters retain sediment grains, in addition to cells. Rather, cellsmust be diluted from natural concentrations to avoid the forma-tion of layers on the filter, or cells must be extracted from thesediment matrix in a method which has been used to obtain totalcell counts but not in FISH and CARD-FISH (32). Researchersworking in sediments must discern the difference between a truecell (small, smooth, well-defined, and highly fluorescent) and thebackground fluorescence of the sediment matrix (15). It is alsopossible that marine sediments have inherently lower yields thanseawater because more of the microbial community is intactenough for cell counts yet free of ribosomes because they are dead.
However, despite all these difficulties, a subset of sedimentstudies achieved yields as high as those from seawater. By focusingon yield (as opposed to absolute amounts), we controlled for var-ious absolute abundances of microorganisms in different environ-ments. These studies that obtained high yields used CARD-FISHwith the same permeabilization procedures that were used withseawater: lysozyme for bacteria and proteinase K for archaea (Fig.1, red points). All 9 sediment cores analyzed with this method hadmedian yields within or above the interquartile range of seawateryields (Fig. 2). When lysozyme or lysozyme and achromopepti-dase together were used to permeabilize archaea for CARD-FISH,yields were extremely low, as none of the 17 cores with archaeapermeabilized with lysozyme and only 2 out of 9 cores with ar-chaea permeabilized with lysozyme/achromopeptidase had me-dian yields within the interquartile range of the seawater yields(Fig. 2). CARD-FISH using detergents for archaeal permeabiliza-tion and FISH (which does not require a permeabilization step)produced variable yields relative to total cell counts (Fig. 2). Theeffects of the permeabilization procedure on CARD-FISH yieldswere significant (P � 0.001, ANOVA with rank-ordered yields),with the median yield obtained with proteinase K permeabiliza-tion being higher than the median yields obtained with lysozyme/achromopeptidase and detergent permeabilization, all of whichwere significantly higher than the median yield obtained with ly-
FIG 1 Yields for seawater (A) and sediments (B) obtained by FISH, CARD-FISH with proteinase K permeabilization for archaea, CARD-FISH with otherpermeabilization methods for archaea, and polyribonucleotide FISH. Thesolid line is the 1:1 line, and the numbers of data points in each method groupare listed in the corresponding color in each panel. In all CARD-FISH analyses,lysozyme was used to permeabilize bacteria.
Lloyd et al.
7792 aem.asm.org Applied and Environmental Microbiology
on May 6, 2016 by guest
http://aem.asm
.org/D
ownloaded from

sozyme permeabilization (Fig. 3A; see Table S5 in the supplemen-tal material). The 13 lowest-yielding sediment cores (medianyield, �6%) were all quantified with CARD-FISH using lysozymeto permeabilize archaea. Notably, all the Peru Margin cores wherearchaea were found to be quantitatively negligible (sites 1227,1229, and 1230) had yields of �13%. As with seawater, othermethodological variations had only small effects on yields, someof which were statistically significant (P � 0.001, ANOVA; see Fig.S2 and Table S4 in the supplemental material). Due to the over-whelming effects of archaeal permeabilization procedures on yield(Fig. 2 and 3), we considered only data from CARD-FISH meth-ods using proteinase K for archaeal permeabilization and all FISHdata in our comparisons of these other factors. SYBR green I- and(dichlorotriazinyl)aminofluorescein (DTAF)-stained cells hadyields 30 percentage points greater than the yield for DAPI-stainedcells, which had a yield 20 percentage points higher than that forAO-stained cells. This result agrees with reports that SYBR green Iprovides better cell counts due to low background staining (33).DTAF, on the other hand, may have led to a high rate of false-positive counts since DTAF stains polysaccharides rather thanDNA, a property that has been used to visualize nonliving extra-cellular polysaccharides in seawater (34). Due to DTAF’s low spec-
ificity, we do not recommend its use for cell counting. CARD-FISH improved on FISH yields by 40 percentage points, possiblydue to the sensitivity of CARD-FISH to cells with low ribosomecontents. No bacterial probe bias was detected (EUB338 I versusEUB338 I to III), and probe bias could not be assessed in archaeabecause all measurements were made with ARCH915.
We then tested whether low yields indicate the contribution ofintact dead, ribosome-free cells to total cell counts, rather thaninaccurate quantifications, by determining whether yield was re-lated to environmental factors that might predict the physiologicalstate of the organisms. Eleven of the 13 lowest-yielding sampleswere from the deep sea (�250-m water depth), and all 13 includedmeasurements from the deep subsurface (�1-m sediment depth).Here, cells are very energy limited (2), and sediments from theselocations may contain a higher proportion of dead cells than sed-iments from other locations. However, deep-sea sediments havehigh CARD-FISH yields when proteinase K is used; five deep-seasediment cores had yields that matched or surpassed seawateryields (25th percentile, 59%). Likewise, deep subsurface sedi-ments (Peru Margin sites 1227, 1228, and 1230, which had depthsup to 121 mbsf) had higher yields when FISH or CARD-FISHusing detergents to permeabilize archaeal cell walls rather than
FIG 2 Sediment FISH and CARD-FISH yield box plots colored by archaeal permeabilization method and ordered by the decreasing yield of each individualstudy. Black line, median seawater yield; blue shading, interquartile range (i.e., the range bounded by the 25th and 75th percentiles of the yields). Samples from�250-m water depths are labeled with “deep-sea” above the data. Numbers in the color ribbon at the top indicate the number of data points in each box plot, andnumbers in brackets after each core description correspond to the source citations in Table S1 in the supplemental material. Data from studies with only one datapoint and studies in intertidal environments (see Fig. S3 in the supplemental material) were excluded from the plot. HMMV, Haakon Mosby Mud Volcano.
Evaluating Marine Quantitative Methods
December 2013 Volume 79 Number 24 aem.asm.org 7793
on May 6, 2016 by guest
http://aem.asm
.org/D
ownloaded from

CARD-FISH using lysozyme to permeabilize archaeal cell wallswas used (Fig. 2). Another study also found archaeal cell countsto be well above the quantification limit, after permeabilizationwith hydrogen peroxide, at depths up to 300 mbsf in the Leg201 samples (35), although the measurements are not includedin Fig. 2 because they did not include bacterial or total cellcounts. Furthermore, the lysozyme method produced signifi-cantly lower yields than the proteinase K method even whensediments from only the upper meter were compared (Fig. 3B),suggesting that low yields in the deep subsurface are an artifactof a suboptimal methodology rather than a direct reflection ofthe metabolic state of cells.
FISH studies, on the other hand, had a wide range of yields,even though most studies used nearly identical FISH methods.Therefore, low FISH yields appear to be associated with less activecommunities since environmental factors do correlate with yield;all eight deep-sea samples had FISH yields below the median yieldrange of seawater (Fig. 2). This sensitivity of FISH to cell activitywas observed in a previous meta-analysis (36) and is consistentwith this method’s demonstrated low fluorescence in presumablylow-activity cells (15).
We then tested whether methods with systematically low yieldshad low ratios of archaea to bacteria, suggesting that a systematic
undercounting of archaea may have contributed to the low yield.Measurements obtained by CARD-FISH with proteinase K per-meabilization had significantly higher percentages of archaea thanCARD-FISH with the other permeabilization methods in the fulldata set (Fig. 3C) and in sediment depths restricted to less than ameter (Fig. 3D). As predicted by our hypothesis, lysozyme ar-chaeal permeabilization reported low archaeal fractions, evenwhen sediments from only the top meter were compared (Fig.3D). The single seawater study that used this method (37) also hadvery low archaeal fractions (�5%). Notable exceptions from thecorrelation between low yields and low ratios of archaea to bacte-ria were intertidal sediments from the Wadden Sea area in Ger-many and the New Jersey shelf in the United States (see Fig. S3 inthe supplemental material). These environments are character-ized by permeable sands and large tidal ranges, which frequentlyexpose the sediment surface to air. All 11 studies with samplesfrom these sites had relatively high (�37%) median yields, eventhough they did not measure archaea at all (4 studies) or quanti-fied archaea to be �5% of total cell counts (7 studies). No othersediment studies coupled high yields and low archaeal fractions,suggesting that for these environments and only these environ-ments, archaea are truly a minor component and are negligible intotal cell counts, as has been noted previously (15, 38). With the
FIG 3 Evaluation of effects of archaeal permeabilization method on CARD-FISH yield (A and B) and fraction of archaea (C and D) for all data (A and C) andsediments shallower than 1 m (B and D). Letters under the box plots indicate statistically indistinguishable groups, based on ANOVA on rank-ordered data withthe Tukey honestly significant difference post hoc analysis (P � 0.001), and the numbers of data points and individual studies are listed above each box plot (boxplot values are listed in Table S5 in the supplemental material). Colors and shadings match those in Fig. 2.
Lloyd et al.
7794 aem.asm.org Applied and Environmental Microbiology
on May 6, 2016 by guest
http://aem.asm
.org/D
ownloaded from
exception of these sandy intertidal zones, proper archaeal permea-bilization procedures appear to be necessary to achieve both highfractions of archaea and high yields.
Evaluating archaeal and bacterial qPCR measurements rela-tive to total cell counts. High CARD-FISH yields relative to totalcell counts do not necessarily mean that CARD-FISH is the mostaccurate method because CARD-FISH and total cell counts areboth based on the visual counting of cells in microscopic imagesand may therefore suffer from similar biases. Therefore, we com-pared the measurements obtained by cell counting methods to themeasurements obtained by qPCR, which is the only other com-monly used quantification method.
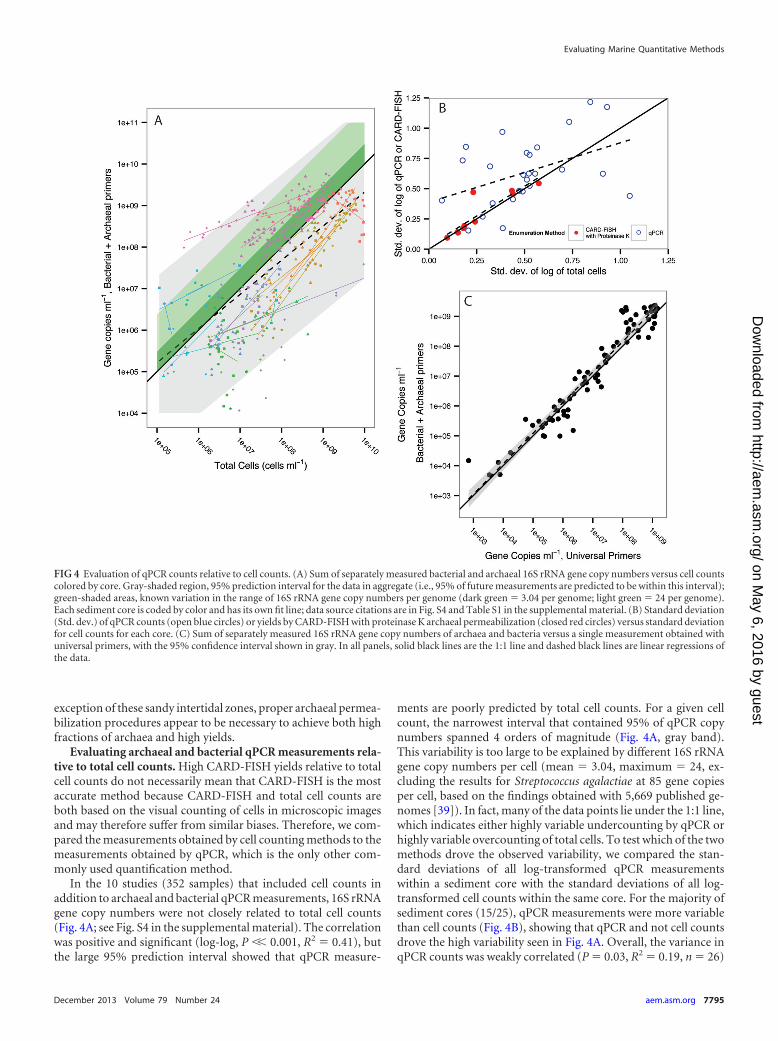
In the 10 studies (352 samples) that included cell counts inaddition to archaeal and bacterial qPCR measurements, 16S rRNAgene copy numbers were not closely related to total cell counts(Fig. 4A; see Fig. S4 in the supplemental material). The correlationwas positive and significant (log-log, P �� 0.001, R2 � 0.41), butthe large 95% prediction interval showed that qPCR measure-
ments are poorly predicted by total cell counts. For a given cellcount, the narrowest interval that contained 95% of qPCR copynumbers spanned 4 orders of magnitude (Fig. 4A, gray band).This variability is too large to be explained by different 16S rRNAgene copy numbers per cell (mean � 3.04, maximum � 24, ex-cluding the results for Streptococcus agalactiae at 85 gene copiesper cell, based on the findings obtained with 5,669 published ge-nomes [39]). In fact, many of the data points lie under the 1:1 line,which indicates either highly variable undercounting by qPCR orhighly variable overcounting of total cells. To test which of the twomethods drove the observed variability, we compared the stan-dard deviations of all log-transformed qPCR measurementswithin a sediment core with the standard deviations of all log-transformed cell counts within the same core. For the majority ofsediment cores (15/25), qPCR measurements were more variablethan cell counts (Fig. 4B), showing that qPCR and not cell countsdrove the high variability seen in Fig. 4A. Overall, the variance inqPCR counts was weakly correlated (P � 0.03, R2 � 0.19, n � 26)
FIG 4 Evaluation of qPCR counts relative to cell counts. (A) Sum of separately measured bacterial and archaeal 16S rRNA gene copy numbers versus cell countscolored by core. Gray-shaded region, 95% prediction interval for the data in aggregate (i.e., 95% of future measurements are predicted to be within this interval);green-shaded areas, known variation in the range of 16S rRNA gene copy numbers per genome (dark green � 3.04 per genome; light green � 24 per genome).Each sediment core is coded by color and has its own fit line; data source citations are in Fig. S4 and Table S1 in the supplemental material. (B) Standard deviation(Std. dev.) of qPCR counts (open blue circles) or yields by CARD-FISH with proteinase K archaeal permeabilization (closed red circles) versus standard deviationfor cell counts for each core. (C) Sum of separately measured 16S rRNA gene copy numbers of archaea and bacteria versus a single measurement obtained withuniversal primers, with the 95% confidence interval shown in gray. In all panels, solid black lines are the 1:1 line and dashed black lines are linear regressions ofthe data.
Evaluating Marine Quantitative Methods
December 2013 Volume 79 Number 24 aem.asm.org 7795
on May 6, 2016 by guest
http://aem.asm
.org/D
ownloaded from
to the variance in total cell counts from the same core. As a com-parison, the variance in CARD-FISH counts using proteinase K topermeabilize archaea was very closely related (P � 0.001, R2 �0.80, n � 10) to the variance in total cell counts with a fit line thatwas indistinguishable from a 1:1 line (slope � 0.98 � 0.18, inter-cept � 0.03 � 0.05; Fig. 4B).
This high variability of qPCR data is well within that expectedfrom the variability of DNA extraction yields. Two commonlyused kits, MoBio UltraClean and FastDNA Spin kits, had yields ofDNA retrieved from a known quantity of cells added to sedimentsof 15% � 16% and 28% � 11%, respectively (40). This means thatqPCR is not a reliable method to measure absolute quantities ofcells in marine sediments, most likely due to variable extractionyields. However, for a given extraction, qPCR of 16S rRNA isquantitative relative to that of other genes, since the sum of bac-terial and archaeal 16S rRNA gene copy numbers closely matchesthe 16S rRNA gene copy numbers obtained using a primer setuniversal for all prokaryotes (P � 0.001, R2 � 0.74, n � 80; Fig.4c). This suggests that, at least for these primers, measurements ofextracted DNA are precise, if not accurate. Previous work agreesthat although absolute quantities of qPCR measurements vary byextraction (35), relative values are repeatable across differentprimer sets (35) and cores (5, 29).
We did not systematically examine primer bias across all prim-ers because bias depends on how well a primer or TaqMan probematches the in situ microbial community, which varies greatlyacross ecosystems. Also, unlike with FISH and CARD-FISH, re-searchers utilized a wide range of qPCR primers and probes, mak-ing spurious correlations likely for each small data set. However,ARCH516, which was developed to target hydrothermal vent ar-chaea (41), has previously been suggested to be biased against thetype of archaea found in organic-rich marine sediments (12).Therefore, we tested whether this bias was borne out in the wholedata set. We found that using ARCH516 as a qPCR primer orprobe was associated with lower percentages of archaea (P �0.001, n � 430; see Fig. S5A and Table S6 in the supplementalmaterial). This bias was depth dependent; we found that the use ofARCH516 systematically resulted in low percentages of archaea atevery depth except for the top centimeter, in which all qPCR prim-ers/probes resulted in low archaeal fractions (see Fig. S5B andTable S6 in the supplemental material). An exception that sup-ports the conclusion that the use of ARCH516 is inadequate forarchaea in organic-rich sediments is that in the few studies ofoligotrophic sediments available, the use of ARCH516 resulted inmore archaea than bacteria (42, 43). This reflects the fact that theARCH516 sequence is a good match to archaeal sequences re-trieved from oligotrophic deep-sea sediments (84 out of 85 ar-chaeal sequences in the Silva 111NR database from the South Pa-cific Gyre contained perfect matches to the ARCH516 sequence).
Using best-practice methods to examine changes in abun-dance of archaea and bacteria with depth in marine environ-ments. We conclude that the best practice to determine the abso-lute densities of viable bacteria and archaea in marine sediments isCARD-FISH using lysozyme and proteinase K to permeabilizebacteria and archaea, respectively. For seawater, FISH measure-ments are also acceptable. The best practice for qPCR is to reportvalues relative to those for comeasured genes. For anoxic marinesediments, ARCH516 should be avoided, although other environ-ments will have different primer biases. These best-practice meth-ods provide initial answers to the two basic questions about bac-
teria and archaea in marine environments: what is theirabundance, and what fraction is viable?
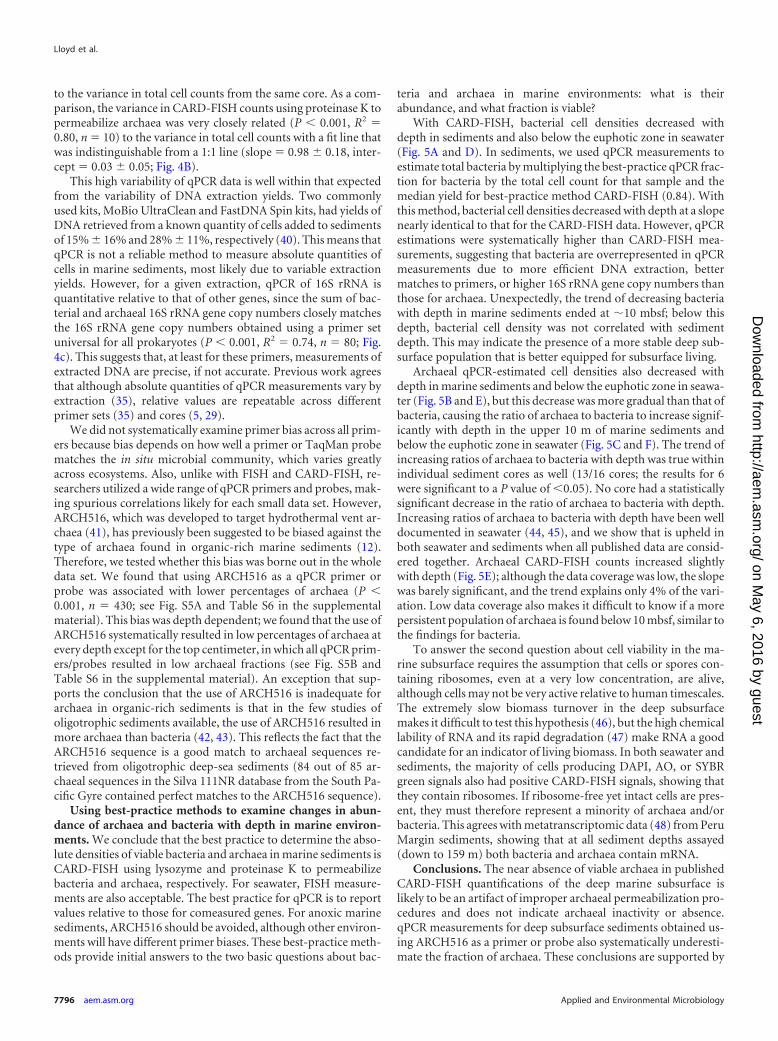
With CARD-FISH, bacterial cell densities decreased withdepth in sediments and also below the euphotic zone in seawater(Fig. 5A and D). In sediments, we used qPCR measurements toestimate total bacteria by multiplying the best-practice qPCR frac-tion for bacteria by the total cell count for that sample and themedian yield for best-practice method CARD-FISH (0.84). Withthis method, bacterial cell densities decreased with depth at a slopenearly identical to that for the CARD-FISH data. However, qPCRestimations were systematically higher than CARD-FISH mea-surements, suggesting that bacteria are overrepresented in qPCRmeasurements due to more efficient DNA extraction, bettermatches to primers, or higher 16S rRNA gene copy numbers thanthose for archaea. Unexpectedly, the trend of decreasing bacteriawith depth in marine sediments ended at �10 mbsf; below thisdepth, bacterial cell density was not correlated with sedimentdepth. This may indicate the presence of a more stable deep sub-surface population that is better equipped for subsurface living.
Archaeal qPCR-estimated cell densities also decreased withdepth in marine sediments and below the euphotic zone in seawa-ter (Fig. 5B and E), but this decrease was more gradual than that ofbacteria, causing the ratio of archaea to bacteria to increase signif-icantly with depth in the upper 10 m of marine sediments andbelow the euphotic zone in seawater (Fig. 5C and F). The trend ofincreasing ratios of archaea to bacteria with depth was true withinindividual sediment cores as well (13/16 cores; the results for 6were significant to a P value of �0.05). No core had a statisticallysignificant decrease in the ratio of archaea to bacteria with depth.Increasing ratios of archaea to bacteria with depth have been welldocumented in seawater (44, 45), and we show that is upheld inboth seawater and sediments when all published data are consid-ered together. Archaeal CARD-FISH counts increased slightlywith depth (Fig. 5E); although the data coverage was low, the slopewas barely significant, and the trend explains only 4% of the vari-ation. Low data coverage also makes it difficult to know if a morepersistent population of archaea is found below 10 mbsf, similar tothe findings for bacteria.
To answer the second question about cell viability in the ma-rine subsurface requires the assumption that cells or spores con-taining ribosomes, even at a very low concentration, are alive,although cells may not be very active relative to human timescales.The extremely slow biomass turnover in the deep subsurfacemakes it difficult to test this hypothesis (46), but the high chemicallability of RNA and its rapid degradation (47) make RNA a goodcandidate for an indicator of living biomass. In both seawater andsediments, the majority of cells producing DAPI, AO, or SYBRgreen signals also had positive CARD-FISH signals, showing thatthey contain ribosomes. If ribosome-free yet intact cells are pres-ent, they must therefore represent a minority of archaea and/orbacteria. This agrees with metatranscriptomic data (48) from PeruMargin sediments, showing that at all sediment depths assayed(down to 159 m) both bacteria and archaea contain mRNA.
Conclusions. The near absence of viable archaea in publishedCARD-FISH quantifications of the deep marine subsurface islikely to be an artifact of improper archaeal permeabilization pro-cedures and does not indicate archaeal inactivity or absence.qPCR measurements for deep subsurface sediments obtained us-ing ARCH516 as a primer or probe also systematically underesti-mate the fraction of archaea. These conclusions are supported by
Lloyd et al.
7796 aem.asm.org Applied and Environmental Microbiology
on May 6, 2016 by guest
http://aem.asm
.org/D
ownloaded from
the fact that lysozyme cannot hydrolyze the compounds in ar-chaeal cell walls (24) and the fact that the ARCH516 sequence is apoor match to the 16S rRNA gene sequences of most archaea inanoxic sediments (12). Despite the inherent difficulties of quanti-fying cells in sediment, it appears to be possible to reach the accu-racy of CARD-FISH yields of seawater if cells are permeabilizedusing lysozyme and proteinase K for bacteria and archaea, respec-tively. Although absolute qPCR quantifications are highly vari-able, likely due to the variability introduced during the DNA ex-traction step, this method provides accurate values relative toother qPCR measurements, as long as appropriate primers andprobes are employed. We propose that gene copy numbers pervolume of sample measured by qPCR should be reported onlyrelative to other qPCR-measured values for samples with similarextraction biases (i.e., the same sample or samples extractedalongside each other with the same methods). We predict that
CARD-FISH measurements made below 1 mbsf using best prac-tices will show that the abundance of bacteria and archaea aresimilar for the following reasons: archaeal abundance in the deepsubsurface (up to 120 mbsf) is supported by qPCR and FISH data,qPCR and CARD-FISH data are in good agreement where bacteriaand archaea co-occur, and qPCR and CARD-FISH show that thefraction of archaea increases with depth. These predictions are inline with the conclusions of previous qPCR-based studies (22, 49,50). Therefore, we propose a solution to the Peru Margin conflict:data from best-practice qPCR and CARD-FISH agree with datafrom lipid (11) and metagenome (9) analyses that both archaeaand bacteria are abundant, alive, and important in shaping theecology and biogeochemistry of the vast microbial subsurfacebiome.
When all data collected with best-practice methods are consid-ered, both bacteria and archaea decrease with depth below the
FIG 5 Results of best-practice quantification methods. (A to C) CARD-FISH and FISH quantifications of bacteria (A), archaea (B), and the fraction of archaearelative to the sum of bacteria and archaea (C) in seawater; (C to F) cell densities measured with CARD-FISH with proteinase K for archaeal permeabilization(red) or estimated from relative qPCR measurements and total cell counts (blue) for bacteria (D), archaea (E), and the fraction of archaea relative to the sum ofbacteria and archaea (F) in marine sediments. Dotted lines, linear regressions of data of the same color; gray shading, 95% confidence interval. Fit parameters,breakpoints, and statistical parameters are provided in Table S7 in the supplemental material.
Evaluating Marine Quantitative Methods
December 2013 Volume 79 Number 24 aem.asm.org 7797
on May 6, 2016 by guest
http://aem.asm
.org/D
ownloaded from

euphotic zone in seawater and in the upper 10 m of sediment,although the archaea increase relative to bacteria. In the presenceof dwindling carbon and energy substrates with depth, somethingin the nature of archaea may make them more resistant to decaythan bacteria in this energy-starved environment, as has been sug-gested previously (51). There is some evidence that unculturedarchaea degrade detrital proteins in marine sediments (52), a me-tabolism shown to confer resistance to Escherichia coli populationsundergoing energy starvation (53). Another option is that archaeamay have lower total mRNA concentrations per cell (48), suggest-ing that archaea tolerate starvation simply by functioning at alower metabolic rate. A third option is that subpopulations ofarchaea are able to find metabolically productive niches, eventhough the larger population is decaying. Interestingly, the majorcontrol of bacterial population size appears to shift at a sedimentdepth of about 10 m, suggesting that a subset of bacteria may beadapted to life in the deep subsurface. However, more data col-lected with best practices are required to determine whether that isalso true for archaea or for sediments in environments with ex-tremely small amounts of organic matter, such as the midoceangyres.
ACKNOWLEDGMENTS
We thank Jens Kallmeyer, David Kirchman, Catarina Magalháes, TakuroNunoura, and Axel Schippers for sending us their original published data;Laurie Schönholzer-Mauclaire, Patrick Meister, Tomaso Bontognali,Francisco Vazquez, Thorsten Kochling, and Irene Sanchez-Andrea forunearthing details on methods from previously published work; DanaDudle for comments on drafts of the manuscript; and Everett Shock for ahelpful suggestion about data presentation.
This study received small research grants from the NSF Center forDark Energy Biosphere Investigations (to K.G.L. and A.D.S.).
REFERENCES1. Kallmeyer J, Pockalny R, Adhikari RR, Smith DC, D’Hondt S. 2012.
Global distribution of microbial abundance and biomass in subseafloorsediment. Proc. Natl. Acad. Sci. U. S. A. 109:16213–16216.
2. Hoehler TM, Jørgensen BB. 2013. Microbial life under extreme energylimitation. Nat. Rev. Microbiol. 11:83–94.
3. Schippers A, Neretin LN, Kallmeyer J, Ferdelman TG, Cragg BA, ParkesRJ, Jørgensen BB. 2005. Prokaryotic cells of the deep sub-seafloor bio-sphere identified as living bacteria. Nature 61:861– 864.
4. Schippers A, Neretin LN. 2006. Quantification of microbial communitiesin near-surface and deeply buried marine sediments on the Peru conti-nental margin using real-time PCR. Environ. Microbiol. 8:1251–1260.
5. Inagaki F, Nunoura T, Nakagawa S, Teske A, Lever M, Lauer A, SuzukiM, Takai K, Delwiche M, Colwell FS, Nealson KH, Horikoshi K,D’Hondt S, Jørgensen BB. 2006. Biogeographical distribution and diver-sity of microbes in methane hydrate-bearing deep marine sediments onthe Pacific Ocean Margin. Proc. Natl. Acad. Sci. U. S. A. 103:2815–2820.
6. Biddle JF, Lipp JS, Lever MA, Lloyd KG, Sørensen KB, Anderson R,Fredricks HF, Elvert M, Kelly TJ, Schrag DP, Sogin ML, Brenchley JE,Teske A, House CH, Hinrichs K-U. 2006. Heterotrophic archaea dom-inate sedimentary subsurface ecosystems off Peru. Proc. Natl. Acad. Sci.U. S. A. 103:3846 –3851.
7. Lipp JS, Morono Y, Inagaki F, Hinrichs K. 2008. Significant contribu-tion of Archaea to extant biomass in marine subsurface sediments. Nature454:991–994.
8. Mauclaire L, Zepp K, Meister P, McKenzie J. 2004. Direct in situdetection of cells in deep-sea sediment cores from the Peru Margin (ODPLeg 201, Site 1229). Geobiology 2:217–223.
9. Biddle JF, Fitz-Gibbon ST, Schuster SC, Brenchley JE, House CH. 2008.Metagenomic signatures of the Peru Margin subseafloor biosphere show agenetically distinct environment. Proc. Natl. Acad. Sci. U. S. A. 105:10583–10588.
10. Schouten S, Middelburg JJ, Hopmans EC, Sinninghe Damsté JS. 2010.
Fossilization and degradation of intact polar lipids in deep subsurfacesediments: a theoretical approach. Geochim. Cosmochim. Acta 74:3806 –3814.
11. Xie S, Lipp JS, Wegener G, Ferdelman TG, Hinrichs K. 2013. Turnoverof microbial lipids in the deep biosphere and growth of benthic archaealpopulations. Proc. Natl. Acad. Sci. U. S. A. 110:6010 – 6014.
12. Teske A, Sørensen KB. 2008. Uncultured archaea in deep marine subsur-face sediments: have we caught them all? ISME J. 2:3–18.
13. Amann RI, Binder BJ, Olson RJ, Chisholm SW, Devereux R, Stahl DA.1990. Combination of 16S rRNA-targeted oligonucleotide probes withflow cytometry for analyzing mixed microbial populations. Appl. Envi-ron. Microbiol. 56:1919 –1925.
14. Braithwaite A. 1976. Unit cell dimensions of crystalline horseradish per-oxidase. J. Mol. Biol. 106:229 –230.
15. Pernthaler A, Pernthaler J, Amann R. 2002. Fluorescence in situ hybrid-ization and catalyzed reporter deposition for the identification of marinebacteria. Appl. Environ. Microbiol. 68:3094 –3101.
16. DeLong EF, Taylor LT, Marsh TL, Preston CM. 1999. Visualization andenumeration of marine planktonic archaea and bacteria by using polyri-bonucleotide probes and fluorescent in situ hybridization. Appl. Environ.Microbiol. 65:5554 –5563.
17. Pernthaler A, Preston CM, Pernthaler J, DeLong EF, Amann R. 2002.Comparison of fluorescently labeled oligonucleotide and polynucleotideprobes for the detection of pelagic marine bacteria and archaea. Appl.Environ. Microbiol. 68:661– 667.
18. Davis BD, Luger SM, Tai PC. 1986. Role of ribosome degradation in thedeath of starved Escherichia coli cells. J. Bacteriol. 166:439 – 445.
19. Siegert M, Krüger M, Teichert B, Wiedicke M, Schippers A. 2011.Anaerobic oxidation of methane at a marine methane seep in a forearcsediment basin off Sumatra, Indian Ocean. Front. Microbiol. 2:249. doi:10.3389/fmicb.2011.00249.
20. Breuker A, Köweker G, Blazejak A, Schippers A. 2011. The deep bio-sphere in terrestrial sediments in the Chesapeake Bay area, Virginia, USA.Front. Microbiol. 2:156. doi:10.3389/fmicb.2011.00156.
21. Schippers A, Kock D, Höft C, Köweker G, Siegert M. 2012. Quantifi-cation of microbial communities in subsurface marine sediments of theBlack Sea and off Namibia. Front. Microbiol. 3:16. doi:10.3389/fmicb.2012.00016v.
22. Webster G, Blazejak A, Cragg BA, Schippers A, Sass H, Rinna J, TangX, Mathes F, Ferdelman TG, Fry JC, Weightman AJ, Parkes RJ. 2009.Subsurface microbiology and biogeochemistry of a deep, cold-water car-bonate mound from the Porcupine Seabight (IODP Expedition 307). En-viron. Microbiol. 11:239 –257.
23. Visweswaran GRR, Dijkstra BW, Kok J. 2011. Murein and pseudo-murein cell wall binding domains of bacteria and archaea—a comparativeview. Appl. Microbiol. Biotechnol. 92:921–928.
24. Albers S-V, Meyer BH. 2011. The archaeal cell envelope. Nat. Rev. Mi-crobiol. 9:414 – 426.
25. Ebeling W, Hennrich N, Klockow M, Metz H, Orth HD, Lang H. 1974.Proteinase K from Tritirachium album Limber. Eur. J. Biochem. 47:91–97.
26. Sekar R, Pernthaler A, Pernthaler J, Posch T, Amann R, Warnecke F.2003. An improved protocol for quantification of freshwater actinobacte-ria by fluorescence in situ hybridization. Appl. Environ. Microbiol. 69:2928 –2935.
27. Teira E, Reinthaler T, Pernthaler A, Pernthaler J, Herndl GJ. 2004.Combining catalyzed reporter deposition-fluorescence in situ hybridiza-tion and microautoradiography to detect substrate utilization by bacteriaand archaea in the deep ocean. Appl. Environ. Microbiol. 70:4411– 4414.
28. Molari M, Manini E. 2012. Reliability of CARD-FISH procedure forenumeration of Archaea in deep-sea surficial sediments. Curr. Microbiol.64:242–250.
29. Lloyd KG, Alperin MJ, Teske A. 2011. Environmental evidence for netmethane production and oxidation in putative anaerobic methanotrophic(ANME) archaea. Environ. Microbiol. 13:2548 –2564.
30. R Core Team. 2013. R: a language and environment for statistical com-puting. R Foundation for Statistical Computing, Vienna, Austria.
31. Wickham H. 2009. ggplot2: elegant graphics for data analysis. Springer,New York, NY.
32. Kallmeyer J, Smith DC, Spivack AJ, Hondt SD. 2008. New cell extractionprocedure applied to deep subsurface sediments. Limnol. Oceanogr.Methods 6:236 –245.
33. Noble RT, Fuhrman JA. 1998. Use of SYBR green I for rapid epifluores-
Lloyd et al.
7798 aem.asm.org Applied and Environmental Microbiology
on May 6, 2016 by guest
http://aem.asm
.org/D
ownloaded from

cence counts of marine viruses and bacteria. Aquat. Microb. Ecol. 14:113–118.
34. Schumann R, Rentsch D. 1998. Staining particulate organic matter withDTAF—a fluorescence dye for carbohydrates and protein: a new approachand application of a 2D image analysis system. Mar. Ecol. Prog. Ser. 163:77– 88.
35. Kubo K, Lloyd KG, Biddle J, Amann R, Teske A, Knittel K. 2012.Archaea of the miscellaneous crenarchaeotal group are abundant, diverseand widespread in marine sediments. ISME J. 6:1949 –1965.
36. Bouvier T, Del Giorgio PA. 2003. Factors influencing the detection ofbacterial cells using fluorescence in situ hybridization (FISH): a quantita-tive review of published reports. FEMS Microbiol. Ecol. 44:3–15.
37. Garneau M-È, Vincent WF, Terrado R, Lovejoy C. 2009. Importance ofparticle-associated bacterial heterotrophy in a coastal Arctic ecosystem. J.Mar. Syst. 75:185–197.
38. Ishii K, Mussmann M, MacGregor BJ, Amann R. 2004. An improvedfluorescence in situ hybridization protocol for the identification of bacte-ria and archaea in marine sediments. FEMS Microbiol. Ecol. 50:203–213.
39. Markowitz VM, Korzeniewski F, Palaniappan K, Szeto E, Werner G,Padki A. 2006. The integrated microbial genomes (IMG) system. NucleicAcids Res. 34:D344 –D348.
40. Mumy KL, Findlay RH. 2004. Convenient determination of DNA extrac-tion efficiency using an external DNA recovery standard and quantitative-competitive PCR. J. Microbiol. Methods 57:259 –268.
41. Takai K, Horikoshi K. 2000. Rapid detection and quantification of mem-bers of the archaeal community by quantitative PCR using fluorogenicprobes. Appl. Environ. Microbiol. 66:5066 –5072.
42. Breuker A, Stadler S, Schippers A. 2013. Microbial community analysisof deeply buried marine sediments of the New Jersey shallow shelf (IODPExpedition 313). FEMS Microbiol. Ecol. 85:578 –592.
43. Breuker A, Schippers A. 2013. Data report: total cell counts and qPCR
abundance of Archaea and Bacteria in shallow subsurface marine sedi-ments of North Pond: gravity cores collected during site survey cruiseprior to IODP Expedition 336. Proc. Integr. Ocean Drill. Progr. 336:1–7.
44. Karner MB, DeLong EF, Karl DM. 2001. Archaeal dominance in themesopelagic zone of the Pacific Ocean. Nature 409:507–510.
45. Kirchman DL, Elifantz H, Dittel AI, Malmstrom RR, Cottrell MT. 2007.Standing stocks and activity of Archaea and Bacteria in the western ArcticOcean. Limnol. Oceanogr. 52:495–507.
46. Lomstein BA, Langerhuus AT, D’Hondt S, Jørgensen BB, Spivack AJ.2012. Endospore abundance, microbial growth and necromass turnoverin deep sub-seafloor sediment. Nature 18:101–104.
47. Srivastava AK, Schlessinger D. 1990. Mechanism and regulation of bac-terial ribosomal RNA processing. Annu. Rev. Microbiol. 44:105–129.
48. Orsi WD, Edgcomb VP, Christman GD, Biddle JF. 2013. Gene expres-sion in the deep biosphere. Nature 499:205–208.
49. Schippers A, Köweker G, Höft C, Teichert BMA. 2010. Quantification ofmicrobial communities in forearc sediment basins off Sumatra. Geomi-crobiol. J. 27:170 –182.
50. Engelen B, Ziegelmüller K, Wolf L, Köpke B, Gittel A, Cypionka H,Treude T, Nakagawa S, Inagaki F, Lever MA, Steinsbu BO. 2008. Fluidsfrom the oceanic crust support microbial activities within the deep bio-sphere. Geomicrobiol. J. 25:56 – 66.
51. Valentine DL. 2007. Adaptations to energy stress dictate the ecology andevolution of the Archaea. Nat. Rev. Microbiol. 5:316 –323.
52. Lloyd KG, Schreiber L, Petersen DG, Kjeldsen KU, Lever MA, SteenAD, Stepanauskas R, Richter M, Kleindienst S, Lenk S, Schramm A,Jørgensen BB. 2013. Predominant archaea in marine sediments degradedetrital proteins. Nature 496:215–218.
53. Zinser ER, Kolter R. 1999. Mutations enhancing amino acid catabolismconfer a growth advantage in stationary phase. J. Bacteriol. 181:5800 –5807.
Evaluating Marine Quantitative Methods
December 2013 Volume 79 Number 24 aem.asm.org 7799
on May 6, 2016 by guest
http://aem.asm
.org/D
ownloaded from