
MELCOR Aerosol Transport Module Modification for NSSR-1
76
Idaho National Engineering Laboratory INEL-96/0081 ITEWUS96/TE/SA-03 Published March 1996 . MELCOR Aerosol I Transport Module Modification for NSSR-1 B. J. Merrill D. L. Hagrman
-
Upload
khangminh22 -
Category
Documents
-
view
1 -
download
0
Transcript of MELCOR Aerosol Transport Module Modification for NSSR-1
Idaho National
Engineering Laboratory
INEL-96/0081 ITEWUS96/TE/SA-03
Published March 1996
. MELCOR Aerosol I Transport Module Modification for NSSR-1
B. J. Merrill D. L. Hagrman

c
INEL96/0081 ITER/US96/TE/SA-03
.
MELCOR Aerosol Transport Module Modification for NSSR-1
€3. J. Merrill D. L. Hagrrnan
Published March 1996
Idaho National Engineering Laboratory Lockheed Idaho Technologies Company
Idaho Falls, Idaho 83415
.
Prepared for the U.S. Department of Energy
Office of Fusion Energy Under DOE Idaho Operations Office
Contract DE-AC07-94ID 13223

ABSTRACT
.
This report describes modifications of the MELCOR computer code aerosol transport module that will increase the accuracy of calculations for safety analysis of the International Thermonuclear Experimental Reactor (ITER). The modifications generalize aerosol deposition models to consider gases other than air, add specialized models for aerosol deposition during high speed gas flows in ducts, and add models for resuspension of aerosols that are entrained in coolants when these coolants flash. Particular attention has been paid to the adhesion of aerosol particles once they are transported to duct walls. The results of calculations with the modified models have been successfully compared to data from Light Water Reactor Aerosol Containment Experiments (LACE) conducted by an international consortium at Hanford, Washington.
DISCLAIMER
This report was prepared as an account of work sponsored by an agency of the United States Government. Neither the United States Government nor any agency thereof, nor any of their employees, makes any warranty, express or implied, or assumes any legal liability or responsi- bility for the accuracy, completeness, or usefulness of any information, apparatus, product, or process disclosed, or represents that its use would not infringe privately owned rights. Refer- ence herein to any specific commercial product, process, or service by trade name, trademark, manufacturer, or otherwise does not necessarily constitute or imply its endorsement, recom- mendation, or favoring by the United States Government or any agency thereof. The views and opinions of authors expressed herein do not necessarily state or reflect those of the United States Government or any agency thereof.
ii

.
EXECUTIVE SUMMARY
The potential for transport of activated material as aerosols is a consideration in the safety analysis for the International Thermonuclear Experimental Reactor (ITER). In order to support the analysis, a number of modifications to the MELCOR computer code aerosol transport module have been completed. The modifications generalize aerosol deposition models to consider gases other than air, add specialized models for aerosol deposition during high speed gas flows in ducts, and add models for resuspension of aerosols that are entrained in coolants when these coolants flash. Particular attention has been paid to the adhesion of aerosol particles once they are transported to duct walls.
We have benchmarked these modifications against data from experiments conducted by the Electric Power Research Institute (EPRI) designated as large-scale light water reactor (LWR) aerosol containment experiments (LACE) and found excellent agreement. For high speed flows in pipes, our model predicts that '3% of the aerosol mass entering the LACE test pipe remains on the pipe walls in comparison with a measured value for LACE test CB3 of 1%. When we extend our surface adhesion model to include gravitational settling, the predicted pipe aerosol mass retention drops to 1.2%. If the deposited aerosol films are highly viscous, as was the case for LACE test LA1, our model predicts that 98.4% of the aerosol mass entering the LACE test pipe will remain on the pipe wall. The measured aerosol mass retention was reported as greater than 98%. We have found good agreement between our model and the data from the LACE containment depressurization test, LA5. MELCOR predicted pressures and temperatures that are within 6% of those measured by this test. In addition, the peak concentration of aerosol re-suspended as a result of pool flashing was predicted to reach 0.58 mg/m3 compared to a measured value of 0.48 mg/m3.
However, even given the success of this benchmarking exercise, there are still some unanswered issues with respect to our modified MELCOR aerosol transport module. These issues primarily center around aerosol chemical characteristics and carrier gas conditions of the LACE experiments being different than those expected in ITER, and the accuracy of some of the LACE measurements. As a consequence, we suggest that additional aerosol transport tests be performed to obtain data more characteristic of ITER accident conditions, and to improve the confidence level we have in our aerosol transport module.
iii

ACKNOWLEDGMENTS
The authors gratefully acknowledge Dr. Hans-Werner Bartels, who is in charge of the system level thermal-chemical Code 3 task for his support for this work. Also, we wish to thank Frank Rahn of the Electric Power Research Institute (EPRI) for providing documents about the light water reactor (LWR) aerosol containment (LACE) experiments.
The authors wish to thank their colleagues, most notably Dave Petti, and Kathy McCarthy, for their comments and critiques of this report.
iv

CONTENTS
.. ABSTRACT ..................................................... 11
EXECUTIVE SUMMARY .......................................... iii
ACKNOWLEDGMENTS ........................................... iv
1 . INTRODUCTION ............................................... 1
2 . IMPROVEMENTS TO MELCOR AEROSOL DEPOSITION COEFFICIENTS ............................................. 2
3 . NEW AEROSOL DEPOSITION MODELS ............................ 4 3.1 Turbulence Deposition Model ................................ 4 3.2 Pipe Bend Inertial Deposition Model ........................... 8 3.3 Surface Adhesion Model .................................... 9
4 . LIQUID ENTRAINED AEROSOL RE-SUSPENSION MODEL ........... 13
5 . COMPARISON OF AEROSOL DEPOSITION MODELS TO LACE DATA . 5.1 LACE Containment Bypass Tests ............................. 5.2 MELCOR Results for LACE Containment Bypass Tests ............ 5.3 LACE Containment De-pressurization Tests ..................... 5.4 MELCOR Results for LACE Containment De-pressurization Tests . . . .
18 18 21 22 23
6 . CONCLUSIONS ............................................... 25
7 . REFERENCES ................................................ 26
Appendix A . Estimate of Properties of Materials in LACE Tests . . . . . . . . . . . . A1 A.1 Particle Composition ..................................... A3 A.2 Condensed Phase Densities ................................ A7 A 3 Surface Tension of Condensates ............................ A8 A.4 Viscosities of Condensates ................................. A8 A S Appendix A References ................................. A l l
Appendix B . Listing of FORTRAN Coding for Modifications of MELCOR ..... B1
V

1. INTRODUCTION
We have completed modifications to the MELCOR code* aerosol transport module that will increase the accuracy of this module for International Thermonuclear Experimental Reactor (ITER) safety analyses of accidents like loss-of-cooling accidents (LOCAs) into the vacuum vessel. These accidents will re-suspend material eroded from the first wall and divertor, and corrosion products in ITER'S heat transport system (HTS) coolant. The modifications described in this engineering design file (EDF) document address aerosol deposition in gases other than air, turbulence and inertial aerosol deposition for high speed flows in ducts, and re-suspension of aerosols that are entrained in coolants when these coolants flash. Most of these modifications were proposed in an assessment of the MELCOR code performed in 1994; and undertaken in 1995 after revising ITER Joint Central Team (JCT) Task Agreement S 81 TT 03 95- 02028 FU, subtask 2, entitled: System Level Transient Thermal-Chemical Codes. These revisions were made because of changes in research and development (R&D) priorities prompted by results from the Early Safety and Environmental Characterization Study (ESECS) . In the following section of this EDF, we address the changes that were made to the aerosol module of the MELCOR code to account for carrier gases that are not air. Section 3 presents the theory for two new aerosol deposition models that were added to the MELCOR code. These models predict the aerosol deposition rates produced by momentum gained by an aerosol particle from turbulence in a carrier gas and by centrifugal forces produced when the carrier gas flows around a pipe bend. Section 4 of this EDF describes a model that has been developed for the MELCOR code that re- suspends aerosols entrained in a liquid coolant back into the atmosphere when this liquid flashes to a vapor. In Section 5, we describe a series of test that were conducted by the Electric Power Research Institute (EPRI) designated as large-scale light water reactor (LWR) aerosol containment experiments (LACE). These tests examined the transport of aerosols typical of LwRs through pipes with high speed flow and in containment volumes during rapid de-pressurization. We also present in Section 5 a comparison between data from these tests and our new MELCOR aerosol transport module. Finally, Section 6 contains conclusions drawn from this model development task.
1
2. IMPROVEMENTS TO MELCOR AEROSOL DEPOSITION COEFFICIENTS
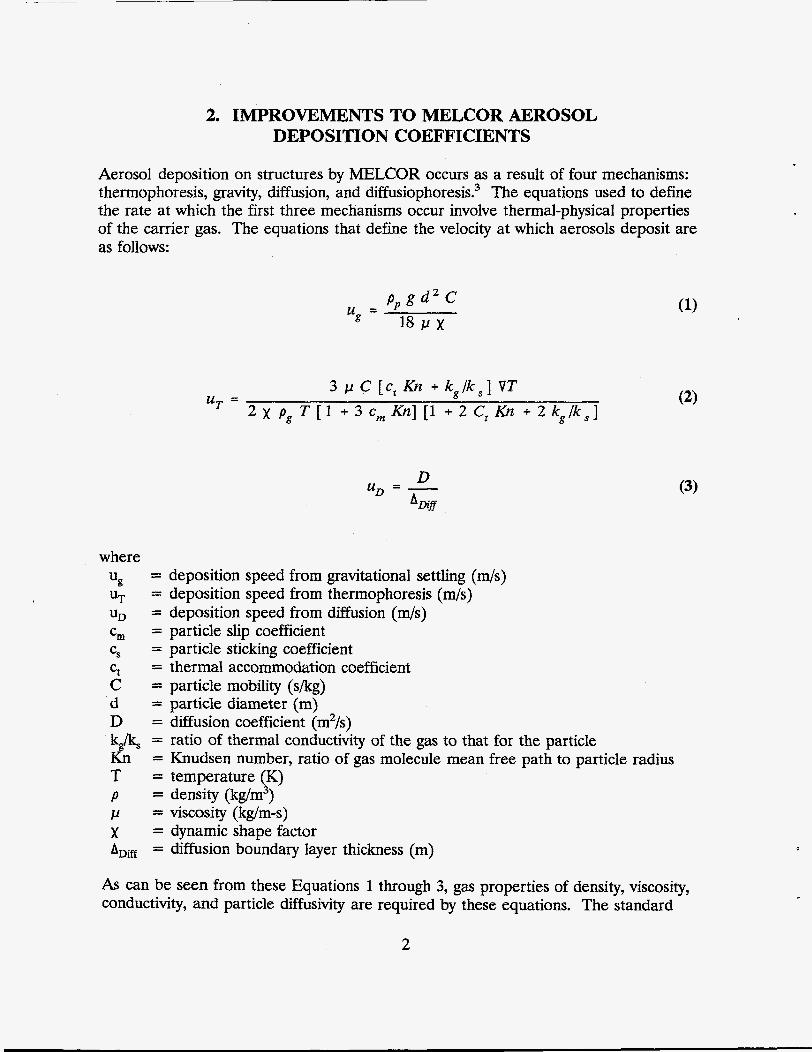
Aerosol deposition on structures by MELCOR occurs as a result of four mechanisms: thermophoresis, gravity, diffusion, and diffusiophoresis? The equations used to define the rate at which the first three mechanisms occur involve thermal-physical properties of the carrier gas. The equations that define the velocity at which aerosols deposit are as follows:
where % UT UD cin cs ct C d D
T P Lc X *,iff
3 I-( C [ct Kn + k , / k , ] VT 2 X P g T [ 1 +3cmKiz][1 + 2 C , K n + 2 k g / k , ]
UT =
D u* = - & , i f f
= deposition speed from gravitational settling (m/s) = deposition speed from thermophoresis (m/s) = deposition speed from diffusion (m/s) = particle slip coefficient = particle sticking coefficient = thermal accommodation coefficient = particle mobility (s/kg) = particle diameter (m) = diffusion coefficient (m2/s) = ratio of thermal conductivity of the gas to that for the particle = Knudsen number, ratio of gas molecule mean free path to particle radius = temperature (K) = density (kg/m3) = viscosity (kg/m-s) = dynamic shape factor = diffusion boundary layer thickness (m)
As can be seen from these Equations 1 through 3, gas properties of density, viscosity, conductivity, and particle diffusivity are required by these equations. The standard
2
MELCOR model assumes that the carrier gas is air. In addition, these deposition velocities are calculated once at the start of a MELCOR calculation for four sets of pressure and temperature values. These four sets are used with linear interpolation techniques to rapidly evaluate the velocities as a function of time during the MELCOR calculation. This approach, while very time efficient, would not be accurate for gases other than air. We have modified MELCOR to calculate these aerosol deposition coefficients by using the time-dependent properties of the gas that actually exits during a given calculation, for example steam, hydrogen, air, helium, etc. or mixtures thereof. The Fortran coding for the required modifications to the MELCOR code are contained in Appendix B.
Comparison of calculation results before and after this revision shows excellent agreement near the temperatures, pressures, and composition (air) used as a basis for the standard MELCOR deposition model. For points away from the basis points, ten to twenty percent differences were found for all aerosol deposition mechanisms in air except thermophoresis. The thermophoresis deposition rates differed by as much as 80%. Of course, gases like hydrogen which have viscosities and densities greatly different than air would have correspondingly larger differences. From this we conclude that the deposition processes other than thermophoresis are approximately linear.
3
3. NEW AEROSOL DEPOSITION MODELS
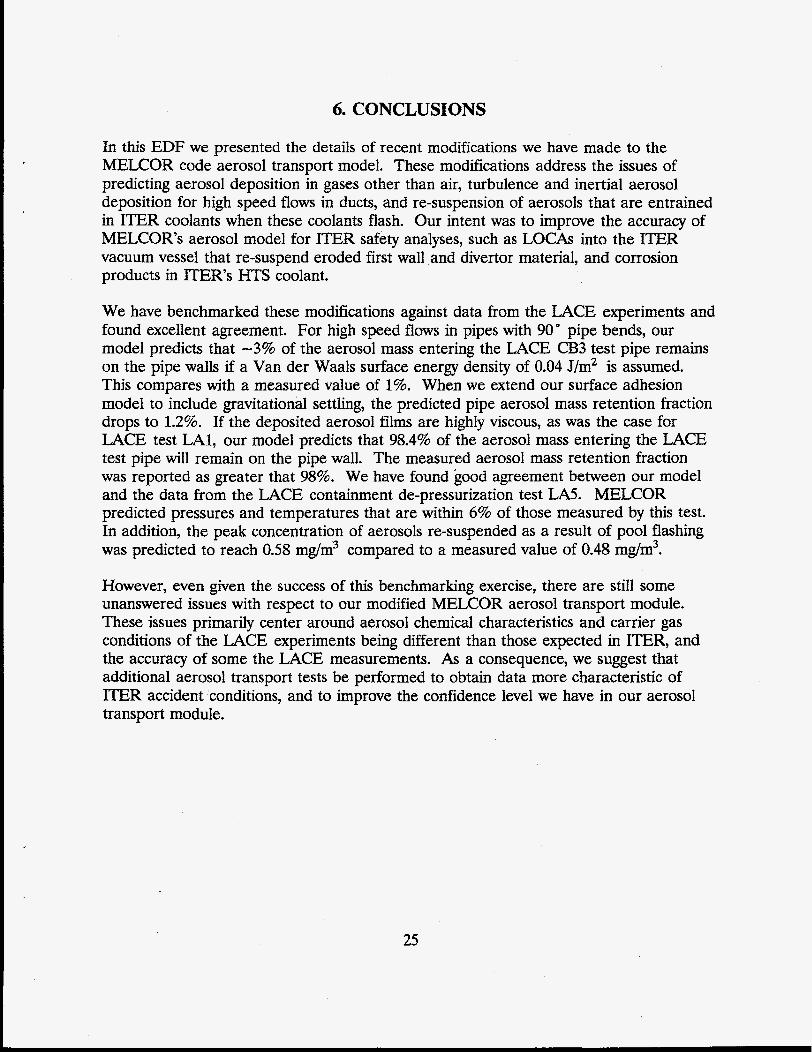
Two new aerosol deposition models have been added to the MELCOR code. These models address the particle deposition mechanisms produced by fluid turbulence in pipes and particle centrifugal forces in pipe bends. These deposition mechanisms are shown schematically in Figure 1. In the case of turbulent deposition (Figure la), a particle suspended in a fluid flowing in a pipe obtains momentum from the fluid in both the parallel and perpendicular direction to flow. The perpendicular momentum is gained from fluid turbulence. Since the particle density is larger than the fluid density, this momentum will allow the particle to penetrate the buffer layer and viscous sublayer of turbulent flow that are adjacent to the pipe surface and to impact this same surface. When a fluid flows around a pipe bend, particles that are suspended in this fluid experience a centrifugal force that radially accelerates these particles, causing them to impact the pipe wall (Figure lb). This process is called inertial deposition. However, even in the event of surface impact produced by either deposition mechanism, surface forces must be large enough to overcome the momentum associated with these particles if these particles are to adhere permanently to this surface. In the following three subsections, we present models for turbulence deposition, inertial deposition, and surface adhesion. The Fortran coding for the required modifications to the MELCOR code are contained in Appendix B.
3.1 Turbulence Deposition Model
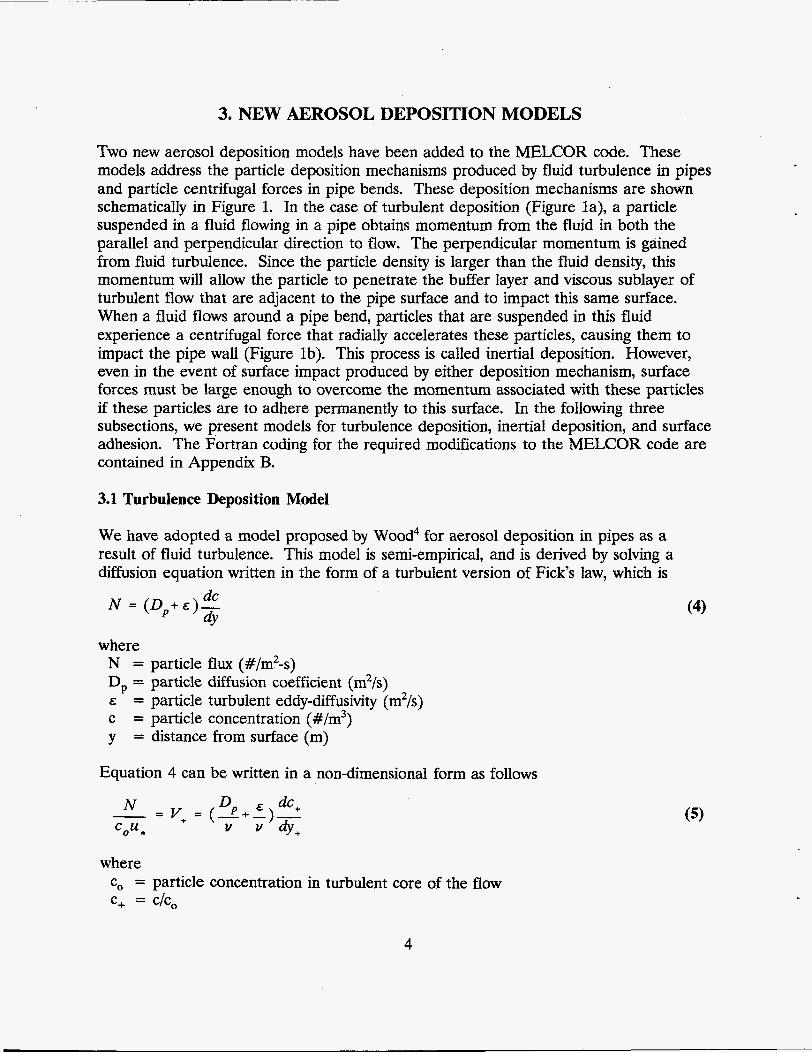
We have adopted a model proposed by Wood4 for aerosol deposition in pipes as a result of fluid turbulence. This model is semi-empirical, and is derived by solving a diffusion equation written in the form of a turbulent version of Fick’s law, which is
dc N = (DP+€)- dY
where N = particle flux (#/m2-s) D, = particle diffusion coefficient (m2/s) E = particle turbulent eddy-diffusivity (m”/s) c = particle concentration (#/m3) y = distance from surface (m)
Equation 4 can be written in a non-dimensional form as follows
where c, = particle concentration in turbulent core of the flow c+ = c/c*
4
(4)
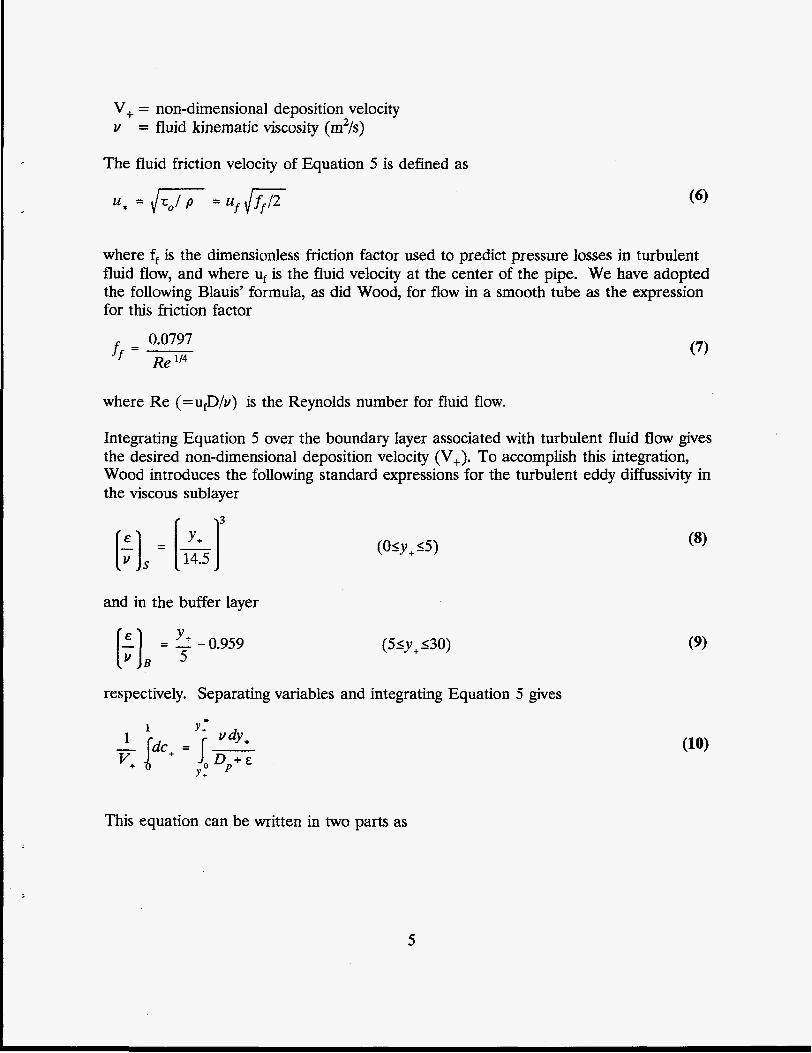
V, = non-dimensional deposition velocity Y = fluid kinematic viscosity (m2/s)
The fluid friction velocity of Equation 5 is defined as
where ff is the dimensionless friction factor used to predict pressure losses in turbulent fluid flow, and where uf is the fluid velocity at the center of the pipe. We have adopted the following Blauis' formula, as did Wood, for flow in a smooth tube as the expression for this friction factor
0.0797 Re lI4
ff = - (7)
where Re (=ufD/v) is the Reynolds number for fluid flow.
Integrating Equation 5 over the boundary layer associated with turbulent fluid flow gives the desired non-dimensional deposition velocity (V,). To accomplish this integration, Wood introduces the following standard expressions for the turbulent eddy diffussivity in the viscous sublayer
3 [:Is = [&] (Osy, 15)
and in the buffer layer [:IB = Y + -0.959 (51y+ 130)
respectively. Separating variables and integrating Equation 5 gives
1 Y + 1 VdY+
v+ 0 - JdC+ = lp
Y ,
This equation can be written in two parts as
5
(9)
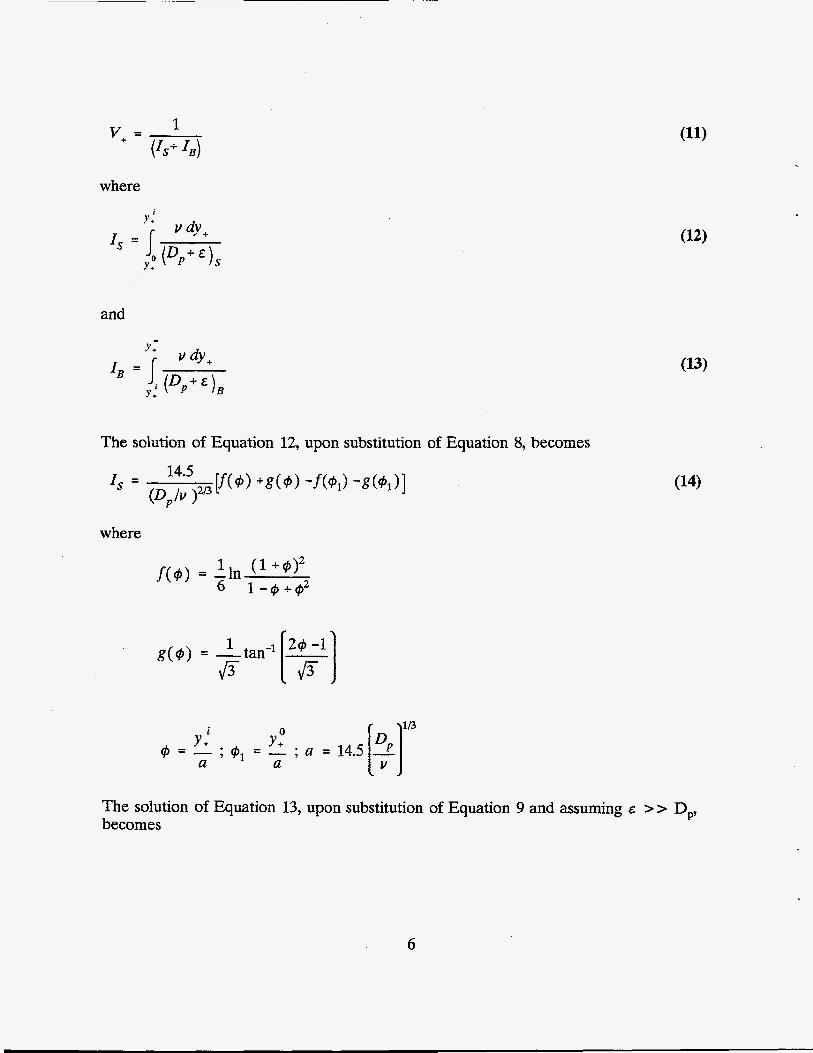
1 v+ = (I,+ 43)
where
and
The solution of Equation 12, upon substitution of Equation 8, becomes
where
li3 i 0 @ = Y + - ; = - Y + ; a = 14.5[~]
a a
The solution of Equation 13, upon substitution of Equation 9 and assuming E >> D,, becomes
6

Wood defines the lower limit of integration for Equation 13 as 0 Y + = s+ 4- b+
which equals the sum of the non-dimensional particle stopping distance and the non- dimensional effective surface roughness. This implies that a particle must diffuse though the buffer layer, and possibly partially though the viscous sublayer, to a height above the pipe surface from which the particle's perpendicular momentum will allow the particle to reach the pipe surface. The upper limit of integration for Equation 12 equals 5, which also equals the lower limit for Equation 13 (Y+~). However, when yiObecomes greater than 5, 4 equals zero, and the lower limit of integration for 1, becomes y+O. The upper limit of integration for 1, (y,")is taken as equal to 30.
The non-dimensional perpendicular stopping distance of Equation 16 is defined as
where the non-dimensional particle relaxation time equals
This particle relaxation time is a measure of the time required by a particle to reach its terminal velocity when a force is applied to it. The perpendicular particle velocity of Equation 17 is that velocity gained from turbulent eddy motion and is defined as
uL = A u *
The coefficient A of this equation was found by Wood to be 0.69 by matching aerosol deposition data for a hydraulically smooth tube (Le. b+equal to zero). For roughened tubes, Wood uses the following expression for the non-dimensional surface roughness
u* b+ = 0.45 e - V
where "e" is the surface roughness height (m).
Wood proposes Equation 11 for calculating the non-dimensional particle deposition
7
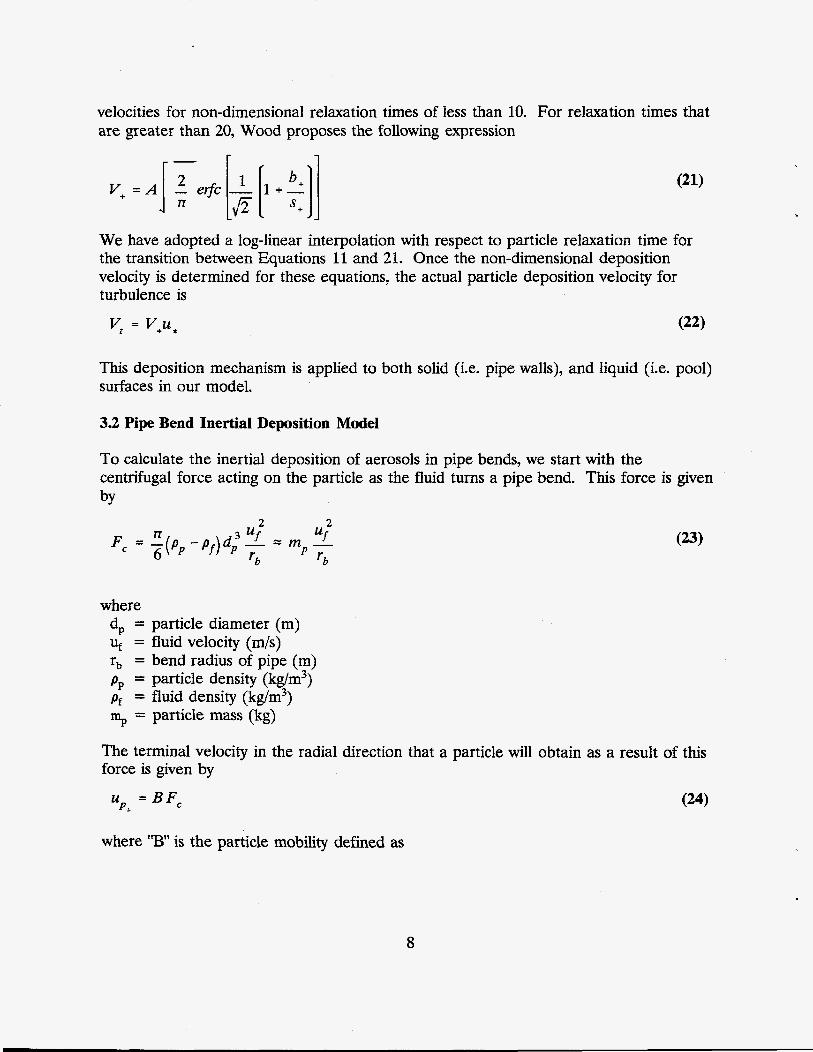
velocities for non-dimensional relaxation times of less than 10. For relaxation times that are greater than 20, Wood proposes the following expression
We have adopted a log-linear interpolation with respect to particle relaxation time for the transition between Equations 11 and 21. Once the non-dimensional deposition velocity is determined for these equations, the actual particle deposition velocity for turbulence is
vt = v+u*
This deposition mechanism is applied to both solid (i.e. pipe walls), and liquid (Le. pool) surfaces in our model.
3.2 Pipe Bend Inertial Deposition Model
To calculate the inertial deposition of aerosols in pipe bends, we start with the centrifugal force acting on the particle as the fluid turns a pipe bend. This force is given bY
2 2 3
' 6 ' 6
where d, = particle diameter (m) uf = fluid velocity (m/s) rb = bend radius of pipe (m) p , = particle density (kg/m3) pr = fluid density (kg/m3) n+, = particle mass (kg)
The terminal velocity in the radial direction that a particle will obtain as a result of this force is given by
u = B F , P A
where "B" is the particle mobility defined as
8

1
where p , is the carrier gas viscosity. The time that it will take for a particle to travel around a bend is given by
'b @b tb = - uf
where "0;' is the pipe turning angle in radians. Consequently, the radial distance a particle will drift during in this turn is the product of bend travel time and the particle radial velocity, which becomes
s = QbBmpuf
when Equation 23 is used to express the centrifugal force. By assuming a well mixed particle concentration in the pipe (e,), the fraction of particles that will collide with the wall in the bend is approximately the radial drift distance divided by the pipe diameter (Le. s/D). The particle flwr (#/m2-s) for inertial deposition based on this collided fraction, when averaged over the pipe surface area, can be expressed as
where D = pipe diameter (m) Ac = pipe cross-sectional area (m2) A, = pipe surface area (m2>
The deposition velocity associated with this particle flux is as follows
ri vi = - CO
This deposition mechanism applies only to solid surfaces in our model.
3 3 Surface Adhesion Model
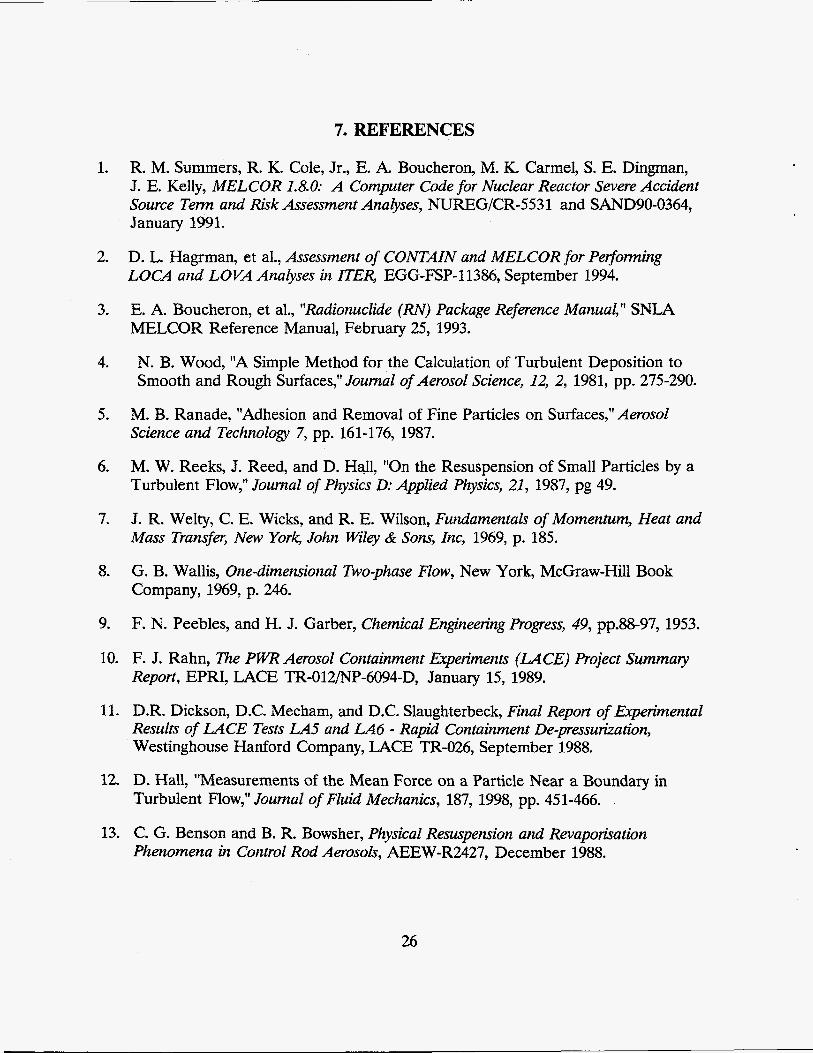
When a particle impacts a given surface, adhesive surface and film drag forces act on this particle, as illustrated in Figure 2. If this particle is to adhere to this surface, these forces must be of sufficient strength to overcome the incident momentum of this particle as it reflects off of a surface. The adhesive forces include both a capillary force
9
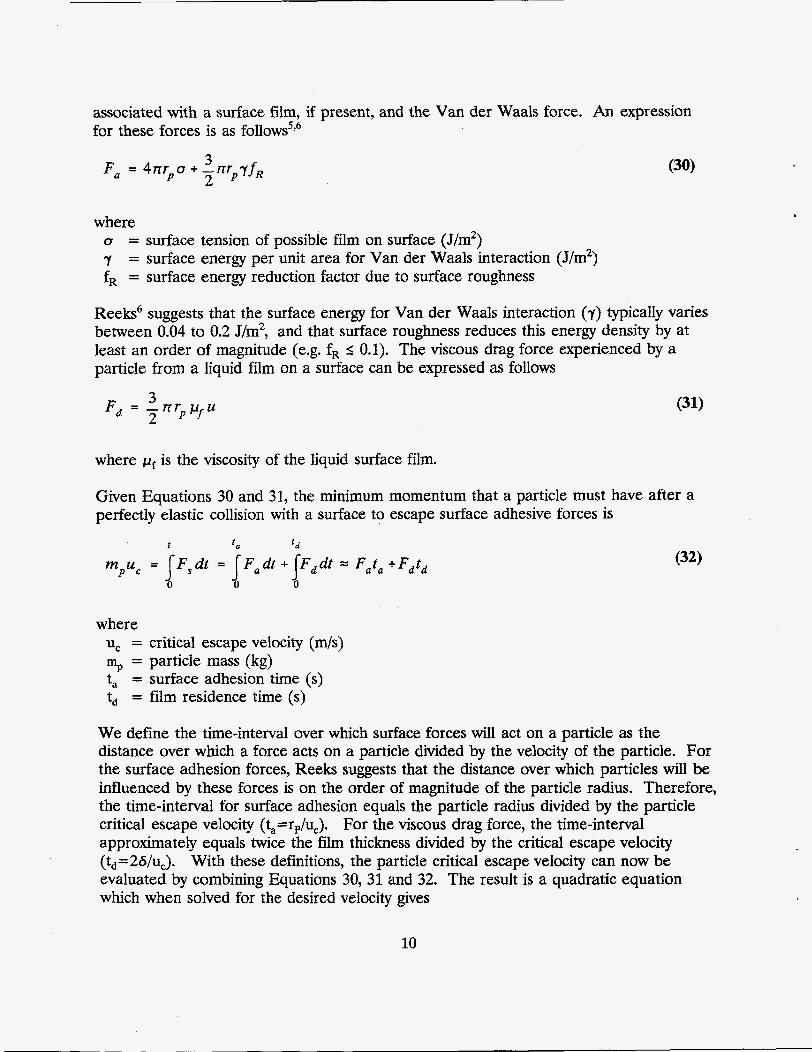
associated with a surface film, if present, and the Van der Waals force. An expression for these forces is as f01lows~~~
Fa = 4;rrrpu +-rtrp7fR 3 2
where o = surface tension of possible film on surface (J/m2) 7 = surface energy per unit area for Van der Waals interaction (J/m2) fR = surface energy reduction factor due to surface roughness
Reeks6 suggests that the surface energy for Van der Waals interaction (7) typically varies between 0.04 to 0.2 J/m2, and that surface roughness reduces this energy density by at least an order of magnitude (e.g. fR 5 0.1). The viscous drag force experienced by a particle from a liquid film on a surface can be expressed as follows
2 J Fd = -rrr p u 2 P f
(31)
where pf is the viscosity of the liquid surface film.
Given Equations 30 and 31, the minimum momentum that a particle must have after a perfectly elastic collision with a surface to escape surface adhesive forces is
I Id
F,dt = F,dt + F,dt Fata +Fdtd mpuc = J 0 1
where u, = critical escape velocity (m/s) % = particle mass (kg) t, = surface adhesion time (s) t, = film residence time (s)
We define the time-interval over which surface forces will act on a particle as the distance over which a force acts on a particle divided by the velocity of the particle. For the surface adhesion forces, Reeks suggests that the distance over which particles will be influenced by these forces is on the order of magnitude of the particle radius. Therefore, the time-interval for surface adhesion equals the particle radius divided by the particle critical escape velocity (ta=rp/u,). For the viscous drag force, the time-interval approximately equals twice the film thickness divided by the critical escape velocity (td=26/uc). With these definitions, the particle critical escape velocity can now be evaluated by combining Equations 30, 31 and 32. The result is a quadratic equation which when solved for the desired velocity gives
10
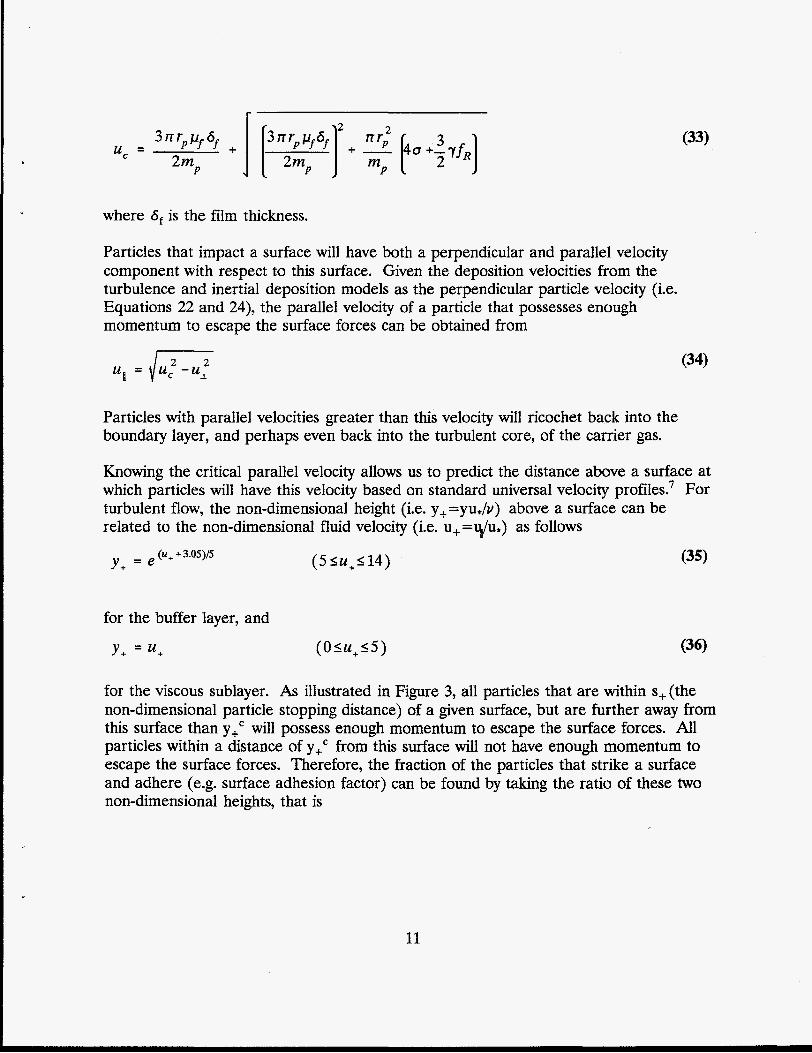
r
u, =
where 6 , is the film thickness.
Particles that impact a surface will have both a perpendicular and parallel velocity component with respect to this surface. Given the deposition velocities from the turbulence and inertial deposition models as the perpendicular particle velocity (i.e. Equations 22 and 24), the parallel velocity of a particle that possesses enough momentum to escape the surface forces can be obtained from
(33)
Particles with parallel velocities greater than this velocity will ricochet back into the boundary layer, and perhaps even back into the turbulent core, of the carrier gas.
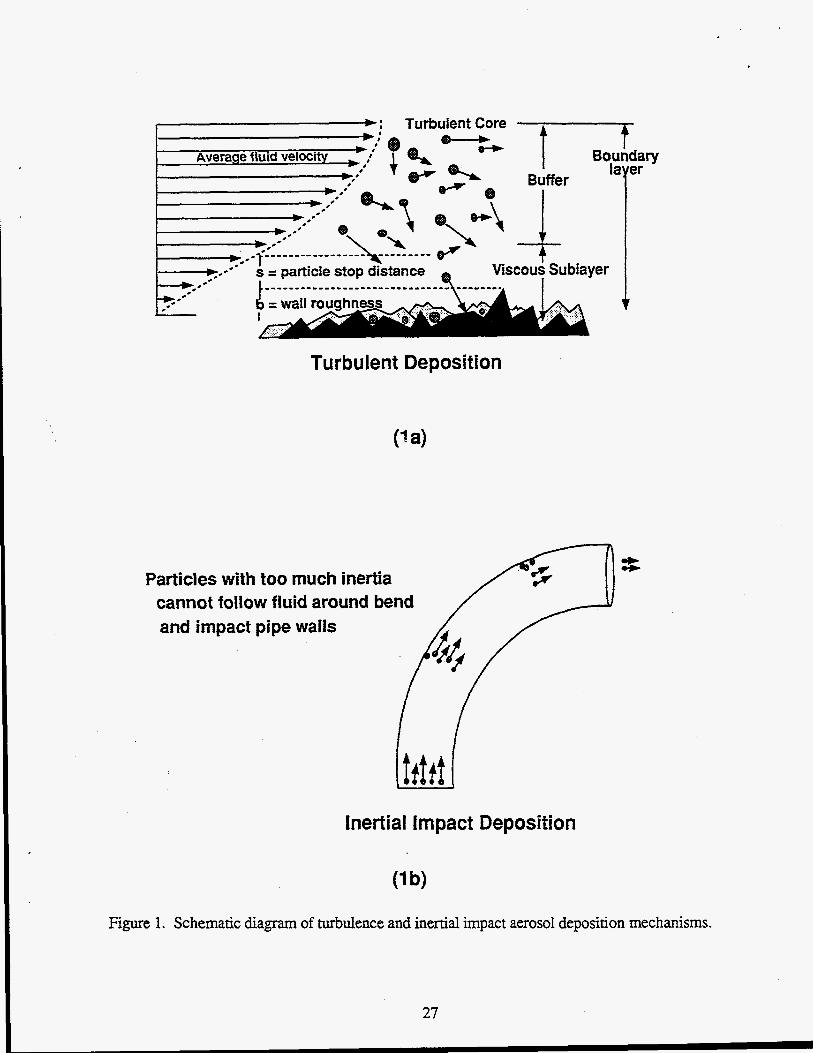
Knowing the critical parallel velocity allows us to predict the distance above a surface at which particles will have this velocity based on standard universal velocity profiles.' For turbulent flow, the non-dimensional height (i.e. y+=yu,/v) above a surface can be related to the non-dimensional fluid velocity (i.e. U+=L@*) as follows
Y + = e (u+ + 3.05)/5 ( 5 <u+l14) (35)
for the buffer layer, and
Y + = u + ( O S U + S ~ )
for the viscous sublayer. As illustrated in Figure 3, all particles that are within s+(the non-dimensional particle stopping distance) of a given surface, but are further away from this surface than y+' will possess enough momentum to escape the surface forces. All particles within a distance of y+' from this surface will not have enough momentum to escape the surface forces. Therefore, the fraction of the particles that strike a surface and adhere (e.g. surface adhesion factor) can be found by taking the ratio of these two non-dimensional heights, that is
11
The product of this adhesion factor and the deposition velocity (Le. Equations 11 or 24, and 37) results in the effective deposition velocity for our turbulence and inertial deposition models on solid surfaces.
12
4. LIQUID ENTRAINED AEROSOL RE-SUSPENSION MODEL
During either normal operation or accident conditions in ITER, particulate will become entrained in the coolant of the ITER HTS. The particulate entrained during normal operation are corrosion products from pipe walls of the HTS. The particulate entrained during accident conditions, such as a LOCA into the vacuum vessel, are dust from first wall and divertor surface erosion. Because this coolant can be superheated with respect to ambient conditions, coolant flashing could occur. The model developed in this section addresses the issue of re-suspension of this particulate into the atmosphere during coolant flashing.
The present MELCOR model assumes that once aerosol particles become entrained in the liquid phase of the coolant, these particles remain in the liquid until an arbitrarily small quantity of liquid remains. After this point, the entrained aerosol mass is linearly re-suspended in proportion with the liquid mass that flashes. This could become a very non-conservative assumption if the aerosol re-suspension occurs after the aerosol carrier gas has lost its impetus to transport these aerosols.
Our new model re-suspends the liquid entrained aerosols into vapor bubbles generated by the flashing process. Once inside these bubbles, these aerosols re-deposit on the liquid surface of the bubbles by the aerosol deposition mechanisms of Brownian diffusion, gravitational settling, and inertial impaction. These bubbles eventually rise to the surface where the aerosols are released into the atmosphere. This approach is very similar to pool scrubbing models developed for codes like MELCOR? Therefore, we have adapted the existing MELCOR pool scrubbing model as a basis for our liquid entrained aerosol re-suspension model. The Fortran coding for the required modifications to the MELCOR code are contained in Appendix B.
Our re-suspension model starts with an integral solution to an aerosol conservation of mass equation written for a bubble, assuming no sources of aerosol mass. This equation relates the aerosol mass that reaches the pool surface to the aerosol mass in a carrier gas that enters the bottom of a pool and forms a bubble as follows
where ma = bubble aerosol mass (kg) V, = bubble volume (m3), ud = total aerosol deposition velocity (m/s) A,, = bubble surface area (m2) t = bubble residence time in pool (s)
13
The total deposition velocity of Equation 38 is defined as
where ug = gravitational settling velocity (m/s) ui = inertial impaction velocity (m/s) uB = Brownian diffusion velocity (m/s)
The deposition velocity due to gravitational settling, accounting for the bubble surface area that is perpendicular to the vertical direction, is defined as
where us = settling velocity (m/s) g = gravitational constant (m/s2) p, = aerosol particle density (kg/m3) d, = particle diameter (m) C, = particle mobility p = vapor viscosity (kg/m-s) 8 = angle with respect to vertical (radians)
For inertial impaction, the aerosol velocity is
where ub = relative bubble rise velocity (m/s) R, = bubble radius (m)
And finally, the Brownian diffusion velocity is 1
UB = [ E 4 3
where D is the particle diffusion coefficient (m2/s) in the bubble vapor.
We assumed for this model that the radius the bubbles obtain during flashing is that of
14
bubbles created over a porous or heated surface by 'Taylor instability" which is8
where 0 = fluid surface tension (N/m) pf = fluid density (kg/m3) P" = vapor density (kg/m3)
The bubble rise velocity of this model is the bubble velocity relative to the mixture or liquid velocity. For this velocity we have adopted formulations proposed by Peebles and Garber' for the terminal velocity of a single gas bubble rising in a stationary liquid. These equations are
( P f - P , ) U b =
Pf Re, < 2
0.52
u, = 0.33g0.76 [;] R;*=
u, = 1.35 [%r -0.214 2 c Re, c 4.02 G,
4.02 G, -0.214 c Re, c 3.10Gpz
3.10GPz e Re,
where the bubble Reynolds number is defined as
Re, = 'Pf ' b Rb
Pf
(45)
(47)
and the parameter G, as
15
By assuming that these bubbles form instantaneously, maintain a constant radius, and aerosol deposition velocities are constant over the bubble rise time, the integration of Equation 38 with respect to bubble surface area, defined as
1; = Vb udA, -l I
becomes time independent. The solution for Equation 50 is somewhat complicated and will not be presented here. Those interested can find this solution in Reference 3.
We define the bubble residence time of Equation 38 as the bubble origination depth divided by the vapor velocity (z/q,). This velocity is the maximum of the vapor superficial velocity and the bubble rise velocity, that is
where K . ~ = liquid mass
7 U b )
flashing rate (kg/s). A; = liquid pool cross-sectional area (m’)
Recalling our discussion of Equation 38, we can now determine the aerosol mass release from a flashing pool. Assuming that this liquid flashing generates vapor bubbles uniformly throughout the pool and that the entrained aerosol mass in the flashing liquid re-suspends into the generated bubbles, then the differential aerosol mass release from the pool surface (dm;) resulting from a differential aerosol mass re-suspension (dmaR) in bubbles that develop at pool depth (z), in height (dz), is
where maR is the total aerosol mass re-suspended over pool depth Z,. By integrating Equation 52 over the depth of the pool, the total aerosol mass release becomes
With this result, we can now define the aerosol mass release rate (R,) in terms of the
16
liquid mass flashing rate as
where xa = entrained aerosol to liquid mass ratio SF = aerosol scrubbing factor
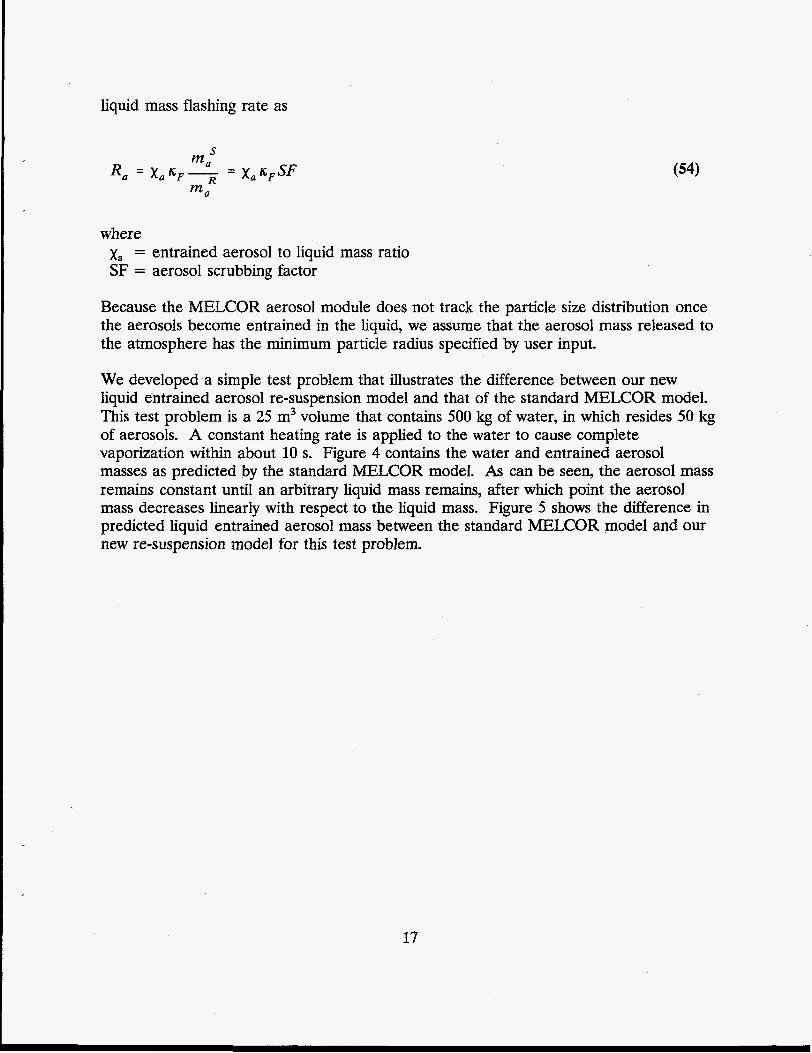
Because the MELCOR aerosol module does not track the particle size distribution once the aerosols become entrained in the liquid, we assume that the aerosol mass released to the atmosphere has the minimum particle radius specified by user input.
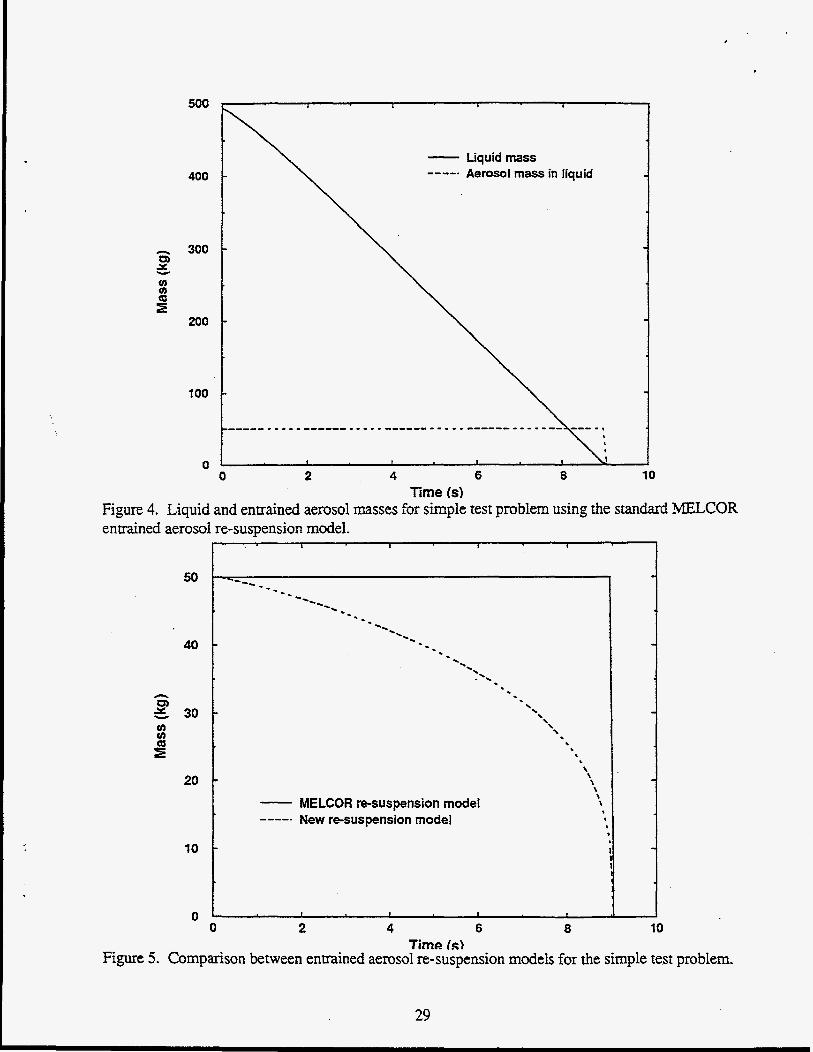
We developed a simple test problem that illustrates the difference between our new liquid entrained aerosol re-suspension model and that of the standard MELCOR model. This test problem is a 25 m3 volume that contains 500 kg of water, in which resides 50 kg of aerosols. A constant heating rate is applied to the water to cause complete vaporization within about 10 s. Figure 4 contains the water and entrained aerosol masses as predicted by the standard MELCOR model. As can be seen, the aerosol mass remains constant until an arbitrary liquid mass remains, after which point the aerosol mass decreases linearly with respect to the liquid mass. Figure 5 shows the difference in predicted liquid entrained aerosol mass between the standard MELCOR model and our new re-suspension model for this test problem.
17
5. COMPARISON OF AEROSOL DEPOSITION MODELS TO LACE DATA
Over the time period of 1981 to 1988, the Electric Power Research Institute (EPRI) organized a test program, sponsored by an international consortium, that conducted a number of large-scale light water reactor (LWR) aerosol containment experiments (LACE) at the Hanford Engineering Development Laboratory (HEDL) in Richland, Washington. These tests examined the transport of aerosols typical of LWRs through pipes with high speed flow and in containment volumes during rapid de- pressurization."*" We have used data from this test series to compare our MELCOR aerosol transport models against. This comparison is given in the following subsections. The first subsection describes the LACE bypass tests and tests results. The second subsection compares our model's predictions against the LACE bypass tests. The third subsection describes the LACE de-pressurization test LA5. The final subsection presents a comparison between the LACE test LA5 data and our liquid entrained aerosol re-suspension model.
5.1 LACE Containment Bypass Tests
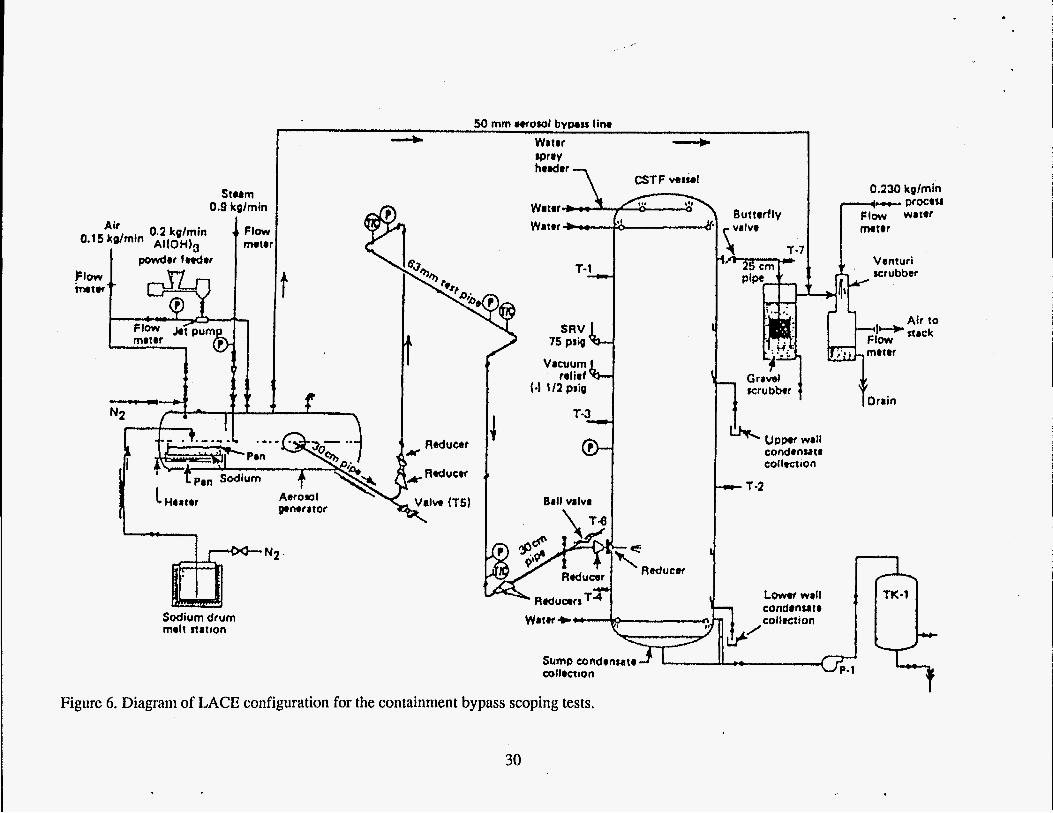
Figure 6 contains a schematic of the LACE facility as it was constructed to perform the aerosol transport tests in pipes. Two test series were conducted with this facility configuration. The first test series was called the Containment bypass scoping tests, designated as the CB series. The second test series was called the containment bypass tests, designated as LWR Aerosol (LA) tests LA1 and LA3. This facility had as major components an aerosol generator, a test pipe, a containment vessel, and an aerosol scrubbindventing system. The LA tests had a different test pipe configuration than that of the CB tests. Both test series examined aerosol transport in pipes with high speed carrier gas flows, but the LA1 and LA3 test series considered aerosols, carrier gases, and carrier gas conditions that were more typical of containment bypass accident scenarios in LWRS.
The aerosol generator was a 5 m3 tank that was divided into a burn chamber and a mixing chamber. The burn chamber was used to vaporize sodium or cesium into an air or nitrogen carrier gas. Aluminum or manganese oxide was also produced in this chamber by the use of a plasma torch, into which the metal oxide powder was injected. These gases then entered the mixing chamber in which steam was introduced. The aerosol particles produced by this aerosol generator were NaOH, CsOH, Al(OH), and MnO.
The test pipe for the CB scoping tests consisted of three pipe sections. The first and third pipe sections were 300 mm in diameter and approximately 3 m long. The center section of the test pipe was 63 rnm in diameter and 27 m long. There were five 90" pipe bends and three pipe reducers in this test pipe. The test pipe for the LA bypass tests eliminated the downstream 300 m diameter pipe section, and extended the 63 mm
18
diameter pipe section to a length of 29 m. This longer 63 mm diameter pipe had six 90" pipe bends. These test pipes were wrapped with 50 mm of glass fiber insulation, and the first section of these pipes was electrically heated.
The containment vessel had a volume of 850 m3, surface area of 520 m2, diameter of 7.62 m, height of 20.3 m, wall thickness of 16.4 mm and was covered by 25 mm of glass fiber insulation. No attempt was made to maintain elevated temperatures in this volume during these tests. The resulting atmosphere temperatures were about 85 " C for the CB series, and 115 C for test LA1. The pressure during these tests was maintained at 0.1 MPa. In the case of tests LA3A-C, this containment volume was bypassed altogether.
Test conditions measured at the inlet of the test pipes and mass retention fractions in these pipes are given in Table 1. The carrier gas inlet conditions were maintained for 20 hours prior to conducting the one hour aerosol transport tests. The rather high carrier gas temperatures and velocities of these tests ensured that the steam in the carrier gas remained super-heated, and that the flow was highly turbulent. Of particular interest is the very dramatic difference in mass retention fraction between the 63-mm and 300-mm pipe sections of the CB test series. The retention fraction was less than 5% for the 63- mm pipe section, but was nearly an order of magnitude higher in the 300-mm pipe. The LACE experimentalists offered two possible explanations for this difference. Either the aerosol material was re-suspended following deposition, or moved along the pipe as a liquid film by shear stresses induced by the high-velocity carrier gases. There is also a very noticeable difference in mass retention fraction for the 63-mm pipe sections of the CB and LA tests. For example, test CB3 resulted in only a 1% mass retention fraction while LA1 is in excess of 98%. The LACE experimentalists attributed this difference to the physical nature of the aerosol, citing surface tension, viscosity, and melting point as important parameters effecting adhesion and re-suspension.
The reason for suspecting the formation of a film in these experiments is that NaOH and CsOH are hygroscopic materials, which means that these aerosols will rapidly absorb steam from the carrier gas. It is these particles that could agglomerate and form a film on the pipe surface. However, aerosol transport by shear stress induced film motion has two problems with regards to the CB test series. The first problem is that test CB3 had no hygroscopic aerosols to form a film, therefore film transport could not explain the small retention fraction for this test. The second problem is that even for the largest retention fraction, which is 5% for test CB2, the film height is only about 17 pm . This compares to an expected surface roughness height for this test pipe of 50 pm. As a result, the film would be below the viscous sublayer and would not experience the shear stress forces produced by the carrier gas.
Aerosol re-suspension was also given as a possible explanation for the low retention factors of the CB test series. Ha1112 has measured the mean lifting forces on a captive sphere near to a surface in fully developed turbulent boundary layer. He demonstrated
19
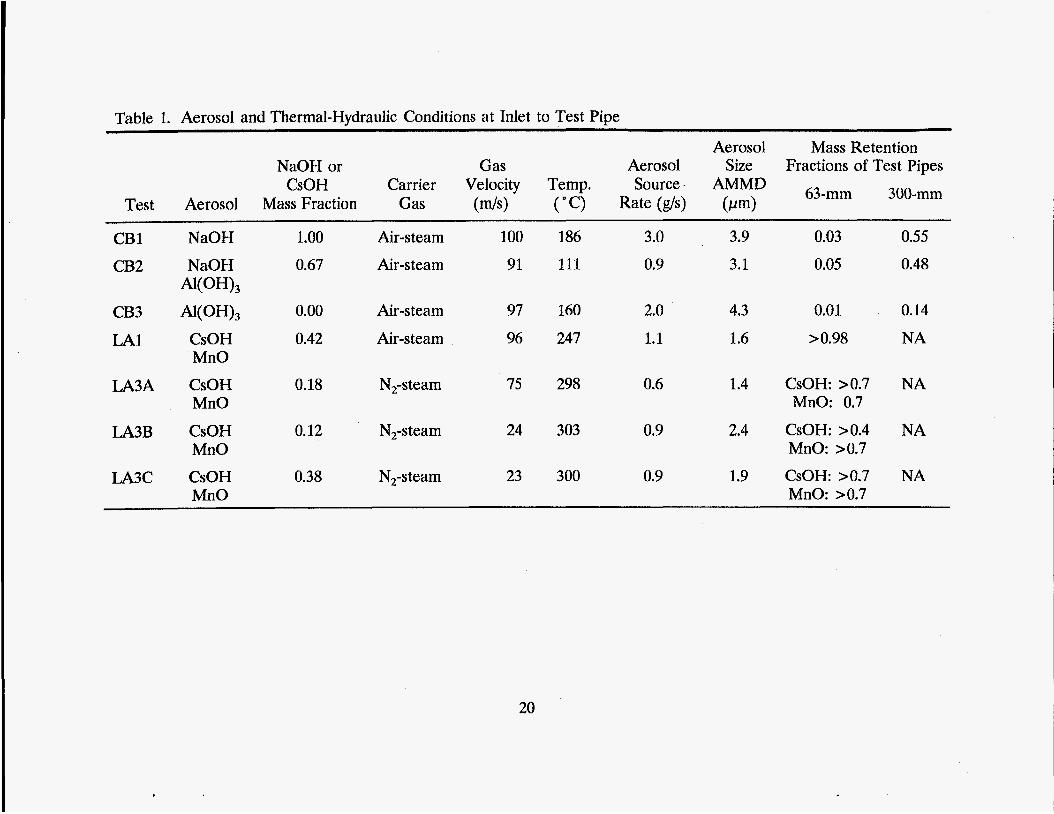
Table 1. Aerosol and Thermal-Hydraulic Conditions at Inlet to Test Pipe ~~
Aerosol Mass Retention NaOH or Gas Aerosol Size Fractions of Test Pipes
63-mm 300-mm CsOH Carrier Velocity Temp. Source. AMMD Test Aerosol Mass Fraction Gas (m/s> ("C) Rate (ds) (Ftm)
CB1 NaOH
CB2 NaOH M(OH),
CB3 M(OH), LA1 CsOH
MnO
LA3A CsOH MnO
LA3B CsOH MnO
LA3C CsOH MnO
1.00 Air-steam 100 186 3.0 3.9 0.03 0.55 0.67 Air-steam 91 111 0.9 3.1 0.05 0.48
0.00 Air-steam 97 160 2.0 4.3 0.01 0.14 0.42 Air-steam 96 247 1.1 1.6 > 0.98 NA
0.18 N,-steam 75 298 0.6 1.4 CsOH: >0.7 NA
0.12 N,-steam 24 303 0.9 2.4 CsOH: >0.4 NA
MnO: 0.7
MnO: >0.7 0.38 N,-steam 23 300 0.9 1.9 CsOH: >0.7 NA
MnO: >0.7
20
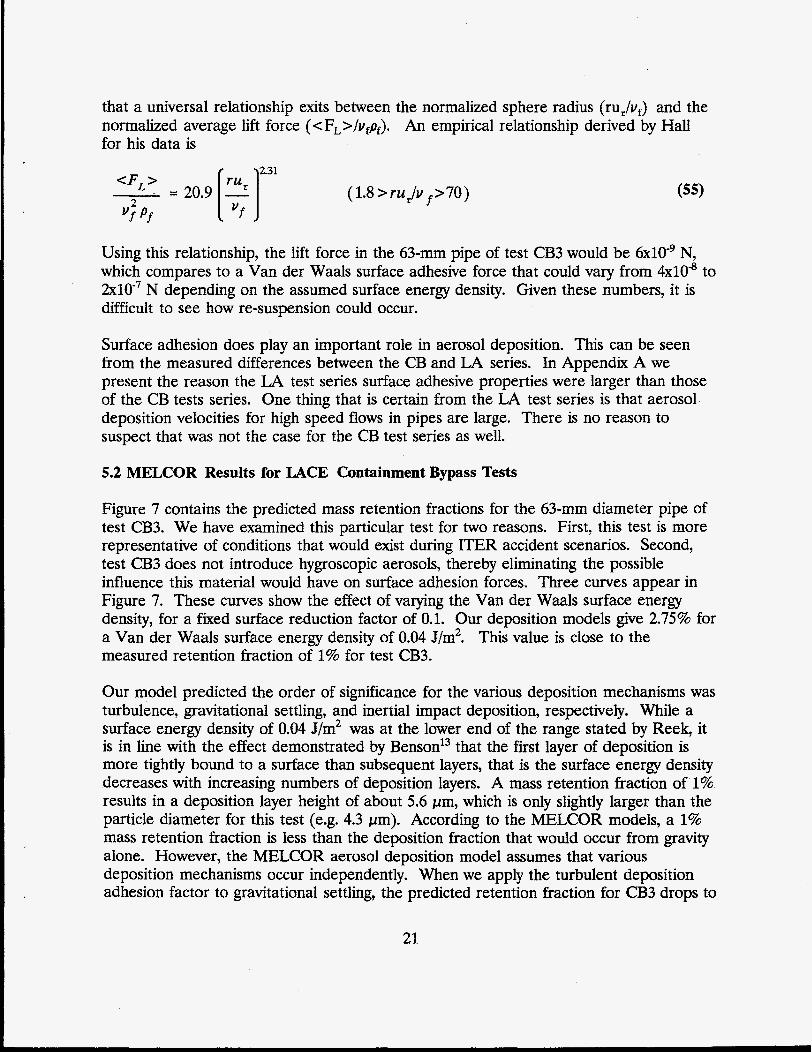
that a universal relationship exits between the normalized sphere radius (rur/uf) and the normalized average lift force (<F,>/ufpf). An empirical relationship derived by Hall for his data is
( 1.8 >ru,/u p 7 0 ) (55)
Using this relationship, the lift force in the 63-mm pipe of test CB3 would be 6x10-' N, which compares to a Van der Waals surface adhesive force that could vary from 4x10" to 2 ~ l O - ~ N depending on the assumed surface energy density. Given these numbers, it is difficult to see how re-suspension could occur.
Surface adhesion does play an important role in aerosol deposition. This can be seen from the measured differences between the CB and LA series. In Appendix A we present the reason the LA test series surface adhesive properties were larger than those of the CB tests series. One thing that is certain from the LA test series is that aerosol deposition velocities for high speed flows in pipes are large. There is no reason to suspect that was not the case for the CB test series as well.
5.2 MELCOR Results for LACE Containment Bypass Tests
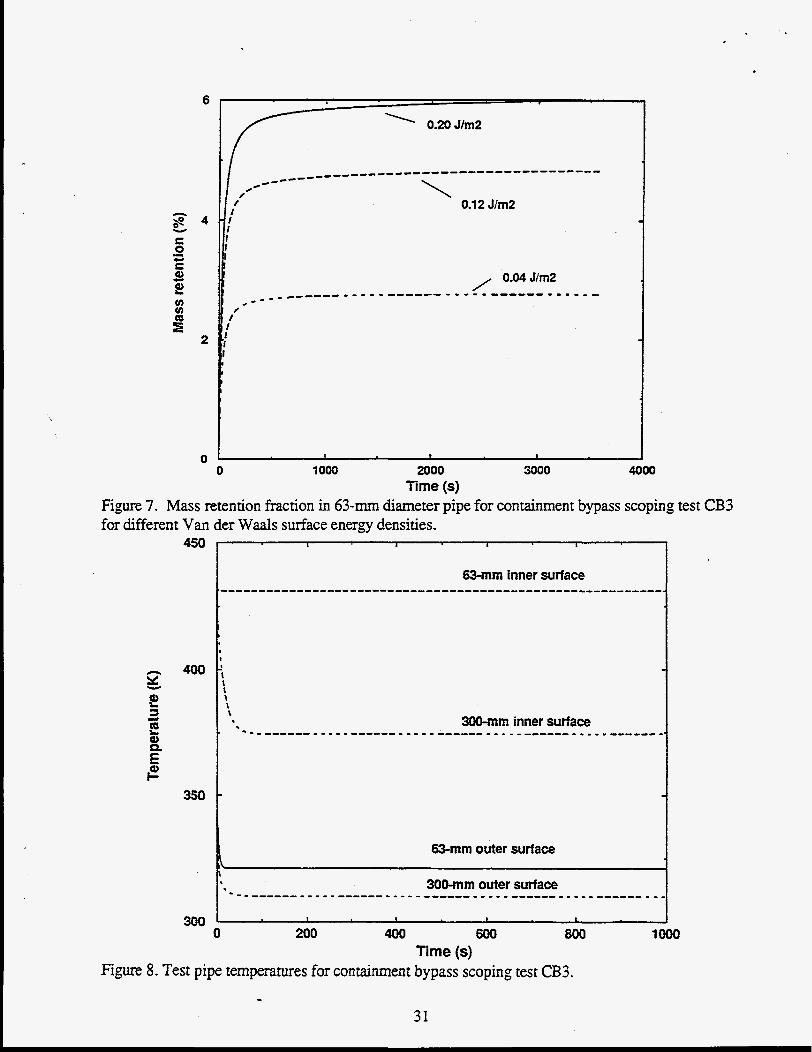
Figure 7 contains the predicted mass retention fractions for the 63-mm diameter pipe of test CB3. We have examined this particular test for two reasons. First, this test is more representative of conditions that would exist during ITER accident scenarios. Second, test CB3 does not introduce hygroscopic aerosols, thereby eliminating the possible influence this material would have on surface adhesion forces. Three curves appear in Figure 7. These curves show the effect of varying the Van der Waals surface energy density, for a fixed surface reduction factor of 0.1. Our deposition models give 2.75% for a Van der Waals surface energy density of 0.04 J/m2. This value is close to the measured retention fraction of 1% for test CB3.
Our model predicted the order of significance for the various deposition mechanisms was turbulence, gravitational settling, and inertial impact deposition, respectively. While a surface energy density of 0.04 J/m2 was at the lower end of the range stated by Reek, it is in line with the effect demonstrated by Benson13 that the first layer of deposition is more tightly bound to a surface than subsequent layers, that is the surface energy density decreases with increasing numbers of deposition layers. A mass retention fraction of 1% results in a deposition layer height of about 5.6 pm, which is only slightly larger than the particle diameter for this test (e.g. 4.3 pm). According to the MELCOR models, a 1% mass retention fraction is less than the deposition fraction that would occur from gravity alone. However, the MELCOR aerosol deposition model assumes that various deposition mechanisms occur independently. When we apply the turbulent deposition adhesion factor to gravitational settling, the predicted retention fraction for CB3 drops to
21
1.2%. Since this is more representative of the data, this assumption has become part of our new MELCOR aerosol deposition model.
The mass retention fraction for the 300-mm diameter pipe of test CB3 was 14%. However, our model for Van der Waals surface forces alone results in only about 0.6 % mass retention fraction for this section of the test pipe. This predicted deposition was primarily due to inertial deposition from the single bend in this pipe section, because turbulent deposition was predicted to be negligible even though the Reynolds number indicated turbulent flow (Re=8x10⁴).
In searching for an explanation for this under prediction, we looked for the possibility of steam condensation in this test pipe section (recall that the upstream 300-mm pipe section was electrically heated). Figure 8 contains predicted pipe temperatures for test CB3, assuming an initial temperature of 433 K (160 C) and an artificially low material density for the pipe wall and glass fiber insulation. The low density assumption was adopted to allow our model to reach thermal equilibrium within the time-scale of the aerosol deposition portion of the experiment. In the actual experiment, a precondition phase occurred where the pipes were allowed 20 hours to obtain thermal equilibrium. As can be seen, the 300-mm diameter pipe surface temperature drops to 374 K (101 ' C) for this test. This indicates the possibility of steam condensation on this surface. If we include the adhesive properties of a water film on this pipe surface, the mass retention factor increases to 6%. This is still a factor of two or more below the measured retention fraction of test CB3, and a factor of eight below that for tests CB1 and CB2. This means that either our turbulence and inertial deposition models under predict the deposition velocities for these tests, or that there is an additional deposition mechanism that we have yet to account for. From the piping schematic of these tests (note Figure 6), it can be seen that this pipe section has an inlet area expansion and an outlet area contraction. Both of these area changes could produce inertial deposition from either flow directional changes or eddy currents. Since we do not have a model for these deposition mechanisms, and since the reported test results do not give an indication of where the deposition occurs, we did not pursue this matter any further. However, this does point up the need for additional experiments.
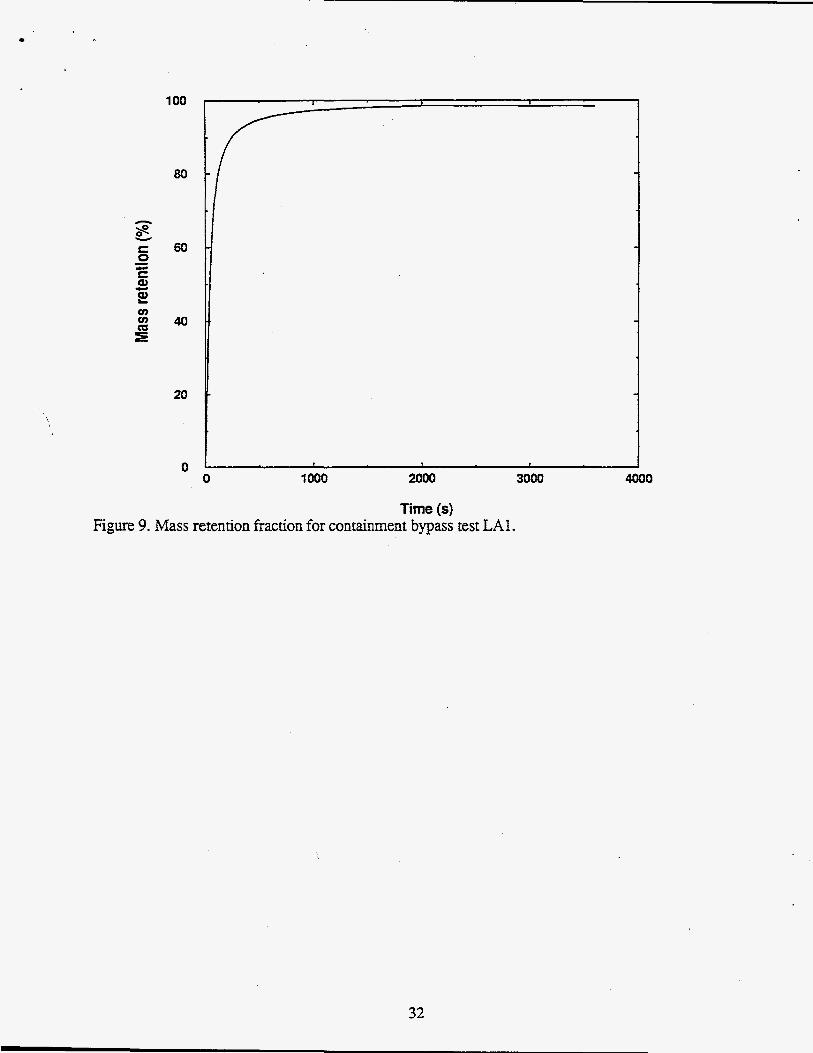
As a final comparison, we have examined test Ul. Figure 9 contains the predicted retention fraction for the surface tension and viscosity, of the deposited material as presented in Appendix A. The predicted retention factor is 98.4%, which is in agreement with the reported results from test LA1. The dominate surface adhesive force in this prediction was the viscous drag experienced by an aerosol particle as it passes through the film.
5.3 LACE Containment De-pressurization Tests
The containment de-pressurization LACE tests LA5 and LA6 used the same aerosol generator and containment vessel as the containment bypass tests described in Section
22
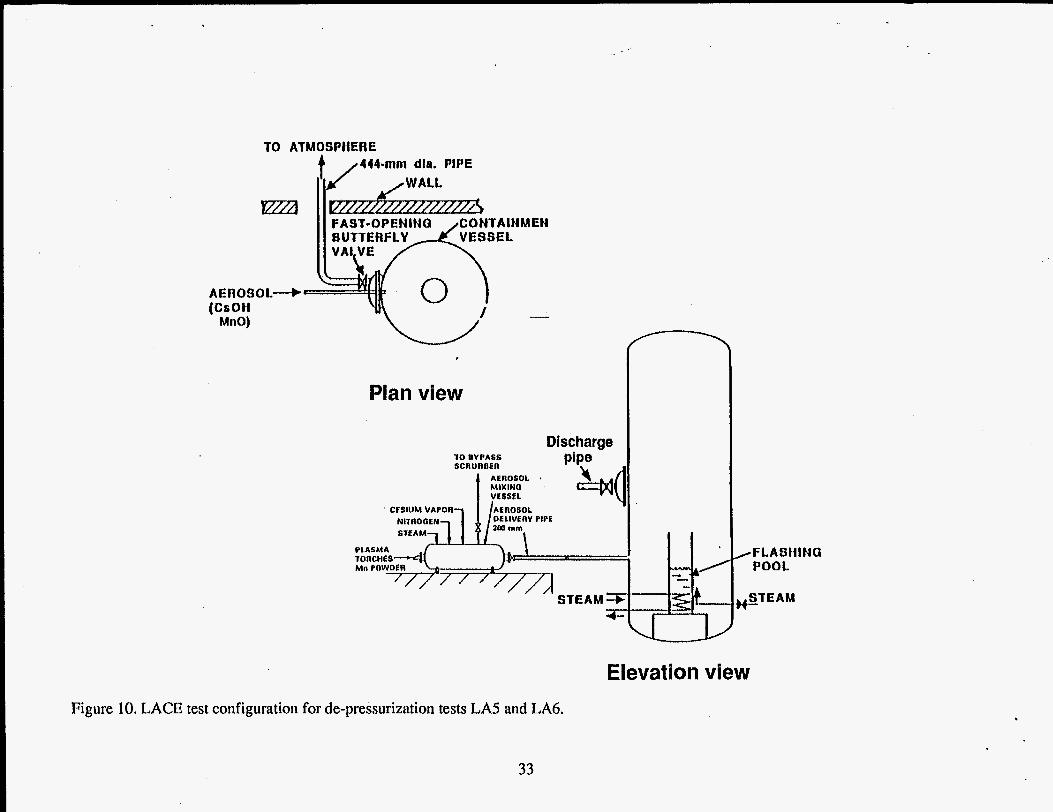
5.1. A schematic of the LA5 and LA6 test configuration is given in Figure 10. For these de-pressurization tests, the aerosol generator and containment vessel were attached by an -five meter long 200 mm diameter aerosol delivery pipe. An internal tank was installed in the containment vessel for these tests. This tank contained a saturated water pool that flashed to vapor as the containment volume de-pressurized. The de- pressurization of the containment vessel was accomplished by adding a 12.7 m long, 444 mm diameter discharge pipe to the containment vessel. In this discharge pipe was one 90" pipe bend and a fast-opening butterfly valve (opening time -4 s). Prior to the de-pressurization phase of these experiments, the containment vessel and flashing pool were heated to thermal equilibrium and pressurized by a steam delivery system.
For test LA6, CsOH and MnO aerosols were introduced into the vapor volume of the containment vessel by the aerosol generator. These aerosols were not introduced in test LA5. The water in the internal tank contained Li,SO, and ZnO aerosols. The Li,SO, aerosol is a water soluble aerosol, and ZnO is water insoluble. Twenty three kg of ZnO were added to this tank, however less than 0.5% of this material remained suspended in the liquid pool. Since it is the insoluble aerosol that most closely represents corrosion products in the ITER HTS, we have selected test LA5 to benchmark our liquid entrained aerosol re-suspension model.
We did not model the pre-test conditioning phase of the LA5 experiment. Instead we used measured parameters of containment vessel pressure, gas temperature and wall temperature, and internal tank water temperature, water mass and ZnO concentrations prior to de-pressurization as initial conditions for our benchmark analysis. The initial containment vessel pressure, gas temperature and wall temperature where 440 kPa, 125 C, and 121 O C, respectively. The initial internal tank water temperature, water mass and ZnO concentration were 135 "C, 5,130 kg and 13.5 m a respectively. These parameters represent averages of multiple measurements for test LA5
5.4 MELCOR Results for LACE Containment De-pressurization Tests
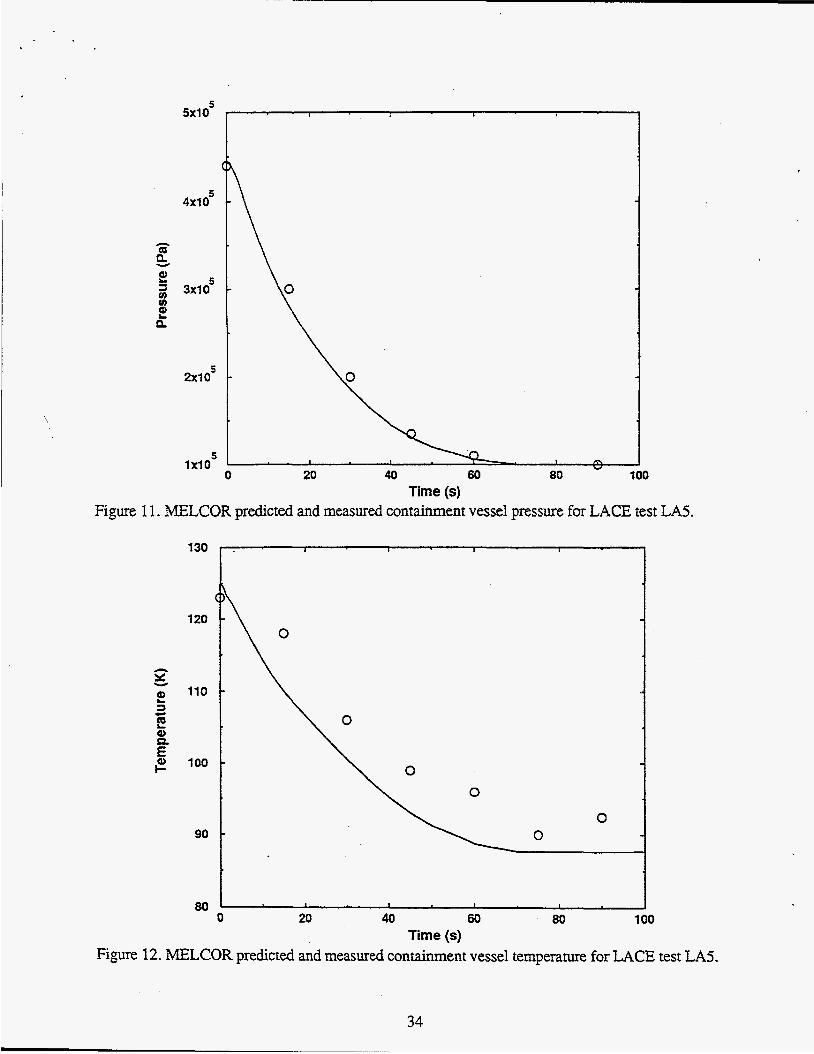
Figures 11 and 12 contain a comparison between MELCOR predictions and LA5 test measurements of containment vessel pressure and gas temperature. As can be seen, very good agreement was obtained for vessel pressure and only a slight variance (-6% at 60 s) occurs for vessel gas temperature. During this de-pressurization, MELCOR predicts that -20% of the liquid in the internal tank vaporizes, leaving the remainder in the internal tank. However, post-test examinations of the LA5 internal tank pool depth suggests that only 40% of the pool remained in the tank. This means that an additional 40% of the liquid was expelled by pool expansion (i.e. pool swell caused by vapor generation). We could have more accurately modeled this pool expulsion by sub-dividing this pool into a number of axial volumes. But due to the accuracy of the ZnO concentration measurements for this test we felt this level of modeling detail was not warranted.
23
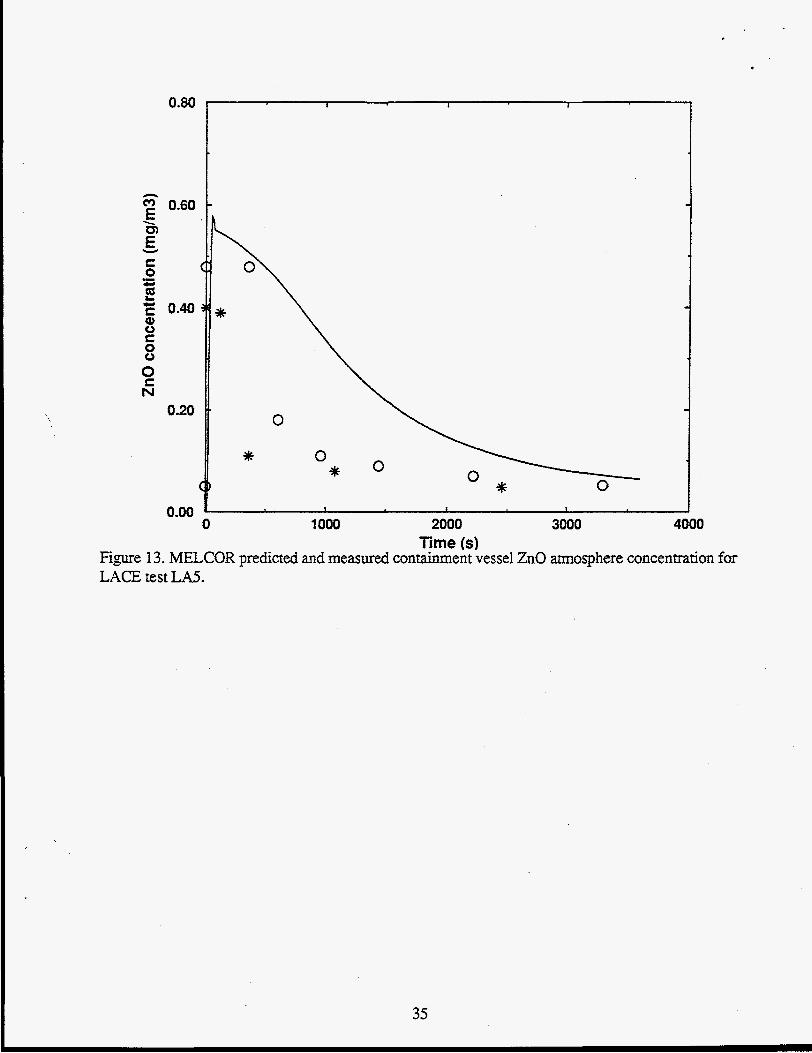
Figure 13 contains the predicted and measured ZnO concentration in the atmosphere of the containment vessel following vessel de-pressurization. There is good agreement regarding the predicted magnitude of the ZnO released from the pool as the pool flashes during containment vessel de-pressurization. There was approximately 15 g of ZnO associated with the predicted liquid inventory that flashes. By taking the ZnO concentration of 0.5 mg/m3 as an accurate measurement of the re-suspended aerosol mass, one can arrive at only 0.4 g being re-suspended during this test, which implies an aerosol scrubbing factor of 2.8%. There appears to be rapid drop in measured ZnO concentration, followed by a slower long term decay in ZnO concentration that our model only shows fair agreement with. This disagreement could be caused by aerosol scrubbing from the atmosphere by liquid drops, which in MELCOR is a user specified quantity.
We should mention in concluding this section that the agreement our model achieved with the ZnO measurements of test LA5 is somewhat fortuitous, and should not be relied upon too heavily because the LACE experimentalists did not give much credence to their ZnO concentration measurements. They cited problems with a high Zn background concentration, for test LA6 in particular, that cast doubts on their measurements. However, we present this comparison here to illustrate that our liquid entrained aerosol re-suspension model is within reason given the data presently available. We strongly urge that experiments like LA5 be conducted with ITER-relevant materials and geometries to improve the confidence level of our re-suspension model.
24
6. CONCLUSIONS
In this EDF we presented the details of recent modifications we have made to the MELCOR code aerosol transport model. These modifications address the issues of predicting aerosol deposition in gases other than air, turbulence and inertial aerosol deposition for high speed flows in ducts, and re-suspension of aerosols that are entrained in ITER coolants when these coolants flash. Our intent was to improve the accuracy of MELCORs aerosol model for ITER safety analyses, such as LOCAs into the ITER vacuum vessel that re-suspend eroded first wall and divertor material, and corrosion products in ITER'S HTS coolant.
We have benchmarked these modifications against data from the LACE experiments and found excellent agreement. For high speed flows in pipes with 90" pipe bends, our model predicts that -3% of the aerosol mass entering the LACE CB3 test pipe remains on the pipe walls if a Van der Waals surface energy density of 0.04 J/m2 is assumed. This compares with a measured value of 1%. When we extend our surface adhesion model to include gravitational settling, the predicted pipe aerosol mass retention fraction drops to 1.2%. If the deposited aerosol films are highly viscous, as was the case for LACE test LA1, our model predicts that 98.4% of the aerosol mass entering the LACE test pipe will remain on the pipe wall. The measured aerosol mass retention fraction was reported as greater that 98%. We have found good agreement between our model and the data from the LACE containment de-pressurization test LA5 MELCOR predicted pressures and temperatures that are within 6% of those measured by this test. In addition, the peak concentration of aerosols re-suspended as a result of pool flashing was predicted to reach 0.58 mg/m3 compared to a measured value of 0.48 rng/m3.
However, even given the success of this benchmarking exercise, there are still some unanswered issues with respect to our modified MELCOR aerosol transport module. These issues primarily center around aerosol chemical characteristics and carrier gas conditions of the LACE experiments being different than those expected in ITER, and the accuracy of some the LACE measurements. As a consequence, we suggest that additional aerosol transport tests be performed to obtain data more characteristic of ITER accident conditions, and to improve the confidence level we have in our aerosol transport module.
25
7. REFERENCES
1.
2.
3.
4.
5.
6.
7.
8.
9.
R. M. Summers, R. K. Cole, Jr., E. A. Boucheron, M. K. Cannel, S. E. Dingman, J. E. Kelly, MELCOR 1.8.0: A Computer Code for Nuclear Reactor Severe Accident Source Term and Risk Assessment Analyses, NUREGKR-553 1 and SAND90-0364, January 1991.
D. L. Hagrman, et al., Assessment of CONTAIN and MELCOR for Pe~oming LOCA arid LOVA Analyses in ITER, EGG-FSP-11386, September 1994.
E. A. Boucheron, et al., "Radionuclide (RN) Package Reference Manual," S N L A MELCOR Reference Manual, February 25, 1993.
N. B. Wood, "A Simple Method for the Calculation of Turbulent Deposition to Smooth and Rough Surfaces," Journal of Aerosol Science, 12, 2, 1981, pp. 275-290.
M. B. Ranade, "Adhesion and Removal of Fine Particles on Surfaces,"Aerosol Science and Technology 7, pp. 161-176, 1987.
M. W. Reeks, J. Reed, and D. Hall, "On the Resuspension of Small Particles by a Turbulent Flow," Journal of Physics D: Applied Physics, 21, 1987, pg 49.
J. R. Welty, C. E. Wicks, and R. E. Wilson, Fundamentals of Momentum, Heat and Mass Transfec New York, John Wiley & Sons, Inc, 1969, p. 185.
G. B. Wallis, One-dimensional Two-phase Flow, New York, McGraw-Hill Book Company, 1969, p. 246.
F. N. Peebles, and H. J. Garber, Chemical Engineering Progress, 49, pp.88-97, 1953.
10. F. J. Rahn, The PWR Aerosol Containment Experiments (LACE) Project Summary Report, EPRI, LACE TR-012/NP-6094-D, January 15, 1989.
11. D.R. Dickson, D.C. Mecham, and D.C. Slaughterbeck, Final Report of ExperimentaZ Results of LACE Tests LA5 and LA6 - Rapid Containment De-pressurizatioq Westinghouse Hanford Company, LACE TR-026, September 1988.
12. D. Hall, "Measurements of the Mean Force on a Particle Near a Boundary in Turbulent Flow," Journal of Fluid Mechanics, 187, 1998, pp. 451-466.
13. C. G. Benson and B. R. Bowsher, Physical Resuspension and Revaporisation Phenomena in Control Rod Aerosok, AEEW-R2427, December 1988.
26
1 + : Turbuient Core
Average fluid velocity t
t d i 3 , Buffer
Turbulent Deposition
(1 a)
'er
Particles with too much inertia cannot follow fluid around bend and impact pipe wails
Particles with too much inertia cannot follow fluid around bend and impact pipe wails
Inertial Impact Deposition
Figure 1. Schematic diagram of turbulence and inertial impact aerosol deposition mechanisms.
27
~
'Capitlay + Van der WaalsLorcesm
Figure 2. Ilhstration of aerosol particle impact on a surface with a liquid film.
y +
30
20
10
0
s+ - u . I
Particles below this :height 'i wall
Particles below this height stick
0 5 10 15 u+
Figure 3. Universal velocity profile for viscous sublayer and buffer layer of internal turbulent flow.
28
500
400
200
100
0
Liquid mass Aerosol mass in liquid
- ----.
0 2 4 6 8 10 Time (SI
Figure 4. Liquid and entrained aerosol masses for simple test problem using the standard MELCOR entrained aerosol re-suspension model.
50
40
h w S. 30
20
10
- MELCOR resuspension model ----. New re-suspension model
\
\ \ \ \
1
10 0 0 I,..., 2 4 6 a
Time k\ Figure 5. Comparison between entrained aerosol re-suspension models for the simple test problem.
29
S t w n 0.9 kplmin
50 mm momf bypru lino
Sodium drum molt nation
Water - W W
CSTF verul
I ' W m r Watrr -B
T- 1
SRV 75 psig
Vacuum rrlirf
(4 112 piig
T-3
Ball wlvr \ T8
Reducer
0.230 kglmin
FIW water & scrubber l t u r i
::: m r t n
Air to 1- stack
condrnracr collntion I
f - 2
t brain
I TK-1
Sump condrntstr collrctcon
Figure 6. Diagram of LACE configuration for the containment bypass scoping tests.
30
C 0 C Q) Q)
- .L
c
L
v) v)
f
6
0 0 1000 2000
Time (s) 3000 4000
Figure 7. Mass retention fraction in 63-mm diameter pipe for containment bypass scoping test CB3 for different Van der Waals surface energy densities.
400
350
300 0
63-mm outer surface
1 1 1 I
200 400 600 Time (s)
BOO lo00
31
Figure 8. Test pipe temperatures for containment bypass scoping test C33. -
100
80
60
40
20
0 0 2000
Time (s}
3000 4000
Figure 9. Mass retention fraction for containment bypass test LAI.
32
TO ATMOSPHERE f /444-mm dla. PIPE
iza
A E R 090 I.-@ r
(CsOH
U’ MnO)
Plan view
Discharge
I
iza
A E R 090 I.-@ r
(CsOH
- Pipe 70 BYPASS
SCRURBER
b(l 4 AEROSOL * MIXINO VESSEL
CESIUM VAPOA-
Mn POWDER - 4 . I
STEAM+ -5L
Elevation view Figure 10. LACE test configuration for de-pressurization tests LA5 and LA6.
33
5 5x10
(
4x1 O5
2 5
2 J 3x10 v) cn
P
Figure 11. Time (s)
MELCOR predicted and measured containment vessel pressure for LACE test
130
120
110
100
90
80
I 1 I I
LA5.
0 20 40 60 80 100 Time (s)
Figure 12. MELCOR predicted and measured containment vessel temperature for LACE test LA5.
34
0.80 1 1 I
0.60 -
0.40
0.20
0.00 f I 1 1
0 1000 2000 3000 4000 Time (s)
Figure 13. MELCOR predicted and measured containment vessel ZnO atmosphere concentration for LACE test LA5
35

Appendix A. Estimate of Properties of Materials in LACE Tests
A1
Appendix A Estimate of Properties of Materials in LACE Tests
The NaOH and CsOH aerosols used in the LACE tests have similar chemical/physical properties. Both have the potential to form sticky aerosol particles and they melt at similar temperatures. (The melting point of NaOH is 318 C and that of CsOH is 272°C.) Since the LA3 tests were above the melting point of CsOH, it is easy to see how the aerosol particles in these tests formed a sticky liquid that caused the high retention factors in tests LA3A - LA3C.
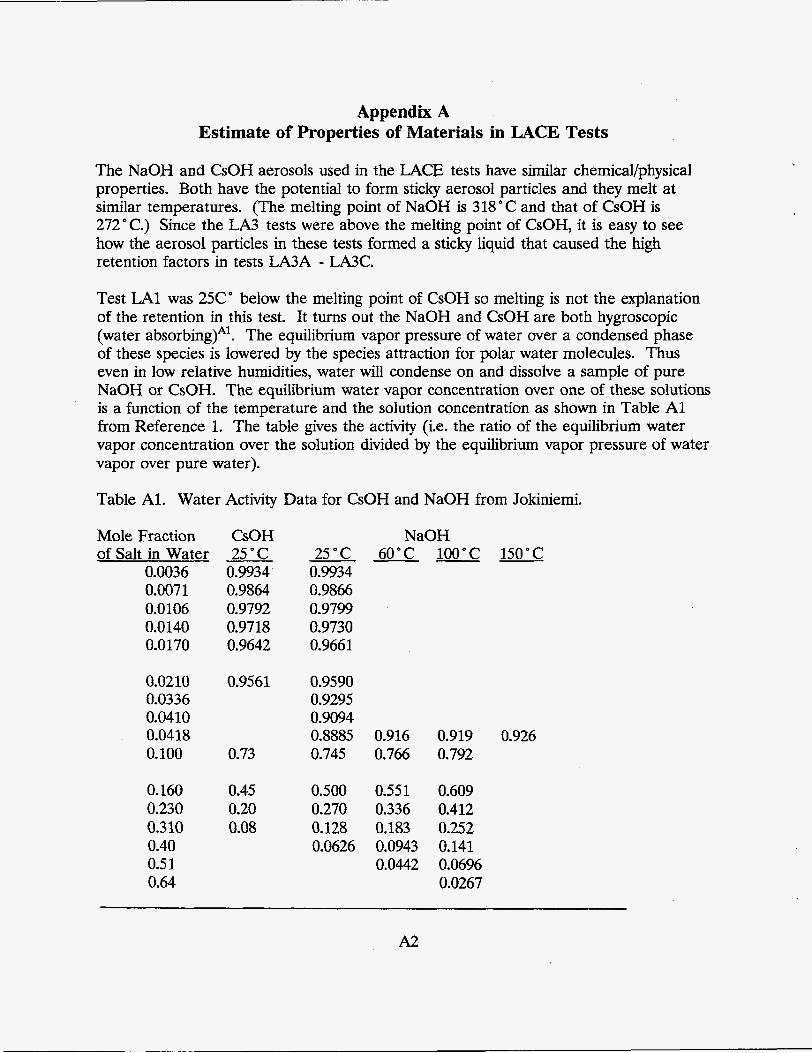
Test LA1 was 25C" below the melting point of CsOH so melting is not the explanation of the retention in this test. It turns out the NaOH and CsOH are both hygroscopic (water absorbing)*'. The equilibrium vapor pressure of water over a condensed phase of these species is lowered by the species attraction for polar water molecules. Thus even in low relative humidities, water will condense on and dissolve a sample of pure NaOH or CsOH. The equilibrium water vapor concentration over one of these solutions is a function of the temperature and the solution concentration as shown in Table A1 from Refereqce 1. The table gives the activity (Le. the ratio of the equilibrium water vapor concentration over the solution divided by the equilibrium vapor pressure of water vapor over pure water).
Table Al. Water Activity Data for CsOH and NaOH from Jokiniemi.
Mole Fraction CsOH NaOH of Salt in Water 25 C ---- 25°C 60°C 100°C 150°C
0.0036 0.9934 0.9934 0.007 1 0.9864 0.9866 0.0106 0.9792 0.9799 0.0140 0.9718 0.9730 0.0170 0.9642 0.966 1
0.0210 0.9561 0.9590 0.0336 0.9295 0.0410 0.9094 0.0418 0.8885 0.916 0.919 0.926 0.100 0.73 0.745 0.766 0.792
0.160 0.45 0.500 0.551 0.609 0.230 0.20 0.270 0.336 0.412 0.310 0.08 0.128 0.183 0.252 0.40 0.0626 0.0943 0.141 0.5 1 0.0442 0.0696 0.64 0.0267
A2
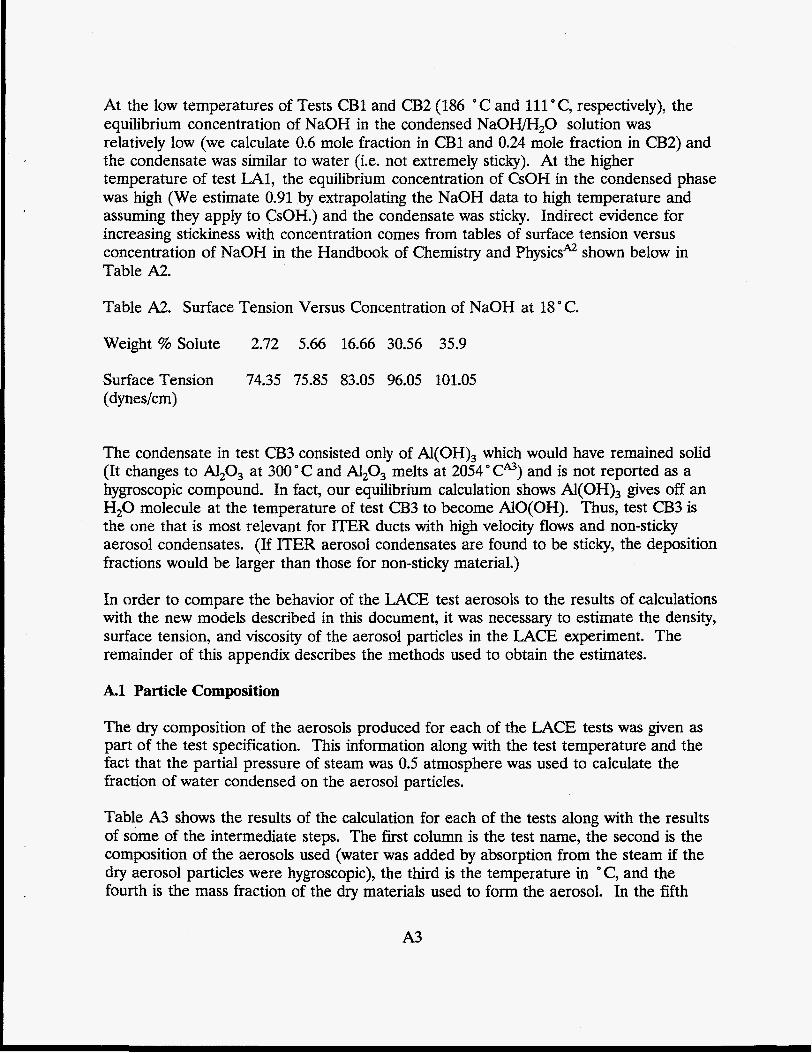
At the low temperatures of Tests CB1 and CB2 (186 "C and 111 OC, respectively), the equilibrium concentration of NaOH in the condensed NaOH/H20 solution was relatively low (we calculate 0.6 mole fraction in CB1 and 0.24 mole fraction in CB2) and the condensate was similar to water (i.e. not extremely sticky). At the higher temperature of test LA1, the equilibrium concentration of CsOH in the condensed phase was high (We estimate 0.91 by extrapolating the NaOH data to high temperature and assuming they apply to CsOH.) and the condensate was sticky. Indirect evidence for increasing stickiness with concentration comes from tables of surface tension versus concentration of NaOH in the Handbook of Chemistry and PhysicsA2 shown below in Table A2.
Table A2. Surface Tension Versus Concentration of NaOH at 18' C.
Weight % Solute 2.72 5.66 16.66 30.56 35.9
Surface Tension 74.35 75.85 83.05 96.05 101.05 (dynes/cm)
The condensate in test CB3 consisted only of Al(OH), which would have remained solid (It changes to A1203 at 300 O C and A1203 melts at 2054' CA3) and is not reported as a hygroscopic compound. In fact, our equilibrium calculation shows Al(OH), gives off an H20 molecule at the temperature of test CB3 to become AlO(0H). Thus, test CB3 is the one that is most relevant for ITER ducts with high velocity flows and non-sticky aerosol condensates. (If ITER aerosol condensates are found to be sticky, the deposition fractions would be larger than those for non-sticky material.)
In order to compare the behavior of the LACE test aerosols to the results of calculations with the new models described in this document, it was necessary to estimate the density, surface tension, and viscosity of the aerosol particles in the LACE experiment. The remainder of this appendix describes the methods used to obtain the estimates.
A.l Particle Composition
The dry composition of the aerosols produced for each of the LACE tests was given as part of the test specification. This information along with the test temperature and the fact that the partial pressure of steam was 0.5 atmosphere was used to calculate the fraction of water condensed on the aerosol particles.
Table A3 shows the results of the calculation for each of the tests along with the results of some of the intermediate steps. The first column is the test name, the second is the composition of the aerosols used (water was added by absorption from the steam if the dry aerosol particles were hygroscopic), the third is the temperature in OC, and the fourth is the mass fraction of the dry materials used to form the aerosol. In the fifth
A3
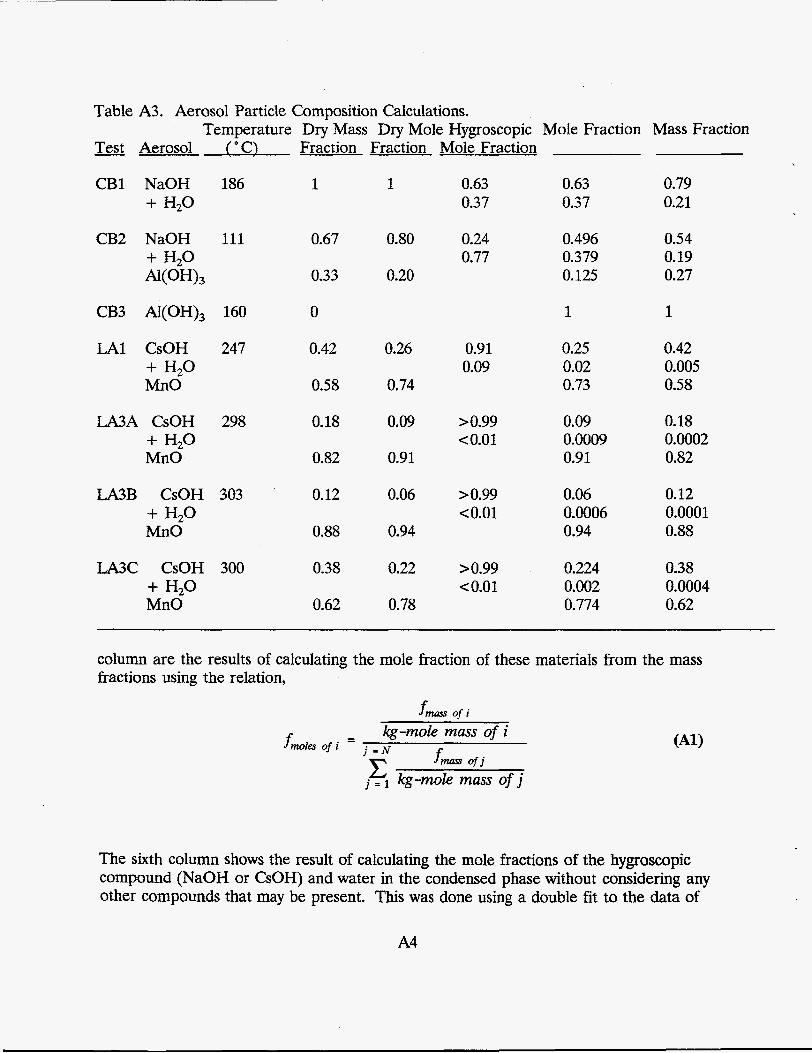
Table A3. Aerosol Particle Composition Calculations.
- Test Aerosol f"C) Fraction Fraction Mole Fraction Temperature Dry Mass Dry Mole Hygroscopic Mole Fraction Mass Fraction
CB1 NaOH 186 + H20
CB2 NaOH 111 + H20
CB3 AI(OH), 160
LA1 CsOH 247
NOH),
+ H,O MnO
LA3A CsOH 298 + H20 MnO
LA3B CsOH 303 + H20 MnO
LA3C CsOH 300 + H,O MnO
1
0.67
0.33
0
0.42
0.58
0.18
0.82
0.12
0.88
0.38
0.62
1
0.80
0.20
0.26
0.74
0.09
0.91
0.06
0.94
0.22
0.78
0.63 0.37
0.24 0.77
0.91 0.09
>0.99 co.01
>0.99 co.01
>0.99 co.01
0.63 0.37
0.496 0.379 0.125
1
0.25 0.02 0.73
0.09 0.0009 0.91
0.06 0.0006 0.94
0.224 0.002 0.774
0.79 0.21
0.54 0.19 0.27
1
0.42 0.005 0.58
0.18 0.0002 0.82
0.12 0.0001 0.88
0.38 0.0004 0.62
column are the results of calculating the mole fraction of these materials from the mass fractions using the relation,
- kg-mole mass of i fmoles o f i - j = N c fmass of j
j = kg-mole muss of j
The sixth column shows the result of calculating the mole fractions of the hygroscopic compound (NaOH or CsOH) and water in the condensed phase without considering any other compounds that may be present. This was done using a double fit to the data of
A4
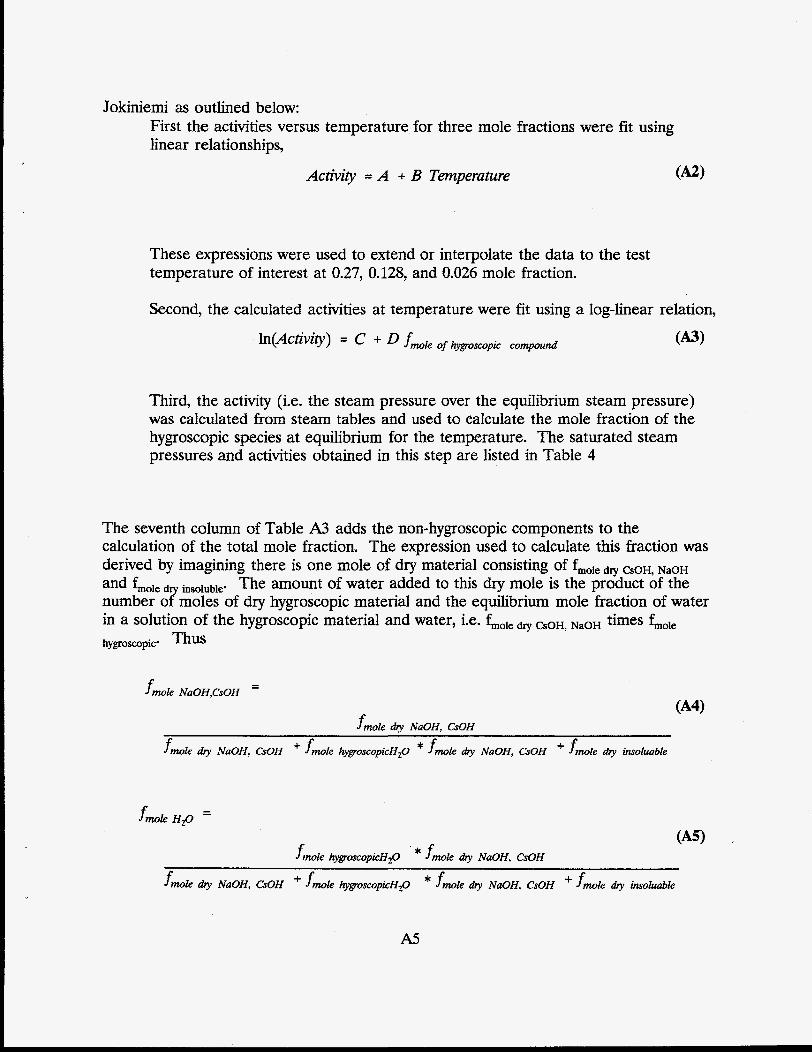
Jokiniemi as outlined below: First the activities versus temperature for three mole fractions were fit using linear relationships,
Activity = A + B Temperature
These expressions were used to extend or interpolate the data to the test temperature of interest at 0.27, 0.128, and 0.026 mole fraction.
Second, the calculated activities at temperature were fit using a log-linear relation, = + f m l e of hygroscopic compound
Third, the activity (Le. the steam pressure over the equilibrium steam pressure) was calculated from steam tables and used to calculate the mole fraction of the hygroscopic species at equilibrium for the temperature. The saturated steam pressures and activities obtained in this step are listed in Table 4
The seventh column of Table A3 adds the non-hygroscopic components to the calculation of the total mole fraction. The expression used to calculate this fraction was derived by imagining there is one mole of dry material consisting of fmole dry CsOH, NaOH and fmole dry insoluble' The amount of water added to this dry mole is the product of the number of moles of dry hygroscopic material and the equilibrium mole fraction of water in a solution of the hygroscopic material and water, i.e. fmole dry CsOH, NaOH times fmole hygroscopic' Thus
- f m I e NaOH.Cs0H -
(A41 fmole dry NaOH, CsOH
f m l e dry NaOH, CsOH f m I e hygroxopicH20 * f m I e &y NaOH, CsOH -k f m l e d?y insoluable
(A51 finole hygoscopicH,O * fmle dry NaOH, CSOH
f m l e &Y NaOH, CSOH + f m l e hygroscopicH20 * f m l e dry NaOH, CsOH + f m l e dry insokable
A5
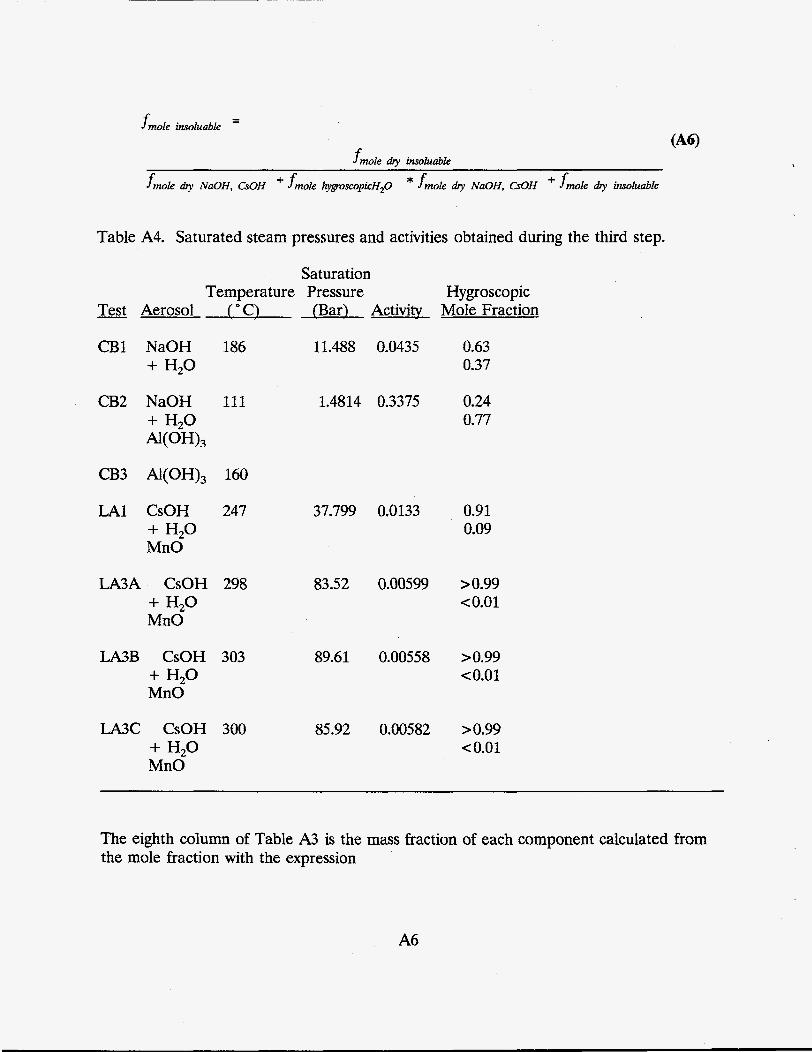
- fmole insohable -
J m l e dry insohable
f m l e dry NaOH, &OH fmole hygroscopicH20 * f m l e dry NaOH, CsOH i- f m l e dty insohable
Table A4. Saturated steam pressures and activities obtained during the third step.
Saturation Temperature Pressure Hygroscopic
Test Aerosol ("C) (Bar) Activity Mole Fraction
CB1 NaOH 186 + H 2 0
CB2 NaOH 111 + H20 fWH),
CB3 Al(OH), 160
LA1 CsOH 247 + H,O MnO
LA3A CsOH 298 + H20 MnO
LA3B CsOH 303 + H,O MnO
CsOH 300 + H,O MnO
11.488 0.0435
1.4814 0.3375
37.799 0.0133
83.52 0.00599
0.63 0.37
0.24 0.77
0.91 0.09
> 0.99 co.01
89.61 0.00558 >0.99 co.01
85.92 0.00582 >0.99 co.01
The eighth column of Table A3 is the mass fraction of each component calculated from the mole fraction with the expression
A6
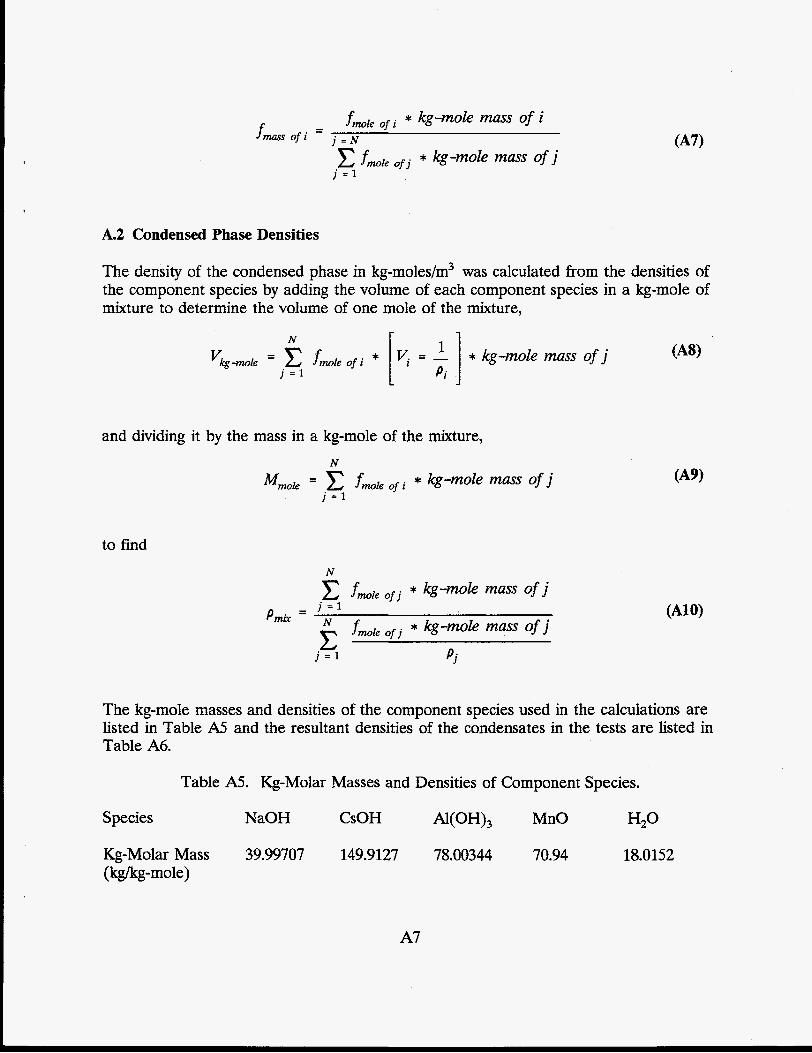
* kg-mole mass of i - - f m l e o f i f m a r r o f i j = N
j = 1 * kg-mole mass of j E fmole of j
A.2 Condensed Phase Densities
The density of the condensed phase in kg-moles/m3 was calculated from the densities of the component species by adding the volume of each component species in a kg-mole of mixture to determine the volume of one mole of the mixture,
N r . 1 Vkgmle = fmle of * I = I * kg-mole mass of j
j = 1 L J
and dividing it by the mass in a kg-mole of the mixture, N
Mmle = E f m l e o f i kg-mole mass of j j = 1
to find N
f m l e o f j * kg-mole mass of j - j = l
Pmi, - N * kg-mole mass of j E fmle of j
j = 1 P j
The kg-mole masses and densities of the component species used in the calculations are listed in Table A5 and the resultant densities of the condensates in the tests are listed in Table A6.
Table A5. Kg-Molar Masses and Densities of Component Species.
Species NaOH CsOH Aw9, MnO H2O
Kg-Molar Mass 39.99707 149.9127 78.00344 70.94 18.0 15 2 (kg/kg-mole)
A7
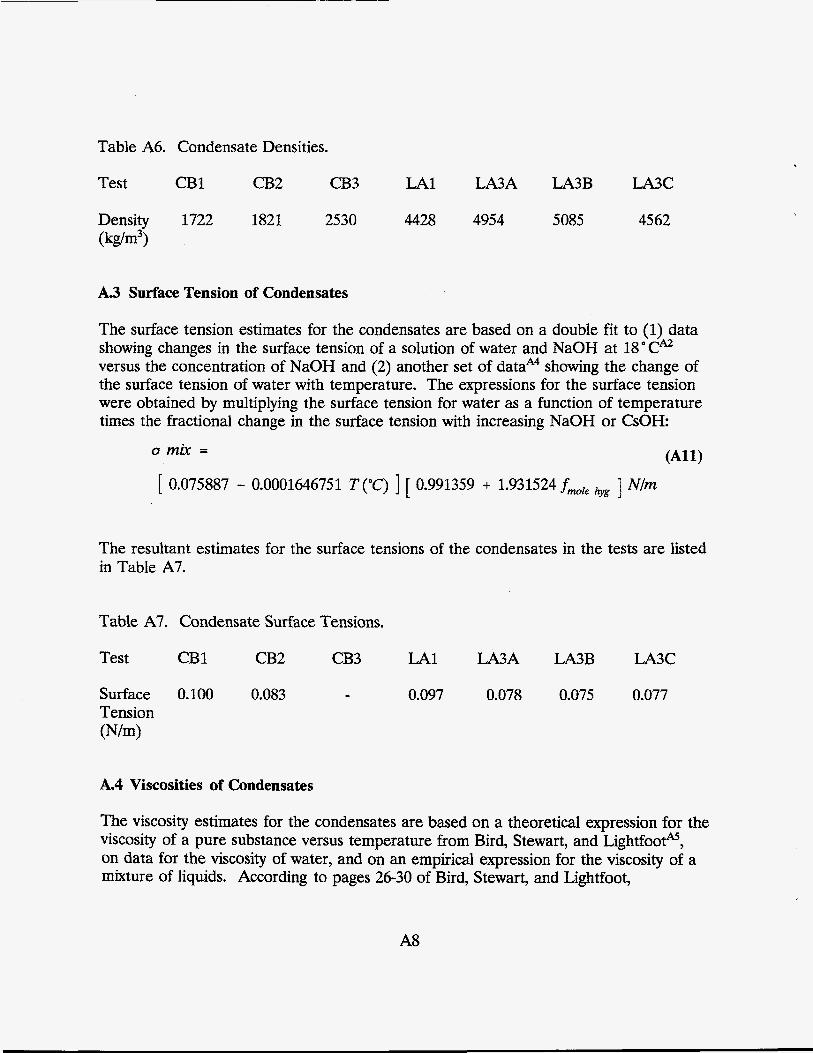
Table A6. Condensate Densities.
Test CB1
Density 1722 (kg/m3>
CB2 CB3
1821 2530
LA1
4428
LA3A
4954
LA3B
5085
LA3C
4562
A 3 Surface Tension of Condensates
The surface tension estimates for the condensates are based on a double fit to (1) data showing changes in the surface tension of a solution of water and NaOH at 18 a CA2 versus the concentration of NaOH and (2) another set of dataA4 showing the change of the surface tension of water with temperature. The expressions for the surface tension were obtained by multiplying the surface tension for water as a function of temperature times the fractional change in the surface tension with increasing NaOH or CsOH:
u mix =
[ 0.075887 - 0.0001646751 T("C) ] [ 0.991359 + 1.931524 fmre hyg ] Nlm
The resultant estimates for the surface tensions of the condensates in the tests are listed in Table A7.
Table A7. Condensate Surface Tensions.
Test CB1
Surface 0.100 Tension (N/m)
CB2
0.083
A.4 Viscosities of Condensates
CB3 LA1
0.097
LA3A
0.078
LA3B u 3 c
0.075 0.077
The viscosity estimates for the condensates are based on a theoretical expression for the viscosity of a pure substance versus temperature from Bird, Stewart, and Lightfoop, on data for the viscosity of water, and on an empirical expression for the viscosity of a mixture of liquids. According to pages 26-30 of Bird, Stewart, and Lightfoot,
A8
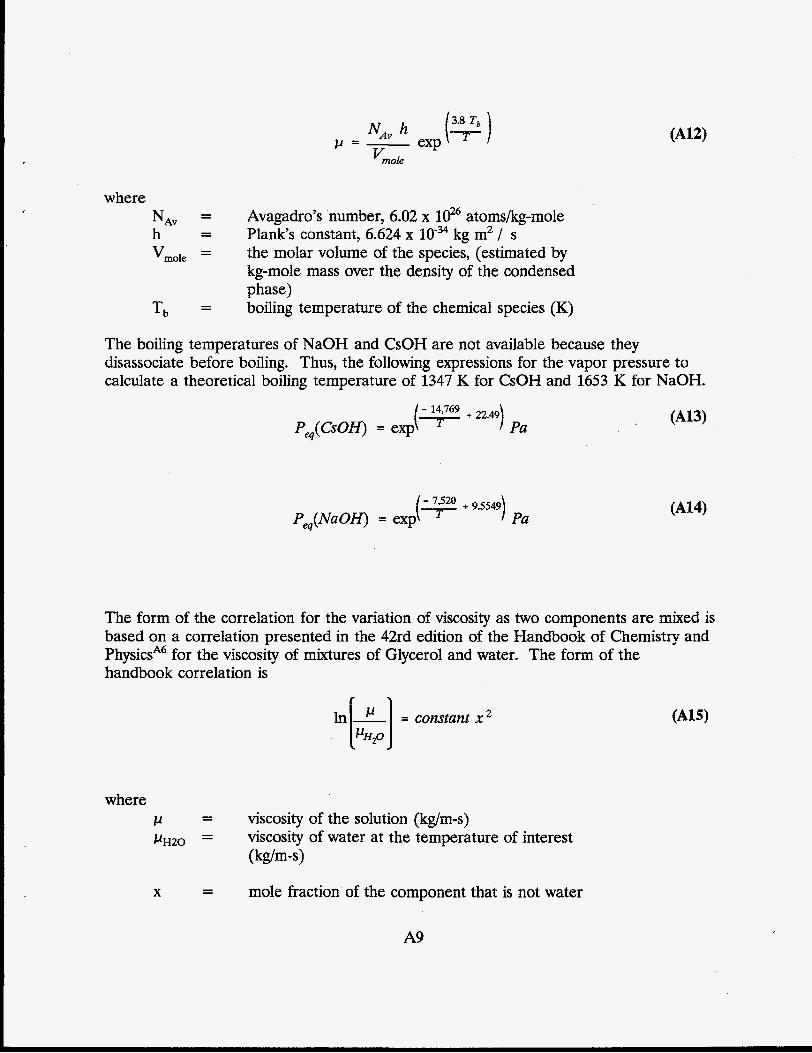
where NAv = Avagadro's number, 6.02 x ld.6 atomskg-mole h - - Plank's constant, 6.624 x kg m2 / s Vmole = the molar volume of the species, (estimated by
kg-mole mass over the density of the condensed phase)
T b = boiling temperature of the chemical species (K)
The boiling temperatures of NaOH and CsOH are not available because they disassociate before boiling. Thus, the following expressions for the vapor pressure to calculate a theoretical boiling temperature of 1347 K for CsOH and 1653 K for NaOH.
( q E + 9.5549) Peq(NuOH) = exp Pa
The form of the correlation for the variation of viscosity as two components are mixed is based on a correlation presented in the 42rd edition of the Handbook of Chemistry and PhysicsA6 for the viscosity of mixtures of Glycerol and water. The form of the handbook correlation is
In
where F.c = viscosity of the solution (kglm-s) ~ . c ~ ~ ~ = viscosity of water at the temperature of interest
(kglm-s)
X = mole fraction of the component that is not water
A9
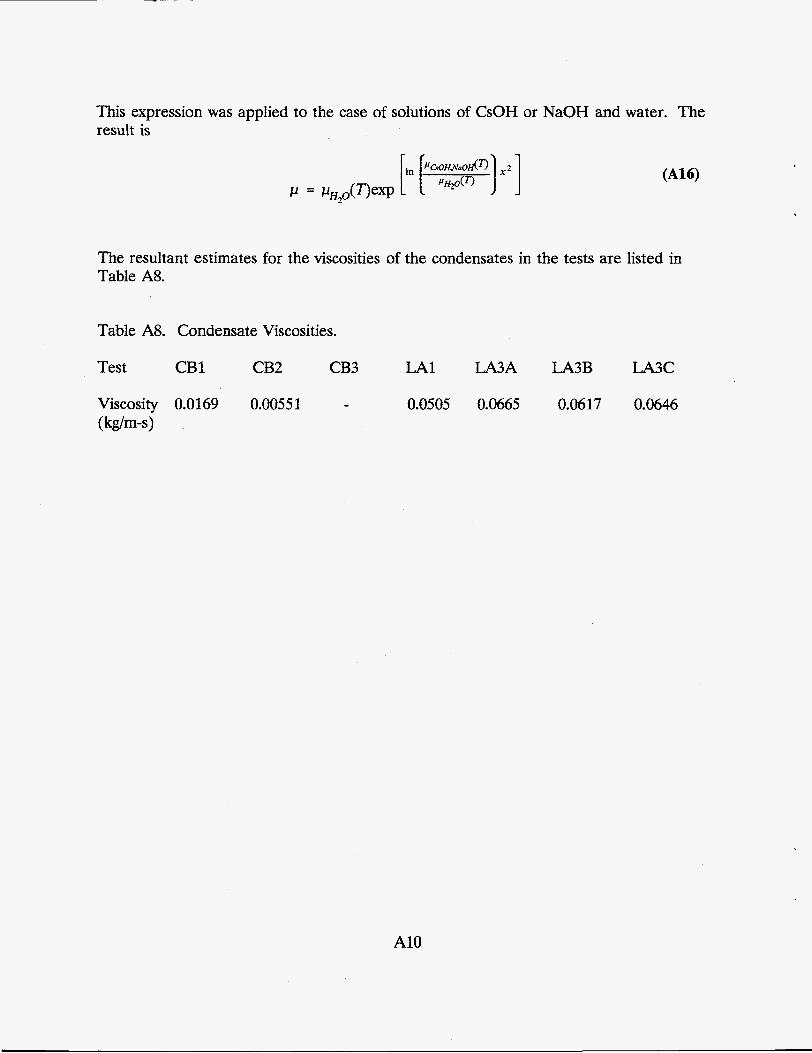
This expression was applied to the case of solutions of CsOH or NaOH and water. The result is
The resultant estimates for the viscosities of the condensates in the tests are listed in Table A8.
Table A8. Condensate Viscosities.
Test CBI CB2 CB3
Viscosity 0.0169 0.00551 (kg/m-s)
LA1 LA3A
0.0505 0.0665
LA3B LA3C
0.0617 0.0646
A10
A S Appendix A References
A1 .
A2.
A3.
A4.
A5.
A6.
Jorma Jokiniemi, "The Growth of Hygroscopic Particles during Severe Core Melt Accidents," Nuclear Technology 83, pp, 16-23, October 1988.
Handbook of Chemistry and Physics, 60 th edition.
John A. Dean, Lange's Handbook of Chemistry. Fourteenth Edition, New York: McGraw-Hill, Inc., 1992.
Charles D. Hodgman (ed.), Handbook of Chemistiy and Physics. 38 th edition, 1956, page 2016.
R. Byron Bird, Warren E. Stewart, and Edwin N. Lightfoot, Transport Phenomena, New York: John Wiley & Sons, 1960.
Charles D. Hodgman (ed.), Handbook of Chemistry and Physics. 43rd edition, 1961.
All

Appendix B
Listing of Fortran Coding for Modifications of MELCOR
B- 1
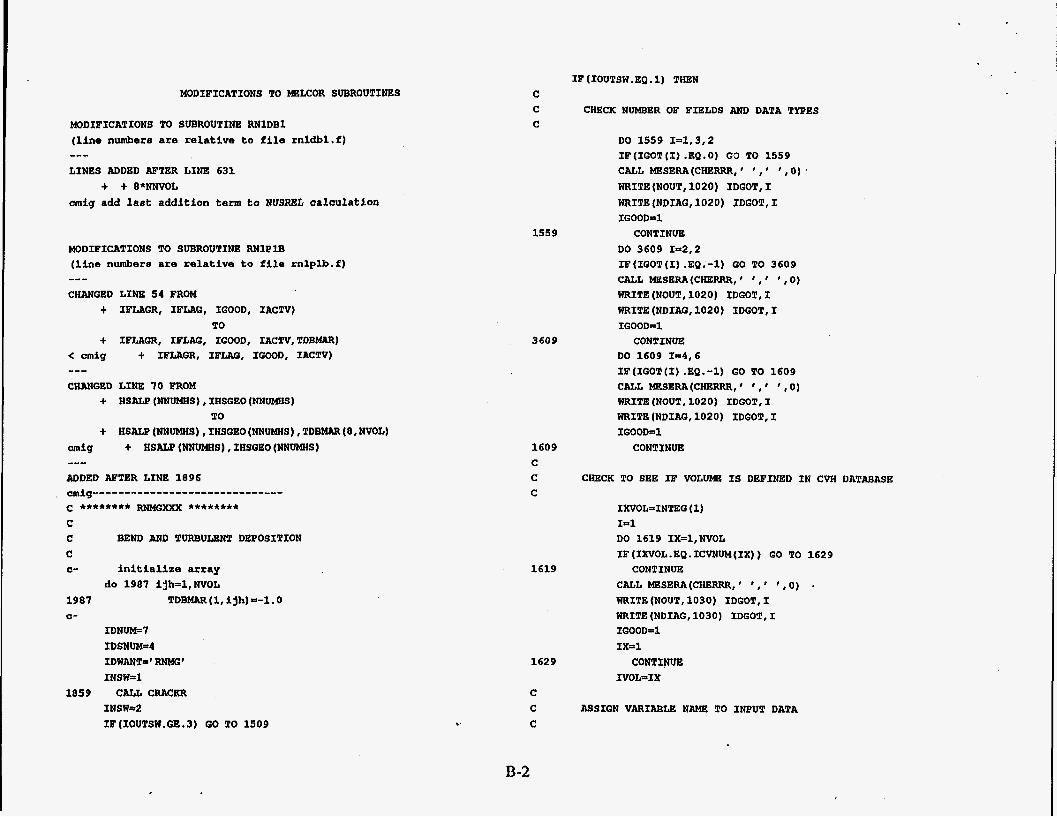
MODIFICATIONS TO MELCOR SUBROUTINES
MODIFICATIONS TO SUBROUTINE RNlDBl ( l i n e n u m b e r e are relat ive t o f i l e r n l d b 1 . f )
LINES ADDED AFTER LINE 631
cmig add laet addi t ion term to NUSREL aaloulation
--- t t 8*NNVOL
MODIFICATIONS TO SUBROUTINE R N l P l B ( l i n e n u m b e r a are relative t o f i le m 1 p l b . f )
CHANGED LINE 54 FROM ---
t IFLAGR, IFLAQ, IGOOD, IACTV) TO
+ IFLRGR, IFLAG, IGOOD, IACTV,TDBMAR) < cmig t IFWLCR, IFIAG, IGOOD, IACTV)
CHANGED LINE 70 FROM ---
t HSALP (NNUMHS) , IHSGEO(NNUMHS) TO
t HSAW (NNUMHS) , IHSGEO (NNUMHS) , TDBMRR (8, NVOL) cmig t HSAtP (NNUMHS) , IHSGEO(NNUMHS)
ADDED AFTER LINE 1896 --- omig------------------------------ c ******** m x x x ******** C C BEND AND TURBULENT DEPOSITION C C- i n i t i a l i z e array
do 1987 i jh=l ,NVOL 1987 TDBMAR(1, i j h ) n - 1 . 0 0-
I D N W 7 IDSNOM=4 IDWANT=' RNMC' INSW=d
1859 CALL CRACKR INSW=2 IF(IOUTSW.GE.3) GO TO 1509
C C C
1559
3609
1609 C C C
1619
1 6 2 9
C C C
B -2
IF (IOUTSW . EQ .1) THEN
CHECK NUMBER OF FIELDS AND DATA TYPES
DO 1559 1=1,3,2 I F ( I G O T ( 1 ) .EQ.O) GO TO 1559 CALL MESERA(CHERRR, ' ' , ' ' , 0) '
WRITE (NOUT, 1 0 2 0 ) IDGOT, I WRITE (NDIAG, 1020) IDGOT, I IGOODPl
CONTINUE DO 3609 I = 2 , 2 I F ( I G O T ( 1 ) .EQ.-1) GO TO 3609 CALL MeSERA(CHERRR, ' ' , ' ' , 0 ) WRITE (NOUT, 1 0 2 0 ) IDGOT, I WRITE (NDIAG, 1 0 2 0 ) IDGOT, I IGOOD=l
CONTINUE DO 1609 I = 4 , 6 I F ( I G O T ( 1 ) .EQ.-l) GO TO 1609 CALL MeSERA(CHERRR, ' ' , ' ' ,0) WRITE (NOUT, 1 0 2 0 ) IDGOT, I WRITE (NDIAQ, 1 0 2 0 ) IDGOT, I IGOOD=l
CONTXNUE
CHECK TO SEE IF VOLUME IS DEFINED I N CVH DATABASE
IXVOL=INTEG ( 1 ) In1 DO 1619 IX=l,NVOL IF(IXVOL.EQ.ICVNUM(1X)) GO TO 1629
CONTINUE CALL MESERA(CHERRR,' I , ' ' , O ) *
WRITE (NOUT, 1 0 3 0 ) IDGOT, I WRITE (NDIAG, 1 0 3 0 ) IDGOT, I IGOOD=1 I X = l
CONTINUE IVOL=IX
ASSIGN VARIABLE NAME TO INPUT DATA
TDBMAR (1, IVOL) 4.0 TDBMAR(2, IVOL)=REAL(INTEG(l)) TDBMAR (3, IVOL) =REALV (2) TDBMAR (4, IVOL) =REAL (INTEG (3 ) ) TDBMAR (5, IVOL) =REALV (4) TDBMRR(6, IVOL)=REALV(5) TDBMAR (7, IVOL) =REALV( 6) TDBMAR ( 8 , IVOL) =REALV (7)
CALL MESERA(CHERRR, ', ' ' ,0) I
WRITE (NOUT, 1040) IDGOT WRXTE (NDIAG, 1040) IDGOT IGOOD-1
ELSE
#
END IF GO TO 1859
1509 CONTINUE cmig------------------------------ C
MODIFICATIONS TO SUBROUTINE RNlDBZ (line numbers are relative to file rn1dbz.f)
--- LINES ADDED AFTER LINE 599 cmig advance IRNEXT by additional storage
IRNEXT = IRElEXT t 8*NNVOL mi9 --- LINES ADDED AFTER LINE 765 a-
omig add pointer to beginning of last part of XRNI
LINE 789 CHANGED FROM
NNUMHS, XRNl (ICVPTH) , NGAPC, MAX (1, NGAPC) , IFLAGR, IFLAG, IGOOD, IACTV)
IMG=IR-Q*NNVOLtl
--- t
TO t
NNUMtlS,XRNl(ICVPTH) ,NGAPC,MAX(l,NGAPC), IFLAGR, IFLAG,IGOOD, IACTV, t XRNl (IMG) )
d g t NNUMffS, XRNl(1CVPTH) ,NGAPC,MAX(l,NoApC), IF-, IFLAO,IOOOD,IACTV) ---
B-3
MODIFICATIONS TO SUBROUTINE RNlDBD (line numbers are relative to file rn1dbd.f)
LINE 679 CHANGED FROM + XCV(KCWO0tIC) ,NUMHS,NNUMHS, IHS (NHSNUM) ,XHS (NHSMLN-IH) ,
TO t t
XCV(KCWO0tIC) ,XCV(KCVVLOtIC) ,NCWZ, ICV(KCWZP) ,XCV(KCVZ) , NUMHS, NNUMHS, IHS (NHSNUM) , XHS (NHSMLN-IH) , ---
LINE 686 CHANGED FROM t ISC(IPI4),ISC(IPIB) ,ISC(IPI9),ISC(IPI11),ISC(IPIl2))
t ISC(IPI4) ,ISC(IPIB) ,ISC'(IPI9) ,ISC(IPI11) ,ISC(IPI12), TO
t XRWl (XRRN1-8*NNvOL+l) ) cmig t ISC(IPI4) , ISC(IPf8), ISC(IPI9), ISC(IPI11) , ISC(IPT12) ) --- MODIFICATIONS TO SUBROUTINE RNlRN4 (line numbers are relative to file rnlrn4.f)
LINE 15 CHANGED FROM
---
+ PVOL, TVOL, CVOL, NUMHS, NNUMHS, IHSNUM, HSMULT, FILMLO, FILMRO, HSMCMN,
TO t +
PVOL, TVOL, CVOL, CVVELO, NCWZ, ICWZP, CVZ, NUMHS, NNUMHS, IHSNUM, HSMULT, FILMLO, FILMRO, HSMCMN, ---
LINE 18 CHANGED FROM t HSMTRN,WDEP, WCOND, IWORK, IC, IAERG, NHS, IERRX, IZ, IZO)
TO t HSMTRN,WDEP, WCOND, IWORK, IC, IAERG, NHS, IERRX, IZ, IZO, TDBMAR) ---
LINE 23 CHANGED FROM t IVDS (NVOL) , IDSUR (4, NNSUR) ,
TO + IVDS(NVOL),IDSUR(4,NNSUR),CVVEL0(2,NVOL), ---
LINE 39 CHANGED FROM t CVZPOL (NVOL) , CVAPOL (NVOL)
CVZPOL (NVOL) , CVAPOL (NVOL) , CVZ (NCWZ) , ICWZp (NVOLt1) TO
t ---
LINE 42 CHANGED FROM + ETRANs(NVOL)
TO t ETRANS (NVOL) , TDBMAR ( 8 , NVOL)
--- LINES ADDED AFTER LINE 42 cmig*************************
a c array TDBMAR(8,NVOL) (turbulent bend deposition array) a contains the following c index 1: flag for valid info: a -lainvalid entry C lnvalid entry E index 2: aatual volume id a index 3: charaateristia dimension (i.e. pipe diameter) c index 4: number o f bends in the bend model c index 5: turning angle of the bends (radians) o index 6: arose-seotional area over deposition area (bend deposit ion) a index 7: surface roughness for turbulent depostion model c index 8 : surface etiaking feator
LINE ADDED AFTER LINE 49 ---
COMXON / RESUSP / BOIL2(999),.ZB2(999) C --- LINaS ADDaD AFTER LINE 309 C * * * ACCOUNT FOR RESUSPENSION BY BOILING C
DO 13 N = 1, NVOL IF (BOIL2 (N) .GE. 0 . 0 ) GO TO 13 ISTAR - IWZP(N) DZPOOL = CVZPOL (N) -CVZ (SSTAR) DPART - (3.*(XMSEC(l)tXMSEC(2))/RHONOM/P1)**(1./3.) SF = BUBDF(DPART, TVOL(l,N), PVOL(N), DT, RHONOM, DZPOOL
DO 14 K = 1, NCLS . # CVAPOL (N) , BOIL2 (N) )
IF(AERlLN(K,N) .LE.O.O) GO TO 14 FRACRL.r MRX(-l.O,BOILP (N) /XMASS ( 1 , N ) ) DAERLN = FRACRL*AERlLN (K, N) *SF AERlLN( K,N) = MAX(O.,AERlLN( K,N)tDAERLN) AERlGN (1, K, N) = MAX ( 0 ., AER16N (1, K, N) -DAERLN)
14 13
C --- LINES C C C
390 C
C
C
C C C
3 90
CONTINUE CONTINUE
412-431 CHANGED FROM
GET BULK DENSITY AND DIFFUSIOPHORESIS FACTOR
XMSTM = XMASS(3,N) XMGAS = ZERO DO 390 Iu4,NMAT XMGAS = XMGAS + XMASS(1,N) CONTINUE
RHOBLK = (l[MoAs t XMSTM) / VOLuMe CALL HPOSAT (1, TSAT, PVOL (N) , RLIQ, RHOSTM, IERR)
WTST = 1000.DO * WM(3) XMOLES = XMSTM / WTST XMOLEG = XMGAS / WTMOL XMOLET = XMOLES + XMOLEG XMS = XMOLES / XMOLET XMA = 1.ODO - XMS XDIFFI = SQRT(WTST) / (XMS * SQRT(WTST) + XMA * SQRT(WTM0L))
TO
VGAS = CWELo(2,N) NUMVISX= 5 CALL MPEVAL (NUMVISX, XMRSS (1, N) , ICNCRN, 3, NMAT, ' CVH' ,
1 NMAT, PDUM, TVOL (2, N) , VISGAS , IGERR)
GET BULK DENSITY AND DIFFUSIOPHORESIS FACTOR
W T M = XMAsS(3,N) XMGAS = ZERO XMOLS = ZERO DO 390 I=Q,NMAT XMGAS = XMGAS 4- XMAsS(1,N) XMOLS XMOLS + XMASS(I,N)/WM(I) CONTINUE WAS = WTMOL IF (XMOLS . GT. ZERO) THEN WAS = ZERO
B-4
DO 395 In4,NUAT WMGAS = WMGAS + lOOO.*XMAsS (1,N) /XMOLS
395 CONTINUE ENDIF
C RHOBLK = (XMGAS + XMSTM) / VOLUME CALL H20SAT (1, TSAT, PVOL (N) , RLIQ, RHOSTM, IERR)
WTST = 1000.DO * WM(3) XMOLES = XMSTM / WTST XMOLEG = XMGAS / WMGAS XMOLET XMOLES t XMOLEG XMS = XMOLES / XMOLET XMA 1.ODO - XMS XDIFFI = SQRT(WTST) / (XMS * SQRT(WTST) t XMA * SQRT(WMGAS)) WAS = XMS*WTST t XMA*WMGAS
C
--- LINES 533-534 CHANGED FROM
DO 445 I=ISUM,ISUMP 445 AREAHS (I) =AREAHs (I) /VOLUME
TO DEPSUM = 0.0 DEPARA = 0.0 DO 445 I=ISUM,ISVMP DEPARA = DEPARA + AREAHS (I) DO 446 J=l,NCLS DEPSUM = DEPSUM + ROEPN (a, I)
DPMIN - (3.*(l(MSEC(1)tXMSEC(2))/RHONOM/PI)**(1./3.) DEPHGT = DEPSUM/RHONOM/DEPARA
446 4 45 AREAHS (I) =AREAHs (I) /VOLVME
..-- LINES ADDED AFTER 562
DPART = (3.*(XMSEC(L)+XMSEC(Ltl))/RHONOM/PI)**(1./3.)
GRAVITY
GRAVDEP = FGRAV (TVOL (2, N) , RHOBLK, VISGAS , WGAS, DPART, RHONOM)
array TDBMAR(8,NVOL) (turbulent bend deposit ion array) contains t h e following index 1: f l a g f o r va l id info:
-l=invalid e n t r y lnva l id en t ry
c index 2: actual volume i d c index 3: cha rac t e r i s t i c dimension ( i .e. pipe diameter) a index 4: number of bends i n the bend model c index 5: turning angle of t he bends (radians) o index 6: cross-sectional area over deposit ion area (bend deposition) c index 7: eurface roughness f o r turbulent depostion model c index 8: eurface at iaking factor
BENDDEP = 0.0 IF (TDBMAR (4, N) .GT . 0 . 0) THEN SR = MAX (TDBMAR (7, N) -DEPHGT, DPMIN) DELFLM - MAX(DEPHGT,O.O) ACOVRAS = PI*TDBMAR(3,N)**2/(4.*VOLUME) BENDDEP = FBEND( VGAS, DPART, VISGAS, RHONOM, TDBMAR(3,N)
. I TDBMAR(4,N), TDBMAR(5,N), ACOVRAS, TDBMAR(6,N)
., TDBMAR (8, N) , RHOBLK, DELFLM) ENDIF
TURBDEP = 0.0 SFTURB = 1.0 IF(TDBMAR(7.N) .QT.O.O) THEN SR = MAX(TDBMAR(7,N) -DEPHGT,DPMIN) DELFLM = MAX (DEPHGT, 0 . 0 ) TURBDEP = FTURB ( VGAS, DPART, VISGAS, RHONOM, TVOL(2,N), RHOBLK ., TDBMAR(3,N), SR, WMGAS, TDBMAR(8,N), DELFLM, SFTURB)
ENDIF C C * * THERMOPHORXSIS COEFFICIENT C
THRMDEP - FTHRM(TVOL(2,N) ,RHOBLK,VISGAs,WMGAS,DPART) C C * * DIFFUSION C
DIFFDEP - FDIFF (TVOL (2, N) ,RHOBLK, VISGAS, WMGAS, DPART) C C * * CHECK FOR EXCESS PARTICLE MOMENTUM C C -...- LINES 568-602 CHANGED FROM
IF(IND.EQ.1) THEN AKeRNL = - COEFAV(L3Mlt3) AKERNL f ZERO
ELSE IF(IND.EQ.2) THEN
B-5
ELSE IF (IND .EQ. 3) THEN
ELSE m R N L = COEFAV(L3Mlt3)
AKERNL = ZERO END IF IF (WCOND (I) . GE . ZERO) THEN DIFFIO = XDIFFI * WCOND(1) / RHOBLK
DIFFIO = WCOND (I) / RHOSTM ELSE
END IF AKERNL = AKERNL + COEFAV(L3Mltl) t t TGRAD (I) *COEFAV(L3Mlt2) t t DIFFIO AKERNL = MAX(ZER0,AKERNL) TDPCOF (L) TDPCOF (L) tAREAHS (I) *AKERNL
9 CONTINVE C c POOL C
DIFFIOaZERO AKERNL = COEFAV(L3M1+3) t COEFAV(L3Mltl) t tTGRADP*COEFAV(L3MIt2) t tD IFF IO AKERNL = MIU[(ZERO,AKERNL) TDPCOF (L) = TDPCOF (L) tAREAP *AKERNL
C C FLOWTHRUS C
AKERNL = COEFAV(L3Mlt3) t COEFAV(L3Mlt1) AKERNL = MAX (ZERO, AKERNL) TDPCOF (L) = TDPCOF (L) t ATHRU*Al(aRNL
TO C C GRAVITY C
IF (IND .EQ . 1) THEN AKERNL p - GRAVDW
ELSE IF (IND .EQ. 2) THEN AI[ERNL = ZERO
AKERNL = GRAVDEP
AKERNL = ZERO
ELSE IF(IND.EQ.3) THEN
ELSE
C C C
C C C
END IF IF (WCOND (I) .GE . ZERO) THEN DIFFIO = WIFFI * WCOND(1) / RHOBLK
DIFFIO = WCOND(1) / RHOSTM ELSE
END IF
ADD IN THERMOPHORESIS AND DIFFUSIOPHORESIS
AKERNL =(AKERNL t DIFFDEP t t TGRAD (I) *THRMDEP t t DIFFIO t TURBDEP) *SFTURB t t BENDDEP AKERNL = MAX(ZER0,AKERNL) TDPCOF (L) = TDPCOF (L) tAREAHS (I) *AKERNL CONTINUE
POOL
DIFFIO=ZERO AKERNL * GRAVDEP AKERNL = AKERNL t DIFFDEP t t TGRADP * THRMDEP t t DIFFIO t TURBDEP AKERNL = MAX(ZER0,AKERNL) TDPCOF (L) = TDPCOF (L) tAREAP*AKERNL
FLOWTHRUS
AKERNL = GRAVDEP t DIFFDEP AKERNL - MAX(ZER0,RKERNL) TDPCOF (L) = TDPCOF (L) t ATHRU*AKERNL
LINES ADDED AFTER LINE 749 7074,7120d6867 C
DPART = (3.*(XMSEC(I)tl(MSEC(It1))/RHONOM/PI) **(1./3.) C C GRAVITY C
GRAVDEP = FGRAV (TVOL (2, N) , RHOBLK, VISGAS , WMGAS , DPART, RHONOM) a a array TDBMAR (8, NVOL) (turbulent bend depoeit ion array)
B-6
c contains the following c index 1: f l a g f o r va l id info: C -1=invalid en t ry C l t v a l i d en t ry c index 2: ac tua l volume id c index 3: charac te r i s t io dimension (i.e. pipe diameter) c index 4: number of bends i n the bend model c index 5: turning angle of the bends (radians) c index 6: cross-sectional area over deposition area (bend deposit ion) c index 7: surface roughneas €or turbulent depostion model c index 8 : surface s t ick ing fac tor
BENDDEP = 0.0 IF (TDBMAR( 4, N) .GT. 0 .O) THEN SR = MAX (TDBMAR (7, N) -DEPHOT, DPMIN) DELFLM = MAX(DEPHGT,O.O) ACOVRAS = PI*TDBMAR(3, N) **2/ (4 .*VOLUME) BENDDEP = FBEND( VGAS, DPART, VISGAS, RHONOM, TDBMAR(3,N) ., TDBMAR(I,N), TDBMAR(5,N), ACOVRAS, TDBMAR(6,N) . # TDBMAR (8, N) , RHOBLK, DELFLM)
ENDIF TURBDEP 0 0.0
SFTURB = 1.0 ,- IF(TDBMAR(7,N) .GT.O.O) THEN SR p MAX (TDBMAR (7, N) -DEPHGT, DPMIN) DELFLM = MAX(DEPHGT,O.O) TURBDEP = FTURB( VGAS, DPART, VISGAS, RHONOM, TVOL(2,N), RHOBLK
. I TDBMAR(3,N), SR, WMGAS, TDBMAR (8, N) , DELFLM, SFTURB) ENDIF
C C * * THERMOPHORESIS COEFFICIENT C
THRMDEP = FTHRM(TVOL(2,N) ,RHOBLK,VISGAS,WMGAS, DPART) C C * * DIFFUSION C
DIFFDEP = FDIFF(TVOL(2,N) ,RHOBLK,VISGAS,WMGAS, DPART) --- LINES 751-788 CHANGED FROM
IF (NTYPE.EQ. 1) THEN AKERNL -COEFAV (ITERMt3)
AKERNL = ZERO ELSE IF(NTYPE.EQ.2) THEN
480 C C C
ELSE IF (NTYPE .EO. 3) THEN AKERNL = COEFAV (ITERM+3)
END IF IF (WCOND (J) .GE . ZERO) THEN DIFFIO =I XDIFFI * WCOND(J) / RHOBLK
DIFFIO = WCOND(J) / RHOSTM ELSE
END IF JUCERNL = AICERNL t COEFAV(ITERMt1)
t t + DIFFIO
+ TGRAD (J) *COEFAV (ITERM+2) AKERNL = MAX(ZER0,AXERNL) SUMH (J) =AREAHS (J) *AKERNL SUMDEPnSUMDEPtSUMH (J) IF (NTYPE .EQ. 3) SUMSET=SUMSET+AREAHS (J) CONTINUE
POOL
DIFF IO= 2 ERO AKERNL = COEFAV (ITERMt3) AKERNL = AKERNL t COEFAV(ITERMt1)
t t TGRADP*COEFAV( ITERMt2) t t DIFFIO
AKERNL = MAX(ZERO,AX(ERNL) SUMHP = AREAP*AKERNL SUMDEP = SVMDEP+SUM€iP SUMSET = SUMSETtAREAP
C C FLOWTHRUS C
AKERNX = COEFAV( ITERMt3) t COEFAV (ITERMt1) AKERNX = MAX (ZERO, AKERNX) SUMTRU = ATHRU*AKERNX
TO IF (NTYPE .EQ. 1) THEN AKERNL = - GRAVDEP ELSE IF (NTYPE .EQ. 2) THEN AKERNL = ZERO ELSE IF (NTYPE .EO. 3) THEN AKERNL = GRAVDEP END IF IF (WCOND (J) . GE . ZERO) THEN
B -7
C C
I
4 8 0 C C C
C C C
DIFFIO = WIFFI * WCOND(J) / RXOBLK
DIFFIO = WCOND(3) / RHOSTM ELSE
END IF SUBROUTINE ADDED FOR LIQUID ENTRAINED AEROSOL RE-SUSPENSION
AKERNL =(AXERNL + DIFFDEP t t TGRAD (J) *THRMDEP + t DIFFIO t TURBDEP)*SFTURB t t BENDDEP
AKERNL - MAX(ZER0, AI(ERNL) SUMH (J) =AReAHS (J) *AWRNL SUMDEP=SUMDEPtSUMH(J) IF (NTYPE .EQ. 3) SUMSET=SWETtAREAHS (J) CONTINUE
POOL
DIFFIO=ZERO AKERNL 5 GRAVDEP AKERNL 5 AKERNL t DIFFDEP
t t TGRADP*THRMDEP t t DIFFIO t TURBDEP
AI(ERI(L = MRX(ZERO,RI(eRNL) SUMHP = AREAP*AKERNL SUMDEP SUMDEPtSUMHP SUMSET = SUMSETCAREAP
FLOWTHRUS
AKERNX = GRAVDEP t DIFFDEP RKERNX a MAX (ZERO, AI(ERNX) SUMTRU = ATHRU*AKERNX
*DECK BUBDF FUNCTION BUBDF (DPART, TP, PT, DT,RHOP, ZPOOL,APOOL,DML)
C C SPARC CLONE FOR MELCOR C C *- INCLUDE SC4405 C C C C C C C C C
C C
4 4 0 5 CONTAINS COEFFICIENTS FOR SPARC BUBBLE PHYSICS MODEL DZZERO IS THE ZERO EFFICIENCY BUBBLE RISE HEIGHT DZEFF I S THE FULL EFFICIENCY BUBBLE RISE HEIGHT I N FLOW
JUNCTION HEIGHTS (FLHGT*DZEFF) DTMPZR IS THE ZERO EFFICIENCY TEMPERATURE DIFFERENCE BETWEEN
THE POOL TEMPERATURE AND THR SATURATION TEMPERATW DTMPZR IS THE FULL EFFICIENCY TEMPERATURE DIFFERENCE BETWEEN
THE POOL TEMPERATURE AND THE SATURATION TEMPERATURE PEFF IS THE RELATIVE HUMIDITY OF THE STEAM AT THE SURFACE COMMON /F4405 1 I 4 4 0 5 , C 4 4 0 5 ( 5 ) , HA4405 COMMON /CP4405/ J P 4 4 0 5 , I S 4 4 0 5 ( 1 ) , I E 4 4 0 5 ( 1 ) , MA4405 COMMON /CF4405/ C I 4 4 0 5 CHARACTER CI4405*19 EQUIVALENCE ( C4405(1),DZZERO ) , ( C4405(2) ,DZEFF) ,
1 ( C4405 (3), DTMPZR ) , (C4405 ( 4 ) , DTEFF) , (124405 (5 ) ,PEFF)
...................................................................... C COMMON BLOCKS CONTAINING COEFFICIENTS, POINTERS, AND IDENTIFIERS FOR C ANALYTIC FUNCTION - SURFACE TENSION AS A FUNCTION OF TEMPERATURE: C C SIGMA(T) = A ( l ) * (A(2 ) tA(3 )*TR) * TR**A(4) t A ( 5 ) C C WHERE C C T = TEMPERATURE AND C TR = A(6) - T / A ( 7 ) . C C ELEMENTS:
B-8
C C A(1) +I C4000 (I), I-TH COEFFICIENT 1 4 , . . . , 7. C --------------------___^________________------------------------------
C COMMON /F4000 / 14000 , C4000(7) , NA4000 COMMON /CP4000/ JP4000, IS4000(7) , IE4000(7) , MA4000 COMMON /CF4000/ CI4000 CHARACTER CI4000*120
C *- C *- INCLUDE MPPRNO C C C C
C C C C C C C C C C
C *-
C
C
C COMMON BLOCK /MPPRNO/ HAS ORDERING OF PROPERTIES IN LIST GIVEN IN /MPPRNM/
COMMON /MPPREIO/ NUMENH, NUMTMP, NUMCPS, NUMTHC, NUMVIS, NUMDIF, 1 NVMRHO
NUMENH = 1 ENTHALPY NUMTMP = 2 TEMPERATURE NUMCPS = 3 SPECIFIC HEAT NUMTHC = 4 THeRMRL CONDUCTIVITY NUMVIS = 5 VISCOSITY NUMDIF = 6 DIFFUSIVITY NUMRHO = 7 DENSITY
DIMENSION XMASS (3)
ZERO =O .DO HALF m0.5DO
CALL H20SAT(O,TP,PWSATrRH0W,RHOV, IERR) TPX
SIGMA = C4000 (1) * (C4000 (2) tC4000 (3) *TRX) * TRX**C4000 (4) f MAX(273. ,MIN (TP, 563 .) )
ZRX +I C4000(6) - TPX/C4000(7) C
1 + C4000(5) SIGMA MAX(SIGMR,l.E-20) C NUMMAT 3 C XMASS(3) a HALF C
CALL MPEVAL(NUMVIS,XMASS,ICNCRN,3,3, 'CVH', 1 NUMMAT, PDUM, TP,VISVAP, IGERR)
NUMMAT = 1 )LMASS(l) = HALF CALL MPEVAL (NUMVIS, XMASS, ICNCRN, 1, 1, CVH' ,
NUMMAT, PDUM, TP, VISLIQ, IGERR) 1
PI 5: ACOS(-1.0) GC = 9.80665D0 DB +i 2. *SQRT (SIGMA/ (GC* (RHOW-RHOV) ) ) RB = DB/2. VB = ' * DB **3 / 6.ODO SB = 6.ODO * VB / DB
01 = GC*VISLIQ*(VISLIQ/SIGMA)**3/RHOW VRI = 2. *RB*RB*GC* (RHOW-RHOV) / (12. *VfSLIQ) REB 2.*RHOW*VRl*RB/VISLIQ IF(REB.LT.2.0) THEN VRISE = VR1 GO TO 10
ENDIF VR2 = 0.33*GC**0.7ri*~RHOW/VISLIQ)**0.52*RB**1.28 REB = 2 .*RHOW*VRS x...,/VISLIQ RE1 4 4.02/61**0.214 IF (REB .GE .2.0 .AND. REB.LT .RE1) THEN VRISE = VR2 GO TO 10
ENDIF RE2 = 3.1/01**0.25 VR3 = 1.35* (SIGMh/RHOW/RB) * *0 .5 REB = 2.*RHOW*VR3*RB/VISLIQ IF(REB.GE.RE1 .AND. REB.LT.RE2) THEN VRISE = VR3 GO TO 10
ENDIF VRISE - 1.53* (GC*SIGMA/RHOW) **O. 25
10 CONTINUE
VBUBL = ABS (DML/ (DT*APOOL*RHOV) ) VBUBL = MAX(VRXSE,VBUBL)
DECONTAMINATION DUE TO GRAVITATIONAL SETTLING
B-9
c
C C C
C C C C
C
C
C
C
C
C
C
C
C
CM 1.1 VS 5 M O P * DPAFtT**2 * CM * GC / (18.DO * VISVAP)
CENTRIFUGAL FORCES
VCM = 9.DO * VRISE * VRISE * VS / (2.DO * DB * GC)
BROWNIAN DIFFUSION
BOLTZ - JOULE / DE0 K BOLTZ = 1.38047D-23 CM = 1.1 DIFFUS = BOLTZ * TP * CM /. (3.DO * DPART * Pf * VISVAP) M 2.DO * SQRT( DIFFUS * VRISE / ( P I * DB) )
A = VS
B = VCM
C = M - W
D = B + C
SUMVB- V S 4 - V D - w SUMVT = - VS t VD - W
TERMX I- A*A + 4 . 0 0 0 * D * B I F (TERMX . LT . ZERO) THEN
DFALL = 1.DO GO TO 110
END IF
IF (B .EQ. ZERO) THEN THETA1 a 0 .DO THETA2 ACOS (-D/A) GO TO 120
END IF
TOPN = A - SQRT(TERMX) TOPP = A -6 SQRT(TERMX) BOT 2.ODO * B
IF (ABS (TOPN/BOT) .LE. 1. ODO) THEN THETAN = ACOS (TOPN/BOT)
THETAN = 0.DO ELSE
END IF C
IF(ABS(TOPP/BOT) .Le.l.ODO) THEN THETAP * &COS (TOPP/BOT)
THETAP = O.DO ELSE
END I F C
THETAl = MIN (TH!ZT&N, THETAP) IF(SUMVB.GE.O.DO) THETAl = O.DO
C
C 120
THETA2 = W(TUETAN,THETAP) IF(SUMVT.GE.O.DO) THETA2 = P I
CONTINUE TERMl = 3.ODO / DB SIN,12 = SIN(THETA1) * SIN(THFTA1) SIN22 = SIN(THETA2) * SIN(THETA2) TERM2 = 0.5DO * A * SIN22 TERM3 = B * COS(THETA2) * (S IN22 4- 2.ODO) / 3.000 TERM4 = C * COS(THeTA2) TERMS = O.SDO * A * S I N 1 2 TERM6 = B * COS(THETA1) * (S IN12 t 2.ODO) / 3 . O D O TERM7 = C * COS(THETA1) TERMAL TERMl * (TERM2 - TERM3 - TERM4
t - TERMS t TERM6 t TERM7) C
E W Z = TERMAL/VBUBL DFALL ( l . - E W (-EWZ) ) /EWZ
C 110
C
DFTOT = DFALL IF(DFTOT.LT.1.OD-5) DFTOT=l.OD-5
BUBDF = DFTOT
RETURN END
B-10
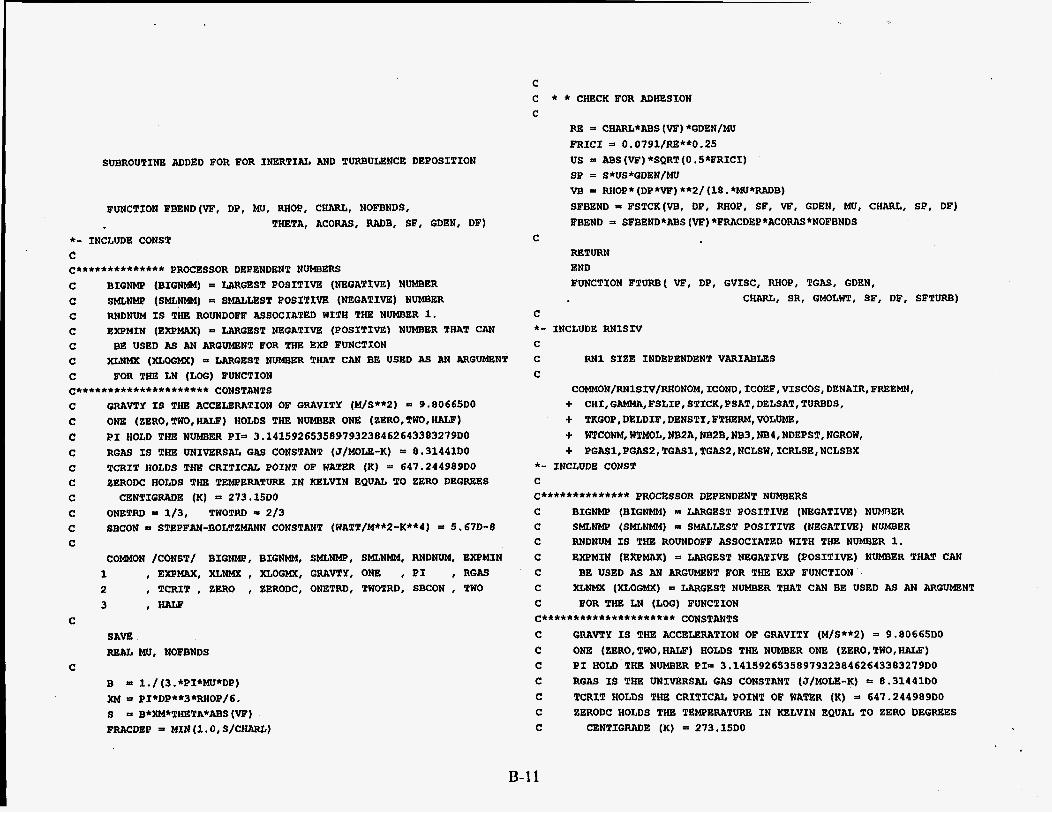
SUBROUTINE ADDED FOR FOR INERTIAL AND TURBULENCE DEPOSITION
FUNCTION FBEND(VF, DP, MU, RHOP, CHARL, NOFBNDS, THETA, ACORAS, RADB, SF, GDEN, DF)
*- INCLUDE CONST c C************** PROCESSOR DEPENDENT NUMBERS C BIGNMP (BIGNMM) = LARGEST POSITIVE (NEGATIVE) NUMBER C SMLNMP (SMLNMM) = SMALLEST POSITIVE (NEGATIVE) NUMBER C RNDNUM IS THE ROUNDOFF ASSOCIATED WITH THE NUMBER 1. C EXPMIN (EXPMAX) = LARGEST NEGATIVE (POSITIVE) NUMBER THAT CAN C C XLNMX (XLOGMX) = LARGEST NUMBER THAT CAN BE USED AS AN ARGUMENT C FOR THE LN (LOG) FUNCTION
C GRAVTY IS THE ACCELERATION OF GRAVITY (M/S**2) = 9.80665DO C ONE (ZERO,TWO,HALF) HOLDS THE NUMBER ONE (ZERO,TWO,HALF) C
C TCRIX HOLDS THE CRITICAL POINT OF WATER (K) - 647.244989DO C ZERODC HOLDS THE TEMPERATURE IN XELVIN EQUAL TO ZERO DEGREES C CENTIGRADE (K) - 273.1580 C ONETRD = 1/3, TWOTRD = 2/3
BE USED AS A N ARGUMENT FOR THE EXP FUNCTXON
C********************* CONSTANTS
PI HOLD THE NUMBER PI= 3.141592653589793238462643383279DO C RGAS IS THE UNIVERSAL GAS CONSTANT (J/MOLE-K) 8.31441D0
C SBCON = STEPFAN-BOLTZMRNN CONSTANT (WATT/M**2-K**4) 5.67D-8 C
COWON /CONST/ BIGNMP, BIGNMM, SMLNMe, S M L W , RNDNWM, EWMIN 1 , EXPMAX, XLNMX, XLOGMX, GRAVTY, ONE , PI , RGAS 2 , TCRIT , ZERO , ZERODC, ONETRD, TWOTRD, SBCON , TWO 3 1 -
C
C
SAVE REAL MU, NOFBNDS
B = 1./(3.*PI*MU*DP) XM 5 PI*DP**8*RHOP/C. S = B*XM*THETA*ABS(VF) FRACDEP = MIN(l.O,S/CHARL)
C C * * CHECK FOR ADHESION C
Rs - CHARL*ABS(VF)*GDEN/MU FRICI = 0.0791/RE**0.25 US = ABS (VF) *SQRT (0.5*FRICI)
VB = RHOP*(DP*VF)**2/(18.*MU*RADB) SFBEND a FSTCK(VB, DP, RHOP, SF, W, GDEN, MU, CHARL, SP, DF) FBEND = SFBEND*ABS(VF)*FRACDEP*ACORAS*NOFBNDS
SP = S*US*GDEN/MU
C =TURN END FUNCTION FTURB( VF, DP, GVISC, RHOP, TGAS, GDEN,
CHARL, SR, GMOLWT, SF, DF, SFTURB) C *- INCLUDE RNlSIV C C W 1 SIZE INDEPENDENT VARIABLES C
COMMON/RN1SIV/RHONOM,ICOND,ICOEF,VISCOS,DENAIR,FREE~, + CHI,GAMMA,FSLIP, STICK,PSAT,DELSAT, TURBDS, + TKGOP,DELDIF,DENSTY,FTHERM,VOLUME, + WTCONM, WTMOL, NBPA, NB2B,NB3, NB4, NDEPST, NGROW, + PGASl,PGASP, TGAS1, TGASl,NCLSW, ICRLSE,NCLSBX
*- INCLUDE CONST C C************** PROCESSOR DEPENDENT NUMBERS C BIGNMP (BIGNMN) = LARGEST POSITIVE (NEGATIVE) NUMDER C SMLNMP (SMLNMM) = SMALLESX POSITIVE (NEGATIVE) NUMBER C RNDNUM IS THE ROUNDOFF ASSOCIATED WITH THE NUMBER 1. C EWMIN (EXPMAX) = LARGEST NEGATIVE (POSITIVE) NUMBER THAT CAN C BE USED AS AN ARGUMENT FOR THE EXP FUNCTION C XLNMX (XLOGMX) = LARGEST NUMBER THAT CAN BE USED AS Aw ARGUMENT C FOR THE LN (LOG) FUNCTION
C ORAVTY IS THE ACCELERATION OF GRAVITY (M/S**2) = 9.80665DO C ONE (ZERO,TWO,HALF) HOLDS THE NUMBER ONE (ZERO,TWO,HALF) C PI HOLD l!He NUMBER PI= 3.141592653589793238462643383279DO
C TCRIT HOLDS THE CRITICAt POINT OF WATER (K) 5 647.244989DO C ZERODC HOLDS THE TEMPERATURE IN KELVIN EQUAL TO ZERO DEGREES C CENTIGRADE (K) = 273.15DO
...................... CONSTANTS
C RGAS IS THE UNIVERSAL GAS CONSTANT (J/MOLE-K) =X 8.31441DO
B-11
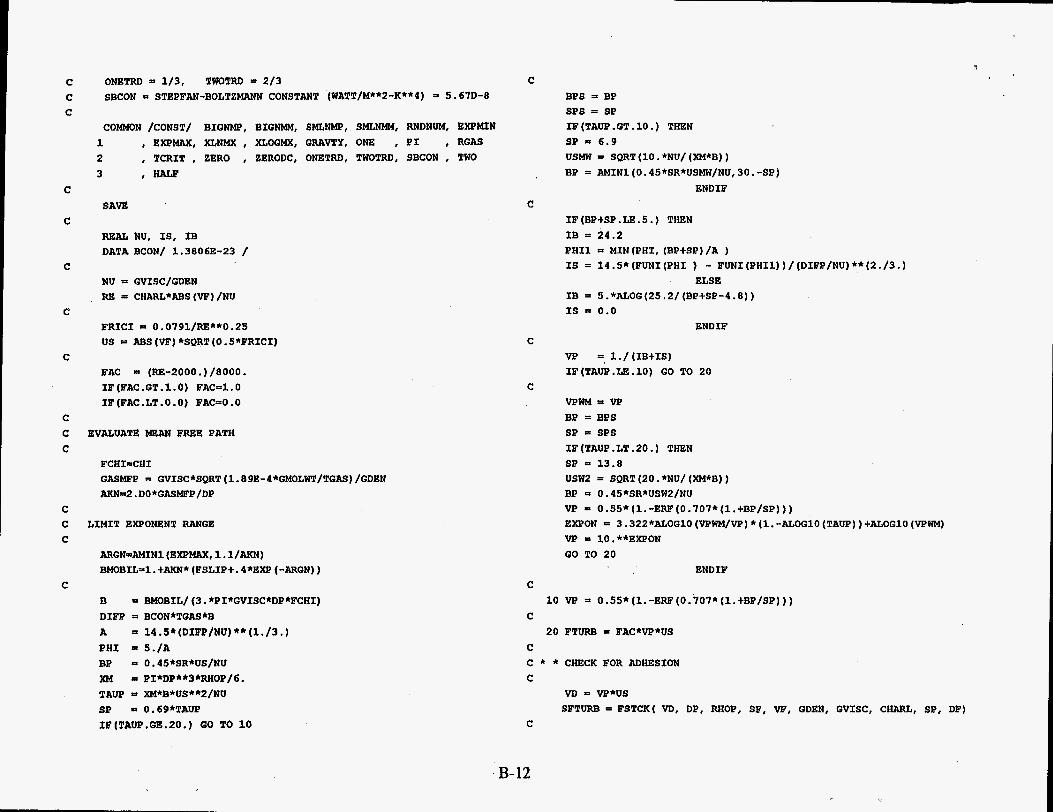
C C C
C
C
C
C
C
C C C
C C C
C
ONETRD = 1/3, TWOTRD = 2/3 SBCON STEPFAN-BOLTZMRNN CONSTANT (WATT/M**Z-K**4) 5.67D-8
COMMON /CONST/ BIGNMP, BIGNMM, SMLNMP, SMLNMM, RNDNUM, EXPMIN 1 , EICPMAX, XLNMX, XLOGMX, GRAVTY, ONE , PI , RGAS 2 , TCRIT , ZERO , ZERODC, ONETRD, TWOTRD, SBCON , TWO 3 #HALF
S A W
REAL NU, IS, IB DATA BCON/ 1.38063-23 /
NU = GVISC/GDEN RB = CHARL*ABS(VF)/NU
FRICI = 0.0791/RE**0.25 US = ABS(VF) *SQRT(O.S*FRICI)
FAC (RE-2000. ) /8000. IF (FAC .GT. 1.0) FAC=l. 0 IF (FAC.LT. 0.0) FAC=O. 0
EVALUATE MEAN FREE PATH
FCHI=CHI
AMN=2,DO*GASME'P/DP GASMFP GVISC*SQRT(1.89E-4*GMOLWT/TGAS)/GDEN
LIMIT EXPONENT RANGE
ARGN=AMINl (EXPMAX, 1 . 1/AKN) BMOBIL=l.tAKN*(FSLIP+.4*EXP(-ARGN))
B = BMOBIL/ (3. *PI*GVISC*DP*FCHI) DIFP = BCON*TGAS*B A = 14.5* (DIFP/NU) ** (1./3 .) PHI = 5. /A BP = 0.45*SR*US/NU XM = PI*DP**3*RHOP/B. T A W = XM*B*US**P/NU SP = 0.69*TAUP IF(TAUP.GE.20.) GO TO 10
?
C BPS = BP SPS = SP IF (TAUP .GT. 10. ) THEN SP = 6.9 USMW = SQRT (10. *NU/ (XM*B) ) BP AMIN1(0.45*SR*USMW/NU,30.-SP)
ENDIF C
IF (BP+SP .LE . 5 . ) THEN IB = 24.2 PHI1 = MIN(PH1, (BP+SP)/A ) IS = 14.5* (FUNI (PHI ) - FUNI (PHI1) ) / (DIFP/NU) ** (2 ./3 .)
ELSE IB 5.*ALOG(25.2/(BP+SP-4.8)) IS = 0.0
ENDIF C
VP =, 1 ./ (IBtIS) IF(TAUP.LE.10) GO TO 20
C VPWM = VP BP = BPS SP = SPS IF (TAUP .LT .20. ) THEN SP = 13.8 USW2 = SQRT (20. *NU/ (XM*B) ) BP = 0.45*SR*USW2/NU VP p 0.55* (1. -ERF (0.707* (1. tBP/SP) ) ) EXPON E: 3.322*ALOGlO (VPWM/VP) * (1. -ALOGlO (TAUP) ) +ALOGlO (VPWM) VP = 10.**EWON GO TO 20
ENDIF C
10 VP =I 0.55* (1. -ERF (0.707* (1.+BP/SP) ) ) C
20 FTURB = FAC*VP*US C C * * CHECK FOR ADHESION C
M = VP*us SFTURB = FSTCK( M, DP, RHOP, SF, W, GDEN, GVISC, CHARL, SP, DF)
C
B- 12
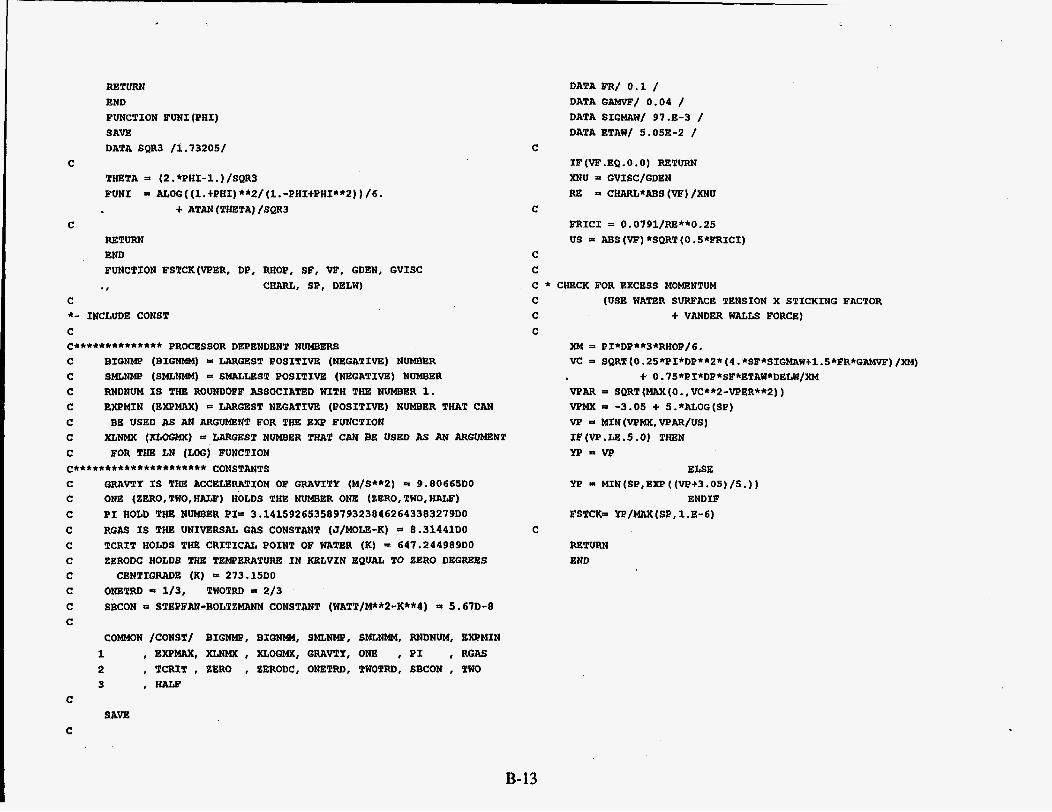
C
RETURN END FUNCTION FUNI (PHI) SAVE DATA SQR3 /1.13205/
THETA f (2. *PHI-1. ) /SQR3 FUNI = ALOG( (1.. +PHI) **2/ (1. -PHItPHI**2) ) /6.
t ATAN (THETA) /SQR3 C
RETURN END FUNCTION FSTCK(VPER, DP, MOP, SF, W, GDEN, GVISC
* / CHARL, SP, DELW) C *- INCLUDE CONST C C************** PROCESSOR DEPENDENT NUMBERS C BIGNMP (BIGNMM) - LFiRGEST POSITIVE (NEGATIVE) NUMBER C SMLNMP (SMLNMM) = SMALLEST POSITIVE (NEGATIVE) NUMBER C RNDNUM IS THE ROUNDOFF RSSOCIATED WITH THE NUMBER 1. C EWMIN (EXPMAX) LARGEST NEGATIVE (POSITIVE) NUMBER THAT CAN
C XLWMX (XLOGMX) = LARGEST NUMBER THAT CAN BE USED As AN ARGUMENT C BE USED AS AN ARGUMENT FOR THE EW FUNCTION
C FOR THE LN (LOG) FUNCTION
C GRAVTY IS THE ACCELERATION OF GRAVITY (M/S**2) = 9.80665DO C ONE (ZERO,TWO,HRtF) HOLDS THE NUMBER ONE (ZERO,TWO,HALF) C PI BOLD THE NUMBER PI= 3.141592653589793238462643383279DO C RGAS IS THE UNIVERSAL GAS CONSTANT (J/MOLE-K) = 8.31441DO C TCRIT HOLDS THB: CRITICAL POINT OF WATER (K) = 647.244989DO C ZERODC HOLDS THE TEMPERATURE IN KELVIN EQUAL TO ZERO DEGREES C CENTIGRADE (K) = 273.15DO C ONETRD - 1/3, TWOTRD = 2/24 C SBCON P STEPFAN-BOLTZMANN CONSTANT (WATT/M**2-K**4) = 5,671)-8 C
...................... CONSTANTS
COMMON /CONST/ BIGNMP, BIGNMM, SMLNMP, SMLNMM, RNDNUM, EWMIN
1 , EXOMAX, XLNMX , XLOGMX, GRAVTY, OWE , PI , RGAS 2 , TCRIT , ZERO , ZERODC, ONETRD, TWOTRD, SBCON , TWO 3 r -
DATA FR/ 0.1 / DATA GAMVF/ 0.04 / DATA SIGMAW/ 91.E-3 / DATA ETAW/ 5.053-2 /
C IF(VF.EQ.0.0) RETURN XNU 3 GVISC/GDEN RE a CHARt*ABs(W)/XNU
FRICI = 0.0791/Ra**0.25 US = ABS (VF) *SQRT (0. S*FRICI)
C
C C C * ClfECK FOR EXCESS MOMENTUM C (USE WATER S W A C E TENSION X STICKING FACTOR C t VANDER WALLS FORCE) C
XM = PI*DP**3*RHOP/6. VC = SQRT(0.25*PI*DP**2*(4.*SF*SIGMAW+1.5*FR*GAMVF)/XM)
t 0.75*PI*DP*SF*ETAW*DELW/XM VPAR SQRT(MAX(O.,VC**2-VPER**2)) VPMX 0 -3.05 t 5.*ALOG(SP) W = MIN(VPMX,VPAR/US) IF(VP.LE.5.0) THEN W = V P
ELSE YP - MIN(SP,EXP((VP+3.05)/5.))
ENDIF FSTCKs YP/MAX(SP, 1 .E-6)
RETURN END
C
C
C SAVE
B-13
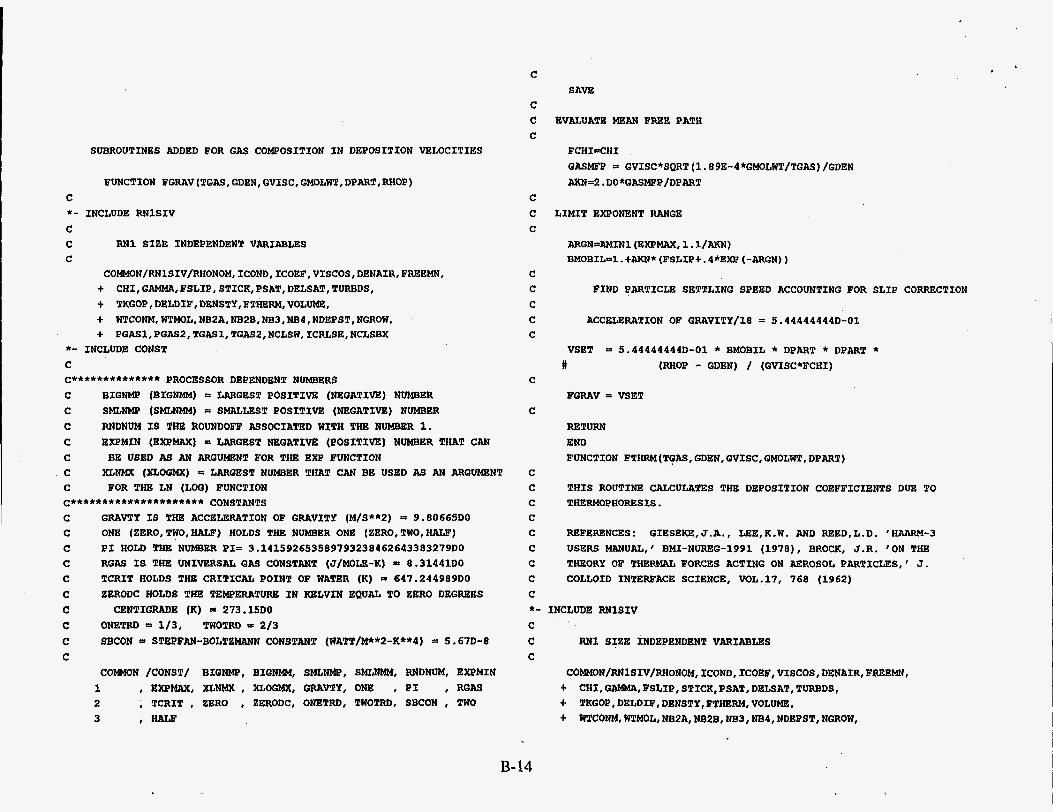
SAVE
SUBROUTINES ADDED FOR GAS COMPOSITION IN DEPOSITION VELOCITIES
FUNCTION FGRAV(TGAS,GDEN, GVISC,GMOLWT,DPART,RHOP) C *- INCLUDE RNlSIV C C RN1 SIZE INDEPENDENT VARIABLES C
COMKON/RNlSIV/RHONOM, ICOND, ICOEF, VISCOS, DENAIR, FREEMN, t t TKGOP,DELDIF,DENSTY,FTHERM,VOLUME, t WTCONM, WTMOL, NBPA, NB2B. NB3, NB4,NDEPST, NGROW, t PGASl,PGASP,TGASl, TGASZ,NCLSW, ICRLSE,NCLSBX
CHI, GAMMA, FSLIP, STICK,PSAT, DELSAT, TURBDS,
*- INCLUDE CONST C C************** PROCESSOR DEPENDENT NUMBERS C BIGNMP (BIGNMM) = LARGEST POSITIVE (NEGATIVE) NUMBER C SMLNMP (SMISJMM) = SMRLLEST POSITIVE (NEGATIVE) NUMBER C RNDNUM IS THE ROIJNDOFF ASSOCIATED WITH THE NUMBER 1. C EXPMIN (EXPMAX) = LARGEST NEGATIVE (POSITIVE) NUMBER THAT CAN C BE USED AS AN ARGUMENT FOR THF: EXP FUNCTION C XLNMX (XLOGMX) = LARGEST NUMBER THAT CAN BE USED AS AN ARGUMENT C FOR THE LN (LOG) FUNCTION
C GRAVTY IS THE ACCELERATION OF GRAVITY (M/S**2) = 9.80665D0 C ONE (ZERO,TWO,W) HOLDS THE NUMBER ONE (ZERO,TWO,HALF) C PI HOLD THE NUMBER PI= 3.141592653589793238462643383279DO
C TCRIT HOLDS THE CRITICAL POINT OF WATER (K) = 647.244989D0 C ZERODC HOLDS THE TEMPERATURE IN KELVIN EQUAL TO ZERO DEGREES C CENTIGRADE (IC) = 273.15D0 C ONETRD 5 1/3, TWOTRD = 213
...................... CONSTANTS
C RGAS IS THE UNIVERSAL GAS CONSTANT (J/MOLE-K) =m 8.31441D0
C SBCON f STEPFAN-BOLTZMANN CONSTANT (WATT/M**2-K**4) =I 5.671)-8 C
C O m N /CONST/ BIGNMP, BIGNMM, SMLNMP, SMLNMM, RNDNUM, EWMIN 1 , EXPMAX, XLNMX, XLOGMX, GRAVTY, ONJ3 , PI , RGAS 2 , TCRIT , ZERO , ZERODC, ONETRD, TWOTRD, SBCON , TWO 3 I W
C
C C C
C C C
C C C C C
C
C
C C C C C C C C C
EVALUATE MEAN FREE PATH
FCHIrCHI GASMP = GVISC*SQRT(1.89E-4*GMOLWT/TGAS)/GDEN AKN=2.DO*GASMFP/DPART
LIMIT EXPONENT RANGE
ARGN=AMINl (EXPMAX, 1 . l/AKN) BMOBILnl . +AKN* (FSLIP+. 4*EXJ? (-ARGN) )
FIND PARTICLE SETTLING SPEED ACCOUNTING FOR SLIP CORRECTION
ACCELERATION OR GRAVITY/18 =: 5.44444444D-01
VSET = 5.44444444D-01 * BMOBIL * DPART * DPART * # (MOP - GDEN) / (GVISC*FCHI)
FGRAV = VSET
RETURN END FUNCTION FTHRM(TGAS, GDEN, GVISC,GMOLWT, DPART)
THIS ROUTINE CALCULATES THE DEPOSITION COEFFICIENTS DUE TO THERMOPHORESIS.
REFERENCES: GIESEKE,J.A., LEE,K.W. AND REED,L.D. 'HARRM-3 USERS MANUAL, ' BMI-NUREG-1991 (1978), BROCK, S.R. 'ON THE THEORY OF THERMAC FORCES ACTING ON AEROSOL PARTICLES,' J. COLLOID INTERFACE SCIENCE, VOL.17, 768 (1962)
*- INCLUDE RNlSIV C C RNl SIZE INDEPENDENT VARIABLES C
COMMON/RNlSIV/RHONOM, ICOND, ICOEF, VISCOS, DENAIR, FREEMN, t + t
CHI, GAMMA,FSLIP, STICK, PSAT, DELSAT, TURBDS, TKGOP, DELDIF, DENSTY, FTHERM, VOLUME. WTCONM, WTMOL, NBPA, NBPB, NB3, NBQ, NDEPST, NGROW,
B-14
t PGAS1, PGAS2, TGAS1, TGAS2, NCLSW, ICRLSE,NCLSBX C *- INCLUDE CONST C C************** PROCESSOR DEPENDENT NUMBERS C BIGNMJ? (BIGNMM) = LARGEST POSITIVE (NEGATIVE) NUMBER c SMLNMP (SMLNMM) = SMALLeST POSITIVE (NEGATIVE) NUMBER C RNDNUM IS THE ROUNDOFF ASSOCIATED WITH THE NUMBER 1. C EXPMIN (EXPMAX) = LARGEST NEGATIVE (POSITIVE) NUMBER THAT CAN C BE USED AS AN A R G W N T FOR THE EXP FUNCTION C XLNMX (XLOGMX) = LARGEST NUMBER THAT CAN BE USED AS AN ARGUMENT C FOR THE LN (LOG) FUNCTION ...................... CONSTANTS
C C C C C C C C C C
C *- C
C
C C C
C
GRAVTY IS THE ACCELERATION OF GRAVITY (M/S**2) = 9.80665DO ONE (ZERO, TWO, HALF) HOLDS THE NUMBER ONE (ZERO, TWO, HALF) PI HOLD THE NUMBER PI= 3.141592653589793238462643383279DO
TCRIT HOLDS THE CRITICAL POINT OF WATER (K) = 647.244989DO ZERODC HOLDS THE TEMPERATURE IN KELVIN EQUAL TO ZERO DEGREES
RGAS IS THE UNIVERSAL GAS CONSTANT (J/MOLE-K) = 8.3144180
CENTIGRADE (K) = 273.15D0 ONETRD = 1/3, TWOTRD = 2/3 SBCON 5 STEPFAN-BOLTZMRNN CONSTANT (WATT/M**P-K**Q) 5 5.6711-8
CObS4ON /CONST/ BIGNMP, BIGNMM, SMLNMP, SMLNMM, RNDNUM, EXPMIN 1 , EXPMAX, XLNHX, XLOGMX, GRAVTY, ONE , PI , RGAS 2 , TCRIT , ZERO , ZERODC, ONETRD, TWOTRD, SBCON I TWO
3 r -
SAVE
FCHI=CHI
AKN=2.DO*GASMFP/DPART GASMBP GVISC*SQRT(1.89E-4*GMOLWT/TGAS)/GDEN
LIMIT EXPONENT RANGE
ARGN=AMINl (EWMAX, l.l/AKN) BMOBIL4. tAKN* (FSLIPt. 4*EXP (-ARGN) ) VT~l.5*GVISC*BMOBIL*(FTHERM*AIU?tTKGOP)/(FCHI*GDEN* TGAS* (1. t3. *FSLIP*AKN) * (1. t2 . * (FTHERM*AKNtTKGOP) ) ) $
FTHRM = VTHRML RETURN END FUNCTION FDIFF (TGAS,GDEN, GVISC, GMOLWT, DPART)
C C THIS ROUTINE CALCULATES THE DEPOSITION COEFFICIENTS DUE TO C GRAVITY, DIFFUSION AND THERMOPHORESIS. C C REFERENCES: GIESEKE,J.A., LEE,K.W. AND REED,L.D. 'HAARM-3 C USERS MANUAL,' BMI-NUREG-1991 (1978), BROCK, J . R . 'ON THE C THEORY OF THERMAL FORCES ACTING ON AEROSOL PARTICLES,' J. C COLLOID INTERFACE SCIENCE, VOL.17, 768 (1962) C *- INCLUDE RNlSIV C C RN1 SIZE INDEPENDENT VARIAELES C
COMMON/RN~SIV/RHONOM,ICOND,ICOEF,VISCOS,DENAIR,FREEMN, t CHI,GAMMA,FSLIP, STICK,PSAT,DELSAT,TURBDS, t TKGOP,DELDIF,DENSTY,FTHERM,VOLUME, 4. WTCONM,WTMOL,NB2A,NB2B,NB3,NB4,NDEPST,NGROW, t PGAS1, PGAS2, TGAS1, TGAS2, NCLSW, ICRLSE, NCLSBX
*- *- INCLUDE CONST C C************** PROCESSOR DEPENDENT NUMBERS C BIGNMP (BIGNMM) IS LARGEST POSITIVE (NEGATIVE) NUMBER C SMLN'MI? (SMLNMM) = SMALLEST POSITIVE (NEGATIVE) NUMBER C RNDNUM IS THE ROUNDOFF ASSOCIATED WITH THE NUMBER 1. C EWMIN (EXPMAX) =I LARGEST NEGATIVE (POSITIVE) NUMBER THAT CAN C BE USED AS AN ARGUMENT FOR THE EXP FUNCTION C XLNMX (XLOGMX) = LARGEST NUMBER THAT CAN BE USED AS AN ARGUMENT C FOR THE LN (LOG) FUNCTION ...................... CONSTANTS
C GRAVTY IS THE ACCELERATION OF GRAVITY (M/S**2) = 9.80665DO C ONE (ZERO,TWO,HALF) HOLDS THE NUMBER ONE (ZERO,TWO,HALF) C
C TCRIT HOLDS THE CRITICAL POINT OF WATER (K) = 647.244989DO C ZERODC HOLDS THE TEMPERATURE IN KELVIN EQUAL TO ZERO DEGREES C CENTIGRADE (K) =I 273.1580 C ONETRD = 1/3, TWOTRD 5 2/3 C SBCON 5 STEPFAN-BOLTZMRNN CONSTANT (WATT/M**P-K**I) * 5.67D-8
PI HOLD THE NUMBER PI= 3.141592653589793238462643383279DO C RGAS IS THE UNIWRSU GAS CONSTANT (J/MOLE-K) 8.31441DO
B-15
C
C *, C
C
C C C
C
C
COMMON /CONST/ BIGNMP, BIGNMM, SMLNMP, SMLNMM, RNDNUM, EXPMIN 1 , EWMAX, XLNMX, XLOGMX, GRAVTY, ONE , PI , RGAS 2 , TCRIT , ZERO , ZERODC, ONETRD, TWOTRD, SBCON , TWO 3 r m
SAVE
FCHI-CHI GASMFP a GVISC*SQRT(1.89E-4*GMOLWT/TGAS)/GDEN AXN=2.DO*GASMFP/DPART
LIMIT EXPONENT RANGE
ARGN=AMINl (EXPMAX, l.l/AKN) BMOBILnl. tAKN* (FSLIPt .4*EXP (-ARGN) ) DIF= (1.46E-24*TGAS*BMOEIL/ (GVISC*FCHI*DPART) ) /DELDIF
FDIFF = DIF
RETURN END
B-16 c