MEGA: A biologist-centric software for evolutionary analysis of DNA and protein sequences
11
MEGA: A biologist-centric software for evolutionary analysis of DNA and protein sequences Sudhir Kumar 1,2 , Masatoshi Nei 3 , Joel Dudley 1,4 , and Koichiro Tamura 1,5 1Center for Evolutionary Functional Genomics, The Biodesign Institute, Arizona State University, Tempe, AZ 85287-5301, USA 2School of Life Sciences, Arizona State University, Tempe, AZ 85287-4501, USA 3Institute of Molecular Evolutionary Genetics and Department of Biology, Pennsylvania State University, PA 16802, USA 4Stanford Center for Biomedical Informatics Research, Stanford University School of Medicine, Stanford, CA 94305-5479, USA 5Department of Biological Sciences, Tokyo Metropolitan University, Tokyo 192-0397, Japan Abstract The Molecular Evolutionary Genetics Analysis (MEGA) software is a desktop application designed for comparative analysis of homologous gene sequences either from multigene families or from different species with a special emphasis on inferring evolutionary relationships and patterns of DNA and protein evolution. In addition to the tools for statistical analysis of data, MEGA provides many convenient facilities for the assembly of sequence data sets from files or web-based repositories, and it includes tools for visual presentation of the results obtained in the form of interactive phylogenetic trees and evolutionary distance matrices. Here we discuss the motivation, design principles, and priorities that have shaped the development of MEGA. We also discuss how MEGA might evolve in the future to assist researchers in their growing need to analyze large dataset using new computational methods. Keywords phylogenetics; genome; evolution; software Biologist-friendly software tools are crucial in this age of burgeoning sequence databases. These tools not only make it possible to use computational and statistical methods but also Address for Correspondence: Sudhir Kumar, Biodesign Institute A240, Arizona State University, Tempe, AZ 85287-5301, USA, E-mail: [email protected]. Key Points • Software developers need to go beyond user-friendliness to a biologist-centric approach for building tools for researchers • The burden is on bioinformatics software developers to inform users about the precise nature of the results generated • There is a need to use Context-dependence in the design of user-interface and adopt an assist-not-reinvent philosophy for integrating biologists' workflows • The advent of web-top (Web 2.0 associated technologies) offers fresh avenues for developing new and porting existing software for use on multiple operating systems NIH Public Access Author Manuscript Brief Bioinform. Author manuscript; available in PMC 2009 January 1. Published in final edited form as: Brief Bioinform. 2008 July ; 9(4): 299–306. doi:10.1093/bib/bbn017. NIH-PA Author Manuscript NIH-PA Author Manuscript NIH-PA Author Manuscript
-
Upload
independent -
Category
Documents
-
view
4 -
download
0
Transcript of MEGA: A biologist-centric software for evolutionary analysis of DNA and protein sequences
MEGA: A biologist-centric software for evolutionary analysis ofDNA and protein sequences
Sudhir Kumar1,2, Masatoshi Nei3, Joel Dudley1,4, and Koichiro Tamura1,5
1Center for Evolutionary Functional Genomics, The Biodesign Institute, Arizona State University, Tempe,AZ 85287-5301, USA
2School of Life Sciences, Arizona State University, Tempe, AZ 85287-4501, USA
3Institute of Molecular Evolutionary Genetics and Department of Biology, Pennsylvania State University, PA16802, USA
4Stanford Center for Biomedical Informatics Research, Stanford University School of Medicine, Stanford,CA 94305-5479, USA
5Department of Biological Sciences, Tokyo Metropolitan University, Tokyo 192-0397, Japan
AbstractThe Molecular Evolutionary Genetics Analysis (MEGA) software is a desktop application designedfor comparative analysis of homologous gene sequences either from multigene families or fromdifferent species with a special emphasis on inferring evolutionary relationships and patterns of DNAand protein evolution. In addition to the tools for statistical analysis of data, MEGA provides manyconvenient facilities for the assembly of sequence data sets from files or web-based repositories, andit includes tools for visual presentation of the results obtained in the form of interactive phylogenetictrees and evolutionary distance matrices. Here we discuss the motivation, design principles, andpriorities that have shaped the development of MEGA. We also discuss how MEGA might evolvein the future to assist researchers in their growing need to analyze large dataset using newcomputational methods.
Keywordsphylogenetics; genome; evolution; software
Biologist-friendly software tools are crucial in this age of burgeoning sequence databases.These tools not only make it possible to use computational and statistical methods but also
Address for Correspondence: Sudhir Kumar, Biodesign Institute A240, Arizona State University, Tempe, AZ 85287-5301, USA, E-mail:[email protected].
Key Points• Software developers need to go beyond user-friendliness to a biologist-centric approach for building tools for researchers• The burden is on bioinformatics software developers to inform users about the precise nature of the results generated• There is a need to use Context-dependence in the design of user-interface and adopt an assist-not-reinvent philosophy for
integrating biologists' workflows• The advent of web-top (Web 2.0 associated technologies) offers fresh avenues for developing new and porting existing
software for use on multiple operating systems
NIH Public AccessAuthor ManuscriptBrief Bioinform. Author manuscript; available in PMC 2009 January 1.
Published in final edited form as:Brief Bioinform. 2008 July ; 9(4): 299–306. doi:10.1093/bib/bbn017.
NIH
-PA Author Manuscript
NIH
-PA Author Manuscript
NIH
-PA Author Manuscript
allow scientists to select methods and algorithms best suited to understand the function,evolution, and adaptation of genes and species. The Molecular Evolutionary Genetics Analysis(MEGA) software aims to serve both of these purposes in inferring evolutionary relationshipsof homologous sequences, exploring basic statistical properties of genes and estimating neutraland selective evolutionary divergence among sequences (Fig. 1).
The MEGA software project grew out of our own need for employing statistical methods inthe phylogenetic analysis of DNA and protein sequences in the early 1990s. At this time, mostcomputer programs available did not allow us to explore their primary data visually and lackeda user-friendly interface. There were two primary general-purpose computer programs forinferring phylogenetic trees. One was PAUP for constructing parsimony trees, and the otherwas PHYLIP for inferring phylogenetic trees using various character and statistical methodssuch as maximum likelihood, parsimony, and distance methods [1,2]. These programs were(and continue to be) very useful, but the former lacked statistical methods at that time and thelatter did not provide a point-and-click user interface [3-6].
In order to make statistical methods available for phylogenetic analysis in a user-friendlymanner, we produced a program with character-based mouse/menu interface for use on DOSsystems (Fig. 2A) [7,8]. It offered many methods for estimating evolutionary distances fromnucleotide and amino acid sequence data, three different methods of phylogenetic inference,and statistical tests of inferred phylogenies. In addition, facilities were provided to computebasic statistical properties of DNA and protein sequences, and tools were included for the visualexploration of input sequence data and inferred phylogenies.
Availability of easy-to-use MEGA 1 initiated many biologists to begin exploring the utility ofdistance-based methods in molecular evolutionary genetic analysis; we received hundreds ofrequest for MEGA 1 in the first year of its release. A case in point is the application of theNeighbor-Joining (NJ) method in phylogenetic inference [9]. By using the NJ method to inferphylogenetic tree in MEGA, researchers often discovered that the NJ method generated a treequickly for datasets containing many sequences and that differences between NJ trees and thoseproduced by other time-consuming methods were localized to parts of the trees that wereusually statistically weakly supported. These first-hand experiences spurred a more widespreadappreciation of statistical methods for phylogenetic analysis, which was clearly reflected inthe fast-growing citations of the NJ method (over 16,000 citations to date) and softwarepackages, such as MEGA 1, providing access to statistical methods in phylogenetics (Fig. 1 in[10]).
In 1995, the release of Microsoft Windows 95 led to the first stable graphical user interface(GUI) for Intel-CPU-based personal computers, which were called IBM-compatibles. Wedecided to develop MEGA's character-based user-interface, which fit into a 640×480 pixel sizescreen, to a graphic user interface (GUI). Such GUIs enhanced the user experience by providingmore screen space for displaying larger amounts of data and results, allowed for a moresophisticated and intuitive display of information, and enabled more intuitive and efficient datamanipulations. Furthermore, the expanded memory space (from 640 kilobytes to up to 3Gigabytes) in Windows made it possible to analyze both a larger number of sequences(>10,000) and sequences of increased length (millions of base pairs and amino acids).
MEGA 2, released in 2001, vastly improved the capabilities of MEGA 1 by facilitating analysesof larger datasets, enabling analyses of grouped sequences, specification of multiple domainsand genes, and expansion of the repertoire of statistical methods for molecular evolutionarystudies (Fig. 2B) [11]. It was made available over the Internet (www.megasoftware.net) andwas downloaded by over 35,000 users (unique e-mail addresses) between 2001–2004. Overtime, the use of the Windows version has been replacing the DOS version.
Kumar et al. Page 2
Brief Bioinform. Author manuscript; available in PMC 2009 January 1.
NIH
-PA Author Manuscript
NIH
-PA Author Manuscript
NIH
-PA Author Manuscript
In 2004, the release of MEGA 3 addressed the longstanding need for making the sequence dataretrieval and alignment less frustrating and less error-prone [12]. Now researchers could editDNA sequence data from auto-sequencers, retrieve data from web-databases, and performautomatic and manual sequence alignments in MEGA. This integrated sequence dataacquisition and evolutionary analysis tool was downloaded by 50,000 unique e-mail addressesfrom 2004–2007. The next release in 2007 (MEGA 4) offered facilities to generate detailedcaptions for many different types of analyses and results (discussed in detail later), a maximumcomposite likelihood method for evolutionary distance estimation, multi-threading and multi-user support, and Linux support via the Wine application compatibility layer [13]. It has alreadyseen over 15,000 downloads in the first six months of its release.
These increasing numbers of downloads per year have translated into expanded use of MEGA,as indicated by an accelerating number of publications citing MEGA (∼10,000 from 1993 to2007; Fig. 3). The ISI Web of Science indicates that over 250 journals have published papersciting MEGA across a diverse spectrum of biological sciences. This growing impact of MEGAtestifies to the widespread utility of statistical methods in deciphering evolutionary patternsand inferring the phylogenetic relationships of DNA and protein sequences in these times ofmomentous sequence data abundance. Indeed, a select group of phylogenetic analysis softwaretools has experienced extensive growth over the last few years (see Fig. 1 in [10]).
In the following, we describe our biologist-centric philosophy behind the user-interface design,priorities for programming new methods and tools, and future plan of the MEGA project. Herewe focus on conceptual aspects though some technical details are discussed.
Biologist-Centric Designs in MEGASimple User-interface and Context-Dependence
The availability of expansive screen display area in modern computing environments enticesdevelopers into presenting access to all of the software's functionality to the user up front inthe form of complex hierarchical menu systems. This often leads to an over-populated interfaceand, consequently, steep learning curve for new users. In MEGA, we circumvented this pitfallby programming the user-interface to render itself dynamically: it only displays buttons andmenu options to the user that are context appropriate for the currently active data set andanalysis conditions. Users specify models of sequence evolution and the data subset to employonly when needed by the program for calculations. Many new users have shared that they areable to learn MEGA functionality without much assistance, which we attribute in part to thiscontext-dependent interface model. The imprint of context-dependence principle is seenthroughout MEGA. For example, the distribution of the computational functionalities anddisplay properties into input data explorers and output result explorers is also a product of thecontext-dependence design imperative, as it enables the user to conduct simple downstreamanalyses easily using the results presented.
Exploration of Basic Attributes of Input DataAll versions of MEGA contain visual modules for browsing, editing, and computing basicstatistical quantities for the input data. For example, the user can also calculate base frequenciesand relative synonymous codon usage for all positions across all selected sequences or for onlypositions they highlight (Fig. 2). These basic statistical quantities are necessary to assess theDNA and protein sequence variability, location of positions that harbor evolutionary change,and inequality of the usage of 4 nucleotides, 20 amino acid residues, and 64 codons. MEGA4.1 supports exporting of statistical results (and even sequence alignments) to Microsoft Exceland to CSV formats for further analyses and graphical representations.
Kumar et al. Page 3
Brief Bioinform. Author manuscript; available in PMC 2009 January 1.
NIH
-PA Author Manuscript
NIH
-PA Author Manuscript
NIH
-PA Author Manuscript
Also, input data explorers contain functions to select/eliminate specific genes, domains, andspecies for analysis. Therefore, MEGA separates the building of the primary data subsets fromthe evolutionary analysis of data. In addition, users are offered many context-dependent datasubset options, including the selection of codon positions to include, automatic translation ofcodons, and the handling of sites containing alignment gaps by removing them for sequencepairs (pairwise-deletion option) or completely (complete-deletion option) across all sequences.
Result ExplorersMEGA contains many visual explorers for results produced, which offer built-in capabilitiesto carry out additional calculations and prepare results for publication. The Tree Explorer is aprime example. It contains facilities for showing multiple representations of the tree, buildingconsensus trees, compressing sub-trees to focus on higher-level relationships amongsequences, printing trees as Windows metafiles and TIFF files, and exporting them in theNewick-compatible format for use in other evolutionary analysis programs. In MEGA 2, weadded functions to compute “linearized” trees [14] and apply molecular clock calibrations toestimate divergence times for all branching points in the tree displayed. The Tree Explorer alsoestimates ancestral states of nucleotide or amino acids on each node in the tree using themaximum parsimony method. In MEGA 3, capabilities for associating and displaying imagesfor individual taxa and clusters were included to make it easier to produce an informativephylogenetic representation fit for publication.
The Distance Matrix Explorer, first made available in MEGA 2, is another visual result explorerthat displays pairwise distances along with the estimates of standard errors, with flexibility torearrange species (sequences or taxa) by dragging-and-dropping. It has the built-in capacity tocalculate overall, within, and between group averages when the user has arranged taxa intogroups. When displaying results from tests of selection, it can highlight all pairs of sequences(or groups of sequences) in which the null hypothesis can be rejected at a 5% level. In MEGA4.1, this explorer supports the export of distance matrices and tables to Microsoft Excel and toCSV formats for additional statistical analysis.
In addition, Distance Matrix Explorer in MEGA 4.1 has the capability to identify all pairs ofsequences for which the evolutionary distances are not calculable due to the lack of anycommon sites in the sequence alignment. This frequently happens when applying phylogeneticanalyses to datasets containing a large number of distantly related DNA and protein sequences.Researchers need to quickly find and eliminate some of these offending sequences to be ableto build phylogenetic trees. Therefore, our focus is on enhancing the capability of resultexplorers to aid researchers in analysis of large datasets.
Intuitive Data Assembly and Sequence AlignmentsMost bench scientists use a web browser to obtain gene sequences from databanks in a complexprocess that results in the mundane and frustrating task of cutting and pasting sequences fromthe web-browsers, or saving them to files before processing them for sequence alignment. Indeveloping MEGA 3, we emulated and enhanced the researchers' data assembly and alignmentworkflow under our assist-rather-than- reinvent design principle. We began by integrating afully-functional web-browsing facility that had the ability to download sequence data directlyinto MEGA with a single click, which replaced a time consuming, multi-step, and error-pronemanual process with a simple and intuitive procedure (see [12] for a description). Becauseexperimental biologists frequently work with trace data, we also included facilities for viewingand editing the trace files (electropherogram) produced by the automated DNA sequencers.
MEGA 3 also featured a full function Alignment Explorer containing an extensive graphicaluser interface for handling and aligning sequences datasets gathered in MEGA through the
Kumar et al. Page 4
Brief Bioinform. Author manuscript; available in PMC 2009 January 1.
NIH
-PA Author Manuscript
NIH
-PA Author Manuscript
NIH
-PA Author Manuscript

web-browsing facility and by importing data from FASTA and trace files [12]. It included anative implementation of selected CLUSTALW source code [15] for automated sequencealignment with facilities for the manual refinement of the alignments. Because biologists oftenneed to align subsets of sequences and positions in a larger alignment, we programmedAlignment Editor to align any user-selected rectangular region in all, or a subset of sequences,and insert it in the context of the larger alignment. For the protein-coding regions, users canclick to translate the selected sequences (or selected rectangular subset) into protein sequences,align the translated protein sequences using CLUSTALW, and switch their context back toDNA sequences—all with a few mouse clicks. The rapidly increasing user base of MEGA 3(Fig. 3) and the use of MEGA's Alignment Explorer in the most recent edition of a popularbook [16] are a testament to the long-standing need for user-friendly and intuitive sequencealignment environment.
Transparency of Assumptions and Explanation of ResultsIntuitive GUI makes it easy for both novice and expert users to conduct a variety ofcomputational and statistical analyses in MEGA. However, users must select which data subsetto use (e.g., codon positions or domains), choose whether to delete all positions containingalignment gaps and missing data, specify an evolutionary model of DNA or amino acidsubstitution, and choose whether to assume uniformity of evolutionary rates among sites ornot. In MEGA 2, these options were available for selection in a series of tabs in a Dialog box,with selections in only one tab displayed at any time. Soon after its release, we realized thatmany users did not change the default options while analyzing data. Default options are notsuitable in all circumstances. So, we revamped the main Analysis Preferences dialog box inMEGA 3 in order to make the user more aware of all the choices available at the same time.This development removed the burden on users of flipping through tabs to examine all options,enhancing the users' knowledge regarding the underlying assumptions and data-handlingoptions chosen in each analysis.
In MEGA 4, we expanded the transparency of choices and assumptions by adding a newCaption Expert system. Caption Expert generates detailed descriptions for every resultproduced by MEGA, which informs the user of all the options selected and includes specificcitations for any method, algorithm, and software employed in the given analysis. Furthermore,it gives the number of sequences used, the number of aligned positions included, and the unitsof the resulting statistical quantities. All captions are context-dependent; that is, they changewith the type of result displayed and the way the user is viewing the results. For example, if auser is viewing a phylogeny without branch lengths (cladograms), then Caption Expert writesabout the branching pattern rather than the number of substitutions or the units in which thebranch lengths are expressed. Therefore, we follow the What-you-see-is-what-you-getprinciple in generating descriptions. All descriptions appear in natural language text, which isaimed at promoting a better understanding of the underlying assumptions and finer details ofthe results presented. Such written descriptions of methods and results are useful for archivalpurposes, and they should aid students and researchers in preparing tables and figures forpresentations.
Facilities for Saving User SessionsIn MEGA, we added functions in Alignment (MEGA 3) and Tree Explorers (MEGA 2) to savethe current state of the visual module to be loaded later. For example, researchers often requiremultiple days to complete aligning sequences, frequently needing to add sequences to analignment as new data as they become available. By saving the current Alignment Explorersession to a file, the users can return to a precise, visual snapshot of any previous alignment,along with any specified display or alignment parameters. This will assist researchers inassembling larger datasets incrementally and will not require saving of the data in flat text files
Kumar et al. Page 5
Brief Bioinform. Author manuscript; available in PMC 2009 January 1.
NIH
-PA Author Manuscript
NIH
-PA Author Manuscript
NIH
-PA Author Manuscript
that lose visual information associated with the sequence alignment and the phylogeny display.In the future, we plan to add a facility to save the input data session in order to obviate the needto save intermediate data subsets (selection of taxa, groups, and genes) and other settings totext files; text files are cumbersome for very large and complex datasets.
Developments in MEGA 5 and beyondWe are currently planning to make a number of fundamental enhancements prompted by thegrowing needs of contemporary researchers to analyze large datasets, to use MEGA on multipleplatforms, and to utilize additional statistical and computational methods. In the following, wediscuss a few of these aspects briefly.
Comparative Genomics using Maximum Likelihood MethodsHistorically, MEGA has included likelihood methods for estimating evolutionary distancesbetween sequence pairs as well as distance-based and Maximum Parsimony methods forinferring phylogenetic trees. Many novel methodological and algorithmic developments,combined with a manifold increase in the computing power on average desktops, have madeit possible to carry out computationally-intensive statistical methods of phylogenetic analysisbased on the Maximum Likelihood (ML) principle [3,5,6]. Therefore, we plan to dramaticallyexpand the repertoire of ML methods in MEGA. Starting with MEGA 5, we will gradually addfacilities for selecting the best-fit model of DNA and protein substitution, estimating the extentof rate variation among sites, testing molecular clocks among species and paralogous genes,reconstructing nucleotides and amino acids in the ancestral sequences, and inferringphylogenetic trees. These additions will provide an integrated solution for analysis of molecularsequences using a variety of statistical methods.
Bioinformatics for Biologists in MEGAAn increasingly greater number of biologists are now interested in automating their analysesin MEGA. This automation need has arisen from the profound success of sequencing efforts,which have fundamentally altered the nature and scope of investigations by evolutionary andmolecular biologists. Biologists are routinely analyzing large sequence datasets, which, untilrecently, used to be the exclusive domain of bioinformatics investigators.
However, a majority of researchers using MEGA do not wish to trade their GUI environmentsfor the cumbersome command line interfaces and learn unintuitive commands [10]. While theuse of scripting in large-scale analysis provides a general solution to many bioinformaticsproblems, we find that researchers commonly turn to scripting to repeat the same analysis fordifferent genes and genomic regions. Therefore, we plan to add a point-and-click iterationsystem that will enable scientists to launch the same analysis for distinct and overlapping datasubsets, including different genes, codon positions, sliding windows, and groups of sequences,without the use of scripting languages or the need to learn command. Using this system,researchers will be able to build gene-by-gene phylogenies (and their consensus), estimateaverage sequence divergence for individual genes in multigene datasets, conduct gene-by-genetests of selection, and estimate substitution parameters (e.g., transition/transversion rate ratiosand G+C-contents) for different genomic segments in MEGA 5 and later releases.
MEGA as a Cross-Platform Web-ApplicationMany biologists have expressed interest in using MEGA on non-Windows platforms (e.g.,Macintosh and Linux). The porting of MEGA source code, especially the graphical user-interface, to multiple platforms has not been feasible; we estimate that this will require multipleyears of development and debugging. However, the recent rise of the web browser as thecenterpiece of the desktop as well as the cultural shift among computer users in regards to web-
Kumar et al. Page 6
Brief Bioinform. Author manuscript; available in PMC 2009 January 1.
NIH
-PA Author Manuscript
NIH
-PA Author Manuscript
NIH
-PA Author Manuscript
based application utilization, offers a unique opportunity to develop cross-platform solutions.The user interface experience offered by Web 2.0 applications has evolved beyond the staticHTML-based displays and clunky, graphical Java applications embedded into HTML-basedweb pages. The Rich User Interface (RUI) technologies made available in the Web 2.0 erahave enabled the creation of web-based analogues of common desktop applications. This hasthe potential to help us bring the full MEGA GUI experience to the web-desktop (WebTop).The general availability of advanced, open-source JavaScript frameworks would allow us toimplement many dynamic elements (i.e., contextual menus and tabular data displays)characteristic of the desktop application user experience. Therefore, our plan is to makeavailable WebTop MEGA version in the future. MEGA for the WebTop will also use a webservice model so the user can experience a perpetual upgrade cycle wherein improvements andbug fixes can be implemented and delivered whenever they are available.
In summary, MEGA is an integrated workbench for biologists for mining data from the web,aligning sequences, conducting phylogenetic analyses, testing evolutionary hypothesis, andgenerating publication quality displays and descriptions.
AcknowledgementsSupport for this work comes, in part, from the National Institutes of Health (S.K., M.N.) and Japan Society of Promotionof Science (K.T., S.K.). We are grateful to Kristi Garboushian for her editorial comments and Wayne Parkhurst forassistance with graphics.
References1. Swofford, D. PAUP: Phylogenetic Analysis Using Maximum Parsimony. Illinois Natural History
Survey; Champaign, Illinois: 1990.2. Felsenstein, J. PHYLIP: Phylogenetic Inference Package. University of Washington; Seattle, WA:
1993.3. Felsenstein, J. Inferring phylogenies. Sunderland, Mass.: Sinauer Associates; 2004.4. Nei, M. Molecular evolutionary genetics. New York: Columbia University Press; 1987.5. Nei, M.; Kumar, S. Molecular Evolution and Phylogenetics. New York: Oxford University Press; 2000.6. Yang, Z. Computational molecular evolution. Oxford: Oxford University Press; 2006.7. Kumar, S.; Tamura, K.; Nei, M. Manual for MEGA: Molecular Evolutionary Genetics Analysis
Software. University Park, PA: Pennsylvania State University; 1993.8. Kumar S, Tamura K, Nei M. MEGA: Molecular Evolutionary Genetics Analysis software for
microcomputers. Comput Appl Biosci 1994;10:189–191. [PubMed: 8019868]9. Saitou N, Nei M. The Neighbor-Joining Method - a New Method for Reconstructing Phylogenetic
Trees. Mol Biol Evol 1987;4:406–425. [PubMed: 3447015]10. Kumar S, Dudley J. Bioinformatics software for biologists in the genomics era. Bioinformatics
2007;23:1713–1717. [PubMed: 17485425]11. Kumar S, Tamura K, Jakobsen IB, et al. MEGA2: molecular evolutionary genetics analysis software.
Bioinformatics 2001;17:1244–1245. [PubMed: 11751241]12. Kumar S, Tamura K, Nei M. MEGA3: Integrated software for Molecular Evolutionary Genetics
Analysis and sequence alignment. Brief Bioinform 2004;5:150–163. [PubMed: 15260895]13. Tamura K, Dudley J, Nei M, et al. MEGA4: Molecular Evolutionary Genetics Analysis (MEGA)
software version 4.0. Mol Biol Evol 2007;24:1596–1599. [PubMed: 17488738]14. Takezaki N, Rzhetsky A, Nei M. Phylogenetic test of the molecular clock and linearized trees. Mol
Biol Evol 1995;12:823–833. [PubMed: 7476128]15. Higgins DG, Thompson JD, Gibson TJ. Using CLUSTAL for multiple sequence alignments. Methods
Enzymol 1996;266:383–402. [PubMed: 8743695]16. Hall, BG. Phylogenetic trees made easy : a how-to manual. Sunderland, Mass.: Sinauer Associates;
2007.
Kumar et al. Page 7
Brief Bioinform. Author manuscript; available in PMC 2009 January 1.
NIH
-PA Author Manuscript
NIH
-PA Author Manuscript
NIH
-PA Author Manuscript
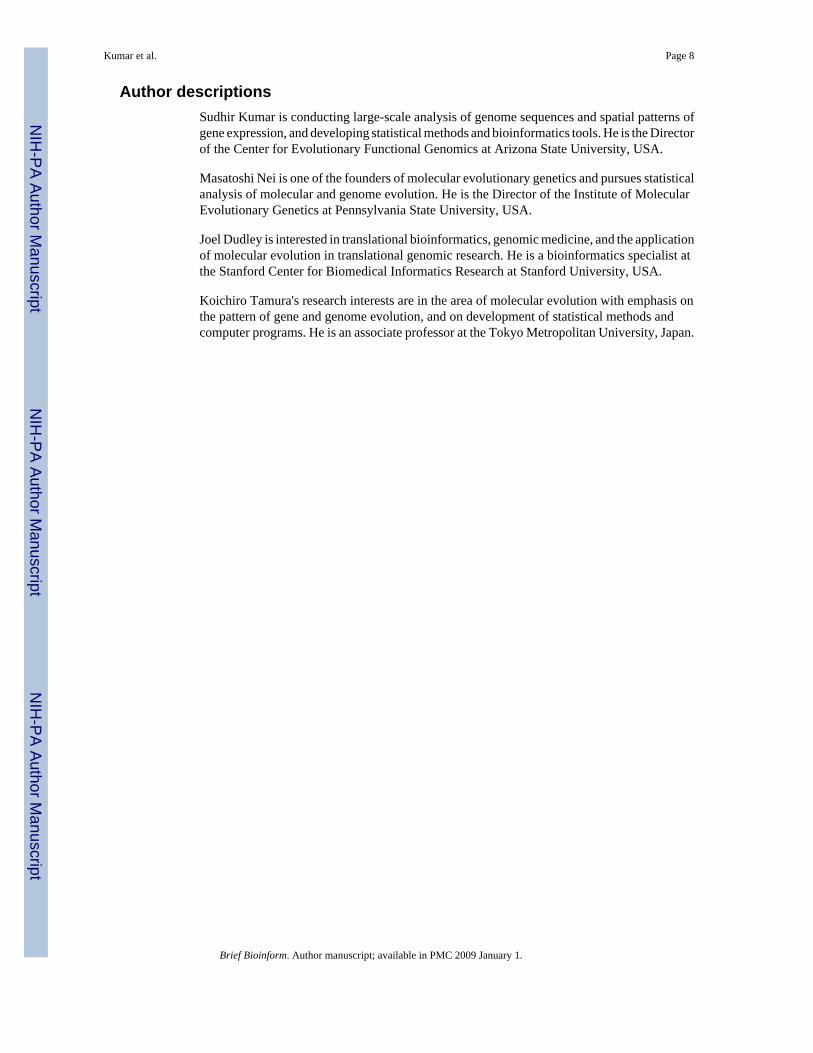
Author descriptionsSudhir Kumar is conducting large-scale analysis of genome sequences and spatial patterns ofgene expression, and developing statistical methods and bioinformatics tools. He is the Directorof the Center for Evolutionary Functional Genomics at Arizona State University, USA.
Masatoshi Nei is one of the founders of molecular evolutionary genetics and pursues statisticalanalysis of molecular and genome evolution. He is the Director of the Institute of MolecularEvolutionary Genetics at Pennsylvania State University, USA.
Joel Dudley is interested in translational bioinformatics, genomic medicine, and the applicationof molecular evolution in translational genomic research. He is a bioinformatics specialist atthe Stanford Center for Biomedical Informatics Research at Stanford University, USA.
Koichiro Tamura's research interests are in the area of molecular evolution with emphasis onthe pattern of gene and genome evolution, and on development of statistical methods andcomputer programs. He is an associate professor at the Tokyo Metropolitan University, Japan.
Kumar et al. Page 8
Brief Bioinform. Author manuscript; available in PMC 2009 January 1.
NIH
-PA Author Manuscript
NIH
-PA Author Manuscript
NIH
-PA Author Manuscript
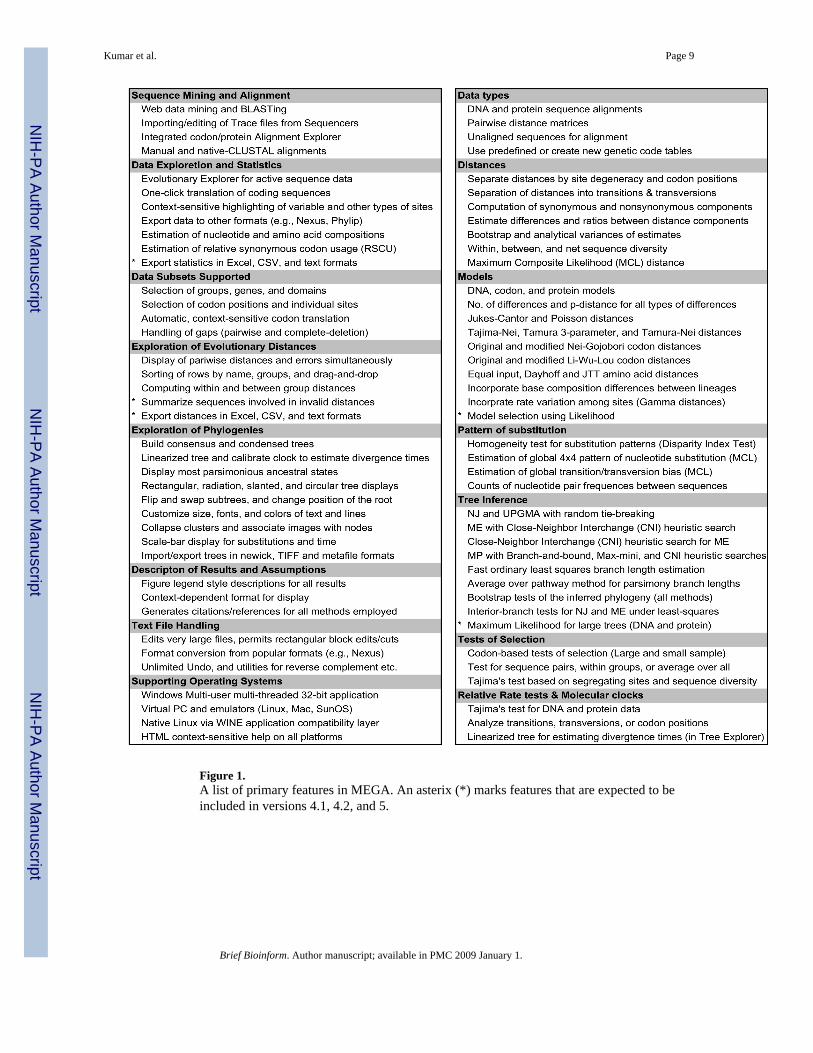
Figure 1.A list of primary features in MEGA. An asterix (*) marks features that are expected to beincluded in versions 4.1, 4.2, and 5.
Kumar et al. Page 9
Brief Bioinform. Author manuscript; available in PMC 2009 January 1.
NIH
-PA Author Manuscript
NIH
-PA Author Manuscript
NIH
-PA Author Manuscript

Figure 2.Screenshots of the first version of MEGA containg a character-based point-and-click interfacefor use on DOS (A). MEGA 1 evolved into a Windows program (MEGA 2) with an extensivegraphical user-interface (B). The main MEGA windows are overlaid with the Input SequenceData Explorer, in which columns containing at least two different types of nucleotides (variablesites) are highlighted.
Kumar et al. Page 10
Brief Bioinform. Author manuscript; available in PMC 2009 January 1.
NIH
-PA Author Manuscript
NIH
-PA Author Manuscript
NIH
-PA Author Manuscript
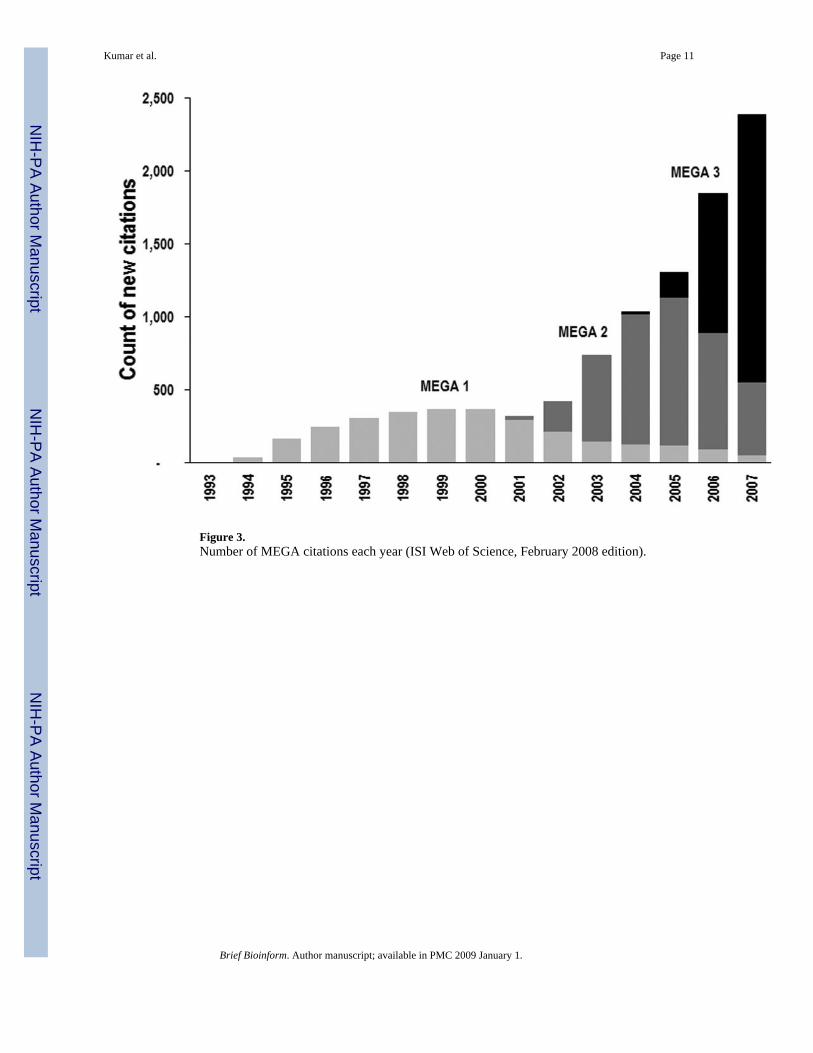
Figure 3.Number of MEGA citations each year (ISI Web of Science, February 2008 edition).
Kumar et al. Page 11
Brief Bioinform. Author manuscript; available in PMC 2009 January 1.
NIH
-PA Author Manuscript
NIH
-PA Author Manuscript
NIH
-PA Author Manuscript