Meeting-Book---UW-System-Board-of-Regents-(June-9-10 ...
195
06/02/2022 Page 1 of 2 BOARD OF REGENTS OF THE UNIVERSITY OF WISCONSIN SYSTEM June 9-10, 2022 UW-Milwaukee, Zelazo Center 2419 E. Kenwood Blvd, Milwaukee Via Webex Videoconferences Wednesday, June 8, 2022 5:30 p.m. – 7:00 p.m. Welcome Reception hosted by Chancellor Mone* 3435 North Lake Drive, Milwaukee Event is by invitation only. Please contact [email protected] for more information. Thursday, June 9, 2022 8:45 a.m. – 10:00 a.m. Audit Committee Suzanne and Richard Pieper Family Foundation Green Room (Room 171), Zelazo Center 8:45 a.m. – 10:00 a.m. Capital Planning & Budget Committee Room 250, Zelazo Center 8:45 a.m. – 10:00 a.m. Research, Economic Development & Innovation Committee Helen Bader Concert Hall (Room 220), Zelazo Center 10:30 a.m. – 12:00 p.m. Business & Finance Committee Room 250, Zelazo Center 10:30 a.m. – 12:00 p.m. Education Committee Helen Bader Concert Hall (Room 220), Zelazo Center 12:00 p.m. Lunch* Room 280, Zelazo Center
-
Upload
khangminh22 -
Category
Documents
-
view
1 -
download
0
Transcript of Meeting-Book---UW-System-Board-of-Regents-(June-9-10 ...

06/02/2022
Page 1 of 2
BOARD OF REGENTS OF THE UNIVERSITY OF WISCONSIN SYSTEM
June 9-10, 2022 UW-Milwaukee, Zelazo Center
2419 E. Kenwood Blvd, Milwaukee Via Webex Videoconferences
Wednesday, June 8, 2022
5:30 p.m. – 7:00 p.m. Welcome Reception hosted by Chancellor Mone* 3435 North Lake Drive, Milwaukee Event is by invitation only. Please contact [email protected] for more information.
Thursday, June 9, 2022
8:45 a.m. – 10:00 a.m. Audit Committee Suzanne and Richard Pieper Family Foundation Green Room (Room 171), Zelazo Center
8:45 a.m. – 10:00 a.m. Capital Planning & Budget Committee Room 250, Zelazo Center
8:45 a.m. – 10:00 a.m. Research, Economic Development & Innovation Committee Helen Bader Concert Hall (Room 220), Zelazo Center
10:30 a.m. – 12:00 p.m. Business & Finance Committee Room 250, Zelazo Center
10:30 a.m. – 12:00 p.m. Education Committee Helen Bader Concert Hall (Room 220), Zelazo Center
12:00 p.m. Lunch* Room 280, Zelazo Center

Page 2 of 2
1:00 p.m. I. All Regents Helen Bader Concert Hall (Room 220), Zelazo Center Closed Session Helen Bader Concert Hall (Room 220), Zelazo Center
5:00 p.m. – 7:00 p.m. Reception Jan Serr Studio, Kenilworth East Building (top floor) 2155 N. Prospect Ave, Milwaukee, Wisconsin Event is by invitation only. Please contact [email protected] for more information.
Friday, June 10, 2022
8:45 a.m. II. All Regents Helen Bader Concert Hall (Room 220), Zelazo Center Optional Closed Session Helen Bader Concert Hall (Room 220), Zelazo Center
*A quorum of the Board of Regents may be present; no Board business will be conducted. Webex videoconference registration information and meeting materials can be found at https://www.wisconsin.edu/regents/meetingmaterials or may be obtained from Jess Lathrop, Executive Director, Office of the Board of Regents, 1860 Van Hise Hall, 1220 Linden Drive, Madison, WI 53706, (608) 262-2324.

06/02/2022
Page 1 of 2
BOARD OF REGENTS OF THE UNIVERSITY OF WISCONSIN SYSTEM
I. All RegentsThursday, June 9, 2022 1:00 p.m.
Helen Bader Concert Hall (Room 220) Zelazo Center
2419 E. Kenwood Boulevard Milwaukee, Wisconsin
1. Calling of the Roll
2. Declaration of Conflicts
3. Introduction of newly-appointed Regents
4. Other Updates and Introductions
5. Resolution of Appreciation for Former Interim President Michael J. Falbo’s Service to the UW System
6. Approval of the record(s) of the February 10-11, 2022 meeting of the UW System Board of Regents, the April 7-8, 2022 meeting of the UW System Board of Regents, the April 26, 2022 meeting of the Executive Committee of the UW System Board of Regents, and the May 16, 2022 Special Meeting of the UW System Board of Regents
7. Report of the Board PresidentA. Report(s) of the Wisconsin Technical College System BoardB. Update on the UW-Platteville and UW-Whitewater Chancellor Search processes
8. Report of the System PresidentA. Strategic Planning and Priorities
9. Host-campus Presentation by Mark Mone, Chancellor, UW-Milwaukee: “Expanding UWM’s Impact”
10. Presentation and Discussion: Graduation and the Value of a College Degree
11. Presentation, Discussion, and Approval: UW System 2022-23 Annual Operating Budget and Tuition and Fee Schedules

Page 2 of 2
12. Closed Session – Helen Bader Concert Hall (Room 220), Zelazo Center Move into closed session to:
A. Consider amended compensation and employment agreements for the UW-Madison head basketball coach, as permitted by s. 19.85(1)(c) and (e), Wis. Stats.;
B. Consider salary adjustments for two UW-Madison employees, as permitted by s. 19.85(1)(c), Wis. Stats.; and
C. Consider a student request for review of a UW-Madison disciplinary decision, as permitted by ss. 19.85(1)(a), (f), and (g), Wis. Stats.
The closed session agenda also may be considered on Friday, June 10, 2022, as the Board’s needs may dictate. In addition, the Board may reconvene in open session regarding matters taken up in the closed session, including voting, where applicable.

Page 1 of 2
Board of Regents Thursday, June 9, 2022
Item I.10.
GRADUATION AND THE VALUE OF A COLLEGE DEGREE
REQUESTED ACTION For information and discussion. SUMMARY The UW System is a significant talent pipeline supplying Wisconsin’s workforce needs. At a time when some are questioning the value of a college degree, there are also strong arguments that a college degree has never been more valuable both for individuals and society as a whole. Ben Passmore, Associate Vice President for UW System’s Office of Policy Analysis & Research (OPAR), will present new data on how the UW System is planning to meet workforce needs by analyzing job trends and assessing the relevance and preparedness provided by UW’s program array. OPAR has been conducting job market research across Wisconsin to help better inform universities in program development and career advising. The office has also created information products to allow universities to project and understand workforce needs in dozens of specific fields through the next decade. The current focus is on areas with known demand and institutional programmatic interest including health care, engineering, and education. The number of workforce sectors included in the analysis continues to expand and will include additional fields by the end of 2022. Passmore’s presentation will serve as the backdrop to a roundtable panel discussion of the changing dynamics of the labor market, how employers are developing new strategies to recruit employees, and how universities are working with students to prepare them to have a competitive edge when seeking employment. Panelists:
• Moderator: Laurie Marks, Executive Director of the Office of Student Experience and Talent (SET), UW-Milwaukee
• Kayla Juds, Labor and Delivery Nurse, Aurora West Allis Medical Center (UW Oshkosh graduate)
• Rebekah Kowalski, Vice President, Manpower Manufacturing at Manpower Group

Page 2 of 2
• Brittany Kulka, Talent Acquisition Manager, Husco International (UW-Whitewater graduate)
• Rebekah Paré, Associate Dean for L&S Career Initiative and Executive Director of SuccessWorks at the College of Letters & Science, UW-Madison
• Lyman Tschanz, Vice President, Global Operations Improvement, Rockwell Automation (UW-Platteville graduate)
• Chia Youyee Vang, Vice Chancellor for Diversity, Equity, and Inclusion at UW-Milwaukee
BACKGROUND A strategic priority for the UW System is to help make workforce readiness a reality for all students and graduates. The global COVID pandemic has often required both employers and those seeking employment to adapt their traditional approaches and use new and different strategies to reach their goals. Further, in the current hot labor market, employers are frequently desperate for talent which can put job seekers in the driver’s seat. UW System Career Services offices are widely recognized for being active in business outreach efforts and supporting work experience and job-placement programs for students and alumni. The panel discussion will offer a closer look at how the University and business and community stakeholders can work together to grow workforce readiness and expand pathways to career development and success.

Page 1 of 2
Item 11. Board of RegentsThursday, June 9, 2022
APPROVAL OF THE 2022-23 UNIVERSITY OF WISCONSIN ANNUAL OPERATING BUDGET
REQUESTED ACTION
Adoption of Resolution 11. Approval of the 2022-23 Annual Operating Budget
Resolution 11. That, upon the recommendation of the President of the University of Wisconsin System, the Board of Regents approves a 0% increase to resident undergraduate tuition rates for the upcoming 2022-23 fiscal year, maintaining the 2012-13 tuition rates. The Board further approves the 2022-23 operating budget, including segregated fees, room and board, and textbook rental, as attached in the document, “2022-23 Operating Budget and Fee Schedules, June 2022”.
SUMMARY
The University of Wisconsin 2022-23 Annual Operating Budget is the second year of the State of Wisconsin’s 2021-23 biennium. The State’s 2021-23 biennial budget does not include language prohibiting the Board of Regents from increasing tuition rates for resident undergraduate students. However, this resolution affirms there will be no increase to resident undergraduate tuition rates for 2022-23.
The total 2022-23 expenditure budget (excluding the use of tuition balances), will increase by approximately $296 million or 4.53%. Planned use of one-time tuition balances is $42 million. The total 2022-23 revenue budget increases by approximately $275.2 million or 4.20%.
The costs for a typical resident undergraduate student living on campus, including tuition, segregated fees, and room and board will increase an average of 1.7% or $273 for 2022-23.
Presenter
• Sean P. Nelson, Vice President for Finance

Page 2 of 2
Related Laws and Policies
• Chapter 20, Wis. Stats.• Chapter 36.09(h), Wis. Stats.
ATTACHMENTS
A) The University of Wisconsin System, “2022-23 Operating Budget and Fee Schedules,June 2022”

Board of Regents Item 11. Attachment A
2022-23
Operating
Budget and
Fee Schedules
University of Wisconsin System
June 2022

2022-23 OPERATING BUDGET AND FEE SCHEDULES TABLE OF CONTENTS
Page
1.
9.
12.
30.
31.
32.
33.
34.
61.
64.
Summary and Overview
2022-23 General Purpose Revenue (GPR)/Tuition Funding
2022-23 Auxiliary Funding
2022-23 General Program Operations Funding
2022-23 Federal Indirect Cost Reimbursement Funding
2022-23 Gifts, Grants, and Contracts Funding
2022-23 Federal Financial Aid and Other Funding
Campus Narratives and Budget Data
Appendix A. Adjustments in GPR Funding
Appendix B. Room and Board Rate Detail Tables
Appendix C. Auxiliary Balance Transfers 70.

SUMMARY AND OVERVIEW
The 2022-23 Annual Operating Budget is for the second year of the 2021-23 State of Wisconsin Biennial Budget. The annual budget information contained herein for the University of Wisconsin is based on the biennial budget as signed by Governor Evers on July 8, 2021.
The 2021-23 biennial budget did not include language prohibiting the Board of Regents from increasing tuition rates for resident undergraduate students. However, the annual budget resolution affirms there will be no increase to resident undergraduate tuition rates for 2022-23.
The total 2022-23 expenditure budget (excluding the use of tuition balances) will increase by approximately $296 million or 4.53%. Anticipated use of one-time tuition balances for 2022-23 is approximately $42 million. The total 2022-23 revenue budget increases by approximately $275.2 million or 4.20%.
The costs for a typical resident undergraduate student living on campus, including tuition, segregated fees, and room and board will increase an average of 1.7% or $273 for 2022-23.
COVID-19
The onset of the pandemic in March of 2020 dramatically altered campus operations and finances for FY20, FY21, and FY22. Every UW institution swiftly pivoted to alternative delivery of instruction and took proactive actions to reduce costs while at the same time incurring additional Covid-related expenses to maintain a safe environment for students and employees. Federal funding – primarily through the Higher Education Relief Funds (HEERF) – was critical in supporting not only the additional Covid-related expenses but also in mitigating decreases to auxiliary revenues, inclusive of dramatic shortfalls in housing and dining. With additional federal funding, coupled with campus measures to reduce costs, the UW institutions were able to maintain financial viability while continuing to slowly rebound to the pre-pandemic level of operations. As FY22 comes to a close, most of the UW institutions will have drawn down all of their one-time funding from the HEERF allocation and will not be reliant on federal funds to support FY23 expenses or lost revenue.
The 2022-23 annual operating budget for the UW System reflects the campuses emerging from the pandemic and increasing revenue and expense budgets in many areas including auxiliary operations and general program operations. Campuses and UW System Administration continue to monitor Covid trends and anticipate an ongoing need for testing and other potential Covid related expenses.
1

Individual Campus Narratives and Budget Data
The past two annual budget documents have included an informational page for each institution. In the 2022-23 budget, this is expanded to provide additional insight to the upcoming year’s budget planning for each UW institution. These narratives include, campus mission statements, key drivers in the 2022-23 annual budget, strategic budget actions in 2022-23, and campus philanthropy efforts.
In addition to the campus narratives, as with prior years, data is provided showing enrollment trends over the past five years by both head count and full-time equivalent students. A view of expenditure and revenue budgets by fund group compared with the prior year is provided in table and chart formats. Specific campus information regarding segregated fees, room and board, and textbook rental is included in the auxiliary section of the annual budget document.
Branch campuses (former UW Colleges) and former UW-Extension units have been budgeted using the structure approved by the Board of Regents in November 2017. Branch campus budgets have been integrated with their receiving institutions in the narrative, enrollment, and budget data. Branch campus auxiliary rates generally differ from main campus rates and are detailed in the auxiliary section of the document.
At-A-Glance
Highlights of the UW System’s 2022-23 Annual Budget include the following:
• The 2021-23 biennial budget does not prohibit the Board of Regents from increasingtuition rates for resident undergraduate students. The annual budget resolutionaffirms that there will not be an increase in resident undergraduate tuition for the2022-23 academic year.
2

• While tuition for resident undergraduate students has remained unchanged since fiscal year 2013-14, the Board has adjusted some tuition rates for non-resident undergraduate, resident graduate, non-resident graduate, and professional school students. Requested changes to these rates were approved at the December 2021 Board meeting and are reflected in the campus 2022-23 budgets.
o Total expenditure authority for tuition, program specific differentials and self-supporting programs, is increased by a total of $66 million.
UW-Madison increased their tuition authority by $46.3 million due to undergraduate enrollment increases and changes in student mix, along with tuition increases in undergraduate non-resident professional schools. UW-Green Bay and UW-Whitewater also increased their tuition authority due to growth in self-supporting programs.
A total of five campuses revised their tuition authority budgets downward for 2022-23, largely reflecting reduced enrollments.
• The total 2022-23 expenditure budget (excluding the use of tuition balances) will increase by approximately $296 million or 4.53%. Planned use of one-time tuition balances is $42 million. The total 2022-23 revenue budget increases by approximately $275.2 million or 4.20%. Expenditures and revenue budgets by campus are detailed in each fund’s section of the document.
• Including tuition, segregated fees, and room and board, the cost for a typical resident student living on campus in 2022-23 will increase by 1.7% or $273 for students at four-year campuses and increase 0.1% or $6 for students at two-year campuses.
3

ALL FUNDS BUDGET OVERVIEW
The UW System budget includes expenses and revenues from several different fund sources. To provide more concise analysis of budgets, the funds are reported by seven fund groups as defined below:
• General Purpose Revenue (GPR)/Tuition Fundso state resourceso tuitiono extension credit fees
• Auxiliary Operationso self-supporting programs whose primary purpose is to provide services to
students, staff, and occasionally the public examples include, residence halls, food service, unions, student
organizations, and parking• General Program Operations (GPO)
o self-supporting operations examples include, camps and clinics, print and copy shops, and dairy
sales• Federal Indirect Cost Reimbursement (FICR)
o reimbursements received from the federal government for various costsincurred in administering federal grant programs
• Gifts, Grants and Contracts (GGC)o use of funds is restrictedo private or organizational giftso federal and nonfederal research grantso contracts that are provided for specific purposes
• Federal Financial Aid (FFA) and Othero federal student aid that is passed through to UW studentso debt service payments for non-academic buildingso non-credit Extension programming
The tables and narratives on the following pages provide information on the total 2022-23 UW System budget, as well as information by source of funds, including the dollar and percent change.
4

2021 - 2022 2022 - 2023 Percent 2021 - 2022 2022 - 2023 PercentExpenditure Expenditure Percent Dollar of Ongoing Revenue Revenue Percent Dollar of Total
Fund Source Category Budget Budget Change Change Base Budget Budget Change Change RevenueOperational GPR (Ongoing) 1,005,879,365 1,027,075,448 2.11% 21,196,083 15.03% 1,005,879,365 1,027,075,448 2.11% 21,196,083 15.06%GPR Debt Service 205,856,900 211,391,800 2.69% 5,534,900 3.09% 205,856,900 211,391,800 2.69% 5,534,900 3.10%GPR Total 1,211,736,265 1,238,467,248 2.21% 26,730,983 18.13% 1,211,736,265 1,238,467,248 2.21% 26,730,983 18.16%Tuition 1,552,139,838 1,616,973,853 4.18% 64,834,015 23.67% 1,573,902,724 1,628,442,893 3.47% 54,540,169 23.88%GPR/Tuition Total 2,763,876,103 2,855,441,101 3.31% 91,564,998 41.79% 2,785,638,989 2,866,910,141 2.92% 81,271,152 42.03%Auxiliary Operations 739,582,358 827,084,710 11.83% 87,502,352 12.10% 709,633,510 793,803,126 11.86% 84,169,617 11.64%General Program Operations 438,015,064 496,689,574 13.40% 58,674,509 7.27% 444,853,102 489,406,098 10.02% 44,552,996 7.18%Federal Indirect Cost Reimbursement 180,427,200 210,793,131 16.83% 30,365,930 3.09% 175,701,586 200,153,196 13.92% 24,451,610 2.93%Gifts, Grants, and Contracts 1,364,671,475 1,436,064,785 5.23% 71,393,310 21.02% 1,378,058,644 1,462,804,294 6.15% 84,745,650 21.45%Federal Financial Aid 783,515,681 734,835,583 -6.21% -48,680,098 10.75% 784,354,647 733,961,777 -6.42% -50,392,870 10.76%Other 266,625,489 271,830,051 1.95% 5,204,562 3.98% 267,155,826 273,511,377 2.38% 6,355,550 4.01%Total Ongoing Base Budget 6,536,713,371 6,832,738,934 4.53% 296,025,563 100.00% 6,545,396,304 6,820,550,009 4.20% 275,153,705 100.00%One Time Use of Tuition Balances 35,690,066 42,046,329 17.81% 6,356,263Total Operating Budget 6,572,403,437 6,874,785,264 4.60% 302,381,827
Expense Revenue
University of Wisconsin System Budget Summary - All Fund Groups
5

GPR/Tuition BaseAuxiliary
Operations
General Program
Operations
Federal Indirect Cost
ReimbursementGifts, Grants, and
ContractsFederal
Financial Aid Other Funds Total Base
One-Time Use of Tuition Balances
Total Including Use of Tuition Balances
Madison 1,127,136,383 411,439,521 341,585,115 193,967,263 1,302,215,089 189,288,070 173,569,246 3,739,200,687 - 3,739,200,687
Milwaukee 265,332,540 88,951,542 12,938,460 7,450,724 58,261,985 133,520,000 12,234,762 578,690,013 18,524,780 597,214,793
Eau Claire 91,969,431 46,115,375 10,062,777 366,996 7,604,237 46,365,909 9,418,958 211,903,683 5,101,539 217,005,222
Green Bay 58,399,893 22,808,611 5,135,410 313,036 7,144,097 36,697,531 2,742,734 133,241,313 - 133,241,313
La Crosse 95,982,763 39,230,107 2,325,574 403,657 7,083,275 49,259,914 9,077,447 203,362,737 2,491,850 205,854,587
Oshkosh 90,160,083 40,541,100 11,545,990 721,576 11,179,202 49,842,194 9,386,102 213,376,247 - 213,376,247
Parkside 42,731,819 9,085,888 1,471,906 93,200 1,725,947 26,125,596 3,761,256 84,995,612 1,344,000 86,339,612
Platteville 66,567,428 28,844,453 9,652,562 167,218 4,578,200 30,807,978 7,460,484 148,078,323 305,545 148,383,868
River Falls 53,500,191 27,793,047 2,882,724 267,927 3,279,622 29,249,347 4,723,560 121,696,418 884,673 122,581,091
Stevens Point 78,811,429 35,738,218 14,665,780 216,255 9,346,344 38,902,322 10,987,261 188,667,609 - 188,667,609
Stout 68,748,810 31,691,521 15,553,182 511,235 7,281,221 34,336,903 7,280,305 165,403,177 - 165,403,177
Superior 30,574,100 5,580,954 1,081,629 346,125 6,634,694 16,084,385 2,094,504 62,396,391 804,367 63,200,758
Whitewater 106,129,844 38,219,953 21,657,026 415,887 5,190,421 54,355,434 9,242,461 235,211,026 2,128,000 237,339,026
Systemwide 97,169,080 1,044,420 46,131,439 5,552,031 4,540,450 - 9,850,971 164,288,391 7,131,796 171,420,187
GPR/Tuition Fringe Benefits 582,227,307 - - - - - - 582,227,307 3,329,779 585,557,086
Total 2,855,441,101 827,084,710 496,689,574 210,793,131 1,436,064,785 734,835,583 271,830,051 6,832,738,934 42,046,329 6,874,785,264
Percent of Total 41.79% 12.10% 7.27% 3.09% 21.02% 10.75% 3.98% 100.00% - -
University of Wisconsin System2022 - 2023 Annual Budget by Management Category and Institution
Expense
6

GPR/TuitionAuxiliary
Operations
General Program
Operations
Federal Indirect Cost
ReimbursementGifts, Grants, and
ContractsFederal
Financial Aid Other Funds Total Revenue
Madison 1,144,688,184 406,331,374 339,090,238 185,496,071 1,329,516,485 188,368,575 176,045,910 3,769,536,837
Milwaukee 263,365,569 80,178,181 12,056,504 6,815,895 58,269,985 133,440,000 12,396,633 566,522,767
Eau Claire 92,356,768 43,466,407 9,957,818 400,267 7,535,853 46,365,909 9,494,886 209,577,908
Green Bay 57,990,224 21,160,725 5,013,044 270,435 6,934,460 36,697,600 2,295,774 130,362,261
La Crosse 98,072,183 37,920,178 2,420,132 403,658 7,261,342 49,259,914 9,038,572 204,375,979
Oshkosh 94,785,911 36,004,337 11,165,366 539,163 10,497,668 49,842,194 9,382,875 212,217,514
Parkside 43,947,899 8,153,096 2,129,548 93,200 1,674,947 26,109,000 3,705,057 85,812,747
Platteville 63,677,894 26,396,424 10,456,435 129,189 4,580,000 30,807,978 7,508,532 143,556,452
River Falls 53,635,744 23,422,157 2,640,131 239,000 3,467,147 29,279,359 4,703,560 117,387,098
Stevens Point 78,247,611 32,552,089 14,824,144 223,129 9,364,508 38,902,973 10,998,536 185,112,990
Stout 69,512,207 31,769,851 14,931,101 440,528 7,691,221 34,336,903 7,280,305 165,962,116
Superior 30,529,936 5,590,427 1,058,500 400,000 6,666,000 16,084,385 2,098,969 62,428,217
Whitewater 96,703,624 40,142,581 21,685,918 609,268 5,394,127 54,466,987 9,242,861 228,245,366
Systemwide 97,169,080 715,300 41,977,219 4,093,393 3,950,551 - 9,318,907 155,549,850
GPR/Tuition Fringe Benefits 582,227,307 - - - - - - 582,227,307
Total 2,866,910,141 793,803,126 489,406,098 200,153,196 1,462,804,294 733,961,777 273,511,377 6,820,550,009
Percent of Total 42.03% 11.64% 7.18% 2.93% 21.45% 10.76% 4.01% 100.00%
University of Wisconsin System2022 - 2023 Annual Budget by Management Category and Institution
Revenue
7

CampusFY23
Tuition ChangeFY22 Seg
FeeFY23 Seg
Fee Change
Tuition and Seg Fee %
ChangeFY22
Room RateFY23
Room Rate ChangeFY22
Meal PlanFY23
Meal Plan ChangeFY22Total
FY23Total
Total Increase
Total % Increase
Madison 9,273 0 1,484 1,523 39 0.4% 7,067 7,167 100 3,850 4,050 200 21,674 22,013 339 1.6%Milwaukee 8,091 0 1,519 1,529 10 0.1% 6,274 6,274 0 4,189 4,274 85 20,073 20,168 95 0.5%
Washington 4,750 0 413 434 21 0.4% 5,163 5,184 21 0.4%Waukesha 4,750 0 413 434 21 0.4% 5,163 5,184 21 0.4%
Eau Claire 7,361 0 1,373 1,413 40 0.5% 5,170 5,325 155 3,180 3,460 280 17,084 17,559 475 2.8%Barron 4,750 0 485 500 15 0.3% 5,235 5,250 15 0.3%
Green Bay 6,298 0 1,575 1,575 0 0.0% 4,575 4,748 173 2,850 2,950 100 15,298 15,571 273 1.8%Manitowoc 4,750 0 424 424 0 0.0% 5,174 5,174 0 0.0%Marinette 4,750 0 424 424 0 0.0% 5,174 5,174 0 0.0%Sheboygan 4,750 0 424 424 0 0.0% 5,174 5,174 0 0.0%
La Crosse 7,585 0 1,436 1,473 37 0.4% 4,130 4,233 103 2,674 2,796 122 15,825 16,087 262 1.7%Oshkosh 6,422 0 1,311 1,373 62 0.8% 5,111 5,209 98 3,330 3,460 130 16,174 16,464 290 1.8%
Fond du Lac*** 4,750 0 510 526 15 0.3% $2,500 $2,500 5,260 7,776 15 0.3%Fox Valley*** 4,750 0 337 348 10 0.2% $2,500 $2,500 5,087 7,598 10 0.2%
Parkside 6,298 0 1,146 1,168 23 0.0% 4,879 4,905 26 2,856 2,900 44 15,179 15,271 92 0.6%Platteville 6,418 0 1,206 1,224 18 0.2% 5,560 5,587 27 3,160 3,220 60 16,344 16,449 105 0.6%
Baraboo 4,750 0 544 544 0 0.0% 5,294 5,294 0 0.0%Richland 4,750 0 600 600 0 0.0% 5,350 5,350 0 0.0%
River Falls 6,428 0 1,484 1,528 44 0.6% 4,450 4,584 134 2,572 2,650 78 14,934 15,190 256 1.7%Stevens Point 6,698 0 1,503 1,533 30 0.4% 4,600 4,750 150 3,200 3,500 300 16,001 16,481 480 3.0%
Marshfield 4,750 0 404 404 0 0.0% 5,154 5,154 0 0.0%Wausau 4,750 0 447 447 0 0.0% 5,197 5,197 0 0.0%
Stout** 7,020 0 1,364 1,474 110 1.3% 4,710 4,830 120 3,038 3,218 180 16,132 16,542 410 2.5%Superior 6,535 0 1,620 1,632 13 0.2% 4,433 4,477 44 2,772 2,940 168 15,360 15,584 225 1.5%Whitewater 6,519 0 1,037 1,149 112 1.5% 4,472 4,517 45 2,701 2,792 91 14,729 14,977 248 1.7%
Rock 4,750 0 382 382 0 0.0% 5,132 5,132 0 0.0%
Average - four year campuses 6,996 0 1,389 1,430 40 0.5% 5,033 5,124 90 3,106 3,247 141 16,524 16,797 273 1.7%
Average - two year campuses*** 4,750 0 447 453 6 0.1% 5,197 5,203 6 0.1%
*** Total and percent increases and the Average - two year campuses exclude the new meal plan options at Fond du Lac and Fox Valley.
**UW-Stout is the only institution to charge a per-credit tuition rate. The full-time tuition rate shown is the per-credit rate multiplied by 15 credits per semester. The actual tuition increase paid by a student will vary based on the number of creditstaken.
*Represents the average cost for the majority of students. Does not include the cost of purchasing textbooks.
Divide by two for semester rate
University of Wisconsin System2022-23 CONSOLIDATED SCHEDULE OF TUITION, SEGREGATED FEES, AND ROOM AND BOARD
Typical Costs of a Resident Undergraduate Student Living on Campus*
8

2022-23 GPR/TUITION FUNDS
The GPR/Tuition Changes by Institution table on page 11, shows the detailed allocation changes in GPR/Tuition by institution from 2021-22 to 2022-23. Appendix A provides details regarding the methodology used for the GPR/Tuition funding adjustments.
Highlights of these changes include:
• In 2021-22, $4 million in funding, including fringe benefits, was held in Systemwideuntil released from the Joint Finance Committee supplemental appropriation inFebruary 2022. That funding has been allocated to the appropriate UW Systemcampus
• An additional $250,000 in ongoing funding has been provided in 2022-23 to supportFoster Youth programs for students who formerly resided in a foster or grouphome. This funding is being held in Systemwide pending completion of a grantaward process.
• The State’s compensation plan for 2021-23, including all UW and State employeeswas approved by the Joint Committee on Employee Relations. 2022-23 fundingincludes:
o Funding for the second six months of the two percent pay plan, which becameeffective January 2, 2022.
o Funding for the first six months of the two percent pay plan, effective January1, 2023
o The total GPR share of pay plan in FY23 is estimated at $21.4 million,including fringe benefits
o The total tuition share of pay plan in FY23 is estimated at $8.6 million,including fringe benefits
• Campuses were required to reallocate for the tuition share of payplan.
9

• There is also an overall increase to budget authority of $66 million for tuition, program specific differentials, and self-supporting programs.
o Four campuses increased tuition authority (excluding fringe benefits): UW-Madison: $46.3 million
• Primarily due to non-resident and professional school tuition and changes in enrollment
UW-Green Bay: $4.2 million• Due to continued growth in self-supporting programs
UW-La Crosse: $186,000• Adjustment to reflect estimated tuition revenue
UW-Whitewater $4.4 million• Due to continued growth in self-supporting programs
• Five UW System campuses reduced their tuition authority to right-size expenditures with revenues.
10

2021-22GPR/Tuition
OngoingBudget
2022-23Tuition
Authority andProgram
Differentials
Full Funding of Pay Plan Effective
Jan 1, 2022
2022-23Portion ofPay PlanEffective
Jan 1, 2023
Reallocation of Outcomes
Based Funding2022-23
Debt Service Other*
2022-23GPR/Tuition
OngoingBudget
Total Change of
GPR/TuitionOngoingBudget
2022-23Use of Tuition
Balances
2022-23GPR/Tuition
Ongoing BudgetPlus Use of
Tuition BalancesMadison 1,063,174,339 46,291,481 7,601,834 4,674,056 617,832 3,762,600 1,014,241 1,127,136,383 63,962,044 - 1,127,136,383Milwaukee 265,764,626 -8,000,000 2,005,228 1,221,701 -111,641 4,643,900 -191,274 265,332,540 -432,086 18,524,780 283,857,320
Eau Claire 90,064,351 -167,447 656,268 403,025 54,886 1,425,700 -467,352 91,969,431 1,905,080 5,101,539 97,070,970Green Bay 53,695,483 4,201,196 362,986 223,338 -13,741 -292,700 223,331 58,399,893 4,704,410 - 58,399,893La Crosse 96,158,596 185,965 578,736 347,259 37,377 -1,300,100 -25,070 95,982,763 -175,833 2,491,850 98,474,613Oshkosh 90,641,183 - 626,351 377,095 -339,132 -1,062,000 -83,414 90,160,083 -481,100 - 90,160,083Parkside 42,912,288 - 300,125 179,520 -9,750 -568,700 -81,664 42,731,819 -180,469 1,344,000 44,075,819Platteville 65,093,367 - 491,551 295,565 -3,378 805,600 -115,277 66,567,428 1,474,061 305,545 66,872,973River Falls 53,363,443 -1,000,000 358,441 212,287 61,091 381,700 123,229 53,500,191 136,748 884,673 54,384,864Stevens Point 81,841,286 -2,807,071 517,577 318,353 -241,834 -819,300 2,418 78,811,429 -3,029,857 - 78,811,429Stout 69,858,728 -1,595,310 477,369 282,576 -179,015 -119,500 23,962 68,748,810 -1,109,918 - 68,748,810Superior 31,538,302 0 191,534 116,814 39,673 -1,372,300 60,077 30,574,100 -964,202 804,367 31,378,467Whitewater 101,198,360 4,419,375 675,275 398,065 -23,394 50,000 -587,837 106,129,844 4,931,484 2,128,000 108,257,844Systemwide 94,081,368 - 382,450 282,487 - - 2,422,775 97,169,080 3,087,712 7,131,796 104,300,876
2% Pay Plan Jan 2022 4,853,541 -4,853,541 - -4,853,541Joint Fin. Suppl. Appn. 3,975,110 -3,975,110 - -3,975,110
System Total Excl FB 2,208,214,371 41,528,189 10,372,184 9,332,141 -111,026 5,534,900 -1,656,965 2,273,213,794 64,999,423 38,716,550 2,311,930,344
Fringe Benefits 555,661,732 24,511,752 345,861 1,390,989 111,026 - 205,947 582,227,307 26,565,575 3,329,779 585,557,086
System Total 2,763,876,103 66,039,941 10,718,045 10,723,130 - 5,534,900 -1,451,018 2,855,441,101 91,564,998 42,046,329 2,897,487,430
* Other includes: Lawton and AOP adjustments, funding formerly held in JFC supplemental appropriation, utilities adjustments, renewable energy appropriation, credit extension
University of Wisconsin System2022-23 GPR/Tuition Changes by Institution
11

2022-23 AUXILIARY OPERATIONS
Auxiliary operations are self-supporting programs whose primary purpose is to provide services to students (e.g., residence halls, student centers/unions, student health clinics, bookstores) and whose secondary purpose is to provide services to staff, and occasionally the general public (e.g., parking, printing and duplicating services). User fees, segregated fees, merchandise sales, and interest earnings generate revenues for auxiliary operations, and the operations are allowed to maintain reserves to smooth rate changes, for new facilities, remodeling/additions, deferred maintenance, high-cost equipment, debt service obligations, and to ensure adequate funding for current operations. Students participate in the programming and budgeting process through institutional Segregated University Fee Allocation Committees.
The table on page 13 shows 2022-23 Auxiliary revenue and expense budget by campus. Expenses exceed revenues by 4.19% or $33.3 million.
While expenditures exceed revenues at many campuses, overall, this is not an indication of a structural deficit. Campuses are utilizing balances to address one-time expenses and to provide bridge funding as they continue to rebound to more normal operations in 2022-23.
Examples of the use of balances are: • Deferred maintenance and repairs• Costs of new projects in areas such as student centers, housing, and dining facilities• Where activities have not fully rebounded to pre-Covid levels, balances are being
used to address one-time needs• Balances are being expended to support the inflationary cost of goods and
contractual increase where they outpace rates• Unanticipated increases in project and construction costs
12

Expense Revenue Variance VarianceBudget Budget (Rev less Exp) Percent
Madison 411,439,521 406,331,374 -5,108,147 -1.26%Milwaukee 88,951,542 80,178,181 -8,773,361 -10.94%Eau Claire 46,115,375 43,466,407 -2,648,968 -6.09%Green Bay 22,808,611 21,160,725 -1,647,886 -7.79%La Crosse 39,230,107 37,920,178 -1,309,929 -3.45%Oshkosh 40,541,100 36,004,337 -4,536,763 -12.60%Parkside 9,085,888 8,153,096 -932,792 -11.44%Platteville 28,844,453 26,396,424 -2,448,029 -9.27%River Falls 27,793,047 23,422,157 -4,370,890 -18.66%Stevens Point 35,738,218 32,552,089 -3,186,129 -9.79%Stout 31,691,521 31,769,851 78,330 0.25%Superior 5,580,954 5,590,427 9,473 0.17%Whitewater 38,219,953 40,142,581 1,922,628 4.79%Systemwide 1,044,420 715,300 -329,120 -46.01%System Total 827,084,710 793,803,126 -33,281,584 -4.19%
University of Wisconsin System2022 - 2023 Auxiliary Operations by Institution
13

Segregated Fee and Room and Board Rates
For 2022-23 campuses were instructed that proposed rate changes should be limited to: • Pay plan and associated fringe benefit increases for 2022-23• Market salary adjustments and fringe• Other fringe benefits• Documented contractual increases• Proposed student-initiated programming• Student safety initiatives• Debt service• Enumerated capital projects
As with prior years, for a more accurate reflection of what families of students living on campus are actually paying, a model is being utilized that calculates rates based on the average cost of room and board paid by the majority of students. The rates shown in the budget tables and charts only reflect the room and board rates paid by the majority of students. The Board of Regents will approve all respective room and board rates contained in Appendix B.
The charts on the following pages include comparative information on segregated fee and room and board rates by institution. Specific campus information regarding segregated fees, room and board, and textbook rental is included in this section.
14

$-
$400
$800
$1,200
$1,600
$1,5232.6%$39
$1,529 0.7%$10 $1,413
2.9%$40
$1,5750.0%
$0 $1,4732.6%$37
$1,3734.7%$62
$1,1682.0%$23
$1,2241.5%$18
$1,5283.0%$44
$1,5332.0%$30
$1,4748.1%$110
$1,6320.8%$13
$1,14910.8%$112
TOTA
L SE
GRE
GAT
ED F
EE IN
DO
LLAR
S
2021-22 Rate 2022-23 Change
Segregated FeePercent ChangeDollar Change
University of Wisconsin System2022-23 Academic Year Segregated Fees
Four-Year Campuses(Divide by two for Semester Rates)
15

$-
$100
$200
$300
$400
$500
$600
$5003.0%$15
$526 3.0%$15
$4240.0%
$0
$4240.0%
$0
$4240.0%
$0
$4345.0%$21
$4345.0%$21
$3483.0%$10
$5440.0%
$0
$6000.0%
$0
$4040.0%
$0
$4470.0%
$0$3820.0%
$0
TOTA
L SE
GRE
GAT
ED F
EE IN
DO
LLAR
S
2021-22 Rate 2022-23 Change
Segregated FeePercent ChangeDollar Change
University of Wisconsin System2022-23 Academic Year Segregated Fees
Two-Year Campuses(Divide by two for Semester Rates)
16

17

Institution 2021-22 2022-23 Change % ChangeMadison $1,484.03 $1,523.03 $39.00 2.6%- Operations $1,086.11 $1,125.11 $39.00 3.6%
Pay plan and Associated Fringes $7.66Market Salary Adjustments and Fringes $6.00Contractual Changes $1.69Student Initiated Programming $12.39Student Initiated Programming $10.09Student Safety $1.17
- Major Projects $397.92 $397.92 $0.00 0.0%Milwaukee $1,518.60 $1,528.70 $10.10 0.7%- Operations $1,305.41 $1,334.91 $29.50 2.3%
Pay plan and Associated Fringes $23.61Market Salary Adjustments and Fringes $10.06Contractual Changes $12.10Student Initiated Programming $5.60Base Expense Reductions -$8.80Base Expense Reductions -$16.30Change in Reserves/Revenues $0.94Change in Reserves/Revenues $15.20Change in Reserves/Revenues -$12.91
- Major Projects $213.19 193.79 -$19.40 -9.1%Eau Claire $1,372.60 $1,412.95 $40.35 2.9%- Operations $1,028.78 $1,069.13 $40.35 3.9%
Pay plan and Associated Fringes $20.00Market Salary Adjustments and Fringes $0.35Contractual Changes $14.80Student Initiated Programming $5.20
- Major Projects $343.82 $343.82 $0.00 0.0%Green Bay $1,575.12 $1,575.12 $0.00 0.0%- Operations $1,386.97 $1,399.83 $12.86 0.9%
Pay plan and Associated Fringes $7.67Market Salary Adjustments and Fringes $21.65Contractual Changes $2.59Contractual Changes -$6.08Contractual Changes -$15.33Contractual Changes -$5.48Contractual Changes -$6.39Student Initiated Programming -$1.78Student Safety $3.13Change in Reserves/Revenues $34.95Change in Reserves/Revenues -$22.07
- Major Projects $188.15 $175.29 -$12.86 -6.8% For decreased debt service in sports programming and facilities
Sports programming and facilities, student life and unionFor staff and student wage increases in sports programming and facilities and union
Due to a decrease in the number of student organization requests in organized activitiesFor increased mental health staffing and support
For contracted rate increase in student health services
To create capital maintenance reserve and inclusivity special projects fund in organized activities
In the union due to an increase in enrollments
In municipal services, organized activities, transit and health due to an increase in enrollmentsIn sports programming and facilities due to an increase in enrollmentsIn student life due to an increase in enrollments
Mental health support expansion
Child care, Sports programming and facilities, Union, Transit, and HealthOrganized activities
HealthSports programming and facilities and transit
For student wage increases in sports programming and facilities and health For equipment servicing in sports programming and facilitiesSports programming and facilities for new Nick and Bakke buildings
Addition of contracted on-call mental health service
Municipal services and sports programming and facilities
Sports programming and facilities and health
For requested additional bus routes in transitMunicipal services and transit
Sports programming and facilities, union and health
DOCTORAL & COMPREHENSIVE SEGREGATED FEES 2022-23 ACADEMIC YEAR
Child care, sports programming and facilities, student life, union, transit, and healthFor student wage increases in sports programming and facilities and union
For various student resource centers in student life
Child care, municipal services, student life, and union
To increase minimum wage in child care center
$9.60 Student Health Center project, -$29.00 Klotsche Center Annex Addition project is completed
Sports programming and facilities
Narrative
18

Institution 2021-22 2022-23 Change % ChangeLa Crosse $1,435.86 $1,473.22 $37.36 2.6%- Operations $858.64 $896.00 $37.36 4.4%
Pay plan and Associated Fringes $32.95Contractual Changes $0.49Student Initiated Programming $3.92
- Major Projects $577.22 $577.22 $0.00 0.0%Oshkosh $1,311.30 $1,373.40 $62.10 4.7%- Operations $1,003.12 $1,059.28 $56.16 5.6%
Pay plan and Associated Fringes $15.16Market Salary Adjustments and Fringes $5.42Student Initiated Programming $2.82Student Safety $33.50Change in Reserves/Revenues -$0.74
- Major Projects $308.18 $314.12 $5.94 1.9%Parkside $1,145.52 $1,168.32 $22.80 2.0%- Operations $642.59 $650.90 $8.31 1.3%
Pay plan and Associated Fringes $9.82Market Salary Adjustments and Fringes $1.02Contractual Changes -$0.39Contractual Changes $7.13Student Initiated Programming -$9.27
- Major Projects $502.93 $517.42 $14.49 2.9%Platteville $1,206.00 $1,224.00 $18.00 1.5%- Operations $939.00 $957.00 $18.00 1.9%
Other Fringe Benefits $1.00
Contractual Changes $17.00
- Major Projects $267.00 $267.00 $0.00 0.0%River Falls $1,484.42 $1,528.34 $43.92 3.0%- Operations $1,135.42 $1,194.34 $58.92 5.2%
Pay plan and Associated Fringes $9.09Market Salary Adjustments and Fringes $1.83Contractual Changes $4.87Student Initiated Programming $35.00Student Safety $8.13
- Major Projects $349.00 $334.00 -$15.00 -4.3%
DOCTORAL & COMPREHENSIVE SEGREGATED FEES 2022-23 ACADEMIC YEAR
Due to a decrease in the number of active student organizations in organized activities
For two additional mental health counselors
For student wage increases in the union
Narrative
Child care, sports programming and facilities, union, and healthFor transit bus contractFor Esports facility operational costs in sports programming and facilities
Debt service in the union
Decreased debt service in the Falcon Center
For increased contracted travel costs, conference dues and video services contract in sports programming and facilities
Municipal servicesCustodial contract in the union
Sports programming and facilities, student life, and health
For increased fringe benefits in the union
Transit
$21.40 for debt service in child care and sports programming and facilities, -$15.46 for decreased debt service in union
For the Green Fund and leadership training in organized activities and additional speakers in the unionFor two additional trainers and a Violence Prevention Coordinator in sports programming and facilities
For student wage increases in the unionChild care, sports programming and facilities, union, and health
Sports programming and facilities, student life, union, and healthFor wage increases for custodial and facilities staff in sports programming and facilitiesSports programming and facilities, student life, and health
For ongoing deferred maintenance funding in the Falcon Center and the union
19

Institution 2021-22 2022-23 Change % ChangeStevens Point $1,503.20 $1,533.12 $29.92 2.0%- Operations $1,044.60 $1,074.52 $29.92 2.9%
Pay plan and Associated Fringes $14.16Student Initiated Programming $11.88Student Initiated Programming $7.32Student Initiated Programming $37.56Student Safety $8.40Change in Reserves/Revenues -$49.40
- Major Projects $458.60 $458.60 $0.00 0.0%Stout $1,364.10 $1,474.20 $110.10 8.1%- Operations $1,071.83 $1,101.83 $30.00 2.8%
Pay plan and Associated Fringes $8.25Contractual Changes $11.94Student Initiated Programming $9.81
- Major Projects $292.27 $372.37 $80.10 27.4%Superior $1,619.70 $1,632.34 $12.64 0.8%- Operations $1,071.70 $1,084.34 $12.64 1.2%
Pay plan and Associated Fringes $3.96Market Salary Adjustments and Fringes $8.43Contractual Changes $0.25
- Major Projects $548.00 $548.00 $0.00 0.0%Whitewater $1,037.27 $1,149.29 $112.02 10.8%- Operations $817.01 $951.00 $133.99 16.4%
Pay plan and Associated Fringes $14.77Contractual Changes $3.15Student Initiated Programming $37.95Student Initiated Programming $40.00Student Initiated Programming $10.01Student Initiated Programming $17.13Student Initiated Programming $1.80Student Safety $8.32Change in Reserves/Revenues $0.86
- Major Projects $220.26 $198.29 -$21.97 -10.0%
Free flu vaccine clinic for students in healthInclude free bowling for all students and for involvement and engagement opportunities in the union
DOCTORAL & COMPREHENSIVE SEGREGATED FEES 2022-23 ACADEMIC YEAR
New position for campus activities and student engagement in student life
Free access to the weight room for all students in sports programming and facilitiesFor increased student organizations and cultural affairs funding in organized activities
Maintain current level of funding for the union
Narrative
Child care, organized activities, sports programming and facilities, student life, union, and health
Municipal services, sports programming and facilities, union, and transitOrganized activities, sports programming and facilities, and union
Student approved recreation complex
Municipal servicesFor staff and student wage increases in organized activities and unionSports programming and facilities and health
Maintain current level of funding for sports programming and facilities
For additional mental health counselorUtilize reserves in health
Create a student advocate case manager position in student life
For roof replacement in the union
Child care, organized activities, sports programming and facilities, union, and healthIncreased municipal services and ticketing software change in the union
Decreased debt service in sports programming and facilities
For student wage increases in organized activities, sports programming and facilities, and union
Union
20

Institution 2021-22 2022-23 Change % ChangeBaraboo/Sauk $543.52 $543.52 $0.00 0.0%
Contractual Changes $2.88Student Initiated Programming -$52.08Student Initiated Programming -$4.92Student Initiated Programming $54.12
Barron $485.45 $500.00 $14.55 3.0%Pay plan and Associated Fringes $14.89Contractual Changes $2.76Student Initiated Programming $14.27Base Expense Reductions -$17.37
Fond du Lac $510.19 $525.51 $15.32 3.0%Contractual Changes $0.50Student Initiated Programming $86.54Base Expense Reductions -$71.72
Fox Valley $337.40 $347.52 $10.12 3.0%Pay plan and Associated Fringes $2.90Contractual Changes $5.70Student Initiated Programming $22.82Student Initiated Programming $59.47Base Expense Reductions -$80.77
Manitowoc $424.44 $424.44 $0.00 0.0%Contractual Changes -$1.65Student Initiated Programming $90.00Student Safety $53.25Base Expense Reductions -$87.40Base Expense Reductions -$65.10Change in Reserves/Revenues $10.90
Marinette $424.44 $424.44 $0.00 0.0%Contractual Changes $1.86Student Initiated Programming $90.00Student Safety $46.00Base Expense Reductions -$64.72Base Expense Reductions -$65.10Change in Reserves/Revenues $38.63Change in Reserves/Revenues -$46.67
Marshfield $404.16 $404.16 $0.00 0.0%
Richland $600.44 $600.44 $0.00 0.0%Contractual Changes $27.14Student Initiated Programming -$61.26Student Initiated Programming $30.96Student Initiated Programming $3.16
Rock $382.02 $382.02 $0.00 0.0%Contractual Changes -$10.00Student Initiated Programming $46.00Student Initiated Programming -$36.00
To maintain current funding level for organized activities
Municipal services
For increased funding in student life
Restructure of sports programming and facilities to an intramural/campus recreation model
Restructure of some programming from organized activities
Restructure of some programming to student life and add a position in student lifeFor mental health services
Health & CounselingMunicipal services
Restructure of some programming from organized activities
Organized activitiesUnion
Sports programming and facilities and student life
Municipal services
Organized activities
Municipal services
From student life for the LSC coordinator
To move counseling off segregated fees
From health to cover counseling with other funds
To maintain current funding level for sports programming and facilities
Municipal servicesFor organized activities to move LSC coordinator here and add tutors
Municipal services
For increased funding in organized activities for student clubs and organizations
Sports programming and facilitiesTo maintain programming level in organized activities and student senate advisor position in student life
To maintain current level of mental health support
Narrative
Municipal servicesFrom organized activitiesFrom sports programming and facilities
Municipal services
Restructure of sports programming and facilities to an intramural/campus recreation model
For increased funding requests in organized activities
BRANCH CAMPUSES SEGREGATED FEES 2022-23 ACADEMIC YEAR
For mental health servicesRestructure of some programming to student life and add a position in student life
To move counseling off segregated fees
21
Institution 2021-22 2022-23 Change % ChangeSheboygan $424.44 $424.44 $0.00 0.0%
Contractual Changes -$0.38Student Initiated Programming $90.00Student Safety $37.40Base Expense Reductions -$58.68Base Expense Reductions -$65.10Change in Reserves/Revenues -$3.24
Washington $413.08 $433.74 $20.66 5.0%Pay plan and Associated Fringes $9.48Contractual Changes $1.94Student Initiated Programming $29.78Base Expense Reductions -$3.12Base Expense Reductions -$17.42
Waukesha $413.08 $433.74 $20.66 5.0%Pay plan and Associated Fringes . $15.80Contractual Changes $0.18Student Initiated Programming $19.78Base Expense Reductions -$15.10
Wausau $447.12 $447.12 $0.00 0.0%Student Initiated Programming $33.12Student Initiated Programming -$21.36Student Initiated Programming -$11.76
Restructure of some programming from organized activities
Organized activities
To maintain health/wellness and mental health programmingOrganized activities
Restructure of some programming to student life and add a position in student lifeMunicipal services
Organized activities, student life, and health
To maintain career planning and development center programming in student life
Health
For mental health services
Restructure of sports programming and facilities to an intramural/campus recreation modelOrganized activities
Municipal services
Narrative
BRANCH CAMPUSES SEGREGATED FEES2022-23 ACADEMIC YEAR
Municipal services
To maintain current funding level for organized activitiesFrom sports programming and facilities to fund organized activitiesFrom health to fund organized activities
Organized activities, student life, and health
22

$5,000
$6,000
$7,000
$8,000
$9,000
$10,000
$11,000
$12,000
$11,2172.8%$300
$10,548 0.8%$85
$8,7855.2%$435
$7,6983.7% $273 $7,029
3.3%$225
$8,6692.7%$228
$7,8050.9%$70
$8,8071.0%$87
$7,2343.0%$212
$8,2505.8%$450
$8,0483.9%$300 $7,417
2.9%$212
$7,3091.9%$136
TOTA
L RO
OM
& M
EAL
PLAN
RAT
ES IN
DO
LLAR
S
2021-22 Rate 2022-23 Change
Room & Meal Plan RatePercent ChangeDollar Change
University of Wisconsin System2022-23 Room & Meal Plan Rates - Average Cost for the Majority of Students
Four-Year Campuses
23

24

Institution 2021-22 2022-23 Change % Change NarrativeMadison $10,916.67 $11,216.67 $300.00 2.7%- Residence Halls $7,066.67 $7,166.67 $100.00 1.4%
Pay plan and Associated Fringes $51.00 Pay plan and fringesMajor Projects $29.00 Increased debt serviceMajor Projects $20.00 Capital improvement plan
- Meal Plans $3,850.00 $4,050.00 $200.00 5.2%Pay plan and Associated Fringes $49.00 Pay plan and fringesContractual Changes $113.00 Increased cost of goods sold
Contractual Changes $38.00New point of sale system, remodeling/refreshes/equipment needs and replacements
Milwaukee $10,463.33 $10,548.33 $85.00 0.8%- Residence Halls $6,274.33 $6,274.33 $0.00 0.0%- Meal Plans $4,189.00 $4,274.00 $85.00 2.0%
Market Salary Adjustments and Fringes $15.00 Student wage increasesContractual Changes $70.00 Increased cost of goods sold
Eau Claire $8,349.50 $8,784.50 $435.00 5.2%- Residence Halls $5,169.50 $5,324.50 $155.00 3.0%
Pay plan and Associated Fringes $20.00 Pay plan and fringesContractual Changes $34.00 Increased utility costsMajor Projects $101.00 Debt service increase related to Towers remodel and Suites construction
- Meal Plans $3,180.00 $3,460.00 $280.00 8.8%Contractual Changes $280.00 Increased cost of goods sold
Green Bay $7,425.00 $7,697.50 $272.50 3.7%- Residence Halls $4,575.00 $4,747.50 $172.50 3.8%
Market Salary Adjustments and Fringes $47.79 Staff and student wage increasesContractual Changes $11.54 Include free laundry for all residents
Student Safety $113.17Create community service officer program and enhanced safety protocols
- Meal Plans $2,850.00 $2,950.00 $100.00 3.5%Contractual Changes $100.00 Increased cost of goods sold
La Crosse $6,804.00 $7,029.25 $225.25 3.3%- Residence Halls $4,130.00 $4,233.25 $103.25 2.5%
Pay plan and Associated Fringes $25.02 Pay plan and fringesContractual Changes $74.49 Increased contract costsMajor Projects $3.74 Debt service increase
- Meal Plans $2,674.00 $2,796.00 $122.00 4.6%Pay plan and Associated Fringes $0.66 Pay plan and fringesContractual Changes $119.58 Increased cost of goods soldMajor Projects $1.76 Debt service increase
DOCTORAL & COMPREHENSIVE ROOM AND BOARD FEES2022-23 ACADEMIC YEAR AVERAGE COST FOR THE MAJORITY OF STUDENTS
25

Institution 2021-22 2022-23 Change % Change NarrativeOshkosh $8,441.00 $8,669.00 $228.00 2.7%- Residence Halls $5,111.00 $5,209.00 $98.00 1.9%
Pay plan and Associated Fringes $27.40 Pay plan and fringesMarket Salary Adjustments and Fringes $48.49 Pay increases for residence hall managers, central staff and student helpStudent Safety $22.11 Create revolving fund to maintain, replace, and add security cameras
- Meal Plans $3,330.00 $3,460.00 $130.00 3.9%Contractual Changes $130.00 Increased cost of goods sold
Parkside $7,735.33 $7,804.67 $69.34 0.9%- Residence Halls $4,879.33 $4,904.67 $25.34 0.5%
Contractual Changes $23.00 Custodial contractContractual Changes $2.34 Increased utility costs
- Meal Plans $2,856.00 $2,900.00 $44.00 1.5%Contractual Changes $44.00 Increased cost of goods sold
Platteville $8,720.00 $8,806.67 $86.67 1.0%- Residence Halls $5,560.00 $5,586.67 $26.67 0.5%
Contractual Changes $26.67 Extended contract length in traditional halls- Meal Plans $3,160.00 $3,220.00 $60.00 1.9%
Market Salary Adjustments and Fringes $27.10 For staff and student wage increasesContractual Changes $32.90 Increased cost of goods sold
River Falls $7,022.00 $7,234.00 $212.00 3.0%- Residence Halls $4,450.00 $4,584.00 $134.00 3.0%
Pay plan and Associated Fringes $15.92 Pay plan and fringesMarket Salary Adjustments and Fringes $6.42 Staff pay increases
Student Safety $111.66Revolving fund for infrastructure projects, including year 3 for replacing electrical systems in all halls
- Meal Plans $2,572.00 $2,650.00 $78.00 3.0%Pay plan and Associated Fringes $3.00 Pay plan and fringesContractual Changes $50.00 Increased cost of goods soldStudent Safety $25.00 Revolving fund for infrastructure projects
Stevens Point $7,800.00 $8,250.00 $450.00 5.8%- Residence Halls $4,600.00 $4,750.00 $150.00 3.3%
Pay plan and Associated Fringes $9.39 Pay plan and fringesContractual Changes $140.61 Revolving fund for replacing student furnishings in all halls
- Meal Plans $3,200.00 $3,500.00 $300.00 9.4%Pay plan and Associated Fringes $18.80 Pay plan and fringesMarket Salary Adjustments and Fringes $64.82 Staff pay increasesContractual Changes $216.38 Increased cost of goods sold
DOCTORAL & COMPREHENSIVE ROOM AND BOARD FEES2022-23 ACADEMIC YEAR AVERAGE COST FOR THE MAJORITY OF STUDENTS
26

Institution 2021-22 2022-23 Change % Change NarrativeStout $7,748.00 $8,048.00 $300.00 3.9%- Residence Halls $4,710.00 $4,830.00 $120.00 2.5%
Pay plan and Associated Fringes $14.90 Pay plan and fringesStudent Initiated Programming $12.10 Student wage increasesMajor Projects $93.00 Debt service on South Hall
- Meal Plans $3,038.00 $3,218.00 $180.00 5.9%Pay plan and Associated Fringes $16.60 Pay plan and fringesContractual Changes $115.40 Increased cost of goods soldStudent Initiated Programming $48.00 Student wage increases
Superior $7,205.00 $7,417.00 $212.00 2.9%- Residence Halls $4,433.00 $4,477.00 $44.00 1.0%
Pay plan and Associated Fringes $21.00 Pay plan and fringesMarket Salary Adjustments and Fringes $23.00 Student wage increases
- Meal Plans $2,772.00 $2,940.00 $168.00 6.1%Contractual Changes $126.00 Increased cost of goods soldContractual Changes $42.00 Revolving fund used for equipment repair and replacement
Whitewater $7,173.00 $7,309.33 $136.33 1.9%- Residence Halls $4,472.00 $4,517.33 $45.33 1.0%
Pay plan and Associated Fringes $36.15 Pay plan and fringes
Contractual Changes -$14.23Increased utilities offset by expense reductions for removal of Cambridge Apartments lease
Change in Reserves/Revenues $34.94 Funds allocated for future capital projectsMajor Projects -$11.53 Debt service decrease
- Meal Plans $2,701.00 $2,792.00 $91.00 3.4%Pay plan and Associated Fringes $2.61 Pay plan and fringesContractual Changes $92.18 Increased cost of goods soldContractual Changes $8.63 Increased utilitiesChange in Reserves/Revenues -$12.42 Utilize reserves to offset contractual increases
DOCTORAL & COMPREHENSIVE ROOM AND BOARD FEES2022-23 ACADEMIC YEAR AVERAGE COST FOR THE MAJORITY OF STUDENTS
27

Institution 2021-22 2022-23 Change % Change NarrativeFond du Lac $0.00 $2,500.00 $2,500.00- Residence Halls $0.00 $0.00 $0.00- Meal Plans $0.00 $2,500.00 $2,500.00
Contractual Changes $2,500.00Implement a declining balance plan for students on the access campus, primarily as an option for international students
Fox Valley $0.00 $2,500.00 $2,500.00- Residence Halls $0.00 $0.00 $0.00- Meal Plans $0.00 $2,500.00 $2,500.00
Contractual Changes $2,500.00Implement a declining balance plan for students on the access campus, primarily as an option for international students
BRANCH CAMPUSES ROOM AND BOARD FEES2022-23 ACADEMIC YEAR AVERAGE COST FOR THE MAJORITY OF STUDENTS
28

Institution 2021-22 2022-23 Change % ChangeEau Claire $140.00 $140.00 $0.00 0.0%
Barron $140.00 $140.00 $0.00 0.0%
La Crosse $173.92 $173.92 $0.00 0.0%
Platteville $220.00 $220.00 $0.00 0.0%Baraboo $220.00 $220.00 $0.00 0.0%Richland $220.00 $220.00 $0.00 0.0%
River Falls $175.36 $178.52 $3.16 1.8%
Stevens Point $130.08 $145.20 $15.12 11.6%Marshfield $130.08 $145.20 $15.12 11.6%Wausau $130.08 $145.20 $15.12 11.6%
Stout (based on 30 credits) $394.50 $394.50 $0.00 0.0%
Whitewater $173.50 $196.00 $22.50 13.0%
Rock $165.12 $165.12 $0.00 0.0%
Textbook Rental is not included in the calculation for the typical costs of a student living on campus.
Increase for pay plan, fringe benefits and the rising cost of textbooks.
Increase for the rising cost of textbooks.
Increase to add digital content and course materials.
UNIVERSITY OF WISCONSIN SYSTEM 2022-23 Academic Year Textbook Rental Rates
29

2022-23 GENERAL PROGRAM OPERATIONS
General Program Operations is made up of self-supporting operations that have a close tie to and/or support the academic mission of the university. These operations include, print and copy shops, dairy sales, camps, and conferences.
The 2022-23 General Program Operations revenue and expense budget by campus is shown in the table below. Expenses exceed revenues by 1.49% or $7.3 million.
The largest variance occurs at UW System Administration where balances within Information Technology units are being spent down. One example of this is the ongoing operation and maintenance of the high-speed fiber network.
Expense Revenue Variance VarianceBudget Budget (Rev less Exp) Percent
Madison 341,585,115 339,090,238 -2,494,877 -0.74%Milwaukee 12,938,460 12,056,504 -881,956 -7.32%Eau Claire 10,062,777 9,957,818 -104,959 -1.05%Green Bay 5,135,410 5,013,044 -122,366 -2.44%La Crosse 2,325,574 2,420,132 94,558 3.91%Oshkosh 11,545,990 11,165,366 -380,624 -3.41%Parkside 1,471,906 2,129,548 657,642 30.88%Platteville 9,652,562 10,456,435 803,873 7.69%River Falls 2,882,724 2,640,131 -242,593 -9.19%Stevens Point 14,665,780 14,824,144 158,364 1.07%Stout 15,553,182 14,931,101 -622,081 -4.17%Superior 1,081,629 1,058,500 -23,129 -2.19%Whitewater 21,657,026 21,685,918 28,892 0.13%Systemwide 46,131,439 41,977,219 -4,154,220 -9.90%System Total 496,689,574 489,406,098 -7,283,476 -1.49%
University of Wisconsin System2022 - 2023 General Program Operations by Institution
30

2022-23 FEDERAL INDIRECT COST REIMBURSEMENT
Federal Indirect Cost Reimbursement funds are received from the federal government for costs incurred in administering federal grant programs. The 2022-23 Federal Indirect Cost Reimbursement revenue and expense budget by campus is shown in the table below. Expenses exceed revenues by 5.32% or $10.6 million. At UW System Administration, while revenue is lower than expenses by 36%, one-time balances will be expended to address the shortfall.
Expense Revenue Variance VarianceBudget Budget (Rev less Exp) Percent
Madison 193,967,263 185,496,071 -8,471,192 -4.57%Milwaukee 7,450,724 6,815,895 -634,829 -9.31%Eau Claire 366,996 400,267 33,271 8.31%Green Bay 313,036 270,435 -42,601 -15.75%La Crosse 403,657 403,658 1 0.00%Oshkosh 721,576 539,163 -182,413 -33.83%Parkside 93,200 93,200 0 0.00%Platteville 167,218 129,189 -38,029 -29.44%River Falls 267,927 239,000 -28,927 -12.10%Stevens Point 216,255 223,129 6,874 3.08%Stout 511,235 440,528 -70,707 -16.05%Superior 346,125 400,000 53,875 13.47%Whitewater 415,887 609,268 193,381 31.74%Systemwide 5,552,031 4,093,393 -1,458,638 -35.63%System Total 210,793,131 200,153,196 -10,639,935 -5.32%
University of Wisconsin System2022 - 2023 Federal Indirect Cost Reimbursement by Institution
31

2022-23 GIFTS, GRANTS, AND CONTRACTS
Gifts, Grants, and Contract funds are typically used only for the purposes specified by the grantor or donor, and therefore are considered restricted. This group contains several different types of funding:
o Private or organizational giftso Federal and nonfederal research grantso Contracts that are provided for specific purposes
The 2022-23 Gifts, Grants, and Contracts revenue and expense budget by campus is shown in the table below. Revenues exceed expenses by 1.83% or $26.7 million.
Gifts, Grants, and Contracts can be difficult to budget within the annual operating budget due to complexities of when the funds are generated and restrictions on their use.
Expense Revenue Variance VarianceBudget Budget (Rev less Exp) Percent
Madison 1,302,215,089 1,329,516,485 27,301,396 2.05%Milwaukee 58,261,985 58,269,985 8,000 0.01%Eau Claire 7,604,237 7,535,853 -68,384 -0.91%Green Bay 7,144,097 6,934,460 -209,637 -3.02%La Crosse 7,083,275 7,261,342 178,066 2.45%Oshkosh 11,179,202 10,497,668 -681,534 -6.49%Parkside 1,725,947 1,674,947 -51,000 -3.04%Platteville 4,578,200 4,580,000 1,800 0.04%River Falls 3,279,622 3,467,147 187,525 5.41%Stevens Point 9,346,344 9,364,508 18,164 0.19%Stout 7,281,221 7,691,221 410,000 5.33%Superior 6,634,694 6,666,000 31,306 0.47%Whitewater 5,190,421 5,394,127 203,706 3.78%Systemwide 4,540,450 3,950,551 -589,899 -14.93%System Total 1,436,064,785 1,462,804,294 26,739,509 1.83%
University of Wisconsin System2022 - 2023 Gifts Grants and Contracts by Institution
32
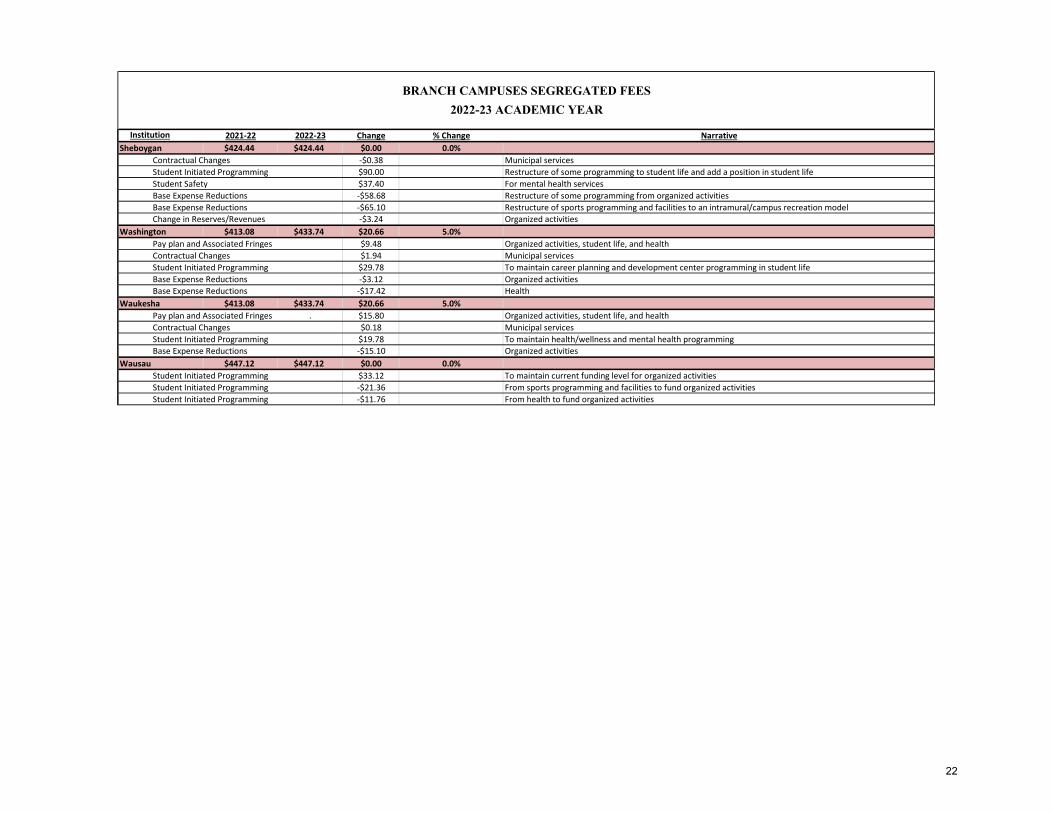
2022-23 FEDERAL FINANCIAL AID AND OTHER FUNDS Federal Financial Aid and Other Funds are primarily financial aid, debt service for non-academic buildings and non-credit Extension programs. Since these funds can typically only be used for specific purposes, they are often considered restricted. The 2022-23 combined Federal Financial Aid and Other revenue and expense budget by campus is shown in the table below. Revenues exceed expenses by .08% or $808,000.
Expense Revenue Variance VarianceBudget Budget (Rev less Exp) Percent
Madison 362,857,316 364,414,485 1,557,169 0.43%Milwaukee 145,754,762 145,836,633 81,871 0.06%Eau Claire 55,784,867 55,860,795 75,928 0.14%Green Bay 39,440,265 38,993,374 -446,892 -1.15%La Crosse 58,337,361 58,298,486 -38,875 -0.07%Oshkosh 59,228,296 59,225,069 -3,227 -0.01%Parkside 29,886,852 29,814,057 -72,795 -0.24%Platteville 38,268,462 38,316,510 48,048 0.13%River Falls 33,972,907 33,982,919 10,012 0.03%Stevens Point 49,889,583 49,901,509 11,926 0.02%Stout 41,617,208 41,617,208 0 0.00%Superior 18,178,889 18,183,354 4,465 0.02%Whitewater 63,597,894 63,709,848 111,954 0.18%Systemwide 9,850,971 9,318,907 -532,064 -5.71%System Total 1,006,665,634 1,007,473,154 807,520 0.08%
University of Wisconsin System2022 - 2023 Federal Financial Aid/Other Funds by Institution
33

2022-23 CAMPUS SPECIFIC BUDGET DATA
Each campus is being shown independently. This allows for a concise snapshot of each institution. This data includes:
- Campus submitted narratives Campus mission statements Key drivers in the 2022-23 annual budget Strategic budget actions in 2022-23 Campus philanthropy
- Five-year history of total enrollment both by full-time equivalent and headcount.
Main and branch campus enrollments are combined where applicable
- 2022-23 expenditures and revenues along with the change from the prior year. This is provided as both a table and pie charts, showing budgets by fund group and percent change from 2021-22.
These charts combine the receiving and branch campus expenditure and revenue budgets
GPR/Tuition budgets• exclude fringe benefits• include one-time use of tuition balances
Both revenues and expenses on Federal Financial Aid funds experience an anticipated decline in 2022-23 for all but two campuses. These are pass-through costs, and the reduction is related to decreased financial aid awards due to enrollment declines
The campus specific budget data expands on what has been included the past two years. Providing narratives along with year-over-year budget data provides additional insight into each UW institution's unique situation.
34

UW-Madison Mission Statement To fulfill its mission as a model public university in the 21st century, serving as a resource to the public, and working to enhance the quality of life in the state, the nation, and the world. To remain a preeminent center for discovery, learning, and engagement by opening new
forms of access to citizens from every background; creating a welcoming, empowered, and inclusive community; and preparing current and future generations to live satisfying, useful, and ethical lives. In partnership with the state and with colleagues around the world, the university’s faculty, staff, and students will identify and address many of the state’s and the world’s most urgent and complex problems.
Key Drivers in the FY22/23 Annual Budget:
In 2022/23, revenues are expected to increase by 7.92%, or $277 million from the prior year. Keydrivers in revenues are:
o Increased undergraduate enrollment as UW-Madison continues to maintain strong enrollmentsfrom both in-state and out-of-state students. In addition, the Board of Regents approved a 2%increase in the non-resident undergraduate tuition rate for the upcoming academic year.
o Increased numbers of first year students living on campus in response to strong student demand.An effort has been made to minimize rate increases, with a combined proposed room and boardrate increase of only 2.7%.
o Based on current awards data, research spending is estimated to grow next year. This will generateadditional federal indirect revenues to invest in the research mission and address critical facilitiesand infrastructure needs.
In 2022/23, expenses will increase by 8.08%, or $280 million from the prior year. Key drivers in expenses are:o High inflation, a challenging hiring market, and results from the Title and Total Compensation (TTC)
study lead to significant investments to strategically raise salary levels to retain and attract talent.o Priority investments in facilities and infrastructure through UW-managed capital projects.
The need to address the threat to the campus mission from aging facilities requiresinvestment to grow the capacity of the Facilities Planning & Management unit in support ofthe expanded workload.
Strategic Budget Actions in the FY22/23 Annual Budget:
Capital Upgrades Initiatives: $62M of gift/grant disbursements will be allocated for 22 high-impact capitalprojects. Schools and colleges are also using their own reserves to pay for lab renovations and otherimprovements to their classrooms and student spaces.
o Source of funds: Indirect cost recovery funds from federal grants and use of one-time reserves. Academic Initiatives: Schools and Colleges will primarily use their own funds, including existing one-time
balances, on competitive start-up packages to recruit and retain top faculty.o Source of funds: Tuition and indirect cost recovery funds from federal grants.
Administrative Initiatives: UW-Madison, along with UW System Administration, recently decided to forgoaccessing a state loan program to pay the System Integrator costs of the Administrative TransformationProgram (ATP), saving millions in interest payments by applying accumulated balances to support the costof implementation.
o Source of funds: Central services assessment balances and indirect recovery from federal grants.
Philanthropy:
Primary Fundraising Foundation: Wisconsin Foundation & Alumni Association (established in 1945) Total Endowment (as of June 30, 2021): $4.0B FY22/23 Highlight: In FY22, WFAA awarded $5.6M of scholarship assistance to over 1,000
undergraduate students.35

GPR/Tuition$1.1B5.71%
Auxiliaries$411M21.28%
GPO$341.6M13.50%
FICR$194M18.70%
GGC$1.3B5.51%
Fed.Fin. Aid
&Other
$362.9M2.07%
Expenses
0
10,000
20,000
30,000
40,000
50,000
60,000
2017-18 2018-19 2019-20 2020-21 2021-22
Total Fall Enrollment, 2017-18 to 2021-22
Headcount FTE
GPR/Tuition$1.1B6.04%
Auxiliaries$406.3M20.39%
GPO$339.1M
9.56%
FICR$185.5M15.41%
GGC$1.3B6.26%
Fed.Fin. Aid
&Other
$364.4M2.78%
Revenues
FY22 to FY23 Budget Summary (Tables exclude GPR/Tuition fringe benefits)
Total dollars and percent change from prior year (FY22 to FY23)
2021 - 2022 2022 - 2023 $ Change 2021 - 2022 2022 - 2023 $ Change
Budget Budget FY22 to FY23 Budget Budget FY22 to FY23
GPR/Tuition 1,066,298,969 1,127,136,383 60,837,414 1,079,490,213 1,144,688,184 65,197,971
Auxiliaries 339,247,362 411,439,521 72,192,159 337,511,289 406,331,374 68,820,085
General Program Operations 300,956,056 341,585,115 40,629,059 309,489,213 339,090,238 29,601,025
Federal Indirect Cost Reimbursement 163,411,726 193,967,263 30,555,537 160,730,001 185,496,071 24,766,070
Gifts, Grants, Contracts 1,234,175,205 1,302,215,089 68,039,885 1,251,137,620 1,329,516,485 78,378,865
Federal Financial Aid / Other 355,510,240 362,857,316 7,347,076 354,570,870 364,414,485 9,843,615
Tota l Base 3,459,599,557 3,739,200,687 279,601,130 3,492,929,206 3,769,536,837 276,607,631
One-Time Use of Tuition Balances - - - - - -
Tota l Includ ing Use of Balances 3,459,599,557 3,739,200,687 279,601,130 3,492,929,206 3,769,536,837 276,607,631
Exp e nse s Re ve nue
36

UW-Milwaukee Mission Statement To fulfill its mission as a major urban doctoral university and to meet the diverse needs of Wisconsin’s largest metropolitan area, the University of Wisconsin–Milwaukee must provide a wide array of degree programs, a balanced program of applied and basic research, and a faculty who are active in public service. Fulfilling this mission requires
the pursuit of these mutually reinforcing academic goals. UWM’s vision is to be a top-tier research university that is the best place to learn and work for students, faculty, and staff, and that is a leading driver for sustainable prosperity.
Key Drivers in the FY22/23 Annual Budget:
In 2022/23, revenues are expected to decrease by (3.04%), or -$17.8 million from the prior year, mostly driven by a decline in federal financial aid and tuition compared to the prior year's budget. Key highlights are:
o While UWM's enrollment will decline on a budget-to-budget basis, the FY23 budget anticipates a 1.6% increase in bachelor undergraduate enrollment over Fall 21 and stable enrollment in graduate programs.
o A planned 0.7% increase in segregated fee rates aided by intentional reductions in capital fees and other expenses to offset rising salary and other costs.
o 2.0% increase in meal plan rates to address inflationary costs for goods and services.o Overall auxiliary revenues are anticipated to return to about 90% of FY 19 or “pre-Covid” levels.o Contract and grant revenue is expected to decline by about 2% compared to prior year’s budget, but gift
revenue to increase by about 9%. In 2022/23, expenses will decrease by (0.51%), or -$3.1 million from the prior year. Key drivers in
expenses are:o Due to end of COVID furloughs and inflation, salary expenses are anticipated to increase by 6% or $15M
compared to FY22, with continued significant upward market pressure on salaries throughout FY23.o Supplies and expenses (S&E) are expected to decline over the prior year budget due to revenue pressure
and shifting S&E resources to support rising salary expenses; given inflation, managing S&E expense relative to budget in FY23 will be challenging.
o Financial aid expenses (excluding federal financial aid) are planned to increase by around 12% due to increased fundraising and reallocation of unrestricted funds to financial aid as well as a budgeting change compared to the prior year. Expenses for Federal Financial Aid also decline in FY23.
Strategic Budget Actions in the FY22/23 Annual Budget:
UWM has reallocated an additional $3.5M in annual base funding from unrestricted funds to institutional financial aid, with $10M total to be spent from operating funds on such aid in FY23
UWM will invest approximately $10M in one-time carryforward funds for student enrollment and success, technology, and infrastructure, among other one-time strategic needs.
UWM will use approximately $10M in one-time carryforward funds to address an anticipated revenue shortfall, part of which is due to the unfunded portion of pay plan.
UWM’s FY23 operating budget is aligned around UWM’s 2030 Action Plan, including initiatives focused on Moon Shot/Student Success, DEI, and Research.
Philanthropy:
Primary Fundraising Foundation: The UWM Foundation (established in 1974). Total Endowment (as of June 30, 2021): $148M FY22/23 Highlight: Between current use funds and endowment proceeds, the UWM Foundation is anticipated
to provide around $16M towards instruction, research, public service and financial aid in FY23.
37

GPR/Tuition$265.3M-0.45%
Use of Bal.$20.7M129.63%
Auxiliaries$89M-5.28%GPO
$12.9M9.09%
FICR$7.5M-5.15%
GGC$58.8M0.49%
Fed.Fin. Aid
& Other
$145.8M-6.13%
EXPENDITURES
10,000
15,000
20,000
25,000
30,000
2017-18 2018-19 2019-20 2020-21 2021-22
Total Fall Enrollment, 2017-18 to 2021-22
Headcount FTE
GPR/Tuition$263.4M-2.16%
Auxiliaries$80.2M-0.83%
GPO$12.1M-0.73%
FICR$6.8M
-14.83%
GGC$58.3M0.58%
Fed.Fin. Aid
&Other
$145.8M-6.62%
REVENUES
FY22 to FY23 Budget Summary (Tables exclude GPR/Tuition fringe benefits)
Total dollars and percent change from prior year (FY22 to FY23)
2021 - 2022 2022 - 2023 $ Change 2021 - 2022 2022 - 2023 $ Change
Budget Budget FY22 to FY23 Budget Budget FY22 to FY23
GPR/Tuition 266,528,429 265,332,540 -1,195,889 269,173,780 263,365,569 -5,808,211
Auxiliaries 93,911,317 88,951,542 -4,959,775 80,850,520 80,178,181 -672,339
General Program Operations 11,860,829 12,938,460 1,077,631 12,144,633 12,056,504 -88,129
Federal Indirect Cost Reimbursement 7,855,604 7,450,724 -404,880 8,002,899 6,815,895 -1,187,004
Gifts, Grants, Contracts 57,979,787 58,261,985 282,198 57,932,999 58,269,985 336,986
Federal Financial Aid / Other 155,277,425 145,754,762 -9,522,663 156,176,298 145,836,633 -10,339,665
Tota l Base 593,413,391 578,690,013 -14,723,378 584,281,130 566,522,767 -17,758,363
One-Time Use of Tuition Balances 9,000,000 20,666,565 11,666,565 - - -
Tota l Includ ing Use of Balances 602,413,391 599,356,578 -3,056,813 584,281,130 566,522,767 -17,758,363
Exp e nse s Re ve nue
38

UW-Eau Claire Mission Statement Foster in one another creativity, critical insight, empathy and intellectual courage, the hallmarks of a transformative liberal education and the foundation for active citizenship and lifelong inquiry.
Key Drivers in the FY22/23 Annual Budget:
In 2022/23, revenues are expected to increase by 3.09%, or $6.3 million from the prior year. Key drivers in revenues are:
o Revenue was budgeted at the projected tuition level for the upcoming academic year. Reserves will be utilized to cover any shortfall in enrollment.
o Auxiliary revenues from housing/dining and segregated fee rates increased slightly due to inflationary costs for good and services.
o Overall revenue budgets were calculated using conservative estimates for enrollment. Expenses were budgeted to stay within the projected revenue budget.
o While revenues increase overall, there is a decrease in Federal Financial Aid.
In 2022/23, expenses will increase by 3.18%, or $6.7 million from the prior year. Key drivers in expenses are:
o Compensation was budgeted to include the approved pay plan increases in all funds, inclusive of the unfunded campus share not included in the state’s compensation reserve.
o Supplies and Expenses (S&E) were budgeted to anticipated FY23 spending levels based on estimated resources. Reserves will be utilized to invest in strategic projects.
o While expenses overall are anticipated to increase, Federal Financial Aid is anticipated to see a decrease.
Strategic Budget Actions in the FY22/23 Annual Budget:
Sonnentag: UWEC plans to invest approximately $5M in reserves for one-time funding in FY23 forSonnentag Event Center equipment. Philanthropy has funded $70M for construction and $12M towardsustainability initiatives.
Strategic Planning: The FY23 budget includes funding of $3.5M from reserves for investments inUWEC’s Strategic Plan and facility upgrades. Future strategic investments planned for the campusinclude the growth of innovative programs, including the recently awarded $9.4M Wisconsin EconomicDevelopment Corporation (WEDC) grant, as well as investments in Equity, Diversity, and Inclusion (EDI)initiatives, and student retention.
Philanthropy:
Primary Fundraising Foundation: The UW-Eau Claire Foundation (established in 1964) Total Endowment (as of June 30, 2021): $95M FY22/23 Highlight: The UW-Eau Claire Foundation raised over $44M in FY22; this is the best
fundraising year ever in the history of the Foundation. UW-Eau Claire has provided over $2.3M inscholarships to over 1,400 students in FY22. UW-Eau Claire is planning to provide over $2.4M inscholarships to over 1,400 students in FY23.
39

GPR/Tuition$92M1.83%
Use of Bal.$5.9M 20.98%
Auxiliaries$46.1M7.70%
GPO$10.1M 2.53%
FICR$367K
57.02%
GGC$7.6M51.27%
Fed.Fin. Aid
&Other
$55.8M-3.81%
Expenses
GPR/Tuition$92.4M2.26%
Auxiliaries$43.5M6.03%
GPO$10M 9.77%
FICR$400K
77.30%
GGC$7.5M60.33%
Fed.Fin. Aid
&Other
$55.9M-3.68%
Revenues
8,000
9,000
10,000
11,000
12,000
2017-18 2018-19 2019-20 2020-21 2021-22
Total Fall Enrollment, 2017-18 to 2021-22
Headcount FTE
FY22 to FY23 Budget Summary (Tables exclude GPR/Tuition fringe benefits)
Total dollars and percent change from prior year (FY22 to FY23)
2021 - 2022 2022 - 2023 $ Change 2021 - 2022 2022 - 2023 $ Change
Budget Budget FY22 to FY23 Budget Budget FY22 to FY23
GPR/Tuition 90,315,263 91,969,431 1,654,168 90,315,263 92,356,768 2,041,505
Auxiliaries 42,817,835 46,115,375 3,297,540 40,993,613 43,466,407 2,472,794
General Program Operations 9,814,344 10,062,777 248,433 9,071,215 9,957,818 886,603
Federal Indirect Cost Reimbursement 233,730 366,996 133,266 225,759 400,267 174,508
Gifts, Grants, Contracts 5,026,801 7,604,237 2,577,436 4,700,169 7,535,853 2,835,684
Federal Financial Aid / Other 57,993,283 55,784,867 -2,208,416 57,993,283 55,860,795 -2,132,488
Tota l Base 206,201,256 211,903,683 5,702,427 203,299,302 209,577,908 6,278,606
One-Time Use of Tuition Balances 4,841,838 5,857,689 1,015,851 - - -
Tota l Includ ing Use of Balances 211,043,094 217,761,372 6,718,278 203,299,302 209,577,908 6,278,606
Exp e nse s Re ve nue
40

UW-Green Bay Mission Statement Our mission and vision is to be a university that fearlessly meets challenges, solves problems, embraces diversity, cares about our region and provides access to education for all who want it. Through these actions, we honor the innovative spirit of the founders of the University and move ourselves forward.
Key Drivers in the FY22/23 Annual Budget:
In 2022/23, revenues are expected to increase by 4.61%, or $5.7 million from the prior year. Keydrivers in revenues are:
o Increase in undergraduate, graduate, summer and winterim enrollment. Adjusted budgetedrevenue to more accurately represent actual activity over the past several years.
o Increase in distance education revenue in response to more demand for online courses.o Segregated fees will remain flat due to new revenue generated from enrollment growth.o Housing rate and dining plan increases in response to new services in Residence Life and higher
costs for goods and services due to inflation in dining. In 2022/23, expenses will increase by 5.77%, or $7.3 million from the prior year. Key drivers in
expenses are:o Increased spending reflects new faculty for high-demand programs and academic advisor
positions.o Increased spending on compensation for pay plan – including the campus share of pay plan not
funded from the state’s compensation reserve -- and market-based salary adjustments forretention
o Increased spending for the higher cost of goods and services due to inflation.o Increased spending for upgrading technology, campus utility and infrastructure improvements,
and deferred maintenance.
Strategic Budget Actions in the FY22/23 Annual Budget:
UW Green Bay plans to invest/reallocate approximately $2M in one-time/base funding from the tuitionfund and GPR carryover for FY23 to support the following strategic priorities:
o Student Success, Recruitment and Retentiono Inclusivityo Digital Transformationo Community Connectionso Sustainabilityo Athletics and Weidner Center
Philanthropy:
Primary Fundraising Foundation: UW-Green Bay Foundation, Inc. (established in 2011). Total Endowment (as of June 30, 2021): $43.6M FY22/23 Highlight: UW-Green Bay Foundation is planning on providing $1.4M in scholarships to over
700 students in FY23.
41

GPR/Tuition$58.4M8.48%
Auxiliaries$22.8M8.31%
GPO$5.1M8.38%
FICR$313K
-17.19%
GGC$7.1M5.91%
Fed.Fin. Aid
&Other
$39.4M0.58%
Expenses
2,0002,5003,0003,5004,0004,5005,0005,5006,0006,5007,0007,5008,0008,5009,0009,500
10,00010,500
2017-18 2018-19 2019-20 2020-21 2021-22
Total Fall Enrollment, 2017-18 to 2021-22
Headcount FTE
GPR/Tuition$58M4.11%
Auxiliaries$21.2M1.29%
GPO$5M
38.88%
FICR$270K1.62%
GGC$6.9M39.83%
Fed.Fin. Aid
&Other$39M-0.51%
Revenues
FY22 to FY23 Budget Summary (Tables exclude GPR/Tuition fringe benefits)
Total dollars and percent change from prior year (FY22 to FY23)
2021 - 2022 2022 - 2023 $ Change 2021 - 2022 2022 - 2023 $ Change
Budget Budget FY22 to FY23 Budget Budget FY22 to FY23
GPR/Tuition 53,833,980 58,399,893 4,565,913 55,701,000 57,990,224 2,289,224
Auxiliaries 21,059,421 22,808,611 1,749,190 20,890,856 21,160,725 269,869
General Program Operations 4,738,549 5,135,410 396,861 3,609,501 5,013,044 1,403,543
Federal Indirect Cost Reimbursement 378,026 313,036 -64,990 266,117 270,435 4,318
Gifts, Grants, Contracts 6,745,414 7,144,097 398,683 4,959,135 6,934,460 1,975,325
Federal Financial Aid / Other 39,211,443 39,440,265 228,822 39,194,608 38,993,374 -201,234
Tota l Base 125,966,833 133,241,312 7,274,479 124,621,217 130,362,262 5,741,045
One-Time Use of Tuition Balances - - - - - -
Tota l Includ ing Use of Balances 125,966,833 133,241,312 7,274,479 124,621,217 130,362,262 5,741,045
Exp e nse s Re ve nue
42

UW-La Crosse Mission Statement The University of Wisconsin-La Crosse provides a challenging, dynamic, and diverse learning environment in which the entire university community is fully engaged in supporting student success. Acknowledging and respecting the contributions of all, UWL is a regional academic and cultural center that prepares
students to take their place in a constantly changing world community.
Key Drivers in the FY22/23 Annual Budget:
In 2022/23, revenues are expected to increase by 1.57%, or $3.2 million from the prior year. Key drivers inrevenues are:
o Undergraduate enrollment is projected to increase to pre-pandemic levels with a record number of first-year and underrepresented students over the prior two years.
o Auxiliary rates were budgeted with moderate increases of 2.6% for segregated fees; 2.5% for room; and4.5% for housing. Textbook rental and parking rates were held constant to support goals for affordabilityand overall cost of attendance.
o General campus operations continue to return to pre-pandemic levels for athletic events, camps,conferences, study abroad, and continuing education activities.
In 2022/23, expenses will increase by 1.28%, or $2.6 million from the prior year. Key drivers in expenses are:o Personnel costs for FY23 increased due to the FY22 and FY23 pay plans, fringe benefit costs, and
compensation adjustments for the Title and Total Compensation (TTC) project.o Auxiliary budget expenses reflect increases to manage the cost of operations, deferred maintenance,
and debt service.o Expenses for information technology, supplies and expense (S&E), travel, and other purchased services
are forecasted to increase due to inflation, supply chain issues, and the global economy.
Strategic Budget Actions in the FY22/23 Annual Budget:
Scholarships for Underrepresented Students: UW-La Crosse is reallocating $600K in base budget funds toprovide scholarships for underrepresented students and the hiring of 2 new multicultural student recruiters.
Investing in Our People: Reserve balances will be used to fund a one-time lump sum payment to employees toaddress issues of retention, equity, market, and inflation.
Prairie Springs Science Center Completion & Cowley Demolition Project: The university has prioritized theallocation of $2M in PR balances for its science building project for the 2023-25 capital budget.
Residence Hall Renovations: The housing auxiliary is addressing deferred maintenance in 2 residence halls withrenovation projects totaling $3M funded from PR balances and operations.
Philanthropy:
Primary Fundraising Foundation: The University of Wisconsin-La Crosse Foundation, Inc. (established in 1967). Total Endowment (as of 12/31/21): $39.3M FY22/23 Highlight: The UW-La Crosse Foundation is planning to provide approximately $1.6M in scholarships,
grants, awards, and support to over 1,000 students.
43

8,500
9,000
9,500
10,000
10,500
11,000
2017-18 2018-19 2019-20 2020-21 2021-22
Total Fall Enrollment, 2017-2018 to 2021-22
Headcount FTE
GPR/Tuition$96M-0.41%
Use of Bal.$2.6M-4.93%
Auxiliaries$39.2M8.63%GPO
$2.3M-10.92%
FICR$404K-0.92%
GGC$7.1M-1.51%
Fed.Fin. Aid
&Other
$58.3M0.71%
Expenses
GPR/Tuition$98.1M-0.08%
Auxiliaries$37.9M9.48%
GPO$2.4M
-11.54%
FICR$404K-0.92%
GGC$7.3M-1.30%
Fed.Fin. Aid
&Other
$58.3M0.64%
Revenues
FY22 to FY23 Budget Summary
(Tables exclude GPR/Tuition fringe benefits)
Total dollars and percent change from prior year (FY22 to FY23)
2021 - 2022 2022 - 2023 $ Change 2021 - 2022 2022 - 2023 $ Change
Budget Budget FY22 to FY23 Budget Budget FY22 to FY23
GPR/Tuition 96,375,929 95,982,763 -393,166 98,150,012 98,072,183 -77,829
Auxiliaries 36,114,011 39,230,107 3,116,096 34,637,609 37,920,178 3,282,569
General Program Operations 2,610,672 2,325,574 -285,098 2,735,737 2,420,132 -315,605
Federal Indirect Cost Reimbursement 407,396 403,657 -3,739 407,396 403,658 -3,738
Gifts, Grants, Contracts 7,191,945 7,083,275 -108,670 7,357,015 7,261,342 -95,673
Federal Financial Aid / Other 57,924,651 58,337,361 412,710 57,929,398 58,298,486 369,088
Tota l Base 200,624,604 203,362,737 2,738,133 201,217,167 204,375,979 3,158,812
One-Time Use of Tuition Balances 2,727,429 2,592,905 -134,524 - - -
Tota l Includ ing Use of Balances 203,352,033 205,955,642 2,603,609 201,217,167 204,375,979 3,158,812
Exp e nse s Re ve nue
44

UW-Oshkosh Mission Statement The University of Wisconsin-Oshkosh provides a high-quality liberal education to all of its students in order to prepare them to become successful leaders in an increasingly diverse and global society. Our dedicated faculty and staff are committed to innovative teaching,
research, economic development, entrepreneurship, and community engagement to create a more sustainable future for Wisconsin and beyond. High quality academic programs in nursing, education, business, social sciences, natural sciences, humanities, fine and performing arts, engineering technology, information technology, health sciences and applied and liberal studies—all delivered in an innovative and inclusive learning environment—lead to degrees at the associate, baccalaureate, master’s and professional doctorate levels.
Key Drivers in the FY22/23 Annual Budget:
In 2022/23, revenues are expected to decrease by (2.5%), or -$5.4 million from the prior year. Key driversin revenues are:
o Overall operating budget projects a slight increase of 1.3% in tuition revenue for FY23 compared toFY22. Applications are currently up from this time last year for the Oshkosh and Fond du Laccampuses, while Fox Cities is slightly down.
o Overall auxiliary revenue is recovering from trends experienced in the pandemic. UWO increasedauxiliary rates for FY23, including: dining rates by 3.9%, housing rates by 1.9%, and segregated feesby 4.74% on the Oshkosh campus and 3% on both the Fond du Lac and Fox Cities campuses.
o Federal Financial Aid revenues are reduced in FY23 due to anticipated enrollment declines. In 2022/23, expenses will decrease by (2.67%), or -$5.9 million from the prior year. Key drivers in expenses
are:o Compensation costs increased by 1.6%, primarily due to pay plan costs inclusive of the campus
share that is not funded in the state’s compensation reserve, and market salary adjustments.o Overall the budgeted non-salary expenses decreased, while supplies and expenses (S&E) increased
by 1%.o Higher costs of goods and services due to inflation.o Federal Financial Aid expenses are reduced in FY23 due to anticipated enrollment declines.
Strategic Budget Actions in the FY22/23 Annual Budget:
UWO Re-Investment Initiative: UWO plans to invest/reallocate approximately $10.8M in one-time/basefunding over fiscal years FY22 through FY24 to support several UWO strategic priorities, including:increasing enrollment; enhancing student retention; improving information technology; building equity,diversity and inclusion efforts; and beautifying campus grounds.
o Source of funds: These initiatives will be funded primarily through $8.8M in program revenuebalances, along with a re-allocation of approximately $2M in state funds (GPR).
Philanthropy:
Primary Fundraising Foundation: The UW-Oshkosh Foundation (established in 1963). Total Endowment (as of June 30, 2021): $30.6M (total endowed assets) and $37.3M (total net assets). FY22/23 Highlight: The UW-Oshkosh Foundation distributed $900K in scholarships to 658 students in FY22
and is planning on providing upwards of $1M in scholarships to approximately 700 students in FY23.
45

GPR/Tuition$90.2M-0.79%
Auxiliaries$40.5M1.19%
GPO$11.5M23.60%
FICR$722K6.82%
GGC$11.2M-6.44%
Fed.Fin. Aid
&Other
$59.2M-10.70%
Expenses
4,0005,0006,0007,0008,0009,000
10,00011,00012,00013,00014,00015,00016,00017,000
2017-18 2018-19 2019-20 2020-21 2021-22
Total Fall Enrollment, 2017-18 to 2021-22
Headcount FTE
GPR/Tuition$94.8M0.08%
Auxiliaries$36M5.44%
GPO$11.2M11.01%
FICR$539K7.77%
GGC$10.5M-11.93%
Fed.Fin. Aid
&Other
$59.2M-10.70%
Revenues
FY22 to FY23 Budget Summary (Tables exclude GPR/Tuition fringe benefits
Total dollars and percent change from prior year (FY22 to FY23)
2021 - 2022 2022 - 2023 $ Change 2021 - 2022 2022 - 2023 $ Change
Budget Budget FY22 to FY23 Budget Budget FY22 to FY23
GPR/Tuition 90,877,046 90,160,083 -716,963 94,712,789 94,785,911 73,122
Auxiliaries 40,065,384 40,541,100 475,716 34,145,930 36,004,337 1,858,407
General Program Operations 9,341,208 11,545,990 2,204,782 10,058,178 11,165,366 1,107,188
Federal Indirect Cost Reimbursement 675,518 721,576 46,058 500,286 539,163 38,877
Gifts, Grants, Contracts 11,949,279 11,179,202 -770,077 11,919,538 10,497,668 -1,421,870
Federal Financial Aid / Other 66,324,172 59,228,296 -7,095,876 66,324,172 59,225,069 -7,099,103
Tota l Base 219,232,607 213,376,247 -5,856,360 217,660,893 212,217,514 -5,443,379
One-Time Use of Tuition Balances - - - - - -
Tota l Includ ing Use of Balances 219,232,607 213,376,247 -5,856,360 217,660,893 212,217,514 -5,443,379
Exp e nse s Re ve nue
46

UW-Parkside Mission Statement The University of Wisconsin-Parkside is committed to high-quality educational programs, creative and scholarly activities, and services responsive to its diverse student population, and its local, national and global communities.
Key Drivers in the FY22/23 Annual Budget: In 2022/23, revenues are expected to decrease by (5.99%), or -$5.5 million from the prior year’s
budget. Key drivers in revenues are:o Traditional full-time undergraduate enrollments continue to decline, impacting revenue from
tuition and segregated fees.o Auxiliary revenue from housing and dining services is directly impacted by the decline in
traditional undergraduate enrollments.o Federal Financial Aid Revenues are reduced in FY23 due to enrollment declines.
In 2022/23, the expense budget will decrease by (6.92%), or -$6.4 million from the prior year’s budget.Key drivers in expenses are:
o Overall planned spending has been reduced to align with anticipated revenue projected fromlower enrollments.
o Increased expenses include insurance costs, campus share of pay plan increases, and the highercost of goods and services due to inflation.
o Federal Financial Aid expenses are reduced in FY23 due to enrollment declines.
Strategic Budget Actions in the FY22/23 Annual Budget: UW-Parkside uses reserves from prior years, primarily due to salary savings from vacant positions, to
fund strategic initiatives that focus on enrollment growth and student success. These initiatives alsosupport student scholarships, provide academic program support, and fund operational initiatives priorto being budgeted in the base. Approximately $6.4M has been committed for strategic initiatives overthe next five years, over $1.5M for FY23.
o Strategic Initiatives funded in FY23 include: support for the tutoring center ($82K), internationalscholarships ($122K), Parkside Promise and related student support ($67K), Precollege Pipelinestudent support ($164K), improving community-based learning ($73K), student internshipsupervision ($11K), EAB Moon Shot implementation ($175K), and marketing and brandinginvestment ($60K).
UW-Parkside continues to expand its tuition base by working with UW Extended Campus and othersupport organizations to add academic programs that are self-supporting from a budget perspective.
Philanthropy: Primary Fundraising Foundation: University of Wisconsin Parkside Foundation, Inc. (established in
1985). Total Endowment (as of June 30, 2021): $12.4M in the Foundation; In addition, the University has
approximately $2.0M endowed funds in UW Trust Funds, most of which are restricted for scholarships. FY22/23 Highlight: In FY22, the Foundation and trust funds provide approximately $664K in
scholarships to students attending UW-Parkside. It is anticipated a similar amount of scholarships willbe awarded in FY23. In recent years, the Foundation has provided approximately $75K annually tostudents for special needs through its Future Focus Fund.
47

GPR/Tuition$42.7M-0.68%
Use of Bal.1.6M
-14.46%
Auxiliaries$9.1M-6.04%GPO
$1.5M-20.82%
FICR$93K0.0%
GGC$1.7M
-33.35%
Fed. Fin. Aid
&Other
$29.9M-11.93%
Expenses
1,0001,5002,0002,5003,0003,5004,0004,5005,000
2017-18 2018-19 2019-20 2020-21 2021-22
Total Fall Enrollment, 2017-18 to 2021-22
Headcount FTE
GPR/Tuition$43.9M0.93%
Auxiliaries$8.2M-5.84%GPO
$2.1M-15.73%
FICR$93K0.0%
GGC$1.7M
-35.32%
Fed. Fin. Aid
&Other
$29.8M-11.96%
Revenues
FY22 to FY23 Budget Summary (Tables exclude GPR/Tuition fringe benefits)
Total dollars and percent change from prior year (FY21 to FY22)
2021 - 2022 2022 - 2023 $ Change 2021 - 2022 2022 - 2023 $ Change
Budget Budget FY22 to FY23 Budget Budget FY22 to FY23
GPR/Tuition 43,023,929 42,731,819 -292,110 43,542,126 43,947,899 405,773
Auxiliaries 9,669,646 9,085,888 -583,758 8,659,143 8,153,096 -506,047
General Program Operations 1,858,887 1,471,906 -386,981 2,527,043 2,129,548 -397,495
Federal Indirect Cost Reimbursement 93,200 93,200 0 93,200 93,200 0
Gifts, Grants, Contracts 2,589,540 1,725,947 -863,593 2,589,540 1,674,947 -914,593
Federal Financial Aid / Other 33,934,516 29,886,852 -4,047,664 33,865,006 29,814,057 -4,050,949
Tota l Base 91,169,718 84,995,612 -6,174,106 91,276,058 85,812,747 -5,463,311
One-Time Use of Tuition Balances 1,842,196 1,575,800 -266,396 - - -
Tota l Includ ing Use of Balances 93,011,914 86,571,412 -6,440,502 91,276,058 85,812,747 -5,463,311
Exp e nse s Re ve nue
48

UW-Platteville Mission Statement
The University of Wisconsin-Platteville provides associate, baccalaureate, and master’s degree programs in a broad spectrum of disciplines including: science,
technology, engineering, and mathematics; criminal justice; education; business; agriculture; and liberal arts. We promote excellence by using a personal, hands-on approach to empower each student to become broader in perspective, intellectually more astute, ethically more responsible, and contribute wisely as an accomplished professional and knowledgeable citizen in a diverse global community.
Key Drivers in the FY22/23 Annual Budget:
In 2022/23, revenues are expected to decrease by (6.53%), or -$10 million from the prior year. Keydrivers in revenues are:
o Tuition revenue is budgeted at the current level, with a plan to utilize reserves to cover anyshortfall in enrollment.
o Federal financial aid revenues are the largest decline, primarily due to decreased enrollmentand to better align with recent experience.
o Auxiliary revenues are budgeted to decline due to decreased enrollment. In 2022/23, expenses will decrease by (5.33%), or -$8.3 million from the prior year. Key drivers in
expenses are:o While GPR/Tuition expenses remain relatively flat, with the exception of additional funding
for pay plan, funds are being reallocated to support specific initiatives like mental health,recruitment of multicultural students and other student support in the Dean of Studentsoffice.
o Federal financial aid costs are the largest decrease, corresponding to the decrease in revenue.o Planned spending in auxiliary operations has been reduced to align with the anticipated
revenue projected from lower enrollment.
Strategic Budget Actions in the FY22/23 Annual Budget:
Scholarship Initiative: UW-Platteville plans to invest in strategically awarded scholarships to supportthe retention and enrollment of all segments of students.
o Source of funds: Reallocation of existing budget Enrollment Growth Initiative: UW-Platteville plans to invest and reallocate to ensure multi-faceted
approaches to growing enrollment of new freshmen, transfer, international, and graduate students.o Source of funds: Combination of university balances and philanthropy funds
Student Success and Retention Initiative: UW-Platteville plans to further invest in microgrants, mentalhealth support, and academic support programs to improve student success and retention efforts.
o Source of funds: Reallocation of existing budget and philanthropy funds
Philanthropy:
Primary Fundraising Foundation: The UW-Platteville Foundation, Inc. (established 1951). Total Endowment (as of June 30, 2021): $43.7M FY22/23 Highlight: UW-Platteville Foundation is planning on providing $1.34M in over 1,073
scholarship awards in FY23.49

GPR/Tuition$66.6M1.98%
Use of Bal.$365k
-41.54%
Auxiliaries$28.8M-5.18%GPO
$9.7M3.08%
FICR$167K
20.65%
GGC$4.6M-1.69%
Fed. Fin. Aid
&Other
$38.3M-17.37%
Expenses
2,000
3,000
4,000
5,000
6,000
7,000
8,000
9,000
10,000
2017-18 2018-19 2019-20 2020-21 2021-22
Total Fall Enrollment, 2017-18 to 2021-22
Headcount FTE
GPR/Tuition$63.7M-2.72%
Auxiliaries$26.4M-4.71%
GPO$10.5M13.28%
FICR$129K
22.80%
GGC$4.6M-1.80%
Fed. Fin. Aid
&Other
$38.3M-17.48%
Revenue
FY22 to FY23 Budget Summary (Tables exclude GPR/Tuition fringe benefits)
Total dollars and percent change from prior year (FY22 to FY23)
2021 - 2022 2022 - 2023 $ Change 2021 - 2022 2022 - 2023 $ Change
Budget Budget FY22 to FY23 Budget Budget FY22 to FY23
GPR/Tuition 65,277,781 66,567,428 1,289,647 65,461,533 63,677,894 -1,783,639
Auxiliaries 30,420,948 28,844,453 -1,576,495 27,700,705 26,396,424 -1,304,281
General Program Operations 9,363,762 9,652,562 288,800 9,230,303 10,456,435 1,226,132
Federal Indirect Cost Reimbursement 138,594 167,218 28,624 105,200 129,189 23,989
Gifts, Grants, Contracts 4,657,125 4,578,200 -78,925 4,664,025 4,580,000 -84,025
Federal Financial Aid / Other 46,311,322 38,268,462 -8,042,860 46,431,899 38,316,510 -8,115,389
Tota l Base 156,169,532 148,078,323 -8,091,209 153,593,665 143,556,452 -10,037,213
One-Time Use of Tuition Balances 624,068 364,809 -259,259 - - -
Tota l Includ ing Use of Balances 156,793,600 148,443,132 -8,350,468 153,593,665 143,556,452 -10,037,213
Exp e nse s Re ve nue
50
UW-River Falls Mission Statement Our mission is to prepare students to be productive, creative, ethical, engaged citizens and leaders with an informed global perspective.
Key Drivers in the FY22/23 Annual Budget:
In 2022/23, revenues are expected to decrease by (1.00%), or -$1.2 million from the prior year. Key driversin revenues are:
o Post-pandemic enrollment levels resulted in a reduction of the estimated tuition revenue byapproximately $1.1M over the previous fiscal year.
o Auxiliary budgets forecast a 2.98% growth due to approved increases in segregated fees, textbookand room and board rates, as well as the resumption of camps, clinics and outside activities.
o Federal Financial Aid revenue is reduced in FY23 due to enrollment declines. In 2022/23, expenses will decrease by (.62%), or -$762,000 from the prior year. Key drivers in expenses
are:o Compensation increases include the approved 2% pay plan increases for all funds, inclusive of the
unfunded campus share not included in the state’s compensation reserve.o Salary expenditures will increase to address critical salary compression and inversion issues as
highlighted by the Title and Total Compensation (TTC) initiative, as well as in response to workforceshortages and a competitive job market.
o Deferred maintenance and inflation are primary contributors to increases in Supplies and Expenses(S&E) for many goods and services. $1.2M is needed for maintenance, internet/technologyupgrades and a predicted return of travel.
o Federal Financial Aid expenses are reduced in FY23 due to enrollment declines.
Strategic Budget Actions in the FY22/23 Annual Budget:
Strategic Recruitment and Enrollment Investments: UWRF will invest approximately $1.2M of pandemicrelief funds and fund balance between FY23-FY25 to increase student recruitment and retention. Actionsinclude development of a strategic enrollment management plan, hiring of key leadership positions, abrand study, web redesign, increased digital and video marketing, and added staffing in key areas.
Affordability and access: Aligned with the strategic recruitment initiatives above, $1.6M in campusfunding will be allocated to support intentionally leveraged first-year student scholarships.
Heating Plant Burner Upgrade (Fuel Redundancy) Initiative: This project has undergone a 67% increase incost which will need to be covered through $1.7M from central reserve fund balances.
Deferred maintenance in Residence Halls. Auxiliary fund balance will be used to support critical electricalupgrades in 50+ year old Residence Halls, at $1M per building per year.
Philanthropy: Primary Fundraising Foundation: University of Wisconsin-River Falls Foundation, Inc. (established in 1948). Total Endowment (as of June 30, 2021): $28.1M FY22/23 Highlight: $5M in gifts and grants will be raised through the UWRF Foundation for the Science
and Technology Innovation Center capital project. Donor-funded scholarships administered by the UWRFFoundation are estimated at $1.031M for FY23.
51

GPR/Tuition$53.5M0.01%
Use of Bal.$885K-2.00%
Auxiliaries$27.8M6.89%
GPO$2.9M-0.73%
FICR$268K
13.64%
GGC$3.3M-1.58%
Fed.Fin. Aid
&Other$34M-6.85%
Expenses
3,0003,5004,0004,5005,0005,5006,0006,500
2017-18 2018-19 2019-20 2020-21 2021-22
Total Fall Enrollment, 2017-18 to 2021-22
Headcount FTE
GPR/Tuition$53.6M-0.77%
Auxiliaries$23.4M8.78%
GPO$2.6M-7.15%
FICR$239K0.00%
GGC$3.5M1.21%
Fed.Fin. Aid
&Other$34M-6.86%
Revenue
FY22 to FY23 Budget Summary
(Tables exclude GPR/Tuition fringe benefits)
Total dollars and percent change from prior year (FY22 to FY23)
2021 - 2022 2022 - 2023 $ Change 2021 - 2022 2022 - 2023 $ Change
Budget Budget FY22 to FY23 Budget Budget FY22 to FY23
GPR/Tuition 53,496,137 53,500,191 4,054 54,052,134 53,635,744 -416,390
Auxiliaries 26,000,986 27,793,047 1,792,061 21,531,158 23,422,157 1,890,999
General Program Operations 2,904,031 2,882,724 -21,307 2,843,324 2,640,131 -203,193
Federal Indirect Cost Reimbursement 235,762 267,927 32,165 239,000 239,000 0
Gifts, Grants, Contracts 3,332,397 3,279,622 -52,775 3,425,667 3,467,147 41,480
Federal Financial Aid / Other 36,471,224 33,972,907 -2,498,317 36,485,236 33,982,919 -2,502,317
Tota l Base 122,440,537 121,696,418 -744,119 118,576,519 117,387,098 -1,189,421
One-Time Use of Tuition Balances 902,726 884,673 -18,053 - - -
Tota l Includ ing Use of Balances 123,343,263 122,581,091 -762,172 118,576,519 117,387,098 -1,189,421
Exp e nse s Re ve nue
52

UW-Stevens Point Mission Statement Through the discovery, dissemination and application of knowledge, UW-Stevens Point fosters intellectual growth, provides a broad-based education, models community engagement, and prepares students for success in a diverse and sustainable world.
Key Drivers in the FY22/23 Annual Budget:
In 2022/23, revenues are expected to increase by .24%, or $442,000 from the prior year. Key drivers in revenues are:
o Enrollment and related tuition growth will continue in graduate level programs with new programs starting and successful programs expanding.
o Total undergraduate enrollment is projected to remain level even though freshmen enrollment is expected to increase over the prior year. Challenges include branch campus enrollment declines, remaining effects of Covid and two small classes on the main campus as they progress to graduation.
o Auxiliary rate increases in room, board and segregated fees.o Return to pre-pandemic levels of activity for operations including study abroad and Continuing Education
outreach activities.o Federal Financial Aid revenue is reduced in FY23.
In 2022/23, expenses will decrease by (1.39%), or -$2.7 million from the prior year. Key drivers in expenses are:o The key driver in decreased expense is due to the implementing the final phase of GPR budget
reductions on the main campus to align expenses with tuition projections. Reduction plans for branch campuses continue to align the operating budget with tuition projections.
o Compensation related to market and recruiting demands will cause a growth in personnel costs.o Auxiliary expense increases include cost of operations related to inflation, personnel expenses, deferred
maintenance, and recruiting/retention factors.o Expansion of our distance education and retention initiatives.o Relocation costs for the Albertson project will use one-time funds for FY23-FY26.o Federal Financial Aid expenses are reduced in FY23 due to enrollments.
Strategic Budget Actions in the FY22/23 Annual Budget:
New Program Development Initiative: UW Stevens Point plans to invest/reallocate approximately $1M in one-time funding over FY23-FY24 to support our strategic priority of new on-line initiatives.
Occupational Therapy program is being evaluated in response to regional needs. Funding source is from adonor and fund balances.
Investing in Professional Development and Tuition reimbursement program to further develop and assist ouremployees. Funding is from one-time funds to support these employee initiatives.
Piloting a conditional admit program to provide more students the college opportunities. Funding is from one-time funds over a two-year period.
Philanthropy:
Primary Fundraising Foundation: The UW Stevens Point Foundation (established in 1965). Total Endowment (as of 12/31/20): $53.6M FY22/23 Highlight: UW Stevens Point Foundation is planning to provide approximately $1M in scholarships to
students and approximately $1.5M in program support based on market conditions.
53

GPR/Tuition$78.8M-3.93%
Use of Bal.$0.00-100%
Auxiliaries$35.7M26.50%
GPO$14.7M4.20%
FICR$216K1.58%
GGC$9.3M1.04%
Fed.Fin. Aid
&Other
$49.9M-4.98%
Expenses
2,000
3,000
4,000
5,000
6,000
7,000
8,000
9,000
10,000
2017-18 2018-19 2019-20 2020-21 2021-22
Total Fall Enrollment, 2017-18 to 2021-22
Headcount FTE
GPR/Tuition$78.2M1.45%
Auxiliaries$32.6M3.38%
GPO$14.8M12.02%
FICR$223K5.47%
GGC$9.4M1.24%
Fed.Fin. Aid
&Other$49.9
-6.48%
Revenue
FY22 to FY23 Budget Summary (Tables exclude GPR/Tuition fringe benefits)
Total dollars and percent change from prior year (FY22 to FY23)
2021 - 2022 2022 - 2023 $ Change 2021 - 2022 2022 - 2023 $ Change
Budget Budget FY22 to FY23 Budget Budget FY22 to FY23
GPR/Tuition 82,039,056 78,811,429 -3,227,627 77,129,002 78,247,611 1,118,609
Auxiliaries 28,252,521 35,738,218 7,485,697 31,486,693 32,552,089 1,065,396
General Program Operations 14,073,997 14,665,780 591,783 13,233,804 14,824,144 1,590,340
Federal Indirect Cost Reimbursement 212,896 216,255 3,359 211,563 223,129 11,566
Gifts, Grants, Contracts 9,250,003 9,346,344 96,341 9,250,003 9,364,508 114,505
Federal Financial Aid / Other 52,504,187 49,889,583 -2,614,604 53,359,620 49,901,509 -3,458,111
Tota l Base 186,332,660 188,667,609 2,334,949 184,670,685 185,112,990 442,305
One-Time Use of Tuition Balances 5,000,000 - -5,000,000 - - -
Tota l Includ ing Use of Balances 191,332,660 188,667,609 -2,665,051 184,670,685 185,112,990 442,305
Exp e nse s Re ve nue
54

UW-Stout Mission Statement The University of Wisconsin – Stout prepares students for careers through applied learning and research, professional experiences, and collaborative partnerships to benefit a global society. As Wisconsin’s Polytechnic University, we fulfill our mission
through a curriculum that combines interdisciplinary knowledge and discipline-specific technical skills with critical thinking, creative problem-solving, communication, and social and ethical reasoning skills to better the human condition. We offer career-focused undergraduate and graduate programs for diverse students, in a variety of in-person, hybrid, and virtual modalities, organized around career clusters that include science, technology, engineering and mathematics; art and design; business and management; education; social and behavioral sciences; information technology and communications; and health sciences and human services.
Key Drivers in the FY22/23 Annual Budget:
In 2022/23, revenues are expected to decrease by 3.64%, or $6.3 million from the prior year. Key drivers inrevenues are:
o Federal Higher Education Emergency Relief Funds have ended.o Auxiliary revenues are expected to increase as dining services rebound from the impact of the pandemic
and employment of staff increases to support more retail spaces across campus.o Federal Financial Aid revenue is reduced in FY23 due to enrollment declines.
In 2022/23, expenses will decrease by 4.89%, or $8.5 million from the prior year. Key drivers in expenses are:o Compensation, including the campus share of pay plan increases that are not covered by the state’s
compensation reserve.o Increased costs for goods and services associated with inflation; common system assessment, and the
removal of Federal Higher Education Emergency Relief Fund expenditures.o Federal Financial Aid expenses are reduced in FY23 due to enrollment declines.
Strategic Budget Actions in the FY22/23 Annual Budget:
Strategic Planning: Approximately $1M in funding will be used to develop a Comprehensive Academic Plan anda University Long-Range Plan for the next 10 years. The combination of these two initiatives will develop a pathto meet the short and long-term academic needs of our students and industry partners along with providing aframework to improve the infrastructure to support student success in the polytechnic environment.
o Source of funds: One-time use of balances Strategic Enrollment Management: UW-Stout will continue to make investments in enrollment management,
including the formation of a new unit and hiring a Vice Chancellor of Enrollment and Strategic Initiatives. Theinstitution will invest approximately $1M to support strategic enrollment planning and implementation.
o Source of funds: Reallocation of base funding and one-time use of balances Equity, Diversity, and Inclusion: UW-Stout has hired an inaugural Assistant Chancellor of Equity, Diversity, and
Inclusion (EDI), forming a new EDI unit, and supporting critical staff to make transformational changes to Stout’senvironment and meet the needs of our students, faculty, and staff.
o Source of funds: Reallocation of base funding.
Philanthropy:
Primary Fundraising Foundation: Stout University Foundation, Inc. (established in 1962). Total Endowment (as of June 30, 2021): $80.3M FY22/23 Highlight: For Fall 23, the Foundation will be awarding $1.2M in scholarships to 540 students.
55

GPR/Tuition$68.7M-1.84%
Auxiliaries$31.7M9.82%
GPO$15.6M-3.77%
FICR$511K
23.42%
GGC$7.3M
-15.36%
Fed.Fin. Aid
&Other
$41.6M-16.50%
Expenses
2,0003,0004,0005,0006,0007,0008,0009,000
10,000
2017-18 2018-19 2019-20 2020-21 2021-22
Total Fall Enrollment, 2017-18 to 2021-22
Headcount FTE
GPR/Tuition$69.5M-1.92%
Auxiliaries$31.8M19.06%
GPO$14.9M-7.24%
FICR$441K9.57%
GGC$7.7M-7.75%
Fed.Fin. Aid
&Other
$41.6M-16.50%
Revenue
FY22 to FY23 Budget Summary (Tables exclude GPR/Tuition fringe benefits)
Total dollars and percent change from prior year (FY22 to FY23)
2021 - 2022 2022 - 2023 $ Change 2021 - 2022 2022 - 2023 $ Change
Budget Budget FY22 to FY23 Budget Budget FY22 to FY23
GPR/Tuition 70,035,734 68,748,810 -1,286,924 70,871,979 69,512,207 -1,359,772
Auxiliaries 28,858,855 31,691,521 2,832,666 26,683,733 31,769,851 5,086,118
General Program Operations 16,162,638 15,553,182 -609,456 16,096,400 14,931,101 -1,165,299
Federal Indirect Cost Reimbursement 414,239 511,235 96,996 402,044 440,528 38,484
Gifts, Grants, Contracts 8,602,437 7,281,221 -1,321,216 8,336,954 7,691,221 -645,733
Federal Financial Aid / Other 49,840,394 41,617,208 -8,223,186 49,840,394 41,617,208 -8,223,186
Tota l Base 173,914,297 165,403,177 -8,511,120 172,231,504 165,962,116 -6,269,388
One-Time Use of Tuition Balances - - - - - -
Tota l Includ ing Use of Balances 173,914,297 165,403,177 -8,511,120 172,231,504 165,962,116 -6,269,388
Exp e nse s Re ve nue
56

UW-Superior Mission Statement The University of Wisconsin-Superior fosters intellectual growth and career preparation within a liberal arts tradition that emphasizes individual attention, embodies respect for diverse cultures and multiple voices, and engages the community and region.
Key Drivers in the FY22/23 Annual Budget:
In 2022/23, revenues are expected to increase by 2.02%, or $1.2 million from the prior year. Key drivers inrevenues are:
o Revenues in the form of indirect costs from grant and contract work conducted by the Lake SuperiorResearch Institute.
o Segregated fees and auxiliary rates will increase marginally by 1% - 2%.o Overall tuition revenue is expected to remain flat; however, the shift from on campus students to online
students will compress the campus margins even further, making it more difficult to cover fixed costs.
In 2022/23, expenses are expected to increase by 2.74%, or $1.7 million from the prior year. Key drivers inexpenses are:
o Compensation: The unfunded campus share of the 2% pay plan and additional costs associated with theTitle and Total Compensation (TTC) project.
o Supplies and Expenses (S&E): Inflationary increases for cost for goods and services, includingconstruction, and maintenance that limit resources to address emergency repairs.
o Inflation is also impacting students, particularly in meal plans, and will strain campus resources as thecampus strives to maintain an equitable level of service.
o Common Systems, insurance premiums, and unfunded mandates/compliance costs from audits (ITsecurity, for example) are becoming significant financial burdens to the operating budget.
Strategic Budget Actions in the FY22/23 Annual Budget:
Student Retention: The campus is currently vetting and implementing feedback received during its strategicplanning process. A key component will be engaging with a consultant to assist in designing tactics for asuccessful retention plan.
o Source of funds: Scholarship support will come from the UW-Superior Foundation. Additional expensesrelated to student retention will come from balances and other one-time funds.
Enrollment: Another key component of the strategic plan is a long-term strategy to grow enrollment. Asuccessful effort will include a careful curation of academic programs inclusive of programming that meets theworkforce needs in Wisconsin.
o Source of funds: One-time use of balances and reallocation of existing budgets. Employee Development: UW-Superior will continue to enhance employee capacity and contribute to a healthy
campus climate by investing in training and other professional development opportunities.o Source of funds: One-time use of balances.
Philanthropy:
Primary Fundraising Foundation: The UW-Superior Foundation, Inc. (established in 1949) Total Endowment (as of June 30, 2021): $20.7M FY22/23 Highlight: The UW-Superior Foundation will celebrate completion of the $20M “Together We Are
Superior" campaign during FY23. One of the highlights of the campaign includes a $4.5M gift to fund a newLake Superior Research Institute boat. The Foundation will also award 550 scholarships totaling over $1M.
57

500
1,000
1,500
2,000
2,500
3,000
2017-18 2018-19 2019-20 2020-21 2021-22
Total Fall Enrollment, 2017-18 to 2021-22
Headcount FTE
GPR/Tuition$30.5
-3.47%
Auxiliaries$5.6M-0.11%GPO
$1.126.77%
FICR$400K
45.45%
GGC$6.7M59.66%
Fed.Fin. Aid
&Other
$18.2M-2.75%
Revenue
GPR/Tuition$30.6M-3.28%
Use of Bal.$844K
45.71%
Auxiliaries$5.6M-0.04%
GPO$1.1M30.59%
FICR$346K
92.41%
GGC$6.6M61.19%
Fed.Fin. Aid
&Other
$18.2M-2.56%
Expenses
FY22 to FY23 Budget Summary (Tables exclude GPR/Tuition fringe benefits)
Total dollars and percent change from prior year (FY22 to FY23)
2021 - 2022 2022 - 2023 $ Change 2021 - 2022 2022 - 2023 $ Change
Budget Budget FY22 to FY23 Budget Budget FY22 to FY23
GPR/Tuition 31,610,356 30,574,100 -1,036,256 31,627,965 30,529,936 -1,098,029
Auxiliaries 5,583,147 5,580,954 -2,193 5,584,119 5,590,427 6,308
General Program Operations 828,294 1,081,629 253,335 835,000 1,058,500 223,500
Federal Indirect Cost Reimbursement 179,887 346,125 166,238 275,000 400,000 125,000
Gifts, Grants, Contracts 4,116,187 6,634,694 2,518,507 4,175,000 6,666,000 2,491,000
Federal Financial Aid / Other 18,656,497 18,178,889 -477,608 18,697,033 18,183,354 -513,679
Tota l Base 60,974,368 62,396,391 1,422,023 61,194,117 62,428,217 1,234,100
One-Time Use of Tuition Balances 579,300 844,092 264,792 - - -
Tota l Includ ing Use of Balances 61,553,668 63,240,483 1,686,815 61,194,117 62,428,217 1,234,100
Exp e nse s Re ve nue
58

UW-Whitewater Mission Statement The University of Wisconsin-Whitewater is a preeminent academic institution driven by the pursuit of knowledge, powered by a spirit of innovation, and focused on transforming lives. As part of the University of Wisconsin System, UW-Whitewater embraces the Wisconsin Idea and is an economic and cultural driver of our region. We
are nationally and internationally recognized for the accomplishments of our students, faculty, staff, and alumni. We are an inclusive educational community with a deep commitment to access that inspires us to serve students from diverse backgrounds, experiences, identities, and abilities. We have a longstanding special mission to serve students with disabilities. By supporting all students, we champion education, opportunity, and prosperity for all.
Key Drivers in the FY22/23 Annual Budget:
In 2022/23, revenues are expected to decrease by (.78%), or -$1.8 million from the prior year. Keydrivers in revenues are:
o The budgeted decrease in tuition revenue reflects the anticipated enrollment changes for thenext academic year.
o An increase to reflect a budgeted change for the pass-through of private scholarships andalternative loans. Federal Financial Aid revenue however, decreases due to enrollmentdeclines.
In FY23, budgeted expenses will increase 5.15%, or $11.6 million over the prior year. Key drivers inexpenses are:
o The growth of online and market-based programming.o Compensation costs from the approved pay plan inclusive of the campus share of the
increase not covered by the state’s compensation reserve.o Higher costs for overall goods and services due to inflation.o An increase to reflect a budgeted change for the pass-through of private scholarships and
alternative loans. Federal Financial Aid expenses however, decrease due to enrollmentdeclines.
Strategic Budget Actions in the FY22/23 Annual Budget:
UW Whitewater plans to invest approximately $2.2M in one-time funding during FY23 to supportenrollment and retention initiatives. This funding will be used for:
o Reestablishment of the Learning Communities Program. This program for new freshman, whichwas previously in place from 2004-2021, includes cohort enrollment in specific courses, housingin the same residence hall and analysis of a theme through multiple perspectives. The programis a partnership between Academic and Student Affairs.
o Expansion of academic advising services. This includes recruitment and hiring of a new advisorto support incoming students.
Philanthropy:
Primary Fundraising Foundation: The UW-Whitewater Foundation, Inc., (established in 1962) Total Endowment (as of June 30, 2021): $36.2 million FY22/23 Highlight: The Foundation-approved budget for FY23 includes $1.3M in scholarships for
approximately 1,200 students.59

GPR/Tuition$106.1M
4.61%
Use of Bal.$2.1M
-14.88%
Auxiliaries$38.2M4.36%
GPO$21.7M119.83%
FICR$416K
87.91%
GGC$5.2M8.27%
Fed. Fin. Aid
&Other
$63.6M-9.50%
Expenses
2,0003,0004,0005,0006,0007,0008,0009,000
10,00011,00012,00013,00014,000
2017-18 2018-19 2019-20 2020-21 2021-22
Total Fall Enrollment, 2017-18 to 2021-22
Headcount FTE
GPR/Tuition$96.7M-5.71%
Auxiliaries$40.1M4.87%GPO
$21.7M76.54%
FICR$609K
12.18%
GGC$5.4M-5.31%
Fed. Fin. Aid
&Other
$63.7M-9.86%
Revenue
FY22 to FY23 Budget Summary
(Tables exclude GPR/Tuition fringe benefits)
Total dollars and percent change from prior year (FY22 to FY23)
2021 - 2022 2022 - 2023 $ Change 2021 - 2022 2022 - 2023 $ Change
Budget Budget FY22 to FY23 Budget Budget FY22 to FY23
GPR/Tuition 101,448,120 106,129,844 4,681,724 102,563,315 96,703,624 -5,859,691
Auxiliaries 36,622,481 38,219,953 1,597,472 38,278,465 40,142,581 1,864,116
General Program Operations 9,851,807 21,657,026 11,805,219 12,283,729 21,685,918 9,402,189
Federal Indirect Cost Reimbursement 221,326 415,887 194,561 543,121 609,268 66,147
Gifts, Grants, Contracts 4,794,049 5,190,421 396,372 5,696,671 5,394,127 -302,544
Federal Financial Aid / Other 70,275,017 63,597,894 -6,677,123 70,680,732 63,709,848 -6,970,884
Tota l Base 223,212,800 235,211,025 11,998,225 230,046,033 228,245,366 -1,800,667
One-Time Use of Tuition Balances 2,500,000 2,128,000 -372,000 - - -
Tota l Includ ing Use of Balances 225,712,800 237,339,025 11,626,225 230,046,033 228,245,366 -1,800,667
Exp e nse s Re ve nue
60

APPENDIX A ANNUAL DISTRIBUTION ADJUSTMENTS FOR CHANGES IN GPR/TUITION
FUNDING
1. BUDGETED TUITION EXPENDITURES, PROGRAM DIFFERENTIAL TUITION, AND CREDIT EXTENSION These allocations reflect institutional re-estimates in tuition authority for enrollment changes, existing program differentials and self-supporting programs, and rate changes for graduate and non-resident students. These changes vary based upon institutional requests and are not the result of tuition rate increases for Wisconsin residents.
2. 2021-22 COMPENSATION AND FRINGE BENEFITS ADJUSTMENTS IN 2022-23 These allocations provide funding for the 2021-22 portion of the 2% compensation increases, which are known as “pay plan” and were approved by the Joint Committee on Employment Relations (JCOER), effective January 1, 2022. Also included are reductions to reflect the unfunded pay plan costs related to the tuition share of compensation and the associated fringe benefit adjustments. The allocations have been distributed based on each institution’s share of the UW System’s pay plan allocation. Health insurance increases also resulted in additional costs related to fringe benefits. Campus budgets were reduced for the tuition portion of these costs.
3. 2022-23 COMPENSATION AND FRINGE BENEFITS ADJUSTMENTS These allocations provide funding for 6-months of the 2022-23 2% compensation increases, which are known as “pay plan” and were approved by the Joint Committee on Employment Relations (JCOER), effective January 1, 2023. Also included are reductions to reflect the unfunded pay plan costs related to the tuition share of compensation and the associated fringe benefit adjustments. The allocations have been distributed based on each institution’s share of the UW System’s pay plan allocation.
4. REALLOCATION OF OUTCOMES BASED FUNDING This allocation redistributes $48.75 million of Outcomes Based Funding based on the formula developed by the Board of Regents and approved by the Joint Finance Committee.
61

5. DEBT SERVICE The 2021-23 Biennial Budget provides $211,391,800 in GPR Debt Service for fiscal year 2022-23. This funding has been allocated based on each institution’s proportion of actual debt service expenditures (principal plus interest) in fiscal year 2020-21.
6. FINANCIAL AID
Lawton Undergraduate Minority Retention Grant/Advanced Opportunity Program (AOP) The budget flat funds the Lawton Undergraduate Minority Retention Grant and the Advanced Opportunity Program in 2022-23. Funding for the AOP is based on each institution’s proportion of a three-year rolling average headcount of the statutorily designated eligible population of minority/disadvantaged graduate students. The Lawton Grant allocation is based on the three-year rolling average of Wisconsin resident undergraduates from eligible populations who are registered full-time. Tuition Assistance Grant (TAG) Tuition Assistance Grant funds are available to institutions to provide need-based aid to resident undergraduate students. These funds are transferred annually to institutions from the centrally held fund based on the most recent proportion of Pell Grants (dollars) for Wisconsin resident undergraduate students with an Expected Family Contribution (EFC) below $5,600 at each UW institution.
7. DISTRIBUTION OF FUNDING PREVIOUSLY HELD IN JOINT FINANCE COMMITTEE (JFC) SUPPLEMENTAL APPROPRIATION This funding was previously held in the JFC Supplemental Appropriation. Funding was released following approval of the UW System’s plan for the use of the funds. Allocations were entered in 2022-23 to distribute the funding.
UW-Extension Cooperative County Agriculture Agents – This funding has been allocated to UW-Madison to expand the number of agriculture agents statewide.
Freshwater Collaborative – Funding has been provided to UW-Milwaukee to administer the program, with the remainder being held at UW System Administration. The centrally held funding will be provided to campuses in the form of grants.
Foster Youth Programs – This funding is being held centrally at UW System Administration and will be provided to campuses through a grant process.
62

8. UTILITY FUNDING For 2022-23, the 2021-22 allocation for campus utilities was compared to an updated 4-year average of actual expenditures (FY18-FY21). Where a campus’ updated average exceeds the FY22 allocation, an allocation is provided for the difference. Conversely, where the updated average is less than the FY22 allocation, campuses retain the savings.
9. REALLOCATION OF RENEWABLE ENERGY APPROPRIATION This allocation redistributes the $4,367,000 in the renewable energy appropriation based on each institution’s proportion of actual renewable energy expenditures in fiscal year 2020-21.
63

EstimatedFY23 Fall
Institution Rooms 2021-22 2022-23 $ Change % Change Occupancy
Madison Single Rooms:Adams(B)/Davis(B)/Merit(A)/Tripp(B) $7,500 $7,600 $100 1.3% 39 Adams(A)/Barnard/Cole/Davis(A)/Merit(B)/Sellery/Smith(B)/Sullivan/Tripp(A)/Waters $8,000 $8,100 $100 1.3% 560 Smith(A) $8,800 $8,900 $100 1.1% 25
Single w/Bath:Phillips/Waters $8,200 $8,300 $100 1.2% 3 Lowell/Smith $9,100 $9,200 $100 1.1% 9
Double Rooms:→ Adams(B)/Bradley/Cole/Davis/Humphrey/Jorns/Kronshage/Slichter/Sullivan/Tripp(B) $6,900 $7,000 $100 1.4% 1,722
Barnard(A)/Waters $7,100 $7,200 $100 1.4% 534 → Chadbourne/Sellery/Smith(B) $7,500 $7,600 $100 1.3% 1,648
Adams(A)/Barnard(B)/Tripp(A)/Witte $7,700 $7,800 $100 1.3% 1,278 Dejope/Leopold/Ogg/Smith(A) $8,000 $8,100 $100 1.3% 668
Double w/Bath:Barnard/Davis/Merit/Phillips/Slichter/Waters $7,900 $8,000 $100 1.3% 188 Lowell/Ogg/Smith $8,200 $8,300 $100 1.2% 290
Triple Rooms:Adams/Tripp $6,400 $6,500 $100 1.6% 90
→ Barnard/Chadbourne/Cole/Dejope/Leopold/Ogg/Smith $6,800 $6,900 $100 1.5% 1,281 Sellery $6,900 $7,000 $100 1.4% 24
Triple w/Bath:Lowell(B)/Merit $7,100 $7,200 $100 1.4% 51 Lowell(A) $7,500 $7,600 $100 1.3% 12
Quad Rooms:Bradley/Cole/Jorns/Kronsage/Sullivan/ $6,400 $6,500 $100 1.6% 44 Dejope/Ogg/Witte $6,800 $6,900 $100 1.5% 120
Average Cost for the Majority of Students $7,067 $7,167 $100 1.4% 8,586
Milwaukee Sandburg Single $6,623 $6,623 $0 0.0% 457→ Sandburg Double $5,603 $5,603 $0 0.0% 995
Sandburg Triple $4,996 $4,996 $0 0.0% 87Sandburg East Tower Single $8,271 $8,271 $0 0.0% 233Sandburg East Tower Double $6,324 $6,324 $0 0.0% 299Purin Hall Single $7,190 $7,190 $0 0.0% 16Purin Hall Double $5,740 $5,740 $0 0.0% 32
→ Cambridge Commons Double $6,779 $6,779 $0 0.0% 479Cambridge Commons Double Upgrade $7,909 $7,909 $0 0.0% 142
→ Riverview Double $6,441 $6,441 $0 0.0% 468Average Cost for the Majority of Students $6,274 $6,274 $0 0.0% 3,208
Eau Claire → Double $4,947 $5,095 $148 3.0% 1,561 → Double Renovated $5,392 $5,554 $162 3.0% 936
Chancellors - Single $6,737 $6,939 $202 3.0% 301 Renovated Towers Single $5,865 $6,041 $176 3.0% 144 Traditional Hall $5,600 $5,768 $168 3.0% 56 Priory - Single Suite $5,865 $6,041 $176 3.0% 40 The Suites - Single Suite $5,865 $6,041 $176 3.0% 128 The Suites - Double Suite $5,567 $5,734 $167 3.0% 278 Haymarket - Studio $8,394 $8,545 $151 1.8% 10 Haymarket - 1BR Single $9,327 $9,495 $168 1.8% 6 Haymarket - 1BR Double $5,567 $5,769 $202 3.6% 4 Haymarket - 1BR Double + Den $6,719 $6,840 $121 1.8% 6 Haymarket 2BR Single $7,026 $7,153 $127 1.8% 10 Haymarket 2BR Double $5,667 $5,769 $102 1.8% 138 Haymarket 2BR Double Economy $5,250 $5,250 56 Haymarket 2BR Double + Den $9,162 $9,495 $333 3.6% 24 Haymarket 4BR Single $6,617 $6,736 $119 1.8% 140 Aspenson Mogensen - 1 BR Single $9,567 $9,740 $173 1.8% 6 Aspenson Mogensen - 2,3,4BR Single 12-mo $8,448 $8,600 $152 1.8% 165
Average Cost for the Majority of Students $5,170 $5,325 $155 3.0% 4,009
Appendix BUniversity of Wisconsin System
2022-23 Academic Year Room Rates
→ Room rate used in calculation of average cost for the majority of students. 64
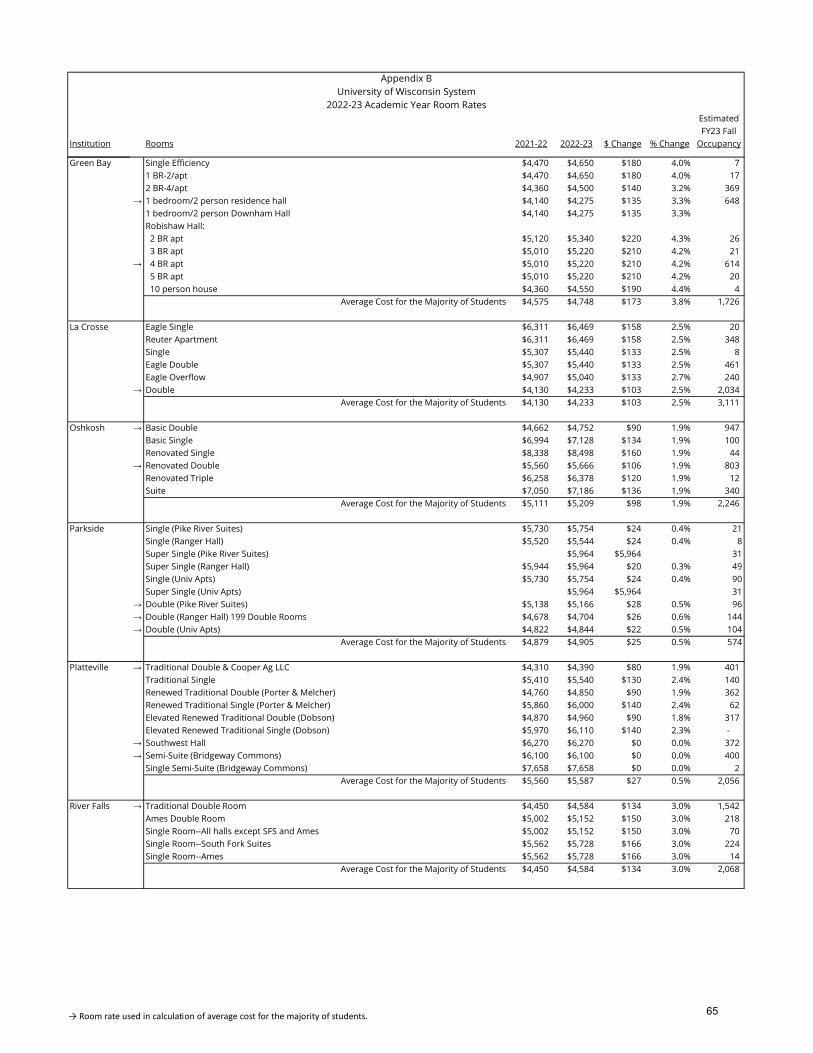
EstimatedFY23 Fall
Institution Rooms 2021-22 2022-23 $ Change % Change Occupancy
Appendix BUniversity of Wisconsin System
2022-23 Academic Year Room Rates
Green Bay Single Efficiency $4,470 $4,650 $180 4.0% 7 1 BR-2/apt $4,470 $4,650 $180 4.0% 17 2 BR-4/apt $4,360 $4,500 $140 3.2% 369
→ 1 bedroom/2 person residence hall $4,140 $4,275 $135 3.3% 648 1 bedroom/2 person Downham Hall $4,140 $4,275 $135 3.3%Robishaw Hall: 2 BR apt $5,120 $5,340 $220 4.3% 26 3 BR apt $5,010 $5,220 $210 4.2% 21
→ 4 BR apt $5,010 $5,220 $210 4.2% 614 5 BR apt $5,010 $5,220 $210 4.2% 20 10 person house $4,360 $4,550 $190 4.4% 4
Average Cost for the Majority of Students $4,575 $4,748 $173 3.8% 1,726
La Crosse Eagle Single $6,311 $6,469 $158 2.5% 20 Reuter Apartment $6,311 $6,469 $158 2.5% 348 Single $5,307 $5,440 $133 2.5% 8 Eagle Double $5,307 $5,440 $133 2.5% 461 Eagle Overflow $4,907 $5,040 $133 2.7% 240
→ Double $4,130 $4,233 $103 2.5% 2,034 Average Cost for the Majority of Students $4,130 $4,233 $103 2.5% 3,111
Oshkosh → Basic Double $4,662 $4,752 $90 1.9% 947 Basic Single $6,994 $7,128 $134 1.9% 100 Renovated Single $8,338 $8,498 $160 1.9% 44
→ Renovated Double $5,560 $5,666 $106 1.9% 803 Renovated Triple $6,258 $6,378 $120 1.9% 12 Suite $7,050 $7,186 $136 1.9% 340
Average Cost for the Majority of Students $5,111 $5,209 $98 1.9% 2,246
Parkside Single (Pike River Suites) $5,730 $5,754 $24 0.4% 21Single (Ranger Hall) $5,520 $5,544 $24 0.4% 8Super Single (Pike River Suites) $5,964 $5,964 31Super Single (Ranger Hall) $5,944 $5,964 $20 0.3% 49Single (Univ Apts) $5,730 $5,754 $24 0.4% 90Super Single (Univ Apts) $5,964 $5,964 31
→ Double (Pike River Suites) $5,138 $5,166 $28 0.5% 96→ Double (Ranger Hall) 199 Double Rooms $4,678 $4,704 $26 0.6% 144→ Double (Univ Apts) $4,822 $4,844 $22 0.5% 104
Average Cost for the Majority of Students $4,879 $4,905 $25 0.5% 574
Platteville → Traditional Double & Cooper Ag LLC $4,310 $4,390 $80 1.9% 401 Traditional Single $5,410 $5,540 $130 2.4% 140 Renewed Traditional Double (Porter & Melcher) $4,760 $4,850 $90 1.9% 362 Renewed Traditional Single (Porter & Melcher) $5,860 $6,000 $140 2.4% 62 Elevated Renewed Traditional Double (Dobson) $4,870 $4,960 $90 1.8% 317 Elevated Renewed Traditional Single (Dobson) $5,970 $6,110 $140 2.3% -
→ Southwest Hall $6,270 $6,270 $0 0.0% 372 → Semi-Suite (Bridgeway Commons) $6,100 $6,100 $0 0.0% 400
Single Semi-Suite (Bridgeway Commons) $7,658 $7,658 $0 0.0% 2 Average Cost for the Majority of Students $5,560 $5,587 $27 0.5% 2,056
River Falls → Traditional Double Room $4,450 $4,584 $134 3.0% 1,542 Ames Double Room $5,002 $5,152 $150 3.0% 218 Single Room--All halls except SFS and Ames $5,002 $5,152 $150 3.0% 70 Single Room--South Fork Suites $5,562 $5,728 $166 3.0% 224 Single Room--Ames $5,562 $5,728 $166 3.0% 14
Average Cost for the Majority of Students $4,450 $4,584 $134 3.0% 2,068
→ Room rate used in calculation of average cost for the majority of students. 65

EstimatedFY23 Fall
Institution Rooms 2021-22 2022-23 $ Change % Change Occupancy
Appendix BUniversity of Wisconsin System
2022-23 Academic Year Room Rates
Stevens Point DeBot Quad Single $5,900 $6,100 $200 3.4% 78 → DeBot Quad Double $4,600 $4,750 $150 3.3% 1,730
Allen Quad Single $5,700 $5,900 $200 3.5% 119 Allen Quad Double $4,400 $4,550 $150 3.4% 566 Suites $6,500 $6,700 $200 3.1% 307
Average Cost for the Majority of Students $4,600 $4,750 $150 3.3% 2,800
Stout Single Occ Rate $5,610 $5,730 $120 2.1% 43 Single Occ Rate, Remodeled Hall $5,810 $5,930 $120 2.1% 4 Single Occ Rate, Air Conditioned $6,010 $6,130 $120 2.0% 1
→ Double Occ Rate $4,610 $4,730 $120 2.6% 1,126 → Double Occ Rate - Remodeled Hall $4,810 $4,930 $120 2.5% 571
Double Occ Rate - Extended $4,810 $4,930 $120 2.5% 206 Double Occ Rate - Extended - Remodeled $5,010 $5,130 $120 2.4% 8 Double Occ Rate - Remodeled - Air Conditioned $5,010 $5,130 $120 2.4% 504 Double Occ Rate - Extended - Remodeled - Air Conditioned $5,210 $5,330 $120 2.3% 8 Triple Occ Rate $4,210 $4,330 $120 2.9% - Triple Occ Rate, Remodeled Hall $4,410 $4,530 $120 2.7% - Triple Occ Rate, Remodeled Hall - Air Conditioned $4,610 $4,730 $120 2.6% - Suite Occ Rate $6,210 $6,330 $120 1.9% 269 Quad - Remodeled $4,810 $4,930 $120 2.5% - Quad - Remodeled - Air Conditioned $5,010 $5,130 $120 2.4% 20 Overloads $4,210 $4,330 $120 2.9% -
Average Cost for the Majority of Students $4,710 $4,830 $120 2.5% 2,760
Superior Crownhart/CMO Single $4,948 $4,998 $50 1.0% 140 → Crownhart/CMO Double $3,638 $3,674 $36 1.0% 260 → Ross/Hawkes Single $5,228 $5,280 $52 1.0% 190
Ross/Hawkes Double $4,058 $4,098 $40 1.0% 90 Ross/Hawkes Suite $4,740 $4,788 $48 1.0% 22
Average Cost for the Majority of Students $4,433 $4,477 $44 1.0% 702
Whitewater → Double rates - Benson, Bigelow, Clem, Lee/Tutt/Knilans $4,430 $4,476 $46 1.0% 742 → Double - Wells (Break) $4,452 $4,496 $44 1.0% 834 → Double - Arey/Fricker/Fischer (renovated) $4,534 $4,580 $46 1.0% 622
Double - Wellers (Break/Renovated) $4,456 $4,600 $144 3.2% 146 Single rates - Benson, Bigelow, Clem, Lee/Tutt/Knilans $5,732 $5,790 $58 1.0% 226 Single - Wells (Break) $5,752 $5,810 $58 1.0% 130 Single - Arey/Fricker/Fischer (renovated) $5,834 $5,892 $58 1.0% - Single - Wellers (Break/Renovated) $5,854 $5,914 $60 1.0% 36 Design Singles $5,470 $5,524 $54 1.0% 18 Triple - Wellers $3,944 $3,982 $38 1.0% - Triple - Tutt/Knilans $3,862 $3,900 $38 1.0% - Expanded Doubles - Wellers $4,964 $5,012 $48 1.0% 16 Expanded Doubles - Tutt/Knilans $4,838 $4,888 $50 1.0% 32 Suite $6,588 $6,654 $66 1.0% 430 Cambridge - 1 Bedroom Double $5,708 ($5,708)Cambridge - 2/3 Bedroom Double $5,544 ($5,544)Cambridge - 1/3 Bedroom Single $6,456 ($6,456)Ma'iingan Single $7,601 $7,686 $85 1.1% - Ma'iingan Double $6,186 $6,248 $62 1.0% 389
Average Cost for the Majority of Students $4,472 $4,517 $45 1.0% 3,621
→ Room rate used in calculation of average cost for the majority of students. 66

EstimatedFY23 Fall
Institution Meal Plans 2021-22 2022-23 $ Change % Change Contracts
Madison → Operational Fee (paid by all students in residence halls) $2,100 $2,100 $0 0.0%→ Tier 1 (approx 9 meals/week required minimum) $1,500 $1,700 $200 13.3% 2,416 → Tier 2 (approx 13 meals/week) $2,000 $2,200 $200 10.0% 3,818
Tier 3 (approx 20 meals/week) $2,900 $3,300 $400 13.8% 2,335 Average Cost for the Majority of Students $3,850 $4,050 $200 5.2% 8,569
Milwaukee Premium Plan $4,922 $0 ($4,922)→ Standard Plan $4,189 $0 ($4,189)
Value Plan $3,456 $0 ($3,456)Commons Fee-East Tower $1,728 $0 ($1,728)Platinum Plan $4,974 $4,974 40
→ Gold Plan $4,274 $4,274 1,543 Silver Plan $3,974 $3,974 1,100
Average Cost for the Majority of Students $4,189 $4,274 $85 2.0% 2,683
Eau Claire → Platinum $3,180 $3,460 $280 8.8% 2,040 Upper Campus $2,860 $3,110 $250 8.7% 103 Lower Campus $2,934 $3,130 $196 6.7% 479 Declining Balance $2,740 $2,740 $0 0.0% 278
Average Cost for the Majority of Students $3,180 $3,460 $280 8.8% 2,900
Green Bay → Phoenix/All Access + $150 Dining Points $2,950 $3,050 $100 3.4% 502 Green 19 Meals/Week + $150 Dining Points $2,850 $2,950 $100 3.5% 89
→ UWGB 14 Meals/Week + $125 Dining Points $2,750 $2,850 $100 3.6% 276 Varsity 10 Meal Plan + $125 Dining Points $2,650 $2,750 $100 3.8% 37 Bay Block Combo Plan + $300 Dining Points $2,550 $2,630 $80 3.1% 151 Apartment Block Plan 1 + $50 Dining Points $930 $960 $30 3.2% 142 Apartment Block Plan 2 + $50 Dining Points $710 $730 $20 2.8% 116 Apartment Block Plan 3 + $50 Dining Points $430 $440 $10 2.3% 101
Average Cost for the Majority of Students $2,850 $2,950 $100 3.5% 1,414
La Crosse 14-Meal $2,638 ($2,638)→ All Access + $115 Dining Dollars $2,674 ($2,674)
All Access + $350 Dining Dollars $3,236 ($3,236)All Access + 50 Blocks $3,026 ($3,026)
→ Stricker Classic - 19 Meals + $115 MD $2,796 $2,796 2,567 Stricker Deluxe - 21 Meals + 30 Block + $150 MD $3,382 $3,382 345 45 Meal Plan - Reuter + $85 MD $896 $938 $42 4.7% 293 64 Block Plan(60 + 4) $896 $938 $42 4.7% 241 42 Block Plan((40 + 2) $626 $626 66 20 Block Plan $314 $314 199
Average Cost for the Majority of Students $2,674 $2,796 $122 4.6% 3,711
Appendix BUniversity of Wisconsin System
2022-23 Academic Year Meal Plan Rates
→ Meal plan rate used in calculation of average cost for the majority of students. 67

EstimatedFY23 Fall
Institution Meal Plans 2021-22 2022-23 $ Change % Change Contracts
Appendix BUniversity of Wisconsin System
2022-23 Academic Year Meal Plan Rates
Oshkosh → Classic $3,230 $3,360 $130 4.0% 854 → All Access $3,430 $3,560 $130 3.8% 902
Ultimate Bronze $870 $900 $30 3.4% 35 Ultimate Silver $2,100 $2,190 $90 4.3% 198 Ultimate Gold $3,120 $3,250 $130 4.2% 119 Ultimate Platinum $3,790 $3,950 $160 4.2% 44
Average Cost for the Majority of Students $3,330 $3,460 $130 3.9% 2,152
Fond du Lac Ultimate Fond du Lac (130) $0 $2,500 $2,500 10
Fox Valley Ultimate Fox (130) $0 $2,500 $2,500 60
Parkside → Plan 1-Parkside Plan $2,856 $2,900 $44 1.5% 334Plan 2-Ranger Plan $3,148 $3,262 $114 3.6% 127Plan 3-Green & Black Plan $3,412 $3,496 $84 2.5% 78Plan 4-Parkside Plus Plan $3,730 $3,822 $92 2.5% 35
Average Cost for the Majority of Students $2,856 $2,900 $44 1.5% 574
Platteville Minor Flex Plan $2,940 $3,000 $60 2.0% 418→ Major Flex Plan $3,160 $3,220 $60 1.9% 1433
Mega Flex Plan $3,380 $3,440 $60 1.8% 336Premium Flex Plan $3,580 $3,640 $60 1.7% 185Junior/Senior Small $2,180 $2,180 $0 0.0% 135Junior/Senior Large $2,380 $2,380 $0 0.0% 105Commuter Small $1,380 $1,380 $0 0.0% 137Commuter Large $1,580 $1,580 $0 0.0% 95
Average Cost for the Majority of Students $3,160 $3,220 $60 1.9% 2,844
River Falls 120 Block $2,562 $2,664 $102 4.0% 254 19 Meal Plan $2,658 $2,712 $54 2.0% 513
→ 14 Meal Plan $2,572 $2,650 $78 3.0% 1,115 60+ Block $930 $958 $28 3.0% 232 All-Access Plan $2,988 $3,078 $90 3.0% -
Average Cost for the Majority of Students $2,572 $2,650 $78 3.0% 2,114
Stevens Point 19 Meals per week +$100 Dawg Dollars $3,650 $3,500 ($150) -4.1% 132 → $1,225 Dawg Dollars $3,200 ($3,200)
14 Meals per week (RA only meal plan) $3,100 ($3,100)14 Meals per week +$275 Dawg Dollars $3,500 $3,500 133 10 Meals per week +$550 Dawg Dollars $3,500 $3,500 795
→ $1,300 Dawg Dollars $3,500 $3,500 1,590 Average Cost for the Majority of Students $3,200 $3,500 $300 9.4% 2,650
→ Meal plan rate used in calculation of average cost for the majority of students. 68

EstimatedFY23 Fall
Institution Meal Plans 2021-22 2022-23 $ Change % Change Contracts
Appendix BUniversity of Wisconsin System
2022-23 Academic Year Meal Plan Rates
Stout Plan 1 $2,388 ($2,388)→ Blue & White (Formerly Plan 2) $2,588 $2,768 $180 7.0% 628
Plan 3 $2,788 ($2,788)Clock Tower $3,068 $3,068 487 Plan 4 $2,988 ($2,988)Blaze (Formerly Plan 5) $3,188 $3,368 $180 5.6% 469 Plan 6 $3,388 $3,388 $0 0.0%
→ Blue Devil $3,668 $3,668 1,054 Stout $3,968 $3,968 215
Average Cost for the Majority of Students $3,038 $3,218 $180 5.9% 2,853
Superior Superior Plan $3,274 $3,339 $65 2.0% 150 → Black & Gold Plan $2,772 $2,940 $168 6.1% 350
1570 Point Plan $3,253 $3,318 $65 2.0% - Average Cost for the Majority of Students $2,772 $2,940 $168 6.1% 500
Whitewater Board-Mega Point $4,264 ($4,264)Board-Full Point $2,914 $3,016 $102 3.5% 80 Board-10 Meal + $50 $2,624 $2,712 $88 3.4% 400 Board-10 Meal + $100 $2,724 $2,812 $88 3.2% 240
→ Board-14 Meal + $50 $2,670 $2,760 $90 3.4% 1,400 Board-14 Meal + $100 $2,770 $2,860 $90 3.2% 360
→ Board-19 Meal + $50 $2,732 $2,824 $92 3.4% 600 Board-19 Meal + $100 $2,832 $2,924 $92 3.2% 225 Board-24 Meal + $50 $2,798 $2,892 $94 3.4% 275 Board-24 Meal + $100 $2,898 $2,992 $94 3.2% 50
Average Cost for the Majority of Students $2,701 $2,792 $91 3.4% 3,630
→ Meal plan rate used in calculation of average cost for the majority of students. 69

APPENDIX C 2019-20 to 2021-22 AUXILIARY BALANCE TRANSFERS
In May 2020, interim COVID-19 waivers were approved by President Cross to two Regent Policies, and three Administrative Policies. One waiver provided the flexibility to transfer auxiliary fund balances between auxiliary operations and to other funding sources to address financial needs resulting from the COVID-19 pandemic if the transfer didn’t adversely affect future rates charged by the auxiliary operation. This waiver expired in June 2020.
In February 2021 Resolution 11584 revised Regent Policy Document (RPD) 21-1, Internal Management Flexibility of Auxiliary Funds. RPD 21-1 delegates authority to the UW System President and the President’s designee(s) to approve the transfer of unanticipated auxiliary fund balances from one auxiliary operation to other operations, or across operations within the institution. These transfers must be reported to the Board of Regents.
Below is a summary of the transfers that have occurred to date.
Fiscal Year 2019-20 Campus Transfer From Amount Transfer To Purpose
Platteville Dining $600,000
Tuition Tuition and COVID
Losses Textbooks $275,000 Housing $200,000 Printing/Postal Svcs. $100,000
Total $1,175,000
River Falls Housing $300,000
Tuition Operating Losses and
COVID Costs
Dining $200,000 Recreation $100,000 University Center $100,000 New Student Prgms. $40,000 Textbooks $15,000 Library Course Fee $10,000 Athletics $5,000
Total $770,000
Whitewater Housing $1,549,463 Tuition and General
Operations
Operating Losses and COVID Costs Dining $560,331
Total $2,109,794
70

Fiscal Year 2020-21 Campus Transfer From Amount Transfer To Purpose
Eau Claire University Center $3,000,000 Facilities Loan for Architect & Engineering Costs for
Science Building Green Bay Dining $617,609 Central
Campus Aux. Account
Operating Loses and COVID Costs Housing $400,786
Total $1,018,395 Milwaukee Waukesha Bookstore $312,012 Multiple Aux.
Operations Eliminate Negative
Balances and Remodel Student Services Space
Washington Bookstore $82,254 Multiple Aux. Operations
Eliminate Negative Balances
Total $394,266 Stout Textbooks $2,000,000 Tuition Scholarships
Fiscal Year 2021-22 Green Bay Housing $796,897
Central Campus Aux
Account
Campus Strategic Priorities including Student Success,
Student Recruitment and Retention,
Inclusivity and Digital Transformation
Union $164,983 Golf Course $39,178 Sheboygan Dining $29,576
Marinette Dining $8,238 Total $1,038,872
Stout Textbooks $2,700,000 Tuition Scholarships
71

06/02/2022
Page 1 of 2
BOARD OF REGENTS OF THE UNIVERSITY OF WISCONSIN SYSTEM
II. All Regents Friday, June 10, 2022 8:45 a.m.
Helen Bader Concert Hall (Room 220) Zelazo Center
2419 E. Kenwood Boulevard Milwaukee, Wisconsin
1. Calling of the Roll
2. Declaration of Conflicts
3. Report and approval of actions taken by the Education Committee
4. Report and approval of actions taken by the Capital Planning & Budget Committee
5. Report of the Research, Economic Development & Innovation Committee
6. Report and approval of actions taken by the Audit Committee
7. Report and approval of actions taken by the Business & Finance Committee
8. Presentation: Annual NCAA Division I Athletics Report—UW-Milwaukee
9. Presentation of Board of Regents 2022 Academic Staff Excellence Awards
• Ms. Robin Jens, Assistant Dean of Student Services, College of Nursing, and Interim Student Service Director, Zilber School of Public Health, UW-Milwaukee
• Ms. Ann Lawton, Violence Prevention Coordinator, Lecturer in Art, and Art Therapist, Student Health and Counseling Services, UW-River Falls
• Center for Excellence in Teaching and Learning, UW-Eau Claire
10. Review and approval of Board of Regents regular meeting schedule
11. Resolution of appreciation for Regent Emeritus Corey Saffold’s service on the UW System Board of Regents
12. Resolution of appreciation for Regent Emeritus Michael Grebe’s service on the UW System Board of Regents
13. Remarks by the outgoing President of the Board
14. Annual election of officers of the Board of Regents

Page 2 of 2
15. Resolution of appreciation to UW-Milwaukee for hosting the June 2022 meeting
16. Regent communications, petitions, and memorials
17. Optional Closed Session
Adjourn The closed session agenda for Thursday, June 9, 2022, may also be considered on Friday, June 10, 2022, as the Board’s needs may dictate. In addition, the Board may reconvene in open session regarding matters taken up in the closed session, including voting, where applicable.

Page 1 of 4
Board of Regents Friday, June 10, 2022
Item II.8.
UW-MILWAUKEE NCAA DIVISION I ATHLETICS 2021-22 REPORT
REQUESTED ACTION
This item is for discussion purposes only.
SUMMARY
UW-Milwaukee sponsors 15 sports, providing an opportunity for more than 300 student- athletes to participate in NCAA Division I athletics. The University participates in the Horizon League, which includes eleven public and private institutions that participate in Division I athletics.
UW-Milwaukee’s Director of Intercollegiate Athletics reports directly to the Vice Chancellor of Student Affairs for day-to-day operations and strategic planning. The Director reports to the Chancellor for issues related to long-term strategic development and external relations.
Financial Situation
The Athletics Department reported $7,086,721 in actual revenues and $7,043,971 in expenses in 2020-21, resulting in an operating surplus of $42,750. The report notes that the program has an unrestricted fund balance of $41,325 of actual expenditures for the 2021-22 fiscal year. This surplus balance is the remainder of a one-time distribution from the NCAA that is budgeted to be spent in FY 2022.The NCAA designated how these funds could be used.
UW-Milwaukee held $6,118,658 in cash at the end of FY 2021 for the Klotsche Annex that has been enumerated, with a projected completion date of December 2, 2022. UW- Milwaukee also reports the Athletics Department had outstanding Program Revenue debt of $5,314,993, with debt service payments of $1,500,544 in the 2021-22 fiscal year. This outstanding debt is related to the construction of the Pavilion completed in 2006.
The report describes how UW-Milwaukee’s Athletics Department accumulated operating debt of nearly $11 million between FY 2000 and FY 2014 due to increased costs during that time. The institution made a commitment to first stabilizing the annual operating budget and debt, which it has accomplished every year since FY 2015. The institution began to

Page 2 of 4
reduce the historic operating debt in FY 2017 with contributions from both campus and athletic funds. The institution reports the historic debt was less than $5 million at the end of FY 2021 and will be less than $2 million at the end of FY 2022. UWM and Athletics plan to fully discharge the debt in FY 2023.
Academics
The Athletics Department uses various means to monitor the academic progress of student-athletes including the Academic Progress Rate, the Graduation Success Rate, and the Federal Graduation Rate.
Academic Progress Rate. The Academic Progress Rate (APR) is a term-by-term calculation of the eligibility and retention of all student-athletes. A score of 1000 means every student- athlete on a particular team remained eligible and returned to school. Teams lose points for student-athletes who are not eligible and/or are not retained.
The NCAA’s 2019-20 Academic Progress Rate Report showed that UW-Milwaukee achieved a multiyear APR above 930. Under NCAA rules, teams must maintain a minimum multiyear APR above 930 to participate in postseason competition. Single-year APRs ranged from 865 to 1000, with four of the thirteen sports teams achieving an APR of 1000. Multiyear APRs ranged from 957 to 1000, with four teams achieving an APR of 1000.
UW-Milwaukee also monitors and compares the institution’s multi-year APR score for each sport to the APR score for all Division I institutions for each sport, as well as to the average scores at other Horizon League institutions in each sport.
Graduation Rates. UW-Milwaukee uses the Federal Graduation Rate (FGR) and the Graduation Success Rate (GSR) to monitor student-athlete graduation rates. The FGR is compiled by the U.S. Department of Education and measures the percentage of first-time, full-time freshmen who graduate within six years of entering their original four-year institution. The GSR differs from the FGR in that it excludes from the denominator those student-athletes who leave the institution in good academic standing and includes in the numerator those who transfer into the institution and go on to graduate.
UW-Milwaukee uses three benchmarks related to the FGR to monitor student-athlete graduation rates. The institution expects student-athletes to (1) maintain a student-athlete FGR that is greater than that of the general student body; (2) maintain a student-athlete FGR greater than 75%; and 3) maintain an FGR that is greater than the average for the Horizon League. UW-Milwaukee’s student-athletes met two of these benchmarks with an FGR of70% in 2020-21 for the 2014-2015 Freshman Cohort, compared to 46% for all UW-Milwaukee students and 66% for Horizon League student-athletes.
Further, UW-Milwaukee expects student-athletes to achieve a GSR (1) greater than the average GSR for the Horizon League; and (2) greater than the GSR of students-athletes in

Page 3 of 4
the Horizon League for each sport. The GSR for UW-Milwaukee’s student-athletes was 91%, above the average GSR for the Horizon League Conference (87%). UW- Milwaukee’s GSR exceeded the average GSR in the Horizon League in six out of eleven sports.
UW-Milwaukee’s student-athletes are expected to maintain a minimum GPA of 3.0. The average GPA for student-athletes was 3.441 in the Fall 2020 and 3.376 in the Spring 2021. Incoming freshmen student-athletes had an average high school GPA of 3.46 and an average ACT score of 25, which was slightly higher than the ACT score of 22.44 of incoming freshmen overall.
NCAA Rules Compliance
UW-Milwaukee’s report includes a list of self-reported known or suspected violations of NCAA rules and regulations, including five self-reported violations in in 2020-21 and two in 2021-2022.
The report also includes a copy of the NCAA-required report on “Agreed-Upon Procedures” issued by UW System Administration’s Office of Internal Audit, for the year ended June 30, 2021.
Presenter
• Amanda Braun, UW-Milwaukee Director of Athletics
BACKGROUND
Collegiate athletics are high-profile activities that exist for the betterment of the student body, student-athletes, and the university. As some of the most visible programs at institutions of higher education, athletics provide valuable experiences for student- athletes, opportunities to engage the broader community and a public face for the institution. This visibility, as well as the number of student-athlete participants, the members of the public attending athletic events and the substantial compliance requirements, necessitates a high level of oversight and scrutiny by both administrators and governing bodies.
In 2012, the Association of Governing Boards of Colleges and Universities (AGB) issued a report, “Trust, Accountability, and Integrity: Board Responsibilities for Intercollegiate Athletics,” that highlighted the important role of higher education governing boards in providing proper oversight of athletics programs. That same year, the Board of Regents

Page 4 of 4
established a reporting framework for institutions that participate in NCAA Division I athletics.
Under the Regents’ Accountability Reporting Framework, each UW System Division I athletics program is required to provide information to the Board annually describing the extent to which the program: 1) adheres to any performance standards implemented by an institution or its athletic board; 2) safeguards the welfare of all students; 3) maintains NCAA compliance; and 4) assures fiscal integrity. The Accountability Reporting Framework provides the Board with consistent information about each NCAA Division I athletics program, enhancing the Board’s ability to effectively monitor the activities of UW System’s Division I athletics programs.
Related Policies
• Regent Policy Document 10-1, “Endorsement of the Statement of Principles from the
Knight Foundation Commission on Intercollegiate Athletics” • Accountability Reporting Framework for Board of Regents Oversight of NCAA
Intercollegiate Athletics Programs
ATTACHMENTS
A) 2021-22 UW-Milwaukee’s Athletics Annual Report Presented to UW Board of Regents

ATHLETICS ANNUAL REPORT P R E S E N T E D T O U W B O A R D O F R E G E N T S
TABLE OF CONTENTS INTRODUCTORY SECTION PAGE(S)
Athletic Department and UWM Mission Statement 1-2 NCAA Classification 2-3 Description of Athletics’ Role at UWM 4 2021-2022 Athletics Year in Review 4-6 Reporting Structure for Director of Athletics 6
FINANCIAL INFORMATION PAGE(S)
2021-22 Athletic Budget Report 7 2020-21 Athletic Budget vs. Actual Results 8 Year-end Unrestricted Fund Balances 9 External Audit Reports 9 Capital Reserve 9 Total Outstanding Debt and Annual Debt Service Requirements 10 Value of Endowments and Foundation Balances for Athletics 10 Historic Operating Debt 11 ACADEMIC PROGRESS RATE (APR) DATA PAGE(S)
2019-20 APR Scores 12 Three-year APR Trend for Highest Revenue Sports 13 Benchmarks Used by Athletics to Assess APR Data 13 GRADUATION SUCCESS RATE (GSR) AND OTHER ACADEMIC/ADMISSIONS DATA PAGE(S)
2020-21 GSR Scores (2014 freshmen cohort) 14-15 Three-year Federal Graduation Rate Trends 16-17 Admission of Student-Athletes 17 Student-Athlete Grade Point Averages 18-20 Declared Majors of Student-Athletes 20-22 Benchmarks Used by Athletics to Assess GSR, Academic and Admissions Data 23
AGREED UPON PROCEDURES REPORT PAGE(S)
2020-21 Institutional Agreed Upon Procedures Report 24
INTERCOLLEGIATE ATHLETICS BUDGET REPORT PAGE(S)
UWM’s Audited NCAA Financial Report for 2020-21 25
OUTSIDE COMPLIANCE REVIEW PAGE(S)
Horizon League Compliance Review 26
NCAA VIOLATIONS REPORT PAGE(S)
2021-22 & 2020-21 Self-Reported NCAA Violations 27-28
ATTACHMENTS – PAGE 29

1
INTRODUCTORY SECTION
ATHLETIC DEPARTMENT MISSION AND VISION STATEMENTS
IT IS OUR MISSION TO:
PROMOTE a spirit and pride in the University through positive athletic experiences for student-athletes, coaches and spectators.
EMBRACE the academic purpose of UWM while achieving athletic excellence.
MAINTAIN an athletics program of high quality through attracting, retaining and developing the best student-athletes, coaches and staff.
ENGAGE students, faculty, staff, alumni and the surrounding community.
IT IS OUR VISION TO:
BUILD A PASSIONATE AND PROUD UNIVERSITY OF WISCONSIN-MILWAUKEE THROUGH CHAMPIONSHIP EXPERIENCES IN ACADEMICS, ATHLETICS AND LEADERSHIP.
CHAMPIONSHIP EXPERIENCES IN ACADEMICS represent the achievement of the highest standards in an academic environment conducive to the success and personal development of our student-athletes.
CHAMPIONSHIP EXPERIENCES IN ATHLETICS represent the highest standards of the Horizon League and the NCAA. Our achievements encourage a culture of excellence consistent with that of the University.
CHAMPIONSHIP EXPERIENCES IN LEADERSHIP represent a commitment to personal and team achievements and to service in our community by student-athletes, coaches and staff.
With PASSION and PRIDE we portray our spirit to the University and beyond.
UWM MISSION STATEMENT
UWM Select Mission Statement:
To fulfill its mission as a major urban doctoral university and to meet the diverse needs of Wisconsin’s largest metropolitan area, the University of Wisconsin–Milwaukee must provide a wide array of degree programs, a balanced program of applied and basic research, and a faculty who are active in public service. Fulfilling this mission requires the pursuit of these mutually reinforcing academic goals:
(a) To develop and maintain high quality undergraduate, graduate and continuing education programs appropriate to a major urban doctoral university.
(b) To engage in a sustained research effort which will enhance and fulfill the University’s role as a doctoral institution of academic and professional excellence.

2
(c) To continue development of a balanced array of high quality doctoral programs in basic disciplines and professional areas.
(d) To attract highly qualified students who demonstrate the potential for intellectual development, innovation, and leadership for their communities.
(e) To further academic and professional opportunities at all levels for women, minority, part-time, and financially or educationally disadvantaged students.
(f) To establish and maintain productive relationships with appropriate public and private organizations at the local, regional, state, national, and international levels.
(g) To promote public service and research efforts directed toward meeting the social, economic and cultural needs of the state of Wisconsin and its metropolitan areas.
(h) To encourage others from institutions in the University of Wisconsin System and from other educational institutions and agencies to seek benefit from the University’s research and educational resources such as libraries, special collections, archives, museums, research facilities, and academic programs.
(i) To provide educational leadership in meeting future social, cultural, and technological challenges.
NCAA CLASSIFICATION
The University of Wisconsin-Milwaukee and its predecessor institutions have offered some form of intercollegiate athletics for over 100 years. (Reflects sport sponsorship figures for 2020-21) Currently, UWM offers 15 sports at the NCAA Division I level, with more than 300 student-athletes in the sports of men’s and women’s basketball, men’s and women’s soccer, men’s and women’s cross country, men’s and women’s indoor and outdoor track and field, men’s and women’s swimming and diving, women’s volleyball, women’s tennis and baseball. UWM moved all of its sports back into Division I in 1990 and previously had placed its sports at the NCAA Division I, II and III levels, as well as in the NAIA, the AIAW and the NCAA’s “Small College” division.
Over the years, UWM has had three main conference affiliations – the Wisconsin State University Conference/Wisconsin Women’s Intercollegiate Athletic Conference, the Mid-Continent Conference and the Midwestern Collegiate Conference/Horizon League. Men’s soccer has always had Division I status with the NCAA.
SPORT # OF MALE STUDENT-ATHLETES
# OF FEMALE STUDENT-ATHLETES
BASEBALL 43 -
BASKETBALL 17 17
CROSS COUNTRY 19 17
SOCCER 21 36
SWIMMING 34 38
TENNIS - 9
TRACK INDOOR/OUTDOOR 50/50 56/56
VOLLEYBALL - 14
TOTALS 234 (49.1%) 243 (50.9%)
Chart reflects the duplicated count of cross country, indoor & outdoor track.
3
There are a number of sports UWM has offered over the years that it does not offer anymore. Most notably, UWM had a football team through 1974 and won a number of WSUC championships. The school has also offered wrestling, men’s tennis and men’s volleyball, among other sports. For more than a decade, UWM has been a dominant and successful presence in the Horizon League. The school has captured the league’s all-sports award – the McCafferty Trophy – seven times. On the national stage, the men’s basketball team advanced to the Sweet 16 of the NCAA Tournament in 2005 and to the second round of the tournament in both 2006 and 2014. In addition, the men’s and women’s soccer teams have been ranked in the top 10 nationally. In the classroom, Panther student-athletes have posted a combined 3.0 grade point average for 42 straight semesters following the 2020-2021 academic year.
HORIZON LEAGUE
In its 43rd season of operation in the 2021-2022 academic year, the Horizon League continues to aspire toward its goal of being one of the nation’s leading athletics conferences while being recognized as a leader in integrity and the development of students. Each of the League’s 3,000 Division I student-athletes has the opportunity to maximize athletic development and academic achievement, while also serving the broader community and growing in personal responsibility and accountability. Through athletics, the 190,000-plus undergraduates among Horizon League institutions have the opportunity to come together, learn and grow in life skills and opportunities.
The Horizon League membership features eleven public and private institutions that have impressive academic reputations and a storied tradition of broad-based athletic programs. Membership includes Cleveland State University, the University of Detroit Mercy, Indiana University-Purdue University Indianapolis, Northern Kentucky University, Oakland University, Purdue University Fort Wayne, Robert Morris University, the University of Wisconsin-Green Bay, the University of Wisconsin-Milwaukee, Wright State University and Youngstown State University.
The Horizon League’s primary focus is on adding value to the educational experience through its core values: student-athlete well-being, integrity, respect and stewardship. It is the League’s belief that athletics is a powerful and visible resource tool that can be used to enhance student-athletes’ collegiate experience. The Horizon League’s goals are to enhance the holistic university experience for the student-athlete, to create an affiliation of institutions with similar athletic goals, and to adhere to the principles of integrity, diversity, excellence and growth. The Horizon League sponsors competition in 19 sports - nine for men (baseball, basketball, cross country, golf, soccer, swimming and diving, indoor track and field, outdoor track and field and tennis) and 10 for women (basketball, cross country, golf, soccer, softball, swimming and diving, indoor track and field, outdoor track and field, tennis and volleyball).
The League receives automatic bids to NCAA championships in baseball, men’s and women’s basketball, men’s and women’s golf, men’s and women’s soccer, softball, men’s and women’s tennis, and women’s volleyball. The Horizon League is headquartered in Indianapolis, the “Amateur Sports Capital of the World,” with offices in the JF Wild Building (129 E. Market Street) located just minutes from Bankers Life Fieldhouse, Lucas Oil Stadium, the State Capitol Building, Victory Field (home of the Indianapolis Indians, AAA affiliate of the Pittsburgh Pirates) and the NCAA national office.
Julie Roe Lach is in her second year as Commissioner of the Horizon League, having been named to the position on Jan. 1, 2021. She is the sixth commissioner in League history, succeeding Jonathan B. LeCrone who served as the conference commissioner for 28 years (1992-2020). Roe Lach is in her eighth year overall with the Horizon League, joining as Deputy Commissioner in August 2014.

4
DESCRIPTION OF ATHLETICS’ ROLE AT UWM
The Athletics Department at UWM provides NCAA Division I competition for over 300 students in 15 varsity sports. Gifted student-athletes are attracted to the university because of these programs, and their talents are added to the diverse gifts of the student body. Besides adding to the diversity of the community, the intercollegiate athletics programs add distinction and identity to the University.
The value of an NCAA Division I Athletics program is reflected in the financial support the students and University provides. Tuition fee remissions, and room and board waivers are examples of campus resources used for daily operation of the Athletics Department.
UWM student-athletes compete in over 250 athletic contests each year, representing the University in Horizon League and NCAA championship events. This adds value to the University brand and provides entertainment and gathering opportunities for students, faculty, staff, alumni and friends of the University. Over the past four years, an annual average of 10,000 students attended athletic contests and promotional events. As UWM continues to evolve as a residential campus, the intercollegiate athletics programs will become an even more important force for driving enrollment and attracting positive interaction for the community.
UWM student-athletes are excellent role models for all students through their performance in the classroom. With 42 consecutive semesters of collectively achieving a better than 3.0 grade point average and a graduation rate of over 91%, Panther athletes demonstrate excellence in the classroom, while achieving championship results in the athletic arena.
The Intercollegiate Athletics programs at the University of Wisconsin-Milwaukee provide a shining example of academic and athletic excellence in a proud and passionate environment. Add to this the lessons learned in preparation for and participation in competition by the student-athletes, the role of athletics at UWM is entirely consonant with the Mission and Core Values of the University and the Department of Athletics.
2021-2022 ATHLETICS YEAR IN REVIEW
Milwaukee Athletics continues to excel on and off the field and did so again during the 2021-2022 academic year. The Panthers head into the spring season – and the final championships of the school year – in first place in the race for the 2022 McCafferty Trophy, given to the all-sports champion of the Horizon League. If the program can maintain its lead, it would claim the eighth McCafferty Trophy in school history – and a chance to extend its league record in that category as well. Highlighting the way has been a group of three teams to have claimed regular-season or Horizon League Tournament titles as well as four program to finish as league runner-ups. The fall featured championship runs from two programs, starting with volleyball claiming its first Horizon League regular-season title since 2013 with a 16-2 mark, part of a 22-9 campaign overall. Ari Miller was named Horizon League Player of the Year and Offensive Player of the Year and became the program’s first All-American since 2011. Rylie Vaughn earned Horizon League Setter of the Year honors, Madi Malone was named Freshman of the Year, and Carmen Heilemann also joined the trio on All-League First Team. The four Panthers on First Team marks the most for Milwaukee since 2011.

5
Women’s soccer once again took the program to even bigger heights, finishing 19-2 overall while advancing to the second round of the NCAA Tournament before being eliminated in a heartbreaking 2-0 loss to No. 2 Virginia. The Panthers claimed their sixth regular-season championship in the past seven years with an unblemished 11-0 conference record and put together the best season in program history on both sides of the ball. The 19-2 record also finished second in the nation in winning percentage (.905). Elaina LaMacchia was named the first All-American for the program since 2011 after leading the country with her 0.42 goals-against average. She was named Horizon League Goalkeeper of the Year, joining teammate Mackenzie Schill with top honors, as Schill was named the Horizon League Player of the Year, as well as the Offensive Player of the Year. Lastly, Rachel Phillpotts was selected as the Defensive Player of the Year. In all, seven different student-athletes were selected for postseason honors: Schill, Phillpotts, LaMacchia, and Gaby Schwartz were Horizon League First-Team members, Jelena Sever was named to the Second-Team, and Clara Broecker and Kat Van Booven were picked for the All-Freshman Team. Sever also made history when she broke the NCAA record and went viral when she scored on the opening kickoff against Youngstown State, hitting the back of the net just :03 after the whistle. Schwartz and Schill were named members of the 2021 Academic All-America® Division I Women's Soccer Team, the highest academic honor possible in NCAA Division I women's soccer. The duo become the 24th and 25th Academic All-Americans in Milwaukee Athletics history. Following an impressive undefeated dual season (7-0 overall, 3-0 in league) the Panthers women’s swimming & diving team earned a runner-up finish at the Horizon League Championships. Overall, the two teams sent 32 to the A-finals along with 36 more to the B-finals over the course of the championships. For the women, McKenzie Sanchez took home a pair of second-place finishes on the boards while Makaila Scheiblein was runner-up in the 200 breaststroke. Bella Passamani recorded a trio of sixth-place finishes in the 200 butterfly, 100 fly, and 500 freestyle. On the men’s side, Jared Kleczka recorded a third-place finish on the three-meter board and fourth on the one-meter. Jay Jensen put together a strong performance, finishing sixth in the 1650 free and adding two B-final runner-up finishes in the 500 free and 400 IM, while Ben Lorenz broke the freshman record in the 50 free. At the Horizon League Indoor Track & Field Championships, both the men’s and women’s teams earned a runner-up finish. As a whole, Milwaukee claimed eight individual titles and 20 podium finishes. On the men’s side, Austin Wallace was named Championship Outstanding Performer for the field events after collecting titles in both the heptathlon and long jump. Sam Conger won the 60-meter hurdles while Gracien Jules took gold in the shot put. For the women, Natalie Block earned Horizon League Indoor Athlete of the Year and Championship Outstanding Performer honors following a pair of titles in the pentathlon and 60-meter hurdles along with a runner-up finish in the 400-meter. In the field events, Kate Watson (pole vault) and Lauren Lietzke (shot put) earned individual titles. This spring, the women’s tennis program enjoyed a spectacular run to the Horizon League Championship, falling in a 4-3 nail biter in its first-ever title match appearance. This marked the third time in four seasons that Milwaukee – led by First-Team All-Horizon League selection Mayya Perova (19-5 overall) – made a tournament appearance, and the first time the Panthers made it to the Championship round. Success was not limited to the court or field, however, as Milwaukee student-athletes continued to participate in community service activities and have been working hard to grow those hours back to pre-pandemic levels. In the classroom, the Panthers posted a cumulative grade-point average of 3.00 or higher for a remarkable 42 consecutive semesters (the current spring semester will make 43). This year's accomplishments add to a long storyline of success in Panther athletics. Milwaukee first broke through in winning the McCafferty Trophy following the 2000-01 school year and then claimed the award in three straight years from 2004-06. Milwaukee also won the all-sports honor in 2009, 2012 and 2014. On the women's side, MKE has won the league award 14 times in the last 21 years.

6
SUCCESS IN THE CLASSROOM
• The Panthers averaged over 172 student-athletes on both the fall and spring league honor rolls during 2020-21.
• The cumulative GPA for all Panther student-athletes is 3.449 – also making it 42 straight semesters where the departmental GPA is above 3.0 as well as 13 consecutive semesters over 3.20.
• Graduation success rate was at 91%, well above the percentage for the general student population. • Student-Athletes log many hours of community service in Milwaukee and the surrounding area. Teams
volunteer for community activities like Make a Difference Day, United Way, Junior Achievement, Team IMPACT, Operation Dream and the United Lutheran Soup Kitchen, among dozens of other agencies. The Athletics Department also partners with the Center for Community-Based Learning, Leadership and Research.
MCCAFFERTY TROPHY WINNERS 2001, 2004, 2005, 2006, 2009, 2012, 2014 HORIZON LEAGUE WOMEN'S ALL-SPORTS AWARD 2001, 2002, 2003, 2004, 2006, 2007, 2008, 2009, 2010, 2012, 2014, 2019, 2020, 2021 HORIZON LEAGUE MEN'S ALL-SPORTS AWARD 2000, 2005, 2006
REPORTING STRUCTURE FOR DIRECTOR OF ATHLETICS
The Director of Intercollegiate Athletics at the University of Wisconsin–Milwaukee reports directly to the Vice Chancellor of Student Affairs regarding the day-to-day operations and strategic planning for the department. For long-term strategic development and external relations, including league and donor connections, the Director of Athletics reports via dotted line to the Chancellor. The Director of Intercollegiate Athletics represents the Department of Athletics by sitting on both the Chancellor’s Cabinet and the Vice Chancellor of Student Affairs Cabinet.
In addition, the UWM Director of Intercollegiate Athletics is an ex-officio member of the UWM Athletic Board. The UWM Athletic Board is made up of 13 elected or appointed faculty, academic staff, and student members. The Athletic Board meets monthly and takes an active role in providing oversight to the operations of the entire UWM athletics program.

7
FINANCIAL INFORMATION
The Athletics Budget information on the next two pages includes only the revenues and expenses that are listed in the UW System financial reporting statements. One chart shows the budget for FY 2022 while the second chart is a comparison of FY 2021 budget vs. actuals. Neither of these include UWM Foundation deposits and payments, in-kind donations, waivers for tuition, books, and room and board, and University indirect facilities and maintenance expenses. Those revenues and expenses are capture in the NCAA Financial Report audited annually. See Attachment B for the year-end June 30, 2021 NCAA Statement of Revenues and Expenses, which captures all UWM Athletics’ financial transactions (including the below items) associated with operations.
2021-2022 UNIVERSITY OF WISCONSIN - MILWAUKEE BUDGET REPORT
REVENUE FY 22 BUDGET Student Fees $ 6,024,776 `
101 Funding $ 211,328 NCAA & Conference Distributions $ 540,000 Development $ 613,000
Corporate Sponsorships $ 280,000 Ticket Sales $ 290,000 Game Guarantees $ 185,000 228 Capital Transfer $ 0 One Time Campus Distribution $ 300,000 Other Revenue $ 50,000 TOTAL REVENUE $ 8,494,104 EXPENSES FY 22 BUDGET 128 Salaries and Fringe Benefits $ 4,572,816
101 Salaries and Fringe Benefits
$ 211,328
128 Operating Expenses Team Expenses $ 1,470,715 Support Services Expenses $ 726,779 Game Operation Expenses $ 615,000
101 Operating Expenses $ 0 Capital $ 0 Athletic Student Aid $ 560,000 Indirect Expenses $ 307,459 TOTAL EXPENSES $ 8,464,097 Fiscal Year Operating Net $ 30,007

8
PREVIOUS FISCAL YEAR BUDGET vs. ACTUAL RESULTS
*This Fiscal Year Budget is the original budget approved in January of 2020. There were two other versions of budget adjustments shared with athletics throughout the COVID year. Spending was adjusted accordingly.
**Tuition fee waivers provided by the University and used as athletic student aid were $3,888,187 but are not included in the amount above.
2020-21 UNIVERSITY OF WISCONSIN - MILWAUKEE BUDGET REPORT
REVENUE FY 21 BUDGET* ACTUAL
Student Fees $ 6,241,349 $ 5,367,560
101 Funding $ 229,665 $ 198,976
NCAA & Conference Distributions $ 540,000 $ 592,855
Corporate Sponsorships $ 310,000 $ 390,725
Ticket Sales $ 347,000 $ 132,933 228 Capital Transfer $ 0 $ 0
Development $ 713,000 $ 224,982
Game Guarantees $ 185,000 $ 122,000 One Time NCAA Distribu�on $ 92,200 $ 84,053 Transfers $ 0 $ (75,000)
Other Revenue $ 71,000 $ 47,637
TOTAL REVENUE $ 8,729,214 $ 7,086,721
EXPENSES FY 21 BUDGET* ACTUAL
128 Salaries and Fringe Benefits $ 4,588,634 $ 4,031,867
101 Salaries and Fringe Benefits $ 229,665 $ 198,976
128 Operating Expenses Team Expenses $ 1,470,715 $ 938,659 Support Services Expenses $ 928,363 $ 671,688 Game Operations Expenses $ 565,000 $ 337,671
101 Operating Expenses $ (4,855) $ 0
Capital $ 0 $ 0
Athletic Student Aid $ 560,000 $ 594,281
Indirect Expenses $ 345,829 $ 270,829
TOTAL EXPENSES $ 8,683,351 $ 7,043,971
Fiscal Year Operating Net (Loss) $ 45,863 $ 42,750

9
YEAR-END UNRESTRICTED FUND BALANCES
Athletics Department year-end unrestricted fund balances = $41,325
This surplus balance is the remainder of a one-time distribution from the NCAA that is budgeted to be spent in FY 2022. The NCAA designated what these funds could be used for. The remaining unrestricted fund balance is $0.
*Note this balance is separate from the Historic Operating Debt outlined in this report on page 11.
EXTERNAL AUDIT REPORTS
An external audit of the NCAA’s Statement of Revenue and Expenses, for the year ending June 30, 2021, was performed by Brenda Hallman and Daniel Gyorog, of the UW System Office of Internal Audit. Please see Attachment A for the Independent Accountant’s Report on the Agreed-Upon Procedures.
CAPITAL RESERVE
The Department of Athletics has reserves held in a Fund 228 Capital Account. The reserve balance is a result of a Student Senate Finance Committee Resolution (SFC0910-002), signed on December 14, 2009. This resolution instituted a $25 per semester segregated fee for the purpose of approving a capital bonding project for Athletics. The resolution was further clarified by a Student Association Resolution Reaffirmation (SB1011-006), on June 7, 2010. The fee was reduced to $14.50 per semester beginning in FY 2016 and has continued at that rate to the present.
After several failed attempts in earlier biennia, in the 2021-2023 Capital Budget, UWM sought and obtained enumeration to build a new Klotsche Annex using $7,000,000 in Program Revenue Cash. The Klotche Center Annex will provide a new one-court gymnasium with co-ed student athletic lounge, film room, nutrition station, hall of history, and multi-purpose fitness/strength and conditioning areas. It will be located east of the existing Klotsche Center complex. The facility also received a donation from the Orthopaedic Hospital of Wisconsin that will enhance the facility and furnishings. As a result of that gift, the project budget was increased to $8,100,000. Design work began in May of 2020 and the project was approved for construction in February of 2021, with a projected completion of December 2, 2022. The segregated fee associated with the project is scheduled to end in FY 2022 as the full $7 million in segregated fees will have accumulated by the end of FY 2022.
Balance as of FY Year-End 2021: $6,118,658
FY21 Capital Projects: $454,000 toward the Klotsche Annex project FY22 Projected Expenditures: $5,770,387 toward the Klotsche Annex project FY23 Projected Expenditures: $775,613 toward the Klotsche Annex project

10
TOTAL OUTSTANDING DEBT & ANNUAL DEBT SERVICE
Total annual debt service = $1,500,544
Total debt outstanding = $5,314,993
The outstanding debt on facilities is a result of the construction of the Pavilion, which is a shared facility between Recreation Sports, Athletics, Academics, and Parking. Designated segregated fees and user fees (non-athletic fee) provides the resources for the annual payment of the debt service.
VALUE OF ENDOWMENTS AND FOUNDATION BALANCES FOR ATHLETICS
Value of Endowments dedicated to the support of athletics = $1,097,882
All endowed amounts are held in six scholarship funds and one non-scholarship fund:
Nicholas Family Scholarship
Kuehneisen Swim and Dive Scholarship
D & E Bogenschild “Green Gulls” Scholarship
Coach John Tierney Memorial Scholarship
Dexter Riesch Memorial Scholarship
Pete J. Corfeld Scholarship Fund
Chuck Hildebrand Baseball Fund
Athletics Department year-end unrestricted fund balances = $560,299
This amount is held in the UWM Foundation in three different accounts:
Development Revenue
Athletic Director’s Excellence
Panther Club

11
HISTORIC OPERATING DEBT
From around FY 2000 through the end of FY 2014, under prior UWM administration, UWM’s Department of Athletics accumulated a cumulative operating debt of nearly $11 million in Fund 128. The debt was due to significant changes taking place in Division 1 athletics which resulted in increased costs over that time. UWM as an institution and the Department of Athletics share responsibility for this historic operating debt. In 2014, UWM administration and the Department of Athletics committed to first balancing Athletics’ annual operating budget and thus stabilizing the growing debt, and then once the debt was stabilized, to reduce the historic operating debt over time. The historic operating debt was transferred to an account separate from operating funds for ongoing oversight and management. Consistent with the commitment made in 2014, Athletics stabilized the operating deficit and historic debt in FY 2015 and 2016. It then worked with UWM administration to pay off portions of the outstanding debt each year beginning in 2017. As a result, the historic debt was less than $5M at the end of FY 2021 and will be less than $2 million at the end of FY 2022. UWM and Athletics plan to fully discharge the debt in FY 2023.

12
ACADEMIC PROGRESS RATE (APR) DATA The NCAA holds Division I institutions accountable for the academic progress of their student-athletes through the Academic Progress Rate, a team-based metric that accounts for the eligibility and retention of each student-athlete, each term. Starting with the 2013-14 academic year data, in order to avoid penalty each team is required to earn a 4-year APR score of 930 or higher. The data is generally released to the public each spring by the NCAA. Due to COVID, the NCAA will not be publicly releasing the APR data for the 19-20 year until the summer of 2022. However, we do have our APR data for 2019-2020 that will made public in a few short months.
HOW TO CALCULATE APR SCORES: Each term, a scholarship student-athlete may earn one retention point for staying in school and one eligibility point for being academically eligible. A team’s total points are divided by points possible and then multiplied by one thousand to equal the team’s Academic Progress Rate. Please see Attachment C for the official 2019-20 Academic Progress Rate Report from the NCAA.
SPORT 2019-20 APR SCORE 4-YEAR APR SCORE NCAA 4-YR AVERAGE
BASEBALL 991 1000 Unavailable for 2019-2020
MEN’S BASKETBALL 865 957 Unavailable for 2019-2020
WOMEN’S BASKETBALL 1000 1000 Unavailable for 2019-2020
MEN’S CROSS COUNTRY 1000 1000 Unavailable for 2019-2020
WOMEN’S CROSS COUNTRY 984 1000 Unavailable for 2019-2020
MEN’S SOCCER 1000 977 Unavailable for 2019-2020
WOMEN’S SOCCER 991 987 Unavailable for 2019-2020
MEN’S SWIMMING 976 982 Unavailable for 2019-2020
WOMEN’S SWIMMING 986 990 Unavailable for 2019-2020
WOMEN’S TENNIS 1000 1000 Unavailable for 2019-2020
MEN’S TRACK 981 991 Unavailable for 2019-2020
WOMEN’S TRACK 988 993 Unavailable for 2019-2020
WOMEN’S VOLLEYBALL 1000 1000 Unavailable for 2019-2020

13
THREE-YEAR APR TREND FOR HIGHEST REVENUE SPORTS
The following lists the single year APR scores for the three highest revenue sports during the 2017-18, 2018-19 and 2019-20 academic years. Please see Attachment C for the official Academic Progress Rate Reports from the NCAA.
HIGHEST REVENUE SPORTS 2017-2018 2018-2019 2019-2020
MEN’S BASKETBALL 1000 960 865
BASEBALL 1000 984 991
WOMEN’S TRACK 1000 1000 988
BENCHMARKS USED BY ATHLETICS TO ASSESS ACADEMIC PROGRESS DATA
Benchmark #1: Maintain multi-year APR score that is at or higher than the all Division I score for each sport.
Benchmark #2: Achieve multi-year APR scores that are greater than average scores at other Horizon League institutions in each sport.
Note: We are unable to assess benchmark #2 for this report due to the 2019-2020 APR data for Horizon League institutions not being released until the summer of 2022. Attachment E is a list of Horizon League institutions and APR data from 2018-2019 (the latest year of released data).

14
GRADUATION SUCCESS RATE (GSR), ACADEMIC & ADMISSIONS DATA
What is the Graduation Success Rate? The NCAA Graduation Success Rate (GSR) is designed to show the proportion of student-athletes on any given team who earn a college degree. The NCAA has imposed a new set of academic standards that seeks to hold teams and institutions accountable for how well student-athlete progresses toward a degree.
The GSR was developed in response to colleges and universities who asked for an alternative rate that more accurately reflects the movement among college student-athletes. The GSR takes into account incoming transfers who graduate from a different institution than the one they started at and transfers who leave an institution in good standing. How does it differ from the Federal Graduation Rate? The Federal Graduation Rate (FGR) is compiled by the U.S. Department of Education and is used as an indicator of academic success for college student-athletes. FGR measures the percentage of first-time, full-time freshmen who graduate within six years of entering their original four-year institution. The NCAA developed its GSR in response to criticism that the FGR understates the academic success of athletes because the FGR method does not take into account two important factors in college athletics:
1. When student-athletes transfer from an institution before graduating and are in good academic standing (perhaps to transfer to another institution for more playing time, different major, or to go pro); and
2. Those student-athletes who transfer to an institution (e.g., from a community college or another 4-year college) and earn a degree.
The FGR treats transfers as non-graduates for the original institution the student-athlete attended, even if that student-athlete later graduates from another institution. Also, the FGR does not include that student-athlete in the graduation rates at the new institution where he/she does graduate. Therefore, once a student-athlete transfers to another school he/she is no longer recognized in the calculated graduation rate. The GSR takes into account both factors and gives credit to institutions for successful transfers, whether they are leaving or entering an institution. The following is a summary of the Graduate Success Rate report that was submitted during the 2020-21 academic year. Please see Attachment D for official Graduation Success Rate Report (2014 freshmen cohort) from the NCAA that was released in October, 2021.

15
2011-14 COHORT GSR SCORES
Below is a summary of the 2011-14 cohort Graduate Success Rate report. Please see Attachment D for official Graduation Success Rate Report from the NCAA that was released in 2021.
SPORT GRADUATION SUCCESS RATE FEDERAL GRADUATION RATE
BASEBALL 95 50
MEN’S BASKETBALL 100 71
WOMEN’S BASKETBALL 92 47
MEN’S SOCCER 79 50
WOMEN’S SOCCER 92 76
MEN’S SWIMMING 88 83
WOMEN’S SWIMMING 96 83
WOMEN’S TENNIS 100 67
MEN’S TRACK/CROSS COUNTRY 84 78
WOMEN’S TRACK/XC 94 81
WOMEN’S VOLLEYBALL 100 100

16
THREE-YEAR FEDERAL GRADUATION RATE TRENDS
The following is a summary of the Federal Graduation Rates for the University of Wisconsin-Milwaukee, reported during the 2018-19, 2019-20 and 2020-21 years. Please see Attachment D for official Graduation Success Rate Report from the NCAA.
SINGLE YEAR FEDERAL GRADUATION RATE FOR UWM STUDENT-ATHLETES
& UWM’S GENERAL STUDENT BODY
ACADEMIC YEAR
GENERAL UWM STUDENT BODY FEDERAL GRADUATION RATE
UWM STUDENT-ATHLETE FEDERAL GRADUATION RATE
2012 FRESHMEN COHORT (reported in 2018-19)
48% 75%
2013 FRESHMEN COHORT
(reported in 2019-20)
44% 78%
2014 FRESHMEN COHORT
(reported in 2020-21)
46% 70%
FEDERAL GRADUATION RATE FOR THREE HIGHEST REVENUE WOMEN’S SPORTS
HIGHEST REVENUE WOMEN’S SPORTS
2018-19 (2009-2012 cohort)
2019-20 (2010-2013 cohort)
2020-2021
(2011-2014 cohort)
WOMEN’S TRACK 81% 90% 81%
WOMEN’S SOCCER 62% 71% 76%
WOMEN’S SWIM & DIVE 67% 84% 83%

17
FEDERAL GRADUATION RATE FOR THREE HIGHEST REVENUE MEN’S SPORTS
ADMISSION OF STUDENT-ATHLETES
Student-athletes admitted to UWM are expected to meet the same academic standards as other admitted students. Student-athletes are also, in general, expected to follow the same application process and adhere to the same deadlines as other applicants. However it is understood that in some cases, prospective student-athletes whom UWM wishes to recruit may not be identified, or may not make the decision to apply to UWM, until very late in the admissions cycle. In such cases, the office of admissions should be contacted about the student-athlete (name and contact information) so that the application process can be initiated.
- Policy updated in April 2015
Admissions Data
Average Incoming Freshman High School GPA
Average Incoming Freshman ACT Score
Student-Athletes 3.46 25
General Student Body Not available 22.44
HIGHEST REVENUE MEN’S SPORTS
2018-19 (2009-2012 cohort)
2019-2020 (2010-2013 cohort)
2020-2021
(2011-2014 cohort)
MEN’S BASKETBALL 43% 71% 71%
BASEBALL 56% 53% 50%
MEN’S TRACK 74% 79% 78%

18
GRADE POINT AVERAGE INFORMATION
GRADE POINT AVERAGE FOR ALL STUDENT-ATHLETES DURING THE 2020-2021 ACADEMIC YEAR:
Fall 2020: 3.441 Spring 2021: 3.376
FALL 2020 STUDENT-ATHLETE GRADE POINT AVERAGE PER SPORT
ALL SPORTS (Active Roster) FALL 2020 GPA CUMULATIVE GPA Men's Baseball 3.383 3.373
Men's Basketball 2.645 2.833
Men's Cross Country 3.478 3.577
Men's Soccer 3.394 3.473
Men's Swimming and Diving 3.323 3.291
Men's Track and Field 3.247 3.310
Women's Basketball 3.545 3.513
Women's Cross Country 3.572 3.509
Women's Soccer 3.686 3.627
Women's Swimming and Diving 3.451 3.519
Women's Tennis 3.692 3.744
Women's Track and Field 3.674 3.585
Women's Volleyball 3.748 3.654
3.441 3.460
SPORTS (HIGHEST TO LOWEST GPA) FALL 2020 GPA CUMULATIVE GPA Women's Volleyball 3.748 3.654
Women's Tennis 3.692 3.744
Women’s Soccer 3.686 3.627
Women’s Track & Field 3.674 3.585
Women's Cross Country 3.572 3.509

19
Women’s Basketball 3.545 3.513
Men’s Cross Country 3.478 3.577
Women’s Swim & Dive 3.451 3.519
Men’s Soccer 3.394 3.473
Men's Baseball 3.383 3.373
Men’s Swim & Dive 3.323 3.291
Men’s Track & Field 3.247 3.310
Men's Basketball 2.645 2.833
SPRING 2021 STUDENT-ATHLETE GRADE POINT AVERAGE PER SPORT
ALL SPORTS (Active Roster) SPRING 2021 GPA CUMULATIVE GPA Men's Baseball 3.222 3.334
Men's Basketball 2.417 2.756
Men's Cross Country 3.547 3.573
Men's Soccer 3.430 3.447
Men's Swimming and Diving 3.252 3.320
Men's Track and Field 3.195 3.287
Women's Basketball 3.576 3.510
Women's Cross Country 3.305 3.470
Women's Soccer 3.625 3.632
Women's Swimming and Diving 3.527 3.573
Women's Tennis 3.757 3.748
Women’s Track and Field 3.522 3.580
Women's Volleyball 3.775 3.676
3.376 3.449

20
SPORT (HIGHEST TO LOWEST GPA) SPRING 2021 GPA CUMULATIVE GPA Women’s Volleyball 3.775 3.676
Women’s Tennis 3.757 3.748
Women’s Soccer 3.625 3.632
Women’s Basketball 3.576 3.510
Men’s Cross Country 3.547 3.573
Women’s Swim & Dive 3.252 3.320
Women’s Track & Field 3.522 3.580
Men’s Soccer 3.430 3.447
Women’s Cross Country 3.305 3.470
Men’s Swim & Dive 3.252 3.320
Baseball 3.222 3.334
Men’s Track & Field 3.195 3.287
Men’s Basketball 2.417 2.756
DECLARED MAJORS OF STUDENT-ATHLETES
Below is a summary of the declared degree programs for student-athletes and the UWM general student body.
MAJOR # OF STUDENT-ATHLETES % OF STUDENT-ATHLETES % OF UWM
STUDENT BODY ACCOUNTING 8 2.36% 1.78%
ACTUARIAL SCIENCE 3 0.88% 0.45%
ANTHROPOLOGY 1 0.29% 0.43%
ARCHITECTURAL STUDIES 2 0.59% 2.82%
ART 3 0.88% 2.70%
ATHLETIC TRAINING 3 0.88% 0.11%
ATMOSPHERIC SCIENCE 3 0.88% 0.13%

21
BIOCHEMISTRY 2 0.59% 0.69%
BIOLOGICAL SCIENCE 2 0.59% 2.38%
BIOMEDICAL ENGINEERING 9 2.65% 0.65%
BIOMEDICAL SCIENCES 3 0.88% 2.75%
BUSINESS 19 5.60% 1.73%
CHEMISTRY 2 0.59% 0.47%
CIVIL ENGINEERING 8 2.36% 1.32%
COMM SCIENCES & DISORDERS 4 1.18% 0.47%
COMMUNICATION 10 2.95% 1.81%
COMMUNITY ENGAGEMENT 2 0.59% 0.79%
COMPUTER ENGINEERING 4 1.18% 2.45%
COMPUTER SCIENCE 9 2.65% 2.10%
CONSERVATION SCIENCE 2 0.59% 1.37%
COUNSELING 1 0.29% 0.12%
CRIMINAL JUSTICE & CRIMINOLOGY 9 2.65% 2.74 %
ECONOMICS 1 0.29% 0.72%
EDUCATION 14 4.13% 4.66%
ELECTRICAL ENGINEERING 1 0.29% 1.16%
ENVIRONMENTAL ENGINEERING 1 0.29% 0.08%
FINANCE 17 5.01% 3.33%
GEOSCIENCES 2 0.59% 0.43%
HEALTH CARE ADMIN 3 0.88% 0.66%
HEALTH SCIENCES 2 0.59% 0.05%
HISTORY 3 0.88% 0.94%
HUMAN RESOURCES 3 0.88% 1.50%
INDUSTRIAL ENGINEERING 3 0.88% 0.42%
INFO SCIENCE & TECH 3 0.88% 3.05%

22
JOURNALISM, ADVERTISING, & MEDIA STUDIES 6 1.77% 2.00%
KINESIOLOGY 25 7.37% 1.30%
MARKETING 39 11.50% 4.92%
MATHEMATICS 1 0.29% 0.44%
MECHANICAL ENGINEERING 12 3.54% 2.60%
MUSIC EDUCATION 2 0.59% 0.28%
NURSING 20 5.90% 5.40%
NUTRITION 5 1.47% 0.32%
OCCUPATIONAL STUDIES 2 0.59% 0.26%
PHOTOGRAPHY 1 0.29% 0.09%
PHYSICAL THERAPY 3 0.88% 0.30%
POLITICAL SCIENCE 2 0.59% 1.15%
PRE DENTISTRY 1 0.29% 0.20%
PRE LAW 1 0.29% 0.78%
PRE MEDICINE 4 1.18% 1.21%
PRE PHYSICIAN ASSISTANT 1 0.29% 0.30%
PRE VET 1 0.29% 0.20%
PSYCHOLOGY 24 7.08% 6.18%
SOCIOLOGY 1 0.29% 0.61%
SPANISH 1 0.29% 0.62%
SUPPLY CHAIN & OPERATIONS 5 1.47% 1.80%
THERAPEUTIC RECREATION 1 0.29% 0.29%
UNDECIDED 3 0.88% 1.76%
URBAN STUDIES 2 0.59% 0.14%

23
BENCHMARKS USED TO ASSESS GSR, ADMISSIONS & ACADEMIC DATA
Benchmark #1: Maintain student-athlete Federal graduation rate that is greater than UWM’s general student body.
Benchmark #2: Maintain student-athlete NCAA graduation rate that is greater than 75%.
Benchmark #3: Maintain an overall student-athlete NCAA graduation rate that is greater than the average for Horizon League.
Benchmark #4: Maintain an overall student-athlete Federal graduation rate that is greater than the average for Horizon League.
Benchmark #5: Maintain student-athlete NCAA graduation rate that is greater than Horizon League institution’s average for each sport.
Benchmark #6: Maintain a student-athlete cumulative GPA greater than 3.0.
Benchmark #7: Maintain average standardized test scores (i.e., ACT and SAT) and grade point average for incoming freshmen student-athletes that are greater than the average test scores and grade point average for UWM’s general student body’s incoming freshman class.

24
AGREED-UPON PROCEDURES REPORT
2020-2021 INSTITUTIONAL AGREED-UPON PROCEDURES REPORT
The NCAA requires all Division I athletic programs to complete an annual Statement of Revenues and Expenses. The deadline to submit the Statement of Revenues and Expenses is January 15th for the preceding fiscal year. Prior to submission, agreed-upon procedures are performed by an independent accountant validating that the Statement of Revenues and Expenses are in compliance with the NCAA. Please see Attachments A for the Independent Accountant’s Report on Agreed-Upon Procedures for UWM’s NCAA Statement of Revenues and Expenses for the year ended June 30, 2021.

25
INTERCOLLEGIATE ATHLETICS BUDGET REPORT
UWM’S AUDITED NCAA FINANCIAL REPORT FOR 2020-2021
Please see Attachment B for the NCAA Statement of Revenue and Expenses, which assigns all transactions to a predetermined revenue or expense category. It is important to note the NCAA Statement of Revenues and Expenses report looks very different from the UWM Athletics Budget previously provided in this report. The NCAA Statement of Revenues and Expenses includes all financial transactions associated with the operations of UWM Athletics for the year ended June 30, 2021. Many of the transactions included in NCAA Statement of Revenues and Expenses extend outside the Athletics Department’s UW System financial statement reporting parameters. Examples of transactions included in NCAA Statement of Revenues and Expenses which are not found in the Athletic Department’s UW System financial statements are:
a. University of Wisconsin – Milwaukee Foundation deposits and payments b. In-kind donations c. Tuition waivers provided by the University as part of student-athletes’ aid awards d. On-campus room and board provided by Auxiliary Services as part of the student-athletes’ grant in
aid e. University indirect facilities and maintenance costs allocated to Athletics
The NCAA Statement of Revenues and Expenses provides a more complete analysis of all the costs associated with operating the athletics program. The NCAA Statement of Revenues and Expenses data is used by the NCAA and multiple media outlets to compare and benchmark athletic financial information of one athletic program to another.

26
OUTSIDE COMPLIANCE REVIEW
HORIZON LEAGUE OUTSIDE COMPLIANCE REVIEW
The Horizon League staff offers, as a service but not a requirement, outside compliance reviews to all institutions in the Horizon League. Staff members from the Horizon League administered their review of athletic compliance in December of 2015. While on campus, Horizon League staff members met with the following individuals:
Athletic Director Senior Woman Administrator Faculty Athletic Representative Ticket Manager Athletic Trainer Strength & Conditioning Coach Sports Information Director Marketing Director Facilities Director Development staff Men’s Basketball coaching staff Women’s Basketball coaching staff Team Sport coaching staff Individual Sport coaching staff Men’s Basketball student-athlete Women’s Basketball student-athlete Individual Sport student-athlete Team Sport student-athlete Academic Advisor Business Manager Registrar Office staff Admissions Liaison Financial Aid Liaison The Horizon League sent a written report to the Assistant AD for Compliance and the Athletic Director. The report includes strengths of the compliance department as well as recommendations for areas that could be improved. No NCAA rules violations were discovered during the audit and the majority of the suggestions from the Horizon League have already been implemented and the remaining suggestions will continue to be reviewed and implemented as appropriate. Compliance audits by the Horizon League generally occur every 5-10 years. UWM will be reviewed again sometime between FY 2020-FY 2025. Please see Attachment F for the Horizon League Compliance Review Report.
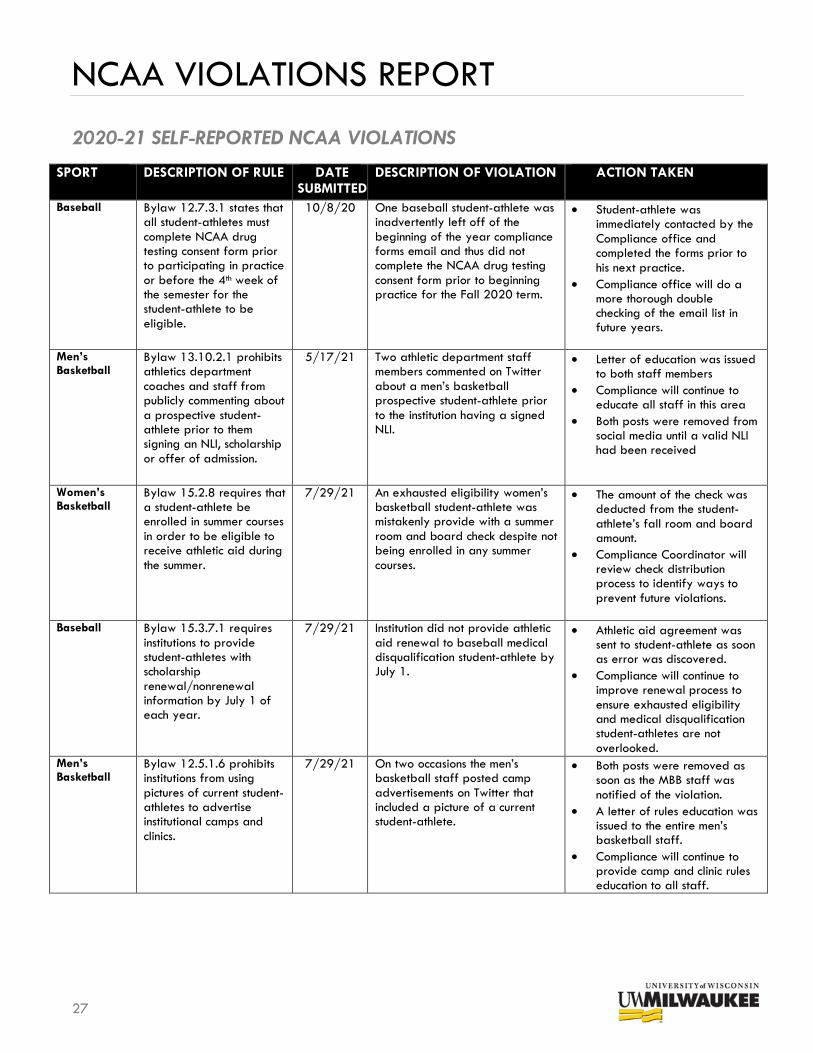
27
NCAA VIOLATIONS REPORT
2020-21 SELF-REPORTED NCAA VIOLATIONS
SPORT DESCRIPTION OF RULE DATE SUBMITTED
DESCRIPTION OF VIOLATION ACTION TAKEN
Baseball Bylaw 12.7.3.1 states that all student-athletes must complete NCAA drug testing consent form prior to participating in practice or before the 4th week of the semester for the student-athlete to be eligible.
10/8/20 One baseball student-athlete was inadvertently left off of the beginning of the year compliance forms email and thus did not complete the NCAA drug testing consent form prior to beginning practice for the Fall 2020 term.
• Student-athlete was immediately contacted by the Compliance office and completed the forms prior to his next practice.
• Compliance office will do a more thorough double checking of the email list in future years.
Men’s Basketball
Bylaw 13.10.2.1 prohibits athletics department coaches and staff from publicly commenting about a prospective student-athlete prior to them signing an NLI, scholarship or offer of admission.
5/17/21 Two athletic department staff members commented on Twitter about a men’s basketball prospective student-athlete prior to the institution having a signed NLI.
• Letter of education was issued to both staff members
• Compliance will continue to educate all staff in this area
• Both posts were removed from social media until a valid NLI had been received
Women’s Basketball
Bylaw 15.2.8 requires that a student-athlete be enrolled in summer courses in order to be eligible to receive athletic aid during the summer.
7/29/21 An exhausted eligibility women’s basketball student-athlete was mistakenly provide with a summer room and board check despite not being enrolled in any summer courses.
• The amount of the check was deducted from the student-athlete’s fall room and board amount.
• Compliance Coordinator will review check distribution process to identify ways to prevent future violations.
Baseball Bylaw 15.3.7.1 requires institutions to provide student-athletes with scholarship renewal/nonrenewal information by July 1 of each year.
7/29/21 Institution did not provide athletic aid renewal to baseball medical disqualification student-athlete by July 1.
• Athletic aid agreement was sent to student-athlete as soon as error was discovered.
• Compliance will continue to improve renewal process to ensure exhausted eligibility and medical disqualification student-athletes are not overlooked.
Men’s Basketball
Bylaw 12.5.1.6 prohibits institutions from using pictures of current student-athletes to advertise institutional camps and clinics.
7/29/21 On two occasions the men’s basketball staff posted camp advertisements on Twitter that included a picture of a current student-athlete.
• Both posts were removed as soon as the MBB staff was notified of the violation.
• A letter of rules education was issued to the entire men’s basketball staff.
• Compliance will continue to provide camp and clinic rules education to all staff.

28
2021-22 SELF-REPORTED NCAA VIOLATIONS
SPORT DESCRIPTION OF RULE DATE DESCRIPTION OF VIOLATION ACTION TAKEN
Men’s & Women’s Track
Bylaw 17.1.7.2 allows student-athletes to only engage in a maximum of 8 hours per week of countable athletically related activity while out of season.
9/13/21 During one week the men’s and women’s throws group exceeded the 8 hour weekly limit of out of season countable activity by 2 hours.
• Out of season practice hours for this group was reduced by 4 hours
• A letter of education was provide to the entire track & field staff
• Rules education was provided to all staff on hours limits
Men’s Basketball
Bylaw 17.1.7.2 allows student-athletes to only engage in a maximum of 8 hours per week of countable athletically related activity while out of season.
9/17/21 On multiple occasions during the month of September the men’s basketball team exceeded the 8 hour weekly limit of out of season countable activity by approximately 10.25 hours.
• In season practice hours were reduced by 20.5 hours over multiple weeks of the season.
• Rules education was provided to all staff on hours limits
• Rules education was provided to the team on hours limits
• Compliance office enhanced the monitoring of practice hours for men’s basketball
• A letter of admonishment was provided to the Head Coach

29
ATTACHMENTS
Independent Accountant’s Report on Agreed-Upon Procedures…………………….Attachment A
NCAA Statement of Revenues and Expenses………………………………………..Attachment B
NCAA Academic Progress Rate (APR) Score Reports………………………………..Attachment C
NCAA Graduation Success Rate (GSR) Score Reports………………………………Attachment D
Peer Institution’s APR and GSR Data………………………………………………...Attachment E
Outside Compliance Review, performed by the Horizon League…………………....Attachment F
NCAA Oversight Certification Letter………………………………………………..Attachment G

ATTACHMENT A

Report Control #2022-01-AUP-MIL P a g e | 1
January 7, 2022 Chancellor Mark Mone University of Wisconsin−Milwaukee 2310 East Hartford Avenue Milwaukee, WI 53201 Dear Chancellor Mone: We have performed the agreed-upon procedures enumerated in the attached report for the sole purpose of assisting you in evaluating whether the accompanying Statement of Revenues and Expenses (SRE) for the University of Wisconsin−Milwaukee (UW-Milwaukee or University) Athletics Department is in compliance with National Collegiate Athletic Association (NCAA) Bylaw 3.2.4.17 for Division I for the year ended June 30, 2021. UW-Milwaukee administration and staff are responsible for the SRE and the University’s compliance with those requirements. This agreed-upon procedures engagement was conducted in conformance with the International Standards for the Professional Practice of Internal Auditing and in accordance with attestation standards established by the American Institute of Certified Public Accountants, as well as requirements enumerated in the NCAA Constitution and common auditing practices. The sufficiency of these procedures is solely the responsibility of those parties specified in this report. Consequently, we make no representation regarding the sufficiency of the procedures described in the Independent Auditor’s Report on the Application of Agreed-Upon Procedures either for the purpose for which this report has been requested or for any other purpose. The NCAA requires this agreed-upon procedures engagement to be conducted by a qualified independent accountant. For the purposes of this engagement, the NCAA considers the UW System Administration Office of Internal Audit to be independent. Our procedures and findings are explained in this report and its attachments. Reportable findings are defined as errors or misclassifications equal to or greater than $500. We were not engaged to and did not conduct an examination, the objective of which would be the expression of an opinion on the accompanying SRE. Accordingly, we do not express such an opinion. Had we performed additional procedures, other matters might have come to our attention that would have been reported to you.
Office of Internal Audit 780 Regent Street, Suite 200 Madison, Wisconsin 53715 (608) 263-4397 wisconsin.edu/offices/audit/

Report Control #2022-01-AUP-MIL P a g e | 2
This report is intended solely for the information and use of the chancellor, management of UW-Milwaukee, the Athletics Department, and authorized representatives of the NCAA. The report is not intended to be, and should not be, used by anyone other than these specified parties. However, this guidance does not supersede distributions governed by the Wisconsin Open Records Law. We greatly appreciate the assistance and cooperation of staff at UW-Milwaukee, who provided information during the conduct of this agreed-upon procedures engagement.
Best regards, __________________________________ Lisa Van Dong, CPA Director, UW System Administration Office of Internal Audit Attachments:
• Attachment A: Independent Auditor’s Report on the Application of Agreed-Upon Procedures • Attachment B: Statement of Revenues and Expenses • Attachment C: Comparisons of Major Revenue and Expense Categories for the Year Ended June
30, 2021 • Attachment D: Notes to Statement of Revenues and Expenses for the Year Ended June 30, 2021
cc: Robin Van Harpen, Vice Chancellor for Finance & Administrative Affairs Amanda Braun, Director of Athletics Catherine Rossi, Deputy Director of Athletics Dave Rice, Interim Controller Sue Weslow, Director of Executive Projects

Report Control #2022-01-AUP-MIL P a g e | 3
ATTACHMENT A: INDEPENDENT AUDITOR’S REPORT ON THE APPLICATION OF AGREED-UPON PROCEDURES
UNIVERSITY OF WISCONSIN−MILWAUKEE
FISCAL YEAR ENDED JUNE 30, 2021
Source: NCAA 2021 Agreed-Upon Procedures, revised March 10, 2021
BACKGROUND The Office of Internal Audit has performed NCAA agreed-upon procedures for Division I at UW-Milwaukee in accordance with the 2022 Audit Plan, as approved by the Audit Committee of the Board of Regents. The objectives of this engagement were as follows:
• Verify accuracy and completeness of data entered onto the NCAA’s Statement of Revenues and Expenses by performing procedures required for “all revenues and expenses” and “other reporting items.”
• Verify accuracy of the data the institution is submitting to the NCAA for sports sponsorship, Pell grants, and grants-in-aid.
Our procedures tested relevant conditions at UW-Milwaukee from July 1, 2020 through June 30, 2021.
REPORTING INTERNAL AUDIT RESULTS The management letter observations for each institution (including UW-Milwaukee) will be summarized as high-level observations in an executive summary to the Audit Committee.
SUMMARY OF REPORTABLE FINDINGS As a result of applying the agreed-upon procedures enumerated below, no reportable findings were noted. Procedures Related to All Revenues and Expenses 1. Agreed the amounts reported on the SRE to UW-Milwaukee’s general ledger.
In performing this procedure and the procedure described in #2 below, we determined that revenues and expenses reported on the SRE (as contained in Attachment B) materially agree with the amounts reported in UW-Milwaukee’s general ledger. In addition, there are certain items recorded on the SRE that are not required to be reported in the athletics accounts, including tuition waivers, indirect facilities and administrative support, and gifts-in-kind. The NCAA requires that these items be reported on the SRE to fully reflect the operations of the Athletics Department.
2. Performed the following procedures for all revenue and expense categories applicable to UW-Milwaukee:

Report Control #2022-01-AUP-MIL P a g e | 4
a. Compared and agreed each operating revenue and expense category reported on the SRE during the reporting period to supporting schedules provided by the institution. If a specific reporting category is less than 4% of the total revenues or total expenses, no procedures are required for that specific category.
b. Compared and agreed a sample of operating revenue receipts and expenses obtained from the above supporting schedules to adequate supporting documentation.
c. Compared each major revenue account over 10% of the total revenues to prior period amounts and budget estimates. Compared each major expense account over 10% of the total expenses to prior period amounts and budget estimates. Obtained and documented an explanation of any variations greater than 10%.
Attachment C describes the results of comparing revenue and expense amounts to budget and prior year values.
3. Identified and documented aspects of the institution’s internal control structure unique to the Athletics
Department. Tested specific elements of the control environment and accounting systems that (1) are unique to intercollegiate athletics and (2) have not been addressed in connection with the audit of the institution’s financial statements. No material exceptions were noted as a result of these procedures.
4. Identified intercollegiate athletics-related affiliated and outside organizations and obtained those
organizations’ financial information for the reporting period. Agreed the amounts reported on the SRE to the athletics-related and outside organization’s records. The SRE includes all functions related to intercollegiate athletics at UW-Milwaukee as well as the accounts of the Athletics Department’s sole affiliated/outside organization, the UW-Milwaukee Foundation (an independent 501(c)(3) organization that is the official not-for-profit fundraising corporation for UW-Milwaukee). No material exceptions were noted as a result of these procedures.
Procedures Related to Revenues 5. Ticket Sales. The NCAA agreed-upon procedures guidelines require that we compare tickets sold
during the reporting period, complimentary tickets provided during the reporting period, and unsold tickets to the related revenue reported by UW-Milwaukee on the SRE and the related attendance figures, and that we recalculate totals.
No procedures were required to be performed for this category since the amount recorded on the SRE for ticket sales was less than 4% of total revenue recorded on the SRE.
6. Direct State or Other Government Support. The NCAA agreed-upon procedures guidelines require
that we compare direct state or other government support recorded by UW-Milwaukee Athletics during the reporting period with state appropriations, institutional authorizations, and/or other corroborative supporting documentation, and recalculate totals.
The Athletics Department did not record any direct state or other government support on the SRE.

Report Control #2022-01-AUP-MIL P a g e | 5
7. Student Fees. Compared and agreed student fees reported by UW-Milwaukee on the SRE for the reporting period to student enrollments during the same reporting period and recalculated totals. Obtained documentation of the institution’s methodology for allocating student fees to intercollegiate athletics programs.
No material exceptions were noted as a result of these procedures.
8. Direct Institutional Support. Compared the direct institutional support recorded by UW-Milwaukee
during the reporting period with institutional supporting budget transfers documentation and other corroborative supporting documentation, and recalculated totals.
No material exceptions were noted as a result of these procedures.
9. Transfers to Institution. The NCAA agreed-upon procedures guidelines require that we compare
transfers to institution with permanent transfers back to the institution from the Athletics Department and recalculate totals.
The Athletics Department did not record any transfers to institution on the SRE for fiscal year (FY) 2021.
10. Indirect Institutional Support; and Indirect Institutional Support – Athletic Facilities Debt
Service, Lease and Rental Fees. The NCAA agreed-upon procedures guidelines require that we compare the indirect institutional support recorded by the institution during the reporting period with expense payments, cost allocation detail, and other corroborative supporting documentation, and recalculate totals. No procedures were required to be performed for indirect institutional support since the amount recorded on the SRE for this category was less than 4% of total revenue recorded on the SRE. No procedures were required to be performed for indirect institutional support – athletic facilities debt service, lease and rental fees since the amount recorded on the SRE for this category was less than 4% of total revenue recorded on the SRE.
11. Guarantees. The NCAA agreed-upon procedures guidelines require that we select a sample of settlement reports for away games during the reporting period and agree each selection to UW-Milwaukee’s general ledger and/or the SRE and recalculate totals. Also agreed-upon procedures require that we select a sample of contractual agreements pertaining to revenues derived from guaranteed contests during the reporting period and compare and agree each selection to UW-Milwaukee’s general ledger and/or the SRE and recalculate totals.
No procedures were required to be performed for this category since the amount recorded on the SRE for guarantees was less than 4% of total revenue recorded on the SRE.
12. Contributions. The NCAA agreed-upon procedures guidelines require that we obtain and review
supporting documentation for any contributions of money, goods, or services received directly by the Athletics Department from any affiliated or outside organization, agency or group of individuals (two or more) not included above (e.g., contributions by corporate sponsors) that constitutes 10% or more in aggregate for the reporting year of all contributions received for intercollegiate athletics during the reporting period and recalculate totals.

Report Control #2022-01-AUP-MIL P a g e | 6
No procedures were required to be performed for this category since the amount recorded on the SRE for contributions was less than 4% of total revenue recorded on the SRE.
13. In-Kind. The NCAA agreed-upon procedures guidelines require that we compare the in-kind recorded by the institution during the reporting period with a schedule of in-kind donations and recalculate totals.
The Athletics Department did not record any in-kind donations on the SRE.
14. Compensation and Benefits Provided by a Third Party. The NCAA agreed-upon procedures
guidelines require that we obtain the summary of revenues from affiliated and outside organizations (the “Summary”) as of the end of the reporting period from the institution and select a sample of funds from the Summary and compare and agree each selection to supporting documentation, UW-Milwaukee’s general ledger, and/or the Summary, and recalculate totals.
The Athletics Department did not record any compensation and benefits provided by a third party on the SRE.
15. Media Rights. The NCAA agreed-upon procedures guidelines require that we obtain and inspect
agreements to understand UW-Milwaukee’s total media (broadcast, television, and radio) rights received by the institution or through their conference offices as reported in the statement. Also, agreed-upon procedures require that we compare and agree the media rights revenues to a summary statement of all media rights identified, if applicable, and UW-Milwaukee’s general ledger, and recalculate totals. The Athletics Department did not record any media rights on the SRE.
16. NCAA Distributions. The NCAA agreed-upon procedures guidelines require that we compare the amounts recorded in the SRE to general ledger detail for NCAA distributions and other corroborative supporting documents and recalculate totals.
No procedures were required to be performed for this category since the amount recorded on the SRE for NCAA distributions was less than 4% of total revenue recorded on the SRE.
17. Conference Distributions (Non-Media and Non-Football Bowl) and Conference Distributions of
Football Bowl Generated Revenue. The NCAA agreed-upon procedures guidelines require that we obtain and inspect agreements related to UW-Milwaukee’s conference distributions and participation in revenues from tournaments during the reporting period for relevant terms and conditions. Also, the agreed-upon procedures require that we compare and agree the related revenues to UW-Milwaukee’s general ledger and/or the SRE and recalculate totals. No procedures were required to be performed for this conference distributions (non-media and non-football bowl) since the amount recorded on the SRE for this category was less than 4% of total revenue recorded on the SRE. The Athletics Department did not record any conference distributions of football bowl generated revenue on the SRE.
18. Program, Novelty, Parking and Concession Sales. The NCAA agreed-upon procedures guidelines
require that we compare the amount recorded in the revenue reporting category to general ledger detail of program sales, concessions, novelty sales, and parking as well as any other corroborative supporting documents, and recalculate totals.

Report Control #2022-01-AUP-MIL P a g e | 7
No procedures were required to be performed for this category since the amount recorded on the SRE for program, novelty, parking and concession sales was less than 4% of total revenue recorded on the SRE.
19. Royalties, Licensing, Advertisement and Sponsorships. The NCAA agreed-upon procedures
guidelines require that we obtain and inspect agreements related to UW-Milwaukee’s participation in revenues from royalties, licensing, advertisement, and sponsorships during the reporting period for relevant terms and conditions. Also, compare and agree the related revenues to UW-Milwaukee’s general ledger and the SRE and recalculate totals.
No procedures were required to be performed for this category since the amount recorded on the SRE for royalties, licensing, advertisement and sponsorships was less than 4% of total revenue recorded on the SRE.
20. Sports Camp Revenues. The NCAA agreed-upon procedures guidelines require that we inspect sports camp contract(s) between UW-Milwaukee and person(s) conducting institutional sports camps or clinics during the reporting period to obtain documentation of UW-Milwaukee’s methodology for recording revenues from sports camps. For a sample of individual camp participant cash receipts from the schedule of sports camp participants, agree each selection to the institution’s general ledger and/or the SRE, and recalculate totals.
The Athletics Department did not record any sports camp revenues on the SRE.
21. Athletics Restricted Endowment and Investments Income. The NCAA agreed-upon procedures
guidelines require that we obtain and inspect endowment agreements (if any) for relevant terms and conditions. Also, compare and agree the classification and use of endowment and investment income reported in the SRE during the reporting period to the uses of income defined within the related endowment agreement and recalculate totals.
The Athletics Department did not record any athletics restricted endowment and investment income on the SRE.
22. Other Operating Revenue. The NCAA agreed-upon procedures guidelines require that we perform
minimum agreed-upon procedures referenced for all revenue categories in Procedure #2 above and recalculate totals.
No procedures were required to be performed for this category since the amount recorded on the SRE for other operating revenue was less than 4% of total revenue recorded on the SRE.
23. Football Bowl Revenues. The NCAA agreed-upon procedures guidelines require we obtain and inspect agreements related to UW-Milwaukee’s revenues from post-season football bowl participation during the reporting period to gain an understanding of the relevant terms and conditions. Also, the agreed-upon procedures require that we compare and agree the related revenues to UW-Milwaukee’s general ledger and/or the SRE and recalculate totals.
The Athletics Department did not record any football bowl revenues on the SRE.

Report Control #2022-01-AUP-MIL P a g e | 8
Procedures Related to Expenses 24. Athletic Student Aid. Selected a sample of 60 student-athletes from the listing of institutional student
aid recipients during the reporting period. The sample was selected from data captured by the institution through the creation of a squad list from each sponsored sport. Obtained individual student account detail for each selection and compared total aid in the institution’s student system to the student’s detail in the NCAA’s Compliance Assistant (CA) software. Performed a check of each student selected to ensure their information was reported accurately in the NCAA’s CA software. We recalculated totals for each sport and overall. No material exceptions were noted as a result of these procedures.
25. Guarantees. The NCAA agreed-upon procedures guidelines require that we obtain and inspect visiting
institution’s away-game settlement reports received by UW-Milwaukee during the reporting period and agree related expenses to UW-Milwaukee’s general ledger and/or the SRE and recalculate totals. Also, the NCAA agreed-upon procedures require that we obtain and inspect contractual agreements pertaining to expenses recorded by the institution from guaranteed contests during the reporting period, compare and agree related amounts expensed by UW-Milwaukee during the reporting period to the institution’s general ledger and/or the SRE, and recalculate totals.
No procedures were required to be performed for this category since the amount recorded on the SRE for guarantees was less than 4% of total expenses recorded on the SRE.
26. Coaching Salaries, Benefits and Bonuses Paid by the University and Related Entities. Obtained
and inspected a listing of coaches employed by UW-Milwaukee and related entities during the reporting period. Selected a sample of four coaches’ contracts that included men’s and women’s basketball from the listing. Compared and agreed the financial terms and conditions of each selection to the related coaching salaries, benefits, and bonuses recorded by UW-Milwaukee and related entities in the statement during the reporting period. Obtained and inspected payroll summaries for the reporting year for each selection. Compared and agreed payroll summary registers from the reporting period to the related coaching salaries, benefits, and bonuses paid by UW-Milwaukee and related entities expense recorded by the institution in the SRE during the reporting period. Compared and agreed the totals recorded to any employment contracts executed for the sample selected, and recalculated totals.
No material exceptions were noted as a result of these procedures.
27. Coaching Salaries, Benefits and Bonuses paid by a Third Party. The NCAA agreed-upon
procedures guidelines require that we (1) obtain and inspect a listing of coaches employed by third parties during the reporting period; (2) select a sample of coaches’ contracts that must include men’s and women’s basketball from the listing; (3) compare and agree the financial terms and conditions of each selection to the related coaching salaries, benefits, and bonuses paid by a third party and recorded by UW-Milwaukee in the statement during the reporting period; (4) obtain and inspect reporting period payroll summary registers for each selection; and (5) compare and agree related payroll summary register to coaching salaries, benefits, and bonuses paid by a third party to expenses recorded by UW-Milwaukee in the SRE during the reporting period, and recalculate totals.
The Athletics Department did not record any coaching salaries, benefits and bonuses paid by a third party on the SRE.

Report Control #2022-01-AUP-MIL P a g e | 9
28. Support Staff/Administrative Compensation, Benefits and Bonuses Paid by the University and Related Entities. Selected a sample of two support staff/administrative personnel employed by UW-Milwaukee and related entities during the reporting period. Obtained and inspected reporting period payroll summary register for each selection. Compared and agreed related summary payroll register to the related support staff/administrative compensation, benefits, and bonuses paid by UW-Milwaukee and related entities expense recorded by UW-Milwaukee in the SRE during the reporting period, and recalculated totals.
No material exceptions were noted as a result of these procedures.
29. Support Staff/Administrative Compensation, Benefits and Bonuses Paid by a Third Party. The
NCAA agreed-upon procedures guidelines require that we select a sample of support staff/ administrative personnel employed by third parties during the reporting period. The agreed-upon procedures also require that we obtain and inspect reporting period payroll summary registers for each selection. For each selection: compare and agree related payroll summary registers to the related support staff/administrative compensation, benefits, and bonuses expense recorded by UW-Milwaukee in the SRE during the reporting period and recalculate totals.
The Athletics Department did not record any support staff/administrative compensation, benefits and bonuses paid by a third party on the SRE.
30. Severance Payments. The NCAA agreed-upon procedures guidelines require that we select a sample
of employees receiving severance payments by the institution during the reporting period and agree each severance payment to the related termination letter or employment contract and recalculate totals.
The Athletics Department did not record any severance payments on the SRE.
31. Recruiting. The NCAA agreed-upon procedures guidelines require that we obtain documentation of UW-
Milwaukee’s recruiting expense policies, and that we compare and agree to existing institutional and NCAA-related policies. It also requires that we obtain general ledger detail and compare to total expenses reported and recalculate totals.
No procedures were required to be performed for this category since the amount recorded on the SRE for recruiting was less than 4% of total expenses recorded on the SRE.
32. Team Travel. Obtained documentation of UW-Milwaukee’s team travel policies. Compared and
agreed to existing institutional and NCAA-related policies. Obtained general ledger detail and compared to the total expenses reported, and recalculated totals.
No material exceptions were noted as a result of these procedures.
33. Sports Equipment, Uniforms and Supplies. The NCAA agreed-upon procedures guidelines require that we obtain general ledger detail and compare to the total expenses reported. We are required to select a sample of transactions to validate existence of transactions and accuracy of recording, and recalculate totals.
No procedures were required to be performed for this category since the amount recorded on the SRE for sports equipment, uniforms and supplies was less than 4% of total expenses recorded on the SRE.

Report Control #2022-01-AUP-MIL P a g e | 10
34. Game Expenses. The NCAA agreed-upon procedures guidelines require that we obtain general ledger detail and compare to the total expenses reported. Also, we are required to select a sample of transactions to validate existence of transactions and accuracy of recording and recalculate totals.
No procedures were required to be performed for this category since the amount recorded on the SRE for game expenses was less than 4% of total expenses recorded on the SRE.
35. Fund Raising, Marketing and Promotion. The NCAA agreed-upon procedures guidelines require that we obtain general ledger detail and compare to total expenses reported. Also, agreed-upon procedures require that we select a sample of transactions to validate existence of transactions and accuracy of recording, and recalculate totals. No procedures were required to be performed for this category since the amount recorded on the SRE for fund raising, marketing and promotion was less than 4% of total expenses recorded on the SRE.
36. Sports Camp Expenses. The NCAA agreed-upon procedures guidelines require that we obtain general
ledger detail and compare to the total expenses reported. Also, agreed-upon procedures require that we select a sample of transactions to validate existence of transactions and accuracy of recording, and recalculate totals.
The Athletics Department did not record any sports camp expenses on the SRE.
37. Spirit Groups. The NCAA agreed-upon procedures guidelines require that we obtain general ledger
detail and compare to the total expenses reported. It also requires that we select a sample of transactions to validate existence of transactions and accuracy of recording and recalculate totals.
No procedures were required to be performed for this category since the amount recorded on the SRE for spirit groups was less than 4% of total expenses recorded on the SRE.
38. Athletic Facilities Debt Service, Leases and Rental Fees. The NCAA agreed-upon procedures
guidelines require that we obtain a listing of debt service schedules, lease payments, and rental payments for athletic facilities for the reporting year, compare a sample of facility payments, including the top two highest facility payments, to additional supporting documentation (e.g., debt financing agreements, leases, and rental agreements), compare amounts recorded to amounts listed in the general ledger detail, and recalculate totals.
No procedures were required to be performed for this category since the amount recorded on the SRE for athletic facilities debt service, leases and rental fees was less than 4% of total expenses recorded on the SRE.
39. Direct Overhead and Administrative Expenses. The NCAA agreed-upon procedures guidelines
require that we obtain general ledger detail and compare to the total expenses reported and that we select a sample of transactions to validate existence of transactions and accuracy of recording and recalculate totals.
No procedures were required to be performed for this category since the amount recorded on the SRE for direct overhead and administrative expenses was less than 4% of total expenses recorded on the SRE.

Report Control #2022-01-AUP-MIL P a g e | 11
40. Indirect Institutional Support. The NCAA agreed-upon procedures guidelines note this category is tested with revenue section - Indirect Institutional Support (see procedure #10). No material exceptions were noted as a result of these procedures.
41. Medical Expenses and Insurance. The NCAA agreed-upon procedures guidelines require that we
obtain general ledger detail and compare to the total expenses reported, and that we select a sample of transactions to validate existence of transactions and accuracy of recording and recalculate totals.
No procedures were required to be performed for this category since the amount recorded on the SRE for medical expenses and insurance was less than 4% of total expenses recorded on the SRE.
42. Memberships and Dues. The NCAA agreed-upon procedures guidelines require that we obtain general
ledger detail and compare to the total expenses reported. Also, select a sample of transactions to validate existence of transactions and accuracy of recording, and recalculate totals.
No procedures were required to be performed for this category since the amount recorded on the SRE for memberships and dues was less than 4% of total expenses recorded on the SRE.
43. Student-Athlete Meals (Non-Travel). The NCAA agreed-upon procedures guidelines require that we
obtain general ledger detail and compare to the total expenses reported. Also, agreed-upon procedures require that we select a sample of transactions to validate existence of transactions and accuracy of recording, and recalculate totals. No procedures were required to be performed for this category since the amount recorded on the SRE for student-athlete meals (non-travel) was less than 4% of total expenses recorded on the SRE.
44. Other Operating Expenses. The NCAA agreed-upon procedures guidelines require that we obtain general ledger detail and compare to the total expenses reported. Also, agreed-upon procedures require that we select a sample of transactions to validate existence of transactions and accuracy of recording, and recalculate totals. No procedures were required to be performed for this category since the amount recorded on the SRE for other operating expenses was less than 4% of total expenses recorded on the SRE.
45. Football Bowl Expenses; and Football Bowl Expenses – Coaching Compensation/Bonuses. The
NCAA agreed-upon procedures guidelines require that we obtain general ledger detail and compare to the total expenses reported. Also, agreed-upon procedures require that we select a sample of transactions to validate existence of transactions and accuracy of recording, and recalculate totals.
The Athletics Department did not record any football bowl expenses on the SRE. The Athletics Department did not record any football bowl expenses – coaching compensation/bonuses on the SRE.

Report Control #2022-01-AUP-MIL P a g e | 12
Additional Minimum Agreed-Upon Procedures 46. For Grants-in-Aid. Compared and agreed the sports sponsored reported in the NCAA Membership
Financial Reporting System to the squad lists of UW-Milwaukee Athletics. The NCAA Membership Financial Reporting System populates the sports from the NCAA Sports Sponsorship and Demographics Form as they are reported by the institution between May and August. If there was a discrepancy in the sports sponsored between the NCAA Membership Financial Reporting System and the squad lists, we inquired about the discrepancy and reported the justification in the Agreed-Upon Procedures report. Compared current year Grants-in-Aid revenue distribution equivalencies to prior year reported equivalencies per the Membership Financial Report submission. Inquired and documented an explanation for any variance greater than +/- 4%. No material exceptions were noted as a result of these procedures.
47. For Sports Sponsorship. We obtained UW-Milwaukee’s “Sports Sponsorship and Demographics Forms” submitted to the NCAA for the reporting year between May and August and validated that the countable NCAA sports reported by the institution met the minimum requirements, set forth in Bylaw 20.9.6.3, related to the number of contests and the number of participants in each contest that is counted toward meeting the minimum-contest requirement. We ensured that UW-Milwaukee has properly reported these sports as countable for revenue distribution purposes within the NCAA Membership Financial Reporting System. We compared current year number of Sports Sponsored to prior year reported total per the Membership Financial Report submission, and inquired and documented an explanation for any variance. No material exceptions were noted as a result of these procedures.
48. For Pell Grants. Agreed the total number of Division I student-athletes who, during the academic year, received a Pell Grant award (e.g., Pell Grant recipients on Full Athletic Aid, Pell Grant recipients on Partial Athletic Aid, and Pell Grant recipients with no Athletic Aid) and the total dollar value of these Pell Grants reported in the NCAA Membership Financial Reporting System to a report, generated out of the institution’s financial aid records, of all student-athlete Pell Grants.
We compared current year Pell Grants total to prior year reported total per the Membership Financial Report submission, and inquired and documented an explanation for any variance greater than +/- 20 grants. No material exceptions were noted as a result of these procedures.
Minimum Agreed-Upon Procedures Program for Other Reporting Items 49. Excess Transfers to Institution and Conference Realignment Expenses. The NCAA agreed-upon
procedures guidelines require that we obtain general ledger detail and compare to the total expenses reported. Also, agreed-upon procedures require that we select a sample of transactions to validate existence of transactions and accuracy of recording, and recalculate totals.

Report Control #2022-01-AUP-MIL P a g e | 13
The Athletics Department did not record any excess transfers to institution or conference realignment expenses on the SRE.
50. Total Athletics-Related Debt. Obtained repayment schedules for all outstanding intercollegiate athletics debt during the reporting period. Recalculated annual maturities (consisting of principal and interest) provided in the schedules obtained. Agreed the total annual maturities and total outstanding athletics-related debt to supporting documentation and the institution’s general ledger, as applicable. The amount of “Total Athletics-Related Debt” on line 52 of the SRE ($5,314,993) represents the outstanding bonds payable on the Klotsche Center, a facility used by the Athletics Department (generally without rental fees or chargebacks). However, payment of interest and principal on these bonds is not the responsibility of the Athletics Department, and a separate segregated fee is used to fund the debt service. Also, the amount of “Total Athletics-Related Debt” on line 52 does not include the cumulative deficit in the Athletics Department in Fund 128 as of June 30, 2021 ($4,991,253). See also Note 4 in Attachment D. No material exceptions were noted as a result of these procedures.
51. Total Institutional Debt. Agreed the total outstanding institutional debt to supporting documentation and the institution’s audited financial statements, if available, or the institution’s general ledger. No material exceptions were noted as a result of these procedures.
52. Value of Athletics Dedicated Endowments. Obtained a schedule of all athletics dedicated endowments maintained by Athletics, the institution, and affiliated organizations. Agreed the fair market value in the schedule(s) to supporting documentation, the general ledger(s), and audited financial statements, if available. No material exceptions were noted as a result of these procedures.
53. Value of Institutional Endowments. Agreed the total fair market value of institutional endowments to supporting documentation, the institution’s general ledger, and/or audited financial statements, if available. No material exceptions were noted as a result of these procedures.
54. Total Athletics-Related Capital Expenditures. Obtained a schedule of athletics-related capital
expenditures made by Athletics, the institution, and affiliated organizations during the reporting period. Obtained general ledger detail and compared to the total expenses reported. Selected a sample of transactions to validate existence of transactions and accuracy of recording, and recalculated totals. The amount of “Total Athletics-Related Capital Expenditures” on line 56 of the SRE ($470,990) is not included, or accounted for, elsewhere in the “Expenses” section of the SRE (as permitted by the NCAA 2021 Agreed-Upon Procedures Guidelines, revised March 10, 2021). No material exceptions were noted as a result of these procedures.

Report Control #2022-01-AUP-MIL P a g e | 14
ATTACHMENT B: STATEMENT OF REVENUES AND EXPENSES
UNIVERSITY OF WISCONSIN-MILWAUKEE ATHLETICS DEPARTMENTSTATEMENT OF REVENUES AND EXPENSES
FOR THE YEAR ENDED JUNE 30, 2021(Unaudited)
NON-MEN'S WOMEN'S OTHER PROGRAM PRIOR
BASKETBALL BASKETBALL SPORTS SPECIFIC TOTAL YEAR VARIANCEREVENUES:
1 Ticket Sales 136,756$ 1,068$ 7,024$ -$ 144,848$ 140,849$ 3,999$
2 Direct State or Other Government Support - - - - - - -
3 Student Fees - - - 5,821,560 5,821,560 6,058,944 (237,384)
4 Direct Institutional Support 342,117 346,753 3,199,317 3,296,559 7,184,746 4,452,984 2,731,762
5 Less: Transfers to Institution - - - - - - -
6 Indirect Institutional Support - - - 493,000 493,000 404,000 89,000
6AIndirect Institutional Support-Athletic Facilities Debt Service, Lease and Rental Fees - - - 233,512 233,512 226,474 7,038
7 Guarantees 100,000 8,000 23,126 - 131,126 334,895 (203,769)
8 Contributions 65,055 12,275 138,121 122,145 337,596 962,052 (624,456) - 9 In-Kind - - - - - - -
10 Compensation and Benefits Provided by a Third Party - - - - - - -
11 Media Rights - - - - - - -
12 NCAA Distributions - - 43,098 364,432 407,530 248,243 159,287
13 Conference Distributions (Non Media and Non Football Bowl) - - - 185,324 185,324 128,031 57,293
13A Conference Distributions of Football Bowl Generated Revenue - - - - - - -
14 Program, Novelty, Parking and Concession Sales - - 3,291 18,690 21,981 6,522 15,459
15 Royalties, Licensing, Advertisement and Sponsorships - - 6,750 575,809 582,559 472,307 110,252
16 Sports Camp Revenues - - - - - - -
17 Athletics Restricted Endowment and Investments Income - - - - - 62,701 (62,701)
18 Other Operating Revenue - - 300 3,563 3,863 22,328 (18,465)
19 Football Bowl Revenues - - - - - - -
Total Operating Revenues 643,928 368,096 3,421,027 11,114,594 15,547,645 13,520,330 2,027,315
EXPENSES:
20 Athletic Student Aid 485,006 531,086 3,463,174 - 4,479,266 4,411,913 67,353
21 Guarantees - - 6,750 - 6,750 68,900 (62,150)
22Coaching Salaries, Benefits and Bonuses Paid by the University and Related Entities 797,878 354,055 1,225,788 - 2,377,721 2,459,998 (82,277)
23 Coaching Salaries, Benefits and Bonuses Paid by a Third Party - - - - - - -
24Support Staff/Administrative Compensation, Benefits and Bonuses Paid by the University and Related Entities 36,392 55,946 6,338 1,940,992 2,039,668 2,301,713 (262,045)
25Support Staff/Administrative Compensation, Benefits and Bonuses Paid by Third Party - - - - - - -
26 Severance Payments - - - - - - -
27 Recruiting 8,502 10,546 16,257 - 35,305 138,095 (102,790)
28 Team Travel 141,283 116,603 368,433 - 626,319 976,803 (350,484)
29 Sports Equipment, Uniforms and Supplies 42,241 39,041 181,434 - 262,716 301,123 (38,407)
30 Game Expenses 74,618 50,801 66,163 - 191,582 317,808 (126,226)
31 Fundraising, Marketing and Promotion 61,116 5,948 7,207 58,459 132,730 359,499 (226,769)
32 Sport Camp Expenses - - - - - - -
33 Spirit Groups - - - 17,799 17,799 82,018 (64,219)
34 Athletic Facilities Debt Service, Leases and Rental Fees - - 90,087 233,512 323,599 425,474 (101,875)
35 Direct Overhead and Administrative Expenses 3,150 1,037 2,953 416,727 423,867 460,241 (36,374)
36 Indirect Institutional Support - - - 493,000 493,000 404,000 89,000
37 Medical Expenses and Insurance - 1,590 - 382,956 384,546 335,963 48,583
38 Memberships and Dues - 1,001 2,858 8,366 12,225 13,666 (1,441)
39 Student-Athlete Meals (Non-Travel) 46,787 22,440 898 10,680 80,805 82,364 (1,559)
40 Other Operating Expenses 52,027 17,948 93,845 69,096 232,916 244,024 (11,108)
41 Football Bowl Expenses - - - - - - -
41A Football Bowl Expenses - Coaching Compensation/Bonuses - - - - - - -
Total Operating Expenses 1,749,000 1,208,042 5,532,185 3,631,587 12,120,814 13,383,602 (1,262,788)
EXCESS (DEFICIENCY) OF REVENUES OVER (UNDER) EXPENSES (1,105,072)$ (839,946)$ (2,111,158)$ 7,483,007$ 3,426,831$ 136,728$ 3,290,103$

Report Control #2022-01-AUP-MIL P a g e | 15
ATTACHMENT B: STATEMENT OF REVENUES AND EXPENSES – CONTINUED
Note: The NCAA does not use category numbers 42 through 49 for purposes of the Statement of Revenues and Expenses.
Additional Information:
TotalPrior Year Variance
50 Excess Transfers to Institution -$ -$ -$
51 Conference Realignment Expenses - - -$
52 Total Athletics Related Debt 5,314,993 6,470,317 (1,155,324)$
53 Total Institutional Debt 112,391,774 93,705,643 18,686,131$
54 Value of Athletics Dedicated Endowments 1,149,018 952,807 196,211$
55 Value of Institutional Endowments 210,805,403 173,161,578 37,643,825$
56 Total Athletics Related Capital Expenditures 470,990 14,160 456,830$

Report Control #2022-01-AUP-MIL P a g e | 16
ATTACHMENT C: COMPARISONS OF MAJOR REVENUE AND EXPENSE CATEGORIES FOR THE YEAR ENDED JUNE 30, 2021
NCAA Agreed-Upon Procedures require the independent auditor to:
a) Compare each major revenue account over 10% of the total revenues to prior period amounts and budget estimates. Obtain and document an understanding of any variations over 10%. Report the analysis as a supplement to the final agreed-upon procedures report. Based upon the above-stated criteria, the following revenue account variance from the prior period amount required an explanation:
NCAA
Category
20-21
Amount
Prior Year
Amount
Variance
Explanation
#4 Direct
Institutional Support
$7,184,746
$4,452,984
$2,731,762
In FY20, the institution was unable to contribute any
funds toward the Athletic Department cumulative
deficit, which accumulated for several years prior to FY15. The institution did contribute $2,925,000 in
FY21, which accounts for this large variance.
Based upon the above-stated criteria, the following revenue account variance from budget estimates required an explanation:
NCAA
Category
20-21
Amount
Budgeted amount
Variance
Explanation
#4 Direct
Institutional Support
$7,184,746
$4,221,415
$2,963,331
The institution contributed $2,925,000 to the Athletic
Department cumulative deficit, which accumulated for several years prior to
FY15. This contribution is not annually budgeted for and accounts for the large
variance.
b) Compare each major expense account over 10% of the total expenses to prior period amounts and budget estimates. Obtain and document an understanding of any variations over 10%. Report the analysis as a supplement to the final agreed-upon procedures report.

Report Control #2022-01-AUP-MIL P a g e | 17
Based upon the above-stated criteria, the following expense account variance from the prior period amount required an explanation:
NCAA
Category
20-21
Amount
Prior Year
Amount
Variance
Explanation
#24 Support
Staff/Administrative Compensation,
Benefits and Bonuses paid by the
University and Related Entities
$2,039,668
$2,301,713
$(262,045)
In FY21, the Athletics Department had additional furloughs, which reduced
this category. Additionally, there were two key roles
that were either eliminated or were not filled (director
of men’s basketball operations and a marketing
position).

Report Control #2022-01-AUP-MIL P a g e | 18
ATTACHMENT D: NOTES TO STATEMENT OF REVENUES AND EXPENSES FOR THE YEAR ENDED JUNE 30, 2021
Note 1: Summary of Significant Accounting Policies UW-Milwaukee uses a fund accounting system of financial reporting. The main premise of fund accounting is to facilitate the stewardship of financial resources and ensure that these resources are budgeted, received, and expended in compliance with legal requirements. UW-Milwaukee has established policies and procedures to ensure that all University assets, including those in the custody of Athletics, are appropriately acquired, utilized, and disposed. The SRE has been prepared on the budgetary basis of accounting, which is a comprehensive basis of accounting other than generally accepted accounting principles (GAAP). The budgetary basis for the UW-Milwaukee Athletics Department represents the accounting principles used in managing its operations in accordance with its budgetary procedures. The Government Accounting Standards Board establishes GAAP for states and local governmental units, including the UW-Milwaukee Athletics Department. Two of the most significant differences between the budgetary basis and GAAP (full accrual basis) are as follows:
• Capital asset acquisitions funded by revenues are reported as expenditures rather than as capital assets.
• Depreciation on capital assets is not reported. The format for the SRE is based upon the prescribed format of the NCAA. Note 2: Reporting Entity The UW-Milwaukee Athletics Department is responsible for intercollegiate sports programs of the University. The Director of Athletics is responsible for the day-to-day operation of the Athletics Department. The Athletics Department is ultimately governed by the University’s Chancellor through authority delegated by the Board of Regents of the University of Wisconsin System, which is a unit of the State of Wisconsin. As of July 1, 2018, as part of the UW Colleges restructure initiative, UW-Milwaukee acquired the UW Colleges campuses located in Waukesha and Washington County. While these branch campuses offer sports, they are considered Club Sports and are not part of the UW-Milwaukee Athletics Department; they are managed by UW-Milwaukee’s Division of Student Affairs and Campus Climate. The SRE includes all functions related to intercollegiate athletics at UW-Milwaukee as well as the accounts of the Athletics Department’s sole affiliated/outside organization, the UW-Milwaukee Foundation (an independent 501(c)(3) organization that is the official not-for-profit fundraising corporation for UW-Milwaukee). Contributions are received by the UW-Milwaukee Foundation on behalf of UW-Milwaukee Athletics. Contributions are recognized and recorded on the SRE in the period provided and used by UW-Milwaukee Athletics. Disbursements of $336,085 made from the UW-Milwaukee Foundation on behalf of the Athletics Department to third parties or paid directly to UW-Milwaukee Athletics are recorded on the SRE in the period of disbursement.

Report Control #2022-01-AUP-MIL P a g e | 19
Note 3: Contributions The UW-Milwaukee Athletics Department receives contributions in support of various intercollegiate sports programs. Donations can be made to the UW-Milwaukee Athletics Department or the UW-Milwaukee Foundation. Revenue from contributions (line 8 of the SRE) was $337,596. The UW-Milwaukee Foundation received contributions for the Athletic Department from one donor that constituted greater than 10% of all contributions: $700,000 was received from one donor. Since line 8 of the SRE recognizes revenue as it is spent, this amount differs from that which was donated during the fiscal year ($1,244,427). Note 4: Total Athletics-Related Debt The amount of “Total Athletics-Related Debt” on line 52 of the SRE ($5,314,993) represents the outstanding bonds payable on the Klotsche Center, a facility used by the Athletics Department (generally without rental fees or chargebacks). However, payment of interest and principal on these bonds is not the responsibility of the Athletics Department, and a separate segregated fee is used to fund the debt service. Also, the amount of “Total Athletics-Related Debt” on line 52 does not include the cumulative deficit in the Athletics Department in Fund 128 at June 30, 2021 ($4,991,253). The scheduled payments of the general obligation bonds are as follows:
Note 5: Total Athletics-Related Capital Expenditures The amount of “Total Athletics-Related Capital Expenditures” on line 56 of the SRE ($470,990) is not included, or accounted for, elsewhere in the “Expenses” section of the SRE (as permitted by the NCAA 2021 Agreed-Upon Procedures Guidelines, revised March 10, 2021). Note 6: Restricted Revenue During the year ending June 30, 2017, UW-Milwaukee received $460,734 from the NCAA as part of its special one-time Division I distribution to directly support student-athletes. Since this distribution is considered restricted with respect to purpose, the entire amount received in FY 2017 ($460,734) was
Fiscal Year Principal Interest Total
2022 1,359,468$ 136,961$ 1,496,428$ 2023 1,436,419 90,671 1,527,091 2024 895,856 51,784 947,641 2025 1,209,784 25,842 1,235,626 2026 83,138 8,185 91,323 2027 153,171 7,520 160,692
2028-2033 177,157 9,448 186,605 Totals 5,314,993$ 330,412$ 5,645,405$

Report Control #2022-01-AUP-MIL P a g e | 20
recognized as revenue in line 12, NCAA distributions, of the SRE during that year. The expense related to this revenue item will be recognized during the year it is spent. UW-Milwaukee Athletics spends approximately $92,400 from this distribution each year (starting in FY 2018 and ending in FY 2022). UW-Milwaukee Athletics plans to spend one-fifth of the funds over each of the next two fiscal years, ending in FY 2022. UW-Milwaukee Athletics intends to provide the full cost of attendance to both the men’s and women’s basketball programs. Full cost of attendance is approximately $3,300 annually for 28 full scholarship student-athletes. Note 7: Use of COVID-19 Institutional Funds in Athletics During the year ended June 30, 2021, UW-Milwaukee Athletics used funds awarded to the institution from the Higher Educational Emergency Relief Fund (HEERF), specifically the Coronavirus Aid, Relief, and Economic Security (CARES) Act (HEERF I) and the Coronavirus Response and Relief Supplemental Appropriations Act, 2021 (CRRSAA) (HEERF II), to defray Athletic Department expenses associated with the COVID-19 pandemic. Expense reimbursements in the amount of $2,403 were recorded in various expense categories (Fund Raising, Marketing and Promotion, Direct Overhead and Administrative Expenses, and Medical Expenses and Insurance).

ATTACHMENT B

Report Control #2022-01-AUP-MIL P a g e | 14
ATTACHMENT B: STATEMENT OF REVENUES AND EXPENSES
UNIVERSITY OF WISCONSIN-MILWAUKEE ATHLETICS DEPARTMENTSTATEMENT OF REVENUES AND EXPENSES
FOR THE YEAR ENDED JUNE 30, 2021(Unaudited)
NON-MEN'S WOMEN'S OTHER PROGRAM PRIOR
BASKETBALL BASKETBALL SPORTS SPECIFIC TOTAL YEAR VARIANCEREVENUES:
1 Ticket Sales 136,756$ 1,068$ 7,024$ -$ 144,848$ 140,849$ 3,999$
2 Direct State or Other Government Support - - - - - - -
3 Student Fees - - - 5,821,560 5,821,560 6,058,944 (237,384)
4 Direct Institutional Support 342,117 346,753 3,199,317 3,296,559 7,184,746 4,452,984 2,731,762
5 Less: Transfers to Institution - - - - - - -
6 Indirect Institutional Support - - - 493,000 493,000 404,000 89,000
6AIndirect Institutional Support-Athletic Facilities Debt Service, Lease and Rental Fees - - - 233,512 233,512 226,474 7,038
7 Guarantees 100,000 8,000 23,126 - 131,126 334,895 (203,769)
8 Contributions 65,055 12,275 138,121 122,145 337,596 962,052 (624,456) - 9 In-Kind - - - - - - -
10 Compensation and Benefits Provided by a Third Party - - - - - - -
11 Media Rights - - - - - - -
12 NCAA Distributions - - 43,098 364,432 407,530 248,243 159,287
13 Conference Distributions (Non Media and Non Football Bowl) - - - 185,324 185,324 128,031 57,293
13A Conference Distributions of Football Bowl Generated Revenue - - - - - - -
14 Program, Novelty, Parking and Concession Sales - - 3,291 18,690 21,981 6,522 15,459
15 Royalties, Licensing, Advertisement and Sponsorships - - 6,750 575,809 582,559 472,307 110,252
16 Sports Camp Revenues - - - - - - -
17 Athletics Restricted Endowment and Investments Income - - - - - 62,701 (62,701)
18 Other Operating Revenue - - 300 3,563 3,863 22,328 (18,465)
19 Football Bowl Revenues - - - - - - -
Total Operating Revenues 643,928 368,096 3,421,027 11,114,594 15,547,645 13,520,330 2,027,315
EXPENSES:
20 Athletic Student Aid 485,006 531,086 3,463,174 - 4,479,266 4,411,913 67,353
21 Guarantees - - 6,750 - 6,750 68,900 (62,150)
22Coaching Salaries, Benefits and Bonuses Paid by the University and Related Entities 797,878 354,055 1,225,788 - 2,377,721 2,459,998 (82,277)
23 Coaching Salaries, Benefits and Bonuses Paid by a Third Party - - - - - - -
24Support Staff/Administrative Compensation, Benefits and Bonuses Paid by the University and Related Entities 36,392 55,946 6,338 1,940,992 2,039,668 2,301,713 (262,045)
25Support Staff/Administrative Compensation, Benefits and Bonuses Paid by Third Party - - - - - - -
26 Severance Payments - - - - - - -
27 Recruiting 8,502 10,546 16,257 - 35,305 138,095 (102,790)
28 Team Travel 141,283 116,603 368,433 - 626,319 976,803 (350,484)
29 Sports Equipment, Uniforms and Supplies 42,241 39,041 181,434 - 262,716 301,123 (38,407)
30 Game Expenses 74,618 50,801 66,163 - 191,582 317,808 (126,226)
31 Fundraising, Marketing and Promotion 61,116 5,948 7,207 58,459 132,730 359,499 (226,769)
32 Sport Camp Expenses - - - - - - -
33 Spirit Groups - - - 17,799 17,799 82,018 (64,219)
34 Athletic Facilities Debt Service, Leases and Rental Fees - - 90,087 233,512 323,599 425,474 (101,875)
35 Direct Overhead and Administrative Expenses 3,150 1,037 2,953 416,727 423,867 460,241 (36,374)
36 Indirect Institutional Support - - - 493,000 493,000 404,000 89,000
37 Medical Expenses and Insurance - 1,590 - 382,956 384,546 335,963 48,583
38 Memberships and Dues - 1,001 2,858 8,366 12,225 13,666 (1,441)
39 Student-Athlete Meals (Non-Travel) 46,787 22,440 898 10,680 80,805 82,364 (1,559)
40 Other Operating Expenses 52,027 17,948 93,845 69,096 232,916 244,024 (11,108)
41 Football Bowl Expenses - - - - - - -
41A Football Bowl Expenses - Coaching Compensation/Bonuses - - - - - - -
Total Operating Expenses 1,749,000 1,208,042 5,532,185 3,631,587 12,120,814 13,383,602 (1,262,788)
EXCESS (DEFICIENCY) OF REVENUES OVER (UNDER) EXPENSES (1,105,072)$ (839,946)$ (2,111,158)$ 7,483,007$ 3,426,831$ 136,728$ 3,290,103$

Report Control #2022-01-AUP-MIL P a g e | 15
ATTACHMENT B: STATEMENT OF REVENUES AND EXPENSES – CONTINUED
Note: The NCAA does not use category numbers 42 through 49 for purposes of the Statement of Revenues and Expenses.
Additional Information:
TotalPrior Year Variance
50 Excess Transfers to Institution -$ -$ -$
51 Conference Realignment Expenses - - -$
52 Total Athletics Related Debt 5,314,993 6,470,317 (1,155,324)$
53 Total Institutional Debt 112,391,774 93,705,643 18,686,131$
54 Value of Athletics Dedicated Endowments 1,149,018 952,807 196,211$
55 Value of Institutional Endowments 210,805,403 173,161,578 37,643,825$
56 Total Athletics Related Capital Expenditures 470,990 14,160 456,830$

Report Control #2022-01-AUP-MIL P a g e | 16
ATTACHMENT C: COMPARISONS OF MAJOR REVENUE AND EXPENSE CATEGORIES FOR THE YEAR ENDED JUNE 30, 2021
NCAA Agreed-Upon Procedures require the independent auditor to:
a) Compare each major revenue account over 10% of the total revenues to prior period amounts and budget estimates. Obtain and document an understanding of any variations over 10%. Report the analysis as a supplement to the final agreed-upon procedures report. Based upon the above-stated criteria, the following revenue account variance from the prior period amount required an explanation:
NCAA
Category
20-21
Amount
Prior Year
Amount
Variance
Explanation
#4 Direct
Institutional Support
$7,184,746
$4,452,984
$2,731,762
In FY20, the institution was unable to contribute any
funds toward the Athletic Department cumulative
deficit, which accumulated for several years prior to FY15. The institution did contribute $2,925,000 in
FY21, which accounts for this large variance.
Based upon the above-stated criteria, the following revenue account variance from budget estimates required an explanation:
NCAA
Category
20-21
Amount
Budgeted amount
Variance
Explanation
#4 Direct
Institutional Support
$7,184,746
$4,221,415
$2,963,331
The institution contributed $2,925,000 to the Athletic
Department cumulative deficit, which accumulated for several years prior to
FY15. This contribution is not annually budgeted for and accounts for the large
variance.
b) Compare each major expense account over 10% of the total expenses to prior period amounts and budget estimates. Obtain and document an understanding of any variations over 10%. Report the analysis as a supplement to the final agreed-upon procedures report.

Report Control #2022-01-AUP-MIL P a g e | 17
Based upon the above-stated criteria, the following expense account variance from the prior period amount required an explanation:
NCAA
Category
20-21
Amount
Prior Year
Amount
Variance
Explanation
#24 Support
Staff/Administrative Compensation,
Benefits and Bonuses paid by the
University and Related Entities
$2,039,668
$2,301,713
$(262,045)
In FY21, the Athletics Department had additional furloughs, which reduced
this category. Additionally, there were two key roles
that were either eliminated or were not filled (director
of men’s basketball operations and a marketing
position).

Report Control #2022-01-AUP-MIL P a g e | 18
ATTACHMENT D: NOTES TO STATEMENT OF REVENUES AND EXPENSES FOR THE YEAR ENDED JUNE 30, 2021
Note 1: Summary of Significant Accounting Policies UW-Milwaukee uses a fund accounting system of financial reporting. The main premise of fund accounting is to facilitate the stewardship of financial resources and ensure that these resources are budgeted, received, and expended in compliance with legal requirements. UW-Milwaukee has established policies and procedures to ensure that all University assets, including those in the custody of Athletics, are appropriately acquired, utilized, and disposed. The SRE has been prepared on the budgetary basis of accounting, which is a comprehensive basis of accounting other than generally accepted accounting principles (GAAP). The budgetary basis for the UW-Milwaukee Athletics Department represents the accounting principles used in managing its operations in accordance with its budgetary procedures. The Government Accounting Standards Board establishes GAAP for states and local governmental units, including the UW-Milwaukee Athletics Department. Two of the most significant differences between the budgetary basis and GAAP (full accrual basis) are as follows:
• Capital asset acquisitions funded by revenues are reported as expenditures rather than as capital assets.
• Depreciation on capital assets is not reported. The format for the SRE is based upon the prescribed format of the NCAA. Note 2: Reporting Entity The UW-Milwaukee Athletics Department is responsible for intercollegiate sports programs of the University. The Director of Athletics is responsible for the day-to-day operation of the Athletics Department. The Athletics Department is ultimately governed by the University’s Chancellor through authority delegated by the Board of Regents of the University of Wisconsin System, which is a unit of the State of Wisconsin. As of July 1, 2018, as part of the UW Colleges restructure initiative, UW-Milwaukee acquired the UW Colleges campuses located in Waukesha and Washington County. While these branch campuses offer sports, they are considered Club Sports and are not part of the UW-Milwaukee Athletics Department; they are managed by UW-Milwaukee’s Division of Student Affairs and Campus Climate. The SRE includes all functions related to intercollegiate athletics at UW-Milwaukee as well as the accounts of the Athletics Department’s sole affiliated/outside organization, the UW-Milwaukee Foundation (an independent 501(c)(3) organization that is the official not-for-profit fundraising corporation for UW-Milwaukee). Contributions are received by the UW-Milwaukee Foundation on behalf of UW-Milwaukee Athletics. Contributions are recognized and recorded on the SRE in the period provided and used by UW-Milwaukee Athletics. Disbursements of $336,085 made from the UW-Milwaukee Foundation on behalf of the Athletics Department to third parties or paid directly to UW-Milwaukee Athletics are recorded on the SRE in the period of disbursement.

Report Control #2022-01-AUP-MIL P a g e | 19
Note 3: Contributions The UW-Milwaukee Athletics Department receives contributions in support of various intercollegiate sports programs. Donations can be made to the UW-Milwaukee Athletics Department or the UW-Milwaukee Foundation. Revenue from contributions (line 8 of the SRE) was $337,596. The UW-Milwaukee Foundation received contributions for the Athletic Department from one donor that constituted greater than 10% of all contributions: $700,000 was received from one donor. Since line 8 of the SRE recognizes revenue as it is spent, this amount differs from that which was donated during the fiscal year ($1,244,427). Note 4: Total Athletics-Related Debt The amount of “Total Athletics-Related Debt” on line 52 of the SRE ($5,314,993) represents the outstanding bonds payable on the Klotsche Center, a facility used by the Athletics Department (generally without rental fees or chargebacks). However, payment of interest and principal on these bonds is not the responsibility of the Athletics Department, and a separate segregated fee is used to fund the debt service. Also, the amount of “Total Athletics-Related Debt” on line 52 does not include the cumulative deficit in the Athletics Department in Fund 128 at June 30, 2021 ($4,991,253). The scheduled payments of the general obligation bonds are as follows:
Note 5: Total Athletics-Related Capital Expenditures The amount of “Total Athletics-Related Capital Expenditures” on line 56 of the SRE ($470,990) is not included, or accounted for, elsewhere in the “Expenses” section of the SRE (as permitted by the NCAA 2021 Agreed-Upon Procedures Guidelines, revised March 10, 2021). Note 6: Restricted Revenue During the year ending June 30, 2017, UW-Milwaukee received $460,734 from the NCAA as part of its special one-time Division I distribution to directly support student-athletes. Since this distribution is considered restricted with respect to purpose, the entire amount received in FY 2017 ($460,734) was
Fiscal Year Principal Interest Total
2022 1,359,468$ 136,961$ 1,496,428$ 2023 1,436,419 90,671 1,527,091 2024 895,856 51,784 947,641 2025 1,209,784 25,842 1,235,626 2026 83,138 8,185 91,323 2027 153,171 7,520 160,692
2028-2033 177,157 9,448 186,605 Totals 5,314,993$ 330,412$ 5,645,405$

Report Control #2022-01-AUP-MIL P a g e | 20
recognized as revenue in line 12, NCAA distributions, of the SRE during that year. The expense related to this revenue item will be recognized during the year it is spent. UW-Milwaukee Athletics spends approximately $92,400 from this distribution each year (starting in FY 2018 and ending in FY 2022). UW-Milwaukee Athletics plans to spend one-fifth of the funds over each of the next two fiscal years, ending in FY 2022. UW-Milwaukee Athletics intends to provide the full cost of attendance to both the men’s and women’s basketball programs. Full cost of attendance is approximately $3,300 annually for 28 full scholarship student-athletes. Note 7: Use of COVID-19 Institutional Funds in Athletics During the year ended June 30, 2021, UW-Milwaukee Athletics used funds awarded to the institution from the Higher Educational Emergency Relief Fund (HEERF), specifically the Coronavirus Aid, Relief, and Economic Security (CARES) Act (HEERF I) and the Coronavirus Response and Relief Supplemental Appropriations Act, 2021 (CRRSAA) (HEERF II), to defray Athletic Department expenses associated with the COVID-19 pandemic. Expense reimbursements in the amount of $2,403 were recorded in various expense categories (Fund Raising, Marketing and Promotion, Direct Overhead and Administrative Expenses, and Medical Expenses and Insurance).

ATTACHMENT C

NCAA Division I 2019 - 2020 Academic Progress Rate Institutional Report
Institution: University of Wisconsin-Milwaukee Date of Report: 04/29/2022
This report is based on NCAA Division I Academic Progress Rate (APR) data submitted by the institution for the 2016-17, 2017 -18, 2018-19 and 2019-20 academic years. Institutions are encouraged to forward this report to appropriate institutional personnel on campus.
[Note: All information contained in this report is for four academic years. Some squads may still have small sample sizes within certain sport groups. In accordance with the Family Educational Rights and Privacy Act's (FERPA's) interpretation of federal privacy regulations, institutions should not disclose statistical data contained in this report for cells made up of three or fewer students without student consent.]
Sport
APR Eligibility/Graduation Retention
Multiyear Rate (N)
Multiyear RateUpper Confidence Boundary
2019 - 2020 (N) Multiyear Rate 2019 - 2020 Multiyear Rate 2019 - 2020
Baseball 1,000 (120) N/A 991 (30) 996 1,000 991 982Men's Basketball 957 (49) N/A 865 (13) 968 885 933 846Men's Cross Country 1,000 (48) N/A 1,000 (16) 1,000 1,000 1,000 1,000Men's Soccer 977 (94) N/A 1,000 (21) 978 1,000 977 1,000Men's Swimming 982 (128) N/A 976 (33) 963 968 984 984Men's Track 991 (144) N/A 981 (40) 982 974 993 987Women's Basketball 1,000 (63) N/A 1,000 (16) 1,000 1,000 1,000 1,000Women's Cross Country 1,000 (76) N/A 984 (17) 986 968 1,000 1,000Women's Soccer 987 (124) N/A 991 (30) 983 982 991 1,000Women's Swimming 990 (137) N/A 986 (37) 989 986 992 986Women's Tennis 1,000 (32) N/A 1,000 (8) 1,000 1,000 1,000 1,000Women's Track 993 (175) N/A 988 (43) 982 975 994 1,000
* Denotes data representing three or fewer student-athletes. In accordance with FERPA's interpretation of federal privacy regulations, institutions should not disclose statistical data contained in this report in cells made up of three or fewer students without student consent. N/A = No APR or not applicable. N = Number of student-athletes represented. 1 Denotes APR that does not subject the team to ineligibility for postseason competition based on institutional, athletics and student resources and the team's Graduation Success Rate. 2 Denotes APR that does not subject the team to ineligibility for postseason competition due to the team's demonstrated academic improvement. 3 Denotes APR that does not subject the team to ineligibility for postseason competition due to the squad-size adjustment. The "upper confidence boundary" of a team's APR must be below 930 for that team to be subject to ineligibility for postseason competition. Squad-size adjustment does not apply to teams with four years of APR data and a multiyear cohort of 30 or more student-athletes. 4 Denotes APR that does not subject the team to penalties due to the team's demonstrated academic improvement. 5 Denotes APR that does not subject the team to penalties due to the squad-size adjustment. The "upper confidence boundary" of a team's APR must be below 930 for that team to be subject to penalties. The squad-size adjustment does not apply to teams with four years of APR data and a multiyear cohort of 30 or more student-athletes. 6 Denotes APR based on a one year cohort, not subject to ineligibility for postseason competition and/or any penalties. 7 Denotes APR based on a two year cohort, not subject to ineligibility for postseason competition and/or any penalties. 8 Denotes that team is not subject to ineligibility for postseason competition and/or penalties based on institutional resources. 9 Denotes APR that requires an APP Improvement Plan be created for this sport.
Page 1 of 2

NCAA Division I 2019 - 2020 Academic Progress Rate Institutional Report
Institution: University of Wisconsin-Milwaukee Date of Report: 04/29/2022
Sport
APR Eligibility/Graduation Retention
Multiyear Rate (N)
Multiyear RateUpper Confidence Boundary
2019 - 2020 (N) Multiyear Rate 2019 - 2020 Multiyear Rate 2019 - 2020
Women's Volleyball 1,000 (53) N/A 1,000 (13) 1,000 1,000 990 1,000
* Denotes data representing three or fewer student-athletes. In accordance with FERPA's interpretation of federal privacy regulations, institutions should not disclose statistical data contained in this report in cells made up of three or fewer students without student consent. N/A = No APR or not applicable. N = Number of student-athletes represented. 1 Denotes APR that does not subject the team to ineligibility for postseason competition based on institutional, athletics and student resources and the team's Graduation Success Rate. 2 Denotes APR that does not subject the team to ineligibility for postseason competition due to the team's demonstrated academic improvement. 3 Denotes APR that does not subject the team to ineligibility for postseason competition due to the squad-size adjustment. The "upper confidence boundary" of a team's APR must be below 930 for that team to be subject to ineligibility for postseason competition. Squad-size adjustment does not apply to teams with four years of APR data and a multiyear cohort of 30 or more student-athletes. 4 Denotes APR that does not subject the team to penalties due to the team's demonstrated academic improvement. 5 Denotes APR that does not subject the team to penalties due to the squad-size adjustment. The "upper confidence boundary" of a team's APR must be below 930 for that team to be subject to penalties. The squad-size adjustment does not apply to teams with four years of APR data and a multiyear cohort of 30 or more student-athletes. 6 Denotes APR based on a one year cohort, not subject to ineligibility for postseason competition and/or any penalties. 7 Denotes APR based on a two year cohort, not subject to ineligibility for postseason competition and/or any penalties. 8 Denotes that team is not subject to ineligibility for postseason competition and/or penalties based on institutional resources. 9 Denotes APR that requires an APP Improvement Plan be created for this sport.
Page 2 of 2

NCAA Division I 2018 - 2019 Academic Progress Rate Institutional Report Institution: University of Wisconsin-Milwaukee Date of Report: 01/28/2020
Page 1 of 2
* Denotes data representing three or fewer student-athletes. In accordance with FERPA's interpretation of federal privacy regulations, institutions should not disclose statistical data contained in this report in cells made up of three or fewer students without student consent. N/A = No APR or not applicable. N = Number of student-athletes represented. 1 Denotes APR that does not subject the team to ineligibility for postseason competition based on institutional, athletics and student resources and the team's Graduation Success Rate.2 Denotes APR that does not subject the team to ineligibility for postseason competition due to the team's demonstrated academic improvement. 3 Denotes APR that does not subject the team to ineligibility for postseason competition due to the squad-size adjustment. The "upper confidence boundary" of a team's APR must be below 930 for that team to be subject to ineligibility for postseason competition. Squad-size adjustment does not apply to teams with four years of APR data and a multiyear cohort of 30 or more student-athletes.4 Denotes APR that does not subject the team to penalties due to the team's demonstrated academic improvement.5 Denotes APR that does not subject the team to penalties due to the squad-size adjustment. The "upper confidence boundary" of a team's APR must be below 930 for that team to be subject to penalties. The squad-size adjustment does not apply to teams with four years of APR data and a multiyear cohort of 30 or more student-athletes.6 Denotes APR based on a one year cohort, not subject to ineligibility for postseason competition and/or any penalties.7 Denotes APR based on a two year cohort, not subject to ineligibility for postseason competition and/or any penalties.8 Denotes that team is not subject to ineligibility for postseason competition and/or penalties based on institutional resources.9 Denotes APR that requires an APP Improvement Plan be created for this sport.
This report is based on NCAA Division I Academic Progress Rate (APR) data submitted by the institution for the 2015-16, 2016-17, 2017-18 and 2018-19 academic years. Institutions are encouraged to forward this report to appropriate institutional personnel on campus.
[Note: All information contained in this report is for four academic years. Some squads may still have small sample sizes within certain sport groups. In accordance with the Family Educational Rights and Privacy Act's (FERPA's) interpretation of federal privacy regulations, institutions should not disclose statistical data contained in this report for cells made up of three or fewer students without student consent.]
Sport
APR Eligibility/Graduation Retention
Multiyear Rate (N) Multiyear Rate Upper Confidence Boundary
2018 - 2019 (N) Multiyear Rate 2018 - 2019 Multiyear Rate 2018 - 2019
Baseball 989 (120) N/A 992 (32) 970 984 991 1,000
Men's Basketball 983 (49) N/A 960 (14) 989 1,000 965 920
Men's Cross Country 1,000 (44) N/A 1,000 (13) 1,000 1,000 1,000 1,000
Men's Soccer 964 (97) N/A 970 (27) 973 980 956 959
Men's Swimming 971 (127) N/A 975 (31) 943 967 984 983
Men's Track 996 (143) N/A 1,000 (37) 989 1,000 993 1,000
Women's Basketball 1,000 (62) N/A 1,000 (17) 1,000 1,000 1,000 1,000
Women's Cross Country 1,000 (76) N/A 1,000 (21) 987 1,000 993 1,000
Women's Soccer 986 (123) N/A 972 (31) 982 964 991 981
Women's Swimming 994 (136) N/A 976 (32) 989 968 996 984

NCAA Division I 2018 - 2019 Academic Progress Rate Institutional Report Institution: University of Wisconsin-Milwaukee Date of Report: 01/28/2020
Page 2 of 2
* Denotes data representing three or fewer student-athletes. In accordance with FERPA's interpretation of federal privacy regulations, institutions should not disclose statistical data contained in this report in cells made up of three or fewer students without student consent. N/A = No APR or not applicable. N = Number of student-athletes represented. 1 Denotes APR that does not subject the team to ineligibility for postseason competition based on institutional, athletics and student resources and the team's Graduation Success Rate.2 Denotes APR that does not subject the team to ineligibility for postseason competition due to the team's demonstrated academic improvement. 3 Denotes APR that does not subject the team to ineligibility for postseason competition due to the squad-size adjustment. The "upper confidence boundary" of a team's APR must be below 930 for that team to be subject to ineligibility for postseason competition. Squad-size adjustment does not apply to teams with four years of APR data and a multiyear cohort of 30 or more student-athletes.4 Denotes APR that does not subject the team to penalties due to the team's demonstrated academic improvement.5 Denotes APR that does not subject the team to penalties due to the squad-size adjustment. The "upper confidence boundary" of a team's APR must be below 930 for that team to be subject to penalties. The squad-size adjustment does not apply to teams with four years of APR data and a multiyear cohort of 30 or more student-athletes.6 Denotes APR based on a one year cohort, not subject to ineligibility for postseason competition and/or any penalties.7 Denotes APR based on a two year cohort, not subject to ineligibility for postseason competition and/or any penalties.8 Denotes that team is not subject to ineligibility for postseason competition and/or penalties based on institutional resources.9 Denotes APR that requires an APP Improvement Plan be created for this sport.
Sport
APR Eligibility/Graduation Retention
Multiyear Rate (N) Multiyear Rate Upper Confidence Boundary
2018 - 2019 (N) Multiyear Rate 2018 - 2019 Multiyear Rate 2018 - 2019
Women's Tennis 1,000 (33) N/A 1,000 (9) 1,000 1,000 1,000 1,000
Women's Track 992 (168) N/A 1,000 (46) 982 1,000 991 1,000
Women's Volleyball 990 (56) N/A 1,000 (13) 990 1,000 980 1,000

NCAA Division I 2017 - 2018 Academic Progress Rate Institutional Report Institution: University of Wisconsin-Milwaukee Date of Report: 05/06/2019
Page 1 of 2
1 Specific information on the playing and practice season penalty may be located in the APP General Summary document located on the Reports tab within the APP data collection portal.2 The team is also subject to a penalty that was previously conditionally waived; however, the team failed to meet the condition and the penalty must now be imposed.3 Denotes that team is not subject to ineligibility for postseason competition based on institutional, athletics and student resources and the team's Graduation Success Rate.4 Denotes that team is not subject to ineligibility for postseason competition due to the team's demonstrated academic improvement. 5 The team's Level One penalty has been waived.6 The team's Level Two penalty has been waived.8 The team is subject to a penalty that was previously conditionally waived; however, the team failed to meet the condition and the penalty must now be imposed.9 The team's Postseason ineligibility has been waived.10 The team's penalty waiver request is pending.11 Denotes that team's APR data is under review.
This report is based on NCAA Division I Academic Progress Rate (APR) data submitted by the institution for the 2014-15, 2015-16, 2016-17 and 2017-18 academic years.
[Note: All information contained in this report is for four academic years. Some squads may still have small sample sizes within certain sport groups. In accordance with the Family Educational Rights and Privacy Act's (FERPA's) interpretation of federal privacy regulations, data cells containing three or fewer student-athletes have been suppressed and are indicated by an * symbol. The information in this report does not reflect any changes to data made after this date.]
The following chart represents by-sport APR averages for noted subgroups. National aggregates are based on all squads that have certified their academic data as final.
Sport (N) Multiyear APR2 0 1 7 - 2 0 1 8 APR
Percentile Rank within Sport
P e r c e n t i l e Rank w i t h i n A l l Sports
All Divison IP u b l i c Institutions
PrivateInstitutions
Football Bowl Subdivision
Football Championship Subdivision
Division I (Non- Football)
By Sport - Men's
Baseball (297) 987 1,000 70th-80th 50th-60th 976 973 981 977 973 976
Men's Basketball (351) 1,000 1,000 90th-100th 80th-90th 967 963 973 969 963 968
Men's Cross Country (315)
1,000 1,000 90th-100th 80th-90th 982 978 989 986 977 982
Men's Soccer (203) 965 989 10th-20th 10th-20th 979 974 983 977 981 978

NCAA Division I 2017 - 2018 Academic Progress Rate Institutional Report Institution: University of Wisconsin-Milwaukee Date of Report: 05/06/2019
Page 2 of 2
1 Specific information on the playing and practice season penalty may be located in the APP General Summary document located on the Reports tab within the APP data collection portal.2 The team is also subject to a penalty that was previously conditionally waived; however, the team failed to meet the condition and the penalty must now be imposed.3 Denotes that team is not subject to ineligibility for postseason competition based on institutional, athletics and student resources and the team's Graduation Success Rate.4 Denotes that team is not subject to ineligibility for postseason competition due to the team's demonstrated academic improvement. 5 The team's Level One penalty has been waived.6 The team's Level Two penalty has been waived.8 The team is subject to a penalty that was previously conditionally waived; however, the team failed to meet the condition and the penalty must now be imposed.9 The team's Postseason ineligibility has been waived.10 The team's penalty waiver request is pending.11 Denotes that team's APR data is under review.
Sport (N) Multiyear APR2 0 1 7 - 2 0 1 8 APR
Percentile Rank within Sport
P e r c e n t i l e Rank w i t h i n A l l Sports
All Divison IP u b l i c Institutions
PrivateInstitutions
Football Bowl Subdivision
Football Championship Subdivision
Division I (Non- Football)
Men's Swimming and Diving (131)
969 984 10th-20th 20th-30th 982 982 981 984 984 977
Men's Track (286) 996 993 90th-100th 70th-80th 973 968 983 974 969 977
By Sport - Women's
Women's Basketball (349)
987 1,000 50th-60th 50th-60th 982 979 988 983 980 983
Women's Cross Country (348)
993 1,000 50th-60th 60th-70th 989 987 992 992 984 990
Women's Soccer (333) 993 983 60th-70th 60th-70th 989 987 993 991 986 989
Women's Swimming and Diving (194)
1,000 1,000 90th-100th 80th-90th 993 992 993 993 994 992
Women's Tennis (314) 992 1,000 40th-50th 60th-70th 990 989 991 991 989 989
Women's Track (338) 989 1,000 60th-70th 50th-60th 983 980 989 985 978 986
Women's Volleyball (333) 986 980 30th-40th 40th-50th 987 986 991 991 985 986
By Sport - Co-Ed

ATTACHMENT D

Page 1 of 1
Draft
Graduation Success Rate Report
2011 - 2014 Cohorts: University of Wisconsin-Milwaukee
Men's Sports
Sport GSR Fed RateBaseball 95 50Basketball 100 71CC/Track 84 78Fencing - -Football - -Golf - -Gymnastics - -Ice Hockey - -Lacrosse - -Mixed Rifle - -Skiing - -Soccer 79 50Swimming 88 83Tennis - -Volleyball - -Water Polo - -Wrestling - -Men's Non-NCAA Sponsor. Sports - -
Women's Sports
Sport GSR Fed RateBasketball 92 47Bowling - -CC/Track 94 81Crew/Rowing - -Fencing - -Field Hockey - -Golf - -Gymnastics - -W. Ice Hockey - -Lacrosse - -Skiing - -Soccer 92 76Softball - -Swimming 96 83Tennis 100 67Volleyball 100 100Water Polo - -Women's Non-NCAA Sponsor. Sports - -

Page 1 of 5
Draft
University of Wisconsin-MilwaukeeFRESHMAN-COHORT GRADUATION RATES All Students Student-Athletes #2014-15 Graduation Rate 46% 70%Four-Class Average 45% 73%Student-Athlete Graduation Success Rate 91%
1. Graduation-Rates Data a. All Students
Men2014-15 4-Class
N % N %Am. Ind./AN 10 20 28 21Asian 132 39 445 44Black 127 22 405 23Hispanic 163 37 398 32Nat. Haw./PI 1 100 4 50N-R Alien 56 50 217 51Two or More 60 40 355 35Unknown 0 - 4 75White 1006 49 4118 49Total 1555 44 5974 45
Women2014-15 4-Class
N % N %7 57 20 35
108 43 376 47187 26 616 25222 42 482 410 - 5 4030 63 95 5585 39 486 412 100 8 75
1178 52 4587 501819 47 6675 46
Total2014-15 4-Class
N % N %17 35 48 27240 40 821 46314 24 1021 24385 40 880 371 100 9 4486 55 312 52145 39 841 382 100 12 75
2184 50 8705 493374 46 12649 45
b. Student-Athletes Men2014-15 4-Class GSR
N % N % N %Am. Ind./AN 0 - 0 - 0 -Asian 0 - 0 - 0 -Black 1 0 4 50 4 100Hispanic 0 - 2 0 2 0Nat. Haw./PI 0 - 0 - 0 -N-R Alien 0 - 3 0 0 -Two or More 0 - 0 - 1 100Unknown 1 0 3 33 4 75White 19 68 85 75 93 89Total 21 62 97 69 104 88
Women2014-15 4-Class GSR
N % N % N %0 - 3 0 0 -0 - 0 - 0 -3 33 15 67 14 861 100 2 50 1 1000 - 0 - 0 -0 - 1 0 0 -1 100 4 50 3 1001 0 4 75 3 10033 79 101 82 92 9639 74 130 76 113 95
Total2014-15 4-Class GSR
N % N % N %0 - 3 0 0 -0 - 0 - 0 -4 25 19 63 18 891 100 4 25 3 330 - 0 - 0 -0 - 4 0 0 -1 100 4 50 4 1002 0 7 57 7 8652 75 186 79 185 9260 70 227 73 217 91

Page 2 of 5
Draft
c. Student-Athletes by Sport CategoryBaseball%-N2014-15 4-Class GSR
Am. Ind./AN - - -Asian - - -Black - - -Hispanic - - -Nat. Haw./PI - - -N-R Alien - - -Two or More - - -Unknown - - 100-aWhite 50-a 50-c 95-dTotal 50-a 50-c 95-d
Men's Basketball%-N2014-15 4-Class GSR
Am. Ind./AN - - -Asian - - -Black 0-a 0-a 100-aHispanic - - -Nat. Haw./PI - - -N-R Alien - - -Two or More - - -Unknown - - -White 100-a 100-a 100-bTotal 50-a 71-b 100-b
Men's CC/Track%-N2014-15 4-Class GSR
Am. Ind./AN - - -Asian - - -Black - 100-a 100-aHispanic - - -Nat. Haw./PI - - -N-R Alien - - -Two or More - - -Unknown - - -White 67-b 77-e 83-eTotal 67-b 78-e 84-e
Football%-N2014-15 4-Class GSR
Am. Ind./AN - - -Asian - - -Black - - -Hispanic - - -Nat. Haw./PI - - -N-R Alien - - -Two or More - - -Unknown - - -White - - -Total - - -
Men's Other%-N2014-15 4-Class GSR
Am. Ind./AN - - -Asian - - -Black - - -Hispanic - 0-a 0-aNat. Haw./PI - - -N-R Alien - 0-a -Two or More - - 100-aUnknown 0-a 33-a 67-aWhite 71-b 79-e 90-eTotal 63-b 67-e 84-e
Women's Basketball%-N2014-15 4-Class GSR
Am. Ind./AN - 0-a -Asian - - -Black 0-a 33-b 80-aHispanic - - -Nat. Haw./PI - - -N-R Alien - - -Two or More - 0-a -Unknown - - -White 100-a 100-b 100-bTotal 75-a 47-d 92-c
Women's CC/Track%-N2014-15 4-Class GSR
Am. Ind./AN - - -Asian - - -Black 50-a 86-b 86-bHispanic - - -Nat. Haw./PI - - -N-R Alien - - -Two or More 100-a 100-a 100-aUnknown - 100-a 100-aWhite 60-b 78-e 95-eTotal 62-c 81-e 94-e
Women's Other%-N
2014-15 4-Class GSRAm. Ind./AN - - -Asian - - -Black - 100-a 100-aHispanic 100-a 50-a 100-aNat. Haw./PI - - -N-R Alien - 0-a -Two or More - 100-a 100-aUnknown 0-a 67-a 100-aWhite 85-d 82-e 95-eTotal 82-e 81-e 96-e
Values for N (a. 1-5, b. 6-10, c. 11-15, d. 16-20, e. greater than 20)

Page 3 of 5
Draft
2. Undergraduate-Enrollment Data (All full-time baccalaureate-degree seeking students enrolled 2020-21)
a. All Students Men Women TotalN N N
Am. Ind./AN 18 30 48Asian 535 599 1134Black 364 579 943Hispanic 915 1094 2009Nat. Haw./PI 6 5 11N-R Alien 231 155 386Two or More 293 413 706Unknown 12 17 29White 4578 5486 10064
Total 6952 8378 15330
b. Student-athletes # Men Women TotalN N N
Am. Ind./AN 1 0 1Asian 3 1 4Black 19 7 26Hispanic 3 5 8Nat. Haw./PI 1 0 1N-R Alien 0 0 0Two or More 6 4 10Unknown 1 2 3White 101 140 241
Total 135 159 294
c. Student-Athletes # By Sports Category Men
Basketball Baseball CC/Track Football OtherAm. Ind./AN 0 0 0 0 1Asian 0 1 0 0 2Black 12 0 4 0 3Hispanic 0 0 2 0 1Nat. Haw./PI 0 0 0 0 1N-R Alien 0 0 0 0 0Two or More 0 0 0 0 6Unknown 0 0 1 0 0White 1 32 32 0 36
Total 13 33 39 0 50
WomenBasketball CC/Track Other
Am. Ind./AN 0 0 0Asian 0 1 0Black 3 4 0Hispanic 0 2 3Nat. Haw./PI 0 0 0N-R Alien 0 0 0Two or More 1 2 1Unknown 0 1 1White 12 43 85
Total 16 53 90
#Only student-athletes receiving athletics aid are included in this report.

1.
2.
NCAA DIVISION I GRADUATION RATES INSTITUTION REPORT INFORMATION
Introduction.
This information sheet and the NCAA Division I Graduation Rates Institution Report have been prepared by the NCAA, based on data provided by the institution in compliance with NCAA Bylaw 18.4.2.2.1 (admissions and graduation-rate disclosure) and the federal Student Right-to-Know Act. Please note, the NCAA will make this report public.
The Graduation Rates Institution Report gives graduation information about the most recent six-year graduating class of students and student-athletes who entered as freshmen in 2014-15. The graduation rate (percent) is based on a comparison of the number (N) of students who entered a college or university and the number of those who graduated within six years. For example, if 100 students entered and 60 graduated within six years, the graduation rate is 60 percent.
The Graduation Rates Institution Report provides information about two groups of students:
All Students.
All undergraduate students who were enrolled in a full-time program of studies for a baccalaureate degree; and
Student-Athletes.
Student-athletes who received athletics aid from the school for any period of time during their entering year. [Note: Athletics aid is a grant, scholarship, tuition waiver or other assistance from a college or university that is awarded on the basis of a student's athletics ability.]
Two different measures of graduation rates are presented in this report: Federal Graduation Rate and NCAA Division I Graduation Success Rate (GSR). The Federal Graduation Rate indicates the percentage of freshmen who entered and received athletics aid during a given academic year who graduated within six years. The GSR adds to the first-time freshmen, those students who entered midyear as well as student-athletes who transferred into an institution and received athletics aid. Both the Federal Graduation Rate and the GSR subtract students from the entering cohort who are considered allowable exclusions (i.e., those who either die or become permanently disabled, those who leave the school to join the armed forces, foreign services or attend a religious mission). In addition, the GSR subtracts those who left the institution prior to graduation, had athletics eligibility remaining and would have been academically eligible to compete had they returned to the institution.
Graduation Rates Report.
The box at the top of the Graduation Rates Institution Report provides the most recent class (i.e., 2014-15) and four-class Federal Graduation Rate (i.e., 2011-12 through 2014-15) for all students and for student-athletes who received athletics aid at this school. Additionally, this box provides GSR data (i.e., 2011-12 through 2014-15) for student-athletes.

1.
a.
b.
c.
2.
a.
b.
c.
NCAA Division I Graduation Rates Institution Report Information Page No. 2
_________
Graduation- Rates Data.
The second section of the report provides Federal Graduation Rate and GSR data for all students, student-athletes and student-athletes by sport group. (Note: Pursuant to the Student Right-to-Know Act, anytime a cell containing cohort numbers includes only one or two students, the data in that cell and one other will be suppressed so that no individual can be identified.)
All Students.
This section provides the freshman-cohort graduation rates for all full-time, degree-seeking students by race or ethnic group. It shows the rate for men who entered as freshmen in 2014-15 and the four-class average, which includes those who entered as freshmen in 2011-12, 2012-13, 2013-14 and 2014-15. The same rates are provided for women. The total for 2014-15 is the rate for men and women combined, and the four-class average is for all students who entered in 2011-12, 2012-13, 2013-14 and 2014-15.
Student-Athletes.
This section provides the freshman-cohort graduation rates and the ASR for student-athletes in each race and ethnic group who received athletics aid. Information is provided for men and women separately and for all student-athletes.
Student-Athletes by Sports Categories.
This section provides the identified graduation rates as in 1-b for each of the eight sports categories. (The small letters indicate the value of N according to the legend at the bottom of 1-c.)
Undergraduate-Enrollment Data.
All Students.
This section indicates the total number of full-time, undergraduate, baccalaureate, degree-seeking students enrolled for the 2020 fall term and the number of men and women in each racial or ethnic group (not just freshmen).
Student-Athletes.
This section identifies how many student-athletes were enrolled and received athletics aid for the 2020-21 academic year, and the number of men and women in each racial or ethnic group.
Student-Athletes by Sports Categories.
This section provides the enrollment data as identified in 2-b for each of the eight sports categories.
NCAA/MD:ld/022421

Draft
Graduation Success Rate Report
2010 - 2013 Cohorts: University of Wisconsin-Milwaukee
Men's Sports
Sport GSR Fed Rate
Baseball 83 53
Basketball 83 71
CC/Track 87 79
Fencing - -
Football - -
Golf - -
Gymnastics - -
Ice Hockey - -
Lacrosse - -
Mixed Rifle - -
Skiing - -
Soccer 71 48
Swimming 96 91
Tennis - -
Volleyball - -
Water Polo - -
Wrestling - -
Men's Non-NCAA Sponsor. Sports - -
Women's Sports
Sport GSR Fed Rate
Basketball 92 47
Bowling - -
CC/Track 93 90
Crew/Rowing - -
Fencing - -
Field Hockey - -
Golf - -
Gymnastics - -
W. Ice Hockey - -
Lacrosse - -
Skiing - -
Soccer 96 71
Softball - -
Swimming 92 84
Tennis 100 78
Volleyball 100 100
Water Polo - -
Women's Non-NCAA Sponsor. Sports - -

Draft
University of Wisconsin-Milwaukee
FRESHMAN-COHORT GRADUATION RATES All Students Student-Athletes #
2013-14 Graduation Rate 44% 78%
Four-Class Average 45% 74%
Student-Athlete Graduation Success Rate 89%
1. Graduation-Rates Data a. All Students
Men
2013-14 4-Class
N % N %
Am. Ind./AN 7 29 23 30
Asian 102 44 408 44
Black 109 23 369 23
Hispanic 156 29 275 29
Nat. Haw./PI 1 100 4 25
N-R Alien 65 35 185 52
Two or More 64 42 397 34
Unknown 0 - 5 60
White 1031 46 4672 47
Total 1535 42 6338 44
Women
2013-14 4-Class
N % N %
2 50 19 26
108 51 364 49
171 26 577 25
170 42 315 40
1 0 8 50
27 41 80 54
90 42 525 42
3 67 8 75
1094 49 4578 49
1666 46 6474 45
Total
2013-14 4-Class
N % N %
9 33 42 29
210 48 772 46
280 25 946 24
326 36 590 35
2 50 12 42
92 37 265 52
154 42 922 38
3 67 13 69
2125 48 9250 48
3201 44 12812 45
b. Student-Athletes
Men
2013-14 4-Class GSR
N % N % N %
Am. Ind./AN 0 - 0 - 0 -
Asian 0 - 0 - 0 -
Black 0 - 5 80 9 78
Hispanic 1 0 3 0 3 0
Nat. Haw./PI 0 - 0 - 0 -
N-R Alien 0 - 5 20 1 100
Two or More 0 - 0 - 0 -
Unknown 1 0 3 33 6 67
White 17 71 91 75 96 89
Total 19 63 107 69 115 84
Women
2013-14 4-Class GSR
N % N % N %
0 - 3 0 0 -
0 - 0 - 0 -
5 80 14 79 14 93
0 - 2 50 1 100
0 - 0 - 0 -
1 0 1 0 0 -
1 0 3 33 1 100
1 100 5 100 5 100
19 100 90 82 87 94
27 89 118 78 108 94
Total
2013-14 4-Class GSR
N % N % N %
0 - 3 0 0 -
0 - 0 - 0 -
5 80 19 79 23 87
1 0 5 20 4 25
0 - 0 - 0 -
1 0 6 17 1 100
1 0 3 33 1 100
2 50 8 75 11 82
36 86 181 78 183 91
46 78 225 74 223 89

Draft
c. Student-Athletes by Sport Category
Baseball
%-N
2013-14 4-Class GSR
Am. Ind./AN - - -
Asian - - -
Black - - -
Hispanic - - -
Nat. Haw./PI - - -
N-R Alien - - -
Two or More - - -
Unknown - - 100-a
White 0-a 53-d 83-e
Total 0-a 53-d 83-e
Men's Basketball
%-N
2013-14 4-Class GSR
Am. Ind./AN - - -
Asian - - -
Black - 0-a 75-a
Hispanic - - -
Nat. Haw./PI - - -
N-R Alien - - -
Two or More - - -
Unknown - - 100-a
White 100-a 83-b 86-b
Total 100-a 71-b 83-c
Men's CC/Track
%-N
2013-14 4-Class GSR
Am. Ind./AN - - -
Asian - - -
Black - 100-a 100-a
Hispanic - - -
Nat. Haw./PI - - -
N-R Alien - - -
Two or More - - -
Unknown - - -
White 100-a 76-e 85-e
Total 100-a 79-e 87-e
Football
%-N
2013-14 4-Class GSR
Am. Ind./AN - - -
Asian - - -
Black - - -
Hispanic - - -
Nat. Haw./PI - - -
N-R Alien - - -
Two or More - - -
Unknown - - -
White - - -
Total - - -
Men's Other
%-N
2013-14 4-Class GSR
Am. Ind./AN - - -
Asian - - -
Black - - 0-a
Hispanic 0-a 0-a 0-a
Nat. Haw./PI - - -
N-R Alien - 20-a 100-a
Two or More - - -
Unknown 0-a 33-a 50-a
White 75-b 82-e 95-e
Total 60-b 68-e 83-e
Women's Basketball
%-N
2013-14 4-Class GSR
Am. Ind./AN - 0-a -
Asian - - -
Black 0-a 40-a 75-a
Hispanic - 100-a 100-a
Nat. Haw./PI - - -
N-R Alien - - -
Two or More 0-a 0-a -
Unknown - - -
White 100-a 83-b 100-b
Total 33-a 47-d 92-c
Women's CC/Track
%-N
2013-14 4-Class GSR
Am. Ind./AN - - -
Asian - - -
Black 100-a 100-b 100-b
Hispanic - - -
Nat. Haw./PI - - -
N-R Alien - - -
Two or More - - -
Unknown - 100-a 100-a
White 100-b 85-d 90-d
Total 100-c 90-e 93-e
Women's Other
%-N
2013-14 4-Class GSR
Am. Ind./AN - - -
Asian - - -
Black 100-a 100-a 100-a
Hispanic - 0-a -
Nat. Haw./PI - - -
N-R Alien 0-a 0-a -
Two or More - 100-a 100-a
Unknown 100-a 100-a 100-a
White 100-b 81-e 95-e
Total 92-c 81-e 95-e
Values for N (a. 1-5, b. 6-10, c. 11-15, d. 16-20, e. greater than 20)

Draft
2. Undergraduate-Enrollment Data (All full-time baccalaureate-degree seeking students enrolled 2019-20)
a. All Students Men Women TotalN N N
Am. Ind./AN 12 41 53
Asian 574 594 1168
Black 419 613 1032
Hispanic 981 1118 2099
Nat. Haw./PI 8 10 18
N-R Alien 351 171 522
Two or More 313 420 733
Unknown 18 15 33
White 5382 6040 11422
Total 8058 9022 17080
b. Student-athletes # Men Women TotalN N N
Am. Ind./AN 0 1 1
Asian 2 1 3
Black 18 10 28
Hispanic 1 5 6
Nat. Haw./PI 2 0 2
N-R Alien 1 0 1
Two or More 3 3 6
Unknown 1 4 5
White 109 123 232
Total 137 147 284
c. Student-Athletes # By Sports Category
Men
Basketball Baseball CC/Track Football Other
Am. Ind./AN 0 0 0 0 0
Asian 0 1 0 0 1
Black 12 0 3 0 3
Hispanic 0 0 1 0 0
Nat. Haw./PI 0 1 0 0 1
N-R Alien 0 0 0 0 1
Two or More 1 0 1 0 1
Unknown 0 0 0 0 1
White 0 28 35 0 46
Total 13 30 40 0 54
Women
Basketball CC/Track Other
Am. Ind./AN 1 0 0
Asian 0 0 1
Black 4 4 2
Hispanic 0 1 4
Nat. Haw./PI 0 0 0
N-R Alien 0 0 0
Two or More 0 0 3
Unknown 0 1 3
White 11 37 75
Total 16 43 88
#Only student-athletes receiving athletics aid are included in this report.

NCAA DIVISION I GRADUATION RATES
INSTITUTION REPORT INFORMATION
Introduction.
This information sheet and the NCAA Division I Graduation Rates Institution Report have been
prepared by the NCAA, based on data provided by the institution in compliance with NCAA Bylaw
18.4.2.2.1 (admissions and graduation-rate disclosure) and the federal Student Right-to-Know Act.
Please note, the NCAA will make this report public.
The Graduation Rates Institution Report gives graduation information about the most recent six-year
graduating class of students and student-athletes who entered as freshmen in 2013-14. The graduation
rate (percent) is based on a comparison of the number (N) of students who entered a college or
university and the number of those who graduated within six years. For example, if 100 students
entered and 60 graduated within six years, the graduation rate is 60 percent.
The Graduation Rates Institution Report provides information about two groups of students:
1. All Students.
All undergraduate students who were enrolled in a full-time program of studies for a
baccalaureate degree; and
2. Student-Athletes.
Student-athletes who received athletics aid from the school for any period of time during their
entering year. [Note: Athletics aid is a grant, scholarship, tuition waiver or other assistance
from a college or university that is awarded on the basis of a student's athletics ability.]
Two different measures of graduation rates are presented in this report: Federal Graduation Rate and
NCAA Division I Graduation Success Rate (GSR). The Federal Graduation Rate indicates the
percentage of freshmen who entered and received athletics aid during a given academic year who
graduated within six years. The GSR adds to the first-time freshmen, those students who entered
midyear as well as student-athletes who transferred into an institution and received athletics aid. Both
the Federal Graduation Rate and the GSR subtract students from the entering cohort who are considered
allowable exclusions (i.e., those who either die or become permanently disabled, those who leave the
school to join the armed forces, foreign services or attend a religious mission). In addition, the GSR
subtracts those who left the institution prior to graduation, had athletics eligibility remaining and would
have been academically eligible to compete had they returned to the institution.
Graduation Rates Report.
The box at the top of the Graduation Rates Institution Report provides the most recent class
(i.e., 2013-14) and four-class Federal Graduation Rate (i.e., 2010-11 through 2013-14) for all students
and for student-athletes who received athletics aid at this school. Additionally, this box provides GSR
data (i.e., 2010-11 through 2013-14) for student-athletes.

NCAA Division I Graduation Rates
Institution Report Information
Page No. 2
_________
NCAA/02_27_20/JGS:ld
1. Graduation- Rates Data.
The second section of the report provides Federal Graduation Rate and GSR data for all
students, student-athletes and student-athletes by sport group. (Note: Pursuant to the
Student Right-to-Know Act, anytime a cell containing cohort numbers includes only one
or two students, the data in that cell and one other will be suppressed so that no individual
can be identified.)
a. All Students.
This section provides the freshman-cohort graduation rates for all full-time, degree-
seeking students by race or ethnic group. It shows the rate for men who entered as
freshmen in 2013-14 and the four-class average, which includes those who entered as
freshmen in 2010-11, 2011-12, 2012-13 and 2013-14. The same rates are provided for
women. The total for 2013-14 is the rate for men and women combined, and the
four-class average is for all students who entered in 2010-11, 2011-12, 2012-13 and
2013-14.
b. Student-Athletes.
This section provides the freshman-cohort graduation rates and the GSR for student-
athletes in each race and ethnic group who received athletics aid. Information is
provided for men and women separately and for all student-athletes.
c. Student-Athletes by Sports Categories.
This section provides the identified graduation rates as in 1-b for each of the eight
sports categories. (The small letters indicate the value of N according to the legend at
the bottom of 1-c.)
2. Undergraduate-Enrollment Data.
a. All Students.
This section indicates the total number of full-time, undergraduate, baccalaureate,
degree-seeking students enrolled for the 2019 fall term and the number of men and
women in each racial or ethnic group (not just freshmen).
b. Student-Athletes.
This section identifies how many student-athletes were enrolled and received athletics
aid for the 2019-20 academic year, and the number of men and women in each racial
or ethnic group.
c. Student-Athletes by Sports Categories. This section provides the enrollment data as
identified in 2-b for each of the eight sports categories.

Graduation Success Rate Report
2009 - 2012 Cohorts: University of Wisconsin-Milwaukee
Men's Sports
Sport GSR Fed Rate
Baseball 71 56
Basketball 75 43
CC/Track 87 74
Fencing - -
Football - -
Golf - -
Gymnastics - -
Ice Hockey - -
Lacrosse - -
Mixed Rifle - -
Skiing - -
Soccer 73 46
Swimming 88 77
Tennis - -
Volleyball - -
Water Polo - -
Wrestling - -
Men's Non-NCAA Sponsor. Sports - -
Women's Sports
Sport GSR Fed Rate
Basketball 91 53
Bowling - -
CC/Track 85 81
Crew/Rowing - -
Fencing - -
Field Hockey - -
Golf - -
Gymnastics - -
W. Ice Hockey - -
Lacrosse - -
Skiing - -
Soccer 88 62
Softball - -
Swimming 83 67
Tennis 100 88
Volleyball 100 100
Water Polo - -
Women's Non-NCAA Sponsor. Sports - -

University of Wisconsin-Milwaukee
FRESHMAN-COHORT GRADUATION RATES All Students Student-Athletes #
2012-13 Graduation Rate 48% 75%
Four-Class Average 45% 67%
Student-Athlete Graduation Success Rate 84%
1. Graduation-Rates Data a. All Students
Men
2012-13 4-Class
N % N %
Am. Ind./AN 5 20 23 30
Asian 98 51 380 45
Black 64 28 336 23
Hispanic 39 23 164 32
Nat. Haw./PI 0 - 7 0
N-R Alien *** *** 144 63
Two or More 133 32 419 33
Unknown *** *** 8 38
White 989 51 4983 48
Total 1395 48 6464 45
Women
2012-13 4-Class
N % N %
6 17 26 31
73 49 343 45
133 29 531 24
45 44 185 34
4 50 8 50
*** *** 66 59
158 41 520 42
*** *** 14 29
1117 51 4868 48
1557 47 6561 45
Total
2012-13 4-Class
N % N %
11 18 49 31
171 50 723 45
197 28 867 24
84 35 349 33
4 50 15 27
*** *** 210 61
291 37 939 38
*** *** 22 32
2106 51 9851 48
2952 48 13025 45
b. Student-Athletes
Men
2012-13 4-Class GSR
N % N % N %
Am. Ind./AN *** *** 0 - 0 -
Asian 0 - *** *** 0 -
Black *** *** 7 57 12 75
Hispanic *** *** *** *** *** ***
Nat. Haw./PI 0 - 0 - 0 -
N-R Alien *** *** 5 20 3 100
Two or More *** *** *** *** *** ***
Unknown *** *** 5 20 6 67
White 28 82 92 70 94 82
Total 32 78 113 63 118 80
Women
2012-13 4-Class GSR
N % N % N %
*** *** 3 0 0 -
0 - *** *** 0 -
*** *** 13 77 13 85
*** *** *** *** *** ***
0 - 0 - 0 -
*** *** 0 - 0 -
*** *** *** *** *** ***
*** *** 6 67 5 100
27 74 100 72 90 88
35 71 126 70 110 88
Total
2012-13 4-Class GSR
N % N % N %
*** *** 3 0 0 -
0 - *** *** 0 -
*** *** 20 70 25 80
*** *** *** *** *** ***
0 - 0 - 0 -
*** *** 5 20 3 100
*** *** *** *** *** ***
*** *** 11 45 11 82
55 78 192 71 184 85
67 75 239 67 228 84

c. Student-Athletes by Sport Category
Baseball
%-N
2012-13 4-Class GSR
Am. Ind./AN - - -
Asian - - -
Black - - -
Hispanic - - -
Nat. Haw./PI - - -
N-R Alien - - -
Two or More - - -
Unknown - - 100-a
White 75-a 56-d 70-e
Total 75-a 56-d 71-e
Men's Basketball
%-N
2012-13 4-Class GSR
Am. Ind./AN - - -
Asian - - -
Black - 0-a 67-b
Hispanic - - -
Nat. Haw./PI - - -
N-R Alien - - -
Two or More - - -
Unknown - - 100-a
White 100-a 75-a 80-a
Total 100-a 43-b 75-c
Men's CC/Track
%-N
2012-13 4-Class GSR
Am. Ind./AN - - -
Asian - - -
Black 100-a 100-a 100-a
Hispanic - - -
Nat. Haw./PI - - -
N-R Alien - - 100-a
Two or More - - -
Unknown - - -
White 80-b 70-e 85-e
Total 82-c 74-e 87-e
Football
%-N
2012-13 4-Class GSR
Am. Ind./AN - - -
Asian - - -
Black - - -
Hispanic - - -
Nat. Haw./PI - - -
N-R Alien - - -
Two or More - - -
Unknown - - -
White - - -
Total - - -
Men's Other
%-N
2012-13 4-Class GSR
Am. Ind./AN - - -
Asian - 0-a -
Black - - 50-a
Hispanic 0-a 0-a 0-a
Nat. Haw./PI - - -
N-R Alien 0-a 20-a 100-a
Two or More - 100-a 100-a
Unknown 100-a 20-a 50-a
White 85-c 75-e 88-e
Total 75-d 61-e 80-e
Women's Basketball
%-N
2012-13 4-Class GSR
Am. Ind./AN 0-a 0-a -
Asian - - -
Black 50-a 50-a 67-a
Hispanic - 100-a 100-a
Nat. Haw./PI - - -
N-R Alien - - -
Two or More - 0-a -
Unknown - - -
White 100-a 75-b 100-b
Total 40-a 53-d 91-c
Women's CC/Track
%-N
2012-13 4-Class GSR
Am. Ind./AN - - -
Asian - - -
Black 100-a 86-b 88-b
Hispanic - - -
Nat. Haw./PI - - -
N-R Alien - - -
Two or More - - -
Unknown 100-a 100-a 100-a
White 67-a 75-d 81-d
Total 80-a 81-e 85-e
Women's Other
%-N
2012-13 4-Class GSR
Am. Ind./AN - - -
Asian - - -
Black 100-a 100-a 100-a
Hispanic - 0-a -
Nat. Haw./PI - - -
N-R Alien - - -
Two or More 100-a 100-a 100-a
Unknown - 33-a 100-a
White 74-e 71-e 88-e
Total 76-e 70-e 89-e
Values for N (a. 1-5, b. 6-10, c. 11-15, d. 16-20, e. greater than 20)

2. Undergraduate-Enrollment Data (All full-time baccalaureate-degree seeking students enrolled 2018-19)
a. All Students Men Women TotalN N N
Am. Ind./AN 30 40 70
Asian 496 528 1024
Black 521 855 1376
Hispanic 271 314 585
Nat. Haw./PI 9 5 14
N-R Alien 448 251 699
Two or More 1234 1530 2764
Unknown 25 17 42
White 6021 6750 12771
Total 9055 10290 19345
b. Student-athletes # Men Women TotalN N N
Am. Ind./AN 2 1 3
Asian 3 1 4
Black 19 9 28
Hispanic 4 5 9
Nat. Haw./PI 2 0 2
N-R Alien 1 1 2
Two or More 7 8 15
Unknown 4 1 5
White 130 134 264
Total 172 160 332
c. Student-Athletes # By Sports Category
Men
Basketball Baseball CC/Track Football Other
Am. Ind./AN 0 0 0 0 2
Asian 0 1 0 0 2
Black 11 0 4 0 4
Hispanic 0 1 1 0 2
Nat. Haw./PI 0 1 0 0 1
N-R Alien 0 0 0 0 1
Two or More 3 1 1 0 2
Unknown 0 0 3 0 1
White 2 37 37 0 54
Total 16 41 46 0 69
Women
Basketball CC/Track Other
Am. Ind./AN 1 0 0
Asian 0 0 1
Black 4 2 3
Hispanic 0 2 3
Nat. Haw./PI 0 0 0
N-R Alien 0 0 1
Two or More 1 1 6
Unknown 0 1 0
White 11 41 82
Total 17 47 96
#Only student-athletes receiving athletics aid are included in this report.

ATTACHMENT E

Academic Progress Rate ComparisionHorizon League 2018-19
Cleveland State Detroit
Green Bay Oakland UIC IUPUI PFW RMU
Wright State
Youngstown State
Northern Kentucky Milwaukee UWM Rank
DI Average
Horizon League
AveBaseball NA NA NA 970 993 NA 964 NA 990 977 991 989 4/7 977 982Men's Basketball 941 909 985 952 954 980 985 948 990 958 964 983 4/12 966 962Men's Cross Country NA 988 963 984 967 996 971 NA 995 970 993 1000 1/10 982 983Men's Soccer 962 989 993 949 965 991 955 984 970 NA 957 964 7/11 978 971Men's Swimming 984 NA 975 990 952 977 NA NA NA NA NA 971 5/6 983 975Men's Track NA 958 NA 967 976 993 NA NA NA 953 1000 996 2/7 974 978
Women's Basketball 1000 986 996 973 977 995 948 1000 985 990 990 1000 T1/12 983 987Women's Cross Country 1000 1000 994 1000 1000 997 984 993 1000 987 1000 1000 T1/12 989 996Women's Soccer 990 984 995 978 991 1000 1000 988 998 957 995 986 9/12 990 989Women's Swimming 988 NA 983 992 1000 997 NA NA NA 991 NA 994 3/7 993 992Women's Tennis 974 NA NA 992 1000 1000 NA NA NA 973 1000 1000 T1/7 991 991Women's Track 967 987 NA 978 994 993 967 1000 990 965 1000 992 5/11 984 985Volleyball 979 NA 1000 1000 980 1000 1000 985 1000 970 989 990 6/11 988 990
All Academic Progress Rate Reports for all NCAA institutions can be found online at: https://web1.ncaa.org/maps/aprRelease.jsp

Graduation Success Rate ComparisionHorizon League 2020-21
Cleveland State Detroit UIC
Green Bay* IUPUI
Northern Kentucky Oakland PFW RMU
Wright State
Youngstown State Milwaukee UWM Rank
Horizon League Average
DI (Non-Football) Average
DI (Overall) Average
UWM Single
Year GSRBaseball NA NA 76 NA NA 82 91 86 NA 100 79 95 3/7 87 86 86 100Men's Basketball 93 62 92 100 92 78 75 100 100 100 86 100 T1/12 90 87 84 100Men's Soccer 80 88 92 82 100 69 94 59 77 58 NA 79 7/11 80 86 87 100Men's Swimming 83 NA 88 78 71 NA 100 NA NA NA NA 88 T2/6 85 89 91 60Men's CC/Track NA 86 75 89 87 88 73 64 NR 71 66 84 5/10 78 84 84 85.7
Women's Basketball 100 85 93 100 100 100 83 83 100 80 100 92 8/12 93 92 92 100Women's Soccer 100 100 100 96 100 89 100 90 100 90 87 92 8/11 95 95 95 87.5Women's Swimming 80 NA 100 95 94 NA 96 NA NA NA 94 96 T2/7 94 96 96 100Women's Tennis 100 NR 100 NR 100 100 100 NR NR NR 100 100 T1/7 100 97 96 100Women's CC/Track 100 92 86 100 89 77 96 76 100 89 67 94 5/12 89 92 91 80Volleyball 100 NA 100 91 100 100 100 77 100 100 100 100 T1/11 97 94 94 100
Overall GSR 89 90 91 90 92 84 90 80 86 87 78 91 T2/12 87 89Single Year GSR 92Overall Fed Rate 70 70 74 72 72 67 73 57 64 61 59 73 2/12 68 69Student Body Fed Rate 48 67 60 47 51 45 54 35 65 40 40 45 T7/12 50Single Yr Fed Rate 40 72 74 78 72 76 65 56 66 63 63 70 6/12 66Single Yr Student Body 48 73 63 36 54 48 56 39 69 43 48 46 8/12 52
*Cross Country Only
The GSR report does not provide the single year GSR data for other institutions. The single year GSR data was gathered from the NCAA IPP application.
All Graduation Rate Success Reports for all NCAA institutions can be accessed online at: http://web1.ncaa.org/GSRSearch/exec/homePage

ATTACHMENT F


2015 Horizon League Compliance Review December 2-3, 2015
University of Wisconsin Milwaukee
A. Governance and Institutional Control
Current Strengths:
1. The Director of Athletics reports directly to the Vice Chancellor for StudentAffairs with a dotted line to the Chancellor. The Director of Athletics is amember of the Chancellor’s Cabinet. Both reporting lines meet and communicateregularly (i.e. at least monthly on a formal basis) with the Director of Athleticsand are kept apprised of all important matters regarding NCAA rules compliance.
2. The Chancellor and Vice Chancellor are notified of all issues that arise in the areaof NCAA rules compliance in a timely manner and are involved in all majorpersonnel decisions, including the hiring and firing of high profile coaches.
3. The Faculty Athletic Representative communicates consistently (i.e. two formalmeetings per year as well as prior to all in-person League meetings) with theChancellor. The Director of Athletics meets with the Faculty AthleticsRepresentative one time per month.
4. There is an established Athletic Board that meets one time per month to discussathletic issues, of which the FAR is a member to provide the outside of athleticsperspective on issues.
5. There are established procedures for the reporting and investigation of allegedrules violations. The Assistant AD for Compliance leads the paperwork andfollow-up for alleged rules violations. The Chancellor is kept apprised ofviolations.
6. Job descriptions and coaches’ contracts reference compliance with NCAA rulesand address consequences of the institution or NCAA discovering a majorviolation including unethical conduct.
7. The Chancellor is kept apprised of and signs off on NCAA graduation metricssuch as APR, GSR and academic success after discussing with the Director ofAthletics at a high level.
8. A missed class policy specific to athletes is in place that is signed by the FAR. Inaddition, early registration for athletics minimizes missed class time for athleticreasons.
2

9. The Vice Chancellor for Student Affairs handles athletics budgeting oversight.
The Director of Athletics reports to the Faculty Senate each semester on key issues.
10. The athletic department receives outstanding support from the financial aid office admissions office, and university registrar. The liaisons in each of these offices have established excellent working relationships with the Assistant AD for Compliance. The liaisons and athletics department staff members have lengthy tenures at the university; therefore, everyone is comfortable with and adheres to the compliance processes.
11. The athletic department is audited on an annual basis by a group of outside auditors.
12. The FAR is involved at beginning of the year athletics meetings, also meets with athletics monthly. The FAR is also involved on the institution’s athletics board.
Suggestion for Improvement:
1. The Assistant AD for Compliance has a dotted line report to the Chancellor,
however does not currently meet with or communicate key or confidential institutional compliance issues on a normal basis. Implementing a more uniform or consistent communication line or meeting structure would provide the institution further protection from an NCAA institutional control violation.
2. The NCAA is requiring more monitoring in compliance than ever before. Milwaukee has tenured, long-standing distinct individuals in campus departments such as the registrar and financial aid that deal with student-athlete eligibility and scholarships. A backup individual liaison to athletics in each of these departments is necessary in order to insulate athletics from risk in the event of an immediate departure or extended time period to train a new liaison.
B. Eligibility Certification Current Strengths:
1. Student-athletes have an enrollment limit placed on their account the Friday
before classes start each semester to ensure that student-athletes cannot drop below full-time status of 12 hours. A weekly full-time credit report is run through the Registrar’s office.
2. The Registrar has access to Compliance Assistant software, rolls over the eligibility data in the software each year, and enters student-athlete data for
3

eligibility based on the student-athlete list provided by the Assistant AD for Compliance.
3. Transfer student-athlete eligibility is handled by a specific transfer credit team. This allows for determinations on what credits are transferrable to be determined by experts instead of solely someone in athletics.
4. The Registrar is the final reviewer of both APR and GSR data after the Assistant AD for Compliance inputs data, which demonstrates institutional control.
5. The Registrar liaisons attend the NCAA Compliance Rules Seminars and supplement current NCAA rules education through educational sessions with the Assistant AD for Compliance.
6. The Admissions and Registrar offices do not receive undue pressure from any
athletics department staff members or coaches regarding the admissions status of prospective student-athletes or eligibility status of current student-athletes since all communication comes through the Assistant AD for Compliance.
7. The Admissions and Registrar liaison have athletics responsibilities listed in their
job descriptions.
8. The Admissions office follows the standard process for all special admissions, not just athletes, which includes admission into the University Opportunity Center.
Suggestions for Improvement:
1. The list of student-athletes is sent to the Registrar from the Assistant AD for
Compliance without the Registrar being able to check in the institutional system whether or not a student is in fact a student-athlete. If the institutional system had a group indicator for student-athletes to cross check the athletics department list, it would ensure that no student-athletes are missed in full-time credit checks or eligibility certification.
2. Only three individuals, two from the Registrar and the Assistant AD for Compliance, are involved in eligibility certification each semester (i.e. credits hour requirements, percentage towards degree and GPA). Student-athletes’ on-campus advisor is involved in certification by completing specific student-athlete degree audits that then are provided to Registrar and athletics. It would be prudent to have an additional person outside of athletics who is familiar with requirements from specific colleges on the eligibility committee. With the FAR not currently involved in eligibility certification, a suggested solution would be to make the FAR this “person outside of athletics.”
4

3. It would be beneficial for the Admissions liaisons to athletics to attend the NCAACompliance Rules Seminars. It is important for them to supplement their currentNCAA rules education and attendance offers a good learning opportunity.
4. The Admissions office should flag all student-athletes once they are admitted sothat the Assistant AD for Compliance does not have to continually ask aboutstudent-athlete’s admission status. If they are flagged, a report could potentiallybe provided on a normal timeline from admissions to ease the burden on trackingstudent-athlete admission.
C. Academic Support
Current Strengths:
1. In addition to an assigned primary on-campus advisor, the athletic academicadvisors are a secondary advisor to all student-athletes throughout their career atthe university. Academic advisors have a manageable work load based on studentcount.
2. Student-athletes have good access to tutors through tutoring services. All student-athletes have an opportunity to meet with a tutor. Academic advisors, tutors andstudent instructors are trained and educated on academic fraud as well as NCAArules by the Assistant AD for Compliance in collaboration with the academiccenter prior to involvement with student-athletes.
3. Freshman and transfers having to be involved in a study table is a normal protocolin DI, but a good practice that the institution follows, nonetheless. For studytables, the GPA threshold is set per team after consultation with the academiccenter. Men’s and women’s basketball having objective based study table goals isa strength of the academic support system, with student-athletes not able topractice if not meeting objectives. Class checks are done for those student-athletes where poor attendance is suspected.
4. With three full-time employees in academics, the athletics department hasadequate resources to support student-athletes, including at-risk students. TheAccessibility Resource Center is a great resource to assist at-risk student-athletes.The institution has a procedure in place to go through procedures to test student-athletes for learning disabilities. These at-risk student-athletes are tracked withmore frequency, and many are tracked in smaller groups by coaching staffs.
Suggestion for Improvement:
1. In addition to the advisors attendance to N4A that already takes place, it would bevaluable for the institution to provide the resources for the academic advisor teamto attend Regional Rules, especially if it is within driving distance as it takes placein Indianapolis every other year.
5

D. Financial Aid Monitoring
Current Strengths:
1. The Assistant AD for Compliance and the Director of Financial Aid communicateregularly regarding the aid received by student-athletes, and inform each other ofany outside aid a student-athlete receives. Outside aid is not inputted into thesystem until it is approved on an athletics form and sent to financial aid.
2. The Director of Financial Aid has athletics listed in her job description and is theone primary contact with athletics. The director attends the NCAA RegionalRules Seminar.
3. The Director of Financial Aid is the final sign off for institution squad lists asidefrom getting coaches to sign prior to filing.
4. The Compliance office and the Financial Aid office have a procedure in place forindicating non-renewal, renewal and reduction. There is a form for change ofstatus that the student-athlete signs indicating understanding of the change. Theinstitution also has a written policy and procedure in place for hearings related tocancellation/non-renewal of financial aid.
5. All student-athletes are part of an NCAA group in the financial aid system, whichis the same group used for the Registrar. Not just students on aid are in thisgroup, but all student-athletes with a roster spot. This ensures that the financialaid department system cannot award excess or impermissible aid to student-athletes.
6. The Financial Aid department includes an appeals process policy in the student-athlete handbook.
7. The Director of Financial Aid has attended the NCAA Compliance RulesSeminars in the past. She is educated about NCAA rules and through the seminarhas developed a network of other financial aid personnel to contact if he hasquestions or wants to discuss a topic.
Suggestion for Improvement:
1. The athletics department sends the financial aid appeal letters to the coach,student-athlete, financial aid office, Financial Aid Director and sportadministrator. By NCAA rule, notification of the opportunity for an appeal lettermust be sent by the institution’s regular financial aid authority.
6

2. Even though financial aid data is confirmed by the Director of Financial Aid,include a checks and balance between the Director of Financial Aid and athleticsfor the inputting (or after the data has been input) of athletics financial aid into theNCAA Compliance Assistant Software and into the UW system. This check andbalance should go both ways; Director of Financial Aid to athletics, and athleticsto Director of Financial Aid.
3. Begin to train a secondary financial aid contact with athletics in the event that theprimary contact is unavailable or is no longer with the institution, as the primarycontact is the sole knowledgeable person about athletics in the financial aid office.
E. Recruitment Monitoring
Current Strengths:
1. Official visit monitoring is very good. Prior to a visit, a preliminary evaluation oftranscripts are completed as a best practice. Coaches are required to submitpaperwork to the Compliance Coordinator prior to the visit and only receiveapproval from compliance upon receipt of a signed copy of such paperwork.Student hosts are given written education about the do’s and don’ts of hosting,understand that they have to fill out forms to return to coaches and are required todocument expenses.
2. Coaches are required to submit recruiting logs in paper form to the complianceoffice on a monthly basis. All coaches interviewed appeared to have a goodsystem for ensuring the initial permissible call is logged and evaluation days aretracked.
3. For some sports, complimentary tickets for athletes and coaches are handledelectronically and each ticket must list name and relationship to ensure tickets arenot going to the incorrect individuals (i.e. so tickets are not going to IndividualsAssociated with Prospects).
4. An academic workup is completed by compliance/academics for each prospectthat visits the university. This workup is given to the coach prior to the visit, aswell as the prospective student when on campus.
5. Sports with certified events or event restrictions are handled through coaches witheducation coming from the Assistant AD for Compliance on this topic each year.
6. Coaching staffs had one individual that handled recruiting travel, countingevaluations, and playing/practice season logs, which leads to consistency in traveland evaluation.
Suggestions for Improvement:
7

1. In order to ease the tracking down of forms and paperwork for the complianceoffice, instituting some sort of online system for submitting recruiting logs wouldbe beneficial. This would also allow coaches to input data on a timely basisinstead of on monthly paperwork, which might ensure better quality of records.This could come through the university’s online system or recruiting software.
2. Move to an electronic system for all sports complimentary tickets. Some teamsindicated that they are using paper forms with just the name listed, which opensthe institution up to providing complimentary tickets to impermissible persons.
F. Playing and Practice Season and Outside Competition
Current Strengths:
1. Coaches complete playing and practice season declarations in a timely mannerand submit them to the compliance office for approval. Also, weekly playing andpractice logs are submitted to compliance on a monthly basis and student-athletessign off on the forms.
2. All student-athletes interviewed indicated that their coaches stayed within thepermissible number of practice hours. In addition, those sports with in/out ofseason work understood the breakdown prior to the season.
3. Coaches submit playing and practice declaration, schedules and promotionalmaterials to the compliance office for approval.
Suggestion for Improvements:
1. Add a check/balance to have each sport randomly select student-athletes sign offon playing and practice season forms instead of one or two student-athletes orcaptains.
G. Rules Education
Current Strengths:
1. There are monthly rules education meetings that all coaches are required toattend. Staff members are educated at department staff meetings. Materials aresent via email as a follow up if an individual misses a meeting.
2. The compliance staff does a nice job of using technology for rules education forcoaches, students, and staff.
3. The institution provides NCAA rules education to all new employees. Additionalinformation is given regarding their specific area of employment.
8

H. Amateurism, Extra Benefits, Boosters and Agents
Current Strengths:
1. Boosters are well educated about extra benefits. Educational materials areprovided on institution’s website, as well as “do/don’t” information is distributedto all boosters once a year.
2. The Assistant AD for Compliance meets with each team at the beginning of eachsport season to review NCAA legislation, extra benefits and encourage askingquestions when they are unsure about rules related to extra benefits and boosters.
3. Senior student-athletes (or those seeking professional career prior to graduation)are well educated about permissible and non-permissible activities related toagents. Student-athletes who were interviewed said that they don’t have muchagent interaction, but also that their coaches had talked to them about agents andthat they informed their coaches when they received correspondence.
4. Student-athletes do not often receive per diem cash, as teams eat meals usinginstitutional credit cards. But, if student-athletes do receive per diem, they arerequired to sign for all money received during travel.
5. The Assistant AD for Compliance monitors the amateurism status of all incomingand current student-athletes.
6. The Assistant AD for Compliance has the ability to review and approve allinstitutional credit card expenditures.
7. All memorabilia, appearance and donation requests go through the complianceoffice to ensure that each entity receiving a donation is acceptable per NCAArules. All requests are documented on the institutional form.
Suggestion for Improvements:
1. All outside groups that wish to use to the athletic facilities are required to gothrough the facilities staff. But, the process seemed somewhat informal. In orderto ensure that groups consisting of prospects do not get free or reduced rental offacilities, it would be prudent to formalize the rental approval process within thedepartment even though there is verbal process that is followed for facilityapproval for outside groups to use the one facility that athletics controls for rental(soccer field).
2. In the future, it would be beneficial for the Assistant AD for Compliance to meetwith the boosters at an event to give an in-person presentation on rules education.
9

3. The equipment management is loosely managed at the institution. Since coaches order equipment, the one point person in athletics should be copied on all orders placed by anyone outside of the administrator that handles equipment.
I. Camps and Clinics Current Strengths:
1. The compliance office has a detailed policy and procedure, including required forms that must be filled out and returned before and after the camp or clinic, relating to institutional camps and clinics.
2. The compliance office requires institutional staff members, high school coaches and student-athletes to submit an employment form to the Assistant AD for Compliance to review and ensure proper payments.
3. The business manager administers camp funds for all institutional camps. The business manager also pays all employees of the camps only after receiving a camp employment form for each employee.
Suggestion for Improvements:
1. During the review, privatizing camps was mentioned on numerous occasions. The compliance office should be aware of any private camps, or desire to privatize camps, to ensure that the camps are still meeting NCAA institutional camp legislation and sports that do not have the ability to host outside, non-institutional camps are not doing so.
2. The business manager should review and audit the books of all privatized coaches camps, as all camps run by an institution’s coach are considered to be institutional camps.
J. Student-Athlete Employment Current Strengths:
1. Prior to the student-athlete’s employment, the employment arrangement must be approved in writing by the Assistant AD for Compliance and each student-athlete signs an employment form.
2. There is appropriate monitoring of non-athletic employment. All student-athletes with jobs are required to have their employer complete paperwork detailing payment and other employment information.
K. Student-Athlete Welfare
10

Current Strengths:
1. The institution has a way to anonymously report NCAA violations so that student-
athletes or administrators do not have to be involved in the reporting if they do not want their name attached to the violation.
2. Men’s/women’s basketball and SAAC student-athletes take part in media training.
3. All student-athletes interviewed believed that there was someone in the athletics department that they could go to in the event of a major problem/issue related to their team, themselves or the department.
4. The institution partners with the health center for all eating disorder issues in the event that an intervention is necessary.
Suggestion for Improvements:
1. Implement a protocol where all supplements taken or used by student-athletes get approved by sports medicine/athletic training.
2. The institution training staff allows weigh-ins. Weigh-ins are on a more frequent basis for men’s teams and only at the beginning and end of each year for women’s teams. With the heightened sensitivity surrounding this area of mental illness, the institution needs to monitor this area to ensure that this is going to continue being the proper protocol.
The Milwaukee compliance department has numerous strengths that have been highlighted in this report. The review emphasized the university and athletic department’s commitment to compliance. The report also emphasizes the compliance office’s relationship and collaboration with other departments on campus. The compliance office has appropriate and effective monitoring procedures and policies in place. We have made some suggestions, mostly minor tweaks, for improvement but overall were pleased with the outcome of the review, as the Assistant AD for Compliance does a nice job managing the athletics compliance program.
11

ATTACHMENT G


Page 1 of 1
Board of Regents Friday, June 10, 2022
Item II.9.
2022 REGENTS ACADEMIC STAFF EXCELLENCE AWARDS
REQUESTED ACTION Presentation of the Board of Regents 2022 Academic Staff Excellence Awards. SUMMARY The purpose of the annual Regents Academic Staff Excellence Awards is to recognize the dedicated work, vital services, and outstanding contributions of the UW System’s non-instructional academic staff. UW System universities may nominate one non-instructional administrative or professional academic staff member and one program primarily staffed by non-instructional and professional staff for these awards. The Regents Academic Staff Excellence Awards Committee selects the recipients, including two individuals and one program, who receive awards of $7,500 each to support professional development or program enhancements. The 2022 Academic Staff Excellence Award recipients are:
• Robin Jens, Assistant Dean of Student Services, College of Nursing, and Interim Student Service Director, Zilber School of Public Health, UW-Milwaukee
• Ann Lawton, Violence Prevention Coordinator, Lecturer in Art, and Art Therapist, Student Health and Counseling Services, UW-River Falls
• Center for Excellence in Teaching and Learning, UW-Eau Claire ATTACHMENTS
• Profiles of 2022 Academic Staff Excellence Award Recipients

Profile of Robin Jens
Assistant Dean of Student Services, College of Nursing, and Interim Student Service Director, Zilber School of Public Health
University of Wisconsin–Milwaukee (UWM) 2022 Regents Academic Staff Excellence Award Individual Recipient
Highlights from nomination materials:
• Has worked at UWM for over 16 years. As assistant dean of student services for the College of Nursing, leads Student Affairs staff and manages office. Oversees advising, recruiting, and retaining undergraduate and graduate nursing students. Since November 2020, has worked in a similar role for Zilber School of Public Health.
• Leadership creates bridges between faculty and student affairs to benefit students at all levels, leading to improvements in student services.
• Played a pivotal role in establishing Nursing program at UW-Milwaukee at Waukesha, helping to meet a critical workforce need. Her advocacy of the idea and organizational acumen resulted in expanding the UWM Nursing program by 32 students in 2021, with an additional 45 students taking prerequisite classes.
• Facilitated adoption of nursing-specific classroom technology at UWM at Waukesha. • Led Student Affairs team at UWM’s Zilber School of Public Health through a challenging time of transition,
playing a leadership role in the campus 2030 Strategic Plan to merge the university’s three health schools/colleges into two colleges. Working collaboratively with College of Health Sciences, facilitating discussions with a combined 24 student affairs professional staff to identify best practices and establish new teams to serve 3,000+ students.
• Has served on and provided a student-centered perspective on UWM’s Transfer Pathways Committee, Academic Staff Committee, University Relations Committee, Academic Support and Leadership Committee, Academic Advising Professional Development Workgroup (committee chair), Health Professions Living/Learning Community, Academic Advising Task Force, and Academic Services & Advising Leadership Council.
• At the UW System level, has represented the College of Nursing on the Math Pathways program and a Workforce Development/Department of Public Instruction (DPI) initiative to create professional pathways for high school students. Also represented the Milwaukee campus at the UW System Academic Staff Representatives Committee for 18 months when the Title and Total Compensation initiative was in the design and initial roll-out phase.
• In 2020, organized one of the first learning circles on campus focused on race and racism as a professional development activity for the College of Nursing’s student affairs personnel.
• Has served in several capacities with Wisconsin College Personnel Association, with members from all Wisconsin public and private four-and two-year institutions; mentors new professionals and graduate students each year.
In Robin Jens’ own words: • “I believe in the UW System’s central mission of helping our communities through our ability to heighten
students’ intellectual, cultural, and humane sensitivities while guiding them as they develop their purpose.” In the words of colleagues:
• “Robin Jens has had a sustained positive impact on student success at UWM, in the College of Nursing, in the Joseph J. Zilber School of Public Health, and as a valued campus contributor on far-reaching student success and strategic planning initiatives.”—Johannes Britz, Provost and Vice Chancellor for Academic Affairs, UW-Milwaukee
• “Robin has the remarkable ability to connect, influence, and build strong relationships with students, faculty, and staff at UWM, within the UW System, and in the community at large. She has created an environment in which students feel ‘heard’ and part of the curricular and organizational changes within the College of Nursing.” — College of Nursing Student Services Team, UW-Milwaukee

Profile of Ann Lawton
Violence Prevention Coordinator, Lecturer in Art, and Art Therapist Student Health and Counseling Services
University of Wisconsin–River Falls 2022 Regents Academic Staff Excellence Award Individual Recipient
Highlights from nomination materials:
• Has served at UW-River Falls since 2011; positions include lecturer in the Art Department; Board-Certified Art Therapist for Student Counseling, and Violence Prevention Coordinator.
• As Violence Prevention Coordinator, plans, implements, and evaluates theory and evidence-informed education and programming to promote healthy relationships and prevent sexual and intimate partner violence, gender-based violence, stalking, and hazing; strives to empower students to be compassionate, proactive, healthy members of the communities they learn, work, and live in.
• Creative methods to connect with and support students include online programming, outreach installations, and a new violence prevention social media account.
• Leads art therapy groups for Student Health and Counseling Services and advises the Art Therapy Club. • Has taught a variety of foundational level art courses, including design, drawing, and introduction to art therapy. • As mixed media artist, uses the applications of drawing, painting, and collage to document and process daily life. • Community art therapy work focuses on populations impacted by high trauma, including incarcerated
individuals, trafficked girls, domestic abuse survivors, individuals coping with addiction, and neurodivergent children.
• Examples of her work include a variety of campus community art projects such as the Empty Place at the Table installation in residence halls for domestic violence awareness and Paint Yourself in the Community; training and outreach for student athletes in compliance with National Collegiate Athletic Association (NCAA) requirements; hazing prevention training for student organizations; care and consent take-and-make kits for students; and Falcon Community Foundations, a workshop designed to bring awareness to the connection between individual and communal accountability concerning healthy relationships and bystander intervention.
• Credits success of violence prevention efforts to colleagues' continuous support and encouragement, as well as willingness to try inventive approaches to transform ideas into realities.
• Member of Academic Staff Council • Select awards: Chancellor’s Award for Non-Instructional Academic Staff: Violence Prevention Coordinator
(2021); College of Arts and Sciences Award for Excellence in Teaching (2018).
In Ann Lawton’s own words: • “Artmaking alleviates psychological defenses, creates opportunities for verbal discussion, builds self-esteem,
and promotes self-awareness and empathy—all attributes necessary in addressing and facilitating change to dismantle the culture of sexual violence and unhealthy relationship behaviors.”
In the words of colleagues: • “[Ann] epitomizes excellence and perseverance and is committed to helping students be successful while
promoting a caring, healthy campus community….And, as always, she does this in a way that leads people to seek her out. She is approachable, kind, and funny. She has found a way to make the hard work of prevention, with its heavy subject matter and difficult conversations, accessible to all.”—David Travis, Provost and Vice Chancellor for Academic Affairs, UW-River Falls
• “Put simply, Ann lives out her value and ethic of caring for student success and well-being in incredibly concrete ways and with a consistency and efficacy that is notable even within the incredibly student-focused and caring environment of UWRF.”—Cyndi Kernahan, Professor of Psychological Sciences, Director of the Center for Excellence in Teaching and Learning, UW-River Falls

Profile of Center for Excellence in Teaching and Learning
UW-Eau Claire 2022 Regents Academic Staff Excellence Program Award Recipient
Highlights from nomination materials:
• The mission of UW-Eau Claire’s Center for Excellence in Teaching and Learning (CETL) is to provide programming and assistance for faculty and staff to enhance their work as educators.
• Under the leadership of its director, Dr. Angie Stombaugh, CETL carries out its core mission of supporting teaching and learning through a wide array of programming, including innovative new faculty orientation; communities of practice focused on common classroom needs; individual coaching for faculty struggling with novel teaching situations; and “just-in-time” pop-up opportunities for seasonal instructors. This work is informed by research-based best practices in teaching and learning.
• Key contributions include transforming UW-Eau Claire’s Liberal Education program, forging an array of collaborations that foster an inclusive learning community, and designing strategies that kept classes going during the COVID-19 pandemic.
• The Center led 66 faculty in communities of practice through the piloting, revisions, and implementation of 11 rubrics that are now the foundation for assessment of Liberal Education on campus. Faculty and instructional academic staff teaching courses in the Liberal Education Core now use these approved rubrics to assess whether students have met benchmarks for each of the learning outcomes. Liberal Education expands beyond course experiences. One example is CETL's extensive work with the Center for International Education, which resulted in the first guided experience for students to reach Liberal Education outcomes through study abroad.
• CETL developed a program that assembles teams of three instructors and a coach to explore ways courses can be better designed to serve students traditionally underrepresented in higher education (EDI Quads).
• As part of UW-Eau Claire’s commitment to consistently enhance student success, CETL has built a plan to provide all UW-Eau Claire faculty and instructional academic staff with professional development in transparent design, an approach to enhance student success for all students in their classes. To advance this project, they have developed in-person, online, and department-based delivery models. To complete the professional development, instructors submit two revised assignments for review by a trained group of colleagues.
• During the pandemic, CETL enabled and empowered faculty who had never delivered high-quality teaching and learning in a remote format. CETL staff provided continuous support to instructors on effective pedagogy for online learning. Instructors could choose from live or recorded online support or individual consultation.
• CETL collaborates with UW-Eau Claire’s McIntyre Library and the Services for Students with Disabilities office. CETL and library staff have worked together to assist faculty in using open educational resources in their classes and in developing these resources to help reduce costs to students. CETL also helps faculty support students with disabilities, including offering remote American Sign Language.
In the words of a colleague:
• “Through innovative programming, creative delivery, and intentional collaboration, CETL touches all faculty, staff and students at UW-Eau Claire.” —Dr. Patricia A. Kleine, Provost and Vice Chancellor for Academic Affairs, UW-Eau Claire
• “For new- or early-career academics, teaching in the classroom is among the most intimidating and anxiety-inducing tasks, and yet a task in which most Ph.D. faculty receive very little training while in their doctoral programs. CETL staff are exceptional with early-career faculty, providing insights, suggestions, support, and encouragement in a supportive and non-threatening manner.” — Dr. Abby Hemmerich, Associate Professor and Chair, Communication Sciences and Disorders, UW-Eau Claire

Page 1 of 2
Board of Regents Friday, June 10, 2022
Item II.10.
APPROVAL OF UW SYSTEM BOARD OF REGENTS REGULAR MEETING SCHEDULE FOR 2023 & 2024
REQUESTED ACTION Adoption of Resolution II.10., adopting the 2023 and 2024 regular meeting schedules for the Board of Regents. Resolution II.10. That, upon the recommendation of the Executive Director and
Corporate Secretary, the Board of Regents adopts the attached regular-meeting schedule for calendar years 2023 and 2024.
SUMMARY Regular meeting dates are determined based on Chapter 1, Section 2 of the Bylaws of the Board of Regents. This section states:
“Unless otherwise specially ordered, regular meetings of the Board shall be held at regular intervals six times each calendar year on the Thursday and Friday following the first Monday in a month, except that the August meeting shall be held on the Thursday and Friday following the third Monday. In addition, twice each year, a one-day meeting may be held on the Thursday following the first Monday in a month. Annually, the Board shall adopt a 12-month calendar of meeting dates and locations, after consideration of a related recommendation from the Secretary of the Board…”
The location of the meetings is determined based on Chapter 1, Section 4 of the Bylaws of the Board of Regents. This section states:
“Meetings of the Board shall be held in Madison, except that up to four meetings each year may be held at UW institutions throughout the UW System, on a rotating basis.”
The proposed schedule for 2023 includes two adjustments and the proposed schedule for 2024 includes one adjustment which all require a suspension of the Board’s bylaws. As detailed in Chapter IV, Section 2 of the Bylaws of the Board of Regents, a suspension of the

Page 2 of 2
Board’s bylaws requires an affirmative vote of two-thirds of the total members of the Board of Regents. The three proposed adjustments include the following:
• The regular meeting of the Board that would normally be scheduled for April 6-7, 2023, would be moved to March 30-31, 2023, out of respect for individuals who intend to observe the Jewish holiday Passover on April 5-13, 2023, and for individuals who intend to observe the Christian holiday Good Friday on April 7, 2023.
• The one-day meeting of the Board that would normally be scheduled for March 9, 2023, would be cancelled to accommodate moving the April meeting to March.
• The regular meeting of the Board that would normally be scheduled for October 10-
11, 2024, would be moved to September 26-27, 2024, out of respect for individuals who intend to observe the Jewish holiday Yom Kippur on October 11-12, 2024.
BACKGROUND Among the responsibilities of the Executive Director and Corporate Secretary is making a recommendation for a calendar of regular meetings. ATTACHMENTS
A) UW System Board of Regents Regular Meeting Schedule – 2023 & 2024

Board of Regents Item II.10. Attachment A.
*Hosted by the Board of Regents Office
UW SYSTEM BOARD OF REGENTS PROPOSED REGULAR MEETING SCHEDULE – 2023
February 9-10, 2023 – Hosted by UW-Madison
March 30-31, 2023 – Hosted by UW-Stout June 8-9, 2023 – Hosted by UW-Milwaukee July 6-7, 2023 – Hosted by UW-La Crosse October 5-6, 2023 – Hosted by UW-River Falls November 9, 2023 — In Madison*
December 7-8, 2023 – [TBD]
UW SYSTEM BOARD OF REGENTS PROPOSED REGULAR MEETING SCHEDULE – 2024
February 8-9, 2024 – Hosted by UW-Madison March 7, 2024 – In Madison* April 4-5, 2024 – Hosted by UW-Platteville June 6-7, 2024 - Hosted by UW-Milwaukee August 22-23, 2024 – [TBD] September 26-27, 2024 – Hosted by UW-Parkside November 7, 2024 – In Madison* December 5-6, 2024 – [TBD]