Mediterranean Overflow Water (MOW) simulation using a coupled multiple-grid Mediterranean Sea/North...
14
Mediterranean Overflow Water (MOW) simulation using a coupled multiple-grid Mediterranean Sea/North Atlantic Ocean model David E. Dietrich, 1 Yu-Heng Tseng, 2 Raul Medina, 3 Steve A. Piacsek, 4 Maria Liste, 3 Maitane Olabarrieta, 3 Malcolm J. Bowman, 5 and Avichal Mehra 6 Received 31 January 2007; revised 12 January 2008; accepted 28 February 2008; published 22 July 2008. [1] A z-level, 4th-order-accurate ocean model is applied in six two-way-coupled grids spanning the Mediterranean Sea and North Atlantic Ocean (MEDiNA). Resolutions vary from 1/4° in central North Atlantic to 1/24° in Strait of Gibraltar region. This allows the MEDiNA model to efficiently resolve small features (e.g., Strait of Gibraltar) in a multibasin, multiscale model. Such small features affect all scales because of nonlinearity and low dissipation. The grid coupling using one coarse grid overlap is nearly seamless without intergrid sponge layers. No instant convective adjustment or other highly diffusive process is used. The deep water in the 1/8° Mediterranean Sea grid is formed by the resolved flows that emulate subgrid-scale processes directly. Downslope migration of Mediterranean Overflow Water (MOW) water involves dense water flowing away from the bottom laterally over bottom stairsteps in the z-level model, thus flowing over less dense underlying water. Without excessively water mass-diluting process, the advection dominates the downslope migration of thin, dense MOW in the simulation. The model results show realistic MOW migration to the observed equilibrium depth, followed by lateral spreading near that depth. The results are also consistent with the climatology along 43°N, where the MOW hugs a steep shelfslope centered at 1 km depth and then spreads westward, with the salinity core (S > 35.7) reaching 18°W. This study clearly restores z-level models to a competitive status doing density current simulations. Citation: Dietrich, D. E., Y.-H. Tseng, R. Medina, S. A. Piacsek, M. Liste, M. Olabarrieta, M. J. Bowman, and A. Mehra (2008), Mediterranean Overflow Water (MOW) simulation using a coupled multiple-grid Mediterranean Sea/North Atlantic Ocean model, J. Geophys. Res., 113, C07027, doi:10.1029/2006JC003914. 1. Introduction 1.1. Background [2] Modeling the downslope penetration of density cur- rents spilling over sills is of considerable research interest and important [e.g., Peters et al., 2005; Legg et al., 2005; Killworth, 2001; Killworth and Edwards, 1999]. Dietrich et al. [2004a], using a purely z-level model, showed that only when the New England shelfslope density current is suffi- ciently intense and undiluted to reach the Cape Hatteras abutment does the Gulf Stream separate there and pinch off warm- and cold-core rings similar to those observed. Strong inertial flow (high Reynolds number based on the scale of the abutment) is necessary but not sufficient. Separation occurs there only if the model resolution is fine enough or the model dissipation and numerical dispersion are suffi- ciently small to avoid dilution and loss of intensity during its long transit time from its high latitude seas sources. The thinness and narrowness of density currents makes them difficult to resolve and accurately model. [3] The main focus of this study is the dense Mediterra- nean Overflow Water (MOW), a thin, narrow intense current that spills over the Strait of Gibraltar sill. MOW is an even more model-challenging density current (see section 1.2) than the New England Shelfslope Current, the Red Sea outflow [Peters et al., 2005] or the Denmark Strait Overflow [Legg et al., 2005]. Although its properties change rapidly as it becomes diluted due to mixing and entrainment while flowing along the northern Gulf of Cadiz shelfslope, the MOW remains well defined as a deep, warm salty current between 1000 m and 1200 m depth all around the Atlantic coast of the Iberian Peninsula, and its deep water mass signature is seen over much of the central North Atlantic Ocean basin [Curry et al., 2003]. Ozkokmen et al. [2001] have described a connection between the Mediter- ranean outflow and the Azores Current. Hence it is clear that the MOW is important in spite of its relatively small transport. It is dense because of its high salinity and is JOURNAL OF GEOPHYSICAL RESEARCH, VOL. 113, C07027, doi:10.1029/2006JC003914, 2008 Click Here for Full Articl e 1 AcuSea, Inc., Via Sonoma, La Jolla, California, USA. 2 Department of Atmospheric Sciences, National Taiwan University, Taipei, Taiwan. 3 Ocean and Coastal Research Group, University of Cantabria, Santander, Spain. 4 Oceanography Division, Naval Research Laboratory, Stennis Space Center, Mississippi, USA. 5 Marine Sciences Research Center, State University of New York at Stony Brook, Stony Brook, New York, USA. 6 Environmental Modeling Center, NCEP/NWS, NOAA, Camp Springs, Maryland, USA. Copyright 2008 by the American Geophysical Union. 0148-0227/08/2006JC003914$09.00 C07027 1 of 14
-
Upload
independent -
Category
Documents
-
view
4 -
download
0
Transcript of Mediterranean Overflow Water (MOW) simulation using a coupled multiple-grid Mediterranean Sea/North...
Mediterranean Overflow Water (MOW) simulation using a coupled
multiple-grid Mediterranean Sea/North Atlantic Ocean model
David E. Dietrich,1 Yu-Heng Tseng,2 Raul Medina,3 Steve A. Piacsek,4 Maria Liste,3
Maitane Olabarrieta,3 Malcolm J. Bowman,5 and Avichal Mehra6
Received 31 January 2007; revised 12 January 2008; accepted 28 February 2008; published 22 July 2008.
[1] A z-level, 4th-order-accurate ocean model is applied in six two-way-coupled gridsspanning the Mediterranean Sea and North Atlantic Ocean (MEDiNA). Resolutions varyfrom 1/4� in central North Atlantic to 1/24� in Strait of Gibraltar region. This allows theMEDiNA model to efficiently resolve small features (e.g., Strait of Gibraltar) in amultibasin, multiscale model. Such small features affect all scales because of nonlinearityand low dissipation. The grid coupling using one coarse grid overlap is nearly seamlesswithout intergrid sponge layers. No instant convective adjustment or other highly diffusiveprocess is used. The deep water in the 1/8� Mediterranean Sea grid is formed by theresolved flows that emulate subgrid-scale processes directly. Downslope migration ofMediterranean Overflow Water (MOW) water involves dense water flowing away fromthe bottom laterally over bottom stairsteps in the z-level model, thus flowing over less denseunderlying water. Without excessively water mass-diluting process, the advectiondominates the downslope migration of thin, dense MOW in the simulation. The modelresults show realisticMOWmigration to the observed equilibrium depth, followed by lateralspreading near that depth. The results are also consistent with the climatology along 43�N,where the MOW hugs a steep shelfslope centered at �1 km depth and then spreadswestward, with the salinity core (S > 35.7) reaching 18�W. This study clearly restoresz-level models to a competitive status doing density current simulations.
Citation: Dietrich, D. E., Y.-H. Tseng, R. Medina, S. A. Piacsek, M. Liste, M. Olabarrieta, M. J. Bowman, and A. Mehra (2008),
Mediterranean Overflow Water (MOW) simulation using a coupled multiple-grid Mediterranean Sea/North Atlantic Ocean model,
J. Geophys. Res., 113, C07027, doi:10.1029/2006JC003914.
1. Introduction
1.1. Background
[2] Modeling the downslope penetration of density cur-rents spilling over sills is of considerable research interestand important [e.g., Peters et al., 2005; Legg et al., 2005;Killworth, 2001; Killworth and Edwards, 1999]. Dietrich etal. [2004a], using a purely z-level model, showed that onlywhen the New England shelfslope density current is suffi-ciently intense and undiluted to reach the Cape Hatterasabutment does the Gulf Stream separate there and pinch offwarm- and cold-core rings similar to those observed. Stronginertial flow (high Reynolds number based on the scale of
the abutment) is necessary but not sufficient. Separationoccurs there only if the model resolution is fine enough orthe model dissipation and numerical dispersion are suffi-ciently small to avoid dilution and loss of intensity duringits long transit time from its high latitude seas sources. Thethinness and narrowness of density currents makes themdifficult to resolve and accurately model.[3] The main focus of this study is the dense Mediterra-
nean Overflow Water (MOW), a thin, narrow intensecurrent that spills over the Strait of Gibraltar sill. MOW isan even more model-challenging density current (seesection 1.2) than the New England Shelfslope Current, theRed Sea outflow [Peters et al., 2005] or the Denmark StraitOverflow [Legg et al., 2005]. Although its propertieschange rapidly as it becomes diluted due to mixing andentrainment while flowing along the northern Gulf of Cadizshelfslope, the MOW remains well defined as a deep, warmsalty current between 1000 m and 1200 m depth all aroundthe Atlantic coast of the Iberian Peninsula, and its deepwater mass signature is seen over much of the central NorthAtlantic Ocean basin [Curry et al., 2003]. Ozkokmen et al.[2001] have described a connection between the Mediter-ranean outflow and the Azores Current. Hence it is clear thatthe MOW is important in spite of its relatively smalltransport. It is dense because of its high salinity and is
JOURNAL OF GEOPHYSICAL RESEARCH, VOL. 113, C07027, doi:10.1029/2006JC003914, 2008ClickHere
for
FullArticle
1AcuSea, Inc., Via Sonoma, La Jolla, California, USA.2Department of Atmospheric Sciences, National Taiwan University,
Taipei, Taiwan.3Ocean and Coastal Research Group, University of Cantabria,
Santander, Spain.4Oceanography Division, Naval Research Laboratory, Stennis Space
Center, Mississippi, USA.5Marine Sciences Research Center, State University of New York at
Stony Brook, Stony Brook, New York, USA.6Environmental Modeling Center, NCEP/NWS, NOAA, Camp Springs,
Maryland, USA.
Copyright 2008 by the American Geophysical Union.0148-0227/08/2006JC003914$09.00
C07027 1 of 14

much warmer than the ambient North Atlantic Central water(NACW) near the 300–400 m depth sill level [Levitus andBoyer, 1994]. Indeed, even after mixing with ambientNACW as it flows along the bottom slope of the Gulf ofCadiz, and after ‘‘sliding’’ toward deeper levels due tosecondary flows induced by bottom friction, the MOW isabout 5�C warmer than the far-field NACW at levels nearthe final equilibrium depth of about 1100 m. The MOW hassignificant climatological effects on the deep North Atlanticheat and salt balance.[4] The contemporary MOW is saltier, warmer, denser
and reaching deeper and further westward than it was in thelast decades of the 20th century, before anthropogeniceffects became evident [Curry et al., 2003; Rixen et al.,2005]. These include a combination of increased evapora-tion (greenhouse warming effect) and Aswan Dam diver-sion of �90% of the Nile River to irrigation. TheMediterranean Sea mean salinity has increased by 0.04during the last 40 years [Bethoux et al., 1998; Johnson,1997; TOPtoTOP Global Climate Expedition]. Mediterra-nean Sea ecosystems will eventually be affected by thesalinity increase of the Mediterranean Seawater [Millot,2007]. These potentially affect the currents, temperature,salinity and geobiochemical distributions and the associatedecosystem around the Iberian Peninsula and western Med-iterranean Sea, and also the entire Mediterranean Sea[Drillet et al., 2005]. The basin-scale thermohaline circula-tion involving water mass transformations in the Mediter-ranean Sea strongly affects this exchange. On the otherhand, fresher and much less dense MAW (modified AtlanticWater) overrides the MOW through the Strait of Gibraltarand flows eastward into the Mediterranean Sea. It spreadsquickly into a thin layer in the Alboran Sea and feeds anintense meandering current along the North Africa coast[Tintore et al., 1988]. The MAW affects the entire Mediter-ranean Sea circulation; and is especially important in theMediterranean coastal regions of the Iberian Peninsula.Sometimes, large MAW meanders even flow directly fromthe eastern Alboran Sea to as far north as the BalearicIslands and affect the surrounding water’s physical andbiogeochemical properties as far north as Mallorca [Millot,1999, 2007]. This ‘‘inverse estuarine’’ or gravitationalcirculation tightly couples the Mediterranean Sea to theNorth Atlantic Ocean.
1.2. MOW Modeling Challenge
[5] Accurate modeling of the MOW is challenging be-cause the MOW represents a very thin, bottom hugging, anddense (compared to the ambient MAW) current spilling intoNorth Atlantic Ocean over a shallow sill in a narrow strait. Itmust be modeled without excessive water mass dilution,possibly caused by numerical dispersion errors (e.g., inac-curate numerical approximations), or by large numericaldissipation (required by some models for stability andnumerical robustness). Accurate modeling of the sinkingprocess also requires an accurate description of the sourceof this water, the thermohaline-forced exchange through thenarrow Strait of Gibraltar, and the circulations in the twobasins feeding the in- and outflows. Thus the significantmodeling challenge is to realistically represent the vigorousexchange of NACW with MOW water through the Strait of
Gibraltar, and the downslope penetration of its thin, narrowdensity current.[6] Johnson et al. [2002] applied a 1/24� regional model
to the southwestern Iberian Peninsula coastal region, west ofthe Strait of Gibraltar, and showed realistic MOW penetra-tion including anticyclonic meddies at depth �845 m(model level 16). In spite of the small scale and intensityof the bottom-hugging MOW, the entrainment of lighterambient water was slow. The entrainment was limited by thelarge static stability at its top and insulated conditions (littleheat or salt transfer) at the ocean bottom. Significantentrainment is possible only near its sloping baroclinic edgewhere baroclinic instability of eddies with small Rossbyradius of deformation, Ro, occurs. The observations of itscharacteristic temperature and salinity signatures far from itssource region indicate that this entrainment is slow espe-cially after reaching its equilibrium level. Indeed, warmsalty MOW water mass signatures are seen thousands ofkilometers away from their source. Modeling such long-lasting current intensity and water mass conservation (fardownstream from the MOW source) is impossible usingmodels that require large viscosity/diffusion for numericalstability, and also difficult using models with large numer-ical dispersion.[7] Drillet et al. [2005] recently applied a new version of
the rigid-lid OPA model in an ultra-high resolution (�6 kmand 43 z-levels) simulation of the coupled MediterraneanSea and North Atlantic focusing on the MOW and theeddies (‘‘meddies’’). To overcome problems with the z-levelgrid, they introduced a relaxation scheme to climatology,applied within a radius encompassing the area of intensedownflow in the Gulf of Cadiz region. The computationaldemands of a high resolution grid on such a large domainlimit their simulation to only five model years, which isadequate to get near-equilibrium in the MOW dynamics inthe southwest Iberian Peninsula region where meddies arespawned. They further relaxed their model toward clima-tology using spatially varying timescale, with the fastest(50 d) in the Cape St. Vincent region where meddies areformed. The modeled meddies properties, and the equilib-rium level of the MOW water as it spreads westward, agreedwell with climatology and limited observations. Smith et al.[2000] andMaltrud andMcClean [2005] have used the 1/10�resolution z-level POP model to simulate the North AtlanticOcean. In their studies, the MOW penetrates downslopefrom the sill level (�300–400 m) to only �500 m depth,while the observed MOW penetrates to �1100 m. Com-bined with the poor results of other density current studiesusing z-level models [Beckmann and Doscher, 1997;Willebrand et al., 2001; Ezer and Mellor, 2004], z-levelmodels were thought to be poor tools to study densitycurrents. However, Dietrich et al. [2004a], Legg et al.[2005], and Drillet et al. [2005] have shown that withproper numerics, resolution and dissipation, z-level modelscan give satisfactory results. The recent investigation of theDynamics of Overflow Mixing and Entrainment (DOME)idealized density current problem using a pure z-levelmodel even shows that the model accuracy, robustnessand dissipation play more important role than the chosencoordinate [Tseng and Dietrich, 2006].
C07027 DIETRICH ET AL.: MOW SIMULATION USING COUPLED OCEAN MODEL
2 of 14
C07027

1.3. Motivation and Approach
[8] Our original goal was to model the currents aroundthe Iberian Peninsula following the supertanker ‘‘Prestige’’oil spill disaster. This required modeling the exchange ofNorth Atlantic and Mediterranean waters through the Straitof Gibraltar, and the associated circulations, including thethermohaline-driven exchange between North AtlanticOcean and Mediterranean waters (much saltier and denser)through the Strait of Gibraltar, and the descending MOWdensity current and its deep penetration. Extending theaccurate and efficient duo-grid approach in Dietrich et al.[2004a], we designed a six-grid, two-way coupled model,MEDiNA (MEDiterranean and North Atlantic) model, inorder to satisfy this requirement efficiently. Early on,however, we also recognized the potential climatologicalimportance of the MOW penetration, and encouraged by themodel’s consistency with previous observations [Barringerand Price, 1997], we proceeded to further investigate theMOW dynamics and its effects in the Iberian Peninsulacoastal regions.[9] The challenge of modeling the MOW (see section 1.2)
is further amplified when one considers the need for mod-eling the entire basins: this is required if one wishes to modelits large multidecadal timescale effects on climate. MOW isby far the warmest (and most saline) water that accumulatesat depth below 1000 m in the North Atlantic, and thuscontrols its deep ocean heat and salt balance. ExtendedMOW modeling in the framework of basin-scale, coupledMediterranean Sea and North Atlantic system has never beendone adequately until now. As the results will show(section 3), the choice of this configuration is well justifiedby the modeled MOW depth and water mass propertiesagreeing quite closely with the observed climatology.[10] The MEDiNA model is described in section 2.
Section 3 presents the main simulation results, including:(1) MOW/MAW volume exchange rate; (2) MOW down-slope migration to its equilibrium depth in the Gulf ofCadiz; (3) MOW flow around the Iberian Peninsula, intothe Bay of Biscay; and (4) time mean path around theobserved anticyclonic gyre in the far western MediterraneanSea. Section 4 summarizes concluding remarks and futureworks.
2. MEDiNA Model: Basic Model and MultipleGrid Framework
[11] To efficiently resolve the Strait of Gibraltar in thefully coupled MEDiNA model, we have employed six gridsthat are all two-way-coupled to their adjacent grids, eachgrid being a local Mercator grid. Longitudinal resolutionvaries from 1/24� in a Strait of Gibraltar regional grid to 1/4�in a central North Atlantic Ocean grid. Brief details of theDieCAST (Dietrich/Center for Air Sea Technology) oceanmodel, used in this study and based on the primitive equa-tions of incompressible flow, are given in the section below.
2.1. Basic Model
[12] The purely z-level DieCAST ocean model [Dietrichet al., 1987; Dietrich, 1997] solves the discretized hydro-static, incompressible conservation equations that are inintegrated ‘‘control volume’’ form within each grid. The
grids and internal control volumes are coupled by fluxesand pressure forces at their interfaces with adjacent gridsand control volumes. All internal control volume fluxes andpressure forces are calculated using interpolations that arerigorously fourth-order-accurate [Sanderson and Brassington,1998; Dietrich, 1997], including the linear-exponentialstretched vertical coordinate space. No bathymetry smoothingis applied and partial bottom cells are not used.[13] Subgrid-scale (Reynolds-averaged type) vertical
mixing is parameterized by eddy diffusivity (for tempera-ture and salinity) and eddy viscosity (for momentum) usinga modified Richardson number approach [Staneva et al.,2001; Tseng et al., 2005] based on Pacanowski andPhilander [1981]. Common instant convective adjustmentis not invoked. Since the horizontal flow is dominated bylow dissipation inertial dynamics and water mass advectionon all resolved scales, the horizontal cell Reynolds numberis extremely large. This, in combination with the high orderlow dissipation numerics, leads to realistic MOW dilutionand associated final equilibrium level. No data assimilationis used, nor any nudging toward climatology which can leadto internal heat and freshwater sources/sinks that do notoccur in the real ocean [Tseng and Breaker, 2007].[14] We emphasize that using large or even infinite (such
as instant ‘‘convective adjustment’’) vertical diffusion insimulating bottom-hugging density currents exacerbates thedispersion errors in z-level models noted above. Densitycurrents migrate downslope over the edges of stairsteps,thus bringing their material over less dense water below. Insuch cases, the common practice of assuming rapid orinstant vertical mixing is physically inappropriate since thismakes diffusion dominate the downslope density currentpropagation leading to excessive entrainment. One mustallow downslope propagation to be dominated by modeledhorizontal and vertical advection, as occurs in nature. Thena subgrid-scale turbulence closure scheme can represent themixing and entrainment without being contaminated bynumerical errors.[15] The continuum equations from which the integrated
control volume equations are derived are given by Stanevaet al. [2001]. More model details are available at the modelwebsite. The wind-forcing of MEDiNA is obtained from theinterpolated monthly Hellerman winds [Hellerman andRosenstein, 1983]. Levitus94 climatology [Levitus andBoyer, 1994] is used to initialize MEDiNA and determineits surface sources of heat and fresh water (e-p) using thenondamping precise approach described by Dietrich et al.[2004b]. The short-circuited Arctic Ocean is parameterizedby an artificial continental shelf along the northern andnortheastern boundary; and with a specified freshwatersource along the northern boundary. The equatorial bound-ary condition is slow nudging toward Levitus climatologyin a sponge layer. Specified lateral viscosity and diffusivityare 20 m2/s and background vertical viscosity and diffusiv-ity have maxima of 3.0 and 0.6 cm2/s in the top layer,decaying exponentially with depth to 0.1 and 0.002 cm2/s,added to the vertical mixing scheme, to emulate mixed layereffects of storm events not included in the climatologicalforcing. The bottom is insulated, with nonslip conditionsparametrized by a nonlinear drag.
C07027 DIETRICH ET AL.: MOW SIMULATION USING COUPLED OCEAN MODEL
3 of 14
C07027

[16] Another requirement for accurate simulation ofdownslope density current migration is the rate of momen-tum extraction at the bottom layer [Legg et al., 2005; Tsengand Dietrich, 2006]. In the absence of such momentumextraction, conservation of absolute potential vorticitystrongly inhibits downslope migration and the densitycurrent approaches geostrophic balance with the cross-slopepressure gradient. This momentum extraction in its typicallythin bottom mixed or ‘‘friction’’ layer adds a bottom sink tothe along-slope momentum balance, thus generating down-slope secondary flows. The nonlinear bottom drag used bythe model (using a standard drag coefficient of 0.002) isadequate for that even when the very thin mixed layer at thebottom of the density current is not resolved.[17] To maintain the observed annual cycle salinity, the
rigid lid approximation is slightly modified to allow amodel-derived e-p [Dietrich et al., 2004b] be representedby a small vertical velocity at the rigid-lid with no salt fluxincluded (purely freshwater). Thus the rigid-lid is slightlyporous, with a nonzero (but extremely small) climatologi-cally based vertical velocity at the slightly porous rigid-lid(see Dietrich et al. [2004b] for justification and details).Integrating e-p over the entire Mediterranean Sea gives a netfreshwater volume loss at the surface, so the inflow throughthe Strait of Gibraltar is slightly bigger than the outflow[Millot, 2007].
2.2. Multiple Grid Framework
[18] Modeling the Mediterranean Sea near-surface inflowof MAW and underlying outflow of much saltier and denserMOW was made possible by the current multiple gridapproach, including a tiny 1/24� resolution Strait of Gibraltarregional grid through which the Mediterranean Sea and
North Atlantic are coupled (Figure 1). MEDiNA model hasbeen run for 70 years. Such multiple-grid approach isclosely related to the domain-decomposition method de-scribed by Dietrich et al. [1975] used by the rigid-lidpressure solver [Roache, 1995] in a global adaptation ofthe DieCAST model. The present six-grid model formula-tion is similar to the duo grid formulation in Dietrich et al.[2004a], except we have increased the resolution andreplaced the equatorial boundary condition by a conven-tional sponge layer approach based on climatology. In thefuture, we will two-way couple the present model to a lowerresolution global model.[19] All six subdomain grids (Figure 1) share the same
smoothly stretched (linear-exponential) z-level vertical grid.Within each individual grid (all in a spherical coordinateframework), longitudinal resolution is uniform and latitudi-nal resolution is generated such that varying latitude andlongitude grid increments are equal everywhere (Mercatorgrid). Lateral resolutions and grid sizes for all six grids aresummarized in Table 1. The vertical resolution is a linear-exponential stretched grid of 30 layers, with a 10 m thicktop layer. The vertical grid is graphically indicated in thevertical cross-section plots presented.
Figure 1. Entire simulation domain of the six-grids MEDiNA model. The grid resolution ranges from1/4� in the central North Atlantic Ocean grid to 1/24� in the Strait of Gibraltar regional grid. Cape St.Vincent and Gulf of Cadiz are labeled on the map.
Table 1. Lateral Resolution and Grid Size in Each Grid
Domain Lateral Grid Resolution Grid Sizes
Western North Atlantic 1/8� 302 � 334Central North Atlantic 1/4� 160 � 396Eastern North Atlantic 1/8� 98 � 792Bay of Biscay 1/16� 112 � 156Strait of Gibraltar 1/24� 123 � 105Mediterranean Sea 1/8� 314 � 155
C07027 DIETRICH ET AL.: MOW SIMULATION USING COUPLED OCEAN MODEL
4 of 14
C07027

[20] The grid coupling approach includes upwind-basedcross-intergrid-boundary fluxes, as did the approach used byDietrich et al. [2004a]. The commonly used time filter(timescale of a few days) has little effect on the couplingother than to damp high frequency internal modes of thefiner of two adjacent grids that are not resolved by theadjacent two-way-coupled coarser grid. The resulting gridcoupling is nearly seamless with low diffusion and viscos-ity. No intergrid sponge layers are applied.
3. Simulation Results
[21] The Levitus’94 climatology [Levitus and Boyer,1994] that is used to initialize the MEDiNA model doesnot resolve the Strait of Gibraltar. Even if it did, the flowthrough the strait is not balanced [Viudez et al., 1998] andthus cannot be accurately initialized from water massclimatology. Thus for simplicity, the model was initializedwith no flow everywhere on all six grids.[22] Using varying resolutions in a bigger region and
simulating multiple decades, the present MEDiNA modelproduces results very similar to those reported by Drillet etal. [2005]. Further comparisons are made of the depths andwestward penetration longitudes of the core salinity withanalyses based on climatology by Iorga and Lozier [1999].In regions closer to Gibraltar and the Spanish coast, forlongitudes <10�W, comparisons are also made with obser-vations and model results by Bascheck et al. [2001] and byJohnson et al. [2002]. These results are discussed insections 3.1–3.3 below.
3.1. Water Mass Exchange Through Strait of Gibraltarand Associated Currents
[23] After a few model years, a westward 1 ± 0.05 SvMOW flow through the Strait of Gibraltar occurs through-
out the model simulation. Above it, an eastward 1.1 ± 0.1 SvMAW flow occurs. These match well with the valuesinferred from the observations within observational error[Bascheck et al., 2001]. This energy-intensive water massexchange through the narrow Strait of Gibraltar stronglyaffects the Iberian Peninsula coastal regions, and alsosignificantly affects the entire Mediterranean Sea. Agreeingwith observations, the simulated eastward volume flow isgenerally larger than the westward flow because it mustbalance the freshwater sink (based on the surface freshwaterflux treatment described by Dietrich et al. [2004b]) due tothe net effects of rivers, precipitation and evaporation.[24] Figure 2 shows the daily transport through the Strait
of Gibraltar during the last part of year 69 and all of year 70in the choke point cross-section (�50 model grid points).The red (blue) curve shows the total eastward (westward)volume flow integrated over all points having eastward(westward) flow; the green curve is the sum of the totaltransport. The sum represents the total inflow through theStrait of Gibraltar into the Mediterranean Sea, whose longterm average exactly balances the e-p-river sources tomaintain Mediterranean Sea surface level; rigid-lid approx-imation enforces this balance each time step. Thus the greencurve may be compared with an average annual cycle e-p-river sources based on climatological data mostly before theAswan dam and other uses of Mediterranean Sea rivers forirrigation decreased the river inflows. There is a 3–5 dfluctuation of the inflow and outflow which are almostexactly opposite, with the small residual containing thesmoothly varying annual cycle e-p-river sources shown bythe green curve.[25] The time average westward transport (blue curve) is
about 1 Sv and is the MOW source. The time averageeastward transport (red curve) is slightly bigger (by about0.03 Sv), most clearly shown by the green curve, due to thetime average e-p-river sources in the Mediterranean Sea(time average of the green curve) and is the fresher MAWsource to the Mediterranean Sea. The e-p-river sourcesmaximum is about 0.1 Sv during January, but switches signto about �0.02 Sv during the spring. In nature, these may beaffected by slight fluctuations of the total MediterraneanSeawater volume (lateral mean surface height) that cannotbe modeled using a rigid-lid approximation, but may havevery little effect on the Mediterranean Sea general circula-tion. In our earlier stand-alone Mediterranean Sea studiesusing the present model, we found (not reported) that eventhe implied regional vortex stretching associated with thelocally big e-p in the eastern Mediterranean Sea has littleeffect on its regional circulation, indicating that the rigid-lidapproximation is appropriate [Fernandez et al., 2005].There is significant interannual variability even though themodel is forced by exactly repeating annual cycle climato-logical data and is well converged after long years ofintegration.[26] Figure 3 shows the annual averaged velocity at 1000m
depth superposed on the time averaged surface height inthe Strait of Gibraltar regional grid during year 20. It clearlyshows that deep flows west of the Strait of Gibraltar crossthe surface height contours. The flow is nearly geostrophicat all levels outside the top and bottom boundary layers anda slightly supergeostrophic flow in the Strait [Viudez et al.,1998]. Thus this indicates the baroclinic nature of the flow.
Figure 2. Transport through the Strait of Gibraltar duringthe last part of year 69 and all of year 70, computed fromdaily model data in the choke point cross-section havingabout 50 points. The red (blue) curve shows the totaleastward (westward) volume flow integrated over all pointshaving eastward (westward) flow; the green curve is thesum of the blue and red curves.
C07027 DIETRICH ET AL.: MOW SIMULATION USING COUPLED OCEAN MODEL
5 of 14
C07027

The NAW freshwater jet east of the Strait is similar to theobserved jets [Viudez et al., 1998] and other high resolutionmodel results [e.g., Drillet et al., 2005]. In spite of using arigid-lid approximation which excludes the fluctuations dueto tides, the time average water mass exchange is consistentwith observations [Bascheck et al., 2001], thus providing arealistic Strait of Gibraltar upstream condition for the MOWdensity current. The interface between the MOW and theMAW is near the observed depth ranging from 50 to 200 m[Tintore et al., 1988]. The MAW forms a surface layercharacterized by salinities that increase, due to evaporationand mixing, from 36.5 at the Strait of Gibraltar to 38.0–38.3in the north of the Western Mediterranean Sea, and by amean temperature, below the mixed layer, of 14–15�[Millot, 1999]. The interface between the MAW andMOW in the Strait of Gibraltar is �60–100 m thick witha strong vertical salinity gradient. The interface is thicker,deeper and fresher (colder) on the west end of the Strait[Bray et al., 1995]. The MOW water mass properties arealso very close to the climatology as shown later.[27] Note that this water mass exchange through the Strait
of Gibraltar is obtained with no data assimilation in spite ofthe coarse Strait of Gibraltar resolution. The water massexchange relies on the throughflow dynamics and is criticalfor long term climate change since the MOW has significantimpacts on the deep and intermediate heat and salt balancein the North Atlantic Ocean.
3.2. MOW Spawned Density Current West ofGibraltar
[28] Figure 4 shows instantaneous vertical/latitudinalcross-sections of model results in the 1/24� resolution Straitof Gibraltar regional grid at the end of year 20. Figures 4a–4e show Strait of Gibraltar regional grid results (at 8.1�W),just east of its interface with the 1/8� resolution easternNorth Atlantic grid. The deep MOW is clearly visible alongthe Iberian slope around 1000 m depth in the (Figure 4a)longitudinal velocity, (Figure 4b) latitudinal velocity,(Figure 4c) salinity, (Figure 4d) temperature and (Figure 4e)vertical velocity. The present results compare well withthose of Johnson et al. [2002] at 8.25�W (their Figure 3).Note that the unfiltered 1/24� resolution bathymetry is usedherein. The MOW reaches the equilibrium depth at �1000m just upstream of this longitude, as shown by verticalsections east of this longitude (Figures 4f–4i; Figure 4i is inthe westernmost of the Strait).[29] The material elements flow along the bottom slope
for O(10) days between the Strait and Cape St. Vincent justwest of 8.1�W (Figures 4a–4e). They approach theirequilibrium depth just east of 8.1� W, after entraining someNorth Atlantic water between the Strait and 8.1� W. Someof the MOW material spreads offshore, away from thebottom slope, thus getting sandwiched by the much lesssaline and colder ambient North Atlantic water. This mayinvolve weak frictionally induced secondary flows in the
Figure 3. Annual averaged sea surface height (color contours) and 1000 m depth velocity vectors in1/24� resolution Strait of Gibraltar regional grid during year 20. The maximum velocity magnitude is48.9 cm/s. The unit of sea surface height is cm. Longitude (�) is shown in x axis while latitude (�) isshown in y axis.
C07027 DIETRICH ET AL.: MOW SIMULATION USING COUPLED OCEAN MODEL
6 of 14
C07027

Figure 4. Vertical/latitudinal sections from the 1/24� resolution Strait of Gibraltar regional grid at theend of year 20. Figures 4a–4e are at 8.1�W longitude, which is the model longitude adjacent to a 3-zoneoverlap region between the 1/8� resolution eastern North Atlantic grid and the Strait of Gibraltar regionalgrid (Figure 1). Figures 4a–4e show longitudinal velocity (positive eastward), latitudinal velocity(positive northward), salinity, temperature and vertical velocity (positive downward, in m/d), respectively.Figures 4f–4n show salinity every 1/2� going eastward from Figure 4c, except the extremely narrowStrait of Gibraltar choke point. 10� water is seen as deep as 1300 m. Figures 4j–4n show the thin near-surface relatively fresh layer of North Atlantic water east of the Strait. This sequence shows thedownslope MOW flow as a result of secondary flows in the bottom friction layer as one goes westwardfrom the Strait of Gibraltar, reaching its equilibrium depth (�1000 m) in the westernmost longitude(Figures 4a–4e) where it begins its offshore spread. Dense MOW is marked as circles. Longitude (�) isshown in x axis while depth (m) is shown in y axis.
C07027 DIETRICH ET AL.: MOW SIMULATION USING COUPLED OCEAN MODEL
7 of 14
C07027

open water (away from the bottom) as well as upstreamfluid dynamic instabilities.[30] Figures 4j–4n focus on the totally different behavior
east of the Strait (Figure 4j locates at longitude 5.1�W). It isdominated by a thin near surface eastward flowing plume ofMAW overriding much saltier westward flowing Mediter-ranean Seawater; the upper part of the latter spills over theStrait’ sill around 300–400 m depth, some of it havingupwelled as bottom-drag-induced secondary flows in thedominant anticyclonic gyre east of the Strait, probably withthe help of the cyclonic frontal eddies. The energy intensiveStrait of Gibraltar region is externally forced by the bigscale buoyancy differences between the North Atlantic andMediterranean Seawater masses and is a focal point ofmultiscale nonlinear interactions.[31] Figures 4f–4i, spaced uniformly between 8.1�W and
the Strait of Gibraltar, continuously show the high salinityintense MOW bottom density current jet core locationdownstream from the Strait of Gibraltar sill. The modeledMOW forms an intense downstream jet from a thin, narrowStrait of Gibraltar sill source. After approaching a nearbalance among Coriolis, buoyancy and viscous forces, thehorizontal flow is nearly parallel to depth contours exceptnear the bottom [Tseng and Dietrich, 2006]. The MOWdensity current gradually edges downslope as it flowswestward from its Strait of Gibraltar source (the sill saddlepoint over which it flows near the bottom is around 300–400 m depth). A high salinity region occurs at deeper levelsaway from the Strait of Gibraltar and is marked as circles.
This descent of the MOW density current reflects secondarydownslope flows in the bottom friction layer as it flowswestward until reaching the equilibrium depth, where itmatches the ambient NACW density and begins mixingand spreading over deeper, less saline NACW away fromthe bottom slope. Along the way, its salinity decreases dueto NACW entrainment and vertical mixing parameteriza-tion. Note that the 10�C water can be observed as deep as1300 m.[32] Near Cape St. Vincent (shown in Figure 3), the main
MOW core turns northward and flows along the NorthAtlantic coast of Spain as it slowly spreads offshore,entrains NACW and mixes vertically. However, the MOWdensity current remains concentrated near the Iberian Pen-insula coast and near its equilibrium level as it flowsnorthward in the 1/8� resolution eastern North AtlanticOcean grid, finally turning into the Bay of Biscay.[33] To further reveal the structure of the MOW density
current near its Strait of Gibraltar source, Figure 5 showshorizontal plots of salinity at various levels of the Strait ofGibraltar regional grid at the end of year 20, thus comple-menting the results in Figure 3 for the MOW density currentdownslope penetration. Salty MOW is highlighted withcircles at different depths. These details show the descentand spreading behavior of MOW to be consistent withobservations [e.g., Figures 1 and 5a of Barringer and Price,1997].[34] Figure 6 shows the annually averaged vertical/latitu-
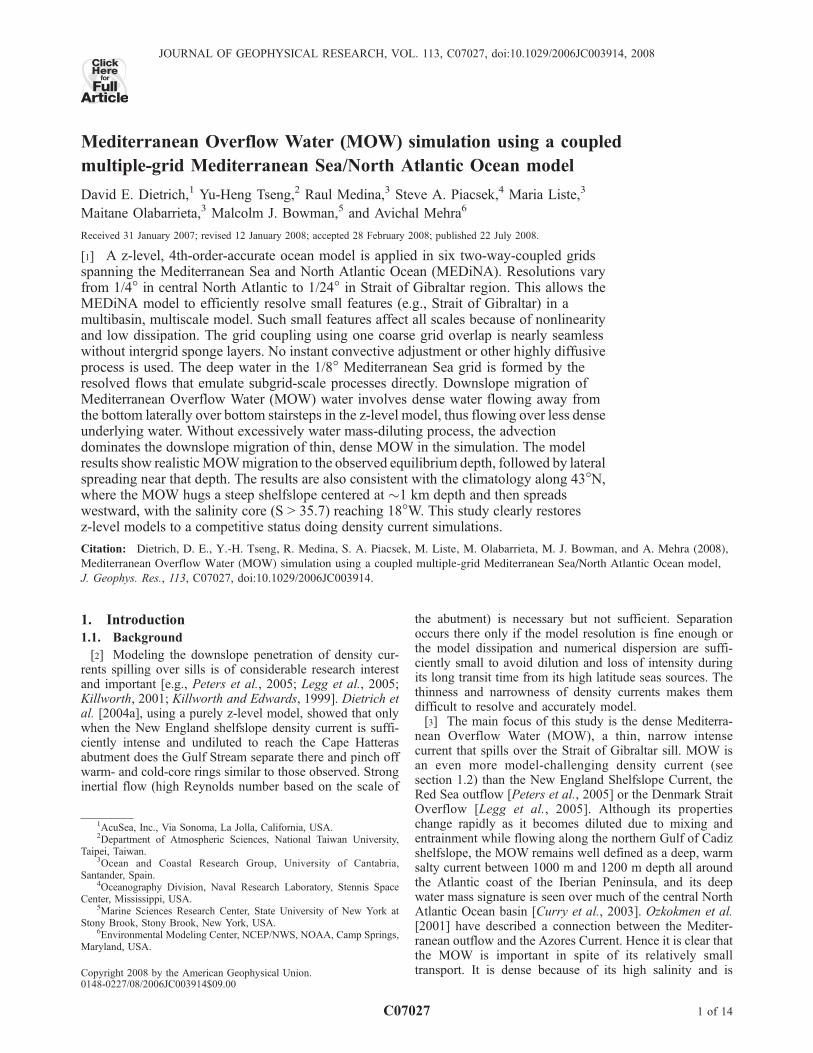
dinal plot of salinity in Bay of Biscay at longitude of
Figure 5. Salinity at the end of year 20 in the 1/24� resolution Strait of Gibraltar regional grid at variousdepths. Dense MOW is marked as circles. The unit of color contours is g/kg. Longitude (�) is shown inx axis while latitude (�) is shown in y axis.
C07027 DIETRICH ET AL.: MOW SIMULATION USING COUPLED OCEAN MODEL
8 of 14
C07027
Santander (3.8�W) during year 20. It took around 5 yearsfor the MOW to penetrate northward and turn eastward intoto the Bay of Biscay. After turning northward at thesouthwest corner of the Iberian Peninsula near Cape St.Vincent, the MOW spread laterally and shed some anticy-clonic deep eddies, thus slowing its northward penetration.It also slowly entrained North Atlantic water, thus dilutingit, but the MOW signal is evident all along the Iberian westcoast and well into the Bay of Biscay (Figures 4–6).[35] Figure 7 shows the annual averaged bottom bound-
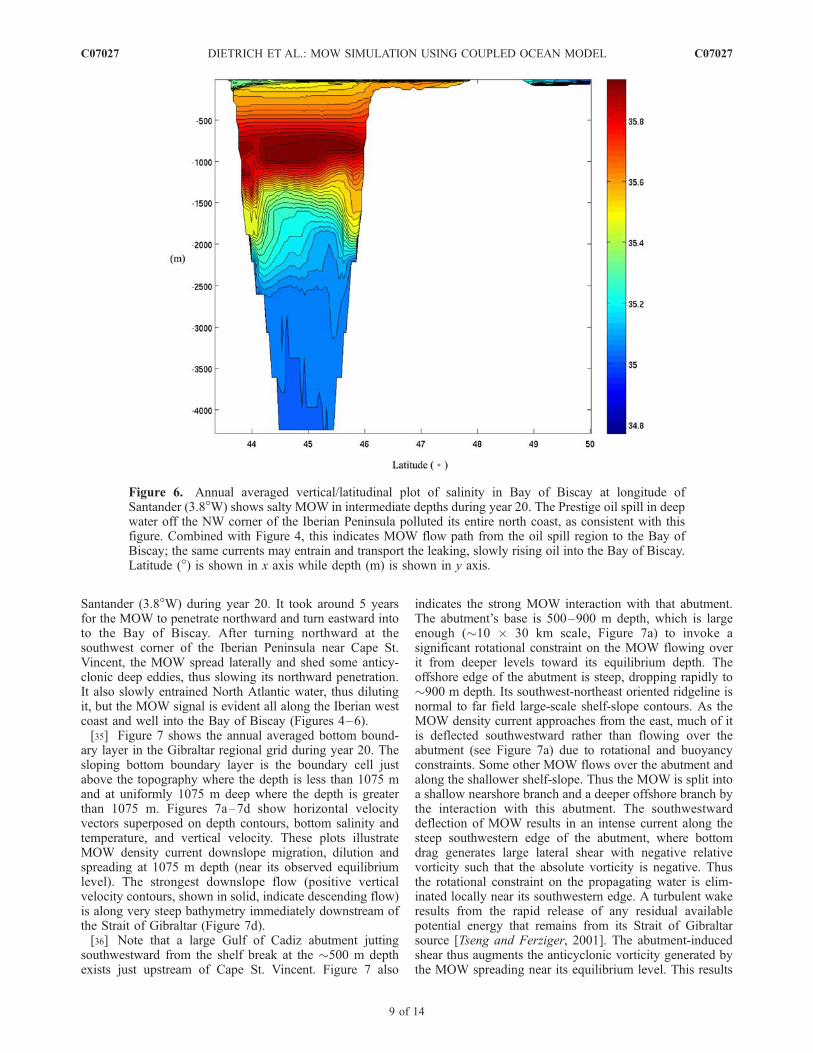
ary layer in the Gibraltar regional grid during year 20. Thesloping bottom boundary layer is the boundary cell justabove the topography where the depth is less than 1075 mand at uniformly 1075 m deep where the depth is greaterthan 1075 m. Figures 7a–7d show horizontal velocityvectors superposed on depth contours, bottom salinity andtemperature, and vertical velocity. These plots illustrateMOW density current downslope migration, dilution andspreading at 1075 m depth (near its observed equilibriumlevel). The strongest downslope flow (positive verticalvelocity contours, shown in solid, indicate descending flow)is along very steep bathymetry immediately downstream ofthe Strait of Gibraltar (Figure 7d).[36] Note that a large Gulf of Cadiz abutment jutting
southwestward from the shelf break at the �500 m depthexists just upstream of Cape St. Vincent. Figure 7 also
indicates the strong MOW interaction with that abutment.The abutment’s base is 500–900 m depth, which is largeenough (�10 � 30 km scale, Figure 7a) to invoke asignificant rotational constraint on the MOW flowing overit from deeper levels toward its equilibrium depth. Theoffshore edge of the abutment is steep, dropping rapidly to�900 m depth. Its southwest-northeast oriented ridgeline isnormal to far field large-scale shelf-slope contours. As theMOW density current approaches from the east, much of itis deflected southwestward rather than flowing over theabutment (see Figure 7a) due to rotational and buoyancyconstraints. Some other MOW flows over the abutment andalong the shallower shelf-slope. Thus the MOW is split intoa shallow nearshore branch and a deeper offshore branch bythe interaction with this abutment. The southwestwarddeflection of MOW results in an intense current along thesteep southwestern edge of the abutment, where bottomdrag generates large lateral shear with negative relativevorticity such that the absolute vorticity is negative. Thusthe rotational constraint on the propagating water is elim-inated locally near its southwestern edge. A turbulent wakeresults from the rapid release of any residual availablepotential energy that remains from its Strait of Gibraltarsource [Tseng and Ferziger, 2001]. The abutment-inducedshear thus augments the anticyclonic vorticity generated bythe MOW spreading near its equilibrium level. This results
Figure 6. Annual averaged vertical/latitudinal plot of salinity in Bay of Biscay at longitude ofSantander (3.8�W) shows salty MOW in intermediate depths during year 20. The Prestige oil spill in deepwater off the NW corner of the Iberian Peninsula polluted its entire north coast, as consistent with thisfigure. Combined with Figure 4, this indicates MOW flow path from the oil spill region to the Bay ofBiscay; the same currents may entrain and transport the leaking, slowly rising oil into the Bay of Biscay.Latitude (�) is shown in x axis while depth (m) is shown in y axis.
C07027 DIETRICH ET AL.: MOW SIMULATION USING COUPLED OCEAN MODEL
9 of 14
C07027

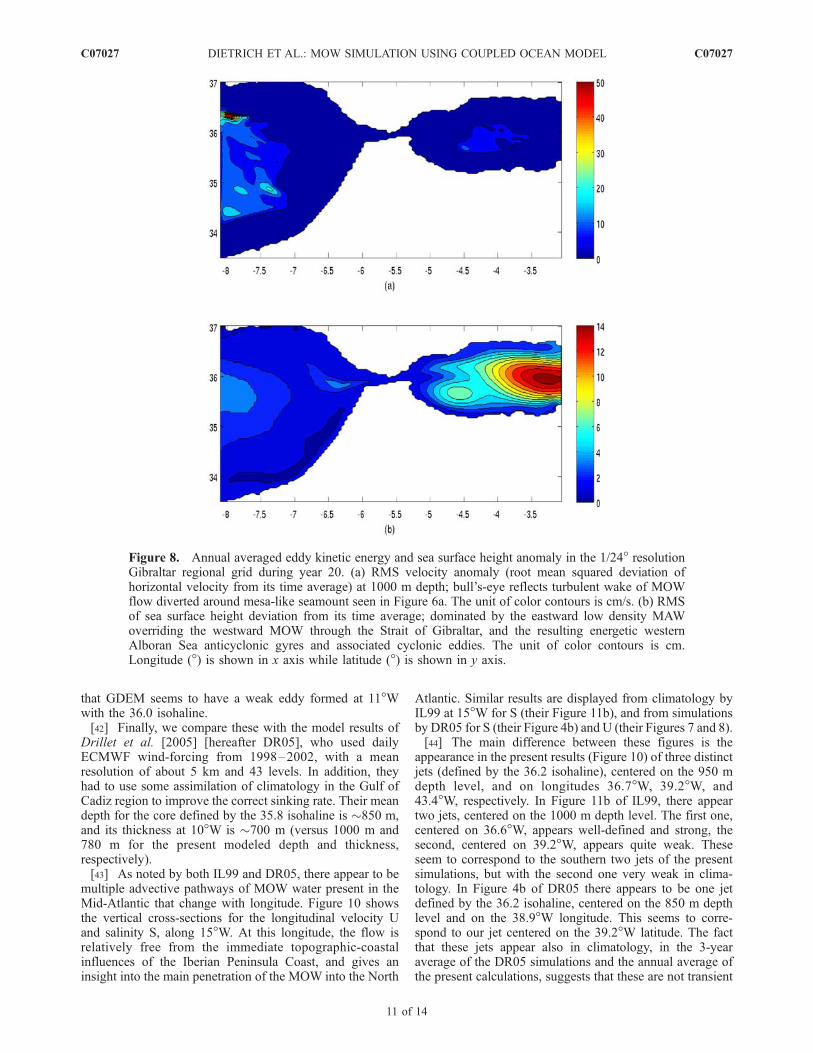
in a ‘‘bull’s-eye’’ in the eddy kinetic energy contoursdownstream from the steep southwestern tip of the abutment(Figure 8a).[37] The anticyclonically rotating MOW elements in the
turbulent wake of the abutment spread as they geostrophi-cally adjust and merge. The adjustment occurs in scalescomparable to the local Ro. MOW accumulates slightlyabove and below the equilibrium level before anticyclonicmeddies break away, thus maintaining a finite MOWthickness [Drillet et al., 2005]. Viewing the meddies as‘‘floating water mass elements’’ in an ambient densitystratified flow, the water above (below) the equilibriumlevel is denser (lighter) than the laterally ambient water. Itfollows that the thermal wind above and below the equilib-rium level is such that the deep MOW signal decreasesaway from that level. Indeed, Figure 8b shows that thesignal from this abutment is relatively weak near thesurface.[38] Thus the MOW interaction with the steep abutment
bathymetry, combined with buoyancy induced MOWspreading, augments theMOWanticyclonic vorticity. Havingdescended toward its equilibrium level by the time itreaches the western Gulf of Cadiz, the MOW spreadstoward deeper water and clockwise around the IberianPeninsula coast, as seen in Figures 4, 5, and 7.[39] Along the Iberian Peninsula west coast, south of
43�N, the modeled MOW is not only close to GDEMclimatology but also quite similar to the upper level flowshown in Figure 5b of Johnson et al. [2002], although theyused higher resolution (1/24� and 36 vertical layers, withdepth truncated at 2000 m) in a focused southwesternIberian Peninsula coastal region model.
3.3. Penetration of MOW Waters Into the NorthAtlantic
[40] The modeled MOW water mass, concentrated near1000 m depth, is clearly observed in the vertical/longitudi-nal salinity cross-section at 43�N (Figure 9) and in thevertical/latitudinal cross-section at 15�W (Figure 10). In thissection, we will make comparisons with climatology(GDEM and Iorga and Lozier [1999]) and other modelresults [Drillet et al., 2005].[41] Figure 9 compares the annual averaged model salin-
ity (a) with the U. S. Navy’s Generalized Digital Environ-mental Model (GDEM) 1/4� resolution climatology (b). Theearly version of the GDEM climatology has been comparedwith Levitus climatology [Teague et al., 1990]. This laterversion of GDEM appears to render better representations ofseasonal variability and high shear regions due to a differentsmoothing method and a finer grid spacing. The consistencyimplies realistic MOW density current penetration, dilutionand propagation, for both climatology and the 1/8� resolu-resolution model. The 35.8 isohaline penetrates to �16�Win GDEM and to �18�W in the model. The thickness of thehigh salinity core with depth, as defined by this isohaline, is�800 m for GDEM and �780 m for the model at 10�W.The mean depth for the GDEM core is �900 m, and for themodel is �1000 m. Iorga and Lozier [1999] [hereafterIL99] present a similar salinity field (their Figure 15a) along46�N; the mean depth of the Lozier et al. [1995] climatol-ogy at this latitude is �1000 m. Its thickness with depth isdifficult to estimate, since the 35.7 isohaline seems to formeddy-like structures at 12�W and 8�W. Thicknesses at thoselongitudes are �400 m at both locations. We note in passing
Figure 7. Annual averaged deep flow west of the Strait of Gibraltar in the 1/24� resolution Gibraltarregional grid at year 20. For depth shallower (deeper) than 1075 m, time averaged bottom field (depth1075 m horizontal field) is shown. (a) Horizontal velocity vectors and depth contours (the unit is meter);(b) Salinity; (c) Temperature; (d) Vertical velocity. Longitude (�) is shown in x axis while latitude (�) isshown in y axis.
C07027 DIETRICH ET AL.: MOW SIMULATION USING COUPLED OCEAN MODEL
10 of 14
C07027
that GDEM seems to have a weak eddy formed at 11�Wwith the 36.0 isohaline.[42] Finally, we compare these with the model results of
Drillet et al. [2005] [hereafter DR05], who used dailyECMWF wind-forcing from 1998–2002, with a meanresolution of about 5 km and 43 levels. In addition, theyhad to use some assimilation of climatology in the Gulf ofCadiz region to improve the correct sinking rate. Their meandepth for the core defined by the 35.8 isohaline is �850 m,and its thickness at 10�W is �700 m (versus 1000 m and780 m for the present modeled depth and thickness,respectively).[43] As noted by both IL99 and DR05, there appear to be
multiple advective pathways of MOW water present in theMid-Atlantic that change with longitude. Figure 10 showsthe vertical cross-sections for the longitudinal velocity Uand salinity S, along 15�W. At this longitude, the flow isrelatively free from the immediate topographic-coastalinfluences of the Iberian Peninsula Coast, and gives aninsight into the main penetration of the MOW into the North
Atlantic. Similar results are displayed from climatology byIL99 at 15�W for S (their Figure 11b), and from simulationsby DR05 for S (their Figure 4b) and U (their Figures 7 and 8).[44] The main difference between these figures is the
appearance in the present results (Figure 10) of three distinctjets (defined by the 36.2 isohaline), centered on the 950 mdepth level, and on longitudes 36.7�W, 39.2�W, and43.4�W, respectively. In Figure 11b of IL99, there appeartwo jets, centered on the 1000 m depth level. The first one,centered on 36.6�W, appears well-defined and strong, thesecond, centered on 39.2�W, appears quite weak. Theseseem to correspond to the southern two jets of the presentsimulations, but with the second one very weak in clima-tology. In Figure 4b of DR05 there appears to be one jetdefined by the 36.2 isohaline, centered on the 850 m depthlevel and on the 38.9�W longitude. This seems to corre-spond to our jet centered on the 39.2�W latitude. The factthat these jets appear also in climatology, in the 3-yearaverage of the DR05 simulations and the annual average ofthe present calculations, suggests that these are not transient
Figure 8. Annual averaged eddy kinetic energy and sea surface height anomaly in the 1/24� resolutionGibraltar regional grid during year 20. (a) RMS velocity anomaly (root mean squared deviation ofhorizontal velocity from its time average) at 1000 m depth; bull’s-eye reflects turbulent wake of MOWflow diverted around mesa-like seamount seen in Figure 6a. The unit of color contours is cm/s. (b) RMSof sea surface height deviation from its time average; dominated by the eastward low density MAWoverriding the westward MOW through the Strait of Gibraltar, and the resulting energetic westernAlboran Sea anticyclonic gyres and associated cyclonic eddies. The unit of color contours is cm.Longitude (�) is shown in x axis while latitude (�) is shown in y axis.
C07027 DIETRICH ET AL.: MOW SIMULATION USING COUPLED OCEAN MODEL
11 of 14
C07027

meddies but manifestations of a more permanent westwardadvective phenomenon, though probably fluctuating inlocation (depth, latitude), and in magnitude with longitude.This will be further discussed in the next paragraphs belowin connection with the advective veins of velocity.[45] An examination of the figures for U shows the
presence of distinct ‘‘veins’’ of westerly motion in bothmodels. The veins in Figure 7 of DR05, labeled 1 and 2, andan unlabeled vein between veins 3 and D, are centered onlongitudes 36.3, 38.7, and 43.3�W, respectively, and appear tohave close alignments with the salinity jets of our Figure 10bcentered on latitudes 36.7, 39.2, and 43.4�W. Figure 10a ofthe present paper shows the presence of a weak vein atlatitudes 36.2, a stronger one at 38.7, and very strong one at43.0�W. A further examination of these two figures showsthe flows in DR05 to be much stronger, but the latitudinallocations are very close.[46] We note that although Figure 7 of DR05 is centered
on 15�W, it actually shows a diagonal cross-section from20�W to 10�W. This may explain the fact that the correla-tion between their velocity veins and our salinity jets isbetter than with the velocity veins in our Figure 10a, sincethe advective effects in the north-south direction and fluc-tuations along longitudes can have significant influences.These effects in fact can be seen clearly in Figure 8 of DR05for the horizontal velocities at 870 m depth. In the domaincovering 30–50�W and 30–50�N, one clearly notes oscil-lations in the current paths, with the currents maintaining alarge degree of connectivity. These path oscillations canexplain some of the latitudinal position changes of the veins
discussed above, and some of the longitudinal amplitudechanges.
4. Summary and Concluding Remarks
[47] This study is especially notable because the MEDI-NA model integration was accomplished using a singleprocessor Pentium 4 based personal computer (PC). It is afull Mediterranean Sea/North Atlantic/Caribbean Sea/Gulfof Mexico system coupled ocean model. Furthermore, itused a purely z-level model to resolve multiscale dynamicswithout data assimilation or nudging to climatology. Thedetailed physical dynamics are resolved by the numericalintegration. The main simulation results are.[48] (1) MOW/MAW volume exchange rate near the
observed �1.0 Sv transport.[49] (2) MOWdownslope migration to its observed�1 km
equilibrium depth in the Gulf of Cadiz.[50] (3) MOW flow around the Iberian Peninsula (into the
Bay of Biscay) and its ability to spread into the 1/8� reso-resolution eastern North Atlantic grid, and even into a 1/16�resolution Bay of Biscay grid.[51] (4) MOW salt core (S > 35.7) penetration to 18�W.[52] (5) The meandering MAW jet and the time mean path
around the anticyclonic gyre in the western MediterraneanSea.[53] This study also showed the MOW interaction with a
large abutment, and its spreading near the equilibrium levelwestward and northward toward observed longitudes andlatitudes. In general, the simulated results and dynamicsagreedwell with observations. These results were noteworthy
Figure 9. Vertical/longitudinal salinity section at 43�N. (a) the annual averaged model results, showingonly upper 24 model levels (scaled to compare with Figure 9b) and (b) U. S. Navy’s GDEM climatology.The unit of color contours is g/kg. Longitude (�) is shown in x axis while depth (m) is shown in y axis.
C07027 DIETRICH ET AL.: MOW SIMULATION USING COUPLED OCEAN MODEL
12 of 14
C07027

since the Strait of Gibraltar sill choke point is resolvedlaterally by four model control volumes (grid points) in thesurface layer and fewer in the bottom few layers throughwhich dense MOW clearly ‘‘spills over the dam’’. We havealso demonstrated that the present multiple grid approach,combined with the lack of excessive dilution of densitycurrents, allows modeling fine-scale features such as theStrait of Gibraltar and its associated MOW density currentin the multibasin-scale model framework. Such multiplegrid approach may be applied judiciously to take advantageof parallel computing power, although the present resultswere all obtained on a single processor PC in a reasonabletime frame.[54] We also emphasize on the importance and the
requirement of maintaining the intense MOW density cur-rents without excessive dilution. Invoking some diffusive
treatments such as instant ‘‘convective’’ adjustment in thebottom two layers of z-level models is simply inappropriatephysics for modeling bottom-hugging density currents(which flow with little dilution over an insulated bottom);see the discussion by Tseng and Dietrich [2006]. Suchapproach does not allow advection to realistically dominatedownslope density current migration–diffusion, dilutionand entrainment being secondary albeit critical processesto model realistically.[55] In the past, some z-level models did poorly in
modeling density currents and this has been taken to implythat this is an inherent feature of all z-level models. Thisconclusion is found to be premature, based on an incom-plete survey of z-level ocean model studies under way [e.g.,Johnson et al., 2002; Dietrich et al., 2004a; Legg et al.,2005; Drillet et al., 2005; Tseng and Dietrich, 2006]. Someof the past problems of z-level models could be attributed toan excessively diffusive behavior resulting from the model’snumerics (nonrobust numerical approximations that requirelarge dissipation to avoid excessive computational noiseand/or numerical instability), or a combination of incom-plete physics and numerics. The current study suggests thatit was these factors, rather than the coordinate system, thatcaused the poor performance.[56] On the basis of the accurate MOW transport simu-
lation in this paper, it seems possible to address long termeffects (decade to century timescale) of MOW on NorthAtlantic Ocean water masses and Arctic Ocean ice dynam-ics using a coupled Mediterranean Sea/North AtlanticOcean/Arctic Ocean model; this requires a straightforwardextension of the present model with added ice dynamics.These long term effects include the evolution of the Med-iterranean Seawater mass properties through directly spec-ifying the river sources rather than deriving them from themodel and climatology as done here. They also includeassessing likely positive biogeochemical feedbacks [Lai etal., 2005]. Such feedbacks may be significant because: thereis more than enough chemical energy in known slightlybuoyant methane hydrates loosely held in the ocean sedi-ments to melt all of the world ocean ice; and biogeochem-ical processes in deep ocean ecosystems can metabolicallyoxidize (‘‘ocean slow burn’’) methane gas in bubbles thatform when the hydrate dissociates due to exposure towarmer currents and the methane gas product escapes frombottom sediments into the overlying water [Lai et al., 2005].This and other ocean biogeochemical dynamic effects onthe ocean water masses can be inferred from observedchemical species distributions in the ocean [Lai, 2006]and are challenging subjects for future research.
[57] Acknowledgments. This project was supported by the MarcelinoBotin Foundation and by AcuSea, Inc. The authors acknowledge the supportfrom National Science Council, Taiwan (grant NSC 962618M002010 and962811M002069) and computing resource of National Center for High-Performance Computing, Taiwan. Useful suggestions and comments onimproving the text by Robert Haney, the editor, and three anonymousreviewers are gratefully acknowledged.
ReferencesBarringer, M., and J. F. Price (1997), Mixing and spreading of the Medi-terranean Overflow, J. Phys. Oceanogr., 27, 1654–1677.
Bascheck, B., U. Send, J. G. Lafuente, and J. Candela (2001), Transportestimates in the Strait of Gibraltar with a tidal inverse model, J. Geophys.Res., 106, 31,017–31,032.
Figure 10. Vertical/latitudinal cross-sections of longitudi-nal velocity component U (a) and salinity S (b) at 15�Wfrom the annual averaged model results. Only upper 24model levels are shown (down to 1450 m). Latitude ranges33–46�N. Unit of salinity is g/kg, and the unit of velocity ismm/s.
C07027 DIETRICH ET AL.: MOW SIMULATION USING COUPLED OCEAN MODEL
13 of 14
C07027
Beckmann, A., and R. Doscher (1997), A method for improved representa-tion of dense water spreading over topography in geopotential-coordinatemodels, Phys. Oceanogr., 27, 581–591.
Bethoux, J.-P., B. Gentili, and D. Tailliez (1998), Warming and freshwaterbudget change in the Mediterranean since the 1940s, their possible rela-tion to the greenhouse effect, Geophys. Res. Lett., 25, 1023–1026.
Bray, N. A., J. Ochoa, and T. H. Kinder (1995), The role of the interface inexchange through the Strait of Gibraltar, J. Geophys. Res., 100, 10,755–10,776.
Curry, R., R. Dickson, and I. Yashayaev (2003), A change in the freshwaterbalance of the North Atlantic Ocean over the last four decades, Nature,426, 826–829.
Dietrich, D. E. (1997), Application of a modified ‘‘a’’ grid ocean modelhaving reduced numerical dispersion to the Gulf of Mexico circulation,Dyn. Atmos. Oceans, 27, 201–217.
Dietrich, D. E., B. E. McDonald, and A. Warn-Varnas (1975), Optimizedblock-implicit relaxation, J. Comput. Phys., 18, 421–439.
Dietrich, D. E., M. G. Marietta, and P. J. Roache (1987), An ocean model-ing system with turbulent boundary layers and topography. Part I: Nu-merical description, Int. J. Numer. Methods Fluids, 7, 833–855.
Dietrich, D. E., A. Mehra, R. L. Haney, M. J. Bowman, and Y.-H. Tseng(2004a), Dissipation effects in North Atlantic Ocean modeling, Geophys.Res. Lett., 31, L05302, doi:10.1029/2003GL019015.
Dietrich, D. E., R. L. Haney, V. Fernandez, S. Josey, and J. Tintore (2004b),Air-sea fluxes based on observed annual cycle surface climatology andocean model internal dynamics: A precise, non-damping zero-phase-lagapproach applied to the Mediterranean Sea, J. Mar. Syst., 52, 145–165.
Drillet, Y., B. Bourdalle-Badie, L. Siefridt, and C. Le Provost (2005),Meddies in the Mercator North Atlantic and Mediterranean Sea eddy-resolving model, J. Geophys. Res., 110, C03016, doi:10.1029/2003JC002170.
Ezer, T., and G. L. Mellor (2004), A generalized coordinate ocean modeland a comparison of the bottom boundary layer dynamics in terrain-following and in z-level grids, Ocean Modell., 6, 379–403.
Fernandez, V., D. E. Dietrich, R. L. Haney, and J. Tintore (2005), Mesos-cale, seasonal and inter-annual variability in the Mediterranean Sea usingthe DieCAST ocean model, Prog. Oceanogr., 66, 321–340.
Hellerman, S., and M. Rosenstein (1983), Normal monthly wind stress overthe world ocean with error estimates, J. Phys. Oceanogr., 13, 1093–1104.
Iorga, M. C., and M. S. Lozier (1999), Signatures of the Mediterraneanoutflow from a North Atlantic climatology: 1. Salinity and density fields,J. Geophys. Res., 104(C11), 25,985–26,009.
Johnson, R. G. (1997), Climate control requires a dam at the Strait ofGibraltar, Eos Trans. AGU, 78, 277, 280–81.
Johnson, J., I. Ambar, N. Serra, and I. Stevens (2002), Comparative studiesof the spreading of Mediterranean water through the Gulf of Cadiz, DeepSea Res., Part II, 49, 4179–4193.
Killworth, P. (2001), On the rate of descent of overflows, J. Geophys. Res.,106(C10), 22,267–22,275.
Killworth, P., and N. R. Edwards (1999), A turbulent bottom boundarylayer code for use in ocean models, J. Phys. Oceanogr., 29, 1221–1238.
Lai, C. A. (2006), Effects of gas hydrates on the chemical and physicalproperties of seawater, J. Pet. Sci. Eng. Spec. Issue Nat. Gas Hydrate,56, 47–53.
Lai, C. A., D. E. Dietrich, and M. J. Bowman (2005), Global warming andthe mining of oceanic methane hydrate, Top. Catal., Spec. Issue MethaneHydrate Mining, 32, 95–99.
Legg, S., R. W. Hallberg, and J. B. Girton (2005), Comparison of entrain-ment in overflows simulated by z-coordinate, isopycnal and non-hydro-static models, Ocean Modell., 11, 69–97, Washington, D.C.
Levitus, S., and T. Boyer (1994), World Ocean Atlas 1994, vol. 4, Tem-perature, 150 pp., NOAA Atlas NESDIS 4.
Lozier, M. S., W. B. Owens, and R. Curry (1995), The climatology of theNorth Atlantic, Prog. Oceanogr., 36, 1–44.
Maltrud, M. E., and J. L. McClean (2005), An eddy resolving global 1/10
degree ocean simulation, Ocean Modell., 8, 31–54.Millot, C. (1999), Circulation in the Western Mediterranean Sea, J. Mar.Syst., 20, 423–442.
Millot, C. (2007), Interannual salinification of the Mediterranean inflow,Geophys. Res. Lett., 34, L21609, doi:10.1029/2007GL031179.
Ozkokmen, T., E. P. Chassignet, and C. G. Rooth (2001), On the connectionbetween the Mediterranean outflow and the Azores Current, J. Phys.Ocean., 31, 461–480.
Pacanowski, R. C., and S. G. H. Philander (1981), Parameterization ofvertical mixing in numerical models of tropical oceans, J. Phys. Ocea-nogr., 30, 1069–1082.
Peters, H., W. E. Johns, A. S. Bower, and D. M. Frantantoni (2005), Mixingand entrainment in the Red Sea overflow plume. Part II: Plume structure,J. Phys. Oceanogr., 35, 569–583.
Rixen, M., et al. (2005), The Western Mediterranean Deep Water: A proxyfor climate change, Geophys. Res. Lett., 32, L12608, doi:10.1029/2005GL022702.
Roache, P. J. (1995), Elliptic Marching Methods and Domain Decomposi-tion, 190 pp., CRC Press, Inc., Boca Raton, Fla.
Sanderson, B. G., and G. Brassington (1998), Accuracy in the context of acontrol-volume model, Atmos. Ocean, 36, 355–384.
Smith, R. D., M. E. Maltrud, F. D. Bryan, and M. M. W. Hecht (2000),Numerical simulation of the North Atlantic Ocean at 1/10�, J. Phys.Oceanogr., 30, 1532–1561.
Staneva, J., D. Dietrich, E. Stanev, and M. Bowman (2001), Rim currentand coastal eddy mechanisms in an eddy-resolving Black Sea generalcirculation model, J. Mar. Syst., Spec. Issue Black Sea, 31, 137–157.
Teague, W. J., M. J. Carron, and P. J. Hogan (1990), A comparison betweenthe Generalized Digital Environmental Model and Levitus climatologies,J. Geophys. Res., 95, 7167–7183.
Tintore, J., P. E. La Violette, I. Blade, and A. Cruzado (1988), A study of anintense density front in the eastern Alboran Sea: The Almeria-Oran front,J. Phys. Oceanogr., 18, 1384–1397.
Tseng, Y.-H., and L. C. Breaker (2007), Nonhydrostatic simulations of theregional circulation in the Monterey Bay area, J. Geophys. Res., 112,C12017, doi:10.1029/2007JC004093.
Tseng, Y.-H., and D. E. Dietrich (2006), Entrainment and transport inidealized three-dimensional gravity current simulation, J. Atmos. Ocean.Technol., 23, 1249–1269.
Tseng, Y.-H., and J. H. Ferziger (2001), Mixing and available potentialenergy in stratified flows, Phys. Fluids, 13, 1281–1293.
Tseng, Y.-H., J. H. Ferziger, and D. E. Dietrich (2005), Regional circulationof the Monterey Bay region-hydrostatic versus non-hydrostatic modeling,J. Geophys. Res., 110, C09015, doi:10.1029/2003JC002153.
Viudez, A., J. M. Pinot, and R. L. Haney (1998), On the upper layercirculation in the Alboran Sea, J. Geophys. Res., 103, 21,653–21,666.
Willebrand, J., B. Barnier, C. W. Boning, C. Dietrich, P. O. Killworth,C. LeProvost, Y. Jia, J. M. Molines, and A. L. New (2001), Circulationcharacteristics in three eddy-permitting models of the North Atlantic,Prog. Oceanogr., 48, 123–161.
�����������������������M. J. Bowman, Marine Sciences Research Center, State University of
New York at Stony Brook, Stony Brook, 215 Endeavour Hall, NY, USA.D. E. Dietrich, AcuSea, Inc., 8450-101 Via Sonoma, La Jolla, CA, USA.M. Liste, R. Medina, and M. Olabarrieta, Ocean and Coastal Research
Group, University of Cantabria, 39005 Av. Castros, Santander, Spain.A. Mehra, Environmental Modeling Center, NCEP/NWS, NOAA, 5200
Auth Road, Camp Springs, MD, USA.S. A. Piacsek, Oceanography Division, Naval Research Laboratory,
Stennis Space Center, 1002 Balch Blvd., MS, USA.Y.-H. Tseng, Department of Atmospheric Sciences, National Taiwan
University, No. 1, Sec. 4 Roosevelt Road, Taipei 10617 Taiwan.([email protected])
C07027 DIETRICH ET AL.: MOW SIMULATION USING COUPLED OCEAN MODEL
14 of 14
C07027