MEDIATING ROLE OF PSYCHOLOGICAL EMPOWERMENT IN THE RELATIONSHIPS BETWEEN STRUCTURAL EMPOWERMENT AND...
282
i MEDIATING ROLE OF PSYCHOLOGICAL EMPOWERMENT IN THE RELATIONSHIPS BETWEEN STRUCTURAL EMPOWERMENT AND ORGANIZATIONAL CULTURE AND WORKPLACE OUTCOMES AMONG ACADEMICS IN MALAYSIAN RESEARCH UNIVERSITIES By SAHAR AHADI Thesis Submitted to the School of Graduate Studies, Universiti Putra Malaysia, in Fulfillment of the Requirements for the Degree of Doctor of philosophy November 2011
Transcript of MEDIATING ROLE OF PSYCHOLOGICAL EMPOWERMENT IN THE RELATIONSHIPS BETWEEN STRUCTURAL EMPOWERMENT AND...

i
MEDIATING ROLE OF PSYCHOLOGICAL EMPOWERMENT IN THE
RELATIONSHIPS BETWEEN STRUCTURAL EMPOWERMENT AND
ORGANIZATIONAL CULTURE AND WORKPLACE OUTCOMES AMONG
ACADEMICS IN MALAYSIAN RESEARCH UNIVERSITIES
By
SAHAR AHADI
Thesis Submitted to the School of Graduate Studies, Universiti Putra Malaysia,
in Fulfillment of the Requirements for the Degree of Doctor of philosophy
November 2011

ii
To the meaning of my life
My mom and dad

iii
Abstract of thesis presented to the senate of University Putra Malaysia in fulfillment
of the requirement for the degree of Doctor of philosophy
ABSTRACT
MEDIATING ROLE OF PSYCHOLOGICAL EMPOWERMENT IN THE
RELATIONSHIPS BETWEEN STRUCTURAL EMPOWERMENT AND
ORGANIZATIONAL CULTURE AND WORKPLACE OUTCOMES AMONG
ACADEMICS IN MALAYSIAN RESEARCH UNIVERSITIES
By
SAHAR AHADI
November 2011
Chairman: Turiman Suandi, PhD
Faculty: Educational studies
The purpose of this study is to examine the mediating effect of psychological
empowerment in the relationship between structural empowerment; organizational
culture and work related outcomes (job satisfaction and organizational commitment)
among academic staffs in research universities in Malaysia. A total of 260 academic
staffs from four research universities (UM; UKM; UPM; and USM) participated in
this study. Questionnaires were used as instruments to gather data on structural
empowerment; organizational culture; psychological empowerment; job satisfaction;

iv
and organizational commitment. SPSS and AMOS softwares were utilized for
analysis the data.
Descriptive statistics (means, standard deviations, and correlation coefficients) were
used. The results of confirmatory factor analysis (CFA), which verify the proposed
factor structure and test of the construct validity and composite validity, were
reported. In conducting confirmatory factor analysis, some items that report lower
factor loadings were removed, also, some constructs that cannot appropriately
support the construct validity were deleted. Finally, structural model was used to test
research hypothesis.
The results of structural model showed there was a significant partial mediation on
the influence of structural empowerment on organizational commitment through
psychological empowerment. And there was a significant partial mediation on the
influence of structural empowerment on job satisfaction through psychological
empowerment. Also, there was a significant and partial mediation on the influence of
clan culture on organizational commitment through psychological empowerment.
And there was a significant partial mediation on the influence of clan culture on job
satisfaction through psychological empowerment
Therefore, psychological empowerment in the context of higher education
organization specially in research universities consider as an important factor, which
may improve work outcomes’ behaviors of academic staff. If leaders of higher
education can improve the psychological empowerment of academic staff in research
universities, this will help them achieve greater commitment and job satisfaction
among academics.

v
Abstrak tesis yang telah di bentangkan kepada Senat Universiti Putra Malaysia
bagi memenuhi kriteria PhD
ABSTRAK
PERANAN PERANTARA PENGUPAYAAN PSIKOLOGI DALAM
HUBUNGAN ANTARA PENGUPAYAAN STRUKTUR DAN BUDAYA
ORGANISASI , DAN HASIL TEMPAT KERJA DALAM KALANGAN STAF
AKADEMIK DALAM UNIVERSITI PENYELIDIKAN DI MALAYSIA
Oleh
SAHAR AHADI
November 2011
Pengerusi: Turiman Suandi, PhD
Fakulti: Pengajian Pendidikan
Objektif kajian ini adalah untuk mengkaji keberkesanan pengaruh psikologi yang
berperanan sebagai perantara terhadap hubungan dalam pengupayaan struktur,
budaya organisasi, dan hasil kerja dalam organisasi (kepuasan kerja dan komitmen

vi
organisasi) di kalangan staf akademik universiti penyelidikan di Malaysia. Sebanyak
260 staf akademik dari empat universiti penyelidikan (UM, UKM, UPM, dan USM)
telah dipilih sebagai responden dalam kajian ini. Kaedah soal selidik telah
digunakan sebagai instrumen bagi mengumpul data untuk mengkaji keberkesanan
pengaruh psikologi yang berperanan sebagai perantara ke atas pengupayaan struktur
budaya organisasi, kepuasan hasil kerja organisasi, dan komitmen organisasi.
Perisian SPSS dan AMOS telah digunakan dalam penganalisan data.
Statistik deskriptif (mean, standard deviation, dan correlation coefficients) telah
digunakan dalam kajian ini. Analisis Pengesahan Faktor (CFA) digunakan untuk
membuktikan hubungan antara faktor yang mempengaruhi pengupayaan struktur
dan ujian kesahihan soalan serta kesahihan data komposit.
Dalam pengaplikasian Analisis Pengesahan Faktor (CFA), item yang tidak menepati
kesahihan dan item yang tidak dapat membuktikan data telah dipadam. Struktur
Model telah digunakan untuk mengkaji hipotesis kajian ini.
Dapatan kajian menunjukkan Struktur Model yang menjadi pengantara mempunyai
hubungan separa signifikan dengan struktur dalam organisasi serta komitmen dalam
organisasi apabila kaedah pengaruh psikologi digunakan. Keputusan juga
menunjukkan struktur dalam organisasi mempunyai hubungan separa signifikan
dalam mempengaruhi kepuasan kerja apabila kaedah pengaruh psikologi digunakan.
Tambahan pula, data menunjukkan hubungan signifikan dan hubungan separa
signifikan antara budaya berpuak dan komitmen dalam organisasi serta hubungan
separa signifikan antara budaya berpuak dengan kepuasan hasil kerja apabila kaedah
psikologi digunakan.

vii
Oleh sebab itu, pengaruh psikologi yang berperanan sebagai perantara adalah lebih
memihak kepada konteks organisasi pengajian tinggi terutama universiti
penyelidikan dimana ia boleh meningkatkan kepuasan hasil kerja staf akademik.
Sekiranya pemimpin dalam pengajian tinggi boleh meningkatkan kesedaran
psikologi dikalangan staf akademik dalam universiti penyelidikan, ia boleh
membantu meningkatkan tahap komitmen serta meningkatkan tahap kepuasan
pekerjaan dikalangan staf akademik.

viii
ACKNOWLEDGEMENTS
I would like to express my deepest appreciation and gratitude to the chairman of my
supervisory committee, Prof. Dr. Turiman Suandi for his help and guidance in
making the completion of my dissertation a success. Dr. Suandi was there from the
initial phase of the dissertation process, first as a as chairperson by providing
excellent recommendation and feedback.
I am also indebted and very grateful to my committee members during the
preparation of this dissertation. I would like to take this opportunity to express my
deepest appreciation to Prof. Dr. Maimunah Ismail for her careful review, advice and
ongoing suggestions and Dr. Zoharah Omar for being always very energetic and
supportive of my ideas.
Second, I would like to thank Dr. Ismi Arif Ismail the head of Department of
Professional Development and Continuous Education, and my dear friend Siti
Rohani for providing invaluable support and assistance in the process of data
collection. Third, I would like to thank the academic staff who took time out of their
busy schedules to complete the survey questionnaire.
Finally, I like to express my gratitude to my dearest my mom and dad for their
patience and understanding of this long endeavor to complete my doctoral studies.
They made it possible for me to actually do this.

ix
APPROVAL
I certify that an Examination Committee has met on 25 November 2011 to conduct
the final examination of Sahar Ahadi on her Doctor of Philosophy thesis entitled
“Mediating Role of Psychological Empowerment in the Relationships Between
Structural Empowerment and Organizational Culture and Workplace Outcomes
Among Academics in Malaysian Research Universities” in accordance with
Universiti Pertanian Malaysia (Higher Degree) Act 1980 and Universiti Pertanian
Malaysia (Higher Degree) Regulations 1981. The Committee recommends that the
candidate be awarded the relevant degree.
Members of Examination Committee are as follows:
Abu Duad b Silong, PhD
Professor
Faculty of Educational Studies
Universiti Putra Malaysia
(Chairman)
Aminah bt Ahmad, PhD
Professor
Faculty of Educational Studies
Universiti Putra Malaysia
(Internal Examiner)
Jegak Anak Uli, PhD
Associate Professor
Faculty of Educational Studies
Universiti Putra Malaysia
(Internal Examiner)
Gary J. Confessore
Professor Emeritus
George Washington University
United States of America
(External Examiner)
Prof. Dr. Seow Heng Fong
Professor/Deputy Dean
School of Graduate Studies
Universiti Putra Malaysia
x
This thesis submitted to the Senate of Universiti Putra Malaysia and has been
accepted as fulfillment of the requirement for the degree of Doctor of Philosophy.
The Members of the Supervisory Committee were as follows:
Turiman Suandi, PhD
Professor
Faculty of Educational Studies
Universiti Putra Malaysia
(Chairman)
Maimunah Ismail, PhD
Professor
Faculty of Educational Studies
Universiti Putra Malaysia
(Member)
Zoharah Omar, PhD
Senior Lecturer
Faculty of Educational Studies
Universiti Putra Malaysia
(Member)
BUJANG KIM HUAT, PhD
Professor and Dean
School of Graduate Studies
Universiti Putra Malaysia
Date:

xi
DECLARATION
I hereby declare that the thesis is based on my original work except for quotations
and citations which have been duly acknowledged. I also declare it has not been
previously or concurrently submitted for any other degree at Universiti Putra
Malaysia or other institutions.
Sahar Ahadi
Date:

xii
TABLE OF CONTENT
Page
ABSTRACT iii
ABSTRAK v
ACKNOWLEDGEMENTS viii
APPROVAL ix
DECLARATION xi
LIST OF ABBREVIATIONS xix
CHAPTER
1.1 Background of study 3 1.2 Statement of problem 4 1.3 Objectives 7
1.4 Hypotheses 8 1.5 Significance of study 8
1.6 Definition of terms 12 1.7 Scope and Limitations of study 13
2.1 Introduction 15
2.2 Academic culture 15 2.3 Concept of Empowerment 19
2.4 Empowerment Theories 27 2.4.1 Structural Empowerment Theory 27
2.4.2 Psychological Empowerment Theory 30 2.4.3 Psychological Empowerment in Educational Work Setting 34 2.4.4 Post-modern Empowerment Theories 36
2.4.5 Integrative Perspective on Empowerment 36 2.5 Research Universities 40 2.6 Structural Empowerment and Psychological Empowerment 44
2.7 Organizational Culture and Psychological Empowerment 45 2.8 Psychological Empowerment and Jab Satisfaction 51
2.9 Psychological Empowerment and Organizational Commitment 56 2.10 Structural Empowerment and Job Satisfaction 60 2.11 Mediating role of Psychological Empowerment in Relationship between
Structural Empowerment and Job Satisfaction 62
2.12 Structural Empowerment and Organizational Commitment 63
2.13 Mediating role of Psychological Empowerment in Relationship between
Structural Empowerment and Organizational Commitment 64
2.14 Organizational Culture and Job Satisfaction 65 3.15 Mediating role of Psychological Empowerment in Relationship between
Organizational Culture and Job Satisfaction 66 2.16 Organizational Culture and Organizational Commitment 67
1 INTRODUCTION 1
2 LITERATURE REVIEW 15

xiii
2.17 Mediating role of Psychological Empowerment in Relationship between
Organizational Culture and Organizational Commitment 67 2.18 Theoretical Framework of Study 69 2.19 Summary 72
3.1 Introduction 75 3.2 Research Design 75 3.3 Research Hypotheses of Study 76
3.4 Measurement and Instrument 77 3.5 Population 82
3.6 Sampling Procedure 84
3.9.2 Construct Validity 86 3.9.3 Convergent Validity 87
3.9.4 Discriminant Validity 87 3.10 Reliability 88
3.10.1 Cronbach Alpha Reliability 88 3.10.2 Composite Reliability 91
3.11 Data Analysis 91
3.12 Structural equation modeling 93
3.13 Measurement model: Confirmatory Factor Analysis (CFA) 95 3.13.1 CFA of Structural Empowerment 96
3.13.2 CFA of Organizational Culture 99 3.13.3 CFA of Psychological Empowerment 102
3.13.4 CFA of Psychological Empowerment (modified) 102
3.13.5 CFA of Job Satisfaction 106 3.13.6 Partial Disaggregation (Item Parceling) 109
3.13.7 CFA of Organizational Commitment 113
3.14 Summary 119
4.1 Introduction 120
4.2 Descriptive Statistics 120
4.2.1 Distribution of level of structural empowerment 123
4.2.2 Distribution of level of psychological empowerment 123
4.2.3 Distribution of level of job satisfaction 124
4.2.4 Distribution of level of organizational commitment 124
4.2.5 Organizational culture profile 125
4.3 Assumption Check 125
4.4 Total Model: Evaluation of Measurement Model 129 4.4.1 Baseline Model 129
4.4.2 Respecified Model 129 4.4.3 Respecified model fit 129
4.5 Reliability 134
4.5.1 Composite reliability 134
4.6 Validity 134
4.6.1 Convergent validity 134
4.6.2 Discriminant validity 135
4.7 Structural Model 138
3 METHODOLOGY 75
4 FINDINGS AND DISCUSSIONS 120

xiv
4.7.1 Direct model 138
4.7.2 Respecified model 146
4.7.3 Partial Mediated Model 150
4.7.4 Full Mediated Model 155
4.8 Mediating role of psychological empowerment 158
4.9 Nested model comparison 161
4.10 Bootstrapping 161
4.11 Significance of Standardized Indirect Effect 163
5.1 Introduction 165
5.2 Discussion 165
5.2.1 Measurement Models 165
5.2.2 Structural Models 167
5.3 Implications 175
5.3.1 Theoretical Implications 175
5.3.2 Implications for Practice 178
5.4 Contribution to HRD 179
5.5 Further Research 183
5.6 Conclusion 184
7.1 APPENDIX A1: Demographic Information Sheet 214
7.2 APPENDIX A2: Conditions of Work Effectiveness Questionnaire – II 215
7.3 APPENDIX A3: Organizational Culture Assessment Instrument 217
7.4 APPENDIX A4: Faculty Empowerment Scale 220
7.5 APPENDIX A5: Job Satisfaction Survey 222
7.6 APPENDIX A6: Organizational Commitment Questionnaire 224
7.7 APPENDIX B1: Assessment of Normality (Group number1) 226
7.8 APPENDIX B2: (Mahalanobis distance) (Group number1) 228
7.9 APPENDIX C1: First-order CFA of Structural Empowerment 231
7.10 APPENDIX C2: First-order CFA of Organizational Culture 232
7.11 APPENDIX C3: First-order CFA of Psychological Empowerment 233
7.12 APPENDIX C4: First-order CFA of Job Satisfaction 234
7.13 APPENDIX C5: First-order CFA of Organizational Commitment 235
7.14 APPENDIX C6: Measurement Model (base line model) 236
7.15 APPENDIX D1: Correlations: (default model) 237
7.16 APPENDIX D2: Baseline First Model Fit 238
7.17 APPENDIX D3: Correlations (default model) 241
7.18 APPENDIX D4: Respecified Model Fit 242
7.19 APPENDIX D5: Standardized Regression Weights: (default model) 245
7.20 APPENDIX D6 Baseline Model Fit Summary 246
7.21 APPENDIX E1: Regression Weights: (direct model) 249
7.22 APPENDIX E2: Standardized Regression Weights: (direct model) 250
7.23 APPENDIX E3: Modified Model (direct Model) 251
7.24 APPENDIX E4: Standardized Regression Weights: (Direct model) 255
7.25 APPENDIX E5: Regression Weights: (direct model) 256
5 CONCLUSION, IMPLICATIONS AND RECOMMENDATIONS 165
6 REFERENCES 189
7 APPENDICES 213

xv
7.26 APPENDIX E6: Assuming model Default model 257
7.27 APPENDIX E7: Regression Weights: (default model) 258
7.28 APPENDIX E8: Standardized Regression Weights: (default model) 259
7.29 APPENDIX F1: Standardized Indirect Effects (default model) 260
7.30 APPENDIX F2: Standardized Indirect Effects 261
BIODATA OF STUDENT 262

xvi
LIST OF TABLES
Table Page
2.1 Definitions of employee empowerment in different work settings 25
3.1 Population of academic staff based on gender distribution 83
3.2 Sample size based on gender distribution in four research universities 85
3.3 Cronbach reliability coefficients conditions for work effectiveness 88
3.4 Cronbach reliability coefficients for organizational culture 89
3.5 Cronbach reliability faculty psychological empowerment 90
3.6 Cronbach reliability coefficients for job satisfaction survey 90
3.7 Cronbach reliability organizational commitment questionnaire 91
3.8 Summary of objectives, hypotheses and statistics use 119
4.1 Mean, standard deviation, frequency and percentage 121
4.2 Mean, standard deviation and reliability of measurement variables 122
4.3 Frequency, mean and SD of structural empowerment 123
4.4. Frequency, mean and SD of psychological empowerment 123
4.5 Frequency, mean and SD of job satisfaction 124
4.6 Frequency, mean and SD of organizational commitment 124
4.7 Multicollinearity 127
4.8 Multicollinearity (respecified) 128
4.9 Composite reliability 134
4.10 Convergent validity 135
4.11 Estimation of squared correlation 135
4.12 Discriminant validity 137
4.13 Path coefficient of direct model (base line model) 139
4.14 Path coefficients of direct model (respecified model) 148

xvii
4.15 Standardized indirect effect 154
4.16 Direct, indirect and total effects of latent exogenous variables 157
4.17 Nested model comparisons 161
4.18 Indirect effect of PE in relationship between SE and JS/COM 164
4.18 Indirect effect of PE in relationship between OC and JS/COM 164

xviii
LIST OF FIGURES
Figure Page
2.1 Psychological empowerment model 33
2.2 Kanter’s work place structural empowerment theory 39
2.3 The competing value framework 49
2.4 Theoretical framework of study 74
3.1 Research hypotheses of study 78
3.2 Second-order CFA of Structural Empowerment 98
3.3 Second-order CFA of Organizational Culture 101
3.4 Second-order CFA of Psychological Empowerment 105
3.5 Second- order CFA of Psychological Empowerment (Aggregation) 108
3.6 Second-order CFA of Job Satisfaction 112
3.7 Second-order CFA of Job Satisfaction (Respecified Model) 113
3.8 Second-order CFA of Organizational Commitment 116
4.1 Organizational culture profile plot 125
4.2 Measurement model (respecified model) 133
4.3 Structural model (base line model) 145
4.4 Structural model (respecified Model) 149
4.5 Structural model (partial mediated model) 151
4.6 Structural model (full mediated model) 156

xix
LIST OF ABBREVIATIONS
AHD Human Resource Development
AVE Average Variance Extracted
CFA Confirmatory Factor Analysis
CFI Comparative Fit Index
COM Organizational Commitment
GFI Goodness of Fit Index
IFI Incremental Fit Index
OC Organizational Culture
PE Psychological Empowerment
RMSEA Root Mean Square Error of Approximation
SE Structural Empowerment
SEM Structural Equation Modeling
UiTM Universiti Teknologi MARA
UKM Universiti Kebangsaan Malaysia
UM Universiti of Malaya
UPM Universiti Putra Malaysia
USM Universiti Sains Malaysia

1
CHAPTER 1
1 INTRODUCTION
Around 70 percent of organizations in this century have intervened empowerment
strategies in their work settings (Lawler, Mohrmen, & Benson, 2001). Workplace
empowerment has been acknowledged as the important and new intervention for
organizational development. Although the idea of empowerment comes from
business and industrial efforts to improve productivity (Short & Johnson, 1994)
empowering academics will also benefit the educational institution, individuals and
colleagues. There is significant support for developing empowerment in
organizations (Thomas & Velthouse, 1990; Spreitzer 1995, 1996; Spreitzer, Kizilos
& Nason, 1997; Laschinger, Finegan, Shamian, & Casier 2001; Cho, Laschinger &
Wong, 2006; Laschinger, Finegan & Wilk, 2009; Bailey, 2009; Biron & Bamberger,
2010). This support has fostered a greater collaboration between business and
academia.
The concept of empowerment academics in colleges and universities - to improve
their academics’ skills and increase professional growth - has been entered into
higher education context within the last decade. Academics comprise a large
percentage of the educational institution. They are the ones who accomplish the
mission and who endeavor to accomplish the goals of the institution. Academics
work and exist within their universe of norms, standards, expectations (Tierney,
1999, 2008; Mountjoy, 2001; Bartell, 2003; Fralinger, Olson, Pinto-Zipp, &
DiCorcia, 2010).

2
Studies of academic culture reveal that academics are greatly influenced by the kind
of institution in which they work (Clark, 1987; ASHE 2003; Budd, 2005; Umbach,
2007).
Like the other workplaces, universities believe that the key to successful
achievement is to focus on the empowerment of their human resources. It is
anticipated that this research will support the need for academics’ empowerment to
enhance the fulfillment of the university’s mission and to improve its organizational
climate. There are a few researches on empowerment in educational organizations,
especially in universities.
Making a career in academia more attractive requires enough consideration on their
empowerment (Short & Greer, 1997; Contreras-McGavin, 2004; Lambert, 2006;
Strazzeri, 2005; Thorndyke, Gusic, George & Quillen, 2006). Empowerment helps
employers and managers to work independently in their workplace (Bowen & Lawler
1992; Spreitzer, 1996; Laschinger, Finegan, Shamian, 2001; Schneider, Dowling &
Raghuram, 2007).
Furthermore, it allows leadership within research universities to select and give more
responsibilities to their academics. Therefore, they can arrange and complete their
tasks well instead of carry out them weakly. In an empowered educational
organization, academics are able to participate in decision making, performing
powerful tasks; they develop initiative, work in teams as well as individually; they
are rewarded for participation, have opportunity for risk taking, and have support for
work-life integration. The empowerment of academics is one of the most successful
ways to improve motivation, organizational commitment, and job satisfaction

3
(Honold, 1997; Manojlovich & Laschinger 2002; Henkin & Marchiori 2003; Wang
& Lee 2009).
1.1 Background of study
Pressure, change and uncertainty are some of the challenges that higher education
faces these days (Bartell 2003; Machado & Taylor 2010). Increasing changes and
pressures from global markets and government change the roles and work style of its
academics and scholars (McInnis 2000; Altbach 2004; Douglass 2005; Gordon &
Whitchurch 2007; Wood, 2005). These challenges are not only related to structure
and systems but also to the development of academic staff. Universities need
increasingly to compete globally with other knowledge providers for highly qualified
staff with new and different skills in research and teaching activity.
To remain competitive, higher education needs flexible strategies that encourage
innovation and allow the academic staff to accomplish appropriately to their various
responsibilities. Teaching, scholarship, research, consultancy, community service,
and administration are the major tasks of academics in universities in the
globalization era.
Since academics are influenced by the culture of their employing institutions (Clark,
1987; Bartell, 2003; Umbach, 2007; Fralinger, Olson, Pinto-Zipp, & DiCorcia, 2010)
and institutions of higher education tend to favor slow change over time, the inability
of a university to respond to these changing might be dangerous to their continued
existence. Higher education is seeking to increase creativity and productivity from
their academic staff (Altbach 2004; Eckel & King, 2004). An ever increasing body of
literature suggests globalization era higher education needs to empower their

4
academic staff (Gordon & Whitchurch 2007; Henkin & Marchiori 2003; Lambert
2006). Research universities have not been protected from this movement toward a
more empowered workplace.
The link between increasing empowerment and job satisfaction, organizational
commitment and productivity is well-documented and now assumed within business
and industry (Seibert, Silver & Randolph, 2004; Logan & Ganster, 2007; Greasley,
Bryman, Dainty, Price & Naismith, 2008; Yang & Choi 2009; Biron & Bamberger,
2010). For nearly fifteen years, the idea of empowerment has been seen often
throughout educational literature (Short & Rinehart, 1992; Short & Johnson, 1994;
Wu & Short, 1996, Perkins, 2006).
Some have found that various dimensions of empowerment are predictors of work
outcomes such as job satisfaction and job commitment in the higher education
context (Manojlovich & Laschinger 2002; Lambert 2006; Gordon & Whitchurch,
2007). Rinehart and Short (1994) assume that enhancing empowerment will increase
job satisfaction and organizational commitment for academic and so increasing
empowerment may be viewed as a means of strengthening job performance for
academic staff in research universities.
1.2 Statement of problem
Today policymakers in Malaysia understand that higher education plays a key role in
the accomplishment of modern society (Newman and Couturier, 2004). It seems that
this responsibility is related more to research universities than the other universities
in Malaysia. Research University goals shift to the creation of new knowledge
(Ministry of Education, 2004, p. 4).

5
Recent change and conflict in the academic environment of research universities
have influenced the way they perform their tasks and may affect academics’ level of
job satisfaction and job commitment and lead to lower organizational commitment
and job satisfaction (Bryson, 2004; Noordin, 2009; Daud, 2010). The studies show
that high satisfaction and commitment level is essential in maintaining in Research
University (Morris et al. 2004; Chong et al., 2010).
Previous studies for development of structural and psychological empowerment
theories (Kanter,1977; Conger & Kanungo, 1988; Thomas & Velthouse, 1990;
Spreitzer, 1995) as well as research on the relationships of empowerment to various
work place outcomes (Sparrowe, 1994; Spreitzer, Kizilos & Nason, 1997; Seibert,
Silver & Randolph, 2004; Logan & Ganster, 2007; Greasley, Bryman, Dainty, Price
& Naismith 2008; Yang & Choi, 2009; Biron & Bamberger, 2010), show the
importance of both structural and psychological empowerment not only in business
but also in educational settings. Empowerment within higher education in Malaysia
can increase the level of workplace outcomes (Ghani et al. 2009; Choong & Wong,
2011).
According to structural empowerment theory, structural empowerment provides the
possibility to improve staff performance. Meanwhile, psychological empowerment
improves job performance, job satisfaction and organizational commitment.
However, the mechanisms and processes by which structural empowerment
influences employee’s positive job outcomes, especially in universities, have not
been adequately addressed in the literature (Zimmerman, 1990; Spreitzer, 1995;
Laschinger et al., 2001; Manojlovich & Laschinger, 2002; Chang, Shih & Lin, 2009).

6
The mediating role of psychological empowerment between structural empowerment
and work related outcomes has been relatively neglected especially in the context of
higher education in southeastern countries. The positive work behavior outcomes of
structural empowerment may be mediated by intrinsically motivating work
experience of psychological empowerment (Liden, Wayne & Sparrow, 2000; Avolio,
Zhu, Koh & Bhatia, 2004; Aryee & Chen, 2006; Chang, Shih & Lin, 2009; Knol &
Linge, 2009).
To have a successful empowerment process, contextual factors are important with in
the organizations (Rappaport, 1984; Siegell & Gardner, 2000; Crawford, 2008;
Tierney, 2008; Trivellas & Dargenidou, 2009). Organizational culture is one of the
contextual factors that provide a comprehensive framework for understanding and
assessing empowerment to succeed within universities. Working on empowerment
strategies without any focus on environmental factors such as cultural contexts may
limit the understanding of the construct of empowerment (Zimmerman, 1990; Sigler
& Pearson, 2000; Johnson, 2001; Spreitzer 1995, 2006; Crawford, 2008; Kim, 2008).
While organizational culture and structural empowerment have been frequently
examined as the antecedents of psychological empowerment (Schlesinger & Heskett,
1991; Sparrowe, 1994; Spreitzer, 1996; Hawks, 1999; Liden et al., 2000; Siegall &
Gardner, 2000; Carless, 2004; Wallach & Mueller, 2006; Bailey, 2009; Johnson,
2009), there is lack of study in understanding the mediating effect of psychological
empowerment between organizational culture and job outcomes, especially in
research universities. Meanwhile, the study of organizational culture in the field of
academic empowerment has been ignored.

7
Psychological empowerment may assist as a mechanism through which structural
empowerment and organizational culture influence work place outcomes.
Apparently, the leaders within the context of higher education must focus on
distinguishing the mechanisms and processes of relationship between contextual
factors and work place outcomes in research universities as there are few studies in
this context on empowerment of academics.
So the purpose of this study is to understand the mediating role of psychological
empowerment between structural empowerment, organizational culture and job
satisfaction as well as organizational commitment.
1.3 Objectives
Main objective
The main objective of this study is to examine the mediating effect of
psychological empowerment in the relationship between structural
empowerment, organizational culture, and work related attitudes (job satisfaction
and organizational commitment).
Specific objectives
Specific objectives of the study are as follow as:
1. To determine the mediating effect of psychological empowerment in the
relationship between structural empowerment and job satisfaction
2. To determine the mediating effect of psychological empowerment in the
relationship between structural empowerment and organizational
commitment

8
3. To determine the mediating effect of psychological empowerment in the
relationship between organizational culture and job satisfaction
4. To determine the mediating effect of psychological empowerment in the
relationship between organizational culture and organizational commitment
5. To develop the best fit model for the research
1.4 Hypotheses
1. Psychological empowerment mediates the relationship between structural
empowerment and job satisfaction.
2. Psychological empowerment mediates the relationship between structural
empowerment and organizational commitment.
3. Psychological empowerment mediates the relationship between
organizational culture and job satisfaction.
4. Psychological empowerment mediates the relationship between
organizational culture and organizational commitment.
1.5 Significance of study
This study is significant in the field of human resource development in higher
education, both theoretically and practically. There are theoretical justifications for
studying the empowerment of academics in research universities. This study
investigates the mediating role of psychological empowerment in relationships
between structural empowerment, organizational culture, and work place outcomes
(organizational commitment and job satisfaction) and contributes to theoretical
understanding of these constructs in the context of higher education in southeastern
countries.

9
An accurate and valid empowerment model provides human resource development
professionals with worthy and useful instruction that can be applied to the quality
improvement of higher education institutions.
Within the context of a university, human resource development professionals may
want to review and analyze organizational development theories and models related
to empowerment. Since this clearly affects academics’ job satisfaction and
organizational commitment, it helps human resource development frontiers to find
ways which could enhance or improve job satisfaction levels and their commitment
to the university.
An important solution that human resource developers can use for inviting, maintain
and motivating academic staff in research universities is psychological
empowerment. Therefore, the findings of this study may help to enhance the
practitioners’ and managers’ awareness of psychological empowerment as a
powerful and valuable managerial intervention means.
As the concept of empowerment in higher education is new, human resource
developers need to know which perceptions of empowerment receive less attention
from research universities. The findings of this study will provide more knowledge
of empowerment perception and the level of empowerment to HRD practitioners and
leadership. This information can be use further by adding new knowledge to the
concept of empowerment itself and to the concept of academics’ performance and
effectiveness, particularly in research universities and generally in organizations.
Psychological empowerment as a mediating factor has not previously been examined
10
in research universities in Malaysia. The results of this study will provide new and
valuable practical knowledge into the empowerment of academic staff.
A critical role of academics is to promote student empowerment that advances their
performance at the work place and in their real life. Academic staffs who have
control over their teaching and who are active participants in a decision making
process in curricular, instructional and organizational issues usually perceive
themselves as being empowered (Short & Johnson, 1994; Hawks, 1999; Womack &
Loyd, 2004; Perkins, 2006; Gardenhour, 2008).
This study is theoretically significant for advancing both structural and psychological
empowerment theory in higher education settings. Empowerment theory,
contextualized by research universities setting, can be used to develop Spreitzer’s
(1997) theoretical model of psychological empowerment and Kanter’s (1977)
theoretical framework of structural empowerment. Theoretically this study
emphasizes the significance of the mediating role of psychological empowerment for
promoting the relationship between structural empowerment and organizational
culture with work-related outcomes.
The academics of universities, like staff in other organizations, need to handle with
the challenges in the competitive work place. Lee (2004), comments: “[The]
Academic profession [in Malaysia] has had to adapt to the rising student numbers,
financial constraints and changing role of lecturers, which happened in the
universities” (p.137). One of the ways to survive successfully in this challenging
work place is to imply an environment which can help empowerment of academics
and ascertain them for protection from suffering these changes and pressures.
11
Many of these challenges are firmly associated with the empowerment dimensions
(such as autonomy, self-efficacy, access to information and resources, having support
and opportunity, meaning, impact, professional growth, status, and decision making).
Laschinger et al. (2001) claims that challenges in the workplace, which can cause job
dissatisfaction and low commitment to the organization, can be reduced with the
establishment of structural and psychological empowerment at the work place.
As universities are seeking to find various strategies to create an appropriate
environment for empowerment among academics, various factors can be considered
for the successful implementation in the work place, including technology, training,
and organizational culture. Empowerment of academics can be attributed to the
culture of an organization (Spreitzer, 1995; Johnson, 2009). Management theorists
have argued that specific contextual factors such as organizational culture contribute
to the empowerment among employees. Organizational culture is considered an
important component of organizational life affecting both performance and behavior,
whether positive or negative (Thompson & Luthans, 1990; Baily, 2009). Researchers
are uncertain that in the context of educational institutions, academics have a high
level of empowerment.
There are few researches on academics’ empowerment in research universities,
especially in Malaysia, determining academics’ empowerment and the possible
influence of factors on this perception. Added to this would be the need to study the
empowerment concept based on an integrative model in higher education to advance
understanding of empowerment of academics. The purpose of this study is therefore
to determine the mediating role of psychological empowerment in the relationship
between contextual factors and work outcomes in research universities in Malaysia.

12
1.6 Definition of terms
Psychological empowerment is defined as “increased intrinsic task
motivation manifested in asset of cognitions (task assessment) reflecting an
individual’s orientation to his or her work role” (Thomas & Velthouse, 1990,
p.1). Six components of psychological empowerment (decision making,
professional growth, status, self-efficacy, autonomy and impact) are studied
in this research.
Structural empowerment is defined as social structures in the workplace
that determine the behaviors and attitudes of the employees. Employees in
organization are empowered when they clearly distinguish that structure
organization present sufficient opportunity for growth and access to power
needed to accomplish their responsibilities within the organization (Kanter,
1977). Six components of structural empowerment namely, opportunity,
information, support, rewards, formal and informal power are studied in this
research.
Organizational culture is employees’ accepted assumptions, and
expectations and values which influence on the concept and feedback to the
organizational environment. (Quinn & Spreitzer, 1997). Four types of
organizational culture (clan, adhocracy, market, and hierarchy culture) are
studied in this research.
Job satisfaction is “the pleasurable emotional state resulting from the
perception of one’s job fulfillment or allowing the fulfillment of one’s
important job values” (Locke, 1976, p.1342). Nine facets of job satisfaction
containing pay, promotion, supervision, fringe benefits, contingent rewards,

13
operating conditions, co-workers, nature of work, and communication are
considered in this study.
Organizational commitment is “a psychological state that characterizes the
employee’s relationship with the organization and has implications for the
decision to continue membership in the organization. Organizational
commitment refers to the employee’s emotional attachment to, involvement
in and identification with, the organization” (Meyer & Allen, 1991, p.67).
Three dimensions, namely affective commitment, normative and continuance
commitment are considered as organizational commitment in this study.
Academic staff refers to Professors, Associate Professors, Assistant
Professors, Instructors and lecturers who work at four research universities
(UM, USM, UKM, UPM) in Malaysia.
Research University in this study of research universities refers to four
universities, namely UM, USM, UKM, and UPM that were accorded the
status of research universities in 2006 from the Ministry of Higher Education
(MOHE) in Malaysia.
1.7 Scope and Limitations of study
This study restricted in its scope to only focus on structural empowerment and
organizational culture that affect workplace outcomes. This study also focuses only
on the concept of psychological empowerment as a mediator between structural
empowerment, organizational culture, and workplace outcomes. As the study design
is co relational, and not all the factors related to empowerment are considered in this
study, so the possibility of other variables affecting the outcome will exist. Other
factors can play a role in increasing organizational commitment and job satisfaction

14
Other limitations exist that may have impact on data interpretation in this study.
These include self-reported responses to questionnaires and a vast number of
questions which may cause low return rate of questionnaires, and lack of application
of the theoretical background on empowerment in the university context. Since this
study is limited to research universities in Malaysia, the result does not necessarily
reflect academics at other types of universities such as public or private universities
in Malaysia.
Modification indices are done in the measurement models in the process of model
modification. While model modification processes are commonly accepted, the
modifications should be supported on theoretical grounds. As it has been argued that
these modifications lead to information loss in the measurement model and
empirically-driven models, it should be noted that a limitation of the present study is
that revised measurement models are only known to fit current data and need to be
re-examined for validity and other fit indices with data from other samples.
Another important limitation is the sample size in this study, which results in low
model fit and in order to have better model fit and reduce the parameters, item
parceling is done. Additional limitation regarding the data used in present study is
that the data were obtained from self-reported and subjective measures to assess
participants’ attitudes. This kind of assessment may lead to increased social
desirability bias and common method variance between predictor variables and
outcome variables.

15
CHAPTER 2
2 LITERATURE REVIEW
2.1 Introduction
This chapter focuses on academic culture, definition of empowerment, theories of
workplace empowerment, empowerment in educational settings, research universities
characteristic, research universities in Malaysia, relationships between structural
empowerment and psychological empowerment, organizational culture and
psychological empowerment, structural empowerment and job satisfaction, structural
empowerment and organizational commitment, theoretical framework of study and
summary of this chapter.
2.2 Academic culture
Faculties in universities, like departments or divisions in other organizations have
their own cultures. The culture of academic staff contributes to performance of
academics and non-academic staff. So, the first issue in a higher education setting is
the academic culture as components of academic culture are useful for understanding
the institution. The culture of an organization shapes the outcome behaviors of
employees (Sparrowe, 1994; Sigler & Pearson, 2000; Tierney, 2008; Trivellas &
Dargenidou, 2009).
Academics at research universities are responsible for their tasks and have their own
culture (Mountjoy, 2001). The literature review shows that academic culture consists
of the concepts and symbols of academic freedom, autonomy, peer-review, merit
principle, change, and professionalism.

16
Academic Freedom
Academic freedom means the freedom of the academic to teach without external
control in his or her area of expertise. After the establishment of research universities
in Germany in the 19th
century, this freedom was given to academic staff in their
teaching and conducting of research. This concept was defined by the American
Association of University Professors (AAUP) at the end of the 19th
century. They
insisted that academic freedom must include not only academic proficiency but all
issues related to their work (Altbach, 2001).
Academics should have academic autonomy from government, students, parents, and
religious sectors in their teaching and research, because accountability and
responsibility of academics to society is very important; academics must be given the
opportunity to perform their tasks without the intervention of any religious or
political parties.
It is very important that in institutional settings, especially in research universities,
academics have the freedom to decide about teaching and research. This freedom is a
kind of decision-making that gives power to academic staff. Administrations must
give more consideration to this concept in research universities. As a result,
academics that have this freedom in their departments may have more power in their
workplace (Womack & Loyd, 2004).
Autonomy
Academics in higher education need high autonomy (Moses, 2007). This autonomy
arises from social contract and in higher education, academics get this autonomy
through academic freedom, peer review, and shared governance. This autonomy also

17
improves job satisfaction and job performance effectiveness and success (Womack &
Loyd, 2004; Phillips, Berg, Rodriguez, & Morgan, 2010). In this way, academics can
gain more autonomy through increasing empowerment.
Peer-Review
Through peer review, academics manage and modify themselves hoping that they
monitor their colleagues’ professional performance (Hamilton, 2007). In higher
education, colleagues make the decision in order to judge the behaviors of their peers
including ethical issues, their competency, promotion, tenure, post-tenure.(Hamilton,
2007).
Merit Principle
In universities and departments that practice meritocracy, academics are doing tasks
and responsibilities and gain position and rewards based on their professional skills
and competency. The equality of opportunity in the higher education and clear
relationship between an academic’s tasks, responsibilities, power, prestige, and
rewards are the key components of an empowered educational setting (Lewis, 1998;
Mountjoy, 2001).
The quality of the research and teaching should be the basis of academics’ judgment.
How well academics perform their professional tasks, which means meritocracy.
And that is what the empowerment focus in the higher education context. This type
of culture is related to the empowered setting in higher education, especially research
universities.

18
Change
Universities, especially research universities, have a dynamic environment.
Academics face a variety of changes inside and outside of their educational work
setting. Changes in the research universities have the potential to influence the roles
of their human resources, and also their perception towards their careers. All
challenges to research universities affect the academic profession in one way or
another. Academics must respond to these changes effectively. Technology will
continue to advance rapidly and funding for research is increasing rapidly and
control of dramatically rising costs will be necessary.
Universities will face competition because of the increasing importance of higher
education for entry into all professions and much of the rest of the knowledge
economy. This is the responsibility of universities, especially research universities, to
respond to these dynamic changes through the cooperation of academics. Higher
education needs more accountability and autonomy for its academics and
administrators to be more empowered to respond to these changes. Academics’
certainty about accountability gives them more power in their situations (Hamilton,
2007).
Professionalism
Faculty culture may also be understood within the framework of professionalization.
Professionalization in higher education shows the way in which academics organize
and conduct their tasks in teaching and research, and how they position themselves
with respect to students and competitors in other universities. Professionalization
needs intellectual and qualified expertise. It also requires training programs,

19
autonomy and working within ethical roles (Bennet, 1998). Academics in a
professional context should participate in decision-making in teaching, research
planning as well as in upper levels of the university (Zuber-Skerritt, 1993).
Academics’ empowerment is synonymous with professionalization. The
empowerment is about autonomy, power and control (Lashley, 1990). In fact, the
academics’ empowerment is the basis of their professionalism. Training of
professionals must be done more easily in order to enhance employees’ relations
(Glasman, 1995).
Generally speaking, academic culture within research universities, which contains
academic freedom and autonomy to teach and research, faces uncertainty and
change. This makes academics feel a sense of dissatisfaction and results in a lack of
commitment, which negatively affects productivity. There is therefore a need to
understand the frustration of academics and a possible solution is grounded on
empowerment of academics (Lambert, 2006; Perkins 2006; Gaziel, 2009).
2.3 Concept of Empowerment
The idea of empowerment as a means of changing destiny was used for the first time
by Bucher (1970) (Bucher cited by Hung, 2005). During 1990s the concept of
empowerment is used in different area of studies such as psychology, management,
business, health, community and education.
Empowerment is a construct that can be used in many areas: economics,
management, education and psychology, community development, and studies of
social movements. The concept and process of empowerment vary among these
perspectives. Rappaport (1984) has posited that defining the concept empowerment

20
is easy it’s not presented in the context. He mentions then that practically it is
difficult to define empowerment in different contexts and with different people.
Zimmerman (1984) has noted that using a general definition for empowerment for all
contexts is not correct. Honold (1997) indicates, "To be successful, each organization
must create and define it [empowerment] for itself” (p.202). So there are different
definitions of the concept and process of empowerment in the literature. The concept
of empowerment first appeared in education during the 1980s (Lambert, 2006). Bsed
on Rappaport (1984) empowerment is a construct that connects personal abilities,
support systems, and eagerness to the change of social policy (Rappaport, 1984).
Keiffer (1984) suggests that empowerment is a developmental mechanism which
includes four stages: entry, advancement, incorporation, and commitment (Keiffer,
1984).
Conger & Kanungo (1988) define empowerment as “a process of enhancing feelings
of self-efficacy among organizational members through the identification of
conditions that foster powerlessness, and through their removal by both formal
organizational practices and informal techniques of providing efficacy information”
(p.474). According to Echiejile (1994), empowerment helps employees to have
control on their responsibilities with sufficient assurance in doing their tasks in the
work place (Echiejile, 1994).
Conger & Kanungo (1988), present five stages for the process of empowerment can:
identifying the factors that reduce empowerment within organization is the first
stage. In this stage managers should employ empowerment approaches in the
organization. In the second stage identifying objectives, designing models, capacity,

21
feedback and work place improvement considered. In the third stage, employees
obtain empowerment and also deleting the factors that cause powerlessness in the
first stage. The fourth stage makes empowerment through performance and self-
efficacy levels. In the last stage, behavioral effects are seen as efforts to maintain
these effects, in order to achieve the empowerment and cooperative acts to
accomplish the goals of organization (Conger & Kanungo, 1988).
Thomas and Velthouse (1990) define empowerment “as intrinsic task motivation that
manifests itself in four cognitions reflecting an individual's orientation to his or her
work roles. Intrinsic task motivation means “positively valued experiences that an
individual derives directly from a task that produces motivation and satisfaction”
(p.668). The four cognitions they identified are meaningfulness, competence, impact,
and choice.
Dunst (1991) has suggested that empowerment consists of two elements: provide the
experiences that increase self-determination, freedom, making decision, and
responsibility in the work place, and giving opportunity to the employees to show
their abilities as well as learning skills that foster their functioning (Dunst, 1991). In
the strategic performance empowerment model, the necessary elements for
employees’ empowerment in the organization includes: supervisor or colleagues
modeling, mentoring of subordinates, and organizational development (Geroy,
Wright, & Anderson, 1998).
Bowen & Lawler (1992) define empowerment as “sharing with frontline employee’s
four organizational ingredients: information about organization’s performance,
rewards based on the organization’s performance, knowledge that enables employees

22
to understand and contributes to organizational performance, and power to make
decisions that influence organizational direction and performance” (p.32). Short and
Rinehart (1992) identify six dimensions to empowerment: decision making,
professional growth, status, self-efficacy, autonomy, and impact.
Short and Johnson (1994) suggest six dimensions of empowerment in educational
settings that include teacher self-efficacy, impact, opportunities for professional
growth, engagement in the process of making decision, teacher status, and
autonomy. Empowerment, as perceived by Short, Greer and Melvin (1994) is defined
as ‘‘a process whereby school participants develop the competence to take charge of
their own growth and resolve their own problems” (p.38).
According to Spreitzer (1995), empowerment is a bunch of cognitions that
employees have in the work place environment. Contextual factors have an impact
on these cognitive elements. Therefore, based on Spreitzer (1996) empowerment is
the result of a set of socio-structural characteristics in the organization. Spreitzer
(1996) identifies six characteristics that create a context of empowerment in the
workplace, namely: access to resource and information, sociopolitical support, wide
span of control in the time of working, a participative culture, and low role ambiguity
(Spreitzer, 1996). Bowen & Lawler (1995) also mention the importance of four
elements (power, information, knowledge, and rewards) that are necessary for
empowerment.
The perception of empowerment is defined by Chiles and Zorn (1995) as “the
symbolic construction of one’s personal state as characterized by competence, or the
skill and ability to act effectively, and control, or the opportunity and authority to

23
act” (p.2). According to Chiles and Zorn (1995), competence and authority are two
dimensions of empowerment. Employees in the work place feel they are empowered,
when they are able to make decisions and have the autonomy and freedom to
accomplish the decisions.
Besed on Blanchard, Carlos & Randolf (1996) empowerment is the freedom that
employees have to conduct their task while they are responsible for the outcomes of
having this freedom. Quinn and Spreitzer (1997) divide empowerment into two
classifications: “Mechanistic approach that defines empowerment as making
decisions within a set of boundaries, and organic approach which defines
empowerment as risk taking, growth and change” (p.38).
According to Duvall (1999), empowerment is decision made by employees which is
internal and its purpose is to have commitment for achieving the objectives of work
place, and to have freedom to perform the tasks within organizational structure.
These freedom in decision making resulted in the success of both organizational and
individual levels. Duvall (1999) believes that “empowerment is related to freedom to
act and having the opportunity to be responsible for performance outcomes, the
availability of necessary resources, and compensation for expected errors,
commitment and collaboration in the process of the employee’s own success , and
the success of the others” (p.207).
Ugboro & Obeng (2000) identify three dimensions of the empowerment concept:
“participation in the decision-making process, delegation of decision-making
authority, and access to information and other organizational resources” (p. 253).
Based on the study by Sweetland & Hoy (2000), empowerment has two dimensions

24
in educational settings: organizational empowerment and classroom empowerment.
Empowerment in an educational setting is a means of gaining increased control of
the profession, connecting teachers with one another, with their principal, students
and society.
Contreras-McGavin (2004) identifies thirteen dimensions of empowerment in
educational settings. These dimensions are: self-efficacy, training new teachers,
transformation, accountability, collegiality/collaboration, change, curriculum
planning/design, self-esteem, decision-making, impact/causal importance,
authority/leadership, professional growth, professional knowledge, responsibility,
and status (Contreras-McGavin, 2004).
According to Alsop, Heinsohn & Somma (2004), empowerment is related to agency
and opportunity structure. Agency refers to an individual’s capacity to make decision
from different alternatives. These choices provide individuals to have different
opportunities socially, economically and politically. Opportunity structure is
contextual factors that an individual can absolutely transfer determinations into
productive activity.
In order to understand the importance of empowerment in organizations, it is
important to be aware of empowerment definitions and how these definitions fit into
the context of each organization (Martin-Crawford, 1999). It is important that each
organization has its own definition of empowerment. Researchers in different field
of studies have created particular definition of empowerment (Table 2.1).

25
Table 2.1. Definitions of employee empowerment in different work settings
Author(s) Definition of empowerment Setting
Tannenbaum (1968) Power is derived from structural
organizational factors such as work
environment, opportunity for growth,
support and rewards
Business
Kanter (1977) Giving power to people who are at a
disadvantaged spot in the organization.
Sharing of power and control increases
organizational effectiveness
Healthcare
Rappaport (1984) Structural and organizational process that
facilitate participative and collective
interaction with in an environment to
enhance goal achievement
Business
Kieffer (1984) the continuing construction of a multi-
dimensional participatory competence
Business
Thomas & Velthouse
(1985; 1990)
Cognitive variables. The key cognitive
variables are the environment, the tasks,
and the behavior of the leader, the
individual’s interpretive styles, and the
impact and meaningfulness of the task.
Empowerment as instinct task motivation
Business
Lightfoot (1986) the opportunity for person to have
autonomy choice, responsibility and
authority
Business
Vogt & Murrell (1990) “Interactive empowerment”, act of
building, developing and increasing power
by working with others. “Self-
empowerment”, having the ability to
influence one’s own behavior.
Business
Short & Rinehart
(1992)
Decision making professional growth,
status, self-efficacy, autonomy, impact
Business
Jenks (1992) collective autonomy and involvement in
leadership process
Education
Short (1994) as a process whereby school participants
develop the competence to take charge of
their own growth and resolve their own
problems
Education

26
Author(s) Definition of empowerment Setting
Menon (1995) “a cognitive state [of] perceived control,
perceived competence and goal
internalization”
Business
Rothstein (1995) act of building, developing, and increasing
power through cooperating, sharing, and
working together
Education
Zimmerman (1995) Empowerment does not have universe
meaning. It may have different meaning
for each person, community or
organization
Business
Gorden (1995) managing organizations by collaboration
where workers have a voice
Business;
Communit
y
Spreitzer(1996) role ambiguity, access to strategic
information, access to resources, work unit
culture
Business
Blanchard, Carlos &
Randolf (1996)
Having the freedom to act but also the
responsibility for results. Freedom can be
achieved by leadership sharing information
with everyone, creating autonomy through
delineating boundaries, and replacing
hierarchies with self-managed teams.
Business
Short and Greer (1997) shared decision making in context of
education erroneously transfer power from
management to labor
Business
Sweetland & Hoy
(2000)
A means for connecting teachers with each
other’s, their principal, students and
society
Education
Laschinger,et al. (2001) psychological empowerment was the
outcome of structural empowerment and
had an intervening effect on structural
work conditions and organizational
outcomes
Education
Hanley & Abell (2002) Process of relatedness, which refers to an
expression of an individual’s worldview
beyond one’s own sense of self,
connection, and commitment to another
person, persons, or entity.
Healthcare
Mills & Ungson (2003) the delegation of decision making
prerogatives to employees, along with the
discretion to act on one’s own
Business
Abdulahi (2004) .managerial strategies such as access to
information, cooperative management,
freedom, team building and authority
organizational environment such as reward
system, organizational structure and access
Business

27
to resources

28
Author(s) Definition of empowerment Setting
Seibert, silver, &
Randolph (2004)
Individuals subjective should be valued.
pertaining to organizations’ structures,
policies, and practices
Business
Luby (2006) An active orientation toward obstacles or
challenges through which one operates
from an internal sense of control and
competence, energized by personal
alignment with larger organizational goals
that are meaningful.
Business
Greasley, Bryman,
Dainty, Price, Naismith,
& Soetanto,(2008)
personal responsibility” and “control over
their work
Business
Bailey (2009) Integration of structural and organizational
factors as “macro” and psychological
factors as “micro” level of empowerment
Business
2.4 Empowerment Theories
The origins of empowerment theory are not clear. Empowerment theory established
from the reforms for the human rights of women and minority groups in 1960s
(Anderson, 2007). The philosophical foundations of empowerment theory are
beginning with the most deep and serious questions of politics and organizational
life: justice and fairness, the roots of power, and the role of the member of an
organization or society (Anderson, 2007, p. 29).
Review of literature revealed three fundamental theories of empowerment: structural
empowerment, psychological empowerment and post-modern empowerment
(Anderson, 2007).
2.4.1 Structural Empowerment Theory
The fundamental assumption of structural empowerment comes from social-
exchange theory. Structural empowerment investigates the power which an employee
at the work place has. Structural empowerment theory is commonly only related to

29
the structure of organization (Prasad, 2001). The focus of structural empowerment
theory is on responsibilities, control and power, and strategies related to system of
organization. Power is divided within the members of organization and each member
can assign this power in the organization. Self-governing regulations are fundamental
in empowerment theory (Prasad, 2001).
Kanter (1977) discussed that an individual respond wisely to the different conditions
he/she faces. In the more structured situation staff feels more empowered.
Empowered employees react in an appropriate way and face to the challenges in their
work places. Therefore, employee attitudes toward his/her work place will improve
and productivity of organization. Generally speaking, the theory of structural
empowerment concentrates more on the formal and informal power and control and
structure of organization.
Kanter (1977) found that empowered workplace represent two components which
can enable staff to accomplish their tasks and responsibilities. Opportunity as a first
component refers to opportunity to increase the level of qualifications and
knowledge, flexibility and development. The second one, structure of power, refers
to the opportunity to access support, resources and information in order to
successfully accomplish the tasks in the organization (Kanter, 1977). Support relates
to the feedback employee got form the colleagues and top management in order to
increase efficacy and productivity with in the work environment. Resources refer
the extent of money, equipment, materials other employees’ requirements for
effectiveness and achievement within the organization. Access to information refers
to knowledge, data and professional skills that employee needs in order to do the
job appropriately (Kanter, 1977).

30
Construction and design of Kanter's (1977) structural empowerment theory is focus
on clarifying the workplace outcomes behaviors such as job satisfaction, job stress,
organizational commitment, job turnover and absenteeism. Kanter (1977) argued that
organizational structure in the work environment is a key that related to the positive
work place behaviors of employees. Meanwhile, access to opportunity structure and
formal/informal power correlate the attitudes of employees in their work place.
Kanter (1977) noted that employees show various behaviors in their work place in
the existence or absent of organizational structure components in the organization. In
summary, the emphasis of structural empowerment theory is on developing more
qualified work place.
Based on structural empowerment theory, formal and informal power in work place
assists the progress of structural empowerment in the organization. Formal power is
related to tasks which are appropriate and principal in the work place and have
clarity, originality and flexibility. Informal power refers to the relationships between
colleagues, mangers and subordinates outside and inside of work place. In an
empowered organization, individuals experience positive feelings about their work.
Employees with appropriate amount of power can do their responsibilities
completely and they also achieve the ability of empowering others in the
organization.
On the other hand, employees that have less opportunity to gain resources,
information and support become less empowered in comparison of their peers in the
work place. The less empowered employees feel that they have less power and
autonomy on their tasks and mostly dependent to the empowered employees. The

31
powerlessness makes employees restricted to rules and regulation, with less
attachment to the organization and inflexible (Kanter, 1977).
However, structural empowerment theory has some limitation with in its approach.
Structural empowerment theory focuses only on the organized system and not the
individual attitudes and experience towards empowerment. Empowerment as
experienced by employees. Even when the organizational structure (power and
opportunity) exists in the organization, employees may feel powerlessness.
Therefore, other approaches of empowerment contribute to the structural
empowerment in the work place.
2.4.2 Psychological Empowerment Theory
Psychological empowerment refers to personal, behavioral and interactional
approach of empowerment. Psychological empowerment theory is a need of
globalization era. In this era, creative and empowered employees are required.
Psychological empowerment as a second perspective of empowerment relates to the
conditions psychologically important for the employees in order to have control over
their tasks. Psychological empowerment basically refers to the individual’s
perception about interaction between peers within the organization (Chiles & Zorn,
1995).
Thomas and Velthouse (1990) developed a cognitive model based on four cognitions
these four cognitions considering employees’ perception and feeling about their work
roles. They believe that the four cognitions of psychological empowerment is the
result of employee’s work place and his/her personal characteristics that influence on
the attitudes and behaviors of employees. Spreitzer (1995) builds upon the Thomas

32
and Velthouse (1990) model and validates a measure of empowerment. Thomas &
Velthouse (1990) and Spreitzer (1995) see empowerment as consisting of four
psychological states (meaning, competence, self-determination, and impact). All four
cognitions are necessary for empowerment to succeed.
Spreitzer (1995) found that these four cognitions associated with the individual
empowerment. As a result this approach of empowerment contributed to productivity
and efficacy within the organization. Thomas and Velthouse (1990) believe that
empowerment is multidimensional and it is increased intrinsic task motivation
consists of four cognitive components considering employees’ perception and
feeling about their work roles: meaning, competence, which is synonymous with
Conger’s and Kanungo’s self-efficacy, self-determination, and impact.
Thomas & Velthouse (1990) and Spreitzer (1992) suggest that psychological
empowerment is the result of four cognitions which are related. Spreitzer (1992) and
Thomas & Tymon (1994) test this multifaceted idea of psychological empowerment
and found support for the four-dimensional construct of psychological
empowerment.
According to Thomas and Velthouse (1990), impact is “the degree to which behavior
is seen as making a difference in terms of achieving the purpose of the task and
influencing strategic, administrative or operating outcomes at work competence”
(Thomas and Velthouse, 1990, p. 672). Self-efficacy refers to “the ability of a person
to perform a task skillfully while meaning is the value of a work goal or purpose,
judged in relation to an individual’s own ideals or standards” (Thomas and
Velthouse, 1990, p. 673). Meaningfulness refers to how much an employee

33
committed to his/her responsibilities in the work place and self-determination or
choice refers to causal responsibility for a person's actions, it refers to autonomy at
the beginning and during doing the tasks and it is a motivational construct for the
work place behaviors.
Spreitzer Empowerment Model
Spreitzer’s (1997) model of individual empowerment describes psychological
empowerment as a mediator between the socio-structural factors within the
organization and positive work place behaviors. Specific characteristics of
organizational structure include organic structure, access to strategic information,
access to organizational resources, and organizational culture.
As illustrated in Figure 2.1., these social structural antecedents (organic structure,
access to strategic information, access to organizational resources, and organizational
culture) are mediated by a psychological sense of empowerment (meaning,
competence, self-determination, and impact) to produce behavioral outcomes
(innovation, upward influence, effectiveness).

34
Social Structural
Antecedence
Organic structure
Access to strategic
Information
Access to organizational
resources
Organizational culture
Psychological Sense of
Empowerment
Meaning
Competence
Self-determination
Impact
Behavioral
Outcome
Innovation
Upward Influence
Effectiveness
Figure 2.1. Psychological Empowerment Model in Organizations
(Source: Spreitzer, G. M., 1997, p.31)

35
2.4.3 Psychological Empowerment in Educational Work Setting
Based on empowerment definitions in the literature, which are mostly defined in the
context of business and education, empowerment is a means that every employee
must have. This process depends on the context; people and culture of staff in
organizations have different dimensions and elements. Therefore, empowerment has
its own definition in the context of research universities, although the main
dimensions can be used in other educational settings. As first attempt, Short &
Rinehart (1992) focus on identifying the components of participants’ empowerment
in educational institutions by the purpose of developing an instrument which is
appropriate to participant empowerment in educational institutions.
They found six components for psychological empowerment in an educational
setting. Psychological empowerment consists of four cognitions, namely, impact,
competence, decision making and meaning. However, as the context of the
educational workplace differs from that of business, Short and Reinhart (1992)
introduce psychological empowerment in educational settings. They explain that
psychological empowerment in educational work setting is dependent on six
dimensions. The dimensions are autonomy, professional growth, status, self-efficacy,
and impact, decision making (Gardenhour 2008; Wan, 2005; Short & Johnson,
1992).
Decision Making
The decision-making process in an educational context refers to problem solving,
having cooperation in the communication, and identifying objectives (Boland-Prom
& Anderson, 2005). Through participating in critical decision making, academics
36
have the opportunity to have enough control over their work environment (Short &
Johnson, 1994).
Professional Growth
Professional growth refers to the degree of opportunities that university and
departments provide to academics to grow and develop professionally, to learn
continuously and develop certain professional skills for teaching and research
(Boland-Prom & Anderson, 2005).
Status
Academic staff status is often determined by academics’ innovation, creativity and
efficacy in the classroom and research. Academics have a natural desire to be valued
for the task they do by their administrator, head of department and their students
(Schneider, 2000).
Self-Efficacy
Self-efficacy refers to the knowledge and belief of academics’ competency by them-
selves. Self-efficacy related to the professional skills which are necessary for
achieving the goals of educational settings (Short & Johnson, 1994).
Autonomy
Autonomy refers to academics’ beliefs that they can control certain aspects of their
work life. This may be control over scheduling, curriculum, research and materials
(Short & Johnson, 1994).

37
Impact
Impact refers to when academics feel they have an effect and influence on their work
place (Short & Johnson, 1994).
2.4.4 Post-modern Empowerment Theories
After two approaches of empowerment, more recent one is the post-modern of
empowerment theories. Experts of this approach argue that there is a need for fixing
the concept of structural power in the work place through which employees can gain
more power within the organization. They explain that there is a need to understand
how power put in to the work place and how employees used this power within the
organization. Knowledge on the concept of empowerment in the work place is not
sufficient action and more emphasis should be done on accomplishment of
empowerment. Post-modern theorists believe that empowerment is a mechanism and
process that employees obtain power within this process. Generally speaking, power
in this approach seen as a process rather than construct of force that is entered in the
organization (Anderson, 2007).
2.4.5 Integrative Perspective on Empowerment
The goal of empowerment theory is to identify and explain interaction between
contextual factors and individual’s feelings, and attitudes, and cognitions
(Zimmerman, 1990), and ultimately predict how these elements influence employee
behaviors on the job. In order to have successful empowerment it must be multi-
dimensional rather than one-dimensional approaches which are not sufficient based
on recent studies (Honold, 1997).

38
Thomas and Velthouse (1990) try to explain empowerment which makes a
distinction between situational characteristics and job essential perception. Conger
and Kanungo (1988) claim that situational characteristics help give power to
employees but are not the only choice. Psychological empowerment is another
approach that can help in individual empowerment of employees. Therefore,
empowerment is not only at the organizational structure level but also at the
individual level (Zimmerman, 1995).
Few researchers integrate two set of structural and psychological empowerment
dimensions. Spreitzer (1996), Laschinger et al. (2001), Seibert et al. (2004), and
Bailey (2009) have arguments about the relationship of structural and psychological
empowerment. The result of their studies reveals that there is significant relationship
between structural empowerment and psychological empowerment. The integration
of empowerment may provide more clarity to higher education’s total empowerment
picture. Therefore, this study embraces and builds on the research regarding the
integration of structural and psychological empowerment.
Laschinger Empowerment Model
Laschinger’s empowerment model was originally developed based on Kanter’s
structural empowerment theory, which focuses on the relationship between structural
empowerment in the work environment and employee’s work place attitudes and
behaviors. In order to investigate and understand more about the employees’
behaviors, Laschinger enters psychological empowerment to expand the
empowerment model (Laschinger, Finegan, Shamian & Wilk, 2001). Therefore,

39
Laschinger’s work empowerment model is a comprehensive model that can integrate
two empowerment approaches (structural and psychological).
This model describes all dimensions of the empowerment process and employee
behavior outcomes. This model shows the integrative and comprehensive definition
and process of work empowerment and makes the study more accurate and valid by
incorporating two approaches of empowerment in organization. As focusing on one
aspect of empowerment is incomplete and questionable, this model links the
organizational context, components of structural and psychological empowerment,
mediating psychological empowerment and work behavioral outcomes.
Laschinger et al. (2001) explain more about the relationships between constructs in
Kanter’s theory. Structural empowerment does not describe the respond of employee
to work conditions. These reactions refer to the concept of psychological
empowerment. Spreitzer (1996) found that access to strategic information in the
work place and rewards are contextual factors that were significantly associated with
psychological empowerment. This is expected from the result of previous studies that
psychological empowerment is a consequence of structural empowerment
(Laschinger et al., 2001; 2006; Ghani et al., 2009). In addition, psychological
empowerment is related to organizational commitment and job satisfaction
(Hechanova, Alampay & Franco, 2006; Laschinger, Purdy & Almost, 2007; Wang &
Lee, 2009; Casey, Saunders & O’Hara, 2010). These studies suggest that
psychological empowerment may be an intervening variable between structural
empowerment and employee effectiveness (Liden, Wayne & Sparrowe, 2000;
Bailey, 2009; Johnson, 2009; Chang, Shih & Lin, 2010).
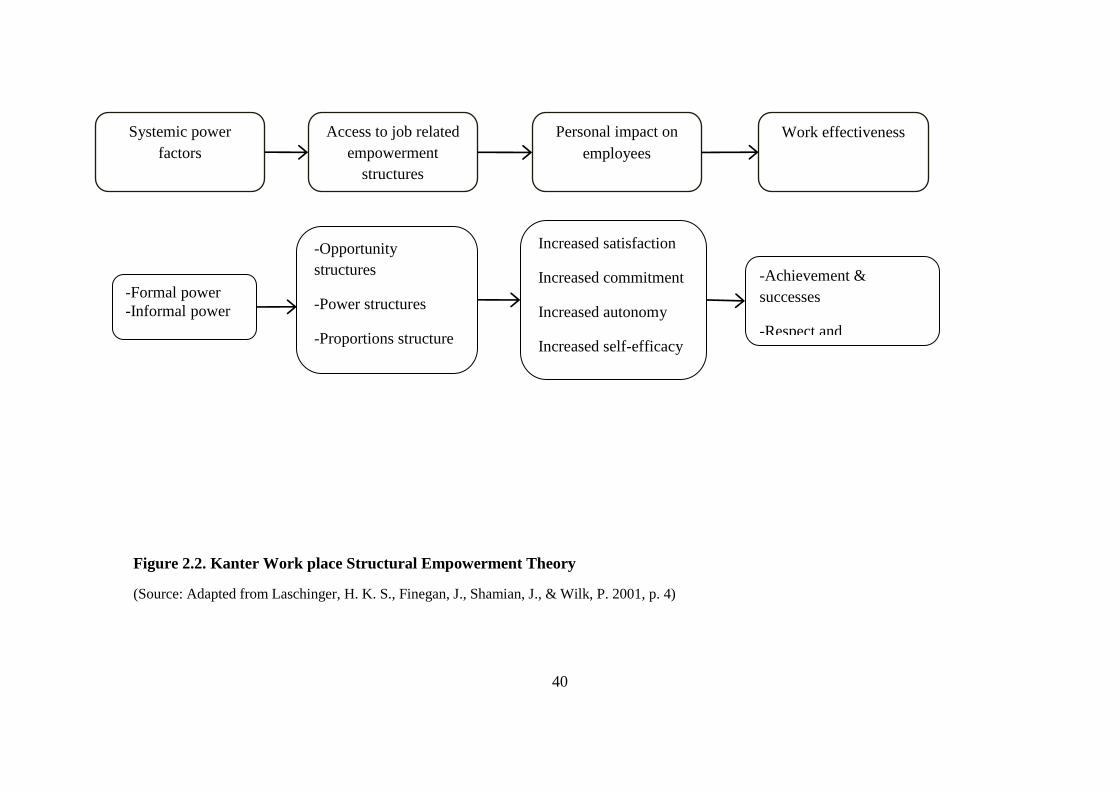
40
-Formal power
-Informal power
-Opportunity
structures
-Power structures
-Proportions structure
Increased satisfaction
Increased commitment
Increased autonomy
Increased self-efficacy
-Achievement &
successes
-Respect and
Systemic power
factors
Access to job related
empowerment
structures
Personal impact on
employees
Work effectiveness
Figure 2.2. Kanter Work place Structural Empowerment Theory
(Source: Adapted from Laschinger, H. K. S., Finegan, J., Shamian, J., & Wilk, P. 2001, p. 4)
41
2.5 Research Universities
The concept of a world-class university indicates the key values and norms of the
world’s research universities. The idea of research universities came from western
countries at the end of the nineteen century. The pioneer was a German research
university that takes a risk of changing the academic thinking at that time (Altbach,
2004). World-class universities are beneficial as they improve the quality of
academics, have important role in the society development, and create new
knowledge through emphasizing on research (Altbach, 2004).
For the accomplishment of these goals world-class research universities need world-
class and research-oriented academic staff. Recruiting and keeping the best qualified
academics that may help a university remain on top. To achieve this, it is the
responsibility of university leadership to apply techniques and strategies that increase
the professional development and performance of their professional human resources
within the context of research universities.
Importance of Research Universities
The important mission of research universities is creating new knowledge that is the
fundamental need for productivity and innovation in the society, culture and
economy. Therefore, academics to combine research with teaching, qualified
professional with great capacity to produce new knowledge, and provide creativity
within the context of research universities are requested. Without academic staff with
these potential and capacity, internationally competitive research universities will not
develop (Report of league of European research universities, 2002).

42
Malaysian universities in globalization era are expected to be more research based in
order to provide new knowledge to be used in economy and development and quality
of life, be more competitive, creative, and innovative, perform qualified, as well as
generate income for the universities, and high impact research publications and
attract qualified and talented graduate students (Komoo, Azman & Frina, 2008).
Productivity of Academics
Organizational productivity is important for survival in today’s competitive higher
education environment. Six main factors have been identified that associated with
research productivity. These are work load of the academic staff, the research culture
of the institution, research opportunities such as funding and resource availability,
intrinsic and extrinsic motivation as well as academic’s knowledge of research
(Kusure, Mutanda, Mawere & Dhliwayo, 2006). All these factors will be helpful in
the productivity of research universities by the contribution of empowered academics
in an empowerment context.
Professional Development
A research university is an educational organization that has major responsibilities.
Teaching, doing research and having administration tasks are just some of these
responsibilities. Academics may have different responsibilities in their work place
such as: head of committees, head of departments, deans, directors or vice
chancellors.
The most important resources for responding to these responsibilities are academics.
Therefore, the professional productivity and development of a research university

43
depends on highly qualified academics with great performance. Academic
professional development will take place when the academics are empowered in any
combination of the three major work areas already discussed, depending on their job
description. Organizational development theories and concept have strong link to the
theory and practice of empowerment (Osborne, 2002; Brancato, 2003).
Academic Staffs in Research Universities
Academics are the main resources in research universities for two reasons: one,
academics are professional human resources in research universities and they are
responsible for the key functions of teaching and research. Academic staffs are
clearly affected by the changes and pressures in the context of higher education.
Therefore, all challenges to research universities affect the academic profession
(Teichler, 2007). In Malaysia, due to the emphasis on accountability of research
universities, there is a need to enhance innovation and productivity, accept the rules
related to research universities goals, participate and agree with professional
assessments and understand and accept the limitations of infrastructure within the
context, facilities, resources or time (Lee, 2003).
Research Universities in Malaysia
One of the major goals of the National Education Development Plan 2001-2010 is to
produce a world-class education system. The development strategies involve
empowerment at university level, improving the teaching profession, increasing
effectiveness in the system of education as well as staff development. In Malaysia,
education plays an important role in enhancing the national economy, and promoting
health and community issues, reducing criminal problems within society, and welfare

44
dependency. According to Lee (2004) the origin and development of higher
education in Malaysia can be seen in terms of “three distinctive waves of expansion”
(p.41).
In the first wave, the first independent university in Malaya at the time of British rule
was established. The second wave took place in the 70s and 80s, after the new
economic policy and resulted in the establishment of more public universities in
order to increase the educational equality among different ethnic groups. Finally, in
the third wave, in the 90s, Malaysia faced with the growth in establishment of private
universities and colleges to meet the increasing demand for higher education arising
from the c modification of education and commercialization. According to Lee
(2004), this witnessed the establishment of new public universities, university
colleges, private universities, and branch campuses of foreign universities. As of
2007, there are 20 public universities, 28 private universities and university colleges
and 486 private colleges.
Malaysia has decided to upgrade the existing institutions to become world-class
research universities, by using the three most effective approaches: creating new
world-class universities from scratch (clean-slate approach), and merging and
transforming into a new university (hybrid formula) (Salmi, 2009).
The Government has designated four public universities as research universities.
Consequently, Universiti Sains Malaysia, Universiti Malaya, Universiti Kebangsaan
Malaysia and Universiti Putra Malaysia have been chosen to lead Malaysia’s
creativity and innovation through creating new knowledge. Therefore, these
universities need the development of academics, as the research universities

45
rearrange to significant organizational changes. For this reason, the elements of
empowerment, meritocracy and academic freedom will need to be considered
(Abdullah, 2009).
2.6 Relationship between Structural Empowerment and Psychological
Empowerment
Perceptions of psychological empowerment can be related to external and contextual
factors that surround employees in their work place. Social structural changes in
organizations can influence individuals' empowerment (Spreitzer, 1996; Zimmerman,
1990). The review of literature supports the belief that structural and organizational
empowerment influences the psychological empowerment of employees in different
work settings. A study by Dee, Henkin & Duemer (2003) shows the associations
between school organizational structures and teacher empowerment, while
psychological perspectives on empowerment suggest potential relationships between
the phenomenon and cognitive and affective outcomes.
The contextual factors are found to be associated with the elements of psychological
empowerment in industry and business settings (Spreitzer, 1996; Siegall & Gardner,
2000; Robbins, Crino & Fredendall, 2002). Communication with supervisor and
general relations with company are significantly related to the dimension of
empowerment such as impact, status, self-determination, and impact, but not related
to the competence.
A study by Ghani et al. (2009) in higher education settings in Malaysia suggests five
factors as antecedents of psychological empowerment in universities in Malaysia.
Access to information, resources, organizational support and opportunity to learn,

46
and trust are identified as structural empowerment and antecedents of psychological
empowerment.
It has also been found that structural empowerment is a significant predictor of
psychological empowerment in business and educational settings (Zimmerman,
1990; Spreitzer, 1996; Siegall & Gardner, 2000; Robbins, Crino & Fredendall, 2002;
Dee, Henkin & Duemer, 2003; Perkins, 2006; Ghani et al., 2009). Based on this
rationale, the following hypothesis proposed for this study: There is a positive
relationship between structural empowerment and psychological empowerment
among academics in research universities.
2.7 Relationship between Organizational Culture and Psychological
Empowerment
Empowerment in the work place cannot be without environmental contexts because
producing empowerment is by changing organizational cultures and environments.
Institutional environments can be facilitator or inhibit empowerment (Contreras-
McGavin, 2004; Chiang & Jang, 2008). Kanter (1977) suggests that the structure of
the work environment is a more important determinant of employee attitudes and
behaviors within organizations.
Organizational culture is one of the contextual factors that can lead to increasing or
decreasing level of psychological empowerment. For understanding and evaluating
the person-environment fit, organization culture gives a comprehensive model in
order to achieve successful empowerment in the work place. Organizational culture
in the organization explains employees’ behaviors and attitudes as well as specific
strategies which are related to the components of work life (Martin, 1992).

47
The importance of organizational culture as a contextual factor in understanding the
individual perceptions of empowerment is completely clear. Researchers in different
work settings have efforts to examine the relationship between organizational culture
and psychological empowerment. Spreitzer (1996) and Sparrowe (1994) studies
show that a participative organizational culture is positively contributed to
perceptions of empowerment.
Thompson & Luthans (1990) noted that organizational culture shapes organizations
and provides a better understanding of employee empowerment (Thompson &
Luthans, 1990 cited by Bailey, 2009). Therefore, organizational culture may be
related to academic and non-academic employee reactions to empowerment in higher
education context.
Psychological empowerment in a work place is more likely to succeed when the
organizational culture contains (Spreitzer, 1995; Kraimer, Seibert, & Liden 1999;
Johnson, 2009). Organizational culture has various definitions. Schein (2004) defines
organizational culture as “a pattern of assumptions judged as a valid way to perceive,
think, and feel as the organization deals with change and problems” (p. 17).
Organizational culture is viewed as one of the dominant features that shapes the
norms and values of organizations’ environment, as well as an important factor for
productivity and effectiveness of work place. Organizations that aim and desire to
ask their employees in participating of decision making process in order to enhance
the quality and effectiveness of their organizations, are beginning to enter the
concept of empowering culture in their work place (Sigler & Pearson, 2000).

48
There are numerous types of organizational culture. Harrison (1972) defines four
cultural types: power, role, people, and tasks (Harrison, 1972 cited by Salumaa,
2007). The competing values by Quinn and Rohrbaugh (1983), describe three ways
that a work place can distinguish its norms and values. These three elements are the
structure of organization or organization attribution through these values,
adaptability or factors both internally and externally assist to the objectives of
organization, and the process of the focus on the objectives or the character that the
tasks is accomplish regardless of the outcomes.
Wallach (1983) suggests three primary organizational cultures: (a) supportive, which
is warm and humanistic; (b) innovative, which is exciting and dynamic; and (c)
bureaucratic, which is classified and hierarchical. Hofstede, Neuijen, Ohavy &
Sanders (1990) define six factors to describe organizational cultural differences: (a)
process versus results-oriented, (b) employee versus job-oriented, (c) parochial
versus professional, (d) open versus closed systems, (e) loose versus tight controls,
and (f) normative versus pragmatic. According to Schein (1996) three management
cultures within organizations are essential for promoting the effectiveness of work
place: (1) executive culture for work place financial health and (2) engineer culture
refers to the technology and the knowledge of using the technology (3) operators
culture is related to is trust, teamwork, participation, communication and personal
interaction, and communication, trust, and teamwork.
Cameron (1998) defines five dimensions of culture: (a) clan, which includes a
concern and sensitivity to consumers; (b) hierarchy; (c) market-supported stability
and control; (d) adhocracy, defined as flexibility; and (e) individualism. Fisher
(2000) defines three dimensions of culture: (a) comfort, have parental vision towards

49
the members; (b) complacency, in which individuals are dependent on their work
place for their own wellbeing; and (c) need for contribution, refers to commitment to
changes which is accepted by individuals in the work place.
The competing values framework (CVF) conceptualizes the differences between
organizational cultures with two dimensions: structure and focus (Quinn &
Rohrbaugh 1983). The structure dimension ranges from flexibility at one extreme to
control at the opposite extreme. This dimension identifies the difference between
organizations that attempts for accepting agreeable behaviors and the organizations
that allow their employees to have their own behaviors. The focus dimension ranges
from an external focus to an internal focus. An internal focus emphasizes factors
internal to the organization, such as employee satisfaction, while an external focus
emphasizes the organization's ability to function well in the work place environment
(Quinn and Rohrbaugh 1983; Dimmit 2004; Cameron and Quinn 2006).
Different types of culture exist in organizations. Based on competing values
framework (CVF), organizations can have the clan, adhocracy, market, and hierarchy
culture (Figure 2.3). Clan emphasizes shared values and goals, participation, and a
sense of family. Adhocracy emphasized entrepreneurship, creativity, and
adaptability, while hierarchy refers to many rules and regulations, clear lines of
authority, and it’s concerned with efficiency. Market emphasizes competition,
environmental interaction and customer orientation (Cameron & Ettington, 1988;
Fralinger, 2007; Johnson, 2009).
The connection between culture in organization and psychological empowerment is
built on the body of research describing the relationship between the aspects of

50
contextual factors and employees’ work behaviors (Spreitzer, 1996). Spreitzer (1996)
suggests that future studies should explore the relationships between each of the
work characteristics and empowerment. Hence, it may be academically and
practically meaningful to check how empowerment is related to organizational
culture in the context of higher education.
Various researchers have looked into the process of empowerment and concluded a
number of conditions that are essential to the implementation of academics’
empowerment. Empowerment in the work place cannot be without environmental
contexts because producing empowerment requires changing organizational cultures
and environments. Organizational environments or climates can facilitate or inhibit
empowerment (Asmawi & Mohan 2010; Contreras-McGavin, 2004).
Flexibility
Clan Glue: loyalty, commitment
Leadership: mentor, facilitator, team builder Theory of effectiveness: Human development and
participation produce effectiveness
Adhocracy Glue: innovation,
development Leadership: innovator, entrepreneur, visionary Theory of effectiveness: innovativeness, vision,
and new resources produce effectiveness
Hierarchy Glue: formal procedures Leadership: coordinator,
Monitor, organizer Theory of effectiveness:
control and efficiency with capable processes produce
effectiveness
Market Glue: goal achievement Leadership: hard driver, competitor, and producer Theory of effectiveness: aggressively competing
and customer focus produce effectiveness
Control
Figure 2.3. The Competing Values Framework
(Source: Adapted from: Diagnosing and Changing Organizational Culture, by K. S.
Cameron, & R. E. Quinn, 2006, p.46)
Inte
rnal
short
-ter
m E
xtern
al lo
ng
-term
com
petitiv
e

51
According to the 2003 Higher Education Report, culture can lead to successful
governance by trust which is accrued between the superiors and subordinates.
Effective university culture, controls information, teaches and presents appropriate
behavior, and motivates individuals. These components of culture can shape internal
relations and values. Organizational culture is a key to the process and structure of
decision making in universities.
Within organizations, including universities, culture defines appropriate behavior,
connecting and motivating employees, as well as governing the way information is
processed within institutions, while shaping their personal interactions. Shaping of
organizational culture depends on the beliefs and practices of trustees,
administrators, and academics regarding the responsibilities of campus community
members, competitors, and society (ASHE, 2003). The university culture is full of
complexity as the beliefs and practices of trustees, senior administrators, academic
staff, campus community members, competitors, and society combine to
fundamentally shape the effectiveness of that university.
The literature shows a lack of study about the relationship between organizational
culture and psychological empowerment among academics in universities.
Organizational culture can be a powerful influence on psychological empowerment
(Johnson, 2001; Spreitzer, 1995, 2006). But a question arises, that, which type of
culture is needed in universities that help academics to be better decision maker,
achieve freedom and autonomy, more growth professionally and be more effective in
teaching and research and as a whole be more qualified and feel empowered
psychologically?

52
This study therefore, looks at organizational culture as one of the predominate
elements for determining the perception of academics toward psychological
empowerment in a multi-dimensional perspective. Universities’ leadership should
identify the dominant type of organizational culture and take actions to balance the
organizational culture which is suitable for increasing the level of psychological
empowerment.
Therefore, it may be academically and practically meaningful to check how
psychological empowerment is related to organizational culture types to gain better
insight on the concept of empowerment culture in higher education. Based on this
rationale, the following hypothesis proposed for this study: There is a relationship
between four types of organizational culture and psychological empowerment among
academics in research universities.
2.8 Relationship between Psychological Empowerment and Job Satisfaction
Job satisfaction has different definition in different theories. Maslow divided
humans’ basic needs into five levels: physiology, safety, love and belongingness,
esteem, and self-actualization. If these needs are fulfilled, people will have self-
esteem, self-confidence and self-respect. Maslow argued that humans attempt to
achieve self-actualizing (Robbins, 2001).
Erg theory by Alderfer (1969) is a revised version of Maslow theory and divides
human needs into three approaches: Existence needs, psychological needs, and safety
needs that include substantial conditions for living and physical conditions for
working (salary, welfare, hunger and thirst). The second aspect is related to
correlative needs of significance and all social potentials of employees in their

53
working environments. Finally, there are growth needs. These refer to the needs of
individuals’ nobility, which includes all types of capacities are needed for
effectiveness and success (Wu, 2006).
Need achievement theory by McClelland (1965) is contributed to the employee’s
positive work place attitudes. The first is the need for achievement. When individuals
desire to achieve something, they follow an internal motivation to obtain fulfillment.
The second is the need for affiliation. This is the need for admission, affection and
friendship as well as the desire to establish socially interactive behavior relationship.
High affiliation needs focus on intercommunicative activities and preference for
social relationships above organization tasks. Finally, there is the need for power, or
desire to obtain power and authority. Those who have a high need for power always
desire to dominate or control others (Robbins, 2001).
Vroom’s (1964) Expectancy theory found that people choose and intent to
accomplish tasks in their work place based on their expectations and the amount of
rewards they get by doing that task properly. It focuses on three key elements: effort-
performance relationship, performance-reward relationship, and rewards-personal
goals relationship (Robbins, 2001).
Adams formulated the Equity theory of job motivation in 1965. It is based on a
reasonable and fair exchange. Adams argues that job satisfaction seen in the fair
exchange of task and rewards they get after accomplishing that task in the work
place. Equity theory consists three aspects:1) the input that employees put in work;
2) rewards they get and the comparison between input and output; 3) and the
comparison between those with equal levels.

54
The motivation-hygiene theory is called two-factor theory. Herzberg (1966) put job
satisfaction and dissatisfaction into two different categories that were not connected
with each othe. He noted that workplace behavior can be affected by hygiene (the
work environment) or by motivation (the challenge of the work itself). The best
result is not from improving the quality of the work environment, but comes from
improving the challenge of the work (Fisher, 1999).
Another approach is the person-environment fit theory of job satisfaction. This
theory suggests that job satisfaction is a result of congruence between the employee’s
perception of the work situation, and the employee’s work values. This model
emphasizes the interaction between the employee’s values and norms and the
working environment of the workplace and represents a person-environment fit.
Hackman and Oldman (1980) identified five main facets that can impact job
satisfaction including: task identity, task significance, skill variety, autonomy, and
feedback.
Based on Locke (1976) there are three approaches that cause job attitudes. Job
attitudes can be derived from differences between what the job offers to the person
and what the person expects, to what extent the job fulfills the personal needs and
values of employees. For this study, job satisfaction is based on the theoretical
framework which represents an affective reaction to a job and contains multi-
dimensional aspects (Spector, 1997).
The professional role of academics has complexities that include teaching,
counseling, conducting research and accepting positions in departments and
university. Academics often experience confusion about their role expectations. This

55
confusion is often caused by poor or limited information or resources, which can
cause job dissatisfaction (Lyons, 1971; Spreitzer, Kizilos & Nason, 1997; Davies,
Laschinger & Andrusyszyn, 2006).
Empowerment leads to increased work effectiveness. Numerous studies have linked
the effects of empowerment to job satisfaction (Spreitzer, Kizilos & Nason, 1997;
Hung, 2005; Davies, Laschinger & Andrusyszyn, 2006; Laschinger, Purdy &
Almost, 2007; Lautizi, Laschinger & Ravazzolo, 2009). Kanter (1977) notes that
employees who access to power from information, support, resources and
opportunities become more creative and innovative and they can carry out job
activities effectively. She believes that when these organizational characteristics are
present, employees are more satisfied with their work (Kanter, 1977).
The multi-dimensional role of academics in universities causes role conflict and over
load. Role conflict and work over load may result in job dissatisfaction, especially
when the structural empowerment and psychological empowerment are not in place.
Academics are more satisfied when they have access to resources and support,
information, opportunities in the university they work. Changes to the research
universities occurred at a rapid pace. Therefore, academics who are experiencing the
negative effects of restructuring in the educational system may feel greater degrees
of job dissatisfaction.
This satisfaction in the work place result from having too much responsibility and
workload, limited participation in decision making, limited opportunity, and lack of
resources and support. When academics have access to structurally empowering
conditions (resources, information, opportunities, and supports) then they are able to
56
achieve effectiveness and their work goals. Enhancing employees’ perception about
meaningfulness and impact of their task and work lead to increased job satisfaction
(Laschinger et al., 2007).
Empirical findings have supported that, empowerment was found to be significantly
related to work satisfaction in organizations (Liden, Wayne & Sparraw, 2000;
Manojlovich & Laschinger, 2002; Liu et al., 2006). Hackman & Oldham (1976)
noted that employees who feel their jobs worthy feel higher levels of work
satisfaction than those who perceive their jobs as less worthy and meaningful. Short
& Rinehart (1994) measure the relationship between psychological empowerment in
educational settings with job satisfaction (Short & Rinehart, 1994).
Laschinger & Havens (1996) found that structural empowerment is strongly related
to perceived control over nursing practice, which is subsequently related to job
satisfaction. Laschinger et al. (2001) found that higher levels of structural
empowerment were predictive of greater psychological empowerment, which in turn,
result in higher levels of job satisfaction. Laschinger et al. (2007) found that greater
structural empowerment of managers contributes to greater job satisfaction in the
case of nurse managers.
These findings show a current lack of study on empowerment and job satisfaction.
Most of these researches have been conducted in the health care and business areas
in western settings. Based on this rationale, the following hypothesis proposed for
this study: There is a relationship between psychological empowerment and job
satisfaction among academics in research universities.

57
2.9 Relationship between Psychological Empowerment and Organizational
Commitment
Academics’ commitment to their university provides important consequences for the
academics as well as for the university as a whole. Universities need academics that
not only join their university but continue to remain actively involved in creating
new knowledge in an innovative manner, utilize new curriculum and techniques for
the process of teaching and learning; evaluate the professional programs, follow the
international standards of qualification in higher education context, cooperate in the
process of decision making, and have interaction with their peers and students. Thus,
it is necessary for universities to enhance the feeling of involvement among their
academics that leads to innovation in the context of higher education. Academics
commitment to the university is psychological connection with is critical for
sufficient levels of participation and involvement in the departments and university
Prior research shows that work experiences, personal and organizational factors such
as leadership, serve as antecedents to organizational commitment (Mowday et al.,
1982; Koh, Steers, & Terborg, 1995; Walumbwa & Lawler, 2003). Empowered
employees see themselves with more capacity to participate and attach to their jobs
and organizations in a more meaningful way, act independently, and have a higher
commitment to their organization (Spreitzer, 1995; Wayne, Kraimer, Seibert &
Liden, 1999 Liden, & Sparrowe, 2000).
Thomas and Velthouse (1990) suggest that employees with high level of
empowerment have more concentration on their tasks which result in high level of
organizational commitment. In other words, individuals who believe their job is
meaningful have higher levels of commitment to their organization and motivation to
58
act (Wiley, 1999; Manojlovich & Laschinger, 2002; DeCicco et al., 2006; Liu et al.,
2006).
In general, commitment reflects loyalty by employees and a willingness to work
toward achieving organizational goals (Meyer & Allen, 1997). There are two basic
approaches have been used to study organizational commitment: commitment-related
attitudes and commitment-related behaviors. The commitment-related attitude
approach refers to an affective attachment to the organization, its values and goals
(Buchanan, 1974 cited by Ugboro, 2006). Employees with a strong affective
commitment remain with an organization because they want to. Employees with a
strong continuance commitment remain because they have to, and employees with a
strong normative commitment remain because they feel they ought to (Meyer, Allen
& Smith, 1993).
The commitment-related behavior approach refers to internal feelings to perform
tasks leads to behavioral actions and results in achieving the goals and missions of
organization. Employees who have a strong sense of organizational commitment are
more likely to contribute to the achievement of organizational goals. They are more
motivated, have lower turnover, and feel a greater sense of satisfaction with their
tasks, and participate with the productivity of the organization. Employees with the
high level of organizational commitment contribute to the positive work place
outcomes. Therefore, it is important for the leader in higher education to provide
opportunities and strategies in the university that enhance the level of organizational
commitment among academics.

59
Mowdays et al. (1982) identifies organizational commitment as a combination of
both psychological and behavioral patterns. According to Mowdays et al. (1982),
organizational commitment is a combination of strong belief and desire of employees
to stay with the organization in order to achieve its goals (Mowdays et al., 1982 cited
by Keiser, 2007). To understand the nature of the complex relationship between
employees and their organizations, many researchers focused on commitment in the
workplace. Organizational commitment is not only a psychological state focusing on
the relationship an individual has with an organization and his willingness to stay
with that organization, but also on the nature of that psychological state (Allen &
Meyer,1997).
According to Meyer and Allen (1991) three-component model of commitment are:
affective commitment refers to employee's positive emotional attachment to the
organization. An employee who has affective commitment is strongly eager to stay
with the organization.
Continuance commitment refers to the employees’ commitment to the organization
in order to not lose the benefits from the organization such as losing economic and
social costs. Employee staying with the organization is a matter of need. Normative
commitment refers to employees’ commitment to and remains with an organization
because of feelings of obligation, Such as agreement with organization.
Kanter (1977) suggests that employees who have high access to the growth
opportunity in the organization are more likely to have high mobility and
commitment to their work place. In other word, employees with the opportunity for

60
professional growth and access to information and rewards, have more aspiration for
participating and involving in their organizations.
The studies that show a strong relationship between work place empowerment and
commitment suggests that organizational structures such as access to rewards,
resources and information , leadership in higher education can enhance academics’
organizational commitment. Academics with high level of commitment can influence
on productivity and effectiveness of their universities and departments. Employees
who feel empowered at work are likely to be committed to the organization that
provides this empowering experience.
Negative working conditions are a major cause of turnover and reduced commitment
to the organization. Structural and psychological empowerment represents a
powerful approach to creating workplaces that attract and retain individuals to
organizations. Numerous studies have linked empowerment to organizational
commitment (Wilson & Laschinger, 1994; Laschinger, Finegan, Shamian & Casier,
2000; DeCicco et al., 2006).
Kirkman and Rosen (1999) found that perceptions of empowerment are significantly
related to organizational commitment. Studies in business and health care settings
show that psychological empowerment has a positive and significant relationship
organizational commitment (King & Ehrhard; 1997; Laschinger, et al., 2001; Henkin
& Marchiori, 2003; Cho, Laschinger & Wong, 2006; Laschinger, Finegan & Wilk,
2009).
Organizational commitment of academics to the university provides important
consequences for the academic staffs and the university. Neumann and Finaly-
61
Neumann (1990) indicate that “universities need dedicated academic staffs who not
only join their university, but continue to remain actively involved in innovative
research activities; prepare new materials and approaches for teaching; build, assess,
and reform academic programs maintain high levels of academic standards;
participate in academic decision making; and work closely and actively with their
students” (p. 77). Lambert (2006) has done a study to investigate the relationships
between empowerment and job commitment as experienced by academics in three
colleges. The result shows a positive and significant correlation between academics
staff empowerment and commitment to their organization.
Generally speaking, based on the review of literature, relationships between
empowerment and work place outcomes reviewed. But there is lack of study on
understanding the relationship of empowerment and organizational commitment in
research universities.
The literature shows lack of knowledge on academics empowerment in the context of
higher education, especially in Malaysian context. Based on this rationale, the
following hypothesis proposed for this study: There is a relationship between
psychological empowerment and organizational commitment among academics in
research universities.
2.10 Relationship between Structural Empowerment and Job Satisfaction
Kanter's (1977) theory of structural empowerment suggests managerial strategies for
increasing conditions for structural empowerment. Structural empowerment can
result in greater job satisfaction among academics by control of university
environment. Researchers found that organizational structure (information, rewards,

62
support) impact on positively on work place outcomes. Thus, job satisfaction among
academics is shaped by social structural characteristics in research universities.
Kanter’s theory of structural factors suggests that employee behavior is shaped by
the degree of access to empowerment structures in the organization. Importance of
the structural empowerment for work place outcomes in the context of research
universities requires more attention. Structural empowerment studies may add to the
understanding of job satisfaction in research universities.
When situations are structured in such a way that employees feel empowered, the
organization is likely to benefit, both in terms of the attitudes of employees and the
organization’s effectiveness. The social structures within organizations that Kanter
believes are particularly important to the growth of empowerment are 1) having
access to information, 2) receiving support, 3) having access to resources necessary
to do the job, and 4) having the opportunity to learn and grow. Access to these
structures will increase job satisfaction among academics.
Patrick and Laschinger (2006) examined the relationship between structural
empowerment and perceived organizational support and the effect of these factors on
role satisfaction. Manojlovich and Laschinger (2002) found that structural
empowerment predicted 30% of the variance in job satisfaction. Rhoades and
Eisenberger (2002) stated that managers who describe their work environments as
empowering and perceive strong organizational support for their contributions will
report high levels of role satisfaction.
The importance of structural empowerment for work place outcomes in the context
of research universities requires more attention. Structural empowerment studies may

63
add to the understanding of job satisfaction in research universities. Thus, it is
reasonable to expect that academics who see their university as empowering with
structural factors will report high levels of job satisfaction. Based on this rationale,
the following hypothesis proposed for this study: There is a relationship between
structural empowerment and job satisfaction among academics in research
universities.
2.11 Mediating role of Psychological Empowerment in Relationship between
Structural Empowerment and Job Satisfaction
Spreitzer (1996) defines psychological empowerment as the affective state that
employees must experience for interventions to be successful. Psychological
empowerment in educational settings is a motivational construct that consists of six
dimensions: decision making, professional growth, status, and self-efficacy, impact,
autonomy.
Organizational structure such as information, resources and support provides
structural empowerment which then leads to existence of psychological
empowerment in the organization. In other words, psychological empowerment is a
consequence of structural empowerment. In addition, psychological empowerment is
related to job satisfaction in organizations. Studies suggest that psychological
empowerment can be an intervening variable between structural empowerment and
job satisfaction.
Kanter’s (1977) theory of structural empowerment has been found to be associated
with job satisfaction. Numerous studies have shown significant positive relationships
between structural empowerment and job satisfaction (Laschinger & Havens, 1996;
Laschinger et al., 2001). But no study has yet examined whether psychological

64
empowerment mediates relationship between structural empowerment and job
satisfaction.
Although structural empowerment has been empirically associated with job
satisfaction in several studies, the current study is one of only a few that examining
the mediating role of psychological empowerment in relationship with structural
empowerment and job satisfaction. The fact that changes in structural empowerment
indirectly affect job satisfaction emphasizes the importance of studying
psychological empowerment in the organization.
The findings from previous studies suggest that psychological empowerment has an
important role for improving job satisfaction with in the organization (Laschinger,
Finegan, Shamian, & Wilk, 2004). Based on this rationale, the following hypothesis
proposed for this study: Psychological empowerment mediates the relationship
between structural empowerment and job satisfaction.
2.12 Relationship between Structural Empowerment and Organizational
Commitment
The influence of committed employees on the organization's effectiveness and
productivity can be significant. Structures that foster empowered behavior of
academics may enable them to be more committed to the universities’ goals.
Spreitzer and Mishra (2002) found that empowerment helps the enhancement of
commitment of academics to their departments and universities which, in turn, leads
to a lower level of turnover among them (Dermott, Laschinger, & Shamian, 1996).
Organizational commitment is an important predictor of employee turnover and is
therefore important to consider given the high costs associated with turnover in

65
higher education. Structural empowerment promotes organizational commitment
both directly and by increasing the feelings of psychological empowerment in
healthcare settings (Wagner, 2007).
Laschinger, Finegan, and Wilk, (2009) state that structural empowerment plays a
significant role in the fostering of organizational commitment. Increasing academics’
commitment to their departments cannot be successful unless the expected linkage
between structural empowerment and organizational commitment in higher
education is explored.
Previous studies found that structural empowerment and organizational commitment
were positively correlated to each other in organizations. Indeed, the more they
perceive a high level of structural empowerment, the more they want to stay in the
organizations (Decicco, Laschinger, & Kerr, 2006; Laschinger, Finegan, Shamian, &
Wilk, 2001; Laschinger, Finegan, & Shamian, 2001; Vacharakiat, 2008). Based on
this rationale, the following hypothesis proposed for this study: There is a
relationship between structural empowerment and organizational commitment.
2.13 Mediating role of Psychological Empowerment in Relationship between
Structural Empowerment and Organizational Commitment
An integrative model of empowerment in the workplace shows that psychological
empowerment mediates the relationship between the structural empowerment and
organizational commitment that is important achievement in understanding of
concept of organizational commitment.
Academics enter work situations and make various investments in as well as
contributions to the university. The university is expected by academics as well as

66
other staff to provide a supportive environment that facilitates their skills, abilities
and professions and giving rewards for their participations. University provides a
supportive environment and rewarding their academics in order to foster their
employees’ commitment. This exchange perspective notes that academics
commitment to their university is critically related to supportive environment of
university.
Based on this rationale, the following hypothesis proposed for this study:
Psychological empowerment mediates relationship between structural empowerment
and organizational commitment.
2.14 Relationship between Organizational Culture and Job Satisfaction
In the hypothesized model, it was also anticipated that different types of
organizational culture would lead to job satisfaction among academics.
Organizational culture is expected to have a direct effect on job satisfaction
(Gregory, Stanley, Harris, Achilles Armenakis & Shook, 2009; MacIntosh &
Doherty, 2010; Melnyk, Fineout-Overholt, Giggleman, & Cruz, 2010).
That organizational culture influences work place outcomes such as job satisfaction
is an assumption implicitly held by many managers and management researchers,
although few empirical studies have provided detailed insight into the relationship.
This study attempts to examine the relationship between organizational culture and
job satisfaction. Organizational culture is commonly known as the values, beliefs and
basic assumptions that help guide and coordinate member behavior.
Research is lacking that has specifically examined the relationship between different
types of organizational culture and job satisfaction of academics (Recardo and Jolly,

67
1997; Wang & Hwang 2007). Lund, (2003) examines the impact of organizational
culture types on job satisfaction in a survey of marketing professionals in a cross-
section of firms. Despite numerous studies of job satisfaction in the industrial and
public sectors, academics’ job satisfaction remains an un-researched topic especially
in relation to organizational culture. Based on this rationale, the following hypothesis
proposed for this study: There is a relationship between organizational culture and
job satisfaction.
2.15 Mediating role of Psychological Empowerment in Relationship between
Organizational Culture and Job Satisfaction
Empowerment theorists view psychological empowerment as the mechanism through
which contextual factors influence individual attitudes and behaviors (Conger &
Kanungo, 1988; Liden & Tewksbury, 1995; Spreitzer, 1995, 1996; Thomas
&Velthouse, 1990; Quinn & Spreitzer, 1997; Egan Yang & Bartlett, 2004).
Organizational culture is the one of the contextual factors that is neglected in these
kinds of studies in the context of higher education. In other words, the process of
relationship between organizational culture and job satisfaction neglected. The
psychological empowerment of academics can explain how resources, information,
support and opportunity in university can lead to better job satisfaction.
Psychological empowerment explains the attitudes of academics towards these power
and opportunities in their work place. Thus, based on this rationale, the following
hypothesis proposed for this study: Psychological empowerment mediates the
relationship between four types of organizational culture and job satisfaction.

68
2.16 Relationship between Organizational Culture and Organizational
Commitment
Organizational commitment has been examined in organizational literature in
business and educational settings. But the relationship between different types of
organizational culture and organizational commitment has received little attention in
research universities especially in southeastern countries. To acknowledge the multi-
dimensional nature of organizational culture influence on organizational
commitment, it is necessary to understand the relationship between different types of
culture and organizational commitment (Lok &Crawford, 1999).
The study by Ipek (2010) shows that organizational commitment at compliance level
was predicted from power and role cultures, while organizational commitment at
identification and internalization levels was predicted from achievement and support
cultures. Strong corporate culture predicts positive outcomes such as commitment to
organization (Meglino, Ravlin, Adkins & Cheryl, 1989; Laschinger, Finegan, &
Shamian, 2001; Laschinger, Finegan, & Wilk, 2009; Yiing, & Ahmad, 2009).
Despite vast number of research on organizational commitment, very little empirical
research has examined the relationship between organizational culture and
organizational commitment within higher education. Based on this rationale, the
following hypothesis proposed for this study: There is a relationship between
organizational culture and organizational commitment.
2.17 Mediating role of Psychological Empowerment in Relationship between
Organizational Culture and Organizational Commitment
Spreitzer (1995) defines empowerment as “increased intrinsic task motivation
manifested in a set of four cognitions reflecting an individual’s orientation to his/her

69
work role: competence, impact, meaning, and self-determination”(p.1443).
Meanwhile, organizational culture is viewed as one of the predominant elements
shaping the environment organizations, and as an important aspect to organizational
productivity and effectiveness (Bailey, 2009).
Organizational culture can be a powerful influence on components of psychological
empowerment (Spreitzer, 1995, 2006; Bosley, 2005; Samad, 2007; Chiang & Jang,
2008; Bailey, 2009; Johnson, 2009). Organizational culture provides a great
approach for understanding the concept of relation between person and environment
which leads to successful psychological empowerment within an organization. It
considers individual attitudes, employee behavior, and organizational practices as
interactional aspects in the work place (Martin 1992).
Because of the importance of organizational culture and organizational commitment
in organizational development, it is important to study and understand the
relationship between organizational culture and organizational commitment in
research universities. It has been widely argued in previous researches that
organizational culture has influence on positive work place behaviors, particularly on
organizational commitment (Peters & Waterman, 1982; Van Vianen, 2000; Wang,
Feng, & Hwang, 2009).
Review of literature reveals that studies on the relationship between organizational
culture and organizational commitment in higher education are limited. There is lack
of research attention in the process of the relationship between organizational culture
and organizational commitment. Previous studies show a research gap that requires

70
further investigation in this area of study (Lok & Crawford, 1999, 2001; Lok,
Westwood & Crawford, 2005).
Organizational culture is one of the contextual factors neglected in these kinds of
studies in the context of higher education. Thus, based on this rationale, the
following hypotheses proposed for this study: Psychological empowerment mediates
the relationship between four types of organizational culture and organizational
commitment.
2.18 Theoretical Framework of Study
The theoretical framework of this study is based on Laschinger’s (2001) work place
empowerment model that contains two empowerment theories, structural
empowerment theory (Kanter, 1977) and psychological empowerment theory
(Spreitzer, 1995). The framework underlying this study contains organizational
culture, organizational commitment, job satisfaction and structural and psychological
empowerment within higher education. Since this concept comes from organizational
management to higher education the transferred ideas within a higher education
setting is important. As illustrated in Figure 2.4., structural empowerment
(information, resources, support, opportunities, formal and informal power) and
organizational culture are mediated by psychological empowerment of academics,
which is defined in educational context (decision making, professional growth,
status, self-efficacy, autonomy, and impact) to produce work place outcomes (job
satisfaction and organizational commitment).
According to Kanter (1977), power is obtained from the ability to access support,
information, resources and opportunities from academics’ position in the university.

71
Access to these empowerment structures is influenced by the degree of formal and
informal power an academic staff has in the university. Academics with sufficient
power are able to do the tasks that lead to the achievement of universities’ goals.
The empowered academics have the ability to empower their peers and students, and
thus provide a productive and creative university environment. On the other hand,
academics in positions that do not have sufficient opportunity and power feel
powerlessness in the university. Academics with less empowerment have lack of
power and control over their responsibilities (decision making and participating in
the process of teaching and research) and have less autonomy, and less committed to
the university.
Psychological empowerment is selected in this study as a mediator, since the
structural empowerment is not sufficient to produce and enhance positive behavioral
outcomes. Empowerment is not just a collection of organizational structures, but it is
individual attitudes and feeling about what academics feel about their role and their
task and the status they have in the work place. Academics’ psychological
empowerment has influence on work place outcomes. Based on Spreitzer (1997),
empowerment produces an active self-orientation to academics work role, so it is
reasonable to expect that an active attitude can be change to positive behavior.
Through empowerment, academics can show more job satisfaction and show more
commitment to their work place. Structural empowerment would have a direct
positive effect on psychological empowerment, which in turn would have a direct
positive effect on work satisfaction and organizational commitment.

72
Organizational culture shapes academics’ behaviors and may have relationship with
work place outcomes in research universities by mediating of psychological
empowerment. Culture can be seen as the accepted norms, values, beliefs and rules
that are shared by the academics and other staff in research universities setting. Since
most of the studies on empowerment especially in relation to organizational culture
have been carried out in western countries, and the findings could not be generalized
in Malaysia due to different sociocultural contexts, this study attempts to examine the
relation between organizational culture empowerment and workplace outcomes in
higher education in Malaysian research universities.
The connection between academics empowerment and job satisfaction and
organizational commitment show the importance of positive workplace behaviors in
increasing the effectiveness of universities by academics. Meanwhile, psychological
empowerment can affect job satisfaction and organizational commitment. While
structural empowerment has been empirically associated with job satisfaction and
organizational commitment in several studies, the aim of the current study is to
demonstrate the intervening role of psychological empowerment.
Since academics with high level of job satisfaction are more empowered to face to
challenges and pressures within the structure of universities and to be more affiliated
to their departments and show less level of burnout, the results suggest that
leadership strategies and interventions that increase feelings of empowerment in
academics will allow them to respond more effectively to the demands of their work
environment in research universities.

73
By linking structural empowerment with psychological empowerment, a broader
understanding of the empowerment process will be obtained, especially on how these
structural organizational factors influence academics’ feelings or experience of
personal empowerment in the work setting. The integration of empowerment may
provide better explanation to higher education’s total empowerment paradiagm.
Therefore, this study embraces and builds on the research regarding the integration of
structural and psychological empowerment. This study is introducing other
organizational aspects, such as organizational culture, as an integral part of
empowerment.
Psychological empowerment may serve as a mechanism through which structural
empowerment and organizational culture influence work place outcomes. Clearly,
there is a need for greater attention to be paid to understanding the mechanisms and
processes of relationship between contextual factors and work place outcomes in
research universities as there are few studies in this context on empowerment of
academics. So the purpose of this study is to understand the mediating role of
psychological empowerment between structural empowerment, organizational
culture and job satisfaction as well as organizational commitment (see Figure 2.4).
2.19 Summary
The last two decades have brought a substantial body of new research in
understanding empowerment at the work place. The biggest contribution has been
more integration of the social-structural and psychological perspectives on
empowerment. This integration notes a need for further research to develop a more
comprehensive theory of empowerment at the work place. Therefore, previous
studies have some of the pieces of this theoretical model but a theory would

74
articulate how the pieces fit together into a whole. The theoretical framework
identifies better definition, and the antecedents and consequences of empowerment.
This study will identify the mechanisms and processes of psychological
empowerment, which result in positive work place outcomes. There is still work to
be done in integrating the current knowledge with a more comprehensive theory of
empowerment in organizations, especially in higher education settings.

75
Figure 2.4. Theoretical Framework of Study
Formal power
Job definition
Discretion (flexible)
Recognition (visible)
Relevance (central)
Informal power Connection with
-Sponsors
-Peers
-Subordinates
-Cross functional group
Empowerment structures
-Opportunity structures
-Power structures
-Resources
-Information
-Support
Meaning
-Status
-Self-efficacy
-Pay
-Promotion
-Supervision
-Fridge Benefits
-Contingent reward
-Operating procedure
-Nature of work
-Communication
-Affective commitment to university
-Normative commitment to university
-Continuance commitment to university
Competency
-Professional growth
Self-determination
-Autonomy
Impact
-Decision making
-Impact
-Dominant characteristics of university
-leadership style
-Management of lecturers
-Organizational glue,
-Statistic emphases
-Criteria success
Market Clan Hierarchy Adhocracy
Increased commitment to university
Increased lecturers job satisfaction
Psychological empowerment Structural empowerment
Organizational culture

76
CHAPTER 3
3 METHODOLOGY
3.1 Introduction
This descriptive co-relational research study seeks to ascertain the mediating role of
psychological empowerment in relationship with structural empowerment,
organizational culture and work place outcomes (job satisfaction and organizational
commitment) among academics in research universities in Malaysia. This chapter
consists of the research design, research framework, population and sampling,
measurement and instruments, pilot test, reliability and validity, and data analysis
procedures.
3.2 Research Design
This quantitative co-relational research design seeks to ascertain the relationship
between study variables. Additionally, the selected study method is used to ascertain
the role of the mediating variable in relationship between predictors and criterion
variables. The relationships among the latent variables are assessed using structural
equation modeling (SEM) through the Amos statistical analysis program. Amos
assists the researcher in generating and testing theoretical models (Arbuckle, 2006;
Byrne, 2001).
SEM is a statistical procedure that combines path and factor analysis to specify
relationships between observed variables (Klem, 2000). Therefore, structural
equation modeling (SEM) is chosen for this study to examine the relationship
between these variables.

77
3.3 Research Hypotheses of Study
The research hypotheses in Figure 3.1. describes the mediating role of psychological
empowrment as a latent variable in relationship between four types of organizational
culture and structural empowerment with work place outcomes (organizational
commitment and job satisfaction). In order to conduct mediation effect based on
Baron and Kenny‘s (1986) mediation approach, three specific hypotheses for each
main hypothesis is conducted. Therefore, four main hypotheses and nine specific
hypotheses examine the mediating role of psychological empowerment in
relationship between
1. Stucutral empowemrent and job satisfaction:
a. There is a positive relationship between stuctural empowerment and job
satisfaction.
b. There is a positive relarionship between structural empowerment and
psychological empowerment.
c. There is a positive relationship between psychological empowerment and
job satisfaction.
2. Structural empowerment and oganizarional commitment:
a. There a is positive relationship between stuctural empowerment and
organizational commitment.
b. There is a positive relationship between structural empowerment and
psychological empowerment.
c. There is a positive relationship between psychological empowerment
and organizational commitment.

78
3. Organizational culture (Clan, adhocracy, market, and heirarchy) and job
satisfaction:
a. There is a positive relationship between organizational culture (Clan,
adhocracy, market, and heirarchy) and job satisfaction.
b. There is a positive relationship between organizational culture (Clan,
adhocracy, market, and heirarchy) and psychological empowerment.
c. There is a positive relationship between psychological empowerment and
job satisfaction.
4. Organizational culture (Clan, adhocracy, market, and heirarchy) and
organizational commitment:
a. There is a positive relationship between organizational culture (Clan,
adhocracy, market, and heirarchy) and organizational commitment.
b. There is a positive relationship between organizational culture (Clan,
adhocracy, market, and heirarchy) and psychological empowerment.
c. There is a positive relationship between psychological empowerment and
job satisfaction.
3.4 Measurement and Instrument
This study was carried out within a quantitative framework, allowing the gathering
data by questionnaire with participants of this study. The questionnaire consists of a
demographic information survey, structural empowerment scale, organizational
culture assessment scale, psychological empowerment scale, job satisfaction survey,
and organizational commitment questionnaire.
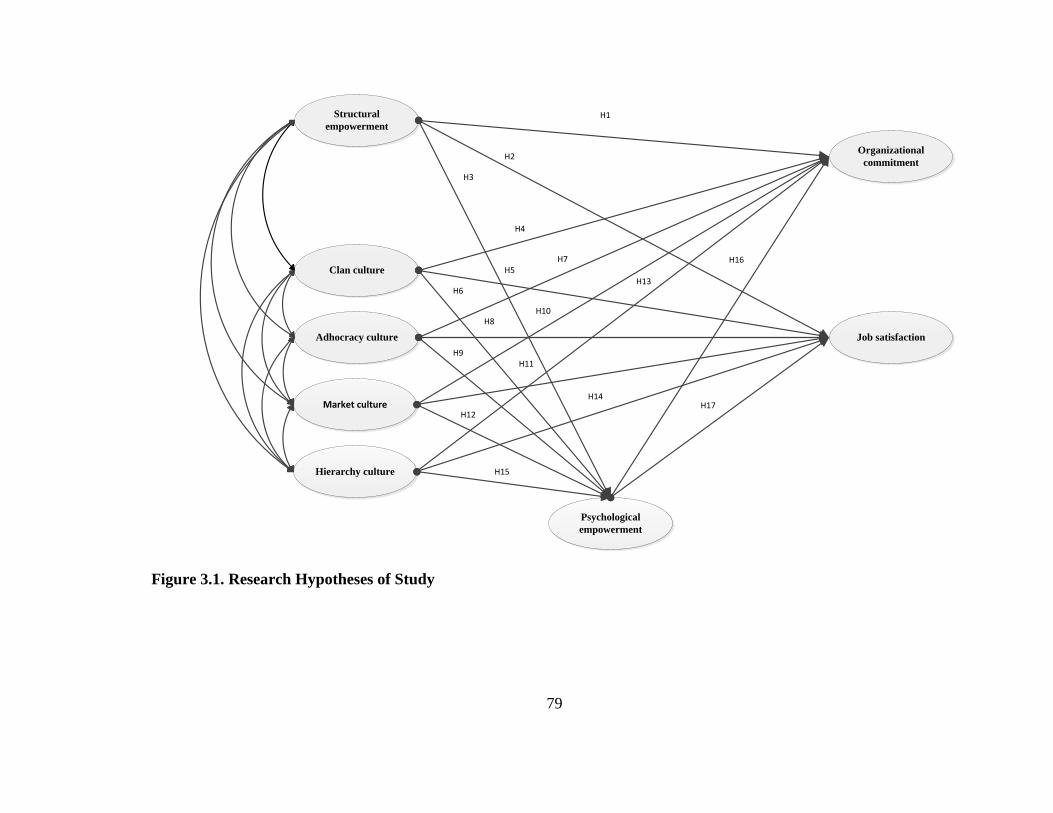
79
Structural
empowerment
Clan culture
Adhocracy culture
Market culture
Hierarchy culture
Job satisfaction
Organizational
commitment
Psychological
empowerment
H1
H2
H3
H4
H5
H6
H7
H8
H9
H10
H11
H12
H13
H14
H15
H16
H17
Figure 3.1. Research Hypotheses of Study

80
Demographic Information Survey
This information includes the personal data characteristics of age, gender, work
experience within the current department, faculty position/rank held, and number of
years worked as an academic staff (see Appendix A1).
Structural Empowerment Scale
Conditions for work effectiveness questionnaire (CWEQ-II), a modified version of
the Conditions for Work Effectiveness questionnaire (CWEQ) was selected (see
Appendix A2). CWEQ-II consists of 19 items that measure the six components of
structural empowerment described by Kanter (1977) including opportunity (three
items); information (three items); resources (three items); support (three items); the
job activities scale (JAS) for formal power (three items); and the organizational
relationships scale (ORS) used to measure informal power (four items) respectively
and two items for global empowerment scale, which is used for construct via
validation purposes (Laschinger, Finegan, Shamian & Wilk, 2001). Rating scale
format is seven-point Likert scale from (1) very strongly disagree to (7) very strongly
agree. Scores of total structural empowerment based on the sum of all 36 items range
from 21 to 147. The mean scores are used for data analysis in the study.
Organizational Culture Assessment Scale
The OCAI is a six-item ipsative response tool to assess organizational culture. The
OCAI (Cameron & Quinn 1999, Quinn & Rohrbaugh, 1983) is designed to measure
and identify four types of cultures in university. Modification is done to the tool from
ipsative scale with four dimensions to a 24-item seven-point Likert scale tool ranging

81
from (1) very strongly disagree to (7) very strongly agree. Each culture type is
measured with six items.
Meanwhile, modification in some items is done in order to change the business
context to research university context (e.g. item 13 “The glue that holds the
organization together is loyalty and mutual trust. Commitment to this organization
runs high” is changed to “The glue that holds the university together is loyalty and
mutual trust”). Therefore, total organizational culture, based on the sum of all 24
items, can range from 24 to 168. The mean scores are used for data analysis in the
study (see Appendix A3).
Psychological Empowerment Instrument
School participant empowerment scale (SPES) measures the perception of
psychological empowerment within an educational setting (Short & Rinehart, 1992).
It is a 39-item instrument on a five-point scale. The items are changed to seven-point
Likert scale ranging from (1) very strongly disagree to (7) very strongly agree. The
instrument measures six dimensions of psychological empowerment: decision
making (10 items); professional growth (six items); status (six items); self-efficacy
(six items); autonomy (four items); and impact (six items) (Short and Rinehart 1992).
Modification in some items is done in order to change the school context to research
university context (e.g. item 32 “I have the opportunity to collaborate with other
teachers” is changed to “I have the opportunity to collaborate with other faculty in
my department”). Item 18 is added in order to focus more on research tasks: “I have
the freedom to make decisions on research topics”. Scores for total psychological

82
empowerment, based on the sum of all 36 items, can range from 38 to 266. The mean
scores are used for data analysis in the study (see Appendix A3).
Job Satisfaction Survey
Job satisfaction scale measures nine aspects of job satisfaction, including: pay (four
items); promotion (four items); supervision (four items); fringe benefits (four items);
contingent rewards (four items); operating procedures (four items); co-workers (four
items); nature of work (four items); and communication (four items) (Spector, 1997).
Rating scale format with seven choices per item ranging from strongly disagree to
strongly agree is changed to seven-point likert scale from (1) very strongly disagree
to (7) very strongly agree (see Appendix A4).
The job satisfaction survey has some of its items written in negative (items 2, 4, 6, 8,
10, 12, 14, 16, 18, 19, 21, 23, 24, 26, 29, 31, 32, 34, and 36). Scores on each of nine
facet subscales, based on four items each, can range from four to 28, while scores for
total job satisfaction, based on the sum of all 36 items, can range from 36 to 252.
High scores on the scale represent job satisfaction, so the scores on the negatively
worded items are reversed before summing up with the positively worded into facet
and total scores. The mean scores are used for data analysis in the study.
Organizational Commitment Questionnaire
Organizational commitment questionnaire measures three types of commitment:
affective commitment, normative commitment, and continuance commitment (Allen
& Meyer, 1997). An 18-item measurement instrument is used .to measure normative
(six items), affective (six items), and continuance (six items) commitment scales.

83
The items are rated based on five-point Likert scale and changed to seven-point
Likert scale from (1) very strongly disagree to (7) very strongly agree (see Appendix
A5).
Modification in some items is done in order to change the business context to
research university context (e.g. item 11 “I would feel guilty if I left my organization
now” is changed to “I would feel guilty if I left my department now”). The
organizational commitment scale has some of its items written in negative (items 2,
8, 10, 12).
Scores for each subscale range from six to 42, while scores for total organizational
commitment are based on 18 items ranging from 18 to 126. The scores on the
negatively worded items are reversed before summing up with the positively worded.
The mean scores are used for data analysis in the study.
3.5 Population
The sampling frame was drawn from academics working in four universities selected
as research universities (UM; USM; UKM; and UPM) by the Ministry of Higher
Education Malaysia in 2006 (Table 3.1). The target population consists of academic
staffs in four research universities in Malaysia. The total numbers of academics who
work in these four research universities in the academic year (2010 – 2011) are
(7877) academics. The target population based on gender distribution was 4003 male
and 3874 female and the total number was 7877.
3.5.1 Sample size
In determining the sample size for this study, there are issues that should be
considered for collecting data to be analyzed using a covariance structure analysis

84
with the maximum likelihood estimation method. In determining sample size,
statistical indices can perform adequately and the results of structural equation
Table 3.1. Population of academic staff based on gender distribution in four
research universities (2008)
University Male Female Total
UM (12 Faculty) 1018 1017 2035
USM (25 Faculty) 1001 667 1668
UKM (13 Faculty) 1012 1242 2254
UPM (16 Faculty) 972 948 1920
Total 4003 3874 7877
Source: Ministry of Higher Education (2008)
modeling (SEM) can yield meaningful and interpretable values when the ratio of 5–
10 participants per estimated parameter rule is used to calculate sample size (Byrne,
1998, 2010; Schreiber et al., 2006; Kline, 2010). Based on the conceptual
framework, there were 6 independent variables. . Based on the result of pilot study,
the effect size (adjusted R square) was 0.16. The sample size was calculated by using
the G* Power 3.1.3 program. The sample size based on G* Power was 154, (α =
0.05) for 6 independent variables (power=0.95).
Some researchers have argued that a minimum sample size must exceed 100, even
though the size of 200 is recommended for a model with moderate complexity
(Marsha, Balla & MacDonald, 1988). Therefore, as a rule of thumb, any number
above 200 is understood to provide sufficient statistical power for data analysis (Hoe,
2008; Kline, 2005). Based on the above criteria and assuming a response rate of

85
50%, the present study requires a sample size of at least 400. Table 3.2 shows the
sample size based on gender distribution of academic staff in four research
universities.
3.6 Sampling Procedure
The ratios of academics in each university were considered in distributing the
questionnaires. Cluster sampling procedure used in the selection of the sample. In
each university, selection of respondents was based on cluster purposive sampling.
First, five faculties (Faculty of Education, Faculty of Medicine, Faculty of
Engineering, Faculty of Science and Faculty of Computer Sciences) were selected
from each university as the selected groups. This sampling is purposive as by
choosing five same faculties (Faculty of Education, Faculty of Medicine, Faculty of
Engineering, Faculty of Science and Faculty of Computer Sciences) in all four
universities (UM; UKM; USM; and UPM) in order to provide more homogeneous
sample and more justification to make generalizations from the sample that is being
studied. Then, from each faculty, a number of academics were selected as subjects of
study by systematic random sampling. Academics were chosen based on academic
staff profiles in each department.
3.7 Data collection procedure
The questionnaires were sent with a covering letter, followed by a reminder letter
two weeks later. Prior to data gathering, negotiation were made with the head of each
department in all four universities for the execution of the research. An introductory
letter from the head of each department explained the purpose of the study as well as
introduced the researcher. The respondents were given two weeks to complete the
questionnaires. Each questionnaire took approximately 30-45 minutes to be

86
completed. The academics were given face to face explanations regarding the
purpose for their participation. To encourage more honest responses, participants
were not required to identify themselves by name or employee number. The
completed questionnaires were picked up after two weeks and a reminder letter was
sent to academics who did not respond. Meanwhile, a website was established for
online responses (www.hrdempo.net). A total of 260 completed questionnaires (65%
return rate) were obtained.
Table 3.2. Sample size based on gender distribution in four research universities
University Male Female Total
UM (5 Faculty) 52 51 103
USM (5 Faculty) 53 35 88
UKM (5 Faculty) 55 57 112
UPM (5 Faculty) 50 47 97
Total 210 190 400
3.8 Pilot Test
In this study, a pilot study was conducted on 50 academics from UiTM. The package
of questionnaires was mailed to them and followed up by a reminder. This pilot study
was done in order to ascertain how much time it took for respondents to answer the
questions to examine the reliability of instrument. In the cover letter respondents
were asked to write their comments. The effect size (adjusted R square) and the
sample size were calculated.
3.9 Validity
Validity described by Huck (2004) as accuracy, was assessed in two ways. Initially,
content validity, including clarity and readability of the items, was assessed by some

87
experts. Feedback was requested from the experts regarding readability, language
specific to the higher education setting, clarity, and redundancy of items. The
feedback provided by the pilot test participants was used to revise the instrument and
provide content validity for the instrument. The instrument was found to be valid.
3.9.1 Content Validity
In order to assess the measurement instrument’s content validity, it was decided to
seek the opinions of experts in higher education. It was felt that this group of experts
possessed an understanding of higher education concepts and was representative of
academic staff within the research universities. The focus group began with a brief
description of the project and the intended aims of the study. All participants were
asked to read the questionnaire package and describe their ideas about the clarity of
each item, the readability of each item, and any redundancy within the instrument.
Overall, the experts provided valuable feedback that was used to modify the
instrument so that it would have a higher level of content validity. This group noted a
few redundant items within the survey. Also highlighted was select vocabulary that
was not pertinent to higher education. For instance, items which were used in the
context of business and industry were changed to higher education context. The
experts felt that the word “organization” was not suitable for the higher education
setting and the alternative “department” was chosen to adequately reflect this specific
setting.
3.9.2 Construct Validity
Construct validity is established through an examination of convergent and
discriminant validity. A construct, according to Merriam & Simpson (2000) is “a

88
theoretical explanation of an attribute or characteristic created by scholars for
purposes of study. Constructs are abstract and, having not been observed directly, are
not considered actual behaviors or events” (p. 161). To assess construct validity one
must first assess how much these characteristics that are not directly observable are
similar as they should theoretically be and represent the construct under
investigation, therefore providing one with convergent validity. Second, one must
assess the extent to which these characteristics that are not directly observable are
able to discriminate from other, different constructs under investigation, therefore
providing one with discriminant validity.
3.9.3 Convergent Validity
Convergent validity is measured by average variance extracted (AVE). A high AVE
(greater than .5) shows that the latent variables have high convergent validity
(Fornell & Larcker, 1981).
Average variance extracted:
∑[
]
∑[ ] ∑[ ]
Where is loading of on , Var denotes variance, is the measurement error of
, and ∑ denotes a sum (Fornell & larker, 1981)
3.9.4 Discriminant Validity
Discriminant validity is determined by examining whether the AVE for each
construct is greater than the squared correlations (shared variance) between the
construct and all other constructs in the model (Fornell & Larcker, 1981; Hair et al.,
2006; Farrell, 2010).

89
3.10 Reliability
Reliability is defined as the consistency of a measure. It is important to assess the
reliability of each scale used so that one can understand to what extent the data are
consistent (Huck, 2004). Internal consistency for each of the scales used in this
research was assessed using Cronbach alpha.
3.10.1 Cronbach Alpha Reliability
Cronbach alpha was chosen due to its versatility with the use of continuous variables
(Huck, 2004). For this study, Cronbach alpha reliability was done for both pilot and
whole sample.
Structural Empowerment Scale
The CWEQ-II has been used in previous studies, and an acceptable internal
consistency for each subscale has been established, ranging from .80-.95 for
information, .72 -.89 for support, .71- .88 for resources, and .76 -.85 for opportunity.
The overall reliability of CWEQ-II is .78 to .93 (Laschinger, 2005; Burns & Grove,
1999). Table 3.3 shows the reliability of total structural empowerment instrument
and its dimensions.
Table 3.3. Cronbach alpha reliability coefficients for conditions for work
effectiveness questionnaire
Instrument Alpha
coefficients
Conditions for Work Effectiveness Questionnaire .966
Subscale: Opportunity .839
Information .890
Support .951
Resources .865
Job Activities Scale .921
Organizational Relationship Scale .790
Global Empowerment .833

90
Organizational Culture Assessment Instrument
Reliability measures for the culture type subscales in the ipsative format have been
previously documented in the literature: for the clan .74 -.84, adhocracy.79-.83,
hierarchy.73-.77, market .71-.78. Reliability coefficient for the subscale is in the
Likert format as documented in the literature (Cameron & Quinn 1999; Quinn &
Spreitzer, 1991). The responses to each cultural type subscale were totaled to
comprise a comprehensive organizational culture score.
In addition, there have been numerous additional studies, with OCAI scale which
means “Sufficient evidence has been produced regarding the reliability of the OCAI
to create confidence that it matches or exceeds reliability of the most commonly used
instruments in the social, organizational and educational sciences” (Cameron &
Quinn, 1999, p. 140). Table 3.4 shows the reliability of total organizational culture
instrument and four types of organizational culture.
Table 3.4. Cronbach reliability coefficients for organizational culture
assessment instrument
Instrument Alpha
coefficients
Organizational Culture Assessment
Instrument
.939
Subscale: Clan .865
Adhocracy .810
Market .818
Hierarchy .716
Psychological Empowerment Instrument
Reliability measures for subscales are: decision making .89, professional growth .83;
status .86, self-efficacy .84; impact .82; autonomy .81. The overall scale has
reliability of .94 (Short & Rinehart, 1992). In order to use SPES in higher education

91
setting, slight modifications were made by the researcher. For instance, the wording
was changed to more appropriately reflect the higher education environment. (e.g.
“Principal” changed to “administration”; “school” is changed to “department” or
“university” and teachers changed to academic staff”. Table 3.5 shows the reliability
of total psychological empowerment instrument and its dimensions.
Table 3.5. Cronbach reliability coefficients for faculty psychological
empowerment scale
Instrument Alpha
coefficients
Faculty psychological empowerment scale .975
Subscale: Decision Making .899
Professional
Growth
.862
Status .878
Self-efficacy .892
Autonomy .865
Impact .856
Job Satisfaction Survey
Spector (1997) research was used to validate the subscales of the job satisfaction
survey. The respective alpha coefficients were found to be: pay .75, promotion .73,
supervision .82, fringe benefits .73, contingent rewards .76, operating procedures .62,
coworkers, 62, nature of work .78, and communication .71. The total reliability of
job satisfaction survey was .91 (Spector, 1985, 1997). Table 3.6 shows the reliability
of total job satisfaction instrument and its dimensions.
Table 3.6. Cronbach reliability coefficients for job satisfaction survey
Instrument Alpha
coefficients
Job satisfaction survey .893
Pay .865
Promotion .854
Supervision .884
Fringe benefits .823
Contingent rewards .791

92
Operating procedures .781
Coworkers .723
Nature of work .765
Communication .816
Organisationnel commitment questionnaire
Affective commitment has a Cronbach alpha value of.81 and a split-half reliability
coefficient of.77, which can be considered to be quite good. The Cronbach alpha
reliability coefficient and split-half reliability coefficients for continuance and
normative commitment are .78 and .76 respectively (Allen & Meyer, 1990). Table
3.7 shows the reliability of total organizational commitment instrument and its
dimensions.
Table 3.7. Cronbach reliability coefficients for organizational commitment
questionnaire
Instrument Alpha
coefficients
Organizational Commitment Questionnaire .918
Subscale: Affective .819
Normative .806
Continuance .766
3.10.2 Composite Reliability
Composite reliability measures the internal consistency of the latent construct (Kline,
2005; Hair et al., 2006). By internal consistency, a better estimate can be gained
using the composite reliability formula.
∑
∑ ∑
Where , are the factor loading, factor variance, and unique/error variance
respectively.

93
3.11 Data Analysis
The statistical package for the social sciences (SPSS) version15 and AMOS
version15 software are utilized for analysis of the data. Amos assists the researcher
in generating and testing theoretical models (Arbuckle, 2006; Byrne, 2001). The
collected data are analyzed using descriptive statistics (means and standard
deviations). In order to assess the mediation effect of psychological empowerment in
relationship between structural empowerment and organizational culture with work
place outcomes, the Baron and Kenny (1986) criteria were followed through
structural equation modeling with AMOS version 15.
Mediation
To establish mediation based on Baron and Kenny (1986) approach, the following
conditions must hold:
First, the independent variable must affect the mediator in the first equation.
Second, the independent variable must be shown to affect the dependent
variable in the second equation; and
Third, the mediator must affect the dependent variable in the third equation.
If these conditions all hold in the predicted direction, then the effect of
independent variable on the dependent variable must be less in the third
equation than in the second.

94
Based on Baron and Kenny (1986) approach, if the effects of independent
variable on dependent variable disappear after mediator controlled, it is called
complete mediation. Partial mediation is the case that the path from independent
variable to dependent variable is reduced but is still significant when mediator is
introduced.
3.12 Structural equation modeling
SEM allows the researcher to determine if the path coefficients between variables are
significant and if the proposed model is a good fit for the obtained data. Further,
direct and indirect pathways between variables can be explored, with the
complications of measurement error being taken into account (Baron & Kenny,
1986; Holmbeck et al., 2003).
SEM procedure (maximum likelihood method) is used in this study because this
approach permits modeling of a set of relations among constructs, simultaneous
estimation of all hypothesized paths, and estimation of indirect or mediating effects.
Additionally, in a structural model, SEM can simultaneously analyze the multiple
and interrelated relationships between each of the unobserved constructs (latent
variables) in one model, as well as consider measurement error in estimating the
structural coefficients to provide more precise estimation for the multi-item measures
(Byrne,2001; Tomarken & Waller, 2005).
SEM models have two major types of variables: latent variables (variables that are
not directly observed, but inferred from a set of variables that we do measure
including tests and surveys) and observed variables (set of measured or indicator
variables that are used to define the latent variables). Structural empowerment and

95
four types of organizational culture are latent exogenous variables in this study.
Organizational commitment, job satisfaction and psychological empowerment are
latent endogenous variables in this study. More specifically, they are dependent or
mediating variables that are predicted by one or other latent variables (Klem, 2000).
For the purposes of this study, constructs are the latent variables and their sub
dimensions. The indicator variables are the items on the structural empowerment
scale, clan culture, adhocracy culture, market culture, and hierarchy culture scales,
psychological empowerment scale, job satisfaction and organizational commitment
scales. The SEM model also includes parameters. Parameters indicate the direct
effects (e.g., the effect of an endogenous factor on a measured variable), as well as
the variances and covariances between variables within the model (Klem, 2000).
For this study, one model is used to test the 17 separate research questions and their
related hypotheses. However, before conducting any analysis, the model is assessed
for identification. This determines whether there is enough information in the sample
covariance to find unique estimates of the model parameters (Schumacker & Lomax,
2010). Only models that are identified can be estimated. A model is said to be
identified if there is a unique numerical solution for each of the parameters in the
model. First, the number data points and the number of parameters that are to be
estimated are counted. The number of data points is equal to the number of non-
redundant sample variances and co variances.
Number of data points=
Where is equal to the number measured variables.

96
The number of parameters is equal to the total number of regression coefficient,
variances and co-variances to be estimated. Therefore,
If there are more data points than parameters to be estimated, the model is an
over-identified model
If number of data points and parameters are equal, the model is a just-
identified model.
If there are fewer data points than parameters to be estimated, the model is
under-identified and parameters cannot be estimated. The number of
parameters needs to be reduced by constraining, or deleting some of them.
In this model there are 69 measured variables, so there are 2415 data points
(
). There are 207 parameters to be estimated in the hypothesized model: 99
regression coefficients, 99 variances, and 9 co-variances. The hypothesized model
has 2208 more data points than parameters to be estimated, so the model is over-
identified. Structural equation modeling contains two parts a measurement model and
a structural model.
3.13 Measurement model: Confirmatory Factor Analysis (CFA)
Confirmatory factor analyses (CFA) were conducted to examine the construct
validity, defined as “the extent to which a set of measured items actually reflects the
theoretical latent construct they are designed to measure” (Hair et al., 2006, p.776).
CFA provides measures of overall degree of fit and model specification, and also
examines the convergent and discriminant validity and composite reliability of model
(Bagozzi, Yi, & Philips, 1991). First-order and second-order CFA were conducted to
assess measurement of factor loading for items and removing the items that had

97
factor loading lower than .5. Second-order CFA regarding all dimensions of the
construct was done in order to examine convergent and discriminant validity and to
test construct validity of each construct.
3.13.1 CFA of Structural Empowerment
First-order CFA of Structural Empowerment
First–order CFA of each dimension of Structural empowerment (opportunity,
information, support, resources, formal power, and informal power) was conducted
to assess each construct’s factor loadings. As a rule of thumb, the item’s factor
loading should be at least .5 or higher (Hair et al, 2006). The result of an initial CFA
of 3-item measure of OPPORTUNITY dimension indicates that all standardized
regression weights (factor loadings) for three items in the OPPORTUNITY scale
exceeded the threshold level. The result of first-order CFA model for the three-item
measure of INFORMATION dimension showed that each items’ factor loadings are
all acceptable.
The first-order CFA for the three-item measure of SUPPORT indicated that all three
items achieved the ideal factor loadings. Conducting first-order CFA for other
dimensions of structural empowerment (three items RESOURCES, three items
FORMAL POWER and, four items INFORMAL POWER) showed that the factor
loadings of the items met the criteria (See Appendix C1).
Second-order CFA of Structural Empowerment
Based on the model of each dimension of structural empowerment in the first-order
CFA, the second-order CFA was conducted to assess model fit and validity of
structural empowerment. Figure 3.2 presents the second-order CFA in which

98
structural empowerment, consisting of six dimensions (namely, opportunity,
information, support, resources, formal power, and informal power) was modeled as
one construct. All regression weights were statistically significant at P < .001. Also,
all factor loadings exceeded the required level (> .5). Furthermore, the results
indicated that the fit indices obtained for the model were generally adequate (

99
STRUCTURAL
EMPOWERMENT
OPPORTUNITY
INFORMATION
SUPPORT
RESOURCES
FORMAL POWER
INFORMAL POWER
Sa2
e1
E2
e3
e4
e5
e8
e10
e12
e13
e14
e11
e7
e9
e6
e15
e16
e17
e18
e19
Sa1
Sa3
Sb1
Sb2
Sb3
Sc1
Sc2
Sc3
Sd1
Sd2
Sd3
Se1
Se2
Se3
Sf1
Sf2
Sf3
Sf4
RES
1
RES
2
RES
3
RES
4
RES
5
RES
6
.60
.58
.55
.70
.91
.91
.86
.93
.87
.68
.76
.69
.73
.58
.77
.65
.77
.83
.78
.86
.78
.86
.62
.94
.89
Figure 3.2. Second-order CFA of Structural Empowerment

100
3.13.2 CFA of Organizational Culture
First-order CFA of Organizational Culture
First–order CFA of organizational culture (clan, adhocracy, market, and hierarchy)
was conducted to assess each construct’s factor loadings. The result of first-order
CFA of six-item measure of CLAN culture revealed that all standardized regression
weights (factor loadings) for six items in CLAN scale reached the threshold level.
The result of first-order CFA model for the six-item measure of ADHOCRACY
dimension showed that each item’s factor loadings were all acceptable. The first-
order CFA for six-item measure of MARKET indicated that one item (cb3) had
factor loading of less than .5 and was deleted from the model. First-order CFA of
HIERARCHY showed that two items of the six items (cd4 and ca4) did not reach the
ideal level of factor loading and were deleted from the model (See Appendix C2).
Second-order CFA of Organizational Culture
After deleting the three items (cb3; cd4; and ca4) with factor loading of less than .5,
four constructs of organizational culture in the first-order CFA, and the second-order
CFA were conducted to assess model fit and validity of organizational culture.
Figure 3.3 shows the second-order CFA with four types of organizational culture
(namely. clan, adhocracy, market, and hierarchy) were modeled as one construct. All
regression weights were statistically significant at P < .001. Also, all factor loadings
exceeded the required level (> .5). Furthermore, the results indicated that the fit
indices obtained for the model were generally adequate (
.

101
Although the fit indices were generally acceptable, some criteria did not meet
appropriate levels in the baseline model. A series of modification process were
applied to the model to increase the model fit. Based on modification index, cb1’s
error (e2) covaried with ce1’s error (e5) term (M.I=17.738). This relationship
theoretically makes sense since cb1 and ce1 measure respectively organizational
leadership and strategic emphasis of clan culture in the research university context.
In other words, correlating these two items' errors demonstrates that participants
approached items in these two items in the same manner, and therefore, error in one
item is similar to the error in the other item.
ca2’s error (e7) co varied with cc2’s error (e9) term (M.I=19.444). This theoretically
makes sense since ca2 and cc2 measure respectively dominant characteristic and
management of academics of adhocracy culture. therefore, correlating these two
items' errors demonstrates that academics approached items in these two items in the
same manner, and therefore, error in one item is similar to the error in the other
item.ca3’s error (e13) covaried with ce3’s error (e16) term (M.I=20.229). This
relationship between errors also makes sense. Ca3 and ce3 measure respectively
dominant characteristic and strategic emphasis of hierarchical culture. Therefore, for
participants respond to these two items in the same manner and the errors become the
same.
The results of the respecified model show an enhanced fit. (
. Meanwhile, the
results reported that all regression weights were statistically significant (p <.001)
correlations between the constructs were also statistically significant (p <.001).

102
ORGANIZATIONAL
CULTURE
CLAN CULTURE
ADHOCRACY
CULTURE
MARKET
CULTURE
HIERARCHY
CULTURE
Cb1
e1
e2
e3
e4
e5
e8
e10
e12
e13
e14
e11
e7
e9
e6
e15
e18
e19
e20
e21
Ca1
Cc1
Cd1
Ce1
Cf1
Ca2
Cb2
Cc2
Cd2
Ce2
Cf2
Ca3
Cc3
Cd3
Cb4
Cc4
Ce4
Cf4
RES
2
RES
4
RES
5
.67
.88
.91
.81
.91
.81
.75
.83
.68
.69
.80
.62
.51
.56
.98
.98
.83
.81Ce3
Cf3
e16
e17
RES
3
.88
.59
.83
.80
.75
.79
.78
.34
.42
.26
3.13.3 CFA of Psychological Empowerment
Figure 3.3. Second-order CFA of Organizational Culture

103
3.13.4 CFA of Psychological Empowerment
First-order CFA of Psychological Empowerment
First–order CFA dimensions of psychological empowerment (decision making,
professional growth, status, self-efficacy, autonomy, and impact) were conducted to
assess each construct’s factor loadings. The result of an initial CFA of 10-item
measure of DECISION MAKING dimension indicated that all standardized
regression weights (factor loadings) met the criteria level (< .5). The result of first-
order CFA model for the six-item measure of PROFESSIONAL GROWTH
dimension showed that each item’s factor loadings were all acceptable.
The first-order CFA for six-item measure of STATUS indicated that two items
(EP28 and EP35) did not achieve the ideal factor loadings and for this reason were
removed from the model. Conducting first-order CFA for SELF-EFFICACY
dimension with six items showed that one item’s (EP 10) factor loadings did not
meet the criteria and was removed from the model. The result of the first-order CFA
model for the five-item measure of AUTONOMY dimension showed that one item’s
(EP 18) factor loadings did not meet the criteria and was removed from the model.
The first-order CFA for the six-item measure of IMPACT indicated that two items
(EP6 and EP19) did not achieve the ideal factor loadings and for this reason were
removed from the model (see Appendix C3).
Second-order CFA of Psychological Empowerment
After deleting the six items (EP28; EP35; EP10; EP18; EP6 and EP19) with factor
loading of less than .5, six constructs of psychological empowerment in the first-
order CFA, and the second-order CFA were conducted to assess model fit and
validity of psychological empowerment. Figure 3.4 shows the second-order CFA

104
with six dimensions of psychological empowerment (decision making, professional
growth, status, self-efficacy, autonomy, and impact) was modeled as one construct.
According to the model fit outcome, some criteria did not meet appropriate levels in
the baseline model. A series of modification processes was applied to the model to
increase the model fit.
Based on modification index, EP1’s error (e1) covaried with EP10’s error (e10) term
(M.I=24.994). EP13’s error (e2) co varied with EP20’s error (e3) term (M.I=41.387).
EP26’s error (e4) covaried with EP39’s error (e9) term (M.I=49.314). EP38’s error
(e8) covaried with EP1’s (e10) terms (M.I. =10.907). This relationship theoretically
makes sense since EP1, EP10, EP13, EP20, EP26, EP39 EP38, and EP1 items
measure decision making of academics dimension of psychological empowerment.
In other words, correlating these items' errors demonstrates that participants
approached these items in the same manner, and therefore, error in one item is
similar to the error in the other item.
EP8’s error (e12) covaried with EP27’s error (e15) term (M.I. =13.552). This
relationship theoretically makes sense since EP8 measures the level of professional
growth among academics and EP27 also measures professional growth by
concentrating on continuous learning of academics. Therefore, correlating these two
items' errors demonstrates that participants approached these items in the same
manner, and therefore, error in one item is similar to the error in the other item.
EP14’s error (e13) covaried with EP32’s error (e16) term (M.I. =12.319). The
relationship between errors of EP14 and EP32 theoretically makes sense since EP14
and EP32 both measure the opportunity that academics have regarding their

105
professional growth. Therefore, correlating these two items' errors demonstrates that
participants approached these items in the same manner, and therefore, error in one
item is similar to the error in the other item.
EP9’s error (e18) covaried with EP15’s error (e19) term (M.I. =12.599). This
relationship theoretically makes sense since EP9 and EP15 measure status of
academics among their colleagues. Therefore, correlating these two items' errors
demonstrates that participants approached these items in the same manner, and
therefore, error in one item is similar to the error in the other item. EP4’s error (e21)
covaried with EP16’s error (e22) term (M.I. =13.846). EP16’s error (e22) covaried
with EP33’s error (e25) term (M.I. =11.090). The correlation between errors of these
two items theoretically makes sense. EP4 and EP16 both ask about self-efficacy of
academic staffs in relation to their students. So, correlating these two items' errors
demonstrates error in one item is similar to the error in the other item. EP11’s error
(e27) covaried with EP17’s error (e28) term (M.I. =33.452). The relationship
between errors of EP11 and EP17 theoretically makes sense since EP11 and EP17
both measure the autonomy of academics in their teaching tasks. Therefore,
correlating these two items' errors demonstrates that participants approached these
items in the same manner, and therefore, error in one item is similar to the error in
the other item (Figure 3.4). The results of the respecified model show an enhanced fit
(
. However, the results reported that the model still did not fit properly. As the
model did not fit the second-order CFA for psychological empowerment construct,
item parceling was used.
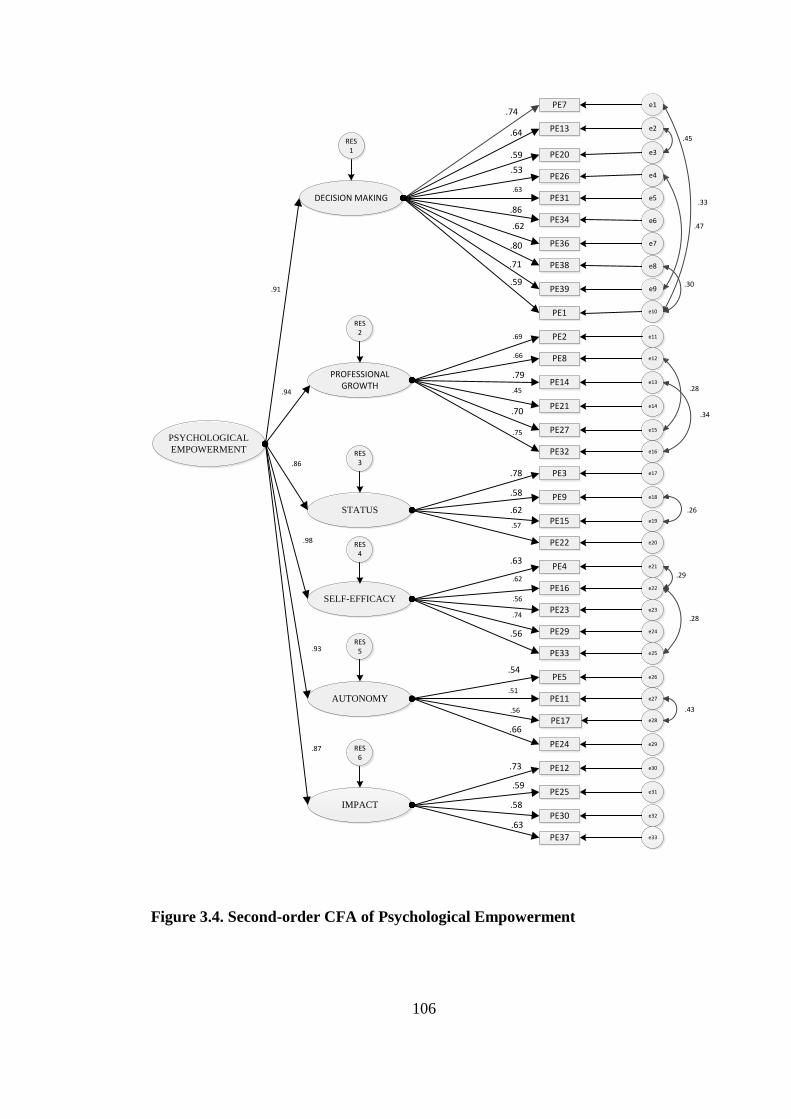
106
PSYCHOLOGICAL
EMPOWERMENT
DECISION MAKING
PE7
PE13
PE20
PE34
PE1
PE39
PE38
PE36
PE26
PE31
PROFESSIONAL GROWTH
PE2
PE8
PE14
PE21
STATUS
PE3
PE9
PE15
PE22
SELF-EFFICACY
PE4
PE23
PE29
PE16
PE33
AUTONOMY
IMPACT
PE5
PE11
PE17
PE24
PE12
PE25
PE37
PE30
e11
e1
e2
e3
e4
e5
e6
e7
e8
e9
e10
e12
e13
e14
e15PE27
e17
e18
e19
e20
e21
e22
e24
e23
e25
e29
e30
e31
e32
e33
e26
e28
e27
PE32 e16
.59
.71
.80
.62
.86
.63
.53
.59
.64
.74
.75
.70
.45
.79
.66
.69
.57
.62
.58
.78
.56
.74
.56
.62
.63
.66
.56
.51
.54
.63
.58
.59
.73
.91
.94
.86
.98
.93
.87
RES1
RES2
RES3
RES4
RES5
RES6
.33
.45
.47
.30
.28
.34
.26
.29
.28
.43
Figure 3.4. Second-order CFA of Psychological Empowerment

107
Partial Disaggregation (Item Parceling)
Decision making was done with 10 items divided into three components: Items
EP34, EP26, EP39, and EP36 for parcel DC1 items; items EP38, EP1, and EP13 for
parcel DC2, and items EP7; EP31 and EP20 for parcel DC3. Professional growth
with six items was divided into two components: items EP14 and EP21; EP27 for
parcel PG1; items EP32, EP8, and EP2 for parcel PG2. Status with four items was
divided into two components: items EP3 and EP9 for parcel ST1; items EP15 and
EP22 for parcel ST2.
Self-efficacy with five items was divided into two components: items EP33, EP4 and
EP29 for parcel ST1; items EP16 and EP23 for parcel ST2. Autonomy with four
items was divided into two components: items EP24 and EP5 for parcel SS1; items
EP17 and EP11 for parcel SS2. Impact with four items was divided into two
components: items EP12 and EP30 for parcel IM1; items EP25 and EP37 for parcel
IM2 (see Figure 3.5). The results of the respecified model by item parceling showed
an enhanced fit (
.
3.13.5 CFA of Job Satisfaction
First-order CFA of Job Satisfaction
First–order CFA of nine dimensions of job satisfaction (pay, promotion, supervision,
fringe benefits, contingent rewards, operating conditions, co-workers, nature of work
and communication) were conducted to assess each construct’s factor loadings. The
result of an initial CFA of four-item measure of PAY dimension indicated that all

108
standardized regression weights (factor loadings) for four items in the PAY scale
exceeded the threshold level.
The result of first-order CFA model for the four-item measure of PROMOTION
dimension showed that one item’s factor loadings (J2) were not acceptable. The first-
order CFA for the four-item measure of SUPERVISION indicated that all four items
achieved the ideal factor loadings. Conducting first-order CFA for the four-item
measure of FRINGE BENEFITS showed that the factor loadings of the items met the
criteria. The result of an initial CFA of four-item measure of CONTINGENT
REWARDS dimension indicated that all factor loadings for the four items in
CONTINGENT REWARDS scale exceeded the threshold level.
Conducting first-order CFA for the four-item measure of OPERATING
CONDITIONS showed that the factor loadings of the items met the criteria.
Conducting first-order CFA for the four-item measure of CO-WORKERS showed
that for one item (J34), factor loading did not meet the criteria and was removed.
First-order CFA for the four-Item measure of NATURE OF WORK showed that for
one item (J35), factor loading did not reach the appropriate level and was removed.
The result of an initial CFA of the four-item measure of COMMINUCATION
dimension indicated that all factor loadings exceeded the threshold level (see
Appendix C4).

109
PSYCHOLOGICAL
EMPOWERMENT
DECISION MAKING
DC3
DC1
DC2
PROFESSIONAL GROWTH
PG1
PG2
STATUS
ST1
ST2
SELF-EFFICACY
SS2
SS1
AUTONOMY
IMPACT
AU1
AU2
IM1
IM2
e4
e5
e6
e12
e13
e18
e19
e22
e23
e31
e32
e28
e27
.96
.75
.88
.86
.82
.67
.86
.67
.86
.69
.71
.77
.76
.88
.97
.84
.93
.88
.94
RES1
RES2
RES3
RES4
RES5
RES6
Figure 3.5. Second- order CFA of Psychological Empowerment (Aggregation)

110
Second-order CFA of Job Satisfaction
After deleting the three items with factor loading of less than .5, nine constructs of
job satisfaction in the first-order CFA, and the second-order CFA were conducted to
assess model fit and validity of job satisfaction. Figure 3.6 shows the second-order
CFA with nine dimensions of job satisfaction (pay, promotion, supervision, fringe
benefits, contingent rewards, operating conditions, co-workers, nature of work and
communication) was modeled as one construct. According to the model fit outcome,
fit indices did not meet appropriate levels in the baseline model. A series of
modification processes was applied to the model to increase the model fit.
Based on modification index, J10’s error (e2) covaried with J19’s error (e3) term
(M.I=40.100). J10’s error (e2) co varied with J28’s error (e4) term (M.I=10.515).
The relationship between errors of J10 and J19 theoretically makes sense since J10
and J19 both measure the level of academics satisfaction by asking about the amount
of payment and both items are negative items. Therefore, correlating these two items'
errors demonstrates that participants approached these items in the same manner, and
therefore, error in one item is similar to the error in the other item.
J24’s error (e23) covaried with J31’s error (e24) term (M.I. =23.393). This
relationship theoretically makes sense since J24 and J31 measure the level of job
satisfaction among academics regarding work over load in the university they work.
Therefore, correlating these two items' errors demonstrates that participants
approached these items in the same manner, and therefore, error in one item is
similar to the error in the other item.

111
J16’s error (e26) covaried with J34’s error (e28) term (M.I. =17.274). This
relationship theoretically makes sense since J16 and J34 measure the level of job
satisfaction among academics in relation to their colleagues and other people in the
university. Therefore, correlating these two items' errors demonstrates that
participants approached these items in the same manner, and therefore, error in one
item is similar to the error in the other item. The results of the respecified model
showed an enhanced fit (see Figure 3.6). (
. However, the results reported that
still the model did not fit properly. As the model did not fit the second-order CFA for
job satisfaction construct, item parceling was used.
3.13.6 Partial Disaggregation (Item Parceling)
As each dimension of job satisfaction variable contains only four items, so for partial
aggregation. Uni-dimensional parcel method cannot be conducted for these
measurement scales. Each parcel should contain three or more items. So, for partial
aggregation, multi-dimensional parcel method was done for this construct. In
homogenous parceling, each parcel is made up of items that load on the same first-
order factor. Each parcel contains items from the same dimensions.
Four Items (J1, J10, J19, J28) of PAY were summed up into the parcel. Three Items
(J11, J20, J33) of PROMOTION were averaged up to one parcel. SUPERVISION
with four items (J3, J12, J21, J30) was summed up and transferred to a parcel. Four
Items (J4, J13, J22, J29) of FRINGE BENEFITS were summed up into the parcel.
Four Items (J5, J14, J23, J32) of CONTINGENT REWARDS were averaged up to
one parcel.

112
OPERATING CONDITIONS with four items (6 J15, J24, and J31) were summed up
and transferred to a parcel. Four Items (J7, J16, J25, J34) of CO-WORKERS were
summed up into the parcel. Three Items (J11, J17, J27) of NATURE OF WORK
were averaged up to one parcel. COMMINUCATION with three items (J9, J18, and
J26), were summed up and transferred to a parcel. Factor loadings for four parcels
(operating conditions, co-workers, nature of work, and supervision) did not meet the
criteria and were removed from the model. Factor loadings for supervision, operating
conditions, co-workers, and nature of work did not meet the appropriate criteria.

113
JOB
SATISFACTION
PAY
J1
J10
J19
J11
J3
J33
J20
J28
SUPERVISION
J12
J21
J30
J4
FRIDGE BENEFITS
J29
J5
J23CONTIGENT
REWARDS
J32
J6
J15
J14
J24
COWORKERS
NATURE OF
WORK
J31
J7
J16
J25
J8
J27
J17
e9
e1
e2
e3
e4
e5
e6
e7
e8
e10
e11
e12
e13J13
e15
e16
e17
e18
e19
e21
e20
e22
e25
e26
e28
e29
e30
e23
e24
J22 e14
.55
.69
.49
.75
.47
.75
.60
.54
.72
.50
.78
.56
.27
.25
.21
RES1
RES3
RES4
RES5
RES7
RES8
PROMOTION
RES2
OPERATING
CONDITIONS
RES6
J34 e27
COMMINUCATION
J18
J9
e31
e32
RES9
J26 e33
.83
.55
.98
.65
-.11
.43
.36
.31
.76
.52
.76
.57
.59
.63
.52
.53
.67
.75
.69
.94
.90
.52
.72
.52
.76
.82
.64
.61
.74
.54
.76
Figure 3.6. Second-order CFA of Job Satisfaction

114
JOB SATISFATION
PAY
PROMOTION
FRINGE BENEFITS
CONTINGENT REWARDS
COMMINUCATION
e1
e2
e3
e4
e5
.84
.69
.86
.81
.55
Figure 3.7. Second-order CFA of Job Satisfaction (Respecified Model)
Therefore, these four dimensions were removed from the model. The results of the
respecified model by item parceling showed an enhanced fit (see Figure 3.7).The last
model fit based on the data is
.
3.13.7 CFA of Organizational Commitment
First-order CFA of Organizational Commitment
First–order CFA of three dimensions of organizational commitment (normative
commitment, affective commitment, and continuance commitment) was conducted to
assess each constructs’ factor loadings. The result of an initial CFA of six-item

115
measure of NORMATIVE COMMITMENT dimension indicated that all
standardized regression weights (factor loadings) for six items of NORMATIVE
COMMITMENT in scale exceeded the threshold level.
The result of first-order CFA model for the six-item measure of AFFECTIVE
COMMITMENT dimension showed that one item’s factor loading (O11) was not
acceptable and thus removed. The first-order CFA for a six-item measure of
CONTINUANCE COMMITMENT indicated that none of the six items (O1, O4, O7,
O9, O14, O17) achieved the ideal factor loadings and deleted (see Appendix C5).
Second-order CFA of Organizational Commitment
After deleting the 7 items with factor loading less than .5, 3 constructs of
organizational commitment in the first-order CFA, the second-order CFA were
conducted to assess model fit and validity of organizational commitment. Figure 3.8
showed the second-order CFA with three dimensions of organizational commitment
(affective, normative and continuance commitment) was modeled as one construct.
According to the model fit outcome, fit indices did not meet appropriate levels in the
baseline model.
A series of modification process were applied to the model to increase the model fit.
Based on modification index, O13’s error (e8) covaried with O18’s error (e10) term
(M.I=12.701). The relationship between errors of O13 and O18 theoretically makes
sense since O13 and O18 both measure the level of academics normative
commitment by asking about their loyalty in their work place Therefore, correlating
these two items' errors demonstrates that participants approached these items in the
same manner, and therefore, error in one item is similar to the error in the other item.

116
O2’s error (e7) co varied with O18’s error (e10) term (M.I=14.065). The relationship
between errors of O2 and O18 theoretically makes sense since O2 and O18 both
measure the level of academics normative commitment Therefore, correlating these
two items' errors demonstrates that participants approached these items in the same
manner, and therefore, error in one item is similar to the error in the other item.
O10’s error (e4) covaried with O16’s error (e6) term (M.I =20.564). The relationship
between errors of O10 and O16 theoretically makes sense since O10 and O16 both
measure the level of academics affective commitment. Therefore, correlating these
two items' errors demonstrates that participants approached these items in the same
manner, and therefore, error in one item is similar to the error in the other item.
O8’s error (e3) covaried with O10’s error (e4) term (M.I=11.064). The relationship
between errors of O10 and O16 theoretically makes sense since O8 and O10 both
measure emotional attachment of academics in their departments. Therefore,
correlating these two items' errors demonstrates that participants approached these
items in the same manner, and therefore, error in one item is similar to the error in
the other item.
O6’s error (e2) covaried with O10’s error (e4) and term (M.I=15.012). The
relationship between errors of O10 and O16 theoretically makes sense since O6 and
O10 both measure affective commitment of academics towards their departments.
Therefore, correlating these two items' errors demonstrates that participants
approached these items in the same manner, and therefore, error in one item is
similar to the error in the other item (see Figure 4.8). The results of the respecified

117
model show an enhanced fit (
) the results report that the model fit properly.
ORGANIZATIONAL COMMITMENT
AFFECTIVE COMMITMENT
NORMATIVECOMMITMENT
RES1
RES2
O3
O6
O8
O10
O12
O16
O2
O13
O15
O18
O5
e1
e2
e3
e4
e5
e6
e7
e8
e9
e10
e11
.25
.17
-.35
.26
-.22
.97
.98
.62
.57
.63
.69
.68
.63
.61
.58
.68
.54
.51
Figure 3.8. Second-order CFA of Organizational Commitment
Structural model
The structural model deals with the relationships between latent variables only. SEM
is used to look at path coefficients among the variables. Goodness-of-fit indices are
generated to determine the overall fit of the model to the data (Arbuckle, 2006).
Goodness of fit indicates how well the specified model reproduces the co-variance
matrix among the indicator items. For this study, chi squares ( ), ratio of to the

118
degree of freedom, the Comparative Fit Index (CFI), the goodness of Fit Index (GFI)
and Incremental Fit Index (IFI) are utilized to determine goodness of fit. These
indices range from 0 to 1.00, with values closer to 1.00 (usually above .90) being
indicative of good model fit. The Root Mean Square Error of Approximation
(RMSEA) is also utilized. A RMSEA coefficient of .08 is normally taken as
indicative of satisfactory model fit, but <.10 is acceptable (Hair et al., 2006).
Modification indices
Modification indices are also generated that suggest new paths and parameter
relationships. These modifications are considered in this study to improve the fit of
the model for the data (Klem, 2000). It is rare that a model fits well at first.
Sometimes model modification is required to obtain a better-fitting model. AMOS
allows for the use of modification indices to generate the expected reduction in the
overall model fit chi-square for each possible path that can be added to the model.
The Threshold for Modification Indices specifies what level of chi-square change is
required for a path to be included in the modification index output.
Item parceling (Aggregation)
Item parceling is used when the total number of indicators for a latent construct is
difficult to manage (involves lengthy scale). Parcels refer to aggregation (sums or
average) of several individual items (Coffman & MacCallum, 2005). The individual
indicators used to represent latent variables are parceled by summing up or averaging
up several individual indicators and then the scores on the parcels as indicators for
the latent variable analysis (Hair et al, 2006). There are three levels of data
aggregation of latent variable indicators.

119
Total disaggregation: when each item serves as an indicator for a
construct.
Partial disaggregation: when several items are summed up or averaged
resulting in several parcels for a construct.
Total aggregation: when all of the items for a scale are summed up or
averaged.
Partial aggregation was conducted based on uni-dimentional parcels method, to allow
the reduction in the number of measured variables in this model. Model with parcels
as indicators tend to fit better than model with items as indicators, because the order
of parcel correlation matrix is much smaller than the order of the item correlation
matrix (Coffman & MacCallum, 2005).
Bagozzi and Heatherton (1994) suggested between five to seven items that can be
randomly divided into two dimensions for components for partial disaggregation. If
there are more than nine items, there could be three or more components. In this
method for each construct one factor model to the all items is fitted. According to the
factor loadings the items are ranked and then, items were assigned to parcels to
equate the average loadings of each parcel on each factor.
Nested model comparison
Nested model comparisons work by imposing a constraint or set of multiple
constraints on a starting or less restricted model to obtain a more restricted final
model. The nested model comparisons provide a powerful tool to test competing
structural equation (and related) models.

120
Bootstrapping
The Bootstrap section of the output contains the mean of the parameter estimates
from the multiple bootstrap samples. Bootstrapping is to examine significant of path
coefficients (To obtain the test of significance for the indirect effect) and its values.
Bootstrapping is to check the normality of sampling distributions of the total and
specific indirect effects; so, it is reasonable to expect the sampling distribution to be
approximately normal. In particular, the bootstrap can be used to find approximate
standard errors (Preacher & Hayes, 2008).
3.14 Summary
This chapter delineated the design of research, population sampling, data collection
procedures measurement and instrument. In addition, threats to validity and
reliability is identified .and the data analysis procedure is also addressed. The data
analyses and the results of hypotheses testing are presented in Chapter Four.
Table 3.8. Summary of objectives, hypotheses and statistics use
Objectives Hypotheses Statistics used
To determine the effect of
structural empowerment
on job satisfaction as
mediated by psychological
empowerment.
Psychological
empowerment mediates
the relationship between
structural empowerment
and job satisfaction.
Structural equation
modeling (SEM);
Mediation effect based on
Baron and Kenny
approach(1986)
To determine the effect of
structural empowerment
on organizational
commitment as mediated
by psychological
empowerment.
Psychological
empowerment mediates
the relationship between
structural empowerment
and organizational
commitment.
Structural equation
modeling (SEM);
Mediation effect based on
Baron and Kenny
approach(1986)
To determine the effect of
organizational culture on
job satisfaction as
mediated by psychological
empowerment.
Psychological
empowerment mediates
the relationship between
organizational culture and
job satisfaction.
Structural equation
modeling (SEM);
Mediation effect based on
Baron and Kenny
approach(1986)
To determine the effect of
organizational culture on
Psychological
empowerment mediates
Structural equation
modeling (SEM);

121
organizational
commitment as mediated
by psychological
empowerment.
the relationship between
organizational culture and
organizational
commitment.
Mediation effect based on
Baron and Kenny
approach(1986)
CHAPTER 4
4 FINDINGS AND DISCUSSIONS
4.1 Introduction
This chapter presents the results of the study analysis in chapter 3. In particular, this
chapter presents study reports descriptive statistics, which focus on the psychometric
properties of the variables used for the analysis in this research. Meanwhile,
assumption of normality, outliers and multicollinearity were checked. Second, the
results of structural equation modeling (SEM) are presented. SEM, analysis was done
by AMOS software in order to show the measurement model (first and second order
confirmatory factor analysis) and structural model. The results of confirmatory factor
analysis (CFA), which verify the proposed factor structure and test the construct
validity, are reported. To support appropriate reliability and validity, convergent and
discriminant validity, and composite reliability and Cronbach alpha are checked.
Finally, the structural model is used to test research hypotheses that were identified
in Chapter 1.
4.2 Descriptive Statistics
From a total 400 questionnaires that initially were distributed to the participants, 260
usable data sets were returned for an overall rate of 65%. Mean standard deviation
and reliabilities were analyzed by using SPSS version 15. Demographic information
of the 260 academics is presented in Table 4.1. The majority (53%) of respondents
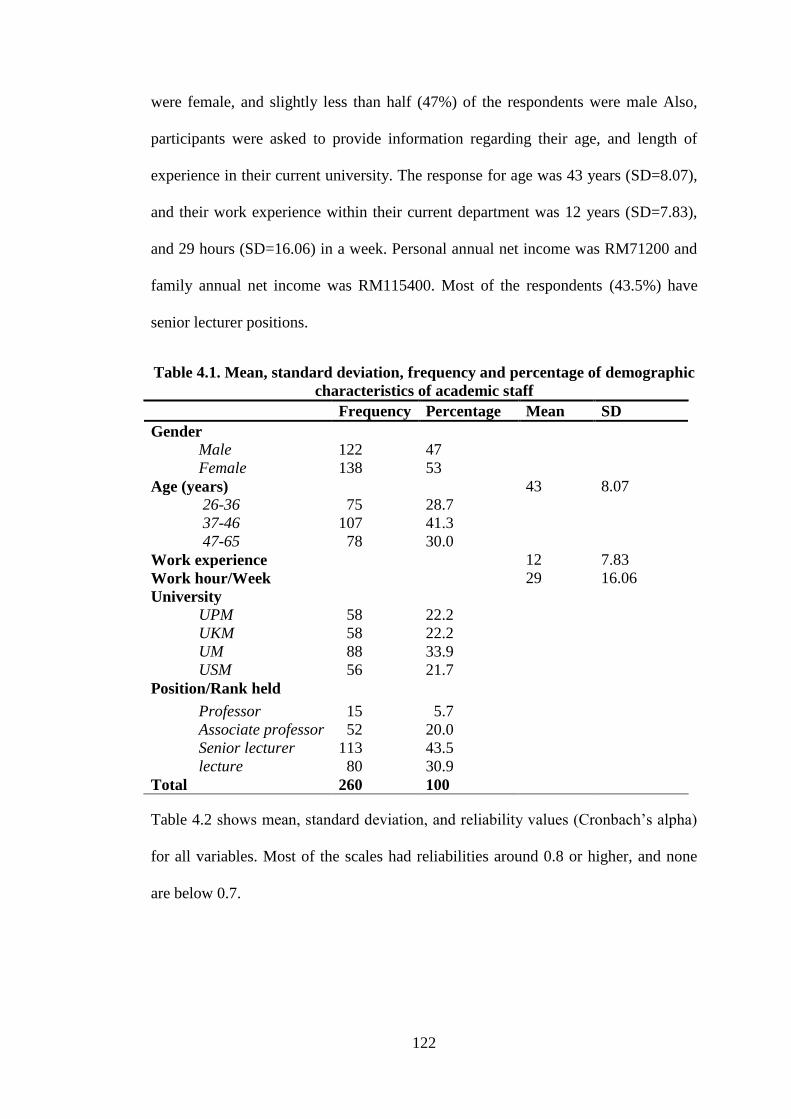
122
were female, and slightly less than half (47%) of the respondents were male Also,
participants were asked to provide information regarding their age, and length of
experience in their current university. The response for age was 43 years (SD=8.07),
and their work experience within their current department was 12 years (SD=7.83),
and 29 hours (SD=16.06) in a week. Personal annual net income was RM71200 and
family annual net income was RM115400. Most of the respondents (43.5%) have
senior lecturer positions.
Table 4.1. Mean, standard deviation, frequency and percentage of demographic
characteristics of academic staff
Frequency Percentage Mean SD
Gender
Male 122 47
Female 138 53
Age (years) 43 8.07
26-36 75 28.7
37-46 107 41.3
47-65 78 30.0
Work experience 12 7.83
Work hour/Week 29 16.06
University
UPM
UKM
UM
USM
58
58
88
56
22.2
22.2
33.9
21.7
Position/Rank held
Professor
Associate professor
Senior lecturer
lecture
15
52
113
80
5.7
20.0
43.5
30.9
Total 260 100
Table 4.2 shows mean, standard deviation, and reliability values (Cronbach’s alpha)
for all variables. Most of the scales had reliabilities around 0.8 or higher, and none
are below 0.7.

123
Table 4.2. Mean, Standard deviation and reliability of measurement variables
Instrument Mean SD Score
Range
Cronbach’s
alpha
CWEQ
Opportunity 5.28 0.88 1-7 .912
Information 4.48 1.36 1-7 .873
Support 4.59 1.31 1-7 .911
Resources 4.64 1.11 1-7 .853
Formal power 4.60 1.14 1-7 .841
Informal power 4.55 1.16 1-7 .843
Total structural empowerment 28.14 5.82 6-42 .907
OCAI
Clan 4.29 1.16 1-7 .865
Market 4.23 1.03 1-7 .818
Adhocracy 4.21 1.04 1-7 .810
Hierarchy 4.59 0.76 1-7 .716
Total Organizational Culture 17.32 3.58 4-28 .939
FPES
Decision Making 4.38 1.04 1-7 .899
Professional Growth 5.00 0.94 1-7 .862
Status 5.47 0.60 1-7 .878
Self-efficacy 5.46 0.69 1-7 .892
Autonomy 5.11 0.82 1-7 .865
Impact 5.16 0.69 1-7 .856
Total Psychological
Empowerment
32.64 4.59 6-42 .975
JSS
Pay 3.03 1.05 1-7 .793
Promotion 3.00 0.92 1-7 .704
Supervision 4.91 1.21 1-7 .758
Fringe benefits 3.59 1.17 1-7 .708
Contingent rewards 2.80 0.86 1-7 .727
Operating conditions 4.73 1.11 1-7 .903
Coworkers 4.86 0.97 1-7 .751
Nature of work 3.36 1.08 1-7 .786
Communication 4.39 1.13 1-7 .719
Total job satisfaction 34.67 6.03 9-63 .885
OCQ
Affective commitment 4.78 1.10 1-7 .703
Normative commitment 4.56 0.94 1-7 .755
Continuance commitment 4.48 0.82 1-7 .827

124
Total organizational commitment 13.82 2.49 3-21 .852
4.2.1 Distribution of level of structural empowerment
The overall mean of structural empowerment is 28.14 with SD of 5.82. The level of
structural empowerment is divided in to three levels, namely low, moderate and high
based on the scales. The result as a whole showed that majority of academics
(54.6%) practice moderate level of structural empowerment and (40.8%) of
academics have high level of structural empowerment. Few academics (4.6%)
practice low level of structural empowerment.
Table 4.3. Frequency, mean and SD of structural empowerment
Variable Frequency Percent Mean SD
28.14 5.82 Low 12 4.6 Moderate 142 54.6 High 106 40.8
4.2.2 Distribution of level of psychological empowerment
The overall mean of psychological empowerment is 32.64 with SD of 4.59. The level
of psychological empowerment is divided in to three levels, namely low, moderate
and high based on the scales. The result as a whole showed that majority of
academics (54.2%) practice high level of psychological empowerment and (44.6%)
of academics have moderate level of psychological empowerment. Few academics
(1.2%) practice low level of psychological empowerment.
Table 4.4. Frequency, mean and SD of psychological empowerment
Variable Frequency Percent Mean SD
32.64 4.59 Low 3 1.2 Moderate 116 44.6 High 141 54.2

125
4.2.3 Distribution of level of job satisfaction
The overall mean of job satisfaction is 34.67 with SD of 6.03. The level of job
satisfaction is divided in to three levels, namely low, moderate and high based on the
scales. The result as a whole showed that majority of academics (80.8%) practice
moderate level of job satisfaction and (14.2%) of academics have high level of job
satisfaction. Few academics (5%) practice low level of job satisfaction.
Table 4.5. Frequency, mean and SD of job satisfaction
Variable Frequency Percent Mean SD
34.67 6.03 Low 13 5 Moderate 210 80.8 High 37 14.2
4.2.4 Distribution of level of organizational commitment
The overall mean of organizational commitment is 13.82 with SD of 2.49. The level
of organizational commitment is divided in to three levels, namely low, moderate
and high based on the scales. The result as a whole showed that majority of
academics (69.9%) practice moderate level of organizational commitment and
(22.7%) of academics have high level of organizational commitment. Few academics
(7.4%) practice low level of organizational commitment.
Table 4.6. Frequency, mean and SD of organizational commitment
Variable Frequency Percent Mean SD
13.82 2.49 Low 20 7.4 Moderate 182 69.9 High 58 22.7

126
4.2.5 Organizational culture profile
The mean scores of cultural alternatives (A=Clan, B=Adhocracy, C=Market,
D=Hierarchy) presented in Figure 4.1 is illustrated on a four-quadrant plot (Figure
3). Based on the descriptive analysis the result shows that hierarchy (M=4.59;
SD=0.76) is dominant organizational culture.
Figure 4.1. Organizational Culture Profile Plot
Note: A = Clan; B = Adhocracy; C = Market; D = Hierarchy
4.3 Assumption Check
Several assumptions for structural equation modeling were checked, including
missing values, multivariate normality, outliers, and multicollinearity.
Extern
al F
ocu
s an
d D
ifferentia
tion
Inte
rnal
Focu
s an
d I
nte
gra
tion
Flexibility and Discretion
Stability and Control
A B
D C

127
Missing Values
Data imputation was done by AMOS software, in order to treat missing values.
Imputation is a process of estimating missing value based on valid values of other
variables and/or cases in the sample. The purpose is to employ known relationships
identified in the valid values of the sample to assist in estimating the missing values.
In this study, maximum likelihood approach was done for missing data imputation.
Multivariate Normality
The assumption of normality was tested by examining the level of skewness and
kurtosis of the frequency or descriptive data of major variables (Byrne, 2010; Kline,
2005). Byrne (2010) following, West, Finch and Curran (1995) suggests a kurtosis
value equal or greater than 7 is indicative of early departure from normality.
Meanwhile a skewness value of less than 2 is acceptable (Kline, 2005). The level of
skewness and kurtosis were checked and they were within the acceptable range (See
Appendix B1).
Outliers
Mahalanobis distance ( ) measures the distance in standard deviation units between
a set of scores for one case and the sample mean (centroid). An outlier case has a
value that stands distinctively apart from all other values (Byrne, 2010).
Checking the level of significance
⁄ value exceeding 2.5 in small samples can
be considered as a possible outlier (Hair et al, 2010). The result showed that there is
not any outlier (See Appendix B2).

128
Multicollinearity
The assumption of multicollinearity was checked by examining correlation
coefficients, which describe the strength of the relationship between two latent
variables (Hair et al., 2006). Multicollinearity was observed between two predictors,
market and adhocracy culture. In order to solve the error of multicollinearity, two
variables were combined with variable.
Table 4.7. Multicollinearity
Latent construct Correlation coefficient
Structural Empowerment Clan culture .78
Structural Empowerment Adhocracy culture .75
Structural Empowerment Market culture .73
Structural Empowerment Hierarchy culture .78
Structural Empowerment Psychological Empowerment .77
Structural Empowerment Organizational Commitment .67
Structural Empowerment Job Satisfaction .60
Clan Culture Psychological Empowerment .70
Clan Culture Organizational Commitment .66
Clan Culture Job Satisfaction .58
Adhocracy Culture Psychological Empowerment .71
Adhocracy Culture Organizational Commitment .70
Adhocracy Culture Job Satisfaction .48
Market Culture Psychological Empowerment .64
Market Culture Organizational Commitment .49
Market Culture Job Satisfaction .36
Hierarchy Culture Psychological Empowerment .71
Hierarchy Culture Organizational Commitment .60
Hierarchy Culture Job Satisfaction .61
Psychological Empowerment Organizational Commitment .56

129
Latent construct Correlation coefficient
Psychological Empowerment Job Satisfaction .58
Organizational Commitment Job Satisfaction .71
Clan Culture Adhocracy Culture .78
Adhocracy Culture Market Culture .88
Market Culture Hierarchy Culture .72
Clan Culture Market Culture .76
Clan Culture Hierarchy Culture .78
Adhocracy Culture Hierarchy Culture .79
Multicollinearity was observed between two predictors, market and adhocracy
culture. In order to solve the error of multicollinearity, two variables were combined
with one variable and called adhocracy culture (see Table 4.8).
Table 4.8. Multicollinearity
Latent construct Correlation coefficient
Structural Empowerment Clan culture .74
Structural Empowerment Adhocracy culture .76
Structural Empowerment Hierarchy culture .79
Structural Empowerment Psychological Empowerment .73
Structural Empowerment Organizational Commitment .64
Structural Empowerment Job Satisfaction .48
Clan Culture Psychological Empowerment .70
Clan Culture Organizational Commitment .65
Clan Culture Job Satisfaction .47
Adhocracy Culture Psychological Empowerment .71
Adhocracy Culture Organizational Commitment .64
Adhocracy Culture Job Satisfaction .63
Hierarchy Culture Psychological Empowerment .74
Hierarchy Culture Organizational Commitment .62

130
Latent construct Correlation coefficient
Hierarchy Culture Job Satisfaction .61
Psychological Empowerment Organizational Commitment .58
Psychological Empowerment Job Satisfaction .50
Organizational Commitment Job Satisfaction .60
Clan Culture Adhocracy Culture .76
Clan Culture Hierarchy Culture .78
Adhocracy Culture Hierarchy Culture .78
For further analysis, the following section presents the results of confirmatory factor
analysis conducted to verify the construct validity of the scales used in this study.
4.4 Total Model: Evaluation of Measurement Model
The measurement model for this study contains baseline model and respecified
model.
4.4.1 Baseline Model
All factor loadings met the criteria ( >.5) and all observed indicators and first-order
constructs loaded significantly on their first-order constructs and second-order
constructs, respectively (p < .001). The results showed that model fit indices were
not consistent with a good model fit, and values were not acceptable (
).
4.4.2 Respecified Model
The result of the measurement model showed that the model fit was not achieved,
and therefore, item parceling was conducted in order to achieve the model fit. This
study employed a two-step procedure involving confirmatory factor analysis (CFA)
and structural equation modeling (Anderson & Gerbing, 1988). Given the small

131
sample size relative to the measurement items, we used item parcels rather than
individual items as manifest indicators of the latent constructs in order to maintain an
adequate sample-size-to-parameter ratio (Bentler & Chou, 1988; Bandalo, 2002;
Matsunaga, 2008).
Structural Empowerment
Structural empowerment was analyzed with six dimensions: three items of (Sa1, Sa2,
Sa3) summed up and parceled to opportunity observed variable; three items of (Sb1,
Sb2, Sb3) summed up and parceled to information observed variable three items of
(Sc1, Sc2, Sc3) summed up and parceled to support observed variables; three items
of (Sd1, Sd2, Sd3) related to resources dimension, summed up and parceled to
observed variables and resources. Three items of (Se1, Se2, and Se3) summed up and
parceled to observed variables, formal power; four items related to informal power
dimension, summed up and averaged to formal power observed variable. Generally
speaking, structural empowerment construct contained six observed variables:
opportunity, information, support, resources, formal power and informal power.
Organizational Culture
Clan culture with its six items (Ca1, Cb1, Cc1, Cd1, Ce1, Cf1) remained without
change in the model. Adhocracy and market culture were combined to reduce
multicollinearity and called adhocracy culture. In order to have better model fit, item
parceling was done on this construct. Twelve items of adhocracy culture (Cb2, Cd3,
Ca2); (Cd2, Cc3, Ce2); (Cf2, Cf3, Ce3) were summed up and parceled to three
observed variables: adhoc1, adhoc2 and adhoc3. Hierarchy culture with four items

132
(Cb4, Cc4, Ce4, and Cf4) remained with the model. Therefore, three constructs of
culture represent the organizational culture.
Psychological Empowerment
Psychological empowerment construct contains six dimensions. Homogenous item
parceling was done for each dimension. Ten items of decision making dimension
(EP1, EP7, EP13, EP20, EP26, EP31, EP34, EP36, EP39, and EP39) were summed
up and parceled to observe variable decision making. Six items of professional
growth (EP2, EP8, EP14, EP21, EP27, and EP32) were summed up and parceled to
professional growth observed variable. Four items of status (EP5, EP9, EP15, and
EP22) were summed up and parceled to observed variable: status.
In order to achieve a parcel for self-efficacy, five items (EP4, EP16, EP23, EP29,
EP33) were summed up and parceled to an observed variable, namely; self-efficacy.
Four items (EP5, EP11, EP17, EP24) of autonomy were summed up and parceled to
observed variable, autonomy. Impact dimension with four items (EP12, EP25, EP30,
EP37) was summed up and parceled to the observed variable, namely, impact.
Therefore, psychological empowerment construct contains six observed variables,
namely, decision making, professional growth, status, self-efficacy, autonomy, and
impact.
Job Satisfaction
Job satisfaction contains five observed variables, namely, pay, promotion, fringe
benefits, contingent rewards, and communication and remained without change in
the model.

133
Organizational Commitment
Organizational culture contains two dimensions of affective and normative
commitment. Six items (O3, O6, O8, O10, O12, O16) of affective commitment were
summed up and parceled to an observed variable, namely affective commitment.
Five items (O2, O5, O13, O15, O18) of normative commitment were summed up and
parceled to the observed variable, normative commitment. The conclusion is that
organizational commitment contains two observed variables namely, affective and
normative commitment.
4.4.3 Respecified model fit
Figure 4.2 shows a better model fit.
).

134
STRUCTURAL EMPOWERMENT
CLAN CULTURE
ADHOCRACY CULTURE
ORGANIZATIONAL COMMITMENT
PSYCHOLOGICALEMPOWERMENT
HIERARCHY CULTURE
OPPORTUNITY
INFORMATION
SUPPORT
RESOURCES
FORMAL POWER
INFORMAL POWER
e1
e2
e3
e4
e5
e6
CLAN ITEM1(Ca1)
CLAN ITEM2(Cb1)
CLAN ITEM3(Cc1)
CLAN ITEM4(Cd1)
CLANITEM 5(Ce1)
CLAN ITEM6(Cf1)
ADHOCRACY 1
ADHOCRACY 2
ADHOCRACY 3
HIERARCHY ITEM2(Cb4)
HIERARCHY ITEM3(Cc4)
HIERARCHY ITEM5(Ce4)
HIERARCHY ITEM6(Cf4)
DECISION MAKING
PROFESSIONAL GROWTH
STATUS
AUTONOMY
IMPACT
SELF-EFFICACY
AFFECTIVE COMMITMENT
NORMATIVE COMMITMENT
PAY
PROMOTION
FRINGE BENEFITS
COMMINUCATION
CONTIGENT REWARDS
JOB SATISFACTION
e7
e8
e9
e10
e11
e12
e16
e17
e18
e24
e25
e26
e27
e28
e29
e30
e31
e32
e33
e34
e35
e36
e37
e38
e39
e40
.67
.75
.84
.54
.79.82
.66
.85
.92
.86
.90
.81
.89
.90
.91
.79
.66
.59
.56
.83
.89
.75
.79
.72
.87
.73
.95
.52
.56
.58
.69
.69
.48
.65
.73
.79
.76
.74
.76
.79
.70
.65
.46
.78
.71
.65
.63
.74
.62
.51
.59
.50
.60
Figure 4.2. Measurement Model (respecified model)

135
4.5 Reliability
4.5.1 Composite reliability
Composite reliability measures the internal consistency of the latent construct (Kline,
2005; Hair et al., 2006). By internal consistency, a better estimate can be obtained
using the composite reliability formula.
Table 4.9. Composite reliability
Latent construct Composite reliability
Structural empowerment (.918)
Clan culture (.933)
Adhocracy culture (.950)
Hierarchy culture (.904)
Psychological empowerment (.927)
Job satisfaction (.846)
Organizational commitment (.850)
According to Hair, Black, Babin, Anderson & Tatham (2006), CR equal to or more
than .7 has adequate composite reliability. Therefore, as a rule of thumb, all five
latent variables have adequate composite reliability (Table 4.9).
4.6 Validity
4.6.1 Convergent validity
Convergent validity measured by average variance is extracted. A high AVE (greater
than .5) shows that the latent variables have high convergent validity (Fornell &
Larcker, 1981). According to Hair, Black, Babin, Anderson & Tatham, (2006), AVE
equal to or more than .5 has adequate convergent validity. Therefore, as a rule of
thumb, all five latent variables have adequate convergence (Table 4.10).

136
Table 4.10. Convergent validity
Latent construct Average variance extracted Structural empowerment (.65)
Clan culture (.70)
Adhocracy culture (.63)
Hierarchy culture (.70)
Psychological empowerment (.68)
Job satisfaction (.52)
Organizational commitment (.74)
4.6.2 Discriminant validity
Discriminant validity is determined by examining whether the AVE for each
construct is greater than the squared correlations (shared variance) between the
construct and all other constructs in the model (Fornell & Larcker, 1981; Hair et al.,
2006; Farrell, 2010).
Table 4.11. Estimation of squared correlation
Latent construct Estimate Squared correlation
SE clan .74 .54
SE PE .73 .53
SE COM .65 .42
SE JS .48 .23
clan PE .70 .49
clan COM .64 .41
clan JS .46 .21
PE COM .58 .34
PE JS .50 .25
COM JS .60 .36
Clan adhocracy .76 .58
adhocracy hierarchy .78 .61
PE hierarchy .74 .54

137
Latent construct Estimate Squared correlation
PE adhocracy .71 .50
Clan hierarchy .78 .60
SE adhocracy .76 .57
SE hierarchy .79 .62
JS adhocracy .63 .39
COM adhocracy .64 .40
JS hierarchy .51 .26
COM hierarchy .62 .38
Based on rule of thumb, AVE for each construct must be bigger than the shared
variance of other constructs. AVE for structural empowerment (.65) is bigger than
shared variance of structural empowerment with clan culture (.54), adhocracy culture
(.57), hierarchy culture (.62), psychological empowerment (.53), job satisfaction
(.36), and organizational commitment (.44). AVE for Clan culture (.70) is bigger
than shared variance of clan culture with structural empowerment (.54), adhocracy
(.58), hierarchy (.60), psychological empowerment (.49), job satisfaction (.33), and
organizational commitment (.43).
Table 4.12. Discriminate validity
Latent construct SE CL AD HI PE JS COM
Structural empowerment (.65) .54 .57 .62 .53 .36 .44
Clan culture .74 (.70) .58 .60 .49 .33 .43
Adhocracy culture .76 .76 (.63) .61 .50 .39 .40
Hierarchy culture .79 .78 .78 (.70) .54 .26 .38
Psychological empowerment .73 .70 .71 .74 (.68) .33 .31
Job satisfaction .60 .58 .63 .51 .58 (.52) .50
Organizational commitment .67 .66 .64 .62 .56 .71 (.74)
Based on rule of thumb, AVE for each construct must be bigger than the shared
variance of other constructs. AVE for structural empowerment (.65) is bigger than

138
shared variance of structural empowerment with clan culture (.54), adhocracy culture
(.57), hierarchy culture (.62), psychological empowerment (.53), job satisfaction
(.36), and organizational commitment (.44). AVE for Clan culture (.70) is bigger
than shared variance of clan culture with structural empowerment (.54), adhocracy
(.58), hierarchy (.60), psychological empowerment (.49), job satisfaction (.33), and
organizational commitment (.43).
AVE for adhocracy culture (.63) is bigger than the shared variance of adhocracy
culture with structural empowerment (.57), clan culture (.58), hierarchy culture (.61),
psychological empowerment (.50), job satisfaction (.39), and organizational
commitment (.40). AVE for hierarchy culture (.70) is bigger than the shared variance
of hierarchy culture with structural empowerment (.62), clan culture (.60), adhocracy
culture (.61), psychological empowerment (.54), job satisfaction (.26), and
organizational commitment (.38).
AVE for psychological empowerment (.68) is bigger than shared variance of
psychological empowerment with structural empowerment (.53), clan culture (.54),
adhocracy culture (.50), hierarchy culture (.54), job satisfaction (.33), and
organizational commitment (.31). AVE for job satisfaction (.52) is bigger than shared
variance of job satisfaction with structural empowerment (.36), clan culture (.33),
adhocracy culture (.39), hierarchy culture (.26), psychological empowerment (.33),
and organizational commitment (.50).
AVE for organizational commitment (.74) is bigger than shared variance of
organizational commitment with structural empowerment (.44), clan culture (.43),
adhocracy culture (.40), hierarchy culture (.38), psychological empowerment(.31),

139
and job satisfaction (.50).Therefore, there is adequate discriminate validity for the
constructs in the model (see Table 4.12).
4.7 Structural Model
Base line model
The results in Figure 4.2 show a better model fit.
).
Path coefficient
After examining the model fit, the path coefficient was examined to determine the
relationship between exogenous variable and endogenous variables. The causal paths
can be evaluated in terms of statistical significance and strength, using standardized
path coefficient that ranges between -1 and +1. Based on of .05, the test statistics
generated from output should be greater than to indicate that the null
hypothesis can be rejected. The rejection of the null hypothesis means that the
structural coefficient is not zero (Bentler, 2002; Byrne, 1994). After reviewing the
statistical significance of the standardized paths, the strength of relationships among
the variables can be reviewed. According to Chin (1998), standardized paths should
be at least .20 in order to be considered meaningful for discussion.
4.7.1 Direct model
The results in Figure 4.9 show a better model fit.
) (see Appendix D6)

140
Table 4.12. Path coefficient of direct model (base line model)
Hypothesis Causal path Standardized
path coefficient
Organizational commitment Structural empowerment
Job satisfaction Structural empowerment
Organizational commitment Clan culture
Organizational commitment Adhocracy culture .168
Organizational commitment Hierarchy culture -
Job satisfaction Clan culture
Job satisfaction Adhocracy culture .243
Job satisfaction Hierarchy culture -.143
Psychological empowerment Structural empowerment .736***
Psychological empowerment Clan culture .370**
Psychological empowerment Adhocracy culture .115
Psychological empowerment Hierarchy culture -.058
The probability of getting a critical ratio as large as 3.368 in absolute value is .001.
In other words, the regression weight for structural empowerment in the prediction of
organizational commitment is significantly different from zero at .001 level. When
structural empowerment goes up by 1 standard deviation, organizational commitment
goes up by .474 standard deviation (β = .476; p < .001). The conclusion, therefore, is
that structural empowerment contributes significantly towards organizational
commitment at .001 level.
The probability of getting a critical ratio as large as 5.887 in absolute value is .001.
In other words, the regression weight for structural empowerment in the prediction of
job satisfaction is significantly different from zero at .001 level. When structural

141
empowerment goes up by 1 standard deviation, job satisfaction goes up by 0.565
standard deviation (β = .565; p < .001). The conclusion, therefore, is that structural
empowerment contributes significantly towards job satisfaction at .001 level of
significance.
The probability of getting a critical ratio as large as 4.347 in absolute value is .008.
In other words, the regression weight for clan culture in the prediction of
organizational commitment is significantly different from zero at .01 level. When
clan culture goes up by 1 standard deviation, organizational commitment goes up by
.513 standard deviation (β = .513; p < .01). Therefore, the conclusion is that clan
culture contributes significantly towards job satisfaction at 01 level of significance.
The probability of getting a critical ratio as large as .976 in absolute value is .329. In
other words, the regression weight for adhocracy culture in the prediction of
organizational commitment is not significantly different from zero at .05 level. When
adhocracy culture goes up by 1 standard deviation, organizational commitment goes
up by .168 standard deviation (β = .168; p=.329). The conclusion, therefore, is that
adhocracy culture does not contribute significantly towards organizational
commitment at .05 level of significance.
The probability of getting a critical ratio as large as 2.085 in absolute value is .67. In
other words, the regression weight for hierarchy culture in the prediction of
organizational commitment is not significantly different from zero at .05 level. When
hierarchy culture goes up by 1 standard deviation, organizational commitment goes
up by -.197 standard deviation (β = -.197; p=.67). Therefore, the conclusion is that
adhocracy culture does not contribute significantly towards organizational
commitment at .05 level of significance.

142
The probability of getting a critical ratio as large as 2.411 in absolute value is .048.
In other words, the regression weight for clan culture in the prediction of job
satisfaction is significantly different from zero at .05 level. When clan culture goes
up by 1 standard deviation, job satisfaction goes up by .318 standard deviation (β =
.318; p < .05. Therefore, the conclusion is that clan culture contributes significantly
towards job satisfaction at .05 level of significance.
The probability of getting a critical ratio as large as 1.958 in absolute value is .056.
In other words, the regression weight for adhocracy culture in the prediction of job
satisfaction is not significantly different from zero at .05 level. When clan culture
goes up by 1 standard deviation, job satisfaction goes up by .243 standard deviation
(β = .243; p=.056). Therefore, the conclusion is that adhocracy culture does not
contribute significantly towards job satisfaction at .05 level of significance.
The probability of getting a critical ratio as large as 0.717 in absolute value is .475.
In other words, the regression weight for hierarchy culture in the prediction of job
satisfaction is not significantly different from zero at .05 level. When hierarchy
culture goes up by 1 standard deviation, job satisfaction goes up by _.143 standard
deviation (β = -.143; p=.475). Therefore, the conclusion is that hierarchy culture does
not contribute significantly towards job satisfaction at .05 level of significance.
The probability of getting a critical ratio as large as 6.601 in absolute value is .001.
In other words, the regression weight for structural empowerment in the prediction of
psychological empowerment is significantly different from zero at .001 level. When
structural empowerment goes up by 1 standard deviation, psychological
empowerment goes up by .736 standard deviation (β = .736; p < .001). Therefore, the

143
conclusion is that structural empowerment contributes significantly towards
psychological empowerment at .001 level of significance.
The probability of getting a critical ratio as large as 3.286 in absolute value is .007.
In other words, the regression weight for clan culture in the prediction of
psychological empowerment is significantly different from zero at .01 level. When
clan culture goes up by 1 standard deviation, psychological empowerment goes up by
.370 standard deviation (β = .370; p < .01). Therefore, the conclusion is that clan
culture contributes significantly towards psychological empowerment at .01 level of
significance.
The probability of getting a critical ratio as large as 1.237 in absolute value is .312.
In other words, the regression weight for adhocracy culture in the prediction of
psychological empowerment is not significantly different from zero at .05 level.
When adhocracy culture goes up by 1 standard deviation, psychological
empowerment goes up by .115 standard deviation (β = .115; p=.312). Therefore, the
conclusion is that adhocracy culture does not contribute significantly towards
psychological empowerment at .05 level of significance.
The probability of getting a critical ratio as large as 0.529 in absolute value is .597.
In other words, the regression weight for hierarchy culture in the prediction of
psychological empowerment is not significantly different from zero at .05 level.
When hierarchy culture goes up by 1 standard deviation, psychological
empowerment goes up by -.058 standard deviation (β = -.058; p=.597). Therefore,
the conclusion is that hierarchy culture does not contribute significantly towards
psychological empowerment at .05 level of significance.
144
The result of examining hypothesis one to 12 shows that six path coefficients of
twelve hypothesized relationships were statistically significant ( < .05) in the
structural model. There is a significant relationship between structural empowerment
and organizational commitment (hypothesis 1), as well as significant relationship
between structural empowerment and job satisfaction (hypothesis 2). In addition,
there is a significant relationship between clan culture and organizational
commitment (hypothesis 3), clan culture and job satisfaction (hypothesis 6) and also
clan culture and psychological empowerment (hypothesis 9).
In addition, the result shows a significant relationship between structural
empowerment and psychological empowerment (hypothesis 10). On the other hand,
the results show that there is no significant relationship between adhocracy culture
and psychological empowerment, job satisfaction and organizational commitment. In
addition, the results show that the relationship between hierarchy culture and
psychological empowerment is not significant.
Also, there is no significant relationship of hierarchy culture on job satisfaction and
organizational commitment. Thus, the results of the structural model in this study do
not support the research hypothesis that adhocracy culture positively affects
psychological empowerment, job satisfaction and organizational commitment
(hypotheses 4, 7, 11) and that hierarchy culture positively affects psychological
empowerment, job satisfaction and organizational commitment (hypotheses 5, 8, 12)
(see Table 4. 12).
The results of structural model also, showed that predictors (structural
empowerment, clan culture, adhocracy culture, and hierarchy culture) of
organizational commitment explained 79 percent of its variance =.79). Also,

145
these predicators (structural empowerment, clan culture, adhocracy culture, and
hierarchy culture) were explained 45 percent of job satisfaction variance =.45)
(Figure 4.3).
While the path coefficients are not significant for hypotheses 4, 5, 7, 11, and 12, the
present study removed the path from construct of adhocracy culture to the constructs
of psychological empowerment, job satisfaction and organizational commitment, as
well as the path from construct of hierarchy culture to the constructs of psychological
empowerment, job satisfaction and organizational commitment. To avoid
complexity, two constructs of adhocracy culture and hierarchy culture were removed
from the structural model.

146
STRUCTURAL EMPOWERMENT
CLAN CULTURE
HIERARCHY CULTURE
ADHOCRACY CULTURE
PSYCHOLOGICAL EMPOWERMENT
ORGANIZATIONAL COMMITMENT
JOB SATISFACTION
OPPORTUNITY
INFORMATION
SUPPORT
RESOURCES
INFORMAL POWER
FORMAL POWER
CLAN ITEM1(Ca1)
CLAN ITEM2(Cb1)
CLAN ITEM3(Cc1)
CLAN ITEM4(Cd1)
CLAN ITEM5(Ce1)
CLAN ITEM6(Cf1)
ADHOCRACY 1
ADHOCRACY 2
ADHOCRACY 3
HIERARCHY ITEM2(Cb4)
HIERARCHY ITEM3(Cc4)
HIERARCHY ITEM5(Ce4)
HIERARCHY ITEM6(Cf4)
STATUS IMPACTAUTONOMYSELF-EFFICACYPROFESSIONAL GROWTHDECISION MAKING
AFFECTIVE COMMITMENT
NORMATIVE COMMITMENT
PAY
PROMOTION
FRINGE BENEFITS
COMMINUCATION
CONTIGENT REWARDS
e19
e18
e17
e16
e13
e14
e15
e7
e8
e9
e10
e11
e12
e1
e2
e3
e4
e5
e6
e20 e21 e22 e23 e24 e25
e32
e31
e30
e29
e28
e26
e27.76
.78
.52
.82
.79
.78
.65
.84
.89
.85
.87
.80
.90
.91
.89
.79
.70
.58
.60
.86 .88.82 .77
.70 .86
.58
.56
.52
.64
.67
.70
.97
.48
.56
.79
.51
.17
-.20
.32
.24
-.14
.74.37
.12
-.06
.00
.00
.76
.76
.78
.76
.78
RES2
RES3
RES1
.79
.45
.00
Figure 4.3. Structural Model (base line model)

147
4.7.2 Respecified model
Direct model
The probability of getting a critical ratio as large as 2.807 in absolute value is .005.
In other words, the regression weight for structural empowerment is in the prediction
of organizational commitment is significantly different from zero at .01 level. When
structural empowerment goes up by 1 standard deviation, organizational commitment
goes up by .372 standard deviations (β =.372; p < .01). The result concludes that
structural empowerment contributes significantly towards organizational
commitment at .01 levels of significance.
The probability of getting a critical ratio as large as 3.25 in absolute value is .001. In
other words, the regression weight for structural empowerment is in the prediction of
job satisfaction is significantly different from zero at .001 level. When structural
empowerment goes up by 1 standard deviation, job satisfaction goes up by .359
standard deviations. (β = .359; p < .001). The result concludes that structural
empowerment contributes significantly towards job satisfaction at .001 level of
significance.
The probability of getting a critical ratio as large as 2.064 in absolute value is .039.
In other words, the regression weight for clan culture is in the prediction of job
satisfaction is significantly different from zero at .05 level. When clan culture goes
up by 1 standard deviation, job satisfaction goes up by .217 standard deviation (β =
.217; p < .05). Therefore, the conclusion is that clan culture contributes significantly
towards job satisfaction at .05 level of significance.

148
The probability of getting a critical ratio as large as 2.681 in absolute value is .007.
In other words, the regression weight for clan culture in the prediction of
organizational commitment is significantly different from zero at .01 level. When
clan culture goes up by 1 standard deviation, organizational commitment goes up by
.345 standard deviation (β = .345; p < .01). The result concludes that clan culture
contributes significantly towards organizational commitment at .01 level of
significance.
The probability of getting a critical ratio as large as 5.735 in absolute value is less
than .001. In other words, the regression weight for structural empowerment in the
prediction of psychological empowerment is significantly different from zero at .001
levels. When structural empowerment goes up by 1 standard deviation, psychological
empowerment goes up by .698 standard deviation (β = .698; p < .001). Therefore, the
conclusion is that structural empowerment contributes significantly towards
psychological empowerment at .001 level of significance.
The probability of getting a critical ratio as large as 2.008 in absolute value is less
than .043. In other words, the regression weight for clan culture in the prediction of
psychological empowerment is significantly different from zero at 0.05 levels. When
clan culture goes up by 1 standard deviation, psychological empowerment goes up by
.310 standard deviation (β = .310; p < .05). Therefore, the conclusion is that clan
culture contributes significantly towards psychological empowerment at .05 level of
significance (see Table 4.13).
The results of structural model showed that structural empowerment and clan culture
were explained 47 percent of variance in organizational commitment variable

149
=.47). Also, these predicators (structural empowerment and clan culture) were
explained 305 percent of job satisfaction variance =.30) (Figure 4.4).
Table 4.13. Path coefficients of direct model (respecified model)
Hypothesis Causal path Standardized
path coefficient
Organizational commitment Structural
empowerment
Job satisfaction Structural empowerment
Organizational commitment Clan culture
Job satisfaction Clan culture
Psychological empowerment Structural
empowerment
Psychological empowerment Clan culture

150
STRUCTURAL EMPOWERMENT
CLAN CULTURE
PSYCHOLOGICAL EMPOWERMENT
ORGANIZATIONAL COMMITMENT
JOB SATISFACTION
OPPORTUNITY
INFORMATION
SUPPORT
RESOURCES
INFORMAL POWER
FORMAL POWER
CLAN ITEM1(Ca1)
CLAN ITEM2(Cb1)
CLAN ITEM3(Cc1)
CLAN ITEM4(Cd1)
CLAN ITEM5(Ce1)
CLAN ITEM6(Cf1)
STATUS IMPACTAUTONOMYSELF-EFFICACYPROFESSIONAL GROWTHDECISION MAKING
AFFECTIVE COMMITMENT
NORMATIVE COMMITMENT
PAY
PROMOTION
FRINGE BENEFITS
COMMINUCATION
CONTIGENT REWARDS
e7
e8
e9
e10
e11
e12
e1
e2
e3
e4
e5
e6
e20 e21 e22 e23 e24 e25
e32
e31
e30
e29
e28
e26
e27
.79
.81
.55
.83
.77
.67
.66
.84
.94
.86
.88
.80
.88 .83.72 .82
.73 .89
54
.60
.58
.70
.72
.70
.97
.00
.00
RES2
RES3
RES1
.37
.76
.31
.22.70
.36
.35
.47
.30
.00
Figure 4.4. Structural Model (respecified model)

151
4.7.3 Partial Mediated Model
Examining the model fit showed the model fit in fit indices (
) (see Appendix E3).
Examining the path coefficient to determine the relationship between exogenous
variables and endogenous variables showed that the probability of getting a critical
ratio as large as 5.061 in absolute value is less than .001. In other words, the
regression weight for structural empowerment in the prediction of psychological
empowerment is significantly different from zero at the .001 level. The estimate of
standardized regression weight showed that when structural empowerment goes up
by 1 standard deviation, psychological empowerment goes up by .68 standard
deviation (β = .680; p < .001). Therefore, the conclusion is that structural
empowerment contributes significantly towards psychological empowerment at .001
level of significance.
The results showed that the probability of getting a critical ratio as large as 2.305 in
absolute value is .28. In other words, the regression weight for clan culture in the
prediction of psychological empowerment is significantly different from zero at the
.05 level. Estimate of standardized regression weight showed that when clan culture
goes up by 1 standard deviation, psychological empowerment goes up by .227
standard deviation (β = .227; p < .05). Therefore, the conclusion is that clan culture
contributes significantly towards psychological empowerment at .05 level of
significance.

152
STRUCTURAL EMPOWERMENT
CLAN CULTURE
PSYCHOLOGICAL EMPOWERMENT
ORGANIZATIONAL COMMITMENT
JOB SATISFACTION
OPPORTUNITY
INFORMATION
SUPPORT
RESOURCES
INFORMAL POWER
FORMAL POWER
CLAN ITEM1(Ca1)
CLAN ITEM2(Cb1)
CLAN ITEM3(Cc1)
CLAN ITEM4(Cd1)
CLAN ITEM5(Ce1)
CLAN ITEM6(Cf1)
STATUS IMPACTAUTONOMYSELF-EFFICACYPROFESSIONAL GROWTHDECISION MAKING
AFFECTIVE COMMITMENT
NORMATIVE COMMITMENT
PAY
PROMOTION
FRINGE BENEFITS
COMMINUCATION
CONTIGENT REWARDS
e7
e8
e9
e10
e11
e12
e1
e2
e3
e4
e5
e6
e20 e21 e22 e23 e24 e25
e32
e31
e30
e29
e28
e26
e27
70
77
.69
.55
.80
.80
.84
.94
.88
.67
.87
.79
.83 .90.81 .76
.69 .82
.77
.58
.51
.50
.52
.71
.94
.43
.28
RES2
RES3
RES1
.25
.75
.23
.20.68
.26
.21
.52
.59
.63
Figure 4.5. Structural Model (partial mediated model)

153
The results showed that the probability of getting a critical ratio as large as 5.077 in
absolute value is .001. In other words, the regression weight for psychological
empowerment in the prediction of job satisfaction is significantly different from zero
at the .001 level. The estimate of standardized regression weight showed that when
psychological empowerment goes up by 1 standard deviation, job satisfaction goes
up by .43 standard deviation (β = .43; p < .001). Therefore, the conclusion is that
psychological empowerment contributes significantly towards job satisfaction at
.001 level of significance.
The results showed that the probability of getting a critical ratio as large as 1.885 in
absolute value is less than .049. In other words, the regression weight for
psychological empowerment in the prediction of organizational commitment is
significantly different from zero at the .05 level. The estimate of standardized
regression weight showed that when psychological empowerment goes up by 1
standard deviation, organizational commitment goes up by .28 standard deviation (β
= .280; p < .05). Therefore, the conclusion is that psychological empowerment
contributes significantly towards organizational commitment at .05 level of
significance.
The results showed that the probability of getting a critical ratio as large as 2.124 in
absolute value is less than .004. In other words, the regression weight for clan culture
in the prediction of organizational commitment is significantly different from zero at
the .01 level. The estimate of standardized regression weight showed that when clan
culture goes up by 1 standard deviation organizational commitment goes up by .263
standard deviation (β = .263; p < .01). Therefore, the conclusion is that clan culture

154
contributes significantly towards organizational commitment at .01 level of
significance.
The results showed that the probability of getting a critical ratio as large as 1.869 in
absolute value is less than .037. In other words, the regression weight for structural
empowerment in the prediction of organizational commitment is significantly
different from zero at the .05 level. The estimate of standardized regression weight
showed that when organizational culture goes up by 1 standard deviation
organizational commitment goes up by .245 standard deviation (β = .245; p < .05).
Therefore, the conclusion is that structural empowerment contributes significantly
towards organizational commitment at .05 level of significance.
The results showed that the probability of getting a critical ratio as large as 2.498 in
absolute value is .26. In other words, the regression weight for structural
empowerment in the prediction of job satisfaction is significantly different from zero
at the .05 level. The estimate of standardized regression weight showed that when
structural empowerment goes up by 1 standard deviation, job satisfaction goes up by
.212 standard deviation (β = .212; p < .05). Therefore, the conclusion is that
structural empowerment contributes significantly towards job satisfaction at .001
level of significance.
The results showed that the probability of getting a critical ratio as large as 1.173 in
absolute value is .51. In other words, the regression weight for clan culture in the
prediction of job satisfaction is significantly different from zero at the .05 level. The
estimate of standardized regression weight showed that when clan culture goes up by
1 standard deviation, job satisfaction goes up by .201 standard deviation (β = .201; p

155
< .05). Therefore, the conclusion is that clan culture contributes significantly towards
job satisfaction at .001 level of significance (see Table 4.14).
The results of partial mediated model showed that structural empowerment and clan
culture were explained 63 percent of variance in psychological empowerment
variable =.63). Also, structural empowerment and clan culture were explained 52
percent of organizational commitment variance =.52). These variables (structural
empowerment and clan culture) were explained 59 percent of variance in job
satisfaction =.59) (Figure 4.6).
Table 4.14. Standardized indirect effect
Hypothesis Causal path Path
coefficient
Psychological empowerment Structural empowerment
Psychological empowerment Clan culture
Job satisfaction Psychological empowerment
Organizational commitment Psychological empowerment
Job satisfaction Clan Culture
Organizational commitment Clan culture
Organizational commitment Structural empowerment
Job satisfaction Structural empowerment

156
4.7.4 Full Mediated Model
Examining the model fit showed the model fit in fit indices (
). The results showed
that the probability of getting a critical ratio as large as 5.642 in absolute value is less
than .001. In other words, the regression weight for structural empowerment in the
prediction of psychological empowerment is significantly different from zero at the
.001 level. The estimate of standardized regression weight showed that when
structural empowerment goes up by 1 standard deviation, psychological
empowerment goes up by .657 standard deviation (β = .657; p < .001). Therefore,
the conclusion is that structural empowerment contributes significantly towards
psychological empowerment at .001 level of significance.
The results showed that the probability of getting a critical ratio as large as 1.784 in
absolute value is less than .044. In other words, the regression weight for clan culture
in the prediction of psychological empowerment is significantly different from zero
at the .05 level. The estimate of standardized regression weight showed that when
clan culture goes up by 1 standard deviation, psychological empowerment goes up
by .314 standard deviation (β = .314; p < .05). Therefore, the conclusion is that clan
culture contributes significantly towards psychological empowerment at .05 level of
significance.
The results showed that the probability of getting a critical ratio as large as 8.963 in
absolute value is less than .001. In other words, the regression weight for
psychological empowerment in the prediction of job satisfaction is significantly
different from zero at the .001 level.

157
STRUCTURAL EMPOWERMENT
CLAN CULTURE
PSYCHOLOGICAL EMPOWERMENT
ORGANIZATIONAL COMMITMENT
JOB SATISFACTION
OPPORTUNITY
INFORMATION
SUPPORT
RESOURCES
INFORMAL POWER
FORMAL POWER
CLAN ITEM1(Ca1)
CLAN ITEM2(Cb1)
CLAN ITEM3(Cc1)
CLAN ITEM4(Cd1)
CLAN ITEM5(Ce1)
CLAN ITEM6(Cf1)
STATUS IMPACTAUTONOMYSELF-EFFICACYPROFESSIONAL GROWTHDECISION MAKING
AFFECTIVE COMMITMENT
NORMATIVE COMMITMENT
PAY
PROMOTION
FRINGE BENEFITS
COMMINUCATION
CONTIGENT REWARDS
e7
e8
e9
e10
e11
e12
e1
e2
e3
e4
e5
e6
e20 e21 e22 e23 e24 e25
e32
e31
e30
e29
e28
e26
e27
.59
.70
.83
.54
.80
.81
.67
.84
.94
.88
.89
.80
.80 .90.78 .74
.68 .81
.77
.58
.51
.50
.52
.73
.91
.54
.62
RES2
RES3
RES1
.00
.73
.32
.00.66
.00
.00
.49
.61
.67
Figure 4.6. Structural Model (full mediated model)

158
The estimate of standardized regression weight showed that when psychological
empowerment goes up by 1 standard deviation, job satisfaction goes up by 0.536
standard deviation (β = .536; p < .001). The result concludes that psychological
empowerment contributes significantly towards job satisfaction at .001 level of
significance. The results showed that the probability of getting a critical ratio as large
as 7.857 in absolute value is less than .001. In other words, the regression weight for
psychological empowerment in the prediction of organizational commitment is
significantly different from zero at the .001 level. The estimate of standardized
regression weight showed that when psychological empowerment goes up by 1
standard deviation, organizational commitment goes up by .623 standard deviation (β
= .623; p < .001). The result concludes that psychological empowerment contributes
significantly towards organizational commitment at .001 level of significance.
Direct, indirect and total effects of all bivariate pairs in the mediation path showed in
Table 4.15.
Table 4.15. Direct, indirect and total effects of latent exogenous variables on job
satisfaction and organizational commitment
Path Direc
t
Effec
t
Indirect
Effect
Total Effect
Structural empo → Org commitment .372 .68 × .28 =
.190
.372 + .190 = .562
Structural empo→ Job Satisfaction .359 .68 × .43 =
.292
.359 + .292 = .651
Structural Empo→ Psychological
Empo
.698 .000 .698 + .000 = .698
Clan culture → Org commitment .345 .23 × .28 = .345 + .064 = .409

159
.064
Clan culture→ Job satisfaction .217 .23 × .43 =
.098
.217 + .098 = .315
Clan culture → Psychological Empo .310 .000 .310 + .000 = .310
Psychological Empo→ Job
satisfaction
.430 .000 .430 + .000 = .430
Psychological Empo→ Org
commitment
.280 .000 .280 + .000 = .280
The results of full mediated model showed that structural empowerment and clan
culture were explained 67 percent of variance in psychological empowerment
variable =.67). Also, structural empowerment and clan culture were explained 49
percent of organizational commitment variance =.49). These variables (structural
empowerment and clan culture) were explained 61 percent of variance in job
satisfaction =.61) (Figure 4.6). Direct, indirect and total effects of all bivariate
pairs in the mediation path
4.8 Mediation role of psychological empowerment
1. Mediation effect of psychological empowerment in the relationship
between structural empowerment and organizational commitment
Based on Baron and Kenny (1986) approach, structural empowerment as the
independent variable has positive significant effect on psychological empowerment
as the mediator variable (β = .698; p < .001). Second, structural empowerment has
positively significant effect on organizational commitment as the dependent variable
(β = .372; p < .001). Third, psychological empowerment as the mediator has
160
significant and positive effect on organizational commitment as the dependent
variable (β = .280; p < .05). Based on Baron and Kenny (1986) approach, if the
effects of independent variable on dependent variable disappear after mediator
controlled, it is called complete mediation. Partial mediation is the case that the path
from independent variable to dependent variable is reduced but is still significant
when mediator is introduced. So based on this criteria, the effect of structural
empowerment (independent variable) on organizational commitment (dependent
variable) is reduced (β = .245; p < .05); but is still significant after introducing
psychological empowerment (mediator variable). The result shows that
psychological empowerment partially mediated the relationship between structural
empowerment and organizational commitment.
2. Mediation effect of psychological empowerment in the relationship
between clan culture and job satisfaction
Based on Baron and Kenny (1986) approach, clan culture as the independent
variable has positive significant effect on psychological empowerment as the
mediator variable (β = .310; p < .05). Second, clan culture has positively significant
effect on job satisfaction as the dependent variable (β = .217; p < .05). Third,
psychological empowerment as the mediator has significant and positive effect on
job satisfaction as the dependent variable (β = .430; p < .05). Based on Baron and
Kenny (1986) approach, if the effects of independent variable on dependent variable
disappear after mediator controlled, it is called complete mediation. Partial mediation
is the case that the path from independent variable to dependent variable is reduced
but is still significant when mediator is introduced. So based on this criteria, the
effect of clan culture (independent variable) on job satisfaction (dependent variable)
is reduced (β = .201; p < .05); but is still significant after introducing psychological
empowerment (mediator variable). The result shows that psychological
161
empowerment partially mediated the relationship between clan culture and job
satisfaction.
3. Mediation effect of psychological empowerment in the relationship
between clan culture and organizational commitment
Based on Baron and Kenny (1986) approach, clan culture as the independent
variable has positive significant effect on psychological empowerment as the
mediator variable (β = .310; p < .05). Second, clan culture has positively significant
effect on organizational commitment as the dependent variable (β = .345; p < .001).
Third, psychological empowerment as the mediator has significant and positive
effect on organizational commitment as the dependent variable (β = .280; p < .05).
Based on Baron and Kenny (1986) approach, if the effects of independent variable
on dependent variable disappear after mediator controlled, it is called complete
mediation. Partial mediation is the case that the path from independent variable to
dependent variable is reduced but is still significant when mediator is introduced. So
based on this criteria, the effect of clan culture (independent variable) on
organizational commitment (dependent variable) is reduced (β = .263; p < .05); but is
still significant after introducing psychological empowerment (mediator variable).
The result shows that psychological empowerment partially mediated the relationship
between clan culture and organizational commitment.
4. Mediation effect of psychological empowerment in the relationship
between structural empowerment and job satisfaction
Based on Baron and Kenny (1986) approach, structural empowerment as the
independent variable has positive significant effect on psychological empowerment
as the mediator variable (β = .698; p < .001). Second, structural empowerment has
positively significant effect on job satisfaction as the dependent variable (β = .359; p

162
< .001). Third, psychological empowerment as the mediator has significant and
positive effect on job satisfaction as the dependent variable (β = .430; p < .001).
Based on Baron and Kenny (1986) approach, if the effects of independent variable
on dependent variable disappear after mediator controlled, it is called complete
mediation. Partial mediation is the case that the path from independent variable to
dependent variable is reduced but is still significant when mediator is introduced. So
based on this criteria, the effect of structural empowerment (independent variable) on
job satisfaction (dependent variable) is reduced (β = .212; p < .05); but is still
significant after introducing psychological empowerment (mediator variable). The
result shows that psychological empowerment partially mediated the relationship
between structural empowerment and job satisfaction.
4.9 Nested model comparison
In order to choose from among two partial mediated and full mediated models,
nested model comparisons were used. This suggests the most commonly used
method for comparing the fit of two nested models. Test the null hypothesis of no
significant difference in fit by evaluating whether the chi-square difference is
significant, for the given degrees of freedom and a chosen significance level. If the
difference is significant, then the null hypothesis is rejected.
Table 4.16. Nested model comparisons
Model DF CMIN P NFI
Delta-1
IFI
Delta-2
RFI
rho-1
TLI
rho-
o2
Full mediated
effect
4 48.609 .000 .010 .011 .009 .010
Table 4.16 shows chi-square difference of 36.211 with DF=4, and the statistic of
significance is significant indicating that the partial mediated model represent a
better model fit than the full mediated model.

163
4.10 Bootstrapping
The study want to test whether an indirect effect exist
In relationship between structural empowerment and organizational
commitment through psychological empowerment
In relationship between structural empowerment and job satisfaction through
psychological empowerment
In relationship between organizational culture and organizational
commitment through psychological empowerment
In relationship between organizational culture and job satisfaction through
psychological empowerment
Checking the results of standardized indirect effect revealed that the estimated
indirect effect of structural empowerment on job satisfaction is .360. This is due to
the indirect (partial mediated) effect of structural empowerment on job satisfaction,
when structural empowerment goes up by 1 standard deviation, job satisfaction goes
up by .360 standard deviation. This is in addition to any direct effect that structural
empowerment may have on job satisfaction.
The estimated indirect effect of structural empowerment on organizational
commitment is .190. This is due to the indirect ( partial mediated) effect of structural
empowerment on organizational commitment, when structural empowerment goes up
by 1 standard deviation, organizational commitment goes up by .190 standard
deviation. This is in addition to any direct effect that structural empowerment may
have on organizational commitment.
The estimated indirect effect of clan culture on job satisfaction is .170. This is due to
the indirect (partial mediated) effect of clan culture on job satisfaction. When clan

164
culture goes up by 1 standard deviation, job satisfaction goes up by .17 standard
deviation. This is in addition to any direct effect that clan culture may have on job
satisfaction.
The estimated indirect effect of clan culture on organizational commitment is .163.
This is due to the indirect (partial mediated) effect clan culture on organizational
commitment, when clan culture goes up by 1 standard deviation, organizational
commitment goes up by .163 standard deviation. This is in addition to any direct
effect that clan culture may have on organizational commitment.
4.11 Significance of Standardized Indirect Effect
Bootstrap standard error results are shown below. The results show that the standard
error for the indirect estimate of structural empowerment on job satisfaction is at
.136 while the standard error for the indirect estimate of structural empowerment on
organizational commitment is at .125. The results also show that the standard error
for the indirect estimate of organizational culture on job satisfaction is at .076 and the
standard error for the indirect estimate of organizational culture on organizational
commitment is at .042.
Table 4.17 shows the significance of the indirect effect of psychological
empowerment in relationship between structural empowerment and job satisfaction
and organizational commitment. The standardized indirect effect of structural
empowerment on job satisfaction is between .236 and .513 and the level of
confidence is 95 percent. The indirect effect is significant (p=.001). The standardized
indirect effect of structural empowerment on organizational commitment is between
.272 and .593 and the level of confidence is 95 percent. The indirect effect is
therefore significant at .001 (p=.001).

165
The results of Table 4.17 show that there is a significant indirect effect on the
influence of structural empowerment on organizational commitment and job
satisfaction through psychological empowerment.
Table 4.17. Indirect effect on the influence of structural empowerment on
organizational commitment and job satisfaction through psychological
empowerment
Point estimate SE Bootstrapping
Percentile 95% p
lower upper
Org commitment .360 .136 .272 .593 .001
Job Satisfaction .190 .125 .236 .513 .001
Table 4.18 shows the significance of the indirect effect of psychological
empowerment in relationship between clan culture and job satisfaction and
organizational commitment. The standardized indirect effect of clan culture on job
satisfaction is between .036 and .410 and the level of confidence is 95 percent. The
indirect effect is therefore significant at .05 level of significance (p=.023).
The standardized indirect effect of clan culture on organizational commitment is
between .012 and .373 and the level of confidence is 95 percent. Thus, the indirect
effect is significant at 05 level of significance (p=.048). Therefore, there is a
significant indirect effect on the influence of organizational culture on organizational
culture and job satisfaction through psychological empowerment.
Table 4.18. Indirect effect on the influence of organizational culture on
organizational culture and job satisfaction through psychological empowerment
Point estimate SE Bootstrapping
166
Percentile 95% p
lower upper
Org commitment .120 .076 .012 .373 .05
Job satisfaction .063 .042 .036 .410 .05
CHAPTER 5
5 CONCLUSION, IMPLICATIONS AND RECOMMENDATIONS
5.1 Introduction
This chapter discusses the findings of the study, theoretical and practical implications
of study, its contribution to human resource development as well as
recommendations for further research and also the conclusion.
5.2 Discussion
5.2.1 Measurement Models
Findings from the measurement models are discussed briefly. First, the present study
found that for the six dimensions of structural empowerment (opportunity,
information, support, resources, formal power, and informal power) the factor
loadings were above the appropriate value and these dimensions significantly loaded
on the construct of structural empowerment (p < .001). All observed indicators had
high factor loading on the first order constructs (> .5). Averaged variance was
extracted and constructs reliability and composite reliability supported validity and
reliability of this construct. Discriminant validity was also fully supported.

167
Second, the present study found that the four dimensions (Clan, adhocracy, market,
and hierarchy) were strongly loaded on the organizational culture construct and the
observed indicators loaded on the appropriate first-order construct (p < .001). In
addition, average variance was extracted and the composite reliability and
discriminant validity achieved appropriate threshold levels.
Third, the findings reported that the six dimensions of psychological empowerment
(decision making, professional growth, status, self-efficacy, autonomy, and impact)
loaded on the second-order construct of psychological empowerment (p < .001) and
factor loadings of observed indicators achieved the appropriate level. In addition, the
average variance was extracted, and the composite reliability and discriminant
validity met the threshold values. However, the model did not properly fit for the
psychological empowerment construct; therefore and item parceling was done in
order to achieve the good model fit. The result showed better model fit after item
parceling was done
Fourth, the present study findings of three dimensions of organizational commitment
(affective, normative and continuance) found that all items were not strongly loaded
on their first-order construct. In particular, observed indicators of continuance
commitment did not get appropriate factor loadings and were therefore deleted from
the first order construct. Further test for composite reliability, average variance was
extracted and the discriminant validity supported. The present study argues that the
construct of organizational commitment would be better understood as a two-factor
construct of affective and normative commitment.

168
Fifth, the present study found that nine dimensions of job satisfaction (pay,
promotion, supervision, fridge benefits, contingent rewards, operating conditions,
coworkers, nature of work and communication) did not loaded on the construct of
job satisfaction. Also the model did not fit, therefore item parceling were conducted
to get better model fit. In particular, four dimensions (supervision, operating
conditions, coworkers and nature of works) did not achieve the significant loading
with job satisfaction construct. After omitting four (supervision, operating
conditions, coworkers and nature of works) dimensions, model fitted better and
achieve appropriate model fit with five dimensions (pay, promotion, , fringe benefits,
contingent rewards, and communication). Overall, the results of the overall
confirmatory factor analysis of five constructs showed that observed variables of
each dimension loaded properly with the constructs but overall confirmatory factor
analysis showed that the model did not fit appropriately, Therefore, item parceling
was conducted in order to achieve the model fit,
).
5.2.2 Structural Models
The findings from the structural models in present study supported all four main
hypotheses. The discussion is based on the respecified model in the measurement
models. Consistent with previous research indicating that structural empowerment
leads to an increase in construct of psychological empowerment significantly
(Spreitzer, 1996; Laschinger et al., 2001; Ghani et al., 2009; Cho, 2008; Dee, Alan,
Henkin & Duemer; 2003; Abdulahi, 2004; Laschinger, Finegan & Wilk, 2009;
Seibert et. al., 2004; Bailey, 2009).

169
The findings of this study reported that structural empowerment construct led to a
statistically significant relationship with psychological empowerment (.69; p < .001).
The present study empirically supported that structural empowerment should be
considered as antecedent of psychological empowerment in higher education context.
This result support that structural empowerment is key factor in enhancing
psychological empowerment in higher education, which was approved in other
organizations.
The results of the baseline structural model reveal that there is no significant
relationship between adhocracy culture and psychological empowerment, job
satisfaction and organizational commitment. Although, the present study reported
that hierarchy culture was a dominant culture in this study, there was no significant
relationship between hierarchy culture with psychological empowerment, job
satisfaction and organizational commitment in the study. Therefore, research
universities culture emphasizes order, rules and regulations, documentation, job
descriptions, as well as authority and control. Some researchers argue that hierarchy
culture is an appropriate tool in management (Cameron & Freedman, 1991), while
other researchers believe that hierarchy culture result in unsuccessful transferring of
information in the organization (Twati & Gammack, 2006).
This study has shown that adhocracy culture, with emphasis on entrepreneurship,
creativity, and innovation is weak in the organizational culture profile of research
universities. Meanwhile, research universities in Malaysia suffer from low level
market culture. Market culture is refers to goal achievement, productivity, task
accomplishment, planning and efficiency. Generally speaking, research universities

170
culture lacks external orientation which may be attributed partially to its strong
dependence on the Ministry of Higher Education.
The review of literature indicates that clan culture leads to significantly increased
psychological empowerment (.31, <.05) and the findings of this study support the
literature. A contextual variable such as culture should be examined to assess its
relationship with empowerment (Spreitzer, 1995) as it is more related to innovative
and effective organizations (Dickson, 1992) and describes the decision making
process at the bottom level of university, in a friendly workplace, which enhances the
academics’ psychological empowerment. Previous study has shown that
organizational culture can be accepted as another important factor influencing
psychological empowerment (Spreitzer, 1995; Jonson, 2009, Bailey, 2009). This
study suggests that clan culture is a determinant in the psychological empowerment
of academic staff.
The present study examined structural empowerment in relation to job satisfaction
(.359, < .001). Previous studies showed the relationship between structural
empowerment and job satisfaction (Laschinger & Havens, 1997; Laschinger &
Wong, 1999; Winter-Collins & McDaniel, 2000; Laschinger et al., 2001; Laschinger
& Patrick, 2006; Chag, Shih & Lin, 2009). Based on the study by Laschinger, Purdy
and Almost (2007), structural and psychological empowerment of managers in
organizations is associated with greater job satisfaction.
The results of this study support the hypothesis that access to empowerment
structures in the organization affects job satisfaction. Studies in eastern as well as
western countries have shown the relationship between structural empowerment and

171
job satisfaction to be significant. Cai and Zhou (2009) examined the levels of
workplace structural empowerment perceived by Chinese clinical nurses, as well as
the relationship between nurses' perceptions of empowerment and job satisfaction.
The present study examined structural empowerment in relation to organizational
commitment (.372, p < .01), while previous studies have shown the relationship
between structural empowerment and organizational commitment (Laschinger &
Havens, 1997; Laschinger & Wong, 1999; Dee, Henkin & Duemer; 2003;
Laschinger & Shamian, 1996; Laschinger, Finegan & Wilk, 2009). A study on nurses
showed a strong and positive relationship between structural empowerment, job
satisfaction, organizational commitment, and turnover of employees (Laschinger,
Leiter, Day & Gilin, 2009). Affective commitment is related to all of the
empowerment structures with the strongest correlations to formal and informal
power (Cho, Laschinger & Wong, 2006). Structural empowerment has significant
and positive direct effects on individual-level psychological empowerment and
organizational commitment (Smith, Andrusyszyn & Laschinger, 2010; Cho et al.,
2006). Having the opportunity to build strong relationships with peers, access
information and resources may increase the academic staff’s commitment to the
university and their departments.
The present study also examined the relationship of clan culture with organizational
commitment (.345, p < .01), while previous studies investigated the relationship
between organizational culture and organizational commitment. Clan culture tends to
increase the level of commitment between managers and employees. Clan culture is
critical for employee organizational commitment and royalty (Zammuto &
Krakower, 1991), and encourages the implementation of management strategies in

172
order to obtain human resource development, organizational commitment and
collaboration (Stock et al., 2006; Gregory, Harris, Armenakis & Shook, 2009).
The present study examined the relationship of clan culture and job satisfaction and
found it to be positively significant (.217, p < .05). Previous studies have investigated
the relationship between clan culture and job satisfaction and found that job
satisfaction appears to be improved in a situation where its culture provides more
autonomy and participative decision making and continued learning (Apker, 2003;
Neuhauser, 2002; Park & Kim, 2009). Specifically, Park and Kim’s (2009) study,
which examined the four types of organizational culture on job satisfaction, revealed
that consensual culture, similar to clan culture, affects job satisfaction. Clan culture
has been associated with high levels of satisfaction with work, promotion, and
supervision (Quinn & Spreitzer, 1991). This culture is also correlated with flexibility,
openness, responsiveness and high levels of growth. Therefore, clan culture may be
more helpful for improving job satisfaction of academic staff than control-based
culture (Gifford, Zammuto & Goodman, 2002; Park & Kim, 2009; An, Yom &
Ruggiero, 2010).
The present study examined psychological empowerment in relation to
organizational commitment (.280, p < .05). Previous studies have shown the
relationship between psychological empowerment and organizational commitment
(Kanter, 1983; Spreitzer, 1995; Thomas & Velthouse, 1990; Wayne et al., 2000;
Wiley, 1999). The findings of this study are consistent with those of previous
research.

173
Academic staff who feel that their tasks and responsibilities are meaningful, have the
opportunity to participate in decision making at their work place, feel competency
about their jobs, and make an impact on peers through successful completion of their
teaching and research tasks, may be more intrinsically motivated in their
responsibilities and more committed in their departments that empower employees
(Liden, Wayne & Sparrowe, 2000; Aryee & Chen, 2006). Previous studies have also
found positive associations between empowerment, job satisfaction, and
organizational commitment (Liu et al., 2006; Manojlovich & Laschinger, 2002; Dee,
Henkin, & Duemer, 2003; Chiang & Jang, 2007; Laschinger, Finegan, & Wilk,
2009). Psychological empowerment is related to organizational commitment in
organizations (Kramer, Siebert & Liden, 1999; Spreitzer, 1995; Laschinger, Finegan
& Shamian, 2001).
The present study examined the psychological empowerment related to job
satisfaction (.430, p < .01). Previous studies have shown the relationship between
psychological empowerment and job satisfaction (Liden, Wayne & Sparraw, 2000;
Spreitzer et al., 1997). Psychological empowerment may to be related to job
satisfaction perhaps because positive attitudes of academics staff towards their
responsibilities enhance effectiveness in doing their tasks. As an intrinsic tasks
motivation, experiencing the high level of psychological empowerment increases the
levels of job satisfaction (Liden, Wayne, & Sparraw, 2000). Previous studies have
also found positive associations between empowerment, job satisfaction, and
organizational commitment (Liu et al., 2006; Manojlovich & Laschinger, 2002;
Laschinger & Havens, 1997; Laschinger & Wong, 1999; Chag, Shih & Lin, 2009;
Chiang & Jang, 2007).

174
The findings of the study reveal that psychological empowerment partially mediate
the effect of structural empowerment on organizational commitment in research
universities. The findings from the study indicate that structural empowerment leads
to increased organizational commitment not only through psychological
empowerment. Studies based on this model have demonstrated the importance of
mediating effect between the organizational environment and workplace outcome
behaviors (Laschinger et al., 2001; Manojlovich & Laschinger, 2002; Chag, Shih &
Lin, 2009). Related studies identified only a partial mediating effect of psychological
empowerment between these variables (Lee, 2003; Huang & Wang, 2006). The
results reveal that psychological empowerment does not fully define the process of
relationship between structural empowerment and organizational commitment in the
educational context and in eastern countries.
The findings reported that psychological empowerment partially mediates the
relationship between structural empowerment and job satisfaction. The results show
that psychological empowerment partially mediates structural empowerment and job
satisfaction. The lack of a mediating effect found in this study has two possible
explanations. First, academics in Asian universities tend to have different
interpretations from the concept of structural and psychological empowerment,
which is a concept that derived from western countries. Empowerment mediates the
relationship between empowerment and job satisfaction (Bailey, 2009; Chang, Shih,
& Lin, 2009; Manojlovich & Laschinger, 2002; Laschinger et al, 2001; Lee, 2003;
Huang & Wang, 2006).
On the other hand, the findings indicate that psychological empowerment partially
mediates the effect of clan culture on job satisfaction in research universities.

175
Psychological empowerment does not fully mediate the relationship between external
factors and job satisfaction. The findings from the study show that clan culture leads
to increased job satisfaction through psychological empowerment. Previous studies
in western countries show the mediating role of psychological empowerment in
relationship between clan culture and job satisfaction (Chang, Shih & Lin, 2009;
Manojlovich & Laschinger, 2002; Laschinger et al., 2001; Gregory, Brian, Albritton
& Osmonbekov, 2010).
The study explores how clan culture affects job satisfaction through psychological
empowerment. As previously mentioned in this study, there has been no known
research examining the mediating role of psychological empowerment in the
relationship between organizational culture and workplace outcomes in higher
education and especially in southeastern universities. This study shows how
enhancing empowerment in a supportive and friendly environment would allow for
job satisfaction (Ning, Zhong, Libo & Qiujie, 2009).
The findings of the last hypothesis have revealed that psychological empowerment
partially mediates the effect of clan culture on organizational commitment in
research universities. The findings from the study are that clan culture leads not only
to psychological but also to increased organizational commitment. The study
provides the initial foundation of the influence clan culture has on psychological
empowerment and organizational commitment. By demonstrating the mediating role
of psychological empowerment in relationship with clan culture and organizational
commitment, this study provides an insight on the important role clan culture has in
organizational commitment through psychological empowerment. Prior studies, such
as that of Laschinger et al. (2001) and Seibert et al. (2004) contain research models

176
that focus on psychological empowerment as the predictor variable and its effects on
Organizational commitment.
However, there have been no research studies that assess the mediating role of
psychological empowerment, especially in relationship with organizational culture
and workplace outcomes. If leaders desire to get the best performance from
academics in an appropriate culture, they should improve the psychological
empowerment of academic staff to help them develop greater commitment and
loyalty. Along with the studies of Seibert et al. (2004) and Bailey (2009), the results
of this study expand the multi-level empowerment literature on the effects of
organizational culture in higher education.
The results of the nested model also empirically support the present that there is a
need for emphasizing psychological empowerment as a partial mediator in the
relationships between structural empowerment and job satisfaction and
organizational commitment as well as considering psychological empowerment as a
partial mediator between organizational culture and job satisfaction and
organizational commitment. The results imply that there is a need for considering the
importance of the type of organizational culture in emphasizing work related
outcomes.
5.3 Implications
5.3.1 Theoretical Implications
The findings support the notion that organizational development studies have
focused on psychological empowerment as a mediator in the relationship between
structural empowerment and work-related outcomes. Meanwhile, psychological

177
empowerment is a mediator in relationship between organizational culture and work-
related outcomes. The findings indicate that structural empowerment affects work-
related outcomes (job satisfaction and organizational commitment). The findings
support the hypotheses, suggesting that university has to consider the importance of
psychological empowerment to increase academics’ job satisfaction and
organizational commitment among academics.
The literature on empowerment in higher education does not focus on the mediating
role of psychological empowerment between organizational culture and work-related
outcomes. Also, the dominant type of organizational culture is considered a predictor
of psychological empowerment and work-related outcomes, instead of the concept of
organizational culture. Therefore, this study suggests that the specific culture type
should be considered as a predictor first in organizational development studies.
Researchers in higher education organizations have not often considered the
importance of organizational culture in relation to empowerment and motivational
approaches. This study provides empirical support for the effect of cultural
orientations on academics’ work-related outcomes. The findings imply that
organizational culture may be one positive and significant factor to be considered.
Meanwhile, there is a need to consider the organizational culture when it emphasizes
increasing work-related outcomes through psychological empowerment. Previous
researches mention the importance of organizational culture and structure which can
directly or indirectly influence on the empowerment of employees (Koberg, Boss,
Senjem & Goodman, 1999; Spreitzer, 1996; Spreitzer, Janasz & Quinn, 1999). This
study adds to the existing knowledge of empowerment studies in research

178
universities by filling this gap. The results of this study support Kanter’s (1977)
organizational empowerment theory on Malaysian research universities.
The results of this investigation have implications for advancing both empowerment
theory and professional education settings. Regarding empowerment theory, the
findings of this study, contextualized by research universities setting, can be used to
develop Spreitzer’s (1997) theoretical model of psychological empowerment and
Kanter’s (1977) theoretical framework of structural empowerment in educational
institutions. As argued by Spreitzer and Kanter, theoretically these findings
emphasize the significance of the mediating role of psychological empowerment for
promoting the relationship between structural empowerment and organizational
culture with work-related outcomes. Also, a contribution of this research for the
empowerment literature is providing a model in this area of research. This proposed
model can be re-specified in order to create a better overall understanding of the
mediation of psychological empowerment and outcomes, such as job satisfaction and
organizational commitment within research universities environment. The results of
this study have implications for advancing empowerment theory which is a part of
organizational development theories in the human resource development field.
This study also creates new knowledge on socio-technical systems (STS) design in
universities which is a known way to increase productivity and job satisfaction. This
study is alike STS intervention, which focus on a combination of organizational
structure (information, resources, support and opportunity) and psychological
demand (psychological empowerment). This is especially important in today’s
environment when higher education is transitioning to world competition and
globalization models.

179
Several researchers have recognized the importance of the diagnosis and analysis of
culture, in order to provide a clear map of organizational strengths and weaknesses.
This need assessment can help leadership to choose appropriate strategies and
management techniques in educational setting in order to obtain effective workplace
outcomes behaviors (Ciampa, 1991, Trivellas & Dargenidou, 2009). This study has
shown the type of organizational culture that is a key element in enhancing or
hindering empowerment, as well as job satisfaction and organizational commitment
of academic staff.
5.3.2 Implications for Practice
The present study suggests that leaders in higher education have to use the two
approaches to empowerment together to increase job satisfaction and organizational
commitment of academic staff. In practice, educational organizations should
emphasize management techniques and motivational approaches (empowerment) to
achieve better and qualified performance and organizational development. By
accepting the mediating role of psychological empowerment to increase job
satisfaction and organizational commitment of academic staff, leadership in
educational institutions has to introduce psychological empowerment in the context
of higher education.
Second, the results have shown that clan culture is an important predictor for
psychological empowerment, job satisfaction and commitment. Thus, leaders in
universities have to recognize the importance of clan culture in the context of higher
education. In addition, leaders in higher education need to focus on clan culture
practices in order to increase academics’ psychological empowerment and work-

180
related outcomes. Some ways to develop clan culture include: using strategies for
keeping balance between employees, motivating academics, and empowering staff to
provide suggestions and to make more decisions within their own areas of expertise
(Park & Kim, 2009). By creating a greater sense of psychological empowerment
among academic staff, levels of organizational commitment and job satisfaction may
foster positively. This study adds new knowledge on empowerment in a southeastern
country such as Malaysia with a multi-cultural context and provides evidence for the
effectiveness of empowerment as a management technique to positively influence
motivational levels of academic staff.
Unlike previous research studies that examined empowerment and workplace
outcomes within business, this study primarily focuses on the Research University.
The present study also posits importance of cultural awareness before any attempt to
change the culture of research universities. By including culture as a variable in a
larger and inclusive model, researchers in the field of human resource development
may be able to fill the gap and understanding more key factors that influence
psychological empowerment as well as workplace outcomes.
5.4 Contribution to HRD
HR provides creative leadership to the higher education by entering basic knowledge
that increases personal and institutional productivity and effectiveness. This study
makes practical contributions to human resource development by providing new
ideas about the concept of psychological empowerment in higher education. The
concept of psychological empowerment in relation to organizational culture has not
been adequately researched in the higher education setting. The findings of this study

181
provide implications in relation to future management and leadership planning,
academics’ professional development and productivity in the higher education arena.
Determining the mediating role of psychological empowerment in relationship
between organizational culture, structural empowerment and work place outcomes
provides empirical support for possible systematic educational approaches or
organizational changes that can foster empowerment and performance in higher
education. Creating a culture of empowerment can influence academics’ abilities to
become more qualified in their teaching and research responsibilities.
This study has notable implications for HRD practitioners, especially those who are
interested in organizational effectiveness and development in educational settings by
knowing which type of organizational culture is predictive of academics’
psychological empowerment. This study will help HRD practitioners realize how
they can create an environment based on organizational culture that fosters
academics’ psychological empowerment that will lead to more positive workplace
outcomes among academic staff. Human resource practitioners and experts can take
action to create an organizational culture and structural empowerment that supports
psychological empowerment of academics.
Effective programs are needed to improve the quality of the workplace in research
universities. New paradigms for higher education are needed for the work
environment, and the preparation of empowered academics. The corporation of
results from this study can help to provide a systematic approach to environmental
changes in the context of research universities.
This study provides a deeper insight on the role of different types of organizational
culture intervention in research universities. HRD experts in higher education can see
182
which type of organizational culture has the potential for eternalizing or hindering
the empowerment and workplace outcomes. Organizational culture has a direct
impact on psychological empowerment. Therefore, it is important for HRD
practitioners and leaderships to examine the norms and values and how they could
foster or impede organizational development in higher education (Bailey, 2009).
This study provides insight on the important role of organizational culture in
psychological empowerment, which in turn will affect academics’ commitment and
satisfaction in research universities. It helps HRD experts to understand the concept
of organizational culture, such as how it shapes in higher education, especially in
research universities in southeastern countries and how it influences universities’
performance and leads to organizational development.
This study provides more knowledge to HRD frontiers with focus on the research
universities environment. This study advances the research on empowerment as two-
facetted phenomena. There are few studies that integrate the two aspects of structural
empowerment and psychological empowerment (Laschinger et al., 2001; Seibert,
Silver & Randolph, 2004). This study contributes to the body of research regarding
organizational culture, structural and psychological empowerment, job satisfaction,
and organizational commitment. This study contributes to HRD theorists and
provides a different reflection of empowerment within the higher education
organizations, which are lacking in human resource development, especially in
Malaysia.
Those that will find this study most informative are human resource professionals
and training and development professionals. Selecting and keeping academic staff

183
that are satisfied and committed to their university is an important issue in human
resource development especially in educational settings.
The context of higher education is definitely different from that of other
organizations. According to this study, HRD frontiers realize how they can create an
environment based on an empowerment model that fosters satisfaction and
commitment among academics. HRD expertise can use this proposed model as a
guideline for creating and maintaining an environment where academics can make
decisions, based on information and resources and established guidelines by
mediating of psychological empowerment.
Examining organizational culture in universities has the potential to contribute to
greater awareness and understanding of the influence or influences the educational
environment may have on key aspects of development such as empowerment. An
understanding of organizational culture is a necessary predictor to change academics’
attitudes and their educational environment to one that is more constructive and that
more fully enhances the empowerment of academics. The organizational culture can
be useful in the evaluation of culture in research universities. Therefore, it can aid
HRD professionals in planning strategic programs for improvement of academics in
institutions of higher learning.
Prior research studies do not contain research models that assess the organizational
culture influence on both structural and psychological empowerment. Consequently,
this study is useful for human resource developers who do not have adequate
knowledge of the importance of organizational culture, such as how it shapes and
influences universities context and leads to the empowerment of academics, thus
resulting in higher education effectiveness. This research study provides empirical

184
data to support the concept that a combination of the organizational culture and
structural and psychological empowerment will increase academics’ job satisfaction
and organizational commitment.
Also, this study has notable implications for HRD frontiers, especially the ones who
are interested on organizational effectiveness and development in higher education
settings, especially in southeastern countries.
Research regarding the mediating role of psychological empowerment has been
conducted in few industry sections, but not in higher education especially in research
universities. This study adds new knowledge to the concept of psychological
empowerment as an intervention for organizational development and performance
and effectiveness in human resource development area. The findings of this study
can provide guidance for investigating perceptions of access to empowerment
structures and psychological empowerment within higher education to aid in
identifying issues surrounding academic’s job satisfaction and commitment to
university.
5.5 Further Research
To improve understanding of the relationships between empowerment and job
satisfaction or organizational commitment among academic staff, in addition to the
variables tested in this study, other variables such as job stress, leadership styles and
professional development should also be analyzed in future studies to clarify the
mediating role of psychological empowerment and work attitudes.
Qualitative studies should be conducted to examine the concept of empowerment
among academic staff. These studies should explore possible explanations related to

185
academic staff empowerment. Longitudinal research is needed to ascertain the causal
nature of the relationship between contextual factors and workplace outcomes.
Meanwhile, empowerment of academics from a gender perspective can also be
considered.
Future studies might also examine the leadership/management style of the dean or
appropriate administrator at these institutions, as it relates to the perceived
empowerment levels of academic staff. Studies should be performed to establish
relationships between empowerment and academic staff and students’ performance.
Future research that includes group as well as individual levels of analysis is needed
to more fully understand the role of empowerment and outcomes.
Future research is needed to identify other mediating variables in relationship
between the contextual factors and workout comes as they would help expand the
current understanding of “how” in this relationship. Structural empowerment and
organizational culture should not be considered as an only alternative to increase job
satisfaction and organizational commitment of academic staff.
5.6 Conclusion
The results of this study indicate that structural empowerment and psychological
empowerment are both important predictors of job satisfaction and organizational
commitment (Laschinger & Havens, 1997; Laschinger & Wong, 1999). Meanwhile,
clan culture is a predictor of job satisfaction and organizational commitment.
However, the mediating effect of psychological empowerment was observed
between external factors (structural empowerment and organizational culture) and
work-related outcomes (job satisfaction and organizational commitment).

186
This study posits that increased collaboration in the decision-making processes
enhance positive workplace behaviors among academic staff in research universities.
The partial mediating effect of psychological empowerment was observed between
structural empowerment and job satisfaction and organizational commitment. The
partial mediating effect of psychological empowerment was observed between
organizational culture and job satisfaction and organizational commitment. Previous
research showed the mediating role of psychological empowerment between
structural empowerment and work-related outcomes (job satisfaction and
organizational commitment) (Thomas & Velthouse, 1990; Liden et al., 2000; Lee,
2003; Laschinger et al., 2001; Huang & Wang, 2006; Chang, Shih & Lin, 2010).
The work environment in this study differs from the organizational settings studied
by previous researchers (Laschinger & Havens, 1997; Laschinger & Wong, 1999).
The geographical environment also differs from that of previous researches. This
study was the first attempt in examining the mediating role of psychological
empowerment in research universities and in southeastern countries, specifically
Malaysia. Academic staff in research universities needs more attention from the
management of higher education. In such a work environment, fostering
psychological empowerment for academic staff is an important issue, in order to
achieve better work-related behaviors (Liu & Yu, 2008; Laschinger et al., 2001;
Spreitzer, 1995).
The most important contribution of the present study is in the associations found
among organizational culture, empowerment, and workplace outcomes. The strength
of association among these variables may be particularly important in terms of
practical implications for academic staff in research universities, considering the

187
challenges that these institutions presently confront. In the context of higher
education, academics must be qualified and empowered enough in order to be more
committed and satisfied in order advance their long term role in research and
teaching (Bok, 2003; Newman, Couturier & Scurry, 2004).
The improvement of higher education performance and quality lies in an
organization’s ability to provide a culture for change through its human resources,
and system of decision-making (Mosadeghard, 2006). A transformation from
hierarchical leadership to decentralization and involvement are required for research
universities (Mizikaci, 2003). These transformations can provide long term
commitment to the organization, and job satisfaction. To promote greater feelings of
psychological empowerment, the responsibility of higher education is to give
autonomy, decision making and opportunity for professional growth and provide
sufficient opportunity to academics to accomplish their tasks.
Leadership plays an important role in the transformation of attitudes of employees
towards psychological empowerment (Trivellas & Dargenidou, 2009). Giving
autonomy for accomplishing the tasks, providing information, rewards and support
may foster level of empowerment among employees. Meanwhile, strategies to
enhance self-efficacy and providing supportive environment can increase level
psychological empowerment (Quinn & Spreitzer 1997; Avolio, Zhu, Koh & Bhatia,
2004).
Malaysian universities follow a hierarchical structure which exists between academic
staff and administrators, students, and other stakeholders. On the other hand, research
studies reveal that governmental organizations are generally dominated by a
hierarchical culture, which their focus is on rule and regulations (Cameron & Quinn,

188
2006). Among three types of culture in this study (clan, adhocracy and hierarchy),
clan culture appears to increase job satisfaction, organizational commitment and
psychological empowerment. Therefore, there is a need for changing the culture
within the context of higher education (Gebhardt et al., 2006).
Only the partial mediating effect of psychological empowerment is observed
between organizational empowerment and job satisfaction. This is consistent with
Thomas and Velthouse (1990) model, and this study shows that psychological
empowerment has an important mediating role between the structural empowerment
and work place outcomes east Asian countries. Related studies identified only a
partial mediating effect of psychological empowerment between these variables
(Lee, 2003; Huang & Wang, 2006).
The lack of a mediating effect identified by this study has two possible explanations.
First, academics in Asian countries tend to have different interpretations of concept
of empowerment, which is a concept that originated in western societies. Second, the
work environment for academics in this study differs from previous studies in
educational settings (Littrell, 2007).
Although the indirect effect is small, this mediator helps to explain how and why
structural empowerment and organizational culture affects job satisfaction and
organizational commitment. There is a need for strategies that focus on facilitating
psychological empowerment to improve job satisfaction and to increase
organizational commitment.
To be able to productively and effectively affect academics positive work place
behaviors through structural empowerment and culture, interventions for
189
improvement must be implemented before any attempts are made. Policymakers may
want to re-examine institutional policies as they relate to decision-making,
professional growth, and academics’ autonomy.
The results of this study provide an insight and add new knowledge to research
universities environment which can help increasing structural and psychological
empowerment among academics, as this can facilitate positive workplace behaviors
and strengthen organizational performance. Strategies such as workplace
interventions, in-service training techniques may increase levels of organizational
commitment and job satisfaction from moderate to high.
In the field of higher education, academic staff empowerment is a means to facilitate
the development of research universities climate and is an attempt to create and
develop environment that lead to positive work place outcomes for academics and
students as well. Generally speaking, psychological empowerment creates natural
conditions for motivation to occur in research universities.
190
6 REFERENCES
Abdolahi, B. (2004). A model of psychological empowerment for staff of ministry of
science, research and technology (Doctoral dissertation). teacher training
university, Iran.
Abdullah, J. Y. (2009). Malaysian public universities and new approaches to meeting
global challenges. Retrieved May 15 2009,
from http://ummatanwasatan.net/2009/01/malasian-public-universites-and new-
approaches-to-meeting-global-challenges/htm.
Aiman-Smith, L. (2004). What do we know about developing and sustaining a
culture of innovation? What Do We Know Journal Review. 1: 1-5
Alderfer, C. (1969). An empirical test of a new theory of human needs.
Organizational Behavior and Human Performance. 4: 142-175.
Allen, N. J., & Meyer, J. P. (1990). The measurement and antecedents of affective,
continuance and normative commitment to the organization. Journal of
Occupational Psychology, 63: 1-18.
Allen, N. J. & Meyer, J. P. (1996). Affective, continuance and normative
commitment to the organization: An examination of construct validity.
Journal of Vocational Behavior, 49: 252-276.
Alsop, R., Heinsohn, N., & Somma A. (2004). Measuring Empowerment: an
Analytic Framework. Empowerment Community of Practice Newsletter.
(Feb./Mar. 2004).
Altbach, P. G. (2001). Academic freedom: International realities and challenges.
Higher Education 41: 205-219.
Altbach, P. G. (2004). The costs and benefits of world-class universities. academe
online. (Jan-Feb 2004).
Altbach, P.G. (2004). Globalization and the university: myths and realities in an
unequal world. Tertiary Education and Management. 10(1): 3-25.
Altbach, P. G., & Umakoshi, T. (2004). Asian universities: historical perspectives
and contemporary challenges. Canada: JHU Press.
An, J. Y., Yom, Y. H., Ruggiero, J. S. (2010). Organizational culture, quality of work
life, and organizational effectiveness in Korean university hospitals. Journal of
Transcultural Nursing. 26(4): 109-119.

191
Anderson, G. (2007). Experiences in academic government and decision-making of
full-time non tenure track faculty in communication fields. (Doctoral
dissertation) University of Southern California, U.S.A.
Anderson, J. C., & Gerbing, D. W. (1988). Structural equation modeling in practice:
A review and recommended two-step approach. Psychological Bulletin.
103(3): 411-423.
ASHE Higher Education Report (2003). Governance in the twenty-first-century
university: Approaches to effective leadership and strategic management.
ASHE Higher Education Report. 30(1): 41-49.
Asmawi, A., & Mohan, A. V. (2010). Understanding patterns of organizational
culture: A study in Malaysian R & D institutions. Management of Innovation
and Technology (ICMIT), 2010 IEEE International Conference. Singapore
June 2010.
Arbuckle, J.L. (2006). Amos 7.0 User's Guide. Chicago: SPSS Inc.
Aryee, S. & Chen, Z. X. (2006). Leader-member exchange in a Chinese context:
Antecedents, the mediating role of psychological empowerment and outcomes.
Journal of Business Research. 59: 793-801.
Aryee, S., Wyatt, T., & Min, M. K. (1991). Antecedents of organizational
commitment and turnover intentions among professional accountants in
different employment settings in Singapore. Journal of Social Psychology. 131:
545-556.
Avolio, B.J., Zhu, W. Koh, W. & Bhatia, P. (2004). Transformational leadership and
organizational commitment: Mediating role of psychological empowerment
and moderating role of structural distance. Journal of Organizational Behavior
25(8): 951–68.
Bagozzi, R. P. & Heatherton, T. F. (1994). A general approach to representing
multifaceted personality constructs: Application to state self-esteem, Structural
Equation Modeling. 1(1): 35-67.
Bagozzi, R. P., Yi, Y., & Phillips, L. W. (1991). Assessing construct validity in
organizational research. Administrative Science Quarterly. 36: 421-458
Bailey, T. L. (2009). Organizational culture, macro and micro empowerment
dimensions, and job satisfaction: an application of concurrent mixed and
multi-level methods in the federal sector. Touro University International,
U.S.A.
Bandalos, D. L. (2002). The effects of item parceling on goodness-of-fit and
parameter estimate bias in structural equation modeling. Structural equation
modeling. 9(1): 78–102.

192
Baron, R. M., & Kenny, D. A. (1986). The moderator-mediator variable distinction
in social psychological research: Conceptual, strategic and statistical
considerations. Journal of Personality and Social Psychology. 51: 1173-1182.
Bartell, M. (2003). Internationalization of universities: A university culture-based
framework. Journal of Higher Education, 45(1): 43-70.
Bennett, J. B. (1998). Collegial Professionalism the Academy, Individualism, and the
Common Good. U.S.A.: Phoenix: American Council on Education & Oryx
Press.
Bentler, P. M., & Chou, C. P. (1988). Practical issues in structural modeling. In J. S.
Long (Ed.), Common problems/proper solutions: Avoiding error in survey
research (pp.161-192). Newbury Park, CA: Sage.
Bentler, P. M. (2002). EQS Structural Equations Program Manual, Encino, CA:
Multivariate Software.
Bérubé, M. (2006). What does academic freedom” mean? Academe online, 2009,
from http://www.aaup.org/AAUP/pubsres/academe/2006/ND/Feat/beru.htm
Biron, M., & Bamberger, P. (2010). The impact of structural empowerment on
individual well-being and performance: Taking agent preferences, self-
efficacy and operational constraints into account. Human Relations, 63(2),
163-191.
Blanchard, K., Carlos, J. P. & Randolf, A. (1996). Empowerment Takes More than a
Minute. San Francisco, CA: Berrett-Koehler.
Blau, M. P. (1994). Bureaucracy and scholarship. In The organization of academic
work (2 illustrated ed.).New Jersey: Transaction Publishers.
Bogler, R., & Somech, A. (2004). Influence of teacher empowerment on teachers’
organizational commitment, professional commitment and organizational
citizenship behavior in schools. Teaching and Teacher Education 20: 277-
289.
Bok, D. C. (2003). Universities in the marketplace: the commercialization of higher
education. Princeton, NJ: Princeton University Press
Bosley, C. L. M. (2005). Organizational culture and student empowerment in
baccalaureate nursing programs (Doctoral dissertation) Kent State University,
U.S.A.
Bowen, D. E., & Lawler, E. E. I. (1995). Empowering service employees. Sloan
Management Review. 36(4), 73-65.
Bowen, D. E., & Lawler, E. E. I. (2006). The empowerment of service workers:
what, why, how, when In D. Mayle (Ed.). Managing innovation and change
(pp. 288): Sage publications.

193
Bowen, D. E., & Lawler III, E. E. (1992). The empowerment of service workers:
what, why, how and when. Sloan Management Review. 33(3): 31-39.
Brancato, V. C. (2003). Professional development in higher education. New
Directions for Adult and Continuing Education. (98): 59-66.
Breland, N. K. (2007). Mental health nurses' perceptions of empowerment and job
saisfaction a quantitative perspective. Winnipeg: University of Manitoba.
Brown, B. B. (2003). Employees’ Organizational Commitment and Their Perception
of Supervisors’ Relations-Oriented and Task-Oriented Leadership Behaviors.
Virginia Polytechnic Institute and State University, U.S.A.
Brown, K. (1989). Implantation of a learning program to train adolescent mothers to
live independently.
Bucher, (1970). Social process and power in a medical school. Nashville, TN:
Vanderbilt University Press.
Budd, J. (2005). The changing academic library: Operations, culture, environments.
Chicago: Association of College & Research Libraries.
Burns, N., & Grove, S. (1999) Understanding Nursing Research. (2nd Ed).
Philadelphia: WB Saunders Company.
Byrne, B. M. (1994). Structural Equation Modeling With EQS and EQS/Windows.
Newbury Park: Sage.
Byrne, B. M. (1998). Structural equation modeling with LISREL, PRELIS, and
SIMPLIS: basic concepts, applications, and programming. New Jersey:
Erlbaum.
Byrne, B. M. (2001). Structural equation modeling with AMOS: basic concepts,
applications, and programming. Multivariate applications book series.
Hillsdale, N. J.: Lawrence Erlbaum Associates.
Byrne, M. B. (2006). Structural equation modeling with EQS: basic concepts,
applications, and programming (2, illustrated ed.): Routledge.
Byrne, B. M. (2009). Structural equation modeling with AMOS: basic concepts,
applications, and programming Multivariate applications book series
.U.S.A.: Routledge.
Byrne, B. M. (2010). Structural Equation Modeling with Mplus. U.K.: Taylor &
Francis Group
Cai, C., & Zhou, Z. (2009). Structural empowerment, job satisfaction, and turnover
intention of Chinese clinical nurses. Nursing & Health Sciences, 11(4), 397-
403.

194
Cameron, K. S., & Ettington, D. R. (1988). The conceptual foundations of
organizational culture. Higher Education: Handbook of Theory and Research,
New York: Agathon.
Cameron, K. S., & Quinn, R. E. (2006). Diagnosing and changing organizational
culture: based on the competing values framework (revised,
illustrated).U.S.A.: John Wiley and Sons.
Caplan, R. D. (1987) person-environment fit theory and organizations:
commensurate dimensions, time perspectives, and mechanisms, Journal of
Vocational Behavior. 31: 248-267
Casey, M., Saunders, J., & O’Hara, T. (2010). Impact of critical social empowerment
on psychological empowerment and job satisfaction in nursing and midwifery
settings. Journal of Nursing Management. 18(1), 24-34.
Careless, S.A. (2004). Does psychological empowerment mediate the relationship
between psychological climate and job satisfaction? Journal of Business and
Psychology. 18: 405–425.
Chang, H. T., & Chi, N. W. (2006). The effects of three-components model of
organizational and occupational commitment on nurses’ intentions to leave
organization and occupation: the mediator of organizational and occupational
leaving intentions. Journal of Human Resource Management. 6: 111–133
Chang, L. C., Shih, C. H., & Lin, S. M. (2010). The mediating role of psychological
empowerment on job satisfaction and organizational commitment for school
health nurses: A cross-sectional questionnaire survey. International journal of
nursing studies, 47(4): 427-433.
Chiang, C. F., & Jang, S. S. (2008). The antecedents and consequences of
psychological empowerment: the case of Taiwan's Hotel companies. Journal of
Hospitality & Tourism research. 32(1): 40-61.
Chiles, A. M., & Zorn, T. E. (1995). Empowerment in organization:employee's
perception of influences on empowerment. Applied communication research,
23(1): 1-25.
Chin, W. W. (1998). Issues and opinion on structural equation modeling, MIS
Quarterly. 22(1): 7-16.
Cho, J., Laschinger, H. K. S., & Wong, C. (2006). Workplace empowerment, work
engagement and organizational commitment of new graduate nurses.
Canadian Journal of Nursing Leadership. 19(3): 43-60.
195
Church, J. A. (2006). Empowerment, structure, process, and outcome in magnet and
non-magnet staff nurse practice: a quantitative study. (Doctoral dissertation).
University of Phoenix, U.S.A.
Clark, B. R. (1987). The Academic Life. Small Worlds, Different Worlds Princeton,
NJ: Carnegie Foundation for the Advancement of Teaching, Princeton
University Press.
Coffman, D. L., & MacCallum, R. C. (2005). Using parcels to convert path analysis
models into latent variable models. Multivariate Behavioral Research. 40(2):
235-259.
Conger, J. A., & Kanungo, R. N. (1988). The empowerment process: integration
theory and practice. Academy of Management Review. 13(3), 471-482.
Contreras-McGavin, M. (2004). changing colleges and universities through
individual empowerment: exploring the intersection between institutional
actors and their organizations. (Doctoral dissertation). University of Southern
California, U.S.A.
Crawford, A. M. (2008). Empowerment and organizational climate: an investigation
of mediating effects on the core-self evaluation, job satisfaction, organizational
commitment relationship. (Doctoral dissertation). UNIVERSITY OF Auburn,
U.S.A.
Davies, M. A., Laschinger, H. K. L., &Andrusyszyn, M. A. (2006). Clinical
educators’ empowerment, job tension, and job satisfaction: A test of Kanter’s
theory. Journal for Nurses in Staff Development. 22(2), 78-86.
DeCicco, J., Laschinger, H. K. S., & Kerr, M. (2006). Perceptions of empowerment
and respect: Effect on nurses’ organizational commitment in nursing home.
Journal of Gerontological Nursing. 32: 49-56
Dee. J. R., Alan B. Henkin. A. B., & Duemer, L.(2003). Structural antecedents and
psychological correlates of teacher empowerment. Teacher Empowerment.
41(3): 257-277.
Dermott, K. M., Laschinger, H. K. S., & Shamian, J. (1996). Work Empowerment
and Organizational Commitment. journal of Nursing Management, 27(5), 44-
47.
Dickson, P. R. (1992). Toward a theory of competitive rationality. Journal of
Marketing. 56: 69–83.
Dimmitt, M. A. (2004). Organizational culture, faculty culture, and faculty
professionalization in an urban community college system university of
Missouri-Kansas city, U.S.A.
Douglass, J. (2005). How all globalization is local: Countervailing forces and their
influence on Higher education markets? Higher Education.18: 445-473

196
Dunst, R. (1991). Issues in empowerment. Presentation before the February Annual
Convention of the Children’s' Mental and Service Policy. Tampa, Florida
(February1991).
Duvall, C. K. (1999). Developing individual freedom to act: Empowerment in the
knowledge organization. Participation & Empowerment: an international
journal. 7(8): 204-212.
Echiejile, I. (1994). Empowering disadvantaged employees. Empowerment in
Organizations 2(1): 31-37.
Eckel, P. D. and King, J. E. (2004). An Overview of Higher Education in the United
States: Diversity, Access and the Role of the Marketplace, Washington, DC:
American Council on Education.
Edward, C. R. (1992). Relationships among teacher and principal perceptions of
principal authenticity and degrees of faculty empowerment. (Doctoral
dissertation) University of Georgia, U.S.A.
Egan, T. M., Yang, B., & Bartlett, K. R. (2004). The effects of organizational
learning culture and job satisfaction on motivation to transfer learning and
turnover intention. Human resource development quarterly. 15(3): 279-301.
Farrell, A. M. (2010). Insufficient discriminant validity: A comment on Bove,
Pervan, Beatty, and Shiu (2009). Journal of Business Research. 63: 324–327.
Fisher, C. D., & Ashkanasy, N. M. (2000). The emerging role of emotions in work
life: an introduction. Journal of Organizational Behavior. 21 (2): 123-129.
Fralinger, B. (2007). Organizational culture at the university level: A study using the
OCAI instrument. Journal of College Teaching & Learning. 4(11): 85-98.
Fralinger, B., Olson, V., Pinto-Zipp, G. & DiCorcia, M. (2010). Organizational
culture at the university level: A follow-up study using the OCAI instrument,
Proceedings of 2010 EABR & ETLC Conference Proceedings, Dublin,
Ireland, June7-10, 2010. Dublin, Ireland.
Freidson, E. (1994). Professionalism reborn: theory, prophecy, and policy: Chicago:
University of Chicago Press.
Freidson, E. (2001). Professionalism: the third logic Chicago: University of Chicago
Press.
Fornell, C., & Larcker, D. F. (1981). Evaluating structural equation models with
unobservable variables and measurement error. Journal of Marketing
Research. 48: 39–50.

197
Ghani, A. Z., Raja Hussin, T. A. B., & Jussef, K. (2009). Antecedents of
psychological empowerment in the Malaysian private higher education
institutions. Journal of International Education Studies. 2(3): 161-165.
Gardenhour, C. (2008). Teachers’ Perceptions of Empowerment in Their Work
Environments as Measured by the Psychological Empowerment Instrument.
(Doctoral dissertation). East Tennessee State University, U.S.A.
Gaye, L., & Cullen, D. L. (1995). empowering the faculty; mentoring redirected and
renewed. ASHE-ERIC Higher Education Report No: 3. Jossey-Bass
publication.
Gebhardt, G. F., Carpenter, G. S., & Sherry J. F. JR. (2006). Creating a market
orientation, a longitudinal, multi-form, grounded: analysis of cultural
transformation. Journal of Marketing. 70(4): 37-55.
Gerbing, D. W. & Anderson, J. C. (1988). An updated paradigm for scale
development incorporating unidimensionality and its assessment, Journal of
Marketing Research. 25(1): 186-192.
Geroy, G. D., Wright, P. C., & Anderson, J. (1998). Strategic performance
empowerment model. Empowerment in Organizations. 6(2), 57-65.
Gifford, B. D., Zammuto, R. F., Goodman, E. A. (2002). The relationship between
hospital unit culture and nurses’ quality of work life. Journal of Healthcare
Management. 47: 13-26.
Gregory, B. T., Harris, S. G, Armenakis, A. A., & Shook, C. L. (2009).
Organizational culture and effectiveness: A study of values, attitudes, and
organizational outcomes. Journal of Business Research. 62(7): 673-679.
Glasman, N. S. (1995). Empowering middle managers in public education.
Empowerment in Organizations. 3(4): 20-25.
Gokenbach, V. (2004). the effects of an empowerment model intervention on
registered nurse trunover and absenteeism. University of Phoenix, U.S.A.
Gordon, G. & Whitchurch, C. (2007). Managing human resources in higher
education: The implications of a diversifying workforce. Higher Education
Management and Policy. 19 (2): 135-155.
Gormley, D. K. (2005). Organizational climate, role ambiguity, role conflict and
nurse faculty work role balance: Influence on organizational commitment
and turnover intention. (Doctoral dissertation) University of Cincinnati,
U.S.A.
Greasley, K., Bryman, A., Dainty, A., Price, A., Naismith, N. & Soetanto, R. (2008).
Understanding empowerment from an employee perspective: What does it
mean and do they want it? Team Performance Management. 14 (1): 39 – 55

198
Hackman, J. R., & Oldham, G. R. (1976). Motivation through the design of work:
Test of a theory. Organizational Behavior and Human Performance. 16: 250-
279.
Hackman, J. R., & Oldham, G. R. (1980). Work Redesign. Reading. MA: Addison
Wesley.
Hair, J., Black, B. Babin, B., Anderson, R. & Tatham, R. (2006). Multivariate Data
Analysis (6th
edition). Upper Saddle River, NJ: Prentice-Hall.
Hamilton, N. W. (2007). Faculty autonomy and obligation. Academe online. 2009.
from http://www.aaup.org/AAUP/pubsres/academe/2007/JF/Feat/hami.htm
Hanley, S. J., & Abell, S. C. (2002). Maslow and relatedness: Creating an
interpersonal model of self-actualization. Journal of Humanistic Psychology. 42(4):
37-57.
Hawks, J. (1999). Organizational culture and faculty use of empowering teaching
behaviors in selected schools of nursing. Nursing Outlook. 47: 67-72.
Hechanova, R., Franco, E. P., & Alampay, R. (2006). Psychological empowerment,
job satisfaction and performance among Filipino service workers. Asian
Journal of Social Psychology. 9: 72-78.
Henkin, A. B. and Marchiori, D. M. (2003). Empowerment and organizational
commitment of chiropractic faculty. Journal of Manipulative and
Physiological Therapeutics. 26(6): 275
Herzberg, F. (1966). Work and the Nature of Man. Cleveland: World Publishing Co.
Hofstede, G., Neuijen, B., Ohavy, D. D., & Sanders, G. (1990). Measuring
organizational cultures: A quantitative and qualitative study across twenty
cases. Administrative Sciences Quarterly, 35(2), 286-316.
Hoe, S. L. (2008). Issues and procedures in adopting structural equation modeling
technique. Journal of applied quantitative methods. 3(1): 76-83.
Holmbeck, G. N., Westhoven, V. C., & Phillips W. (2003). A multi-method, multi-
informant, and multi-dimensional perspective on psychosocial adjustment in
pre-adolescents with spin bifida. Journal of Consultant Clinical
Psychology.71: 782–796.
Honold, L. (1997). A review of the literature on employee empowerment.
Empowerment in Organizations. 5(4): 202-212.
Hoy, W. K., & Sweetland, S. R. (2001). Designing better schools: The meaning and
measure of enabling school structures. Educational Administration Quarterly.
37: 296-321.

199
Huck, S. W. (2004). Reading Statistics and Research. Boston: Pearson Education
Inc.
Huang, X., Shi, K., Zhang, Z., & Cheung, Y. (2006). The impact of participative
leadership behavior on psychological empowerment and organizational
commitment in Chinese state-owned enterprises: the moderating role of
organizational tenure. Asia Pacific Journal of Management. 23(3), 345-367.
Hung, C. J. (2005). A correlational study between junior high school teacher
empowerment and job satisfaction in Kaohsiung area of Taiwan (China).
(Doctoral dissertation). University of the Incarnate Word, U.S.A.
İpek, C. (2010). Predicting organizational commitment from organizational culture in
Turkish primary schools. Asia Pacific Education Review. 11(3): 371-385.
Ismail, A. (2007). European support for Advancement of Malaysian Research. Paper
presented at the Asia-Link Symposium Malaysia, December 2007.
Johnson, B. A. H. (2001). Organizational culture and job satisfaction as antecedents
for empowerment of associate degree nursing faculty. (Doctoral dissertation).
Georgia State University, U.S.A.
Johnson, B.A. (2009). Empowerment of nurses through organizational culture,
Nursing Education Perspectives. 30(1) 8-13.
Jusoff, K., & Samah, A. (2009) Enhancing Malaysian innovative research leadership
from an experiential perspective. International Education Studies. 2(3): 106-
113.
Kanter, R. M. (1977). Men and women of the corporation. New York: Basic books.
Kathrins, R. (2007). The Relationship of Leadership Style and Types of
Organizational Cultures to the Effectiveness and Employee Satisfaction in
Acute Care Hospital. (Doctoral dissertation). Touro University, U.S.A.
Kaye, B., & Jordan-Evans, S. (2001). Retaining key employees. Public Management.
83: 6-11.
Keiser, C. M. (2007). the relationship between teacher empowerment and
organizational commitment. (Doctoral dissertation). University of Virginia,
U.S.A.
Kim, D. (2004). Employment relations and human resource development in South
Korea explorations in Asia Pacific Business economics. Aldershotim:
Ashgate publishing.
Kim, T. K. (2008). How organizational culture affects the empowerment of social
workers?: Application of multilevel modeling to social work research, society
for social work and research The SSWR Annual Conference. USA. January
2008.

200
King, A.S. & Ehrhard, B. J. (1997). Empowerment the workplace: A commitment
cohesion exercise. Empowerment in Organizations. 5(3): 139 -150.
Kirkman, B. L. & Rosen, B. (1999). Beyond self-management: Antecedents and
consequences of team empowerment. The Academy of Management Journal.
42(1): 58-74.
Klecker, B., & Loadman, W. E. (1996). Dimensions of teacher empowerment:
identifying new roles for classroom teachers in restructuring schools. paper
presented at the annual meeting of the Mid-South Educational Research
Association. Alabama June 1996.
Klem, L. (2000). Structural equation modeling. In L.G. Grimm & P.R. Arnold (Eds.),
Reading and understanding more multivariate statistics. (pp. 227-260).
Washington, DC: American Psychological Association.
Kline, R. B. (2005). Principles and practice of structural equation modeling:
Methodology in the social sciences. New York: Guilford Press.
Knol, J., & Van Linge, R. (2009). Innovative behavior: the effect of structural and
psychological empowerment on nurses. Journal of Advanced Nursing. 65(2),
359-370.
Koberg, C. S., Boss, R. W., Senjem, J. C., & Goodman, E. A. (1999). Antecedents
and outcomes of empowerment: empirical evidence from the health care
industry. Group and Organization Management. 24: 71–91.
Koh, W. L., Steers, R. M., & Terborg, J. R. (1995). The effects of transformational
leadership on teacher attitudes and student performance in Singapore. Journal
of Organizational Behavior. 16: 319-333.
Komoo, I., Azman, N., & Aziz, Y. F. A. (2008). Malaysian research universities and
their performance indicators. Bulletin of Higher Education Research. 11(June):
1–28
Kraimer, M. L., Seibert, S. E., & Liden, R. C. (1999). Psychological empowerment
as multi-dimensional construct: a test of construct validity. Journal of
Educational and Psychology Measurement 59(1): 127-142.
Kusure, L. P., Mutanda, L., Mawere, D., & Dhliwayo, L. (2006). Factors influencing
research productivity among lecturers in teachers' colleges in Zimbabwe.
Southern African Journal of Education, Science and Technology 1(2), 118-
124.
Lambert, A. P. (2006). Faculty perceptions of empowerment, job satisfaction, and
commitment to organization in three Midwest universities. (Doctoral
dissertation). University of Missouri-Columbia, U.S.A.

201
Laschinger, H. K. S., & Havens, D. (1996). Staff nurse work empowerment and
perceived control over nursing practice, work satisfaction and work
effectiveness. Journal of Nursing Administration. 26(9): 27-35
Laschinger, H. K., & Wong, C. (1999). Staff nurse empowerment and collective
accountability: effect on perceived productivity and self rated work
effectiveness. Nursing Economics. 17(6): 308-316.
Laschinger, H. K. S., Finegan, J., Shamian, J., & Casier, S. (2000). Organizational
trust and empowerment in restructured health care settings: Effects on staff
nurse commitment. Journal of Nursing Administration. 30(9): 413-425.
Laschinger, H. K. S., Finegan, J., Shamian, J., & Wilk, P. (2001). Impact of
structural and psychological empowerment on job strain in nursing work
settings: expanding Kanter's model. Journal of Nursing Administration,
31(5), 260-272.
Laschinger, H.K.S., Finegan, J. & Shamian, J. (2001). The impact of workplace
empowerment and organizational trust on staff nurses' work satisfaction and
organizational commitment. Health Care Management Review. 6(3): 7-23.
Laschinger, H. K. S., Finegan, J., Shamian, J., & Wilk, P. (2004). A longitudinal
analysis of the impact of workplace empowerment on staff nurses' work
satisfaction. Journal of Organizational Behavior. 25(4): 527-545.
Laschinger, H. K. S. (2005). Research in nursing administration and nursing service
delivery: Building knowledge for evidence-based nursing administration
practice. In Smith, D. L. & Hibberd, N. J. (Eds.), Nursing leadership in
Canada (3rd
Ed). Toronto: Elsevier Science Ltd.
Laschinger, H. K. S., Purdy, N., & Almost, J. (2007). The impact of leader-member
exchange quality, empowerment, and core self evaluation on nurse managers’
job satisfaction. Journal of Nursing Administration. 37: 221-229
Laschinger, H. K. S., Wilk, P., Cho, J., & Greco, P. (2009). Empowerment,
engagement and perceived effectiveness in nursing work environments: does
experience matter? Journal of Nursing Management. 17(5), 636-646.
Laschinger, H., Finegan, J., & Wilk, P. (2009). Context matters: The impact of unit
leadership and empowerment on nurses’ organizational commitment. Journal
of Nursing Administration. 39: 228-235.
Laschinger, H., Leiter, M., Day, A., & Gilin, D. (2009). Workplace empowerment,
incivility, and burnout: Impact on staff nurse recruitment and retention
outcomes. Journal of Nursing Management. 17: 302-311.
Lashley, C. (1999). Employee empowerment in services: A framework for analysis.
Personnel Review. 5(4): 202-212.

202
Lautizi, M., Laschinger, H. K. S., & Ravazzolo, S. (2009). Workplace empowerment,
job satisfaction and job stress among Italian mental health nurses: an
exploratory study. Journal of Nursing Management. 17: 446-452.
Lawler, E. E., Mohrman, S., & Benson, G. (2001). Organizing for High
Performance: The chief executive officer Report on Employee Involvement,
total quality management, Reengineering, and Knowledge Management in
Fortune 1000 Companies. San Francisco: Jossey-Bass.
League of European Research Universities. (2003). Research Intensive Universities
as Engines for the Europe of Knowledge Belgium: League of European
Research Universities.
Lee, M., & Koh, J. (2001). Is empowerment really a new concept? International
Journal of Human Resource Management. 12: 684-695.
Lee, M. N. N. (1997). Malaysia. In G. A. Postiglione & G. C. L. Mak (Eds.), Asian
higher education: An international handbook and reference guide (pp. 173–
197). Westport, CT: Greenwood Press.
Lee, M. N. N. (2003). The academic profession in Malaysia and Singapore: between
bureaucratic and corporate cultures. In P. G. Altbach (Ed.). The decline of the
guru: the academic profession in the third world (pp. 338). New York:
Palgrave Macmillan
Lee, M. N. N. (2004). Malaysian universities toward equality, accessibility, and
quality. In P. G. Altbach & T. Umakoshi (Eds.). Asian universities: Historical
perspectives and contemporary challenges (pp. 377). Baltimore, MD: Johns
Hopkins University Press.
Lewis, L. S. (1998). Scaling the ivory tower: merit & its limits in academic careers.
New Brunswick, NJ: Transaction Publishers.
Liden, R. C. & Tewksbury, T. W. (1995). Empowerment and work teams. In G.R.
Ferris, S.D. Rosen, & D.T. Barnum (Eds.), Handbook of Human Resource
Management (pp.386-403). Cambridge, MA: Blackwell.
Liden, R., Wayne, S. J., Sparrow, R. T., (2000). An examination of the mediating
role of psychological empowerment on the relations between the job,
interpersonal relationships, and work outcomes. Journal of Applied
Psychology. 85 (3): 407–416.
Lightfoot, S. L. (1986). On Goodness in Schools: Themes of Empowerment.
Peabody Journal of Education, 63(3), 9-28.
Littrell, R. F. (2007). Influences on employee preferences for empowerment
practices by the Ideal Manager in China. International Journal of
Intercultural Relations. 31(1): 87-110.

203
Liu, Y. (2008). Taiwanese Nurses’ Empowerment and Participation in Decision
Making. (Doctoral dissertation). University of Texas, U.S.A.
Liu, C. H., Chang, L. C., Li, I. C., Liao, J. Y.,& Lin, C. I. (2006). Organizational and
psychological empowerment on organizational commitment and job
satisfaction among primary health professionals. Journal of Evidence Based
Nursing 2 (1): 5–13.
Loh, F. (2005). Crisis in Malaysia’s public universities? Balancing the pursuit of
academic excellence and the massification of tertiary education Aliran
Monthly, 25(10).
Locke, E. A. (1976). The nature and causes of job satisfaction. In M. D. Dunnette
(Ed.), Handbook of industrial and organizational psychology. (pp. 1297–
1349). Chicago: Rand McNally College Publication Company.
Lok, P. (1997). The influence of organizational culture, subculture, leadership style
and job satisfaction on organizational commitment. (Doctoral
dissertation).University of Technology, Sydney, Australia.
Lok, P. & Crawford, J. (1999). The relationship between commitment and
organizational culture, subculture, leadership styles, job satisfaction in
organizational change and development Leadership and Organizational
Development Journal. 20 (7): 365-373.
Lok, P. & Crawford, J (2001). Antecedents of organizational commitment and the
mediating role of job satisfaction Journal of Managerial Psychology. 16(8):
594-613.
Lok, P. & Crawford, J. (2004). The effect of organizational culture and leadership
style on job satisfaction and organizational commitment: A cross-national
comparison. Journal of Management Development. 22(3): 321-338.
Lok, P., Westwood, R., & Crawford, J. (2005). Perceptions of organizational
subculture and their significance for organizational commitment. Applied
Psychology: An International Review. 54(4): 490-514.
Logan, M. S. & Ganster, D. C. (2007). The effects of empowerment on attitudes and
performance: The role of social support and empowerment beliefs. Journal of
Management Studies. 44(8): 1523-1550.
Luby, C. E. (2006) A case of psychological empowerment of employees in a
community college. (Master thesis) University of Florida, USA. Available
from ProQuest Dissertations & Theses database. (UMI No. 3224579)
Lund, B. (2003). Organizational culture and job satisfaction. Journal of Business &
Industrial Marketing. 18(3): 219–236.

204
Lyons, T. F. (1971). Role clarity, need for clarity, satisfaction, tension, and
withdrawal. Organizational Behavior and Human Performance. 6: 99-110.
Machado, M. L. and Taylor, J. S. (2010). The struggle for strategic planning in
European higher education: the case of Portugal. Journal of Research in
Higher Education. 1(1): 1-20.
MacIntosh E. W., and Doherty, A. (2010). The influence of organizational culture on
job satisfaction and intention to leave. Sport Management Review. 13: 106–
17.
MacKinnon, D. P. (2000). Contrasts in multiple mediator models. In: R. J., Chassin,
L., Presson, C. C., Sherman, S. J. (Eds.), Multivariate Applications in
Substance Use Research: New Methods for New Questions (pp. 141–160).
New Jersey: Erlbaum, Mahwah.
Mallak, L. A., & Kurstedt, H. A., Jr. (1996). Understanding and using Empowerment
to change organizational culture. Industrial Management. 38(6): 8-10.
Malone, T. W. (1997). Is empowerment just a fad? control, decision making and IT.
Sloan Management Review. 38(2): 23-35.
Manojlovich, M., & Laschinger, H. K. S. (2002). The relationship of empowerment
and selected personality characteristics to nursing job satisfaction. Journal of
Nursing Administration. 32(11): 586-595.
Marchiori, D. M., & Henkin, A. B. (2003). Empowerment of chiropractic faculty: A
profile in context Journal of Manipulative and Physiological Therapeutics
26(1): 17-24.
Marsh, H. W., Balla, J. R., & McDonald, R. P. (1988) Goodness-of-fit indexes in
confirmatory factor analysis: The effect of sample size. Psychological
Bulletin. 103: 391-410.
Martin-Crawford, L. (1999). Empowerment in healthcare. Participation &
Empowerment: An International Journal, 7(1): 15-24.
Martin, J. (1992). Cultures in organizations: Three perspectives. New York: Oxford
University Press.
McBurnie, G., & Ziguras, C. (2001). The regulation of transnational higher education
in Southeast Asia: Case studies of Hong Kong, Malaysia and Australia.
Higher Education 42: 85-105.
McClelland, D. C. (1965). Toward a theory of motive acquisition. American
Psychologist, 20(5): 321-333.

205
Melnyk, B. M., Fineout-Overholt, E., Giggleman, M., & Cruz, R. (2010). Correlates
among cognitive beliefs, EBP implementation, organizational culture,
cohesion and job satisfaction in evidence-based practice mentors from a
community hospital system. Nursing Outlook. 58(6): 301-8.
Menon, S. T. (1995). Employee empowerment definition, measurement, and
construct validation. (Doctoral dissertation) McGill University, Canada.
Merriam, S. B., & Simpson, E. L. (2000). A guide to research for educators and
trainers of adults: Malabar, FL: Krieger Publishing Company.
Meyer, J. P., & Allen, N. J. (1991). A three-component conceptualization of
organizational commitment. human resource management review, 1(1), 61-
89.
Meyer, J. P., & Allen, N. J. (1997). Commitment in the workplace: theory, research,
and application. Thousand Oaks, CA: Sage publication.
Meyer, J. P., Allen, N. J., & Smith, C. A. (1993). Commitment to organizations and
occupations: Extension and test of a three-component conceptualization.
Journal of Applied Psychology. 78(4): 538-551.
Meyerson, S. (2007). Updating empowerment: the role of leadership and self-
reliance on the psychological and environmental aspects of empowerment.
University of Calgary, Calgary.
Mills, P. K. & Ungson, G. R. (2003). Reassessing the limits of structural
empowerment: organizational constitution and trust as controls. Academy of
Management Review. 28 (1): 143-53.
Ministry of Education. (2004). Establishment of research universities in Malaysia: A
concept paper. Kuala Lumpur, Ministry of Education.
Mizikaci, F. (2003). Quality systems and accreditation in higher education: an
overview of Turkish higher education. Quality in Higher Education. 9(1): 95-
106.
Mlczoch, M. (2002). Participation and Empowerment of unaccompanied minor
asylum seekers in Austria and the Netherlands. (Doctoral
dissertation).University of North London, U.K.
Mosadeghard, A. M. (2006). The impact of organizational culture on the successful
implementation of total quality management. The TQM Magazine. 18(6):
606-25.
Moses, I. (2007). Institutional Autonomy Revisited: Autonomy Justified and
Accounted. Higher Education Policy. 20: 261-274.
Mountjoy, M. S. (2001). Faculty perception of empowerment in private four-year
colleges (Doctoral dissertation). University of Missouri-Columbia, U.S.A.

206
Mowday, R. T., Porter, L. W., & Steers, R. M. (1982). Employee-organization
linkages: The psychology of commitment, absenteeism, and turnover. New
York: Academic Press.
Nedd, N. (2006). Kanter's structural theory of organizational empowerment. Nursing
Econ., 24(1): 13-18.
Neuhauser,P. C. (2002). Building a high-retention culture in healthcare:15 ways to
get good people to stay. The Journal of Nursing Administration. 32(9): 470-
478.
Neumann, Y., & Finaly-Neumann, E. (1990). The reward-support framework and
faculty commitment to their university. Research in Higher Education, 31(1),
75-97.
Newman, F., Couturier, L., & Scurry, J. (2004). The Future of Higher Education:
Rhetoric, Reality and the Risks of the Market: Jossey Bass.
Ning, S., Zhong, H., Libo, W., & Qiujie, L. (2009). The impact of nurse
empowerment on job satisfaction. Journal of Advanced Nursing, 65(12),
2642-2648.
Osborne, J. S. (2002). Components of empowerment and how they differentially
relate to employee job satisfaction, organizational commitment, and intent to
leave the job. (Doctoral dissertation).Vanderbilt University, U.S.A.
Page, N., & Czuba, C. E. (1999). Empowerment: What is it? Journal of Extension.
37(5): 1-7.
Park, J. S., Kim, T. H. (2009) Do types of organizational culture matter in nurse job
satisfaction and turnover intention?. Leadership in Health Services. 22(1):
20–38.
Patrick, A., Laschinger, H. K. S. (2006). The effect of structural empowerment and
perceived organizational support on middle level nurse managers’ role
satisfaction. Journal of Nurse Management. 14: 13-22.
Peters, T. & Waterman, R. (1982). In Search of Excellence. Sydney: Harper & Row.
Perkins, A. (2006). The relationship between social structure and sense of
empowerment for school personnel. (Doctoral dissertation).Michigan state
university, U.S.A.
Perkins, D. D., & Zimmerman, M. A. (1995). Empowerment theory, research, and
application. American Journal of Community Psychology. 23(5): 569-579.
Phillips, E., Berg, M., Rodriguez, C., & Morgan, D. A Case Study of Participatory
Action Research in a Public New England Middle School: Empowerment,

207
Constraints and Challenges. American Journal of Community Psychology.
46(1): 179-194.
Prasad, A. (2001). Understanding workplace empowerment as inclusion: A historical
investigation of the discourse of difference in the United States. Applied
Behavioral Science. 37(1): 51-59.
Preacher, K. J., & Hayes, A. F. (2008). Asymptotic and re sampling strategies for
assessing and comparing indirect effects in multiple mediator models.
Behavior Research Methods. 40: 879-891.
Quinn, R., & Spreitzer, G. (1997). The road to empowerment: seven questions every
leader should consider. Organizational Dynamics: 26(2): 37-49.
Quinn, R. E., & Rohrbaugh, J. (1983). A spatial model of effectiveness criteria:
Towards a competing values approach to organizational analysis.
Management Science.29(3): 363–377.
Rappaport, Swift, C. & Hess. R. (1984). Studies in empowerment: steps toward
understanding and action. New York: Haworth Press.
Rappaport, J. (1984). Studies in empowerment: Introduction to the issue. Prevention
in Human Services: 3: 1-7.
Reese, C. N. ( 2004). Leadership practices and empowerment strategies in associate
degree nursing program directors and the impact on the professional quality
of life, job satisfaction, and academic productivity of nursing faculty.
((Doctoral dissertation). University of North Carolina, U.S.A.
Rhoades, L, & Eisenberger, R. (2002). Perceived organizational support: A review of
the literature. Journal of Applied Psychology. 87: 698-714.
Rinehart, J. S., & Short, P. M. (1994). Job satisfaction and empowerment among
teacher leaders, reading recovery teachers and regular classroom teachers.
Education. 114(4): 570–580.
Robbins, S. P. (2001). Organizational Behavior (9, illustrated, revised ed.). New
Jersey: Prentice Hall.
Robbins, T. L., Crino, M. D., & Fredendall, L. D. (2002). An integrative model of
the empowerment process Human Resource Management Review. 12(3): 419-
443.
Rothstein, L.R. (1995). The empowerment effort that came undone. Harvard
Business Review. 73(1): 20-26
Salmi, J. (2009). The challenge of establishing world-class universities. U.S.A:
World Bank Publications.

208
Samad, S. (2007). Social structural characteristics and employee empowerment: The
role of proactive personality, International Review of Business Research
Papers. 3(4): 254-264.
Schein, E. H. (1996). Three cultures of management: The key to organizational
learning. Sloan Management Review 38(1): 234-256.
Schein, E.H. (2004) Organizational Culture and Leadership, 3rd Ed., Jossey-Bass
Schlesinger, L.A. & Heskett, J.L. (1991). Breaking the cycle of failure in services.
Sloan Management Review. 32(3): 17-28.
Schneider, J., Dowling, M., & Raghuram, S. (2007). Empowerment as a success
factor in start-up companies. Review of Managerial Science. 1(2): 167-184.
Schumacker, R. E. & Lomax, R. G. (2010). A beginner's guide to structural equation
modeling (3rd ed.). New York: Routledge.
Seibert, S. E., Silver, S. R. & Randolph, W. A. (2004). Taking empowerment to the
next level: A multiple-level model of empowerment, performance and
satisfaction. Academy of Management Journal. 47(3): 332-349.
Short, P.M. & Greer, J.T. (1997). Leadership in empowered schools. themes from
innovative efforts. New Jersey: Merrill.
Short, P. M., Greer, J. T., & Melvin, W. M. (1994). Creating empowered schools:
Lessons in change. Journal of Educational Research, 32(4), 38–52.
Short, P. M., & Johnson, P. E. (1994). Exploring the links among teacher
empowerment, leader power, and conflict. Education. 114(4): 581-593.
Short, P. M., & Rinehart, J. S. (1992). Empowerment within the school environment
school participant empowerment scale: Assessment of level of. empowerment
within the school environment. Educational and Psychological Measurement.
52(4): 951-961.
Siegall, M., & Gardner, S. (2000). Contextual factors of psychological
empowerment. Personnel Review. 29(6): 703-722.
Slaughter, S., & Rhoades, G. (2004). Academic capitalism and the new economy:
markets, state, and higher education: Baltimore: Johns Hopkins University
Press.
Smart J. C., & St. John, E. P. (1996). Organizational culture and effectiveness in
higher education: A test of the culture type and strong culture hypotheses.
Educational Evaluation and Policy Analysis. 18(3): 219-241.
Smart, J. C. & Umbach, P. D. (2007). Faculty and academic environments: using
Holland's theory to explore differences in how faculty structure

209
undergraduate courses. Journal of College Student Development. 48(2): 183-
195.
Smith, L. M., Andrusyszyn, M. A., & Laschinger, H. K. S. (2010). Effects of
workplace incivility and empowerment on newly-graduated nurses’
organizational commitment. Journal of Nursing Management. 18(8): 1004-
1015.
Snyder, M. (2002). State of the profession: academic research and access to
information. Academe online (2002 issues).
Soranastaporn, S. (2001). The relationship between the power of department chairs
and faculty conflict, empowerment, and compliance at Mahidol University in
Thailand. (Doctoral dissertation). Illinois State University, U.S.A.
Sparrowe, R. T. (1994). Empowerment in the hospitality industry: An exploration of
antecedents and outcomes. Journal of Hospitality & Tourism Research.
17(3): 51-73.
Spector, P. E. (1985). Measurement of human service staff satisfaction: development
of the job satisfaction survey. American Journal of Community Psychology.
13: 693-713.
Spector, P. E. (1997). Job satisfaction: Application, assessment, causes, and
consequences. Thousand Oaks, C.A: Sage publication.
Spreitzer, G. M. (1995). Psychological empowerment in the workplace: Dimensions,
measurement, and validation. Academy of Management Journal. 38(5): 1442-
1465.
Spreitzer, G. M. (1996). Social structural characteristics of psychological
empowerment. Academy of Management Journal, 39, 483-504.
Spreitzer, G. M. (1997). Toward a common ground in defining empowerment. In W.
A. Pasmore & R. W. Woodman (Eds), Research in organizational change
and development. Vol. 10 (pp.31-62). Greenwich, CT: JAI Press, Inc.
Spreitzer, G. M. (2006). Empowerment, In S. G. Rogelberg (Ed.), Encyclopedia of
Industrial and Organizational Psychology. (Vol.1). Thousand Oaks, CA:
Sage Publications.
Spreitzer, G. M., Janasz, S. C., & Quinn, R. E. (1999). Empowered to lead: the role
of psychological empowerment in leadership. Journal of Organizational
Behavior. 20: 511–526.
Spreitzer, G. M., Kizilos, M. A., & Nason, S. W. (1997). A dimensional analysis of
the relationship between psychological empowerment and effectiveness
satisfaction, and strain. Journal of Management. 23(5): 679-704.

210
Strazzeri, L. (2005). Managing motivation and commitment versus compensation and
research institutions. OECD Conference in Trends in the Management of
Human Resources. Paris. August 2005.
Stock, G. N., McFadden, K. L., & Gowen, C. R. (2006). Organizational culture,
critical success factors and the reduction of hospital errors. International
Journal of Production Economics. 106: 368-92.
Sweetland, S. R., & Hoy, W. K. (2000). School characteristics and educational
outcomes: Toward an organizational model of student achievement in middle
schools. Educational Administration Quarterly. 36(5): 703–729.
Tannenbaum, R. (1968). Control in Organizations. New York: McGraw-Hill.
Tarmo, S. (2007). Changes in organizational culture in schools and readiness of
teachers for those changes. Journal of Teacher Education for Sustainability.
8: 5-13.
Teichler, U. (2007). Germany and beyond. new dynamics for the academic
profession, the changing conditions for academic work and career in select
countries, Werkstattberichte, S. 15-38
Tierney, W.G. (1999). Building the responsive campus: Creating high performance
colleges and universities. Thousand Oaks: Sage publication.
Tierney, W. G. (2008). Trust and organizational culture in higher education. Cultural
Perspectives on Higher Education. 1: 27-41.
Thibault, J. W., & Kelley, H. (1959). Control in organizations. New York: McGraw
Wiley.
Thomas, k., & Velthouse, B. (1990). Cognitive element of empowerment: An
interpretive model of intrinsic motivation. Academy of Management Review
15(4): 666-681.
Thomas, K. W., & Tymon, W. G., Jr. (1994). Does empowerment always work:
Understanding the role of intrinsic motivation and personal interpretation?
Journal of Management Systems. 6(2): 1-13.
Tomarken, A. J., & Waller, N. G. (2005). Structural equation modeling: Strengths,
limitations, and misconceptions. Annual Review of Clinical Psychology.1: 31-
65.
Thompson, K. R., & Luthans, F. (1990). Organizational culture: A behavioral
perspective. In B. Schneider (Ed), Organizational climate and culture (pp.
319-344). San Francisco: Jossey-Bass.
Thompson T. L. (2003). Handbook of health communication. Communication Series.
New York, NY: Routledge.
211
Tomarken, A. J., & Waller, N. G. (2005). Structural equation modeling: Strengths,
limitations, and misconceptions. Annual Review of Clinical Psychology. 1:
31-65.
Thorndyke, L.E., Gusic, M.E., George, J.H. , Quillen, D.A. & Milner, R.J. (2006).
Empowering junior faculty: Penn State's faculty development and mentoring
program. Journal of the Association of American Medical Colleges. 81(7):
668-673.
Trivellas, P., & Dargenidou, D. (2009). Organizational culture, job satisfaction and
higher education service quality: The case of technological educational
institute of Larissa, The TQM Journal. 21 (4): 382-399.
Twati, J. M. & Gammack, J. G. (2006). The impact of organizational culture
innovation on the Adoption of IS/IT: The case of Libya. Journal of Enterprise
Information Management, 19(2): 175-191.
Tymon, W. G. Jr. (1988). An empirical investigation of a cognitive model of
empowerment. (Doctoral dissertation). Temple University, Philadelphia.
Ugboro, I. O., & Obeng, K. (2000). Top management leadership, employee
empowerment, job satisfaction, and customer satisfaction in TQM
organizations: an empirical study Journal of Quality Management 5(2), 247-
272.
Ugboro, I. O. (2006). Organizational commitment, job redesign, employee
empowerment and intent to quit among survivors of restructuring and
downsizing. Journal of Behavioral and Applied Management. 7(3), 232-257.
Umbach, P. D. (2007). Faculty cultures and college teaching. In R.P. Perry and J.C.
Smart. The Scholarship of Teaching and Learning in Higher Education: An
Evidence-Based Perspective. New York: Springer.
Vacharakiat, M. (2008). The relationships between empowerment, job satisfaction,
and organizational commitment between Filipino and American registered
nurses working in the U.S.A. (Doctoral dissertation). George Mason
University, U.S.A.
Van Vianen, A. E. M. (2000). Person–organization fit: the match between
newcomers' and recruiters' preferences for organizational cultures. Personnel
Psychology. 53(1): 113-149.
Vogt, J. F., & Murrell, K. L. (1990). Empowerment in organizations: how to spark
exceptional performance. San Diego, CA: University Associates.
Vroom, V. (1964). Work and Motivation. New York: Jon Wiley & Sons.

212
Wallach, E. (1983). Individuals and organization: the cultural match. Training and
Development Journal, 12(2), 28-35.
Wallach, V. A. & Mueller, C. W. (2006). Job characteristics and organizational
predictors of psychological empowerment among paraprofessionals within
human service organizations: An exploratory study. Journal of Administration
in Social Work. 30(1): 95-116.
Walumbwa, F. O., & Lawler, J. J. (2003). Building effective organizations:
transformational leadership, collectivist orientation, work-related attitudes, and
withdrawal behaviors in three emerging economies. International Journal of
Human Resource Management 14: 1083–1101.
Wan, E. (2005). Teacher empowerment as perceived by teachers in Hong Kong.
Teachers’ College Record. 107: 842-861.
Wang, H. C., Hwang, F. (2007). Study on organizational culture, organizational
commitment and attitude toward organizational reform comprehensive high
schools as example. The Journal of Human Resource and Adult Learning. 3(2):
189-198.
Wang, G. & Lee, P. D. (2009). Psychological empowerment and job satisfaction: an
analysis of interactive effects. Group Organization Management. 34(3): 271-
296
Weaver II, R. L., Mullins, D. G., Cotrell, H. W., & Michel, T. A. (1990). Faculty
dynamation: Guided empowerment Innovative Higher Education 14(2): 93-
105.
West, S. G., Finch, J. F. & Curran. P. J. (1995). Structural Equation Models with
Nonnormal Variables, in Structural Equation Modeling: Concepts, Issues and
Applications. Thousand Oaks: Sage Publications.
Wikinson, R., & Yussof, I. (2005). Public and private provision of higher education
in Malaysia: A comparative analysis. Higher Education. 50: 361-386.
Wilson, B., & Laschinger, H. K. S. (1994). Staff nurse perception of job
empowerment and organizational commitment. A test of Kanter's theory of
structural power in organizations. Journal of Nursing Administration. 24(4):
39-47.
Wiley, D. M. (1999). Impact of locus of control and empowerment on organizational
commitment. (Doctoral dissertation).United States International University,
U.S.A.
Winter-Collins, A. & McDaniel, A. (2000). Sense of belonging and new job graduate
satisfaction. Journal for Nurses in Staff Development. 16(3): 103-111.

213
Wood, F. (2005). National capacity, competitiveness and scientific excellence.
OECD Conference on Trends in the Management of Human Resources. Paris.
August 2005.
Womack, C. E., & Loyd, G. (2004). Quintessential leadership: leading by design
College Quarterly. 7(2): 1-11.
World Bank (2007). Empowerment in Practice: Analysis and Implementation A
World Bank Learning Module Washington. D.C.
Wu, F. Y. (2006). A study of leadership styles and foreign English teachers job
satisfaction in adult English cram schools of Taipei and Kaohsiung cities in
Taiwan. (Doctoral dissertation). University of Incarnate Word, U.S.A.
Wu, V., & Short, P. M. (1996). The relationship of empowerment to teacher job
commitment and job satisfaction. Journal of Instructional Psychology. 23(1):
85-89.
Yang, S. & Choi, S.O. (2009). Employee empowerment and team performance:
Autonomy, responsibility, information, and creativity Team Performance
Managemen.15 (5/6): 289-301.
Yiing, L. H., & Bin Ahmad. K. Z. (2009). The moderating effects of organizational
culture on the relationships between leadership behavior and organizational
commitment and between organizational commitment and job satisfaction
and performance. Leadership & Organization Development Journal. 30(1):
53-86.
Zammuto, R., & Krakower, J. (1991). Quantitative and qualitative studies of
organizational culture. In R. Woodman & W. Pasmore (Eds.), Research in
organizational change and development (pp. 83-114). Greenwich, CT: JAI
Press Inc.
Zimmerman, M. A. (1990). Taking aim on empowerment research: On the
distinction between individual and psychological conceptions. American
Journal of Community Psychology. 18(1): 169-177.
Zuber-Skerritt, O. (1993). Research and development in management and higher
education: A personal explication. Occasional Paper No 2. The Tertiary
Education Institute. Brisbane: University of Queensland.
Zuber-Skerritt, O. (1994). Action research. in Professional development in higher
education: a theoretical framework for action research (pp. 290): New
Jersey: Routledge.

214
7 APPANDICES

215
7.1 APPENDIX A1: Demographic information sheet
Age:
Gender:
Male:
Female:
Typical number of hours worked per week: …………… hours
Academic Department: ………………………………………………..
How many years have you been at your current university?
……………………...Years
Approximate yearly gross personal income:
………………………RM
Approximate yearly gross family income:
……………………...RM
Faculty position/rank held: ………………………………………..
Demographic Information:

216
7.2 APPENDIX A2: Conditions of Work Effectiveness Questionnaire – II
Please circle one number for each question that comes closest to reflecting your
opinion about the university in which you work.
1) Very Strongly Disagree
2) Strongly Disagree
3) Disagree
4) Neutral
5) Agree
6) Strongly Agree
7) Very Strongly Agree
1 My work place is challenging
1 2 3 4 5 6 7
2 I have chance to gain new skills and
knowledge on the job.
1 2 3 4 5 6 7
3 In my work place there are tasks that use all
of my own skills and knowledge.
1 2 3 4 5 6 7
4 I have access to information about the
current state of the university.
1 2 3 4 5 6 7
5 I have access to information about the
values of top management.
1 2 3 4 5 6 7
6 I have access to information about the goals
of top management
1 2 3 4 5 6 7
7 My present job give me support to the
specific information about things I do well.
1 2 3 4 5 6 7
8 My present job give me support to the
specific comments about things I could
improve.
1 2 3 4 5 6 7
9 My present job gives me support to the
helpful hints or problem solving advice.
1 2 3 4 5 6 7
10 There is time available to do necessary
paperwork.
1 2 3 4 5 6 7
11 There is time available to accomplish job
requirements.
1 2 3 4 5 6 7
12 I can acquire temporary help when needed
in my work place.
1 2 3 4 5 6 7
13 In my work setting there are rewards for
innovation on the job. 1 2 3 4 5 6 7
Structural Empowerment Instrument:

217
14 There are amount of flexibility in my job. 1 2 3 4 5 6 7
15 There are amount of visibility of my work-
related activities within the institution.
1 2 3 4 5 6 7
16 I have opportunity for collaborating on
students with lecturers.
1 2 3 4 5 6 7
17 I have opportunity for being sought out by
peers for help with problems.
1 2 3 4 5 6 7
18 I have opportunity for being sought out by
administrators for help with problems.
1 2 3 4 5 6 7
19 I have opportunity for seeking out ideas
from professionals other than lecturers.
1 2 3 4 5 6 7
20 Overall, my current work environment
empowers me, accomplish in an effective
manner.
1 2 3 4 5 6 7
21 Overall, I consider my workplace to be an
empowering environment.
1 2 3 4 5 6 7

218
7.3 APPENDIX A3: Organizational Culture Assessment Instrument
Please circle one number for each question that comes closest to reflecting your
opinion about the university in which you work.
1) Very Strongly Disagree
2) Strongly Disagree
3) Disagree
4) Neutral
5) Agree
6) Strongly Agree
7) Very Strongly Agree
1 The university is a very personal place. It
is like an extended family. People seem to
share a lot of themselves.
1 2 3 4 5 6 7
2 The university is a very dynamic and
entrepreneurial place. People are willing
to stick their necks out and take risks.
1 2 3 4 5 6 7
3 The university is very results-oriented. A
major concern is with getting the job
done. People are very competitive and
achievement-oriented.
1 2 3 4 5 6 7
4 The university is a very controlled and
structured place. Formal procedures
generally govern what people do.
1 2 3 4 5 6 7
5 The leadership in the university is
generally considered to exemplify
mentoring, facilitating, or nurturing.
1 2 3 4 5 6 7
6 The leadership in the university is
generally considered to exemplify
entrepreneurship, innovating or risk
taking.
1 2 3 4 5 6 7
7 The leadership in the university is
generally considered to exemplify a no-
nonsense, aggressive results-oriented
focus.
1 2 3 4 5 6 7
8 The leadership in the university is
generally considered to exemplify
coordinating, organizing, or smooth-
running efficiency.
1 2 3 4 5 6 7
Organizational Culture Assessment Instrument

219
9 The management style in the university is
characterized by teamwork, consensus,
and participation.
1 2 3 4 5 6 7
10 The management style in the university is
characterized by individual risk-taking,
innovation, freedom, and uniqueness.
1 2 3 4 5 6 7
11 The management style in the university is
characterized by hard-driving
competitiveness, high demands, and
achievement.
1 2 3 4 5 6 7
12 The management style in the university is
characterized by security of employment,
conformity, predictability, and stability in
relationships.
1 2 3 4 5 6 7
13 The glue that holds the university together
is loyalty and mutual trust. Commitment
to this university runs high.
1 2 3 4 5 6 7
14 The glue that holds the university together
is commitment to innovation and
development. There is an emphasis on
being on the cutting edge.
1 2 3 4 5 6 7
15 The glue that holds the university together
is the emphasis on achievement and goal
accomplishment. Aggressiveness and
winning are common themes.
1 2 3 4 5 6 7
16 The glue that holds the university together
is formal rules and policies. Maintain a
smooth-running university is important.
1 2 3 4 5 6 7
17 The university emphasized human
development. High trust, openness, and
participation persist.
1 2 3 4 5 6 7
18 The university emphasizes acquiring new
resources and creating new challenges.
Trying new things and prospecting for
opportunities are valued.
1 2 3 4 5 6 7
19 The university emphasizes competitive
actions and achievement. Hitting stretch
targets and wining in the marketplace are
dominants.
1 2 3 4 5 6 7

220
20 The university emphasizes permanence
and stability. Efficiency, control and
smooth operations are important.
1 2 3 4 5 6 7
21 The university defines success on the
basis of the development of human
resources, teamwork, employee
commitment, and concern for people.
1 2 3 4 5 6 7
22 The university defines success on the
basis of having the most unique or newest
products. It is a product leader and
innovator.
1 2 3 4 5 6 7
23 The university defines success on the
basis of winning in the marketplace and
out placing the competition.
1 2 3 4 5 6 7
24 1. The university defines success on the
2. basis efficacy.
1 2 3 4 5 6 7

221
7.4 APPENDIX A4: Faculty empowerment scale
Please circle one number for each question that comes closest to reflecting your
opinion about the university in which you work.
1) Very Strongly Disagree
2) Strongly Disagree
3) Disagree
4) Neutral
5) Agree
6) Strongly Agree
7) Very Strongly Agree
1 3. I am given the responsibility to monitor
4. Programs.
1 2 3 4 5 6 7
2 5. I function in a professional environment. 1 2 3 4 5 6 7
3 6. I believe that I have earned respect. 1 2 3 4 5 6 7
4 7. I believe that I am helping students
8. become independent learners.
1 2 3 4 5 6 7
5 9. I have control over daily schedules. 1 2 3 4 5 6 7
6 10. I believe that I have the ability to get
11. things done.
1 2 3 4 5 6 7
7 12. I make decisions about the
13. implementation of new programs in
14. the department.
1 2 3 4 5 6 7
8 15. I am treated as a professional. 1 2 3 4 5 6 7
9 16. I believe that I am very effective. 1 2 3 4 5 6 7
10 17. I believe that I am empowering students. 1 2 3 4 5 6 7
11 18. I am able to teach as I choose. 1 2 3 4 5 6 7
12 19. I participate in staff development. 1 2 3 4 5 6 7
13 20. I make decisions about the selection of
21. other lecturers in my department.
1 2 3 4 5 6 7
14 22. I have the opportunity for professional
23. Growth.
1 2 3 4 5 6 7
15 24. I have the respect of my colleagues. 1 2 3 4 5 6 7
16 25. I feel that I am involved in an important
26. program for students
1 2 3 4 5 6 7
Psychological Empowerment Instrument

222
17 27. I have the freedom to make decisions on
28. what is taught
1 2 3 4 5 6 7
18 29. I have the freedom to make decisions on
30. research topics.
1 2 3 4 5 6 7
19 31. I believe that I am having an impact. 1 2 3 4 5 6 7
20 32. I am involved in department budget
33. decisions.
1 2 3 4 5 6 7
21 34. I work in a department where students
35. come first.
1 2 3 4 5 6 7
22 36. I have the support and respect of my
37. colleagues.
1 2 3 4 5 6 7
23 38. I see students learn. 1 2 3 4 5 6 7
24 39. I make decisions about curriculum. 1 2 3 4 5 6 7
25 40. I am a decision maker. 1 2 3 4 5 6 7
26 41. I am given the opportunity to teach other
42. academics.
1 2 3 4 5 6 7
27 43. I am given the opportunity to continue
44. learning.
1 2 3 4 5 6 7
28 45. I have a strong knowledge base in the
46. areas in which I teach.
1 2 3 4 5 6 7
29 47. I believe that I have the opportunity to
48. grow by working daily with student
1 2 3 4 5 6 7
30 49. I believe that I have the opportunity to
50. influence other staff.
1 2 3 4 5 6 7
31 51. I can determine my own schedule. 1 2 3 4 5 6 7
32 52. I have the opportunity to collaborate with
53. other academics in my department.
1 2 3 4 5 6 7
33 54. I perceive that I am making a difference. 1 2 3 4 5 6 7
34 55. Administrators and other academics solicit
56. my advice.
1 2 3 4 5 6 7
35 57. I believe I am good at what I do. 1 2 3 4 5 6 7
36 58. I can plan my own schedule. 1 2 3 4 5 6 7
37 59. I perceive that I have an impact on other
60. academics and students.
1 2 3 4 5 6 7
38 61. My advice is solicited by other staffs. 1 2 3 4 5 6 7
39 62. I have an opportunity to teach other
63. academics about innovative ideas.
1 2 3 4 5 6 7

223
7.5 APPENDIX A5: Job Satisfaction Survey
Please circle one number for each question that comes closest to reflecting your
opinion about the university in which you work.
1) Very Strongly Disagree
2) Strongly Disagree
3) Disagree
4) Neutral
5) Agree
6) Strongly Agree
7) Very Strongly Agree
1 I feel I am being paid a fair amount for the
work I do.
1 2 3 4 5 6 7
2 There is really too little chance for
promotion on my job.
1 2 3 4 5 6 7
3 Head of department is quite competent in
doing his/her Job.
1 2 3 4 5 6 7
4 I am not satisfied with the benefits I
receive.
1 2 3 4 5 6 7
5 When I do a good job, I receive the
recognition for it that I should receive.
1 2 3 4 5 6 7
6 Many of our rules and procedures make
doing a good job difficult.
1 2 3 4 5 6 7
7 I like the people I work with. 1 2 3 4 5 6 7
8 I sometimes feel my job is meaningless. 1 2 3 4 5 6 7
9 Communications seem good with in this
department.
1 2 3 4 5 6 7
10 Raises are too few and far between. 1 2 3 4 5 6 7
11 Those who do well on the job stand a fair
chance of being promoted.
1 2 3 4 5 6 7
12 Head of department is unfair to me. 1 2 3 4 5 6 7
13 The benefits we receive are as good as
most other organizations offer.
1 2 3 4 5 6 7
14 I do not feel that the work I do is
appreciated.
1 2 3 4 5 6 7
15 My efforts to do a good job are seldom
blocked by red tape.
1 2 3 4 5 6 7
Job Satisfaction Survey
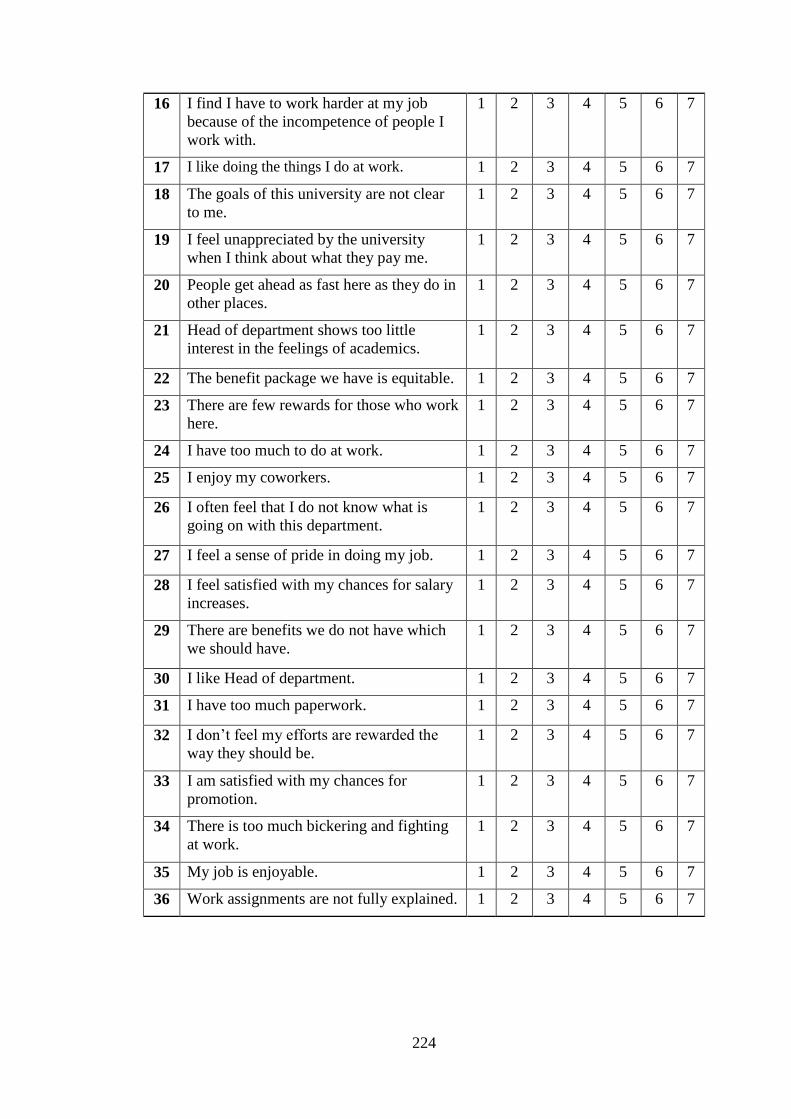
224
16 I find I have to work harder at my job
because of the incompetence of people I
work with.
1 2 3 4 5 6 7
17 I like doing the things I do at work. 1 2 3 4 5 6 7
18 The goals of this university are not clear
to me.
1 2 3 4 5 6 7
19 I feel unappreciated by the university
when I think about what they pay me.
1 2 3 4 5 6 7
20 People get ahead as fast here as they do in
other places.
1 2 3 4 5 6 7
21 Head of department shows too little
interest in the feelings of academics.
1 2 3 4 5 6 7
22 The benefit package we have is equitable. 1 2 3 4 5 6 7
23 There are few rewards for those who work
here.
1 2 3 4 5 6 7
24 I have too much to do at work. 1 2 3 4 5 6 7
25 I enjoy my coworkers. 1 2 3 4 5 6 7
26 I often feel that I do not know what is
going on with this department.
1 2 3 4 5 6 7
27 I feel a sense of pride in doing my job. 1 2 3 4 5 6 7
28 I feel satisfied with my chances for salary
increases.
1 2 3 4 5 6 7
29 There are benefits we do not have which
we should have.
1 2 3 4 5 6 7
30 I like Head of department. 1 2 3 4 5 6 7
31 I have too much paperwork. 1 2 3 4 5 6 7
32 I don’t feel my efforts are rewarded the
way they should be.
1 2 3 4 5 6 7
33 I am satisfied with my chances for
promotion.
1 2 3 4 5 6 7
34 There is too much bickering and fighting
at work.
1 2 3 4 5 6 7
35 My job is enjoyable. 1 2 3 4 5 6 7
36 Work assignments are not fully explained. 1 2 3 4 5 6 7
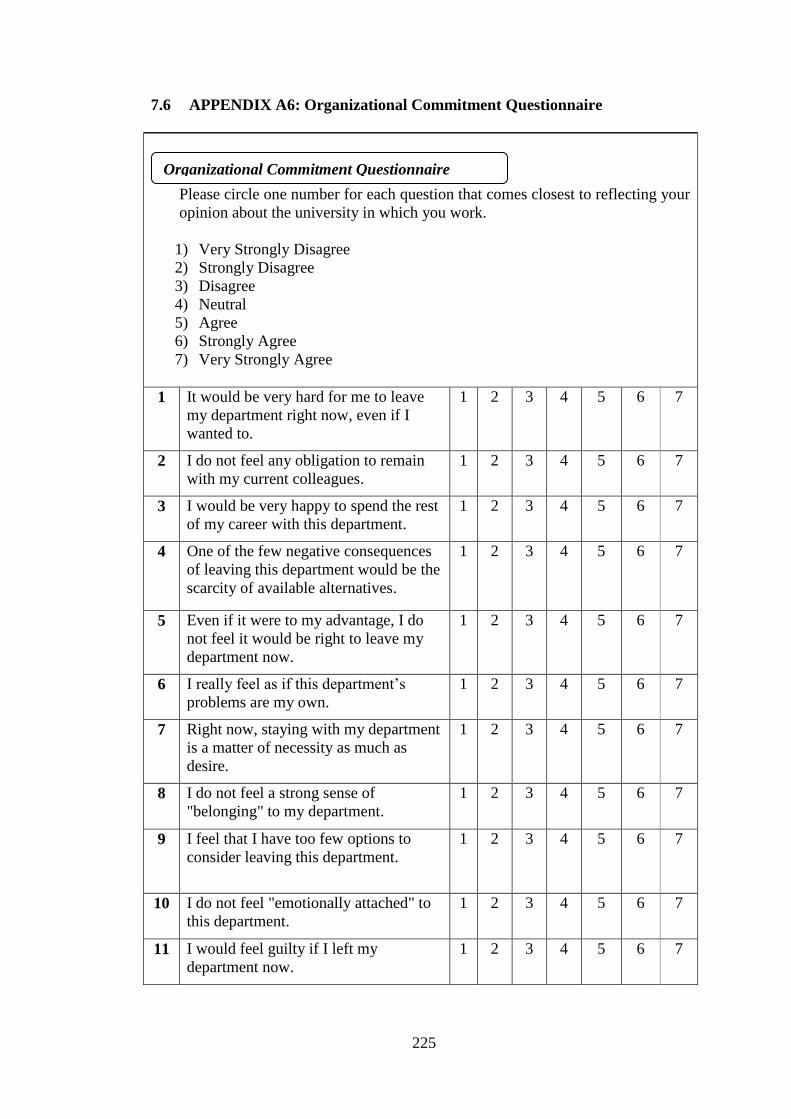
225
7.6 APPENDIX A6: Organizational Commitment Questionnaire
Please circle one number for each question that comes closest to reflecting your
opinion about the university in which you work.
1) Very Strongly Disagree
2) Strongly Disagree
3) Disagree
4) Neutral
5) Agree
6) Strongly Agree
7) Very Strongly Agree
1 It would be very hard for me to leave
my department right now, even if I
wanted to.
1 2 3 4 5 6 7
2 I do not feel any obligation to remain
with my current colleagues.
1 2 3 4 5 6 7
3 I would be very happy to spend the rest
of my career with this department.
1 2 3 4 5 6 7
4 One of the few negative consequences
of leaving this department would be the
scarcity of available alternatives.
1 2 3 4 5 6 7
5 Even if it were to my advantage, I do
not feel it would be right to leave my
department now.
1 2 3 4 5 6 7
6 I really feel as if this department’s
problems are my own.
1 2 3 4 5 6 7
7 Right now, staying with my department
is a matter of necessity as much as
desire.
1 2 3 4 5 6 7
8 I do not feel a strong sense of
"belonging" to my department.
1 2 3 4 5 6 7
9 I feel that I have too few options to
consider leaving this department.
1 2 3 4 5 6 7
10 I do not feel "emotionally attached" to
this department.
1 2 3 4 5 6 7
11 I would feel guilty if I left my
department now.
1 2 3 4 5 6 7
Organizational Commitment Questionnaire

226
12 I do not feel like "part of the family" at
my department.
1 2 3 4 5 6 7
13 This university deserves my loyalty. 1 2 3 4 5 6 7
14 If I had not already put so much of
myself into this department, I might
consider working elsewhere.
1 2 3 4 5 6 7
15 I would not leave my department right
now because I have a sense of
obligation to the people in it.
1 2 3 4 5 6 7
16 This department has a great deal of
personal meaning for me.
1 2 3 4 5 6 7
17 Too much of my life would be
disrupted if I decided I wanted to leave
my department now.
1 2 3 4 5 6 7
18 I owe a great deal to my department. 1 2 3 4 5 6 7

227
7.7 APPENDIX B1: Assessment of normality (Group number1)
Variable min max skew c.r. kurtosis c.r.
jsf6 4.000 21.000 -.235 -1.455 -.545 -1.688
jsf5 4.000 28.000 -.071 -.437 .230 .711
jsf4 4.000 28.000 -.153 -.946 -.260 -.803
jsf2 14.000 35.000 -.252 -1.558 -.446 -1.380
jsf1 11.000 70.000 -.303 -1.875 -.439 -1.360
Sf4 1.000 7.000 -.381 -2.359 -.738 -2.285
Sf3 1.000 7.000 -.481 -2.981 -.422 -1.307
Sf2 1.000 7.000 -.588 -3.639 .056 .175
Sf1 1.000 7.000 -.855 -5.292 .636 1.967
Se3 1.000 7.000 -.634 -3.926 .211 .653
Se2 1.000 7.140 -.710 -4.399 .519 1.607
Se1 1.000 7.000 -.349 -2.162 -.872 -2.700
Sb3 1.000 7.000 -.380 -2.351 -.586 -1.815
Sb2 1.000 7.000 -.625 -3.868 -.451 -1.396
Sb1 1.000 7.000 -.859 -5.318 .264 .819
Sd3 1.000 7.000 -1.073 -6.645 1.377 4.261
Sd2 1.000 7.000 -.944 -5.843 .696 2.154
Sd1 1.000 7.000 -.616 -3.815 -.455 -1.407
Sc3 1.000 7.000 -.453 -2.806 -.076 -.236
Sc2 1.000 7.000 -.519 -3.212 -.222 -.686
Sc1 1.000 7.000 -.413 -2.559 -.253 -.784
Sa3 1.000 7.002 -1.243 -7.694 1.842 5.703
Sa2 1.000 7.000 -.993 -6.150 1.434 4.439
Sa1 1.000 7.000 -.663 -4.104 -.297 -.920
Cf1 1.000 7.000 -.402 -2.489 -.359 -1.111
Ce1 1.000 7.000 -.484 -2.999 -.459 -1.422
Cd1 1.000 7.000 -.540 -3.342 .095 .295
Cc1 1.000 7.000 -.229 -1.421 -.693 -2.147
Cb1 1.000 7.000 -.416 -2.579 -.742 -2.295
Ca1 1.000 7.000 -.533 -3.302 -.501 -1.550
IM1 2.000 14.000 -.673 -4.169 .715 2.214
IM2 4.000 14.000 -.412 -2.553 -.158 -.489
SS1 10.000 21.000 -.412 -2.552 -.117 -.362
SS2 9.000 21.000 -.504 -3.119 .478 1.481
AT1 2.000 14.000 -.568 -3.514 -.121 -.374
AT2 2.000 14.000 -.869 -5.381 .830 2.568
ST1 6.000 14.000 -.683 -4.231 .815 2.522
ST2 5.000 14.000 -.655 -4.053 .585 1.812
PG1 4.000 20.000 -.588 -3.640 -.199 -.616
PG2 6.000 21.000 -.736 -4.554 .561 1.737
DC1 5.000 27.000 -.490 -3.034 -.376 -1.163
DC2 3.000 21.000 -.580 -3.589 -.130 -.404

228
Variable min max skew c.r. kurtosis c.r.
dc3 3.000 20.000 -.221 -1.366 -.539 -1.670
O18 1.000 7.000 -.521 -3.224 -.195 -.605
O15 1.000 7.000 -.925 -5.729 .518 1.603
O13 1.000 7.000 -.538 -3.332 -.015 -.045
O5 1.000 7.000 -.491 -3.037 -.421 -1.304
O2 1.000 7.000 -.293 -1.816 -.826 -2.558
O16 1.000 7.000 -.784 -4.853 .462 1.432
O12 1.000 7.000 -.564 -3.495 -.300 -.930
O10 1.000 7.000 -.857 -5.309 .119 .367
O8 1.000 7.000 -.716 -4.435 .209 .648
O6 1.000 7.000 -.616 -3.811 .397 1.229
O3 1.000 7.352 -.601 -3.722 -.575 -1.779
Multivariate
518.304 50.537

229
7.8 APPENDIX B2: (Mahalanobis distance) (Group number1)
Observation number Mahalanobis d-squared p1 p2
115 140.481 .000 .000
82 128.181 .000 .000
42 125.525 .000 .000
94 119.663 .000 .000
58 117.924 .000 .000
45 116.099 .000 .000
80 113.285 .000 .000
101 112.712 .000 .000
60 110.793 .000 .000
36 107.209 .000 .000
9 106.148 .000 .000
100 103.113 .000 .000
61 102.606 .000 .000
10 98.713 .000 .000
124 98.330 .000 .000
127 97.568 .000 .000
139 97.265 .000 .000
19 97.246 .000 .000
97 94.626 .001 .000
68 93.458 .001 .000
46 89.920 .002 .000
149 88.286 .002 .000
11 87.911 .002 .000
53 86.622 .003 .000
17 86.267 .003 .000
6 85.934 .004 .000
48 85.708 .004 .000
186 85.432 .004 .000
151 81.934 .008 .000
183 81.819 .009 .000
14 80.699 .011 .000
150 80.580 .011 .000
18 80.449 .011 .000
12 80.411 .011 .000
62 79.994 .012 .000
24 79.918 .013 .000
4 79.654 .013 .000
198 79.654 .013 .000
106 76.200 .025 .000
105 75.076 .030 .000
76 74.994 .031 .000
130 74.815 .032 .000

230
Observation number Mahalanobis d-squared p1 p2
99 73.922 .037 .000
54 72.705 .046 .000
47 71.923 .052 .000
160 70.034 .070 .000
211 69.629 .075 .000
85 69.629 .075 .000
15 69.125 .081 .000
157 68.975 .082 .000
96 68.535 .088 .000
21 68.452 .089 .000
181 66.218 .123 .000
173 65.797 .130 .000
144 65.797 .130 .000
64 65.455 .137 .000
57 65.077 .144 .000
188 64.971 .146 .000
179 64.818 .149 .000
75 64.709 .151 .000
195 64.695 .151 .000
1 64.695 .151 .000
191 63.414 .178 .000
27 62.919 .190 .001
216 62.761 .194 .001
107 62.761 .194 .000
103 62.759 .194 .000
110 62.716 .195 .000
219 62.716 .195 .000
69 62.148 .209 .000
184 61.647 .221 .001
59 61.647 .221 .001
140 61.528 .225 .001
122 61.419 .228 .001
206 61.147 .235 .001
70 61.147 .235 .001
55 60.038 .266 .013
79 60.037 .266 .009
197 60.008 .267 .006
3 60.008 .267 .004
192 59.773 .274 .006
117 59.535 .281 .008
164 59.535 .281 .005
95 59.322 .288 .007
13 58.966 .299 .013
155 58.471 .315 .033

231
Observation number Mahalanobis d-squared p1 p2
90 58.188 .324 .047
137 57.200 .357 .230
226 57.200 .357 .191
20 57.106 .360 .182
205 56.821 .370 .233
35 56.821 .370 .194
152 56.724 .374 .187
66 56.668 .376 .168
38 56.496 .382 .183
109 56.439 .384 .165
218 56.439 .384 .133
185 56.412 .385 .112
56 56.412 .385 .089
147 56.231 .391 .100

232
OPPORTUNITY
INFORMATION
SUPPORT
RESOURCES
FORMAL POWER
INFORMAL POWER
Sa2
e1
E2
e3
e4
e5
e8
e10
e12
e13
e14
e11
e7
e9
e6
e15
e16
e17
e18
e19
Sa1
Sa3
Sb1
Sb2
Sb3
Sc1
Sc2
Sc3
Sd1
Sd2
Sd3
Se1
Se2
Se3
Sf1
Sf2
Sf3
Sf4
.60
.61
.55
.70
.91
.91
.86
.93
.87
.69
.79
.86
.75
.57
.74
.65
.77
.83
.77
.55
.64 .62
.56
.52
.82
.47
.78
.71
.79
.81
.80
.77
.54
.79
7.9 APPENDIX C1: First-order CFA of Structural Empowerment

233
CLAN CULTURE
ADHOCRACY
CULTURE
MARKET
CULTURE
HIERARCHY
CULTURE
Cb1
e1
e2
e3
e4
e5
e8
e10
e12
e13
e14
e11
e7
e9
e6
e15
e18
e19
e20
e21
Ca1
Cc1
Cd1
Ce1
Cf1
Ca2
Cb2
Cc2
Cd2
Ce2
Cf2
Ca3
Cc3
Cd3
Cb4
Cc4
Ce4
Cf4
.65
.87
.91
.86
.89
.81
.76
.73
.70
.52
.78
.66
.51
.53
Ce3
Cf3
e16
e17
.87
.62
.83
.80
.77
.80
.77
.69
.78
.81
.68
.83
.84
7.10 APPENDIX C2: First-order CFA of Organizational Culture

234
DECISION MAKING
DC3
DC1
DC2
PROFESSIONAL GROWTH
PG1
PG2
STATUS
ST1
ST2
SELF-EFFICACY
SS2
SS1
AUTONOMY
IMPACT
AU1
AU2
IM1
IM2
e4
e5
e6
e12
e13
e18
e19
e22
e23
e31
e32
e28
e27
.96
.75
.88
.86
.82
.67
.86
.67
.86
.69
.71
.77
.76
.88
.89
.90
.86
.94
.62
.66
.75
.96
.85
.76
.93
.71
.81
.93
7.11 APPENDIX C3: First-order CFA of Psychological Empowerment

235
PAY
J1
J10
J19
J11
J3
J33
J20
J28
SUPERVISION
J12
J21
J30
J4
FRIDGE BENEFITS
J29
J5
J23CONTIGENT
REWARDS
J32
J6
J15
J14
J24
COWORKERS
NATURE OF
WORK
J31
J7
J16
J25
J8
J27
J17
e9
e1
e2
e3
e4
e5
e6
e7
e8
e10
e11
e12
e13J13
e15
e16
e17
e18
e19
e21
e20
e22
e25
e26
e28
e29
e30
e23
e24
J22 e14
.55
.77
.51
.79
.46
.75
.75
.63
.70
.57
PROMOTION
OPERATING
CONDITIONS
J34 e27
COMMINUCATION
J18
J9
e31
e32
J26 e33
.77
.52
.75
.59
.57
.64
.52
.50
.68
.72
.72
.93
.90
.52
.85
.53
.80
.73
.71
.63
.71
.51
.76
.67
.55
.56
.18
.77
.47
.59
.50
.64
.11
.22
.19
.52
.13
.17
.14
.38
.10
.56
.23
.15
..20
.18
.10
.15
.11
.86
.54
.88
.89
.28
.87
.97
.26
.83
.37
7.12 APPENDIX C4: First-order CFA of Job Satisfaction
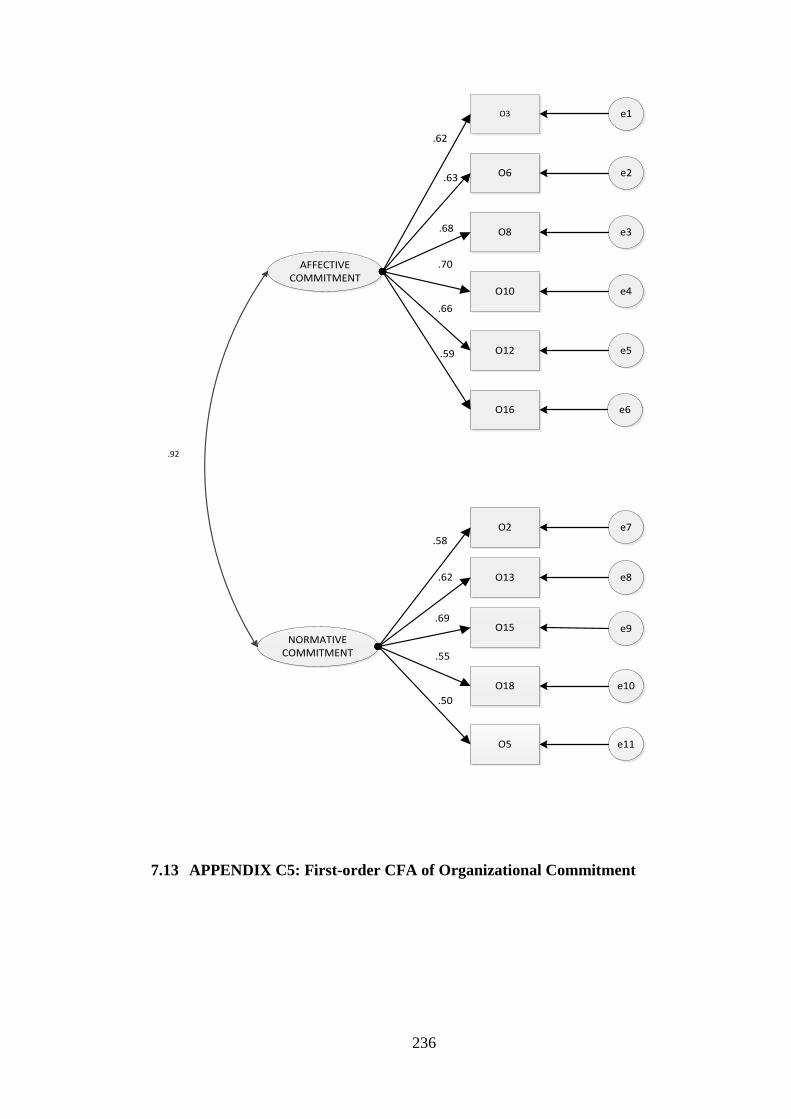
236
AFFECTIVE COMMITMENT
NORMATIVECOMMITMENT
O3
O6
O8
O10
O12
O16
O2
O13
O15
O18
O5
e1
e2
e3
e4
e5
e6
e7
e8
e9
e10
e11
.62
.63
.68
.70
.66
.59
.58
.62
.69
.55
.50
.92
7.13 APPENDIX C5: First-order CFA of Organizational Commitment

237
7.14 APPENDIX C6: Measurement model (base line model)
.46 SA
Sa3 .94
e
3 1.00 1 Sa2
.78 e
2 1.03 1 Sa1
1.58 e
1 .80 1
2.0
2 SB Sb3
.44 e
6 1.00 1 Sb2
.41 e
5 1.01 1 Sb1
.99 e
4 .70 1
1.42 S
C Sc
3
.48 e9
1.00 1 Sc
2
.28 e8 1.10 1 Sc
1
.56 e7 1.07 1
1.14 SD
Sd3 .53
e12 1.00 1 Sd2
.96 e11 .77 1 Sd1
1.4
9 e10 .79 1
.88 SE
Se3 .89
e15 1.0
0 1 Se2 .88
e14 .71 1 Se1 1.1
7 e13 1.44 1
1.52 S
F Sf4 1.0
1 e19 1.00
1 Sf3 .75
e18 .99 1 Sf2
.79 e17 .88 1 Sf1
.89 e16 .70
1
1.43 CA
Cf1 .78
e25
1.00 1 Ce1 .53
e24 1.17
1 Cd1 .46
e23 .99 1 Cc1
.41 e22 1.24 1 Cb1
.61 e21 1.11
1 Ca1 1.36
e20 .85
1
1.44 AH
Cf2 .93
e31
1.00 1 Ce2 .86
e30 1.00
1 Cd2 .57
e29 .98 1 Cc2
1.27 e28 .74 1 Cb2
.54 e27 1.02
1 Ca2 .72
e26 .86
1
1.54 MA
Cf3 1.13
e36 1.00
1 Ce3 .82
e35 .97 1 Cd3
1.48 e34 .60 1 Cc3
.96 e33 .80 1 Ca3
1.08 e32
.89 1
.39 HI
Cf4 1.36
e40 1.00
1 Ce4 1.27
e39 1.01 1 Cc4
1.17 e38 1.64 1 Cb4
.76 e37 1.56
1
11.62 DC
dc3 2.63
e43 1.00 1 DC2
3.25 e42 1.02 1 DC1
7.17 e41 1.10 1
1.90 ST
ST2 1.53
e47 1.00 1 ST1
1.02 e46 .96 1
6.86 P
G PG2
3.05 e45
1.00 1 PG1 5.33
e44 1.02 1
4.35 SS
SS2 1.43
e49 1.00 1 SS1
2.02 e48 .95 1
2.91 IM
IM2 1.93
e53 1.00 1 IM1
2.08 e52 1.06 1
1.85 AT
AT2 3.30
e51 1.00 1 AT1
1.90 e50 1.62 1
.83 NC
O18 1.53
e58 1.0
0 1 O15 1.39
e57 1.01 1 O13
1.04 e56 1.14 1 O5
2.24 e55 .60 1 O2
1.87 e54
1.11 1
.73 AC
O16 1.35
e63
1.0
0 1 O12 1.49
e62 1.25
1 O10 1.24
e61 1.29 1 O8
1.14 e60 1.20 1 O6
1.09 e69 1.03
1 O3 1.96
e59 1.17
1
6.01 JS 1.00
1 jsf5 10.44
e67 1.31 1 jsf4
14.32 e66 1.12 1 jsf2
12.47 e65 1.05 1 jsf1
97.99 e64
2.35 1
.54 .62
.43
.49
.66
.60
.6
6
.72
.33
2.06 1.74
.75 1.21
.63 1.11
.44
.32
.68
1.06
.91
1.08
1.24
1.11
1.10
.85
.62
2.84 2.5
6 1.12 .90
1.03 1.24
.77
.34
1.45
.78
.90
1.16
1.01
.96
.91
2.4
1
.58
2.2
3 1.08 1.25
.82 1.32
.6
6
.33
1.25
.5
8 .72
.69
.64
.37
.43
1.27 1.67
.91 .72
.62 .97
.73
.50
1.4
3
.94
.96
.92
.84
.50
1.99 1.90
.84 .69
.60 .91
.52
.32
1.16
1.15
1.14
1.08
.62
2.82 2.70
1.26
1.52
.73
.46
1.12
1.37
1.15
.79
2.85 2.58
1.08 1.10
.92 1.38
.81
.44
1.52
1.37
.7
2 2.75
2.53 1.1
1 1.13 .94
.87
.44
1.29
.65
2.62 2.41
.96 1.15
.84 1.31
.66
.25
.90
1.69 1.45
.56 .55
.50
.4
1
.20
.90
7.95 2.77
4.1
3 3.85 5.57
1.48
.93
2.96
3.58 4.55
2.82 4.36
1.83
1.15
4.60
2.52 1.37
1.89
.98
.70
2.44
2.07 3.15
.88
.75
2.16
2.13
.58
.44
1.13
1.01
.75
1.72 .68
1.63
1.47
1.04
.80
1.39
.76
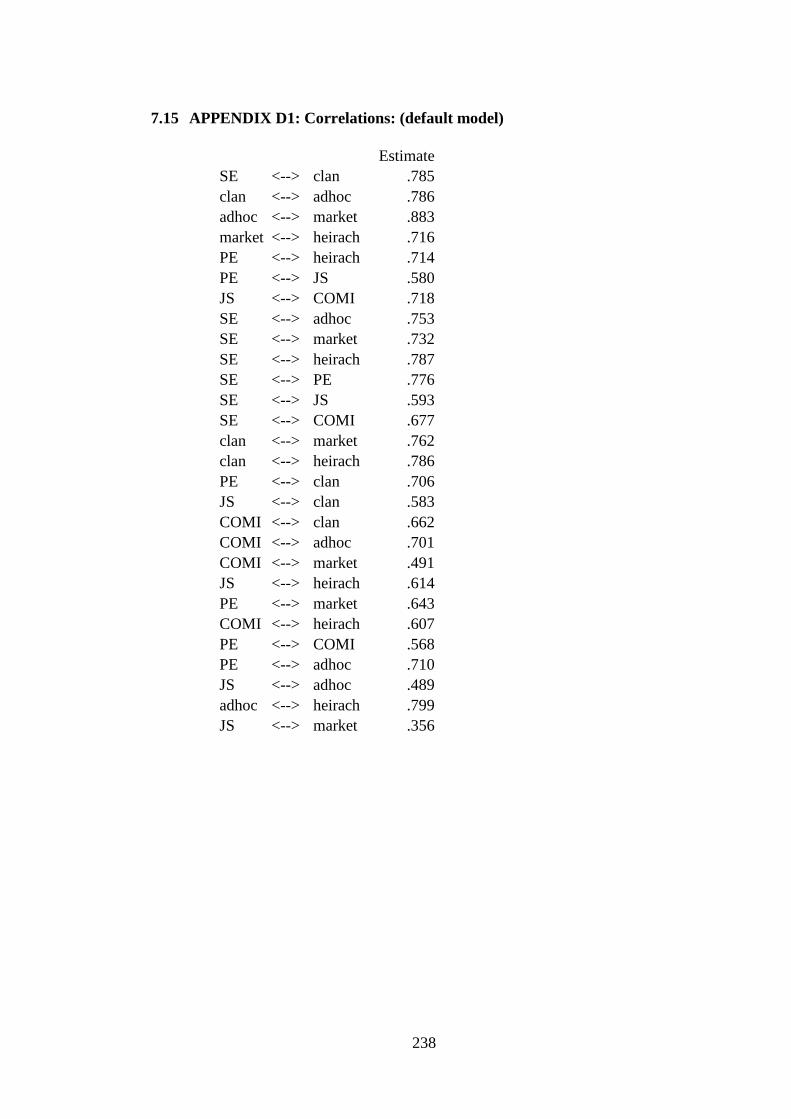
238
7.15 APPENDIX D1: Correlations: (default model)
Estimate
SE <--> clan .785
clan <--> adhoc .786
adhoc <--> market .883
market <--> heirach .716
PE <--> heirach .714
PE <--> JS .580
JS <--> COMI .718
SE <--> adhoc .753
SE <--> market .732
SE <--> heirach .787
SE <--> PE .776
SE <--> JS .593
SE <--> COMI .677
clan <--> market .762
clan <--> heirach .786
PE <--> clan .706
JS <--> clan .583
COMI <--> clan .662
COMI <--> adhoc .701
COMI <--> market .491
JS <--> heirach .614
PE <--> market .643
COMI <--> heirach .607
PE <--> COMI .568
PE <--> adhoc .710
JS <--> adhoc .489
adhoc <--> heirach .799
JS <--> market .356

239
7.16 APPENDIX D2: Baseline first model fit
Model Fit Summary
CMIN
Model NPAR CMIN DF P CMIN/DF
Default model 310 7461.663 2105 .000 3.545
Saturated model 2415 .000 0
Independence model 69 17346.884 2346 .000 7.394
RMR, GFI
Model RMR GFI AGFI PGFI
Default model .969 .538 .470 .469
Saturated model .000 1.000
Independence model 2.271 .094 .067 .091
Baseline Comparisons
Model NFI
Delta1
RFI
rho1
IFI
Delta2
TLI
rho2 CFI
Default model .570 .521 .649 .602 .643
Saturated model 1.000
1.000
1.000
Independence model .000 .000 .000 .000 .000
Parsimony-Adjusted Measures
Model PRATIO PNFI PCFI
Default model .897 .511 .577
Saturated model .000 .000 .000
Independence model 1.000 .000 .000
NCP
Model NCP LO 90 HI 90
Default model 5356.663 5096.766 5623.475

240
Model NCP LO 90 HI 90
Saturated model .000 .000 .000
Independence model 15000.884 14585.808 15422.542
FMIN
Model FMIN F0 LO 90 HI 90
Default model 32.584 23.392 22.257 24.557
Saturated model .000 .000 .000 .000
Independence model 75.751 65.506 63.693 67.347
RMSEA
Model RMSEA LO 90 HI 90 PCLOSE
Default model .105 .103 .108 .000
Independence model .167 .165 .169 .000
AIC
Model AIC BCC BIC CAIC
Default model 8081.663 8354.619 9147.467 9457.467
Saturated model 4830.000 6956.415 13132.962 15547.962
Independence model 17484.884 17545.639 17722.112 17791.112
ECVI
Model ECVI LO 90 HI 90 MECVI
Default model 35.291 34.156 36.456 36.483
Saturated model 21.092 21.092 21.092 30.377
Independence model 76.353 74.541 78.195 76.619
HOELTER
Model HOELTER
.05
HOELTER
.01
Default model 68 70

241
Model HOELTER
.05
HOELTER
.01
Independence model 33 34

242
7.17 APPENDIX D3: Correlations (default model)
Estimate
SE <--> clanc .742
PE <--> JS .507
JS <--> COMI .606
SE <--> PE .732
SE <--> JS .480
SE <--> COMI .649
PE <--> clanc .704
JS <--> clanc .465
COMI <--> clanc .647
PE <--> COMI .587
clanc <--> adhocc .763
adhocc <--> heirachc .784
PE <--> heirachc .746
PE <--> adhocc .712
clanc <--> heirachc .786
SE <--> adhocc .764
SE <--> heirachc .790
JS <--> adhocc .637
COMI <--> adhocc .649
JS <--> heirachc .515
COMI <--> heirachc .626

243
7.18 APPENDIX D4: Respecified model fit
Model Fit Summary
CMIN
Model NPAR CMIN DF P CMIN/DF
Default model 117 924.256 348 .000 2.656
Saturated model 465 .000 0
Independence model 30 6398.420 435 .000 14.709
RMR, GFI
Model RMR GFI AGFI PGFI
Default model 1.593 .803 .737 .601
Saturated model .000 1.000
Independence model 9.200 .130 .070 .122
Baseline Comparisons
Model NFI
Delta1
RFI
rho1
IFI
Delta2
TLI
rho2 CFI
Default model .856 .819 .905 .879 .903
Saturated model 1.000
1.000
1.000
Independence model .000 .000 .000 .000 .000
Parsimony-Adjusted Measures
Model PRATIO PNFI PCFI
Default model .800 .684 .723
Saturated model .000 .000 .000
Independence model 1.000 .000 .000
NCP
Model NCP LO 90 HI 90
Default model 576.256 489.943 670.225
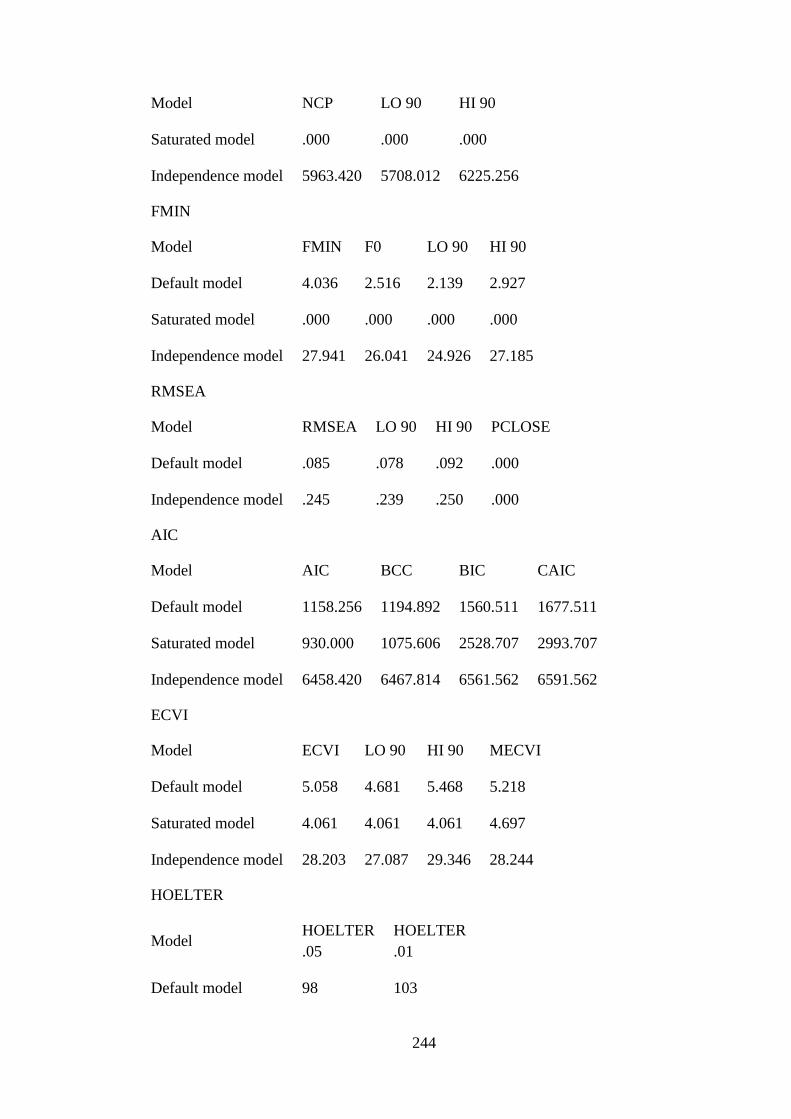
244
Model NCP LO 90 HI 90
Saturated model .000 .000 .000
Independence model 5963.420 5708.012 6225.256
FMIN
Model FMIN F0 LO 90 HI 90
Default model 4.036 2.516 2.139 2.927
Saturated model .000 .000 .000 .000
Independence model 27.941 26.041 24.926 27.185
RMSEA
Model RMSEA LO 90 HI 90 PCLOSE
Default model .085 .078 .092 .000
Independence model .245 .239 .250 .000
AIC
Model AIC BCC BIC CAIC
Default model 1158.256 1194.892 1560.511 1677.511
Saturated model 930.000 1075.606 2528.707 2993.707
Independence model 6458.420 6467.814 6561.562 6591.562
ECVI
Model ECVI LO 90 HI 90 MECVI
Default model 5.058 4.681 5.468 5.218
Saturated model 4.061 4.061 4.061 4.697
Independence model 28.203 27.087 29.346 28.244
HOELTER
Model HOELTER
.05
HOELTER
.01
Default model 98 103

245
Model HOELTER
.05
HOELTER
.01
Independence model 18 19

246
7.19 APPENDIX D5: Standardized Regression Weights: (default model)
Estimate
informt <--- SE .803
formt <--- SE .757
resorct <--- SE .825
supt <--- SE .857
infot <--- SE .778
oppt <--- SE .819
Cf1 <--- clanc .881
Ce1 <--- clanc .927
Cd1 <--- clanc .845
Cc1 <--- clanc .688
Cb1 <--- clanc .868
Ca1 <--- clanc .790
Cc3 <--- adhocc .754
Cf2 <--- adhocc .750
Cd2 <--- adhocc .811
Cb2 <--- adhocc .863
Ca2 <--- adhocc .758
Cf4 <--- hierchc .789
Ce4 <--- hierchc .799
Cc4 <--- hierchc .894
Cb4 <--- hierchc .867
imt <--- PE .872
att <--- PE .696
sset <--- PE .794
stt <--- PE .849
proft <--- PE .886
dct <--- PE .839
normt <--- COM .988
afft <--- COM .724
jsf6 <--- JS .776
jsf5 <--- JS .724
jsf4 <--- JS .680
jsf2 <--- JS .615
jsf1 <--- JS .781
Ce3 <--- adhocc .715
Cc2 <--- adhocc .836
Ce2 <--- adhocc .787
Ca3 <--- adhocc .715

247
7.20 APPENDIX D6 Baseline Model Fit Summary
CMIN
Model NPAR CMIN DF P CMIN/DF
Default model 100 721.274 251 .000 2.874
direct model 98 738.174 253 .000 2.918
Saturated model 351 .000 0
Independence model 26 5240.748 325 .000 16.125
RMR, GFI
Model RMR GFI AGFI PGFI
Default model 2.397 .813 .739 .581
direct model 2.740 .810 .737 .584
Saturated model .000 1.000
Independence model 11.179 .153 .085 .141
Baseline Comparisons
Model NFI
Delta1
RFI
rho1
IFI
Delta2
TLI
rho2 CFI
Default model .862 .822 .906 .876 .904
direct model .859 .819 .903 .873 .901
Saturated model 1.000
1.000
1.000
Independence model .000 .000 .000 .000 .000
Parsimony-Adjusted Measures
Model PRATIO PNFI PCFI
Default model .772 .666 .698
direct model .778 .669 .702
Saturated model .000 .000 .000
Independence model 1.000 .000 .000
NCP

248
Model NCP LO 90 HI 90
Default model 470.274 393.760 554.424
direct model 485.174 407.594 570.386
Saturated model .000 .000 .000
Independence model 4915.748 4684.538 5153.374
FMIN
Model FMIN F0 LO 90 HI 90
Default model 3.150 2.054 1.719 2.421
direct model 3.223 2.119 1.780 2.491
Saturated model .000 .000 .000 .000
Independence model 22.885 21.466 20.456 22.504
RMSEA
Model RMSEA LO 90 HI 90 PCLOSE
Default model .090 .083 .098 .000
direct model .092 .084 .099 .000
Independence model .257 .251 .263 .000
AIC
Model AIC BCC BIC CAIC
Default model 921.274 948.007 1265.082 1365.082
direct model 934.174 960.372 1271.105 1369.105
Saturated model 702.000 795.832 1908.766 2259.766
Independence model 5292.748 5299.699 5382.138 5408.138
ECVI
Model ECVI LO 90 HI 90 MECVI
Default model 4.023 3.689 4.390 4.140
direct model 4.079 3.741 4.451 4.194
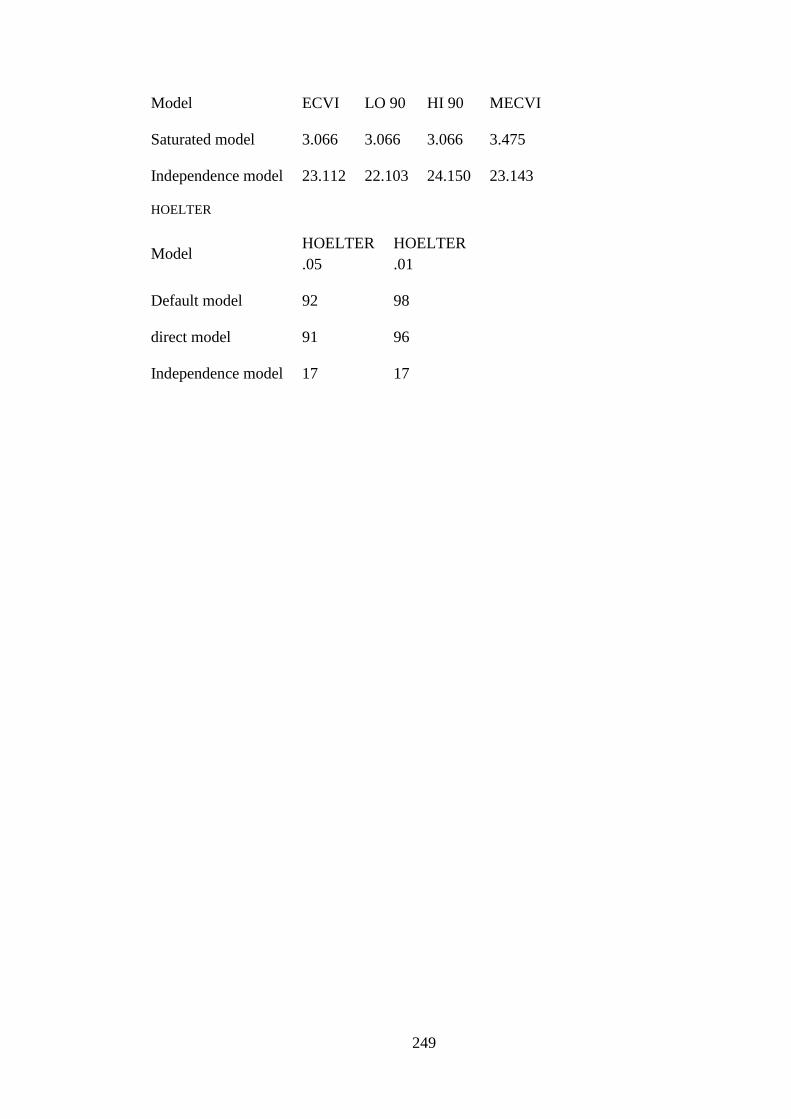
249
Model ECVI LO 90 HI 90 MECVI
Saturated model 3.066 3.066 3.066 3.475
Independence model 23.112 22.103 24.150 23.143
HOELTER
Model HOELTER
.05
HOELTER
.01
Default model 92 98
direct model 91 96
Independence model 17 17

250
7.21 APPENDIX E1: Regression Weights: (direct model)
Estimate S.E. C.R. P Label
PE <--- clanc .364 .145 3.286 .007
PE <--- SE .754 .114 6.601 ***
PE <--- hirachc -.082 .231 .529 .597
PE <--- adhocc .130 .126 1.237 .312
JS <--- PE .000
COM <--- PE .000
COM <--- SE .646 .192 3.368 ***
JS <--- SE .367 .098 3.729 ***
JS <--- clanc .292 .136 2.411 .048
JS <--- hirachc -.159 .222 .714 .475
COM <--- hirachc -.121 .538 2.085 .067
JS <--- adhocc .222 .113 1.958 .056
COM <--- adhocc .227 .233 .976 .329
COM <--- clanc .420 .311 4.347 .008
informt <--- SE 1.000
formt <--- SE .787 .053 14.791 ***
resorct <--- SE .535 .059 9.119 ***
supt <--- SE .949 .059 16.053 ***
infot <--- SE 1.000
oppt <--- SE .380 .033 11.529 ***
imt <--- PE 1.000
att <--- PE .846 .069 12.239 ***
sset <--- PE .744 .052 14.419 ***
stt <--- PE .728 .058 12.539 ***
proft <--- PE 1.454 .084 17.313 ***
dct <--- PE 2.758 .132 20.873 ***
afft <--- COM 1.000
jsf6 <--- JS 1.000
jsf5 <--- JS 1.141 .135 8.434 ***
jsf4 <--- JS 1.102 .170 6.469 ***
jsf2 <--- JS 1.254 .178 7.028 ***
jsf1 <--- JS 3.484 .491 7.103 ***
normt <--- COM .945 .085 11.112 ***
cll2 <--- clanc 1.000
cll1 <--- clanc 1.057 .043 24.788 ***
hri22 <--- hirachc 1.000
hri12 <--- hirachc .990 .087 11.400 ***
adh3 <--- adhocc 1.000
adh2 <--- adhocc .957 .054 17.654 ***
adh1 <--- adhocc .855 .050 17.158 ***
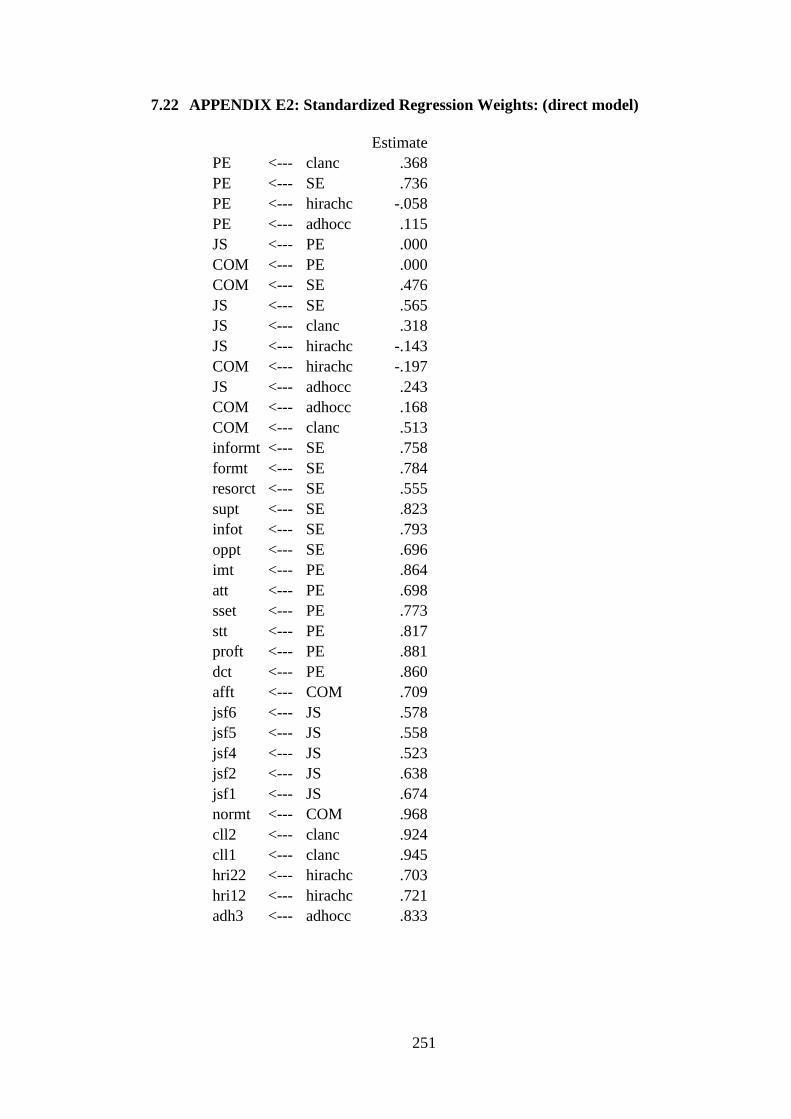
251
7.22 APPENDIX E2: Standardized Regression Weights: (direct model)
Estimate
PE <--- clanc .368
PE <--- SE .736
PE <--- hirachc -.058
PE <--- adhocc .115
JS <--- PE .000
COM <--- PE .000
COM <--- SE .476
JS <--- SE .565
JS <--- clanc .318
JS <--- hirachc -.143
COM <--- hirachc -.197
JS <--- adhocc .243
COM <--- adhocc .168
COM <--- clanc .513
informt <--- SE .758
formt <--- SE .784
resorct <--- SE .555
supt <--- SE .823
infot <--- SE .793
oppt <--- SE .696
imt <--- PE .864
att <--- PE .698
sset <--- PE .773
stt <--- PE .817
proft <--- PE .881
dct <--- PE .860
afft <--- COM .709
jsf6 <--- JS .578
jsf5 <--- JS .558
jsf4 <--- JS .523
jsf2 <--- JS .638
jsf1 <--- JS .674
normt <--- COM .968
cll2 <--- clanc .924
cll1 <--- clanc .945
hri22 <--- hirachc .703
hri12 <--- hirachc .721
adh3 <--- adhocc .833

252
7.23 APPENDIX E3: Modified model (Model Fit Summary of Direct Model)
CMIN
Model NPAR CMIN DF P CMIN/DF
Default model 81 690.036 244 .000 2.828
full mediated effect 77 738.645 248 .000 2.978
partial mediated model 81 690.036 244 .000 2.828
Direct model 79 697.856 246 .000 2.837
Saturated model 325 .000 0
Independence model 25 4809.526 300 .000 16.032
RMR, GFI
Model RMR GFI AGFI PGFI
Default model 1.502 .810 .747 .608
full mediated effect 1.836 .801 .739 .611
partial mediated model 1.502 .810 .747 .608
Direct model 1.867 .809 .748 .613
Saturated model .000 1.000
Independence model 9.911 .161 .092 .149
Baseline Comparisons
Model NFI
Delta1
RFI
rho1
IFI
Delta2
TLI
rho2 CFI
Default model .857 .824 .902 .878 .901
full mediated effect .846 .814 .892 .868 .891
partial mediated model .857 .824 .902 .878 .901
Direct model .855 .823 .901 .878 .900
Saturated model 1.000
1.000
1.000
Independence model .000 .000 .000 .000 .000

253
Parsimony-Adjusted Measures
Model PRATIO PNFI PCFI
Default model .813 .697 .733
full mediated effect .827 .700 .737
partial mediated model .813 .697 .733
Direct model .820 .701 .738
Saturated model .000 .000 .000
Independence model 1.000 .000 .000
NCP
Model NCP LO 90 HI 90
Default model 446.036 371.413 528.297
full mediated effect 490.645 412.861 576.051
partial mediated model 446.036 371.413 528.297
Direct model 451.856 376.765 534.587
Saturated model .000 .000 .000
Independence model 4509.526 4288.510 4737.807
FMIN
Model FMIN F0 LO 90 HI 90
Default model 3.013 1.948 1.622 2.307
full mediated effect 3.226 2.143 1.803 2.516
partial mediated model 3.013 1.948 1.622 2.307
Direct model 3.047 1.973 1.645 2.334
Saturated model .000 .000 .000 .000
Independence model 21.002 19.692 18.727 20.689
RMSEA

254
Model RMSEA LO 90 HI 90 PCLOSE
Default model .089 .082 .097 .000
full mediated effect .093 .085 .101 .000
partial mediated model .089 .082 .097 .000
Direct model .090 .082 .097 .000
Independence model .256 .250 .263 .000
AIC
Model AIC BCC BIC CAIC
Default model 852.036 872.784 1130.520 1211.520
full mediated effect 892.645 912.369 1157.377 1234.377
partial mediated model 852.036 872.784 1130.520 1211.520
Direct model 855.856 876.093 1127.465 1206.465
Saturated model 650.000 733.251 1767.376 2092.376
Independence model 4859.526 4865.930 4945.478 4970.478
ECVI
Model ECVI LO 90 HI 90 MECVI
Default model 3.721 3.395 4.080 3.811
full mediated effect 3.898 3.558 4.271 3.984
partial mediated model 3.721 3.395 4.080 3.811
Direct model 3.737 3.409 4.099 3.826
Saturated model 2.838 2.838 2.838 3.202
Independence model 21.221 20.256 22.217 21.249
HOELTER
Model HOELTER
.05
HOELTER
.01
Default model 94 99

255
Model HOELTER
.05
HOELTER
.01
full mediated effect 89 94
partial mediated model 94 99
Direct model 94 99
Independence model 17 18

256
7.24 APPENDIX E4: Standardized Regression Weights: (Direct model)
Estimate
PE <--- SE .698
PE <--- clan .310
JS <--- PE .000
COMI <--- PE .000
COMI <--- SE .372
JS <--- SE .359
JS <--- clan .217
COMI <--- clan .345
oppt <--- SE .705
infot <--- SE .764
supt <--- SE .829
resorct <--- SE .552
formt <--- SE .791
informt <--- SE .797
imt <--- PE .884
att <--- PE .722
sset <--- PE .808
stt <--- PE .749
proft <--- PE .845
dct <--- PE .880
afft <--- COMI .699
normt <--- COMI .963
jsf2 <--- JS .603
jsf4 <--- JS .584
jsf5 <--- JS .703
jsf6 <--- JS .723
jsf1 <--- JS 1.005
Cc1 <--- culture .934
Cb1 <--- culture .841
Ca1 <--- culture .673
Cd1 <--- culture .861
Ce1 <--- culture .879
Cf1 <--- culture .791
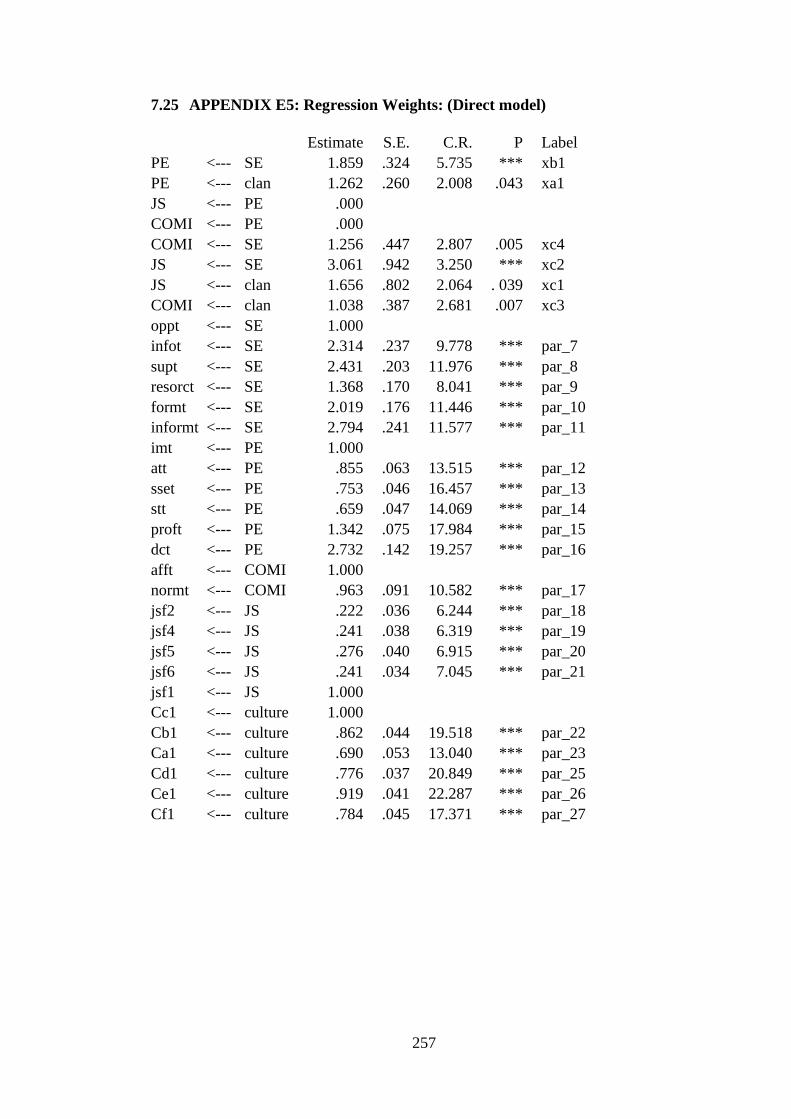
257
7.25 APPENDIX E5: Regression Weights: (Direct model)
Estimate S.E. C.R. P Label
PE <--- SE 1.859 .324 5.735 *** xb1
PE <--- clan 1.262 .260 2.008 .043 xa1
JS <--- PE .000
COMI <--- PE .000
COMI <--- SE 1.256 .447 2.807 .005 xc4
JS <--- SE 3.061 .942 3.250 *** xc2
JS <--- clan 1.656 .802 2.064 . 039 xc1
COMI <--- clan 1.038 .387 2.681 .007 xc3
oppt <--- SE 1.000
infot <--- SE 2.314 .237 9.778 *** par_7
supt <--- SE 2.431 .203 11.976 *** par_8
resorct <--- SE 1.368 .170 8.041 *** par_9
formt <--- SE 2.019 .176 11.446 *** par_10
informt <--- SE 2.794 .241 11.577 *** par_11
imt <--- PE 1.000
att <--- PE .855 .063 13.515 *** par_12
sset <--- PE .753 .046 16.457 *** par_13
stt <--- PE .659 .047 14.069 *** par_14
proft <--- PE 1.342 .075 17.984 *** par_15
dct <--- PE 2.732 .142 19.257 *** par_16
afft <--- COMI 1.000
normt <--- COMI .963 .091 10.582 *** par_17
jsf2 <--- JS .222 .036 6.244 *** par_18
jsf4 <--- JS .241 .038 6.319 *** par_19
jsf5 <--- JS .276 .040 6.915 *** par_20
jsf6 <--- JS .241 .034 7.045 *** par_21
jsf1 <--- JS 1.000
Cc1 <--- culture 1.000
Cb1 <--- culture .862 .044 19.518 *** par_22
Ca1 <--- culture .690 .053 13.040 *** par_23
Cd1 <--- culture .776 .037 20.849 *** par_25
Ce1 <--- culture .919 .041 22.287 *** par_26
Cf1 <--- culture .784 .045 17.371 *** par_27

258
7.26 APPENDIX E6: Assuming model Default model to be correct:
Model DF CMIN P NFI
Delta-1
IFI
Delta-2
RFI
rho-1
TLI
rho2
full mediated effect 4 48.609 .000 .010 .011 .009 .010
Direct model 2 7.821 .020 .002 .002 .001 .001

259
7.27 APPENDIX E7: Regression Weights: (Default model)
Estimate S.E. C.R. P Label
PE <--- SE 1.723 .308 5.601 *** xb1
PE <--- clan 1.109 .353 2.305 .028 xa1
JS <--- PE 1.338 .264 5.077 *** xa2
COMI <--- PE .967 .128 2.885 .049 xb2
JS <--- clan 1.175 .202 1.173 .051 xc1
COMI <--- clan 1.124 .529 2.124 .004 xc3
COMI <--- SE 1.012 .493 1.869 .037 xc4
JS <--- SE 1.146 .946 2.498 .026 xc2
oppt <--- SE 1.000
infot <--- SE 2.303 .234 9.846 *** par_9
supt <--- SE 2.434 .204 11.961 *** par_10
resorct <--- SE 1.340 .169 7.931 *** par_11
formt <--- SE 2.031 .177 11.483 *** par_12
informt <--- SE 2.847 .245 11.636 *** par_13
imt <--- PE 1.000
att <--- PE .853 .072 11.844 *** par_14
sset <--- PE .756 .053 14.152 *** par_15
stt <--- PE .788 .057 13.723 *** par_16
proft <--- PE 1.519 .087 17.456 *** par_17
dct <--- PE 2.629 .137 19.244 *** par_18
afft <--- COMI 1.000
normt <--- COMI .945 .092 10.277 *** par_19
Cb1 <--- culture 1.236 .106 11.649 *** par_20
Ca1 <--- culture 1.000
jsf2 <--- JS .297 .047 6.293 *** par_21
jsf4 <--- JS .248 .040 6.191 *** par_22
jsf5 <--- JS .243 .039 6.250 *** par_23
jsf6 <--- JS .237 .034 6.970 *** par_24
jsf1 <--- JS 1.000
Cc1 <--- culture 1.441 .113 12.787 *** par_25
Cd1 <--- culture 1.141 .095 12.006 *** par_28
Ce1 <--- culture 1.330 .109 12.185 *** par_29
Cf1 <--- culture 1.131 .100 11.269 *** par_30
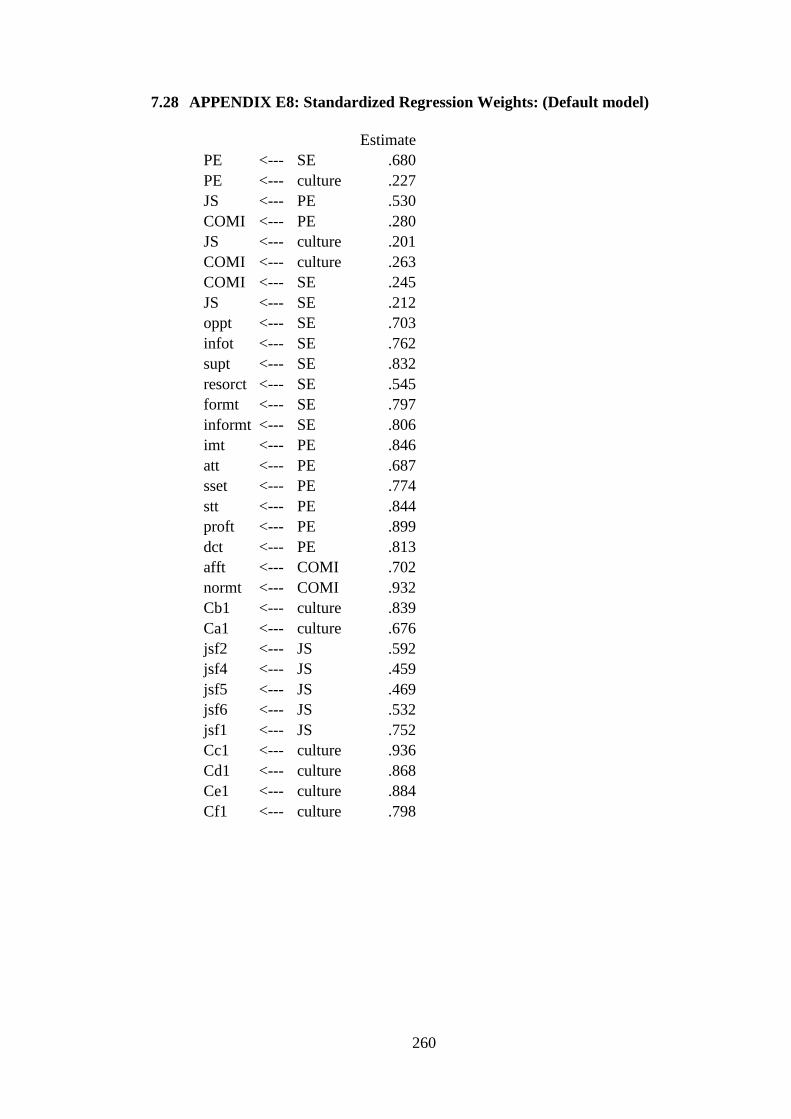
260
7.28 APPENDIX E8: Standardized Regression Weights: (Default model)
Estimate
PE <--- SE .680
PE <--- culture .227
JS <--- PE .530
COMI <--- PE .280
JS <--- culture .201
COMI <--- culture .263
COMI <--- SE .245
JS <--- SE .212
oppt <--- SE .703
infot <--- SE .762
supt <--- SE .832
resorct <--- SE .545
formt <--- SE .797
informt <--- SE .806
imt <--- PE .846
att <--- PE .687
sset <--- PE .774
stt <--- PE .844
proft <--- PE .899
dct <--- PE .813
afft <--- COMI .702
normt <--- COMI .932
Cb1 <--- culture .839
Ca1 <--- culture .676
jsf2 <--- JS .592
jsf4 <--- JS .459
jsf5 <--- JS .469
jsf6 <--- JS .532
jsf1 <--- JS .752
Cc1 <--- culture .936
Cd1 <--- culture .868
Ce1 <--- culture .884
Cf1 <--- culture .798

261
7.29 APPENDIX F1: Standardized Indirect Effects (Default model)
clan SE PE JS COMI
PE .000 .000 .000 .000 .000
JS .170 .360 .000 .000 .000
COMI .163 .190 .000 .000 .000
Cf1 .000 .000 .000 .000 .000
Ce1 .000 .000 .000 .000 .000
Cd1 .000 .000 .000 .000 .000
Ca1 .000 .000 .000 .000 .000
Cb1 .000 .000 .000 .000 .000
Cc1 .000 .000 .000 .000 .000
jsf6 .180 .226 .160 .000 .000
jsf5 .173 .218 .154 .000 .000
jsf4 .147 .185 .131 .000 .000
jsf2 .151 .190 .134 .000 .000
jsf1 .258 .326 .230 .000 .000
normt .349 .338 .095 .000 .000
afft .253 .244 .069 .000 .000
dct .111 .596 .000 .000 .000
proft .107 .577 .000 .000 .000
stt .096 .513 .000 .000 .000
sset .102 .547 .000 .000 .000
att .091 .488 .000 .000 .000
imt .111 .597 .000 .000 .000
informt .000 .000 .000 .000 .000
formt .000 .000 .000 .000 .000
resorct .000 .000 .000 .000 .000
supt .000 .000 .000 .000 .000
infot .000 .000 .000 .000 .000
oppt .000 .000 .000 .000 .000

262
7.30 APPENDIX F2: Standardized Indirect Effects - Two Tailed Significance
clan SE PE JS COMI
PE ... ... ... ... ...
JS .023 .001 ... ... ...
COMI .048 .001 ... ... ...
Cf1 ... ... ... ... ...
Ce1 ... ... ... ... ...
Cd1 ... ... ... ... ...
Ca1 ... ... ... ... ...
Cb1 ... ... ... ... ...
Cc1 ... ... ... ... ...
jsf6 .015 .004 .009 ... ...
jsf5 .016 .004 .009 ... ...
jsf4 .013 .004 .008 ... ...
jsf2 .013 .004 .009 ... ...
jsf1 .013 .005 .011 ... ...
normt .006 .015 .325 ... ...
afft .005 .013 .320 ... ...
dct .285 .001 ... ... ...
proft .286 .001 ... ... ...
stt .293 .001 ... ... ...
sset .290 .001 ... ... ...
att .288 .001 ... ... ...
imt .288 .001 ... ... ...
informt ... ... ... ... ...
formt ... ... ... ... ...
resorct ... ... ... ... ...
supt ... ... ... ... ...
infot ... ... ... ... ...
oppt ... ... ... ... ...

263
BIODATA OF STUDENT
I have received my high school diploma from Maryam High School in Mashhad, Iran
1996. In 2000 I received my Bachelor degree of Art in TESL at Azad university of
Mashhad, Iran. In 2003 I received a Master of Science in Adult Education with the
concentration in life skills education. I have continued my studies at Univrsiti Putra
Malaysia for the degree of Doctor of Philosophy in Human Resource Development at
Department of Professional Development and Continuous Education.