Mechanistic modeling of a magnetic marker monitoring study linking gastrointestinal tablet transit,...
7
CLINICAL PHARMACOLOGY & THERAPEUTICS | VOLUME 86 NUMBER 1 | JULY 2009 77 ARTICLES nature publishing group Magnetic marker monitoring (MMM) is a new technique for visualizing the transit of a solid oral dosage form through the gastrointestinal (GI) tract. e technique is based on the determination of the magnetic dipole field generated by magnetically labeled dosage forms. Furthermore, the dis- integration properties of the solid dosage form can be moni- tored during its passage through the GI tract by means of the decrease of magnetic moment. For certain dosage forms, the magnetic moment is directly linked to the drug release. In these cases a relationship between decrease in magnetic signal and drug release, characterized in in vitro experiments, can be used to obtain actual in vivo drug release profiles. 1 In combi- nation with measured plasma concentrations of the studied drug, this approach offers a unique possibility of studying the influence of GI transit and drug release on the pharma- cokinetics of a compound. 2,3 e characteristics of the MMM technique make it, in many cases, an attractive alternative to gamma scintigraphy, which is the method generally used for such purposes. 4 e use of modeling and simulation in drug development has increased over the past 20 years and has been adopted for a wide range of applications. 5–7 A trend toward the use of more mecha- nistic models can be seen over time. Mechanistic models have an advantage over the more empirical ones in that they allow the use of prior mechanistic knowledge about the system and enable inference to be made between alternative mechanistic hypotheses. 8,9 Scientific literature contains only a few examples of mechanistic models applied to gamma scintigraphy studies of solid dosage forms in GI tract transit and no examples for MMM studies. 10,11 We can see several advantages of applying a model-based evaluation of MMM and gamma scintigraphy studies. With an integrated model describing the interrelation- ship between tablet location in the GI tract, drug release, absorp- tion, and disposition, it is anticipated that we could enhance the mechanistic knowledge gained from the studies and improve in vitro predictions to better guide pharmaceutical develop- ment. It has previously been shown that applying a mixed-effect modeling approach to in vitro–in vivo correlation studies with 1 Division of Pharmacokinetics and Drug Therapy, Department of Pharmaceutical Biosciences, Uppsala University, Uppsala, Sweden; 2 Product Development, AstraZeneca R&D, Mölndal, Sweden; 3 Institute of Pharmacy, University of Greifswald, Greifswald, Germany. Correspondence: M Bergstrand ([email protected]) Received 18 November 2008; accepted 25 February 2009; advance online publication 22 April 2009. doi:10.1038/clpt.2009.43 Mechanistic Modeling of a Magnetic Marker Monitoring Study Linking Gastrointestinal Tablet Transit, In Vivo Drug Release, and Pharmacokinetics M Bergstrand 1 , E Söderlind 2 , W Weitschies 3 and MO Karlsson 1 Magnetic marker monitoring (MMM) is a new technique for visualizing transit and disintegration of solid oral dosage forms through the gastrointestinal (GI) tract. The aim of this work was to develop a modeling approach for gaining information from MMM studies using data from a food interaction study with felodipine extended-release (ER) formulation. The interrelationship between tablet location in the GI tract, in vivo drug release, and felodipine disposition was modeled. A Markov model was developed to describe the tablet’s movement through the GI tract. Tablet location within the GI tract significantly affected drug release and absorption through the gut wall. Food intake decreased the probability of tablet transition from the stomach, decreased the rate with which released felodipine left the stomach, and increased the fraction absorbed across the gut wall. In conclusion, the combined information of tablet location in the GI tract, in vivo drug release, and plasma concentration can be utilized in a mechanistically informative way with integrated modeling of data from MMM studies.
-
Upload
independent -
Category
Documents
-
view
1 -
download
0
Transcript of Mechanistic modeling of a magnetic marker monitoring study linking gastrointestinal tablet transit,...

CliniCal pharmaCology & TherapeuTiCs | VOLUME 86 NUMBER 1 | JULY 2009 77
articlesnature publishing group
Magnetic marker monitoring (MMM) is a new technique for visualizing the transit of a solid oral dosage form through the gastrointestinal (GI) tract. The technique is based on the determination of the magnetic dipole field generated by magnetically labeled dosage forms. Furthermore, the disintegration properties of the solid dosage form can be monitored during its passage through the GI tract by means of the decrease of magnetic moment. For certain dosage forms, the magnetic moment is directly linked to the drug release. In these cases a relationship between decrease in magnetic signal and drug release, characterized in in vitro experiments, can be used to obtain actual in vivo drug release profiles.1 In combination with measured plasma concentrations of the studied drug, this approach offers a unique possibility of studying the influence of GI transit and drug release on the pharmacokinetics of a compound.2,3 The characteristics of the MMM technique make it, in many cases, an attractive alternative to gamma scintigraphy, which is the method generally used for such purposes.4
The use of modeling and simulation in drug development has increased over the past 20 years and has been adopted for a wide range of applications.5–7 A trend toward the use of more mechanistic models can be seen over time. Mechanistic models have an advantage over the more empirical ones in that they allow the use of prior mechanistic knowledge about the system and enable inference to be made between alternative mechanistic hypotheses.8,9 Scientific literature contains only a few examples of mechanistic models applied to gamma scintigraphy studies of solid dosage forms in GI tract transit and no examples for MMM studies.10,11 We can see several advantages of applying a modelbased evaluation of MMM and gamma scintigraphy studies. With an integrated model describing the interrelationship between tablet location in the GI tract, drug release, absorption, and disposition, it is anticipated that we could enhance the mechanistic knowledge gained from the studies and improve in vitro predictions to better guide pharmaceutical development. It has previously been shown that applying a mixedeffect modeling approach to in vitro–in vivo correlation studies with
1Division of Pharmacokinetics and Drug Therapy, Department of Pharmaceutical Biosciences, Uppsala University, Uppsala, Sweden; 2Product Development, AstraZeneca R&D, Mölndal, Sweden; 3Institute of Pharmacy, University of Greifswald, Greifswald, Germany. Correspondence: M Bergstrand ([email protected])
Received 18 November 2008; accepted 25 February 2009; advance online publication 22 April 2009. doi:10.1038/clpt.2009.43
Mechanistic Modeling of a Magnetic Marker Monitoring Study Linking Gastrointestinal Tablet Transit, In Vivo Drug Release, and PharmacokineticsM Bergstrand1, E Söderlind2, W Weitschies3 and MO Karlsson1
magnetic marker monitoring (mmm) is a new technique for visualizing transit and disintegration of solid oral dosage forms through the gastrointestinal (gi) tract. The aim of this work was to develop a modeling approach for gaining information from mmm studies using data from a food interaction study with felodipine extended-release (er) formulation. The interrelationship between tablet location in the gi tract, in vivo drug release, and felodipine disposition was modeled. a markov model was developed to describe the tablet’s movement through the gi tract. Tablet location within the gi tract significantly affected drug release and absorption through the gut wall. Food intake decreased the probability of tablet transition from the stomach, decreased the rate with which released felodipine left the stomach, and increased the fraction absorbed across the gut wall. in conclusion, the combined information of tablet location in the gi tract, in vivo drug release, and plasma concentration can be utilized in a mechanistically informative way with integrated modeling of data from mmm studies.

78 VOLUME 86 NUMBER 1 | JULY 2009 | www.nature.com/cpt
articles
extendedrelease (ER) formulations has several advantages over the traditional deconvolution methods.12 The use of a differential equation–based mixedeffect modeling approach becomes especially important in the case of nonlinear pharmacokinetics such as saturable absorption.13,14 There is reason to believe that models developed on the basis of MMM or gamma scintigraphy studies could be of extra value in these cases. Furthermore, an integrated model is valuable for visualizing in vitro predictions and simulating “what if ” scenarios such as “what if we give this tablet an enteric coating” or “what if we go with a tablet with this in vitro release profile.”
This article aims at outlining a suitable modeling approach for data from MMM studies and applying it to a previously published MMM study with felodipine ER tablet under both fed and fasting conditions.2
ResultsFigure 1 is a schematic representation of the final model structure for drug release, GI tract distribution of the released drug substance, and absorption and disposition of felodipine. A schematic compartmental structure of the Markov model describing tablet transit of the GI tract is depicted in Figure 2.
Drug releaseParameter estimates and their imprecision are reported in Table 1. The in vivo drug release was best described with three different zeroorder rate constants depending on the position of the remaining ER tablet (D1, D2/D3, and D4/D5). A relatively
slow release rate was seen for fundus (D1). The fastest drug release was estimated for antrum and proximal small intestine. The release rate was found to be similar in these two locations and sufficiently characterized by a single parameter, D2/D3. Similarly, an intermediate drug release rate in the distal small intestine and colon was described by a single parameter, D4/D5. The interindividual variability for the three zeroorder rate constants was highly correlated and sufficiently described with only one variability term affecting all rate constants. The magnitude of the interindividual variability was small (9%).
No significant effect of concomitant food intake on disintegration could be detected when the effect of tablet location within the GI tract was taken into account in the model.
GI distribution of released drug substance, absorption, and dispositionParameter estimates and their imprecision are reported in Table 2. Firstorder rate constants were found to best describe the distribution of released drug substance from fundus to antrum (K23) and from antrum to proximal small intestine (K34). However, it was also hypothesized during the model building that a potentially higher concentration of released drug substance in very close proximity to the tablet would move simultaneously with the tablet. This was mimicked by adding an acceleration factor to the rate constant K23 at the time point of tablet movement from fundus to antrum and, similarly, to K34
Tablet Liver Central
Fundus
Antrum
Prox s.i.
D1
D2
D3
D4
K47
K23 *
K34 *
ColonD5
Shallow
DeepDist s.i.
1 4
3
2
5
6
7
9
8
10EH × QH
F47
K57
F57
K67
F67
Figure 1 Integrated compartmental model structure applied to drug release, absorption, and disposition of felodipine extended-release formulation. Compartment 1 represents the amount of drug present in the remaining part of the tablet. Zero-order drug release constants D1–5 are activated one at a time depending on the tablet location in the GI tract. Compartments 2 to 6 represent released drug substance in discrete parts of the GI tract: (2) proximal stomach (fundus), (3) distal stomach (antrum), (4) proximal small intestine (prox s.i.), (5) distal small intestine (dist s.i.), and (6) colon. The first-order rate constants K23 and K34 describe the distribution of disintegrated drug substance downstream in the GI channel. Asterisks (*) represent acceleration of these rates when the undisintegrated tablet moves to the target compartment. Rate of absorption across the GI wall is governed by the first-order rate constants K47, K57, and K67. The amount of drug absorbed across the GI wall is limited by bioavailability factors F47, F57, and F67. Compartment 7 is a semiphysiological representation of a liver with a fixed volume (0.0143 l/kg). Hepatic elimination is governed by allometrically scaled liver blood flow (QH) and the estimated hepatic extraction ratio (EH). The systemic distribution of felodipine is described by a central observation compartment (8) and two peripheral compartments (9, 10).
A
P:1
D:3
P:2 P:4P:3
D:1D:2
F
C
KFA
KAFKAP
KPD
KDC
KDC KDC
KPD KPD
KPD
Distal small intestine
Colon
Proximalsmallintestine
StomachF = fundusA = antrum
Figure 2 Schematic compartmental structure of the Markov model describing gastrointestinal tablet transit. The tablet can move backward and forward between the upper and lower parts of the stomach (fundus and antrum). The probability of transiting through the proximal small intestine is described by four transit compartments (P:1–P:4). Transit through the distal part is described by three transit compartments (D:1–D:3). In the model, the colon is assumed to be the final stage from which the tablet moves no further. Concomitant food intake prolongs the residence of the tablet in the stomach by inhibiting the parameters KFA and KAP.
table 1 typical parameter estimates for in vivo drug release model and associated interindividual variability
parameter Typical value (rse %) iiV (%) (rse %)
D1 (mg/h) 0.68 (5.1)
9.2 (30.8)D2/D3 (mg/h) 1.91 (5.0)
D4/D5 (mg/h) 1.16 (3.3)
Residual error (mg) 0.36 (13.2) NE
D1–5, zero-order rate constants for fundus (D1), antrum and proximal small intestine (D2/D3); distal small intestine and colon (D4/D5); IIV, interindividual variability; NE, not estimated; RSE, relative standard error.

CliniCal pharmaCology & TherapeuTiCs | VOLUME 86 NUMBER 1 | JULY 2009 79
articles
at the time of transit from antrum to small intestine. These additions improved the model fit to the data primarily as judged by goodnessoffit plots. However, probably because of the rapidity of this process, reliable values for these acceleration factors could not be estimated (see Methods section). After a sensitivity analysis, a fixed addition was set to 5 h−1.
The absorption rate was similar in the proximal and distal areas of the small intestine. However, it was significantly higher in the small intestine (K47/K57) than in the colon (K67). No significant distinction could be made between the extent of absorption from small intestine and colon; i.e., the fraction absorbed across the gut wall was sufficiently characterized by a single parameter (FA). We recognized early on that the subject designated as individual no. 4 had 5–10 times higher exposure
as compared to the other individuals. This was found to be best described by estimating a separate FA for this individual. Estimates of this parameter in this individual approached the upper theoretical limit, and the parameter was fixed to 1 in the final model.
The effect of concomitant food intake was investigated for all parameters related to distribution of released drug substance and absorption. A significantly slower rate of distribution of released drug from antrum to proximal small intestine (K34) was seen when the tablet was taken together with food. Further, a significantly higher fraction was found to be absorbed across the gut wall (FA) when the tablet was taken after a meal (in a fed state).
Parameter estimates regarding elimination and distribution of felodipine were in agreement with previously published data on felodipine pharmacokinetics.15 Only minor changes were seen when data relating to oral administration of the drug were also used in the estimation of these parameters as compared to using only data relating to intravenous (i.v.) administration. Individual goodnessoffit plots for fed and fasting conditions are presented in Figure 3. The plots reveal a good agreement between the individual predictions and the observations in all cases but one (ID:1 fasting). The most pronounced trends can also be seen as captured by the typical population prediction.
tablet transit through the GI tractConcomitant food intake was found to significantly prolong the mean tablet transit time from antrum to proximal small intestine. A borderline significant effect on mean tablet transit time from fundus to antrum was also included in the final model. Estimated mean transit times and their imprecision are reported in Table 3.
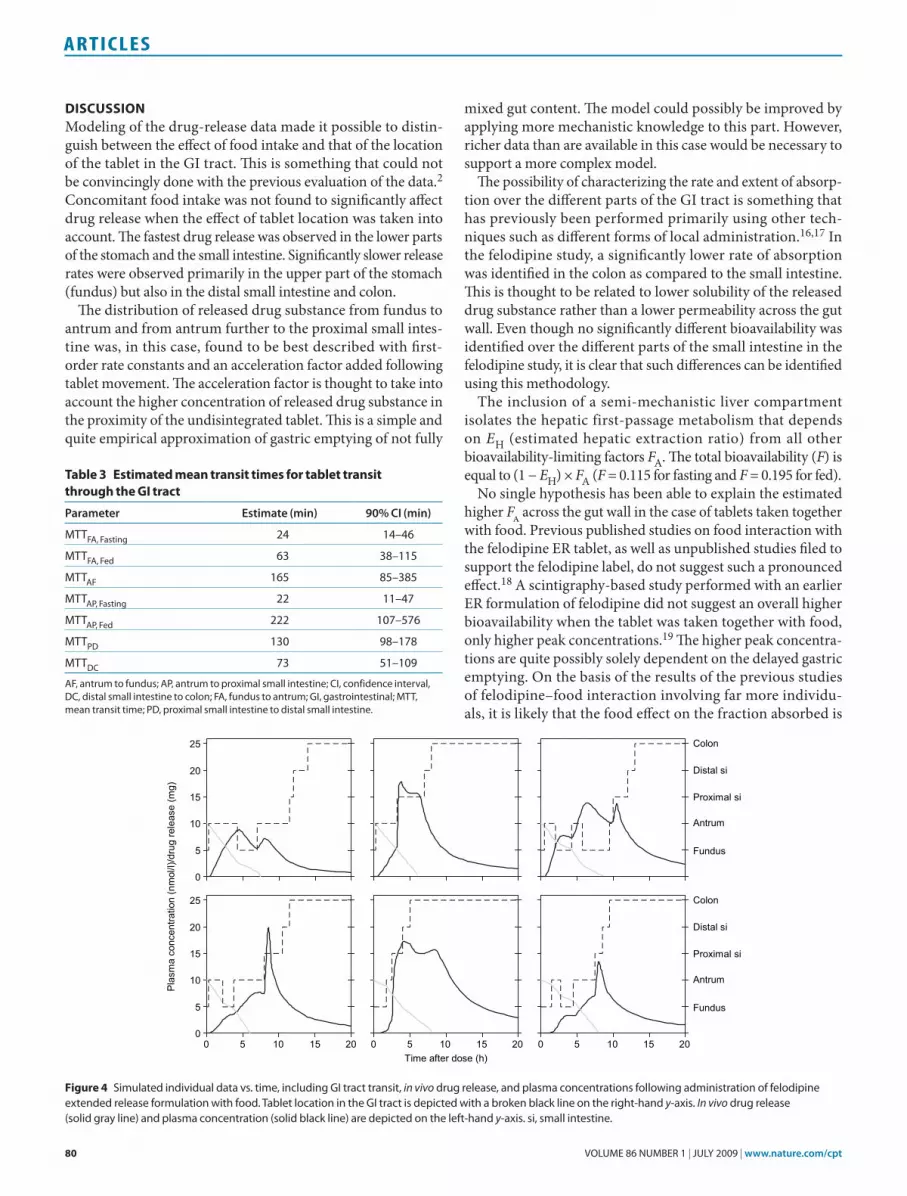
Model simulations predict a median time of gastric emptying at ~50 min for tablets taken in a fasting state. The corresponding time for the fed state is 5 h. Furthermore, the model predicts median times for arrival of the tablet at the colon of 4.3 h and 8.5 h for administration in the fasting and fed states, respectively. Data for six randomly selected simulated individuals are presented in Figure 4.
table 2 typical parameter estimates and associated interindividual variability for the pharmacokinetic model
parameter Typical value (rse %) iiV (%) (rse %)
K23 (h−1)a 0.43 (9.3) NE
K34, Fasting (h−1)a 3.48 (7.4) 46.4 (32.1)
K34, Fed (h−1)a 0.81 (5.9) NE
K47 and K57 (h−1) 2.87 (8.4) NE
K67 (h−1) 1.15 (18.8) NE
FA, Fastingb 0.23 (12.9) 17.4 (15.7)
FA, Fedb 0.39 (13.8) 12.3 (14.2)
EHc 0.50 (3.5) 10.8 (17.5)
VCentral (l) 20.4 (5.0) 47.9 (30.8)
QShallow (l/h) 174 (3.1) 23.4 (22.7)
VShallow (l) 88 (3.0) 25.0 (23.6)
QDeep (l/h) 21.9 (7.3) NE
VDeep (l) 166 (4.1) 18.4 (21.5)
Residual error p.o. (%) 23 (8.9) NE
Residual error i.v. (%) 14 (7.4) NE
IIV, interindividual variability; i.v., intravenous; NE, not estimated; p.o., oral; RSE, relative standard error.aRate increased by 5 h−1 after GI transit. bFraction absorbed over gut wall (FA = F47 = F57 = F67), for individual no. 4 fixed to 1. cHepatic extraction ratio.
1
10
100ID:1 ID:2 ID:3
ID:4 ID:5 ID:6
Obs
erva
tions
/pre
dict
ions
(nm
ol/l)
Time (h)
1
10
100
Time (h)
2 4 6 2 4 6
2 4 6 2 4 62 4 62 4 6
ID:1 ID:2 ID:3
ID:4 ID:5 ID:6
Fed state Fasting state
Figure 3 Individual goodness-of-fit plots for tablets taken in fed and fasting state. Open circles represent observed plasma concentrations, the solid line represents the population prediction, and the broken line represents the individual model prediction on a logarithmic y-axis scale.
80 VOLUME 86 NUMBER 1 | JULY 2009 | www.nature.com/cpt
articles
DIscussIonModeling of the drugrelease data made it possible to distinguish between the effect of food intake and that of the location of the tablet in the GI tract. This is something that could not be convincingly done with the previous evaluation of the data.2 Concomitant food intake was not found to significantly affect drug release when the effect of tablet location was taken into account. The fastest drug release was observed in the lower parts of the stomach and the small intestine. Significantly slower release rates were observed primarily in the upper part of the stomach (fundus) but also in the distal small intestine and colon.
The distribution of released drug substance from fundus to antrum and from antrum further to the proximal small intestine was, in this case, found to be best described with first order rate constants and an acceleration factor added following tablet movement. The acceleration factor is thought to take into account the higher concentration of released drug substance in the proximity of the undisintegrated tablet. This is a simple and quite empirical approximation of gastric emptying of not fully
mixed gut content. The model could possibly be improved by applying more mechanistic knowledge to this part. However, richer data than are available in this case would be necessary to support a more complex model.
The possibility of characterizing the rate and extent of absorption over the different parts of the GI tract is something that has previously been performed primarily using other techniques such as different forms of local administration.16,17 In the felodipine study, a significantly lower rate of absorption was identified in the colon as compared to the small intestine. This is thought to be related to lower solubility of the released drug substance rather than a lower permeability across the gut wall. Even though no significantly different bioavailability was identified over the different parts of the small intestine in the felodipine study, it is clear that such differences can be identified using this methodology.
The inclusion of a semimechanistic liver compartment isolates the hepatic firstpassage metabolism that depends on EH (estimated hepatic extraction ratio) from all other bioavailabilitylimiting factors FA. The total bioavailability (F) is equal to (1 − EH) × FA (F = 0.115 for fasting and F = 0.195 for fed).
No single hypothesis has been able to explain the estimated higher Fa across the gut wall in the case of tablets taken together with food. Previous published studies on food interaction with the felodipine ER tablet, as well as unpublished studies filed to support the felodipine label, do not suggest such a pronounced effect.18 A scintigraphybased study performed with an earlier ER formulation of felodipine did not suggest an overall higher bioavailability when the tablet was taken together with food, only higher peak concentrations.19 The higher peak concentrations are quite possibly solely dependent on the delayed gastric emptying. On the basis of the results of the previous studies of felodipine–food interaction involving far more individuals, it is likely that the food effect on the fraction absorbed is
table 3 estimated mean transit times for tablet transit through the GI tract
parameter estimate (min) 90% Ci (min)
MTTFA, Fasting 24 14–46
MTTFA, Fed 63 38–115
MTTAF 165 85–385
MTTAP, Fasting 22 11–47
MTTAP, Fed 222 107–576
MTTPD 130 98–178
MTTDC 73 51–109
AF, antrum to fundus; AP, antrum to proximal small intestine; CI, confidence interval, DC, distal small intestine to colon; FA, fundus to antrum; GI, gastrointestinal; MTT, mean transit time; PD, proximal small intestine to distal small intestine.
0
5
10
15
20
25
0
5
10
15
20
25
0 5 10 15 20 0 5 10 15 20 0 5
Plas
ma
conc
entra
tion
(nm
ol/l)
/dru
g re
leas
e (m
g)
10 15 20
Fundus
Antrum
Proximal si
Distal si
Colon
Fundus
Antrum
Proximal si
Distal si
Colon
Time after dose (h)
Figure 4 Simulated individual data vs. time, including GI tract transit, in vivo drug release, and plasma concentrations following administration of felodipine extended release formulation with food. Tablet location in the GI tract is depicted with a broken black line on the right-hand y-axis. In vivo drug release (solid gray line) and plasma concentration (solid black line) are depicted on the left-hand y-axis. si, small intestine.

CliniCal pharmaCology & TherapeuTiCs | VOLUME 86 NUMBER 1 | JULY 2009 81
articles
overestimated in this study. The small number of individuals in the study leaves the possibility that the observed difference is attributable to large interoccasion variability and random chance. Furthermore, the presence of a highly atypical individual (individual no. 4) and an unfortunate early termination of plasma concentration monitoring decreases the power to reach a clear conclusion about this. No single reason has been conclusively determined to explain the highly atypical plasma concentrations seen in individual no. 4, but the results seem to be consistent with complete absorption across the gut wall.
The Markov model approach was found to be suitable for describing the GI tract transit of the disintegrating tablets. It offers a convenient opportunity to make inferences about the magnitude and origin of covariate effects such as concomitant food intake. Parameter estimates of the Markov model are fairly uncertain. This is expected, given the small number of indivi duals studied. More precise parameter estimates could be obtained in the future by performing pooled analysis over several studies using this methodology. The pooled analysis could be performed across different formulations that are anticipated to have similar GI tract transit patterns. Parameter estimates from such a pooled analysis could serve as useful prior information to support the analysis of individual studies in the future.20
The advanced compartmental absorption and transit (ACAT) model21 has structural similarities to the modeling approach presented in this article. The ACAT model has been used for simulations based on in vitro data and physicochemical properties; our model, on the other hand, is adapted for MMM data and is used for the estimation of in vivo properties such as regional drug release, absorption rate, and fraction absorbed. Another pronounced difference is that, whereas the model described in this article uses a Markov model to describe discrete tablet movement through the GI tract, the ACAT model assumes continuous processes for drug transfer and dispersion of the undisintegrated tablet in the GI tract.
The amount of unexplained inter and intraindividual variability affecting oral absorption of felodipine was found to be small when the influence of GI tract location and concomitant food intake was accounted for. This is in clear contrast to unpublished results from a more traditional model with lagtime and a firstorder absorption. The modelbased evaluation of this MMM study was found to strengthen previously suggested conclusions and also reveal additional quantitative mechanistic knowledge about the pharmacokinetics of the felodipine ER formulation. Furthermore, it allows for simulations of new individuals (Figure 4). This is something that can be useful in a clinical trial simulation setting and for visualizing and interpreting in vitro predictions.
MethoDsthe study. In a clinical crossover study, the GI transit and the in vivo drug release of magnetically labeled ER tablets containing felodipine were monitored under fasting and fed conditions in six healthy volunteers, using MMM.2 MMM is a highly sensitive technique for the threedimensional realtime tracking of solid dosage forms in the GI tract.1 The method is based on the labeling of solid dosage forms as
magnetic dipoles by the incorporation of small amounts (in the case of this clinical study, 5 mg) of the ferromagnetic food colorant black iron oxide into the dosage form and subsequent magnetization of the dosage form. The location, orientation, and strength of the magnetic dipole are determined by using extremely sensitive biomagnetic measurement equipment based on superconducting quantum interference devices. In the MMM study2 the limit of quantification was set to 10% of the initial magnetic moment of the tablet. This corresponds to an amount of felodipine released of ~8 mg (i.e., 80% of the total drug content). Because of an unfortunate protocol violation, sampling of plasma concentrations was terminated when the magnetic moment was too weak to monitor any further.
This study yielded three kinds of observations: location of the tablet in the GI tract, the remaining part of the undisintegrated tablet, and plasma concentration of felodipine. These data were combined with concentration data obtained from a previous study involving i.v. infusion in eight healthy volunteers.21 The additional i.v. data were included in the analysis to increase the information on felodipine disposition. Additional information on study conditions and subject demographics are presented in the referenced publications.
Tablet location within the GI tract was categorized into five distinct regions: fundus (proximal stomach), antrum (middle and distal stomach), proximal small intestine, distal small intestine, and colon.
Model building. Data analysis was carried out using a nonlinear mixedeffects approach as implemented in NONMEM software version VI, level 1.0 (ICON Development Solutions, Ellicott City, MD).22 The firstorder conditional estimation method with interaction and the ADVAN6 (general nonlinear kinetics) subroutine were applied for parameter estimation. Model discrimination was based on goodnessoffit plots, simulations, and changes in NONMEM’s objective function value. Xpose 4.0 (Uppsala University) was used for data checkout, graphics, and other diagnostic techniques, to assist in the model building.23
Model building was carried out in a stepwise manner in which separate models for the drug release and for the i.v. dosing data were developed first. These models were later used as fixed parts of an integrated model that also described distribution of the released drug and its absorption. Finally, the entire integrated model was fitted to all data, and all parameters were reestimated (Figure 1).
In the integrated model, tablet location within the GI tract was integrated as a covariate varying with time and modeled separately using a Markov model approach to allow for simulations of new individuals. The NONMEM code for the two models is available on request.
Drug-release model. The input data for modeling of the drug release were estimates of drug substance remaining in the tablet. These data had been previously obtained by applying a known in vitro relationship between drug release and decrease in magnetic signal to the in vivo measurements of magnetic signal as described by Weitschies et al.2 Throughout the model building, several approaches were tested to describe the in vivo release of felodipine from the disintegrating tablets. Zeroorder release rate constants as well as firstorder constants were investigated. The effects of having different release rates for the different GI tract locations and/or different implementations of direct food interaction (timedependent/independent) were also investigated.
GI distribution of released drug substance, absorption, and disposi-tion. A threecompartment model was first fitted separately to the intravenous dosing data. The elimination of felodipine was assumed to be 100% hepatic and was described with a hypothetical liver compartment.15,24,25 An allometric relationship to weight was assumed a priori for liver volume, liver blood flow, and all other disposition parameters.26 Typical liver volume and liver blood flow for a 70kg person were assumed to be 1 l and 90 l/h, respectively. Furthermore, a literature value of 1.45 for the felodipine blood/plasma concentration ratio was assumed in order to relate the estimated hepatic extraction ratio to hepatic clearance.

82 VOLUME 86 NUMBER 1 | JULY 2009 | www.nature.com/cpt
articles
When the data relating to oral dosing were first included, the disposition parameters were fixed to estimates derived from modeling of data relating to i.v. administration only. Furthermore, the amount of substance available for absorption was fixed to prior estimates of drug release. The released drug substance was directed into five compartments representing the different observed GI tract locations, based on the timevarying covariate of the observed GI tract location. Transitions between the different GI tract locations frequently occurred between monitoring sessions. Two approaches to handling such transitions were explored. A simple approach involved setting the unknown time of transit at midway between the observations before and after. This approach was compared with a more elaborate approach, in which the time of transit was estimated. It was assumed that there was no absorption from the stomach. Transport of the released drug substance from fundus to antrum and transport from antrum to the proximal small intestine (duodenum) were described in terms of two separate rate constants. In the final model, apart from firstorder rate constants governing the constant distribution, a fixed acceleration factor (+5 h−1) was added at the time of tablet transit. Efforts made to estimate these acceleration factors resulted in highly uncertain parameter estimates and unsuccessful termination. A sensitivity analysis was performed to assess the impact of setting the fixed acceleration factor to higher values. Separate rates and extents of absorption were investigated for the three GI tract locations: proximal small intestine, distal small intestine, and colon. A schematic of the integrated drug release, absorption, and disposition model is presented in Figure 1.
tablet transit through the GI tract. Tablet transit through the GI tract was described with a Markov chain–type model in which the probability of observing the tablet in the various GI locations was dependent on where it was last observed and the time elapsed since the last observation. This was achieved with a compartmental model in which the amounts in all compartments at any time point add up to 1 and represent probability. Each of the distinct GI locations was represented by one or more compartments. Firstorder rate constants were used to determine how probability was shifted within the compartmental system between observations. At each observation, the system was reset and the probability was set to 1 for the observed compartment.
A chain of transit compartments was used to achieve a prolonged retention time in proximal and distal small intestine. A sufficient number of transit compartments was found by increasing the number of transit compartments stepwise until there was only a marginal improvement in the NONMEM objective function value (<0.5) with the addition of more compartments. In the final model, the proximal small intestine was characterized by four transit compartments, and the distal small intestine was characterized by three (Figure 2). The reinitialization of the transit compartments after an observation of the tablet in one of the small intestine locations was done in relation to the probability associated with each of the transit compartments immediately prior to the observation (Eq. 1).
PPPii
i n
= ′′−∑
, (1)
where Pi = probability of transit compartment i; ′Pi = probability of transit compartment i previous to observation; ′−∑Pi n = sum of probabilities for all transit compartments previous to observation.
The parameters in this model were estimated in the form of mean transit times. Mean transit time relates to the firstorder rate constants in accordance with Eq. 2.
MTTNKij
i
ij
= , (2)
where MTTij = mean transit time from position i to j; Ni = number of transit compartments describing position i; Kij = firstorder rate constant governing flow of probability between positions i and j.
The uncertainty around parameter estimates was obtained with log likelihood profiling as implemented in the package perlspeaks
NONMEM.27 The effect of concomitant food intake was evaluated for all parameters in the model.
simulations. Simulations of new individuals were performed on the basis of final parameter estimates for illustrative purposes. The simulations were carried out by first simulating tablet movement with the Markov model under fed and fasting conditions. The simulated tablet locations were utilized as input covariate data to simulate plasma concentration and drug release profiles based on the integrated model.
conFlIct oF InteRestM.B. was supported by a grant from AstraZeneca. M.O.K. and W.W. have received research funding from AstraZeneca. E.S. is employed by AstraZeneca.
© 2009 American Society for Clinical Pharmacology and Therapeutics
1. Weitschies, W., Kosch, O., Monnikes, H. & Trahms, L. Magnetic Marker Monitoring: an application of biomagnetic measurement instrumentation and principles for the determination of the gastrointestinal behavior of magnetically marked solid dosage forms. Adv. Drug Deliv. Rev. 57, 1210–1222 (2005).
2. Weitschies, W. et al. Impact of the intragastric location of extended release tablets on food interactions. J. Control Release 108, 375–385 (2005).
3. Weitschies, W. et al. Bioavailability of amoxicillin and clavulanic acid from extended release tablets depends on intragastric tablet deposition and gastric emptying. Eur. J. Pharm. Biopharm. 70, 641–648 (2008).
4. Podczeck, F., Course, N.J. & Newton, J.M. Determination of the gastric emptying of solid dosage forms using gamma-scintigraphy: a problem of image timing and mathematical analysis. Eur. J. Nucl. Med. 26, 373–378 (1999).
5. Lalonde, R.L. et al. Model-based drug development. Clin. Pharmacol. Ther. 82, 21–32 (2007).
6. Miller, R. et al. How modeling and simulation have enhanced decision making in new drug development. J. Pharmacokinet. Pharmacodyn. 32, 185–197 (2005).
7. Powell, J.R. & Gobburu, J.V. Pharmacometrics at FDA: evolution and impact on decisions. Clin. Pharmacol. Ther. 82, 97–102 (2007).
8. Sheiner, L.B. Learning versus confirming in clinical drug development. Clin. Pharmacol. Ther. 61, 275–291 (1997).
9. Aarons, L. et al. Role of modelling and simulation in Phase I drug development. Eur. J. Pharm. Sci. 13, 115–122 (2001).
10. Haruta, S. et al. Evaluation of absorption kinetics of orally administered theophylline in rats based on gastrointestinal transit monitoring by gamma scintigraphy. J. Pharm. Sci. 90, 464–473 (2001).
11. Iavarone, L. et al. A population PK model to evaluate variability in oral absorption using gamma scintigraphy. PAGE 17 (2008) Abstr 1319 <http://www.page-meeting.org/?abstract=1319>.
12. Gaynor, C., Dunne, A. & Davis, J. A comparison of the prediction accuracy of two IVIVC modelling techniques. J. Pharm. Sci. 97, 3422–3432 (2008).
13. Gaynor, C., Dunne, A. & Davis, J. A differential equations approach to in vitro– in vivo correlation modelling in NONMEM. PAGE 17 (2008) Abstr 1267 <http://www.page-meeting.org/?abstract=1267>.
14. Buchwald, P. Direct, differential-equation-based in-vitro-in-vivo correlation (IVIVC) method. J. Pharm. Pharmacol. 55, 495–504 (2003).
15. Edgar, B. et al. Felodipine kinetics in healthy men. Clin. Pharmacol. Ther. 38, 205–211 (1985).
16. Nyberg, L., Mansson, W., Abrahamsson, B., Seidegard, J. & Borga, O. A convenient method for local drug administration at predefined sites in the entire gastrointestinal tract: experiences from 13 phase I studies. Eur. J. Pharm. Sci. 30, 432–440 (2007).
17. Petri, N., Borga, O., Nyberg, L., Hedeland, M., Bondesson, U. & Lennernas, H. Effect of erythromycin on the absorption of fexofenadine in the jejunum, ileum and colon determined using local intubation in healthy volunteers. Int. J. Clin. Pharmacol. Ther. 44, 71–79 (2006).
18. Plendil extended-release tablets [FDA label]. <http://www.fda.gov/cder/foi/label/2004/19834slr022_plendil_lbl.pdf> (2004).
19. Abrahamsson, B. et al. Absorption, gastrointestinal transit, and tablet erosion of felodipine extended-release (ER) tablets. Pharm. Res. 10, 709–714 (1993).
20. Gisleskog, P.O., Karlsson, M.O. & Beal, S.L. Use of prior information to stabilize a population data analysis. J. Pharmacokinet. Pharmacodyn. 29, 473–505 (2002).

CliniCal pharmaCology & TherapeuTiCs | VOLUME 86 NUMBER 1 | JULY 2009 83
articles
21. Edgar, B., Hoffmann, K.J., Lundborg, P., Regardh, C.G., Ronn, O. & Weidolf, L. Absorption, distribution and elimination of felodipine in man. Drugs 29 (suppl 2), 9–15 (1985).
22. Beal, S.L., Sheiner, L.B. & Boeckmann, A.J. NONMEM Users Guides (1989–2006) (Icon Development Solutions, Ellicott City, MD).
23. Jonsson, E.N. & Karlsson, M.O. Xpose—an S-PLUS based population pharmacokinetic/pharmacodynamic model building aid for NONMEM. Comput. Methods Programs Biomed. 58, 51–64 (1999).
24. Edgar, B., Regardh, C.G., Attman, P.O., Aurell, M., Herlitz, H. & Johnsson, G. Pharmacokinetics of felodipine in patients with impaired renal function. Br. J. Clin. Pharmacol. 27, 67–74 (1989).
25. Gordi, T., Xie, R., Huong, N.V., Huong, D.X., Karlsson, M.O. & Ashton, M. A semiphysiological pharmacokinetic model for artemisinin in healthy subjects incorporating autoinduction of metabolism and saturable first-pass hepatic extraction. Br. J. Clin. Pharmacol. 59, 189–198 (2005).
26. Holford, N.H. A size standard for pharmacokinetics. Clin. Pharmacokinet. 30, 329–332 (1996).
27. Lindbom, L., Pihlgren, P. & Jonsson, E.N. PsN-Toolkit—a collection of computer intensive statistical methods for non-linear mixed effect modeling using NONMEM. Comput. Methods Programs Biomed. 79, 241–257 (2005).