Mechanical stratigraphy as a factor controlling the development of a sandbox transfer zone: a...
14
UNCORRECTED PROOF Mechanical stratigraphy as a factor controlling the development of a sandbox transfer zone: a three-dimensional analysis Antonio Ravaglia a, * , Claudio Turrini b , Silvio Seno a a 3D Modelling Laboratory, Dipartimento di Scienze della Terra, Universita ` di Pavia, Via Ferrata, 1, 27100 Pavia, Italy b Total, 2 Place de La Coupole, 92078 Paris La Defense, France Received 14 April 2003; received in revised form 29 January 2004; accepted 12 April 2004 Abstract In thrust belts, fold – fault terminations are common features of the structural architecture and can pose complicated problems to unravel, in particular when two or more terminations are in close proximity. Such terminations usually reflect pre-existing attributes. Amongst the many factors, lateral variations in the mechanical stratigraphy can control along-strike geometry and kinematics of fault-related folds. A displacement transfer zone was produced in a compressional sandbox model by means of two adjacent, mechanically different stratigraphic domains. The experiment allowed two discrete chains to develop in the different domains, so that a complex structural setting occurred in the connecting area. Periclinal folds, oblique thrust fronts and oblique ramps developed in the resulting transfer zone. The interaction between periclines in the transfer zone produced lateral culminations in the folded structures. The analysis of displacement across the structural domains revealed that a significant loss of slip along the faults occurred in the relay zone. In this area, imbricate faulting was partially replaced by layer-parallel shortening. A linear relationship appears to exist between the bed length of the thrust sheet and the related fault slip. q 2004 Published by Elsevier Ltd. Keywords: Displacement gradient; Lateral/oblique ramps; Fault-related folds; Plunging folds; Sandbox model; Strain partitioning; Transfer zones; Mechanical stratigraphy; Critical-taper theory; Bed-length versus slip relationship; Lateral heterogeneity 1. Introduction Displacement transfer zones are complex structural domains characterized by rapid lateral and vertical changes in the structural elements. In compressional settings, oblique and/or curved thrust fronts, en-e ´chelon plunging anticlines, anastomosing fault patterns, tear faults and lateral ramps are all evidence of transfer zones. Each of these geological structures transfers and accommodates displacement along the strike (Dahlstrom, 1970; Blay et al., 1977; Wilkerson et al., 2002). Where two or more overlapping fault segments occur, the slip across a fault surface decreases and, finally, dies out towards its tip, replaced by the increasing slip on the contiguous fault. Displacement profiles between overlapping structures (Rowan, 1997; Burbank et al., 1999; Nicol et al., 2002) often display loss of slip that may suggest various mechanisms of shortening accommodations such as folding, faulting and layer parallel shortening. In fact, structures may be the result of the strain accommodated by the arrangement of these three main mechanisms, which mutually act both vertically and laterally. At the thrust tips, whether frontal or lateral, there are localized zones of layer parallel shortening and layer thickening as well (Coward and Potts, 1983; Geiser, 1988; Butler, 1992). A correct evaluation of the shortening accommodation may improve the cross-section construction and validation process. Besides, the close proximity of more faults and folds poses some questions regarding the geometrical compatibility of the structures in three dimensions. Interference occurs at the lateral tips of faults and folds where the development of low level and generally younger thrusts may cause refolding and strain to occur on the upper and older sheet (Coward and Potts, 1983). In nature, transfer zones have been widely recognised and greatly studied in different tectonic settings. In fold- and-thrust belts, the role played by the lateral variation of 0191-8141/$ - see front matter q 2004 Published by Elsevier Ltd. doi:10.1016/j.jsg.2004.04.009 Journal of Structural Geology xx (0000) xxx–xxx www.elsevier.com/locate/jsg * Corresponding author. Tel.: þ 39-0382-505857; fax: þ 39-0382- 505890. E-mail address: [email protected] (A. Ravaglia). SG 1559—7/7/2004—17:02—MNICHOLLS—110000— MODEL 5 – pp. 1–14 ARTICLE IN PRESS 1 2 3 4 5 6 7 8 9 10 11 12 13 14 15 16 17 18 19 20 21 22 23 24 25 26 27 28 29 30 31 32 33 34 35 36 37 38 39 40 41 42 43 44 45 46 47 48 49 50 51 52 53 54 55 56 57 58 59 60 61 62 63 64 65 66 67 68 69 70 71 72 73 74 75 76 77 78 79 80 81 82 83 84 85 86 87 88 89 90 91 92 93 94 95 96 97 98 99 100 101 102 103 104 105 106 107 108 109 110 111 112
-
Upload
independent -
Category
Documents
-
view
2 -
download
0
Transcript of Mechanical stratigraphy as a factor controlling the development of a sandbox transfer zone: a...
UNCORRECTED PROOF
Mechanical stratigraphy as a factor controlling the development of a
sandbox transfer zone: a three-dimensional analysis
Antonio Ravagliaa,*, Claudio Turrinib, Silvio Senoa
a3D Modelling Laboratory, Dipartimento di Scienze della Terra, Universita di Pavia, Via Ferrata, 1, 27100 Pavia, ItalybTotal, 2 Place de La Coupole, 92078 Paris La Defense, France
Received 14 April 2003; received in revised form 29 January 2004; accepted 12 April 2004
Abstract
In thrust belts, fold–fault terminations are common features of the structural architecture and can pose complicated problems to unravel, in
particular when two or more terminations are in close proximity. Such terminations usually reflect pre-existing attributes. Amongst the many
factors, lateral variations in the mechanical stratigraphy can control along-strike geometry and kinematics of fault-related folds.
A displacement transfer zone was produced in a compressional sandbox model by means of two adjacent, mechanically different
stratigraphic domains. The experiment allowed two discrete chains to develop in the different domains, so that a complex structural setting
occurred in the connecting area. Periclinal folds, oblique thrust fronts and oblique ramps developed in the resulting transfer zone. The
interaction between periclines in the transfer zone produced lateral culminations in the folded structures. The analysis of displacement across
the structural domains revealed that a significant loss of slip along the faults occurred in the relay zone. In this area, imbricate faulting was
partially replaced by layer-parallel shortening. A linear relationship appears to exist between the bed length of the thrust sheet and the related
fault slip.
q 2004 Published by Elsevier Ltd.
Keywords: Displacement gradient; Lateral/oblique ramps; Fault-related folds; Plunging folds; Sandbox model; Strain partitioning; Transfer zones; Mechanical
stratigraphy; Critical-taper theory; Bed-length versus slip relationship; Lateral heterogeneity
1. Introduction
Displacement transfer zones are complex structural
domains characterized by rapid lateral and vertical changes
in the structural elements. In compressional settings,
oblique and/or curved thrust fronts, en-echelon plunging
anticlines, anastomosing fault patterns, tear faults and
lateral ramps are all evidence of transfer zones. Each of
these geological structures transfers and accommodates
displacement along the strike (Dahlstrom, 1970; Blay et al.,
1977; Wilkerson et al., 2002). Where two or more
overlapping fault segments occur, the slip across a fault
surface decreases and, finally, dies out towards its tip,
replaced by the increasing slip on the contiguous fault.
Displacement profiles between overlapping structures
(Rowan, 1997; Burbank et al., 1999; Nicol et al., 2002)
often display loss of slip that may suggest various
mechanisms of shortening accommodations such as folding,
faulting and layer parallel shortening. In fact, structures may
be the result of the strain accommodated by the arrangement
of these three main mechanisms, which mutually act both
vertically and laterally. At the thrust tips, whether frontal or
lateral, there are localized zones of layer parallel shortening
and layer thickening as well (Coward and Potts, 1983;
Geiser, 1988; Butler, 1992). A correct evaluation of the
shortening accommodation may improve the cross-section
construction and validation process. Besides, the close
proximity of more faults and folds poses some questions
regarding the geometrical compatibility of the structures in
three dimensions. Interference occurs at the lateral tips of
faults and folds where the development of low level and
generally younger thrusts may cause refolding and strain to
occur on the upper and older sheet (Coward and Potts,
1983).
In nature, transfer zones have been widely recognised
and greatly studied in different tectonic settings. In fold-
and-thrust belts, the role played by the lateral variation of
0191-8141/$ - see front matter q 2004 Published by Elsevier Ltd.
doi:10.1016/j.jsg.2004.04.009
Journal of Structural Geology xx (0000) xxx–xxx
www.elsevier.com/locate/jsg
* Corresponding author. Tel.: þ39-0382-505857; fax: þ39-0382-
505890.
E-mail address: [email protected] (A. Ravaglia).
SG 1559—7/7/2004—17:02—MNICHOLLS—110000— MODEL 5 – pp. 1–14
ARTICLE IN PRESS
1
2
3
4
5
6
7
8
9
10
11
12
13
14
15
16
17
18
19
20
21
22
23
24
25
26
27
28
29
30
31
32
33
34
35
36
37
38
39
40
41
42
43
44
45
46
47
48
49
50
51
52
53
54
55
56
57
58
59
60
61
62
63
64
65
66
67
68
69
70
71
72
73
74
75
76
77
78
79
80
81
82
83
84
85
86
87
88
89
90
91
92
93
94
95
96
97
98
99
100
101
102
103
104
105
106
107
108
109
110
111
112
UNCORRECTED PROOF
the mechanical stratigraphy is frequently considered one of
the most important factors explaining the presence of lateral
and oblique ramps, tear faults and pericline terminations
(Fischer and Woodward, 1992; Letouzey et al., 1995;
Corrado et al., 1998; Philippe et al., 1998; Thomas and
Bayona, 2002, among others).
Several physical models have been built to simulate and
analyse transfer zones. The induced lateral variations were
obtained by imposing:
† variable thickness of the initial stratigraphy (Marshak
and Wilkerson, 1992; Marshak et al., 1992; Corrado et al.,
1998; Marques and Cobbold, 2002; Soto et al., 2002,
2003);
† vertical passive offset of the basement (Calassou et al.,
1993; Corrado et al., 1998);
† horizontal passive offset of the backstop (Calassou et al.,
1993);
† variable basal friction (Colletta et al., 1991; Calassou
et al., 1993; Cotton and Koyi, 2000; Schreurs et al., 2001;
Turrini et al., 2001; Lickorish et al., 2002; Bahroudi and
Koyi, 2003; Luian et al., 2003);
† presence of stationary ‘foreland’ obstacles (Corrado
et al., 1998; Turrini et al., 2001; Lickorish et al., 2002;
Gomes et al., 2003);
† syntectonic sedimentation or erosion (Barrier et al.,
2002; Marques and Cobbold, 2002), and
† non-homogeneous (i.e. interbedded layer composition)
mechanical stratigraphy (Corrado et al., 1998; Turrini
et al., 2001).
In this work we analyse the influence of mechanical
stratigraphy in the construction of a transfer zone and the
interactions occurring between faults and folds, while
evaluating the complexity of the resulting structural style.
We present a detailed analysis of a compressional sandbox
model, being part of a set of experiments focusing on
transfer zone simulation with lateral variation of the
mechanical stratigraphy. We reconstruct the three-dimen-
sional geometry of folds and faults in the resulting transfer
zone, giving a relationship between the lateral variation of a
thrust sheet and the slip along its fault. Finally, we assess the
partitioning of strain both along strike and vertically.
2. The experiment
For a complete historical review of modelling techniques
and a complete literature list, see Koyi (1997), Cobbold and
Castro (1999), Ranalli (2001) and Schellart (2002). We
reproduced a displacement transfer zone by simultaneously
deforming two adjacent, mechanically different, strati-
graphic domains within a sandbox apparatus (Fig. 1). The
first domain was a multilayer (non-homogeneous domain)
composed of sand and glass microbeads beds; the second
was a sand-only domain (homogeneous domain). The
thickness was constant across the model. The boundary
(B) between the two sectors was parallel to the shortening
direction and was located along the central part of the
model.
The initial model was 42 cm long, 30 cm wide and
1.8 cm high. We used two types of granular materials with
different physical parameters: sand, and glass microbeads.
The sand has an angle of internal friction (f) of 338 and a
grain size of 100–300 mm. In the near side of the model, i.e.
from 0 to 15 cm along-strike, two layers of 3 mm each of
glass microbeads replaced the sand, at 6 and 12 mm from
the base of the model. Glass microbeads are suitable for
simulating natural rocks because they enable low basal
friction detachment (Sassi et al., 1993) and inter-strata slips
(Turrini et al., 2001) to occur. Glass microbeads have
f ¼ 248, due to their high sphericity and rounding
(Schellart, 2000), and a grain size of 300–400 mm. For
this reason, in the non-homogeneous domain, f had an
average value of 308. The two domains were shortened over
the same basal detachment, this having a friction angle (f)
of 328.
The foreland side of the box was not closed. As soon as
sand started falling down from the foreland edge of the box,
but only in the far left-hand side (homogeneous domain), the
total shortening was 18.5 cm (44%) and the experiment was
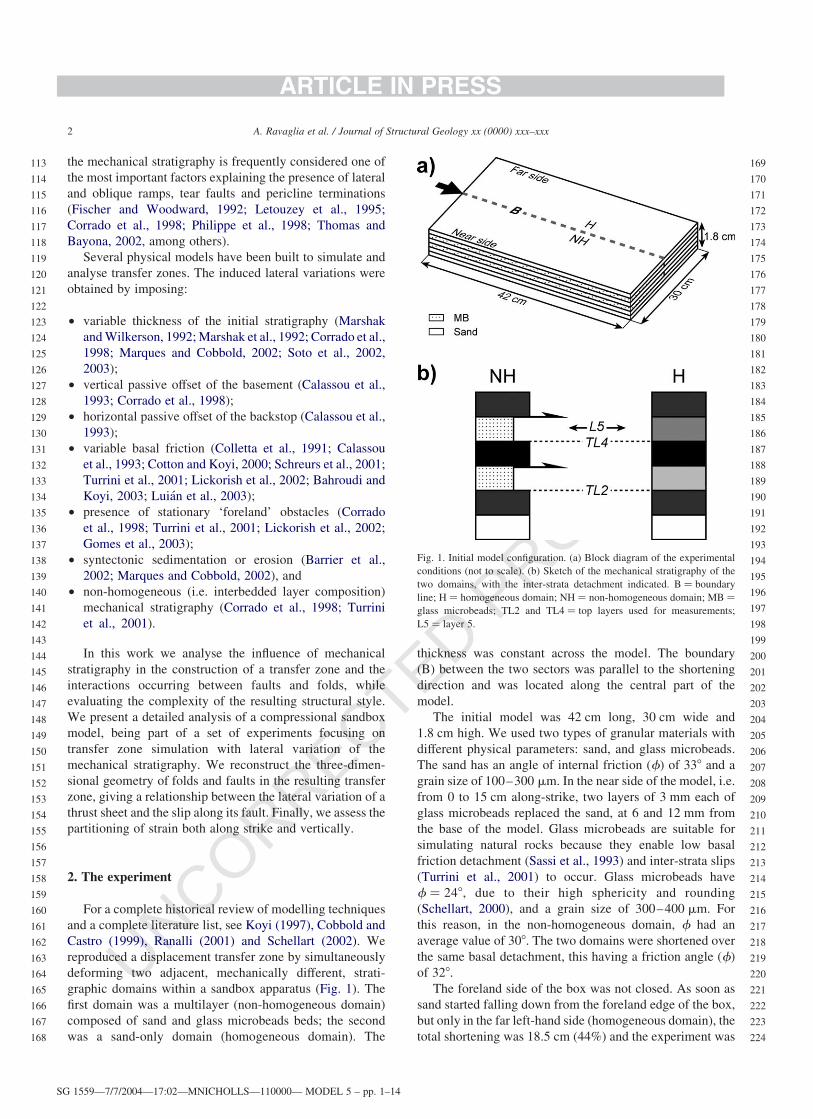
Fig. 1. Initial model configuration. (a) Block diagram of the experimental
conditions (not to scale). (b) Sketch of the mechanical stratigraphy of the
two domains, with the inter-strata detachment indicated. B ¼ boundary
line; H ¼ homogeneous domain; NH ¼ non-homogeneous domain; MB ¼
glass microbeads; TL2 and TL4 ¼ top layers used for measurements;
L5 ¼ layer 5.
SG 1559—7/7/2004—17:02—MNICHOLLS—110000— MODEL 5 – pp. 1–14
A. Ravaglia et al. / Journal of Structural Geology xx (0000) xxx–xxx2
ARTICLE IN PRESS
113
114
115
116
117
118
119
120
121
122
123
124
125
126
127
128
129
130
131
132
133
134
135
136
137
138
139
140
141
142
143
144
145
146
147
148
149
150
151
152
153
154
155
156
157
158
159
160
161
162
163
164
165
166
167
168
169
170
171
172
173
174
175
176
177
178
179
180
181
182
183
184
185
186
187
188
189
190
191
192
193
194
195
196
197
198
199
200
201
202
203
204
205
206
207
208
209
210
211
212
213
214
215
216
217
218
219
220
221
222
223
224
UNCORRECTED PROOF
considered finished. During the experiment, neither erosion
nor sedimentation were simulated. The analysis of 1-cm-
spaced sections across the final model, combined with a
progressive snap-shot of the evolution in plan, aided the
three-dimensional reconstruction of the obtained defor-
mation geometries through time and space. The opportunity
to see clear cut-offs allowed the dip length of the thrust sheet
and slip along the faults to be measured accurately.
Measurements were performed on two stratigraphic levels.
The model transfer zone was analysed by 11 cross-
sections, taken every centimetre from 10 to 20 cm from the
near side of the sandbox apparatus. The interpreted
structures were then measured and contoured to reconstruct
the three-dimensional deformation distribution across the
modelled transfer zone. Structure contour maps for faults
and layering were constructed based on digitized interpret-
ations of cross-sections.
3. Results
Two distinct thrust belts develop in each domain (Figs. 2
and 3). In the non-homogeneous domain, far from the
boundary line, first-order thrust sheets develop, along with
second-order thrust faults, these being detached over the
shallow glass microbeads level (Fig. 4d–g). Conversely, in
the homogeneous domain, only first-order thrusts occur. In
both the domains, only small backthrusts appear, which are
slightly more developed in the homogeneous domain.
The model kinematics follows a generic piggyback
sequence, from the hinterland to the foreland, without
significant out-of-sequence events. The main feature of the
experiment was the alternate development of the four
external thrusts (labelled 5–8; Fig. 2) in the two compart-
ments of the model. After the continuous growth of thrusts 3
and 4 over the entire width of the sandbox, thrusts 5–8
developed as related to discontinuous periclinal faulted
folds plunging towards the centre of the model. Thrusts 5
and 7 formed in the homogeneous domain, then rapidly
propagated laterally with fronts curved towards the middle
of the model, and crossed the boundary for a distance of
4.2 cm. Thrust faults 6 and 8 developed in the non-
homogeneous domain, then propagated along-strike with
oblique fronts across the boundary. Such thrusts extended
into the opposite domain only for 2 cm.
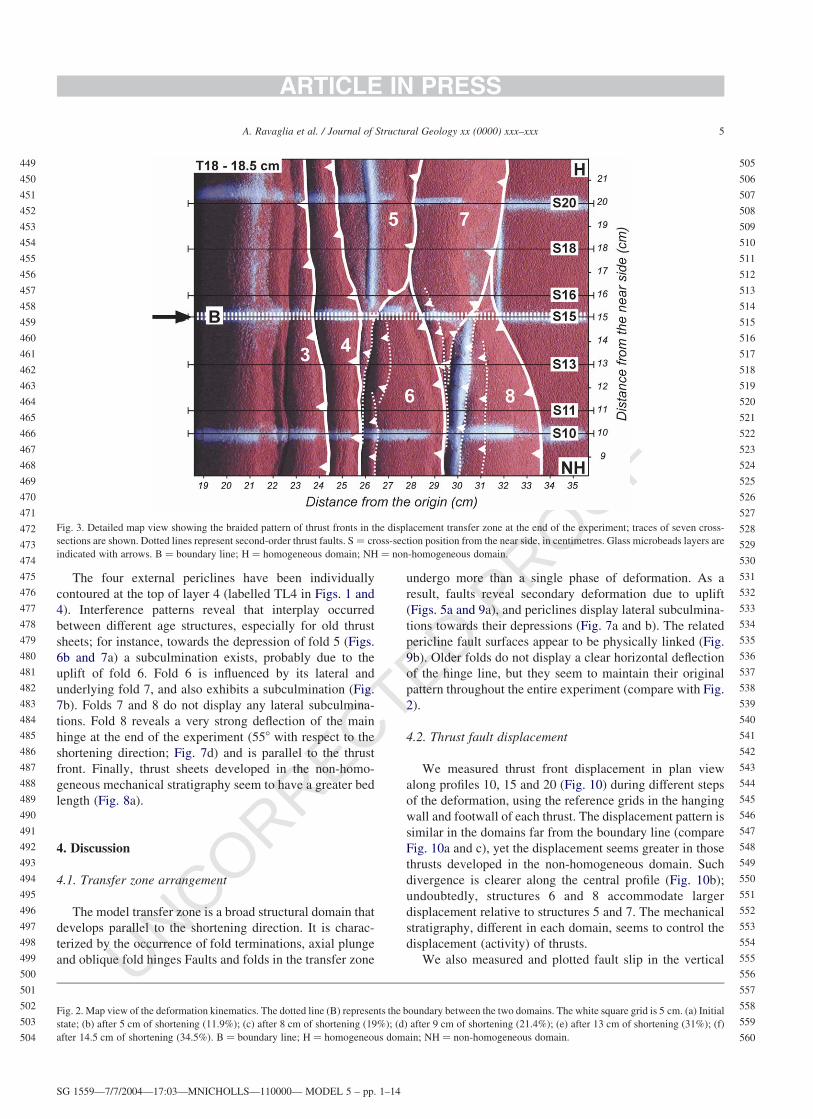
3.1. The transfer zone
A 6.2-cm-wide transfer zone parallel to the shortening
direction formed in the centre of the model, representing the
connection between the homogeneous and non-homo-
geneous domains. This zone was characterized by the
contemporaneous occurrence of all faulted folds. The close-
up photograph of the transfer zone in plan view (Fig. 3)
reveals a braided pattern of thrust fronts. Thrusts 3 and 4
were almost parallel to the backstop away from the
boundary line and are slightly oblique in the transfer zone.
For instance, thrust 4 in the transfer zone is oblique and has
an acute angle of 728 with respect to the shortening
direction. Thrust faults within the transfer zone tend to form
with strike directions oblique (rather than perpendicular) to
the shortening direction, and do not tend to rotate during the
temporal evolution of the thrust system. The oblique front
connects two thrusts, different both in bed length and fault
slip. Structures from 5 to 8 are nearly confined to the domain
where they grew, and terminate towards the centre of the
model with an oblique front. All of the pericline-related
thrust surfaces branch from the base of the model and
laterally join the adjacent and earlier surface (thrusts 5–8;
Figs. 3 and 4).
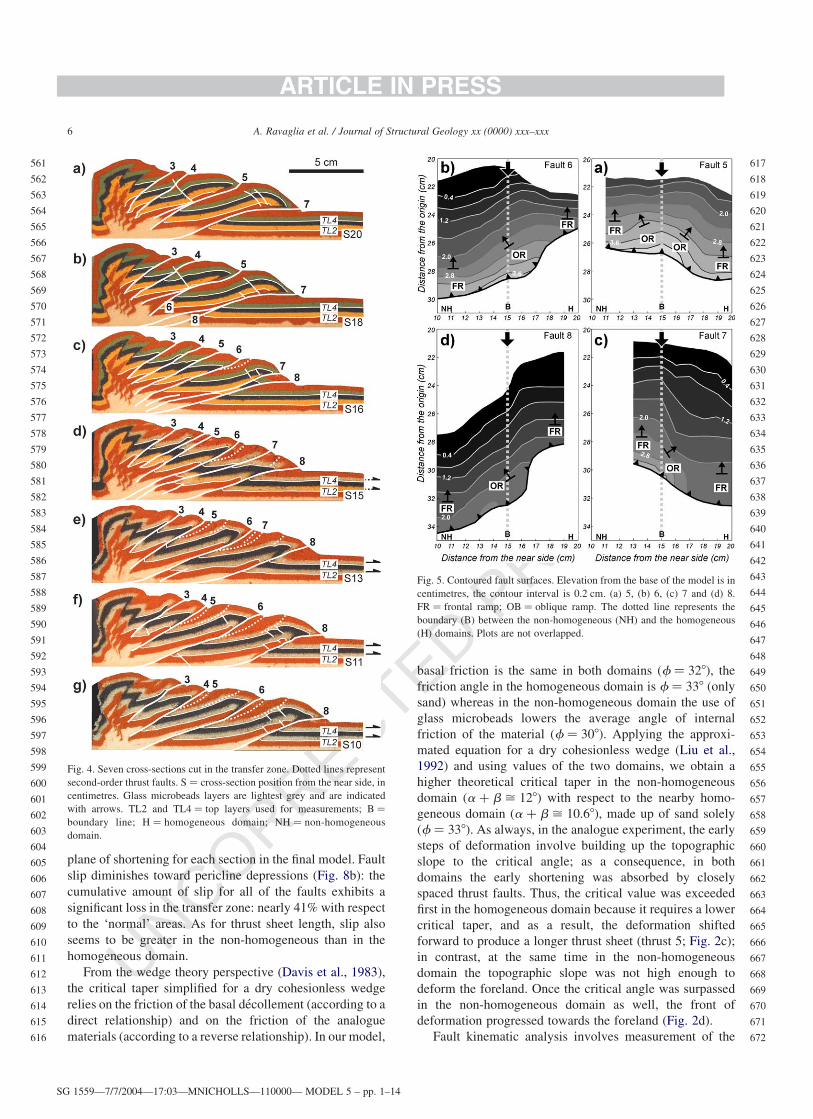
Fault surfaces in the transfer zone are oblique ramps
connecting frontal ramps on both sides (Figs. 5 and 6a).
Structural contours of faults 6–8 exhibit the geometry of the
oblique ramps that are normally associated with plunging
anticlines. The oblique ramp along fault 6 dips at 258 and the
angle between the strike of the ramp and the transport
direction is 558. Along fault 7, the oblique ramp is very
narrow and similar to a lateral ramp. The oblique ramp dips
at 288, and the angle between the strike of the ramp and the
transport direction is 268. Fault 8 shows a wide oblique ramp
dipping at 258; the angle between the strike of the ramp and
the transport direction is 508. At depth, thrust fault 8
branches off the footwall of the adjacent thrust fault 7 (Fig.
4b). Similarly, thrust surface 6 branches off the footwall of
fault 5. The position of the oblique ramps shows that the
transfer zone, or the interference area, is more developed in
the non-homogeneous domain than in the homogeneous
one.
3.2. Thrust sheet geometry
Except for structures in the hinterland, which are
continuous throughout the model, the four more external
folds are periclines plunging towards the centre of the model
(Figs. 3, 6b and 7). The bed lengths of such thrust sheets
strongly decrease along-strike, and become zero approach-
ing their tip in the opposite domain (Fig. 8a). In the non-
homogeneous domain, thrust sheets have the shape of
recumbent thrust related folds (see sheets 6 and 8, Fig. 4d–
g), whereas in the homogeneous domain they are upright
thrust related folds (see sheets 5 and 7; Fig. 4a–c).
Only in the non-homogeneous domain do two orders of
structures develop; first-order faulted folds branch from the
basal detachment, and second-order smaller thrust sheets
detach over the shallow glass microbeads bed. The second-
order structures are poorly developed because of the mutual
competition between the two weak layers. Indeed a higher
basal friction decollement would have likely produced a
greater second-order structures occurrence (Turrini et al.,
2001, see their fig. 18). However, second-order thrusts
terminate as they approach the homogeneous domain (Figs.
2 and 3).
SG 1559—7/7/2004—17:02—MNICHOLLS—110000— MODEL 5 – pp. 1–14
A. Ravaglia et al. / Journal of Structural Geology xx (0000) xxx–xxx 3
ARTICLE IN PRESS
225
226
227
228
229
230
231
232
233
234
235
236
237
238
239
240
241
242
243
244
245
246
247
248
249
250
251
252
253
254
255
256
257
258
259
260
261
262
263
264
265
266
267
268
269
270
271
272
273
274
275
276
277
278
279
280
281
282
283
284
285
286
287
288
289
290
291
292
293
294
295
296
297
298
299
300
301
302
303
304
305
306
307
308
309
310
311
312
313
314
315
316
317
318
319
320
321
322
323
324
325
326
327
328
329
330
331
332
333
334
335
336

UNCORRECTED PROOF
SG 1559—7/7/2004—17:02—MNICHOLLS—110000— MODEL 5 – pp. 1–14
ARTICLE IN PRESS
337
338
339
340
341
342
343
344
345
346
347
348
349
350
351
352
353
354
355
356
357
358
359
360
361
362
363
364
365
366
367
368
369
370
371
372
373
374
375
376
377
378
379
380
381
382
383
384
385
386
387
388
389
390
391
392
393
394
395
396
397
398
399
400
401
402
403
404
405
406
407
408
409
410
411
412
413
414
415
416
417
418
419
420
421
422
423
424
425
426
427
428
429
430
431
432
433
434
435
436
437
438
439
440
441
442
443
444
445
446
447
448
UNCORRECTED PROOF
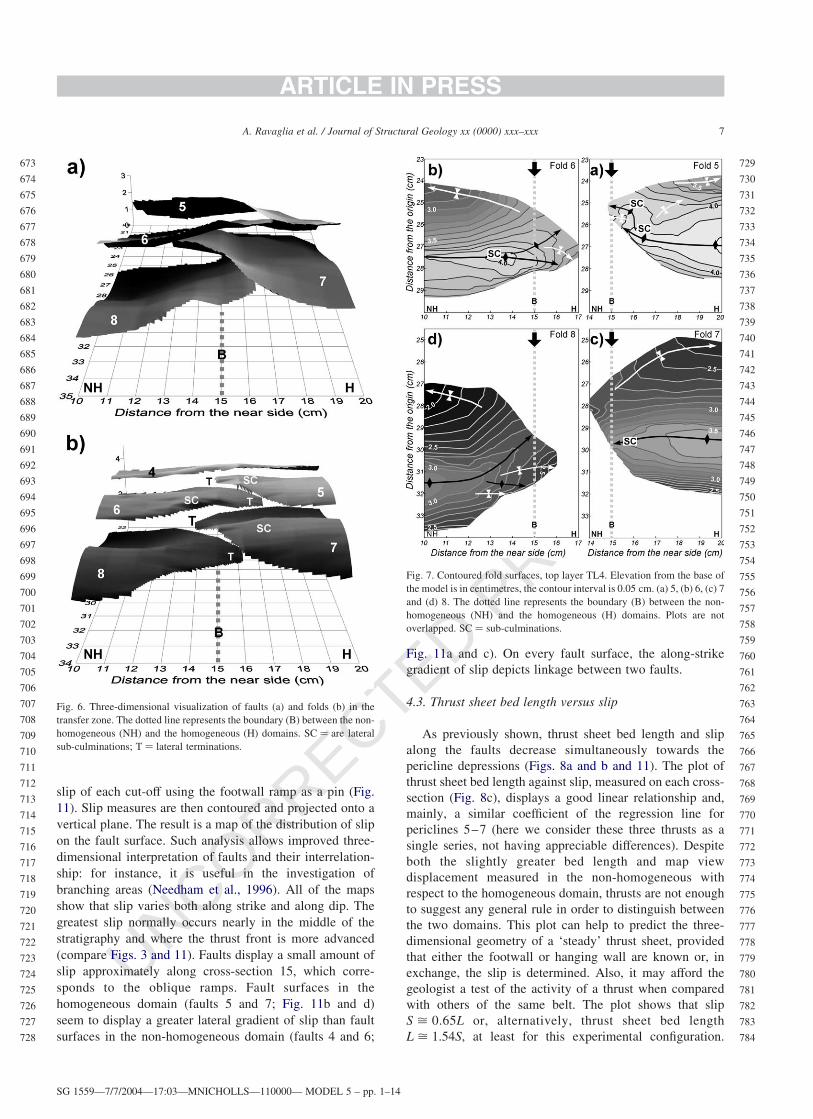
The four external periclines have been individually
contoured at the top of layer 4 (labelled TL4 in Figs. 1 and
4). Interference patterns reveal that interplay occurred
between different age structures, especially for old thrust
sheets; for instance, towards the depression of fold 5 (Figs.
6b and 7a) a subculmination exists, probably due to the
uplift of fold 6. Fold 6 is influenced by its lateral and
underlying fold 7, and also exhibits a subculmination (Fig.
7b). Folds 7 and 8 do not display any lateral subculmina-
tions. Fold 8 reveals a very strong deflection of the main
hinge at the end of the experiment (558 with respect to the
shortening direction; Fig. 7d) and is parallel to the thrust
front. Finally, thrust sheets developed in the non-homo-
geneous mechanical stratigraphy seem to have a greater bed
length (Fig. 8a).
4. Discussion
4.1. Transfer zone arrangement
The model transfer zone is a broad structural domain that
develops parallel to the shortening direction. It is charac-
terized by the occurrence of fold terminations, axial plunge
and oblique fold hinges Faults and folds in the transfer zone
undergo more than a single phase of deformation. As a
result, faults reveal secondary deformation due to uplift
(Figs. 5a and 9a), and periclines display lateral subculmina-
tions towards their depressions (Fig. 7a and b). The related
pericline fault surfaces appear to be physically linked (Fig.
9b). Older folds do not display a clear horizontal deflection
of the hinge line, but they seem to maintain their original
pattern throughout the entire experiment (compare with Fig.
2).
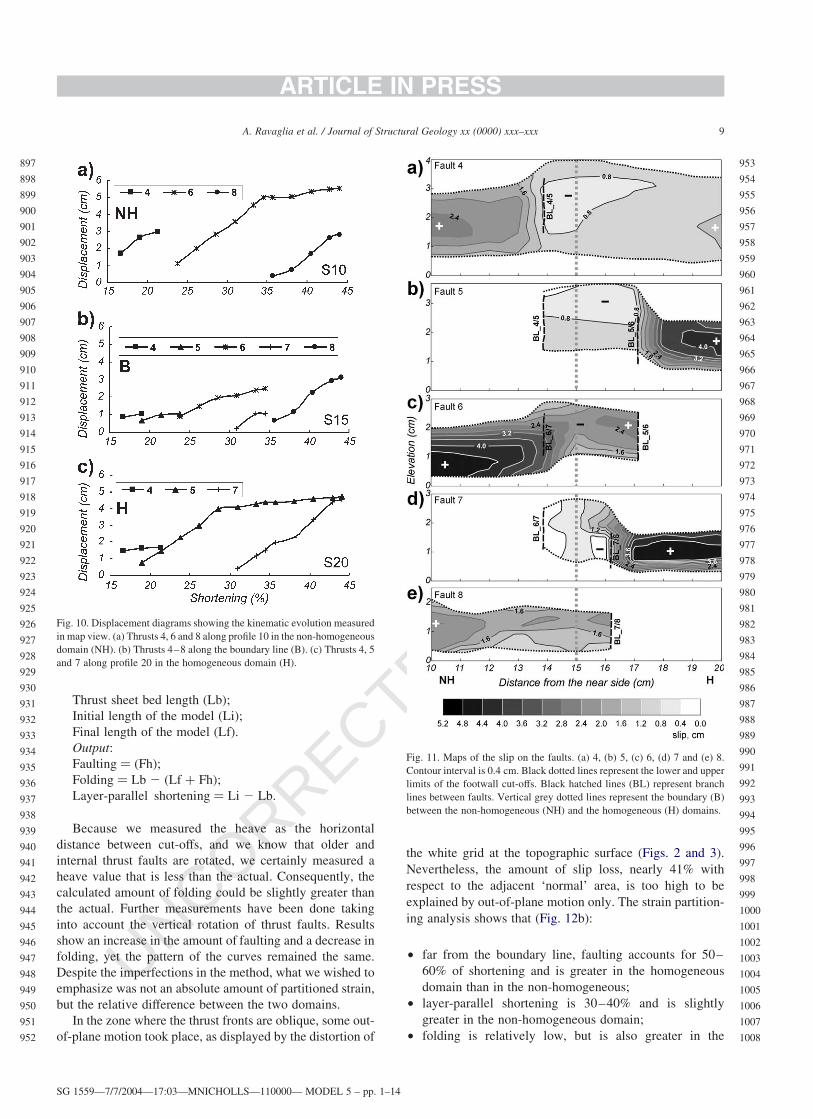
4.2. Thrust fault displacement
We measured thrust front displacement in plan view
along profiles 10, 15 and 20 (Fig. 10) during different steps
of the deformation, using the reference grids in the hanging
wall and footwall of each thrust. The displacement pattern is
similar in the domains far from the boundary line (compare
Fig. 10a and c), yet the displacement seems greater in those
thrusts developed in the non-homogeneous domain. Such
divergence is clearer along the central profile (Fig. 10b);
undoubtedly, structures 6 and 8 accommodate larger
displacement relative to structures 5 and 7. The mechanical
stratigraphy, different in each domain, seems to control the
displacement (activity) of thrusts.
We also measured and plotted fault slip in the vertical
Fig. 2. Map view of the deformation kinematics. The dotted line (B) represents the boundary between the two domains. The white square grid is 5 cm. (a) Initial
state; (b) after 5 cm of shortening (11.9%); (c) after 8 cm of shortening (19%); (d) after 9 cm of shortening (21.4%); (e) after 13 cm of shortening (31%); (f)
after 14.5 cm of shortening (34.5%). B ¼ boundary line; H ¼ homogeneous domain; NH ¼ non-homogeneous domain.
Fig. 3. Detailed map view showing the braided pattern of thrust fronts in the displacement transfer zone at the end of the experiment; traces of seven cross-
sections are shown. Dotted lines represent second-order thrust faults. S ¼ cross-section position from the near side, in centimetres. Glass microbeads layers are
indicated with arrows. B ¼ boundary line; H ¼ homogeneous domain; NH ¼ non-homogeneous domain.
SG 1559—7/7/2004—17:03—MNICHOLLS—110000— MODEL 5 – pp. 1–14
A. Ravaglia et al. / Journal of Structural Geology xx (0000) xxx–xxx 5
ARTICLE IN PRESS
449
450
451
452
453
454
455
456
457
458
459
460
461
462
463
464
465
466
467
468
469
470
471
472
473
474
475
476
477
478
479
480
481
482
483
484
485
486
487
488
489
490
491
492
493
494
495
496
497
498
499
500
501
502
503
504
505
506
507
508
509
510
511
512
513
514
515
516
517
518
519
520
521
522
523
524
525
526
527
528
529
530
531
532
533
534
535
536
537
538
539
540
541
542
543
544
545
546
547
548
549
550
551
552
553
554
555
556
557
558
559
560
UNCORRECTED PROOF
plane of shortening for each section in the final model. Fault
slip diminishes toward pericline depressions (Fig. 8b): the
cumulative amount of slip for all of the faults exhibits a
significant loss in the transfer zone: nearly 41% with respect
to the ‘normal’ areas. As for thrust sheet length, slip also
seems to be greater in the non-homogeneous than in the
homogeneous domain.
From the wedge theory perspective (Davis et al., 1983),
the critical taper simplified for a dry cohesionless wedge
relies on the friction of the basal decollement (according to a
direct relationship) and on the friction of the analogue
materials (according to a reverse relationship). In our model,
basal friction is the same in both domains (f ¼ 328), the
friction angle in the homogeneous domain is f ¼ 338 (only
sand) whereas in the non-homogeneous domain the use of
glass microbeads lowers the average angle of internal
friction of the material (f ¼ 308). Applying the approxi-
mated equation for a dry cohesionless wedge (Liu et al.,
1992) and using values of the two domains, we obtain a
higher theoretical critical taper in the non-homogeneous
domain (a þ b ø 128) with respect to the nearby homo-
geneous domain (a þ b ø 10.68), made up of sand solely
(f ¼ 338). As always, in the analogue experiment, the early
steps of deformation involve building up the topographic
slope to the critical angle; as a consequence, in both
domains the early shortening was absorbed by closely
spaced thrust faults. Thus, the critical value was exceeded
first in the homogeneous domain because it requires a lower
critical taper, and as a result, the deformation shifted
forward to produce a longer thrust sheet (thrust 5; Fig. 2c);
in contrast, at the same time in the non-homogeneous
domain the topographic slope was not high enough to
deform the foreland. Once the critical angle was surpassed
in the non-homogeneous domain as well, the front of
deformation progressed towards the foreland (Fig. 2d).
Fault kinematic analysis involves measurement of the
Fig. 5. Contoured fault surfaces. Elevation from the base of the model is in
centimetres, the contour interval is 0.2 cm. (a) 5, (b) 6, (c) 7 and (d) 8.
FR ¼ frontal ramp; OB ¼ oblique ramp. The dotted line represents the
boundary (B) between the non-homogeneous (NH) and the homogeneous
(H) domains. Plots are not overlapped.
Fig. 4. Seven cross-sections cut in the transfer zone. Dotted lines represent
second-order thrust faults. S ¼ cross-section position from the near side, in
centimetres. Glass microbeads layers are lightest grey and are indicated
with arrows. TL2 and TL4 ¼ top layers used for measurements; B ¼
boundary line; H ¼ homogeneous domain; NH ¼ non-homogeneous
domain.
SG 1559—7/7/2004—17:03—MNICHOLLS—110000— MODEL 5 – pp. 1–14
A. Ravaglia et al. / Journal of Structural Geology xx (0000) xxx–xxx6
ARTICLE IN PRESS
561
562
563
564
565
566
567
568
569
570
571
572
573
574
575
576
577
578
579
580
581
582
583
584
585
586
587
588
589
590
591
592
593
594
595
596
597
598
599
600
601
602
603
604
605
606
607
608
609
610
611
612
613
614
615
616
617
618
619
620
621
622
623
624
625
626
627
628
629
630
631
632
633
634
635
636
637
638
639
640
641
642
643
644
645
646
647
648
649
650
651
652
653
654
655
656
657
658
659
660
661
662
663
664
665
666
667
668
669
670
671
672
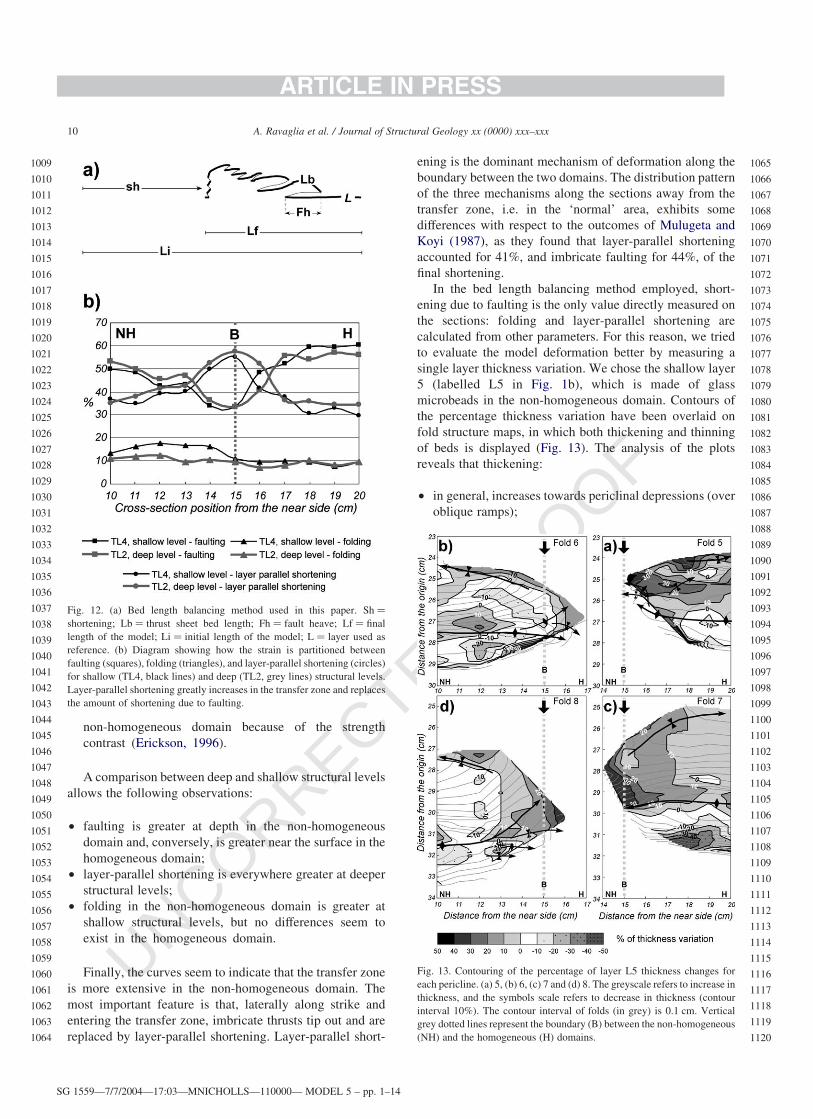
UNCORRECTED PROOF
slip of each cut-off using the footwall ramp as a pin (Fig.
11). Slip measures are then contoured and projected onto a
vertical plane. The result is a map of the distribution of slip
on the fault surface. Such analysis allows improved three-
dimensional interpretation of faults and their interrelation-
ship: for instance, it is useful in the investigation of
branching areas (Needham et al., 1996). All of the maps
show that slip varies both along strike and along dip. The
greatest slip normally occurs nearly in the middle of the
stratigraphy and where the thrust front is more advanced
(compare Figs. 3 and 11). Faults display a small amount of
slip approximately along cross-section 15, which corre-
sponds to the oblique ramps. Fault surfaces in the
homogeneous domain (faults 5 and 7; Fig. 11b and d)
seem to display a greater lateral gradient of slip than fault
surfaces in the non-homogeneous domain (faults 4 and 6;
Fig. 11a and c). On every fault surface, the along-strike
gradient of slip depicts linkage between two faults.
4.3. Thrust sheet bed length versus slip
As previously shown, thrust sheet bed length and slip
along the faults decrease simultaneously towards the
pericline depressions (Figs. 8a and b and 11). The plot of
thrust sheet bed length against slip, measured on each cross-
section (Fig. 8c), displays a good linear relationship and,
mainly, a similar coefficient of the regression line for
periclines 5–7 (here we consider these three thrusts as a
single series, not having appreciable differences). Despite
both the slightly greater bed length and map view
displacement measured in the non-homogeneous with
respect to the homogeneous domain, thrusts are not enough
to suggest any general rule in order to distinguish between
the two domains. This plot can help to predict the three-
dimensional geometry of a ‘steady’ thrust sheet, provided
that either the footwall or hanging wall are known or, in
exchange, the slip is determined. Also, it may afford the
geologist a test of the activity of a thrust when compared
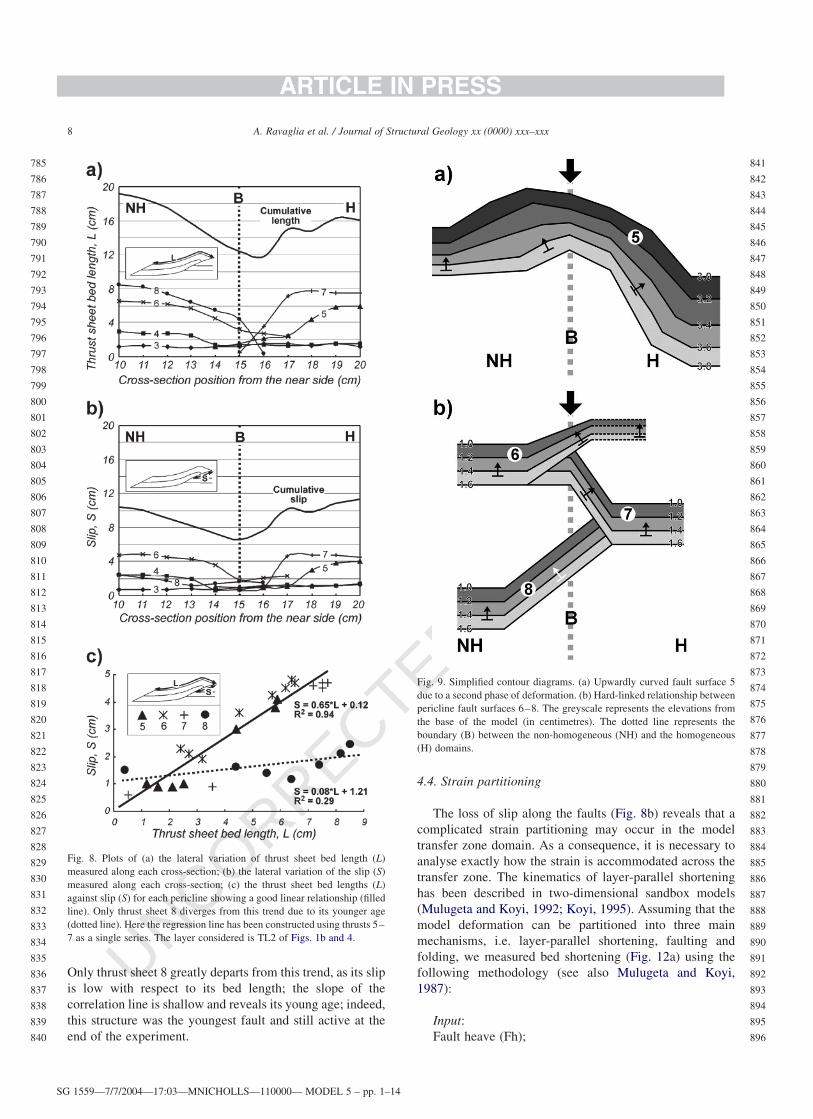
with others of the same belt. The plot shows that slip
S ø 0.65L or, alternatively, thrust sheet bed length
L ø 1.54S, at least for this experimental configuration.
Fig. 6. Three-dimensional visualization of faults (a) and folds (b) in the
transfer zone. The dotted line represents the boundary (B) between the non-
homogeneous (NH) and the homogeneous (H) domains. SC ¼ are lateral
sub-culminations; T ¼ lateral terminations.
Fig. 7. Contoured fold surfaces, top layer TL4. Elevation from the base of
the model is in centimetres, the contour interval is 0.05 cm. (a) 5, (b) 6, (c) 7
and (d) 8. The dotted line represents the boundary (B) between the non-
homogeneous (NH) and the homogeneous (H) domains. Plots are not
overlapped. SC ¼ sub-culminations.
SG 1559—7/7/2004—17:03—MNICHOLLS—110000— MODEL 5 – pp. 1–14
A. Ravaglia et al. / Journal of Structural Geology xx (0000) xxx–xxx 7
ARTICLE IN PRESS
673
674
675
676
677
678
679
680
681
682
683
684
685
686
687
688
689
690
691
692
693
694
695
696
697
698
699
700
701
702
703
704
705
706
707
708
709
710
711
712
713
714
715
716
717
718
719
720
721
722
723
724
725
726
727
728
729
730
731
732
733
734
735
736
737
738
739
740
741
742
743
744
745
746
747
748
749
750
751
752
753
754
755
756
757
758
759
760
761
762
763
764
765
766
767
768
769
770
771
772
773
774
775
776
777
778
779
780
781
782
783
784
UNCORRECTED PROOF
Only thrust sheet 8 greatly departs from this trend, as its slip
is low with respect to its bed length; the slope of the
correlation line is shallow and reveals its young age; indeed,
this structure was the youngest fault and still active at the
end of the experiment.
4.4. Strain partitioning
The loss of slip along the faults (Fig. 8b) reveals that a
complicated strain partitioning may occur in the model
transfer zone domain. As a consequence, it is necessary to
analyse exactly how the strain is accommodated across the
transfer zone. The kinematics of layer-parallel shortening
has been described in two-dimensional sandbox models
(Mulugeta and Koyi, 1992; Koyi, 1995). Assuming that the
model deformation can be partitioned into three main
mechanisms, i.e. layer-parallel shortening, faulting and
folding, we measured bed shortening (Fig. 12a) using the
following methodology (see also Mulugeta and Koyi,
1987):
Input:
Fault heave (Fh);
Fig. 8. Plots of (a) the lateral variation of thrust sheet bed length (L)
measured along each cross-section; (b) the lateral variation of the slip (S)
measured along each cross-section; (c) the thrust sheet bed lengths (L)
against slip (S) for each pericline showing a good linear relationship (filled
line). Only thrust sheet 8 diverges from this trend due to its younger age
(dotted line). Here the regression line has been constructed using thrusts 5–
7 as a single series. The layer considered is TL2 of Figs. 1b and 4.
Fig. 9. Simplified contour diagrams. (a) Upwardly curved fault surface 5
due to a second phase of deformation. (b) Hard-linked relationship between
pericline fault surfaces 6–8. The greyscale represents the elevations from
the base of the model (in centimetres). The dotted line represents the
boundary (B) between the non-homogeneous (NH) and the homogeneous
(H) domains.
SG 1559—7/7/2004—17:03—MNICHOLLS—110000— MODEL 5 – pp. 1–14
A. Ravaglia et al. / Journal of Structural Geology xx (0000) xxx–xxx8
ARTICLE IN PRESS
785
786
787
788
789
790
791
792
793
794
795
796
797
798
799
800
801
802
803
804
805
806
807
808
809
810
811
812
813
814
815
816
817
818
819
820
821
822
823
824
825
826
827
828
829
830
831
832
833
834
835
836
837
838
839
840
841
842
843
844
845
846
847
848
849
850
851
852
853
854
855
856
857
858
859
860
861
862
863
864
865
866
867
868
869
870
871
872
873
874
875
876
877
878
879
880
881
882
883
884
885
886
887
888
889
890
891
892
893
894
895
896
UNCORRECTED PROOF
Thrust sheet bed length (Lb);
Initial length of the model (Li);
Final length of the model (Lf).
Output:
Faulting ¼ (Fh);
Folding ¼ Lb 2 (Lf þ Fh);
Layer-parallel shortening ¼ Li 2 Lb.
Because we measured the heave as the horizontal
distance between cut-offs, and we know that older and
internal thrust faults are rotated, we certainly measured a
heave value that is less than the actual. Consequently, the
calculated amount of folding could be slightly greater than
the actual. Further measurements have been done taking
into account the vertical rotation of thrust faults. Results
show an increase in the amount of faulting and a decrease in
folding, yet the pattern of the curves remained the same.
Despite the imperfections in the method, what we wished to
emphasize was not an absolute amount of partitioned strain,
but the relative difference between the two domains.
In the zone where the thrust fronts are oblique, some out-
of-plane motion took place, as displayed by the distortion of
the white grid at the topographic surface (Figs. 2 and 3).
Nevertheless, the amount of slip loss, nearly 41% with
respect to the adjacent ‘normal’ area, is too high to be
explained by out-of-plane motion only. The strain partition-
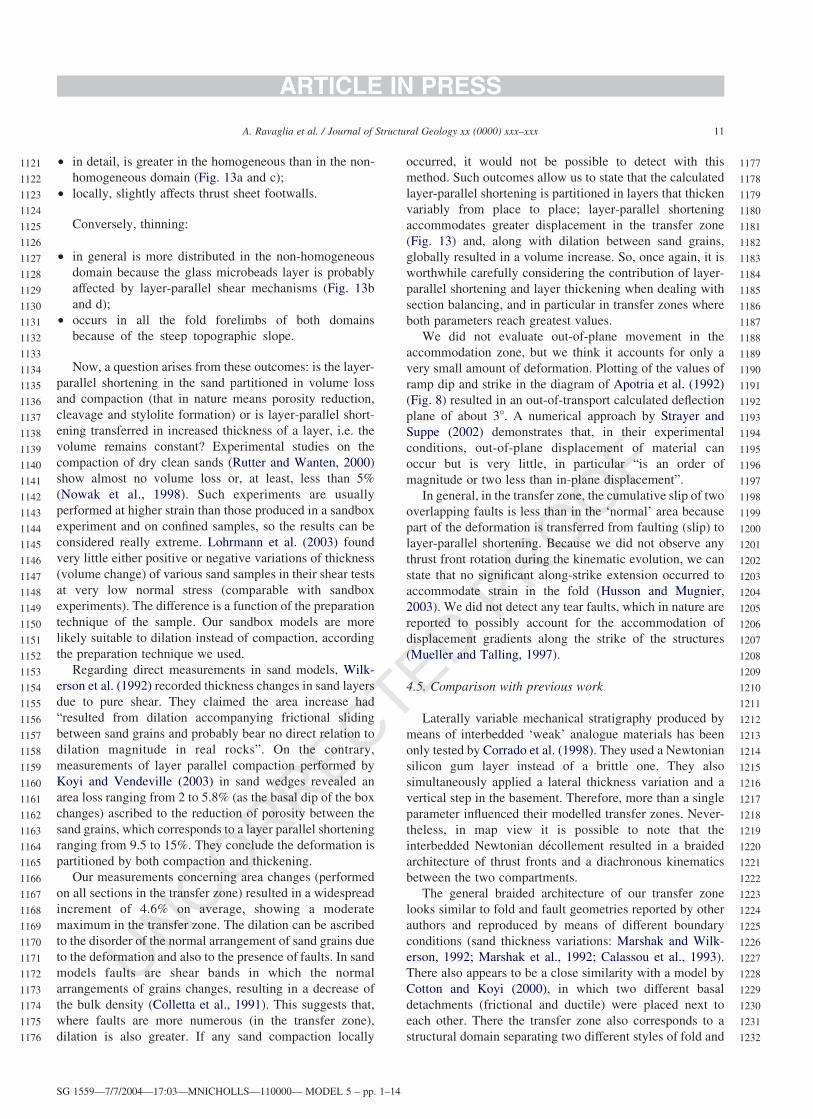
ing analysis shows that (Fig. 12b):
† far from the boundary line, faulting accounts for 50–
60% of shortening and is greater in the homogeneous
domain than in the non-homogeneous;
† layer-parallel shortening is 30–40% and is slightly
greater in the non-homogeneous domain;
† folding is relatively low, but is also greater in the
Fig. 10. Displacement diagrams showing the kinematic evolution measured
in map view. (a) Thrusts 4, 6 and 8 along profile 10 in the non-homogeneous
domain (NH). (b) Thrusts 4–8 along the boundary line (B). (c) Thrusts 4, 5
and 7 along profile 20 in the homogeneous domain (H).
Fig. 11. Maps of the slip on the faults. (a) 4, (b) 5, (c) 6, (d) 7 and (e) 8.
Contour interval is 0.4 cm. Black dotted lines represent the lower and upper
limits of the footwall cut-offs. Black hatched lines (BL) represent branch
lines between faults. Vertical grey dotted lines represent the boundary (B)
between the non-homogeneous (NH) and the homogeneous (H) domains.
SG 1559—7/7/2004—17:03—MNICHOLLS—110000— MODEL 5 – pp. 1–14
A. Ravaglia et al. / Journal of Structural Geology xx (0000) xxx–xxx 9
ARTICLE IN PRESS
897
898
899
900
901
902
903
904
905
906
907
908
909
910
911
912
913
914
915
916
917
918
919
920
921
922
923
924
925
926
927
928
929
930
931
932
933
934
935
936
937
938
939
940
941
942
943
944
945
946
947
948
949
950
951
952
953
954
955
956
957
958
959
960
961
962
963
964
965
966
967
968
969
970
971
972
973
974
975
976
977
978
979
980
981
982
983
984
985
986
987
988
989
990
991
992
993
994
995
996
997
998
999
1000
1001
1002
1003
1004
1005
1006
1007
1008
UNCORRECTED PROOF
non-homogeneous domain because of the strength
contrast (Erickson, 1996).
A comparison between deep and shallow structural levels
allows the following observations:
† faulting is greater at depth in the non-homogeneous
domain and, conversely, is greater near the surface in the
homogeneous domain;
† layer-parallel shortening is everywhere greater at deeper
structural levels;
† folding in the non-homogeneous domain is greater at
shallow structural levels, but no differences seem to
exist in the homogeneous domain.
Finally, the curves seem to indicate that the transfer zone
is more extensive in the non-homogeneous domain. The
most important feature is that, laterally along strike and
entering the transfer zone, imbricate thrusts tip out and are
replaced by layer-parallel shortening. Layer-parallel short-
ening is the dominant mechanism of deformation along the
boundary between the two domains. The distribution pattern
of the three mechanisms along the sections away from the
transfer zone, i.e. in the ‘normal’ area, exhibits some
differences with respect to the outcomes of Mulugeta and
Koyi (1987), as they found that layer-parallel shortening
accounted for 41%, and imbricate faulting for 44%, of the
final shortening.
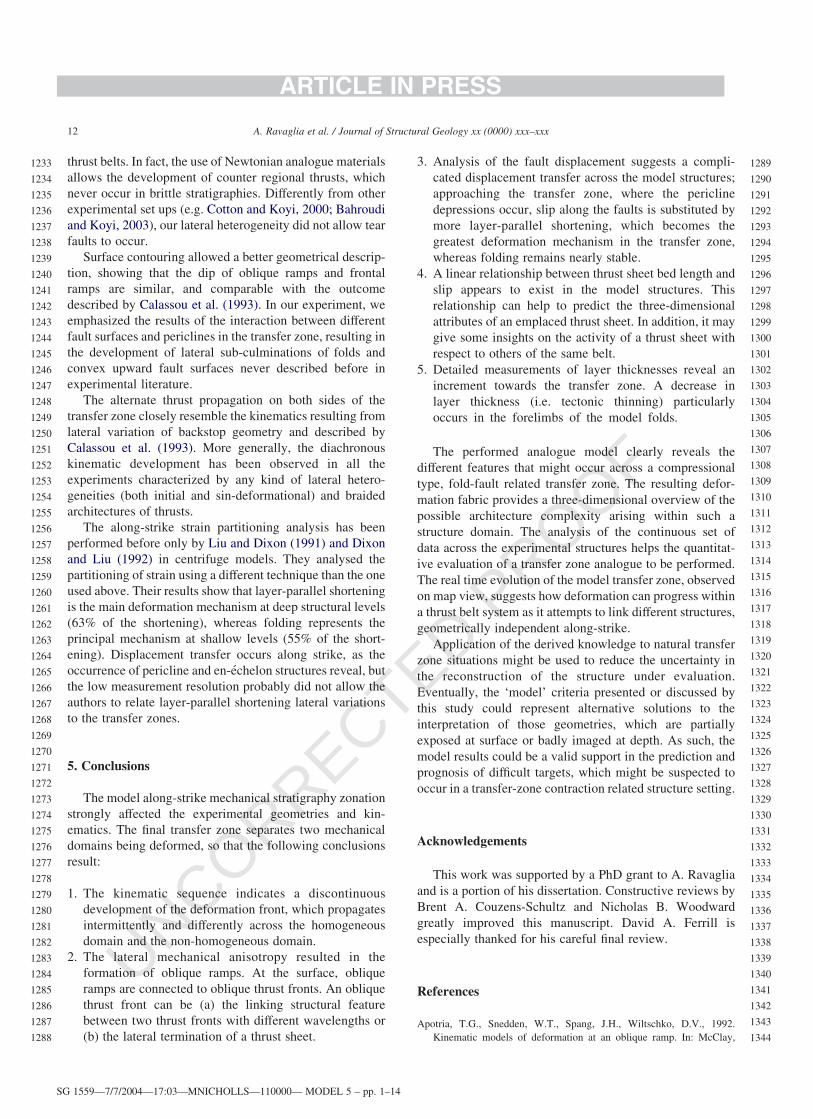
In the bed length balancing method employed, short-
ening due to faulting is the only value directly measured on
the sections: folding and layer-parallel shortening are
calculated from other parameters. For this reason, we tried
to evaluate the model deformation better by measuring a
single layer thickness variation. We chose the shallow layer
5 (labelled L5 in Fig. 1b), which is made of glass
microbeads in the non-homogeneous domain. Contours of
the percentage thickness variation have been overlaid on
fold structure maps, in which both thickening and thinning
of beds is displayed (Fig. 13). The analysis of the plots
reveals that thickening:
† in general, increases towards periclinal depressions (over
oblique ramps);
Fig. 13. Contouring of the percentage of layer L5 thickness changes for
each pericline. (a) 5, (b) 6, (c) 7 and (d) 8. The greyscale refers to increase in
thickness, and the symbols scale refers to decrease in thickness (contour
interval 10%). The contour interval of folds (in grey) is 0.1 cm. Vertical
grey dotted lines represent the boundary (B) between the non-homogeneous
(NH) and the homogeneous (H) domains.
Fig. 12. (a) Bed length balancing method used in this paper. Sh ¼
shortening; Lb ¼ thrust sheet bed length; Fh ¼ fault heave; Lf ¼ final
length of the model; Li ¼ initial length of the model; L ¼ layer used as
reference. (b) Diagram showing how the strain is partitioned between
faulting (squares), folding (triangles), and layer-parallel shortening (circles)
for shallow (TL4, black lines) and deep (TL2, grey lines) structural levels.
Layer-parallel shortening greatly increases in the transfer zone and replaces
the amount of shortening due to faulting.
SG 1559—7/7/2004—17:03—MNICHOLLS—110000— MODEL 5 – pp. 1–14
A. Ravaglia et al. / Journal of Structural Geology xx (0000) xxx–xxx10
ARTICLE IN PRESS
1009
1010
1011
1012
1013
1014
1015
1016
1017
1018
1019
1020
1021
1022
1023
1024
1025
1026
1027
1028
1029
1030
1031
1032
1033
1034
1035
1036
1037
1038
1039
1040
1041
1042
1043
1044
1045
1046
1047
1048
1049
1050
1051
1052
1053
1054
1055
1056
1057
1058
1059
1060
1061
1062
1063
1064
1065
1066
1067
1068
1069
1070
1071
1072
1073
1074
1075
1076
1077
1078
1079
1080
1081
1082
1083
1084
1085
1086
1087
1088
1089
1090
1091
1092
1093
1094
1095
1096
1097
1098
1099
1100
1101
1102
1103
1104
1105
1106
1107
1108
1109
1110
1111
1112
1113
1114
1115
1116
1117
1118
1119
1120
UNCORRECTED PROOF
† in detail, is greater in the homogeneous than in the non-
homogeneous domain (Fig. 13a and c);
† locally, slightly affects thrust sheet footwalls.
Conversely, thinning:
† in general is more distributed in the non-homogeneous
domain because the glass microbeads layer is probably
affected by layer-parallel shear mechanisms (Fig. 13b
and d);
† occurs in all the fold forelimbs of both domains
because of the steep topographic slope.
Now, a question arises from these outcomes: is the layer-
parallel shortening in the sand partitioned in volume loss
and compaction (that in nature means porosity reduction,
cleavage and stylolite formation) or is layer-parallel short-
ening transferred in increased thickness of a layer, i.e. the
volume remains constant? Experimental studies on the
compaction of dry clean sands (Rutter and Wanten, 2000)
show almost no volume loss or, at least, less than 5%
(Nowak et al., 1998). Such experiments are usually
performed at higher strain than those produced in a sandbox
experiment and on confined samples, so the results can be
considered really extreme. Lohrmann et al. (2003) found
very little either positive or negative variations of thickness
(volume change) of various sand samples in their shear tests
at very low normal stress (comparable with sandbox
experiments). The difference is a function of the preparation
technique of the sample. Our sandbox models are more
likely suitable to dilation instead of compaction, according
the preparation technique we used.
Regarding direct measurements in sand models, Wilk-
erson et al. (1992) recorded thickness changes in sand layers
due to pure shear. They claimed the area increase had
“resulted from dilation accompanying frictional sliding
between sand grains and probably bear no direct relation to
dilation magnitude in real rocks”. On the contrary,
measurements of layer parallel compaction performed by
Koyi and Vendeville (2003) in sand wedges revealed an
area loss ranging from 2 to 5.8% (as the basal dip of the box
changes) ascribed to the reduction of porosity between the
sand grains, which corresponds to a layer parallel shortening
ranging from 9.5 to 15%. They conclude the deformation is
partitioned by both compaction and thickening.
Our measurements concerning area changes (performed
on all sections in the transfer zone) resulted in a widespread
increment of 4.6% on average, showing a moderate
maximum in the transfer zone. The dilation can be ascribed
to the disorder of the normal arrangement of sand grains due
to the deformation and also to the presence of faults. In sand
models faults are shear bands in which the normal
arrangements of grains changes, resulting in a decrease of
the bulk density (Colletta et al., 1991). This suggests that,
where faults are more numerous (in the transfer zone),
dilation is also greater. If any sand compaction locally
occurred, it would not be possible to detect with this
method. Such outcomes allow us to state that the calculated
layer-parallel shortening is partitioned in layers that thicken
variably from place to place; layer-parallel shortening
accommodates greater displacement in the transfer zone
(Fig. 13) and, along with dilation between sand grains,
globally resulted in a volume increase. So, once again, it is
worthwhile carefully considering the contribution of layer-
parallel shortening and layer thickening when dealing with
section balancing, and in particular in transfer zones where
both parameters reach greatest values.
We did not evaluate out-of-plane movement in the
accommodation zone, but we think it accounts for only a
very small amount of deformation. Plotting of the values of
ramp dip and strike in the diagram of Apotria et al. (1992)
(Fig. 8) resulted in an out-of-transport calculated deflection
plane of about 38. A numerical approach by Strayer and
Suppe (2002) demonstrates that, in their experimental
conditions, out-of-plane displacement of material can
occur but is very little, in particular “is an order of
magnitude or two less than in-plane displacement”.
In general, in the transfer zone, the cumulative slip of two
overlapping faults is less than in the ‘normal’ area because
part of the deformation is transferred from faulting (slip) to
layer-parallel shortening. Because we did not observe any
thrust front rotation during the kinematic evolution, we can
state that no significant along-strike extension occurred to
accommodate strain in the fold (Husson and Mugnier,
2003). We did not detect any tear faults, which in nature are
reported to possibly account for the accommodation of
displacement gradients along the strike of the structures
(Mueller and Talling, 1997).
4.5. Comparison with previous work
Laterally variable mechanical stratigraphy produced by
means of interbedded ‘weak’ analogue materials has been
only tested by Corrado et al. (1998). They used a Newtonian
silicon gum layer instead of a brittle one. They also
simultaneously applied a lateral thickness variation and a
vertical step in the basement. Therefore, more than a single
parameter influenced their modelled transfer zones. Never-
theless, in map view it is possible to note that the
interbedded Newtonian decollement resulted in a braided
architecture of thrust fronts and a diachronous kinematics
between the two compartments.
The general braided architecture of our transfer zone
looks similar to fold and fault geometries reported by other
authors and reproduced by means of different boundary
conditions (sand thickness variations: Marshak and Wilk-
erson, 1992; Marshak et al., 1992; Calassou et al., 1993).
There also appears to be a close similarity with a model by
Cotton and Koyi (2000), in which two different basal
detachments (frictional and ductile) were placed next to
each other. There the transfer zone also corresponds to a
structural domain separating two different styles of fold and
SG 1559—7/7/2004—17:03—MNICHOLLS—110000— MODEL 5 – pp. 1–14
A. Ravaglia et al. / Journal of Structural Geology xx (0000) xxx–xxx 11
ARTICLE IN PRESS
1121
1122
1123
1124
1125
1126
1127
1128
1129
1130
1131
1132
1133
1134
1135
1136
1137
1138
1139
1140
1141
1142
1143
1144
1145
1146
1147
1148
1149
1150
1151
1152
1153
1154
1155
1156
1157
1158
1159
1160
1161
1162
1163
1164
1165
1166
1167
1168
1169
1170
1171
1172
1173
1174
1175
1176
1177
1178
1179
1180
1181
1182
1183
1184
1185
1186
1187
1188
1189
1190
1191
1192
1193
1194
1195
1196
1197
1198
1199
1200
1201
1202
1203
1204
1205
1206
1207
1208
1209
1210
1211
1212
1213
1214
1215
1216
1217
1218
1219
1220
1221
1222
1223
1224
1225
1226
1227
1228
1229
1230
1231
1232
UNCORRECTED PROOF
thrust belts. In fact, the use of Newtonian analogue materials
allows the development of counter regional thrusts, which
never occur in brittle stratigraphies. Differently from other
experimental set ups (e.g. Cotton and Koyi, 2000; Bahroudi
and Koyi, 2003), our lateral heterogeneity did not allow tear
faults to occur.
Surface contouring allowed a better geometrical descrip-
tion, showing that the dip of oblique ramps and frontal
ramps are similar, and comparable with the outcome
described by Calassou et al. (1993). In our experiment, we
emphasized the results of the interaction between different
fault surfaces and periclines in the transfer zone, resulting in
the development of lateral sub-culminations of folds and
convex upward fault surfaces never described before in
experimental literature.
The alternate thrust propagation on both sides of the
transfer zone closely resemble the kinematics resulting from
lateral variation of backstop geometry and described by
Calassou et al. (1993). More generally, the diachronous
kinematic development has been observed in all the
experiments characterized by any kind of lateral hetero-
geneities (both initial and sin-deformational) and braided
architectures of thrusts.
The along-strike strain partitioning analysis has been
performed before only by Liu and Dixon (1991) and Dixon
and Liu (1992) in centrifuge models. They analysed the
partitioning of strain using a different technique than the one
used above. Their results show that layer-parallel shortening
is the main deformation mechanism at deep structural levels
(63% of the shortening), whereas folding represents the
principal mechanism at shallow levels (55% of the short-
ening). Displacement transfer occurs along strike, as the
occurrence of pericline and en-echelon structures reveal, but
the low measurement resolution probably did not allow the
authors to relate layer-parallel shortening lateral variations
to the transfer zones.
5. Conclusions
The model along-strike mechanical stratigraphy zonation
strongly affected the experimental geometries and kin-
ematics. The final transfer zone separates two mechanical
domains being deformed, so that the following conclusions
result:
1. The kinematic sequence indicates a discontinuous
development of the deformation front, which propagates
intermittently and differently across the homogeneous
domain and the non-homogeneous domain.
2. The lateral mechanical anisotropy resulted in the
formation of oblique ramps. At the surface, oblique
ramps are connected to oblique thrust fronts. An oblique
thrust front can be (a) the linking structural feature
between two thrust fronts with different wavelengths or
(b) the lateral termination of a thrust sheet.
3. Analysis of the fault displacement suggests a compli-
cated displacement transfer across the model structures;
approaching the transfer zone, where the pericline
depressions occur, slip along the faults is substituted by
more layer-parallel shortening, which becomes the
greatest deformation mechanism in the transfer zone,
whereas folding remains nearly stable.
4. A linear relationship between thrust sheet bed length and
slip appears to exist in the model structures. This
relationship can help to predict the three-dimensional
attributes of an emplaced thrust sheet. In addition, it may
give some insights on the activity of a thrust sheet with
respect to others of the same belt.
5. Detailed measurements of layer thicknesses reveal an
increment towards the transfer zone. A decrease in
layer thickness (i.e. tectonic thinning) particularly
occurs in the forelimbs of the model folds.
The performed analogue model clearly reveals the
different features that might occur across a compressional
type, fold-fault related transfer zone. The resulting defor-
mation fabric provides a three-dimensional overview of the
possible architecture complexity arising within such a
structure domain. The analysis of the continuous set of
data across the experimental structures helps the quantitat-
ive evaluation of a transfer zone analogue to be performed.
The real time evolution of the model transfer zone, observed
on map view, suggests how deformation can progress within
a thrust belt system as it attempts to link different structures,
geometrically independent along-strike.
Application of the derived knowledge to natural transfer
zone situations might be used to reduce the uncertainty in
the reconstruction of the structure under evaluation.
Eventually, the ‘model’ criteria presented or discussed by
this study could represent alternative solutions to the
interpretation of those geometries, which are partially
exposed at surface or badly imaged at depth. As such, the
model results could be a valid support in the prediction and
prognosis of difficult targets, which might be suspected to
occur in a transfer-zone contraction related structure setting.
Acknowledgements
This work was supported by a PhD grant to A. Ravaglia
and is a portion of his dissertation. Constructive reviews by
Brent A. Couzens-Schultz and Nicholas B. Woodward
greatly improved this manuscript. David A. Ferrill is
especially thanked for his careful final review.
References
Apotria, T.G., Snedden, W.T., Spang, J.H., Wiltschko, D.V., 1992.
Kinematic models of deformation at an oblique ramp. In: McClay,
SG 1559—7/7/2004—17:03—MNICHOLLS—110000— MODEL 5 – pp. 1–14
A. Ravaglia et al. / Journal of Structural Geology xx (0000) xxx–xxx12
ARTICLE IN PRESS
1233
1234
1235
1236
1237
1238
1239
1240
1241
1242
1243
1244
1245
1246
1247
1248
1249
1250
1251
1252
1253
1254
1255
1256
1257
1258
1259
1260
1261
1262
1263
1264
1265
1266
1267
1268
1269
1270
1271
1272
1273
1274
1275
1276
1277
1278
1279
1280
1281
1282
1283
1284
1285
1286
1287
1288
1289
1290
1291
1292
1293
1294
1295
1296
1297
1298
1299
1300
1301
1302
1303
1304
1305
1306
1307
1308
1309
1310
1311
1312
1313
1314
1315
1316
1317
1318
1319
1320
1321
1322
1323
1324
1325
1326
1327
1328
1329
1330
1331
1332
1333
1334
1335
1336
1337
1338
1339
1340
1341
1342
1343
1344
UNCORRECTED PROOF
K.R., (Ed.), Thrust Tectonics, Chapman and Hall, London, pp.
141–154.
Bahroudi, A., Koyi, H.A., 2003. Effect of spatial distribution of Hormutz
salt on deformation style in the Zagros fold and thrust belt: an analogue
modelling approach. Journal of the Geological Society of London 160,
719–733.
Barrier, L., Nalpas, T., Gapais, D., Proust, J.N., Casas, A., Bourquin, S.,
2002. Influence of syntectonic sedimentation on thrust geometry. Field
examples from the Iberian Chain (Spain) and analogue modeling.
Sedimentary Geology 146, 91–104.
Blay, P., Cosgrove, J.W., Summers, J.M., 1977. An experimental
investigation of the development of structures in multilayers under
the influence of gravity. Journal of Geological Society of London 133,
329–342.
Burbank, D.W., McLean, J.K., Bullen, M., Abdrakhmatov, K.Y., Miller,
M.M., 1999. Partitioning of intermontane basins by thrust-related
folding, Tien Shan, Kyrgyzstan. Basin Research 11, 75–92.
Butler, R.W.H., 1992. Evolution of Alpine fold-thrust complexes: a linked
kinematic approach. In: Mitra, S., Fisher, G. (Eds.), Structural Geology
of Fold and Thrust Belts, The Johns Hopkins University Press,
Baltimore, pp. 29–44.
Calassou, S., Larroque, C., Malavieille, J., 1993. Transfer zones of
deformation in thrust wedges: an experimental study. Tectonophysics
221, 325–344.
Cobbold, P.R., Castro, L., 1999. Fluid pressure and effective stress in
sandbox models. Tectonophysics 301, 1–19.
Colletta, B., Letouzey, J., Pinedo, R., Ballard, J.F., Bale, P., 1991.
Computerized X-ray tomography analysis of sandbox models:
examples of thin-skinned thrust systems. Geology 19, 1063–1067.
Corrado, S., Di Bucci, D., Naso, G., Faccenna, C., 1998. Influence of
palaeogeography on thrust system geometries: an analogue modelling
approach for the Abruzzi–Molise (Italy) case history. Tectonophysics
296, 437–453.
Cotton, J.T., Koyi, H.A., 2000. Modeling of thrust fronts above ductile and
frictional detachments: application to structures in the Salt Range and
Potwar Plateau, Pakistan. Geological Society of America Bulletin 112,
351–363.
Coward, M.P., Potts, G.J., 1983. Complex strain patterns developed at the
frontal and lateral tips to shear zones and thrust zones. Journal of
Structural Geology 5, 383–399.
Dahlstrom, C.D.A., 1970. Structural geology of the eastern margin of the
Canadian Rocky Mountains. Bulletin of Canadian Petroleum Geology
18, 332–406.
Davis, D., Suppe, J., Dahlen, F.A., 1983. Mechanics of fold-and-thrust belts
and accretionary wedges. Journal of Geophysical Research 94,
10347–10354.
Dixon, J.M., Liu, S., 1992. Centrifuge modelling of the propagation of
thrust faults. In: McClay, K.R., (Ed.), Thrust Tectonics, Chapman and
Hall, London, pp. 53–69.
Erickson, S.G., 1996. Influence of mechanical stratigraphy on folding vs
faulting. Journal of Structural Geology 18, 443–450.
Fischer, M.P., Woodward, N.B., 1992. The geometric evolution of foreland
thrust systems. In: McClay, K.R., (Ed.), Thrust Tectonics, Chapman and
Hall, London, pp. 181–189.
Geiser, P.A., 1988. Mechanisms of thrust propagation: some examples and
implications for the analysis of overthrust terranes. Journal of Structural
Geology 10, 829–845.
Gomes, C.J.S., Pereira Filho, M., Braga, S.C.M., 2003. Experimental
models of ‘Basement’-controlled salients—application to the Proter-
ozoic fold-thrust belt of the Quadrilatero Ferrıfero (Minas Gerais,
Southeastern Brasil). Anais da Academia Brasileira de Ciencias 75,
249–263.
Husson, L., Mugnier, J.-L., 2003. Three-dimensional horizon reconstruc-
tion from outcrop structural data, restoration, and strain field of the
Baisahi anticline, Western Nepal. Journal of Structural Geology 25,
79–90.
Koyi, H.A., 1995. Mode of internal deformation in sand wedges. Journal of
Structural Geology 17, 293–300.
Koyi, H.A., 1997. Analogue modelling: from a qualitative to a quantitative
technique—a historical outline. Journal of Petroleum Geology 20,
223–238.
Koyi, H.A., Vendeville, B.C., 2003. The effect of decollement dip on
geometry and kinematics of model accretionary wedges. Journal of
Structural Geology 25, 1445–1450.
Letouzey, J., Colletta, B., Vially, R., Chermette, J.C., 1995. Evolution of
salt-related structures in compressional settings. In: Jackson, M.P.A.,
Roberts, D.G., Snelson, S. (Eds.), Salt Tectonics: a Global Perspective,
American Association of Petroleum Geologists Memoir, 65, pp. 41–60.
Lickorish, W.H., Ford, M., Burgisser, J., Cobbold, P.R., 2002. Arcuate
thrust systems in sandbox experiments: a comparison to the external
arcs of the Western Alps. Geological Society of America Bulletin 114,
1089–1107.
Liu, S., Dixon, J.M., 1991. Centrifuge modelling of thrust faulting:
structural variation along strike in fold-thrust belts. Tectonophysics
188, 39–62.
Liu, H., McClay, K.R., Powell, D., 1992. Physical models of thrust wedges.
In: McClay, K.R., (Ed.), Thrust Tectonics, Chapman and Hall, London,
pp. 71–81.
Lohrmann, J., Kukowski, N., Adam, J., Oncken, O., 2003. The impact of
analogue material properties on the geometry, kinematics, and
dynamics of convergent sand wedges. Journal of Structural Geology
25, 1691–1711.
Luian, M., Storti, F., Balanya, J.C., Crespo-Blanc, A., Rossetti, F., 2003.
Role of decollement material with different rheological properties in the
structure of the Aljibe thrust imbricate (Flysch Trough, Gibraltar Arc):
an analogue modelling approach. Journal of Structural Geology 25,
867–881.
Marques, F.O., Cobbold, P.R., 2002. Topography as a major factor in the
development of Arcuate thrust belts: insights from sandbox exper-
iments. Tectonophysics 348, 247–268.
Marshak, S., Wilkerson, M.S., 1992. Effect of overburden thickness on
thrust belt geometry and development. Tectonics 11, 560–566.
Marshak, S., Wilkerson, M.S., Hsui, A.T., 1992. Generation of curved fold-
thrust belts: insight from simple physical and analytical models. In:
McClay, K.R., (Ed.), Thrust Tectonics, Chapman and Hall, London, pp.
83–92.
Mueller, K., Talling, P., 1997. Geomorphic evidence for tear faults
accommodating lateral propagation of an active fault-bend fold,
Wheeler Ridge, California. Journal of Structural Geology 19, 397–411.
Mulugeta, G., Koyi, H.A., 1987. Three-dimensional geometry and
kinematics of experimental piggyback thrusting. Geology 15,
1052–1056.
Mulugeta, G., Koyi, H.A., 1992. Episodic accretion and strain partitioning
in a model sand wedge. Tectonophysics 202, 319–333.
Needham, D.T., Yielding, G., Freeman, B., 1996. Analysis of fault
geometry and displacement patterns. In: Buchanan, P.G., Nieuwland,
D.A. (Eds.), Modern Developments in Structural Interpretation,
Validation and Modelling, Geological Society Special Publication,
99, pp. 189–199.
Nicol, A., Gillespie, P.A., Childs, C., Walsh, J.J., 2002. Relay zones
between mesoscopic thrust faults in layered sedimentary sequences.
Journal of Structural Geology 24, 709–727.
Nowak, E.R., James, B., Knight, J.B., Eli Ben-Naim, E.B., Jaeger, H.M.,
Nagel, S.R., 1998. Density fluctuations in vibrated granular materials.
Physical Review E 57, 1971–1982.
Philippe, Y., Deville, E., Mascle, A., 1998. Thin-skinned inversion
tectonics at oblique basin margins: example of the western Vercors
and Chartreuse Subalpine massifs (SE France). In: Mascle, A.,
Piugdefabregas, C., Luterbacher, H.P., Fernandez, M. (Eds.), Cenozoic
Foreland Basins of Western Europe, Geological Society Special
Publication, 134, pp. 239–262.
Ranalli, G., 2001. Experimental tectonics: from Sir James Hall to the
present. Journal of Geodynamics 32, 65–76.
SG 1559—7/7/2004—17:03—MNICHOLLS—110000— MODEL 5 – pp. 1–14
A. Ravaglia et al. / Journal of Structural Geology xx (0000) xxx–xxx 13
ARTICLE IN PRESS
1345
1346
1347
1348
1349
1350
1351
1352
1353
1354
1355
1356
1357
1358
1359
1360
1361
1362
1363
1364
1365
1366
1367
1368
1369
1370
1371
1372
1373
1374
1375
1376
1377
1378
1379
1380
1381
1382
1383
1384
1385
1386
1387
1388
1389
1390
1391
1392
1393
1394
1395
1396
1397
1398
1399
1400
1401
1402
1403
1404
1405
1406
1407
1408
1409
1410
1411
1412
1413
1414
1415
1416
1417
1418
1419
1420
1421
1422
1423
1424
1425
1426
1427
1428
1429
1430
1431
1432
1433
1434
1435
1436
1437
1438
1439
1440
1441
1442
1443
1444
1445
1446
1447
1448
1449
1450
1451
1452
1453
1454
1455
1456
UNCORRECTED PROOF
Rowan, M.G., 1997. Three-dimensional geometry and evolution of a
segmented detachment fold, Mississippi Fan foldbelt, Gulf of Mexico.
Journal of Structural Geology 19, 463–480.
Rutter, E.H., Wanten, P.H., 2000. Experimental study of the compaction of
phyllosilicate-bearing sand at elevated temperature and with controlled
pore water pressure. Journal of Sedimentary Research 70, 107–116.
Sassi, W., Colletta, B., Bale, P., Paquereau, T., 1993. Modelling of
structural complexity in sedimentary basins: the role of pre-existing
faults in thrust tectonics. Tectonophysics 226, 97–112.
Schellart, W.P., 2000. Shear test results for cohesion and friction
coefficients for different granular materials: scaling implications for
their usage in analogue modelling. Tectonophysics 324, 1–16.
Schellart, W.P., 2002. Analogue modelling of large-scale tectonic
processes: an introduction. In: Schellart, W.P., Passchier, C. (Eds.),
Analogue Modelling of Large-Scale Tectonic Processes, Journal of the
Virtual Explorer, 7, pp. 1–6.
Schreurs, G., Hanni, R., Vock, P., 2001. Four-dimensional analysis of
analog models: experiments on transfer zones in fold and thrust belts.
In: Koyi, H.A., Mancktelow, N.S. (Eds.), Tectonic Modeling: A
Volume in Honor of Hans Ramberg, Geological Society of America
Memoir, 193, pp. 179–190.
Soto, R., Casas, A.M., Storti, F., Faccenna, C., 2002. Role of lateral
thickness variations on the development of oblique structures at the
Western end of the South Pyrenean Central Unit. Tectonophysics 350,
215–235.
Soto, R., Storti, F., Casas, A.M., Faccenna, C., 2003. Influence of along-
strike pre-orogenic sedimentary tapering on the internal architecture of
experimental thrust wedges. Geological Magazine 140, 253–264.
Strayer, L.M., Suppe, J., 2002. Out-of-plane motion of a thrust sheet during
along-strike propagation of a thrust ramp: a distinct-element approach.
Journal of Structural Geology 24, 637–650.
Thomas, W.A., Bayona, G., 2002. Palinspastic restoration of the Anniston
transverse zone in the Appalachian thrust belt, Alabama. Journal of
Structural Geology 24, 797–826.
Turrini, C., Ravaglia, A., Perotti, C.R., 2001. Compressional structures in a
multilayered mechanical stratigraphy: insights from sandbox modeling
with three-dimensional variations in basal geometry and friction. In:
Koyi, H.A., Mancktelow, N.S. (Eds.), Tectonic Modeling: A Volume in
Honor of Hans Ramberg, Geological Society of America Memoir, 193,
pp. 153–178.
Wilkerson, M.S., Marshak, S., Bosworth, W., 1992. Computerized
tomographic analysis of displacement trajectories and three-dimen-
sional fold geometry above oblique thrust ramps. Geology 20,
439–442.
Wilkerson, M.S., Apotria, T., Farid, T., 2002. Interpreting the geologic map
expression of contractional fault-related fold terminations: lateral/
oblique ramps versus displacement gradients. Journal of Structural
Geology 24, 593–607.
SG 1559—7/7/2004—17:03—MNICHOLLS—110000— MODEL 5 – pp. 1–14
A. Ravaglia et al. / Journal of Structural Geology xx (0000) xxx–xxx14
ARTICLE IN PRESS
1457
1458
1459
1460
1461
1462
1463
1464
1465
1466
1467
1468
1469
1470
1471
1472
1473
1474
1475
1476
1477
1478
1479
1480
1481
1482
1483
1484
1485
1486
1487
1488
1489
1490
1491
1492
1493
1494
1495
1496
1497
1498
1499
1500
1501
1502
1503
1504
1505
1506
1507
1508
1509
1510
1511
1512
1513
1514
1515
1516
1517
1518
1519
1520
1521
1522
1523
1524
1525
1526
1527
1528
1529
1530
1531
1532
1533
1534
1535
1536
1537
1538
1539
1540
1541
1542
1543
1544
1545
1546
1547
1548
1549
1550
1551
1552
1553
1554
1555
1556
1557
1558
1559
1560
1561
1562
1563
1564
1565
1566
1567
1568