Measuring instructional practice in science using classroom artifacts: lessons learned from two...
30
JOURNAL OF RESEARCH IN SCIENCE TEACHING VOL. 49, NO. 1, PP. 38–67 (2012) Measuring Instructional Practice in Science Using Classroom Artifacts: Lessons Learned From Two Validation Studies Jose ´ Felipe Martı ´nez, 1 Hilda Borko, 2 and Brian M. Stecher 3 1 University of California, Los Angeles, Graduate School of Education and Information Studies, 2019B Moore Hall, Los Angeles, California 90095 2 Stanford University, Stanford, California 3 The RAND Corporation, Santa Monica, California Received 5 March 2010; Accepted 12 October 2011 Abstract: With growing interest in the role of teachers as the key mediators between educational policies and outcomes, the importance of developing good measures of classroom processes has become increasingly apparent. Yet, collecting reliable and valid information about a construct as complex as instruction poses important conceptual and technical challenges. This article summarizes the results of two studies that investigated the properties of measures of instruction based on a teacher-generated instrument (the Scoop Notebook) that combines features of portfolios and self-report. Classroom arti- facts and teacher reflections were collected from samples of middle school science classrooms and rated along 10 dimensions of science instruction derived from the National Science Education Standards; ratings based on direct classroom observations were used as comparison. The results suggest that instru- ments that combine artifacts and self-reports hold promise for measuring science instruction with reli- ability similar to, and sizeable correlations with, measures based on classroom observation. We discuss the implications and lessons learned from this work for the conceptualization, design, and use of arti- fact-based instruments for measuring instructional practice in different contexts and for different pur- poses. Artifact-based instruments may illuminate features of instruction not apparent even through direct classroom observation; moreover, the process of structured collection and reflection on artifacts may have value for professional development. However, their potential value and applicability on a larger scale depends on careful consideration of the match between the instrument and the model of instruc- tion, the intended uses of the measures, and the aspects of classroom practice most amenable to reliable scoring through artifacts. We outline a research agenda for addressing unresolved questions and advanc- ing theoretical and practical knowledge around the measurement of instructional practice. ß 2011 Wiley Periodicals, Inc. J Res Sci Teach 49: 38–67, 2012 Keywords: science education; measurement of instruction; generalizability theory There is growing consensus among researchers and policymakers about the importance of accurate, valid, and efficient measures of instructional practice in science classrooms. Instruction directly or indirectly mediates the success of many school improvement efforts and thus accurate descriptions of what teachers do in classrooms as they attempt to implement reforms is key for understanding ‘‘what works’’ in education, and equally importantly, ‘‘how?’’ Many educational policies and programs rely on claims about the value of certain Contract grant sponsor: U.S. Department of Education, Institute of Education Sciences (IES). Correspondence to: Jose ´ Felipe Martı ´nez; E-mail: [email protected] DOI 10.1002/tea.20447 Published online 18 November 2011 in Wiley Online Library (wileyonlinelibrary.com). ß 2011 Wiley Periodicals, Inc.
-
Upload
independent -
Category
Documents
-
view
0 -
download
0
Transcript of Measuring instructional practice in science using classroom artifacts: lessons learned from two...

JOURNAL OF RESEARCH IN SCIENCE TEACHING VOL. 49, NO. 1, PP. 38–67 (2012)
Measuring Instructional Practice in Science Using Classroom Artifacts:Lessons Learned From Two Validation Studies
Jose Felipe Martınez,1 Hilda Borko,2 and Brian M. Stecher3
1University of California, Los Angeles, Graduate School of Education and Information Studies,
2019B Moore Hall, Los Angeles, California 900952Stanford University, Stanford, California
3The RAND Corporation, Santa Monica, California
Received 5 March 2010; Accepted 12 October 2011
Abstract: With growing interest in the role of teachers as the key mediators between educational
policies and outcomes, the importance of developing good measures of classroom processes has become
increasingly apparent. Yet, collecting reliable and valid information about a construct as complex as
instruction poses important conceptual and technical challenges. This article summarizes the results of
two studies that investigated the properties of measures of instruction based on a teacher-generated
instrument (the Scoop Notebook) that combines features of portfolios and self-report. Classroom arti-
facts and teacher reflections were collected from samples of middle school science classrooms and rated
along 10 dimensions of science instruction derived from the National Science Education Standards;
ratings based on direct classroom observations were used as comparison. The results suggest that instru-
ments that combine artifacts and self-reports hold promise for measuring science instruction with reli-
ability similar to, and sizeable correlations with, measures based on classroom observation. We discuss
the implications and lessons learned from this work for the conceptualization, design, and use of arti-
fact-based instruments for measuring instructional practice in different contexts and for different pur-
poses. Artifact-based instruments may illuminate features of instruction not apparent even through direct
classroom observation; moreover, the process of structured collection and reflection on artifacts may
have value for professional development. However, their potential value and applicability on a larger
scale depends on careful consideration of the match between the instrument and the model of instruc-
tion, the intended uses of the measures, and the aspects of classroom practice most amenable to reliable
scoring through artifacts. We outline a research agenda for addressing unresolved questions and advanc-
ing theoretical and practical knowledge around the measurement of instructional practice. � 2011
Wiley Periodicals, Inc. J Res Sci Teach 49: 38–67, 2012
Keywords: science education; measurement of instruction; generalizability theory
There is growing consensus among researchers and policymakers about the importance
of accurate, valid, and efficient measures of instructional practice in science classrooms.
Instruction directly or indirectly mediates the success of many school improvement efforts
and thus accurate descriptions of what teachers do in classrooms as they attempt to implement
reforms is key for understanding ‘‘what works’’ in education, and equally importantly,
‘‘how?’’ Many educational policies and programs rely on claims about the value of certain
Contract grant sponsor: U.S. Department of Education, Institute of Education Sciences (IES).
Correspondence to: Jose Felipe Martınez; E-mail: [email protected]
DOI 10.1002/tea.20447
Published online 18 November 2011 in Wiley Online Library (wileyonlinelibrary.com).
� 2011 Wiley Periodicals, Inc.

practices for improving student outcomes; for example, the No Child Left Behind legislation
prompted schools to adopt scientifically based practices to improve the achievement of all
students. Similarly, the reform teaching movement often recommends specific approaches to
instruction designed to promote higher-level learning. More generally, the National Research
Council (2006) recommended that states and districts address existing inequities in the kinds
of experiences or opportunities to learn different groups of students are exposed to in their
classrooms. These examples suggest that a detailed examination of teachers’ classroom prac-
tices and their relationship with student achievement is key for understanding why policy
recommendations such as these may be effective or not (Ball & Rowan, 2004; Blank, Porter,
& Smithson, 2001; Mayer, 1999).
In the case of science classrooms, large-scale implementation of high quality instruction
can be particularly challenging given the relative lack of qualified teachers available. At the
same time, there is a relative paucity of research on the measurement of instructional
practices in science classrooms compared to other subjects such as mathematics (see e.g.,
Glenn, 2000). As a result, the research base to support claims about instructional effects
in science is often limited (e.g., Laguarda, 1998; McCaffrey et al., 2001; Von Secker &
Lissitz, 1999). As with other subjects, this shortage of empirical evidence reflects in part
the conceptual difficulty of finding common frames of reference for describing science
instruction, but in equal or larger measure the technical challenge of developing efficient,
reliable procedures for large-scale data collection about science teachers’ instructional
practices.
Features of Instructional Practice in Middle School Science
The first major challenge facing the development of a measure of instructional practice
is defining the target construct itself. Instruction in any subject is a complex and multidimen-
sional phenomenon that can be described (and quantified) only partially within an organizing
model or set of assumptions. In the case of science education, representing instruction across
scientific disciplines and areas of scientific knowledge can make construct definition particu-
larly challenging. For this study, we adopted as reference the model of content (what is
taught) and pedagogy (how it is taught) proposed by the National Science Education
Standards (National Research Council, 1996). The standards emphasize student learning of
the skills that characterize the work of scientists (observation, measurement, analysis, and
inference), and accordingly focus on instructional practices and classroom experiences that
help students learn how to ask questions, construct and test explanations, form arguments,
and communicate their ideas (Ruiz-Primo, Li, Tsai, & Schneider, 2010).
While the NRC model offers a useful set of organizing notions for conceptualizing and
studying science instruction, it lacks specificity and detail in terms of concrete features of
teacher classroom practices. Le et al. (2006) operationalized the NRC model in terms of
specific measurable features of teacher practice, offering more concrete guidance for charac-
terizing variation in instruction across classrooms. In their study, a panel of scientists and
national science education experts was convened to develop a taxonomy of science curricu-
lum and instruction linked to the NRC model. The initial taxonomy included four categories
(scientific understanding, scientific thinking, classroom practice, and teacher knowledge),
which the panel then described in terms of concrete behaviors and instructional practices
that could be found in classrooms. Through this process, the panel identified 10 measurable
features or dimensions of science instruction: Grouping, Structure of Lessons, Scientific
Resources, Hands-on, Inquiry, Cognitive Depth, Explanation and Justification, Connections
and Applications, Assessment, and Scientific Discourse Community. Figure 1 presents
MEASURING INSTRUCTION USING CLASSROOM ARTIFACTS 39
Journal of Research in Science Teaching

synthetic definitions for each of these dimensions, which provided the conceptual framework
for characterizing instruction in our studies. For each of these dimensions a complete rubric
can be found in the Supplementary online appendix; the rubrics describe in detail the teacher
behaviors that characterize instructional practice of varying quality.
Importantly, the framework underlying the dimensions of science instruction in this paper
predates more recent conceptualizations such as the model offered in Taking Science to
School (NRC, 2007), the science Standards for College Success (College Board, 2009), or
most recently the Framework for K-12 Science Education of the National Research Council
and the National Academy of Science (NRC, 2011). However, careful review suggests that
the dimensions in our framework are far from obsolete; collectively, they reflect a model of
1. Grouping. The extent to which the teacher organizes the series of lessons to use groups to work on scientific tasks that are directly related to the scientific goals of the lesson, and to enable students to work together to complete these activities. An active teacher role in facilitating group interactions is not necessary.
2. Structure of Lessons. The extent to which the series of lessons is organized to be conceptually coherent, such that activities are related scientifically and build on one another in a logical manner.
3. Use of Scientific Resources. The extent to which a variety of scientific resources (e.g., computer software, internet resources, video materials, laboratory equipment and supplies, scientific tools, print materials) permeate the learning environment and are integral to the series of lessons. These resources could be handled by the teacher and/or the students, but the lesson is meant to engage all students. By variety we mean different types of resources OR variety within a type of scientific resource.
4. “Hands-On”. The extent to which students participate in activities that allow them to physically engage with scientific phenomena by handling materials and scientific equipment.
5. Inquiry. The extent to which the series of lessons involves the students actively engaged in posing scientifically oriented questions, designing investigations, collecting evidence, analyzing data, and answering questions based on evidence.
6. Cognitive Depth. Cognitive depth refers to a focus on the central concepts or “big ideas” of the discipline, generalization from specific instances to larger concepts, and making connections and relationships among science concepts. This dimension includes two aspects of cognitive depth: lesson design and teacher enactment. That is, it considers the extent to which lesson design focuses on achieving cognitive depth and the extent to which the teacher consistently promotes cognitive depth.
7. Scientific Discourse Community. The extent to which the classroom social norms foster a sense of community in which students feel free to express their scientific ideas honestly and openly. The extent to which the teacher and students “talk science,” and students are expected to communicate their scientific thinking clearly to their peers and teacher, both orally and in writing, using the language of science.
8. Explanation/Justification. The extent to which the teacher expects, and students provide, explanations/justifications, both orally and on written assignments.
9. Assessment. The extent to which the series of lessons includes a variety of formal and informal assessment strategies that measure student understanding of important scientific ideas and furnish useful information to both teachers and students (e.g., to inform instructional decision-making).
10. Connections/Applications. The extent to which the series of lessons helps students connect science to their own experience and the world around them, apply science to real world contexts, or understand the role of science in society (e.g., how science can be used to inform social policy).
Figure 1. Dimensions of instructional practice in middle school science.
40 MARTINEZ ETAL.
Journal of Research in Science Teaching

instruction that shares many easily recognizable features and areas of emphasis in the newer
models. Below we review our dimensions of science instruction specifically in relation to
the framework for K-12 Science Education (NRC, 2011), the most recent model that will
serve as the foundational document for the first generation of common core science standards.
The discussion reveals considerable overlap between the 1996 and 2011 frameworks, but also
points to areas where significant differences exist between them.
Most of the dimensions we use map fairly directly onto elements of the new NRC frame-
work. In our model Cognitive Depth refers to instruction that emphasizes understanding cen-
tral (core) disciplinary concepts or ideas, developing models as generalizations of findings,
and drawing relationships among science concepts. While not organized under a cognitive
depth category, these components are all included the new framework; in particular, the no-
tion of disciplinary core ideas represents one of three major dimensions that constitute the
Framework-dimensions that are organized as learning progressions that best support student
learning across grades (NRC, 2011, p. 2-2 to 2-3). Furthermore, the development and use of
mental and conceptual models is one of eight elements that constitute the scientific practices
dimension (NRC, 2011, p. 3–8). In our model, cognitive depth covers both content and enact-
ment, which mirrors the emphasis on designing learning experiences that intertwine scientific
explanations and practices in the new framework (NRC, 2011, p. 1–3).
Another instance of considerable overlap concerns the evaluation of evidence for support-
ing scientific discourse and explanation. Our Explanation/Justification dimension focuses on
the use of scientific evidence and concepts to explain and justify claims or findings, while
Scientific Discourse is concerned with students and teachers communicating scientific evi-
dence and reasoning to each other. In concert, these two dimensions in our framework reflect
one of the major emphases of the 2011 framework-engaging students in argumentation from
evidence. Both models are concerned with students and teachers ‘‘talking science,’’ communi-
cating scientific evidence and reasoning.
A key change from the 1996 National Science Education Standards in the 2011 frame-
work is the replacement of scientific inquiry with the broader notion of scientific practices
that emphasize understanding of how scientists work (NRC, 2011, p. 3–2). Key practices
includes engaging students first hand in posing scientific questions, designing investigations,
collecting and analyzing data, and providing evidence to support an answer (NRC, 2011,
p. 3-6 to 3-18). Notably, however, each of these practices can be mapped directly to elements
of the Inquiry dimension in our model of instruction based in the 1996 standards. The dimen-
sion Connections and applications in our model refers to instruction that emphasizes develop-
ing connections among scientific concepts and students experiences in the world around
them, and the application of scientific knowledge and reasoning to specific real world con-
texts. Like inquiry, the term connections and applications does not explicitly appear in the
three dimensions of the 2011 framework, but rather this notion constitutes one of six guiding
principles underlying the framework (NRC, 2011, p. 2–4).
In our model, Structure of Lessons refers to an organized and coherent series of lessons
that build on one another logically to enhance student learning. The new framework addresses
this dimension in two ways. First, the disciplinary core ideas build on student prior knowl-
edge and interest and second, these core ideas are organized as coherent learning progressions
that delineate the developmental trajectory necessary for students to master a concept (NRC,
2011, p.2-2, 2-6). Finally, Assessment in our model includes formal and informal approaches
teachers use to gauge student understanding and progress and inform instructional decision-
making. The 2011 framework articulates a vision of formative and summative assessment that
emphasizes combined use of formal and informal assessments in the classroom, using teacher
MEASURING INSTRUCTION USING CLASSROOM ARTIFACTS 41
Journal of Research in Science Teaching

developed or large-scale tools aligned to curriculum and instruction and linked to longitudinal
models of student learning.
Some dimensions in our model are not identified specifically in the new framework, but
refer to practices that are still easily recognizable within it. Our dimensions Scientific
Resources and Hands-on are two examples. The former refers to use of scientific tools, mate-
rials, and equipment during instruction; the latter more specifically requires students to handle
these resources directly as a way to physically engage with scientific phenomena. While the
2011 framework does not explicitly name these as dimensions, the use of scientific tools and
materials is an important component of in scientific practice (see e.g., ‘‘planning and carrying
out investigations’’). As described in the first dimension in the 2011 framework (Scientific
and Engineering Practices) the use of a variety of tools and materials to engage children in
work that aims to solve a specific challenges posed by the teacher is a priority for science
students of all ages (NRC, 2011 p. 3–17). Similarly, Grouping refers to students working
together in groups to carry out scientific tasks. While there is little direct discussion of
Grouping practices during instruction in the 2011 framework, the notion of collaborative
learning and the social nature of scientific investigation is hardly foreign to it. Indeed,
the document acknowledges that science is a collaborative enterprise (p. 2–3) and refers to
findings in Taking Science to School that call for incorporating a range of instructional
approaches including collaborative small-group investigations to reflect the social nature of
science (NRC, 2011; p. 10-9).
This overlap is, of course, not surprising; the latest framework from the NAS and NRC,
and the ones that preceded it did not seek to compete with or replace the NRC (1996) stand-
ards, as much as build on and complement them to offer a more comprehensive and cohesive
vision for science education (NRC, 2011, p. 2–5). Nevertheless, some prominent features of
these more recent frameworks are absent in our model of instruction. For example, our
dimensions do not include mathematical reasoning and quantitative applications highlighted
in the 2009 College Board standards and incorporated as one of the practices of scientists in
the 2011 framework. Similarly absent are the engineering practices and technology applica-
tions that provide one of the central organizing themes in the new framework. Also, unlike
recent frameworks, our dimensions do not explicitly address equity and other social issues
related to science and technology. Finally, while the new framework outlines important impli-
cations for the types of instruction needed in science classrooms, it is it directly tied to a
particular model of teaching or instructional standards. Systematically measuring instructional
practice will require explicitly describing and classifying teaching behaviors and in that sense
defining teaching standards (see e.g., Le et al., 2006). In the final section of the article, we
discuss how dimensions of instructional practice of varying grain sizes and inference levels
might be derived from general science education frameworks in future research or policy
efforts.
Methods for Collecting Information About Instructional Practice in Classrooms
Researchers have used different methods to collect data about instructional practice, each
with strengths and weaknesses. Surveys are the most widely used approach because they offer
a cost-effective way to include a large number of classrooms and broad range of aspects of
practices (e.g., coverage of subject matter, cognitive demand, instructional strategies, time
allocation, or teachers’ beliefs and attitudes; see, for example, Mayer, 1999). However, like
all self-report measures surveys are subject to error, bias, and social-desirability effects. First,
respondents have imperfect memories and may not always consistently recall, summarize, or
42 MARTINEZ ETAL.
Journal of Research in Science Teaching

judge the frequency or nature of instruction over the school year. Moreover, practitioners and
researchers may not have a shared understanding of key terms, particularly those used to
describe new or evolving practices (e.g., cooperative groups, formative classroom assess-
ment), or aspects of practice that involve high abstraction (e.g., inquiry, classroom discourse);
in these situations teachers may refer to personal definitions or idiosyncratic interpretations
(Antil, Jenkins, Wayne, & Vasdasy, 1998). Finally, some elements of classroom practice (e.g.,
interactions between teachers and students) may be inherently difficult to capture accurately
through teacher surveys (Matsumura, Garnier, Slater, & Boston, 2008).
Case study methods overcome some of the limitations of surveys through extensive direct
observation in schools and classrooms, and interviews that provide insights into the perspec-
tives of students, teachers, and administrators (Stecher & Borko, 2002). Because observers
can be carefully trained to recognize nuanced features of practice, case studies can reduce
respondent bias and memory error and are easily adaptable for studying different kinds of
instructional innovations (Spillane & Zeuli, 1999). However, case studies are time- and labor-
intensive and thus are usually not feasible as a tool for large-scale research or policy uses
(Knapp, 1997). Nevertheless, while the generalizability of findings sometimes may be suspect,
much of what we know about instructional practice is based on in-depth studies of small
numbers of classrooms (Mayer, 1999).
In light of the limitations of surveys and case studies, novel approaches have been pro-
posed to gather information about instruction. Some researchers have asked teachers to record
information about classroom events or interactions in daily structured logs using selected-
response questions to make recall easier and reduce the reporting burden (see e.g., Rowan,
Camburn, & Correnti, 2004; Smithson & Porter, 1994). While logs typically address discrete
events rather than more complex features of instruction, collecting logs over extended periods
may also provide a broader, longer-term perspective on instruction. Others have explored the
use of vignettes to obtain insights into instructional practice: teachers respond to written or
oral descriptions of real or hypothetical classroom events, ideally revealing their attitudes,
understanding and pedagogical skills (Kennedy, 1999; Stecher et al., 2003). When used with
open-ended response formats, vignettes offer an opportunity for teachers to provide detailed
descriptions about the instructional strategies they use and to explain the decisions they make
when planning and implementing their lessons. However, both logs and vignettes rely on
teacher self-report and thus, like surveys, suffer from the potential for self-report bias, social
desirability, and inconsistency in interpretation (Hill, 2005).
More recently, researchers have incorporated instructional artifacts into their studies
of classroom practice (e.g., Borko et al., 2006; Clare & Aschbacher, 2001; Resnick,
Matsumura, & Junker, 2006; Ruiz-Primo, Li, & Shavelson, 2002). Artifacts are actual materi-
als generated in classrooms, such as assignments, homework, quizzes, projects, or examina-
tions. Systematically collected artifacts, assembled into portfolios or collected in other forms,
can be used to measure various features of instructional practice, including some that are
difficult to capture through surveys or observations (e.g., use of written feedback); moreover,
because they contain direct evidence of classroom practice, artifacts are less susceptible to
biases and social desirability effects. In addition to its potential for measuring instructional
practice, the process of collecting artifacts can have value for teacher professional develop-
ment (see e.g., Gerard, Spitulnik, & Linn, 2010; Moss et al., 2004). However, this method
is not without limitations: collecting artifacts places a significant burden on teachers, who
must save, copy, assemble, and even annotate and reflect on the materials. Furthermore, as
with surveys, artifacts may reveal little about instructional interactions between teachers and
students during class time.
MEASURING INSTRUCTION USING CLASSROOM ARTIFACTS 43
Journal of Research in Science Teaching

The Scoop Notebook: Measuring Instructional Practice Through Artifacts and Self-Report
We designed an instrument for measuring instruction that seeks to combine the advanta-
geous features of portfolios, logs, and vignettes. We call our instrument the Scoop Notebook
as an analogy to scientists scooping samples of materials for analysis. As with most portfoli-
os, our notebook contains actual instructional materials and work products that serve as a
concrete basis for interpreting teacher reports about their classroom practices, reducing self-
report bias and potentially providing richer information about instruction. As with logs, the
notebook asks teachers to collect and annotate artifacts daily for a period of time; reporting
on daily events when they are recent in memory reduces memory effects, and enables the
consideration of day-to-day fluctuations in classroom practice in context. Finally, like
vignettes, the notebook includes open-ended questions that solicit teachers’ reflections on
their practice specifically situated in their classroom context. Specifically, when compiling
their notebooks, science teachers are first asked to respond to a set of reflection questions
intended to elicit important contextual information for understanding their instructional prac-
tices in the context of the particular classroom and series of lessons. Teachers then collect
three kinds of classroom artifacts every day over a period of 5 days of instruction: instruction-
al artifacts generated or used before class (e.g., lesson plans, handouts, rubrics), during class
(e.g., readings, worksheets, assignments), and after/outside class (e.g., student homework,
projects). Teachers also provide three samples of student work for each graded artifact (e.g.,
assignments, homework), and a recent formal assessment used in the classroom (e.g., test,
quiz, paper). Teachers use self-adhesive notes included in the materials they receive to briefly
describe each artifact and sample of student work. A disposable camera enables teachers to
provide transitive evidence of instruction that cannot be photocopied (e.g., equipment, posters,
three-dimensional science projects); a daily photo-log is used to title or briefly describe each
photograph. At the end of the notebook period teachers answer a series of retrospective ques-
tions eliciting additional information about the series of lessons in the notebook. Finally,
teachers are asked to assess the extent to which the contents of the notebook reflect their
instructional practice in the classroom.
As this description makes clear, our instrument belongs in the broad category of teacher
portfolios (or more recently e-portfolios; see for example, Wilkerson & Lang, 2003). We see
the Scoop Notebook as a particular type of portfolio instrument designed to provide
more depth of information about instruction over a shorter period of time (Wolfe-Quintero
& Brown, 1998). The leading hypothesis behind this type of instrument is that the combina-
tion of teacher reflections and classroom artifacts results in a more complete picture of sci-
ence instruction than each source can provide by itself. A more detailed presentation of the
notebook and accompanying materials, including sample artifacts, annotations, and instruc-
tions to teachers is available in the Supplementary online appendix or from the authors by
request.
This article summarizes the results of two field studies that investigated the properties of
measures of instructional practice in middle school science based on our teacher-generated
notebook instrument. The purpose of these pilot studies was twofold: first, to answer basic
questions about the reliability and validity of the measure; and second, to collect useful infor-
mation to help researchers design better artifact-based instruments for measuring instruction
in the future. The results contribute to a small but growing body of research that systematical-
ly examines the measurement of instructional practice through a variety of methods and in a
variety of contexts (see e.g., Borko et al., 2006; Matsumura et al., 2008; Mayer, 1999; Pianta
& Hamre, 2009; Rowan & Correnti, 2009). This is a particularly interesting topic in science
44 MARTINEZ ETAL.
Journal of Research in Science Teaching

education, because previous research on the measurement of instruction has largely focused
on mathematics and language arts.
Methods
We present the results of two field studies that investigated the properties of measures
of instruction based on the Scoop Notebook and on direct classroom observation. Our
studies addressed four main research questions: (a) What is the reliability of measures of
science instruction based on the notebook and direct classroom observation? (b) What are the
patterns of inter-correlation among dimensions of instructional practice? (i.e., do measures
based on notebooks and observations reflect similar underlying structure?) (c) What is the
correlation between measures of the same classroom based on notebooks and observations?
and (d) What lessons can be drawn from our use of the a teacher-generated notebook for
measuring science instruction in general, and for improving artifact-based instruments in
particular?1
Participants
We recruited middle school teachers for our study in school districts in the Los Angeles
and Denver areas. In all, 49 teachers from 25 schools (nine in California, 14 in Colorado)
participated in the two studies. Table 1 shows the composition of the samples for each study:
The year 1 (2003–2004) sample included 11 middle school science teachers in California,
and 17 in Colorado. The year 2 (2004–2005) study included a different sample of 11 teachers
in California, and 10 in Colorado. Schools come from six districts in two states ensuring a
diversity of contextual policy influences, including academic standards, curricular programs,
and instructional approaches. The schools are also diverse with respect to enrollment of mi-
nority students (11–94%), students receiving free/reduced lunch (1–83%), and English lan-
guage learners (0.2–40%). Finally, the sample is diverse in terms of school performance with
17–90% of students proficient in English, 13–77% proficient in math, and about a third of
schools in each state identified as low performing.
Teachers selected for the study a classroom they considered typical of the science
classes they taught with respect to student composition and achievement. To compile
their notebooks, teachers collected materials in the selected class during a 5-day period of
Table 1
Summary of data collected, sources of evidence, and analysis
2003–2004 Study 2004–2005 Study
Sample Size (Schools) 4 CA, 10 CO 6 CA, 7 COSample Size (Teachers) 11 CA, 17 CO 11 CA, 10 CO
Notebooks Observations Notebooks Observations
Number of raters 2 1 1 2Number of occasions 1 2 1 3Generalizability design TxRa n/a n/a TxRxO, TxRb
Correlations Notebook—Observation Observation —Gold StandardNotebook—Gold Standard
aD, Daily Ratings; S, Summary Rating; GS, Gold Standard Rating.bT, Teacher (notebook); R, Rater; O, Occasion.
MEASURING INSTRUCTION USING CLASSROOM ARTIFACTS 45
Journal of Research in Science Teaching
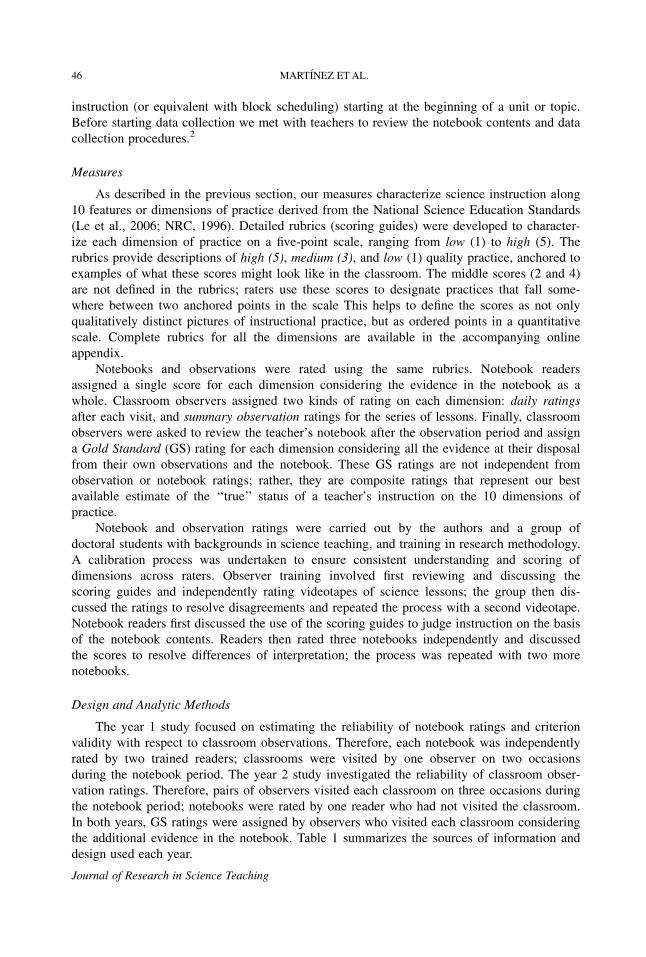
instruction (or equivalent with block scheduling) starting at the beginning of a unit or topic.
Before starting data collection we met with teachers to review the notebook contents and data
collection procedures.2
Measures
As described in the previous section, our measures characterize science instruction along
10 features or dimensions of practice derived from the National Science Education Standards
(Le et al., 2006; NRC, 1996). Detailed rubrics (scoring guides) were developed to character-
ize each dimension of practice on a five-point scale, ranging from low (1) to high (5). The
rubrics provide descriptions of high (5), medium (3), and low (1) quality practice, anchored to
examples of what these scores might look like in the classroom. The middle scores (2 and 4)
are not defined in the rubrics; raters use these scores to designate practices that fall some-
where between two anchored points in the scale This helps to define the scores as not only
qualitatively distinct pictures of instructional practice, but as ordered points in a quantitative
scale. Complete rubrics for all the dimensions are available in the accompanying online
appendix.
Notebooks and observations were rated using the same rubrics. Notebook readers
assigned a single score for each dimension considering the evidence in the notebook as a
whole. Classroom observers assigned two kinds of rating on each dimension: daily ratings
after each visit, and summary observation ratings for the series of lessons. Finally, classroom
observers were asked to review the teacher’s notebook after the observation period and assign
a Gold Standard (GS) rating for each dimension considering all the evidence at their disposal
from their own observations and the notebook. These GS ratings are not independent from
observation or notebook ratings; rather, they are composite ratings that represent our best
available estimate of the ‘‘true’’ status of a teacher’s instruction on the 10 dimensions of
practice.
Notebook and observation ratings were carried out by the authors and a group of
doctoral students with backgrounds in science teaching, and training in research methodology.
A calibration process was undertaken to ensure consistent understanding and scoring of
dimensions across raters. Observer training involved first reviewing and discussing the
scoring guides and independently rating videotapes of science lessons; the group then dis-
cussed the ratings to resolve disagreements and repeated the process with a second videotape.
Notebook readers first discussed the use of the scoring guides to judge instruction on the basis
of the notebook contents. Readers then rated three notebooks independently and discussed
the scores to resolve differences of interpretation; the process was repeated with two more
notebooks.
Design and Analytic Methods
The year 1 study focused on estimating the reliability of notebook ratings and criterion
validity with respect to classroom observations. Therefore, each notebook was independently
rated by two trained readers; classrooms were visited by one observer on two occasions
during the notebook period. The year 2 study investigated the reliability of classroom obser-
vation ratings. Therefore, pairs of observers visited each classroom on three occasions during
the notebook period; notebooks were rated by one reader who had not visited the classroom.
In both years, GS ratings were assigned by observers who visited each classroom considering
the additional evidence in the notebook. Table 1 summarizes the sources of information and
design used each year.
46 MARTINEZ ETAL.
Journal of Research in Science Teaching

Reliability. We employed two complimentary approaches to investigate the reliability of
notebook and observation ratings. Inter-rater agreement indices offered preliminary evidence
of consistency and helped pinpoint problematic notebooks, classrooms, or raters. The reliabil-
ity of ratings was then formally assessed using Generalizability (G) Theory (Shavelson &
Webb, 1991). G-theory is particularly suitable as a framework for investigating the reliability
of measures of instruction because it can assess the relative importance of multiple sources of
error simultaneously (e.g., raters, tasks, occasions; see e.g., Moss et al., 2004). In the year 1
study each notebook was scored by multiple raters on each dimension; this is a crossed
Teacher � Rater design with one facet of error (raters), which identifies three sources of
score variance: true differences in instructional practice across teachers (s2T), mean differen-
ces between raters (i.e., variance in rater severity, s2R), and a term combining interaction and
residual error (s2TR;e). The year 2 study investigated the reliability of observation ratings. For
summary observation ratings assigned at the end of the observation period we used the same
Teacher � Rater design just described. With daily observation ratings there is one more facet
of error (Teacher � Rater � Occasion); the design thus separates true variance in instruction-
al practice (s2T), from error variance related to raters and occasions (s2
R and s2O); variance
related to two-way interactions (s2TR, s
2RO, and s2
TO; for example, raters give different scores
to the same teachers, averaging over occasions); and residual interaction and error in the
model (s2TRO;e).
3
In addition to reviewing the sources of variance in the ratings, we conducted a series
of decision (D) studies to estimate the reliability of the ratings under various measurement
scenarios (e.g., varying numbers of raters and observations). G-theory distinguishes between
reliability for relative (norm-referenced) and absolute (criterion-referenced) score interpreta-
tions. Because our measures assess teacher practice in relation to fixed criteria outlined in our
model of science instruction (not in relation to other teachers) we report absolute reliability
coefficients (known as dependability coefficients in G-theory).
Correlations Among Dimensions Within Methods. To address the second research question
we conducted a series of exploratory factor analyses to examine the patterns of intercorrela-
tion among dimensions. Comparing the results observed with notebook and observation rat-
ings can offer evidence of the degree to which both methods yield measures that capture the
same underlying constructs of instructional practice. We first examined the hypothesis of
unidimensionality—whether a dominant factor underlies all dimensions of instruction. We
then assessed the possibility that more than one factor underlies and explains the correlations
among dimensions. In this situation creating a single aggregate index of instruction would not
be appropriate; instead multiple indices would be necessary to reflect different aspects of
instructional practice represented by separate groups of dimensions.4
Correlations Among Methods Within Dimensions. The third research question concerns
the degree to which notebooks and observations converge in their assessments of instructional
practice in the same science classrooms. To address this question we estimated raw and dis-
attenuated correlations between ratings of instruction as measured through notebooks and
observations in the year 1 study (n ¼ 28 classrooms).5 In addition, we estimated correlations
between notebook, observation, and Gold Standard ratings.
Additional Qualitative Analysis of Notebook Use
To address the fourth research question, we examined the operational evidence from the
two field studies in an effort to understand how the notebooks functioned in practice and how
MEASURING INSTRUCTION USING CLASSROOM ARTIFACTS 47
Journal of Research in Science Teaching

they might be modified to improve reliability, validity, and feasibility for measuring science
instruction on a larger scale. These analyses consisted of a qualitative review of the complete-
ness of each notebook and the variety of artifacts collected in it, and extensive qualitative
analysis of reflections offered by teachers on the notebook, their perceptions about the note-
book and its potential for adequately capturing their instructional practices in the science
classroom, as well as their feedback on potential ways to improve the notebook and data
collection procedures. Finally raters assessed the usefulness of each source of information in
the notebook for judging each dimension of instruction using a three-point scale (ranging
from 0-Not helpful to 2-Very helpful).
Results
Reliability of Notebook and Observation Ratings
Table 2 shows inter-rater agreement indices for notebook and summary observation rat-
ings for each dimension of science instruction. Exact inter-rater agreement was low to moder-
ate, ranging from 22% to 47% with notebooks, 29% to 62% with observations. These results
suggest that better rater training and potentially also improvements or clarifications to the
scoring guidelines may be needed; in the discussion section, we outline changes to the scor-
ing rubrics that may help improve rating consistency. On the other hand agreement within-
one point gives a more hopeful sense of rater consistency: over 90% for Overall, and over
75% for all dimensions, which is in the typical range for more established observation and
portfolio measures (see e.g., Pecheone & Chung, 2006; Pianta & Hamre, 2009). These results
also indicate that raters in our studies were able to judge science instruction using the note-
books with similar levels of agreement to observers inside classrooms.6
Table 2
Notebook and summary observation ratings of reform-oriented instruction (1–5 scale)
Dimension
Notebook Ratings
(2003–2004)
Summary Observation Ratings
(2004–2005)
% Agreement % of Variance % Agreement % of Variance
Exact W/in1 T R
Error
(TR,e) Exact W/in-1 T R
Error
(TR,e)
Overall 40 91 57.1 8.2 34.7 57 95 64.8 — 34.0Assessment 38 76 43.3 15.3 41.4 29 76 35.0 30.9 34.0Cognitive depth 40 82 53.2 10.4 36.5 38 90 63.9 — 32.6Connections/Applications 22 85 52.6 — 41.9 38 76 48.3 9.7 41.9Discou rse Community 43 91 61.0 — 34.3 33 81 33.2 8.8 57.9Explanation/Justification 33 88 43.0 8.9 48.1 29 86 31.8 24.4 43.7Grouping 40 81 61.0 — 38.2 48 86 76.1 — 23.8Hands-on 42 77 59.6 — 38.4 57 95 87.8 — 12.1Inquiry 38 88 49.7 8.4 42.0 62 95 68.0 8.3 23.5Scientific resources 37 75 51.9 8.2 39.9 48 90 76.8 — 23.1Structure of lessons 47 82 28.9 9.9 61.1 33 86 57.6 21.9 20.3
Percent agreement and variance components by dimension.
Note: Components that account for 5% of variance or less are not displayed for ease of interpretation
48 MARTINEZ ETAL.
Journal of Research in Science Teaching

We conducted a series of analyses using Generalizability Theory to further investigate
the sources of error affecting judgments of science instruction based on notebooks and obser-
vations. Table 2 also presents estimated variance components for notebook ratings and sum-
mary observation ratings of each dimension. The results indicate that most of the variance in
the Overall ratings (57% and 65%, respectively, with notebooks and observations) reflects
true differences between teachers. Also notable are the small rater variance components,
which may suggest that rater training was more successful than the agreement indices would
initially indicate. Among the individual dimensions the few instances of substantial rater vari-
ance occurred not with notebooks but with observation ratings: observers were less consistent
in judging Assessment, Explanation—Justification, and Structure of Lessons. Finally, residual
error variance was considerable. The s2TR;e term combines teacher by rater interaction, random
error, and potentially variance associated with facets excluded from the design. One important
source of error often hidden in measures of instruction is variation across measurement occa-
sions (Shavelson, Webb, & Burstein, 1986); in the next section, we investigate whether this
facet may have contributed to error variance in the measures.
Table 3 presents variance components for a teacher by rater by occasion Generalizability
design for daily observation ratings in the year 2 study. Of note is that most of the variance in
Overall ratings (52%) reflects true differences across teachers. The results also show that
variance across occasions is an important source of error in the measures; in particular
we found substantial (over 20%) day-to-day variation in instructional practices (s2TO) related
to Grouping, Scientific Resources, Hands-On Activities, and Connections/Applications.
Naturally, instruction in science classrooms can be expected to vary from day to day for a
variety of reasons, and thus s2TO could be seen as reflecting true variance in teacher practice
over time, not error. However, the interaction does reflect the degree of uncertainty (i.e.,
error) in generalizing from a measure of science instruction based on a limited sample of
observations (or with notebooks, days of data collection) beyond the period covered by
the observations as if it were a true measure over time and raters across the school year.
This day-to-day variation highlights the need for drawing sufficient samples of occasions of
practice as we will examine in detail below.
Table 3
Variance components by dimension, daily observation ratings (2004–2005)
Dimension
Daily Observation Ratings (2004–2005) (% of Variance)
T (%) R (%) O (%) T � R (%) T � O (%) R � O TRO,e (%)
Overall 51.9 6.9 — 10.8 13.5 — 16.6Assessment 25.5 19.8 — 12.4 13.0 — 29.2Cognitive depth 30.2 — — 11.5 16.2 — 42.0Connections/Applications 16.7 8.6 — 12.8 28.5 — 25.9Discourse Community 17.3 — — 49.9 7.4 — 22.6Explanation/Justification 33.2 17.4 — 19.7 — — 26.1Grouping 24.2 — — 5.9 52.0 — 17.4Hands-on 47.8 — — — 45.3 — —Inquiry 47.9 10.0 — 6.3 10.5 — 25.1Scientific resources 52.1 — — — 26.3 — 12.2Structure of lessons 26.6 10.5 — 12.1 16.6 — 29.2
Note: Components that account for 5% of variance or less are not displayed for ease of interpretation
MEASURING INSTRUCTION USING CLASSROOM ARTIFACTS 49
Journal of Research in Science Teaching

Table 4 presents absolute reliability (i.e., dependability) coefficients for measures of science
instruction obtained through notebooks and observations, averaging over two and three raters.
In the g-theory framework these coefficients reflect the extent to which a measure of instruc-
tion generalizes beyond the specific instances of measurement it represents (i.e., one lesson
judged by one rater) to the universe of admissible conditions under which it could have been
obtained (i.e., all lessons in the year, all possible raters).7 The results offer valuable insight
for assessing the reliability of measures based on notebooks and observations. For individual
dimensions the dependability of ratings differed across methods. Notebook ratings of Hands-
on, Inquiry, Scientific Resources, and Structure of Lessons have lower dependability coeffi-
cients than observation ratings. Conversely, notebook ratings of Assessment, Explanation/
Justification, and Discourse Community are more reliable than observation ratings. The large
teacher by rater interaction seen with Discourse Community suggests that raters interpreted
the scoring guide for this dimension inconsistently during direct observation. In the discussion
section, we consider in detail the possibility that some aspects of instructional practice may
be measured more reliably by artifact collections while others are better measured through
direct observation. Finally, the dependability of Overall notebook ratings over two raters is
0.73, compared to 0.79 and 0.80 for Overall summary and daily observation ratings (with
three raters dependability is over 0.80 throughout). One early lesson from these results is that
while notebooks and observations may support reliable Overall judgments of science instruc-
tion, reliable measures of the individual dimensions of practice are harder to obtain and re-
quire either larger numbers of observations or raters, or potentially modifications to the rating
rubrics.
Because classroom practice can be naturally expected to vary from day to day, it is also
important to consider how the reliability of indicators of instructional practice may vary as a
function of the number of days of observation or data collection. The variance components in
Table 3 can be used to obtain projections of reliability under different scenarios; Figure 2
plots estimated dependability coefficients by number of daily observations. The figure indi-
cates that Overall ratings of science instruction by two raters reach dependability of 0.80 after
the fifth observation (with three raters only three observations would be required; see
Table 4
Dependability coefficients for notebooks, multiple and summary observation ratings and notebooks
ratings by dimension
Dimension
Notebook
(2003–2004)
Summary Observation
(2004–2005)
Daily Observationa
(2004–2005)
2 Raters 3 Raters 2 Raters 3 Raters 2 Raters 3 Raters
Overall 0.73 0.80 0.79 0.85 0.80 0.84Assessment 0.60 0.70 0.52 0.62 0.54 0.63Cognitive depth 0.69 0.77 0.78 0.84 0.70 0.75Connections/Applications 0.69 0.77 0.65 0.74 0.45 0.52Discourse Community 0.76 0.82 0.50 0.60 0.37 0.46Explanation/Justification 0.60 0.69 0.48 0.58 0.60 0.69Grouping 0.77 0.82 0.86 0.91 0.62 0.64Hands-on 0.75 0.82 0.94 0.96 0.82 0.83Inquiry 0.66 0.75 0.81 0.86 0.79 0.84Scientific resources 0.68 0.76 0.87 0.91 0.84 0.86Structure of lessons 0.45 0.55 0.73 0.80 0.59 0.66
aThe coefficients reflect the reliability of the average rating over five observations.
50 MARTINEZ ETAL.
Journal of Research in Science Teaching

Table 4). As could be expected, for individual dimensions with greater day-to-day variance,
such as Grouping, Hands-on, and Connections, additional observations are required to pro-
duce reliable measures. In general, the curves suggest that reliability improves little beyond
five or six observations. Thus, another lesson that can be drawn from our results is that
obtaining reliable ratings may require multiple visits to the classrooms (as many as five or
more depending on the features of instruction of interest) which has direct implications for
assessing the cost, efficiency, and ultimately the usefulness of direct observation in class-
rooms for research and policy purposes.
In our study, each teacher completed only one notebook and thus it is not possible to
directly estimate the extent of variation in the ratings over time (or, in consequence, to inves-
tigate rating reliability as a function of number of occasions sampled). In practice, however,
notebook ratings do implicitly consider variation over time because each rating is based in
evidence that spans 5 days of instruction. The results in the Table 4 suggest that a single
notebook rating spanning multiple days of instruction can offer reliability comparable to that
attainable by averaging together multiple daily observation ratings. One final lesson that can
be drawn from the middle column in Table 4 is that summary observation ratings (single
ratings based on evidence from multiple observations taken as a whole) can be used to
improve further on the reliability of daily ratings.
Correlations Among Dimensions Within Methods of Measurement
Table 5 condenses the results of exploratory factor analyses investigating the internal
structure of notebook ratings (year 1) and summary observation ratings (year 2). The first
column for each type of rating shows the results of analyses that tested the hypothesis of
unidimensionality. The results generally support the notion that a dominant factor underlies
the 10 dimensions of instructional practice in science—as shown in the table the first factor
0.00
0.10
0.20
0.30
0.40
0.50
0.60
0.70
0.80
0.90
1.00
0186420
# Of Observations
Depe
ndab
ility
Coe
ffici
ent
Grouping'Structure of Lessons'Use of Scientific Resources'Hands-On'Inquiry'Cognitive Depth'Scientific Discourse Community'Explanation and Justification'Assessment'Connections/Applications'Overall'
Figure 2. Dependability of science classroom observation ratings (by number of observations; n ¼ 3
raters).
MEASURING INSTRUCTION USING CLASSROOM ARTIFACTS 51
Journal of Research in Science Teaching

Table
5
Factorloadingsfornotebookandsummary
observationratings,oneandthree-factorsolutions
Dim
ension
NotebookRatings(per
Rater)
(2003–2004;n¼
84)
SummaryObservationRatings
(per
Rater)(2004–2005;n¼
42)
One-Factor
(50%
ofVariance)
Three-Factor
(RMSEA
¼0.071,TLI¼
0.97)
One-Factor
(42%
ofVariance)
Three-Factor
(RMSEA
¼0.059,TLI¼
0.95)
Instruction
ContentForm
atStructure
Instruction
ContentForm
atStructure
Assessm
ent
0.80
0.82
0.34
0.29
0.59
0.75
0.04
0.11
Cognitivedepth
0.81
0.83
0.33
0.44
0.83
0.75
0.41
0.52
Connections/Applications
0.60
0.56
0.52
0.01
0.57
0.53
0.21
0.42
DiscourseCommunity
0.81
0.87
0.26
0.18
0.79
0.84
0.34
0.20
Explanation/Justification
0.76
0.77
0.39
0.17
0.70
0.89
0.13
0.04
Grouping
0.76
0.77
0.43
0.12
0.37
0.00
0.70
0.32
Hands-on
0.58
0.40
0.91
0.05
0.45
0.06
0.84
0.21
Inquiry
0.82
0.85
0.35
0.25
0.64
0.50
0.72
�0.12
Scientificresources
0.59
0.37
0.92
0.30
0.66
0.38
0.80
0.20
Structure
oflessons
0.36
0.27
0.16
0.97
0.47
0.23
0.24
0.93
52 MARTINEZ ETAL.
Journal of Research in Science Teaching

accounts for 50% of the total variance in notebook ratings, and 42% of the variance in sum-
mary observation ratings. While these one-factor solutions may appropriately describe the
pattern of correlations among dimensions, from a substantive standpoint the fact that about
half of the total variance in these measures remains unexplained should not be overlooked. It
suggests that additional factors are necessary to fully explain the pattern of correlations
among dimensions and the variance of individual dimensions of instruction. Accordingly,
additional analyses explored solutions with two and three factors underlying the ten dimen-
sions of science instruction. The model with three factors appeared to fit the notebook and
observation data best, both statistically (TLI ¼ 0.97 and 0.95) and substantively. The first
factor (which we term Content) groups Cognitive Depth, Discourse Community, Assessment,
and Inquiry; the second factor (termed Format) reflects use of Scientific Resources and
Hands-on experiences in the classroom. Finally, Structure of Lessons is singled out as a third
factor, suggesting that well-structured lesson plans are equally likely to occur in classrooms
that differ substantially in terms of the other two factors. This analysis suggests that future
studies might investigate scoring notebooks (or observing classrooms) using a rating system
where individual aspects of instruction are mapped to or organized around two or three over-
arching instructional factors.
Correlations among Methods Within Dimensions
Table 6 presents correlations between notebook, summary observation, and Gold
Standard ratings for each dimension of instruction.8 The raw correlation coefficient between
Overall notebook and observation ratings is 0.57 (the disattenuated correlation is 0.69).
Notably, the correlation between the average rating across dimensions for notebooks and
observations is 0.71, suggesting that a simple arithmetic average may be a more consistent
measure of practice across dimensions than the holistic average provided by raters (i.e., the
Overall rating). Across individual dimensions the raw correlations between notebooks and
Table 6
Correlation among notebook, summary observation, and gold standard ratings, by dimension (2003–
2004 and 2004–2005 studies)
Dimension
Pearson (and Disattenuated) Correlations
Notebook—
Observation
(2003–2004; n ¼ 28)
Notebook—
Gold Standard
(2003–2004; n ¼ 28)
Observation—
Gold Standard
(2004–2005; n ¼ 21)a
Overall (holistic rating) 0.57 (0.69) 0.59 (0.70) 0.92Average Index (average rating) 0.71 0.72 0.94Hands-on 0.76 (0.95) 0.85 (0.99) 0.95Inquiry 0.69 (0.85) 0.62 (0.75) 0.96Scientific resources 0.55 (0.72) 0.59 (0.79) 0.92Assessment 0.54 (0.77) 0.54 (0.73) 0.82Cognitive depth 0.53 (0.83) 0.41 (0.75) 0.95Connections 0.55 (0.63) 0.70 (0.81) 0.93Discourse community 0.64 (0.72) 0.70 (0.81) 0.90Explanation/Justification 0.62 (0.77) 0.54 (0.67) 0.84Grouping 0.61 (0.73) 0.67 (0.80) 0.96Structure of lessons 0.26 (0.39) 0.26 (0.39) 0.96
aNote: Corrected correlations were over 1.00 and are not displayed.
MEASURING INSTRUCTION USING CLASSROOM ARTIFACTS 53
Journal of Research in Science Teaching

observations are 0.5 or higher in nearly all cases (the weaker correlation for Structure of
Lessons reflects its skewed distribution and lower reliability seen in Tables 3 and 4). The
strongest convergence was observed with Hands on (0.76), Inquiry (0.69), and Discourse
Community (0.64).
Similar correlations were observed in the year 1 study between notebook and Gold
Standard ratings, contrasting with the much higher correlations observed between GS and
observation ratings in year 2 (0.92 for Overall ratings and over 0.84 for all dimensions, see
Table 6). Because GS ratings combine evidence from notebooks and observations, these cor-
relations represent part-whole relationships and thus cannot be used directly to assess criteri-
on validity.9 However, the correlations reflect the relative weight raters gave to evidence from
notebooks and observations when both sources were available. The larger correlations in the
second study suggest that raters who visited a classroom may have been more persuaded by
or inclined to rely on their own observations than on the evidence contained in the notebook.
Where both sources of evidence are available, these results imply a need for explicitly out-
lining the ways in which the evidence from the notebook should complement and in some
cases override evidence garnered during classroom visits.
Notebook Completeness
Nearly every notebook contained teacher-generated artifacts, with the average being nine
artifacts per notebook. Similarly, nearly all notebooks contained annotated examples of stu-
dent work. On the other hand only six in 10 teachers provided examples of formative or
summative assessments given in their classroom, and only four in 10 included completed
assessments with student answers; this could reflect teacher unwillingness to share assess-
ments or it could mean simply that no assessments were given during the notebook period.
Teachers annotated most of the materials they collected in the notebook, but the comments
tended to be brief and often added little information that was not apparent in the materials
themselves. Every teacher answered the pre-notebook reflection questions, providing informa-
tion about classroom organization, expectations for student behavior and learning, equipment
and material availability, plans, events, and activities affecting classroom practice during the
notebook period. While most teachers (82%) provided answers to all daily reflection ques-
tions, the quality of the information provided varied considerably from terse responses pro-
viding little valuable context, to in-depth commentary illuminating important elements of the
lesson. Daily reflections often grew shorter over the notebook period.
Usefulness of Notebook Artifacts for Judging Instructional Practice
Table 7 summarizes rater reports of the usefulness of each source of information in the
notebook for judging each dimension of instruction. Reflection questions (in particular daily
reflections) were very helpful for judging most aspects of instructional practice. In addition,
at least one artifact was considered very useful for judging instruction across dimensions.
Instructional materials (e.g., lesson plans, handouts, worksheets) were very helpful for judging
inquiry, cognitive depth, and connections/applications, and somewhat helpful for all the
remaining dimensions. On the other hand, some artifacts provide useful information for some
dimensions but not others; for example, formal assessment artifacts and samples of student
work were very helpful for judging assessment, explanation-justification, and cognitive depth,
and not as helpful for the remaining dimensions. Finally, the photo log and the white (assess-
ment) labels were of limited value for judging most dimensions of science instruction. The
results provide some support for the notion that the combination of artifacts and teacher
reflections is useful for assessing instructional practice.
54 MARTINEZ ETAL.
Journal of Research in Science Teaching

Teacher Perceptions of the Notebook
Teacher answers to the post-notebook reflection questions offer additional insight on the
potential of this instrument for supporting valid measures of instructional practice in science
classrooms. The vast majority of teachers said the lessons in the notebook were very repre-
sentative of their typical instructional practice in that classroom during the year. Most teach-
ers also said the collection of artifacts and reflections in the notebook captured very well
what it was like to learn science in their classroom; however, a minority thought that the
notebook did not adequately reflect instruction in their classrooms. Teacher feedback points
to ways the notebook may be improved for future use. The most frequent suggestions were to
extend the notebook period, and to collect additional materials to reflect the organizational
and support structures of classrooms. Interestingly, a few teachers suggested supplementing
the information in the notebooks with classroom observations.
Discussion
This article presented the results of two field studies of the Scoop Notebook—an artifact-
based instrument for measuring middle school science instruction that combines artifact col-
lection and teacher self report. Our analyses addressed four main research questions concern-
ing reliability, dimensionality, and correlation between notebook ratings and ratings based on
Table 7
Usefulness of artifacts for rating each dimension of science instruction
*noitamrofnIfoecruoS/tcafitrA
Dimension Pre-Scoop
Reflection
Daily
Reflection
Post-Scoop
ReflectionCalendar
Photo
LogPhotos
Yellow
Labels
White
Labels
Instructional
Materials
Student
Work
Formal
Assessment
Grouping 1.1 1.6 0.4 0.6 1.2 1.8 0.3 0.2 0.8 0.3 0.0
Structure of Lessons 1.9 2.0 1.2 1.7 0.2 0.1 0.4 0.2 1.3 0.4 0.4
Scientific Resources 0.8 1.7 0.3 1.7 1.0 1.8 0.7 0.1 1.4 0.6 0.2
Hands-On 1.1 1.7 0.8 1.2 1.1 1.7 0.6 0.1 1.3 0.4 0.1
Inquiry 1.0 1.9 0.9 0.4 0.4 0.6 0.8 0.3 1.7 1.1 0.7
Cognitive Depth 0.8 1.9 1.4 0.1 0.0 0.1 0.6 1.1 1.6 1.6 1.5
Discourse Community 1.1 1.9 1.0 0.2 0.2 0.7 0.1 0.1 0.7 0.8 0.4
Explanation/Justif. 0.6 1.6 0.7 0.0 0.1 0.1 0.7 0.9 1.4 1.9 1.9
Assessment 1.6 1.8 1.0 0.8 0.1 0.1 0.8 1.6 1.6 1.8 2.0
Connectns/Applicatns 1.1 1.9 0.9 0.3 0.2 0.2 0.3 0.2 1.6 1.3 1.0
Average Across
Dimensions 1.11 1.79 0.86 0.74 0.48 0.78 0.56 0.51 1.31 0.99 0.79
* Coding: Very helpful/Essential
(Mean Rating ≥ 1.5)
Somewhat helpful
(0.5 < Mean < 1.4)
Not helpful/Trivial
(Mean Rating ≤ 0.5)
MEASURING INSTRUCTION USING CLASSROOM ARTIFACTS 55
Journal of Research in Science Teaching

direct observations, and lessons for improving artifact-based measures of instruction. The
results have bearing on the strength of a validity argument for interpreting notebook scores as
reflective of variation in science teachers’ instructional practices in the classroom. Equally
importantly, the results offer valuable insight into the conceptual and methodological chal-
lenges involved in measuring instructional practice in science classrooms. In this section, we
discuss the lessons we derive from our studies for the development of better artifact-based
instruments that may help address some of these challenges in the future.
Summary of Results (Reliability and Validity of Notebook Ratings)
In our study, global (overall) ratings of instruction based on our instrument showed ap-
propriate reliability comparable to that attainable through direct observation over multiple
classroom visits. For individual dimensions of instruction, the results were mixed: reliability
was adequate for some dimensions (e.g., Grouping, Hands-on, Discourse) but not for others
(e.g., Cognitive Depth, Inquiry, Assessment, Structure). Factor analyses point to similar (albe-
it not identical) factorial structures underlying notebook and observations ratings. Finally, we
found sizeable correlations (0.60–0.70) between Overall and Average notebook ratings and
their observation counterparts; for individual dimensions the correlations remain consistently
over 0.50, further bolstering the claim that the two methods are measuring that same selected
aspects of science instruction.
Overall, these results suggest that carefully constructed artifact-based instruments hold
potential for measuring instructional practice in science classrooms; at the same time, there is
ample reason to caution against over-interpretation and misuse of ratings of instruction based
on the notebook. Notebook ratings can be valuable for describing instructional practice for
groups of science teachers, and to assess curriculum implementation or track change in prac-
tice over time (Lee, Penfield, & Maerten-Rivera, 2009). Aggregate measures can also be used
to evaluate the effect of interventions or professional development programs on the practices
of groups of teachers (Bell, Matkins, & Gansneder, 2011). In its current form, however, use
of the notebook for decisions or judgments about individual teachers on individual dimen-
sions is not warranted. Portfolio instruments may be appropriate for use within a multiple
indicator system for assessing teacher performance, but further validation research would be
needed to justify such uses. Moreover, additional research with larger samples of teachers is
needed to investigate how notebooks function with different groups of teachers (e.g., novice
and expert) or students (e.g., low or high performing), and in different types of classes (e.g.,
lower vs. college track).
The Notebook Validation Studies: Lessons Learned
Our studies set out to shed light on the technical aspects of developing reliable and valid
measures of instruction in science classrooms. The psychometric results and our experience
conducting the study emphasized the close interconnectedness of the technical and conceptual
challenges involved in measuring instructional practice. In the following section we discuss
the implications and lessons we draw from our studies for the development of better instru-
ments for measuring instructional practice.
Dimensions of Instruction: Sources of Variance and Sources of Evidence. The first series of
lessons is related to the implications of variation in practice over time for measuring different
dimensions of instruction. Considerable day-to-day variability affected the reliability of daily
ratings for some dimensions (e.g., Grouping). For dimensions with large daily fluctuations it
may be preferable to assign a single score over time than to assign daily ratings. Summary
56 MARTINEZ ETAL.
Journal of Research in Science Teaching

observation and notebook ratings take this holistic approach, resulting in considerable im-
provement in reliability for ratings of the Grouping dimension. Thus, an ‘‘overall’’ approach
(i.e., assigning a single score that takes into account the variation in practice observed over
time) may be better suited for measuring dimensions of practice that vary considerably from
day to day. Finally, it should be noted that variation over time and average quality are not
directly related; large fluctuations in practice could signal high quality instruction (i.e.,
instruction that is varied and adaptable to lesson content and student progress) in some class-
rooms, while similar variation in other classrooms might still be accompanied by low quality
instruction.
A second lesson concerns the fit between dimensions and sources of evidence. In our
study notebook ratings of Hands-on, Inquiry, Scientific Resources, and Structure of Lessons
have lower reliability than observation ratings. The evidence suggests that these dimensions
may stand out clearly when observing teachers in classrooms, but are likely more difficult to
discern on the basis of notebook contents alone (e.g., hands-on use of materials will be appar-
ent in class, while notebooks can only offer indirect evidence via artifacts such as photo-
graphs or worksheets). Conversely, notebook ratings of Assessment, Explanation/Justification,
and Discourse Community are more reliable than observation ratings. For these dimensions,
artifacts accompanied by teacher reflections may offer a clearer and more comprehensive
picture of practice than would be available to classroom observers, who may not have access
to materials, and may not visit a classroom when key instructional activities are occurring.
These findings are encouraging for the future of artifact-based measures, given the importance
of classroom assessment and student-generated explanations in current thinking on science
instruction (Gerard et al., 2010; Ruiz-Primo et al., 2010).
The results of the factor analyses shed further light on the close interplay between dimen-
sions and sources of evidence in the notebook and observation ratings. While we found simi-
lar factorial structures with notebook and observation ratings, the differences point to
interesting unresolved questions about the precise nature of the constructs measured with
each approach. Given the high levels of inference involved in judging the complex dimen-
sions of instruction in the model, these results hold important clues about how the two meth-
ods may be influenced by (or privilege) different sources of evidence of practice. For
example, notebook ratings of Grouping relate to the content factor more strongly than obser-
vation ratings, suggesting that notebook readers considered not only the frequency of group
work, but also the cognitive nature of the work carried out in the groups. Inquiry is more
closely tied to the format factor in observation ratings, and to the content factor in notebook
ratings, suggesting that observers judged this dimension primarily in terms of physical
arrangements and formal activities carried out in classrooms (e.g., laboratories, experiments),
whereas notebook raters may have more closely considered the cognitive nature of the activi-
ties as intended in the scoring guide for this dimension. In general, because notebook readers
rely on teacher reflections to illuminate the artifacts collected, notebook ratings of some
dimensions (e.g., grouping, inquiry) may be highly influenced by the quality and depth of
teacher reflections, or the overall cognitive depth reflected by the contents of the notebook.
Classroom observers on the other hand process large amounts of visual and auditory informa-
tion about classroom activity and discourse, which for some dimensions may lead to judg-
ments of instruction that are influenced by routine processes, types of activities, and physical
arrangements in the classroom.
The correlations between notebook and observation ratings also provide insight into the
match between measures and sources of evidence. While the correlations are sizeable (i.e.,
0.50 or larger) they are not so high as to suggest complete convergence across methods. More
MEASURING INSTRUCTION USING CLASSROOM ARTIFACTS 57
Journal of Research in Science Teaching

likely, notebooks and observations tap into some overlapping aspects of science instruction,
and each tool also reflects unique features of instructional practice not adequately captured by
the other method. The assessment dimension presents a prime example: notebooks are well
suited to measure formal assessment practice through the variety of artifacts collected, but are
inherently limited in the extent to which they can convey informal, on-the-fly assessment.
Conversely, instances of informal assessment will be evident to classroom observers, but
more formal aspects of assessment might be difficult to gauge after only two or three visits.
This raises questions about the use of observations as the central validation criterion for
notebook ratings (or other measures of instruction), when a combination of both methods
would yield a more complete picture of instructional practice in science than either method is
capable of by itself. Interestingly, Matsumura et al. (2008) reached a similar conclusion in
their investigation of tools for measuring instructional practice in literacy and mathematics
lessons. Since different artifacts and sources of information may provide better evidence for
some dimensions than others, it is crucial to start with a clear idea of what aspects of practice
are of interest, consider the potential sources of evidence available, and select those sources
that balance evidentiary power with practicality.
Grain Size and Level of Inference in Measures of Instructional Practice. Our experience
in conducting these studies offers valuable insights into the challenges faced in designing
measures to capture complex features of science instruction, and the potential for tradeoffs
between the reliability and validity of the measures (Moss, 1994). Lessons can also be drawn
about the interplay between the grain size and level of inference of a measure of instruction.
Grain size refers to the scope of a construct (its conceptual richness or internal dimensionali-
ty), while level of inference refers to the distance between the evidence in the notebook and
the scores assigned by a rater on a dimension—that is, ratings may map directly to artifacts
in the notebook, or require considerable inference and interpretation from raters.
Each dimension in our model represents a rich construct that may involve multiple fea-
tures of science instruction. The conceptual richness resulting from this large grain size is an
important aspect of the validity of the resulting measures of science instruction. At the same
time, the reliability and practical usefulness of these measures rest on the ability of the
rubrics to map features of science instruction to scores in a way that minimizes subjectivity
in rater interpretation and therefore maximizes the reliability of notebook ratings. Compared
to measures of smaller grain size, the inclusion of multiple features of instruction within a
dimension can negatively impact the reliability of ratings, or alternatively require additional
rater training to attain the same reliability. For example, in our study, the assessment dimen-
sion had generally low levels of agreement and reliability. As defined in our model, this
dimension encompasses both formal and informal aspects of classroom assessment practice,
which rater reports suggest sometimes made it difficult to synthesize practice into a single
score.
Our experience suggests that to maximize rating consistency it is useful to define dimen-
sions in terms of fewer features of practice, provided that this does not compromise the core
essence of the dimension. Thus, one possibility would be to use a larger number of dimen-
sions, each encompassing fewer features of practice. For example, separate dimensions could
be defined for formal and informal components of classroom assessment, and informal assess-
ment might be further separated into dimensions for initial assessments of prior knowledge
and monitoring of small group activities. Crucially, however, narrowing a measure of instruc-
tion to improve its reliability can also raise important questions of validity or usefulness. The
reliability-validity paradox is well known in the measurement literature: while adequate
58 MARTINEZ ETAL.
Journal of Research in Science Teaching

reliability is generally necessary for validity, after a certain point increasing reliability by
narrowing a measure limits the variance it can share with others, thus effectively decreasing
validity (see e.g., Li, 2003). While the number of quizzes administered per week is easier to
measure reliably, it also yields less rich and less useful information than a larger grain assess-
ment practice dimension, other things being equal. Finally, a larger number of items, even of
small grain size can increase the burden on raters or observers.
If multiple features of practice are needed to adequately characterize a dimension, anoth-
er approach would be to provide weights or precise decision rules describing how these fea-
tures should be condensed into one rating. This approach reduces the latitude of raters in
interpreting the scoring guides and can improve consistency. For example, judgments of
grouping based on the frequency of group work will differ from others based on the nature of
activities conducted in groups; to improve rater consistency without omitting either feature,
our guides specified different combinations of frequency and type of activity leading to an
intermediate rating (see rating guide in the Supplementary online appendix). Admittedly, the
complexity of the dimensions may make it difficult to specify all possible combinations of
activities that comprise the dimension in a rubric, and the weights to be assigned to each
of them in different classroom contexts and scenarios. These issues concerning grain size,
reliability, and validity warrant investigation in future research.
Ultimately, efforts to improve reliability by tightening the scoring rules have to be bal-
anced with the need to avoid narrow rules that are not responsive to the range and complexity
of science instruction. The tradeoffs between small and large grain size, and between low and
high inference, when measuring instruction are well known: measures with large grain size
can offer rich, contextualized information about instruction with high potential value for
informing policy analysis and professional development. This type of measure has thus
become standard practice for measuring instruction through observation (see e.g., Grossman
et al., 2010; Hill et al., 2008; Pianta, Hamre, Haynes, Mintz, & Paro, 2009), video (see e.g.,
Marder et al., 2010), artifacts (Matsumura, Garnier, Pascal, & Valdes, 2002), and portfolio
instruments (e.g., Pecheone & Chung, 2006; Silver et al., 2002). However, a large grain size
also carries higher development, training and collection costs that may not be realistic for
many applications and in some cases ultimately results in measures that do not improve
upon, or even fail to match the reliability of survey-based measures. Small grain size) ratings
offer superior reliability, but are limited in their ability to capture instruction in its full com-
plexity—rich, contextualized information about a construct as complex as instruction cannot
be obtained by merely aggregating narrow, de-contextualized indicators. Researchers and
developers thus need to be mindful and explicit about their goals, assumptions, and choices in
considering the tradeoffs between specificity (i.e., reliability) and richness (i.e., validity) of
the dimensions included in their measures of instruction. Importantly, the grain size of a
measure is not dictated by the framework used to develop them; any framework poses similar
tradeoffs for researchers between large and small grain sizes, reliability, and validity. Within
any given framework some aspects of instructional practice (e.g., discipline, grouping, hands-
on practices) may lend themselves more easily to quantification through small grain-size
measures and constructs, while others (e.g., explanation/justification, inquiry) may be best
captured through broader constructs.
Similarly, in designing artifact-based and observational measures of instruction it is im-
portant to consider the appropriate combination of grain size and level of inference. While
the two are often positively correlated, grain size and level of inference should be understood
as distinct and important aspects of a measure. The assessment dimension again offers a good
case study: as discussed before, one option for improving the reliability of this dimension
MEASURING INSTRUCTION USING CLASSROOM ARTIFACTS 59
Journal of Research in Science Teaching

would be to split it into two dimensions capturing only formal or informal aspects of assess-
ment. While narrower than the original, both dimensions would still clearly encompass
constructs of fairly large grain size. However, the constructs would differ in terms of level of
inference as it relates to our instrument: formal assessment can be more directly quantified
from artifacts in the notebooks, while informal assessment requires considerable inference
from artifacts, and teacher annotations and reflections. In general, irrespective of grain
size developers try to minimize the level of inference in their measures to the degree this is
reasonable and useful. It is important to note, however, that inferential leaps are always
required for deriving contextualized ratings of complex constructs like instruction, and that a
potential advantage of portfolio-like instruments is precisely that the artifacts collected
can help strengthen these inferences, and ameliorate concerns about validity and teacher self-
report bias. Developers should thus aim to balance grain size and level of inference to suit
the intended uses and interpretations of their measures. One final recommendation for im-
proving consistency when high inference measures are deemed desirable is to offer specific
guidance to raters about the sources of information in the notebook that should be considered
when rating the dimension. For example, our rubrics instruct raters to look for indirect
evidence of Discourse Community in teacher reflections and lesson plans, and to look for
evidence to inform their ratings of hands-on and grouping in the photographs and the photo-
graph log.
Refinements to Notebooks and Materials. Our experience suggests a number of ways in
which our instrument could be improved for future use. Rater perceptions about the useful-
ness of notebook materials for rating instructional practice revealed two broad patterns: First,
the usefulness of artifacts varied across dimensions of practice; not surprisingly the most
revealing artifacts for judging Cognitive Depth are not the same as those most revealing of
Hands-On activities. This has direct implications for notebook design. If interest centers only
on a subset of dimensions of science instruction some artifacts could be eliminated without
significant loss of clarity. Conversely, if some artifacts are eliminated the notebook will lose
power for describing some dimensions of practice but not others. Secondly, raters found that
teacher reflections were as revealing of instructional practice as the artifacts in the notebooks.
As noted earlier, we hypothesized that artifacts and reflections combined would provide a
more complete picture of science instruction than either source alone. The findings seem
consistent with this hypothesis, suggesting that artifacts are most informative when illuminat-
ed by teacher reflections. For example, while assessment artifacts may be revealing of teacher
expectations and cognitive demand, teacher reflections describing the learning goals and the
way the lesson developed provide crucial contextual information to better interpret these arti-
facts. Finally, some artifacts in the notebook appeared to be generally less valuable for mea-
suring instruction than others; specifically photos and photo logs were not consistently
provided and when present were of limited usefulness. For these reasons, and because provid-
ing disposable cameras increases the cost and burden to both teachers and researchers, these
artifacts could be omitted in future versions of the notebook.
Feedback solicited from teachers after they completed their notebooks also points to poten-
tial areas for improvement. The teachers generally felt that more days of data collection and
more materials would provide a more accurate representation of instruction in their classrooms.
Future studies should investigate the use of portfolios spanning different periods of time (e.g.,
5, 10, or 20 days of instruction) and assess the properties of the resulting measures against the
cost incurred in the collection and scoring of the portfolio. Studies are also needed to explore
different configurations of notebooks for collecting data over time (e.g., five consecutive days
60 MARTINEZ ETAL.
Journal of Research in Science Teaching

of instruction, 5 days in a fixed period of time, 5 days in content units of variable length).
Moreover, informal discussions with teachers and a review of notebook contents reveal that
teachers provided shorter and terser annotations and responses to reflection questions as days
went by. This pattern suggests that notebooks should be designed to minimize the amount of
daily open-ended writing required of teachers. One possibility is to use shorter questions for
daily reflections and for the self-adhesive notes; another is to eliminate daily reflections alto-
gether and to incorporate some of this information in responses on the adhesive notes.
Unanswered Questions and Next Steps
What Dimensions Should be Used to Characterize Science Instruction?. Several questions
remain related to the measurement of science instruction in general and the use of artifact-
based measures of science instruction in particular. The first involves the choice of model and
dimensions of science instruction to measure. Albeit still highly influential, the National
Science Education Standards are only one possible model of instruction. Other models have
been proposed which may emphasize different aspects or dimensions of instruction (see e.g.,
NRC, 2007; Luykx & Lee, 2007; Windschitl, 2001). In particular, future studies aiming to
measure instructional practice in science should incorporate the new common core science
standards that will be developed from the 2011 framework for K-12 Science Education of-
fered by the National Academy (NRC, 2011). Unlike others in the past the new NAS frame-
work specifically highlights implications for instruction and offers a general vision of
instructional practice that emphasizes scientific practices and coherently carries core scientific
notions across disciplines and grades (NRC, 2011 p. 10-9). While the development of meas-
ures and rating schemes would require a far greater level of detail than the framework pro-
vides, the attention to instruction in the framework suggests that such guidance will be
present in the forthcoming common core science standards.
To be more relevant for instructional improvement, the dimensions should reflect a fully
articulated, widely adopted set of standards based on the new 2011 framework. As discussed
in the introduction, there is considerable overlap between this framework and the dimensions
of instruction derived from the 1996 NRC standards used in this study, so that a set of dimen-
sions of instructional practice constructed to reflect the new framework will likely bear more
than a passing resemblance to the dimensions in our measures. Nevertheless, it is likely that
new dimensions would differ in important ways from the rating dimensions used in this study.
For example, new dimensions would be needed to incorporate practice related to equity and
social issues, and quantitative analysis and summary of data, both of which are prominent in
the new framework. One or more dimensions are also needed to capture the new explicit
focus on engineering practices and problems. Some dimensions in our model would likely
also need to be revised to incorporate some of these key components of the new framework
that we expect will be reflected in common core standards. Finally, our dimensions currently
focus on pedagogy and are not anchored to specific scientific content. The 2011 framework
makes this approach more difficult in some cases because a coherent treatment of core disci-
plinary ideas and concepts across lessons, grade levels, and disciplines is at the heart of the
model. For example, we reduced redundancy in this study by eliminating focus on conceptual
understanding from the definition of Structure of Lessons and Discourse Community. This
approach would not work under the new framework; instead, the dimensions would need to
be revised to incorporate an explicit expectation for continued and cohesive treatment of
cognitively complex core ideas over time.
A closely related issue concerns the appropriate degree of overlap between the dimen-
sions in the model. While each dimension represents a distinct aspect of instructional practice,
MEASURING INSTRUCTION USING CLASSROOM ARTIFACTS 61
Journal of Research in Science Teaching
the dimensions are closely related conceptually (and empirically as demonstrated by the fac-
tor analysis results). A review of the scoring rubrics (available in the Supplementary online
appendix) further highlights the areas of overlap between some of them. For example, the
description for high scores in Grouping also hints at a constructivist-oriented pedagogy and
high levels of cognitive demand, while low scores reflect more didactic teaching. Discourse
Community emphasizes frequency and mode of communication, but also includes peer ques-
tioning and review. The overlap reflects cross cutting themes embedded in the NRC model,
but is more generally symptomatic of the conceptual difficulty entailed in disentangling the
elements of complex multidimensional constructs. It may be possible to use a smaller set of
dimensions condensed from the NSES (or other) model while still providing useful informa-
tion about instruction for specific purposes. In addition, using fewer, less overlapping dimen-
sions could also help improve rating consistency and reliability.
At the same time, the results suggest that reducing the number of dimensions can result
in substantial loss of information about unique aspects of science instruction that would not
be adequately captured by aggregate indices. Thus, improvements in reliability may come at
the cost of losing nuance and richness in the information. The Overall dimension in our rating
guidelines can be seen as an extreme example of this type of overlap, where all the conceptu-
al richness of the model and all the evidence in the notebook are condensed into a single
rating. This dimension has reasonable empirical backing in the form of a large proportion of
variance explained in a factor analysis, and in fact it exhibits better measurement properties
than some of the individual dimensions. However, it is also apparent that its usefulness for
most or all practical purposes is at least questionable—an Overall rating of 3 (medium) con-
tains little specific information of value to form an impression or a judgment about any one
teacher’s instructional practices, or the areas of relative strength or weakness.
Thus, in deciding what model to use to characterize instruction, consideration should be
given to the inferences sought and the uses intended. In general, for evaluative purposes (or
other purposes for which reliability is key) we caution against using large numbers of over-
lapping dimensions in favor of fewer, more conceptually distinct dimensions. For other pur-
poses (e.g., professional development, providing feedback to teachers) retaining more
dimensions that reflect specific aspects of science instruction will likely be desirable. This
process is closely related to the considerations about grain size discussed previously. The
2011 framework is organized around three macro dimensions (scientific practices, disciplinary
core ideas, and crosscutting concepts) each sub-divided into multiple elements (e.g., eight for
scientific practices, six for cross-cutting concepts). In principle these elements might represent
the appropriate initial grain size for measuring instruction but as noted earlier they are
themselves rich, overlapping constructs and capturing them reliable may pose a significant
measurement challenge. For example, a developer would need to decide how to handle
the substantial overlap between discursive processes captured in developing arguments from
evidence and communicating information (scientific practices 7 and 8 in the new framework).
How Many Days (or Topics) are Needed for Reliable Notebook Ratings?. Another critical
issue in developing measures of instruction involves the sampling of observations and topics.
Our studies confirm the notion that variation in teacher practice over time is an important
source of error in the measures (Shavelson et al., 1986), and suggest that five or more obser-
vations may be needed to support reliable global ratings of instructional practice in science
classrooms, with longer periods likely needed for judging some individual dimensions of
instruction. One could extend this claim to suggest that a 5-day period may also be sufficient
for notebooks to support reliable judgments of science instruction across the school year;
62 MARTINEZ ETAL.
Journal of Research in Science Teaching

however, this extrapolation requires empirical testing. For each classroom, we collected a
single notebook in a single science unit and therefore our data do not allow us to assess the
degree to which our measures can be generalized over time or to other science topics.
Additional research is needed employing designs that include collection of multiple note-
books from each teacher to allow investigation of questions related to variation in practice
over time and over topics. While the NRC model of science instruction applies in principle
across the range of contents found in middle school science curricula, one could certainly
imagine that some science units are more conducive than others to particular instructional
practices. If present, this science content specificity could call for designing portfolios to
capture instructional practice that spans multiple units of science content.
What are the Most Cost-Effective Uses of Notebooks?. An important set of considerations
in using portfolio-type measures relate to the cost of data collection and scoring. The viability
of a teacher-generated artifact-based instrument like ours for large-scale use rests not only on
the reliability and validity of the measures of instruction it may yield, but also on the cost of
collecting and scoring the evidence in the notebooks. Our experience conducting these studies
suggest that teachers spent an average of 10–12 hours compiling and annotating materials for
the notebook, and raters invested an average of 45–60 minutes scoring each notebook. More
systematic cost-effectiveness studies are needed to assess the burden that the various notebook
components place on teachers and raters, and to explore ways to streamline notebook collec-
tion and rating without negatively affecting reliability and validity. Finally, a comprehensive
cost-benefit analysis of notebooks would ideally include a systematic investigation of their
potential value as formative tools for teacher professional development.
How Should Measures of Instruction be Validated Against Student Achievement?. A final
but critical issue concerns the types of evidence that should support the validity of notebook
ratings as indicators of instructional practice in science classrooms (Jaeger, 1998). In our
studies, validity was assessed with reference to a particular model of instruction by looking at
the dimensionality of the measures, and their relationship with other instruments measuring
the same dimensions of instruction (i.e., observations). As with other measures of instruction,
however, it is also critical to consider the relationship to relevant student outcomes. The value
of a portfolio tool for measuring science instruction ultimately rests on its ability to diagnose
and improve instruction, which is conceived (implicitly or explicitly) as a mechanism for
improving student science learning. Because we were not able to collect measures of student
science learning in our studies, an important piece of the validity argument for these measures
is missing. Future studies should thus include investigation of the relationship between meas-
ures of science instruction and relevant student science learning outcomes.
Conclusion
The findings in the studies presented in this paper suggest that artifact-based instruments
like the Scoop Notebook may hold promise for supporting reliable and valid measures of
instructional practice in science classrooms. Artifact collection can be suitable for capturing
important components of science instruction that may be difficult to capture using other types
of instruments (e.g., long-term science projects, group collaborations), and components that
do not occur regularly and is thus difficult to capture through direct observation (e.g., cogni-
tive challenge of assessment, written feedback to students). Finally, artifact-based measures
or portfolios may be valuable value as tools for professional development. However, the use
of this type of instrument can also represent a considerable challenge for researchers and
MEASURING INSTRUCTION USING CLASSROOM ARTIFACTS 63
Journal of Research in Science Teaching

practitioners. Our studies point to areas in need of improvement with our current instruments,
but more generally they provide useful insight into the strengths and limitations of portfolio-
type instruments, and their potential value as part of a comprehensive model of science
assessment.
Overall, the studies highlight some of the key conceptual, methodological, and practical
issues faced in developing portfolio-type instruments anchored on a comprehensive model of
science instruction.
The authors would like to thank three anonymous reviewers and the editors for their
thoughtful comments and suggestions for improving the manuscript. We also thank
Matt Kloser at Stanford for providing valuable feedback to strengthen the final version
of this document. The work reported herein was supported under the Educational
Research and Development Centers Program, PR/Award Number R305B960002, admin-
istered by the Institute of Education Sciences (IES), U.S. Department of Education.
Notes
1A more detailed presentation and discussion of methodological approaches and results is
provided in the Supplementary online technical appendix.2Each teacher received a $200 honorarium for participating in the study.3The designs are incomplete because not all raters evaluate all notebooks. However,
because the cells in the design are missing at random we treated our design as fully crossed
for estimation purposes. Variance components were estimated using SAS Varcomp (SAS
Institute Inc., 2003) with minimum variance quadratic unbiased estimates (MIVQUE) to take
into account the imbalanced sample sizes in the design (Brennan, 2001).4Principal component analysis was first carried out in SPSS v.16 (SPSS Inc., 2007) to
investigate the hypothesis of unidimensionality; this was followed by factor analysis with
OLS extraction and oblique rotation using CEFA (Tateneni, Mels, Cudeck, & Browne, 2008).
Solutions were assessed through RMSEA and TLI fit indices alongside substantive consider-
ations. Due to the small sample sizes available, for these analyses we considered different
raters as separate data points.5Raw correlations are biased downward by unreliability of the measures. Disattenuated
correlations are shown estimating the theoretical true correlation without measurement error.6The indices of agreement are based on different samples of teachers over 2 years. While
the teacher samples were very similar across studies, and the rater pool was nearly identical,
the comparison of agreement indices offered is indirect and warrants some caution.7As with any reliability coefficient, dependability coefficients cannot be judged without
reference to a specific use and context; coefficients of 0.70 are often acceptable for research
or low-stake uses, 0.80–0.90 is typically needed for decisions about individual subjects.8Correlations involving notebooks shown come from the year 1 study. In the year 2 study,
independent notebook ratings were not obtained for each classroom.9Where resources permit, future studies will should try to obtain Gold Standard ratings
independent from notebook and observation ratings (i.e., assigned by a separate pool of
raters).
References
Antil, L. R., Jenkins, J. R., Wayne, S. K., & Vasdasy, P. F. (1998). Cooperative learning:
Prevalence, conceptualizations, and the relation between research and practice. American Educational
Research Journal, 35, 419–454.
64 MARTINEZ ETAL.
Journal of Research in Science Teaching

Ball, D. L., & Rowan, B. (2004). Introduction: Measuring instruction. The Elementary School
Journal, 105(1), 3–10.
Bell, R. L., Matkins, J. J., & Gansneder, B. M. (2011). Impacts of contextual and explicit instruc-
tion on preservice elementary teachers’ understandings of the nature of science. Journal of Research in
Science Teaching, 48, 414–436.
Blank, R. K., Porter, A., & Smithson, J. (2001). New tools for analyzing teaching, curriculum and
standards in mathematics and science: Results from survey of enacted curriculum project. Final report.
National Science Foundation/HER/REC. Washington, DC: CCSSO.
Borko, H., Stecher, B. M., Martinez, F., Kuffner, K. L., Barnes, D., Arnold, S. C., . . . Gilbert, M.
L. (2006). Using classroom artifacts to measure instructional practices in middle school science: A two-
state field test (CSE Report No. 690). Los Angeles, CA: University of California, Center for Research
on Evaluation. Standards and Student Testing.
Brennan, R. L. (2001). Generalizability theory. New York: Springer-Verlag.
Clare, L., & Aschbacher, P. R. (2001). Exploring the technical quality of using assignments and
student work as indicators of classroom practice. Educational Assessment, 7(1), 39–59.
College Board. (2009). Science College Board Standards for College Success. Available: http://
professionals.collegeboard.com/profdownload/cbscs-science-standards-2009.pdf [August 2011].
Gerard, L. F., Spitulnik, M., & Linn, M. C. (2010). Teacher use of evidence to customize inquiry
science instruction. Journal of Research in Science Teaching, 47, 1037–1063. DOI: 10.1002/tea.20367.
Glenn, J. (2000). Before it’s too late: A report to the nation from the National Commission on
Mathematics and Science teaching for the 21st Century. Washington, DC: Department of Education. As
of March 22, 2009: http://www2.ed.gov/inits/Math/glenn/index.html
Grossman, P., Loeb, S., Cohen, J., Hammerness, K., Wyckoff, J., Boyd, D., Lankford, H. (2010).
Measure for measure: The relationship between measures of instructional practice in middle school
English Language Arts and teachers’ value-added scores, NBER Working Paper No. 1601.
Hill, H. C. (2005). Content across communities: Validating measures of elementary mathematics
instruction. Educational Policy, 19(3), 447–475.
Hill, H. C., Blunk, M., Charalambous, C., Lewis, J., Phelps, G. C., Sleep, L., & Ball, D. L. (2008).
Mathematical knowledge for teaching and the mathematical quality of instruction: An exploratory study.
Cognition and Instruction, 26(4), 430–511.
Jaeger, R. M. (1998). Evaluating the Psychometric Qualities of the National Board for Professional
Teaching Standards’ Assessments: A Methodological Accounting. Journal of Personnel Evaluation in
Education, 12(2), 189–210.
Kennedy, M. M. (1999). Approximations to indicators of student outcomes. Educational Evaluation
and Policy Analysis, 21, 345–363.
Knapp, M. (1997). Between systemic reforms and the mathematics and science classroom: The
dynamics of innovation, implementation, and professional learning. Review of Educational Research,
67, 227–266.
Laguarda, K. G. (1998). Assessing the SSIs’ impacts on student achievement: An imperfect
science. Menlo Park, CA: SRI International.
Le, V., Stecher, B. M., Lockwood, J. R., Hamilton, L. S., Robyn, A., Williams, V. L., . . . Klein, S.P. (2006). Improving mathematics and science education: A longitudinal investigation of the relationship
between reform-oriented instruction and student achievement. Santa Monica, CA: RAND Corporation.
As of May 31, 2011: http://www.rand.org/pubs/monographs/2006/RAND_MG480.pdf
Lee, O., Penfield, R., & Maerten-Rivera, J. (2009). Effects of fidelity of implementation on
science achievement gains among english language learners. Journal of Research in Science Teaching,
46, 836–859.
Li, H. (2003). The resolution of some paradoxes related to Reliability and Validity. Journal of
Educational and Behavioral Statistics, 28(2), 89–95.
Luykx, A., & Lee, O. (2007). Measuring instructional congruence in elementary science class-
rooms: Pedagogical and methodological components of a theoretical framework. Journal of Research in
Science Teaching, 44, 424–447.
MEASURING INSTRUCTION USING CLASSROOM ARTIFACTS 65
Journal of Research in Science Teaching

Marder, M., Walkington, C., Abraham, L., Allen, K., Arora, P., Daniels, M., . . . Walker, M. (2010).
The UTeach Observation Protocol (UTOP) training guide (adapted for video observation ratings).
Austin, TX: UTeach Natural Sciences, University of Texas Austin.
Matsumura, L. C., Garnier, H., Pascal, J., & Valdes, R. (2002). Measuring instructional quality in
accountability systems: Classroom assignments and student achievement. Educational Assessment, 8(3),
207–229.
Matsumura, L. C., Garnier, H. E., Slater, S. C., & Boston, M. D. (2008). Toward measuring instruc-
tional interactions ‘‘at-scale.’’ Educational Assessment, 13(4), 267–300.
Mayer, D. P. (1999). Measuring instructional practice: Can policymakers trust survey data?
Educational Evaluation and Policy Analysis, 21, 29–45.
McCaffrey, D. F., Hamilton, L. S., Stecher, B. M., Klein, S. P., Bugliari, D., & Robyn, A.
(2001). Interactions among instructional practices, curriculum, and student achievement: The case
of standards-based high school mathematics. Journal for Research in Mathematics Education, 32(5),
493–517.
Moss, P. (1994). Can there be validity without reliability? Educational Researcher, 23(5), 5–12.
Moss, P. A., Sutherland, L. M., Haniford, L., Miller, R., Johnson, D., Geist, P. K., . . . Pecheone, R.L. (2004). Interrogating the generalizability of portfolio assessments of beginning teachers: A qualitative
study. Education Policy Analysis Archives, 12(32). Retrieved [June 15, 2011] from http://epaa.asu.edu/
ojs/article/view/187.
National Research Council. (2011). A Framework for K-12 Science Education: Practices,
Crosscutting Concepts, and Core Ideas. [July, 20, 2011] Available: http://www.nap.edu/catalog.
php?record_id¼13165#toc
National Research Council. (1996). National science education standards. Washington, DC:
National Academy Press.
National Research Council. (2006). Systems for state science assessment. In: M. R. Wilson & M.
W. Bertenthal (Eds.), Board on Testing and Assessment, Center for Education, Division of Behavioral
and Social Sciences and Education. Washington, DC: National Academies Press.
National Research Council. (2007). Taking science to school: Learning and teaching science in
grades K-8. Washington, DC: National Academies Press.
Pecheone R. & Chung, R. (2006). Evidence in teacher education: The performance assessment for
California teachers. Journal of Teacher Education, 57(1), 22–36.
Pianta, R. C., & Hamre, B. K. (2009). Conceptualization, measurement, and improvement of class-
room processes: Standardized observation can leverage capacity. Educational Researcher, 38, 109–119.
Pianta, R. C., Hamre, B. K., Haynes, N. J., Mintz, S. L., & Paro, K. M. (2009). Classroom
Assessment Scoring System (CLASS), secondary manual. Charlottesville, VA: University of Virginia
Center for Advanced Study of. Teaching and Learning.
Resnick, L., Matsumura, L. C., & Junker, B. (2006). Measuring reading comprehension and
mathematics instruction in urban middle schools: A pilot study of the instructional quality assessment
(CSE Report No. 681). Los Angeles, CA: University of California, National Center for Research on.
Evaluation, Standards, and Student Testing (CRESST).
Rowan, B., Camburn, E., & Correnti, R. (2004). Using teacher logs to measure the enacted curricu-
lum: a study of literacy teaching in third-grade classrooms. The Elementary School Journal, 105,
75–102.
Rowan, B., & Correnti, R. (2009). Studying reading instruction with teacher logs: Lessons from the
study of instructional improvement. Educational Researcher, 38, 120–131.
Ruiz-Primo, M. A., Li, M., & Shavelson, R. J. (2002). Looking into students’ science notebooks:
What do teachers do with them? (CSE Report No. 562). Los Angeles, CA: University of California,
National Center for Research on. Evaluation, Standards, and Student Testing (CRESST).
Ruiz-Primo, M. A., Li, M., Tsai, S. -P., & Schneider, J. (2010). Testing one premise of scientific
inquiry in science classrooms: Examining students’ scientific explanations and student learning. Journal
of Research in Science Teaching, 47, 583–608.
SAS Institute, Inc. (2002–2003). SAS 9.1 documentation. Cary, NC: SAS Institute, Inc.
66 MARTINEZ ETAL.
Journal of Research in Science Teaching

Shavelson, R. J., & Webb, N. M. (1991). Generalizability theory: A primer. Thousand Oaks, CA:
Sage Publications.
Shavelson, R. J., Webb, N. M., & Burstein, L. (1986). Measurement of teaching. In: M. Wittrock
(Ed.), Handbook of research on teaching. New York, NY: McMillan.
Silver, E., Mesa, V., Benken, B., Mairs, A., Morris, K., Star, J. R. (2002). Characterizing teaching
and assessing for understanding in middle grades mathematics: An examination of ‘‘best practice’’ port-
folio submissions to NBPTS. Paper presented at the annual meeting of the American Educational
Research Association, New Orleans, LA.
Smithson, J. L., & Porter, A. C. (1994). Measuring classroom practice: Lessons learned from the
efforts to describe the enacted curriculum—The Reform Up-Close study. Madison, WI: Consortium for
Policy Research in Education.
Spillane, J. P., & Zeuli, J. S. (1999). Reform and teaching: Exploring patterns of practice in
the context of national and state mathematics reforms. Educational Evaluation and Policy Analysis, 21,
1–27.
SPSS Inc. (2007). SPSS Base 16.0 User’s Guide. Chicago, IL.
Stecher, B. M., & Borko, H. (2002). Integrating findings from surveys and case studies: Examples
froma study of standards-based educational reform. Journal of Education Policy, 17, 547–570.
Stecher, B., Le, V., Hamilton, L., Ryan, G., Robyn, A., & Lockwood, J. R. (2003). Using structured
classroom vignettes to measure instructional practices in mathematics. Educational Evaluation and
Policy Analysis, 28(2), 101–130.
Tateneni, K., Mels, G., Cudeck, R., & Browne, M. (2008). Comprehensive Exploratory Factor
Analysis (CEFA) software version 3.02. As of May 31, 2011: http://faculty.psy.ohio-state.edu/browne/
software.php
Von Secker, C. E., & Lissitz, R. W. (1999). Estimating the impact of instructional practices on
student achievement in science. Journal of Research in Science Teaching, 36, 1110–1126.
Wilkerson, J. R., & Lang, W. S. (2003). Portfolios, the Pied Piper of teacher certification assess-
ments: Legal and psychometric issues. Education Policy Analysis Archives, 11(45), Retrieved [July 10,
2011] from http://epaa.asu.edu/ojs/article/view/273.
Windschitl, M. (2001). The diffusion and appropriation of ideas in the science classroom:
Developing a taxonomy of events occurring between groups of learners. Journal of Research in Science
Teaching, 38, 17–42.
Wolfe-Quintero, K., & Brown, J. D. (1998). Teacher portfolios. TESOL Journal 7(6), 24–27.
MEASURING INSTRUCTION USING CLASSROOM ARTIFACTS 67
Journal of Research in Science Teaching