Measurement of Women's Economic Empowerment (WEE)
37
Measurement of Women’s Economic Empowerment (WEE) Confidential- FINAL VERSION A stocktake of existing practices in measuring WEE in DFID/HMG economic development programmes Chris Hearle, Kavita Kalsi, Rebecca Calder and Naomi Clugston 23 rd January 2020
-
Upload
khangminh22 -
Category
Documents
-
view
1 -
download
0
Transcript of Measurement of Women's Economic Empowerment (WEE)

Measurement of Women’s Economic Empowerment (WEE) Confidential- FINAL VERSION
A stocktake of existing practices in measuring WEE in DFID/HMG economic development programmes
Chris Hearle, Kavita Kalsi, Rebecca Calder and Naomi Clugston
23rd January 2020

Measurement of Women’s Economic Empowerment 2
Query Questions:
What types of WEE indicators are currently being used, and to what extent, across key areas of DFID programming, and wider HMG including Prosperity Fund and WeFi?
Authors and institutional affiliations: Chris Hearle (Social Development Direct), Kavita Kalsi
(Social Development Direct), Rebecca Calder (Freelance) and Naomi Clugston (Social
Development Direct).

Measurement of Women’s Economic Empowerment 3
Acknowledgements The authors would like to thank Benedetta Musillo, Samane Azar-Pey, Grace Anyaegbu, Catherine Arnold and Helen Poulsen for kindly providing the logframes and other necessary information so that this query could be delivered. We are also grateful for their colleagues for assisting with information requests. The findings from this query were presented at DFID Whitehall on 21st November, and we are grateful for the feedback provided at this event and in written form afterwards.

Table of contents Glossary....................................................................................................................................... 5
Executive Summary ...................................................................................................................... 7
1. Introduction ....................................................................................................................... 10
2. Methodology ...................................................................................................................... 10
3. Findings and Analysis .......................................................................................................... 13
What types of WEE indicators are currently being used? ............................................................. 13
To what extent are WEE indicators being used? .......................................................................... 21
References ................................................................................................................................. 27
Annex ........................................................................................................................................ 28

Measurement of Women’s Economic Empowerment | 5
Glossary
Agency Ability to use endowments and take advantage of economic opportunities to achieve desired outcomes.
Asset Resource with economic value that an individual, corporation or country owns or controls with the expectation that it will provide a future benefit.
Business practices A method, procedure, process or rule employed or followed by a company in the pursuit of its objectives.
Capacity building Process through which individuals, organisations and societies obtain, strengthen and maintain the capabilities to set and achieve their own development objectives over time.
Enabling Environment Conditions necessary for business and entrepreneurs to operate and the conditions that facilitate international trade and private investment in a country.
Gender awareness Understanding that there are differences in the roles and relations between women and men. Recognition that life experiences, expectations and the needs of women, men and non-binary people are different.
Impact statement Shared vision that the programme contributes to.
Indicator A quantitative or qualitative factor or variable that provides a simple and reliable means to measure achievement, to reflect the changes connected to a programme or to help assess the performance of a development actor.
Logframe A project planning and oversight tool consisting of indicators and milestones for key inputs, activities, outputs, outcomes and impacts
Output The tangible and intangible products that result from programme activities
Outcome The benefits that a programme is designed to deliver.
Outcome statement Specific objective of the programme.
Sex disaggregation Data collected which is separated for men and women.
Social norms Informal rules and shared social expectations that shape individual attitudes and behaviour. Gender norms are social norms that relate specifically to gender differences.
Women’s Economic Empowerment
Women having (i) the ability to succeed and advance economically and (ii) the power to make and act on economic decisions.
Women’s economic empowerment marker
A scoring to assess to what extent a programme targets gender equality.
Women-owned business A woman owned business that is a continuing, independent, for profit business which performs a commercially useful function, and is at least fifty-one percent (51%) owned and controlled by one or more women; or, in the case of any publicly owned business, at least fifty-one percent (51%) of the stock of which is owned and controlled by one (1) or more women.
Measurement of Women’s Economic Empowerment | 6
Acronyms
DbS Disaggregated by sex
DFID Department for International Development
HMG Her Majesty’s Government
ODA Overseas Development Assistance
PF Prosperity Fund
WEE Women’s Economic Empowerment
WeFi Women Entrepreneurs Finance Initiative
WOW Work and Opportunities for Women

Measurement of Women’s Economic Empowerment | 7
Executive Summary
This Work and Opportunities for Women (WOW) Helpdesk query is a stocktake of existing practices in measuring Women’s Economic Empowerment (WEE) in DFID and HMG economic development programmes. The question that it aims to answer is: what types of WEE indicators are currently being used, and to what extent, across key areas of DFID programming, and wider HMG including Prosperity Fund and WeFi? This query will form the basis for the second WOW Helpdesk Guidance Note on WEE measurement.
A total of 119 WEE-specific and mainstream economic empowerment programmes were reviewed
using lists provided by DFID/HMG. Information on each programme was extracted from logframes
and other publicly available information and inputted into a matrix. The team then classified
programmes and indicators using the following:
• Expected domain of WEE impact were classified using the Calder (2019) WEE framework
comprised of 3 domains: (1) women’s access to economic assets, services and opportunities:
(2) enabling environment and (3) women’s voice and agency. The primary domain is the
principal area of programme focus. Some programmes had secondary and tertiary domains
and these were listed too.
• WEE outcome and output indicators were classified according to indicator type (women’s
jobs, products and services for women etc.)
• Programme focus on WEE and WEE measurement was assessed and assigned a WEE marker.
One of five possible WEE markers, was decided upon, using information found within the
logframe1.
The analysis found a marked emphasis on indicators of economic advancement/participation
compared to indicators that reflect the enabling environment and social norms change and power
to make and act on economic decisions. At the outcome level, most programmes have indicators on
women’s jobs, women’s earnings/productivity and products/services for women whereas at the
output level, most of the indicators focus on capacity building, products/services for women and
1 Level 0: an economic development programme with no mention of gender/WEE in the programme description or logframe; Level 1a: at least one output indicator is disaggregated by sex but no indicators at outcome level are disaggregated by sex and there are no WEE-specific indicators; Level 1b: at least one outcome indicator is disaggregated by sex; there may or may not be indicators at the output level that are sex disaggregated. There are no WEE-specific indicators; Level 1c: there is at least one WEE-specific indicator. There may or may not be indicators that are disaggregated by sex; Level 2: WEE is a top-level ambition of the programme as stated in the description, or impact/outcome statements. The logframe measures progress towards this ambition through gender-specific indicators and indicators are disaggregated by sex where applicable.

Measurement of Women’s Economic Empowerment | 8
business practices. When the number of indicators is taken across the whole sample reflecting
multiple indicators of the same type within one programme, research and capacity building indicators
at the output level and product/services at the outcome level become more prominent. Few
programmes sought to measure changes in the enabling environment and social norms or women’s
agency and confidence. Attempts to address economic participation, in the absence of supportive
gender policies and where the nature of work itself is undergoing substantial change, may not be
empowering (IDRC 2017). Recent shifts in the nature of work, such as increased automation and a rise
in the gig economy, may require different types of indicators rather than economic participation
alone.
The following list provides the most common indicator types at the outcome level, with a description
of the types of indicators found.
• Women’s earnings/productivity: most outcome indicators centre on income, productivity and
sales, with only one programme focusing on savings. Most output indicators captured the number
of women targeted for an increase in income.
• Women’s jobs: most indicators are on the number of jobs created for women, usually at entry
level, and the quality of jobs is rarely mentioned. Some programmes make the link between
women trained in the programme and securing employment. Only three programmes mention
the “sustainability” of jobs.
• Products and services for women: At the outcome level, indicators on access to financial services
dominate such as the number of project clients accessing credit, savings, pensions, payments and
insurance. Output level indicators also focused on access to finance.
• Business practices: Indicators were on expanded business networks and stronger network
relations between beneficiaries, supply chain linkages, and addressing of WEE within those supply
chains. Other indicators related to gendered business plans/screening products and gender
responsive information, education and communication campaigns.
• Women’s agency/confidence: Most outcome indicators focused on decision-making power at the
household level. At the output level, indicators focused on confidence in using services and ability
to make household-level decisions.
The assessment of the sampled programmes focuses on WEE and WEE measurement, found that
most programmes scored 0 and 1c. With 0 indicating the least focus on WEE and 2 the most,
• 29.4% scored 0 – no mention of gender/WEE in prog description/logframe.
• 11.8% scored 1a - at least one output indicator disaggregated by sex. But no disaggregated
outcome indicators or WEE specific indicators.
• 23.5% scored 1b, at least one outcome indicator disaggregated and possibly output indicators
disaggregated. But no WEE-specific indicators.
• 25.2% scored 1c - at least one WEE-specific indicator. Possibly disaggregated indicators at
outcome or output.
• 10.1% scored 2. WEE top-level ambition stated in description/logframe.
Programmes that are measuring women’s jobs and women’s earnings/productivity at the outcome
level tend to have lower WEE marker scores. In contrast, programmes that have outcome indicators
on women’s agency/confidence tend to have higher scores—either 1c or 2. However there are few

Measurement of Women’s Economic Empowerment | 9
programmes that aim to shift gender norms around women’s voice and agency. While women’s jobs
and earnings are easier to measure and achieve, they may play less of a role in achieving more
ambitious WEE outcomes. We find less WEE/gender sensitivity within programmes aimed primarily at
the enabling environment.
There is significant potential to better track changes in WEE that current practice is not measuring.
Economic empowerment for women is most likely to occur in a sustainable way if there are changes
within multiple domains of WEE. Programmes targeting multiple domains occur within all the WEE
Marker groupings, including programmes that have a score of 0, suggesting potential unmeasured
WEE. We judge that approximately half of the programmes that score a 0 could have included sex
disaggregated indicators, which would have raised their WEE marker score to 1a. A total of 20% of
Marker 0 programmes refer to gender in their descriptions or impact statements but do not have
WEE-specific indicators at output and outcome levels.
Within programmes that have a WEE Marker Score of 2, there are either a mixed set of indicators
(qualitative and quantitative) or solely quantitative indicators. Women’s perceptions of their own
empowerment sometimes measured. However, qualitative indicators measuring relationships
between men and women in the household and men’s attitudes and behaviour concerning women’s
economic participation, advancement and agency are largely absent. We only found two programmes
that disaggregated by a variable other than sex. We found few ambitious indicators measuring harder
areas to measure and collecting harder to get data.
Lastly, an analyse of programme budgets finds a lack of attention to WEE within mainstream and
large economic development programmes with unmeasured changes in women’s lives as a result of
programme interventions. Programmes that are have a Marker Score of 0 or are only disaggregating
by sex at the output level (Level 1a) receive the highest proportion of Overseas Development
Assistance (ODA) spending.

Measurement of Women’s Economic Empowerment |
10
1. Introduction
The purpose of this research was to undertake a stocktake of which indicators are currently being
used by DFID/HMG to assess WEE. The key question asked by this WOW Helpdesk query was: what
types of WEE indicators are currently being used, and to what extent, across key areas of DFID
programming, and wider HMG including Prosperity Fund, and WeFi? It will provide a point of
discussion for internal conversations about WEE within DFID and potentially within other HMG and
non-HMG departments. For the purposes of this research, the delivery team used the definition of
WEE currently used by DFID: women having (i) the ability to succeed and advance economically and
(ii) the power to make and act on economic decisions.
This research is intended to serve as an ‘entry point’ for the proposed WOW programme Guidance
Note No. 2 on WEE measurement. The results of this initial mapping exercise will contribute to
developing an understanding of the scope and type of guidance that would be useful for DFID/HMG
in order to improve practice in this area.
2. Methodology
The first step of the query was to compile a list of economic development programmes in low- and
middle-income countries across DFID and wider HMG. Most of these programmes were mainstream
economic development programmes but others were targeted women’s economic empowerment.
The delivery team requested DFID/HMG advisers to share lists of Economic Development programmes
for inclusion in this review. The delivery team also conducted their own search in Dev Tracker for any
obvious programmes that may have been omitted from the other lists.
The breakdown by type of key WEE and economic development programmes, according to DevTracker
and other public sources, is given below.
HMG classification of programme
No. of programmes
HMG classification of programme
No. of programmes
Agriculture/ land rights 19 Industrial development and policy
6
Business Policy and Administration
18 Infrastructure 5
SME development 12 Research 5
Financial sector 12 Multiple 4
Trade 11 Urban development 3
Social protection 9 Other 8
Technical and Vocational Education and Training
7
Measurement of Women’s Economic Empowerment |
11
There were a small minority of these programmes that did not have a focus on economic development
either in the description or in the impact or outcome statements and therefore these were deleted
from the list. There were also many duplicates i.e. the same programme within different lists. The
total list of programmes for the stocktake was 119, including 94 from DFID, 24 from Prosperity Fund
and 1 from WeFi. A total of 23 programmes are centrally managed, 12 are from regional offices and
84 are managed by country offices.2
Following the compilation of this list of programmes, a data-gathering exercise took place. This
included the identification of impact statements, outcome statements, WEE-related outcome/output
indicators, and other relevant information including sector, budgets, targeted countries and
timelines.3 This information was collated through the examination of each programme logframe,
publicly available information and information provided to the delivery team in emails. Most
information, including logframes, was found on DevTracker but in cases where it was not available it
was requested from DFID and PF. Due to limited resources, a large sample of programmes, and
overstretched DFID/HMG staff, we did not request meetings with advisers to understand their
programmes more fully.
Once this information was assembled, the delivery team made several classifications according to
the Calder (2019) WEE framework (see Figure 1). As IDRC (2017 p. 3) states, “it is crucial that
empowerment initiatives and those assessing them, adopt clear conceptual frameworks based on
context-specific definitions of economic empowerment and related measures of progress. This is
important for research design as it is for policy” (IDRC 2017 p. 3). It was not possible for us to assess
context-specific empowerment frameworks for such a large sample; however we chose a broad
framework that can be applied to different contexts (see Calder 2019).4 The three domains are:
• Women’s access to economic assets, services and opportunities—access to and control over
financial, physical and knowledge-based assets, services and opportunities, including access
to employment and income generation activities.
• Enabling environment—policies, laws, legislation, rules and regulations at the market and
state level, and norms – exercised primarily at the household/family and community levels
but also present in formal institutions – that mediate women’s access to and control over
economic assets within their household, community and local economy.
• Women’s voice and agency—the individual capabilities, sense of entitlement, self-esteem and
self-belief to make economic decisions, and the ability to organise with others to enhance
economic activity and rights.
2 This assumes that global programmes are centrally managed, and any programme focusing at the regional level would be managed at the regional level, and any programme focusing on a country would be a managed by a DFID/HMG country office. 3 The delivery team felt that most of the outcome and output indicators were pitched at the right level. However for some programmes, we felt that output indicators would be better classified as outcome and vice versa. However since this was a stocktake of existing practice within DFID/HMG, rather than an exercise to improve the accuracy of indicators, we did not attempt to re-classify any indicators. Classification of indicators by outcome and output was carried out since WEE does not happen and cannot be “tracked” unless change is captured at both levels. 4 This framework has drawn upon 11 general empowerment frameworks and two women’s economic empowerment frameworks (ODI and UNHLP). It was applied Women’s Economic Empowerment Landscaping in East Africa, undertaken by KoreGlobal, Inc. and The Global Centre for Gender Equality at Stanford University, and was supported by a grant from the Bill and Melinda Gates Foundation.

Measurement of Women’s Economic Empowerment |
12
This framework was used to determine the primary, secondary and tertiary domains. The primary
domain was the main focus of the programme and some programmes had secondary and tertiary
domains as well.
Figure 1: WEE Conceptual framework used for domain classification
Source: Calder (2019)
The Calder (2019) framework is used since it allows an exploration of why and how change has
occurred and is explicit about the systematic and structural changes needed for empowerment. For
example, it enables an assessment of whether women have gained ability from increased access to
certain assets or whether it was more to do with policy change or normative change. In addition, the
Calder framework provides a balance of women having ability/women having power, and the gender
discriminatory institutions/rules of the game. It is for these reasons that used rather than the DFID
definition of WEE, which is provided in the glossary.
In addition, the WEE outcome and output indicators were classified according to type. Classification
of the indicators was general enough to be applied to both output and outcome indicators. A
deductive approach was taken, allowing the data to inform the categories we chose rather assigning
to a pre-determined list (e.g. based on the United Nations High Level Panel drivers of WEE) which may
or may not fit the indicators found. A few indicators crosscut different indicator types and therefore
were included under both. For example, “the number of individuals reporting an increase in
knowledge and skills from services/activities implemented as part of market interventions” would be
classified under “capacity building” and “products/services for women”.
There was also programme classification according to a WEE marker score, based on the focus of
the programme and WEE measurement. The delivery team defined the categories, according to
Enabling environment
Assets, services and
opportunities
Women’s voice and agency

Measurement of Women’s Economic Empowerment |
13
information that could be found in the programme logframe, with Level 0 indicating the least focus
on WEE and 2 the most:
• Level 0: an economic development programme with no mention of gender/WEE in the
programme description or logframe.
• Level 1a: at least one output indicator is disaggregated by sex but no indicators at outcome
level are disaggregated by sex and there are no WEE-specific indicators.
• Level 1b: at least one outcome indicator is disaggregated by sex; there may or may not be
indicators at the output level that are sex disaggregated. There are no WEE-specific indicators.
• Level 1c: there is at least one WEE-specific indicator. There may or may not be indicators that
are disaggregated by sex.
• Level 2: WEE is a top-level ambition of the programme as stated in the description, or
impact/outcome statements. The logframe measures progress towards this ambition through
gender-specific indicators and indicators are disaggregated by sex where applicable.
Analysis of WEE indicators does not consider unintended consequences on women. WEE
interventions that intend to empower women may have unintended consequences which negatively
(or positively) impact them. Programmes should determine these unintended consequences via
ongoing monitoring and evaluation, then add indicators to capture them with a view to adapting
programmes accordingly. It is not within the remit of this report to explore these unintended
consequences since the delivery team has not considered programme monitoring and evaluation data
in their analysis.
On completion of the mapping exercise, the delivery team analysed programmes making a
distinction between WEE outcome and output indicators and comparing these against other
variables in the table. The authors provide a balanced analysis of outcome and output indicators,
since together both are necessary to tell a coherent story of change: outcome indicators are important
since they measure actual results and output indicators are crucial as they measure what the
programme delivered to obtain the results, which is critical for scaling and replicating. WEE does not
happen and cannot be tracked unless change is captured at both levels. The findings from this analysis
are displayed in a variety of charts and graphs within this report.
As it is the broader trends which are of greater interest, names of individual programmes have been
omitted from this report. As a result, we have not generated specific programme case studies.
However, the mapping spreadsheet attached to this report lists each individual programme included
in the stocktake and can be referred to for programme-specific information. The mapping spreadsheet
should be kept confidential.
3. Findings and Analysis
What types of WEE indicators are currently being used?
At the outcome level, most programmes have indicators on women’s jobs, women’s
earnings/productivity and products/services for women whereas at the output level, most of the

Measurement of Women’s Economic Empowerment |
14
indicators focus on capacity building, products/services for women and business practices.5
However, the stocktake identified a wider range of indicators that are used to measure women’s
economic empowerment across a diverse range of programmes and contexts within which DFID/HMG
works, including those that measure changes in the legal and policy environment, and those that
measure changes in women’s confidence and agency.
Figure 2 below displays the frequency of programmes that have one or more indicators on a certain
theme.
Figure 2: Frequency of programmes that contain WEE outcome and output indicators
There is a marked emphasis on indicators of economic advancement/participation such as women’s
earnings/productivity, creation of women’s jobs and products/services for women, compared to
indicators that reflect social norms change and power to make and act on economic decisions. This
is despite DFID’s concern not only with women’s ability to succeed and advance economically but also
with the power to make and act on economic decisions. Far fewer programmes sought to measure
changes in social norms or women’s agency and confidence, for example. Similarly, there was an
emphasis on quantitative indicators over qualitative; for example, few indicators sought to measure
changes in men’s and women’s perceptions of how their lives had changed as a result of project
interventions related to economic development.
We find only four programmes (3 DFID and 1 PF) targeting government policy at the outcome level,
signalling a lack of efforts to understand or increase the gender inclusivity of government policy.
5 Outcomes are short-term changes, benefits, learning or other effects that result from what a project or organisation does. These short-term steps will contribute to a final goal and may include changes in users’ knowledge, skills, attitudes, and behaviour. A useful way to think about intermediate outcomes is the outcomes achieved after the project—what service users take away from it. Outputs are products, services or facilities that result from an organisation or project’s activities. These are often expressed quantitatively; for example, number of users, how many sessions they receive and the amount of contact they had with a project.
0 5 10 15 20 25 30
Women's earnings/productivity
Women's jobs
Business practices
Govt policy
Legal
Products/services for women
Social norms
Capacity building
Investment in women's business
Research
Women's agency/confidence
Gender awareness
Other
Number of programmes with indicator type
Ind
icat
or
typ
e
Output Outcome

Measurement of Women’s Economic Empowerment |
15
Attempts to address economic participation, in the absence of supportive gender policies and where
the nature of work itself is undergoing substantial change, may not be empowering (IDRC 2017). For
example, the rise in automation has the potential to displace women from formal employment
(McKinsey 2019 in Hearle et al. 2019). Long established barriers will make it harder for women to make
these transitions than men. The gig economy is expanding globally and exponential growth is forecast
in female-dominated sectors such as on-demand household services (Hunt et al. 2019). Yet gig workers
face significant financial insecurity (Hunt et al. 2019). Indicators on women’s jobs in the annex suggest
often do not state the creation of “decent” or “better” jobs—a significant omission since not all jobs
are empowering. Recent shifts in the nature of work may require different types of indicators rather
than economic participation alone.
Women’s perceptions of their own empowerment are sometimes measured; however, indicators
measuring changes to relationships between men and women in the household, and men’s
attitudes and behaviour concerning women’s economic participation, advancement and agency are
largely absent. This is particularly evident among the women’s agency/confidence indicators where
you would expect these aspects to be reflected. Typical indicators within the women’s
agency/confidence category are “percentage of women who report increased decision-making power
in the household/firm” and “percentage of women who report increased confidence in using digital
financial services”. An exception to this finding is some of the social protection programmes which
assess men and women’s views about decisions related to cash transfer expenditure. Progress
towards WEE is difficult to assess unless the views of men are considered (Taylor and Pereznieto 2014).
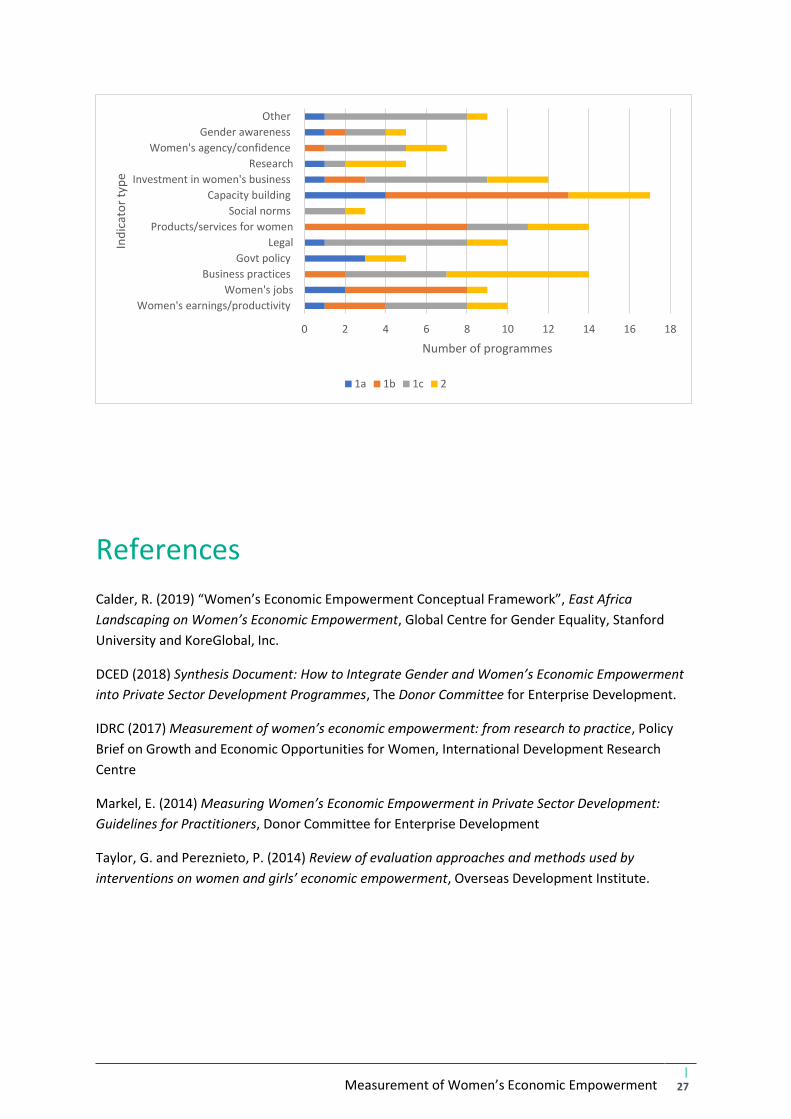
When the number of indicators is taken across the whole sample, in comparison to Figure 2,
research and capacity building indicators at the output level and product/services at the outcome
level become more prominent. When compared with Figure 2,
Figure 3 illustrates how these types of programmes have numerous indicators of the same type. This
includes projects targeting women’s access to finance, as well as research programmes which have
separate indicators on (a) research products produced and (b) research products disseminated, and
capacity building which has different indicators for (a) participation in training courses; (b) skills gained
through training; and (c) application of those skills.
Figure 3, therefore, shows an even greater focus on economic advancement indicators.

Measurement of Women’s Economic Empowerment |
16
Figure 3: Number of indicators across the whole sample
Annex A lists the indicators within each classification. A synopsis of findings from this annex can be
found in Table 1 below, which we have listed in order from highest frequency of outcome indicators
to lowest frequency. At a minimum, all the indicators viewed disaggregate by sex, but some are
specific to WEE.
0 10 20 30 40 50 60
Women's earnings/productivity
Women's jobs
Business practices
Government policy
Legal, including land ownership
Products/services for women
Social norms
Capacity building/skills
Investment in women's business
Research and data
Women's agency and confidence
Gender awareness
Other
Number of indicators in sample
Ind
icat
or
typ
e
Output Outcome
Measurement of Women’s Economic Empowerment |
17
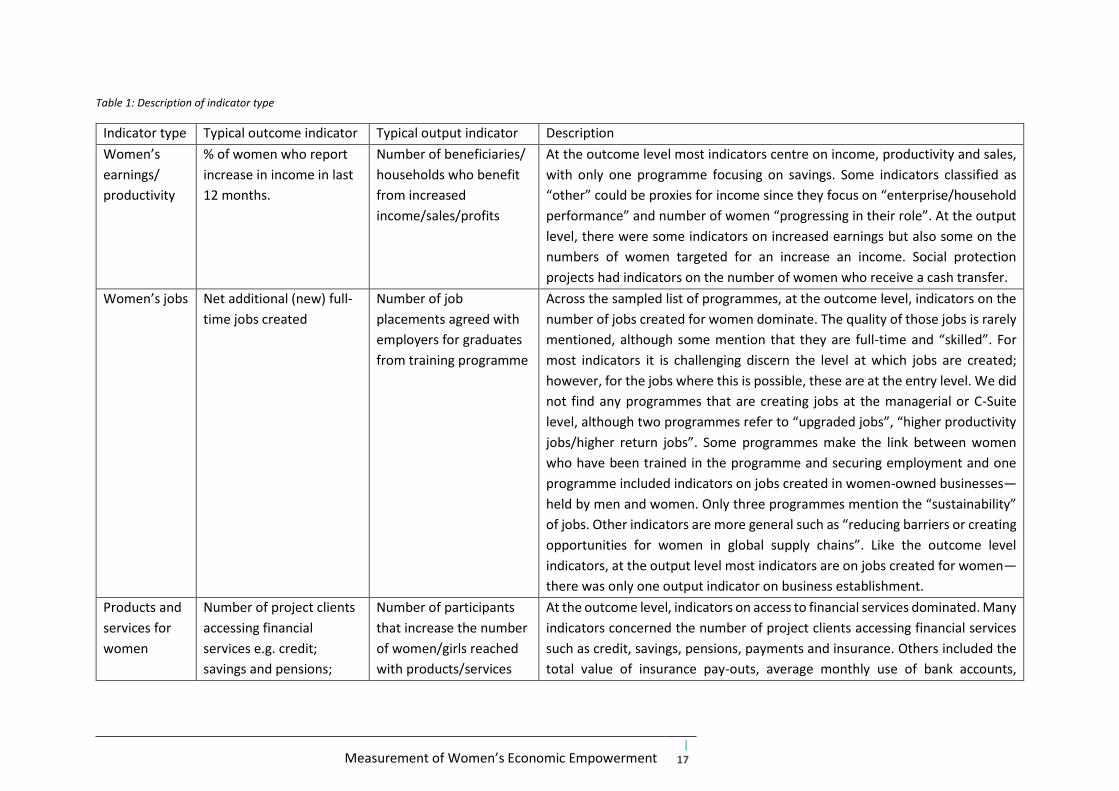
Table 1: Description of indicator type
Indicator type Typical outcome indicator Typical output indicator Description
Women’s
earnings/
productivity
% of women who report
increase in income in last
12 months.
Number of beneficiaries/
households who benefit
from increased
income/sales/profits
At the outcome level most indicators centre on income, productivity and sales,
with only one programme focusing on savings. Some indicators classified as
“other” could be proxies for income since they focus on “enterprise/household
performance” and number of women “progressing in their role”. At the output
level, there were some indicators on increased earnings but also some on the
numbers of women targeted for an increase an income. Social protection
projects had indicators on the number of women who receive a cash transfer.
Women’s jobs Net additional (new) full-
time jobs created
Number of job
placements agreed with
employers for graduates
from training programme
Across the sampled list of programmes, at the outcome level, indicators on the
number of jobs created for women dominate. The quality of those jobs is rarely
mentioned, although some mention that they are full-time and “skilled”. For
most indicators it is challenging discern the level at which jobs are created;
however, for the jobs where this is possible, these are at the entry level. We did
not find any programmes that are creating jobs at the managerial or C-Suite
level, although two programmes refer to “upgraded jobs”, “higher productivity
jobs/higher return jobs”. Some programmes make the link between women
who have been trained in the programme and securing employment and one
programme included indicators on jobs created in women-owned businesses—
held by men and women. Only three programmes mention the “sustainability”
of jobs. Other indicators are more general such as “reducing barriers or creating
opportunities for women in global supply chains”. Like the outcome level
indicators, at the output level most indicators are on jobs created for women—
there was only one output indicator on business establishment.
Products and
services for
women
Number of project clients
accessing financial
services e.g. credit;
savings and pensions;
Number of participants
that increase the number
of women/girls reached
with products/services
At the outcome level, indicators on access to financial services dominated. Many
indicators concerned the number of project clients accessing financial services
such as credit, savings, pensions, payments and insurance. Others included the
total value of insurance pay-outs, average monthly use of bank accounts,

Measurement of Women’s Economic Empowerment |
18
payments; and insurance
(that consider
differentiated gender
needs).
number of accounts and percentage increase in formal sector lending to women
entrepreneurs/woman-led Small-to-Medium-sized Enterprises (SMEs). Two
indicators mentioned technology-enabled financial services. At the output level
indicators on access to financial services dominated and there were ten
indicators focused on women’s and girls’ access to services and products.
Programmes targeting businesses included indicators on the number of
enterprises that increase the number of women/girls reached with
products/services, while those intervening at the beneficiary level had
indicators on the numbers who report increased access to services or products.
A significant proportion of output indicators focused on increased
awareness/knowledge due to acquisition of new information.
Business
practices
Improved capacity for
data management across
company registries and
availability of data on
women’s
entrepreneurship through
greater standardization
and systems to conduct
data analytics
Number of supported
businesses agreeing high
quality and gendered
business plans/screening
products etc.
Across outcome and output levels, indicators centred on changes in practices
such as expanded business networks and stronger network relations between
beneficiaries, supply chain linkages, and addressing of WEE within those supply
chains through, for example, undertaking gender value chain mapping to collect
sex-disaggregated data on workers at different value chain tiers. Other
indicators related to gendered business plans/screening products and gender
responsive information, education and communication campaigns. Four
indicators focused on perceptions of changes to business practices regarding
women’s participation in markets; two of these four related specifically to
women-owned businesses.
Women’s
agency/
confidence
% of women who report
increased decision-making
power in the
household/firm
% of women who report
increased confidence in
using digital financial
services
Most outcome indicators focused on decision-making power at the household
level, but one focused on voice and choice in the labour market and another
focused on independence from husbands while outside of the home. At the
output level, indicators focused on confidence in using services and ability to
make household-level decisions—either alone or jointly between husbands and
wives.
Capacity
building
Number of poor women
with an increase in skills
Number of
staff/farmers/enterprise
Most of the indicators on capacity building were at the output level where there
are a total of 31 indicators either on number of beneficiaries trained, number of

Measurement of Women’s Economic Empowerment |
19
as a result of programme
activities
owners receiving training
on X
training programmes conducted or number of training modules on gender and
inclusion. A total of 9 indicators focused on skills learned during the training,
either measured using trainee perceptions of skills learned, or trainee test
scores. Fewer indicators focused on the application of skills in the workplace
and the links between trainees and employers. One indicator measured the
proportion of gendered capacity building plans completed and another on
whether it was implemented according to schedule. At the outcome level,
indicators measured the result of capacity building outputs, which included
actual indicators of capacity improvements.
Government
policy
Number of changes to
formal policy that
addresses market
constraints for poor
women
Number of govt officials
trained to integrate
gender and inclusion
priorities
At the outcome level most policy indicators focused on the incorporation of
programme recommendations within policy. However, there was one indicator
on the “number of stakeholders that have “the potential” to take-up or
champion programme learning or approaches”. At the output level, policy-
focused indicators were largely concerned with training government officials to
integrate gender and inclusion priorities and changes to policy as a result of
programme activities e.g. “number of agreed governance models with gender
considerations developed in supported departments”.
Legal Number of men and
women with improved
land tenure security
Number of target
population with use or
ownership rights
recorded in a manner
recognised by national/
customary law
Many of the legal indicators focused on land ownership, both at the outcome
and output level; most of these were drawn from programmes listed in the
commercial agricultural portfolio mapping exercise. Other indicators focused on
legal, regulatory or procedural reforms that address market constraints for
women, including supporting women’s entrepreneurship.
Investment in
women’s
business
Number of programme
participants securing
external investment
Value of
investments/investment
plans made by firms
At the outcome level these indicators centred on either the number of
programme participants securing external investment, or the amount of
investment secured. At the output level, indicators focused on the amount of
money invested by programme supported institutions, numbers of people
trained in investment, number of training participants who have improved their
investment readiness, and number of investment applications received.

Measurement of Women’s Economic Empowerment |
20
Research and
data
Number of companies
that pilot research
guidelines/toolkits to
undertake a gender value
chain mapping to collect
gender-disaggregated
data on workers at
different value chain tiers,
identify data and
information gaps and
address issues related to
women’s work and roles.
Number of companies
adopting research
methodology developed
by the programme to
collect and report
gender-disaggregated
data
There was only one indicator at the outcome level which focused on the
collection of sex-disaggregated data and “addressing issues related to women’s
work and roles”. At the output level there were 6 indicators on the collection
and reporting of sex-disaggregated data, gender specific indicators and
frameworks; 5 indicators on WEE/gender research produced; and 6 indicators
on research products disseminated to “targeted stakeholders” including
community members and industry actors. One programme had an output
indicator on the proportion of women among the contracted external
researchers that come from developing countries.
Gender
awareness
% of
beneficiaries/companies
who report improved
gender awareness and/or
inclusivity
Number of staff receiving
gender awareness
training
11 output indicators were related to training on gender relations—either
numbers trained, or number of training sessions. At the outcome level there
were two indicators on reported awareness of gender issues and the
importance of inclusion.
Social norms Evidence of system-level
changes in social norms
that positively effect
women’s participation in
focus markets
Level of perception
among target
beneficiaries on changes
in household and
business attitudes
regarding women’s
participation in markets
The two indicators focused on changes in social norms regarding women’s
participation in markets. The outcome level indicator was “evidence of system-
level changes in social norms that positively effect women’s participation in
focus markets” and the output level indicator was “level of perception among
target beneficiaries on changes in household and business attitudes regarding
women’s participation in markets.”

Measurement of Women’s Economic Empowerment |
21
To what extent are WEE indicators being used?
The most common WEE marker of programmes sampled is 0: a total of 29.4% of programmes scored 0, 11.8% scored 1a, 23.5% scored 1b, 25.2% scored 1c and 10.1% scored 2.
Table 2 shows that there is a wide spectrum of programmes from those with a Marker of 0 to those
with a Marker of 2. According to DCED (2018) if programmes decide to use an individual unit of analysis
for beneficiary-focused indicators, then sex-disaggregated indicators should always be required. In
some occasions it may not make sense to have gender-specific indicators for programmes operating
at the more macro-level. Prosperity Fund programmes tend to operate at this more macro-scale,
focusing on the enabling environment. The overwhelming majority (87.5%) of these programmes are
focused on shifting the enabling environment, compared to 48.4% of DFID programmes. A total of
45.8% of Prosperity Fund programmes scored 0 for the WEE marker score, in comparison to 25.2% of
DFID programmes.
There is significant potential to better track changes in WEE that current practice is not measuring.
The delivery team analysed the programmes at Level 0 to determine whether they could have included
WEE-related indicators. It found that 49 percent of them (n=17) could have at least included indicators
that required sex disaggregation, which would have raised their WEE marker score to 1a. A total of
20% (n=7) of Marker 0 programmes refer to gender in their descriptions or impact statements but do
not have WEE-specific indicators at output and outcome levels. These references to gender are largely
WEE-related but sometimes refer to other aspects of gender equality. This suggests an intention to
tackle gender inequality at programme design stage which did not translate into output/outcome level
measurement, thereby making it impossible to measure the programme’s actual gender
repercussions. Of these seven programmes, six are in the enabling environment domain.

Measurement of Women’s Economic Empowerment |
22
Table 2: Primary domain according to assigned WEE marker
Primary domain TOTAL
Assets, services
and opportunities
Enabling
environment
Voice and
agency
WEE
marker
0 5 30 (11) 0 35 (11)
1a 7 7 (3) 0 14 (3)
1b 18 10 (2) 0 28 (2)
1c 15 (3) 15 (4) 0 30 (7)
2 6 5 (1) 1 12 (1)
TOTAL 51 (3) 67 (21) 1 119 (24)
Key: red numbers in brackets denote PF programmes
We find less WEE/gender sensitivity within programmes aimed primarily at the enabling environment, and few programmes that aim to shift gender norms around voice and agency.
Table 2 also compares the primary domain of the programme with the WEE marker. It suggests that
for programmes that have the primary domain of enabling environment, nearly half have a Marker
Score of 0. Of the programmes that do have WEE-relevant indicators, most focus on formal institutions
rather than informal institutions and norms, and there is minimal focus on workplace protection and
workplace equality for women. For programmes with the primary domain of assets, services and
opportunities, nearly two thirds are classified as 1b or 1c. A stand-out finding from the table is that
only one programme has its primary aim to increase the voice and agency of women which suggests
a much weaker focus across DFID/HMG on the power to make and act on economic decisions.
Programmes targeting multiple domains occur within all WEE marker groupings, including
programmes that have a score of 0 suggesting potential unmeasured WEE. Economic empowerment
for women is most likely to occur in a sustainable way if there are changes within multiple domains of
WEE. Figure 4 displays the WEE marker for all programmes that are targeting more than one domain.
Unsurprisingly, Marker 2 programmes had the most programmes targeting multiple domains, but this
was still only 50 percent of the Marker 2 programmes. It may be that the single domain-focused Level

Measurement of Women’s Economic Empowerment |
23
2 programmes not represented in Figure 4 below are complementing the efforts of other programmes
that focus on different domains. More surprising is that nearly 15 percent of programmes scoring 0
for the WEE marker that are targeting multiple domains. This includes a Prosperity Fund programme
that aims at driving “inclusive economic growth” and supporting “gender equality and WEE”. Another
example is a programme that has “to increase incomes and create employment, especially for
women” within its impact statement. This suggests that the potential for WEE is evident and yet there
is no way of measuring this progress since indicators are not disaggregated by sex and there are no
gender specific indicators.
Figure 4: % of programmes that address more than one domain within each WEE marker
Note: we insert “N” to indicate the number of programmes.
Figure 5 illustrates that, within the Marker 2 programmes, there are either a mixed set of indicators
(qualitative and quantitative) or solely quantitative indicators. The complex and non-linear process
of empowerment means that qualitative indicators are particularly important for understanding
relevant proxies such as decision-making influence, respect, mobility and self-confidence (Markel
2014, DCED 2018).
We also find there was a lack of more ambitious indicators within these Marker 2 programmes.
Ambitious indicators may be those measuring harder areas to measure, harder to get data, harder to
get programmes to measure impact or it is challenging to attribute results. For example, only one
programme had an indicator on unpaid care, none on time use, none on mobility and only one on
shifting social norms at the household and enterprise levels that enable women to access paid work.
0
10
20
30
40
50
60
0 (N=5) 1a (N=3) 1b (N=5) 1c (N=7) 2 (N=6)
% t
hat
tar
get
mo
re t
han
on
e d
om
ain
Adapted OCED Gender Policy marker

Measurement of Women’s Economic Empowerment |
24
Figure 5: Type of indicator in programmes ranked as 2 in WEE marker
In addition, within these Marker 2 programmes, we only found two programmes that disaggregated
by a variable other than sex. We would expect that there would be disaggregation beyond sex to
variables such as age, ethnicity, head of household, disability, employment status or other variables
that intersect with gender. One programme had an indicator at the outcome level and one programme
that had an indicator at the output level that disaggregated by marital status and age, respectively.
Taylor and Pereznieto (2014) also find that few WEE programmes disaggregate by other aspects of
identity. Disaggregating beyond sex is important as different sub-groups of men and women have
different needs, different responses to development interventions, and different experiences of
empowerment. For example, a female unpaid family labourer will typically have a different pathway
to empowerment than a female wage worker, and progress needs to be measured using different
metrics. DCED (2018) recommends that more programmes should disaggregate data by life course
stages to understand, for example, how adolescent girls or women of childbearing age may be affected
differently by an intervention.
We find a lack of priority to WEE within mainstream and large economic development programmes
and how changes in women’s lives as a result of programme interventions are not being measured.
Figure 6 shows the total budget for programmes of different WEE marker classifications. Programmes
that have a Marker of 0 or are only disaggregating by sex at the output level (Level 1a) receive the
0
1
2
3
4
5
6
7
Mixed Qualitative Quantiative None
Nu
mb
er o
f p
rogr
amm
es
Type of WEE indicators
Outcome Output

Measurement of Women’s Economic Empowerment |
25
highest proportion of ODA spending. The total budgets for Level 0 and Level 1c would significantly
increase if the budgets from the Prosperity Fund programmes are included in this chart.
Figure 6: Total budget for programmes with various WEE marker classifications
Note: We were not able to access information about budgets from Prosperity Fund programmes, and therefore this data
has been omitted from this chart.
Programmes that are measuring women’s jobs and women’s earnings/productivity at the outcome level tend to have lower WEE marker scores. In contrast, programmes that have outcome indicators on women’s agency/confidence tend to have higher scores—either 1c or 2 (see
Figure 7 below). At the output level, programmes that tend to have higher WEE marker scores are
those that have indicators on business practices, legal reform, women’s agency/confidence and
investment in women’s business. Programmes with lower scores have indicators on capacity building,
products/services for women and women’s jobs (see Figure 8). It could be that if time and resources
are dedicated to thinking how WEE occurs at the design stage then there are strategies to include
issues that are more difficult to gain traction on and measure such as agency or institutional
constraints and barriers such as business practices, legal reform and investment. While indicators on
women’s earnings, creation of women’s jobs, capacity building and products/services to women may
be easier to measure and achieve, they play less of a role in striving for transformative outcomes for
WEE.
0
10000000
20000000
30000000
40000000
50000000
60000000
70000000
80000000
90000000
0 (N=35) 1a (N=14) 1b (N=28) 1c (N=30) 2 (N=12)
Tota
l bu
dge
t (£
)
WEE marker

Measurement of Women’s Economic Empowerment |
26
Figure 7: Outcome indicators according to WEE marker
Note: there was no 1a scores as by definition, any programmes that have WEE-relevant indicators at the outcome level
would not score 0 or 1a for the WEE marker.
Figure 8: Output indicators according to WEE marker
Measurement of Women’s Economic Empowerment |
27
References
Calder, R. (2019) “Women’s Economic Empowerment Conceptual Framework”, East Africa
Landscaping on Women’s Economic Empowerment, Global Centre for Gender Equality, Stanford
University and KoreGlobal, Inc.
DCED (2018) Synthesis Document: How to Integrate Gender and Women’s Economic Empowerment
into Private Sector Development Programmes, The Donor Committee for Enterprise Development.
IDRC (2017) Measurement of women’s economic empowerment: from research to practice, Policy
Brief on Growth and Economic Opportunities for Women, International Development Research
Centre
Markel, E. (2014) Measuring Women’s Economic Empowerment in Private Sector Development:
Guidelines for Practitioners, Donor Committee for Enterprise Development
Taylor, G. and Pereznieto, P. (2014) Review of evaluation approaches and methods used by
interventions on women and girls’ economic empowerment, Overseas Development Institute.
0 2 4 6 8 10 12 14 16 18
Women's earnings/productivity
Women's jobs
Business practices
Govt policy
Legal
Products/services for women
Social norms
Capacity building
Investment in women's business
Research
Women's agency/confidence
Gender awareness
Other
Number of programmes
Ind
icat
or
typ
e
1a 1b 1c 2

Measurement of Women’s Economic Empowerment |
28
Annex
Women’s earnings/productivity
Theme Indicator Frequency of indicator use
OUTCOME
Income • % of women who report increase in income in last 12 months.
• Net additional income for small scale producers/entrepreneurs.
• Cumulative number of people having additional income through getting jobs or upgrading jobs.
• % change in earnings
8
Productivity • Number of women who experience increase in productivity/ crop yields/higher return jobs and/or more diversified roles.
• Annual % increase in crop yields of targeted farmers
7
Sales • Number of farmers/entrepreneurs/firms who experience higher sales and higher turnover.
• Number of farmers selling products
6
Savings • Number of beneficiaries with increase in savings or investment of remittances
1
Changes in existing roles
• Number of people who report substantial increase in “enterprise/household performance”
• Number of women showing a “progression in their role”
2
OUTPUT

Measurement of Women’s Economic Empowerment |
29
Increased earnings (or proxies of)
• Number of beneficiaries/households who benefit from increased income/sales/profits
• % of interventions that provide poor women more beneficial roles
4
Numbers targeted
• Number of farmers/entrepreneurs supported to cope with the effects of climate change
• Number of women using warehouse receipting to increase incomes
• Number of clients reached to raise agricultural productivity
3
Cash transfers to women
• Number of women directly receiving regular cash payments
• % active beneficiaries receiving correct transfer amounts
2
Women’s jobs
Theme Indicator Frequency of indicator use
OUTCOME
Job creation • Net additional (new) full-time jobs created
• Cumulative number of people having additional income through getting jobs
• Number of jobs created in women-owned businesses number of jobs created in women-owned businesses that are held by women.
• Number of trained beneficiaries in gainful/skilled employment.
• Number of individuals engaged in productive activity
• Total employment in selected industries
• # of individuals who transition to full-time, seasonal and short-term employment, internships or apprenticeships.
• Number of indirect jobs supported
• Annual growth rate of jobs created
21
Job sustainability
• Net additional full-time jobs sustained
• Number of jobs safeguarded
3
Other • Number of companies/business initiatives that reduce barriers or create opportunities for women in global supply chains
• Number of programmes reporting plans for improved design to reach higher number of women beneficiaries
2
OUTPUT
Job creation • Net additional jobs created in enterprises supported by the programme
• Number of jobs sustained to date through exited and active investments
• Number of beneficiaries placed in employment
• Number of job placements agreed with employers for graduates from training programme
11

Measurement of Women’s Economic Empowerment |
30
• Number of households receiving regular wage payments from public works.
• % of households receiving a cash transfer who report that the programme has enabled them to access employment
• Number of direct jobs created by women-owned/led SMEs
• Number of days’ work for beneficiaries on programme activities
Business establishment
• % of budget spent to support disabled and widows to establish commercial enterprises
1
Business practices
Theme Indicator Frequency of indicator use
OUTCOME
Data • Number of companies that undertake a gender value chain mapping to collect gender-disaggregated data on workers at different value chain tiers.
• Improved capacity for data management across company registries and availability of data on women’s entrepreneurship through greater standardization and systems to conduct data analytics
• Implementation of gender indicators in the investors tracking system
3
Other • Number of farmers/entrepreneurs that make changes in their farming or business practices
• Number of private sector partners adopting new business practices with the objective of creating opportunities for women in trade.
• Number of private sector actors who have improved their own investment and supply chain management practices.
3
OUTPUT
Changes to business practices
• Number of actors adopting and/or adapting programme supported practices
• Evidence of expanded business networks and relationships between beneficiaries
• Number of business linkages facilitated between small-scale producers/entrepreneurs and input suppliers and/or buyers.
• Number of companies/initiatives implementing agreed activities to address issues related to WEE in targeted supply chains
• Number of supported businesses agreeing high quality and gendered business plans/screening products etc.
• Ongoing gender responsive information, education and outreach campaign developed and implemented.
• Number of finance institutions reporting the integration of gender in their existing policies
11
Measurement of Women’s Economic Empowerment |
31
• Proportion of households adopting climate smart agricultural production technologies
Perceptions of changes to business practices
• Level of perception amongst target beneficiaries on whether the new practices of market actors have a positive change for them
• Level of perception amongst target beneficiaries on changes in household and business attitudes regarding women’s participation in markets
• Number of women-owned businesses reporting changes in their business practices
• % of women-owned businesses supported reporting productive engagement with the private sector
4
Changes to business models to target women/girls
• Number of participants that refine their business model to meet the needs of target girls
• Number of grants that have demonstrated practical pro-poor innovations in explicitly targeting the engagement of women/girls.
2
Government policy
Theme Indicator Frequency of indicator use
OUTCOME
Policy design • Number of changes to formal policy that addresses market constraints for poor women
• Number of national and regional programmes and policy instruments that take on board programme recommendations.
• Number of programme proposals included in next departmental investment plans
3
Policy implementation
• Number of assistant governments implementing measures to support inclusive trade
1
Other • Number of stakeholders that have the potential to take-up for champion programme learning or approaches
1
OUTPUT
Number of govt participants engaged
• Number of govt officials trained to integrate gender and inclusion priorities
• Number of training sessions and/or modules dedicated to gender issues
• Number of govt stakeholders who participate in dialogue events about programme approaches and vision
5
Changes to policy
• Number of national competitiveness/sector specific action plans/innovation plans developed
• Number of gender-sensitive public policies and practices demonstrating impact from training provided
5

Measurement of Women’s Economic Empowerment |
32
• Number of agreed governance models with gender considerations developed in supported departments
• Govt programme reaches underserved communities
Issues raised to govt
• Prioritised licensing issues for govt to address 1
Legal, including land ownership
Theme Indicator Frequency of indicator use
OUTCOME
Land ownership • Number of men and women with improved land tenure security
1
Other • Number of changes to formal laws, regulations or procedures that address market constraints for women.
1
OUTPUT
Land ownership • Gender proportion of privately-owned land
• Number of target population with use or ownership rights recorded in a manner recognised by national/customary law
2
Women’s entrepreneurship
• Number of legal and regulatory reforms supported by the programme that remove constraints and support women’s entrepreneurship
1
Products/services for women
Theme Indicator Frequency of indicator use
OUTCOME
Access to financial services
• Number of project clients accessing financial services e.g. credit; savings and pensions; payments; and insurance (that consider differentiated gender needs).
• Total value of insurance pay-outs
• Average monthly use of accounts from beneficiaries using financial services
• % of beneficiaries using at least one Fintech solution every month e.g. mobile money
• % of beneficiaries who have more than one product from financial services
• Number of deposit accounts per 10,000 adults in programme location
• % increase in formal sector lending to women entrepreneurs/women-led SMEs
• Number of small businesses/merchants that have accessed a financial product or service from a financial service provider
• Number of underserved adults benefitting from upgraded/modernised payments infrastructure
30

Measurement of Women’s Economic Empowerment |
33
• Number of adults gaining access to cheaper, more convenient and more secure technology-enabled international remittance services
Technology • Number of smallholders and small companies taking up transferred agricultural technology
1
Other • Number of women/girls accessing participants’ products and services.
• Number of participants who have increased sales from products, services or business models benefitting women/girls by X% or more.
2
OUTPUT
Access to services and products
• Number of participants that increase the number of women/girls reached with products/services
• Number of participants who refine their business model, product or service to meet the needs of target girls
• Number of active customers that are women/ number of women who use products/services
• Number of programme participants reporting increased access to services or products
• Number of new or improved products/services targeting women.
• Number of farmers/entrepreneurs who are assisted to access new and/or improved products/services
• Number of people who are provided services
10
Access to information
• Number of women receiving information to improve decision making
• % of farmers who judge the advice to be helpful or very helpful
• Number of individuals reporting an increase in knowledge and skills from services/activities implemented as part of market interventions
5
Financial services
• Number of women who open new savings accounts
• Number of graduates receiving start-up loan
• % of households receiving credit for their business plan
• Number of financial service providers that have updated or implemented new screening procedures, or financial/non-financial products or services for women-owned/led SMEs
5
Social norms
Theme Indicator Frequency of indicator use
OUTCOME
System level Evidence of system-level changes in social norms that positively effect women’s participation in focus markets
1
OUTPUT
Measurement of Women’s Economic Empowerment |
34
Beneficiary level Level of perception among target beneficiaries on changes in household and business attitudes regarding women’s participation in markets
1
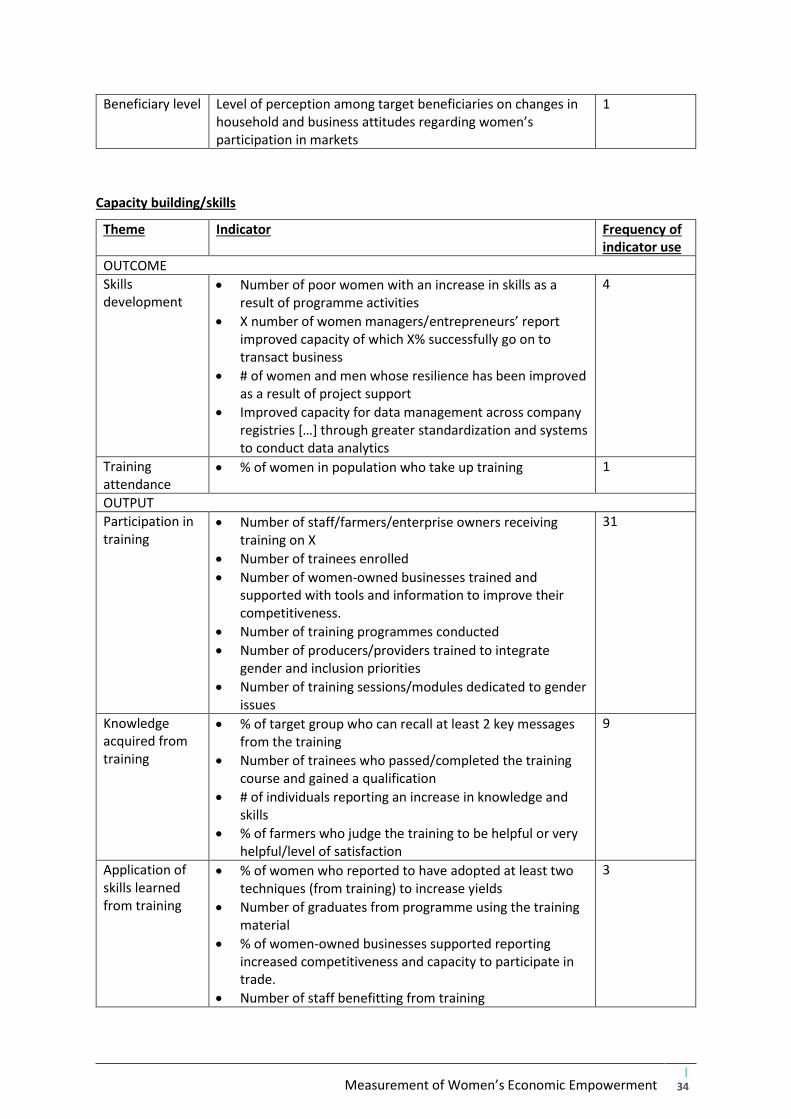
Capacity building/skills
Theme Indicator Frequency of indicator use
OUTCOME
Skills development
• Number of poor women with an increase in skills as a result of programme activities
• X number of women managers/entrepreneurs’ report improved capacity of which X% successfully go on to transact business
• # of women and men whose resilience has been improved as a result of project support
• Improved capacity for data management across company registries […] through greater standardization and systems to conduct data analytics
4
Training attendance
• % of women in population who take up training 1
OUTPUT
Participation in training
• Number of staff/farmers/enterprise owners receiving training on X
• Number of trainees enrolled
• Number of women-owned businesses trained and supported with tools and information to improve their competitiveness.
• Number of training programmes conducted
• Number of producers/providers trained to integrate gender and inclusion priorities
• Number of training sessions/modules dedicated to gender issues
31
Knowledge acquired from training
• % of target group who can recall at least 2 key messages from the training
• Number of trainees who passed/completed the training course and gained a qualification
• # of individuals reporting an increase in knowledge and skills
• % of farmers who judge the training to be helpful or very helpful/level of satisfaction
9
Application of skills learned from training
• % of women who reported to have adopted at least two techniques (from training) to increase yields
• Number of graduates from programme using the training material
• % of women-owned businesses supported reporting increased competitiveness and capacity to participate in trade.
• Number of staff benefitting from training
3

Measurement of Women’s Economic Empowerment |
35
• Number of policies and practices/providers demonstrating impact from training provided
Linkages between employers and training provided
• Number of employers who support TVET and employment in the programme
• Number of job placements agreed with employers for graduates
2
Capacity building plans
• Proportion of gendered capacity building plan completed.
• Proportion of gendered capacity building plan implemented according to schedule.
2
Investment in women’s business
Theme Indicator Frequency of indicator use
OUTCOME
Investment into business
• Number of programme participants securing external investment
• At least £X millions of impact investment into women-owned enterprises
2
OUTPUT
Value of investment
• # of matching grants allocated to firms
• Amount of new financing given to women-owned/led SMEs by We-Fi supported institutions
• Value of investments/investment plans made by firms
4
Knowledge and capacity
• Number of participants that have improved their investment readiness
• Number of people trained on investment promotion
2
Other • Cumulative number of investment applications received that meet standard required.
• Gendered investment plans are judged by Annual Reviewer to be of special benefit to women
• Total number of beneficiaries engaged to date through exited and active investments
4
Research and data
Theme Indicator Frequency of indicator use
OUTCOME
Sex-disaggregated data
• Number of companies that pilot research guidelines/toolkits to undertake a gender value chain mapping to collect gender-disaggregated data on workers at different value chain tiers, identify data and information gaps and address issues related to women’s work and roles.
2
OUTPUT

Measurement of Women’s Economic Empowerment |
36
Global supply chains/ sex disaggregated data
• Number of companies adopting research methodology developed by the programme to collect and report gender-disaggregated data
• Defining and using gender indicators
• Number of methodologies, guidelines, toolkits and evidence digests publicly available as a resource to companies beyond programme partners to assist them in undertaking gender value chain mapping, data collection, identify data information gaps and address issues related to women’s work in global value chains
• Developed and validated measurement framework that can disaggregate impact on women
6
Research products produced
• Number of reviews/research papers/learning products/resources/tools on WEE/gender
5
Research products disseminated
• Number of programme level research outputs on WEE that are disseminated to stakeholders
4
Other • Number of completed projects that test approaches towards greater WEE and build knowledge about effectiveness and scalability
• Proportion of impact evaluations with WEE-specific interventions
• Proportion of women among the contracted external researchers from developing countries
3
Women’s agency/confidence
Theme Indicator Frequency of indicator use
OUTCOME
Household • % of women who report increased decision-making power in the household/firm
• Proportion of women who report being able to take decisions on the household savings and investment
• Proportion of beneficiary women who can visit market alone
4
Labour market • Number of poor women with improved voice and choice in the workplace as a result of programme activities
1
Other/ knowledge
• % of women who demonstrate basic understanding of their rights to inheritance
1
OUTPUT
Decision making • % of women who report being able to take decisions on household savings and investment
• % of households reporting that use of transfers is decided jointly between husbands and wives
2
Confidence • % of women who report increased confidence in using digital financial services
1

Measurement of Women’s Economic Empowerment |
37
Gender awareness
Theme Indicator Frequency of indicator use
OUTCOME
Gender awareness
% of beneficiaries/companies who report improved gender awareness and/or inclusivity
2
OUTPUT
Training • Number of staff receiving gender awareness training
• Number of beneficiaries participating in gender workshops
• Number of training sessions and/or modules dedicated to gender issues
• Training material on gender indicators
11
Other
Theme Indicator Frequency of indicator use
OUTCOME
Various • Number of concrete examples of gender mainstreaming in programme interventions with partners
• Number of deals for which the PBR element is paid for one or more of (d) gender
• Number of specific and relevant cases of take-up of programme learning or approaches within DFID or other donors.
• Average non-food expenditure of cash transfer clients
• % of clients reporting that asset depletion is prevented as a result of transfers.
5
OUTPUT
Various • Poverty and gender targets clearly defined and results achieved in invested infrastructure projects
• Number of poor women participating in programme interventions
2