
Measurement of the inclusive jet cross section using the kT algorithm in pp¯ collisions at...
26
arXiv:hep-ex/0701051v1 28 Jan 2007 Measurement of the Inclusive Jet Cross Section using the k T algorithm in p p Collisions at √ s = 1.96 TeV with the CDF II Detector A. Abulencia, 24 J. Adelman, 13 T. Affolder, 10 T. Akimoto, 56 M.G. Albrow, 17 D. Ambrose, 17 S. Amerio, 44 D. Amidei, 35 A. Anastassov, 53 K. Anikeev, 17 A. Annovi, 19 J. Antos, 14 M. Aoki, 56 G. Apollinari, 17 J.-F. Arguin, 34 T. Arisawa, 58 A. Artikov, 15 W. Ashmanskas, 17 A. Attal, 8 F. Azfar, 43 P. Azzi-Bacchetta, 44 P. Azzurri, 47 N. Bacchetta, 44 W. Badgett, 17 A. Barbaro-Galtieri, 29 V.E. Barnes, 49 B.A. Barnett, 25 S. Baroiant, 7 V. Bartsch, 31 G. Bauer, 33 F. Bedeschi, 47 S. Behari, 25 S. Belforte, 55 G. Bellettini, 47 J. Bellinger, 60 A. Belloni, 33 D. Benjamin, 16 A. Beretvas, 17 J. Beringer, 29 T. Berry, 30 A. Bhatti, 51 M. Binkley, 17 D. Bisello, 44 R.E. Blair, 2 C. Blocker, 6 B. Blumenfeld, 25 A. Bocci, 16 A. Bodek, 50 V. Boisvert, 50 G. Bolla, 49 A. Bolshov, 33 D. Bortoletto, 49 J. Boudreau, 48 A. Boveia, 10 B. Brau, 10 L. Brigliadori, 5 C. Bromberg, 36 E. Brubaker, 13 J. Budagov, 15 H.S. Budd, 50 S. Budd, 24 S. Budroni, 47 K. Burkett, 17 G. Busetto, 44 P. Bussey, 21 K. L. Byrum, 2 S. Cabrera o , 16 M. Campanelli, 20 M. Campbell, 35 F. Canelli, 17 A. Canepa, 49 S. Carillo i , 18 D. Carlsmith, 60 R. Carosi, 47 S. Carron, 34 M. Casarsa, 55 A. Castro, 5 P. Catastini, 47 D. Cauz, 55 M. Cavalli-Sforza, 3 A. Cerri, 29 L. Cerrito m , 43 S.H. Chang, 28 Y.C. Chen, 1 M. Chertok, 7 G. Chiarelli, 47 G. Chlachidze, 15 F. Chlebana, 17 I. Cho, 28 K. Cho, 28 D. Chokheli, 15 J.P. Chou, 22 G. Choudalakis, 33 S.H. Chuang, 60 K. Chung, 12 W.H. Chung, 60 Y.S. Chung, 50 M. Ciljak, 47 C.I. Ciobanu, 24 M.A. Ciocci, 47 A. Clark, 20 D. Clark, 6 M. Coca, 16 G. Compostella, 44 M.E. Convery, 51 J. Conway, 7 B. Cooper, 36 K. Copic, 35 M. Cordelli, 19 G. Cortiana, 44 F. Crescioli, 47 C. Cuenca Almenar o , 7 J. Cuevas l , 11 R. Culbertson, 17 J.C. Cully, 35 D. Cyr, 60 S. DaRonco, 44 M. Datta, 17 S. D’Auria, 21 T. Davies, 21 M. D’Onofrio, 3 D. Dagenhart, 6 P. de Barbaro, 50 S. De Cecco, 52 A. Deisher, 29 G. De Lentdecker c , 50 M. Dell’Orso, 47 F. Delli Paoli, 44 L. Demortier, 51 J. Deng, 16 M. Deninno, 5 D. De Pedis, 52 P.F. Derwent, 17 G.P. Di Giovanni, 45 C. Dionisi, 52 B. Di Ruzza, 55 J.R. Dittmann, 4 P. DiTuro, 53 C.D¨orr, 26 S. Donati, 47 M. Donega, 20 P. Dong, 8 J. Donini, 44 T. Dorigo, 44 S. Dube, 53 J. Efron, 40 R. Erbacher, 7 D. Errede, 24 S. Errede, 24 R. Eusebi, 17 H.C. Fang, 29 S. Farrington, 30 I. Fedorko, 47 W.T. Fedorko, 13 R.G. Feild, 61 M. Feindt, 26 J.P. Fernandez, 32 R. Field, 18 G. Flanagan, 49 A. Foland, 22 S. Forrester, 7 G.W. Foster, 17 M. Franklin, 22 J.C. Freeman, 29 I. Furic, 13 M. Gallinaro, 51 J. Galyardt, 12 J.E. Garcia, 47 F. Garberson, 10 A.F. Garfinkel, 49 C. Gay, 61 H. Gerberich, 24 D. Gerdes, 35 S. Giagu, 52 P. Giannetti, 47 A. Gibson, 29 K. Gibson, 48 J.L. Gimmell, 50 C. Ginsburg, 17 N. Giokaris a , 15 M. Giordani, 55 P. Giromini, 19 M. Giunta, 47 G. Giurgiu, 12 V. Glagolev, 15 D. Glenzinski, 17 M. Gold, 38 N. Goldschmidt, 18 J. Goldstein b , 43 A. Golossanov, 17 G. Gomez, 11 G. Gomez-Ceballos, 11 M. Goncharov, 54 O. Gonz´ alez, 32 I. Gorelov, 38 A.T. Goshaw, 16 K. Goulianos, 51 A. Gresele, 44 M. Griffiths, 30 S. Grinstein, 22 C. Grosso-Pilcher, 13 R.C. Group, 18 U. Grundler, 24 J. Guimaraes da Costa, 22 Z. Gunay-Unalan, 36 C. Haber, 29 K. Hahn, 33 S.R. Hahn, 17 E. Halkiadakis, 53 A. Hamilton, 34 B.-Y. Han, 50 J.Y. Han, 50 R. Handler, 60 F. Happacher, 19 K. Hara, 56 M. Hare, 57 S. Harper, 43 R.F. Harr, 59 R.M. Harris, 17 M. Hartz, 48 K. Hatakeyama, 51 J. Hauser, 8 A. Heijboer, 46 B. Heinemann, 30 J. Heinrich, 46 C. Henderson, 33 M. Herndon, 60 J. Heuser, 26 D. Hidas, 16 C.S. Hill b , 10 D. Hirschbuehl, 26 A. Hocker, 17 A. Holloway, 22 S. Hou, 1 M. Houlden, 30 S.-C. Hsu, 9 B.T. Huffman, 43 R.E. Hughes, 40 U. Husemann, 61 J. Huston, 36 J. Incandela, 10 G. Introzzi, 47 M. Iori, 52 Y. Ishizawa, 56 A. Ivanov, 7 B. Iyutin, 33 E. James, 17 D. Jang, 53 B. Jayatilaka, 35 D. Jeans, 52 H. Jensen, 17 E.J. Jeon, 28 S. Jindariani, 18 M. Jones, 49 K.K. Joo, 28 S.Y. Jun, 12 J.E. Jung, 28 T.R. Junk, 24 T. Kamon, 54 P.E. Karchin, 59 Y. Kato, 42 Y. Kemp, 26 R. Kephart, 17 U. Kerzel, 26 V. Khotilovich, 54 B. Kilminster, 40 D.H. Kim, 28 H.S. Kim, 28 J.E. Kim, 28 M.J. Kim, 12 S.B. Kim, 28 S.H. Kim, 56 Y.K. Kim, 13 N. Kimura, 56 L. Kirsch, 6 S. Klimenko, 18 M. Klute, 33 B. Knuteson, 33 B.R. Ko, 16 K. Kondo, 58 D.J. Kong, 28 J. Konigsberg, 18 A. Korytov, 18 A.V. Kotwal, 16 A. Kovalev, 46 A.C. Kraan, 46 J. Kraus, 24 I. Kravchenko, 33 M. Kreps, 26 J. Kroll, 46 N. Krumnack, 4 M. Kruse, 16 V. Krutelyov, 10 T. Kubo, 56 S. E. Kuhlmann, 2 T. Kuhr, 26 Y. Kusakabe, 58 S. Kwang, 13 A.T. Laasanen, 49 S. Lai, 34 S. Lami, 47 S. Lammel, 17 M. Lancaster, 31 R.L. Lander, 7 K. Lannon, 40 A. Lath, 53 G. Latino, 47 I. Lazzizzera, 44 T. LeCompte, 2 J. Lee, 50 J. Lee, 28 Y.J. Lee, 28 S.W. Lee n , 54 R. Lef` evre, 3 N. Leonardo, 33 S. Leone, 47 S. Levy, 13 J.D. Lewis, 17 C. Lin, 61 C.S. Lin, 17 M. Lindgren, 17 E. Lipeles, 9 A. Lister, 7 D.O. Litvintsev, 17 T. Liu, 17 N.S. Lockyer, 46 A. Loginov, 61 M. Loreti, 44 P. Loverre, 52 R.-S. Lu, 1 D. Lucchesi, 44 P. Lujan, 29 P. Lukens, 17 G. Lungu, 18 L. Lyons, 43 J. Lys, 29 R. Lysak, 14 E. Lytken, 49 P. Mack, 26 D. MacQueen, 34 R. Madrak, 17 K. Maeshima, 17 K. Makhoul, 33 T. Maki, 23 P. Maksimovic, 25 S. Malde, 43 G. Manca, 30 F. Margaroli, 5 R. Marginean, 17 C. Marino, 26 C.P. Marino, 24 A. Martin, 61 M. Martin, 25 V. Martin g , 21 M. Mart´ ınez, 3 T. Maruyama, 56 P. Mastrandrea, 52 T. Masubuchi, 56 H. Matsunaga, 56 M.E. Mattson, 59 R. Mazini, 34 P. Mazzanti, 5 K.S. McFarland, 50 P. McIntyre, 54 R. McNulty f , 30 A. Mehta, 30 P. Mehtala, 23 S. Menzemer h , 11 A. Menzione, 47 P. Merkel, 49 C. Mesropian, 51 A. Messina, 36 T. Miao, 17 N. Miladinovic, 6 J. Miles, 33 R. Miller, 36 C. Mills, 10 M. Milnik, 26 A. Mitra, 1 G. Mitselmakher, 18 A. Miyamoto, 27 S. Moed, 20 N. Moggi, 5 B. Mohr, 8
Transcript of Measurement of the inclusive jet cross section using the kT algorithm in pp¯ collisions at...
arX
iv:h
ep-e
x/07
0105
1v1
28
Jan
2007
Measurement of the Inclusive Jet Cross Section using the kT algorithm
in pp Collisions at√
s = 1.96 TeV with the CDF II Detector
A. Abulencia,24 J. Adelman,13 T. Affolder,10 T. Akimoto,56 M.G. Albrow,17 D. Ambrose,17 S. Amerio,44
D. Amidei,35 A. Anastassov,53 K. Anikeev,17 A. Annovi,19 J. Antos,14 M. Aoki,56 G. Apollinari,17 J.-F. Arguin,34
T. Arisawa,58 A. Artikov,15 W. Ashmanskas,17 A. Attal,8 F. Azfar,43 P. Azzi-Bacchetta,44 P. Azzurri,47
N. Bacchetta,44 W. Badgett,17 A. Barbaro-Galtieri,29 V.E. Barnes,49 B.A. Barnett,25 S. Baroiant,7 V. Bartsch,31
G. Bauer,33 F. Bedeschi,47 S. Behari,25 S. Belforte,55 G. Bellettini,47 J. Bellinger,60 A. Belloni,33 D. Benjamin,16
A. Beretvas,17 J. Beringer,29 T. Berry,30 A. Bhatti,51 M. Binkley,17 D. Bisello,44 R.E. Blair,2 C. Blocker,6
B. Blumenfeld,25 A. Bocci,16 A. Bodek,50 V. Boisvert,50 G. Bolla,49 A. Bolshov,33 D. Bortoletto,49 J. Boudreau,48
A. Boveia,10 B. Brau,10 L. Brigliadori,5 C. Bromberg,36 E. Brubaker,13 J. Budagov,15 H.S. Budd,50 S. Budd,24
S. Budroni,47 K. Burkett,17 G. Busetto,44 P. Bussey,21 K. L. Byrum,2 S. Cabrerao,16 M. Campanelli,20
M. Campbell,35 F. Canelli,17 A. Canepa,49 S. Carilloi,18 D. Carlsmith,60 R. Carosi,47 S. Carron,34 M. Casarsa,55
A. Castro,5 P. Catastini,47 D. Cauz,55 M. Cavalli-Sforza,3 A. Cerri,29 L. Cerritom,43 S.H. Chang,28 Y.C. Chen,1
M. Chertok,7 G. Chiarelli,47 G. Chlachidze,15 F. Chlebana,17 I. Cho,28 K. Cho,28 D. Chokheli,15 J.P. Chou,22
G. Choudalakis,33 S.H. Chuang,60 K. Chung,12 W.H. Chung,60 Y.S. Chung,50 M. Ciljak,47 C.I. Ciobanu,24
M.A. Ciocci,47 A. Clark,20 D. Clark,6 M. Coca,16 G. Compostella,44 M.E. Convery,51 J. Conway,7 B. Cooper,36
K. Copic,35 M. Cordelli,19 G. Cortiana,44 F. Crescioli,47 C. Cuenca Almenaro,7 J. Cuevasl,11 R. Culbertson,17
J.C. Cully,35 D. Cyr,60 S. DaRonco,44 M. Datta,17 S. D’Auria,21 T. Davies,21 M. D’Onofrio,3 D. Dagenhart,6
P. de Barbaro,50 S. De Cecco,52 A. Deisher,29 G. De Lentdeckerc,50 M. Dell’Orso,47 F. Delli Paoli,44 L. Demortier,51
J. Deng,16 M. Deninno,5 D. De Pedis,52 P.F. Derwent,17 G.P. Di Giovanni,45 C. Dionisi,52 B. Di Ruzza,55
J.R. Dittmann,4 P. DiTuro,53 C. Dorr,26 S. Donati,47 M. Donega,20 P. Dong,8 J. Donini,44 T. Dorigo,44
S. Dube,53 J. Efron,40 R. Erbacher,7 D. Errede,24 S. Errede,24 R. Eusebi,17 H.C. Fang,29 S. Farrington,30
I. Fedorko,47 W.T. Fedorko,13 R.G. Feild,61 M. Feindt,26 J.P. Fernandez,32 R. Field,18 G. Flanagan,49 A. Foland,22
S. Forrester,7 G.W. Foster,17 M. Franklin,22 J.C. Freeman,29 I. Furic,13 M. Gallinaro,51 J. Galyardt,12 J.E. Garcia,47
F. Garberson,10 A.F. Garfinkel,49 C. Gay,61 H. Gerberich,24 D. Gerdes,35 S. Giagu,52 P. Giannetti,47 A. Gibson,29
K. Gibson,48 J.L. Gimmell,50 C. Ginsburg,17 N. Giokarisa,15 M. Giordani,55 P. Giromini,19 M. Giunta,47
G. Giurgiu,12 V. Glagolev,15 D. Glenzinski,17 M. Gold,38 N. Goldschmidt,18 J. Goldsteinb,43 A. Golossanov,17
G. Gomez,11 G. Gomez-Ceballos,11 M. Goncharov,54 O. Gonzalez,32 I. Gorelov,38 A.T. Goshaw,16
K. Goulianos,51 A. Gresele,44 M. Griffiths,30 S. Grinstein,22 C. Grosso-Pilcher,13 R.C. Group,18 U. Grundler,24
J. Guimaraes da Costa,22 Z. Gunay-Unalan,36 C. Haber,29 K. Hahn,33 S.R. Hahn,17 E. Halkiadakis,53
A. Hamilton,34 B.-Y. Han,50 J.Y. Han,50 R. Handler,60 F. Happacher,19 K. Hara,56 M. Hare,57 S. Harper,43
R.F. Harr,59 R.M. Harris,17 M. Hartz,48 K. Hatakeyama,51 J. Hauser,8 A. Heijboer,46 B. Heinemann,30
J. Heinrich,46 C. Henderson,33 M. Herndon,60 J. Heuser,26 D. Hidas,16 C.S. Hillb,10 D. Hirschbuehl,26 A. Hocker,17
A. Holloway,22 S. Hou,1 M. Houlden,30 S.-C. Hsu,9 B.T. Huffman,43 R.E. Hughes,40 U. Husemann,61
J. Huston,36 J. Incandela,10 G. Introzzi,47 M. Iori,52 Y. Ishizawa,56 A. Ivanov,7 B. Iyutin,33 E. James,17
D. Jang,53 B. Jayatilaka,35 D. Jeans,52 H. Jensen,17 E.J. Jeon,28 S. Jindariani,18 M. Jones,49 K.K. Joo,28
S.Y. Jun,12 J.E. Jung,28 T.R. Junk,24 T. Kamon,54 P.E. Karchin,59 Y. Kato,42 Y. Kemp,26 R. Kephart,17
U. Kerzel,26 V. Khotilovich,54 B. Kilminster,40 D.H. Kim,28 H.S. Kim,28 J.E. Kim,28 M.J. Kim,12 S.B. Kim,28
S.H. Kim,56 Y.K. Kim,13 N. Kimura,56 L. Kirsch,6 S. Klimenko,18 M. Klute,33 B. Knuteson,33 B.R. Ko,16
K. Kondo,58 D.J. Kong,28 J. Konigsberg,18 A. Korytov,18 A.V. Kotwal,16 A. Kovalev,46 A.C. Kraan,46 J. Kraus,24
I. Kravchenko,33 M. Kreps,26 J. Kroll,46 N. Krumnack,4 M. Kruse,16 V. Krutelyov,10 T. Kubo,56 S. E. Kuhlmann,2
T. Kuhr,26 Y. Kusakabe,58 S. Kwang,13 A.T. Laasanen,49 S. Lai,34 S. Lami,47 S. Lammel,17 M. Lancaster,31
R.L. Lander,7 K. Lannon,40 A. Lath,53 G. Latino,47 I. Lazzizzera,44 T. LeCompte,2 J. Lee,50 J. Lee,28 Y.J. Lee,28
S.W. Leen,54 R. Lefevre,3 N. Leonardo,33 S. Leone,47 S. Levy,13 J.D. Lewis,17 C. Lin,61 C.S. Lin,17 M. Lindgren,17
E. Lipeles,9 A. Lister,7 D.O. Litvintsev,17 T. Liu,17 N.S. Lockyer,46 A. Loginov,61 M. Loreti,44 P. Loverre,52
R.-S. Lu,1 D. Lucchesi,44 P. Lujan,29 P. Lukens,17 G. Lungu,18 L. Lyons,43 J. Lys,29 R. Lysak,14 E. Lytken,49
P. Mack,26 D. MacQueen,34 R. Madrak,17 K. Maeshima,17 K. Makhoul,33 T. Maki,23 P. Maksimovic,25 S. Malde,43
G. Manca,30 F. Margaroli,5 R. Marginean,17 C. Marino,26 C.P. Marino,24 A. Martin,61 M. Martin,25 V. Marting,21
M. Martınez,3 T. Maruyama,56 P. Mastrandrea,52 T. Masubuchi,56 H. Matsunaga,56 M.E. Mattson,59 R. Mazini,34
P. Mazzanti,5 K.S. McFarland,50 P. McIntyre,54 R. McNultyf ,30 A. Mehta,30 P. Mehtala,23 S. Menzemerh,11
A. Menzione,47 P. Merkel,49 C. Mesropian,51 A. Messina,36 T. Miao,17 N. Miladinovic,6 J. Miles,33 R. Miller,36
C. Mills,10 M. Milnik,26 A. Mitra,1 G. Mitselmakher,18 A. Miyamoto,27 S. Moed,20 N. Moggi,5 B. Mohr,8
2
R. Moore,17 M. Morello,47 P. Movilla Fernandez,29 J. Mulmenstadt,29 A. Mukherjee,17 Th. Muller,26 R. Mumford,25
P. Murat,17 J. Nachtman,17 A. Nagano,56 J. Naganoma,58 I. Nakano,41 A. Napier,57 V. Necula,18 C. Neu,46
M.S. Neubauer,9 J. Nielsen,29 T. Nigmanov,48 L. Nodulman,2 O. Norniella,3 E. Nurse,31 S.H. Oh,16 Y.D. Oh,28
I. Oksuzian,18 T. Okusawa,42 R. Oldeman,30 R. Orava,23 K. Osterberg,23 C. Pagliarone,47 E. Palencia,11
V. Papadimitriou,17 A.A. Paramonov,13 B. Parks,40 S. Pashapour,34 J. Patrick,17 G. Pauletta,55 M. Paulini,12
C. Paus,33 D.E. Pellett,7 A. Penzo,55 T.J. Phillips,16 G. Piacentino,47 J. Piedra,45 L. Pinera,18 K. Pitts,24
C. Plager,8 L. Pondrom,60 X. Portell,3 O. Poukhov,15 N. Pounder,43 F. Prakoshyn,15 A. Pronko,17 J. Proudfoot,2
F. Ptohose,19 G. Punzi,47 J. Pursley,25 J. Rademackerb,43 A. Rahaman,48 N. Ranjan,49 S. Rappoccio,22
B. Reisert,17 V. Rekovic,38 P. Renton,43 M. Rescigno,52 S. Richter,26 F. Rimondi,5 L. Ristori,47 A. Robson,21
T. Rodrigo,11 E. Rogers,24 S. Rolli,57 R. Roser,17 M. Rossi,55 R. Rossin,18 A. Ruiz,11 J. Russ,12 V. Rusu,13
H. Saarikko,23 S. Sabik,34 A. Safonov,54 W.K. Sakumoto,50 G. Salamanna,52 O. Salto,3 D. Saltzberg,8 C. Sanchez,3
L. Santi,55 S. Sarkar,52 L. Sartori,47 K. Sato,17 P. Savard,34 A. Savoy-Navarro,45 T. Scheidle,26 P. Schlabach,17
E.E. Schmidt,17 M.P. Schmidt,61 M. Schmitt,39 T. Schwarz,7 L. Scodellaro,11 A.L. Scott,10 A. Scribano,47
F. Scuri,47 A. Sedov,49 S. Seidel,38 Y. Seiya,42 A. Semenov,15 L. Sexton-Kennedy,17 A. Sfyrla,20 M.D. Shapiro,29
T. Shears,30 P.F. Shepard,48 D. Sherman,22 M. Shimojimak,56 M. Shochet,13 Y. Shon,60 I. Shreyber,37 A. Sidoti,47
P. Sinervo,34 A. Sisakyan,15 J. Sjolin,43 A.J. Slaughter,17 J. Slaunwhite,40 K. Sliwa,57 J.R. Smith,7 F.D. Snider,17
R. Snihur,34 M. Soderberg,35 A. Soha,7 S. Somalwar,53 V. Sorin,36 J. Spalding,17 F. Spinella,47 T. Spreitzer,34
P. Squillacioti,47 M. Stanitzki,61 A. Staveris-Polykalas,47 R. St. Denis,21 B. Stelzer,8 O. Stelzer-Chilton,43
D. Stentz,39 J. Strologas,38 D. Stuart,10 J.S. Suh,28 A. Sukhanov,18 H. Sun,57 T. Suzuki,56 A. Taffard,24
R. Takashima,41 Y. Takeuchi,56 K. Takikawa,56 M. Tanaka,2 R. Tanaka,41 M. Tecchio,35 P.K. Teng,1 K. Terashi,51
J. Thomd,17 A.S. Thompson,21 E. Thomson,46 P. Tipton,61 V. Tiwari,12 S. Tkaczyk,17 D. Toback,54 S. Tokar,14
K. Tollefson,36 T. Tomura,56 D. Tonelli,47 S. Torre,19 D. Torretta,17 S. Tourneur,45 W. Trischuk,34 R. Tsuchiya,58
S. Tsuno,41 N. Turini,47 F. Ukegawa,56 T. Unverhau,21 S. Uozumi,56 D. Usynin,46 S. Vallecorsa,20
N. van Remortel,23 A. Varganov,35 E. Vataga,38 F. Vazquezi,18 G. Velev,17 G. Veramendi,24 V. Veszpremi,49
R. Vidal,17 I. Vila,11 R. Vilar,11 T. Vine,31 I. Vollrath,34 I. Volobouevn,29 G. Volpi,47 F. Wurthwein,9 P. Wagner,54
R.G. Wagner,2 R.L. Wagner,17 J. Wagner,26 W. Wagner,26 R. Wallny,8 S.M. Wang,1 A. Warburton,34 S. Waschke,21
D. Waters,31 M. Weinberger,54 W.C. Wester III,17 B. Whitehouse,57 D. Whiteson,46 A.B. Wicklund,2
E. Wicklund,17 G. Williams,34 H.H. Williams,46 P. Wilson,17 B.L. Winer,40 P. Wittichd,17 S. Wolbers,17
C. Wolfe,13 T. Wright,35 X. Wu,20 S.M. Wynne,30 A. Yagil,17 K. Yamamoto,42 J. Yamaoka,53 T. Yamashita,41
C. Yang,61 U.K. Yangj,13 Y.C. Yang,28 W.M. Yao,29 G.P. Yeh,17 J. Yoh,17 K. Yorita,13 T. Yoshida,42 G.B. Yu,50
I. Yu,28 S.S. Yu,17 J.C. Yun,17 L. Zanello,52 A. Zanetti,55 I. Zaw,22 X. Zhang,24 J. Zhou,53 and S. Zucchelli5
(CDF Collaboration∗)1Institute of Physics, Academia Sinica, Taipei, Taiwan 11529, Republic of China
2Argonne National Laboratory, Argonne, Illinois 604393Institut de Fisica d’Altes Energies, Universitat Autonoma de Barcelona, E-08193, Bellaterra (Barcelona), Spain
4Baylor University, Waco, Texas 767985Istituto Nazionale di Fisica Nucleare, University of Bologna, I-40127 Bologna, Italy
6Brandeis University, Waltham, Massachusetts 022547University of California, Davis, Davis, California 95616
8University of California, Los Angeles, Los Angeles, California 900249University of California, San Diego, La Jolla, California 92093
10University of California, Santa Barbara, Santa Barbara, California 9310611Instituto de Fisica de Cantabria, CSIC-University of Cantabria, 39005 Santander, Spain
12Carnegie Mellon University, Pittsburgh, PA 1521313Enrico Fermi Institute, University of Chicago, Chicago, Illinois 60637
14Comenius University, 842 48 Bratislava, Slovakia; Institute of Experimental Physics, 040 01 Kosice, Slovakia15Joint Institute for Nuclear Research, RU-141980 Dubna, Russia
16Duke University, Durham, North Carolina 2770817Fermi National Accelerator Laboratory, Batavia, Illinois 60510
18University of Florida, Gainesville, Florida 32611
∗ With visitors from aUniversity of Athens, bUniversity of Bristol, cUniversity Libre de Bruxelles, dCornell University, eUniversityof Cyprus, fUniversity of Dublin, gUniversity of Edinburgh, hUniversity of Heidelberg, iUniversidad Iberoamericana, jUniversity ofManchester, kNagasaki Institute of Applied Science, lUniversity de Oviedo, mUniversity of London, Queen Mary and Westfield College,nTexas Tech University, oIFIC(CSIC-Universitat de Valencia),
3
19Laboratori Nazionali di Frascati, Istituto Nazionale di Fisica Nucleare, I-00044 Frascati, Italy20University of Geneva, CH-1211 Geneva 4, Switzerland
21Glasgow University, Glasgow G12 8QQ, United Kingdom22Harvard University, Cambridge, Massachusetts 02138
23Division of High Energy Physics, Department of Physics,University of Helsinki and Helsinki Institute of Physics, FIN-00014, Helsinki, Finland
24University of Illinois, Urbana, Illinois 6180125The Johns Hopkins University, Baltimore, Maryland 21218
26Institut fur Experimentelle Kernphysik, Universitat Karlsruhe, 76128 Karlsruhe, Germany27High Energy Accelerator Research Organization (KEK), Tsukuba, Ibaraki 305, Japan
28Center for High Energy Physics: Kyungpook National University,Taegu 702-701, Korea; Seoul National University, Seoul 151-742,Korea; and SungKyunKwan University, Suwon 440-746, Korea
29Ernest Orlando Lawrence Berkeley National Laboratory, Berkeley, California 9472030University of Liverpool, Liverpool L69 7ZE, United Kingdom
31University College London, London WC1E 6BT, United Kingdom32Centro de Investigaciones Energeticas Medioambientales y Tecnologicas, E-28040 Madrid, Spain
33Massachusetts Institute of Technology, Cambridge, Massachusetts 0213934Institute of Particle Physics: McGill University, Montreal,
Canada H3A 2T8; and University of Toronto, Toronto, Canada M5S 1A735University of Michigan, Ann Arbor, Michigan 48109
36Michigan State University, East Lansing, Michigan 4882437Institution for Theoretical and Experimental Physics, ITEP, Moscow 117259, Russia
38University of New Mexico, Albuquerque, New Mexico 8713139Northwestern University, Evanston, Illinois 6020840The Ohio State University, Columbus, Ohio 43210
41Okayama University, Okayama 700-8530, Japan42Osaka City University, Osaka 588, Japan
43University of Oxford, Oxford OX1 3RH, United Kingdom44University of Padova, Istituto Nazionale di Fisica Nucleare,
Sezione di Padova-Trento, I-35131 Padova, Italy45LPNHE, Universite Pierre et Marie Curie/IN2P3-CNRS, UMR7585, Paris, F-75252 France
46University of Pennsylvania, Philadelphia, Pennsylvania 1910447Istituto Nazionale di Fisica Nucleare Pisa, Universities of Pisa,
Siena and Scuola Normale Superiore, I-56127 Pisa, Italy48University of Pittsburgh, Pittsburgh, Pennsylvania 15260
49Purdue University, West Lafayette, Indiana 4790750University of Rochester, Rochester, New York 14627
51The Rockefeller University, New York, New York 1002152Istituto Nazionale di Fisica Nucleare, Sezione di Roma 1,
University of Rome “La Sapienza,” I-00185 Roma, Italy53Rutgers University, Piscataway, New Jersey 08855
54Texas A&M University, College Station, Texas 7784355Istituto Nazionale di Fisica Nucleare, University of Trieste/ Udine, Italy
56University of Tsukuba, Tsukuba, Ibaraki 305, Japan57Tufts University, Medford, Massachusetts 02155
58Waseda University, Tokyo 169, Japan59Wayne State University, Detroit, Michigan 48201
60University of Wisconsin, Madison, Wisconsin 5370661Yale University, New Haven, Connecticut 06520
(Dated: February 7, 2008)
We report on measurements of the inclusive jet production cross section as a function of thejet transverse momentum in pp collisions at
√s = 1.96 TeV, using the kT algorithm and a data
sample corresponding to 1.0 fb−1 collected with the Collider Detector at Fermilab in Run II. Themeasurements are carried out in five different jet rapidity regions with |yjet| < 2.1 and transverse mo-
mentum in the range 54 < pjetT < 700 GeV/c. Next-to-leading order perturbative QCD predictions
are in good agreement with the measured cross sections.
PACS numbers: PACS numbers 12.38.Aw, 13.85.-t, 13.87.-a
4
I. INTRODUCTION
The measurement of the inclusive jet cross section as a function of the jet transverse momentum, pjetT , in pp collisions
at√
s = 1.96 TeV constitutes a test of perturbative quantum chromodynamics (pQCD) [1]. In Run II of the Tevatron,
measurements of the jet cross section for jets with pjetT up to about 700 GeV/c [2, 3] have extended the pjet
T range bymore than 150 GeV/c compared to Run I [4–6]. In particular, the CDF collaboration recently published results [2]
on inclusive jet production using the kT algorithm [7, 8] for jets with pjetT > 54 GeV/c and rapidity [9] in the region
0.1 < |yjet| < 0.7, which are well described by next-to-leading order (NLO) pQCD predictions [10]. As discussedin [2], the kT algorithm has been widely used for precise QCD measurements at both e+e− and e±p colliders, andmakes possible a well defined comparison to the theoretical predictions [8]. The pQCD calculations involve matrixelements, describing the hard interaction between partons, convoluted with parton density functions (PDFs) [11, 12]in the proton and antiproton that require input from experiment. The pQCD predictions are affected by the still-limited knowledge of the gluon PDF, which translates into a large uncertainty on the theoretical cross sections athigh pjet
T [2, 3]. Inclusive jet cross section measurements from Run I at the Tevatron [5], performed in different jetrapidity regions, have been used to partially constrain the gluon distribution in the proton. This article continuesthe studies on jet production using the kT algorithm at the Tevatron [2, 6] and presents new measurements of the
inclusive jet production cross section as a function of pjetT in five different jet rapidity regions up to |yjet| = 2.1, based
on 1.0 fb−1 of CDF Run II data. The measurements are corrected to the hadron level [13] and compared to NLOpQCD predictions.
II. EXPERIMENTAL SETUP
The CDF II detector (see Fig. 1) is described in detail in [14]. The sub-detectors most relevant for this analysisare discussed briefly here. The detector has a charged particle tracking system immersed in a 1.4 T magnetic field.A silicon microstrip detector [15] provides tracking over the radial range 1.35 to 28 cm and covers the pseudorapidityrange |η| < 2. A 3.1-m-long open-cell drift chamber [16] covers the radial range from 44 to 132 cm and providestracking coverage for |η| < 1. Segmented sampling calorimeters, arranged in a projective tower geometry, surroundthe tracking system and measure the energy of interacting particles for |η| < 3.6. The central barrel calorimeter [17]covers the region |η| < 1. It consists of two sections, an electromagnetic calorimeter (CEM) and a hadronic calorimeter(CHA), divided into 480 towers of size 0.1 in η and 15o in φ. The end-wall hadronic calorimeter (WHA) [18] is behindthe central barrel calorimeter in the region 0.6 < |η| < 1.0, providing forward coverage out to |η| < 1.3. In Run II, newforward scintillator-plate calorimeters [19] replaced the Run I gas calorimeter system. The new plug electromagneticcalorimeter (PEM) covers the region 1.1 < |η| < 3.6, while the new hadronic calorimeter (PHA) provides coveragein the 1.3 < |η| < 3.6 region. The calorimeter has gaps at |η| ≈ 0 (between the two halves of the central barrelcalorimeter) and at |η| ≈ 1.1 (in the region between the WHA and the plug calorimeters). The measured energy
resolutions for electrons in the electromagnetic calorimeters [17, 19] are 14%/√
ET ⊕ 2% (CEM) and 16%/√
E ⊕ 1%(PEM), where the energies are expressed in GeV. The single-pion energy resolutions in the hadronic calorimeters, as
determined in test-beam data [17–19], are 50%/√
ET ⊕3% (CHA), 75%/√
ET ⊕4% (WHA) and 80%/√
E⊕5% (PHA).Cherenkov counters covering the 3.7 < |η| < 4.7 region [20] measure the average number of inelastic pp collisions perbunch crossing and thereby determine the beam luminosity.
III. JET RECONSTRUCTION
The kT algorithm [8] is used to reconstruct jets from the energy depositions in the calorimeter towers in bothdata and Monte Carlo simulated events (see Section VI). For each calorimeter tower, the four-momenta [21] of itselectromagnetic and hadronic sections are summed to define a physics tower. First, all physics towers with transversemomentum above 0.1 GeV/c are considered as protojets. The quantities
kT,i = p2T,i ; kT,(i,j) = min(p2
T,i, p2T,j) · ∆R2
i,j/D2, (1)
are computed for each protojet and pair of protojets, respectively, where pT,i denotes the transverse momentumof the ith protojet, ∆Ri,j is the distance (y − φ space) between each pair of protojets, and D is a parameter thatapproximately controls the size of the jet by limiting, in each iteration, the clustering of protojets according to theirspacial separation. All kT,i and kT,(i,j) values are then collected into a single sorted list. In this list, if the smallestquantity is of the type kT,i, the corresponding protojet is promoted to be a jet and removed from the list. Otherwise, if
5
the smallest quantity is of the type kT,(i,j), the protojets are combined into a single protojet by summing up their four-vector components. The procedure is iterated over protojets until the list is empty. The jet transverse momentum,rapidity, and azimuthal angle are denoted as pjet
T,cal, yjetcal, and φjet
cal, respectively.In the Monte Carlo event samples, the same jet algorithm is also applied to the final-state particles, considering all
particles as protojets, to search for jets at the hadron level. The resulting hadron-level jet variables are denoted aspjetT,had, yjet
had, and φjethad.
IV. EVENT SELECTION
Events are selected online using a three-level trigger system [22] with unique sets of selection criteria called paths.For the different trigger paths used in this measurement, this selection is based on the measured energy deposits inthe calorimeter towers, with different thresholds on the jet ET and different prescale factors [23] (see Table I). Inthe first-level trigger, a single trigger tower [24] with ET above 5 GeV or 10 GeV, depending on the trigger path, isrequired. In the second-level trigger, calorimeter clusters are formed around the selected trigger towers. The eventsare required to have at least one second-level trigger cluster with ET above a given threshold, which varies between15 and 90 GeV for the different trigger paths. In the third-level trigger, jets are reconstructed using the CDF Run Icone algorithm [25], and the events are required to have at least one jet with ET above 20 to 100 GeV.
Trigger Path Level 1 tower ET [GeV] Level 2 cluster ET [GeV] Level 3 jet ET [GeV] eff. prescale
JET 20 5 15 20 775
JET 50 5 40 50 34
JET 70 10 60 70 8
JET 100 10 90 100 1
TABLE I: Summary of trigger paths, trigger thresholds and effective prescale factors employed to collect the data.
Jets are then reconstructed using the kT algorithm, as explained in Section III, with D = 0.7. For each trigger path,the minimum pjet
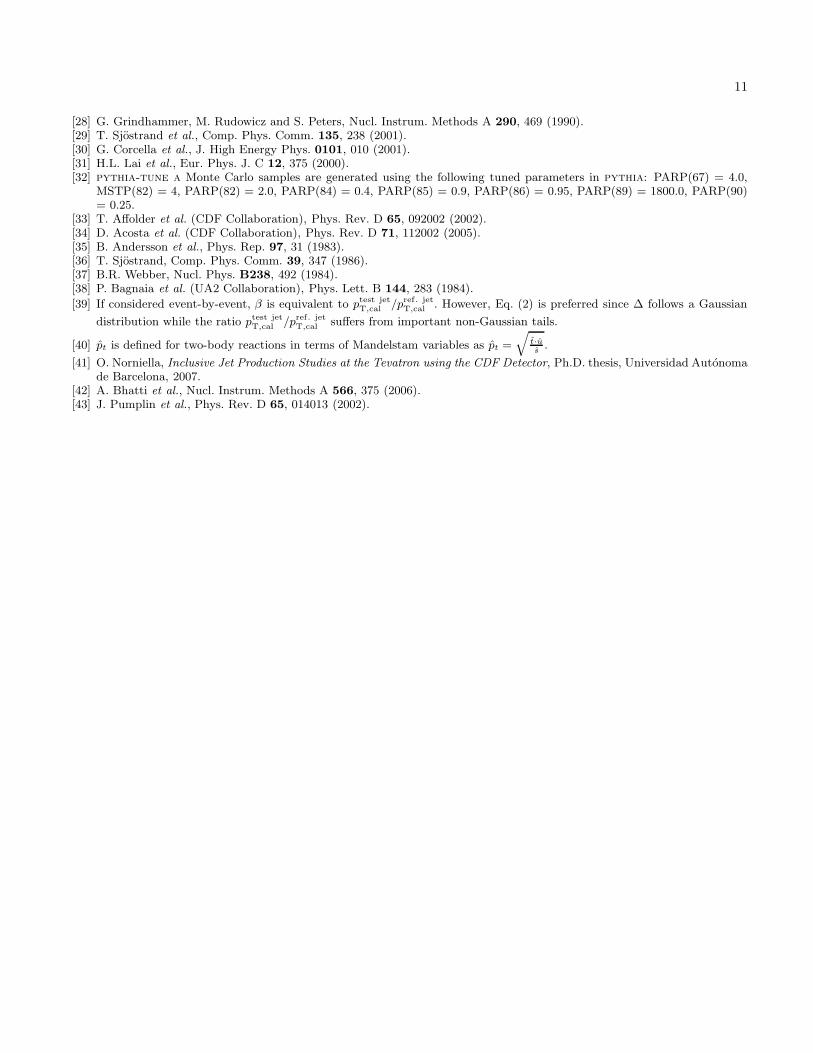
T,cal, in each |yjetcal| region, is chosen in such a way that the trigger selection is fully efficient. The
efficiency for a given trigger path is obtained using events from a different trigger path with lower transverse energythresholds (see Table I). In the case of the JET 20 trigger path, the trigger efficiency is extracted from additionalcontrol samples, which include a sample with only first-level trigger requirements as well as data collected usingunbiased trigger paths with no requirement on the energy deposits in the calorimeter towers. As an example, for jetsin the region 0.1 < |yjet
cal| < 0.7, Fig. 2 shows the trigger efficiency as a function of pjetT,cal for the different samples. The
following selection criteria have been imposed:
1. Events are required to have at least one reconstructed primary vertex with z-position within 60 cm of thenominal interaction point. This partially removes beam-related backgrounds and ensures a well-understoodevent-by-event jet kinematics.
2. Events are required to have at least one jet with rapidity in the region |yjetcal| < 2.1 and corrected pjet
T,cal (see
Section IX) above 54 GeV/c, which constitutes the minimum jet transverse momentum considered in the analysis.
The measurements are limited to jets with |yjetcal| < 2.1 to avoid contributions from the p and p remnants that
would affect the measured pjetT,cal in the most forward region of the calorimeter.
3. In order to remove beam-related backgrounds and cosmic rays, the events are required to fulfill ET/ /√
ΣET <
F (p jet1T,cal), where ET/ denotes the missing transverse energy [26] and ΣET =
∑
i EiT is the total transverse energy
of the event, as measured using calorimeter towers with EiT above 0.1 GeV. The threshold function F (p jet1
T,cal) is
defined as F (pjetT ) = min(2+0.0125×pjet
T , 7), where p jet1T,cal is the uncorrected transverse momentum of the leading
jet (highest pjetT ) in GeV/c, and F is in GeV1/2. This criterion preserves more than 95% of the QCD events, as
determined from Monte Carlo studies (see Section VI). A visual scan of events with pjetT,cal > 400 GeV/c did not
show remaining backgrounds.
Measurements are carried out in five different jet rapidity regions: |yjetcal| < 0.1, 0.1 < |yjet
cal| < 0.7, 0.7 < |yjetcal| < 1.1,
1.1 < |yjetcal| < 1.6, and 1.6 < |yjet
cal| < 2.1, where the different boundaries are chosen to reduce systematic effects comingfrom the layout of the calorimeter system.
6
V. EFFECT OF MULTIPLE P P INTERACTIONS
The measured pjetT,cal includes contributions from multiple pp interactions per bunch crossing at high instantaneous
luminosity, Linst. The data used in this measurement were collected at Linst between 0.2 × 1031cm−2s−1 and 16.3 ×1031cm−2s−1 with an average of 4.1 × 1031cm−2s−1. On average, 1.5 inelastic pp interactions per bunch crossing areexpected. At the highest Linst considered, an average of 5.9 interactions per bunch crossing are produced. This mainlyaffects the measured cross section at low pjet
T where the contributions are sizeable. Multiple interactions are identifiedvia the presence of additional primary vertices reconstructed from charged particles. The measured jet transversemomenta are corrected for this effect by removing a certain amount of transverse momentum, δmi
pT× (NV − 1), where
NV denotes the number of reconstructed primary vertices in the event and δmipT
is determined from the data by
requiring that, after the correction is applied, the ratio of cross sections at low and high Linst does not show any pjetT
dependence. The study is carried out separately in each |yjetcal| region, and the results are consistent with a common
value δmipT
= 1.86 ± 0.23 GeV/c across the whole rapidity range.
VI. MONTE CARLO SIMULATION
Monte Carlo simulated event samples are used to determine the response of the detector and the correction factors tothe hadron level. The generated samples are passed through a full CDF II detector simulation (based on geant3 [27],where the gflash [28] package is used to simulate the energy deposition in the calorimeters) and then reconstructedand analyzed using the same analysis chain as used for the data.
Samples of simulated inclusive jet events have been generated with pythia 6.203 [29] and herwig 6.4 [30] MonteCarlo generators, using CTEQ5L [31] PDFs. The pythia samples have been created using a specially tuned set ofparameters, denoted as pythia-tune a [32], that includes enhanced contributions from initial-state gluon radiationand secondary parton interactions between remnants. The parameters were determined from dedicated studies ofthe underlying event using the CDF Run I data [33] and has been shown to properly describe the measured jetshapes in Run II [34]. In the case of pythia, fragmentation into hadrons is carried out using the string model [35] asimplemented in jetset [36], while herwig implements the cluster model [37].
VII. SIMULATION OF THE CALORIMETER RESPONSE TO JETS
Dedicated studies have been performed to validate the Monte Carlo simulation of the calorimeter response to jets forthe different |yjet
cal| regions. Previous analyses [2] for jets with 0.1 < |yjetcal| < 0.7 indicate that the simulation properly
reproduces both the average pjetT and the jet momentum resolution, σpjet
T
, as measured in the data. The study is
performed for the rest of the |yjetcal| regions using jets in the range 0.1 < |yjet
cal| < 0.7 as a reference. An exclusive dijetsample is selected, in data and simulated events, with the following criteria:
1. Events are required to have one and only one reconstructed primary vertex with z-position within 60 cm of thenominal interaction point.
2. Events are required to have exactly two jets with pjetT,cal > 10 GeV/c, where one of the jets must be in the region
0.1 < |yjetcal| < 0.7.
3. ET/ /√
ΣET < F (p jet1T,cal), as explained in Section IV.
The bisector method [38] is applied to data and simulated exclusive dijet events to test the accuracy of the simulatedσpjet
T
in the detector. The study indicates that the simulation systematically underestimates the measured σpjet
T
by
6% and 10% for jets in the regions 0.7 < |yjetcal| < 1.1 and 1.6 < |yjet
cal| < 2.1, respectively, with no significant pjetT,cal
dependence. An additional smearing of the reconstructed pjetT,cal is applied to the simulated events to account for
this effect. In the region 1.1 < |yjetcal| < 1.6, the measured σpjet
T
is overestimated by 5% in the simulation. The effect
on the final result is included via slightly modified unfolding factors (see Section IX). For jets with |yjetcal| < 0.1, the
simulation properly describes the measured σpjet
T
. Figure 3 shows the ratio between σpjet
T
in data and simulated events,
σdatapjet
T
/σmcpjet
T
, in different |yjetcal| regions as a function of the average pjet
T,cal of the dijet event. After corrections have
been applied to the simulated events, data and simulation agree. In the region 1.1 < |yjetcal| < 1.6, and only for the
7
purpose of presentation, a 5% smearing of the reconstructed pjetT,cal is applied to the data to show the resulting good
agreement with the uncorrected simulated resolution. The relative difference between data and simulated resolutionsis conservatively taken to be ±8% (see Fig. 3) over the whole range in pjet
T,cal and |yjetcal| in the evaluation of systematic
uncertainties.The average jet momentum calorimeter response in the simulation is then tested by comparing the pjet
T,cal balance
in data and simulated exclusive dijet events. The variable β, defined as [39]
β =1 + 〈∆〉1 − 〈∆〉 , with ∆ =
ptest jetT,cal − pref. jet
T,cal
ptest jetT,cal + pref. jet
T,cal
, (2)
is computed in data and simulated events in bins of (ptest jetT,cal + pref. jet
T,cal )/2, where pref. jetT,cal denotes the transverse
momentum of the jet in the region 0.1 < |yjetcal| < 0.7, and ptest jet
T,cal is the transverse momentum of the jet in the |yjetcal|
region under study. Figure 4 presents the ratios βdata/βmc as a function of pjetT,cal = ptest jet
T,cal in the different |yjetcal| bins.
The study indicates that small corrections are required around calorimeter gaps, |yjetcal| < 0.1 and 1.1 < |yjet
cal| < 1.6, as
well as in the most forward region, 1.6 < |yjetcal| < 2.1. For jets with |yjet
cal| > 1.1, the correction shows a moderate pjetT,cal
dependence, and several parameterizations are considered to extrapolate to very high pjetT,cal. The difference observed
in the final results, using different parameterizations, is included as part of the total systematic uncertainty.
VIII. RECONSTRUCTION OF THE JET VARIABLES
The jet reconstruction in the detector is studied using Monte Carlo event samples, with modified jet energy responsein the calorimeter, as described in the previous section, and pairs of jets at the calorimeter and hadron levels matched
in (y - φ) space by requiring√
(yjetcal − yjet
had)2 + (φjetcal − φjet
had)2 < D. These studies indicate that the angular variables
of a jet are reconstructed with no significant systematic shift and with a resolution better than 0.05 units in y andφ at low pjet
T,cal, improving as pjetT,cal increases. The measured pjet
T,cal systematically underestimates that of the hadron
level jet. This is attributed mainly to the non-compensating nature of the calorimeter [17]. For jets with pjetT,cal around
50 GeV/c, the jet transverse momentum is reconstructed with an average shift that varies between −9% and −30%
and a resolution between 10% and 16%, depending on the |yjetcal| region. The jet reconstruction improves as pjet
T,cal
increases. For jets with pjetT,cal around 500 GeV/c, the average shift is −7% and the resolution is about 7%.
IX. UNFOLDING
The measured pjetT,cal distributions in the different |yjet
cal| regions are unfolded back to the hadron level using simulated
event samples (see Section VI), after including the modified jet energy response described in Section VII. pythia-
tune a provides a reasonable description of the different jet and underlying event quantities, and is used to determinethe correction factors in the unfolding procedure. In order to avoid any potential bias on the correction factors dueto the particular PDF set used during the generation of the simulated samples, which translates into slightly differentsimulated pjet
T,cal distributions, the underlying pt spectrum [40] in pythia-tune a is re-weighted until the Monte Carlo
samples accurately follow each of the measured pjetT,cal distributions. The unfolding is carried out in two steps.
First, an average correction is computed separately in each jet rapidity region using corresponding matched pairsof jets at the calorimeter and hadron levels. The correlation 〈pjet
T,had − pjetT,cal〉 versus 〈pjet
T,cal〉 (see Fig. 5), computed in
bins of (pjetT,had + pjet
T,cal)/2, is used to extract correction factors which are then applied to the measured jets to obtain
the corrected transverse momenta, pjetT,cor. In each jet rapidity region, a cross section is defined as
d2σ
dpjetT,cordyjet
cal
=1
LN jet
cor
∆pjetT,cor ∆yjet
cal
, (3)
where N jetcor denotes the number of jets in a given pjet
T,cor bin, ∆pjetT,cor is the size of the bin, ∆yjet
cal denotes the size of
the region in yjetcal, and L is the integrated luminosity. N jet
cor includes event-by-event weights that account for trigger
prescale factors, and ∆pjetT,cor is chosen according to the jet momentum resolution.
8
Second, each measurement is corrected for acceptance and smearing effects using a bin-by-bin unfolding procedure,which also accounts for the efficiency of the selection criteria. The unfolding factors, defined as
U(pjetT,cor, y
jetcal) =
d2σ/dpjetT,haddyjet
had
d2σ/dpjetT,cordyjet
cal
, (4)
are extracted from Monte Carlo event samples and applied to the measured pjetT,cor distributions to obtain the final
results. As shown in Fig. 6, the factor U(pjetT,cor, y
jetcal) increases with pjet
T,cor and presents a moderate |yjetcal| dependence.
At low pjetT,cor, the unfolding factor varies between 1.02 and 1.06 for different rapidity regions. For jets with pjet
T,cor
of about 300 GeV/c, the factor varies between 1.1 and 1.2, and increases up to 1.3 - 1.4 at very high pjetT,cor. In the
region 1.1 < |yjetcal| < 1.6, the unfolding factor includes an additional correction, fU(pjet
T,cor), to account for the fact
that the simulation overestimates the jet momentum resolution in that region (see Section VII). The factor fU(pjetT,cor)
is computed from Monte Carlo samples as the ratio between the pjetT,had distribution smeared using the simulated σpjet
T
and the one smeared using σpjet
T
in data as extracted from the bisector method (see Section VII). The factor fU(pjetT,cor)
is about 1.03 and shows no significant pjetT,cor dependence.
X. SYSTEMATIC UNCERTAINTIES
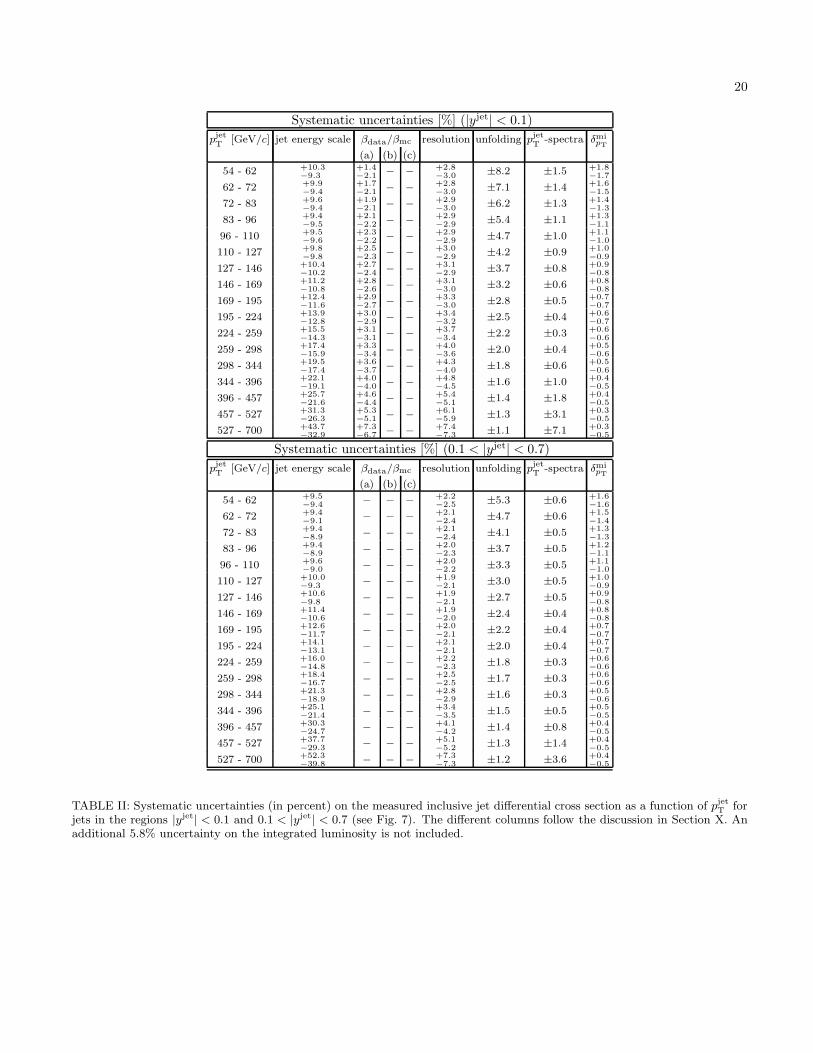
A detailed study of the systematic uncertainties on the measurements has been carried out [41]. Tables II-III show
the different contributions to the total systematic uncertainty in each pjetT bin and |yjet| region:
1. The measured jet energies are varied by ±2% at low pjetT to ±2.7% at high pjet
T to account for the uncertainty onthe absolute energy scale in the calorimeter [42]. This introduces an uncertainty on the measured cross sections
which varies between ±9% at low pjetT and +61%
−39% at high pjetT , and dominates the total systematic uncertainty on
the different measurements.
2. Several sources of systematic uncertainty on the ratio βdata/βmc are considered for the different |yjet| regions:
(a) The uncertainty on the definition of the exclusive dijet sample in data and Monte Carlo events introducesa ±0.5% uncertainty on the absolute energy scale for jets outside the region 0.1 < |yjet| < 0.7, which
translates into an uncertainty on the cross sections between ±2% at low pjetT and ±10% at very high pjet
T .
(b) The use of different βdata/βmc parameterizations for jets with |yjet| > 1.1 introduces uncertainties between
12% and 23% at very high pjetT .
(c) In the region 1.1 < |yjet| < 1.6, an additional +0%−3% uncertainty on the measured cross sections, independent
of pjetT , accounts for variations in the βdata/βmc ratio due to the overestimation of the jet momentum
resolution in the simulated samples.
3. A ±8% uncertainty on the jet momentum resolution introduces an uncertainty between ±2% at low pjetT and
+12%−9% at high pjet
T .
4. The unfolding procedure is repeated using herwig instead of pythia-tune a to account for the uncertainty onthe modeling of the parton cascades and the jet fragmentation into hadrons. This translates into an uncertaintyon the measured cross sections between ±3% and ±8% at low pjet
T that becomes negligible at very high pjetT .
5. The unfolding procedure is also carried out using unweighted pythia-tune a, to estimate the residual depen-dence on the pjet
T spectra. This introduces an uncertainty of about ±3% to ±7% at very high pjetT , which becomes
negligible at low pjetT .
6. The quoted ±0.23 GeV/c uncertainty on δmipT
is taken into account. The maximal effect on the measured crosssections is about ±2%.
7. Different sources of systematic uncertainty related to the selection criteria are considered. The threshold on thez-position of the primary vertex is varied by ±5 cm in data and simulated events. The lower edge of each pjet
T,cal
bin is varied by ±3% in data and simulated events. The ET/ scale is varied by ±10% in the data. The totaleffect on the measured cross sections is smaller than 1% and considered negligible.

9
Positive and negative deviations with respect to the nominal values in each pjetT bin are added separately in quadrature.
Figure 7 shows the total systematic uncertainty as a function of pjetT in the different |yjet| regions, where an additional
5.8% uncertainty on the total luminosity is not included.
XI. QCD PREDICTIONS
The measurements are compared to parton-level NLO pQCD predictions, as computed using jetrad [10] with
CTEQ6.1M PDFs [11] and the renormalization and factorization scales (µR and µF ) both set to µ0 = max(pjetT )/2.
Different sources of uncertainty on the theoretical predictions are considered. The main contribution comes fromthe uncertainty on the PDFs and is computed using the Hessian method [43]. At low pjet
T , the uncertainty is about
±5% and approximately independent of yjet. The uncertainty increases as pjetT and |yjet| increase. At very high pjet
T ,
the uncertainty varies between +60%−30% and +130%
−40% for jets with |yjet| < 0.1 and 1.6 < |yjet| < 2.1, respectively, andis dominated by the limited knowledge of the gluon PDF. An increase of µR and µF from µ0 to 2µ0 changes thetheoretical predictions by only a few percent. Values significantly smaller than µ0 lead to unstable NLO results andare not considered.
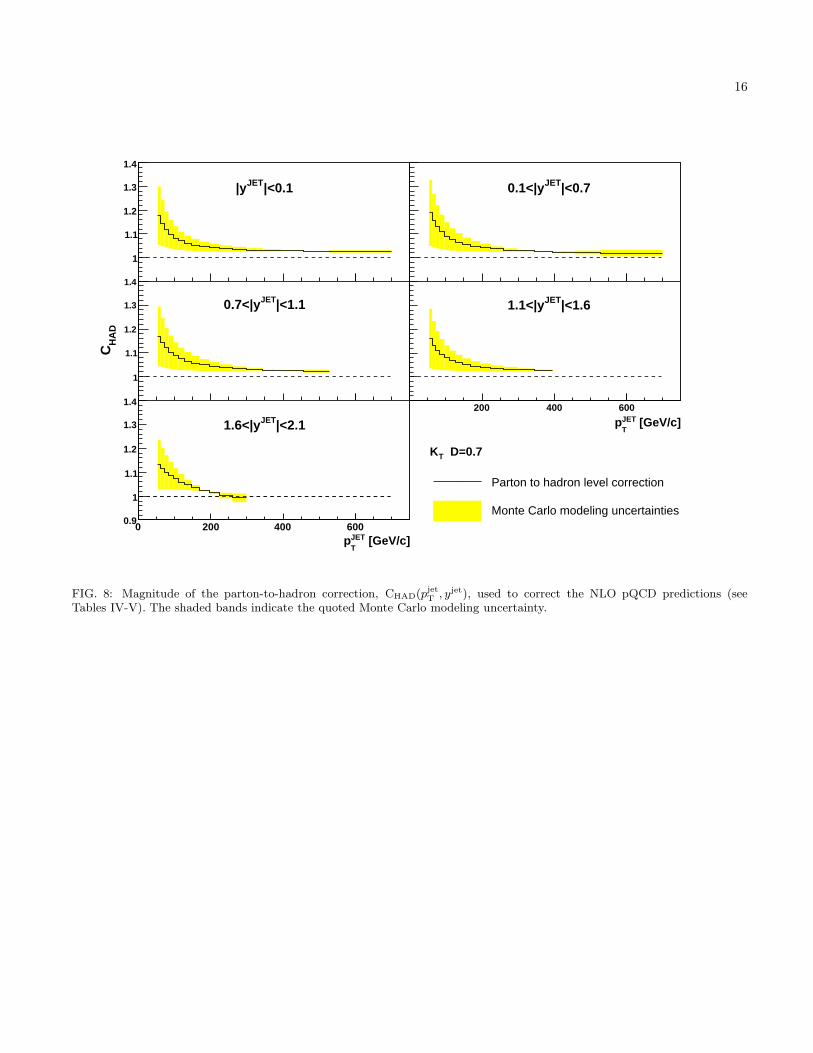
The theoretical predictions include a correction factor, CHAD(pjetT , yjet), that approximately accounts for non-
perturbative contributions from the underlying event and fragmentation of partons into hadrons (see Fig. 8 andTables IV-V). In each jet rapidity region, CHAD is estimated, using pythia-tune a, as the ratio between the nominal
pjetT,had distribution and the one obtained after removing the interactions between p and p remnants and the fragmen-
tation into hadrons in the Monte Carlo samples. The correction decreases as pjetT increases and shows a moderate
|yjet| dependence. At low pjetT , CHAD varies between 1.18 and 1.13 as |yjet| increases, and it becomes of the order of
1.02 at very high pjetT . The uncertainty on CHAD varies between ±9% and ±12% at low pjet
T and decreases to about
±1% at very high pjetT , as determined from the difference between the parton-to-hadron correction factors obtained
using herwig instead of pythia-tune a.
XII. RESULTS
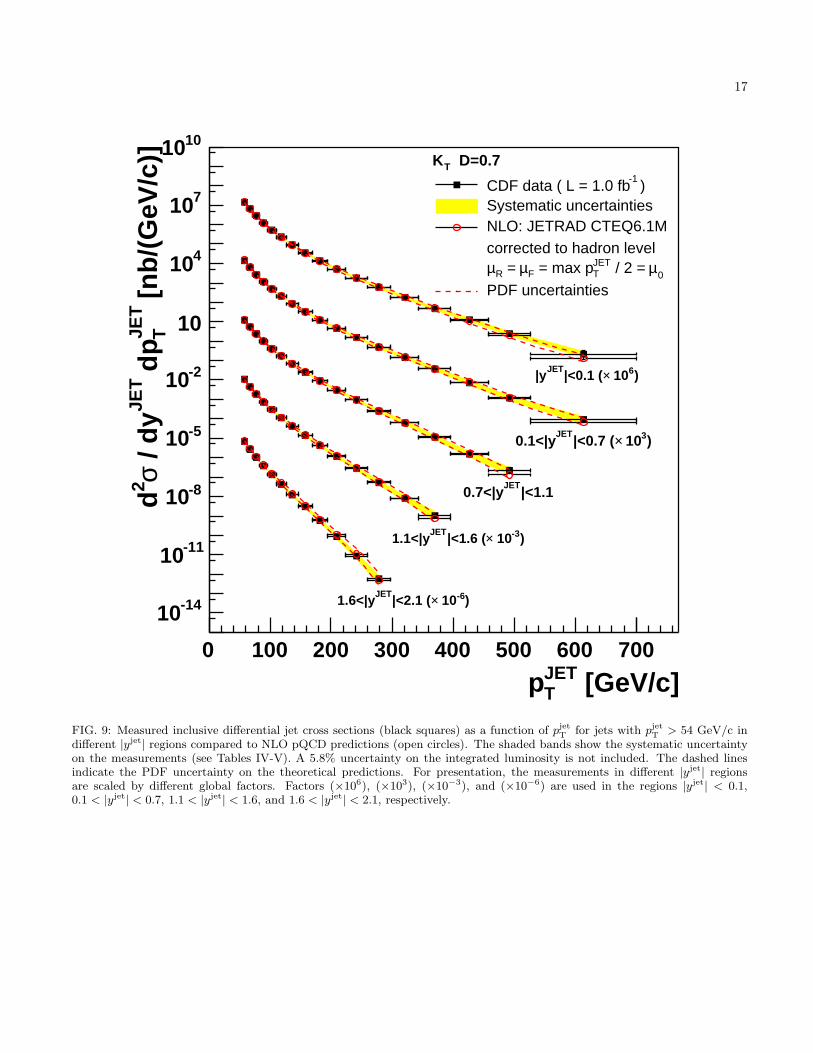
The measured inclusive jet cross sections, d2σ/dpjetT dyjet, refer to hadron-level jets, reconstructed using the kT
algorithm with D = 0.7, in the region pjetT > 54 GeV/c and |yjet| < 2.1. Figure 9 shows the measured cross sections
as a function of pjetT in five different |yjet| regions compared to NLO pQCD predictions. The data are reported in
Tables IV-V. The measured cross sections decrease by more than seven to eight orders of magnitude as pjetT increases.
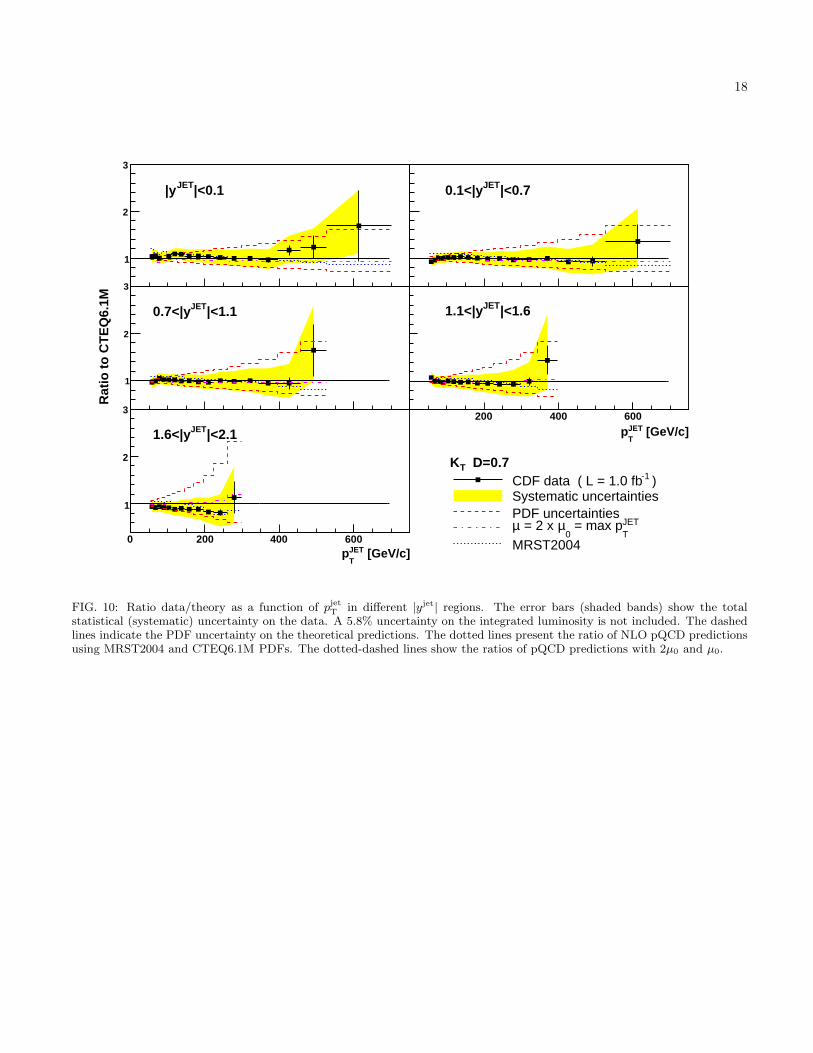
Figure 10 shows the ratio data/theory as a function of pjetT in the five different |yjet| regions. Good agreement is
observed in the whole range in pjetT and yjet between the measured cross sections and the theoretical predictions.
In particular, no significant deviation from the pQCD prediction is observed for central jets at high pjetT . The
corresponding χ2 tests, relative to the nominal pQCD prediction and performed separately in each |yjet| region, giveprobabilities that vary between 9% and 90%. A global χ2 test, applied to all the data points in all |yjet| regionssimultaneously, gives a probability of 7%. In both cases, a detailed treatment of correlations between systematicuncertainties was considered, as discussed in Appendix A. In addition, Fig. 10 shows the ratio of pQCD predictionsusing MRST2004 [12] and CTEQ6.1M PDF sets, well inside the theoretical and experimental uncertainties. The
uncertainty on the measured cross sections at high pjetT , compared to that on the theoretical predictions, indicates
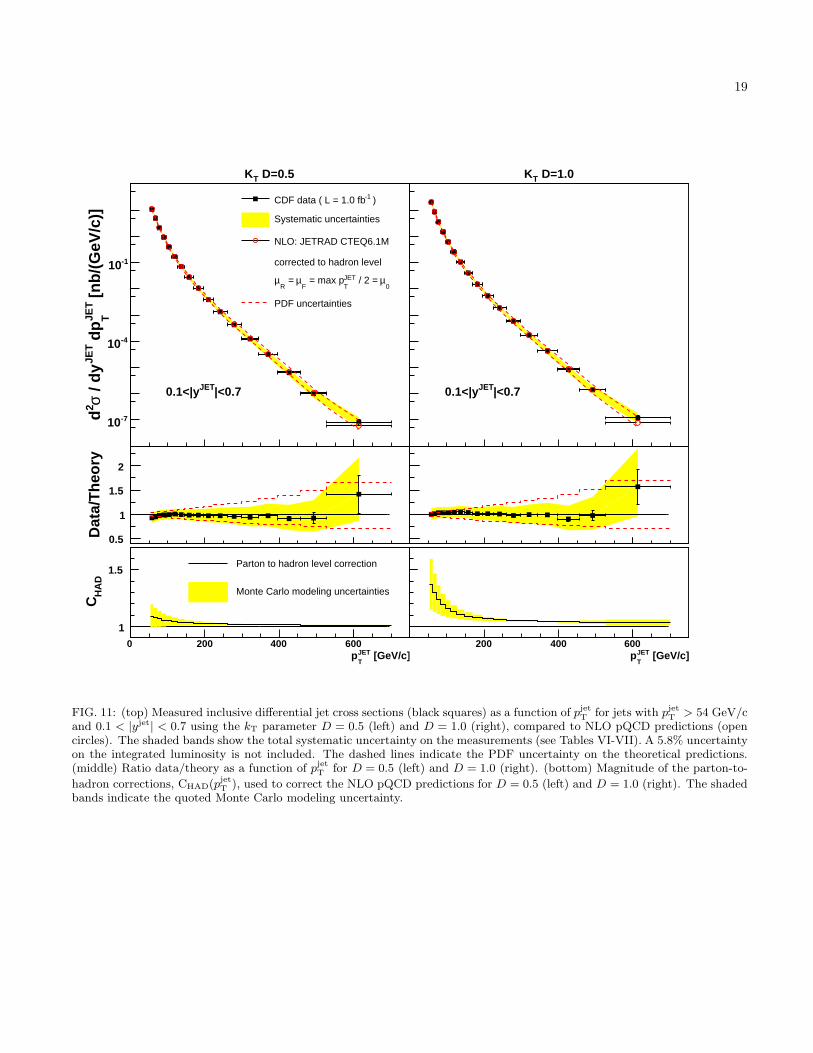
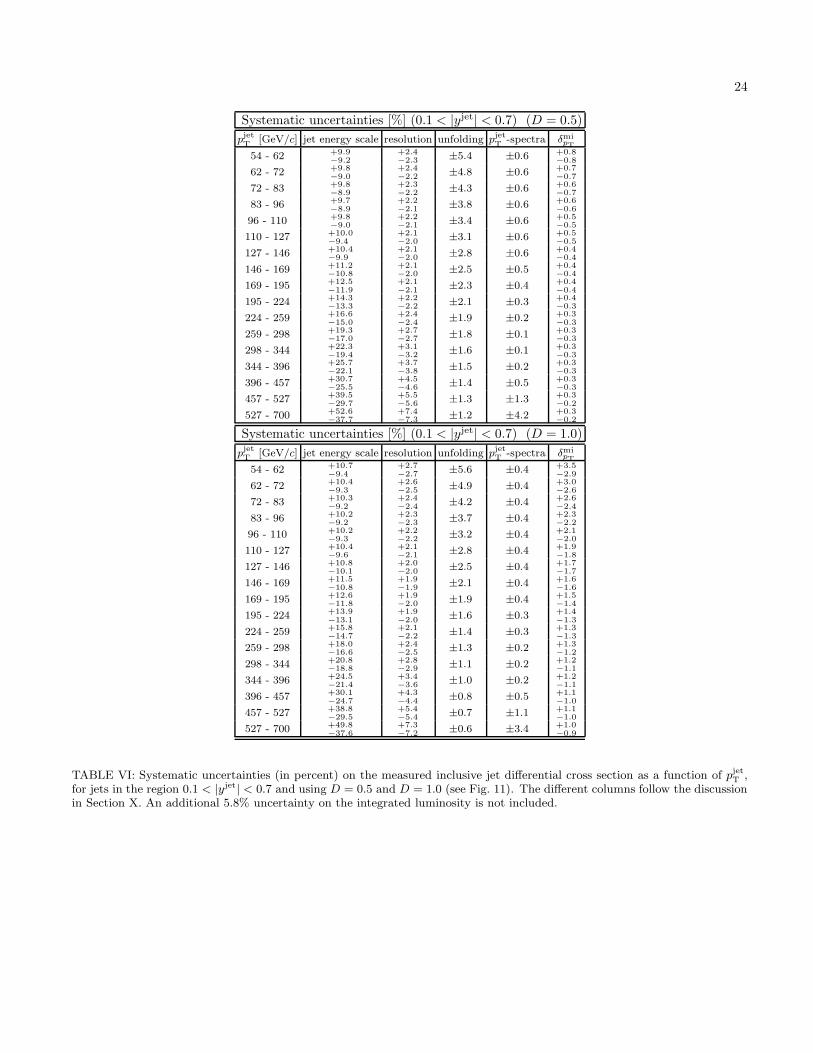
that the data presented in this article will contribute to a better understanding of the gluon PDF.Finally, in the region 0.1 < |yjet| < 0.7, the analysis is repeated using different values for D in the kT algorithm:
D = 0.5 and D = 1.0. In both cases, good agreement is observed between the measured cross sections and theNLO pQCD predictions in the whole range in pjet
T (see Fig. 11 and Tables VI-VII). The corresponding χ2 tests giveprobabilities of 84% and 22% for D = 0.5 and D = 1.0, respectively. As D decreases, the measurement is lesssensitive to contributions from multiple pp interactions per bunch crossing, and the presence and proper modeling ofthe underlying event. For D = 0.5 (D = 1.0), the value for δmi
pTbecomes 1.18 ± 0.12 (3.31 ± 0.47) GeV/c, and the
parton-to-hadron correction factor applied to the pQCD predictions is CHAD = 1.1 (CHAD = 1.4) at low pjetT .
10
XIII. SUMMARY AND CONCLUSIONS
We have presented results on inclusive jet production in pp collisions at√
s = 1.96 TeV for jets with transverse
momentum pjetT > 54 GeV/c and rapidity in the region |yjet| < 2.1, using the kT algorithm and based on 1.0 fb−1 of
CDF Run II data. The measured cross sections are in agreement with NLO pQCD predictions after the necessarynon-perturbative parton-to-hadron corrections are taken into account. The results reported in this article shouldcontribute to a better understanding of the gluon PDF inside the proton when used in QCD global fits.
Acknowledgments
We thank the Fermilab staff and the technical staffs of the participating institutions for their vital contributions.This work was supported by the U.S. Department of Energy and National Science Foundation; the Italian IstitutoNazionale di Fisica Nucleare; the Ministry of Education, Culture, Sports, Science and Technology of Japan; theNatural Sciences and Engineering Research Council of Canada; the National Science Council of the Republic ofChina; the Swiss National Science Foundation; the A.P. Sloan Foundation; the Bundesministerium fur Bildung undForschung, Germany; the Korean Science and Engineering Foundation and the Korean Research Foundation; theParticle Physics and Astronomy Research Council and the Royal Society, UK; the Institut National de PhysiqueNucleaire et Physique des Particules/CNRS; the Russian Foundation for Basic Research; the Comision Interministerialde Ciencia y Tecnologıa, Spain; the European Community’s Human Potential Programme under contract HPRN-CT-2002-00292; and the Academy of Finland.
[1] D.J. Gross and F. Wilczek, Phys. Rev. D 8, 3633 (1973);H. Fritzsch, M. Gell-Mann, H. Leutwyler, Phys. Lett. B47, 365 (1973).
[2] A. Abulencia et al. (CDF Collaboration), Phys. Rev. Lett. 96, 122001 (2006).[3] A. Abulencia et al. (CDF Collaboration), Phys. Rev. D 74, 071103(R) (2006).[4] T. Affolder et al. (CDF Collaboration), Phys. Rev. D 64, 032001 (2001). [Erratum-ibid. D 65, 039903 (2002)].[5] B. Abbott et al. (DØ Collaboration), Phys. Rev. Lett. 82, 2451 (1999).[6] V.M. Abazov et al. (DØ Collaboration), Phys. Lett. B 525, 211 (2002).[7] S. Catani et al., Nucl. Phys. B406, 187 (1993).[8] S.D. Ellis and D.E. Soper, Phys. Rev. D 48, 3160 (1993).[9] We use a cylindrical coordinate system about the beam axis in which the proton defines the positive z-direction, θ is the
polar angle, and φ is the azimuthal angle. We define ET = E sinθ, pT = p sinθ, η = −ln(tan( θ2)), and y = 1
2ln( E+pz
E−pz
).
[10] W.T. Giele, E.W.N. Glover, D.A. Kosower, Nucl. Phys. B403, 633 (1993).[11] J. Pumplin et al., J. High Energy Phys. 0207, 012 (2002).[12] A.D. Martin et al., Eur. Phys. J. C 23, 73 (2002).[13] The hadron level in the Monte Carlo generators is defined using all final-state particles with lifetime above 10−11s.[14] D. Acosta et al. (CDF Collaboration), Phys. Rev. D 71, 032001 (2005).[15] A. Sill et al., Nucl. Instrum. Methods A 447, 1 (2000);
A. Affolder et al., Nucl. Instrum. Methods A 453, 84 (2000);C.S. Hill, Nucl. Instrum. Methods A 530, 1 (2000).
[16] T. Affolder et al., Nucl. Instrum. Methods A 526, 249 (2004).[17] L. Balka et al., Nucl. Instrum. Methods A 267, 272 (1988);
S.R. Hahn, et al., Nucl. Instrum. Methods A 267 351 (1988).[18] S. Bertolucci et al., Nucl. Instrum. Methods A 267, 301 (1988).[19] R. Oishi, Nucl. Instrum. Methods A 453, 277 (2000);
M.G. Albrow et al., Nucl. Instrum. Methods A 480, 524 (2002).[20] D. Acosta et al., Nucl. Instrum. Meth., A 494, 57 (2002).[21] The electromagnetic and hadronic sections of a calorimeter tower are defined massless. For each of them, the four-
momentum is constructed using its energy and its position with respect to the interaction point.[22] B.L. Winer, Int. J. Mod. Phys. A 16S1C, 1169 (2001).[23] In order to reduce online trigger rates, different prescale factors are applied to trigger paths. For a given trigger path, a
prescale of 1000 would indicate that only one of every 1000 events satisfying the trigger requirements is selected.[24] A trigger tower is defined adding the information of two adjacent calorimeter towers.[25] F. Abe et al. (CDF Collaboration), Phys. Rev. D 45, 1448 (1992).[26] ET/ is defined as the norm of −
∑
iEi
T ·~ni, where ~ni is the unit vector in the azimuthal plane that points from the beamlineto the i-th calorimeter tower.
[27] R. Brun et al., Tech. Rep. CERN-DD/EE/84-1, 1987 (unpublished).
11
[28] G. Grindhammer, M. Rudowicz and S. Peters, Nucl. Instrum. Methods A 290, 469 (1990).[29] T. Sjostrand et al., Comp. Phys. Comm. 135, 238 (2001).[30] G. Corcella et al., J. High Energy Phys. 0101, 010 (2001).[31] H.L. Lai et al., Eur. Phys. J. C 12, 375 (2000).[32] pythia-tune a Monte Carlo samples are generated using the following tuned parameters in pythia: PARP(67) = 4.0,
MSTP(82) = 4, PARP(82) = 2.0, PARP(84) = 0.4, PARP(85) = 0.9, PARP(86) = 0.95, PARP(89) = 1800.0, PARP(90)= 0.25.
[33] T. Affolder et al. (CDF Collaboration), Phys. Rev. D 65, 092002 (2002).[34] D. Acosta et al. (CDF Collaboration), Phys. Rev. D 71, 112002 (2005).[35] B. Andersson et al., Phys. Rep. 97, 31 (1983).[36] T. Sjostrand, Comp. Phys. Comm. 39, 347 (1986).[37] B.R. Webber, Nucl. Phys. B238, 492 (1984).[38] P. Bagnaia et al. (UA2 Collaboration), Phys. Lett. B 144, 283 (1984).
[39] If considered event-by-event, β is equivalent to ptest jetT,cal /pref. jet
T,cal . However, Eq. (2) is preferred since ∆ follows a Gaussian
distribution while the ratio ptest jet
T,cal/pref. jet
T,calsuffers from important non-Gaussian tails.
[40] pt is defined for two-body reactions in terms of Mandelstam variables as pt =
√
t·us
.
[41] O. Norniella, Inclusive Jet Production Studies at the Tevatron using the CDF Detector, Ph.D. thesis, Universidad Autonomade Barcelona, 2007.
[42] A. Bhatti et al., Nucl. Instrum. Methods A 566, 375 (2006).[43] J. Pumplin et al., Phys. Rev. D 65, 014013 (2002).
12
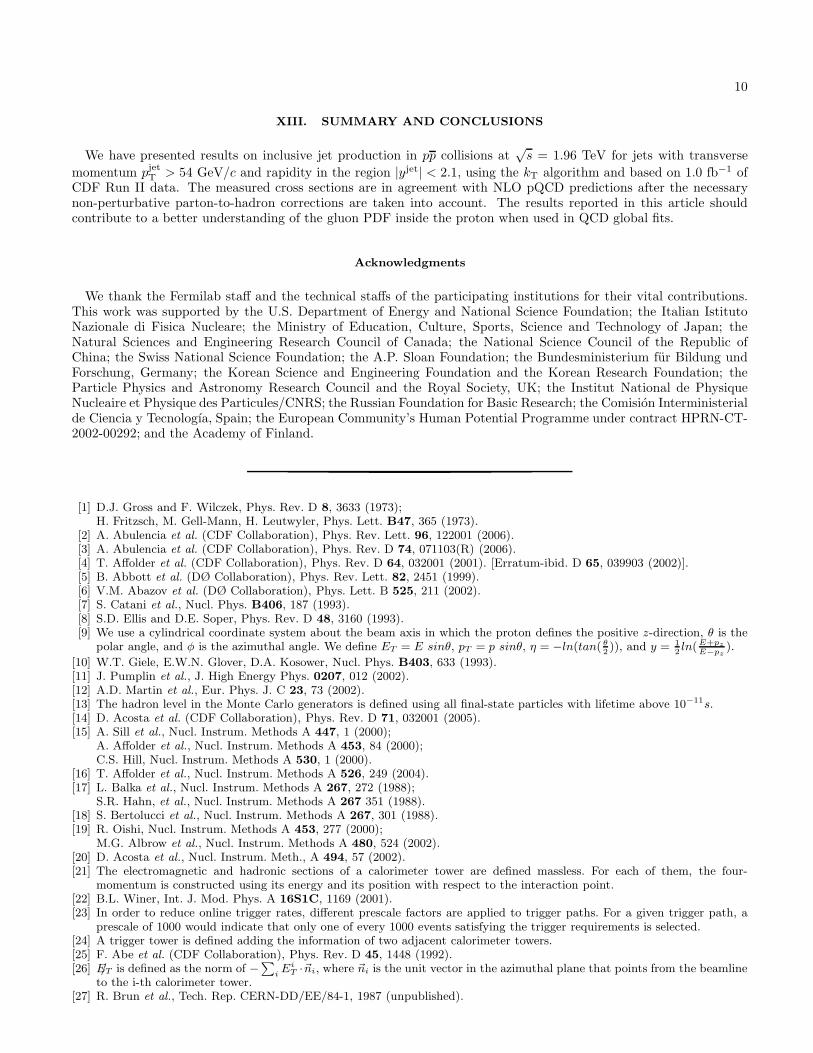
FIG. 1: Elevation view of one half of the CDF detector displaying the components of the CDF calorimeter.
[GeV/c]JETT,CAL
p20 40 60 80 100 120 140 160 180
Tri
gg
er e
ffic
ien
cy
0.8
0.85
0.9
0.95
1
1.05
JET 20
JET 50
JET 70
JET 100
|<0.7JET
CAL0.1<|y
FIG. 2: Measured trigger efficiencies as a function of pjet
T,calfor different trigger paths and in the region 0.1 < |yjet
cal| < 0.7.
13
0.8
0.9
1
1.1
1.2
1.3
|<0.1CALJET
|y |<0.7CALJET0.1<|y
MC JE
TT
pσ/D
AT
AJE
TT
pσ
0.8
0.9
1
1.1
1.2
1.3
|<1.1CALJET0.7<|y
(dijet) [GeV/c]JETT,CALaverage p
100 200 300
|<1.6CALJET1.1<|y
(dijet) [GeV/c]JETT,CALaverage p
0 100 200 3000.7
0.8
0.9
1
1.1
1.2
1.3
|<2.1CALJET1.6<|y
Ratio Data/MC before corrections
Ratio Data/MC after corrections
fit after corrections
8% Systematic uncertainty
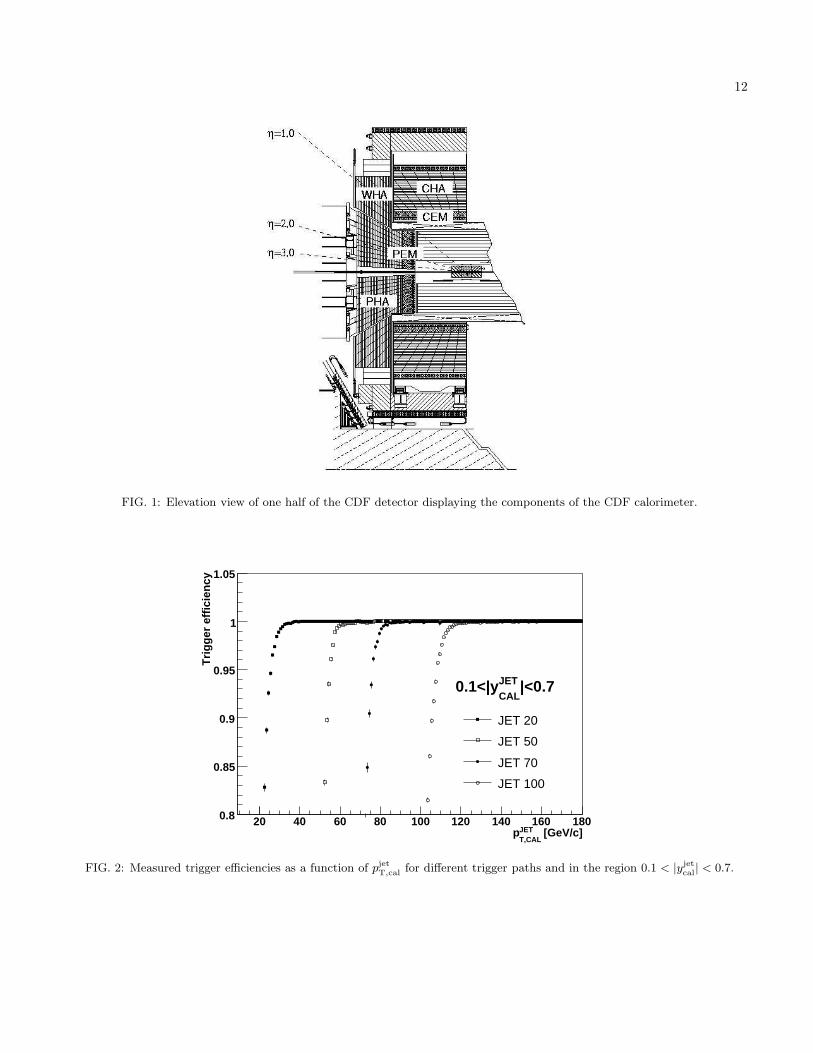
FIG. 3: Ratio σdata
pjet
T
/σmc
pjet
T
as a function of the average pjetT,cal of the dijet event, in different |yjet
cal| regions, before (black squares)
and after (open circles) corrections have been applied (see Section VII). The solid lines are fits to the corrected ratios. Thedashed lines indicate a ±8% relative variation considered in the study of systematic uncertainties.
0.95
1
1.05
|<0.1CALJET|y |<0.7CAL
JET0.1<|y
MC
β /D
AT
Aβ 0.95
1
1.05
|<1.1CALJET0.7<|y
[GeV/c]JETT,CAL
p100 200 300 400
|<1.6CALJET1.1<|y
[GeV/c]JETT,CAL
p100 200 300 400
0.95
1
1.05
|<2.1CALJET1.6<|y
Ratio Data/MCfit to the ratioSystematic uncertainty
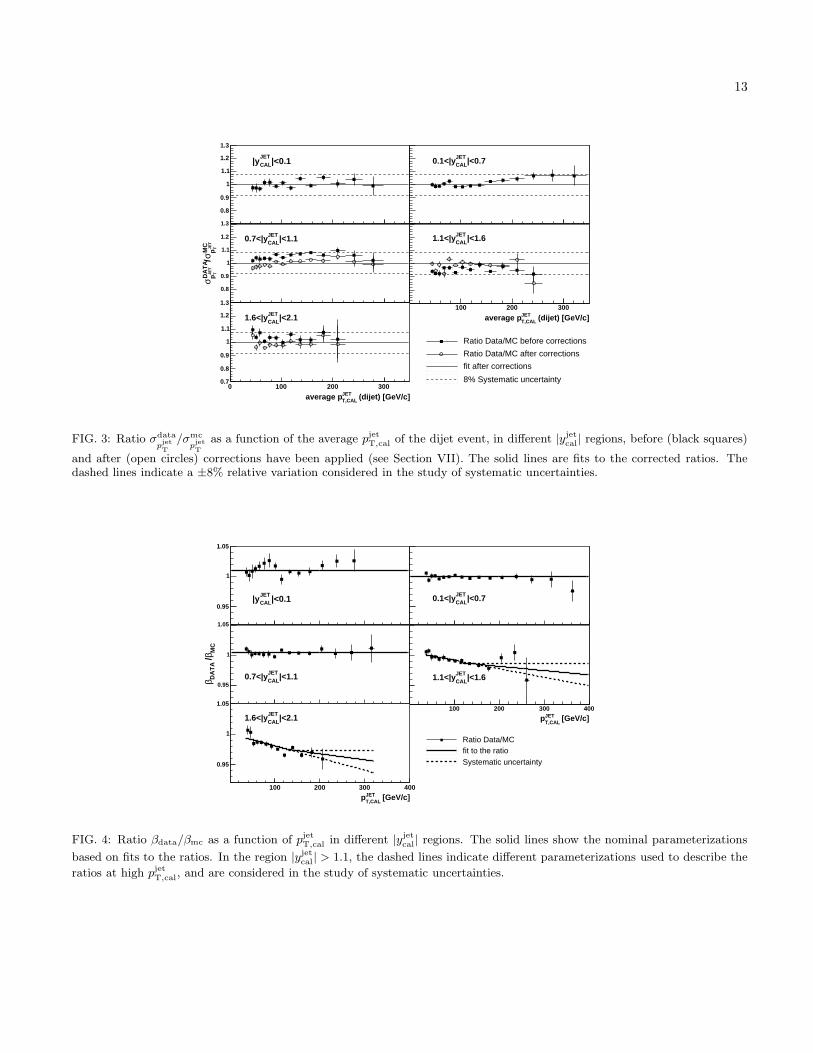
FIG. 4: Ratio βdata/βmc as a function of pjet
T,cal in different |yjet
cal| regions. The solid lines show the nominal parameterizations
based on fits to the ratios. In the region |yjetcal| > 1.1, the dashed lines indicate different parameterizations used to describe the
ratios at high pjet
T,cal, and are considered in the study of systematic uncertainties.

14
10
20
30
40
50
|<0.1CALJET|y |<0.7CAL
JET0.1<|y
> [G
eV/c
] JE
TT
,CA
L -
pJE
TT
,HA
D<p
10
20
30
40
50
60
|<1.1CALJET0.7<|y
> [GeV/c]JETT,CAL
<p200 400 600
|<1.6CALJET1.1<|y
> [GeV/c]JETT,CAL
<p200 400 600
0
5
10
15
|<2.1CALJET1.6<|y
fit to correlation
FIG. 5: Correlation 〈pjetT,had − pjet
T,cal〉 versus 〈pjetT,cal〉, as extracted from pythia tune a simulated event samples, in the different
|yjet
cal| regions.
1
1.2
1.4
1.6|<0.1CAL
JET|y |<0.7CAL
JET0.1<|y
Un
fold
ing
fac
tors
1
1.2
1.4
1.6|<1.1CAL
JET0.7<|y
[GeV/c]JETT,COR
p200 400 600
|<1.6CALJET1.1<|y
[GeV/c]JETT,COR
p0 200 400 600
0.8
1
1.2
1.4
1.6|<2.1CAL
JET1.6<|y
FIG. 6: Unfolding factors, U(pjetT,cor, y
jet
cal), as extracted from pythia tune a simulated event samples, as a function of pjetT,cor in
the different |yjetcal| regions.

15
-50
0
50
100
|<0.1JET
|y |<0.7JET
0.1<|y
Sys
tem
atic
[%
]
-50
0
50
100
|<1.1JET
0.7<|y
[GeV/c]JETTp
200 400 600
|<1.6JET
1.1<|y
[GeV/c]JETTp
0 200 400 600-100
-50
0
50
100
|<2.1JET
1.6<|yTo
tal S
yste
mat
ic U
nce
rtai
nty
[%]
FIG. 7: Total systematic uncertainty (in percent) on the measured inclusive differential jet cross sections as a function pjetT for
the different |yjet| regions (see Tables II-III). An additional 5.8% uncertainty on the integrated luminosity is not included.
16
1
1.1
1.2
1.3
1.4
|<0.1JET|y |<0.7JET0.1<|y
HA
DC
1
1.1
1.2
1.3
1.4
|<1.1JET0.7<|y
[GeV/c]JETT
p200 400 600
|<1.6JET1.1<|y
[GeV/c]JETT
p0 200 400 600
0.9
1
1.1
1.2
1.3
1.4
|<2.1JET1.6<|y
D=0.7 TK
Parton to hadron level correction
Monte Carlo modeling uncertainties
FIG. 8: Magnitude of the parton-to-hadron correction, CHAD(pjetT , yjet), used to correct the NLO pQCD predictions (see
Tables IV-V). The shaded bands indicate the quoted Monte Carlo modeling uncertainty.
17
[GeV/c]JETTp
0 100 200 300 400 500 600 700
[n
b/(
GeV
/c)]
JET
T d
pJE
T /
dy
σ2d
-1410
-1110
-810
-510
-210
10
410
710
1010 D=0.7TK
)-1CDF data ( L = 1.0 fbSystematic uncertaintiesNLO: JETRAD CTEQ6.1Mcorrected to hadron level
0µ / 2 = JETT = max pFµ = Rµ
PDF uncertainties
)-6 10×|<2.1 (JET1.6<|y
)-3 10×|<1.6 (JET1.1<|y
|<1.1JET
0.7<|y
)3 10×|<0.7 (JET
0.1<|y
)6 10×|<0.1 (JET|y
FIG. 9: Measured inclusive differential jet cross sections (black squares) as a function of pjetT for jets with pjet
T > 54 GeV/c indifferent |yjet| regions compared to NLO pQCD predictions (open circles). The shaded bands show the systematic uncertaintyon the measurements (see Tables IV-V). A 5.8% uncertainty on the integrated luminosity is not included. The dashed linesindicate the PDF uncertainty on the theoretical predictions. For presentation, the measurements in different |yjet| regionsare scaled by different global factors. Factors (×106), (×103), (×10−3), and (×10−6) are used in the regions |yjet| < 0.1,0.1 < |yjet| < 0.7, 1.1 < |yjet| < 1.6, and 1.6 < |yjet| < 2.1, respectively.
18
1
2
3
|<0.1JET|y |<0.7JET0.1<|y
Rat
io t
o C
TE
Q6.
1M
1
2
3
|<1.1JET0.7<|y
[GeV/c]JETT
p200 400 600
|<1.6JET1.1<|y
[GeV/c]JETT
p0 200 400 600
1
2
3
|<2.1JET1.6<|y
D=0.7 TK )-1CDF data ( L = 1.0 fb
Systematic uncertaintiesPDF uncertainties
JETT
= max p0
µ = 2 x µMRST2004
FIG. 10: Ratio data/theory as a function of pjetT in different |yjet| regions. The error bars (shaded bands) show the total
statistical (systematic) uncertainty on the data. A 5.8% uncertainty on the integrated luminosity is not included. The dashedlines indicate the PDF uncertainty on the theoretical predictions. The dotted lines present the ratio of NLO pQCD predictionsusing MRST2004 and CTEQ6.1M PDFs. The dotted-dashed lines show the ratios of pQCD predictions with 2µ0 and µ0.
19 [
nb
/(G
eV/c
)]JE
T
T d
pJE
T /
dy
σ2d -710
-410
-110
)-1CDF data ( L = 1.0 fb
Systematic uncertainties
NLO: JETRAD CTEQ6.1M
corrected to hadron level
0µ / 2 = JET
T = max p
Fµ =
Rµ
PDF uncertainties
|<0.7JET0.1<|y
D=0.5TK
|<0.7JET0.1<|y
D=1.0TK
Dat
a/T
heo
ry
0.5
1
1.5
2
[GeV/c]JETT
p0 200 400 600
HA
DC
1
1.5Parton to hadron level correction
Monte Carlo modeling uncertainties
[GeV/c]JETT
p200 400 600
FIG. 11: (top) Measured inclusive differential jet cross sections (black squares) as a function of pjetT for jets with pjet
T > 54 GeV/cand 0.1 < |yjet| < 0.7 using the kT parameter D = 0.5 (left) and D = 1.0 (right), compared to NLO pQCD predictions (opencircles). The shaded bands show the total systematic uncertainty on the measurements (see Tables VI-VII). A 5.8% uncertaintyon the integrated luminosity is not included. The dashed lines indicate the PDF uncertainty on the theoretical predictions.(middle) Ratio data/theory as a function of pjet
T for D = 0.5 (left) and D = 1.0 (right). (bottom) Magnitude of the parton-to-
hadron corrections, CHAD(pjetT ), used to correct the NLO pQCD predictions for D = 0.5 (left) and D = 1.0 (right). The shaded
bands indicate the quoted Monte Carlo modeling uncertainty.
20
Systematic uncertainties [%] (|yjet| < 0.1)
pjetT
[GeV/c] jet energy scale βdata/βmc resolution unfolding pjetT
-spectra δmipT
(a) (b) (c)
54 - 62 +10.3−9.3
+1.4−2.1
− −+2.8−3.0
±8.2 ±1.5 +1.8−1.7
62 - 72 +9.9−9.4
+1.7−2.1 − −
+2.8−3.0 ±7.1 ±1.4 +1.6
−1.5
72 - 83 +9.6−9.4
+1.9−2.1
− −+2.9−3.0
±6.2 ±1.3 +1.4−1.3
83 - 96 +9.4−9.5
+2.1−2.2
− −+2.9−2.9
±5.4 ±1.1 +1.3−1.1
96 - 110 +9.5−9.6
+2.3−2.2 − −
+2.9−2.9 ±4.7 ±1.0 +1.1
−1.0
110 - 127 +9.8−9.8
+2.5−2.3
− −+3.0−2.9
±4.2 ±0.9 +1.0−0.9
127 - 146 +10.4−10.2
+2.7−2.4 − −
+3.1−2.9 ±3.7 ±0.8 +0.9
−0.8
146 - 169 +11.2−10.8
+2.8−2.6
− −+3.1−3.0
±3.2 ±0.6 +0.8−0.8
169 - 195 +12.4−11.6
+2.9−2.7 − −
+3.3−3.0 ±2.8 ±0.5 +0.7
−0.7
195 - 224 +13.9−12.8
+3.0−2.9
− −+3.4−3.2
±2.5 ±0.4 +0.6−0.7
224 - 259 +15.5−14.3
+3.1−3.1
− −+3.7−3.4
±2.2 ±0.3 +0.6−0.6
259 - 298 +17.4−15.9
+3.3−3.4 − −
+4.0−3.6 ±2.0 ±0.4 +0.5
−0.6
298 - 344 +19.5−17.4
+3.6−3.7
− −+4.3−4.0
±1.8 ±0.6 +0.5−0.6
344 - 396 +22.1−19.1
+4.0−4.0 − −
+4.8−4.5 ±1.6 ±1.0 +0.4
−0.5
396 - 457 +25.7−21.6
+4.6−4.4
− −+5.4−5.1
±1.4 ±1.8 +0.4−0.5
457 - 527 +31.3−26.3
+5.3−5.1 − −
+6.1−5.9 ±1.3 ±3.1 +0.3
−0.5
527 - 700 +43.7−32.9
+7.3−6.7
− −+7.4−7.3
±1.1 ±7.1 +0.3−0.5
Systematic uncertainties [%] (0.1 < |yjet| < 0.7)
pjetT
[GeV/c] jet energy scale βdata/βmc resolution unfolding pjetT
-spectra δmipT
(a) (b) (c)
54 - 62 +9.5−9.4 − − −
+2.2−2.5 ±5.3 ±0.6 +1.6
−1.6
62 - 72 +9.4−9.1
− − −+2.1−2.4
±4.7 ±0.6 +1.5−1.4
72 - 83 +9.4−8.9 − − −
+2.1−2.4 ±4.1 ±0.5 +1.3
−1.3
83 - 96 +9.4−8.9
− − −+2.0−2.3
±3.7 ±0.5 +1.2−1.1
96 - 110 +9.6−9.0 − − −
+2.0−2.2 ±3.3 ±0.5 +1.1
−1.0
110 - 127 +10.0−9.3
− − −+1.9−2.1
±3.0 ±0.5 +1.0−0.9
127 - 146 +10.6−9.8
− − −+1.9−2.1
±2.7 ±0.5 +0.9−0.8
146 - 169 +11.4−10.6 − − −
+1.9−2.0 ±2.4 ±0.4 +0.8
−0.8
169 - 195 +12.6−11.7
− − −+2.0−2.1
±2.2 ±0.4 +0.7−0.7
195 - 224 +14.1−13.1 − − −
+2.1−2.1 ±2.0 ±0.4 +0.7
−0.7
224 - 259 +16.0−14.8
− − −+2.2−2.3
±1.8 ±0.3 +0.6−0.6
259 - 298 +18.4−16.7 − − −
+2.5−2.5 ±1.7 ±0.3 +0.6
−0.6
298 - 344 +21.3−18.9
− − −+2.8−2.9
±1.6 ±0.3 +0.5−0.6
344 - 396 +25.1−21.4
− − −+3.4−3.5
±1.5 ±0.5 +0.5−0.5
396 - 457 +30.3−24.7 − − −
+4.1−4.2 ±1.4 ±0.8 +0.4
−0.5
457 - 527 +37.7−29.3
− − −+5.1−5.2
±1.3 ±1.4 +0.4−0.5
527 - 700 +52.3−39.8 − − −
+7.3−7.3 ±1.2 ±3.6 +0.4
−0.5
TABLE II: Systematic uncertainties (in percent) on the measured inclusive jet differential cross section as a function of pjetT for
jets in the regions |yjet| < 0.1 and 0.1 < |yjet| < 0.7 (see Fig. 7). The different columns follow the discussion in Section X. Anadditional 5.8% uncertainty on the integrated luminosity is not included.
21
Systematic uncertainties [%] (0.7 < |yjet| < 1.1)
pjetT
[GeV/c] jet energy scale βdata/βmc resolution unfolding pjetT
-spectra δmipT
(a) (b) (c)
54 - 62 +9.2−9.9
+2.1−2.3
− −+4.0−3.8
±6.3 ±2.0 +1.7−1.6
62 - 72 +9.2−9.3
+2.2−2.3 − −
+3.8−3.7 ±5.6 ±1.9 +1.5
−1.4
72 - 83 +9.2−9.0
+2.3−2.3
− −+3.7−3.5
±4.9 ±1.8 +1.3−1.3
83 - 96 +9.5−9.0
+2.3−2.3
− −+3.5−3.4
±4.4 ±1.8 +1.2−1.2
96 - 110 +9.9−9.3
+2.4−2.4 − −
+3.4−3.3 ±3.9 ±1.7 +1.1
−1.1
110 - 127 +10.6−9.8
+2.5−2.5
− −+3.3−3.2
±3.5 ±1.7 +1.0−1.0
127 - 146 +11.5−10.7
+2.6−2.6 − −
+3.3−3.1 ±3.2 ±1.7 +0.9
−0.9
146 - 169 +12.6−11.7
+2.8−2.7
− −+3.3−3.2
±2.8 ±1.6 +0.8−0.8
169 - 195 +14.1−13.0
+3.0−2.9 − −
+3.4−3.3 ±2.6 ±1.6 +0.8
−0.8
195 - 224 +15.9−14.6
+3.3−3.2
− −+3.7−3.5
±2.3 ±1.7 +0.7−0.7
224 - 259 +18.1−16.5
+3.8−3.6
− −+4.1−3.9
±2.1 ±1.8 +0.7−0.7
259 - 298 +21.0−19.2
+4.4−4.1 − −
+4.7−4.5 ±2.0 ±2.1 +0.6
−0.6
298 - 344 +25.2−22.7
+5.0−4.8
− −+5.6−5.3
±1.8 ±2.4 +0.6−0.6
344 - 396 +31.5−26.9
+5.9−5.6 − −
+6.8−6.4 ±1.7 ±3.0 +0.6
−0.6
396 - 457 +41.3−31.0
+7.2−6.6
− −+8.3−7.7
±1.6 ±3.8 +0.5−0.5
457 - 527 +55.4−38.3
+10.4−7.7 − −
+10.0−9.1 ±1.5 ±5.0 +0.5
−0.5
Systematic uncertainties [%] (1.1 < |yjet| < 1.6)
pjetT
[GeV/c] jet energy scale βdata/βmc resolution unfolding pjetT
-spectra δmipT
(a) (b) (c)
54 - 62 +9.4−8.6
+2.6−2.4
−+0.0−3.0
+2.9−3.1
±6.7 ±1.3 +1.8−1.8
62 - 72 +9.5−8.9
+2.5−2.4 −
+0.0−3.0
+2.9−3.0 ±6.4 ±1.1 +1.6
−1.5
72 - 83 +9.8−9.3
+2.5−2.5
−+0.0−3.0
+2.9−2.9
±6.1 ±0.9 +1.4−1.3
83 - 96 +10.2−9.8
+2.5−2.6 −
+0.0−3.0
+2.9−2.8 ±5.8 ±0.8 +1.3
−1.2
96 - 110 +10.9−10.5
+2.6−2.6
−+0.0−3.0
+3.0−2.9
±5.6 ±0.6 +1.2−1.1
110 - 127 +11.7−11.4
+2.7−2.8 −
+0.0−3.0
+3.1−3.0 ±5.4 ±0.4 +1.1
−1.0
127 - 146 +12.8−12.6
+2.9−3.0
−+0.0−3.0
+3.4−3.2
±5.2 ±0.3 +1.1−1.0
146 - 169 +14.5−14.2
+3.3−3.3
−+0.0−3.0
+3.8−3.6
±5.0 ±0.1 +1.0−0.9
169 - 195 +16.9−16.2
+3.8−3.7 −
+0.0−3.0
+4.3−4.2 ±4.8 ±0.1 +1.0
−0.9
195 - 224 +20.3−18.6
+4.4−4.2
+0.7−0.9
+0.0−3.0
+5.1−5.0
±4.7 ±0.2 +0.9−0.9
224 - 259 +24.7−21.2
+5.2−5.0
+2.6−2.4
+0.0−3.0
+6.2−6.1 ±4.6 ±0.4 +0.9
−0.9
259 - 298 +29.9−24.1
+6.2−5.9
+6.3−4.5
+0.0−3.0
+7.8−7.3
±4.4 ±0.8 +0.9−0.9
298 - 344 +37.2−28.6
+7.3−7.1
+12.6−7.5
+0.0−3.0
+9.8−8.5 ±4.3 ±1.6 +0.9
−0.9
344 - 396 +61.2−39.2
+8.7−8.3
+22.7−11.7
+0.0−3.0
+12.4−9.4
±4.2 ±2.8 +0.9−0.9
Systematic uncertainties [%] (1.6 < |yjet| < 2.1)
pjetT
[GeV/c] jet energy scale βdata/βmc resolution unfolding pjetT
-spectra δmipT
(a) (b) (c)
54 - 62 +11.6−10.3
+2.3−2.1 − −
+1.7−1.6 ±3.2 ±1.0 +2.1
−2.0
62 - 72 +10.9−10.1
+2.4−2.4
− −+1.6−1.7
±3.3 ±0.8 +1.8−1.8
72 - 83 +11.0−10.3
+2.6−2.6 − −
+1.5−1.7 ±3.4 ±0.6 +1.7
−1.7
83 - 96 +12.0−11.1
+2.8−2.9
− −+1.5−1.8
±3.5 ±0.4 +1.6−1.6
96 - 110 +13.7−12.5
+3.2−3.2 − −
+1.5−1.8 ±3.6 ±0.3 +1.5
−1.5
110 - 127 +16.2−14.4
+3.7−3.5 − −
+1.6−1.9 ±3.7 ±0.2 +1.4
−1.4
127 - 146 +19.2−16.9
+4.3−4.0
− −+1.8−2.0
±3.7 ±0.1 +1.4−1.4
146 - 169 +22.8−19.8
+5.0−4.6 − −
+2.1−2.1 ±3.8 ±0.2 +1.4
−1.3
169 - 195 +27.7−23.0
+6.0−5.4
+1.3−0.9
−+2.5−2.3
±3.8 ±0.5 +1.4−1.3
195 - 224 +34.9−26.7
+7.0−6.4
+5.3−5.6 −
+3.0−2.7 ±3.8 ±1.1 +1.4
−1.3
224 - 259 +46.0−32.4
+8.1−8.0
+11.0−11.1
−+3.5−3.3
±3.8 ±2.1 +1.4−1.3
259 - 298 +52.9−44.5
+9.1−10.5
+19.1−17.5 −
+3.9−4.4 ±3.8 ±3.7 +1.4
−1.3
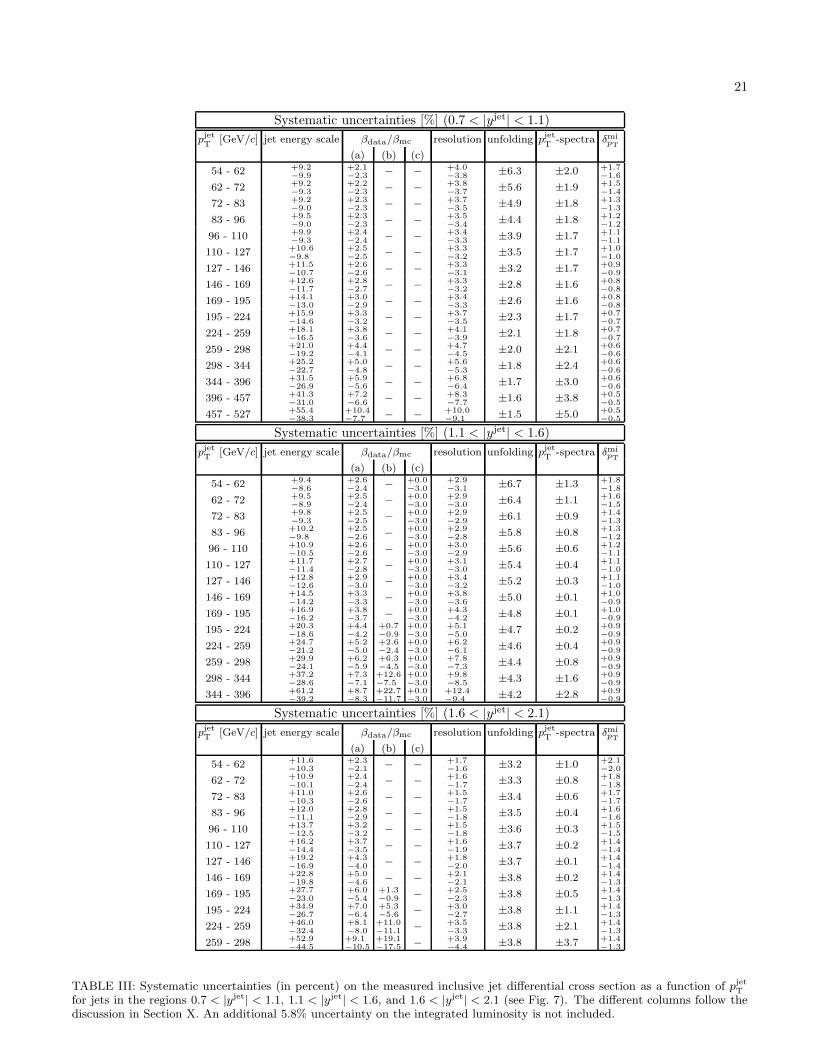
TABLE III: Systematic uncertainties (in percent) on the measured inclusive jet differential cross section as a function of pjetT
for jets in the regions 0.7 < |yjet| < 1.1, 1.1 < |yjet| < 1.6, and 1.6 < |yjet| < 2.1 (see Fig. 7). The different columns follow thediscussion in Section X. An additional 5.8% uncertainty on the integrated luminosity is not included.
22
d2σ
dpjet
Tdyjet
(|yjet| < 0.1)
pjetT
σ ± (stat.) ± (sys.) CHAD
[GeV/c] [nb/(GeV/c)] parton → hadron
54 - 62 (14.5 ± 0.5+2.0−1.9) × 100 1.177 ± 0.124
62 - 72 (6.68 ± 0.08+0.85−0.84
) × 100 1.144 ± 0.097
72 - 83 (2.87 ± 0.05+0.35−0.34) × 100 1.119 ± 0.077
83 - 96 (1.24 ± 0.02+0.14−0.14) × 100 1.098 ± 0.061
96 - 110 (5.31 ± 0.11+0.60−0.61
) × 10−1 1.083 ± 0.049
110 - 127 (2.33 ± 0.06+0.27−0.26) × 10−1 1.070 ± 0.039
127 - 146 (9.36 ± 0.12+1.10−1.08
) × 10−2 1.060 ± 0.032
146 - 169 (3.63 ± 0.06+0.45−0.43) × 10−2 1.052 ± 0.026
169 - 195 (1.39 ± 0.01+0.19−0.18
) × 10−2 1.046 ± 0.021
195 - 224 (5.22 ± 0.06+0.77−0.72) × 10−3 1.041 ± 0.017
224 - 259 (1.79 ± 0.03+0.29−0.27) × 10−3 1.037 ± 0.013
259 - 298 (5.92 ± 0.11+1.08−1.00
) × 10−4 1.034 ± 0.010
298 - 344 (1.78 ± 0.06+0.36−0.33) × 10−4 1.032 ± 0.007
344 - 396 (4.68 ± 0.28+1.08−0.94
) × 10−5 1.030 ± 0.005
396 - 457 (1.29 ± 0.12+0.34−0.29) × 10−5 1.028 ± 0.002
457 - 527 (2.47 ± 0.50+0.80−0.68
) × 10−6 1.027 ± 0.001
527 - 700 (2.13 ± 0.95+0.97−0.75) × 10−7 1.026 ± 0.006
d2σ
dpjet
Tdyjet
(0.1 < |yjet| < 0.7)
pjetT
σ ± (stat.) ± (sys.) CHAD
[GeV/c] [nb/(GeV/c)] parton → hadron
54 - 62 (14.0 ± 0.20+1.6−1.6) × 100 1.188 ± 0.140
62 - 72 (6.14 ± 0.12+0.66−0.65
) × 100 1.156 ± 0.113
72 - 83 (2.69 ± 0.02+0.29−0.27) × 100 1.129 ± 0.091
83 - 96 (1.14 ± 0.01+0.12−0.11
) × 100 1.108 ± 0.073
96 - 110 (4.90 ± 0.04+0.51−0.48) × 10−1 1.090 ± 0.059
110 - 127 (2.08 ± 0.02+0.22−0.21
) × 10−1 1.076 ± 0.047
127 - 146 (8.51 ± 0.04+0.95−0.89
) × 10−2 1.065 ± 0.038
146 - 169 (3.33 ± 0.02+0.40−0.37) × 10−2 1.055 ± 0.029
169 - 195 (1.23 ± 0.01+0.16−0.15
) × 10−2 1.047 ± 0.023
195 - 224 (4.53 ± 0.02+0.65−0.61) × 10−3 1.041 ± 0.017
224 - 259 (1.57 ± 0.01+0.26−0.24
) × 10−3 1.036 ± 0.012
259 - 298 (4.87 ± 0.06+0.91−0.83) × 10−4 1.031 ± 0.007
298 - 344 (1.43 ± 0.02+0.31−0.27
) × 10−4 1.028 ± 0.003
344 - 396 (3.69 ± 0.10+0.94−0.80
) × 10−5 1.025 ± 0.001
396 - 457 (7.18 ± 0.34+2.20−1.80) × 10−6 1.023 ± 0.004
457 - 527 (1.16 ± 0.13+0.44−0.35
) × 10−6 1.021 ± 0.008
527 - 700 (8.97 ± 2.40+4.75−3.64) × 10−8 1.018 ± 0.014
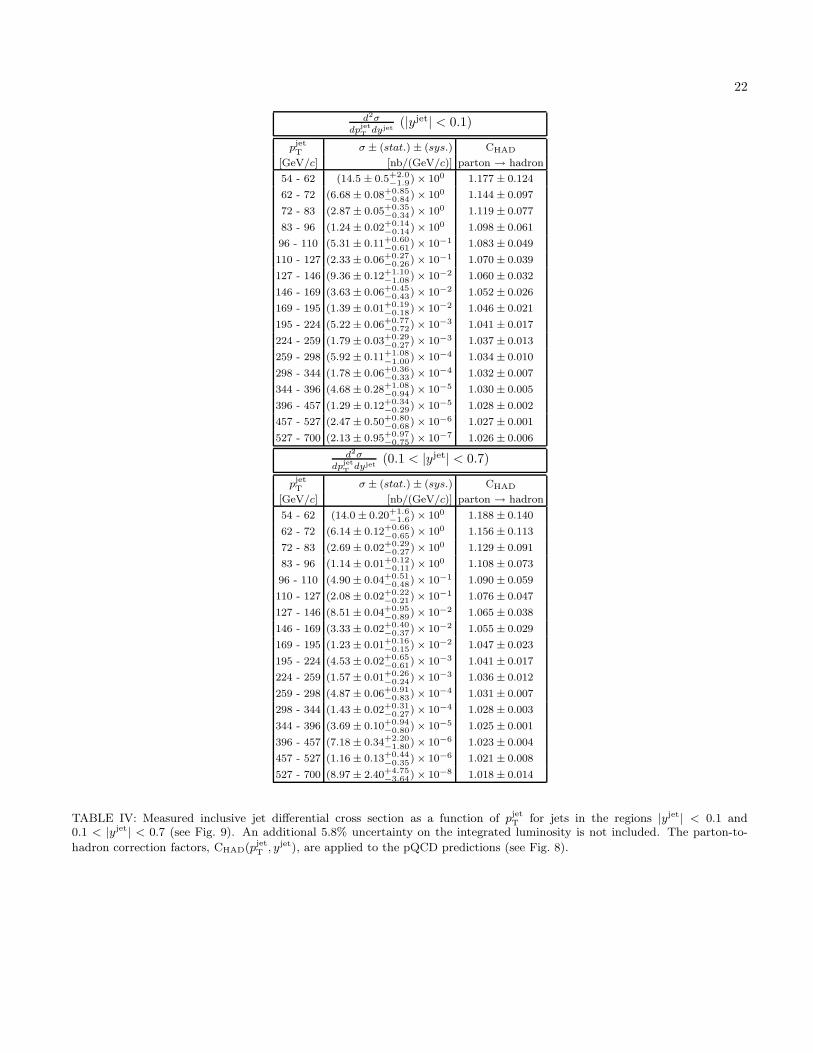
TABLE IV: Measured inclusive jet differential cross section as a function of pjetT for jets in the regions |yjet| < 0.1 and
0.1 < |yjet| < 0.7 (see Fig. 9). An additional 5.8% uncertainty on the integrated luminosity is not included. The parton-to-
hadron correction factors, CHAD(pjetT , yjet), are applied to the pQCD predictions (see Fig. 8).
23
d2σ
dpjet
Tdyjet
(0.7 < |yjet| < 1.1)
pjetT
σ ± (stat.) ± (sys.) CHAD
[GeV/c] [nb/(GeV/c)] parton → hadron
54 - 62 (12.3 ± 0.2+1.5−1.5) × 100 1.169 ± 0.125
62 - 72 (5.48 ± 0.14+0.65−0.65
) × 100 1.143 ± 0.103
72 - 83 (2.40 ± 0.02+0.28−0.27) × 100 1.120 ± 0.085
83 - 96 (1.00 ± 0.01+0.15−0.11) × 100 1.102 ± 0.070
96 - 110 (4.15 ± 0.05+0.48−0.46
) × 10−1 1.087 ± 0.057
110 - 127 (1.73 ± 0.03+0.21−0.20) × 10−1 1.075 ± 0.047
127 - 146 (6.83 ± 0.05+0.87−0.82
) × 10−2 1.064 ± 0.038
146 - 169 (2.52 ± 0.03+0.35−0.33) × 10−2 1.056 ± 0.031
169 - 195 (8.95 ± 0.06+1.36−1.26
) × 10−3 1.048 ± 0.024
195 - 224 (3.04 ± 0.02+0.51−0.47) × 10−3 1.042 ± 0.019
224 - 259 (9.52 ± 0.11+1.82−1.68) × 10−4 1.037 ± 0.014
259 - 298 (2.53 ± 0.05+0.56−0.51
) × 10−4 1.033 ± 0.009
298 - 344 (6.18 ± 0.17+1.64−1.49) × 10−5 1.030 ± 0.005
344 - 396 (1.11 ± 0.07+0.36−0.31
) × 10−5 1.027 ± 0.001
396 - 457 (1.53 ± 0.20+0.65−0.50) × 10−6 1.025 ± 0.003
457 - 527 (2.17 ± 0.72+1.25−0.88
) × 10−7 1.023 ± 0.007
d2σ
dpjet
Tdyjet
(1.1 < |yjet| < 1.6)
pjetT
σ ± (stat.) ± (sys.) CHAD
[GeV/c] [nb/(GeV/c)] parton → hadron
54 - 62 (11.0 ± 0.3+1.4−1.3
) × 100 1.160 ± 0.125
62 - 72 (4.40 ± 0.15+0.54−0.53) × 100 1.133 ± 0.101
72 - 83 (1.82 ± 0.06+0.22−0.22
) × 100 1.111 ± 0.081
83 - 96 (7.22 ± 0.37+0.90−0.90) × 10−1 1.094 ± 0.065
96 - 110 (2.98 ± 0.05+0.38−0.38
) × 10−1 1.080 ± 0.052
110 - 127 (1.14 ± 0.03+0.15−0.15) × 10−1 1.068 ± 0.042
127 - 146 (4.10 ± 0.04+0.60−0.60
) × 10−2 1.059 ± 0.034
146 - 169 (1.39 ± 0.02+0.22−0.23
) × 10−2 1.051 ± 0.027
169 - 195 (4.19 ± 0.04+0.78−0.76) × 10−3 1.045 ± 0.021
195 - 224 (1.15 ± 0.02+0.25−0.24
) × 10−3 1.040 ± 0.016
224 - 259 (2.73 ± 0.09+0.73−0.64) × 10−4 1.036 ± 0.012
259 - 298 (5.18 ± 0.23+1.68−1.39
) × 10−5 1.033 ± 0.009
298 - 344 (7.99 ± 0.61+3.31−2.56) × 10−6 1.030 ± 0.006
344 - 396 (1.05 ± 0.22+0.71−0.45
) × 10−6 1.028 ± 0.003
d2σ
dpjet
Tdyjet
(1.6 < |yjet| < 2.1)
pjetT
σ ± (stat.) ± (sys.) CHAD
[GeV/c] [nb/(GeV/c)] parton → hadron
54 - 62 (6.67 ± 0.15+0.84−0.75
) × 100 1.132 ± 0.104
62 - 72 (2.68 ± 0.02+0.32−0.30) × 100 1.116 ± 0.087
72 - 83 (1.04 ± 0.01+0.12−0.12
) × 100 1.100 ± 0.072
83 - 96 (3.77 ± 0.04+0.49−0.46) × 10−1 1.086 ± 0.058
96 - 110 (1.32 ± 0.02+0.19−0.18
) × 10−1 1.072 ± 0.045
110 - 127 (4.18 ± 0.04+0.72−0.65) × 10−2 1.059 ± 0.033
127 - 146 (1.21 ± 0.02+0.24−0.22) × 10−2 1.047 ± 0.022
146 - 169 (2.92 ± 0.04+0.70−0.61
) × 10−3 1.035 ± 0.012
169 - 195 (5.74 ± 0.09+1.65−1.38) × 10−4 1.024 ± 0.003
195 - 224 (8.49 ± 0.31+3.09−2.42
) × 10−5 1.013 ± 0.005
224 - 259 (8.65 ± 0.63+4.18−3.08) × 10−6 1.003 ± 0.012
259 - 298 (5.67 ± 1.65+3.25−2.80
) × 10−7 0.993 ± 0.018
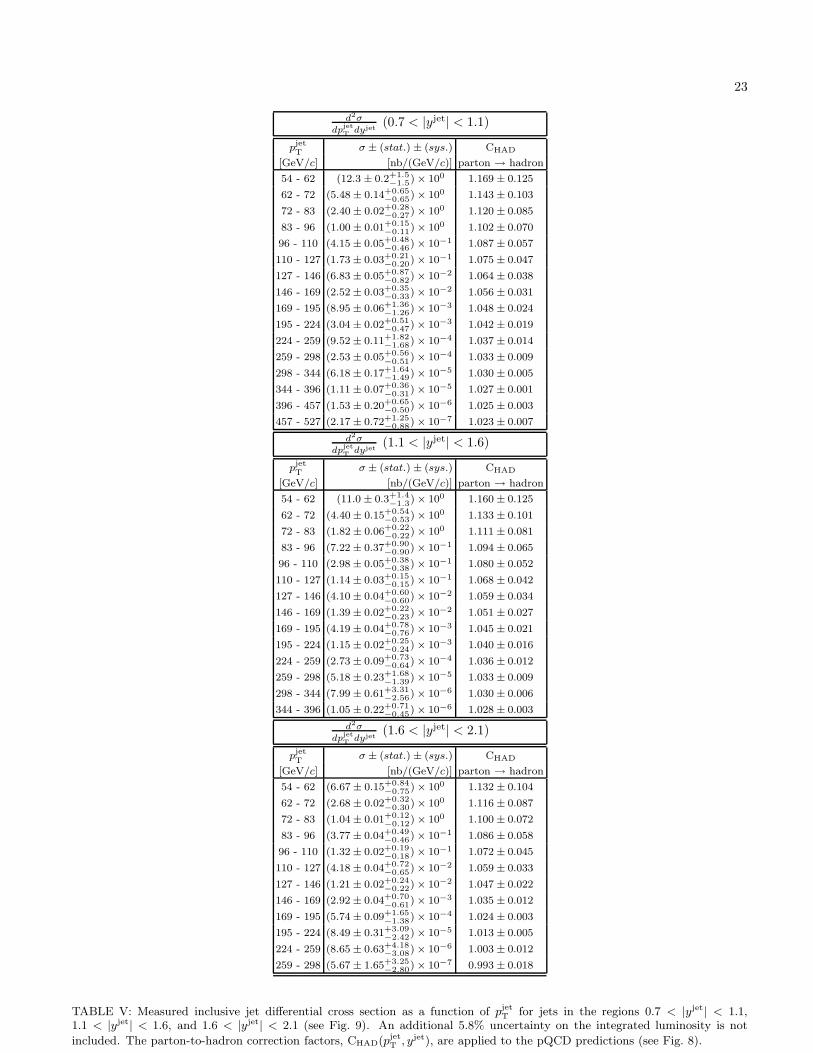
TABLE V: Measured inclusive jet differential cross section as a function of pjetT for jets in the regions 0.7 < |yjet| < 1.1,
1.1 < |yjet| < 1.6, and 1.6 < |yjet| < 2.1 (see Fig. 9). An additional 5.8% uncertainty on the integrated luminosity is not
included. The parton-to-hadron correction factors, CHAD(pjetT , yjet), are applied to the pQCD predictions (see Fig. 8).
24
Systematic uncertainties [%] (0.1 < |yjet| < 0.7) (D = 0.5)
pjetT
[GeV/c] jet energy scale resolution unfolding pjetT
-spectra δmipT
54 - 62 +9.9−9.2
+2.4−2.3 ±5.4 ±0.6 +0.8
−0.8
62 - 72 +9.8−9.0
+2.4−2.2
±4.8 ±0.6 +0.7−0.7
72 - 83 +9.8−8.9
+2.3−2.2 ±4.3 ±0.6 +0.6
−0.7
83 - 96 +9.7−8.9
+2.2−2.1
±3.8 ±0.6 +0.6−0.6
96 - 110 +9.8−9.0
+2.2−2.1 ±3.4 ±0.6 +0.5
−0.5
110 - 127 +10.0−9.4
+2.1−2.0
±3.1 ±0.6 +0.5−0.5
127 - 146 +10.4−9.9
+2.1−2.0 ±2.8 ±0.6 +0.4
−0.4
146 - 169 +11.2−10.8
+2.1−2.0 ±2.5 ±0.5 +0.4
−0.4
169 - 195 +12.5−11.9
+2.1−2.1
±2.3 ±0.4 +0.4−0.4
195 - 224 +14.3−13.3
+2.2−2.2 ±2.1 ±0.3 +0.4
−0.3
224 - 259 +16.6−15.0
+2.4−2.4
±1.9 ±0.2 +0.3−0.3
259 - 298 +19.3−17.0
+2.7−2.7 ±1.8 ±0.1 +0.3
−0.3
298 - 344 +22.3−19.4
+3.1−3.2
±1.6 ±0.1 +0.3−0.3
344 - 396 +25.7−22.1
+3.7−3.8 ±1.5 ±0.2 +0.3
−0.3
396 - 457 +30.7−25.5
+4.5−4.6 ±1.4 ±0.5 +0.3
−0.3
457 - 527 +39.5−29.7
+5.5−5.6
±1.3 ±1.3 +0.3−0.2
527 - 700 +52.6−37.7
+7.4−7.3 ±1.2 ±4.2 +0.3
−0.2
Systematic uncertainties [%] (0.1 < |yjet| < 0.7) (D = 1.0)
pjetT
[GeV/c] jet energy scale resolution unfolding pjetT
-spectra δmipT
54 - 62 +10.7−9.4
+2.7−2.7
±5.6 ±0.4 +3.5−2.9
62 - 72 +10.4−9.3
+2.6−2.5 ±4.9 ±0.4 +3.0
−2.6
72 - 83 +10.3−9.2
+2.4−2.4
±4.2 ±0.4 +2.6−2.4
83 - 96 +10.2−9.2
+2.3−2.3 ±3.7 ±0.4 +2.3
−2.2
96 - 110 +10.2−9.3
+2.2−2.2
±3.2 ±0.4 +2.1−2.0
110 - 127 +10.4−9.6
+2.1−2.1 ±2.8 ±0.4 +1.9
−1.8
127 - 146 +10.8−10.1
+2.0−2.0
±2.5 ±0.4 +1.7−1.7
146 - 169 +11.5−10.8
+1.9−1.9
±2.1 ±0.4 +1.6−1.6
169 - 195 +12.6−11.8
+1.9−2.0 ±1.9 ±0.4 +1.5
−1.4
195 - 224 +13.9−13.1
+1.9−2.0
±1.6 ±0.3 +1.4−1.3
224 - 259 +15.8−14.7
+2.1−2.2 ±1.4 ±0.3 +1.3
−1.3
259 - 298 +18.0−16.6
+2.4−2.5
±1.3 ±0.2 +1.3−1.2
298 - 344 +20.8−18.8
+2.8−2.9 ±1.1 ±0.2 +1.2
−1.1
344 - 396 +24.5−21.4
+3.4−3.6
±1.0 ±0.2 +1.2−1.1
396 - 457 +30.1−24.7
+4.3−4.4
±0.8 ±0.5 +1.1−1.0
457 - 527 +38.8−29.5
+5.4−5.4 ±0.7 ±1.1 +1.1
−1.0
527 - 700 +49.8−37.6
+7.3−7.2
±0.6 ±3.4 +1.0−0.9
TABLE VI: Systematic uncertainties (in percent) on the measured inclusive jet differential cross section as a function of pjetT ,
for jets in the region 0.1 < |yjet| < 0.7 and using D = 0.5 and D = 1.0 (see Fig. 11). The different columns follow the discussionin Section X. An additional 5.8% uncertainty on the integrated luminosity is not included.

25
d2σ
dpjet
Tdyjet
(0.1 < |yjet| < 0.7) (D = 0.5)
pjetT
σ ± (stat.) ± (sys.) CHAD
[GeV/c] [nb/(GeV/c)] parton → hadron
54 - 62 (10.5 ± 0.2+1.2−1.1) × 100 1.089 ± 0.104
62 - 72 (4.81 ± 0.03+0.54−0.50
) × 100 1.076 ± 0.086
72 - 83 (2.09 ± 0.01+0.23−0.21) × 100 1.064 ± 0.070
83 - 96 (0.91 ± 0.01+0.10−0.09) × 100 1.055 ± 0.057
96 - 110 (3.95 ± 0.04+0.42−0.39
) × 10−1 1.047 ± 0.047
110 - 127 (1.71 ± 0.02+0.18−0.17) × 10−1 1.041 ± 0.037
127 - 146 (0.71 ± 0.01+0.08−0.07
) × 10−1 1.035 ± 0.029
146 - 169 (2.76 ± 0.02+0.32−0.31) × 10−2 1.030 ± 0.023
169 - 195 (1.04 ± 0.01+0.14−0.13
) × 10−2 1.026 ± 0.017
195 - 224 (3.87 ± 0.02+0.57−0.53) × 10−3 1.022 ± 0.012
224 - 259 (1.34 ± 0.01+0.23−0.21) × 10−3 1.019 ± 0.008
259 - 298 (4.26 ± 0.04+0.83−0.74
) × 10−4 1.017 ± 0.005
298 - 344 (1.22 ± 0.02+0.28−0.24) × 10−4 1.015 ± 0.002
344 - 396 (3.16 ± 0.09+0.82−0.71
) × 10−5 1.013 ± 0.001
396 - 457 (6.30 ± 0.32+1.96−1.63) × 10−6 1.011 ± 0.002
457 - 527 (1.01 ± 0.12+0.40−0.31
) × 10−6 1.010 ± 0.003
527 - 700 (0.83 ± 0.23+0.44−0.32) × 10−7 1.008 ± 0.005
d2σ
dpjet
Tdyjet
(0.1 < |yjet| < 0.7) (D = 1.0)
pjetT
σ ± (stat.) ± (sys.) CHAD
[GeV/c] [nb/(GeV/c)] parton → hadron
54 - 62 (20.0 ± 0.2+2.6−2.3) × 100 1.372 ± 0.227
62 - 72 (8.65 ± 0.04+1.1−1.0
) × 100 1.296 ± 0.171
72 - 83 (3.59 ± 0.02+0.42−0.39) × 100 1.236 ± 0.129
83 - 96 (1.49 ± 0.01+0.17−0.16
) × 100 1.190 ± 0.098
96 - 110 (6.27 ± 0.05+0.70−0.65) × 10−1 1.155 ± 0.075
110 - 127 (2.63 ± 0.03+0.29−0.27
) × 10−1 1.127 ± 0.057
127 - 146 (1.05 ± 0.01+0.12−0.11
) × 10−1 1.105 ± 0.044
146 - 169 (4.04 ± 0.03+0.48−0.45) × 10−2 1.088 ± 0.034
169 - 195 (1.48 ± 0.01+0.19−0.18
) × 10−2 1.075 ± 0.026
195 - 224 (5.41 ± 0.02+0.77−0.73) × 10−3 1.065 ± 0.019
224 - 259 (1.86 ± 0.01+0.30−0.28
) × 10−3 1.057 ± 0.013
259 - 298 (5.77 ± 0.04+1.05−1.00) × 10−4 1.050 ± 0.008
298 - 344 (1.70 ± 0.02+0.36−0.32
) × 10−4 1.045 ± 0.003
344 - 396 (4.26 ± 0.10+1.05−0.93
) × 10−5 1.041 ± 0.003
396 - 457 (8.17 ± 0.36+2.49−2.06) × 10−6 1.038 ± 0.009
457 - 527 (1.39 ± 0.14+0.55−0.42
) × 10−6 1.036 ± 0.015
527 - 700 (1.19 ± 0.27+0.60−0.46) × 10−7 1.033 ± 0.027
TABLE VII: Measured inclusive jet differential cross section as a function of pjetT for jets in the region 0.1 < |yjet| < 0.7
using D = 0.5 and D = 1.0 (see Fig. 11). An additional 5.8% uncertainty on the integrated luminosity is not included. The
parton-to-hadron correction factors, CHAD(pjetT ), are applied to the pQCD predictions.

26
APPENDIX A: CORRELATIONS OF SYSTEMATIC UNCERTAINTIES
The correlations among systematic uncertainties in different pjetT bins and |yjet| regions are studied in detail. The
uncertainty on the absolute jet energy scale is decomposed into different sources considered independent but fullycorrelated across pjet
T bins and |yjet| regions. A ±1.8% uncertainty on the absolute energy scale, independent of pjetT ,
results from the sum in quadrature of four different contributions [42]: a ±0.5% uncertainty from the calorimeterstability versus time, a ±1.0% uncertainty due to the modeling of the jet fragmentation, a ±0.5% uncertainty from thesimulation of the electromagnetic calorimeter response, and a ±1.3% uncertainty from the simulation of the calorimeterresponse at the boundary between calorimeter towers. Other contributions to the absolute energy scale uncertaintycome from the description of the calorimeter response to hadrons for different ranges in hadron momentum [42].Table VIII shows the resulting relative contributions to the quoted systematic uncertainty on the measured crosssections related to the absolute jet energy scale uncertainty.
pjetT
pjetT
independent response to hadrons
[GeV/c] uncertainty p < 12 GeV/c 12 < p < 20 GeV/c p > 20 GeV/c
54 - 62 90.3 37.8 15.2 13.5
62 - 72 90.2 35.2 16.1 19.1
72 - 83 89.9 31.9 17.0 24.6
83 - 96 89.2 28.8 17.3 30.1
96 - 110 88.0 26.0 16.9 35.8
110 - 127 86.4 22.7 16.4 41.9
127 - 146 84.3 20.0 15.1 47.7
146 - 169 82.1 17.2 14.1 52.6
169 - 195 79.8 14.6 12.7 57.0
195 - 224 77.6 12.5 11.5 60.7
224 - 259 75.7 10.7 10.3 63.6
259 - 298 73.8 9.1 9.2 66.2
298 - 344 72.1 7.8 8.2 68.3
344 - 396 70.5 6.8 7.3 70.2
396 - 457 69.2 5.8 6.4 71.7
457 - 527 68.0 5.0 5.7 72.9
527 - 700 66.8 4.2 5.0 74.2
TABLE VIII: Relative contributions (in percent) to the quoted systematic uncertainty on the measured cross sections relatedto the absolute jet energy scale uncertainty. The second column corresponds to a ±1.8% uncertainty on the absolute energyscale, as discussed in the text. Sources are considered independent and fully correlated in pjet
T and |yjet|.
The rest of the systematic uncertainties on the measured cross sections, including that on the total integrated lumi-nosity, are also assumed to be independent and fully correlated across pjet
T bins and |yjet| regions, except those relatedto the βdata/βmc ratio, for which uncertainties in different |yjet| regions are uncorrelated.
A global χ2 test is performed according to the formula
χ2 =
76∑
j=1
[σdj − σth
j (s)]2
[δσdj ]2 + [δσth
j (s)]2+
17∑
i=1
[si]2 , (A1)
where σdj is the measured cross section for data point j, σth
j (s) is the corresponding prediction, and s denotes thevector of standard deviations, si, for the different independent sources of systematic uncertainty. The values forσth
j (s) are obtained from the nominal NLO pQCD prediction, where s includes the uncertainty on CHAD but does
not consider PDF uncertainties. The uncertainty on CHAD is assumed to be fully correlated across pjetT bins and |yjet|
regions. The sums in Eq. (A1) run over 76 data points and 17 independent sources of systematic uncertainty, andthe χ2 is minimized with respect to s. Correlations among systematic uncertainties are taken into account in σth
j (s).
As an example, for a given source i, variations of si will coherently affect all the σthj (s) values if the corresponding
systematic uncertainties are considered fully correlated across pjetT bins and |yjet| regions.