Measurement of particle production and inclusive differential cross sections in p pmacr collisions...
21
arXiv:0904.1098v2 [hep-ex] 29 Apr 2009 Measurement of Particle Production and Inclusive Differential Cross Sections in p ¯ p Collisions at √ s =1.96 TeV T. Aaltonen, 24 J. Adelman, 14 T. Akimoto, 56 B. ´ Alvarez Gonz´ alez t , 12 S. Amerio z , 44 D. Amidei, 35 A. Anastassov, 39 A. Annovi, 20 J. Antos, 15 G. Apollinari, 18 A. Apresyan, 49 T. Arisawa, 58 A. Artikov, 16 W. Ashmanskas, 18 A. Attal, 4 A. Aurisano, 54 F. Azfar, 43 W. Badgett, 18 A. Barbaro-Galtieri, 29 V.E. Barnes, 49 B.A. Barnett, 26 P. Barria bb , 47 V. Bartsch, 31 G. Bauer, 33 P.-H. Beauchemin, 34 F. Bedeschi, 47 D. Beecher, 31 S. Behari, 26 G. Bellettini aa , 47 J. Bellinger, 60 D. Benjamin, 17 A. Beretvas, 18 J. Beringer, 29 A. Bhatti, 51 M. Binkley, 18 D. Bisello z , 44 I. Bizjak ff , 31 R.E. Blair, 2 C. Blocker, 7 B. Blumenfeld, 26 A. Bocci, 17 A. Bodek, 50 V. Boisvert, 50 G. Bolla, 49 D. Bortoletto, 49 J. Boudreau, 48 A. Boveia, 11 B. Brau a , 11 A. Bridgeman, 25 L. Brigliadori y , 6 C. Bromberg, 36 E. Brubaker, 14 J. Budagov, 16 H.S. Budd, 50 S. Budd, 25 S. Burke, 18 K. Burkett, 18 G. Busetto z , 44 P. Bussey, 22 A. Buzatu, 34 K. L. Byrum, 2 S. Cabrera v , 17 C. Calancha, 32 M. Campanelli, 36 M. Campbell, 35 F. Canelli 14 , 18 A. Canepa, 46 B. Carls, 25 D. Carlsmith, 60 R. Carosi, 47 S. Carrillo n , 19 S. Carron, 34 B. Casal, 12 M. Casarsa, 18 A. Castro y , 6 P. Catastini bb , 47 D. Cauz ee , 55 V. Cavaliere bb , 47 M. Cavalli-Sforza, 4 A. Cerri, 29 L. Cerrito p , 31 S.H. Chang, 28 Y.C. Chen, 1 M. Chertok, 8 G. Chiarelli, 47 G. Chlachidze, 18 F. Chlebana, 18 K. Cho, 28 D. Chokheli, 16 J.P. Chou, 23 G. Choudalakis, 33 S.H. Chuang, 53 K. Chung o , 18 W.H. Chung, 60 Y.S. Chung, 50 T. Chwalek, 27 C.I. Ciobanu, 45 M.A. Ciocci bb , 47 A. Clark, 21 D. Clark, 7 G. Compostella, 44 M.E. Convery, 18 J. Conway, 8 M. Cordelli, 20 G. Cortiana z , 44 C.A. Cox, 8 D.J. Cox, 8 F. Crescioli aa , 47 C. Cuenca Almenar v , 8 J. Cuevas t , 12 R. Culbertson, 18 J.C. Cully, 35 D. Dagenhart, 18 M. Datta, 18 T. Davies, 22 P. de Barbaro, 50 S. De Cecco, 52 A. Deisher, 29 G. De Lorenzo, 4 M. Dell’Orso aa , 47 C. Deluca, 4 L. Demortier, 51 J. Deng, 17 M. Deninno, 6 P.F. Derwent, 18 A. Di Canto aa , 47 G.P. di Giovanni, 45 C. Dionisi dd , 52 B. Di Ruzza ee , 55 J.R. Dittmann, 5 M. D’Onofrio, 4 S. Donati aa , 47 P. Dong, 9 J. Donini, 44 T. Dorigo, 44 S. Dube, 53 J. Efron, 40 A. Elagin, 54 R. Erbacher, 8 D. Errede, 25 S. Errede, 25 R. Eusebi, 18 H.C. Fang, 29 S. Farrington, 43 W.T. Fedorko, 14 R.G. Feild, 61 M. Feindt, 27 J.P. Fernandez, 32 C. Ferrazza cc , 47 R. Field, 19 G. Flanagan, 49 R. Forrest, 8 M.J. Frank, 5 M. Franklin, 23 J.C. Freeman, 18 I. Furic, 19 M. Gallinaro, 52 J. Galyardt, 13 F. Garberson, 11 J.E. Garcia, 21 A.F. Garfinkel, 49 P. Garosi bb , 47 K. Genser, 18 H. Gerberich, 25 D. Gerdes, 35 A. Gessler, 27 S. Giagu dd , 52 V. Giakoumopoulou, 3 P. Giannetti, 47 K. Gibson, 48 J.L. Gimmell, 50 C.M. Ginsburg, 18 N. Giokaris, 3 M. Giordani ee , 55 P. Giromini, 20 M. Giunta, 47 G. Giurgiu, 26 V. Glagolev, 16 D. Glenzinski, 18 M. Gold, 38 N. Goldschmidt, 19 A. Golossanov, 18 G. Gomez, 12 G. Gomez-Ceballos, 33 M. Goncharov, 33 O. Gonz´ alez, 32 I. Gorelov, 38 A.T. Goshaw, 17 K. Goulianos, 51 A. Gresele z , 44 S. Grinstein, 23 C. Grosso-Pilcher, 14 R.C. Group, 18 U. Grundler, 25 J. Guimaraes da Costa, 23 Z. Gunay-Unalan, 36 C. Haber, 29 K. Hahn, 33 S.R. Hahn, 18 E. Halkiadakis, 53 B.-Y. Han, 50 J.Y. Han, 50 F. Happacher, 20 K. Hara, 56 D. Hare, 53 M. Hare, 57 S. Harper, 43 R.F. Harr, 59 R.M. Harris, 18 M. Hartz, 48 K. Hatakeyama, 51 C. Hays, 43 M. Heck, 27 A. Heijboer, 46 J. Heinrich, 46 C. Henderson, 33 M. Herndon, 60 J. Heuser, 27 S. Hewamanage, 5 D. Hidas, 17 C.S. Hill c , 11 D. Hirschbuehl, 27 A. Hocker, 18 S. Hou, 1 M. Houlden, 30 S.-C. Hsu, 29 B.T. Huffman, 43 R.E. Hughes, 40 U. Husemann, 61 M. Hussein, 36 J. Huston, 36 J. Incandela, 11 G. Introzzi, 47 M. Iori dd , 52 A. Ivanov, 8 E. James, 18 D. Jang, 13 B. Jayatilaka, 17 E.J. Jeon, 28 M.K. Jha, 6 S. Jindariani, 18 W. Johnson, 8 M. Jones, 49 K.K. Joo, 28 S.Y. Jun, 13 J.E. Jung, 28 T.R. Junk, 18 T. Kamon, 54 D. Kar, 19 P.E. Karchin, 59 Y. Kato m , 42 R. Kephart, 18 W. Ketchum, 14 J. Keung, 46 V. Khotilovich, 54 B. Kilminster, 18 D.H. Kim, 28 H.S. Kim, 28 H.W. Kim, 28 J.E. Kim, 28 M.J. Kim, 20 S.B. Kim, 28 S.H. Kim, 56 Y.K. Kim, 14 N. Kimura, 56 L. Kirsch, 7 S. Klimenko, 19 B. Knuteson, 33 B.R. Ko, 17 K. Kondo, 58 D.J. Kong, 28 J. Konigsberg, 19 A. Korytov, 19 A.V. Kotwal, 17 M. Kreps, 27 J. Kroll, 46 D. Krop, 14 N. Krumnack, 5 M. Kruse, 17 V. Krutelyov, 11 T. Kubo, 56 T. Kuhr, 27 N.P. Kulkarni, 59 M. Kurata, 56 S. Kwang, 14 A.T. Laasanen, 49 S. Lami, 47 S. Lammel, 18 M. Lancaster, 31 R.L. Lander, 8 K. Lannon s , 40 A. Lath, 53 G. Latino bb , 47 I. Lazzizzera z , 44 T. LeCompte, 2 E. Lee, 54 H.S. Lee, 14 S.W. Lee u , 54 S. Leone, 47 J.D. Lewis, 18 C.-S. Lin, 29 J. Linacre, 43 M. Lindgren, 18 E. Lipeles, 46 A. Lister, 8 D.O. Litvintsev, 18 C. Liu, 48 T. Liu, 18 N.S. Lockyer, 46 A. Loginov, 61 M. Loreti z , 44 L. Lovas, 15 D. Lucchesi z , 44 C. Luci dd , 52 J. Lueck, 27 P. Lujan, 29 P. Lukens, 18 G. Lungu, 51 L. Lyons, 43 J. Lys, 29 R. Lysak, 15 D. MacQueen, 34 R. Madrak, 18 K. Maeshima, 18 K. Makhoul, 33 T. Maki, 24 P. Maksimovic, 26 S. Malde, 43 S. Malik, 31 G. Manca e , 30 A. Manousakis-Katsikakis, 3 F. Margaroli, 49 C. Marino, 27 C.P. Marino, 25 A. Martin, 61 V. Martin k , 22 M. Mart´ ınez, 4 R. Mart´ ınez-Ballar´ ın, 32 T. Maruyama, 56 P. Mastrandrea, 52 T. Masubuchi, 56 M. Mathis, 26 M.E. Mattson, 59 P. Mazzanti, 6 K.S. McFarland, 50 P. McIntyre, 54 R. McNulty j , 30 A. Mehta, 30 P. Mehtala, 24 A. Menzione, 47 P. Merkel, 49 C. Mesropian, 51 T. Miao, 18 N. Miladinovic, 7 R. Miller, 36 C. Mills, 23 M. Milnik, 27 A. Mitra, 1 G. Mitselmakher, 19 H. Miyake, 56 N. Moggi, 6 C.S. Moon, 28 R. Moore, 18 M.J. Morello, 47 J. Morlock, 27 P. Movilla Fernandez, 18 J. M¨ ulmenst¨ adt, 29 A. Mukherjee, 18 Th. Muller, 27 R. Mumford, 26 P. Murat, 18 M. Mussini y , 6 J. Nachtman o , 18 Y. Nagai, 56 A. Nagano, 56 J. Naganoma, 56
-
Upload
independent -
Category
Documents
-
view
3 -
download
0
Transcript of Measurement of particle production and inclusive differential cross sections in p pmacr collisions...
arX
iv:0
904.
1098
v2 [
hep-
ex]
29
Apr
200
9
Measurement of Particle Production and Inclusive Differential Cross Sections in pp
Collisions at√
s = 1.96 TeV
T. Aaltonen,24 J. Adelman,14 T. Akimoto,56 B. Alvarez Gonzalezt,12 S. Amerioz,44 D. Amidei,35 A. Anastassov,39
A. Annovi,20 J. Antos,15 G. Apollinari,18 A. Apresyan,49 T. Arisawa,58 A. Artikov,16 W. Ashmanskas,18 A. Attal,4
A. Aurisano,54 F. Azfar,43 W. Badgett,18 A. Barbaro-Galtieri,29 V.E. Barnes,49 B.A. Barnett,26 P. Barriabb,47
V. Bartsch,31 G. Bauer,33 P.-H. Beauchemin,34 F. Bedeschi,47 D. Beecher,31 S. Behari,26 G. Bellettiniaa,47
J. Bellinger,60 D. Benjamin,17 A. Beretvas,18 J. Beringer,29 A. Bhatti,51 M. Binkley,18 D. Biselloz,44 I. Bizjakff ,31
R.E. Blair,2 C. Blocker,7 B. Blumenfeld,26 A. Bocci,17 A. Bodek,50 V. Boisvert,50 G. Bolla,49 D. Bortoletto,49
J. Boudreau,48 A. Boveia,11 B. Braua,11 A. Bridgeman,25 L. Brigliadoriy,6 C. Bromberg,36 E. Brubaker,14
J. Budagov,16 H.S. Budd,50 S. Budd,25 S. Burke,18 K. Burkett,18 G. Busettoz,44 P. Bussey,22 A. Buzatu,34
K. L. Byrum,2 S. Cabrerav,17 C. Calancha,32 M. Campanelli,36 M. Campbell,35 F. Canelli14,18 A. Canepa,46
B. Carls,25 D. Carlsmith,60 R. Carosi,47 S. Carrillon,19 S. Carron,34 B. Casal,12 M. Casarsa,18 A. Castroy,6
P. Catastinibb,47 D. Cauzee,55 V. Cavalierebb,47 M. Cavalli-Sforza,4 A. Cerri,29 L. Cerritop,31 S.H. Chang,28
Y.C. Chen,1 M. Chertok,8 G. Chiarelli,47 G. Chlachidze,18 F. Chlebana,18 K. Cho,28 D. Chokheli,16 J.P. Chou,23
G. Choudalakis,33 S.H. Chuang,53 K. Chungo,18 W.H. Chung,60 Y.S. Chung,50 T. Chwalek,27 C.I. Ciobanu,45
M.A. Cioccibb,47 A. Clark,21 D. Clark,7 G. Compostella,44 M.E. Convery,18 J. Conway,8 M. Cordelli,20
G. Cortianaz,44 C.A. Cox,8 D.J. Cox,8 F. Crescioliaa,47 C. Cuenca Almenarv,8 J. Cuevast,12 R. Culbertson,18
J.C. Cully,35 D. Dagenhart,18 M. Datta,18 T. Davies,22 P. de Barbaro,50 S. De Cecco,52 A. Deisher,29
G. De Lorenzo,4 M. Dell’Orsoaa,47 C. Deluca,4 L. Demortier,51 J. Deng,17 M. Deninno,6 P.F. Derwent,18
A. Di Cantoaa,47 G.P. di Giovanni,45 C. Dionisidd,52 B. Di Ruzzaee,55 J.R. Dittmann,5 M. D’Onofrio,4
S. Donatiaa,47 P. Dong,9 J. Donini,44 T. Dorigo,44 S. Dube,53 J. Efron,40 A. Elagin,54 R. Erbacher,8 D. Errede,25
S. Errede,25 R. Eusebi,18 H.C. Fang,29 S. Farrington,43 W.T. Fedorko,14 R.G. Feild,61 M. Feindt,27 J.P. Fernandez,32
C. Ferrazzacc,47 R. Field,19 G. Flanagan,49 R. Forrest,8 M.J. Frank,5 M. Franklin,23 J.C. Freeman,18 I. Furic,19
M. Gallinaro,52 J. Galyardt,13 F. Garberson,11 J.E. Garcia,21 A.F. Garfinkel,49 P. Garosibb,47 K. Genser,18
H. Gerberich,25 D. Gerdes,35 A. Gessler,27 S. Giagudd,52 V. Giakoumopoulou,3 P. Giannetti,47 K. Gibson,48
J.L. Gimmell,50 C.M. Ginsburg,18 N. Giokaris,3 M. Giordaniee,55 P. Giromini,20 M. Giunta,47 G. Giurgiu,26
V. Glagolev,16 D. Glenzinski,18 M. Gold,38 N. Goldschmidt,19 A. Golossanov,18 G. Gomez,12 G. Gomez-Ceballos,33
M. Goncharov,33 O. Gonzalez,32 I. Gorelov,38 A.T. Goshaw,17 K. Goulianos,51 A. Greselez,44 S. Grinstein,23
C. Grosso-Pilcher,14 R.C. Group,18 U. Grundler,25 J. Guimaraes da Costa,23 Z. Gunay-Unalan,36 C. Haber,29
K. Hahn,33 S.R. Hahn,18 E. Halkiadakis,53 B.-Y. Han,50 J.Y. Han,50 F. Happacher,20 K. Hara,56 D. Hare,53
M. Hare,57 S. Harper,43 R.F. Harr,59 R.M. Harris,18 M. Hartz,48 K. Hatakeyama,51 C. Hays,43 M. Heck,27
A. Heijboer,46 J. Heinrich,46 C. Henderson,33 M. Herndon,60 J. Heuser,27 S. Hewamanage,5 D. Hidas,17
C.S. Hillc,11 D. Hirschbuehl,27 A. Hocker,18 S. Hou,1 M. Houlden,30 S.-C. Hsu,29 B.T. Huffman,43 R.E. Hughes,40
U. Husemann,61 M. Hussein,36 J. Huston,36 J. Incandela,11 G. Introzzi,47 M. Ioridd,52 A. Ivanov,8 E. James,18
D. Jang,13 B. Jayatilaka,17 E.J. Jeon,28 M.K. Jha,6 S. Jindariani,18 W. Johnson,8 M. Jones,49 K.K. Joo,28
S.Y. Jun,13 J.E. Jung,28 T.R. Junk,18 T. Kamon,54 D. Kar,19 P.E. Karchin,59 Y. Katom,42 R. Kephart,18
W. Ketchum,14 J. Keung,46 V. Khotilovich,54 B. Kilminster,18 D.H. Kim,28 H.S. Kim,28 H.W. Kim,28 J.E. Kim,28
M.J. Kim,20 S.B. Kim,28 S.H. Kim,56 Y.K. Kim,14 N. Kimura,56 L. Kirsch,7 S. Klimenko,19 B. Knuteson,33
B.R. Ko,17 K. Kondo,58 D.J. Kong,28 J. Konigsberg,19 A. Korytov,19 A.V. Kotwal,17 M. Kreps,27 J. Kroll,46
D. Krop,14 N. Krumnack,5 M. Kruse,17 V. Krutelyov,11 T. Kubo,56 T. Kuhr,27 N.P. Kulkarni,59 M. Kurata,56
S. Kwang,14 A.T. Laasanen,49 S. Lami,47 S. Lammel,18 M. Lancaster,31 R.L. Lander,8 K. Lannons,40 A. Lath,53
G. Latinobb,47 I. Lazzizzeraz,44 T. LeCompte,2 E. Lee,54 H.S. Lee,14 S.W. Leeu,54 S. Leone,47 J.D. Lewis,18
C.-S. Lin,29 J. Linacre,43 M. Lindgren,18 E. Lipeles,46 A. Lister,8 D.O. Litvintsev,18 C. Liu,48 T. Liu,18
N.S. Lockyer,46 A. Loginov,61 M. Loretiz,44 L. Lovas,15 D. Lucchesiz,44 C. Lucidd,52 J. Lueck,27 P. Lujan,29
P. Lukens,18 G. Lungu,51 L. Lyons,43 J. Lys,29 R. Lysak,15 D. MacQueen,34 R. Madrak,18 K. Maeshima,18
K. Makhoul,33 T. Maki,24 P. Maksimovic,26 S. Malde,43 S. Malik,31 G. Mancae,30 A. Manousakis-Katsikakis,3
F. Margaroli,49 C. Marino,27 C.P. Marino,25 A. Martin,61 V. Martink,22 M. Martınez,4 R. Martınez-Balların,32
T. Maruyama,56 P. Mastrandrea,52 T. Masubuchi,56 M. Mathis,26 M.E. Mattson,59 P. Mazzanti,6 K.S. McFarland,50
P. McIntyre,54 R. McNultyj ,30 A. Mehta,30 P. Mehtala,24 A. Menzione,47 P. Merkel,49 C. Mesropian,51 T. Miao,18
N. Miladinovic,7 R. Miller,36 C. Mills,23 M. Milnik,27 A. Mitra,1 G. Mitselmakher,19 H. Miyake,56 N. Moggi,6
C.S. Moon,28 R. Moore,18 M.J. Morello,47 J. Morlock,27 P. Movilla Fernandez,18 J. Mulmenstadt,29 A. Mukherjee,18
Th. Muller,27 R. Mumford,26 P. Murat,18 M. Mussiniy,6 J. Nachtmano,18 Y. Nagai,56 A. Nagano,56 J. Naganoma,56
2
K. Nakamura,56 I. Nakano,41 A. Napier,57 V. Necula,17 J. Nett,60 C. Neuw,46 M.S. Neubauer,25 S. Neubauer,27
J. Nielseng,29 L. Nodulman,2 M. Norman,10 O. Norniella,25 E. Nurse,31 L. Oakes,43 S.H. Oh,17 Y.D. Oh,28
I. Oksuzian,19 T. Okusawa,42 R. Orava,24 K. Osterberg,24 S. Pagan Grisoz,44 E. Palencia,18 V. Papadimitriou,18
A. Papaikonomou,27 A.A. Paramonov,14 B. Parks,40 S. Pashapour,34 J. Patrick,18 G. Paulettaee,55 M. Paulini,13
C. Paus,33 T. Peiffer,27 D.E. Pellett,8 A. Penzo,55 T.J. Phillips,17 G. Piacentino,47 E. Pianori,46 L. Pinera,19
K. Pitts,25 C. Plager,9 L. Pondrom,60 O. Poukhov∗,16 N. Pounder,43 F. Prakoshyn,16 A. Pronko,18 J. Proudfoot,2
F. Ptohosi,18 E. Pueschel,13 G. Punziaa,47 J. Pursley,60 J. Rademackerc,43 A. Rahaman,48 V. Ramakrishnan,60
N. Ranjan,49 I. Redondo,32 P. Renton,43 M. Renz,27 M. Rescigno,52 S. Richter,27 F. Rimondiy,6 L. Ristori,47
A. Robson,22 T. Rodrigo,12 T. Rodriguez,46 E. Rogers,25 S. Rolli,57 R. Roser,18 M. Rossi,55 R. Rossin,11
P. Roy,34 A. Ruiz,12 J. Russ,13 V. Rusu,18 B. Rutherford,18 H. Saarikko,24 A. Safonov,54 W.K. Sakumoto,50
O. Salto,4 L. Santiee,55 S. Sarkardd,52 L. Sartori,47 K. Sato,18 A. Savoy-Navarro,45 P. Schlabach,18 A. Schmidt,27
E.E. Schmidt,18 M.A. Schmidt,14 M.P. Schmidt∗,61 M. Schmitt,39 T. Schwarz,8 L. Scodellaro,12 A. Scribanobb,47
F. Scuri,47 A. Sedov,49 S. Seidel,38 Y. Seiya,42 A. Semenov,16 L. Sexton-Kennedy,18 F. Sforzaaa,47 A. Sfyrla,25
S.Z. Shalhout,59 T. Shears,30 P.F. Shepard,48 M. Shimojimar,56 S. Shiraishi,14 M. Shochet,14 Y. Shon,60
I. Shreyber,37 P. Sinervo,34 A. Sisakyan,16 A.J. Slaughter,18 J. Slaunwhite,40 K. Sliwa,57 J.R. Smith,8 F.D. Snider,18
R. Snihur,34 A. Soha,8 S. Somalwar,53 V. Sorin,36 T. Spreitzer,34 P. Squillaciotibb,47 M. Stanitzki,61 R. St. Denis,22
B. Stelzer,34 O. Stelzer-Chilton,34 D. Stentz,39 J. Strologas,38 G.L. Strycker,35 J.S. Suh,28 A. Sukhanov,19
I. Suslov,16 T. Suzuki,56 A. Taffardf ,25 R. Takashima,41 Y. Takeuchi,56 R. Tanaka,41 M. Tecchio,35 P.K. Teng,1
K. Terashi,51 J. Thomh,18 A.S. Thompson,22 G.A. Thompson,25 E. Thomson,46 P. Tipton,61 P. Ttito-Guzman,32
S. Tkaczyk,18 D. Toback,54 S. Tokar,15 K. Tollefson,36 T. Tomura,56 D. Tonelli,18 S. Torre,20 D. Torretta,18
P. Totaroee,55 S. Tourneur,45 M. Trovatocc,47 S.-Y. Tsai,1 Y. Tu,46 N. Turinibb,47 F. Ukegawa,56 S. Vallecorsa,21
N. van Remortelb,24 A. Varganov,35 E. Vatagacc,47 F. Vazquezn,19 G. Velev,18 C. Vellidis,3 M. Vidal,32 R. Vidal,18
I. Vila,12 R. Vilar,12 T. Vine,31 M. Vogel,38 I. Volobouevu,29 G. Volpiaa,47 P. Wagner,46 R.G. Wagner,2
R.L. Wagner,18 W. Wagnerx,27 J. Wagner-Kuhr,27 T. Wakisaka,42 R. Wallny,9 S.M. Wang,1 A. Warburton,34
D. Waters,31 M. Weinberger,54 J. Weinelt,27 W.C. Wester III,18 B. Whitehouse,57 D. Whitesonf ,46 A.B. Wicklund,2
E. Wicklund,18 S. Wilbur,14 G. Williams,34 H.H. Williams,46 P. Wilson,18 B.L. Winer,40 P. Wittichh,18
S. Wolbers,18 C. Wolfe,14 T. Wright,35 X. Wu,21 F. Wurthwein,10 S. Xie,33 A. Yagil,10 K. Yamamoto,42
J. Yamaoka,17 U.K. Yangq,14 Y.C. Yang,28 W.M. Yao,29 G.P. Yeh,18 K. Yio,18 J. Yoh,18 K. Yorita,58 T. Yoshidal,42
G.B. Yu,50 I. Yu,28 S.S. Yu,18 J.C. Yun,18 L. Zanellodd,52 A. Zanetti,55 X. Zhang,25 Y. Zhengd,9 and S. Zucchelliy,6
(CDF Collaboration†)1Institute of Physics, Academia Sinica, Taipei, Taiwan 11529, Republic of China
2Argonne National Laboratory, Argonne, Illinois 604393University of Athens, 157 71 Athens, Greece
4Institut de Fisica d’Altes Energies, Universitat Autonoma de Barcelona, E-08193, Bellaterra (Barcelona), Spain5Baylor University, Waco, Texas 76798
6Istituto Nazionale di Fisica Nucleare Bologna, yUniversity of Bologna, I-40127 Bologna, Italy7Brandeis University, Waltham, Massachusetts 02254
8University of California, Davis, Davis, California 956169University of California, Los Angeles, Los Angeles, California 90024
10University of California, San Diego, La Jolla, California 9209311University of California, Santa Barbara, Santa Barbara, California 93106
12Instituto de Fisica de Cantabria, CSIC-University of Cantabria, 39005 Santander, Spain13Carnegie Mellon University, Pittsburgh, PA 15213
14Enrico Fermi Institute, University of Chicago, Chicago, Illinois 6063715Comenius University, 842 48 Bratislava, Slovakia; Institute of Experimental Physics, 040 01 Kosice, Slovakia
16Joint Institute for Nuclear Research, RU-141980 Dubna, Russia17Duke University, Durham, North Carolina 27708
18Fermi National Accelerator Laboratory, Batavia, Illinois 6051019University of Florida, Gainesville, Florida 32611
20Laboratori Nazionali di Frascati, Istituto Nazionale di Fisica Nucleare, I-00044 Frascati, Italy21University of Geneva, CH-1211 Geneva 4, Switzerland
22Glasgow University, Glasgow G12 8QQ, United Kingdom23Harvard University, Cambridge, Massachusetts 02138
24Division of High Energy Physics, Department of Physics,University of Helsinki and Helsinki Institute of Physics, FIN-00014, Helsinki, Finland
25University of Illinois, Urbana, Illinois 6180126The Johns Hopkins University, Baltimore, Maryland 21218
27Institut fur Experimentelle Kernphysik, Universitat Karlsruhe, 76128 Karlsruhe, Germany
3
28Center for High Energy Physics: Kyungpook National University,Daegu 702-701, Korea; Seoul National University, Seoul 151-742,
Korea; Sungkyunkwan University, Suwon 440-746,Korea; Korea Institute of Science and Technology Information, Daejeon,305-806, Korea; Chonnam National University, Gwangju, 500-757, Korea
29Ernest Orlando Lawrence Berkeley National Laboratory, Berkeley, California 9472030University of Liverpool, Liverpool L69 7ZE, United Kingdom
31University College London, London WC1E 6BT, United Kingdom32Centro de Investigaciones Energeticas Medioambientales y Tecnologicas, E-28040 Madrid, Spain
33Massachusetts Institute of Technology, Cambridge, Massachusetts 0213934Institute of Particle Physics: McGill University, Montreal, Quebec,
Canada H3A 2T8; Simon Fraser University, Burnaby, British Columbia,Canada V5A 1S6; University of Toronto, Toronto, Ontario,
Canada M5S 1A7; and TRIUMF, Vancouver, British Columbia, Canada V6T 2A335University of Michigan, Ann Arbor, Michigan 48109
36Michigan State University, East Lansing, Michigan 4882437Institution for Theoretical and Experimental Physics, ITEP, Moscow 117259, Russia
38University of New Mexico, Albuquerque, New Mexico 8713139Northwestern University, Evanston, Illinois 6020840The Ohio State University, Columbus, Ohio 43210
41Okayama University, Okayama 700-8530, Japan42Osaka City University, Osaka 588, Japan
43University of Oxford, Oxford OX1 3RH, United Kingdom44Istituto Nazionale di Fisica Nucleare, Sezione di Padova-Trento, zUniversity of Padova, I-35131 Padova, Italy
45LPNHE, Universite Pierre et Marie Curie/IN2P3-CNRS, UMR7585, Paris, F-75252 France46University of Pennsylvania, Philadelphia, Pennsylvania 19104
47Istituto Nazionale di Fisica Nucleare Pisa, aaUniversity of Pisa,bbUniversity of Siena and ccScuola Normale Superiore, I-56127 Pisa, Italy
48University of Pittsburgh, Pittsburgh, Pennsylvania 1526049Purdue University, West Lafayette, Indiana 47907
50University of Rochester, Rochester, New York 1462751The Rockefeller University, New York, New York 10021
52Istituto Nazionale di Fisica Nucleare, Sezione di Roma 1,ddSapienza Universita di Roma, I-00185 Roma, Italy53Rutgers University, Piscataway, New Jersey 08855
54Texas A&M University, College Station, Texas 7784355Istituto Nazionale di Fisica Nucleare Trieste/Udine,
I-34100 Trieste, eeUniversity of Trieste/Udine, I-33100 Udine, Italy56University of Tsukuba, Tsukuba, Ibaraki 305, Japan
57Tufts University, Medford, Massachusetts 0215558Waseda University, Tokyo 169, Japan
59Wayne State University, Detroit, Michigan 4820160University of Wisconsin, Madison, Wisconsin 53706
61Yale University, New Haven, Connecticut 06520
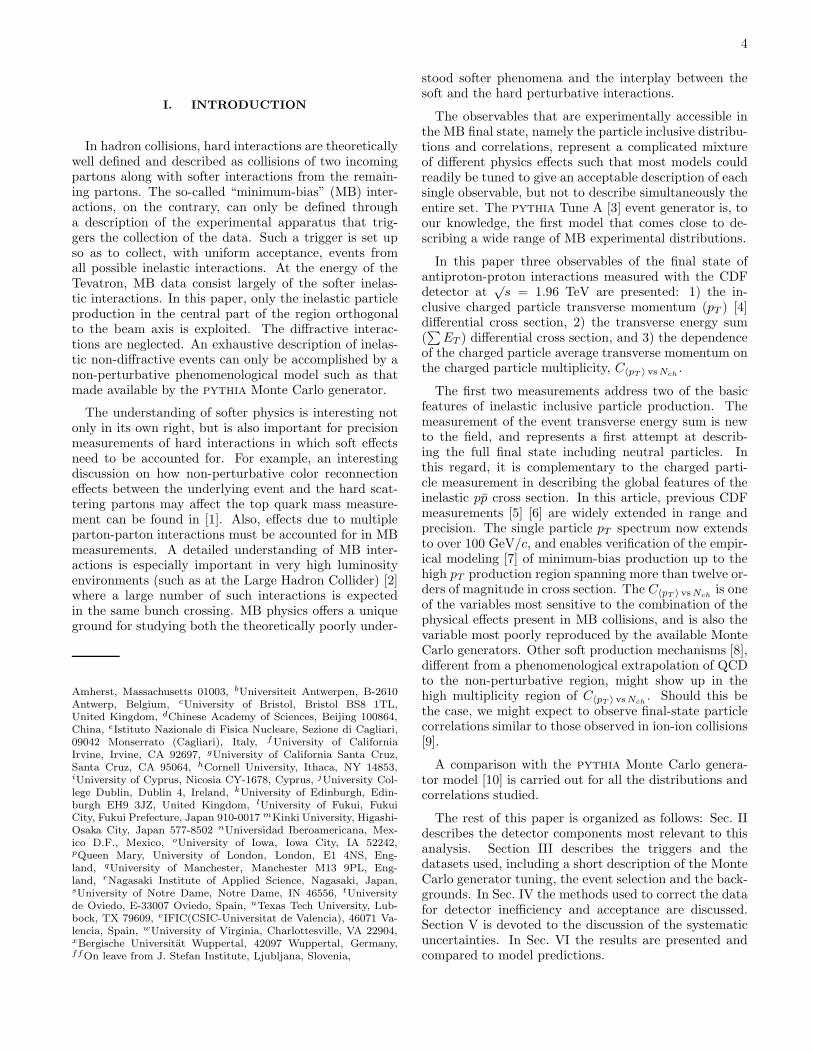
We report a set of measurements of particle production in inelastic pp collisions collected with aminimum-bias trigger at the Tevatron Collider with the CDF II experiment. The inclusive chargedparticle transverse momentum differential cross section is measured, with improved precision, over arange about ten times wider than in previous measurements. The former modeling of the spectrumappears to be incompatible with the high particle momenta observed. The dependence of the chargedparticle transverse momentum on the event particle multiplicity is analyzed to study the variouscomponents of hadron interactions. This is one of the observable variables most poorly reproducedby the available Monte Carlo generators. A first measurement of the event transverse energy sumdifferential cross section is also reported. A comparison with a pythia prediction at the hadronlevel is performed. The inclusive charged particle differential production cross section is fairly wellreproduced only in the transverse momentum range available from previous measurements. Athigher momentum the agreement is poor. The transverse energy sum is poorly reproduced overthe whole spectrum. The dependence of the charged particle transverse momentum on the particlemultiplicity needs the introduction of more sophisticated particle production mechanisms, such asmultiple parton interactions, in order to be better explained.
PACS numbers: 13.60.Hb, 13.85.Hd
∗Deceased †With visitors from aUniversity of Massachusetts Amherst,
4
I. INTRODUCTION
In hadron collisions, hard interactions are theoreticallywell defined and described as collisions of two incomingpartons along with softer interactions from the remain-ing partons. The so-called “minimum-bias” (MB) inter-actions, on the contrary, can only be defined througha description of the experimental apparatus that trig-gers the collection of the data. Such a trigger is set upso as to collect, with uniform acceptance, events fromall possible inelastic interactions. At the energy of theTevatron, MB data consist largely of the softer inelas-tic interactions. In this paper, only the inelastic particleproduction in the central part of the region orthogonalto the beam axis is exploited. The diffractive interac-tions are neglected. An exhaustive description of inelas-tic non-diffractive events can only be accomplished by anon-perturbative phenomenological model such as thatmade available by the pythia Monte Carlo generator.
The understanding of softer physics is interesting notonly in its own right, but is also important for precisionmeasurements of hard interactions in which soft effectsneed to be accounted for. For example, an interestingdiscussion on how non-perturbative color reconnectioneffects between the underlying event and the hard scat-tering partons may affect the top quark mass measure-ment can be found in [1]. Also, effects due to multipleparton-parton interactions must be accounted for in MBmeasurements. A detailed understanding of MB inter-actions is especially important in very high luminosityenvironments (such as at the Large Hadron Collider) [2]where a large number of such interactions is expectedin the same bunch crossing. MB physics offers a uniqueground for studying both the theoretically poorly under-
Amherst, Massachusetts 01003, bUniversiteit Antwerpen, B-2610Antwerp, Belgium, cUniversity of Bristol, Bristol BS8 1TL,United Kingdom, dChinese Academy of Sciences, Beijing 100864,China, eIstituto Nazionale di Fisica Nucleare, Sezione di Cagliari,09042 Monserrato (Cagliari), Italy, f University of CaliforniaIrvine, Irvine, CA 92697, gUniversity of California Santa Cruz,Santa Cruz, CA 95064, hCornell University, Ithaca, NY 14853,iUniversity of Cyprus, Nicosia CY-1678, Cyprus, jUniversity Col-lege Dublin, Dublin 4, Ireland, kUniversity of Edinburgh, Edin-burgh EH9 3JZ, United Kingdom, lUniversity of Fukui, FukuiCity, Fukui Prefecture, Japan 910-0017 mKinki University, Higashi-Osaka City, Japan 577-8502 nUniversidad Iberoamericana, Mex-ico D.F., Mexico, oUniversity of Iowa, Iowa City, IA 52242,pQueen Mary, University of London, London, E1 4NS, Eng-land, qUniversity of Manchester, Manchester M13 9PL, Eng-land, rNagasaki Institute of Applied Science, Nagasaki, Japan,sUniversity of Notre Dame, Notre Dame, IN 46556, tUniversityde Oviedo, E-33007 Oviedo, Spain, uTexas Tech University, Lub-bock, TX 79609, vIFIC(CSIC-Universitat de Valencia), 46071 Va-lencia, Spain, wUniversity of Virginia, Charlottesville, VA 22904,xBergische Universitat Wuppertal, 42097 Wuppertal, Germany,ffOn leave from J. Stefan Institute, Ljubljana, Slovenia,
stood softer phenomena and the interplay between thesoft and the hard perturbative interactions.
The observables that are experimentally accessible inthe MB final state, namely the particle inclusive distribu-tions and correlations, represent a complicated mixtureof different physics effects such that most models couldreadily be tuned to give an acceptable description of eachsingle observable, but not to describe simultaneously theentire set. The pythia Tune A [3] event generator is, toour knowledge, the first model that comes close to de-scribing a wide range of MB experimental distributions.
In this paper three observables of the final state ofantiproton-proton interactions measured with the CDFdetector at
√s = 1.96 TeV are presented: 1) the in-
clusive charged particle transverse momentum (pT ) [4]differential cross section, 2) the transverse energy sum(∑
ET ) differential cross section, and 3) the dependenceof the charged particle average transverse momentum onthe charged particle multiplicity, C〈pT 〉 vs Nch
.
The first two measurements address two of the basicfeatures of inelastic inclusive particle production. Themeasurement of the event transverse energy sum is newto the field, and represents a first attempt at describ-ing the full final state including neutral particles. Inthis regard, it is complementary to the charged parti-cle measurement in describing the global features of theinelastic pp cross section. In this article, previous CDFmeasurements [5] [6] are widely extended in range andprecision. The single particle pT spectrum now extendsto over 100 GeV/c, and enables verification of the empir-ical modeling [7] of minimum-bias production up to thehigh pT production region spanning more than twelve or-ders of magnitude in cross section. The C〈pT 〉 vs Nch
is oneof the variables most sensitive to the combination of thephysical effects present in MB collisions, and is also thevariable most poorly reproduced by the available MonteCarlo generators. Other soft production mechanisms [8],different from a phenomenological extrapolation of QCDto the non-perturbative region, might show up in thehigh multiplicity region of C〈pT 〉 vs Nch
. Should this bethe case, we might expect to observe final-state particlecorrelations similar to those observed in ion-ion collisions[9].
A comparison with the pythia Monte Carlo genera-tor model [10] is carried out for all the distributions andcorrelations studied.
The rest of this paper is organized as follows: Sec. IIdescribes the detector components most relevant to thisanalysis. Section III describes the triggers and thedatasets used, including a short description of the MonteCarlo generator tuning, the event selection and the back-grounds. In Sec. IV the methods used to correct the datafor detector inefficiency and acceptance are discussed.Section V is devoted to the discussion of the systematicuncertainties. In Sec. VI the results are presented andcompared to model predictions.
5
II. THE CDF DETECTOR
CDF II is a general purpose detector that combinesprecision charged particle tracking with projective geom-etry calorimeter towers. A detailed description of thedetector can be found elsewhere [11]. Here we briefly de-scribe the detector components that are relevant to thisanalysis: the tracking system, the central calorimeters,and the forward luminosity counters.
The tracking system is situated immediately outsidethe beam pipe and is composed of an inner set of sil-icon microstrip detectors and an outer drift chamber(COT). The silicon detectors are located between radiiof 1.5 < r < 29.0 cm, and provide precision measure-ments of the track’s impact parameter with respect tothe primary vertex. The innermost layer (L00) [12] issingle sided, and is attached directly on the beam pipe.Five layers of double-sided silicon microstrips (SVXII)[13] cover the pseudorapidity |η| ≤ 2 region: in each layerone side is oriented at a stereo angle with respect to thebeam axis to provide three dimensional measurements.The ISL [14] is located outside SVXII. It consists of onelayer of silicon microstrips covering the region |η| < 1and of two layers at 1 < |η| < 2 where the COT cover-age is incomplete or missing. The COT [15] is a cylin-drical open-cell drift chamber with 96 sense wire layersgrouped into eight alternating superlayers of stereo andaxial wires. Its active volume covers 40 < r < 137 cmand |z| < 155 cm, thus providing fiducial coverage up to|η|<∼1 to tracks originating within |z| ≤ 60 cm. Outsidethe COT, a solenoid provides a 1.4 T magnetic field thatallows the particle momenta to be computed from thetrajectory curvature. The transverse momentum resolu-tion is σ(pT )/pT ≃ 0.1% · pT /(GeV/c) for the integratedtracking system and σ(pT )/pT ≃ 0.2% · pT /(GeV/c) forthe COT tracking alone.
Located outside the solenoid, two layers of seg-mented sampling calorimeters (electromagnetic [16] andhadronic [17]) are used to measure the energy of the par-ticles. In the central region, |η| < 1.1, the calorimeterelements are arranged in a projective tower geometry ofgranularity ∆η × ∆φ ≈ 0.11 × 15◦. The electromagneticcomponents use lead-scintillator sampling. A multi-wireproportional chamber (CES) is embedded at approxi-mately the depth of the shower maximum. The hadroncalorimeter uses iron absorbers and scintillators. At nor-mal incidence the total depth corresponds to about 18radiation lengths in the electromagnetic calorimeter and4.5 interaction lengths in the hadronic calorimeter.
The energy resolution of the electromagnetic calorime-ter is σ(ET )/ET = 14%/
√
(ET (GeV)) ⊕ 2% forelectromagnetic particles. It is σ(ET )/ET =
75%/√
(ET (GeV)) ⊕ 3% for single pions when usingboth calorimeters.
Two systems of gas Cherenkov counters (CLC) [18],covering the forward regions 3.7 < |η| < 4.7, are used tomeasure the number of inelastic pp collisions per bunchcrossing and to determine the luminosity. For trigger-
ing purposes only, this analysis exploits a Time-of-Flightdetector (TOF) [19] located between the COT and thesolenoid at a mean radius of 140 cm. The TOF consistsof 216 scintillator bars with photomultipliers at each endand covers roughly |η| < 1.
III. DATA SAMPLE AND EVENT SELECTION
This analysis is based on an integrated luminosity of506 pb−1 collected with the CDF II detector betweenOctober 2002 and August 2004. The data were collectedwith a minimum-bias trigger that operates as follows. Anantiproton-proton bunch crossing, signalled by the Teva-tron radio frequency, is defined to contain at least one ppinteraction if there is a coincidence in time of signals inboth forward and backward CLC modules. This requiredcoincidence is the start gate of the first-level CDF trigger(Level 1) and is the so-called minimum-bias trigger. CDFuses a three-level trigger system that selects events to berecorded to tape at ∼ 75 Hz from the bunch crossing rateof approximately 2.5 MHz. The minimum-bias trigger israte limited at Level 1 in order to keep the Level 3 outputat 1 Hz. A total of about 16 × 106 bunch crossings wasrecorded.
Part of the analysis also uses data collected with ahigh multiplicity trigger that selects events that passedthe minimum-bias trigger precondition and in additionhave a large number of primary charged particles. Itfunctions at Level 1 by selecting events with at least 14hit bars in the TOF system, a hit being defined as thecoincidence of two signals from the photomultipliers atthe two ends of each bar. At Level 3 this trigger requiresat least 22 reconstructed tracks converging to the eventvertex. The threshold of 14 TOF signals was selectedas the highest compatible with a fully efficient triggerfor events with offline charged particle multiplicity ≥ 22.The latter threshold was dictated by the statistics avail-able in Run I and that expected for Run II. This datasample consists of about 64000 triggered events.
For transverse energy measurements, only part of theMB sample was used. Only runs with initial instanta-neous luminosity below 50 × 1030 cm−2s−1 have beenkept in order to reduce the effects of event pile-up in thecalorimeters. The total number of bunch crossings ac-cepted in this subsample is about 11 × 106. The averageinstantaneous luminosities of the two MB samples areroughly 17×1030 cm−2s−1 for the energy subsample and20 × 1030 cm−2s−1 for the full sample.
An offline event selection is applied to the recordedsample of minimum-bias triggered events. Events thatcontain cosmic-ray candidates, identified by the combi-nation of tracking and calorimeter timing, are rejected.Only those events collected when all the detector com-ponents were working correctly are included in the finalreduced data sample.
6
A. Event Selection
Primary vertices are identified by the convergence ofreconstructed tracks along the z-axis. All tracks withhits in at least two COT layers are accepted. No effi-ciency correction is applied to the tracks used for thistask. Vertices are classified in several quality classes:the higher the number of tracks and their reconstructionquality (Sec. IV A), the higher the class quality assignedto the vertex. For vertices of lowest quality (mainly ver-tices with one to three tracks) a requirement that theybe symmetric is added, i.e. there must be at least onetrack in both the positive and negative rapidity regionsfor the vertex to be accepted as primary. In other words,the quantity |(N+ −N−)/(N+ + N−)|, where N± is thenumber of tracks in the positive or negative η hemisphere,cannot equal one.
Events are accepted that contain one, and only one,primary vertex in the fiducial region |zvtx| ≤ 40 cm cen-tered around the nominal CDF z = 0 position. Thisfiducial interval is further restricted to |zvtx| ≤ 20 cmwhen measurements with the calorimeter are involved.
The event selection described contains an unavoidablecontamination due to multiple vertices when the separa-tion between vertices is less than the vertex resolution inthe z-coordinate, which is about 3 cm. A correction forthis effect is discussed in Sec. VI.
B. Trigger and Vertex Acceptance
Due to small inefficiencies in the response of the CLCdetector, the minimum-bias trigger is not 100% efficient.The efficiency has been evaluated by monitoring the trig-ger with several central high transverse energy triggers,such as those containing a high pT track, a central highpT electron, or a central high ET jet. The results showthat the trigger efficiency increases with the increase ofsome global event variables such as central multiplicityand central sum ET .
On the other hand, the total acceptance (including theefficiency) of the trigger has been measured by compar-ing it with a sample of zero-bias events collected dur-ing the same period. The zero-bias data set is collectedwithout any trigger requirements, simply by starting thedata acquisition at the Tevatron radio-frequency signal.The results are in agreement with previous studies [20]and indicate that the efficiency depends on a numberof variables, most of which in some way are related tothe number of tracks present in the detector: number ofbeam interactions, number of tracks, instantaneous lu-minosity and the CLC calibration. We parametrized thedependence on these variables so that a correction canbe applied on an event-by-event basis.
The total MB trigger acceptance increases linearlywith the instantaneous luminosity. As a function of thenumber of tracks, the acceptance is well represented by atypical turn-on curve starting at about 20% (two tracks)
and reaching its plateau with a value between 97 and99% for about 15 tracks.
As stated above, the present analysis includes data col-lected with the high multiplicity trigger previously de-scribed. The offline selection for these data is the sameas that for the minimum-bias. Events from the high mul-tiplicity trigger are accepted if they have reconstructedcharged track multiplicity at Level 3 greater than or equalto 22. This value is a compromise between the desire forlarger statistics in the multiplicity region where the crosssection drops and the available trigger bandwidth. Thetrigger efficiency for this multiplicity is higher than 97%.
The primary vertex recognition efficiency for the MBdata sample is evaluated in two ways: by comparing thenumber of expected vertices on the basis of the instanta-neous luminosity and by using a Monte Carlo simulationwith multiple pp interactions. This efficiency was stud-ied as a function of various event variables and found tobe roughly flat for |z| ≤40 cm, but strongly dependenton the number of interactions in the bunch crossing andon the number of tracks available for vertex clustering.Therefore the efficiency has been parametrized as a func-tion of the number of tracks and of the instantaneousluminosity.
Because of their dependence on the number of tracksin the bunch crossing, a variable closely related to theevent particle multiplicity, both the trigger and the ver-tex efficiencies affect not only the total cross section butalso the shape of inclusive distributions. The efficiencyvalues are computed on an event-by-event basis, and arecommon to all the distributions analyzed.
C. Backgrounds
Diffractive events, with final-state particles mostlyconfined in the forward regions, may have some activ-ity in the central region that enters as a background inour sample. By assuming the following indicative valuesσci/σsd/σdd =44.4/10.3/7.0 mb for the central-inelastic,single-, and double-diffractive cross sections [21], respec-tively, and knowing the relative CLC acceptances, weestimate their contribution to the MB cross section tobe approximately 6%. Roughly the same conclusion wasdrawn by analyzing a sample of diffractive events gener-ated with the pythia simulation and passed through aMB trigger simulation. Considering that in about half ofthe diffractive events no primary vertex is reconstructed,we estimate that diffractive production forms up to 3.4%of our MB sample and is concentrated in the region oflow charged particle multiplicity and low
∑
ET .For the energy measurements, the presence of calorime-
ter towers with significant energy deposits not due to par-ticles originating from the pp interaction was checked. Ina sample of zero-bias events, after requiring no recon-structed tracks and no signal in the CES, about 0.002towers per event were found above the pedestal thresh-old. This number increases with the instantaneous lu-
7
minosity and is attributed to real particles crossing thecalorimeter, probably scattered back from the forwardcalorimeters. The resulting average energy per event wassubtracted from the measurement of each event
∑
ET .
D. The Monte Carlo Sample
A sample of simulated Monte Carlo (MC) events abouttwice the size of the data was generated with pythia
version 6.216 [22], with parameters optimized for thebest reproduction of minimum-bias interactions. pythia
Tune A [3] describes the MB interactions starting froma leading order QCD 2 → 2 matrix element augmentedby initial- and final-state showers and multiple partoninteractions [23], folded in with CTEQ5L parton distri-bution functions [24] and the Lund string fragmentationmodel [25]. To model the mixture of hard and soft inter-actions, pythia introduces a pT 0 cut off parameter [26]that regulates the divergence of the 2-to-2 parton-partonperturbative cross section at low momenta. This param-eter is used also to regulate the additional parton-partonscatterings that may occur in the same collision. Thus,fixing the amount of multiple-parton interactions (i.e.,setting the pT cut-off) allows the hard 2-to-2 parton-parton scattering to be extended all the way down topT (hard) = 0, without hitting a divergence. The amountof hard scattering in simulated MB events is, therefore,related to the activity of the so-called underlying eventin the hard scattering processes. The final state, like-wise, is subject to several effects such as the treatmentsof the beam remnants and color (re)connection effects.The pythia Tune A results presented here are the pre-dictions, not fits.
The MC sample used for all the efficiency and ac-ceptance corrections was generated with Tune A andpT 0 = 1.5 GeV/c. This tuning was found to give a similaroutput as the default (pT 0 = 0) with only slightly betterreproduction of the high pT particles and a somewhatlarger particle multiplicity distribution.
The definition of primary particles was to consider allparticles with mean lifetime τ > 0.3 × 10⁻¹⁰ s producedpromptly in the pp interaction, and the decay productsof those with shorter mean lifetimes. With this definitionstrange hadrons are included among the primary parti-cles, and those that are not reconstructed are correctedfor. On the other hand, their decay products (mainly π±
from K0S decays) are excluded, while those from heavier
flavor hadrons are included.A run-dependent simulation with a realistic distribu-
tion of multiple interactions was employed. Events werefully simulated through the detector and successively re-constructed with the standard CDF reconstruction chain.The simulation includes the CLC detectors used to trig-ger the MB sample.
The MC sample agrees with data within 10% for in-clusive charged particle pT up to about 20 GeV/c (seeFig. 6), and η distributions. A discussion on how well
the MC sample reproduces the rest of the data can befound in Sec. VI.
IV. TRACKING AND ENERGY
CORRECTIONS
This section describes the procedures adopted to cor-rect the data for detector inefficiencies and limited ac-ceptance, and for reconstruction errors. First, chargedparticle tracks are selected in such a way as to removethe main sources of background such as secondary parti-cles and mis-identified tracks (Sec. IVA). The trackingefficiency is then computed for the selected tracks, andan appropriate correction is applied to the data distribu-tions (Sec. IVB). The measurement of
∑
ET requiresa careful evaluation of the calorimeter intrinsic responseand acceptance, and of other distorting effects, especiallyin the lower ET range. A correction for each of these ef-fects is described in Sec. IV C and is applied to the data.
A. Track Selection and Acceptance
Reconstructed tracks are accepted if they comply witha minimal set of quality selections including a minimumnumber of hits, both in axial and stereo layers of theCOT. These requirements are made more stringent if nohits in the silicon detectors are used.
All tracks are required to originate in a fiducial regionin the plane (d0; ∆z), where d0 is the nearest distance,projected in the transverse plane, between the track ex-trapolation and the beam axis; ∆z is the distance be-tween the point of closest approach of the track to the z-axis and the z-coordinate of the event vertex. The actualregion selected in the (d0; ∆z) plane depends on the trackitself. Tracks reconstructed including the informationfrom silicon detectors are selected within d0 < 0.1 cm;those reconstructed with no information from the silicondetectors have worse resolution in d0, and are acceptedif d0 < 0.5 cm. A similar selection criterion is used alongthe beam axis: ∆z < 1 cm for tracks with silicon infor-mation and ∆z < 2 cm for the remaining tracks. Thesetrack selection criteria are used to select primary tracks,and were determined from MC simulation as the onesthat maximize the ratio of primary to secondary parti-cles.
As a further requirement, primary charged parti-cles must have a transverse momentum greater than0.4 GeV/c and pseudorapidity |η| ≤ 1 in order to opti-mize the efficiency and acceptance conditions. The tracksample used in this analysis is therefore very differentfrom the one used to reconstruct the event vertex.
The number of primary charged particles in the eventafter the above selection is defined as the event multiplic-ity Nch.
8
B. Tracking Efficiency
The detector acceptance and the tracker efficiency havebeen analyzed with the aim of estimating a correction toeach inclusive distribution presented in the paper. Foreach track, the multiplicative correction is computed us-ing MC as
C(pT , Nch) =NGEN
primary(pT , Nch) in |η| < 1
NRECprimary(pT , Nch) in |η| < 1
, (1)
where NRECprimary is the number of tracks reconstructed
as primary and NGENprimary the number of generated pri-
mary charged particles. This correction factor includesthe track detection and reconstruction efficiency, the cor-rection for the contamination of secondary particles (par-ticle interaction, pair creation), particle decays and mis-identified tracks (in MC, reconstructed tracks that do notmatch to a generated charged particle).
The tracking efficiency is strongly dependent on thenumber of tracks with a trajectory passing close to theevent vertex. To avoid biases due to an incorrect multi-plicity distribution in the MC generator, the correctionfactor was evaluated, as a function of pT , in ten differentranges of track multiplicity.
The tracking efficiency is the largest contribution toC. It is about 70% at pT = 0.4 GeV/c and increases toabout 92% at 5 GeV/c, where it reaches a plateau.
The fraction of secondary and mis-identified tracksranges between 1 and 3% over the whole spectrum. Thefinal correction is roughly flat in η and φ, and shows twobroad peaks in z that correspond to the edges of the sil-icon detector barrels.
The total correction, as defined in Eq. 1, includes alsothe smearing correction for very high pT tracks, wherethe small curvature may be a source of high dispersion inthe reconstructed pT value, and introduces a significantdeviation with respect to the generated pT .
The measured track pT distribution is corrected byweighting each track that enters the distribution by thecorrection (computed at the pT and Nch values corre-sponding to that specific track) and by the event-relatedacceptances (trigger and vertex efficiency and diffractiveevent subtraction described in Sec. III B and III C).
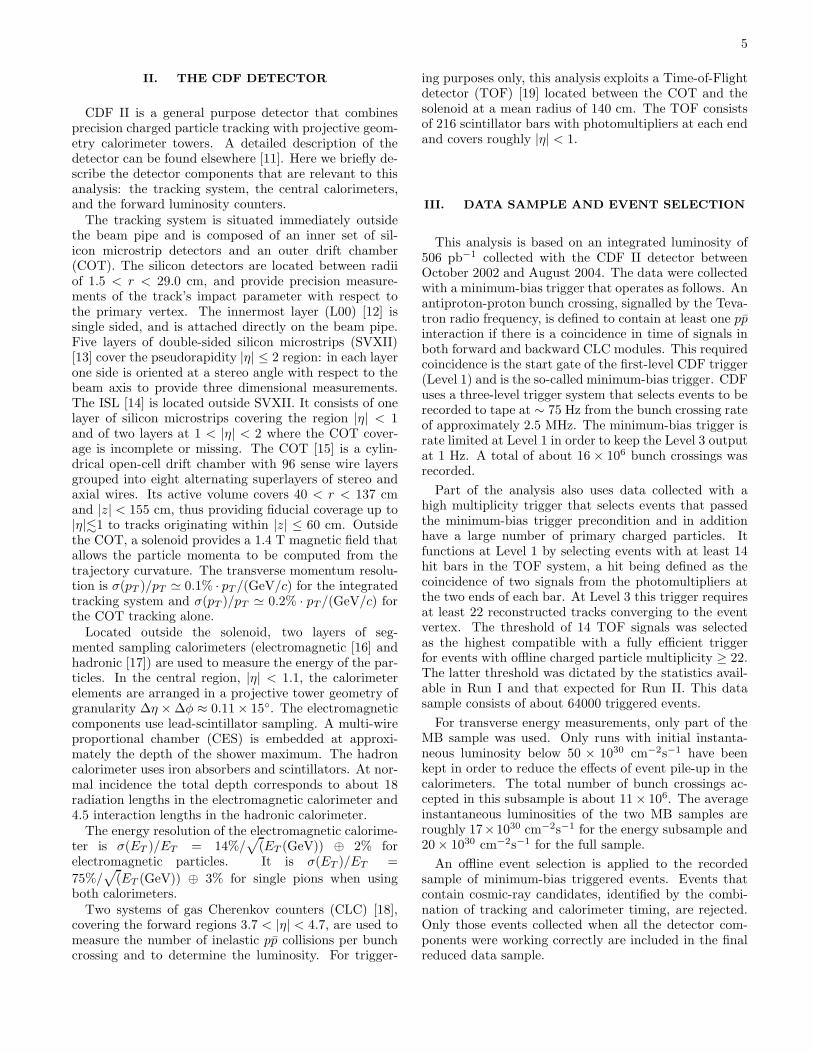
To illustrate the effect of the convolution of all thecorrections on the final distribution, the ratio of the fullycorrected to the raw distributions is shown in Fig. 1. Thecorrection decreases from 1.6 at pT = 0.4 GeV/c to 1.05above 100 GeV/c.
The C〈pT 〉 vs Nchdependence (presented in Sec. VI B)
requires a specific two step correction procedure. First,for each data point at fixed Nch, the correction to the〈pT 〉 is evaluated and 〈pT 〉 is corrected accordingly. Ina second step, a correction is applied for the smearingof the multiplicity of the events. Using MC, a matrix isgenerated that contains the probability P that an event
[GeV/c] T
p1 10 210
corr
ecte
d / u
ncor
rect
ed
1
1.2
1.4
1.6
1.8
FIG. 1: Ratio of the corrected to uncorrected pT distributions.The correction is roughly flat for pT > 10 GeV/c.
with nr reconstructed tracks was actually generated withng particles:
〈pT 〉nr=m =
ng∑
i
(〈pT 〉nr=i · Png=inr=m) , (2)
where m and i refer to the reconstructed and generatedmultiplicity bin, respectively. In doing this it is assumedthat, for all multiplicities, the average pT of events withng = n generated tracks is the same as that of the eventswith nr = n reconstructed tracks. This is indeed the caseafter the absolute correction on 〈pT 〉 is applied.
C. Calorimeter Response and Correction of the∑
ET Distribution
The transverse energy is computed in the limited re-gion |η| < 1 as the scalar sum over the calorimeter tow-ers of the transverse energies in the electromagnetic andhadronic compartments:
∑
ET =∑
towers
Etower sin (θtower) , (3)
where θtower is the polar angle measured with respectto the direction of the proton beam from the actual pri-mary vertex position. Towers with less than 100 MeVdeposition are not included in the sum.
CDF calorimetry is optimized for the measurement ofhigh energy depositions and the analysis of its energy re-sponse is not usually performed below a few GeV. In thispaper the total
∑
ET distribution is pushed down belowthis limit and a specific study of the energy correctionextension had to be done.
The calorimeter response to single charged particleswas checked to be well represented by the simulationdown to a track pT of about 400 MeV/c. The simulationof the energy deposition of neutral particles is assumedto be correct. Since the fraction of charged and neutralenergy produced in data and in our MC sample agree
9
fairly well, we rely on MC simulation to measure downto
∑
ET = 1 GeV the integrated calorimeter response tothe total energy deposited.
The list of corrections applied to the data∑
ET dis-tribution is the following. All corrections are made afterthe calibration of the calorimeters.
1. Tower relative correction. The response to the en-ergy entering each calorimeter tower was measuredwith MC as a function of the η of the tower andof the z coordinate of the primary vertex and thennormalized to the value obtained for the tower withthe best response. This correction is introduced tomake the calorimeter response flat in η and vertexz.
2. Absolute correction for the calorimeter response tothe total energy released in each event. This iscalculated, using MC, as the ratio of the
∑
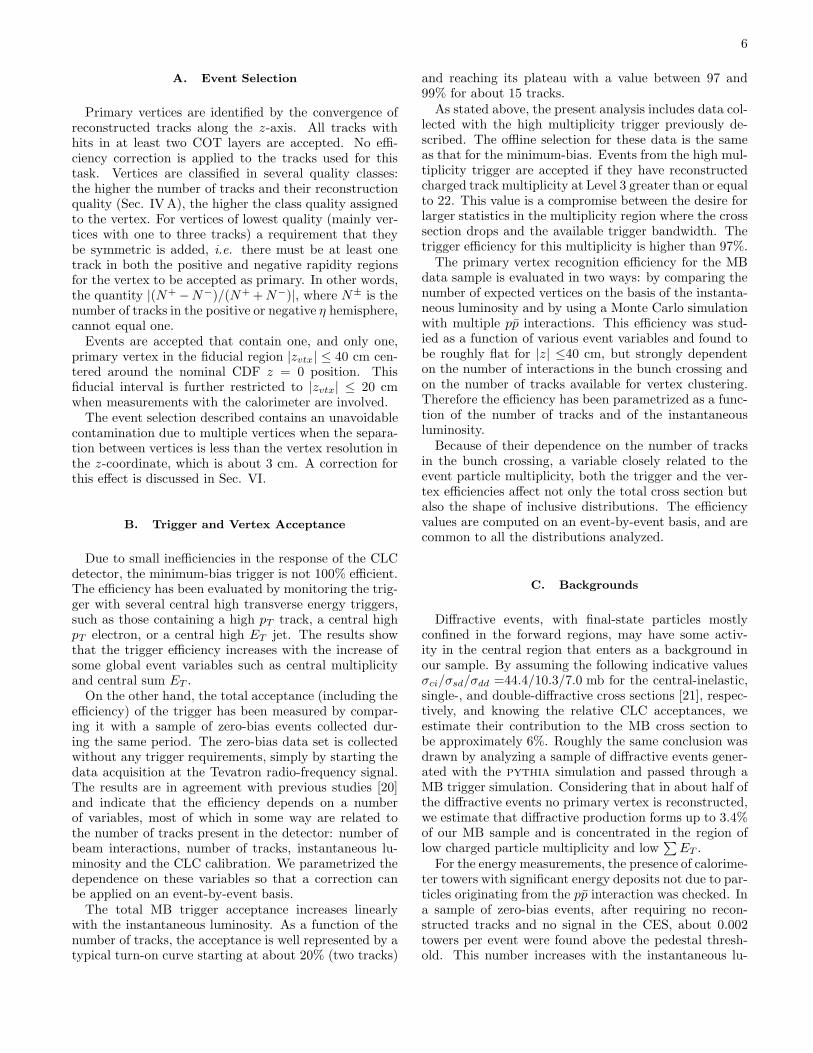
ET re-constructed in the calorimeter and corrected for thetower relative response in (η; z), to the sum of thetransverse energies of the generated primary parti-cles in |η| < 1 whose trajectory extrapolates to thesame region. The calorimeter response as a func-tion of
∑
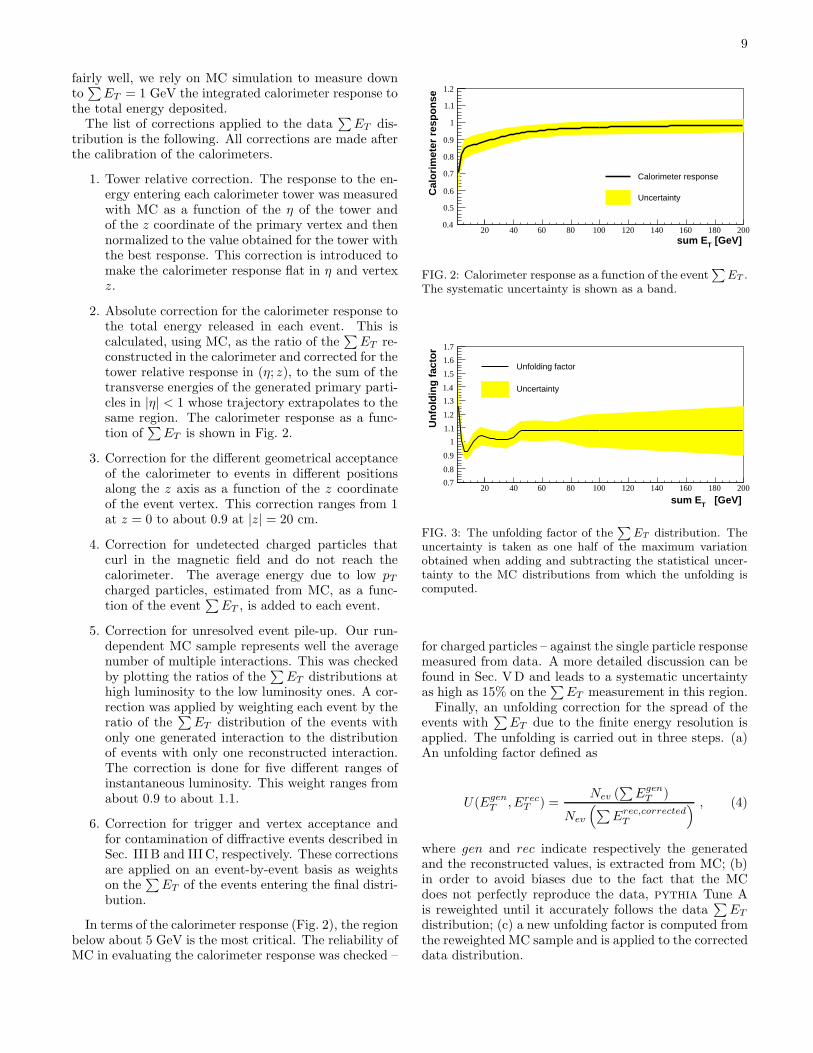
ET is shown in Fig. 2.
3. Correction for the different geometrical acceptanceof the calorimeter to events in different positionsalong the z axis as a function of the z coordinateof the event vertex. This correction ranges from 1at z = 0 to about 0.9 at |z| = 20 cm.
4. Correction for undetected charged particles thatcurl in the magnetic field and do not reach thecalorimeter. The average energy due to low pT
charged particles, estimated from MC, as a func-tion of the event
∑
ET , is added to each event.
5. Correction for unresolved event pile-up. Our run-dependent MC sample represents well the averagenumber of multiple interactions. This was checkedby plotting the ratios of the
∑
ET distributions athigh luminosity to the low luminosity ones. A cor-rection was applied by weighting each event by theratio of the
∑
ET distribution of the events withonly one generated interaction to the distributionof events with only one reconstructed interaction.The correction is done for five different ranges ofinstantaneous luminosity. This weight ranges fromabout 0.9 to about 1.1.
6. Correction for trigger and vertex acceptance andfor contamination of diffractive events described inSec. III B and III C, respectively. These correctionsare applied on an event-by-event basis as weightson the
∑
ET of the events entering the final distri-bution.
In terms of the calorimeter response (Fig. 2), the regionbelow about 5 GeV is the most critical. The reliability ofMC in evaluating the calorimeter response was checked –
[GeV] Tsum E20 40 60 80 100 120 140 160 180 200
Cal
orim
eter
res
pons
e
0.4
0.5
0.6
0.7
0.8
0.9
1
1.1
1.2
Calorimeter response
Uncertainty
FIG. 2: Calorimeter response as a function of the event∑
ET .The systematic uncertainty is shown as a band.
[GeV] Tsum E20 40 60 80 100 120 140 160 180 200
Unf
oldi
ng fa
ctor
0.7
0.8
0.9
1
1.1
1.2
1.3
1.4
1.5
1.6
1.7
Unfolding factor
Uncertainty
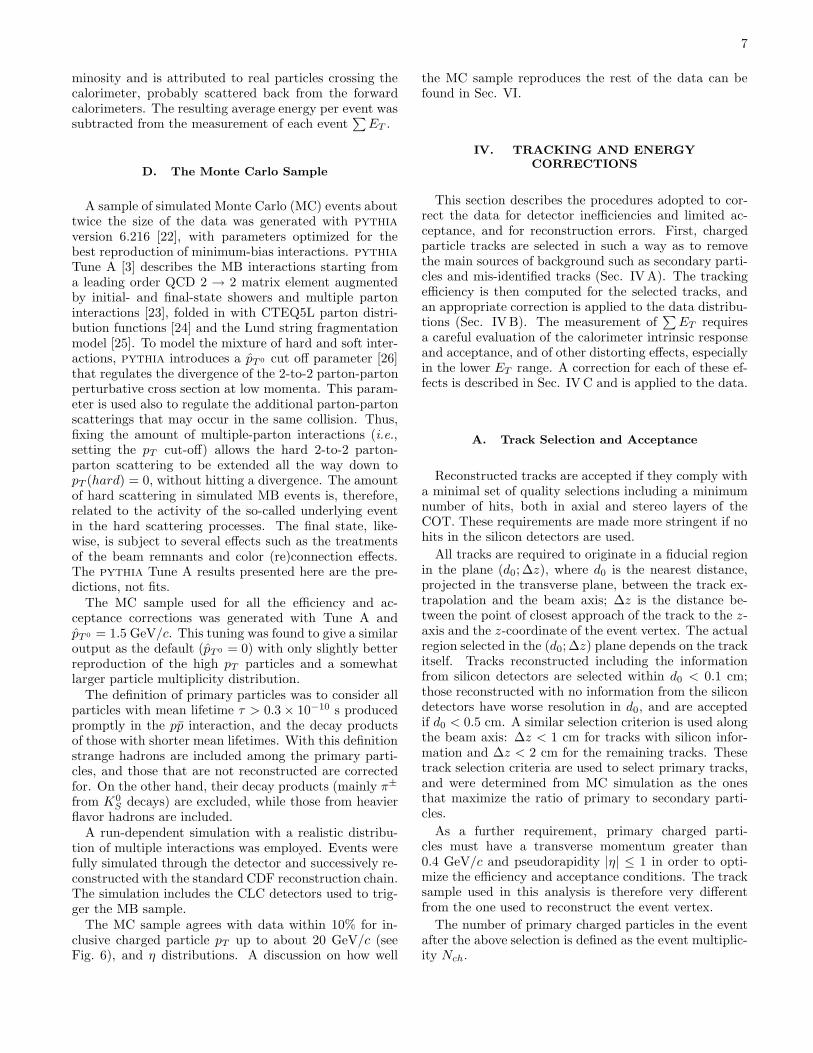
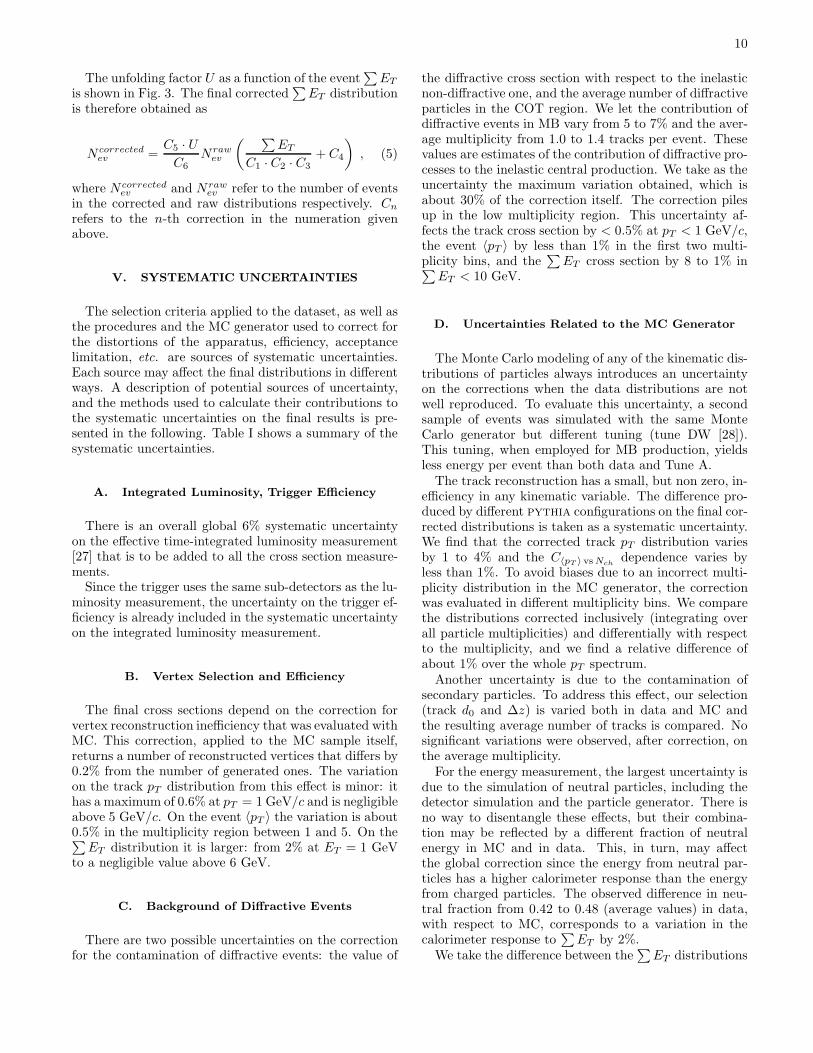
FIG. 3: The unfolding factor of the∑
ET distribution. Theuncertainty is taken as one half of the maximum variationobtained when adding and subtracting the statistical uncer-tainty to the MC distributions from which the unfolding iscomputed.
for charged particles – against the single particle responsemeasured from data. A more detailed discussion can befound in Sec. VD and leads to a systematic uncertaintyas high as 15% on the
∑
ET measurement in this region.Finally, an unfolding correction for the spread of the
events with∑
ET due to the finite energy resolution isapplied. The unfolding is carried out in three steps. (a)An unfolding factor defined as
U(EgenT , Erec
T ) =Nev (
∑
EgenT )
Nev
(
∑
Erec,correctedT
) , (4)
where gen and rec indicate respectively the generatedand the reconstructed values, is extracted from MC; (b)in order to avoid biases due to the fact that the MCdoes not perfectly reproduce the data, pythia Tune Ais reweighted until it accurately follows the data
∑
ET
distribution; (c) a new unfolding factor is computed fromthe reweighted MC sample and is applied to the correcteddata distribution.
10
The unfolding factor U as a function of the event∑
ET
is shown in Fig. 3. The final corrected∑
ET distributionis therefore obtained as
N correctedev =
C5 · UC6
N rawev
( ∑
ET
C1 · C2 · C3+ C4
)
, (5)
where N correctedev and N raw
ev refer to the number of eventsin the corrected and raw distributions respectively. Cn
refers to the n-th correction in the numeration givenabove.
V. SYSTEMATIC UNCERTAINTIES
The selection criteria applied to the dataset, as well asthe procedures and the MC generator used to correct forthe distortions of the apparatus, efficiency, acceptancelimitation, etc. are sources of systematic uncertainties.Each source may affect the final distributions in differentways. A description of potential sources of uncertainty,and the methods used to calculate their contributions tothe systematic uncertainties on the final results is pre-sented in the following. Table I shows a summary of thesystematic uncertainties.
A. Integrated Luminosity, Trigger Efficiency
There is an overall global 6% systematic uncertaintyon the effective time-integrated luminosity measurement[27] that is to be added to all the cross section measure-ments.
Since the trigger uses the same sub-detectors as the lu-minosity measurement, the uncertainty on the trigger ef-ficiency is already included in the systematic uncertaintyon the integrated luminosity measurement.
B. Vertex Selection and Efficiency
The final cross sections depend on the correction forvertex reconstruction inefficiency that was evaluated withMC. This correction, applied to the MC sample itself,returns a number of reconstructed vertices that differs by0.2% from the number of generated ones. The variationon the track pT distribution from this effect is minor: ithas a maximum of 0.6% at pT = 1 GeV/c and is negligibleabove 5 GeV/c. On the event 〈pT 〉 the variation is about0.5% in the multiplicity region between 1 and 5. On the∑
ET distribution it is larger: from 2% at ET = 1 GeVto a negligible value above 6 GeV.
C. Background of Diffractive Events
There are two possible uncertainties on the correctionfor the contamination of diffractive events: the value of
the diffractive cross section with respect to the inelasticnon-diffractive one, and the average number of diffractiveparticles in the COT region. We let the contribution ofdiffractive events in MB vary from 5 to 7% and the aver-age multiplicity from 1.0 to 1.4 tracks per event. Thesevalues are estimates of the contribution of diffractive pro-cesses to the inelastic central production. We take as theuncertainty the maximum variation obtained, which isabout 30% of the correction itself. The correction pilesup in the low multiplicity region. This uncertainty af-fects the track cross section by < 0.5% at pT < 1 GeV/c,the event 〈pT 〉 by less than 1% in the first two multi-plicity bins, and the
∑
ET cross section by 8 to 1% in∑
ET < 10 GeV.
D. Uncertainties Related to the MC Generator
The Monte Carlo modeling of any of the kinematic dis-tributions of particles always introduces an uncertaintyon the corrections when the data distributions are notwell reproduced. To evaluate this uncertainty, a secondsample of events was simulated with the same MonteCarlo generator but different tuning (tune DW [28]).This tuning, when employed for MB production, yieldsless energy per event than both data and Tune A.
The track reconstruction has a small, but non zero, in-efficiency in any kinematic variable. The difference pro-duced by different pythia configurations on the final cor-rected distributions is taken as a systematic uncertainty.We find that the corrected track pT distribution variesby 1 to 4% and the C〈pT 〉 vs Nch
dependence varies byless than 1%. To avoid biases due to an incorrect multi-plicity distribution in the MC generator, the correctionwas evaluated in different multiplicity bins. We comparethe distributions corrected inclusively (integrating overall particle multiplicities) and differentially with respectto the multiplicity, and we find a relative difference ofabout 1% over the whole pT spectrum.
Another uncertainty is due to the contamination ofsecondary particles. To address this effect, our selection(track d0 and ∆z) is varied both in data and MC andthe resulting average number of tracks is compared. Nosignificant variations were observed, after correction, onthe average multiplicity.
For the energy measurement, the largest uncertainty isdue to the simulation of neutral particles, including thedetector simulation and the particle generator. There isno way to disentangle these effects, but their combina-tion may be reflected by a different fraction of neutralenergy in MC and in data. This, in turn, may affectthe global correction since the energy from neutral par-ticles has a higher calorimeter response than the energyfrom charged particles. The observed difference in neu-tral fraction from 0.42 to 0.48 (average values) in data,with respect to MC, corresponds to a variation in thecalorimeter response to
∑
ET by 2%.We take the difference between the
∑
ET distributions
11
Source/Distribution Ntracks (pT ) event 〈pT 〉 Nevents (∑
ET )Luminosity and Trigger 6% — 6%Vertex 0 – 0.6% 0 – 0.5% 0 – 2%Diffractive events 0 – 0.5% 0 – 1% 0 – 8%MC tuning 1 – 4 % < 1% 5 – 15%Method 1% — —Lost ET — — 1%Pile-Up — — 0 – 3%
TABLE I: Summary of the systematic uncertainties.
corrected with different MC tunings as the uncertaintydue to the generator. The uncertainty is about 15% atET < 5 GeV, drops to about 5% at 10 GeV and thenremains roughly constant. Note that, at least in part,this uncertainty includes the previous one concerning thesimulation of neutral particles.
The uncertainty on the amount of energy per eventdue to low pT looping charged particles depends directlyon the generator because the region of lower momenta isdifficult to compare to data. The two pythia tuningsthat we employ give a difference of about 1% in
∑
ET
over the whole spectrum, which corresponds to about thesame uncertainty on the distribution shape.
E. Uncertainties Originating from Event Pile-Up
Finally, there is an uncertainty due to unresolved pile-up of events within 3 cm to each other along the beamline. None of the algorithms that we tried was able toseparate these overlaps efficiently.
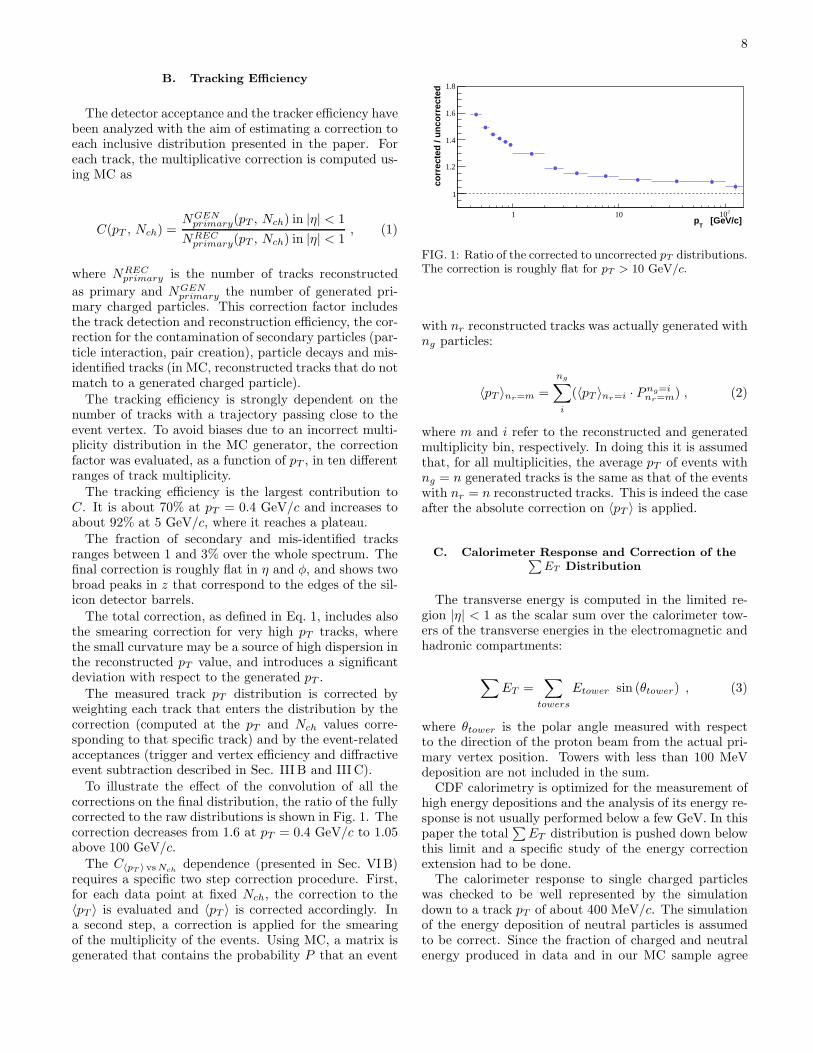
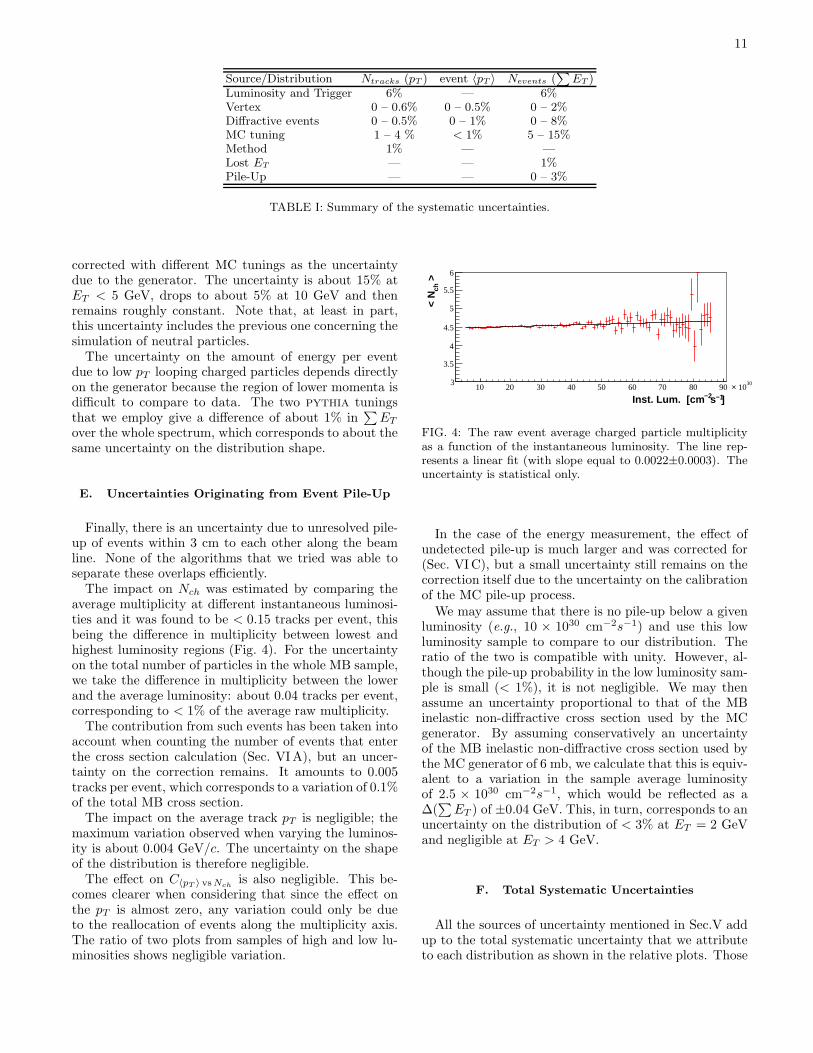
The impact on Nch was estimated by comparing theaverage multiplicity at different instantaneous luminosi-ties and it was found to be < 0.15 tracks per event, thisbeing the difference in multiplicity between lowest andhighest luminosity regions (Fig. 4). For the uncertaintyon the total number of particles in the whole MB sample,we take the difference in multiplicity between the lowerand the average luminosity: about 0.04 tracks per event,corresponding to < 1% of the average raw multiplicity.
The contribution from such events has been taken intoaccount when counting the number of events that enterthe cross section calculation (Sec. VI A), but an uncer-tainty on the correction remains. It amounts to 0.005tracks per event, which corresponds to a variation of 0.1%of the total MB cross section.
The impact on the average track pT is negligible; themaximum variation observed when varying the luminos-ity is about 0.004 GeV/c. The uncertainty on the shapeof the distribution is therefore negligible.
The effect on C〈pT 〉 vs Nchis also negligible. This be-
comes clearer when considering that since the effect onthe pT is almost zero, any variation could only be dueto the reallocation of events along the multiplicity axis.The ratio of two plots from samples of high and low lu-minosities shows negligible variation.
] −1s−2Inst. Lum. [cm10 20 30 40 50 60 70 80 90
>
ch<
N
3
3.5
4
4.5
5
5.5
6
30 10×
FIG. 4: The raw event average charged particle multiplicityas a function of the instantaneous luminosity. The line rep-resents a linear fit (with slope equal to 0.0022±0.0003). Theuncertainty is statistical only.
In the case of the energy measurement, the effect ofundetected pile-up is much larger and was corrected for(Sec. VI C), but a small uncertainty still remains on thecorrection itself due to the uncertainty on the calibrationof the MC pile-up process.
We may assume that there is no pile-up below a givenluminosity (e.g., 10 × 1030 cm−2s−1) and use this lowluminosity sample to compare to our distribution. Theratio of the two is compatible with unity. However, al-though the pile-up probability in the low luminosity sam-ple is small (< 1%), it is not negligible. We may thenassume an uncertainty proportional to that of the MBinelastic non-diffractive cross section used by the MCgenerator. By assuming conservatively an uncertaintyof the MB inelastic non-diffractive cross section used bythe MC generator of 6 mb, we calculate that this is equiv-alent to a variation in the sample average luminosityof 2.5 × 1030 cm−2s−1, which would be reflected as a∆(
∑
ET ) of ±0.04 GeV. This, in turn, corresponds to anuncertainty on the distribution of < 3% at ET = 2 GeVand negligible at ET > 4 GeV.
F. Total Systematic Uncertainties
All the sources of uncertainty mentioned in Sec.V addup to the total systematic uncertainty that we attributeto each distribution as shown in the relative plots. Those
12
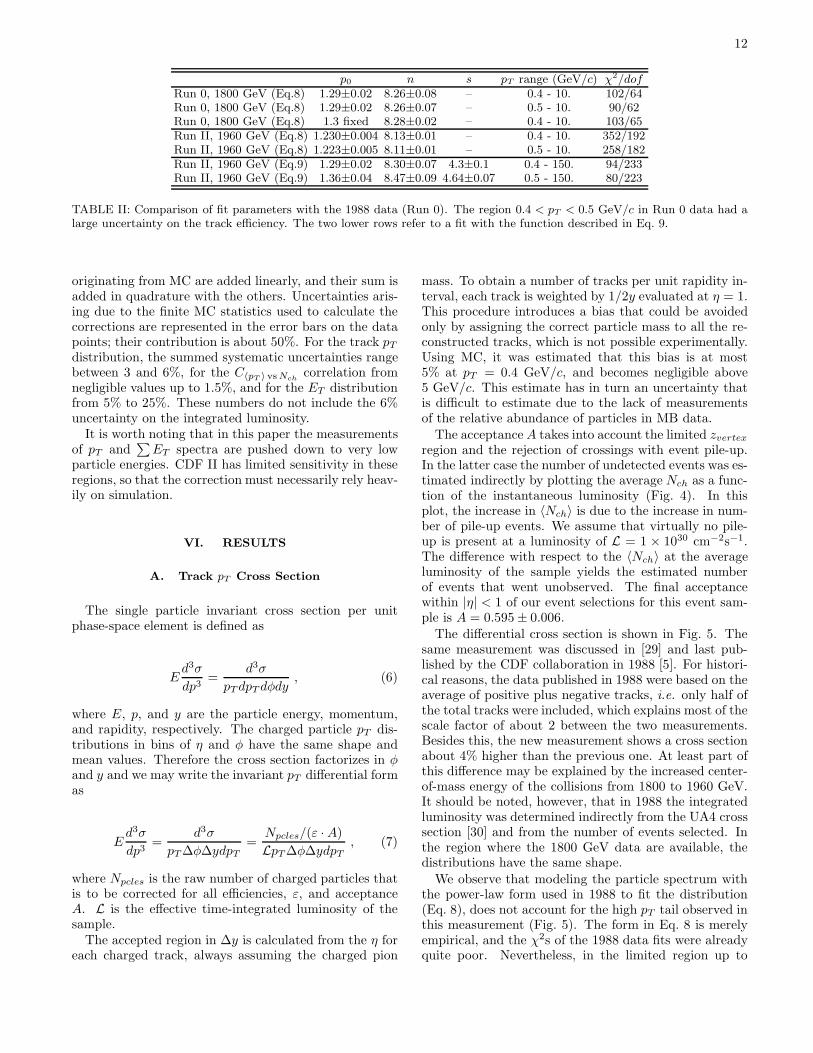
p0 n s pT range (GeV/c) χ2/dofRun 0, 1800 GeV (Eq.8) 1.29±0.02 8.26±0.08 – 0.4 - 10. 102/64Run 0, 1800 GeV (Eq.8) 1.29±0.02 8.26±0.07 – 0.5 - 10. 90/62Run 0, 1800 GeV (Eq.8) 1.3 fixed 8.28±0.02 – 0.4 - 10. 103/65Run II, 1960 GeV (Eq.8) 1.230±0.004 8.13±0.01 – 0.4 - 10. 352/192Run II, 1960 GeV (Eq.8) 1.223±0.005 8.11±0.01 – 0.5 - 10. 258/182Run II, 1960 GeV (Eq.9) 1.29±0.02 8.30±0.07 4.3±0.1 0.4 - 150. 94/233Run II, 1960 GeV (Eq.9) 1.36±0.04 8.47±0.09 4.64±0.07 0.5 - 150. 80/223
TABLE II: Comparison of fit parameters with the 1988 data (Run 0). The region 0.4 < pT < 0.5 GeV/c in Run 0 data had alarge uncertainty on the track efficiency. The two lower rows refer to a fit with the function described in Eq. 9.
originating from MC are added linearly, and their sum isadded in quadrature with the others. Uncertainties aris-ing due to the finite MC statistics used to calculate thecorrections are represented in the error bars on the datapoints; their contribution is about 50%. For the track pT
distribution, the summed systematic uncertainties rangebetween 3 and 6%, for the C〈pT 〉 vs Nch
correlation fromnegligible values up to 1.5%, and for the ET distributionfrom 5% to 25%. These numbers do not include the 6%uncertainty on the integrated luminosity.
It is worth noting that in this paper the measurementsof pT and
∑
ET spectra are pushed down to very lowparticle energies. CDF II has limited sensitivity in theseregions, so that the correction must necessarily rely heav-ily on simulation.
VI. RESULTS
A. Track pT Cross Section
The single particle invariant cross section per unitphase-space element is defined as
Ed3σ
dp3=
d3σ
pT dpT dφdy, (6)
where E, p, and y are the particle energy, momentum,and rapidity, respectively. The charged particle pT dis-tributions in bins of η and φ have the same shape andmean values. Therefore the cross section factorizes in φand y and we may write the invariant pT differential formas
Ed3σ
dp3=
d3σ
pT ∆φ∆ydpT
=Npcles/(ε · A)
LpT ∆φ∆ydpT
, (7)
where Npcles is the raw number of charged particles thatis to be corrected for all efficiencies, ε, and acceptanceA. L is the effective time-integrated luminosity of thesample.
The accepted region in ∆y is calculated from the η foreach charged track, always assuming the charged pion
mass. To obtain a number of tracks per unit rapidity in-terval, each track is weighted by 1/2y evaluated at η = 1.This procedure introduces a bias that could be avoidedonly by assigning the correct particle mass to all the re-constructed tracks, which is not possible experimentally.Using MC, it was estimated that this bias is at most5% at pT = 0.4 GeV/c, and becomes negligible above5 GeV/c. This estimate has in turn an uncertainty thatis difficult to estimate due to the lack of measurementsof the relative abundance of particles in MB data.
The acceptance A takes into account the limited zvertex
region and the rejection of crossings with event pile-up.In the latter case the number of undetected events was es-timated indirectly by plotting the average Nch as a func-tion of the instantaneous luminosity (Fig. 4). In thisplot, the increase in 〈Nch〉 is due to the increase in num-ber of pile-up events. We assume that virtually no pile-up is present at a luminosity of L = 1 × 1030 cm−2s−1.The difference with respect to the 〈Nch〉 at the averageluminosity of the sample yields the estimated numberof events that went unobserved. The final acceptancewithin |η| < 1 of our event selections for this event sam-ple is A = 0.595 ± 0.006.
The differential cross section is shown in Fig. 5. Thesame measurement was discussed in [29] and last pub-lished by the CDF collaboration in 1988 [5]. For histori-cal reasons, the data published in 1988 were based on theaverage of positive plus negative tracks, i.e. only half ofthe total tracks were included, which explains most of thescale factor of about 2 between the two measurements.Besides this, the new measurement shows a cross sectionabout 4% higher than the previous one. At least part ofthis difference may be explained by the increased center-of-mass energy of the collisions from 1800 to 1960 GeV.It should be noted, however, that in 1988 the integratedluminosity was determined indirectly from the UA4 crosssection [30] and from the number of events selected. Inthe region where the 1800 GeV data are available, thedistributions have the same shape.
We observe that modeling the particle spectrum withthe power-law form used in 1988 to fit the distribution(Eq. 8), does not account for the high pT tail observed inthis measurement (Fig. 5). The form in Eq. 8 is merelyempirical, and the χ2s of the 1988 data fits were alreadyquite poor. Nevertheless, in the limited region up to
13
)]
2/c2
[mb/
(GeV
φdy
dT
dpT
/ p
σ3d
−1310
−1210
−1110
−1010
−910
−810
−710
−610
−510
−410
−310
−210
−110
1
10
210
Data Run II
fit Run II 1960 GeV
fit Run 1800 GeV (x 2)
1≤|η|
0.4 GeV/c≥T
p
[GeV/c] T
p0 20 40 60 80 100 120 140
Unc
erta
inty
%
0
20
40
Total uncertainty
Systematic uncertainty
6% luminosity uncertainty± not included
Data Run II
fit Run II 1960 GeV
fit Run 1800 GeV (x 2)
1≤|η|
0.4 GeV/c≥T
p
[GeV/c] T
p1 10 210
Total uncertainty
Systematic uncertainty
6% luminosity uncertainty not included±
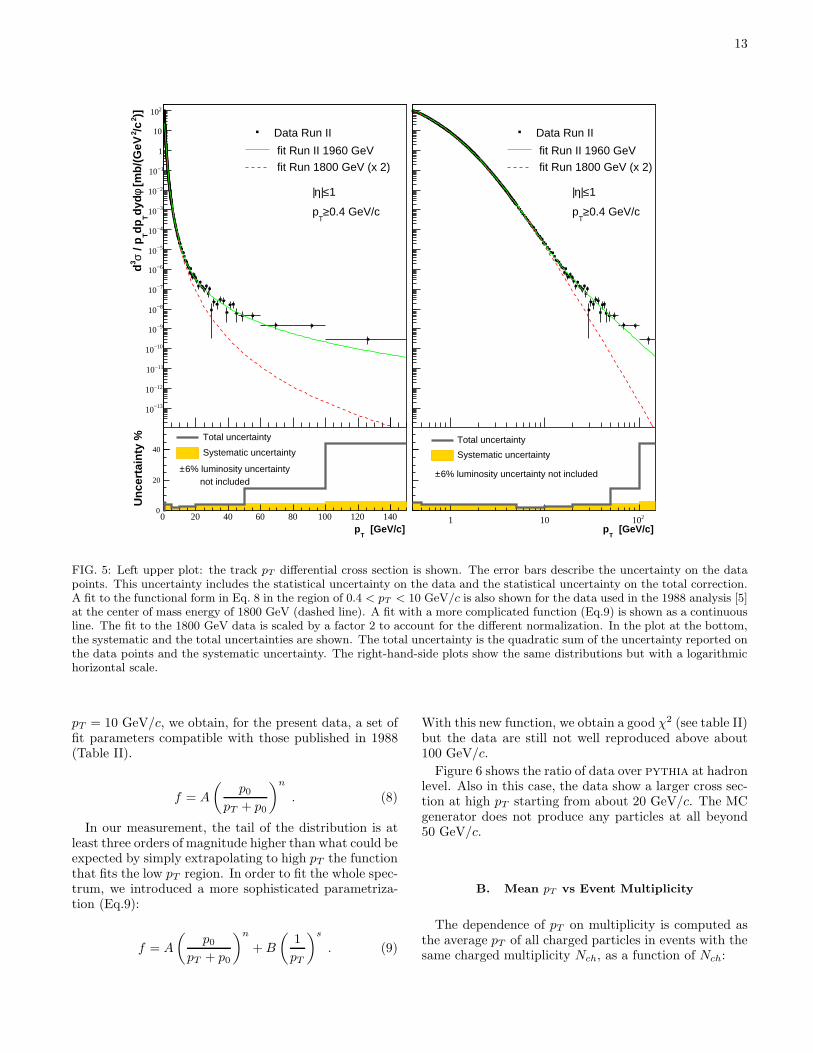
FIG. 5: Left upper plot: the track pT differential cross section is shown. The error bars describe the uncertainty on the datapoints. This uncertainty includes the statistical uncertainty on the data and the statistical uncertainty on the total correction.A fit to the functional form in Eq. 8 in the region of 0.4 < pT < 10 GeV/c is also shown for the data used in the 1988 analysis [5]at the center of mass energy of 1800 GeV (dashed line). A fit with a more complicated function (Eq.9) is shown as a continuousline. The fit to the 1800 GeV data is scaled by a factor 2 to account for the different normalization. In the plot at the bottom,the systematic and the total uncertainties are shown. The total uncertainty is the quadratic sum of the uncertainty reported onthe data points and the systematic uncertainty. The right-hand-side plots show the same distributions but with a logarithmichorizontal scale.
pT = 10 GeV/c, we obtain, for the present data, a set offit parameters compatible with those published in 1988(Table II).
f = A
(
p0
pT + p0
)n
. (8)
In our measurement, the tail of the distribution is atleast three orders of magnitude higher than what could beexpected by simply extrapolating to high pT the functionthat fits the low pT region. In order to fit the whole spec-trum, we introduced a more sophisticated parametriza-tion (Eq.9):
f = A
(
p0
pT + p0
)n
+ B
(
1
pT
)s
. (9)
With this new function, we obtain a good χ2 (see table II)but the data are still not well reproduced above about100 GeV/c.
Figure 6 shows the ratio of data over pythia at hadronlevel. Also in this case, the data show a larger cross sec-tion at high pT starting from about 20 GeV/c. The MCgenerator does not produce any particles at all beyond50 GeV/c.
B. Mean pT vs Event Multiplicity
The dependence of pT on multiplicity is computed asthe average pT of all charged particles in events with thesame charged multiplicity Nch, as a function of Nch:

14
)]
2/c2
[mb/
(GeV
φdy
dT
dpT
/ p
σ3d
−1010
−910
−810
−710
−610
−510
−410
−310
−210
−110
1
10
210
Data Run II
Pythia TuneA, hadron level
1≤|η|
0.4 GeV/c≥T
p
[GeV/c] T
p5 10 15 20 25 30 35 40 45
Dat
a / P
ythi
a
0.5
1
1.5
2
2.5
3
3.5 Data / Pythia TuneA, hadron level
Systematicuncertainty
Data Run II
Pythia TuneA, hadron level
1≤|η|
0.4 GeV/c≥T
p
[GeV/c] T
p1 10
Data / Pythia TuneA, hadron level
Systematic uncertainty
FIG. 6: Left upper plot: comparison of the track pT differential cross section with pythia prediction at hadron level (Tune Awith pT0 = 1.5 GeV/c). The data error bars describe the uncertainty on the data points. This uncertainty includes thestatistical uncertainty on the data and the statistical uncertainty on the total correction. The error bars on MC represent itsstatistical uncertainty. The ratio of data over prediction is shown in the lower plot. The right-hand-side plots show the samedistributions but with a logarithmic horizontal scale. Note that these distributions are cut off at 50 GeV/c since pythia doesnot produce particles at all beyond that value.
C〈pT 〉 vs Nch=
∑
ev
∑Nch
i piT
NNchev · Nch
. (10)
The rate of change of 〈pT 〉 versus Nch is a measure ofthe amount of hard versus soft processes contributing tominimum-bias collisions; in simulation the rate is sensi-tive to the modeling of the multiple-parton interactions(MPI) [1]. The model that currently best reproduces thecorrelation, pythia Tune A, was tuned to fit the activityin the so-called underlying event in high transverse mo-mentum jet production [31]. However, it uses the samecut-off parameter pT 0 to regulate the divergence of theprimary 2-to-2 parton-parton scattering and the numberof additional parton-parton interactions in the same col-lision. In addition, in pythia the final state is subjectto color (re)connection effects between different parton
interactions of the same collision.
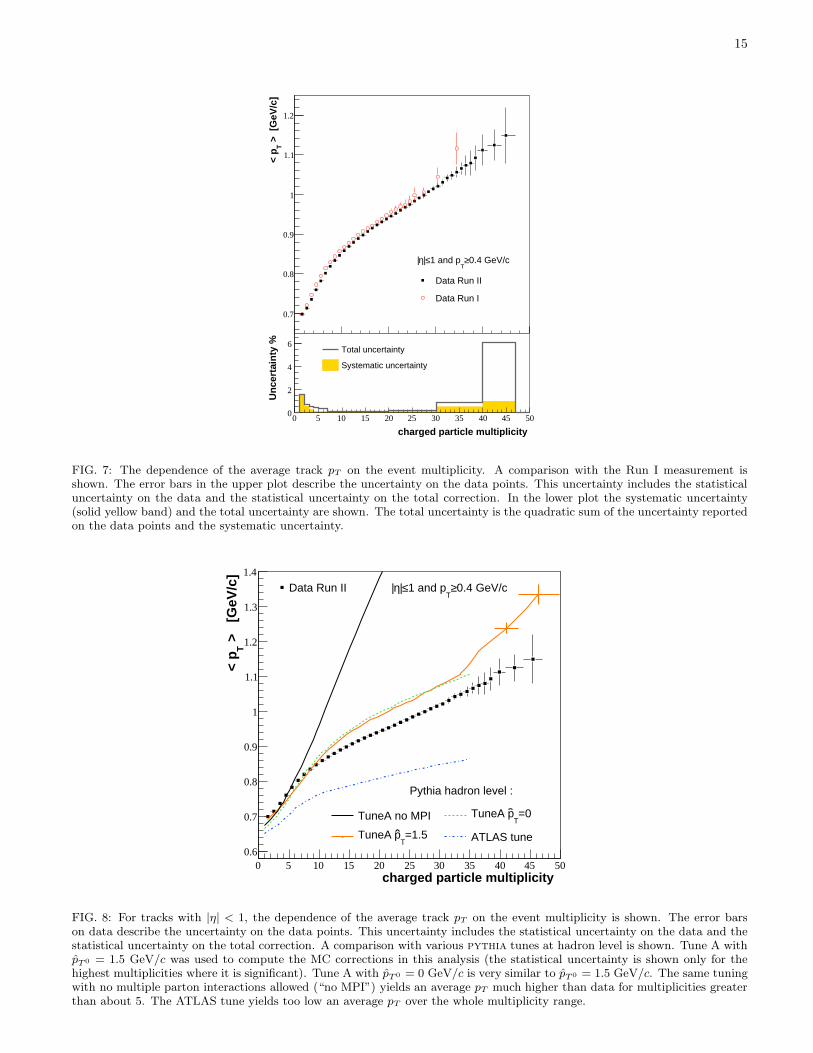
The naive expectation from an uncorrelated systemof strings decaying to hadrons would be that the 〈pT 〉should be independent of Nch. However, already at theISR and at the SppS [32], and more recently at RHIC andat the Tevatron [29] [33], such flat behavior was convinc-ingly ruled out. A study of the dependence of the meantransverse momentum 〈pT 〉 on the charged multiplicitywas already performed by CDF in Run I and publishedin [6]. In the analysis presented here an extension tohigher multiplicities, well over 40 particles in the centralrapidity region, is presented. The precision greatly ben-efits from the larger statistics obtained with a dedicatedtrigger (Sec. III). Data from the high multiplicity trig-ger are included by merging them into the MB sample.Comparison with Run I data (Fig. 7) suggests that thereis no faster rise of 〈pT 〉 at the higher multiplicities. Such
15
> [
GeV
/c]
T<
p
0.7
0.8
0.9
1
1.1
1.2
0.4 GeV/c≥T
1 and p≤|η |
Data Run II
Data Run I
charged particle multiplicity 0 5 10 15 20 25 30 35 40 45 50
Unc
erta
inty
%
0
2
4
6Total uncertainty
Systematic uncertainty
FIG. 7: The dependence of the average track pT on the event multiplicity. A comparison with the Run I measurement isshown. The error bars in the upper plot describe the uncertainty on the data points. This uncertainty includes the statisticaluncertainty on the data and the statistical uncertainty on the total correction. In the lower plot the systematic uncertainty(solid yellow band) and the total uncertainty are shown. The total uncertainty is the quadratic sum of the uncertainty reportedon the data points and the systematic uncertainty.
charged particle multiplicity 0 5 10 15 20 25 30 35 40 45 50
>
[GeV
/c]
T<
p
0.6
0.7
0.8
0.9
1
1.1
1.2
1.3
1.4
TuneA no MPI
=1.5T
pTuneA
=0T
pTuneA
ATLAS tune
Data Run II 0.4 GeV/c≥T
1 and p≤|η|
Pythia hadron level :
FIG. 8: For tracks with |η| < 1, the dependence of the average track pT on the event multiplicity is shown. The error barson data describe the uncertainty on the data points. This uncertainty includes the statistical uncertainty on the data and thestatistical uncertainty on the total correction. A comparison with various pythia tunes at hadron level is shown. Tune A withpT0 = 1.5 GeV/c was used to compute the MC corrections in this analysis (the statistical uncertainty is shown only for thehighest multiplicities where it is significant). Tune A with pT0 = 0 GeV/c is very similar to pT0 = 1.5 GeV/c. The same tuningwith no multiple parton interactions allowed (“no MPI”) yields an average pT much higher than data for multiplicities greaterthan about 5. The ATLAS tune yields too low an average pT over the whole multiplicity range.
16
[m
b/G
eV]
φdηdT
/dE
σ3d
−710
−610
−510
−410
−310
−210
−110 Data Run II
1≤|η|
[GeV] T
sum E0 20 40 60 80 100 120 140 160 180
Unc
erta
inty
%
0
20
40 6% from luminosity not included)± Total uncertainty (
Systematic uncertainty
Data Run II
1≤|η|
[GeV] T
sum E1 10 210
6% from luminosity not included)± Total uncertainty (
Systematic uncertainty
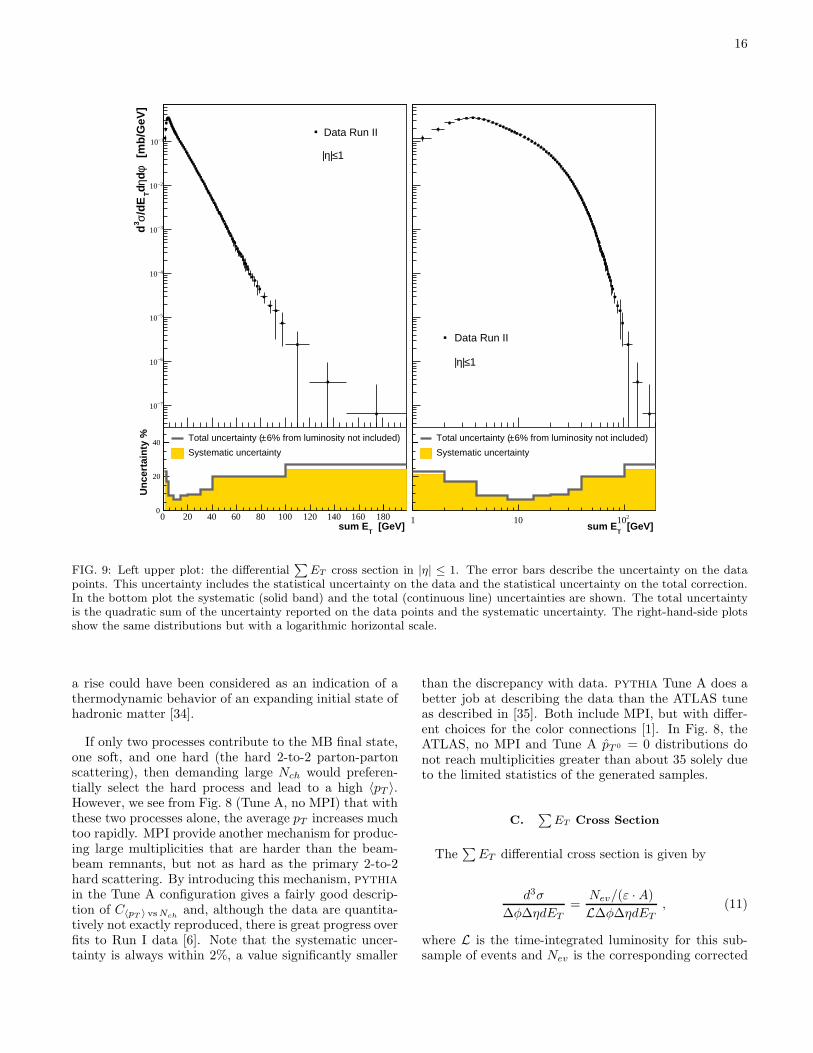
FIG. 9: Left upper plot: the differential∑
ET cross section in |η| ≤ 1. The error bars describe the uncertainty on the datapoints. This uncertainty includes the statistical uncertainty on the data and the statistical uncertainty on the total correction.In the bottom plot the systematic (solid band) and the total (continuous line) uncertainties are shown. The total uncertaintyis the quadratic sum of the uncertainty reported on the data points and the systematic uncertainty. The right-hand-side plotsshow the same distributions but with a logarithmic horizontal scale.
a rise could have been considered as an indication of athermodynamic behavior of an expanding initial state ofhadronic matter [34].
If only two processes contribute to the MB final state,one soft, and one hard (the hard 2-to-2 parton-partonscattering), then demanding large Nch would preferen-tially select the hard process and lead to a high 〈pT 〉.However, we see from Fig. 8 (Tune A, no MPI) that withthese two processes alone, the average pT increases muchtoo rapidly. MPI provide another mechanism for produc-ing large multiplicities that are harder than the beam-beam remnants, but not as hard as the primary 2-to-2hard scattering. By introducing this mechanism, pythia
in the Tune A configuration gives a fairly good descrip-tion of C〈pT 〉 vs Nch
and, although the data are quantita-tively not exactly reproduced, there is great progress overfits to Run I data [6]. Note that the systematic uncer-tainty is always within 2%, a value significantly smaller
than the discrepancy with data. pythia Tune A does abetter job at describing the data than the ATLAS tuneas described in [35]. Both include MPI, but with differ-ent choices for the color connections [1]. In Fig. 8, theATLAS, no MPI and Tune A pT 0 = 0 distributions donot reach multiplicities greater than about 35 solely dueto the limited statistics of the generated samples.
C.∑
ET Cross Section
The∑
ET differential cross section is given by
d3σ
∆φ∆ηdET
=Nev/(ε · A)
L∆φ∆ηdET
, (11)
where L is the time-integrated luminosity for this sub-sample of events and Nev is the corresponding corrected
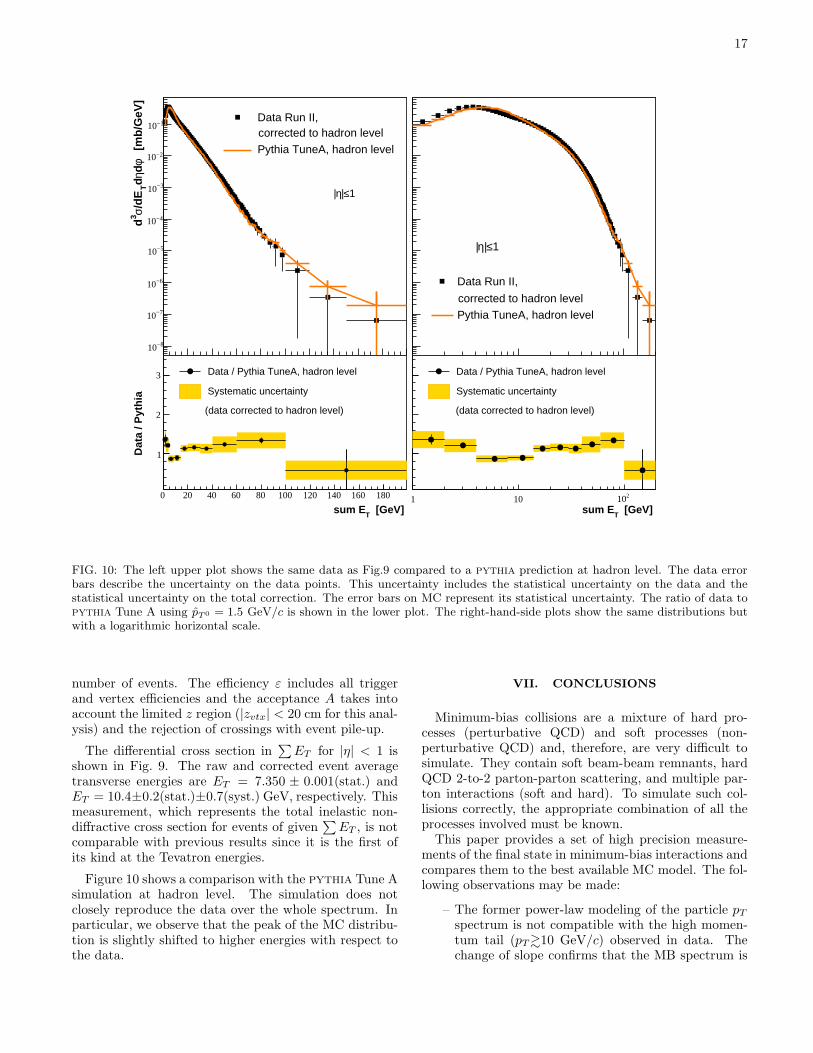
17
0 20 40 60 80 100 120 140 160 180 200
[m
b/G
eV]
φdηdT
/dE
σ3d
−810
−710
−610
−510
−410
−310
−210
−110Data Run II,
Pythia TuneA, hadron level
corrected to hadron level
1≤|η|
[GeV] Tsum E0 20 40 60 80 100 120 140 160 180
Dat
a / P
ythi
a
1
2
3 Data / Pythia TuneA, hadron level
Systematic uncertainty
(data corrected to hadron level)
Data Run II,
Pythia TuneA, hadron level
corrected to hadron level
1≤|η|
[GeV] Tsum E1 10 210
Data / Pythia TuneA, hadron level
Systematic uncertainty
(data corrected to hadron level)
FIG. 10: The left upper plot shows the same data as Fig.9 compared to a pythia prediction at hadron level. The data errorbars describe the uncertainty on the data points. This uncertainty includes the statistical uncertainty on the data and thestatistical uncertainty on the total correction. The error bars on MC represent its statistical uncertainty. The ratio of data topythia Tune A using pT0 = 1.5 GeV/c is shown in the lower plot. The right-hand-side plots show the same distributions butwith a logarithmic horizontal scale.
number of events. The efficiency ε includes all triggerand vertex efficiencies and the acceptance A takes intoaccount the limited z region (|zvtx| < 20 cm for this anal-ysis) and the rejection of crossings with event pile-up.
The differential cross section in∑
ET for |η| < 1 isshown in Fig. 9. The raw and corrected event averagetransverse energies are ET = 7.350 ± 0.001(stat.) andET = 10.4±0.2(stat.)±0.7(syst.) GeV, respectively. Thismeasurement, which represents the total inelastic non-diffractive cross section for events of given
∑
ET , is notcomparable with previous results since it is the first ofits kind at the Tevatron energies.
Figure 10 shows a comparison with the pythia Tune Asimulation at hadron level. The simulation does notclosely reproduce the data over the whole spectrum. Inparticular, we observe that the peak of the MC distribu-tion is slightly shifted to higher energies with respect tothe data.
VII. CONCLUSIONS
Minimum-bias collisions are a mixture of hard pro-cesses (perturbative QCD) and soft processes (non-perturbative QCD) and, therefore, are very difficult tosimulate. They contain soft beam-beam remnants, hardQCD 2-to-2 parton-parton scattering, and multiple par-ton interactions (soft and hard). To simulate such col-lisions correctly, the appropriate combination of all theprocesses involved must be known.
This paper provides a set of high precision measure-ments of the final state in minimum-bias interactions andcompares them to the best available MC model. The fol-lowing observations may be made:
– The former power-law modeling of the particle pT
spectrum is not compatible with the high momen-tum tail (pT >∼10 GeV/c) observed in data. Thechange of slope confirms that the MB spectrum is
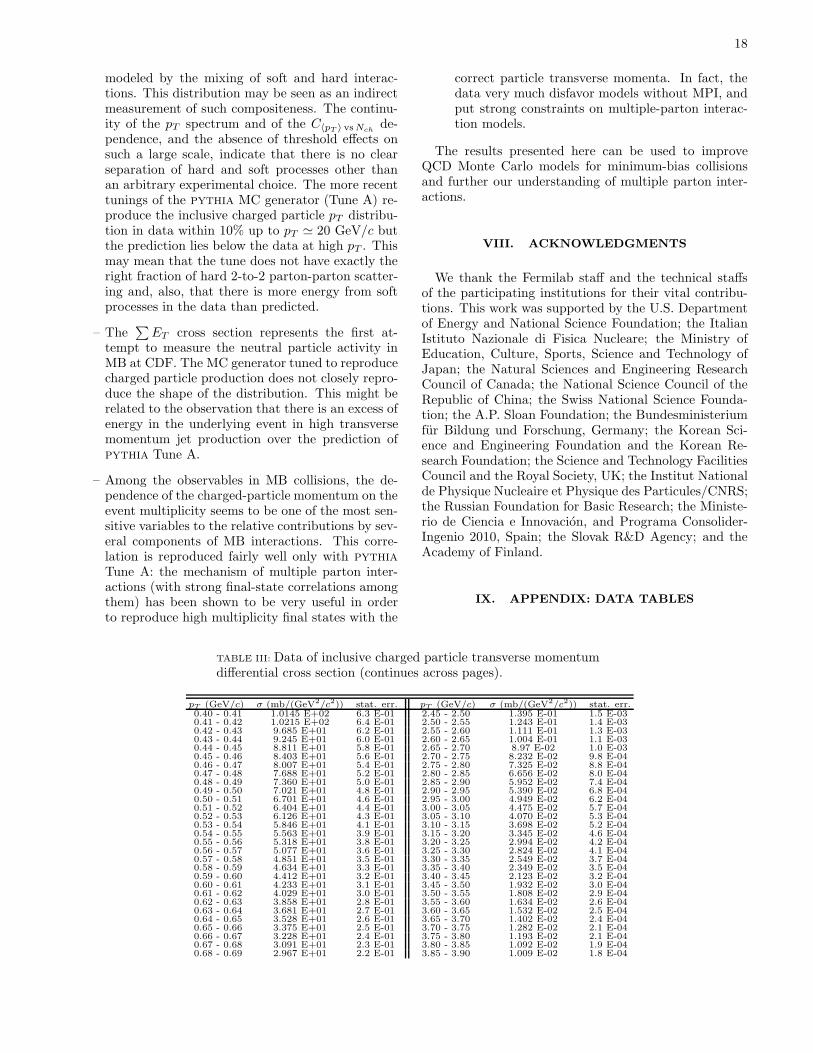
18
modeled by the mixing of soft and hard interac-tions. This distribution may be seen as an indirectmeasurement of such compositeness. The continu-ity of the pT spectrum and of the C〈pT 〉 vs Nch
de-pendence, and the absence of threshold effects onsuch a large scale, indicate that there is no clearseparation of hard and soft processes other thanan arbitrary experimental choice. The more recenttunings of the pythia MC generator (Tune A) re-produce the inclusive charged particle pT distribu-tion in data within 10% up to pT ≃ 20 GeV/c butthe prediction lies below the data at high pT . Thismay mean that the tune does not have exactly theright fraction of hard 2-to-2 parton-parton scatter-ing and, also, that there is more energy from softprocesses in the data than predicted.
– The∑
ET cross section represents the first at-tempt to measure the neutral particle activity inMB at CDF. The MC generator tuned to reproducecharged particle production does not closely repro-duce the shape of the distribution. This might berelated to the observation that there is an excess ofenergy in the underlying event in high transversemomentum jet production over the prediction ofpythia Tune A.
– Among the observables in MB collisions, the de-pendence of the charged-particle momentum on theevent multiplicity seems to be one of the most sen-sitive variables to the relative contributions by sev-eral components of MB interactions. This corre-lation is reproduced fairly well only with pythia
Tune A: the mechanism of multiple parton inter-actions (with strong final-state correlations amongthem) has been shown to be very useful in orderto reproduce high multiplicity final states with the
correct particle transverse momenta. In fact, thedata very much disfavor models without MPI, andput strong constraints on multiple-parton interac-tion models.
The results presented here can be used to improveQCD Monte Carlo models for minimum-bias collisionsand further our understanding of multiple parton inter-actions.
VIII. ACKNOWLEDGMENTS
We thank the Fermilab staff and the technical staffsof the participating institutions for their vital contribu-tions. This work was supported by the U.S. Departmentof Energy and National Science Foundation; the ItalianIstituto Nazionale di Fisica Nucleare; the Ministry ofEducation, Culture, Sports, Science and Technology ofJapan; the Natural Sciences and Engineering ResearchCouncil of Canada; the National Science Council of theRepublic of China; the Swiss National Science Founda-tion; the A.P. Sloan Foundation; the Bundesministeriumfur Bildung und Forschung, Germany; the Korean Sci-ence and Engineering Foundation and the Korean Re-search Foundation; the Science and Technology FacilitiesCouncil and the Royal Society, UK; the Institut Nationalde Physique Nucleaire et Physique des Particules/CNRS;the Russian Foundation for Basic Research; the Ministe-rio de Ciencia e Innovacion, and Programa Consolider-Ingenio 2010, Spain; the Slovak R&D Agency; and theAcademy of Finland.
IX. APPENDIX: DATA TABLES
TABLE III: Data of inclusive charged particle transverse momentumdifferential cross section (continues across pages).
pT (GeV/c) σ (mb/(GeV2/c2)) stat. err. pT (GeV/c) σ (mb/(GeV2/c2)) stat. err.0.40 - 0.41 1.0145 E+02 6.3 E-01 2.45 - 2.50 1.395 E-01 1.5 E-030.41 - 0.42 1.0215 E+02 6.4 E-01 2.50 - 2.55 1.243 E-01 1.4 E-030.42 - 0.43 9.685 E+01 6.2 E-01 2.55 - 2.60 1.111 E-01 1.3 E-030.43 - 0.44 9.245 E+01 6.0 E-01 2.60 - 2.65 1.004 E-01 1.1 E-030.44 - 0.45 8.811 E+01 5.8 E-01 2.65 - 2.70 8.97 E-02 1.0 E-030.45 - 0.46 8.403 E+01 5.6 E-01 2.70 - 2.75 8.232 E-02 9.8 E-040.46 - 0.47 8.007 E+01 5.4 E-01 2.75 - 2.80 7.325 E-02 8.8 E-040.47 - 0.48 7.688 E+01 5.2 E-01 2.80 - 2.85 6.656 E-02 8.0 E-040.48 - 0.49 7.360 E+01 5.0 E-01 2.85 - 2.90 5.952 E-02 7.4 E-040.49 - 0.50 7.021 E+01 4.8 E-01 2.90 - 2.95 5.390 E-02 6.8 E-040.50 - 0.51 6.701 E+01 4.6 E-01 2.95 - 3.00 4.949 E-02 6.2 E-040.51 - 0.52 6.404 E+01 4.4 E-01 3.00 - 3.05 4.475 E-02 5.7 E-040.52 - 0.53 6.126 E+01 4.3 E-01 3.05 - 3.10 4.070 E-02 5.3 E-040.53 - 0.54 5.846 E+01 4.1 E-01 3.10 - 3.15 3.698 E-02 5.2 E-040.54 - 0.55 5.563 E+01 3.9 E-01 3.15 - 3.20 3.345 E-02 4.6 E-040.55 - 0.56 5.318 E+01 3.8 E-01 3.20 - 3.25 2.994 E-02 4.2 E-040.56 - 0.57 5.077 E+01 3.6 E-01 3.25 - 3.30 2.824 E-02 4.1 E-040.57 - 0.58 4.851 E+01 3.5 E-01 3.30 - 3.35 2.549 E-02 3.7 E-040.58 - 0.59 4.634 E+01 3.3 E-01 3.35 - 3.40 2.349 E-02 3.5 E-040.59 - 0.60 4.412 E+01 3.2 E-01 3.40 - 3.45 2.123 E-02 3.2 E-040.60 - 0.61 4.233 E+01 3.1 E-01 3.45 - 3.50 1.932 E-02 3.0 E-040.61 - 0.62 4.029 E+01 3.0 E-01 3.50 - 3.55 1.808 E-02 2.9 E-040.62 - 0.63 3.858 E+01 2.8 E-01 3.55 - 3.60 1.634 E-02 2.6 E-040.63 - 0.64 3.681 E+01 2.7 E-01 3.60 - 3.65 1.532 E-02 2.5 E-040.64 - 0.65 3.528 E+01 2.6 E-01 3.65 - 3.70 1.402 E-02 2.4 E-040.65 - 0.66 3.375 E+01 2.5 E-01 3.70 - 3.75 1.282 E-02 2.1 E-040.66 - 0.67 3.228 E+01 2.4 E-01 3.75 - 3.80 1.193 E-02 2.1 E-040.67 - 0.68 3.091 E+01 2.3 E-01 3.80 - 3.85 1.092 E-02 1.9 E-040.68 - 0.69 2.967 E+01 2.2 E-01 3.85 - 3.90 1.009 E-02 1.8 E-04
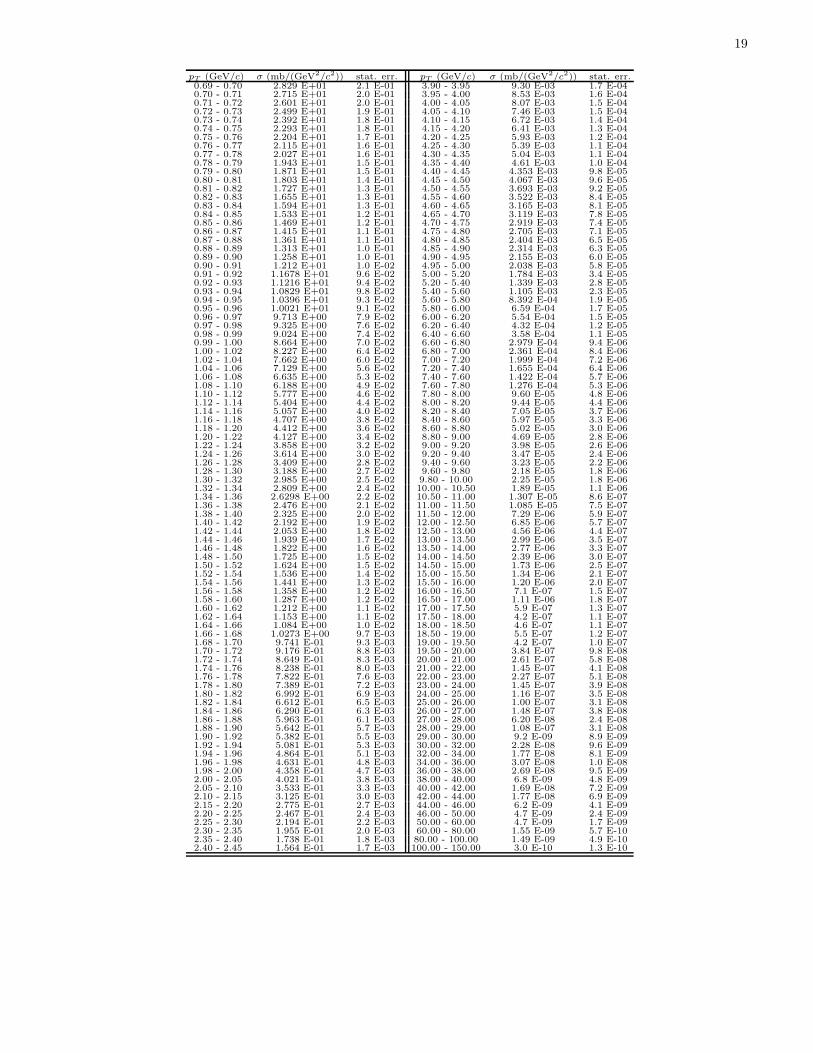
19
pT (GeV/c) σ (mb/(GeV2/c2)) stat. err. pT (GeV/c) σ (mb/(GeV2/c2)) stat. err.0.69 - 0.70 2.829 E+01 2.1 E-01 3.90 - 3.95 9.30 E-03 1.7 E-040.70 - 0.71 2.715 E+01 2.0 E-01 3.95 - 4.00 8.53 E-03 1.6 E-040.71 - 0.72 2.601 E+01 2.0 E-01 4.00 - 4.05 8.07 E-03 1.5 E-040.72 - 0.73 2.499 E+01 1.9 E-01 4.05 - 4.10 7.46 E-03 1.5 E-040.73 - 0.74 2.392 E+01 1.8 E-01 4.10 - 4.15 6.72 E-03 1.4 E-040.74 - 0.75 2.293 E+01 1.8 E-01 4.15 - 4.20 6.41 E-03 1.3 E-040.75 - 0.76 2.204 E+01 1.7 E-01 4.20 - 4.25 5.93 E-03 1.2 E-040.76 - 0.77 2.115 E+01 1.6 E-01 4.25 - 4.30 5.39 E-03 1.1 E-040.77 - 0.78 2.027 E+01 1.6 E-01 4.30 - 4.35 5.04 E-03 1.1 E-040.78 - 0.79 1.943 E+01 1.5 E-01 4.35 - 4.40 4.61 E-03 1.0 E-040.79 - 0.80 1.871 E+01 1.5 E-01 4.40 - 4.45 4.353 E-03 9.8 E-050.80 - 0.81 1.803 E+01 1.4 E-01 4.45 - 4.50 4.067 E-03 9.6 E-050.81 - 0.82 1.727 E+01 1.3 E-01 4.50 - 4.55 3.693 E-03 9.2 E-050.82 - 0.83 1.655 E+01 1.3 E-01 4.55 - 4.60 3.522 E-03 8.4 E-050.83 - 0.84 1.594 E+01 1.3 E-01 4.60 - 4.65 3.165 E-03 8.1 E-050.84 - 0.85 1.533 E+01 1.2 E-01 4.65 - 4.70 3.119 E-03 7.8 E-050.85 - 0.86 1.469 E+01 1.2 E-01 4.70 - 4.75 2.919 E-03 7.4 E-050.86 - 0.87 1.415 E+01 1.1 E-01 4.75 - 4.80 2.705 E-03 7.1 E-050.87 - 0.88 1.361 E+01 1.1 E-01 4.80 - 4.85 2.404 E-03 6.5 E-050.88 - 0.89 1.313 E+01 1.0 E-01 4.85 - 4.90 2.314 E-03 6.3 E-050.89 - 0.90 1.258 E+01 1.0 E-01 4.90 - 4.95 2.155 E-03 6.0 E-050.90 - 0.91 1.212 E+01 1.0 E-02 4.95 - 5.00 2.038 E-03 5.8 E-050.91 - 0.92 1.1678 E+01 9.6 E-02 5.00 - 5.20 1.784 E-03 3.4 E-050.92 - 0.93 1.1216 E+01 9.4 E-02 5.20 - 5.40 1.339 E-03 2.8 E-050.93 - 0.94 1.0829 E+01 9.8 E-02 5.40 - 5.60 1.105 E-03 2.3 E-050.94 - 0.95 1.0396 E+01 9.3 E-02 5.60 - 5.80 8.392 E-04 1.9 E-050.95 - 0.96 1.0021 E+01 9.1 E-02 5.80 - 6.00 6.59 E-04 1.7 E-050.96 - 0.97 9.713 E+00 7.9 E-02 6.00 - 6.20 5.54 E-04 1.5 E-050.97 - 0.98 9.325 E+00 7.6 E-02 6.20 - 6.40 4.32 E-04 1.2 E-050.98 - 0.99 9.024 E+00 7.4 E-02 6.40 - 6.60 3.58 E-04 1.1 E-050.99 - 1.00 8.664 E+00 7.0 E-02 6.60 - 6.80 2.979 E-04 9.4 E-061.00 - 1.02 8.227 E+00 6.4 E-02 6.80 - 7.00 2.361 E-04 8.4 E-061.02 - 1.04 7.662 E+00 6.0 E-02 7.00 - 7.20 1.999 E-04 7.2 E-061.04 - 1.06 7.129 E+00 5.6 E-02 7.20 - 7.40 1.655 E-04 6.4 E-061.06 - 1.08 6.635 E+00 5.3 E-02 7.40 - 7.60 1.422 E-04 5.7 E-061.08 - 1.10 6.188 E+00 4.9 E-02 7.60 - 7.80 1.276 E-04 5.3 E-061.10 - 1.12 5.777 E+00 4.6 E-02 7.80 - 8.00 9.60 E-05 4.8 E-061.12 - 1.14 5.404 E+00 4.4 E-02 8.00 - 8.20 9.44 E-05 4.4 E-061.14 - 1.16 5.057 E+00 4.0 E-02 8.20 - 8.40 7.05 E-05 3.7 E-061.16 - 1.18 4.707 E+00 3.8 E-02 8.40 - 8.60 5.97 E-05 3.3 E-061.18 - 1.20 4.412 E+00 3.6 E-02 8.60 - 8.80 5.02 E-05 3.0 E-061.20 - 1.22 4.127 E+00 3.4 E-02 8.80 - 9.00 4.69 E-05 2.8 E-061.22 - 1.24 3.858 E+00 3.2 E-02 9.00 - 9.20 3.98 E-05 2.6 E-061.24 - 1.26 3.614 E+00 3.0 E-02 9.20 - 9.40 3.47 E-05 2.4 E-061.26 - 1.28 3.409 E+00 2.8 E-02 9.40 - 9.60 3.23 E-05 2.2 E-061.28 - 1.30 3.188 E+00 2.7 E-02 9.60 - 9.80 2.18 E-05 1.8 E-061.30 - 1.32 2.985 E+00 2.5 E-02 9.80 - 10.00 2.25 E-05 1.8 E-061.32 - 1.34 2.809 E+00 2.4 E-02 10.00 - 10.50 1.89 E-05 1.1 E-061.34 - 1.36 2.6298 E+00 2.2 E-02 10.50 - 11.00 1.307 E-05 8.6 E-071.36 - 1.38 2.476 E+00 2.1 E-02 11.00 - 11.50 1.085 E-05 7.5 E-071.38 - 1.40 2.325 E+00 2.0 E-02 11.50 - 12.00 7.29 E-06 5.9 E-071.40 - 1.42 2.192 E+00 1.9 E-02 12.00 - 12.50 6.85 E-06 5.7 E-071.42 - 1.44 2.053 E+00 1.8 E-02 12.50 - 13.00 4.56 E-06 4.4 E-071.44 - 1.46 1.939 E+00 1.7 E-02 13.00 - 13.50 2.99 E-06 3.5 E-071.46 - 1.48 1.822 E+00 1.6 E-02 13.50 - 14.00 2.77 E-06 3.3 E-071.48 - 1.50 1.725 E+00 1.5 E-02 14.00 - 14.50 2.39 E-06 3.0 E-071.50 - 1.52 1.624 E+00 1.5 E-02 14.50 - 15.00 1.73 E-06 2.5 E-071.52 - 1.54 1.536 E+00 1.4 E-02 15.00 - 15.50 1.34 E-06 2.1 E-071.54 - 1.56 1.441 E+00 1.3 E-02 15.50 - 16.00 1.20 E-06 2.0 E-071.56 - 1.58 1.358 E+00 1.2 E-02 16.00 - 16.50 7.1 E-07 1.5 E-071.58 - 1.60 1.287 E+00 1.2 E-02 16.50 - 17.00 1.11 E-06 1.8 E-071.60 - 1.62 1.212 E+00 1.1 E-02 17.00 - 17.50 5.9 E-07 1.3 E-071.62 - 1.64 1.153 E+00 1.1 E-02 17.50 - 18.00 4.2 E-07 1.1 E-071.64 - 1.66 1.084 E+00 1.0 E-02 18.00 - 18.50 4.6 E-07 1.1 E-071.66 - 1.68 1.0273 E+00 9.7 E-03 18.50 - 19.00 5.5 E-07 1.2 E-071.68 - 1.70 9.741 E-01 9.3 E-03 19.00 - 19.50 4.2 E-07 1.0 E-071.70 - 1.72 9.176 E-01 8.8 E-03 19.50 - 20.00 3.84 E-07 9.8 E-081.72 - 1.74 8.649 E-01 8.3 E-03 20.00 - 21.00 2.61 E-07 5.8 E-081.74 - 1.76 8.238 E-01 8.0 E-03 21.00 - 22.00 1.45 E-07 4.1 E-081.76 - 1.78 7.822 E-01 7.6 E-03 22.00 - 23.00 2.27 E-07 5.1 E-081.78 - 1.80 7.389 E-01 7.2 E-03 23.00 - 24.00 1.45 E-07 3.9 E-081.80 - 1.82 6.992 E-01 6.9 E-03 24.00 - 25.00 1.16 E-07 3.5 E-081.82 - 1.84 6.612 E-01 6.5 E-03 25.00 - 26.00 1.00 E-07 3.1 E-081.84 - 1.86 6.290 E-01 6.3 E-03 26.00 - 27.00 1.48 E-07 3.8 E-081.86 - 1.88 5.963 E-01 6.1 E-03 27.00 - 28.00 6.20 E-08 2.4 E-081.88 - 1.90 5.642 E-01 5.7 E-03 28.00 - 29.00 1.08 E-07 3.1 E-081.90 - 1.92 5.382 E-01 5.5 E-03 29.00 - 30.00 9.2 E-09 8.9 E-091.92 - 1.94 5.081 E-01 5.3 E-03 30.00 - 32.00 2.28 E-08 9.6 E-091.94 - 1.96 4.864 E-01 5.1 E-03 32.00 - 34.00 1.77 E-08 8.1 E-091.96 - 1.98 4.631 E-01 4.8 E-03 34.00 - 36.00 3.07 E-08 1.0 E-081.98 - 2.00 4.358 E-01 4.7 E-03 36.00 - 38.00 2.69 E-08 9.5 E-092.00 - 2.05 4.021 E-01 3.8 E-03 38.00 - 40.00 6.8 E-09 4.8 E-092.05 - 2.10 3.533 E-01 3.3 E-03 40.00 - 42.00 1.69 E-08 7.2 E-092.10 - 2.15 3.125 E-01 3.0 E-03 42.00 - 44.00 1.77 E-08 6.9 E-092.15 - 2.20 2.775 E-01 2.7 E-03 44.00 - 46.00 6.2 E-09 4.1 E-092.20 - 2.25 2.467 E-01 2.4 E-03 46.00 - 50.00 4.7 E-09 2.4 E-092.25 - 2.30 2.194 E-01 2.2 E-03 50.00 - 60.00 4.7 E-09 1.7 E-092.30 - 2.35 1.955 E-01 2.0 E-03 60.00 - 80.00 1.55 E-09 5.7 E-102.35 - 2.40 1.738 E-01 1.8 E-03 80.00 - 100.00 1.49 E-09 4.9 E-102.40 - 2.45 1.564 E-01 1.7 E-03 100.00 - 150.00 3.0 E-10 1.3 E-10
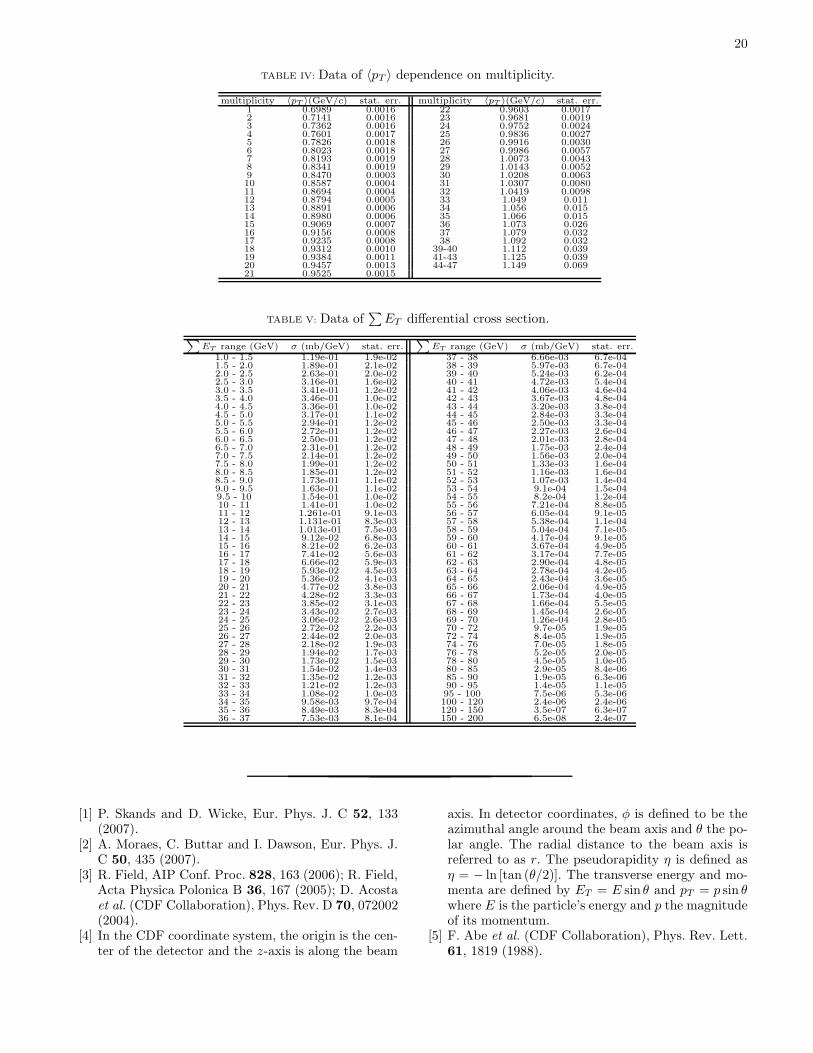
20
TABLE IV: Data of 〈pT 〉 dependence on multiplicity.
multiplicity 〈pT 〉(GeV/c) stat. err. multiplicity 〈pT 〉(GeV/c) stat. err.1 0.6989 0.0016 22 0.9603 0.00172 0.7141 0.0016 23 0.9681 0.00193 0.7362 0.0016 24 0.9752 0.00244 0.7601 0.0017 25 0.9836 0.00275 0.7826 0.0018 26 0.9916 0.00306 0.8023 0.0018 27 0.9986 0.00577 0.8193 0.0019 28 1.0073 0.00438 0.8341 0.0019 29 1.0143 0.00529 0.8470 0.0003 30 1.0208 0.006310 0.8587 0.0004 31 1.0307 0.008011 0.8694 0.0004 32 1.0419 0.009812 0.8794 0.0005 33 1.049 0.01113 0.8891 0.0006 34 1.056 0.01514 0.8980 0.0006 35 1.066 0.01515 0.9069 0.0007 36 1.073 0.02616 0.9156 0.0008 37 1.079 0.03217 0.9235 0.0008 38 1.092 0.03218 0.9312 0.0010 39-40 1.112 0.03919 0.9384 0.0011 41-43 1.125 0.03920 0.9457 0.0013 44-47 1.149 0.06921 0.9525 0.0015
TABLE V: Data of∑
ET differential cross section.
∑
ET range (GeV) σ (mb/GeV) stat. err.∑
ET range (GeV) σ (mb/GeV) stat. err.1.0 - 1.5 1.19e-01 1.9e-02 37 - 38 6.66e-03 6.7e-041.5 - 2.0 1.89e-01 2.1e-02 38 - 39 5.97e-03 6.7e-042.0 - 2.5 2.63e-01 2.0e-02 39 - 40 5.24e-03 6.2e-042.5 - 3.0 3.16e-01 1.6e-02 40 - 41 4.72e-03 5.4e-043.0 - 3.5 3.41e-01 1.2e-02 41 - 42 4.06e-03 4.6e-043.5 - 4.0 3.46e-01 1.0e-02 42 - 43 3.67e-03 4.8e-044.0 - 4.5 3.36e-01 1.0e-02 43 - 44 3.20e-03 3.8e-044.5 - 5.0 3.17e-01 1.1e-02 44 - 45 2.84e-03 3.3e-045.0 - 5.5 2.94e-01 1.2e-02 45 - 46 2.50e-03 3.3e-045.5 - 6.0 2.72e-01 1.2e-02 46 - 47 2.27e-03 2.6e-046.0 - 6.5 2.50e-01 1.2e-02 47 - 48 2.01e-03 2.8e-046.5 - 7.0 2.31e-01 1.2e-02 48 - 49 1.75e-03 2.4e-047.0 - 7.5 2.14e-01 1.2e-02 49 - 50 1.56e-03 2.0e-047.5 - 8.0 1.99e-01 1.2e-02 50 - 51 1.33e-03 1.6e-048.0 - 8.5 1.85e-01 1.2e-02 51 - 52 1.16e-03 1.6e-048.5 - 9.0 1.73e-01 1.1e-02 52 - 53 1.07e-03 1.4e-049.0 - 9.5 1.63e-01 1.1e-02 53 - 54 9.1e-04 1.5e-049.5 - 10 1.54e-01 1.0e-02 54 - 55 8.2e-04 1.2e-0410 - 11 1.41e-01 1.0e-02 55 - 56 7.21e-04 8.8e-0511 - 12 1.261e-01 9.1e-03 56 - 57 6.05e-04 9.1e-0512 - 13 1.131e-01 8.3e-03 57 - 58 5.38e-04 1.1e-0413 - 14 1.013e-01 7.5e-03 58 - 59 5.04e-04 7.1e-0514 - 15 9.12e-02 6.8e-03 59 - 60 4.17e-04 9.1e-0515 - 16 8.21e-02 6.2e-03 60 - 61 3.67e-04 4.9e-0516 - 17 7.41e-02 5.6e-03 61 - 62 3.17e-04 7.7e-0517 - 18 6.66e-02 5.9e-03 62 - 63 2.90e-04 4.8e-0518 - 19 5.93e-02 4.5e-03 63 - 64 2.78e-04 4.2e-0519 - 20 5.36e-02 4.1e-03 64 - 65 2.43e-04 3.6e-0520 - 21 4.77e-02 3.8e-03 65 - 66 2.06e-04 4.9e-0521 - 22 4.28e-02 3.3e-03 66 - 67 1.73e-04 4.0e-0522 - 23 3.85e-02 3.1e-03 67 - 68 1.66e-04 5.5e-0523 - 24 3.43e-02 2.7e-03 68 - 69 1.45e-04 2.6e-0524 - 25 3.06e-02 2.6e-03 69 - 70 1.26e-04 2.8e-0525 - 26 2.72e-02 2.2e-03 70 - 72 9.7e-05 1.9e-0526 - 27 2.44e-02 2.0e-03 72 - 74 8.4e-05 1.9e-0527 - 28 2.18e-02 1.9e-03 74 - 76 7.0e-05 1.8e-0528 - 29 1.94e-02 1.7e-03 76 - 78 5.2e-05 2.0e-0529 - 30 1.73e-02 1.5e-03 78 - 80 4.5e-05 1.0e-0530 - 31 1.54e-02 1.4e-03 80 - 85 2.9e-05 8.4e-0631 - 32 1.35e-02 1.2e-03 85 - 90 1.9e-05 6.3e-0632 - 33 1.21e-02 1.2e-03 90 - 95 1.4e-05 1.1e-0533 - 34 1.08e-02 1.0e-03 95 - 100 7.5e-06 5.3e-0634 - 35 9.58e-03 9.7e-04 100 - 120 2.4e-06 2.4e-0635 - 36 8.49e-03 8.3e-04 120 - 150 3.5e-07 6.3e-0736 - 37 7.53e-03 8.1e-04 150 - 200 6.5e-08 2.4e-07
[1] P. Skands and D. Wicke, Eur. Phys. J. C 52, 133(2007).
[2] A. Moraes, C. Buttar and I. Dawson, Eur. Phys. J.C 50, 435 (2007).
[3] R. Field, AIP Conf. Proc. 828, 163 (2006); R. Field,Acta Physica Polonica B 36, 167 (2005); D. Acostaet al. (CDF Collaboration), Phys. Rev. D 70, 072002(2004).
[4] In the CDF coordinate system, the origin is the cen-ter of the detector and the z-axis is along the beam
axis. In detector coordinates, φ is defined to be theazimuthal angle around the beam axis and θ the po-lar angle. The radial distance to the beam axis isreferred to as r. The pseudorapidity η is defined asη = − ln [tan (θ/2)]. The transverse energy and mo-menta are defined by ET = E sin θ and pT = p sin θwhere E is the particle’s energy and p the magnitudeof its momentum.
[5] F. Abe et al. (CDF Collaboration), Phys. Rev. Lett.61, 1819 (1988).
21
[6] D. Acosta et al. (CDF Collaboration), Phys. Rev. D65, 072005 (2002).
[7] T. Sjostrand and M. van Zijl, Phys. Rev. D 36, 2019(1987) and references therein.
[8] S. Barshay, Phys. Lett. B 127, 129 (1983); L. VanHove, Phys. Lett. B 118, 138 (1982); R. Hagedorn,Rev. Nuovo Cimento 6, 10 (1983); J. D. Bjorken,Phys. Rev. D 27, 140 (1983); X. N. Wangand R. C. Hwa, Phys. Rev. D 39, 187 (1989);F. W. Bopp, P. Aurenche and J. Ranft, Phys. Rev.D 33, 1867 (1986).
[9] T. S. Ullrich et al. (STAR Collaboration), Heavy IonPhys 21, 143 (2004) and references therein.
[10] T. Sjostrand, S. Mrenna and P. Skands, J. High En-ergy Phys. 0605 (2006) 026.
[11] D. Acosta et al. (CDF Collaboration), Phys. Rev. D71, 032001 (2005); D. Acosta et al. (CDF Collabora-tion), Phys. Rev. D 71, 052003 (2005); A. Abulenciaet al. (CDF Collaboration), J. Phys. G Nucl. Part.Phys. 34, 2457 (2007).
[12] C. S. Hill et al., Nucl. Instrum. Methods A 530, 1(2004).
[13] A. Sill et al., Nucl. Instrum. Methods A 447, 1(2000).
[14] A. Affolder et al., Nucl. Instrum. Methods A 453,84 (2004).
[15] A. Affolder et al., Nucl. Instrum. Methods A 526,249 (2004).
[16] L. Balka et al., Nucl. Instrum. Methods A 267, 272(1988).
[17] S. Bertolucci et al., Nucl. Instrum. Methods A 267,301 (1988).
[18] D. Acosta et al., Nucl. Instrum. Methods A 494, 57(2002).
[19] D. Acosta et al., Nucl. Instrum. Methods A 518, 605(2004).
[20] D. Acosta et al., Nucl. Instrum. Methods A 461, 540(2001).
[21] F. Abe et al., (CDF Collaboration), Phys. Rev. D
50, 5550 (1994); F. Abe et al., (CDF Collaboration),Phys. Rev. D 50, 5535 (1994);
[22] T. Sjostrand et al., High-Energy-Physics Event Gen-eration with PYTHIA 6.1, Comput. Phys. Commun.135 238, (2001); T. Sjostrand, Phys. Lett. B 157,321 (1985); T. Sjostrand and M. van Zijl, Phys. Rev.D 36, 2019 (1987).
[23] T. Sjostrand and P. Skands, Eur. Phys. J., C 39, 129(2005).
[24] H. L. Lai et al. (CTEQ Collaboration), Eur. Phys.J. C 12, 375 (2000).
[25] B. Andersson, Camb. Monogr. Part. Phys. Nucl.Phys. Cosmol. 7, 1 (1997).
[26] pT 0 is defined as the transverse momentum of the2-to-2 scattering in the rest frame of the hard inter-action.
[27] S. Klimenko, J. Konigsberg and T. M. Liss,FERMILAB-FN-0741 (2003).
[28] R. Field, Pub. Proc. 33rd Int. Conf. on High En-ergy Physics, Moscow, Russia (2006); R. Field, Pub.Proc. TeV4LHC Workshop, Fermilab, Batavia IL,USA (2005).
[29] T. Alexopoulos et al. (E735 Collaboration), Phys.Lett. B 336, 599 (1994); T. Alexopoulos et al. (E735Collaboration), Phys. Rev. Lett. 60, 1622 (1988).
[30] D. Bernard et al. (UA4 Collaboration), Phys. Lett.B 186, 227 (1987).
[31] A. Affolder et al. (CDF Collaboration), Phys.Rev. D65, 092002 (2002).
[32] G. Arnison et al. (UA1 Collaboration), Phys. Lett.B 118, 167 (1982); A. Breakstone et al., Phys. Lett.B 132, 463 (1983).
[33] N. Moggi, Nucl. Phys. Proc. Suppl. B 71, 221 (1999);T. Alexopoulos et al., Phys. Rev. D 48, 984 (1993);S. H. Oh, Nucl. Phys. Proc. Suppl. B 25, 40 (1992).
[34] J. D. Bjorken, Phys. Rev. D 27, 140 (1983).[35] C. M. Buttar et al. Acta Phys. Polon. B 35, 433
(2004).