Measurement and Simulation of the Neutron Response and Detection Efficiency of a Pb-Scintillating...
20
arXiv:physics/0606077v1 [physics.ins-det] 8 Jun 2006 a,1 b d a,2 c b b b b b a b a b c a b c d 1.5 <T n < 10 252 E γ = 14 - 18 2 H(γ, n) p 2 H(γ, p) n 1 2
-
Upload
independent -
Category
Documents
-
view
3 -
download
0
Transcript of Measurement and Simulation of the Neutron Response and Detection Efficiency of a Pb-Scintillating...
arX
iv:p
hysi
cs/0
6060
77v1
[ph
ysic
s.in
s-de
t] 8
Jun
200
6
Measurement and Simulation of the NeutronResponse of the Nordball Liquid S intillatorArrayA. Reiter a,1, J.-O. Adler b, I. Akkurt d, J.R.M. Annand a,2,F. Fasolo c, K. Fissum b, K. Hansen b, L. Isaksson b, M. Karlsson b,M. Lundin b, J.C. M George a, B. Nilsson b, G. Rosner a,B. S hrøder b and A. Zanini c
aDepartment of Physi s & Astronomy, University of Glasgow, Glasgow G12 8QQ,S otland, UK.bDepartment of Physi s, University of Lund, Sölvegatan 14, S-223 62, Lund,Sweden.cIstituto Nazionale di Fisi a Nu leare (INFN), Sez. Torino, Via P. Giuria 1,10128 Torino, Italy.
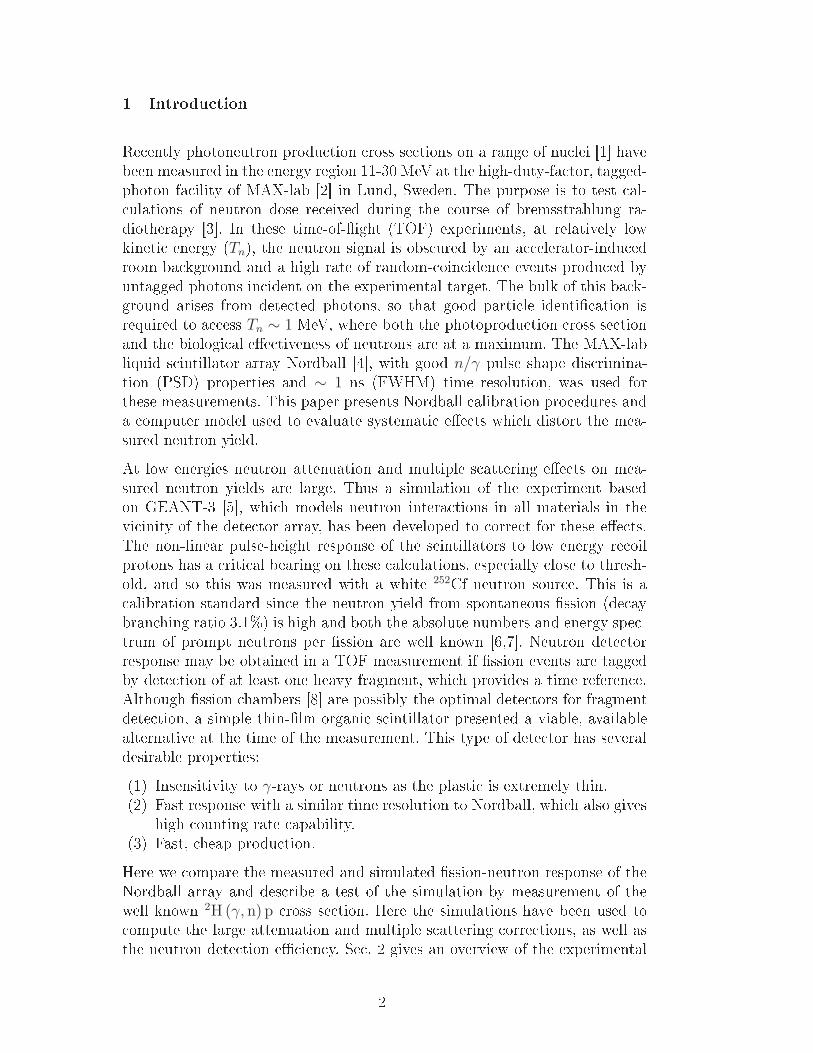
dSüleyman Demirel University, Fen-Edebiyat Fa ulty, 32 260 Isparta, Turkey.Abstra tThe response of the liquid s intillator array Nordball to neutrons in the energyrange 1.5 < Tn < 10 MeV has been measured by time of ight using a 252Cf ssionsour e. Fission fragments were dete ted by means of a thin-lm plasti s intillator.The measured dierential and integral neutron dete tion e ien ies agree well withpredi tions of a Monte Carlo simulation of the dete tor whi h models geometry a - urately and in orporates the measured, non-linear proton light output as a fun tionof energy. The ability of the model to provide systemati orre tions to photoneutron ross se tions, measured by Nordball at low energy, is tested in a measurement of thetwo-body deuteron photodisintegration ross se tion in the range Eγ = 14−18 MeV.After orre tion the present 2H(γ,n) p measurements agree well with a publishedevaluation of the large body of 2H(γ,p) n data.Key words: PACS: 29.40.M s intillation dete tors, 29.30.Hs neutron spe tros opy,25.20.Lj photoprodu tion rea tions, 87.53.Wz Monte Carlo appli ations.1 Present Address: Gesells haft für S hwerionenfors hung mbH, Plan kstrasse 1,64291 Darmstadt, Germany.2 Corresponding author: j.annandphysi s.gla.a .uk, +44 141 330 6428.Preprint submitted to Elsevier S ien e 2nd February 2008
1 Introdu tionRe ently photoneutron produ tion ross se tions on a range of nu lei [1 havebeen measured in the energy region 11-30 MeV at the high-duty-fa tor, tagged-photon fa ility of MAX-lab [2 in Lund, Sweden. The purpose is to test al- ulations of neutron dose re eived during the ourse of bremsstrahlung ra-diotherapy [3. In these time-of-ight (TOF) experiments, at relatively lowkineti energy (Tn), the neutron signal is obs ured by an a elerator-indu edroom ba kground and a high rate of random- oin iden e events produ ed byuntagged photons in ident on the experimental target. The bulk of this ba k-ground arises from dete ted photons, so that good parti le identi ation isrequired to a ess Tn ∼ 1 MeV, where both the photoprodu tion ross se tionand the biologi al ee tiveness of neutrons are at a maximum. The MAX-labliquid s intillator array Nordball [4, with good n/γ pulse shape dis rimina-tion (PSD) properties and ∼ 1 ns (FWHM) time resolution, was used forthese measurements. This paper presents Nordball alibration pro edures anda omputer model used to evaluate systemati ee ts whi h distort the mea-sured neutron yield.At low energies neutron attenuation and multiple s attering ee ts on mea-sured neutron yields are large. Thus a simulation of the experiment basedon GEANT-3 [5, whi h models neutron intera tions in all materials in thevi inity of the dete tor array, has been developed to orre t for these ee ts.The non-linear pulse-height response of the s intillators to low energy re oilprotons has a riti al bearing on these al ulations, espe ially lose to thresh-old, and so this was measured with a white 252Cf neutron sour e. This is a alibration standard sin e the neutron yield from spontaneous ssion (de aybran hing ratio 3.1%) is high and both the absolute numbers and energy spe -trum of prompt neutrons per ssion are well known [6,7. Neutron dete torresponse may be obtained in a TOF measurement if ssion events are taggedby dete tion of at least one heavy fragment, whi h provides a time referen e.Although ssion hambers [8 are possibly the optimal dete tors for fragmentdete tion, a simple thin-lm organi s intillator presented a viable, availablealternative at the time of the measurement. This type of dete tor has severaldesirable properties:(1) Insensitivity to γ-rays or neutrons as the plasti is extremely thin.(2) Fast response with a similar time resolution to Nordball, whi h also giveshigh ounting rate apability.(3) Fast, heap produ tion.Here we ompare the measured and simulated ssion-neutron response of theNordball array and des ribe a test of the simulation by measurement of thewell known 2H (γ, n) p ross se tion. Here the simulations have been used to ompute the large attenuation and multiple s attering orre tions, as well asthe neutron dete tion e ien y. Se . 2 gives an overview of the experimental2
setup, the measured Nordball response is presented in Se . 3, the Monte Carlo(MC) simulation is des ribed in Se . 4, measurements and simulations are ompared in Se . 5, and a short summary is given in Se . 6.2 The time-of-ight experiment2.1 The Nordball arrayThe Nordball dete tor (Fig. 1) onsists of 16 liquid s intillators, type Bi ronBC-501, with PSD apability. Ten dete tors are of hexagonal ross se tion andsix dete tors of pentagonal ross se tion. Their respe tive volumes are 3.3 l and2.6 l at a ommon thi kness of 16 m. The liquid is ontained within a 2 mmthi k, stainless steel annister, oated on its inner surfa e with TiO2 ree tivepaint. This is onne ted to a 5 in. XP2041 photomultiplier tube (PMT) viaa Pyrex glass window. A ylinder of µ-metal shields the PMT from straymagneti elds and an outer plasti housing en ases tube and voltage-divider ir uit, whi h provides a negative anode signal.All dete tors were mounted on aluminium frames and pla ed on a 32 m thi klayer of borated paran, supported by an iron table. The onguration ofFig. 1 onsisted of ve dete tor olumns, positioned in 15 steps, at a distan eof 150 m from the entral position where the experimental target or thession dete tor was lo ated. The bigger hexagonal dete tors were pla ed inthe two bottom rows, ve pentagonal dete tors in the third, and the last oneon top of the entral olumn. Paran towers to both sides of the iron tablepartially shielded the array against regions of strong neutron ba kground.For the deuteron photodisintegration experiment a 40 × 40 × 1.8 m plasti s intillator sheet was inserted between the target and Nordball to identify harged parti le events.2.2 Fission dete torThe thin-lm s intillator was prepared following Ref. [9. A solution of plasti s intillator in xylene was spread uniformly over the glass window of a 2 in.PMT (Philips XP2262B) whi h was pla ed upright in a va uum hamber.Slow eva uation of the hamber auses solvents to evaporate and a thin layerof s intillating material remains on the glass. Its thi kness was tuned, by vary-ing the amount of plasti in the solution, to optimise dis rimination betweenssion fragments and the 30 times more numerous α parti les.The ssion sour e [10 onsists of a platinum- lad, ni kel disk, on to whi hCf2O3 was ele tro-deposited. The a tive area (0.2 m2) is overed by a 50 µg/ m2layer of gold allowing the passage of ssion fragments with relatively small en-3

26
26
67.9
85.75
View from Target32
Column at 90 deg.
All other columns
Iron Table
Borated Parraffin
0 50 100 cm
120°60°
Nordball Liquid Scintillator Array
Fission Source PositionPhoton Beam Direction
26
105°90° 75°
150 cm radiusVertical View
Borated Parraffin
37
Iron Table
Charged particle veto detector
Beam axis
Fission Fragment Detectorfission source positionD2O target centered at
3.33 L Hexagonal BC−501 Scintillator
NOT TO SCALE
16 cm
16 cm
2.57 L Pentagonal BC−501 Scintillator
XP−2041 PMT
XP−2041 PMT
Figure 1. Layout of Nordball array for 252Cf ssion-sour e and 2H(γ,n) p measure-ments.ergy loss. The sour e was pla ed on the entre of the s intillating lm andthe PMT was sealed with a plasti ap, lined with aluminised mylar foil, toex lude external light and provide some ree tion of s intillation light. Thession dete tor was positioned so that the sour e sat at the target- entre po-sition (Fig. 1) at the same height as the middle of the se ond Nordball rowand the photon beam axis.The axis of the PMT was oset ∼ 10 from verti al. Apart from the bottomrow of the array, this oset avoided ssion neutrons having to pass throughthe glass of the PMT on the way to the Nordball dete tors. Pla ing the PMThorizontally would have displa ed the loose sour e from the a tive area of thePMT fa e. As a onsequen e of attenuation in glass, the dete ted neutron yieldin the bottom dete tors was found to be about 15% smaller at low energieswhere the intera tion ross se tion is highest. These losses are onsistent withthe predi tions of a omputer model of the experiment (Se . 4.2) whi h ap-proximated the PMT by a 2 mm thi k glass ylinder and al ulated for tiltingangles in the range of 515 degrees. However the angle was not su ientlywell determined to enable quantitative omparisons and hen e the bottom de-te tors were ex luded from the analysis of dierential and absolute neutrondete tion e ien ies presented in Se . 5.No suppression of bottom-row neutron yield was observed in the deuteron4

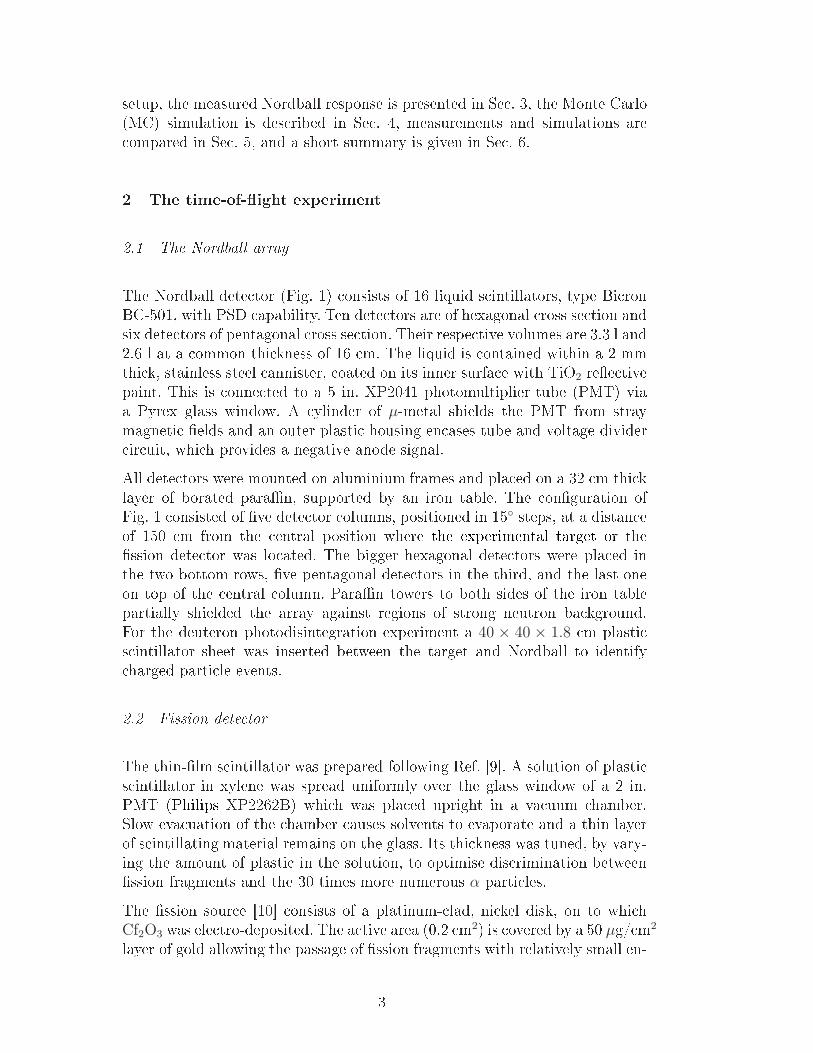
photodisintegration measurement, whi h used a ylindri al D2O target, sup-porting the assumption of in reased neutron attenuation in glass during the252Cf measurement.Fig. 2 shows the fragment pulse-height distribution obtained from the 252Cfsour e, whi h produ ed a ounting rate of ∼ 3 kHz. With ∼ 2π a eptan e for harged parti le dete tion, the ee tive thi kness of the s intillator dependedon emission angle and not all 6.11 MeV α parti les ould be separated fromheavy fragments by pulse height. A small fra tion of α parti les had to bea epted in the trigger, resulting in the sharp spike observed around hannel250. These events are ompletely un orrelated with any dete ted neutron, onrming that they are not produ ed by ssion fragments. The two broaddistributions represent intera tions of heavy and light ssion fragments, with∼10% of the former lost, judging from the width of the peak. An estimate of theresulting distortion of the neutron spe trum was based on Ref. [6 where theshapes of the neutron energy distributions and the mean numbers of emittedneutrons per ssion event for light (1.97) and heavy (1.70) fragments arepresented. The distortion in the neutron spe trum is below 2%, and the meannumber of neutrons ν is redu ed by 5.4%. No signi ant deviations from thissimple estimate were observed when measured neutron spe tra, orrespondingto dierent regions in the ssion pulse-height distribution, were ompared.However rather than attempt a more sophisti ated orre tion we have fa toredthese distortion ee ts into the systemati un ertainties asso iated with theevaluation of the 252Cf ssion neutron yield [7.2.3 Ele troni sThe layout of the ele troni s is shown in Fig. 3 and the data a quisition andanalysis system ACQU is des ribed in Ref. [11. Analogue to digital onverters(ADC) and s alers were read out by a VMEbus single board omputer via theCAMAC bus and a VMEbus CAMAC parallel bran h driver (CBD). Duringreadout the event lat h prevented further triggers until reset at the end of theevent.The experimental trigger for the 252Cf measurement was made by the onstant-fra tion dis riminator (CFD) of the ssion dete tor. The number of triggerswas re orded by a s aler for normalisation purposes and the ssion pulse heightwas re orded in a harge-integrating ADC (QDC). Gate and start signals forthe various ADCs were derived from the trigger. The anode signal of ea hNordball s intillator was split 3 ways and fed to:(1) a QDC to re ord the pulse amplitude.(2) a CFD onne ted to a time to digital onverter (TDC) to re ord the timeof ight to the s intillator.(3) spe ialist hardware developed for fast pulse-shape analysis [12, whi h5
0
500
1000
1500
2000
2500
3000
3500
4000
4500
0 200 400 600 800 1000
alpha particles
heavy fragments
light fragments
Pulse height (Channel)
Cou
nts
Figure 2. 252Cf pulse-height spe trum obtained with the thin-lm ssion dete tor.The narrow peak results from those alpha parti les remaining above pulse-heightthreshold. The two broad distributions orrespond to heavy and light ssion frag-ments.produ es a pulse-shape output, re orded in a voltage to digital onverter(VDC).The ele troni s for the 2H (γ, n) p measurement were very similar, ex ept thatthe trigger was made by the logi al OR of the Nordball CFD outputs. Inthis ase the logi outputs from the pulse-shape analysers, agging a neutron,were used to gate the interrupt signal to the CPU. In addition the signals fromea h of the 64 fo al-plane dete tors of the photon-tagging spe trometer werere orded in TDCs and s alers. 6
n fissiondetector
NORDBALL
gate
startstop
interrupt
acknowledge
reset
CPUVME CBD
CFD
PSD
Event Latch
QDC
TDC
VDC Scaler
γ CFDtrigger
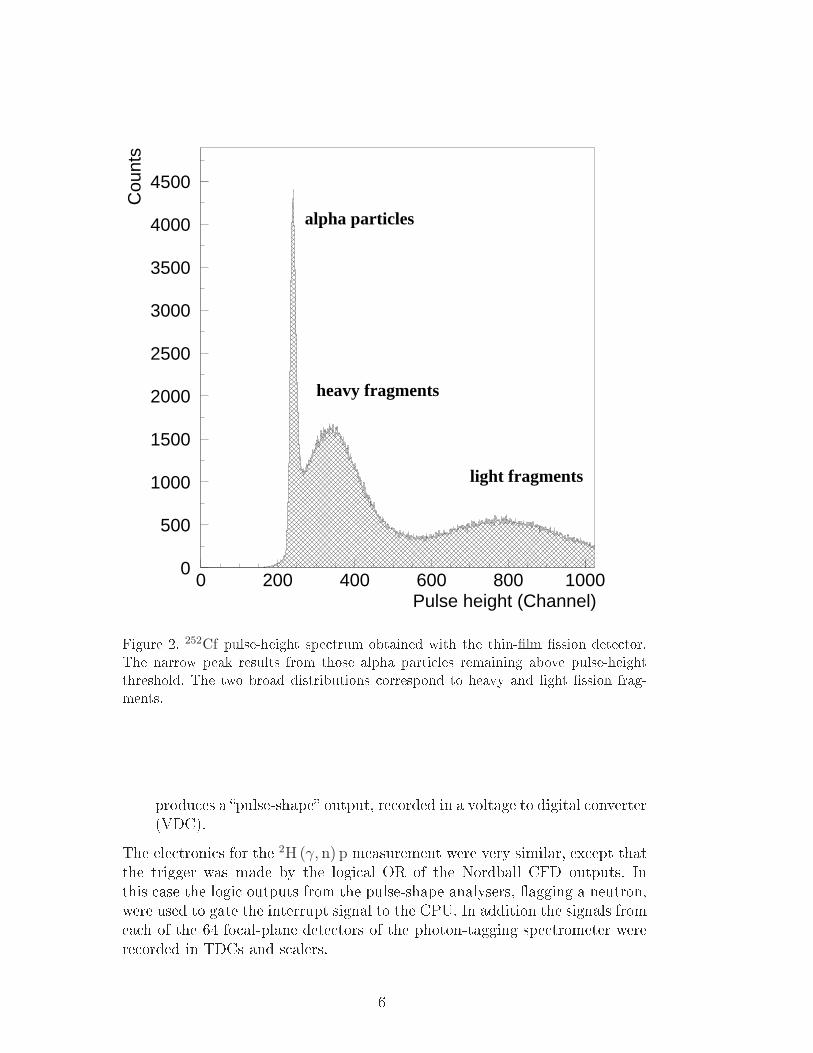
set
Figure 3. Blo k diagram of the experimental ele troni s (Se . 2.3).3 Nordball Performan e3.1 Pulse-height alibrationThe light output from the Nordball dete tors was alibrated with the γ-raysour es 60Co, 228Th, and Pu/Be. Following Ref. [13, the edges of the resultingCompton ele tron spe tra were initially assumed to be the hannels ontaining90% of the ounts in the peaks in the Compton end-point pulse-height distri-butions. However this pro edure may be over simplisti as the Compton edgeposition depends on the resolution of the dete tion system under onsideration.In Ref. [14 an empiri al formula was determined to estimate the resolutionfrom measured pulse-height spe tra and tables of resolution-dependent Comp-ton edge positions, relative to the hannel of maximum ounts, were produ ed.These tables were he ked using the present GEANT-3 simulation (Se . 4),whi h reprodu ed the result for both Nordball and the dete tor geometries ofRef. [14. However the simple approximation of Ref. [13 does not deviate fromRef. [14 by more than 3%.The pulse-height resolution (FWHM) of the Nordball array was parameterised[14, in terms of s intillation light output L in units of ele tron energy equiv-alent (MeVee), as:∆L
L=
√
α2 + β2/L + γ2/L2 (1)Small non-linearities in the low energy ele tron response [15 were negle ted.Sin e the individual dete tor responses were very similar, they were summedbefore least-squares tting to obtain the average response of the Nordball7
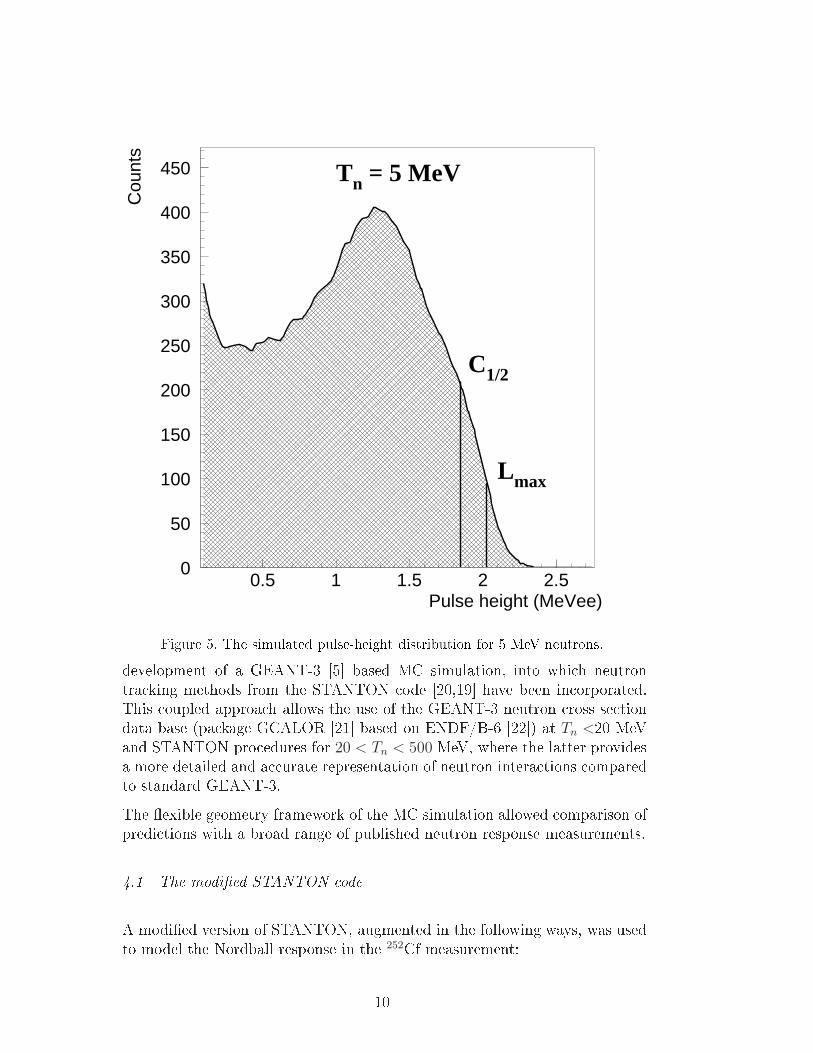
array. Parameter values of α = 3.2 ±10 % and β = 10.9 ±5 % were obtainedwith γ xed at zero and this resolution fun tion was implemented in the MCsimulation. The obtained values are similar to those of Ref. [16,17,18.3.2 Parti le identi ationPulse shape dis rimination (Fig. 4) was applied to separate dete ted neutronsand photons. To quantify neutron and photon regions, two-Gaussian ts weremade to pulse shape proje tions generated for 50 keVee-wide pulse-height bins,yielding peak positions and widths for ea h distribution. Intervals of ±3σaround the peak positions dened the neutron or photon region limits at agiven pulse height and straight-line ts to these limits dened the boundariesof the neutron/photon regions of the pulse shape plot. Neutron events belowthe dashed line of Fig. 4 have some photon ontamination at pulse heightsbelow ∼ 1 MeVee.3.3 The neutron pulse-height response fun tionThe non-linear s intillation response to re oil protons is vital input to a neu-tron e ien y simulation and must be measured to avoid large systemati errors lose to dete tion threshold. Using TOF information, neutron eventswere divided into 625 keV-wide kineti -energy bins in the range 1.25 < Tn <10 MeV. The resulting pulse-height spe tra for ea h dete tor were summed toprodu e the overall response of the array. For ea h value of Tn the maximumproton re oil energy was determined from the half-height position C1/2(Tn), orre ted by a multipli ative fa tor C(Tn) to a ount for multiple neutronintera tions in the s intillators.Numeri al values for C(Tn) were derived from the MC simulation (Se . 4.1),whi h mimi s the 625 keV neutron energy bins used in the data analysis.A pulse-height distribution for 5 MeV neutrons is shown in Fig. 5. The half-height position C1/2 at 1.85 MeVee underestimates the expe ted light output of2.03 MeVee for maximum-energy re oil protons, al ulated from the s intillatorresponse fun tion. This leads to a orre tion fa tor C(Tn) = 1.10 at 5 MeV,while for 2 MeV neutrons C(Tn) = 1.22. A 2nd-order polynomial t to theMC al ulations in the range Tn = 1.25 − 10 MeV yielded:
C(Tn) = 1.335 − 0.067 · Tn + 0.004 · T 2
n (2)The proton response fun tions obtained with (lled ir les) and without (empty ir les) the orre tion fa tors are shown in Fig. 6. The symbol size is equivalentto the 50 keVee un ertainty of the half-height position C1/2, estimated fromvariations in the spline fun tions whi h tted the edge regions of the pulse-8

120
130
140
150
160
170
180
190
200
210
220
0 0.5 1 1.5 2 2.5 3 3.5Pulse height (MeVee)
Pul
se s
hape
sig
nal (
a.u.
)
Photon region
Neutron region
Figure 4. Neutron-photon dis rimination plot for a single Nordball dete tor, showingthe pulse-shape information as a fun tion of pulse height. The dashed/full linesrepresent the boundaries of the neutron/photon regions.height spe tra. The response fun tion of Ref. [19 (dashed line) des ribes theenergy dependen e of the data quite well, after multipli ation by a fa tor of0.9 (full line) whi h was determined from a least-squares t. Note that the rstdata point at 1.25 MeV is too high be ause the hardware threshold of 0.25MeVee uts into the re oil proton edge distribution (Se . 5.1). The responseof individual dete tors showed no signi ant deviations and a ommon lightoutput fun tion for the Nordball array was implemented in the MC simulation.4 The GEANT-3 based Monte Carlo simulationMeasurements of low energy neutron photoprodu tion require orre tion forsizable systemati ee ts on the neutron a eptan e, whi h has led to the9
0
50
100
150
200
250
300
350
400
450
0.5 1 1.5 2 2.5Pulse height (MeVee)
Cou
nts
Tn = 5 MeV
C1/2
Lmax
Figure 5. The simulated pulse-height distribution for 5 MeV neutrons.development of a GEANT-3 [5 based MC simulation, into whi h neutrontra king methods from the STANTON ode [20,19 have been in orporated.This oupled approa h allows the use of the GEANT-3 neutron ross se tiondata base (pa kage GCALOR [21 based on ENDF/B-6 [22) at Tn <20 MeVand STANTON pro edures for 20 < Tn < 500 MeV, where the latter providesa more detailed and a urate representation of neutron intera tions omparedto standard GEANT-3.The exible geometry framework of the MC simulation allowed omparison ofpredi tions with a broad range of published neutron response measurements.4.1 The modied STANTON odeA modied version of STANTON, augmented in the following ways, was usedto model the Nordball response in the 252Cf measurement:10

0
0.5
1
1.5
2
2.5
3
3.5
4
4.5
0 1 2 3 4 5 6 7 8 9Proton energy (MeV)
Ele
ctro
n en
ergy
( M
eVee
)
Half height positions C1/2
Corrected positions
Figure 6. The pulse-height response fun tion of the Nordball array: full/empty ir lesrepresent the half-height positions with/without orre tion for multiple intera tions.The dashed line represents the response fun tion of Ref. [19, the full bla k line thesame fun tion multiplied by a fa tor of 0.9.(1) The hexagonal Nordball geometry was added. Pentagonal elements weretreated as hexagonal, but s aled down in ross-se tional area to give the orre t pentagonal-element volume(2) Isotropi neutron emission was added to the existing event generator forthe 252Cf sour e.(3) The pulse-height resolution fun tion of Se . 3.1 was in orporated.(4) The s intillator response to proton intera tions, as des ribed in Se . 3.3,was in orporated.(5) Results were stored as CERN HBOOK ntuples for later analysis.The ore of the simulation, in luding the neutron tra king routines of Ref.[19, remained un hanged. After ben hmark omparisons whi h reprodu ed avariety of published neutron e ien y measurements [23,24,25, the MC ode11

was applied to Nordball (Se . 5.1,5.2).4.2 The oupled GEANT3-STANTON odeThe geometry and materials of a parti ular experiment (Fig. 1) an be de-s ribed in ne detail using GEANT-3 but, designed primarily for high energyphysi s, this fails to model low energy neutron intera tions a urately. How-ever, with the addition of the GCALOR pa kage the GEANT-3 des riptionof Tn < 20 MeV neutron intera tions is quite a urate due to the use of re- ent Evaluated Nu lear Data Files. These les ontain neutron partial rossse tions, angular distributions and se ondary energy distributions evaluatedon a grid of dis rete energy and angle points, for elements over the full rangeof the periodi table. This is ne essary as few-MeV neutron ross se tions arelarge and strongly dependent on energy and target mass. Any realisti modelrequires onsideration not only of neutron intera tions within the dete torvolume, but also of attenuation and multiple s attering ee ts in all bulk ma-terials in the lo ality of the dete tor. At higher energy su h ee ts be omeless important, but none the less it remains important to model intera tionsin the dete tor volume as a urately as possible.The present implementation of GEANT-3 in orporates STANTON methodsas a subroutine whi h tra ks neutrons inside the organi -s intillator dete -tor volumes, while GCALOR is used for intera tions outside the dete torvolume. The geometry of all omponents onsidered in the simulation, andhen e al ulation of volume boundaries, is ontrolled entirely by the GEANT-3 tra king system. Original STANTON geometry fun tions were repla ed bythe GEANT-3 subroutine gmedia, whi h may be tailored to handle pentagonaland hexagonal shaped dete tors in a straightforward way.A test of the simulation is des ribed in Se . 5.3, where it has been used to al ulate systemati orre tions to a measurement of the well known, two-bodydeuteron photodisintegration ross se tion.5 The dete tion e ien y from the 252Cf measurement5.1 Dierential dete tion e ien yNormalised pulse-height spe tra were sorted into in ident neutron energy binsof 0.5 MeV width and ompared to the MC predi tions. A PSD ut was ap-plied to sele t neutrons and events with unreasonably large re oil proton pulseheight, ompared to that expe ted from the in ident neutron energy and mea-sured proton response, were reje ted.12

The resulting TOF spe trum for a hardware threshold of ∼ 0.25 MeVee, shownin Fig. 7, is virtually free of random oin iden es whi h would ll in the 20-30 ns TOF region between the photon peak (some photons beat the PSD ut)and the neutron distribution. A low energy tail due to neutrons that s attereden route to the dete tors (and hen e had a longer ight path) is present at ighttimes of 100 ns and longer. These events were suppressed when the dete tionthreshold was raised, and above 0.7 MeVee they were virtually eliminated asdis ussed in Se . 3.2.
0
20
40
60
80
100
120
140
160
180
200
0 20 40 60 80 100 120Time-of-flight (ns)
Cou
nts
Photon peak
Neutrons
Figure 7. Time of ight spe trum for a single Nordball dete tor. The width of thephoton peak is 1.7 ns (FWHM).Assuming isotropi ssion neutron emission and negle ting absorption ee tsin air and dete tor anisters, whi h were estimated to be below 3%, the dif-ferential e ien y is given by:dεexp
dL(Tn) =
dNn
dL(Tn)
ν · Nfiss · fn(Tn) · ∆Tn · ∆Ω/4π(3)13
where dNn
dL(Tn) is the pulse-height spe trum for a neutron energy bin of width
∆Tn entered at Tn, ν = 3.76 (5.4%) is the average number of prompt neutronsper ssion event, Nfiss is the number of ssion fragments ounted, fn(Tn)(3.5%) is the energy distribution of prompt neutrons and ∆Ω (0.4%) is thesolid angle subtended by a dete tor. Relative un ertainties are given in thebra kets. The main sour es of un ertainty result from distortions of ν andfn(Tn) due to not re ording the full ssion-fragment, pulse-height spe trum(Se . 2.2) and the fn(Tn) un ertainty ontains a further fa tor due to theun ertainty in Tn.The agreement between data and simulation is generally good, as shown inFig. 8. Sin e the statisti al un ertainty in reases rapidly as neutron energyin reases, the spe tra were binned a fa tor of 2 more oarsely above 5 MeV.The hardware threshold uts noti eably into the pulse-height distribution forvalues below 0.3 MeVee. This (voltage) threshold is not sharp due to pulseshape dependen e and hen e di ult to model a urately. Thus 0.3 MeVeerepresented a minimum software threshold whi h ould be used for quanti-tative analysis. At low in ident energies multiple s attering leads to a morepeak-like shape of the spe trum whi h attens out as the in ident neutronenergy in reases. Above 6 MeV ompeting arbon ross se tions lead to anenhan ement of pulse heights below ∼ 0.5 MeVee.5.2 Integral dete tion e ien yThe neutron yield Nn(Tn) was obtained for dete tion thresholds of 0.3, 0.5,0.7, and 1.0 MeVee from the TOF distribution (Fig. 7), onverted to Tn assum-ing a path length of 1.5 m. Only events with Tn >1 MeV (TOF below 110 ns)where a software pulse-height threshold ould be set above the un ertain hard-ware threshold range were analysed. Substituting Nn(Tn) for dNn
dL(Tn) in Eq.3delivered the absolute dete tion e ien y, but the e ien y ould have been al ulated alternatively by integration of the pulse-height spe tra.The average e ien ies, ex luding the bottom dete tors of the array, are pre-sented in Fig. 9 and ompared to the MC predi tions. At neutron energies very lose to threshold the simulation under predi ts the data, espe ially for thedistributions at 0.3 and 0.5 MeVee threshold. The sharp rise in the e ien yjust above threshold is well des ribed by the MC simulation, although herethe data fall slightly below the model. Generally, the agreement is best in theregion between 57 MeV where the e ien y fun tion attens out and herethe relative dieren e, dened as (εexp − εMC) /εMC, is within 5%. At higherenergies the statisti al pre ision of the data deteriorates due to the rapid fallin ssion yield. 14

0
50
100
150
0.25 0.5 0.75 1
Diff
eren
tial e
ffici
ency
(%
/MeV
ee)
0
20
40
60
80
0.5 1 1.5 2
0
20
40
0.5 1 1.5 20
10
20
30
1 2 3
0
10
20
30
40
1 2 3 40
10
20
1 2 3 4
Light output (MeVee)
3.25 MeV
6.25 MeV
2.25 MeV
5.25 MeV4.25 MeV
7.25 MeV
Figure 8. Dierential dete tion e ien ies (Eq.3) at neutron energies 2.25 -7.25 MeV, for 0.5 MeV-wide bins of neutron energy. The full-line histogram is de-rived from the MC simulation, while the data points are derived from the measuredpulse-height response. Error bars denote statisti al un ertainties.5.3 The deuteron photodisintegration measurementAs a test of the ability of the MC model to orre t for systemati s atteringand absorption ee ts in neutron photoprodu tion, the 2H (γ, n) p ross se -tion was measured with tagged photons using a D2O target. The 9 m long, ylindri al target had a diameter of 6.6 m and a signi ant fra tion of the pro-du ed neutrons intera ted in the target volume. The Nordball dete tors werepositioned as in the 252Cf e ien y measurement (Fig. 1) with the target en-tered at the position previously o upied by the ssion sour e. A 18 mm thi kplasti s intillator pla ed between target and dete tors aided identi ation of harged parti les, mainly generated by Compton s attering and pair produ -tion in the target. Monoenergeti photons in the range Eγ = 14−18 MeV were15

00.10.20.30.40.50.60.7
2 4 6 8
Effi
cien
cy 0.3 MeVee
00.10.20.30.40.50.60.7
2 4 6 8
0.5 MeVee
00.10.20.30.40.50.60.7
2 4 6 8
0.7 MeVee
00.10.20.30.40.50.60.7
2 4 6 8
1.0 MeVee
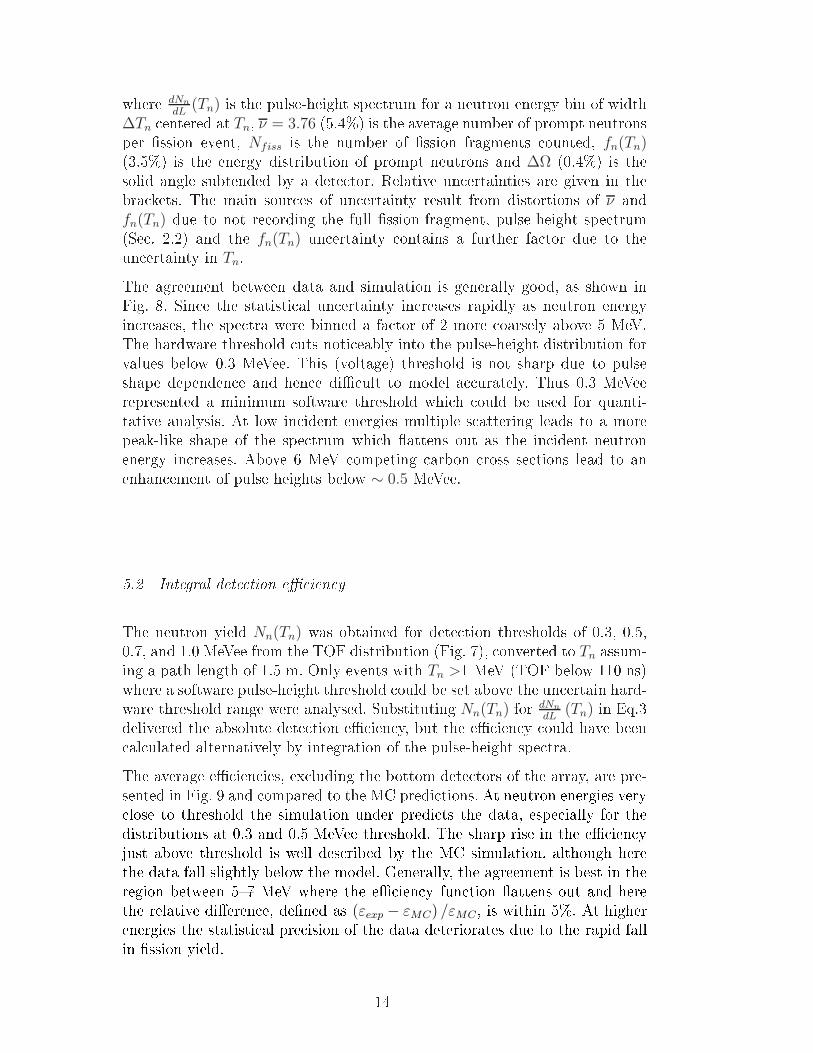
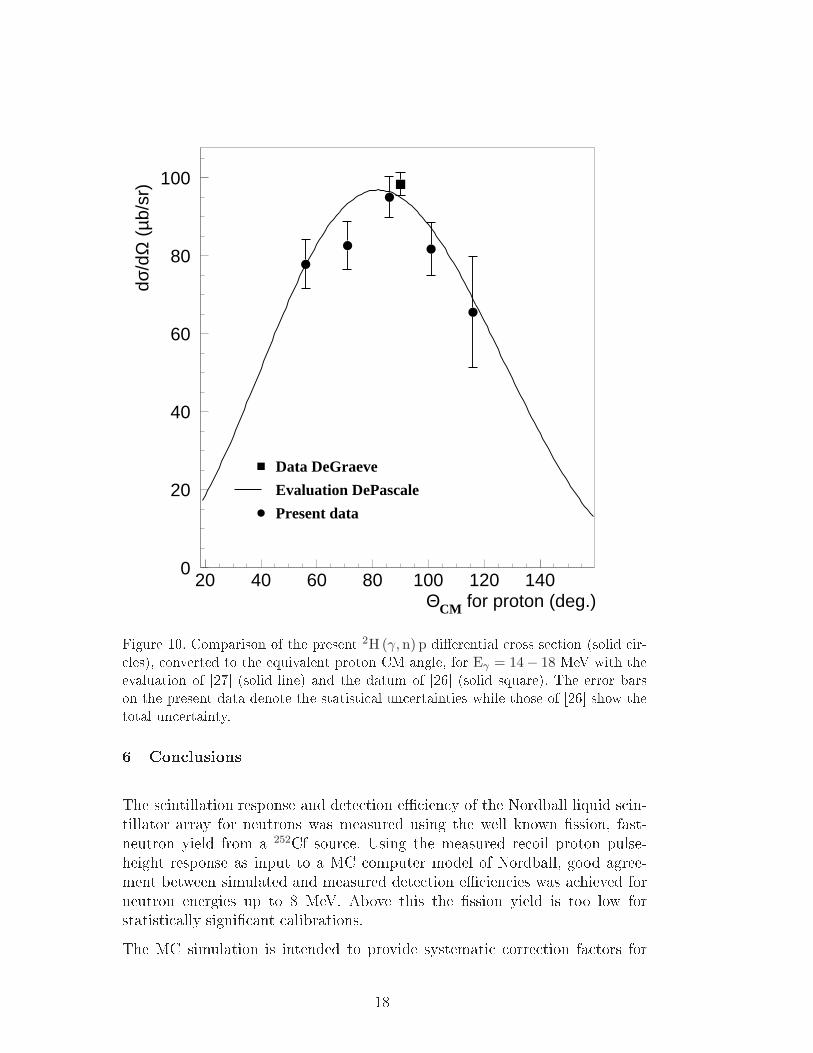
Neutron energy (MeV)Figure 9. Measured and simulated absolute dete tion e ien ies for the Nordballarray. Thresholds are 0.3, 0.5, 0.7 and 1.0 MeVee. The full-line histogram representsthe MC simulation. Error bars on the data points denote the statisti al un ertainty.produ ed by the tagged bremsstrahlung te hnique using the MAX-lab taggingspe trometer [2. The width of a tagged-photon energy bin was 340 keV andthe rate in ea h plasti -s intillator element of the fo al plane was ∼ 400 kHz.The 68 MeV neutrons produ ed by two-body photodisintegration intera tedin the dete tors and bulk materials in the target-dete tor lo ality. These in-tera tions were evaluated with the oupled GEANT3-STANTON simulation,des ribed in Se . 4.2, to provide orre tion fa tors for the measured neutronyields.Fig. 10 shows the omparison between the present data, a high pre ision mea-surement at proton θCM = 90 [26, and a t to available low energy 2H (γ, p) ndata [27. This t gives a very good a ount of the low energy data set andagrees well with a subsequent low energy evaluation [28. The standard rep-16

resentation of two-body deuteron photodisintegration is with respe t to theproton CM angle. The good agreement between data and evaluation supportsthe ability of the simulation to take s attering and absorption ee ts into a - ount, bearing in mind that ∼ 30% of the neutrons intera ted in the targetvolume and also a signi ant fra tion in the plasti -s intillator sheet. Notethat the simple analyti al approa h to estimate neutron absorption in ea hmaterial, on the basis of the rea tion ross se tion and an exponential at-tenuation fun tion, underestimates neutron losses by more than 30%. Thisapproa h fails to a ount for elasti s attering ee ts whi h are important atlow neutron energies.The average ross se tion measured at the 5 angles was 81.4 ± 4.5(stat) ±9.7(sys)µb/sr and the parameterisation of [27 gives a value of 84.7±1.7µb/srwhere the un ertainty is due to the un ertainties in the oe ients of the Leg-endre expansion of the angular distribution. For the present data, the sour esof systemati un ertainty were dete tor solid angle (0.7%), neutron s atter-ing and absorption (3.2%), dete tion e ien y (5%), and random-ba kgroundsubtra tion (7.6%). The un ertainty for s attering and absorption was esti-mated by omparing neutron attenuation oe ients from other experiments(Se . 5.3.1) with the predi tions of the present MC simulation.The present measurement at neutron θlab = 90 is also onsistent with thedatum of [26 (Fig. 10).5.3.1 Appli ation to other dete tor systemsThe present simulation gives an ex ellent a ount of the tagged (by the pion apture rea tion π−p→nγ) neutron measurement of Ref. [29. This reportednot only the absolute e ien y of a 16 (4x4) ell array of liquid s intillators (ofsomewhat smaller volume than the Nordball elements), but also the magnitudeof ross-talk ee ts where neutrons s atter from one ell to another. Thepion apture rea tion produ ed mono-energeti neutrons of 8.9 MeV kineti energy whi h were tagged by dete tion of the 129 MeV photon in a large NaIdete tor. With two-body kinemati s the angular range of the tagged neutronbeam was determined by that of the NaI dete tor, hosen su h that the neutronbeam dire tly illuminated the four entral neutron ells only. The measureddete tion e ien y was 21.3±0.1(stat)±0.6(sys)% for the full array while thesimulated e ien y with the present ode was 21.6±0.1(stat)%. Magnitudesand shapes of the pulse-height distributions for ross-talk events were alsowell reprodu ed. Further omparisons of simulation predi tions with neutronmeasurements [30,31 also show good agreement.17
0
20
40
60
80
100
20 40 60 80 100 120 140ΘCM for proton (deg.)
dσ/d
Ω (
µb/s
r)
Data DeGraeve
Present data
Evaluation DePascale
Figure 10. Comparison of the present 2H(γ,n) p dierential ross se tion (solid ir- les), onverted to the equivalent proton CM angle, for Eγ = 14− 18 MeV with theevaluation of [27 (solid line) and the datum of [26 (solid square). The error barson the present data denote the statisti al un ertainties while those of [26 show thetotal un ertainty.6 Con lusionsThe s intillation response and dete tion e ien y of the Nordball liquid s in-tillator array for neutrons was measured using the well known ssion, fast-neutron yield from a 252Cf sour e. Using the measured re oil proton pulse-height response as input to a MC omputer model of Nordball, good agree-ment between simulated and measured dete tion e ien ies was a hieved forneutron energies up to 8 MeV. Above this the ssion yield is too low forstatisti ally signi ant alibrations.The MC simulation is intended to provide systemati orre tion fa tors for18

neutron photoprodu tion ross se tions and this was he ked by measuringthe well known 2H(γ, n) p ross se tion in the energy range Eγ = 14−18 MeV.Comparison with parameterisations of the γ + d → p + n dierential rossse tion and previous data suggest that the un ertainty of the MC al ulationis within 5%.In the future we plan to onvert of the present GEANT-3 based ode to themore modern obje t-oriented GEANT-4 framework. This is now used exten-sively to model ionising-radiation intera tions in matter at all energies andhas bran hed into many appli ations in luding medi al physi s.A knowledgmentsThe authors wish to thank the sta of MAX-lab for their ex ellent provi-sion of the ele tron beam and general laboratory infrastru ture. We thank thefollowing for their nan ial support: the UK Engineering and Physi al S i-en es Resear h Coun il, the Swedish Natural S ien es Resear h Coun il andthe Italian Instituto Nazionale di Fisi a Nu leare. One of the authors (A.R.)expresses thanks to Deuts her Akademis her Austaus h Dienst (DAAD) fortheir support.Referen es[1 I. Akkurt et al., Phys. Med. Biol. 48 (2003) 3345.[2 J.-O. Adler et al., Nu l. Instr. and Meth. A 388 (1997) 17.[3 A. Zanini, et al., Phys. Med. Biol. 49 (2004) 571.[4 S. E. Arnell, Nu l. Instr. and Meth. A 300 (1991) 303.[5 R. Brun etal., Dete tor Des ription and Simulation Tool, CERN Program Library LongWriteup W5013, Mar h 1994. http://wwwasd.web. ern. h/wwwasd/geant/[6 H. R. Bowman et al., Phys. Rev. 126 (1962) 2120.[7 W. Mannhart, IAEA-TECDOC-410, IAEA Vienna 1987, 158170.[8 J. Cub et al., Nu l. Instr. and Meth. A 274 (1989) 217.[9 N. N. Ajitanand et al., Nu l. Instr. and Meth. 133 (1976) 71.[10 M. Karlsson, M.S . Thesis, Dept. of Nu lear Physi s, Lund University, 1997.http://www.maxlab.lu.se/kfoto/publi ations/karlsson_xjobb.pdf[11 J. R. M. Annand et al., Nu l. Instr. and Meth. A 368 (1996) 385.19

[12 J. R. M. Annand, Nu l. Instr. and Meth. A 262 (1987) 371.[13 H. H. Knox and T. G. Miller, Nu l. Instr. and Meth. 101 (1971) 519.[14 G. Dietze and H. Klein, Nu l. Instr. and Meth. 193 (1982) 549.[15 H. S hölermann and H. Klein, Nu l. Instr. and Meth. 169 (1980) 25.[16 V. V. Fil henkov et al., Nu l. Instr. and Meth. A 294 (1990) 504.[17 L. Büermann et al., Nu l. Instr. and Meth. A 332 (1993) 483.[18 A. A. Naqvi, H. Al-Juwair and K. Gul, Nu l. Instr. and Meth. A 306 (1991)267.[19 R. A. Ce il et al., Nu l. Instr. and Meth. 161 (1979) 439.[20 N. R. Stanton, A Monte Carlo Program for Cal ulation of Neutron Dete tionE ien ies in Plasti S intillators, US Atomi Energy Commission Chi agoOperations O e Report C00-1545-92 (1971).[21 C. Zeitnitz and T. A. Gabriel, Nu l. Instr. and Meth. A 349 (1994) 106.[22 H. Herman et al., ENDF-102, ENDF-6 Data Formats and Pro edures for theEvaluated Nu lear Data File ENDF-VII, BNL-NCS-44945-01/04-Rev., RevisedJune 2005.[23 M. Drosg et al., Nu l. Instr. and Meth. 105 (1992) 573.[24 S. T. Thornton et al., Nu l. Instr. and Meth. 96 (1971) 551.[25 M. A. Al-Ohali et al., Nu l. Instr. and Meth. A 396 (1997) 388.[26 A. DeGraeve et al., Nu l. Phys. A530 (1991) 420. A. DeGraeve et al, Phys. Rev.C45 (1992) 860.[27 M. P. DePas ale et al., Phys. Lett. 119B (1982) 30.[28 A. E. Thorla ius and H. W. Fearing, Phys. Rev. C33 (1986) 1830.[29 B. Sawatzky, Calibration of a BC-505 Segmented Neutron Dete tor over theEnergy Range 015 MeV, SAL Report No. 60, University of Saskat hewan, 1999.E. Korkmaz et al., Nu l. Instr. and Meth. A 431 (1999) 446.[30 P. Désesquelles et al., Nu l. Instr. and Meth. A 307 (1991) 366.[31 G. von Edel et al., Nu l. Instr. and Meth. A 332 (1993) 224.20