MBA Project PEREZ A. ANYUMBA. - UoN Repository
69
AN EMPIRICAL TEST OF THE RANDOM WALK MODEL FOR THE NAIROBI STOCK EXCHANGE (NSE) BY: PEREZ A. ANYUMBA. A PROJECT SUBMITTED IN PARTIAL FULFILMENT OF REQUIREMENT FOR THE AWARD OF MASTER OF BUSINESS ADMINISTRATION (MBA) DEGREE. SCHOOL OF BUSINESS, UNIVERSITY OF NAIROBI. NOVEMBER 2010.
-
Upload
khangminh22 -
Category
Documents
-
view
1 -
download
0
Transcript of MBA Project PEREZ A. ANYUMBA. - UoN Repository

AN EMPIRICAL TEST OF THE RANDOM WALK MODEL FOR THE NAIROBI STOCK EXCHANGE (NSE)
BY: PEREZ A. ANYUMBA. A PROJECT SUBMITTED IN PARTIAL FULFILMENT OF REQUIREMENT FOR THE AWARD OF MASTER OF BUSINESS ADMINISTRATION (MBA) DEGREE. SCHOOL OF BUSINESS, UNIVERSITY OF NAIROBI.
NOVEMBER 2010.

ii
DECLARATION I the undersigned declare that this research project is my original work and has not been
submitted to any college, institution or University other than the University of Nairobi for
academic purposes.
Signed: _______________________ Date: ________________ PEREZ A. ANYUMBA D61/71217/2008 This research project has been submitted with my approval as University supervisor. Signed: _______________________ Date: ________________ MR. MOSES ANYANGU LECTURER, DEPT. OF FINANCE AND ACCOUNTING UNIVERSITY OF NAIROBI.
DEDICATION
This study has been dedicated to my dear husband Robert, my son Albert, my daughter
Mical and my sister Rebecca for their love, understanding and patience when I could not
be with them because of my studies. May they receive God’s blessings in abundance.

iii
ACKNOWLEDGEMENT
First and foremost I thank God, for giving me the strength to go through this demanding
and rewarding exercise. I appreciate and wish to extend my best wishes and gratitude to
all whose assistance and encouragement enabled me to complete this project.
Special thanks to my supervisor, Mr. Moses Anyangu for his invaluable input, dedication
to this work, expert support, knowledge , motivation, patience and encouragement. God
bless you.
I would like to thank my family for standing by me throughout the challenge. Special
thanks to my son Albert and daughter Mical for putting up with my absence. My loving
husband Robert Otom and my sisters Rebecca, Miriam and Lillian for your support
through the years. God bless you abundantly. To my friends Isaac and Robert Mule for
your faithful academic support. God bless you. To NSE that provided me with the needed
data for this project, I say thank you very much.
I am grateful to my colleagues for the various information and contribution in whichever
way, especially Peris Kiguta, may God bless you, not forgetting my different groups,
Young Professionals (OLQP church) and Success Island members.
Finally, my sincere appreciation to my late parents, I will always be grateful for your
noble support in bringing me up to the person I am. God bless you.

iv
ABSTRACT It is usually believed that the markets in developing and less developed countries are not
efficient in semi-strong form or strong form. Efficient capital market is one which prices
fully reflect the available information. An important implication of efficient market
theorists is that stock market should approximately follow a random walk. The Random
walk Model states that present market price is the best indicator of the future market price
with an error term that is stochastic in nature. Hence the next period’s price is anybody’s
guess.
The purpose of the study is to empirically test whether NSE indices follow random walk
or not, that is to determine whether NSE conforms to the efficient market hypothesis or
not. If NSE follows random walk, the share prices cannot be predicted or forecasted using
predictive model developed using the historical data. Hence NSE will be classical
example of efficient capital market in developing economy in the weak form.
The research study assessed the variance ratio of NSE 20 share index and NASI at lag q
and corresponding Z-statistic for different specification of the error Et term behavior
between operational periods; 1st March 2004 to 30th April 2009 and 1st January 2008 to
30th April 2009 respectively. It adopted a model in random walk first designed by
Bachelier in 1990 but modified by substituting stock prices by NSE share indices. The
study population will comprise of the NSE 20 share indices points and NASI. The study
used secondary data collected from NSE daily index return files, daily newspapers and
internet.
NSE was found to follow random walk, hence according to this project; it has been
classified as efficient market in a developing economy under weak form of Market
Efficiency. The information is significant to different stake holders in making informed

v
decisions in relation to the share prices, better policies to regulate the players in CMA,
proper planning and also form a basis of further research on the subject.

vi
LIST OF ABBREVIATIONS
AIG (EA) - American Insurance Group (East Africa)
AIMS - Alternative Investment market Segment
ANN - Artificial neutral network
ANOVA - Analysis of Variance
ARIMA - Auto-regression Integrated Moving Average
ASE - American Stock Exchange
ASMs - Asian stock markets
BSE - Bombay stock exchange
CRSP - Centre for research in security prices
CSE - Chittagong Stock Exchange
D/N - Daily Nation
DSE - Dhaka Stock Exchange
DW -Durbin Watson Test
ESMs - Emerging Stock Markets
FMA - Fixed length moving average
GSE DSI - Ghana Stock Exchange Databank stock Index
ISE - Indian stock exchange
ISM - Indian stock market
NASI - Nairobi Stock Exchange All Share Index
NYSE - New York Stock Exchange
NBK - National Bank of Kenya
NSE - Nairobi stock Exchange
P/E - Price per Earning Ratio
SKM - South Korean market
USSM - United States Stock market
VMA - Variable length moving average
ZSE - Zimbabwe Stock Exchange

vii
LIST OF TABLES Table 4.2.1: Weekly values of NSE 20 share indices for null hypothesis of Random Walk
Model.
Table 4.2.2: Weekly values of NASI for null hypothesis of Random Walk Model.
Table 4.2.3: Monthly values of NSE 20 share indices for null hypothesis of Random
walk Model.
Table 4.2.4: Monthly values of NASI for null hypothesis of the Random Walk Model

viii
LIST OF FIGURES
Figure 4.3.1: NSE 20 share weekly indices based on Monday’s reports of the first twenty
weeks (1st March 2004 to 30th April 2005)
Figure 4.3.2: NSE 20 share weekly indices based on Monday’s reports of the last twenty
weeks (1st March 2008 to 30th April 2009)
Figure 4.3.3: NSE 20 share monthly indices based on the last working day of the month
for the first one year period for the study (1st March 2004 to 30th April 2005)
Figure 4.3.4: NSE 20 share monthly indices based on the last working day of the month
for the last one year period for the study (1st March 2008 to 30th April 2009)
Figure 4.3.5: NASI monthly indices based on the last working day of the month (1st
January 2008 to 30th April 2009)

ix
TABLE OF CONTENTS
DECLARATION ............................................................................................................ ii
DEDICATION................................................................................................................ iii
ACKNOWLEDGEMENT..............................................................................................iv
ABSTRACT .................................................................................................................... v
LISTOF TABLES............................................................................................................ix
LIST OF FIGURES..........................................................................................................x
CHAPTER ONE: INTRODUCTION........................................................................... 1
1.1 Background to the study......................................................................................... 1
1.2 Statement of the Problem ....................................................................................... 5
1.3 Research objective.................................................................................................. 8
1.4 Importance of the Study ........................................................................................ 8
CHAPTER TWO: LITERATURE REVIEW ............................................................. 10
2.0 Introduction ............................................................................................................ 10
2.1 Theoritical Literature.............................................................................................. 10
2.1.1 The Genesis of random in stock prices................................................................ 10
2.1.2Theory of efficient market hypothesis.................................................................. 11
2.1.3 The Dumb Agent Theory..................................................................................... 11
2.2 Empirical Studies.................................................................................................... 12
2.2.1 Empirical evidence of independence................................................................... 12
2.2.1 Empirical evidence against independence........................................................... 15
2.3 Common Predictive Techniques............................................................................. 21
2.3.1 Chartist or technical theories ............................................................................... 22
2.3.2 Fundamental or intrinsic value analysis .............................................................. 23
2.4 Historic Information …………………………………………..……………….…24
2.4.1 New Information………………………………………………………………...24
2.5 The interaction between weak form market efficiency and the emerging
markets……………………………………………………………………………..…26
2.6 Criticism of random walk…………………………………………………………27

x
2.7 Conceptual framework……………………………………………………………28
2.8 Conclusion from Literature Review………………………………………………30
CHAPTER THREE: RESEARCH METHODOLOGY ......................................... 32
3.0 Introduction ............................................................................................................ 32
3.1 Research Design ..................................................................................................... 32
3.2 The target population.............................................................................................. 32
3.3 Sample .................................................................................................................... 33
3.4 Data type and Collection Techniques………………………………………..……33
3.5 Data Analysis………………………………………………………………….......33
CHAPTER FOUR: DATA ANALYSIS,RESULTS AND DISCUSSION. ................ 35
4.0 Introduction ............................................................................................................ 35
4.1 Data Analysis.......................................................................................................... 35
4.2 Tables and Analysis of Results............................................................................... 36
4.3 Line graphs for NSE 20 share index and NASI for portions of the study period... 44
4.4 Summary of Findings ............................................................................................. 48
CHAPTER FIVE: CONCLUSIONS AND RECOMMENDATIONS...... ................. 50
5.0 Introduction ............................................................................................................ 50
5.1 Conclusions ............................................................................................................ 50
5.2 Recommendations .................................................................................................. 51
5.3 Limitation of the study ........................................................................................... 51
54 Suggestions for Further Research............................................................................ 52
REFERENCES ............................................................................................................... 53
APPENDIX .................................................................................................................. 58

1
CHAPTER ONE INTRODUCTION
1.1Background to the study
It is usually believed that the markets in developing and less developed countries are not
efficient in semi-strong form or strong form. Random walk has become prominent in the
macroeconomics literature since the development of rational expectation, they are
implications, for example, of the efficient market hypothesis for real stock prices, of
hysteresis models of unemployment, and of the permanent income hypothesis of
consumption (Kennedy, 1996).
From a statistical dictionary, a random walk is defined as a walk in which the walker's
movements are a consequence of a sequence of observations on one or more random
variables. For instance, suppose that, at each time point an individual walks one step to
the left (with probability p) or one step to the right (with probability 1−p). This simple
Markov process is a one-dimensional random walk.
The Random Walk Model states that present market price is the best indicator of the
future market price with an error term that is stochastic in nature. Hence the next period’s
price is anybody’s guess. In an Efficient market it is not possible to make profits based on
past information hence the prediction of future price conditional on the past prices on an
average should be zero. In the most efficient market the future prices will be totally
random and the price formation can be assumed to be a stochastic process with means in
prices change equal to zero. Alexander, et al (1989) points out that in most efficient
market the future price will be totally random and the price formation can be assumed to

2
be a stochastic process. The random walk assumes that a fixed drift in the price change
from one period to another with a component of increment that are independently and
identically distributed. The increment term has a zero mean and a fixed variance
(homoskedasticity).
Kangila(2007) basing his argument on the significance of the relationship between
dividends declared and effect on share price, he concluded that only twenty percent
(20%) of the share price of the companies responded positively to the amount of
dividends declared. He found out that some shares prices increased significantly even
when the companies made loses and no dividends declare d e.g. National Bank of Kenya
and Uchumi supermarkets. In general he concluded that share prices are not influenced
by any information about the company’s previous day’s events or trading.
Brealey et al (1995) points out that if stock’s price follow a random walk, the odds of an
increase or decrease during any day, month, or year do not depend at all on the stock’s
prices. Stock prices traded in the bourse seems to wander randomly, virtually equally
likely to go up or go down on any particular day, regardless of what had occurred on the
previous day.
Kennedy (1996) defines random walk in terms of macroeconomic data that are
nonstationary in nature as this period's value is equal to last period's value plus a random
error, even after a deterministic trend has been removed.

3
Mishkin (2004), points out that while the theory of rational expectation was being
developed by monetary economists, financial economists were developing a parallel
theory of expectation formation in financial markets called the efficient market
hypothesis which led to the same conclusion as that of rational expectation theorists that
expectation of financial markets are equal to optimal forecast using all available
information. An important implication of efficient market theorists is that stock market
should approximately follow a random walk. In fact, when people mention the random
walk theory of stock prices, they are in reality referring to the efficient market hypothesis.
For many years’ economists, statisticians, and teachers of finance have been interested in
developing and testing models of stock price behavior. One important model that has
evolved is the theory of random walks. This theory casts serious doubt on many other
methods for describing and predicting stock price behavior-methods that have
considerable popularity outside the academic world.
An efficient market is defined as a market where there are large numbers of rational
profit-maximizers actively competing, with each trying to predict future market values of
individual securities, and where important current information is almost freely available
to all participants. In an efficient market, competition among the many intelligent
participants leads to a situation where, at any point in time, actual prices of individual
securities already reflect the effects of information based both on events that have already
occurred and on events which as of now the market expects to take place in the future.

4
Under Weak Form of Market Efficiency, the price of a security reflects all the available
information about the economy, the market and the specific security and that price adjust
immediately to new information. Pandey (2006), points out that the security prices reflect
all the past information about the price movement in a Weak Form of Efficiency. It is
therefore, not possible for an investor to predict future security by analyzing historical
prices and achieve a performance (return) better than the stock market index, that is,
investors cannot make more than a fair (required) return using information based on
historic price movement. Stock market share index
The Stock Market is one of the most closely observed economic phenomenons in the
world. Market indicators meet the demand for measures of stock market performance.
Such indicators quantify movements in stock market prices, and act as a standard in
evaluating the returns on money invested in the stock market. Stock market indices as
aggregate measures are an instrument to meet the information requirement of investors by
characterizing the development of global markets and specified market segments
(descriptive function). Presently, In Kenyan stock market, that is, the Nairobi Stock
Exchange, two major indices are used, that is, Nairobi Stock Exchange, NSE 20 share
index reconciled from previously used NSE Share Index (1966=100) and its compliment,
the NSE All Share Index, NASI introduced on 25th February 2008, backdated to 1st
January 2008 to replace AIG (EA) 27 Share Index. Index numbers are applied in the
measurement of movements at the stock market. An Index number effectively
summarizes hundreds of price movements. There are both price and volume index. The
volume of shares traded might be as important as the change in a market index since

5
substantial price increases and decreases are often accompanied by heavy trading activity.
(Obtained from NSE website)
1.2 Statement of the problem
Market efficiency has been and is likely to continue to be a matter of intense debate in
investment community. Economists agree that it is desirable to see that capital is
channeled to places where it will do most good, in which case, a reasonable goal is to
encourage the establishment of allocatively efficient markets in which the firms with the
most promising investment opportunities have access to needed funds at affordable costs.
This is ensured by informationally efficient markets.
In efficient market, actual price of a security will be a good estimate of its intrinsic value
(an equilibrium price) which depends on the earning potential of the security. The earning
potential of the security depends on such fundamental factors as the quality of
management, the outlook of the industry, reported profits and general economic
conditions prevailing at that time.
Empirical studies on random walk theory based on developed markets (Lo and
Mackinlay, 1988; Pan et al, 1991; Kim et al, 1991; Koh and Goh, 1994; Campbell, 1997;
Mobarek and Keasey, 2000 and Abraham et al, 2002) have yielded mixed findings. For
example, Lo and Mackinlay (1988) found a positive autocorrelation for weekly holding
period returns not only for the entire sample but also for all sub-periods. Pan et al (1991)
applied variance ratio test on daily and weekly returns for a five year sample period in
Taiwan, Hongkong, Japan, South Korea and Singapore. They rejected the null hypothesis
of randomness for both daily and weekly returns for Singapore, South Korea and Japan.

6
Koh and Goh (1994) tested the random walk hypothesis on Malaysian stock indices. The
results revealed that Malaysian stock market followed random walk in the long run.Grieb
and Geyes (1999) employed variance ratio on weekly stock returns to re-examine the
Brazilian market which indicated evidence in favour of the random walk.
The study of rejection of random walk in the share price due to mean reverting tendency
which is a consequence of persistence of one sided volley in share price was first
presented by De Bondt and Thaler (1985). The presence of mean reverting tendency and
absence of random walk in United States stocks was confirmed by studies of Poterba and
Summers (1988) and De Bondt and Thaler (1989). The rejection of the random walk
model by Lo and Mackinlay (1988) was mainly due to behavior of small stocks. But this
could not be attributed entirely to the effect of the infrequent trading on time varying
volatilities. They used simple specification test based on variance estimators to prove that
stock market did not follow a random walk. Fama and French (1988) who discovered that
for the USSM, 40% of the variations of longer holding period returns were predictable
from the information on past returns.
A study conducted by Sunde and Ziwanomoyo (2008) in Zimbabwe stock Exchange,
ZSE found that using monthly data from January 1998-November 2006, ZSE did not
follow a random walk and therefore was not efficient in the weak form. This meant that
past prices had an influence in the determination of future prices and this provided an
opportunity for out-performance by skillful financial managers and investment
specialists. During the period studied investment analysts and managers of companies
were able to take advantage of these investment opportunities to make abnormal returns
from the ZSE.

7
Presently, in Kenya, some Investment advisors basically employ technical analyst
approach in advising their clients. This is in contrast to the random walk theory as
advocated by efficient market hypothesis where successive price changes in individual
securities are independent, implying that a series of stock prices changes has no memory,
that is, past history of the series cannot be used to predict the future in any meaningful
way.
From the foregoing, empirical analysis of random walk has been conducted in various
stock markets globally to establish whether they conform to efficient market hypothesis.
Despite Dickinson and Muragu (1994) findings that Nairobi stock Exchange amongst
other emerging stock market is efficient stock markets, yet it is generally assumed that
the emerging markets are less efficient than the developed markets.
Kangila (2007) used correlation coefficient that is by definition a measure of degree of
linear relationship between any two variables. Correlation analysis is non directional and
only considers relationship as the critical aspect. It does not give a clear indication as to
whether dividend declared is the best independent variable (Economic Plausibility). The
presence of correlation between two variables does not necessarily mean that there is a
cause and effect on the relationship between the two variables. Correlation only implies
that the variables move together in the same direction (positive correlation) or opposite
direction (negative correlation). There is need to employ a better method of analyzing
whether share prices depends on the previous day’s trading at NSE. The variance ratio
derived from regression analysis will be used in this study.
There has been no consensus on whether random walk applies in the stock exchange.
There existed a gap hence continuous research on this area to reach an ultimate

8
conclusion about the level of efficiency of less developed market is necessary. It was
therefore necessary to conduct such analysis at the Nairobi stock Exchange, NSE.
It was on the strength of this background that the study sought to empirically test whether
NSE indices follow random walk or not. The study sought to establish whether NSE
conforms to the efficient market hypothesis or not.
1.3 Research objective
To empirically test Random Walk model for NSE indices.
1.4 Importance of the study
This study will empirically test whether NSE share indices follow a random walk to
establish whether NSE conforms to efficient market hypothesis or not. If the NSE will be
found to follow a random walk, then it will be classified as efficient market in the weak
form a developing economy. This study will be significant to the following stakeholders:
Corporate Managers of Multi-national companies
The corporate Managers of Multi-National Companies interested in trading their shares at
NSE, will make informed decisions in relation to their share prices, which cannot be
predicted using a forecasting model or any historical data because random walk has no
memory.
Capital Market Authority (CMA)
Capital Market Authority (CMA) being a regulatory body will be able to make better
policies in order to regulate the players in the Capital Market Sector e.g. Stock brokers,
bond traders and other interested parties in the NSE.

9
The Government of Kenya
The Ministry of Finance will be in a position to plan well especially in the area of
privatization. When the Government is planning to off load its shares from public
parastatal, will have detailed information about the financial market and the expected
selling price of her shares.
The Academics
There is very little literature in relation to random walk especially in the developing
countries. This research thus aims at shading more light in this field and forms the basis
for further research on this subject. It will also help the academics to use this study as an
example when teaching random walk theory.

10
CHAPTER TWO LITERATURE REVIEW
2.0 Introduction
This chapter reviews prior studies, highlights issues that are related to this study. In
addition it also reviews theories related to the study and discusses the conceptual
framework, which help to appreciate the idea behind the study. This section will thus be
discussed under the following subheadings as follows:
2.1Theoretical Literature
2.1.1The Genesis of random walk in stock prices
Brealey et al (1995) points out that the idea of stock market following random walk was
first suggested by a British statistician Maurice Kendall in 1953 in a conference held by
the Royal Statistical society in London to discuss his paper titled; the analysis of
economic time series part one with the subject of discussion being the behavior of stock
and common prices. This, he came up with, after having looked for regular price cycles in
stock, but to his surprise he could not find them. Fama(1960)persuasively made the
argument that in an active market that includes many well informed and intelligent
investors securities will be appropriately priced and reflect all available information. If a
market is efficient no information or analysis can be expected to result in outperformance
of an appropriate benchmark.
2.1.2Theory of efficient market hypothesis
Levich (1998) asserts that the classical definition of efficient market was formally
developed by Eugene Fama in 1970. He defined an efficient capital market as one in

11
which prices in the market fully reflects available information. If this condition is
satisfied, market participants can not earn more above-average returns without accepting
above average risks (Malkiel, 2003,) that is, unusual, or risk-adjusted profits on the basis
of available information. According to this, a stock market is seen as more efficient the
faster market relevant information is incorporated into assets prices. Under fully efficient
markets, past information should not affect returns in present period (Fratzscher, 2002).
Market efficiency does not mean that the market price of a stock should equal the true
value of the stock. What it means is that errors in the market price, that is, over or under
valued of the true value, should be unbiased and randomly deviated. Based on this
argument, the existence of random deviation prevents investors from finding those over
or undervalued stocks.
2.1.3 The Dumb Agent Theory
States that many people making individual buying and selling decisions will better
reflect true value than any one individual can. In finance this theory is predicated on the
efficient-market hypothesis (EMH). One of the first instances of the Dumb Agent Theory
in action was with the Policy Analysis Market (PAM); a futures exchange developed by
DARPA. While this project was quickly abandoned by the Pentagon, its idea is now
implemented in futures exchanges and prediction markets such as Intrade, Newsfutures
and Predictify.
While first mentioned strictly by name in relation to PAM in 2003, the Dumb Agent
Theory was originally conceived (as the Dumb Smart Market) by James Surowiecki
(1999). Here, Surowiecki differentiated from the EMH stating that it "doesn't mean that

12
markets are always right." Instead, he argues that markets are subject to manias and
panics because "people are always shouting out" their stock picks. This, in turn, results in
other investors worrying about these picks and become influenced by them, which
ultimately drives the markets (irrationally) up or down. His argument states that if market
decisions were made independently of each other, and with the sole goal of being correct
(as opposed to being in line with what others are choosing), then the markets would
produce the best choice possible and eliminate biases such as Groupthink, the
Bandwagon effect and the Abilene Paradox.
2.2 Empirical studies
2.2.1 Empirical evidence of independence
Over the years a number of empirical tests of the random-walk theory have been
performed. The main concern of empirical research on the random-walk model has been
to test the hypothesis that successive price changes are independent, that is, successive
price changes are generally random and that the correlation between stock prices from
one day to the next day is virtually zero. Brealey et al (1995), Points out that historical
path of prices gives no useful information about the future – just as a long series of
recorded heads and tails gives no information about the next coin toss. Pandey, (2006)
asserts that most empirical tests have shown that there exists serial independence between
the security prices over time, implying that share prices behave randomly.
Brealey et al (1995) asserts that researchers have looked at many different stocks in many
different countries and for many different periods; they have calculated the correlation

13
coefficient between these prices change, they have looked for runs of consistently
positive or negative price changes, and they have simulated mechanical trading rules that
try to exploit trends or cycles in stock prices. With remarkable unanimity researches have
concluded that there is little information in sequence of past stock price changes.
Two different approaches have been followed. First, there is the approach that relies
primarily on common statistical tools such as serial correlation coefficients and analyses
of runs of consecutive price changes of the same sign. If the statistical tests tend to
support the assumption of independence, one then infers that there are probably no
mechanical trading rules or chartist techniques, based solely on patterns in the past
history of price changes, which would make the expected profits of the investor greater
than they would be with a simple buy-and-hold policy. The second approach to testing
independence proceeds by testing directly different mechanical trading rules to see
whether or not they provide profits greater than buy-and-hold (Mishkin, 2004). Research
to date has tended to concentrate on the statistical approach to testing independence since
its results has been consistent and impressive.
The random walk model was first developed by Bachelier in 1900 in which he asserted
that the successive price change between two periods is independent with zero mean and
its variance is proportional to the interval between two time periods. Accordingly, the
variance of weekly changes should be five times the variance of daily changes (assuming
the market remains closed on the weekends-like in NSE).This concept is exploited in the

14
variance ratio test which has been widely used to test the random walk hypothesis various
markets.
Lo and Mackinlay (1988) found a positive autocorrelation for weekly holding period
returns not only for the entire sample but also for all sub-periods. Pan et al (1991) applied
variance ratio test on daily and weekly returns for a five year sample period in the five
ASMs namely; Hong Kong, Japan, Singapore, South Korea, and Taiwan. They rejected
the null hypothesis of randomness for both daily and weekly returns for Korea, Singapore
and Japan. The null hypothesis for Hong Kong daily return index and the Taiwan weekly
return index was also rejected. Their result indicated that all the returns based on the five
market indices were positively auto correlated except for Japan. Kim et al (1991)
examined the random walk process of stock prices by using weekly and monthly results
in five Pacific-basin stock markets. The findings provided evidence that the mean
reversion was only a phenomenon of the pre World War II period and not a feature of the
post-war period. They found that the variance ratio tests produced positive serial
correlation.
Dickinson and Muragu (1994) found efficient stock markets in several emerging markets
(Kuwait, Greece and Nairobi). Koh and Goh (1994) tested the random walk hypothesis
by extending the framework of Cochrane (1988) on Malaysian stock indices. The results
revealed that Malaysian stock market followed random walk in the long run. Campell
(1997) used variance decomposition method for stock return and concluded that the
expected stock returns changes through time in a fairly persistent fashion. Grieb and
Geyes (1999) employed variance ratio on weekly stock returns to re-examine the
Brazilian market which indicated evidence in favor of the random walk

15
For retail investor, tests of the Alexander filter technique used by chartists tend to support
the random-walk model.
2.2.2Empirical evidence against independence
Various studies have rejected the random walk despite its exhibition in many markets.
One of the earliest studies that focused on the Middle East was done by Butler and
Malaikah (1992). They examined the behavior of individual stock returns in two stock
markets, Saudi Arabia and Kuwait, over the period 1985-1989. They used serial
correlation and run several tests to evaluate the weak form of efficiency in these two
stock markets. The study tried to investigate the similarities and dissimilarities of these
stocks, regarding exchange mechanisms and efficiency. They concluded that institutional
factors contribute to operational inefficiency in Saudi Arabia stock market and less
pronounced but significant autocorrelations for many Kuwait stocks similar to other
thinly traded markets. Another study, by Al-Loughani (1995), used different statistical
techniques on the Kuwait market index; it concluded that this index does not follow
random walk as it shows signs of stationarity.
Maborek and Keasey (2000), in their study to study seeks evidence supporting the
existence of at least weak-form efficiency of the Dhaka Stock Exchange (DSE), used
sample which included the daily price indices of all the listed securities on the DSE for
the period of 1988 to 1997. The hypothesis of their study was whether the Dhaka Stock
Market is weak form efficient. The results of both non-parametric (Kolmogrov–Smirnov
normality test and run test) test and parametric test ( Auto-correlation test, Auto-
regression, ARIMA model ) provide evidence that the share return series do not follow
random walk model and the significant autocorrelation co-efficient at different lags reject

16
the null hypothesis of weak-form efficiency. The results were consistent in different sub-
sample observations, without outlier and for individual securities.
A recent study by Abraham et al, (2002) tested the random walk hypothesis (RWH) and
market efficiency hypothesis for three Gulf countries, namely Saudi Arabia, Kuwait and
Bahrain. Their results could not reject the RWH for Saudi and Bahraini markets, while
the Kuwaiti market fails to follow a random walk, which means it is inefficient.
The study of rejection of random walk in the share price due to mean reverting tendency
which is a consequence of persistence of one sided volley in share price was first
presented by De Bondt and Thaler (1985). The presence of mean reverting tendency and
absence of random walk in United States stocks was confirmed by studies of Poterba and
summers (1988) and De Bondt and Thaler (1989). The rejection of the random walk
model by Lo and Mackinlay (1988) was mainly due to behavior of small stocks. But this
could not be attributed entirely to the effect of the infrequent trading on time varying
volatilities. They used simple specification test based on variance estimators to prove that
stock market did not follow a random walk. Farma and French (1988) who discovered
that for the USSM, 40% of the variations of longer holding period returns were
predictable from the information on past returns.
The variance ratio test was proposed by Lo and Mackinlay in 1988 to test random walk
hypothesis. The study compared various estimators derived from data at various levels of
frequency for weekly stock market return in the NYSE and ASE for a period of over
thirty-two years. They improved the variance ratio statistics by taking overlapping
periods and corrected the variance used in estimating the statistics for bias. They also

17
proposed a test statistics Z*, which is robust under the heteroscedastic random walk
hypothesis, hence can be used for a longer time series analysis. They conducted an
extensive Monte–Carlo simulation to find out the size and power of variance ratio test in
infinite samples. They identified that the variance of random walk increments was linear
in all sampling intervals. Their finding provided evidence to reject the random walk
model for the entire sample period of 1962 to 1985 and for all sub periods for a variety of
aggregate return indices and size sorted portfolios. Studies based on the Lo and
Mackinlay’s simple volatilities based on specification test have indicated a rejection of
random walk in the stock market of developing countries and newly developed countries
as well. The rejection of the random walk model by Lo and Mackinlay was mainly due to
the behavior of small stocks. But this could not be attributed entirely to the effect of
infrequent trading or time-varying volatilities. They used sample specification tests based
on variance estimator to prove that stock prices did not follow a random walk.
Ayadi and Pyun (1994) showed that SKM does not follow random walk when tested
under homoskedastic error term assumption and follow random walk when the test
statistics is corrected for heteroskedasticity. Madhusoodanan (1998) used variance ratio
test to find out the temporary and permanent component in the ISM. The study based on
industry wise indices concluded that in general ISM is mean reverting. In his further
study, he concluded that if random walk hypothesis cannot be accepted by BSE
sensitivity index and BSE national index then heteroskedasticity does not seem to play an
important role in ISE. Grieb and Geyes (1999) employed variance ratio on weekly stock
returns to re-examine the Mexican stock markets. The findings indicated that non-random
behavior in the Mexican market. Ramasastri (1999) tested Indian Stock Market for

18
random walk during the post liberalization period using three Dickey-Fuller hypotheses.
Contrary to the other studies he could not reject the null hypothesis that the stock prices
are random walk.
Parameswaran (2000) performed variance ratio test corrected for bid –ask spread and
non-synchronous trading on the weekly returns derived from CRSP daily returns file for
the period of twenty-three years. His results show that eight out of ten size sorted
portfolios do not follow random walk. He observed that non-trading is not a source of
serial correlation in the large sized firms. Ming et al (2000) showed that variance ratio
and the multiple variance ratio tests rejects the random walk for Kuala-Lampa stock
exchange. They further showed that trading rules like VMA and FMA have predictive
ability of earning profit over and above the transaction cost. Darrat and Zhong (2000)
examined random walk hypothesis for two newly created stock exchanges in China. They
rejected the random walk in newly created Chinese stock exchange. They further
suggested ANN based models as strong tools for predicting prices in the stock exchanges
of developing countries.
Chaudhuri and Wu (2003) implemented the Zivot and Andrews (1992) endogenous one
break test to examine the random walk hypothesis in seventeen emerging markets. They
found that for ten markets, the null hypothesis of a random walk can be rejected at 1%
and 5% significance level.
In a study to investigate the efficiency of the Karachi stock exchange (KSE) with
corrections for thin trading and non-linearity as suggested by Miller, Muthuswamy and
Whaley (1994), daily, weekly, and monthly data on stock prices from December 1991 to

19
May 2003 were used, with three non-overlapping periods (December 1991 to May 1998;
May 1998 to September 2001; and September 2001 to May 2003) and one combined
period (May 1998 to May 2003). The results indicated that the Karachi stock Market is
efficient for the overall period, the three sub-periods, and the combined period in linear
and non-linear behavior after making adjustments for thin trading. The same result was
observed when the efficiency test is conducted on weekly and monthly data after
adjusting for thin trading during the overall study period.
Gupta (2007) tested the weak form efficiency in the framework of random walk
hypothesis for the two major equity markets in India, that is, Mumbai (formerly known as
Bombay) stock exchange and National stock exchange for the period 1991 to 2006. The
evidence suggested that the series do not follow random walk model and there is an
evidence of autocorrelation in both market.
Raihan and Ullah (2008), in their study, in Bangladesh searched for evidence supporting
the existence of at least weak-form efficiency of the Chittagong Stock exchange, CSE.
The sample they used included the daily price indices of all the listed securities on the
CSE for the period of 10/10/1995 to 19/01/2004. The hypothesis of the study was
whether the Chittagong Stock Market is weak form efficient. The results of parametric
test – auto-correlation test, auto-regression & ARIMA model – provide evidence that the
share return series do not follow random walk model and the significant autocorrelation
co-efficient at different lags reject the null hypothesis of weak-form efficiency.
A study conducted by Sunde and Ziwanomoyo (2008) in Zimbabwe stock Exchange,
ZSE found that using monthly data from January 1998-November 2006, ZSE did not
follow a random walk and therefore was not efficient in the weak form. This meant that

20
past prices had an influence in the determination of future prices and this provided an
opportunity for out-performance by skillful financial managers and investment
specialists. During the period studied investment analysts and managers of companies
were able to take advantage of these investment opportunities to make abnormal returns
from the ZSE.
In the 9th International academy of African Business and Development conference held at
the University of Florida, USA between 20th to 24th may 2008, Frimpong and Oteng-
Abayie presented a paper they researched on Ghana Stock exchange titled; Market
Returns and Weak-Form Efficiency: The Case of the Ghana Stock Exchange. Their paper
examined the weak-form efficient market hypothesis (EMH) in the case of the Ghana
Stock Exchange (GSE) as an emerging market. Daily returns from the Databank Stock
Index (DSI) over a 5-year period 1999-2004 were used for the exercise. Random walk
(RW) and GARCH (1, 1) models are used as the basis for the analysis. The GSE DSI
returns series exhibit volatility clustering, an indication of inefficiency on the GSE. The
weak-form efficient market (random walk) hypothesis was rejected for the GSE, meaning
that the market is inefficient. The inefficient market has important implications for
investors, both domestic and international. Knowledge of profitable arbitrage
opportunities due to market predictability serves to attract investors to diversify from
more efficient markets to invest on the GSE bourse to increase their returns.
For a long time the empirical testing of the efficient market hypothesis was based on the
rejection of forecastability of asset returns. Ability of any model to predict future stock
price fairly accurately itself proves that the market does not follow random walk. The

21
studies based on technical analysis and neural network disapprove random walk
hypothesis by providing that future prices can be accurately forecasted. Mitra (2000)
developed ANN model based on past stock prices as parameters and showed that network
performs very well in forecasting the criteria of unforecastability of stock prices in BSE.
In general, the results of previous research evidence that the market of developed
economies are generally weak form efficient. That means the successive returns are
independent and follow random walk. On the other hand, the research findings on the
market of developing and less developed countries are controversial. Some of the
researcher find evidence of weak form efficiency and cannot reject the random walk
hypothesis in emerging markets.
2.3 Common Predictive Techniques
The two approaches usually used to predicting stock prices that are espoused by market
professionals are chartist or technical theories and the theory of fundamental or intrinsic
value analysis. These theories are really the province of the market professional and, to a
large extent, of teachers of finance. Historically, however, there has been a large body of
academic people, primarily economists and statisticians, who subscribe to a radically
different approach to market analysis-the theory of random walks in stock market prices.
Random-walk theorists usually start from the premise that the major security exchanges
are good examples of efficient market.

22
2.3.1Chartist or technical theories
The basic assumption of all the chartist or technical theories is that history tends to repeat
itself, that is, past patterns of price behavior in individual securities will tend to recur in
the future. Thus the way to predict stock prices (and, of course, increase one’s potential
gains) is to develop a familiarity with past patterns of price behavior in order to recognize
situations of likely recurrence. Chartists can approach this in two ways that is,
determining the existence of predictability using past return series or price information or
use technical trading rules if they can be exploited as profit making strategy.
Brealey, et al. (1995) asserts that Technical analysts try to get rich by looking for patterns
in stock prices. The success of some of them is credited to luck and good judgment, not
to technical trading rules because technical trading rules are useless when stock prices
follow a random walk. Technical analysts can however help keep the market efficient
since they identify misplaced stock hence their trading would extinguish any predictable
patterns in stock prices. However, whether any trading rule is profitable depends largely
on the operating cost (such as brokerage cost, interest cost, trading settlement procedure)
and on whether transactions can be made at the exact prices quoted in the market.
Essentially, then, chartist techniques attempt to use knowledge of the past behavior of a
price series to predict the probable future behavior of the series by using charts of
previous stock prices and trading volumes (most commonly bar charts indicating a
security’s high price, low price and closing price for the day) to pick stock investments.
A statistician would characterize such techniques as assuming that successive price
changes in individual securities are dependent. That is, the various chartist theories

23
assume that the sequence of price changes prior to any given day is important in
predicting the price change for that day.
2.3.2 Fundamental or intrinsic value analysis.
The assumption of the fundamental analysis approach is that at any point in time an
individual security has an intrinsic value (an equilibrium price) which depends on the
earning potential of the security. The earning potential of the security depends on such
fundamental factors as quality of management, outlook for the industry and the economy,
and many others. The fundamental price of stock may fluctuate because of the
expectation about the dividend may change and the required rate of return may change. A
combination of these two factors enables the calculation of the warranted price. Through
a careful study of these fundamental factors the analyst should, in principle, be able to
determine whether the actual price of a security is above or below its intrinsic value. If
actual prices tend to move toward intrinsic values, then attempting to determine the
intrinsic value of a security is equivalent to making a prediction of its future price; and
this is the essence of the predictive procedure implicit in fundamental analysis. In an
efficient market at any point in time the actual price of a security will be a good estimate
of its intrinsic value. Now in an uncertain world the intrinsic value of a security can never
be determined exactly. Thus there is always room for disagreement among market
participants concerning just what the intrinsic value of an individual security is, and such
disagreement will give rise to discrepancies between actual prices and intrinsic values. In
an efficient market, however, the actions of the many competing participants should
cause the actual price of a security to wander randomly about its intrinsic value. If the
discrepancies between actual prices and intrinsic values are systematic rather than

24
random in nature, then knowledge of this should help intelligent market participants to
better predict the path by which actual prices will move toward intrinsic values. When the
many intelligent traders attempt to take advantage of this knowledge, however, they will
tend to neutralize such systematic behavior in price series. Although uncertainty
concerning intrinsic values will remain, actual prices of securities will wander randomly
about their intrinsic values.
2.4 Historic Information
Brealey et al (1995) asserts that the fact that stock prices follow a random walk is
consistent with the notion that they reflect all available historic public information about
a firm and hence you can’t make superior profits just by studying past stock prices since
old news and trends are already impounded in the historic prices and are of no use in
predicting today’s or future stock prices.
2.4.1 New Information
Brealey et al (1995) points out that if prices already reflect all available information
about a firm, then only new information will cause price to change. But new information,
by its nature, is unpredictable and equal likely to make the prospects of the firm seem
rather worse than your current assessment.
Intrinsic values can themselves change across time as a result of new information. The
new information may involve such things as the success of a current research and
development project, a change in management, a tariff imposed on the industry’s product
by a foreign country, an increase in industrial production, or any other actual or
anticipated change in a factor which is likely to affect the company’s prospects. When
25
new information is released about a firm, expectation about the firm and the prices
changes (Mishkin, 2004). New information can cause changes in expectation about the
level of future dividends or the risk of those dividends. In an efficient market, on the
average, competition will cause the full effects of new information on intrinsic value to
be reflected instantaneously in actual prices.
However, because there is vagueness or uncertainty surrounding new information,
instantaneous adjustment really have two implications. First, actual prices will initially
over adjust to changes in intrinsic values as often as they will under adjust. Second, the
lag in the complete adjustment of actual prices to successive new intrinsic values will
itself be an independent, random variable, with the adjustment of actual prices sometimes
preceding the occurrence of the event which is the basis of the change in intrinsic values
(that is, when the event is anticipated by the market before it actually occurs) and
sometimes following. This implies that the instantaneous adjustment property of an
efficient market means that successive price changes in individual securities will be
independent. A market where successive price changes in individual securities are
independent is, by definition, a random-walk market. Most simply the theory of random
walks implies that a series of stock price changes has no memory-the past history of the
series cannot be used to predict the future in any meaningful way. The future path of the
price level of a security is no more predictable than the path of a series of cumulated
random numbers. It is unlikely that the random-walk hypothesis provides an exact
description of the behavior of stock-market prices.
26
The independence assumption of the random-walk model is valid as long as knowledge
of the past behavior of the series of price changes cannot be used to increase expected
gains. More specifically, if successive price changes for a given security are independent,
there is no problem in timing purchases and sales of that security. A simple policy of
buying and holding the security will be as good as any more complicated mechanical
procedure for timing purchases and sales. This implies that, for investment purposes, the
independence assumption of the random-walk model is an adequate description of reality
as long as the actual degree of dependence in series of price changes is not sufficient to
make the expected profits of any more sophisticated mechanical trading rule or chartist
technique greater than the expected profits under naive buy-and-hold policy.
2.5 The interaction between weak form market efficiency and
the emerging markets
A few studies conducted on the test of efficient market hypothesis (EMH) in emerging
markets compared to the volume of studies published on the developed market. It is
generally assume that the emerging markets are less efficient than the developed market.
The definition of emerging market is highlighted on the growth potentiality as well as
rapid growth of size of the market. However, it is not unlikely that the market participants
are not well informed and behaving irrational compare to well organize markets. The
causes of lack of financial development especially in capital markets are due to certain
market imperfection such as transaction costs, lack of timely information, cost of
acquiring new information, and possibly greater uncertainty about the future [Taylor
(1969); Goldsmith (1971); Marson (1972); Wai and Patrick (1973)]. The different
researchers define the emerging market in different ways.

27
Samuel’s (1981), who asserts the nature of the emerging market in terms of information
availability such as follows: Prices cannot be assumed to fully reflect all available
information. It cannot be assumed that investors will correctly interpret the information
that is released. The corporation has greater potential to influence its own stock market
price and there is a greater possibility that its price will move about in a manner not
justified by the information available.
Emerging markets are also defined in terms of policy-making decisions such as follows:
A realization of inefficiencies inherent in command and control policies and the tighter
lending policies of international creditors have led the developing countries to re-define
the role of domestic equity markets in their economies. Most countries have adopted
policies that make the allocation of equity capital more responsive to market forces.
These policy changes have resulted in remarkable growth in the size of the equity
markets in the developing world, commonly known as Emerging Stock Markets (ESMs).
And with this open market policy, in the emerging markets speculations are common;
large investors can easily speculate the market. As a less organized market without
market makers and timely available information, there is always a possibility to make
profit by large investors and insiders. The ability to predict stock price changes based on
a given set of information lies behind the notion of stock market efficiency. The lower the
market efficiency, the greater the predictability of stock price changes.
2.6 Criticism of random walk
Although the statistical technique is a common tools used in testing independence, the
chartist or technical theorist probably would not consider it adequate. Chartists would not
consider either serial correlations or runs analyses as adequate tests of whether the past

28
history of series of price changes can be used to increase the investor’s expected profits.
The simple linear relationships that underlie the serial correlation model are much too
unsophisticated to pick up the complicated patterns that the chartist sees in stock prices.
Similarly, the runs tests are changes, regardless of the size of the price change that causes
the change in sign. The chartist would like to have a more sophisticated method for
identifying movements, a method which does not always predict the termination of the
movement simply because the price level has temporarily changed direction much too
rigid in their manner of determining the duration of upward and downward movements in
prices. In particular, in runs testing, a run is considered as terminated whenever there is a
change in sign in the sequence of successive price.
One such technique used by chartists is Alexander’s filter technique, which is an attempt
to apply more sophisticated criteria to the identification of moves. Although the filter
technique does not correspond exactly to any well-known chartist theory, it is closely
related to such things as the Dow Theory. Thus, the profitability of the filter technique
can be used to make inferences concerning the potential profitability of other mechanical
trading rules.
2.7 Conceptual framework
Alexander, et al. (1989) points out that in most efficient market the future price will be
totally random and the price formation can be assumed to be a stochastic process. This
study will adopt a random walk with a drift. Kennedy (1996) points out that Nelson and
Plosser (1982) is a seminar study claiming that macroeconomic data are better
characterized as a random walk with a drift than as a stationary with a time trend. This
model assumes that present period stock price is equal to a fixed drift in the price change
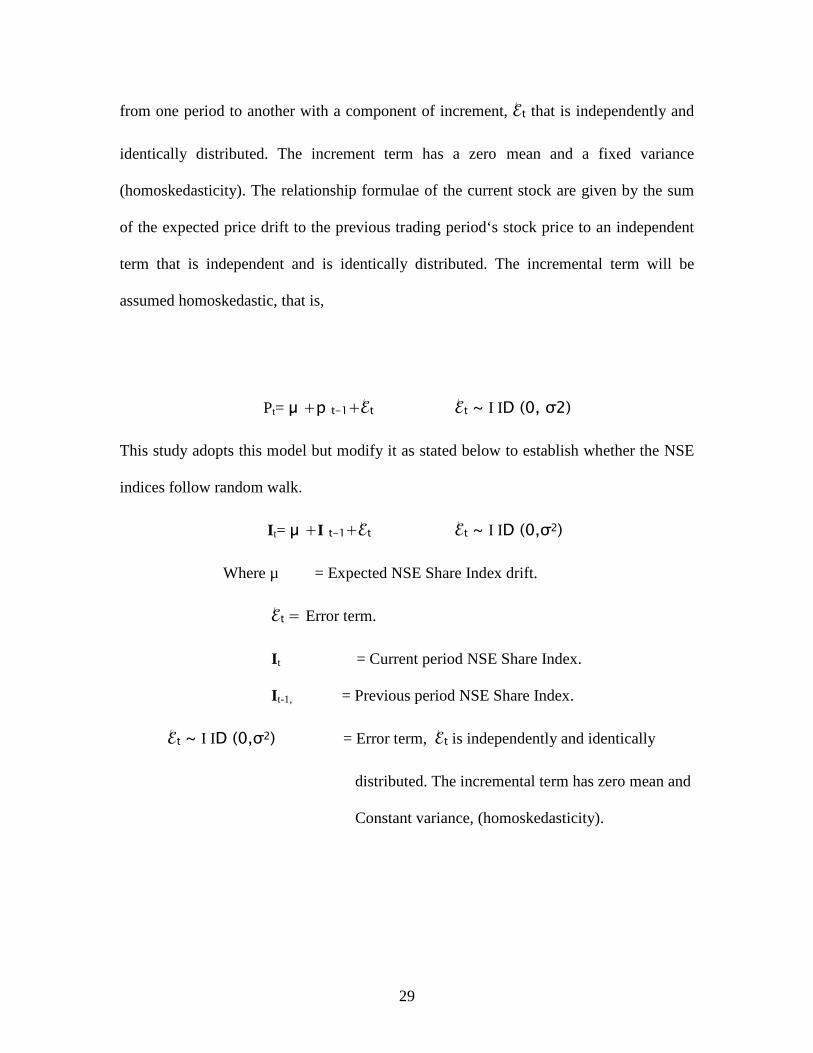
29
from one period to another with a component of increment, ℰt that is independently and
identically distributed. The increment term has a zero mean and a fixed variance
(homoskedasticity). The relationship formulae of the current stock are given by the sum
of the expected price drift to the previous trading period‘s stock price to an independent
term that is independent and is identically distributed. The incremental term will be
assumed homoskedastic, that is,
Pt= � +p t-1+ℰt ℰt ~ І ID (0, σ2)
This study adopts this model but modify it as stated below to establish whether the NSE
indices follow random walk.
I t= � +I t-1+ℰt ℰt ~ І ID (0,σ2)
Where µ = Expected NSE Share Index drift.
ℰt = Error term.
I t = Current period NSE Share Index.
I t-1, = Previous period NSE Share Index.
ℰt ~ І ID (0,σ2) = Error term, ℰt is independently and identically
distributed. The incremental term has zero mean and
Constant variance, (homoskedasticity).

30
CONCEPTUAL FRAMEWORK
(Dependent variable) (Independent Variables)
2.8 Conclusion from Literature Review
Several studies have been done in relation to the applicability of random walk theory in
different stock exchange.Lo and Mackinlay (1988) found out that a positive
autocorrelation for weekly holding period returns, indicating that random walk exists in a
developed economy. Pan et al (1991) rejected the null hypothesis of randomness for
Korea, Singapore and Taiwan. Dickson and Muragu (1994) found efficient stock market
in Kuwait, Greece and Nairobi.
Butler and Malaikah(1992) concluded that institution factors contribute to operation
inefficiency in Saudi Arabia stock, Al-Loughani(1995) in his study noted that price index
does not follow random walk in Kuwait as he used different statistical techniques. Sunde
and Ziwanomoyo(2008) concluded that ZSE did not follow a random walk and therefore
was not efficient in the weak form.
In general, the results of previous research evidence that the market of developed
economies are generally weak form efficient, the successive returns are independent and
Previous day Price index
Other independent (random) variables
Share price

31
follow random walk. On the other hand, the research findings on the market of
developing and less developed countries are controversial. There seems to be no
agreement as to whether random walk theory applies or not. Currently no study has been
done in Kenyan market to give a conclusive result. This study differs from the rest in that
it relates to Kenyan Scenario.
32
CHAPTER THREE RESEARCH METHODOLOGY
3.0 Introduction
This chapter covers the research design and methodology that was used in the study. It
discusses the population from which the firms studied were obtained from and how the
data used in this study was collected and analyzed.
3.1 Research Design
The research was descriptive and was based on a case study of Nairobi stock Exchange.
The study was useful in studying in-depth the randomness of the variables already
mentioned in the theoretical framework to test whether Nairobi stock exchange indices
follows random walk model. The variables were known and well defined. The design was
adopted as it allows collection of large amounts of data from the target population.
3.2 The target population
The study population comprised of the fifty five companies quoted at the Nairobi Stock
Exchange for operational period 1st January 2008 to 30th April 2009 for NASI. Also for
the fifty five listed companies at Nairobi Stock Exchange, another population of twenty
companies forming the NSE 20 share index will be tested for operational period; 1st
March 2004 to 30th April 2009, to give a better comparison for the two sets of population.
The period was selected as it captures both times of improved growth and decline of
growth in the Kenyan economy. The existence of available data for NSE 20 share index
for a long period of time is an added advantage for this study. NASI replaced AIG (EA)
27 Share Index as a compliment of NSE 20 Share Index with effect from 1st January

33
2008. NASI is a comprehensive and complementary index designed to represent
investors’ expectations of the future performance of all listed companies.
3.3 Sample
There was no sample to be taken since the study was based on the entire qualifying
population.
3.4 Data type and Collection Techniques
The study used secondary data. NSE 20 Share indices and NASI running from 1st March
2004 to 30th April 2009 and 1st January 2008 to 30th April 2009 respectively, collected
from NSE daily index return files, daily newspapers and Internet.
3.5 Data Analysis
Variance ratio test of NSE 20 share index and NASI at q lag and corresponding Z –
statistics for different specification of the error ℰt term behavior between the operational
periods; 1st March 2004 to 30th April 2009 and 1st January 2008 to 30th April 2009
respectively was used .The variance ratio at lag q is the ratio of the variance of q-periods'
return to the variance of the one period return divided by q, which is a unity under
random walk hypothesis, that is, VR=Var [rt(q)] / (q. Var [vt ]) =1. This is the null
hypothesis of random walk model. Acceptance of this null hypothesis means conformity
to random walk hence a rejection of null hypothesis for this study.
Lo and Mackinlay, (1988) stated that in a finite sample the increments in the variance are
linear in the observation interval for a random walk. The variance ratio is defined as
VR (q) = σ2c (q) / σ2
γ
Where σ2c (q) = unbiased estimator of 1/q of variance of qth

34
difference of Rt
σ2γ = unbiased estimator of the variance of the first
difference of Rt
After deriving an asymptotic distribution, the Z statistical tests for different specification
of error term, ℰt, behavior will be conducted. Under the random walk hypothesis, the
variance ratio (VR) at lag q for NSE 20 share weekly and monthly indices and NASI
weekly and monthly indices, that is, VR (2), VR (4), VR (8) should have values closer to
one since the variance of increment of a random walk is linear in the sampling interval.
The statistics of interest was the autocorrelation at various orders.

35
CHAPTER FOUR
DATA ANALYSIS, RESULTS AND DISCUSSION
4.0 Introduction
This chapter presents the results of the analysis and findings of the study with reference
to the study objectives. The first section gives a summary of the data analysis method
used. The second part gives the findings of the study, and it includes relevant graphs that
help to explain the results of the data analysis. The last part gives a summary of findings
and interpretations.
4.1 Data Analysis
The variance ratio VR at various lags q for NSE 20 share weekly and monthly indices
and NASI weekly and monthly indices, that is, VR (2), VR (4), VR (8) were determined,
and corresponding Z-statistics for different specification of the error ℰt term behavior
between the sampling periods of 1st March 2004 to 30th April 2009 for NSE 20 share
weekly and monthly indices and 1st January 2008 to 30th April 2009 for NASI were
determined. Derived asymptotic standard normal distribution that takes the following
form was used.
Z (q) = √nq [VR (q)-1]
q-1
∑ [2(q-j)-q] 2δ (j)
j=1
When q=2, that is, q=21 VR (q) - 1 estimates the first order of autocorrelation coefficient
[x t-xt-1] s, thus, if xt s are weekly / monthly indices, then VR (q) =VR (2) approximates

36
the first order autocorrelation of weekly / monthly returns. First order of autocorrelation
coefficient [xt-xt-1] s was critical for decision making in this study, that is, whether to
accept or reject the null hypothesis for random walk model and for the study since the
sample size used to determine the variance ratio tests of the NSE indices at different lags
q was small, that is, nq=270 for NSE 20 share weekly indices for sampling period
between 1st March 2004 to 30th April 2009, nq=68 for NASI weekly indices for sampling
period between 1st January 2008 to 30th April 2009, nq=62 for NSE 20 share monthly
indices for sampling period between 1st March 2004 to 30th April 2009 and nq=16 for
NASI monthly indices for sampling period between 1st January 2008 to 30th April 2009.
Third or higher order of autocorrelation coefficient (that is, when q=8 => q=23 or more)
wasn’t critical in decision making in this study, that is, whether to accept or reject the null
hypothesis for random walk model that the variance ratio has a value of one hence reject
or accept the null hypothesis of this study since higher order of autocorrelation
coefficient are prone to very high deviation more so for data with small sample size
analyzed with variance ratio test. Therefore the variance ratio for NSE indices at lag q
should be equal to unity for random walk model under homoskedastic error term, ℰt,
assumption. Accepting the null hypothesis for random model means rejecting the null
hypothesis for this study.
4.2 TABLES AND ANALYSIS OF RESULTS OF VARIANCE RAT IO
ESTIMATES OF NSE 20 SHARE INDEX AND NASI AT VARIOUS LAG q AND
VALUES FOR Z-STATISTICAL TESTS UNDER HOMOSKEDASTIC ERROR
TERM, ℰt, ASSUMPTION AT 5% LEVEL OF SIGNIFICANCE
Table 4.2.1: Tabulation of the weekly values of the NSE 20 share indices of Nairobi
stock exchange for the null hypothesis of random walk model that the variance ratio

37
has a value of one under homoskedastic error term, ℰt, for the sampling period
between 1st March 2004 to 30th April 2009
Lag
q
Total sample size
Nq
Variance Ratio Estimate
VR(q)
Z-
Statistical
Z(q)
Inference
2 270 0.96 -0.52 NOT rejected at
5%
4 270 1.07 0.80 NOT rejected at
5%
8 270 1.15 1.51 NOT rejected at
5%
16 270 1.41 1.78 NOT rejected at
5%
Source: Survey data (2010)
The table shows that for NSE 20 share weekly indices for q=2, that is, q=21; q=4, that is,
q=22; q=8, that is, q=23; and q=16, that is, q=24, VR (q) - 1 estimated the first, second,
third, and forth order of autocorrelation coefficients respectively and their corresponding
z-statistics to test for different specification of homoskedastic error term, ℰt, for NSE 20
share weekly indices of sample size nq=270 and the results are such that at lag q=2, The
variance ratio estimate for the first order of autocorrelation coefficient, VR(q)=0.96 and
the corresponding Z(q)= -0.52 at 5% level of significance, and since VR(q)=0.96 is
greater than (>) the absolute value of Z(q)= -0.52 , that is, | Z(q) |= | -0.52 |= 0.52, the null
hypothesis for random walk model that the variance ratio of NSE 20 share weekly
indices of the Nairobi stock exchange for the sampling period between 1st March 2004 to
30th April 2009 has a value of one is not rejected at 5% level of significance. Therefore,

38
first order of autocorrelation coefficient estimate of variance ratio of the NSE 20 share
weekly index for Nairobi stock exchange for the period between 1st March 2004 to 30th
April 2009 follows random walk and hence rejects the null hypothesis for this study. The
same applies to the second order of autocorrelation coefficient estimate of variance ratio
for the NSE 20 share weekly indices for the same period where, at lag q=4, VR(q)=1.07
and the corresponding Z (q) = 0.80 at 5% level of significance, and since VR (q) =1.07 is
greater than (>) the value of Z (q) =0.80, the null hypothesis for random walk model that
the variance ratio of NSE 20 share weekly indices of the Nairobi stock exchange for the
sampling period between 1st March 2004 to 30th April 2009 has a value of one is not
rejected at 5% level of significance. At lag q=8, the variance ratio estimate for the third
order autocorrelation, VR (q) =1.15 and the corresponding Z (q) = 1.51 at 5% level of
significance isn’t critical for accepting or rejecting the null hypothesis of random walk
model that the variance ratio of NSE 20 share weekly indices for the sampling period 1st
March 2004 to 30th April 2009 has a value of one since the sample size nq=270 is small
and such a higher order of autocorrelation coefficient estimate for variance ratio are
prone to very high deviation. This means that the first and the second order of
autocorrelation coefficient estimates of VR (q) for NSE 20 share weekly indices under
homoskedastic error term, ℰt, follows random walk hence the null hypothesis for this
study that NSE 20 share index do not follow random walk is rejected.

39
Table 4.2.2: Tabulation of the weekly values of the NASI of Nairobi stock exchange
for the null hypothesis of random walk model that the variance ratio has a value of
one under homoskedastic error term, ℰt, the sampling period between 1st January
2008 to 30thApril 2009
Lag
q
Total sample
size
Nq
Variance Ratio Estimate
VR(q)
Z-
Statistical
Z(q)
Inference
2 68 0.97 -0.35 NOT rejected at
5%
4 68 1.12 0.84 NOT rejected at
5%
8 68 1.30 1.42 NOT rejected at
5%
Source: Survey data (2010)
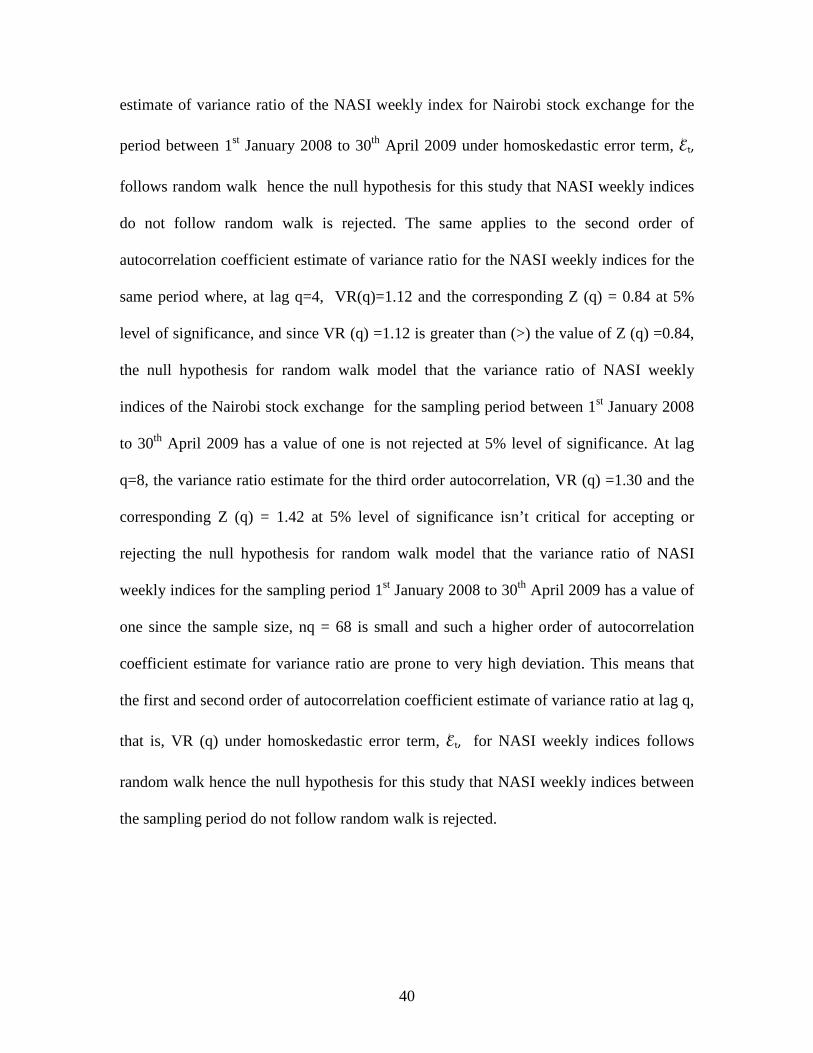
The table shows that for NASI weekly indices for q=2, that is, q=21; q=4, that is, q=22;
and q=8, that is, q=23, VR (q) - 1 estimated the first, second, and third order of
autocorrelation coefficients respectively and their corresponding z-statistics to test for
different specification of the error term, ℰt, for NASI weekly indices of sample size
nq=68 and the results are such that at lag q=2, The variance ratio estimate for the first
order of autocorrelation coefficient, VR(q)=0.97 and the corresponding Z(q)= -0.35 at
5% level of significance, and since VR(q)=0.97 is greater than (>) the absolute value of
Z(q)= -0.35 , that is, | Z(q) |= | -0.35 |= 0.35, the null hypothesis for random walk model
that the variance ratio of NASI weekly indices of the Nairobi stock exchange for the
sampling period between 1st January 2008 to 30th April 2009 has a value of one is not
rejected at 5% level of significance. Therefore, first order of autocorrelation coefficient
40
estimate of variance ratio of the NASI weekly index for Nairobi stock exchange for the
period between 1st January 2008 to 30th April 2009 under homoskedastic error term, ℰt,
follows random walk hence the null hypothesis for this study that NASI weekly indices
do not follow random walk is rejected. The same applies to the second order of
autocorrelation coefficient estimate of variance ratio for the NASI weekly indices for the
same period where, at lag q=4, VR(q)=1.12 and the corresponding Z (q) = 0.84 at 5%
level of significance, and since VR (q) =1.12 is greater than (>) the value of Z (q) =0.84,
the null hypothesis for random walk model that the variance ratio of NASI weekly
indices of the Nairobi stock exchange for the sampling period between 1st January 2008
to 30th April 2009 has a value of one is not rejected at 5% level of significance. At lag
q=8, the variance ratio estimate for the third order autocorrelation, VR (q) =1.30 and the
corresponding Z (q) = 1.42 at 5% level of significance isn’t critical for accepting or
rejecting the null hypothesis for random walk model that the variance ratio of NASI
weekly indices for the sampling period 1st January 2008 to 30th April 2009 has a value of
one since the sample size, nq = 68 is small and such a higher order of autocorrelation
coefficient estimate for variance ratio are prone to very high deviation. This means that
the first and second order of autocorrelation coefficient estimate of variance ratio at lag q,
that is, VR (q) under homoskedastic error term, ℰt, for NASI weekly indices follows
random walk hence the null hypothesis for this study that NASI weekly indices between
the sampling period do not follow random walk is rejected.
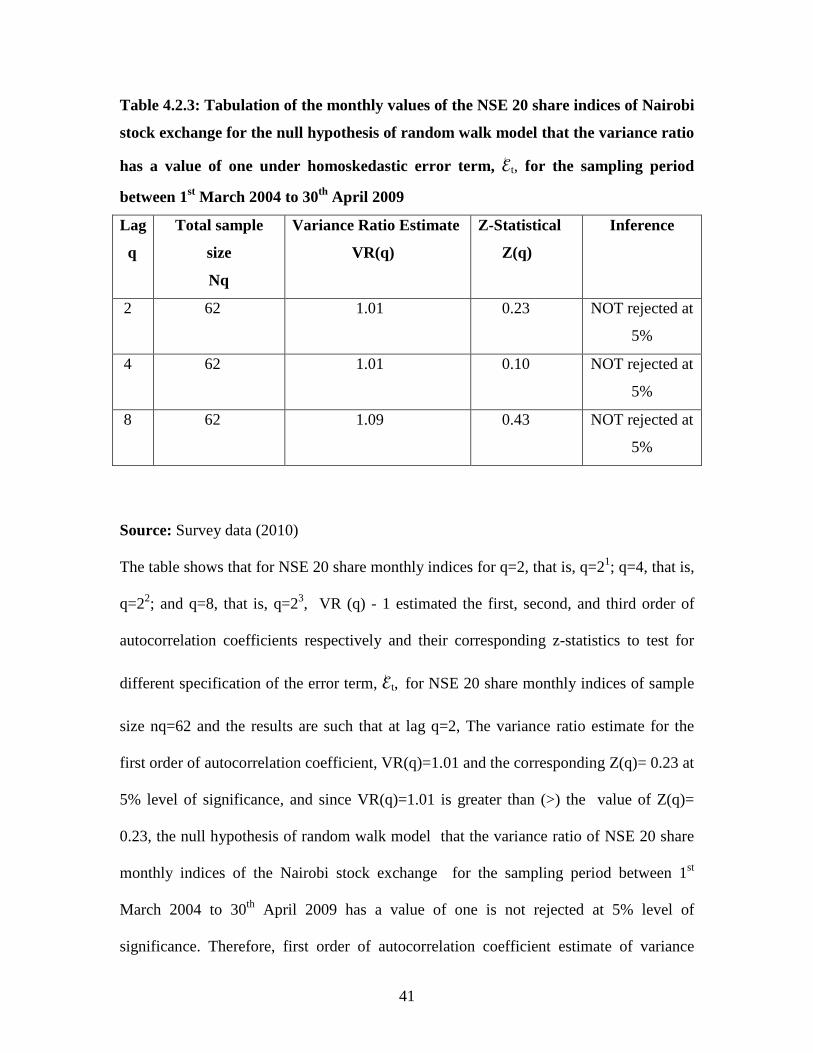
41
Table 4.2.3: Tabulation of the monthly values of the NSE 20 share indices of Nairobi
stock exchange for the null hypothesis of random walk model that the variance ratio
has a value of one under homoskedastic error term, ℰt, for the sampling period
between 1st March 2004 to 30th April 2009
Lag
q
Total sample
size
Nq
Variance Ratio Estimate
VR(q)
Z-Statistical
Z(q)
Inference
2 62 1.01 0.23 NOT rejected at
5%
4 62 1.01 0.10 NOT rejected at
5%
8 62 1.09 0.43 NOT rejected at
5%
Source: Survey data (2010)
The table shows that for NSE 20 share monthly indices for q=2, that is, q=21; q=4, that is,
q=22; and q=8, that is, q=23, VR (q) - 1 estimated the first, second, and third order of
autocorrelation coefficients respectively and their corresponding z-statistics to test for
different specification of the error term, ℰt, for NSE 20 share monthly indices of sample
size nq=62 and the results are such that at lag q=2, The variance ratio estimate for the
first order of autocorrelation coefficient, VR(q)=1.01 and the corresponding Z(q)= 0.23 at
5% level of significance, and since VR(q)=1.01 is greater than (>) the value of Z(q)=
0.23, the null hypothesis of random walk model that the variance ratio of NSE 20 share
monthly indices of the Nairobi stock exchange for the sampling period between 1st
March 2004 to 30th April 2009 has a value of one is not rejected at 5% level of
significance. Therefore, first order of autocorrelation coefficient estimate of variance

42
ratio of the NSE 20 share monthly index for Nairobi stock exchange under
homoskedastic error term, ℰt, for the period between 1st March 2004 to 30th April 2009
follows random walk and hence the null hypothesis for this study that NSE 20 share
monthly index between the sampling period does not follow random walk is rejected. The
same applies to the second order of autocorrelation coefficient estimate of variance ratio
for the NSE 20 share monthly indices under homoskedastic error term, ℰt, for the same
period where, at lag q=4, VR(q)=1.01 and the corresponding Z (q) = 0.10 at 5% level of
significance, and since VR (q) =1.01 is greater than (>) the value of Z (q) =0.10, the null
hypothesis for random walk hypothesis that the variance ratio of NSE 20 share monthly
indices of the Nairobi stock exchange under homoskedastic error term, ℰt, for the
sampling period between 1st March 2004 to 30th April 2009 has a value of one is not
rejected at 5% level of significance. At lag q=8, the variance ratio estimate for the third
order autocorrelation, VR (q) =1.09 and the corresponding Z (q) = 0.43 at 5% level of
significance isn’t critical for accepting or rejecting the null hypothesis that the variance
ratio of NSE 20 share monthly indices for the sampling period 1st March 2004 to 30th
April 2009 has a value of 1 since the sample size, nq=62 is small and such a higher order
of autocorrelation coefficient estimate for variance ratio are prone to very high deviation.
This means that the first and the second order of autocorrelation coefficient estimates of
variance ratio at lag q, that is, VR (q) for NSE 20 share monthly indices under
homoskedastic error term, ℰt, follows random walk hence rejecting the null hypothesis
for the study that NSE 20 share monthly indices between the sampling period do not
follow random walk.
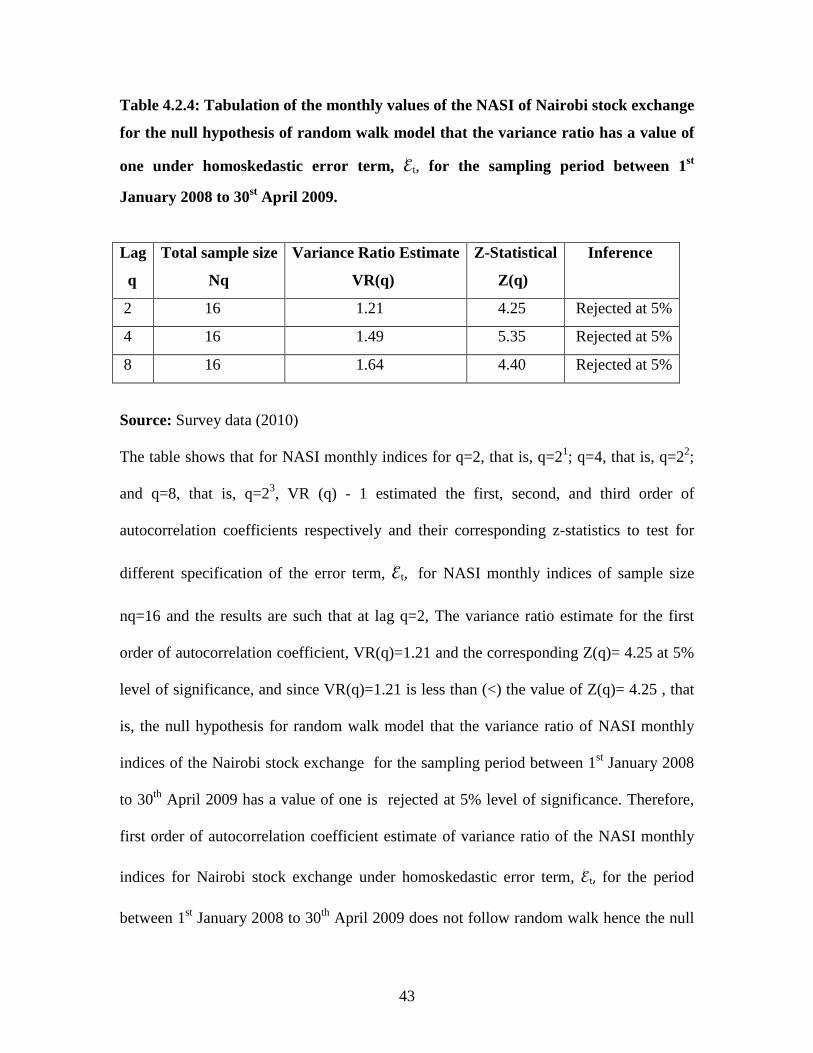
43
Table 4.2.4: Tabulation of the monthly values of the NASI of Nairobi stock exchange
for the null hypothesis of random walk model that the variance ratio has a value of
one under homoskedastic error term, ℰt, for the sampling period between 1st
January 2008 to 30st April 2009.
Lag
q
Total sample size
Nq
Variance Ratio Estimate
VR(q)
Z-Statistical
Z(q)
Inference
2 16 1.21 4.25 Rejected at 5%
4 16 1.49 5.35 Rejected at 5%
8 16 1.64 4.40 Rejected at 5%
Source: Survey data (2010)
The table shows that for NASI monthly indices for q=2, that is, q=21; q=4, that is, q=22;
and q=8, that is, q=23, VR (q) - 1 estimated the first, second, and third order of
autocorrelation coefficients respectively and their corresponding z-statistics to test for
different specification of the error term, ℰt, for NASI monthly indices of sample size
nq=16 and the results are such that at lag q=2, The variance ratio estimate for the first
order of autocorrelation coefficient, VR(q)=1.21 and the corresponding Z(q)= 4.25 at 5%
level of significance, and since VR(q)=1.21 is less than (<) the value of Z(q)= 4.25 , that
is, the null hypothesis for random walk model that the variance ratio of NASI monthly
indices of the Nairobi stock exchange for the sampling period between 1st January 2008
to 30th April 2009 has a value of one is rejected at 5% level of significance. Therefore,
first order of autocorrelation coefficient estimate of variance ratio of the NASI monthly
indices for Nairobi stock exchange under homoskedastic error term, ℰt, for the period
between 1st January 2008 to 30th April 2009 does not follow random walk hence the null

44
hypothesis for the study that NASI monthly indices between the sampling period is not
rejected. The same applies to the second order of autocorrelation coefficient estimate of
variance ratio for the NASI monthly indices under homoskedastic error term, ℰt, for the
same period where, at lag q=4, VR(q)=1.49 and the corresponding Z (q) = 5.35 at 5%
level of significance, and since VR (q) =1.49 is less than (<) the value of Z (q) =5.35, the
null hypothesis for random walk model that the variance ratio of NASI monthly indices
of the Nairobi stock exchange under homoskedastic error term, ℰt, for the sampling
period between 1st January 2008 to 30th April 2009 has a value of one is rejected at 5%
level of significance. At lag q=8, the variance ratio estimate for the third order
autocorrelation, VR (q) =1.64 and the corresponding Z (q) = 4.40 at 5% level of
significance isn’t critical for accepting or rejecting the null hypothesis for random walk
model that the variance ratio of NASI monthly indices for the sampling period 1st January
2008 to 30th April 2009 has a value of one since the sample size, nq=16 is small and such
a higher order of autocorrelation coefficient estimate for variance ratio are prone to very
high deviation. This means that the first and the second order of autocorrelation
coefficient estimates of variance ratio at lag q, that is, VR (q) for NASI monthly indices
under homoskedastic error term, ℰt, for the sampling period did not follow random walk.
4.3 LINE GRAPHS FOR NSE 20 SHARE INDEX AND NASI FOR PORTIONS OF
THE STUDY PERIOD
Line graphs for the first and the last year for the study, that is, 1st March 2004 to 30th
April 2005 and 1st March 2008 to 30th April 2009 for NSE 20 share weekly and monthly
indices are presented. The line graph for NASI for the period between 1st January 2008 to
30th April 2009 for weekly and monthly indices are presented.

45
Figure 4.3.1 Line graph for NSE 20 share weekly indices based on Monday’s reports
of the first twenty weeks (1st March 2004 to 30th April 2005)
Source: Response data (2010)
The above line graph relating the share index with the first twenty weeks of the first year
of the sampling period, show that the weekly index is very variable oscillating between
2500 and 3200. From the above graph, it is clear that the share prices were varying from
week to week, bearing in mind that the Kenyan economy was showing a sign of recovery
under a new government.
Figure 4.3.2 Line graph for NSE 20 share weekly indices based on Monday’s
reports of the last twenty weeks (1st March 2008 to 30th April 2009)

46
Source: Response data (2010)
The graph above present the behavior of weekly share index during last year of the
sampling period. The last twenty weeks shows how un predictable were the share prices
at the time the economy was down , following the political instability in the country. This
is clear evidence that the market was efficient consistent with the random walk theory.
Figure 4.3.3 Line graph for NSE 20 share monthly indices based on the last working
day of the month for the first one year period for the study (1st March 2004 to 30th
April 2005)
Source: Response data (2010)

47
The graph of monthly indices during the first year of the of the sampling period, shows a
steady increase with time. This is due to economic growth which was being experienced
at that time. Though the volume traded was increasing, the share prices were fluctuating
as usual, as shown in the weekly indices within the same period.
Figure 4.3.4 Line graph for NSE 20 share monthly indices based on the last working
day of the month for the last one year period for the study (1st March 2008 to 30th
April 2009)
Source: Response data (2010)
The monthly indices for last year of the sampling period appear very variable without any
obvious trend. Though within this period the indices in general were on the downward
trend, there is no pattern to predict the next period’s value. This is very consistent with
efficient market, though in the weak form. In this scenario it is not possible to develop a
predictive model because the observations are independent of one another and therefore a
predictive model like time series is not applicable.

48
Figure 4.3.5 Line graph for NASI monthly indices based on the last working day of
the month (1st January 2008 to 30th April 2009)
DURATION
30-APR-2009
01-MAR-2009
01-FEB-2009
01-JAN-2009
01-DEC-2008
01-NOV-2008
01-OCT-2008
01-SEP-2008
01-AUG-2008
01-JUL-2008
01-JUN-2008
01-MAY-2008
01-APR-2008
01-MAR-2008
01-FEB-2008
01-JAN-2008
Mea
n N
SE
shar
e in
dex
120
110
100
90
80
70
60
50
Source: Response data (2010)
This graph was meant to test whether there is a relationship of share index at different
time intervals. From the graph, there is no relation of the share index with the time
interval picked. Since there is no pattern, a forecasting model cannot be used in this
market.
4.4 Summary of Findings
The aim of the study was to empirically test random walk model for the Nairobi stock
exchange indices for the period between 1st March 2004 to 30th April 2009 using
parametric autocorrelation test, that is, variance ratios of the indices for the sampling
periods at lag q under homoskedastic error term, ℰt, assumption and hence ascertains

49
whether during this period, historical price for stock traded in the bourse were used to
predict future stock price as advocated by chartists or technical analysts / theorists.
The Z statistics was used to test autocorrelation because the error term is assumed to be
normally distributed with zero mean and constant variance. The level of significance was
5% (95% confidence level). Null hypothesis was to be rejected if the Z value computed is
greater than the critical of Z at 5% level of significance and fail to reject Null hypothesis
if the value of Z computed is less than critical value of Z.
The study population comprised the NSE 20 share indices points and NASI. NSE 20
share index was a natural choice for including in this study as it is the most popular
market index and widely used by market players for benchmarking. For the entire study
period, the NSE 20 share weekly indices comprised a sample size nq=270, NSE 20 share
monthly indices comprised of nq=62, NASI weekly indices comprised of nq=68 and
NASI monthly indices comprised a sample size of nq=16.
The findings of the study show that for the entire study period, except for NASI monthly
indices whose sample size was as small as nq=16, the NSE 20 share weekly indices, the
NSE 20 share monthly indices and NASI weekly indices at the first and the second order
of autocorrelation estimate of variance ratio test under homoskedastic error term, ℰt,
follows random walk for the operational periods between 1st March 2004 to 30th April
2009 for NSE 20 share indices and 1st January 2008 to 30th April 2009 for NASI.

50
CHAPTER FIVE
SUMMARY, CONCLUSION AND RECOMMENDATIONS 5.0 Introduction
This chapter presents the conclusion to the study and the implications of the main
findings. Limitations encountered in the course of the study are also given. Suggestions
for further research are also given.
5.1 Conclusion
Except for NASI monthly indices, the random walk model for NSE 20 share weekly and
monthly indices and NASI weekly indices are accepted for the Kenyan, Nairobi Stock
Market using homoscedasticity corrected variance ratio test. This is evident for the
acceptance of the of the null hypothesis of random walk model at 5% level of
significance that the variance ratio for the NSE 20 share weekly and monthly indices for
the sampling period between 1st March 2004 to 30th April 2009 and NASI weekly indices
for the sampling period between 1st January 2008 to 30th April 2009 under homoskedastic
error term, ℰt, assumption.
The null hypothesis of random walk that VR (q) have a value of one is not rejected since
none of the test statistics Z (q) is large or small enough to reject the hypothesis. That is to
say that except for NASI monthly indices for the sampling period between 1st January
2008 to 30th April 2009, there is a strong support that during the period between 1st
March 2004 to 30th April 2009, Nairobi stock indices followed random walk, hence NSE
as an emerging market conformed to the weak form of the efficient market hypothesis.
This means that during this period, prices for stock traded in the bourse were governed by

51
market fundamentals and that stock prices already reflected all available information
about a firm, and that past stock prices could not be used to forecast future stock prices
with certainty as advocated by chartists / technical theorists since stock market has no
memory. Though the sampling period was only five years, a conclusion is drawn for this
study that NSE follows random walk under the weak form of market efficiency.
5.2 Recommendations
Recommendations to Policy Makers
There is need to establish sufficient machinery for prudential policy measures and
supervision hence proper regulatory framework be set in place.
Recommendations to retail and corporate investors
There is need to invest on security stocks traded in the bourse whose prices are driven by
market fundamentals, hence seek investment advisor’s advice first before investing in any
stock. Also a simple policy of buy and hold be adopted in trading on stock which will be
as good as any more complicated mechanical procedures of timing purchases and sales.
Recommendations for investment advisors
There is need to conduct sufficient research on stock for companies trading in the bourse
and avail all the necessary information to any client who comes for advice. Full
disclosure of factors determining prices for stocks traded in the bourse will protect
individual and corporate investors interested in trading in stocks
5.3 Limitations of this study
The data for NASI was inadequate to make a concrete conclusion; the data available was
only for sixteen months that is operational period 1st January 2008 to 30th April 2009. If

52
the model is applied for a longer period, chances are that NASI will conform to efficient
market in a weak form, consistent to random walk model.
The model used, variance ratio to test autocorrelation on the assumption that the error
term is normally distributed, which might to be the case. Use of Durbin Waston statistics
could have been better to test autocorrelation especially for a second order
autocorrelation.
5.4 Suggestions for further research
There is need to constantly conduct research to ascertain whether emerging stock market
are efficient in the weak form since it is generally assume that the emerging markets are
less efficient than the developed market continuous research on this area to reach an
ultimate conclusion about the level of efficiency of less developed market is necessary.
Researchers could specifically conduct a parametric autocorrelation test of NSE indices
to ascertain whether it follows random walk using a test statistics that is corrected for
heteroskedasticity for the sampling period of this study to establish whether under this
condition the NSE conformed to weak form of market efficiency
Researchers could also use Durbin Waston statistics to test second order autocorrelation
of which is a more robust approach than the variance ratio.

53
REFERENCES Abraham, A., Fazal J. S. and Sulaiman A. A. (2002). Testing the random walk behavior
And efficiency of the Gulf stock markets. The Financial Review. Vol. 37, pp. 469-480.
Alexander, G. J., Sharpes, W. F and Brailey, J. V. International Edition. (1989).
Fundamentals of Investment. Prentice Hall
Alexander, S., (1961) Price Movements in Speculative Markets: Trends or Random
Walks.
Al-Loughani, NE. (1995). Random walk in thinly traded stock markets: The case of
Kuwait Arab Journal of Administration Science. Vol. 3, pp. 189-209.,
Ayadi, O. F., and Pyun, C. S., (1994). An application of variance ratio test to the Korean
securities market, Journal of Banking and Finance, 18, 643-658
Bonyo, J. (March 3rd, 2009). As NSE investors lose 700 billions, brokers enter crisis
mode. D/N. Smart Company – The weekly magazine. PP 1&7
Bonyo, J. (March 10th , 2009). Four Big Losers in NSE meltdown. D/N. Smart Company–
The weekly magazine. PP 1&7.
Brealey, A. R., Myer, S. C. and Marcus, A. J. (1995). Fundamentals of Corporate
Finance. Mc Graw Hill.
Burton G. Malkiel (April 2003).The efficient Market Hypothesis and Its Critics.CEPS
Working Paper No.91.Princeton University
Campbell J.(1997)Economic Research Federal Reserve Paper. Journal of Finance.
Cootner, P., (1962), Stock Prices: Random vs. Systematic Changes. Industrial
Management. Vol. 2

54
Darrat, A. F., and Zhong, M., (2000). On testing the random walk hypothesis: A Model
Comparison Approach.
De Bondt, W, and Thaler R. H., (1985). Does the stock market Overreact? Journal of
Finance, 40, 793-805.
Dickinson, J.P. and Muragu K., (1994). Market Efficiency in Developing Countries:
Study of the Nairobi Stock Exchange. Journal of Business Finance and
Accounting 21:1, 133-150.
Donaldson, G. R., and Kamstra, M. (1996). A New Dividend Forecasting procedure that
Reject Bubbles in Asst prices. A case of 1929 Stock crash. Review of
Financial studies, Vol. 9 No.2. PP333-83
Fama, E. F., and French, K. R., (1988). Permanent and temporary components of stock
prices. Journal of Political Economy, 92(2), 246-273.
Fama, E. F., (1965). The Behavior of Stock-Market Prices. Journal of Business, Vol.
XXXVIII 34-105.
Fisher, L., and Lorie, J. H., (1964). Rates of Return on Investments in Common Stocks.
Journal of Business. Vol. XXXVJI 1-21.
Fratzscher, M. (2002). Financial market integration in Europe: on the effect of EMU on
Stock markets. International Journal of Finance and Economic. vol. 7.PP
165.
Frimpong, J.M and Oteng-Obayie, E.F. (2008) Stock market and Economic performance
in Africa. Market returns and weak form efficiency: The case of Ghana
stock exchange. Vol 9. PP20

55
Goldsmith, R.W. (1971). Capital Markets and Economic Development. National
symposium on Development of Capital Markets
Granger, C., Clivier, J., and Morgenstern, 0. (1963). Spectral Analysis of New York Stock
Market Prices. Kyklos.Vol. XVI, I-27
Grieb, T., and Geyes, M. R., (1999). Random walk test for Latin American equity indexes
And individual firms. The Journal of Financial Research, XXII (4), 371 -383.
Gupta R. (2007). Weak Form Efficiency in Indian Stock Markets. International Business
& Economics Research Journal. Volume 6, Number 3-57
James Surowiecki (1999) the Dumb Smart Market. Finance magazine, Wed, Feb 17
Kangila I.(2007)Relationship between dividend declared and effect on share price, a case
of NSE. Unpublished MBA research paper.
Kendall, M. G., (1953). The Analysis of Economic Time Series. Journal of the Royal
Statistical Society (Series A). Vol. XCVI 11-25.
Kennedy, P., (1996). 4th Ed. A Guide to Econometrics. Blackwell Publishers.
Kim, M. J., Nelson, R. C., and Startz, R., (1991). Mean reversion in stock prices? A
reappraisal of the empirical evidence. The revive of economic studies, 58, 515-528.
Kok, K. L., and Goh, K. L., (1994). Weak-form efficiency and mean reversion in the
Malaysian stock market. Asian pacific Development Journal, 1(2), 137-152.
Lo, A. w., and Mackinlay, A. C., (1988), Stock market prices do not follow Random
Evidence from a simple specification test, the review of financial studies, vol. 1, No 1,
41-66.

56
Levich, R. M., (1998), International Financial Markets: Prices and policies. NY.
McGraw Hil Economic review. Vol.62. pp 77
Miller, M.H., Muthuswany, J. and Whaley, R.E. (1994). Mean reversion of Standard and
Poor’s 500 Index basis change; Arbitrage-Induced or statistical
Illusion. Journal of finance. Vow 49:2. PP479-513
Ming, L. M., Nor, F. M., and Guru, B. K. (2000). Random walk model and technical
trading rules: Some evidence from Malaysia.
Mitra, S. K., (2000). Forecasting stock index using Neural Network. Applied Finance,
Vol. 6, No. 2, 16-25
Mishkin, F. S. 7th Ed. (2004). The Economics of Money, Banking and Financial markets.
Pearson publisher - Additional. Wesley series.
Mobarek and Keasey (2000) Seasonalities in the Monthly Stock Returns. Finance Journal
Mugenda M. O. and Mugenda A. G., (1999). Research Methods. Quantitative and
Qualitative Approaches. ACTS Press. Nairobi, Kenya.
Pan et al (1991) Stock Markets in Developed Markets. Economic Review, Finance
Journal
Pandey, I. M., (2006). Financial Management. Vikas publishing house. Pvt. Limited.
Parameswaran, S. K., (2000). A method of moments test of the random walk model in the
presence of Bid-ask Spreads and Non-synchronous Trading. Applied finance.
Vol. 6, No. 1, 1-22.

57
Samuels, J.M (1981). Stock Exchanges in Developing Countries; Savings and
development No.4.
Sunde, T. And Ziwanomoyo, J. (2008). The Random Walk Hypothesis for Zimbabwe
Stock Exchange. January 1998-November 2006. Journal of Social Science. Vol. 4(3).
PP 216-221
Whitelaw, R. F., (June 1994). Time Variations and Co variation in Expectation and
Volatility in Stock market Returns. Journal of Finance. Vol. 49, No. 2. PP
515.
www.clevelandfed.org/research/commentary.
www.Googlemap.com
www.nse.co.ke

58
APPENDIX COMPANIES LISTED IN NAIROBI STOCK EXCHANGE. AGRICULTURAL Kakuzi Ord.5.00 Rea Vipingo Plantations Ltd Ord 5.00 Sasini Ltd Ord 1.00 COMMERCIAL AND SERVICES AccessKenya Group Ltd Ord. 1.00 Car & General (K) Ltd Ord 5.00 CMC Holdings Ltd Ord 0.50 Hutchings Biemer Ltd Ord 5.00 Kenya Airways Ltd Ord 5.00 Marshalls (E.A.) Ltd Ord 5.00 Nation Media Group Ord. 2.50 Safaricom limited Ord 0.05 Scangroup Ltd Ord 1.00 Standard Group Ltd Ord 5.00 TPS Eastern Africa (Serena) Ltd Ord 1.00 Uchumi Supermarket Ltd Ord 5.00 FINANCE AND INVESTMENT Barclays Bank Ltd Ord 2.00 Centum Investment Company Ltd Ord 0.50 CFC Stanbic Holdings Ltd ord.5.00 Diamond Trust Bank Kenya Ltd Ord 4.00 Equity Bank Ltd Ord 5.00 Housing Finance Co Ltd Ord 5.00 Jubilee Holdings Ltd Ord 5.00 Kenya Commercial Bank Ltd Ord 1.00 Kenya Re-Insurance Corporation Ltd Ord 2.50 National Bank of Kenya Ltd Ord 5.00 NIC Bank Ltd 0rd 5.00 Olympia Capital Holdings ltd Ord 5.00 Pan Africa Insurance Holdings Ltd 0rd 5.00 Standard Chartered Bank Ltd Ord 5.00 The Co-operative Bank of Kenya Ltd Ord 1.00 INDUSTRIAL AND ALLIED Athi River Mining Ord 5.00 B.O.C Kenya Ltd Ord 5.00 Bamburi Cement Ltd Ord 5.00

59
British American Tobacco Kenya Ltd Ord 10.00 Carbacid Investments Ltd Ord 5.00 Crown Berger Ltd 0rd 5.00 E.A.Cables Ltd Ord 0.50 E.A.Portland Cement Ltd Ord 5.00 East African Breweries Ltd Ord 2.00 Eveready East Africa Ltd Ord.1.00 Kenya Oil Co Ltd Ord 0.50 Kenya Power & Lighting Ltd Ord 20.00 KenGen Ltd. Ord. 2.50 Mumias Sugar Co. Ltd Ord 2.00 Sameer Africa Ltd Ord 5.00 Total Kenya Ltd Ord 5.00 Unga Group Ltd Ord 5.00 ALTERNATIVE INVESTMENT MARKET A.Baumann & Co.Ltd Ord 5.00 City Trust Ltd Ord 5.00 Eaagads Ltd Ord 1.25 Express Ltd Ord 5.00 Williamson Tea Kenya Ltd Ord 5.00 Kapchorua Tea Co. Ltd Ord 5.00 Kenya Orchards Ltd Ord 5.00 Limuru Tea Co. Ltd Ord 20.00 Source: The Nairobi Stock Exchange.