Marketing; Media Research; *Newspapers; *Programming ...
352
DOCUMENT RESUME ED 392 090 CS 509 184 TITLE Proceedings of the Annual Meeting of the Association for Education in Journalism and Mass Communication (78th, Washington, DC, August 9-12, 1995). Media Management and Economics Division. INSTITUTION Association for Education in Journalism and Mass Communication. PUB DATE Aug 95 NOTE 358p.; For other sections of these proceedings, see CS 509 173-187 and CS 509 196. PUB TYPE Collected Works Conference Proceedings (021) EDRS PRICE MF01/PC15 Plus Postage. DESCRIPTORS Broadcast Television; *Cable Television; Case Studies; Economic Research; Job Satisfaction; Marketing; Media Research; *Newspapers; *Programming (Broadcast); *Radio IDENTIFIERS *Management Practices; *Relative Constancy ABSTRACT The Media Management and Economics section of the proceedings contains the following 11 papers: "Umbrella Competition among Daily Newspapers: A Case Study of the St. Louis, MO-IL MSA" (Michael Zhaoxu Yan); "Diversity and the Economics of Television: Why the Prime Time Access Rule Has Given Us 25 Years of the Same Old Thing" (Walt McDowell); "An Integrated Model for Determining Channel Diversity in a Multichannel Environment" (Eun-mee Kim); "Marketing Cable Television: Programming and Interactive Service Preferences of Cable Subscribers" (Randy Jacobs); "A Study of Radio Station Managers' Attitudes on Station Format Changes" (Max V. Grubb); "An Investigation of Factors Affecting Job Satisfaction and Career Motivation of On-Air Radio personalities" (Kathleen A. Fox); "A Theoretical and Methodological Critique of the Principle of Relative Constancy" (Michel Dupagne); "Radio Station Characteristics and the Adoption of Satellite-Delivered Radio Programming" (A. Joseph Borrell); "How Perceived Environmental Uncertainty Influences the Marketing Orientation of U.S. Daily Newspapers" (Randal A. Beam); "Strategic Behavior and Competition in Cable Television: Evidence from Two Overbuilt Markets" (Marianne Barrett); and "Vertical Integration and Consumer Welfare in the Cable Industry" (Hoekyun Ahn). (RS) *********************************************************************** Reproductions supplied by EDRS are the best that can be made from the original document. ***********************************************************************
-
Upload
khangminh22 -
Category
Documents
-
view
0 -
download
0
Transcript of Marketing; Media Research; *Newspapers; *Programming ...
DOCUMENT RESUME
ED 392 090 CS 509 184
TITLE Proceedings of the Annual Meeting of the Associationfor Education in Journalism and Mass Communication(78th, Washington, DC, August 9-12, 1995). MediaManagement and Economics Division.
INSTITUTION Association for Education in Journalism and MassCommunication.
PUB DATE Aug 95NOTE 358p.; For other sections of these proceedings, see
CS 509 173-187 and CS 509 196.PUB TYPE Collected Works Conference Proceedings (021)
EDRS PRICE MF01/PC15 Plus Postage.DESCRIPTORS Broadcast Television; *Cable Television; Case
Studies; Economic Research; Job Satisfaction;Marketing; Media Research; *Newspapers; *Programming(Broadcast); *Radio
IDENTIFIERS *Management Practices; *Relative Constancy
ABSTRACTThe Media Management and Economics section of the
proceedings contains the following 11 papers: "Umbrella Competitionamong Daily Newspapers: A Case Study of the St. Louis, MO-IL MSA"
(Michael Zhaoxu Yan); "Diversity and the Economics of Television: Whythe Prime Time Access Rule Has Given Us 25 Years of the Same OldThing" (Walt McDowell); "An Integrated Model for Determining ChannelDiversity in a Multichannel Environment" (Eun-mee Kim); "MarketingCable Television: Programming and Interactive Service Preferences ofCable Subscribers" (Randy Jacobs); "A Study of Radio StationManagers' Attitudes on Station Format Changes" (Max V. Grubb); "AnInvestigation of Factors Affecting Job Satisfaction and CareerMotivation of On-Air Radio personalities" (Kathleen A. Fox); "ATheoretical and Methodological Critique of the Principle of RelativeConstancy" (Michel Dupagne); "Radio Station Characteristics and theAdoption of Satellite-Delivered Radio Programming" (A. JosephBorrell); "How Perceived Environmental Uncertainty Influences theMarketing Orientation of U.S. Daily Newspapers" (Randal A. Beam);"Strategic Behavior and Competition in Cable Television: Evidencefrom Two Overbuilt Markets" (Marianne Barrett); and "VerticalIntegration and Consumer Welfare in the Cable Industry" (HoekyunAhn). (RS)
***********************************************************************
Reproductions supplied by EDRS are the best that can be madefrom the original document.
***********************************************************************
PROCEFDINGS OF THE ANNUAL MEETING OF THE
ASSOCIATION FOR EDUCATION IN JOURNALISM
AND MASS COMMLAICATION (78th, Washington, DC,
August 9-12, 1995). Media Management and Economics Division.
U.II. DEPARTMeNT Of EDUCATIONOffice 01 Educahonal Research and Improvement
EDUCATIONAL RESOURCES INFORMATIONCENTER IERICI
This document has been reproduced asma...4,d horn the person or organezaPonOrripnatong d
0 Minor changes have been made to .mprovereproduchon oublity
Points ol v.*** or opovons stated m then documint do not necessardy represent offloalOERI posthon or pohcy
PERMISSION TO REPRODUCE THISMATERIAL HAS BEEN GRANTED BY
J
TO THE EDUCATIONAL RESOURCESINFORMATION CENTER (ERIC)
RFST COPY AVAILABLE
Umbrella Competition in St. Louis1
Umbrella Competition among Daily Newspapers:A Case Study of the St. Louis, MO-IL MSA
Michael Zhaoxu Yan
Paper presented tothe Media Management and Economics Division of
the Associatior for Education inJournalism and Mass CommunicationWashington D.C., August 10, 1995
Mailing address:Michael Z. YanPh.D. student
Department of TelecommunicationsIndiana University, Bloomington, IN 405
Tel: (812)3397897E-mail: [email protected]
Running Head: Umbrella Competition in St. Louis
11,
Umbrella Competition in St. Louis2
Umbrella Competition among Daily Newspapers:A Case Study of the St. Louis, MO-IL MSA
Abstract
Umbrella competition model has been used to examine
newspaper competition across city boundaries. Extant research of
the model, however, has generally ignored comparing inter-layer
and intra-layer competition.
This study tests the umbrella competition model by comparing
the intensity of inter-layer with that of intra-layer competition
for newspaper circulation in Madison county of the St. Louis, MO-
IL MSA. The study-confirms the umbrella competition model,
showing that inter-layer competition between the metro daily and
the suburban newspapers is more intense than that among suburban
dailies of the same layer. The implications of the study are
discussed in light of the most recent discussions on intercity
competition research.
Umbrella Competition in St. Louis3
Umbrella Competition among Daily Newspapers
in the St. Louis, MO-IL MSA
Michael Yan
Introduction
Since World War II, the American newspaper industry has been
undergoing a major structural change, that is, the decrease of
metropolitan dailies and the increase of suburban dailies and
weeklies (Rosse, 1978) . Parallel with this change is the shift of
research focus from intracity competition to intercity
competition (Compaine, 1982, Mishra, 1980).
An umbrella competition model has been advanced to describe
intercity competition in metropolitan areas (Rosse, 1975) . The
theory starts by dividing the newspapers in a metropolitan area
into four layers. The first layer is composed of metro dailies
that provide regional coverage. The second layer includes
satellite city dailies. Satellite dailies are similar to the
first layer newspapers in content, but more locally-oriented. The
third layer consists of suburban dailies, which are outside the
central city and very local in their coverage. The last layer is
made up of weekly newspapers and shoppers, which are almost
exclusively local in nature.
Newspaper competition, according to the umbrella model, is
more intense between layers than within layers. One of the
reasons is that newspapers compete against each other for
advertising and circulation along the fringes of the markets.
Umbrella Competition in St. Louis4
Because the geographic boundaries of daily newspapers on the same
level overlap only slightly, if at all, there is little or no
competition among the papers. On the other hand, because of the
greater overlapping in coverage between higher and lower layers
of newspapers, newspapers between layers compete for readers and
advertisers (Rosse, 1975).1
The trend of growing newspaper monopoly in central cities
and increasing competition between metro and suburban newspapers
have aroused economic concern that metro dailies will eventually
run suburban newspapers out of business (Roberts, 1981) . A
related ethical consideration is that the social responsibility
of a free press will be limited by increasing intercity
competition and decreasing intracity competition (Rosse, 1975).
Subsequent studies of umbrella competition, however, have
generated mixed results.
A small body of research of intercity competition has
advanced since the inception of the umbrella competition model,
but extant empirical research on this model has generally ignored
comparing inter-layer and intra-layer newspaper competition, a
necessary step in validating the model. This study chooses the
St. Louis Metropolitan Statistical Area (MSA) to tentatively test
the umbrella model by comparing the intensity of between-layer
competition with that of within-layer competition using
regression analyses.
Literature Review
As shown below, past research based on the umbrella
Umbrella Competition in St. Louis
competition model has either taken the existence of umbrella
competition for granted and attempted mainly to gauge its impact
on newspaper content, circulation and advertising, or focused
only on between-layer competition. In addition, few efforts have
been made to statistically test the umbrella competition model by
comparing between-layer and within-layer competition.
Lacy's study (1988a) examined the impact of intercity
competition on newspaper content. He found that the intensity of
intercity newspaper competition is positively related to the
percentage of space in a newspaper devoted to general news
coverage and local news coverage. Although the study showed that
intercity competition is a stronger contributing factor to
increased general news and local news coverage than are intracity
competition as well as other variables including population,
average household income and newspaper circulation, it did not
directly and systematically compare intercity and intracity
competition. It defined intercity competition as the "percentage
of households in a newspaper's county that took another daily
newspaper" (Lacy, 1988a, p.402), and the higher the percentage,
the more intense the umbrella competition is assumed to be.
In another study of the impact of intercity competition on
newspaper content, Lacy (1990) looked at competition between
metro dailies and suburban weeklies, testing the hypot:Aesis that
"circulation of metropolitan dailies and circulation of suburban
weeklies within suburbs will correlate positively with the same
categories of suburban news, editorials and advertising" (p.
Umbrella Competition in St. Louis6
789). He reasoned that if there are similar patterns of content-
circulation correlations between metro dailies and suburban
dailies, there will exist substitutability and thus competition
between these metro and suburban weeklies. The result of this
case study only partially supported his hypothesis with similar
correlation patterns appearing only in such content areas as
display advertising, insert advertising and local sports.
One example of research on advertising and circulation
competition is Lacy's study (1985) measuring between-layer
competition in adertising and circulation as perceived by
suburban newspaper executives. In this survey, suburban editors
and publishers in metro areas with monopolized central markets
perceived circulation competition from metro dailies to be
greater than advertising competition. On the other hand, those in
areas with two or more separately owned and operated newspapers
in the central market perceived advertising competition more
intense than circulation competition. The study also found that
advertising competition was perceived to be more influenced by
distance between the metro cities and suburban cities than was
circulation competition.
However, Niebauer Jr. et al (1988) fouml that the newspaper
market structure of the central city did not extensively
influence either the existence of suburban newspapers or their
circulation. On the other hand, as population increases, the
circulation of suburban newspapers increases; as the circulation
of the metro daily increases, the circulation of suburban dailies
Umbrella Competition in St. Louis7
decreases; as the distances of the suburbs from the central
market increases, the circulation of the metro daily in the
suburbs decreases. Like Lacy (1990), this study focused more on
interlayer than intralayer competition.
One of the few studies that directly tested the umbrella
competition model is a historical account by Tillignhast (1988)
of the southern California papers in the Los Angeles area. The
research showed that competition among these papers was limited
to between-layer competition and there
competition among the dailies.
Another case study, however,
Devey (1989) aggregated the total
each of the three umbrella layers
in the Boston MSA and found that
newspapers increased at a faster
that of metropolitan newspapers.
was little within-layer
came up with different results.
circulation of newspapers in
(metro, satellite and suburban)
circulation of lower-level
rate between 1945 and 1985 than
This led her to refute the
hypothesis that interlayer umbrella competition for circulation
exits in that area. One of the reasons for the lack of interlayer
umbrella competition was thought to be the competitive central
market in the Boston MSA which facilitated the continuing growth
of satellite and suburban newspapers.
These two studies have their limitations. Whereas
Tillinghast (1988) was historical and descriptive, Devey (1989)
only looked at the competition be.tween higher-level and lower-
level newspapers, ignoring the r2mpetition between lower-level
newspapers. Besides that, the latter study concluded without
Umbrella Competition in St. Louis8
statistical support that the increase in circulation of lower-
level newspapers was due to the proportionate decrease of
population in the central city and population growth in satellite
cities and suburbs during that time period rather than inter-
layer competition from the metro dailies. This same study also
used aggregated circulation data for each layer, overlooking the
fact that umbrella competition might exist only in some counties
within a metropolitan area.
Research Design
By stating that between-layer competition is more intense
than within-layer competition in a newspaper market, the umbrella
model factually involves a comparison of between-layer and
within-layer competition, but as the above literature review
shows, the previous studies have generally neglected the fact.
This study thus goes back to the starting point to test the
umbrella competition model, that is, to find out whether the
competition between the metro daily and the suburban dailies is
greater than the one among suburban dailies.2
As shown earlier, newspaper competition includes content,
advertising and circulation competition. Only circulation
competition is examined in this study for the reason of
simplicity although a rigorous test of the model should consider
content and advertising competition also.3
Circulation competition is usually defined according to the
cross-demand elasticity theory, that is, if a newspaper's
circulation demand is reponsive to another newspaper's price,
Umbrella Competition in St. Louis9
content quality, or other choice variables, there is readership
competition among the papers. However, while editorial quality is
hard to measure, the assumed existence of price inelasticity of
circulation demand makes it less meaningful to operationalize
circulation competition based on the price cross-demand
elasticity theory (Lewis, 1995).
This study, following Lacy (1988a) and Winter (1993), test
newspaper circulation competition by examining the extent of
local circulation penetration by non-local newspapers from
different or the same layers. Interlayer competition is measured
by interlayer penetration, i.e., the market share of upper- or
lower-layer newspapers (e.g., a metro daily's market share in a
suburban county) . Intralayer competition is measured by
intralayer peneration, the market share of newspapers from the
same layer (e.g., a suburban daily's market share in a suburban
county). To test the umbrella competition model is therefore to
test the following hypothesis:
The interlayer penetration is predictive ofnewspaper circulation over and above theintralayer penetration.
The Newspaper Market of the St. Louis MSA Metropolitan
Statistic Area is often used to study umbrella competition
because generally metro dailies cover this geographic area and
the proposed umbrella competition is more likely to occur here
(Morton, 1983).4 The St. Louis MSA used for the present study
includes nine counties, five from the state of Illinois and four
Umbrella Competition in St. Louis10
from the state of Missouri. They are Clinton, Jersey, Madison,
Monroe, and St. Clair in Illinois, and Franklin, Jefferson, St.
Charles and St. Louis in Missouri.
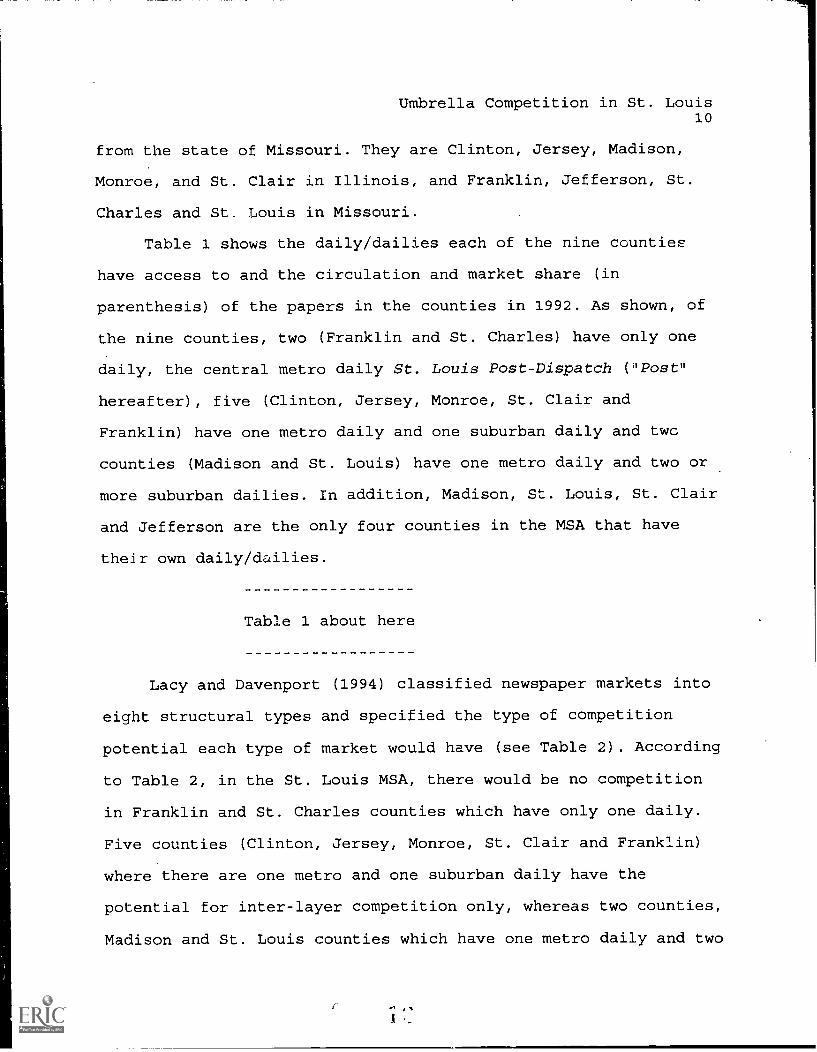
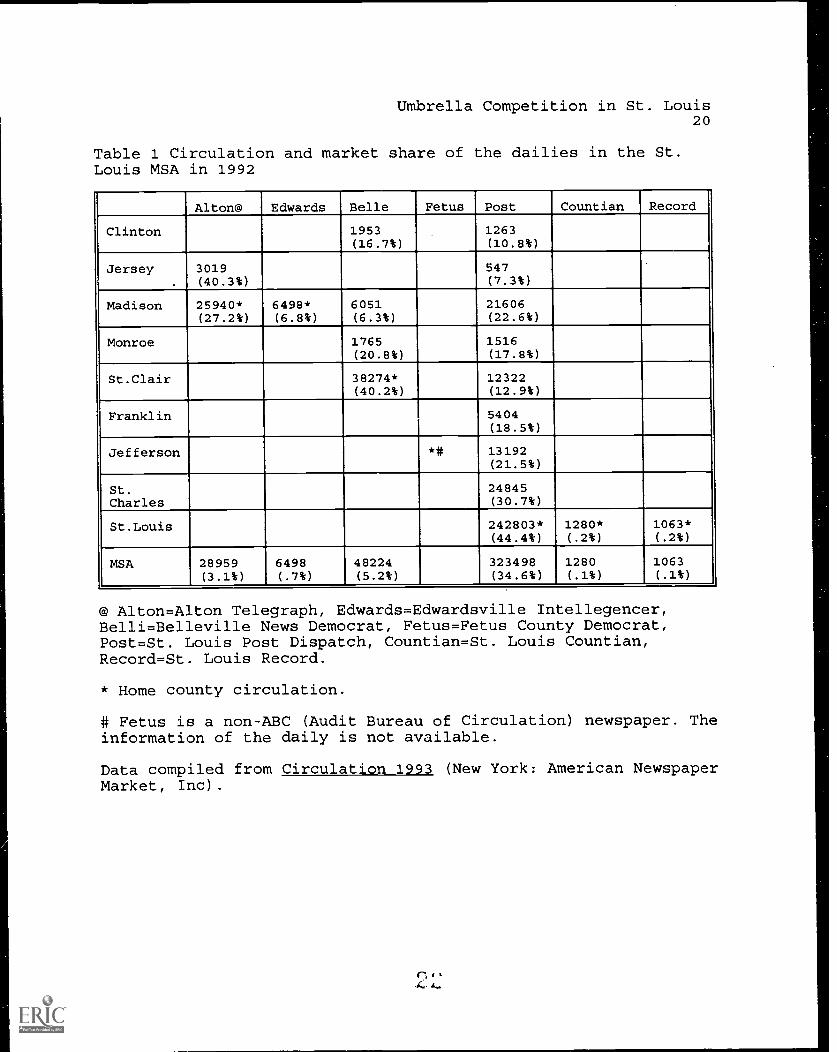
Table 1 shows the daily/dailies each of the nine counties
have access to and the circulation and market share (in
parenthesis) of the papers in the counties in 1992. As shown, of
the nine counties, two (Franklin and St. Charles) have only one
daily, the central metro daily St. Louis Post-Dispatch (dPost"
hereafter), five (Clinton, Jersey, Monroe, St. Clair and
Franklin) have one metro daily and one suburban daily and two
counties (Madison and St. Louis) have one metro daily and two or
more suburban dailies. In addition, Madison, St. Louis, St. Clair
and Jefferson are the only four counties in the MSA that have
their own daily/dailies.
Table 1 about here
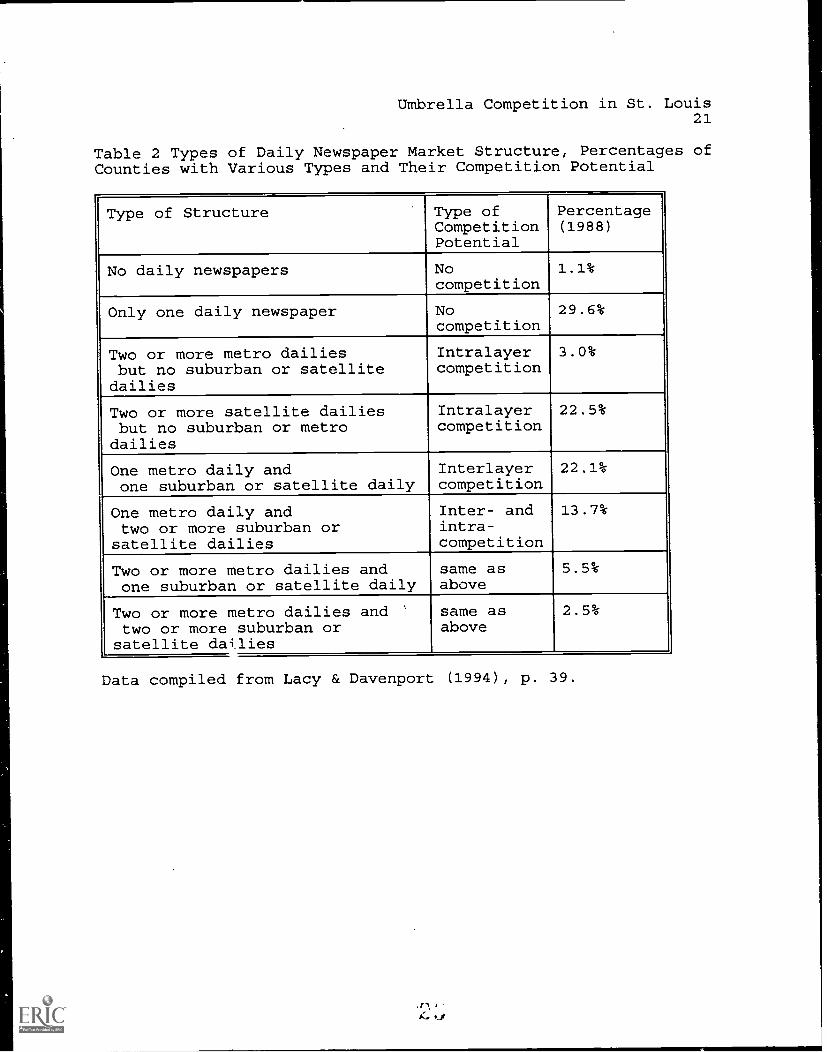
Lacy and Davenport (1994) classified newspaper markets into
eight structural types and specified the type of competition
potential each type of market would have (see Table 2). According
to Table 2, in the St. Louis MSA, there would be no competition
in Franklin and St. Charles counties which have only one daily.
Five counties (Clinton, Jersey, Monroe, St. Clair and Franklin)
where there are one metro and one suburban daily have the
potential for inter-layer competition only, whereas two counties,
Madison and St. Louis counties which have one metro daily and two
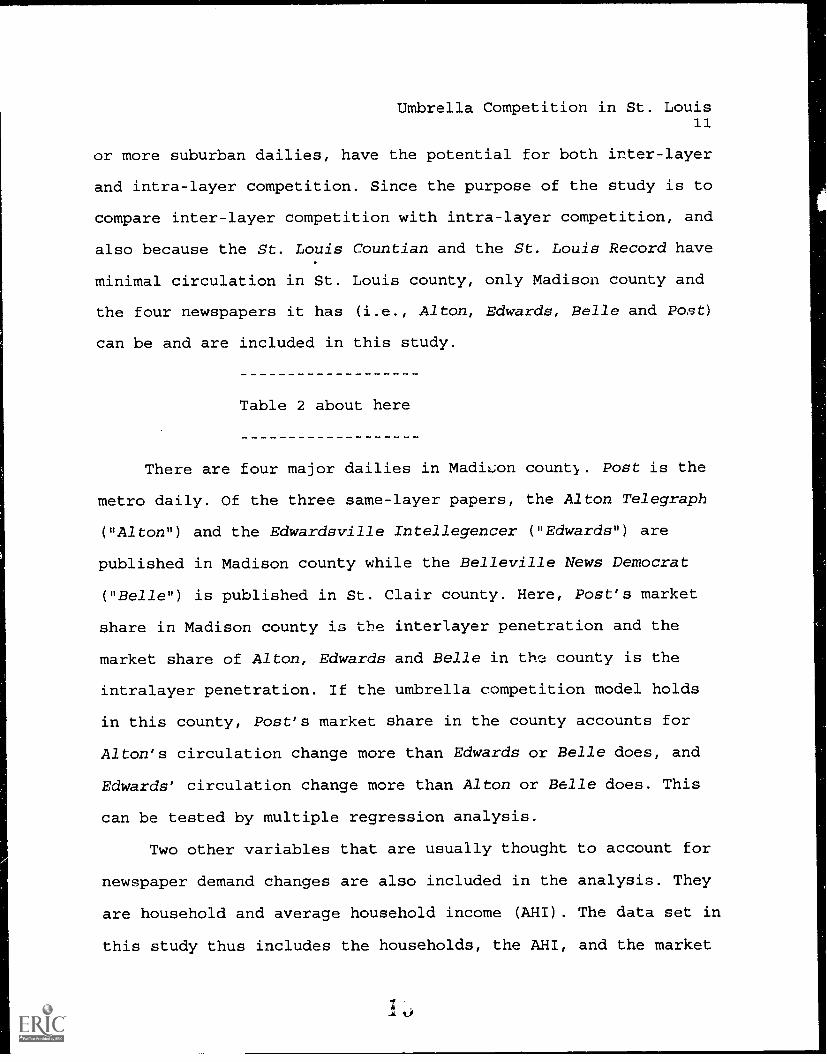
Umbrella Competition in St. Louis11
or more suburban dailies, have the potential for both inter-layer
and intra-layer competition. Since the purpose of the study is to
compare inter-layer competition with intra-layer competition, and
also because the St. Louis Countian and the St. Louis Record have
minimal circulation in St. Louis county, only Madison county and
the four newspapers it has (i.e., Alton, Edwards, Belle and Po5t)
can be and are included in this study.
Table 2 about here
There are four major dailies in Madik;on countl. Post is the
metro daily. Of the three same-layer papers, the Alton Telegraph
("Alton") and the Edwardsville Intellegencer ("Edwards") are
published in Madison county while the Belleville News Democrat
("Belle") is published in St. Clair county. Here, Post's market
share in Madison county is the interlayer penetration and the
market share of Alton, Edwards and Belle in thc: county is the
intralayer penetration. If the umbrella competition model holds
in this county, Post's market share in the county accounts for
Alton's circulation change more than Edwards or Belle does, and
Edwards' circulation change more than Alton or Belle does. This
can be tested by multiple regression analysis.
Two other variables that are usually thought to account for
newspaper demand changes are also included in the analysis. They
are household and average household income (AHI). The data set in
this study thus includes the households, the AHI, and the market
Umbrella Competition in St. Louis12
shares of Post, Alton, Edwards and Belle in Madison county from
1971 to 1992.
The circulation and penetration data of the newspapers
collected by the American Audit Bureau of Circulation were taken
from Cilculation. The household and average household income data
came from Editor and Publisher Market Guide. SAS/STAT is used for
the multiple regression analysis.
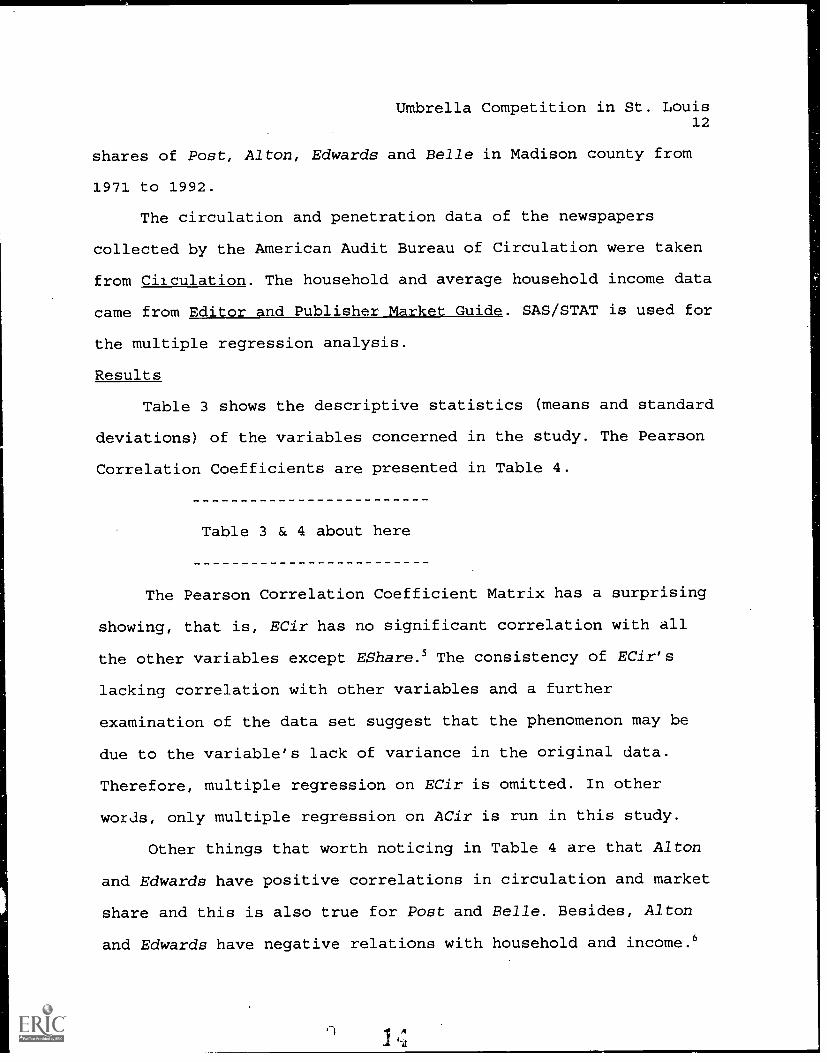
Results
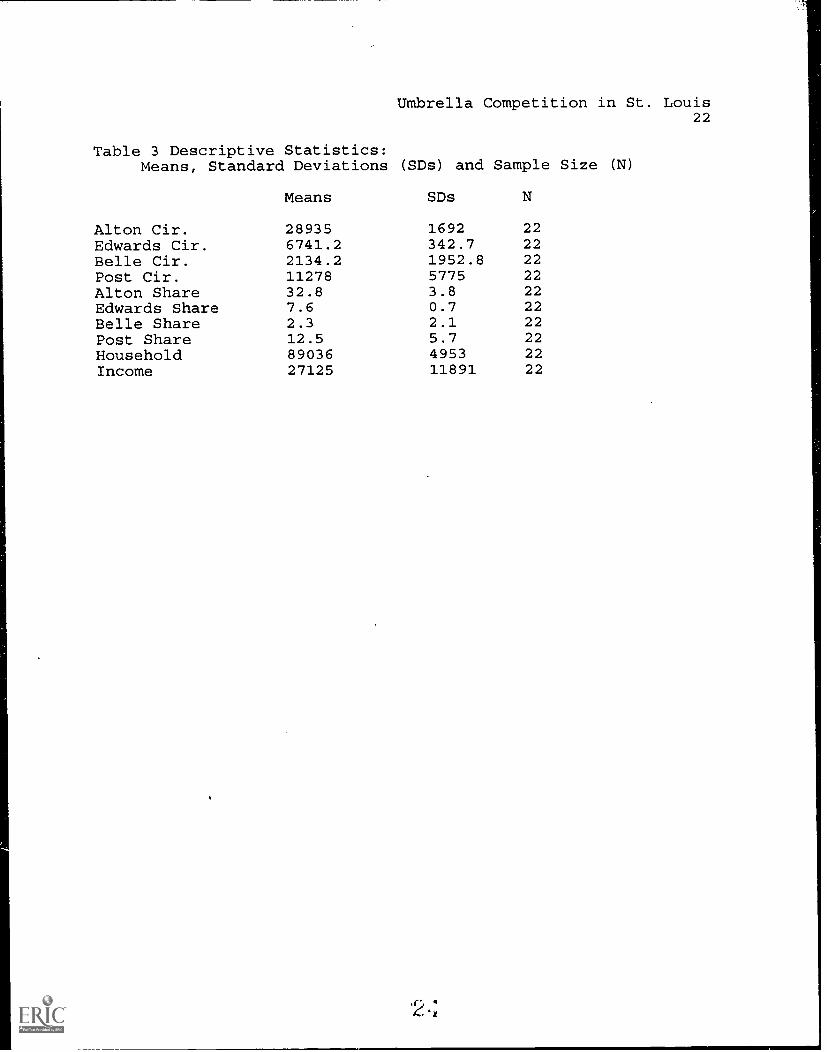
Table 3 shows the descriptive statistics (means and standard
deviations) of the variables concerned in the study. The Pearson
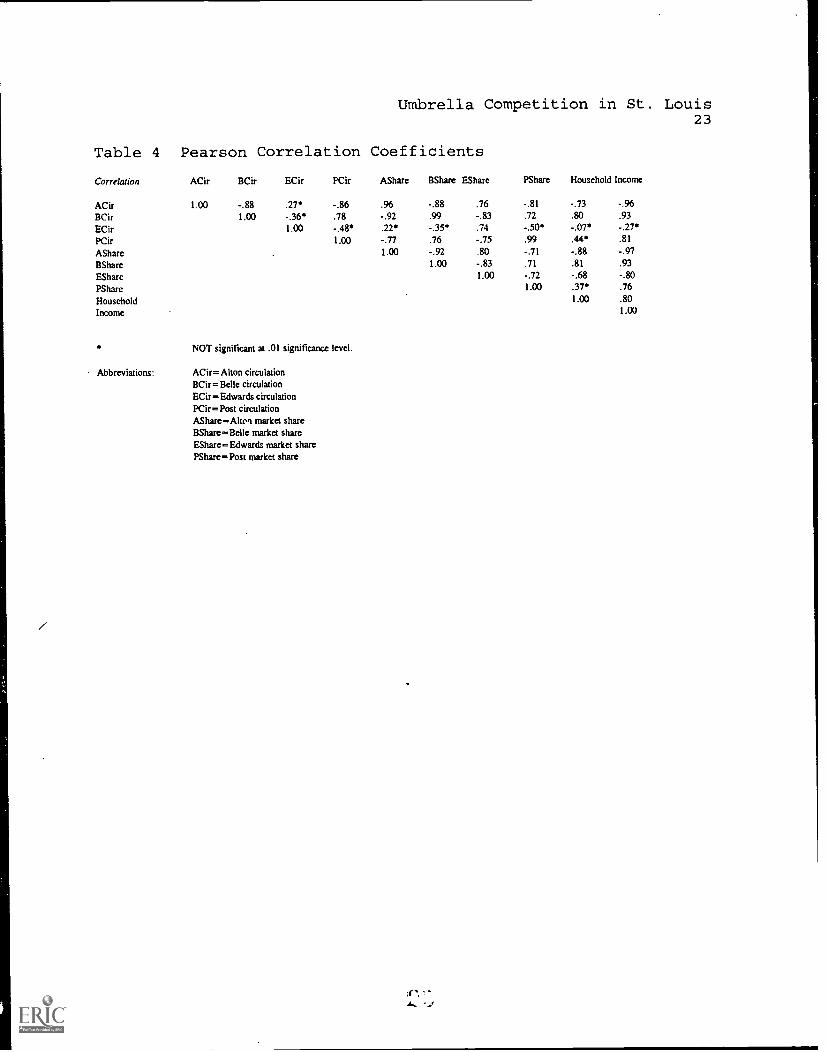
Correlation Coefficients are presented in Table 4.
Table 3 & 4 about here
The Pearson Correlation Coefficient Matrix has a surprising
showing, that is, ECir has no significant correlation with all
the other variables except EShare.5 The consistency of ECir's
lacking correlation with other variables and a further
examination of the data set suggest that the phenomenon may be
due to the variable's lack of variance in the original data.
Therefore, multiple regression on ECir is omitted. In other
words, only multiple regression on ACir is run in this study.
Other things that worth noticing in Table 4 are that Alton
and Edwards have positive correlations in circulation and market
share and this is also true for Post and Belle. Besides, Alton
and Edwards have negative relations with household and income.6
4-1
1
Umbrella Competition in St. Louis13
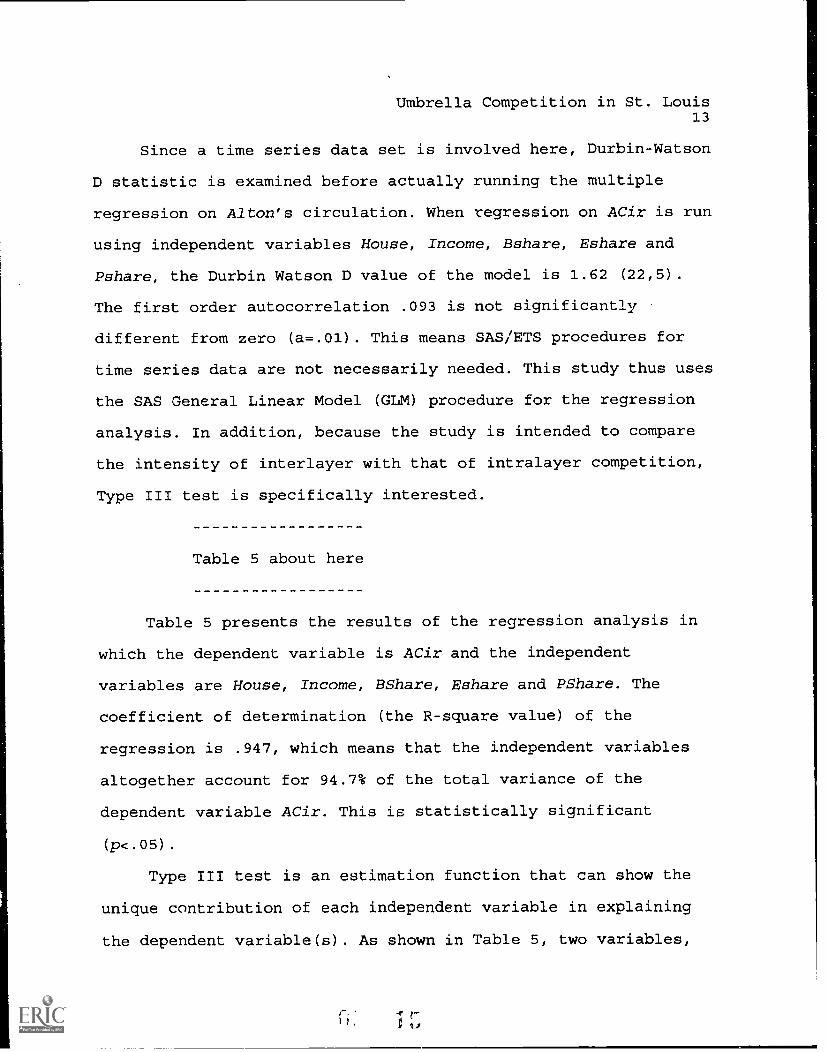
Since a time series data set is involved here, Durbin-Watson
D statistic is examined before actually running the multiple
regression on Alton's circulation. When egression on ACir is run
using independent variables House, Income, Bshare, Eshare and
Pshare, the Durbin Watson D value of the model is 1.62 (22,5).
The first order autocorrelation .093 is not significantly
different from zero (a..01). This means SAS/ETS procedures for
time series data are not necessarily needed. This study thus uses
the SAS General Linear Model (GLM) procedure for the regression
analysis. In addition, because the study is intended to compare
the intensity of interlayer with that of intralayer competition,
Type III test is specifically interested.
Table 5 about here
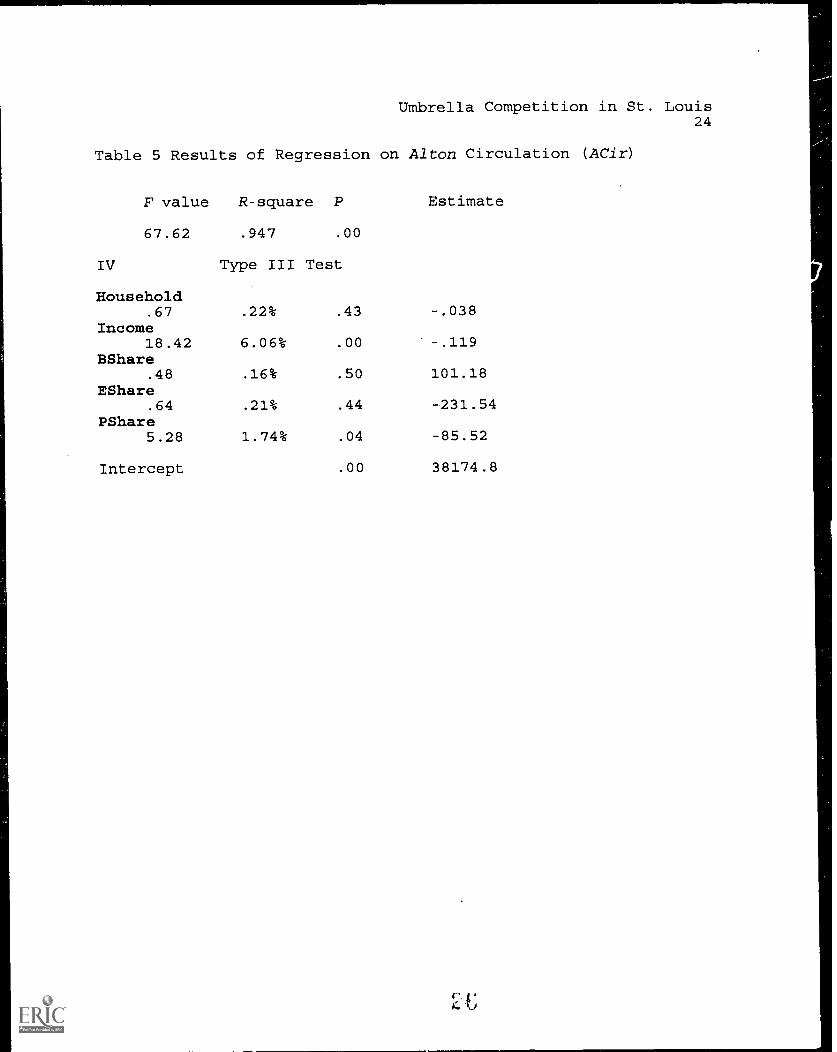
Table 5 presents the results of the regression analysis in
which the dependent variable is ACir and the independent
variables are House, Income, BShare, Eshare and PShare. The
coefficient of determination (the R-square value) of the
regression is .947, which means that the independent variables
altogether account for 94.7% of the total variance of the
dependent variable ACir. This is statistically significant
(p<.05).
Type III test is an estimation function that can show the
unique contribution of each independent variable in explaining
the dependent variable(s). As shown in Table 5, two variables,
Umbrella Competition in St. Louis14
household income and Post's market share, are statistically
significant predictors. Their R-squre values are 6.069; and 1.74%
respectively (a=.05). There is a negative regression correlation
between ACir and PShare, showing there is statistically
significant interlayer competition between the two papers. On the
other hand, the two intralayer penetration variables, Edwards'
market share and Belle's market share, along with the household
variable, have non-significant predicting power. The hypothsis is
supported here.
Discussion
The study tests the umbrella competition among newspapers in
a county. The regression analysis show that in Madison county of
the St. Louis, MO-IL MSA, the market share of the metro daily St.
Louis Post-Dispatch in this county (i.e., interlayer penetration)
and the average household income of the county are predictive of
the circulation of the county's major daily Alton Telegraph, but
circulation penetration of two other same-level dailies,
Belleville News Democrat and Edwardsville Intellegencer, are not.
The umbrella competition model is thus confirmed in this case
study.
The conclusion, however, comes with several shortcomings of
the study. First, in order to test the umbrella competition
model, considered can be only those counties having access to at
least three dailies including both metro and suburban or
satellite ones (see Table 2). The St. Louis MO-IL MSA chosen for
the study includes only one such county, i.e., Madison county.
Umbrella Competition in St. Louis15
The final analysis is thus confined to only one county with a
particular structure of newspaper market. The three-firm
concentration, which is 56.6%, and the Lacy competition index,'
which is 4.6, in Madison county in 1992 (see Table 1) indicate
that newspaper market in Madison county is competitive. This area
also has a monopolistic central market structure with the St.
Louis Post-Dispatch dominating the market. It should not be
surprising that the nature and extent of umbrella competition
differ in different markets. Although individual market analysis
has been shown to be able to better describe the reality of
newspaper competition (see, e.g., Lewis, 1995), we should go
further than market-by-market case studies.
Although the study finds that interlayer penetration rather
than intralayer penetration is predictive of newspaper
circulation, the contribution of interlayer penetration is very
small, that is, accouting for only 1.74% of the variance of
newspaper circulation. The great and significant determination
coefficient (.947) and small r-sqaure value for the individual
variables in this case indicate the existence of
multicollinearity in the independent variables, a problem the
study does not address. The small sample (N.22) of the study
further worsens the problem of multicollinearity.
In addition, the study reveals that number of household and
average household income do not have consistent relations with
newspaper circulation. It thus resonate Lewis's (1995)
observation that population and income might nct be good
Umbrella Competition in St. Louis16
variables in explaining circulation demand. Other variables may
be missing8 and should be included in the study.
In summary, this study is just a tentative step in testing
the umbrella competition model. Its shortcomings discussed above
limit its validity. However, the way to test the umbrella
competition model as proposed in the study, that is, comparing
the predictive power of interlayer and intralayer penetration,
should not be invalidated by the weaknesses of the study. Future
research using this conceptualization should be done with a
larger sample size and more carefully selected independent
variables. For the former, more counties with umbrella
competition potential as defined by Lacy and Davenport (1994)
could be sampled to test the model. For the latter, newspaper
content and advertising variables, distance between newspaper
markets, educational level as well as competition from non-print
media could be included in the regression model. Only when more
research with more generalizability is done can the umbrella
competition model develop to the point that "it can predict the
results or explain tAe nature of intercity competition in
individual markets" (Lacy, p. 70, 1988b).
Umbrella Competition in St. Louis17
References
Compaine, B. M. (1982). Who owns the media? Concentration of
ownership in the mass communication industry. White Plains, New
York: Knowledge Industry Publications, Inc.
Devey, S. M. (1989, Spring). Umbrella competition for
newspaper circulation in the Boston Metro Area. Journal of Media
Economics, 2, 31-40.
Editor and Publisher Market Guide (1972-1993). New York:
Editor & Publisher Co.
Grotta, G. L., Larkin, E. F., & Carrel, Jr., B. J. (1976).
News versus advertising: Does the public perceive the
journalistic distinction. Journalism Quarterly, 53, 448-521.
Lacy, S. (1984). Competition among metropolitan daily, small
daily and weekly newspaper. Journalism Quarterly, 61, 640-644.
Lacy, S. (1985). Monopoly metropolitan dailies and inner-/
city competition. Journalism Quarterly, 62, 640-644.
Lacy, S. (1987). The impact of intracity competition on
daily newspaper content. Journalism Quarterly, 64, 281-290.
Lacy, S. (1988a). The impact of intercity competition on
daily newspaper content. Journalism Quarterly, 65, 399-406.
Lacy, S. (1988b). Competing in the suburbs: A research
review of intercity newspaper competition. Newspaper Research
Journal, 9 (2), 69-76.
Lacy, S. (1990). Correlation of newspaper content with
circulation in the suburbs: A case study. Journalism Quarterly,
67, 785-793.
Umbrella Competition in St. Louis18
Lacy, S., & Davenport, L. 1994). Daily newspaper market
structure, concentration, and competition. Journal of Media
Economics, 7 (3), 33-46.
Lacy, S., & Simcn, T. (1993). The economics and regulation
of United States m-.:wspapers. Norwood, New Jersey: Ablex.
Lewis, R. (1995). Relation between newspaper subscription
price and circulation, 1971-1992. Journal of Media Economics, 8
(1), 25-41.
Mishra, V. M. (1980). The future of the newspaper industry
in America: Some research contingencies and portents. Gazette,
26, 16-29.
Morton, J. (1983, July/August). Hitting the markets.
Washington Journalism Review.
Niebauer, Jr., W. E., Lacy, S., Bernstein, J. M., & Lau, T.
(1988). Central city market structure's impact on suburban
newspaper circulation. Journalism Quarterly, 65, 339-406.
Rosse, J. (1975) . Economic lir.ts of press responsibility
(Discussion paper No. 56). Palo Alto, CA: Stanford University,
Studies in Industry Economics.
Rosse, J. (1978) . The evolution of one newspaper cities
(Paper No. 95). Stanford, CA: Stanford University, Studies in
Industry Economics.
Tillignhast, D. (1988) . Limits of competition. In R. G.
Picard, J. P. Winter, M. E. McCombs, & S. Lacy (eds.), Press
concentration and monopoly: New Perspectives on newspaper
ownership and operation. Norwood, NJ: Ablex.

Umbrella Competition in St. Louis19
Winter, H. (1993). Readership competition and the 'monopoly'
press. Applied Economics, 25, 1229-1231.
Umbrella Competition in St. Louis20
Table 1 Circulation and market share of the dailies in the St.Louis MSA in 1992
Alton@ Edwards Belle Fetus Post Countian Record
Clinton 1953 1263(16.7%) (10.8%)
Jersey 3019 547, (40.3%) (7.3%)
Madison 25940* 6498* 6051 21606(27.21) (6.8%) (6.3%) (22.6%)
Monroe 1765 1516(20.8%) (17.8%)
St.Clair 38274* 12322(40.2%) (12.9%)
Franklin 5404(18.5%)
Jefferson *# 13192(21.5%)
St. 24845Charles (30.7%)
St.Louis 242803* 1280* 1063*(44.4%) (.2%) (.2%)
MSA 28959 6498 48224 323498 1280 1063(3.1%) (.7%) (5.2%) (34.6%) (.1%) (.1%)
@ Alton=Alton Telegraph, Edwards=Edwardsville Intellegencer,Belli=Belleville News Democrat, Fetus=Fetus County Democrat,Post=St. Louis Post Dispatch, Countian=St. Louis Countian,Record=St. Louis Record.
* Home county circulation.
# Fetus is a non-ABC (Audit Bureau of Circulation) newspaper. Theinformation of the daily is not available.
Data compiled from Circulation 1993 (New York: American NewspaperMarket, Inc).
Umbrella Competition in St. Louis21
Table 2 Types of Daily Newspaper Market Structure, Percentages ofCounties with Various Types and Their Competition Potential
Type of Structure Type ofCompetitionPotential
Percentage(1988)
No daily newspapers Nocompetition
1.1%
Only one daily newspaper Nocompetition
29.6%
Two or more metro dailiesbut no suburban or satellitedailies
Intralayercompetition
3.0%
Two or more satellite dailiesbut no suburban or metrodailies
Intralayercompetition
22.5%
One metro daily andone suburban or satellite daily
Interlayercompetition
22.1%
One metro daily andtwo or more suburban orsatellite dailies
Inter- andintra-competition
13.7%
Two or more metro dailies andone suburban or satellite daily
same asabove
5.5%
Two or more metro dailies andtwo or more suburban or
satellite da-i_lies
same asabove
2.5%
Data compiled from Lacy & Davenport (1994), p. 39.
Umbrella Competition in St. Louis22
Table 3 Descriptive Statistics:Means, Standard Deviations
Means
Alton Cir. 28935Edwards Cir. 6741.2
(SDs) and Sample Size (N)
SDs
1692 22342.7 22
Belle Cir. 2134.2 1952.8 22Post Cir. 11278 5775 22Alton Share 32.8 3.8 22Edwards Share 7.6 0.7 22Belle Share 2.3 2.1 22Post Share 12.5 5.7 22
Household 89036 4953 22Income 27125 11891 22
'2,;
Umbrella Competition in St. Louis
Table
Correlation
ACirBCirECirPCirAShareBShareESharePShareHouseholdIncome
4 Pearson Correlation Coefficients
ACir BCir ECir PCir AShare BShare EShare
1.00 -.88 .27* -.86 .96 -.88 .761.00 -.36* .78 ,92 .99 -.83
1.00 -.48* .22* -.35* .741.00 -.77 .76 -.75
1.00 -.92 .801.00 -.83
1.00
PShare
-.81.72-.50*.99-.71.71
-.721.00
23
Household Income
-.73 -.96.80 .93-.07* -.27*.44* .81
-.88 -.97.81 .93-.68 -.8037* .761.00 .80
1.00
Abbreviations:
NOT significant at .01 significance level.
ACir= Alton circulationBCir= Belle circulationECir=Edwards circulationPCir= Post circulationAShare=Altol market shareBShare=Belle market shareEShare=Edwards market sharePShare= Post market share
Umbrella Competition in St. Louis24
Table 5 Results of Regression on Alton Circulation (ACir)
F value R-square P Estimate
67.62
IV
Household
.947
Type III
.00
Test
.67 .22% .43 -.038Income
18.42 6.06% .00 -.119BShare
.48 .16% .50 101.18EShare
.64 .21% .44 -231.54PShare
5.28 1.74% .04 -85.52
Intercept .00 38174.8
Umbrella Competition in St. Louis25
Notes:
1. Lacy & Simon (1993) proposed to add two more layers to the
model. One is a layer of national newspapers above the metro
dailies. The other is a layer of group-owned, non-daily newspapers
in suburban areas in the bottom. They also pointed out that the
number of layers vary in different markets. In addition, there has
always been a practical problem in distinguishing the second and
the third layer newspapers in many areas due to the difficulties in
defining satellite cities. In most cases where the boundaries of
the second and the third layers blur, researchers simply clustered
the two layers into one (Lacy, 1984).
2. Only two layers, the metro daily and suburban dailies, are
discussed in this study because information on weeklies over the
years is not consistent and always available.
3. Examining advertising and content competition requires other
data, especially qualitative data, and additional research design,
e.g., content analysis, which are beyond the scope of this study.
In addition, circulation competition is presumptively the basis for
advertising and content competition.
4. Umbrella competition could exist in counties outside of the
metropolitan areas (Lacy and Davenport, 1994).
5. It is not surprising at all that there is significant
correlation between ECir and EShare.
6. This may be contrary to the common knowledge, but may not be
contradictory to common sense. It might just reflect the shift of
people's media preference from newspaper to other media.
0".`,.t"
Umbrella Competition in St. Louis26
7. This is determined by subtracting the market penetration of the
second largest circulation newspaper from the penetration of the
largest circulation newspaper in a market (Lacy, 1987). The smaller
the difference, the more competitive the market is.
8. Missing variables is another source of the multilinearity
problem.
Diversity and The Economics of Television:
Why The Prime Time Access Rule
Has Given Us 25 Years Of
The Same Old Thing
A research paper prepared by
Walt McDowell
Ph.D Student
University of FloridaCollege of Journalism and Communication
Graduate Studies Division2000 Weimer Hall
Gainesville, FL 32611-2084March 1, 1995
Office: 904-392-6557Home: 904-336-4599
APA Style
Running head: Diversity
Diversity and The Economics of Television:
Why The Prime Time Access Rule
Has Given Us 25 Years Of
.The Same Old Thing
Running Head: Diversity
APA Style
fl
Diversity 2
Abstract
1995 marks the 25th anniversary of the highly
controversial Prime Time Access Rule (PTAR) and the
first serious consideration of repeal by the FCC. With
the intention of limiting the economic power of the
networks and thereby generating meaningful program
diversity on a local level, PTAR has been the source of
disappointment and debate for over two decades. While
recognizing that First Amendment issues involving
program content regulation are important, this paper
emphasizes an economic perspective to explain why PTAR
has remained a promise unfulfilled.
The article provides five interrelated factors
that have contributed to the rule's poor performance in
generating program diversity.
1. The FCC's spectrum management policies that fostered
a three network oligopoly on a national and local
market level.
2. The Nielsen ratings that lack the depth and
precision to measure small specialized audiences
3. The program content theory known as least
objectionable programming (LOP) that caters to large
homogeneous audiences
Diversity 3
4. The program scheduling strategy known as "stripping"
which reduces mathematically the availability of
program options.
5. The influence of barter syndication advertising
which requires a broad national distribution of
programs.
The article concludes that real program content
diversity is not only a matter of cultivating more
program suppliers, but also increasing the number of
program channels.
Diversity 4
Diversity and The Economics of Television Decree:
Why The Prime Time Access Rule
Has Given us 25 Years of The Same Old thing
In the fall of 1971, ABC, CBS and NBC were forced
to cancel over a dozen prime-time programs in order to
accommodate the introduction of a new FCC rule that
limited the number of hours of programming the networks
could provide to their affiliated stations. Among the
canceled shows were, "Hogan's Heroes", "The Newlywed
Game", "Let's Make A Deal", and "The Beverly
Hillbillies" (Brown, 1971; Shapiro, 1989). According to
the new FCC mandate, local station affiliates were to
access this vacated time with newly created local and
syndicated programming.
With the introduction of The Prime Time Access
Rule (PTAR, 1970), the Federal Communications
Commission (FCC) ventured into the "vast wasteland" of
prime time television. The commission expected that,
over time, its decree would stimulate the production of
network quality syndicated prime-time programs, thereby
enhancing competition among program suppliers.
The commission envisioned "an hour of top-rated evening
Diversity 5
time for competition among present and potential non-
network program sources...so that the public interest
in diverse broadcast service may be served" (PTAR I, 23
FCC 2d at 397).
Twenty-four years later, the following programs
dominate the same time period that was declared off
limits to the networks: "Wheel of Fortune", "Jeopardy",
"Entertainment Tonight, "A Current Affair", "Hard Copy"
and "Inside Edition". Four of the top six most popular
programs are distributed by one company, Kingworld
Productions (Blair Television, 1994; NATPE, 1995).
There is no doubt that PTAR truly did restrict the
networks, but most broadcasters, FCC commissioners,
Federal Court judges, media critics, and scholars have
given only faint praise to the rule's ability to
inspire significant alternative programming (Sterling &
Kittross, 1990; Krattenmaker, 1984). After more than
two decades of dodging the issue, in 1994 the FCC
announced a formal Notice Of Proposed Rule Making to
access the future value of PTAR (FCC, October 25,
1994). Hearings are scheduled to begin in April 1995.
Analysis and criticism of PTAR have
essentially taken two approaches - The first has been a
3 ;
Diversity 6
legal approach that has focused on the limited First
Amendment rights of broadcasters and the FCC's
authority to intervene in program content. The
constitutional issues are provocative and deserving of
their own specialized research. For those interested in
a more legalistic perspective of the PTAR debate, the
author recommends a review of Mt. Mansfield Television
v. FCC, (442 F.2d 470, 1971), and the 1994 FCC Petition
for Declaratory Ruling filed by First Media Corporation
(MMB File No. 900418A).
The second approach, and the focus of this paper,
has concentrated more on the practical economic impact
of the rule. While the trade press has given PTAR
thorough coverage.for many years, there is a surprising
lack of scholarly research on the economic
repercussions of the law. One prophetic journal
article, written over 20 years ago, offers insightful
analysis and an accurate prediction of the rule's
lackluster performance. Hall and Batliva (1973)
maintained that the oligopolistic structure of the
television industry discouraged diversity. As long as
there remained a limited number of channels of
distribution, the natural desire to obtain the largest
Diversity 7
possible share of a market would inevitably force
broadcasters to telecast similar programming. The
authors asserted that the key to generating more
diverse programming was not the FCC's "Misadventure in
Program Regulation" (p. 215), but rather, to establish
more outlets. A decade later Krattebmaker (1984)
offered more provocative opinion than scholarly
substance with his scathing "Six Commandments for Inept,
Regulation." (p.27). Although PTAR was intended to
inspire more program variety an analytical study
conducted by Walshlag & Adams (1985) concluded that the
national networks responded to PTAR with even less
variety in prime time.
Almost 20 years after the rule's inception,
Rosencrans (1990) analyzed the economic influence of
PTAR rule and observed that, "Rather than shifting
control away from the few powerful networks to the many
independent program suppliers, the beneficiaries of the
shift have been the major motion picture studios, whose
television divisions have merely replaced the networks
as the dominant programming sources" (p. 66).
This paper explores some of the major economic
causes and consequences of PTAR and explains why the
Diversity 8
rule has remained a promise unfulfilled. While
reiterating valid observations made in prior studies,
this paper also incorporates several new perspectives.
Section I summarizes the essential components of PTAR
and the core issues involved in the upcoming Proposed
Rule Making. Section II examines the historic roots of
the law and the primary rationales for enacting it in
the first place. Section III looks at the immediate and
long term consequences of the rule on television
programming. Section IV provides a number of economic
reasons for the rule's disappointing impact on program
diversity, while Section V explores the multi-channel
future of television and the relevancy of PTAR. The
paper concludes in section VI with a brief summary and
discussion of the necessary ingredients for significant
program diversity.
Diversity 9
Section I
The Essentials of PTAR
and the Upcoming Proposed Rule Making
PTAR, in essence, prohibits network affiliates in
the top 50 markets from airing more than three hours of
network or off-network programming during the four
hours of prime time each evening. The rule effectively
carves out one hour of "access" time for the local
stations to air first-run syndicated or locally-
produced programs. All Independent stations, as well as
affiliated stations licensed to markets ranked below
the top 50, are exempted from the rule.
The FCC enacted PTAR in 1970. Three years later
the Commission in PTAR II (1973) reduced the access
time to one-half hour and stipulated that it must be
between 7:30 and 8:00 pm. The resulting uproar fron
the National Association of Independent Television
Producers and Distributors forced the Commission in
1975 to adopt PTAR III, which increased access time
back to one hour within the specified time frame of
7:00 to 11:00 pm (PTAR III, 1975). PTAR III, which has
been in effect for almost 20 years, provides for a
:4
Diversity 10
number of "waivers" including off-network children's
programs, public affairs, and documentaries.
In tandem with PTAR I, the Commission adopted the
Network Financial Interest and Syndication Rules. The
"Fyn-Syn rules", as they are called, placed severe
restrictions on the networks' involvement in program
syndication. A network could retain the right to
produce or purchase a program for first run airing in
prime time, but once that program was available for
syndication (ie. off-network), the network had to
relinquish all financial interest from profits derived
from syndicated sales to stations (Fin-Syn, 1970).
Looking at the multi-channel future and believing
.that the old fears of "network dominance" were no
longer relevant, the U.S Court of Appeals for the
Washington D.0 Circuit in 1992 persuaded the Commission
to begin a multi-stage phase out of the Fyn-Syn rules
(Schurz Communications v. FCC, 1992).
Although, the Fyn-Syn rules and PTAR are separate
and distinct FCC rulings, they were initiated for all
intents and purposes as a "package" designed to
restrict the power of the networks over local stations.
Therefore, the rationales used to roll back the Fyn-Syn
-4
Diversity 11
rules have prompted debate over the continued need for
PTAR, particularly the section dealing with off network
programming (FCC, October, 1994).
The Two Sides of the PTAR Debate
Aside from First Amendment concerns, the core
economic issue the FCC is considering in its rule
making proceedings is the alleged disadvantages network
affiliates face in an era of increased competition from
cable and independent stations. Many of these
"independent" stations are affiliated with partial
networks such as Fox and the fledgling Warner Brothers
and United Paramount networks (Tobenkin, 1995). These
three mini-networks are currently exempt from PTAR
because they do not provide a minimum of 15 hours of
programming per week (FCC, 1994; Jessell, 1995).
Advocates for repeal of PTAR include the three
major networks, most station group owners and several
major studios that syndicate off-network programming
(FCC, October, 1994; Jessell, 1995; Stern, 1994). Under
the banner of the Coalition To Enhance Diversity
(CTED), these groups urge repeal of the off-network
restrictions but retention of the network programming
portion of the rule. They maintain that the "original
Diversity 12
motivations for the rule - network dominance and
scarcity of program outlets - are simply not rational
concerns in the 1990s" (New Networks, 1995, p.4).
Those who believe that PTAR should be retained are
convinced that the rule has served its purpose in
encouraging first run syndication and protecting the
interests of struggling UHF independent stations.
Groups opposing repeal include the Association of
Independent TV Stations, Warner Brothers Network (WBN),
United Paramount Network (UPN), and King World
Productions (FCC, October, 1994; Stern, 1994). Uniting
under the organizational title of Friends of Prime-Time
Access, they insist that the repeal of the off-network
r.lAtiQa wniod thp dpvPlopment of the 5th and 6th
networks in their infancy" (New Networks, 1995, p.4)
Lacking on either side of the debate is concern
over the diversity of program content. The burning
question for the FCC appears to be whether the
broadcasting industry and the "public interest" are
better served by permitting affiliate stations to air
old network reruns in prime access (Jessell, 1995).
Most participants providing formal comments to the FCC
Diversity 13
appear reluctant to address the once great expectations
of PTAR I. Krattenmaker (1984) argues that there is no
provable reason to believe that television viewers are
better off simply because more first-run syndicated
programming is produced (p.28).
Section II
The Roots Of PTAR
By the late 1960s, three broadcast networks; ABC,
ps and NBC, dominated prime time television
programming in the United States. Although tens of
millions of people watched each night, and the three
networks were financially successful, many media
ghsavverQ fimaraa thAf fhiuQc ng,fwm-kc wmrel almost too
successful and were not necessarily operating in the
public interest.
From a program-content perspective, many critics
agreed with former FCC Chairman Newton Minow, that
prime time had become, "a vast wasteland" (Barnouw,
1970, p. 196). There was also concern about the sheer
economic dominance of the three networks over all of
television. Although the networks in some ways were
highly competitive, these three media giants also had
Diversity 14
much in common. Concerned media onlookers regarded the
situation as an oligopoly, where the networks
controlled too many broadcast hours and produced too
many of their own programs. The early development of
the network oligopoly has been traced by Long (1979).
His study concludes that the FCC's own rule makings in
the 1950s contributed to this concentration of economic
power (p. 75).
In 1970, after more than five years of extensive
studies and hearings, the Commission issued
an amendment of part 73 of the Commission's Rules and
Regulations with Respect to Competition and
Responsibility in Network Television Broadcasting (FCC,
May 13, 1970). This document concluded that, "the three
national television networks for all practical purposes
control the entire network television program
production process from idea through exhibition"
(p. 389). The formal statement also addressed a growing
concern with the networks' sizable financial interests
in the syndication of "off network" programs to local
stations.
Diversity 15
A Matter of Diversity
This criterion of network dominance was used by
the Commission to explain a perceived lack of program
diversity in American television. Based on a "positive
liberty" interpretation of the First Amendment, the
commission justified its incursion into program content
regulation (Rainey, 1993),
According to Krattenmaker, Metzer & Woodbury
(1984), program diversity should be understood through
three related dimensions; (a) types of programs (ie.
content) (b) sources of programs (ie. suppliers) and,
most importantly, (c) the number of outlets (ie.
channels). The authors suggest that the most practical
means to enhance all three dimensions is to first
stimulate a diversity of outlets (p.26).
However, implicit in all of the Commission's
analyses and recommendations was the notion that an
increase in the diversity of program sources would
result in an increase in the diversity of program
content. By restricting the networks' access to prime
time and sanctioning local and syndicated producers to
create new programs to occupy these access time
periods, the FCC hoped that the vast wasteland would
4 41
Diversity
become a garden of worthy innovative programming.-
without having to increase the number of channels.
Section II
The Results Of PTAR
From the moment it was implemented, PTAR has been
one of the most controversial rulings ever passed by
the FCC. Many early observers believed the mandate
contributed to a decrease in program diversity on the
major networks as well as local stations. Although
unable to support a direct causal influence, Wakshlag &
Adams, (1985) contend that there was a sharp and
enduring decline in network program variety associated
with the introduction of the Prime Access Rule (p. 27).
One of the most frequent criticisms of network
programming in the 1960s was its lack of originality
and intellectual risk-taking. When PTAR was first
enacted, Variety critic Les Brown, made the
observation that by cutting back the number of
available prime time hours, the networks became even
less daring and innovative than before PTAR (Brown,
1971). Fred Friendly, former President of CBS News and
a highly respected professor at Columbia University,
stated that PTAR was damaging efforts to achieve "the
16
Diversity 17
imperative goal of the one-hour nightly news
broadcast...and imposing a destructive economic
hardship on any network that schedules prime-time
documentaries" (FCC Moves to Prime, 1970, p. 34). This
opinion was echoed by Lawrence White, NBC Vice
President of Programming, when he complained that "the
loss of prime time by the networks has reduced the
ability of the networks to present diversified
programming - something we have been under pressure to
do" (Three Negative Views, 1971, p. 23).
Six months after the rule's introduction,
Newsweek called it," A Prime Time Fiasco" (Prime Time,
1972, p.68). As early as 1973, FCC Chairman Dean Burch
was so disenchanted with the rule that he proclaimed
that, "the Commission has simply got to get out of this
business of deciding which programs may run in...prime
time" (Dean Burch, 1973, p. 19). In 1980, a Federal
Court Judge admitted that, "The fact is, as the
Commission concedes, that the degree of diversity in
programming has been disappointing" (National Ass'n of
Independent Television Producers & Distributors v. FCC,
1980). A decade after the rule's inception, an FCC
Network Inquiry staff examined the rule's efficacy and
46
Diversity 18
reported that, "the staff was unable to conclude that
PTAR reduced 'network dominance' in the sense of
increasing the number of outlets or viewing options
available to the public" (FCC, 1980, P. 510). This
formal inquiry also recommended the repeal of PTAR, but
the Commission remained reluctant to take action.
Although at one time the networks had made dire
forecasts of huge financial losses due to PTAR
(Prospects, 1970), the actual results were that both
the networks and their affiliates made considerable
profits. When the networks lost the hour or half hour
of programming time, they followed the rules of classic
supply and demand economic theory and simply raised the
advertising rates for their remaining prog,... on the
local level, stations airing syndicated programs in
prime-access had 30 to 50 percent more minutes of
commercial time to sell compared to what the networks
had once offered.(Brown, 1986). The net financial
effect of PTAR was that both the networks and their
affiliated stations continued to make profits
(Rosenrans, 1990).
Another significant economic result of PTAR has
been the growth of viable independent stations. Airing
Diversity 19
successful off-network programs such as "Cheers" and
"Roseanne" in the 7:00 to 8:00 pm time period has given
major market independent stations parity with network
affiliates in competing for advertising dollars. In
fact, the PTAR exemption has proven to be so successful
that ABC, CBS and NBC network affiliates are now
claiming that they are at a competitive disadvantage
with independent stations (Stern, 1994; New Networks,
1995). PTAR's contribution to the survival of
independent station cannot be ignored, but in terms of
program diversiiy, these stations have thrived because
they have been allowed to air programs that formerly
aired on the major networks.
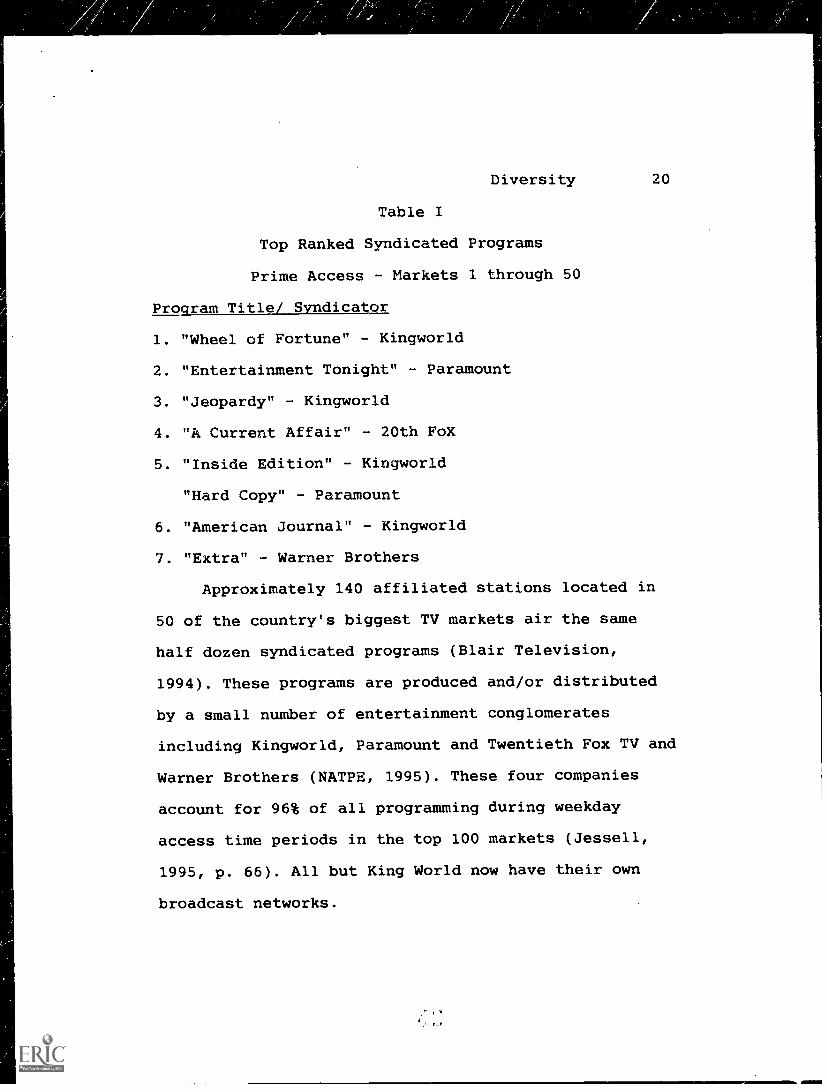
An unintended consequence of the rule's enactment
has been the lack of diversity in the type and number
of production companies that produce most of the
successful first-run syndicated programming for Prime
Access. Table I reveals that throughout the United
States, the time period is dominated by just six
programs and an even smaller number of suppliers.
Diversity 20
Table I
Top Ranked Syndicated Programs
Prime Access - Markets 1 through 50
Program Title/ Syndicator
1. "Wheel of Fortune" - Kingworld
2. "Entertainment Tonight" - Paramount
3. "Jeopardy" - Kingworld
4. "A Current Affair" - 20th FoX
5. "Inside Edition" - Kingworld
"Hard Copy" - Paramount
6. "American Journal" - Kingworld
7. "Extra" - Warner Brothers
Approximately 140 affiliated stations located in
50 of the country's biggest TV markets air the same
half dozen syndicated programs (Blair Television,
1994). These programs are produced and/or distributed
by a small number of entertainment conglomerates
including Kingworld, Paramount and Twentieth Fox TV and
Warner Brothers (NATPE, 1995). These four companies
account for 96% of all programming during weekday
access time periods in the top 100 markets (Jessell,
1995, p. 66). All but King World now have their own
broadcast networks.
Diversity 21
Section IV
Why PTAR Has Been A Disappointment
From its inception, many broadcast professionals
were pessimistic about the intended goals of PTAR. In
1970, Screen Gems conducted a survey of network
affiliated stations in the top 50 markets. The survey
asked General Managers and Program Directors to predict
the future impact of PTAR on television programming.
The results revealed that a large majority believed the
rule would (a) not encourage more original and
diversified programming and (b) would lead to the
deterioration of the over-all quality of TV programming
(Dire Predictions, 1971)
To properly understand the failure of PTAR to
significantly increase program diversity, the rule must
be viewed within an economic framework. Beginning with
the presumption that the business of television is the
selling of audiences to advertisers, five interrelated
factors have contributed to the rule's ineffectiveness.
These factors include (a) the commission's spectrum
management policies (b) the inadequacies of the Nielsen
ratings (c) the theory of Least Objectionable
Programming (d) the program scheduling strategy known
Diversity 22
as stripping and finally (e) the impact of barter
syndication advertising.
FCC Spectrum Management
The regulated structure of the industry and the
often quoted FCC doctrine of "spectrum scarcity" made
television a mass medium by design. The Communications
Act calls for a fair geographic apportionment of
channels to all communities. Multiple services or
programming choices were only a secondary priority in
creating the Commission's channel Assignment Table.
Through its spectrum management authority, the
commission distributed throughout the country a limited
number of VHF stations allocations with a maximum of
three assigned to any one market. A second distribution
of UHF stations was also created with the same
geographic considerations (FCC, 1952). Prior to the
enactment of this master plan (FCC Sixth Report and
Order), there were a number of alternative plans
presented to the commission. Rather than a mixture of
UHF and VHF stations in the same market, these
alternative proposals advocated "all-UHF" or "all-VHF"
markets, thus offering technological parity for
competing stations. To the potential investors of UHF
Diversity 23
stations, this decision to "intermix" markets was an
economic disaster. By 1961 only 5.5 percent of all new
television sets made in the U.S were equipped to even
receive UHF channels (Krasnow, Longley & Terry, 1982).
Suffering from inherent signal reception problems,
UHF stations could not effectively compete for
audiences or advertisers. Bensen, Krattenmaker, Metzger
& Woodbury (1984) maintain that the Commission's
choices to limit the TV band, assign stations locally,
and intermix VHrand UHF stations in the same market
produced an economic situation that "virtually
guaranteed that no more then three full scale, nation-
wide commercial networks could arise" (p. 14). Except
for a brief attempt by the Dumont company in the early
1950s (Hess, 1960), American network *elevision
consisted of just three players. With only three VHS
competitors in any given TV market, there was no
compelling business incentive to indulge small diverse
audience segments with unique programming.
On a local market level, the oligopoly concept
carries over from the national networks and influences
local and syndicated programming airing on affiliated
stations. With only a small number of stations
Diversity 24
allocated to most communities, these "mini-oligopolies"
offer the same low risk, high volume programming in the
7:00 to 8:00 pm time period as the networks do from
8:00 to 11:00 pm.
Television Audience Ratings
Another factor hampering the growth of diverse
program content has been the lack of sophisticated
audience measurements. A program's success or failure
is usually measured by the Nielsen audience ratings. At
best, the ratings are a rather blunt instrument,
measuring only households and age/gender attributes of
an estimated audience (Buzzard,1992). Standard
broadcast ratings cannot reveal subtle qualitative
differencPA among audience segments. For almost 45
years, the TV networks have prospered by selling mass
homogeneous audiences to national advertisers.
Diversity in program content was considered risky.
Instead, the networks applied a program formula that
guaranteed big undifferentiated audiences. The formula
was called LOP - Least Objectionable. Programming.
Least Obiectionable Programming
NBC researcher and programmer, Paul Klein, is
credited with coining the term LOP or Least
Diversity 25
Objectionable Programming. The central idea was that a
program that generated only moderate liking, but was
hated by no one, would draw bigger audiences than a
program that elicits extreme positive or negative
opinions. LOP theory presumes that in a group viewing
situation, a family will probably choose the least
objectionable program (Eastman, 1993, ch 4). There have
been several empirical studies that validate the LOP
theory, including one done by Rust, Kamakura and Alpert
(1992). As long as there are only a few channels from
which to choose, the LOP theory of programming will
prevail.
Strip Programming
Another contributing factor affecting the
perceived lack of program diversity in the access time
period deals with the simple mathematics of program
scheduling. Prior to the implementation of PTAR, the
three national networks provided a different program
each week night at 7:30 pm. During a typical week,
between 12 to 15 different programs were telecast
(Shapiro, 1989). This scheduling technique is known as
"checkerboarding".
Diversity 26
With the advent of PTAR, local stations were
forced to program the same time slot. It did not take
long for these stations to realize it was far more cost
effective to schedule the same program five nights a
week. This technique, known as "stripping", soon became
the standard format for most major market stations
(Eastman, 1993, ch 3). In terms of program diversity,
the mathematics of stripping reduces significantly the
number of program options. At 7:30 pm, instead of a
dozen or more choices per week, viewers today are
usually given no more than three "strip" programs.
Between 1975 and 1977, one syndicated program
supplier, Sandy Frank Program Sales, Inc., attempted to
defeat the anticompetitive nature of strip programming
by petitioning the FCC to amend PTAR with an "Anti-
multiple Exposure" amendment. The Commission refused to
give the concept serious consideration, claiming that
such a rule change would create First Amendment
conflicts involving excessive intervention in program
content, (FCC, 1977). Thus, the Commission basically
said that checkerboarding could not be mandated even in
the name of program diversity.
Diversity 27
In their zeal for more program diversity, the
creators of PTAR failed to take into account the
economies of scale between network and syndicated
programming budgets. While the four major networks can
recover an investment of up $1 million per episode for
a nationally distributed prime time program,
independent syndication producers are confined to much
smaller budgets (Eastman, 1993; NATPE, 1995). By
restricting network and off-network programming from
7:00 to 8:00 pm, PTAR turned the time period over to
less affluent production companies with limited
distribution. The result was a host of inexpensive
"stripped" game shows and tabloid news programs (Brown,
1986; Sterling & Kittross, 1990),
Barter Programming
In the early 1970s, most stations were balking at
the license fees syndicators were demanding for access
programming but soon an alternative to cash payments
was devised that satisfied both parties. Instead of a
total cash payment for a program, the station provided
commercial time to the syndicator. This "barter" time
(usually one minute) was resold to national advertisers
with all revenues going to the syndicator. What began
Diversity 28
as a device to offset production costs and syndicated
rights fees eventually became a huge industry. Today,
virtually all prime access syndicated programming
contains national barter commercials (NATPE, 1994).
According to the Association of Syndicated Television
Advertisers, this $1.5 billion industry refers to
itself as a "Fifth Network" for mass market advertising
(ASTA,1994).
Once again LOP theory comes into play. In order to
be cleared in as many TV markets as possible and
generate high audience ratings for these national brand
advertisers, the syndicated program suppliers must
produce shows that have a broad homogeneous audience
appeal. Regardless of the supplier, the content of a
barter syndicated program remains a captive of a mass
marketing.
Section V
The Channel Explosion And The Future Of PTAR
For decades, the objectives of PTAR were thwarted
by the five interdependent factors addressed in section
IV. It was not until the late 1980s with the
successful introduction of the Fox network and the
growth of cable programming that the original three
Diversity 29
network oligopoly began to experience serious
competition (Eastman, 1993). Network ratings for ABC,
CBS and NBC have dropped significantly in the past ten
years (Eastman, 1993, ch 4). Technological innovations,
such as digital compression and fiber optics, are
facilitating the development of a multichannel
"Information Superhighway". By the year 2000, many
cities will have hundreds of programming options,
including video on demand and interactive capabilities.
With this increase in channels there will soon be
what some scholars call, "The Race For Content"
(Freedom Forum Media Studies, 1994, p. xxiii).
Advertising professionals have anticipated
and welcomed this channel explosion for some time.
In 1990, an article in Inside Media entitled "The Death
of Mass Marketing", envisioned a radically different
media environment that "would respect consumers not so
much for what they have in common, but for ways they
are unique. So the trend toward more segmented
marketing and the use of special interest media...will
accelerate" (p. 54). This anticipated diversity of
program options has placed new pressures on Nielsen and
other research organizations to provide more
Diversity 30
qualitative audience data (Gunter, 1993). After decades
of frustration, a crucial element for significant
program diversity - more channels - has finally come of
age
Section VI
Conclusion
As a weapon to halt the domination of the three
networks and stimulate program diversity, PTAR has
often misfired or, in some cases, backfired in the face
of its founders. Either by choice or by chance the
Commission's spectrum management policies helped create
a three network/VHS station oligopoly that by its very
nature discouraged content diversity. The noble but
naive aspirations of PTAR's decree could not overcome
the economic realities of the television and
advertising industries.
In its recent Notice, the Commission
concedes that "One conceptual criticism of the rule's
current ability to encourage diverse programming ...is
that economic incentives, rather than the source of the
programming, may play the greater role in determining
the program type the public sees" (FCC, October, 1994).
Amen.
Diversity 31
References
ASTA, Association Syndication Television Advertisers.(1994). Syndication: The fifth Network: 1994 Guideto Advertiser-Supported Syndication. SpecialAdvertising section in Advertising Age. (May, 15,1994).
Barnow, E. (1970). A History of Broadcasting In TheUnited States. New York: Oxford University Press.
Besen, S. B., Krattenmaker, T. G., Metzger Jr.,Woodbury, J. R. (1984). Misregulating Television:Network Dominance And The FCC. Chicago, IL:University of Chicago Press, pp. 2-29.
Blair Television Programming. (May, 1994). The MarketReport: Performance By Station (A.0 Nielsendatabase). New York: Author.
Brown, L. (1971). Television The Business Behind TheBox. New York, NY: Harcourt Brace Jovanovich, Inc.
Brown, L. (February 1986). The Law of UnexpectedConsequences. Channels of Communication, p. 19.
Buzzard, K. (1992). Electronic Media Ratihcfs: TurningAudiences into Dollars and Sense. Boston, MA:Focal Press.
Dean Burch Writes Off Access Rule As Failure.(January 15, 1973). Broadcasting, p. 19.
Dexler, D. (April 4, 1990). The Death of MassMarketing. Inside Media. p. 54.
Dire Predictions for Prime-time Ruling.(August 30, 1971). Broadcasting, p. 47.
Eastman, S. T. (1993). Broadcast/Cable Programming:Strategies and Practices. Belmont, CA: WadsworthPublishing.
FCC Moves To Prime-time Rule (May 4, 1970).Broadcasting, p. 34.
Diversity 32
FCC Amendment of Section 3.606 of Communication Rulesand regulations (Sixth Report and Order), 41 FCC148 (1952).
FCC, Federal Communications Commission. (May 13, 1970).Competition and Responsibility in NetworkTelevision Broadcasting. Docket 12782. FederalRegister 35:93:7417-7426.
FCC, Federal Communications Commission (March 2, 1977).Memorandum Opinion and Order in the matter ofMultiple Exposure of Prógrams in Access Time, 39RR 2d 1653.
FCC, Federal Communications Commission (1980). Network .
Inquiry Special Staff, New Television Networks:Entry, Jurisdiction, Ownership and Regulation.Volume I at 510 - 513.
FCC, Federal Communications Commission. (October 25,1994). Notice of Proposed Rule Making: In ReReview of the Prime Time Access Rule, Section73.658(k). MM Docket No. 94-266.
Fin-Syn, Network Financial Interest and SyndicationRules. 23 FCC 2d 382 (1970)
Freedom Forum Media Studies Center. (Winter 1994). TheRace For Content. Media Studies Journal. 8 xi-xix.
Gunter, B. (Summer, 1993). On The Future of TelevisionRatings. Journal of Broadcasting and ElectronicMedia. 359 -362.
Hall, C. W., Batliva, R. D. (Spring, 1973). The PrimeTime Rule: A Misadventure in Broadcast Regulation?Journal of Broadcasting. 17:2, 215-222.
Hess, G.N.(1979). An History of the Dumont TelevisionNetwork. Reprinting of 1960 Ph.D Dissertation,Northwestern University.
Jessell, H. (June 20, 1994). Disney-led coalitionPushing PTAR repeal. Broadcasting and Cable,p.35.
Diversity 33
Jessell, H. (March 13, 1995). PTAR Pros and Cons.Broadcasting and Cable, p.66.
Krattenmaker, T. G. (Fall, 1984). The Prime Time AccessRule: Six Commandments For Inept Regulation.Communication & Entertainment Journal. v.7, 19-38.
Krasnow, E.G., Longley, L. D., Terry, H. A. (1982). ThePolitics of Regulation. New York: St. Martin'sPress. pp. 176-191.
Long, S.T. (1979). The Development Of The TelevisionNetwork Oligopoly. New York, NY: Arno Press.(reprint of Doctoral thesis, University ofIllinois)
National Association of Independent TelevisionProducers & Distributors v. FCC, 516 F.2d 526(1975).
New Networks. (March 8, 1995). New Networks and Fin/SynConcerns: PTAR Rule Making Filings At FCC RepeatPosition. Communications Daily, v15, n.45, p.4.(no author)
NATPE, National Association of Television ProgramExecutives (1995). NATPE Programmer's Guide.
Prime Time Fiasco (March 31, 1972). Newsweek, p. 68.
Prospects of a Blow to Network Billings. (April 27,1970). Broadcasting Magazine. p.19.
PTAR, Prime Time Access Rule, Section 73.658 (k) of theFederal Communications Commission's Rules.
PTAR II, Report and Order in Docket No. 19622, 44 FCC2d 1081 (1974).
PTAR III, Report and Order in Docket 19622, 50 FCC 2d829 (1975)
Rainey, R. R (1993). The Public's Interest in PublicAffairs Discourse, Democratic Governance, adFairness in Broadcasting: A Critical Review of thePublic Interest Duties of the Electronic Media.Georgia Law Journal, p. 269-299.
Diversity 34
Rosencrans, S. (December, 1990). The QuestionableValidity of the Network Syndication and FinancialInterest Rules in the Present Media Environment.Federal Communications Law Journal (UCLA School ofLaw). 66.
Rust, R. t., Kamakura, W. A., Alpert, M. I. (March,1992). Preference Segmentation and Viewing ChoiceModels for Network Television. Journal OfAdvertising.
Shapiro, M. E. (1989). Television Network Prime-TimeProgramming, 1948-1988. Jefferson, NC: McFarland.
Schurz Communications v. FCC, 982 F.2d 1043 (1992).
Three Negative Views of Prime-time Access Rule(December 13, 1971). Broadcasting, P. 23.
Tobenkin, D. (January 2, 1995). New Players Get ReadyTo Roll: UPN, WB networks Prepare to Take TheirShots. Broadcasting and Cable. v125, nl, p. 30.
Sterling, C. H, Kittross, J. M. (1990). Stay Tuned: AConcise History of American Broadcasting. 2d ed.Belmont, CA: Wadsworth Publishing.
Stern, S., Tobenkin, D. (October 24, 1994). FCC MovesOn Prime Time Access Rule. Broadcasting and Cable,p. 7.
Wakshlag, J., Adams, W. J. (Winter, 1985). Trends inProgram Variety and the Prime Time Access Rule.Journal of Broadcasting and Electronic Media. v29,nl, p. 27.
St adult Paper
An Integrated Model for Determining Channel Diversityin a Multichannel Environment
Presented onAugust 8, 1995
Media Management & Economies DivisionALIMC, 1995 Annual convention
By Eun-mee KimDepartment of Communication Studies, Northwestern I lniversity
Rm 12, Harris Hall1881 Sheridan Rd
Evanston, IL 60208(Tel) 708-332- f 854
E-maik eunmeeOrmu.edu
1
1. Introduction
A quick survey of current trade press covering cable television industry tells that
prevailing concern of cable system operators and cable networks, especially those up-starting,
lies at the impact of re-regulation and rate roll-back. Reduced profits of a local systems will
limit the number of new services that the operators might. intend to add and this, in turn, will
result in difficulty of networks in achieving enough level of access to the audience.
Accumulating critical mass of subscribers, which is usually said to be 30 million, is critical for
up-starting networks. There arc numerous new and proposed basic cable networks, some up-
starting and some spin-offs from existing networks, which plan to launch in no time ("New
network ...", cW1levision Aug 8, 1994). These networks try to promote themselves to the
system operators in addition to consumers despite the hostile regulatory environment. in
anticipation of so-called '500-ehanner television environment. Established networks are no
exception in competing with one another to increase access coverage'. Access through local
system carriage is the foundation of business for a cable programming network -whether it is
basic, premium, or pay-per-view network. leonomies of scale are realized from the
network's point of view since first copy costs of program acquisition and programming
(putting programs together as a schedule) per viewer gets smaller as it achieves higher
coverage. Coverage rate of a network depends on each operator's system programming
dision how many channels to putlogether as a bundle and which networks to select..
'The proportion of subscribers who have access to the particular network out of totalcable subscribers in the II.S.
2
Even though spectrum scarcity is not a problem for cable television industry, not every
network, even the best, is guaranteed to have 100% coverage. First of all, there is a physical
limit due to the channel' capacity of the kind of wire used for cabling. This technological
capacity is the primary limitation on how many networks a system can have in its system
programming line-up. A system with channel capacity of 12 cannot carry more than 12
networks without going through some.eostly plant upgrade.
Then the ibllowing questions arise. Is technological capacity only factor determining
the number of programmed channels(channel capacity carrying programming networks)
television viewers can receive? Will '500-channel TV environment' be pa»acea for increasing
the array of services viewers receive since all 500 channels will be programmed with various
kinds of broadcasting and narrowcasting networks'? If there are factors affecting the number of
programming networks a local cable system can carry other than channel capacity, finding out
what they are and in what way they affect. cable system programming in current environment
are imporutnt not only to better understand the current state of cable television industry but
also to make more realistic predictions about the '500-channel world' television without
technological limit.
This study borrows theoretical framework from a model developed to understand
newspaper industry. We can always learn lessons from other mass media industries. A
comparison can be made between bundling diverse sections together in a newspaper and
bundling different programming networks together in a local cable system. Before introducing
lull model, a simplified example seems appropriate at this point. A small local town
Throughout this study, a 'channel' raers to physical conduit ofprogramming, but not the content or programming network.
1;
3
newspaper (for example, 'Evanston Review') cannot have sections such as 'Woman news' or
'Good eating', which are included in big city papers such as 'Chicago Tribune'. 'Ivanston
Review' is not technologically limited from including those minorinterested sections in its
paper. I lowever, 'Evanston Review' is economically constrained from doing so. Because
with smaller subscriber base 'Evanston Review' relies on, it is simply not economically viable
to have all the diverse sections that 'Chicago Tribune' would have. Smaller subscriber base
means less subscription revenue and less advertising revenue that can sustain such diverse
contents.
Are small cable systems free from such economic constraints that 'Evanston Review'
faces in this example'? Will technological upgrade solve all the constraints and make even
systems serving small number of cable subscribers carry as many programming networks as
big urban systems have?
Economic constraint of the local market is not. solved by technological advance alone
since an operator must decide the number of channels to program based on marginal revenue
and marginal cost. its own market incurs. That is, an operator would add a network as long as
the marginal revenue potentially earned from adding an additional network covers the marginal
cost (such as added operating cost and transaction cost) it incurs. l',ve» though there are more
programming networks than available channel capacity in the systems, some operators might
choose to program only certain number of channels that is economically viable leaving some
portion of channel capacity unused.
Ultimately, the willingness for consumer to subscribe to cable depends on the quantity
and the quality of the programming the local cable operator in its area offers. On the other
hand, cable operators adjust quantity and quality of service in addition to marketing strategies
and infrastructure investments so as to maximize returns under each circunistance(I lazlett,
,;
4
1994). An operator decides how many and what kind of services its system offers based on
the economic condition of local market in which a system is located as well as the
demographics of the service area (assessment of potential and actual subscriber preferences).
Although 100% coverage (that is 62% of total TV households in the U.S. as of this writing) is
ideal for every programming network, the rate cannot but be constrained by economic factors
affecting local systems' carriage decisions. Cable systems need operational flexibilitY so
that they can properly respond to market changes and regulatory structure changes, and for
tlmt reason alone some systems might not want. to maximiie the number of programmed
channels up to the channel capaeity(Solomon, 1989). Some networks are bound to be left out
li-om being carried. Varying rate of coverage determines the competitiveness of the
pregramming networks. 1993 Myers Reports Survey_ofCabIc..0.perator_l!,xecutivcs.mi.13asic
Netyks shows that the majority nuMber of the up-starting networks are only considered by
less than 5% of the systems surveyed. To some extent, competition among the wholesalers of
cable programs, that is, programming networks, is determined by the system level
programming decisions. Chipty(1993) listed three kinds of effects local system's carriage
decision had on the profitability of programming networks: advertising revenue, popularity of
the network (externality), and quality of programs. Studying cconomk: factors affecting local
cable system programmiog will be a starting point in understanding why only a limited
number of networks survive in cable television industry.
It has been often assumed that.the number of programmed channels of the local system
increases and thus more networks become viable with higher coverage as long as channel
As 'programming' means putting programs together in a schedule, 'system programminr!can he defined as putting programming services or networks together in a cable system servicepackage to subscribers.
capacity increases to contain them. It was the kind of optimism that prevailed in the Sloan
commission report (Sloan Commission, 1971) in the early days of cable television, which
resurrected recently with the '500-channeP scenario. This study attempts to find out economic
factors affecting local system operators' system programming decisions. And as we have
many more emerging video delivery technologies of multichannel nature which emulate the
programming, operation and managemeht of cable television, it. is meaningful to examine the
behavior of 'okl industry at this point of time.
'I'he following section reviews why studying the determinants of pi ogrammed channels
in a cable system is important along with Wildman model of newspaper content. diversity
which will be used as a major theoretical framework. Section 111 deals with literature review.
Section IV proposes an integrated model tor determining channel diversity (defined in section
II), which is empirically tested in the subsequent sections. Section V as a brief description of
data and method. Section VI reports results of statistical analysis and section Vli concludes
with discussing implications of the result.
'1'heoretical framework
1. Channel diversity
Programs and the audience they attract are the products by which media industry's
performance is measured. Diversity in programming has been one way to evaluate the
television industry. Diversity is not only important to increased consumer surplus, but also
has the political value of providing citizens with more information and access to a wider range
of viewpoints. I lowever it. is hard to define or measure diversity. There arc numerous ways
to approach diversity.
Scholars of communication and economics have tried to measure diversity in television
network programming in relation to economic factors such as the level of market
concentration, competition among networks, and the number of channels over many years. To
list, a few, Greenberg and Barnett (1971) examined the relationship between program type arid
the number of channels; Dominick and Pearce (1976) found market concentration inversely
correlated with diversity; while Litman (1979) found just. the opposite. These scholars
measured diversity by the number of program types (which are commonly stated as program
genres) available within a given time and the range of viewing options available within a
program type.
Diversity is multi-dimensional in terms of the scope of the definition and also across
time. It can-be the number of program types or it can be the number of options available
within a particular type. 11. can be examined across channels at a given point, of time oi
kmgitudinally.
The following studies have examined the diversity of cable programming. Wildman
and lee(1989) examined program repetition rates and also devised a diversity index based on
an industry definition of the program genre. Waterman and Grant (1991) analyzed
programming origin, subject, and format of 3 over-the-air broadcasting networks and 34 cable
networks during 1986. De Jong and Bates (1991) defined diversity as the number of networks
cable system operators carry. Waterman (1986) offered an explanation for why direct pricing
of programs to viewers and increased channel capacity could not bring the 'narrowcasting. of
'high culture' programming into being. Ile pointed to a shortage of demand a shortage of
viewers with high willingness-to-pay as the critical factor. And he also pointed cut that.
increased channel capacity was not used for new and fresh kinds of programming but for
program repetition within a channel and intermedia repetition (sequential windowing) of mass-
appeal programming.
As inentioned above, diversity is a complex concept and it can be measured in many
different ways. Whichever way it is measured, defining diversity requires a lot of subjective
judgement and has unavoidable limitations. lt. is hard to refute the argument that every
program is different. and at the same time one can say that all programs are essentially the
same. Owen(1977) argued, while pointing out the limitations of counting the genres/formats
as a way to measure diversity in television programs, that it is unreasonable to assume that
consumers do not obtain some positive utility from having choices among substitute p ov yams
within the same basic format andlhat diversity of format/genre is unrelated to any measurable
economic index of consumer well-being. Information about consumer demand for program
genres/formats is very difficult to collect.
l'ollowing Owen's view on diversity, this research regards the number of channels
programmed by an operator as one way of measuring diversity in a multichannel television. In
this definition, channel includes the numbers of over-the-air channels, distant broadcast
signals, basic and premium cable networks, public access channels, and pay-per -view
channelsthe number of total channels programmed by an operator. l'ach network carried is
assumed to be equivalent to I hypothetical unit, of diversity. Assuming no two identical
programs are aired at the same time by more than one cable channel in a system, one
additional channel programmed by an operator means that a subscriber/viewer has one more
program to choose from at a given point of time.
2. Wildman model of newspaper section-bundling
8
Wildman model(1991, lecture; 1994) of newspaper content diversity addresses why
sections of a paper are added or dropped. This model provides a framework which can be
applied to the examination of the diversity in cable system programming.
Let. Fi = First copy. cost of section i
MCi = Marginal cost per copy of section i
Si = Fraction of subscribers that read section i
C = Circulation of the newspaper
Ri = Revenue generated by a reader of section i.
When deciding whether to add section i to the paper, a newspaper publisher will equate
revenue generated by adding section i with thc cost it incurs and will add a section H. the cost.
is equal or smaller than the revenue expected. This condition is written as
Ri * Si * C (MCi *
If we rearrange this equation, we have critical threshold proportion of subscriber on which the
decision for adding a section depends on. I ,et this critical fraction of subscribers be st
, (vici I Ri) + (Fi / Ri*C).
This final equation tells that as cost relative to revenue goes up the critical threshold
also goes up. Moreover, it suggests that. with large circulation critical fraction of the readers
that. makes a particular section financially feasible goes down.
According to the model, larger circulation reduces critical fraction of the readers that
makes a section financially viable. For example, while a paper with circulation of 100,000
needs only 10% of its readers' interesi in the new, say, 'womenews' section which it considers
adding, another paper with 10,000 readers need 100% of its readers' interest in the newly
proposed content to offer a comparable addition. With large group of readers, more diverse
sections can be published. In addition, each section comes to have higher quality since more
9
money is invested in anticipation of subscription and advertising revenue based on the size of
readers. These factors make the paper with large circulation more attractive to the audiences
with wide ranging interests. Bundling of diverse features in a paper can be compared to
bundling of diverse programming networks in a cable system despite a number of diarences
between the two media. At the heart of the analysis is a more general model of inter-temporal
inter-media flow of media products (Wildman, 1994).
This model of newspaper sectibn-bundling suggests that. the primary relationship
between the number of programmed channels and the number of cable subscribers in the
system area should be examined. The model predicts that, as the number of subscriber
increases, the number of programmed channels offered in a system will increase holding all
other factors constant. The larger the subscriber base, an operator would put more video
programming up to the point where marginal revenue-subscription revenue and advertising
revenue- becomes zero.
An operator can expand revenue by the ancillary services such as pay-per-view and
subscription to premium channels. The amount of ancillary revenue becomes larger when
subscriber base is large. An operator might still want to increase the number of programmed
channels as long as the cost of adding a channel is justified by just maintaining current
subscription rate (that is, reducing the churn rate). The relationship between subscriber base
and channel diversity should be measured holding the channel capacity constant since it poses a
limit to thc number of channels possibly programmed.
An integrated model proposed and tested in the study is an application of the theoretical
reasoning explaining newspaper content diversity. In determining the primary relationship
between subscriber base and channel diversity of system programming, economic factors
affecting revenue and cost of local cable systems will be incorporated in the integrated model.
1 0
It should be acknowledged that newspaper and cable television are two entirely
different industry. The model here is presented as an example of general model defining the
relationship between quality of the media product. and market sin. Market size determines
expected revenue and investment on the product is made according to the amount of expected
revenue. In general, product quality is higher in larger markets.
Ill. Previous research
Unfortunately, there has been little research to date which has focused on systematic
analysis of cable system programming. Paucity of previous literature partly reflects lack of
research in the area of cable television as a whole. The differences among systems in terms of
the number of available channels not in use and the reason behind it have not been addressed
yet. I lowever, the factors affecting the profitability of cable system (thus affecting marginal
cost/revenue of adding a programmed channel) have been explored in the following studies.
I ayib lity_ of (ableWeins
Vogel (1990) points out that. profitability of a cable system is usually measured by
population density of the area the system serves and cable penetration figure since much of a
system's operating cost is fixed and independent of subscriber numbers and the only major
variable costs arc drop charges and the cost of installing converter boxes. It means that there
is economies of scale realized by population density and system size.
Some factors were found to positively affect basic penetration, which results in revenue
increase. The more stations a system carried, the fewer of each type of UFA stations
receivable, the older the system was, the farther away the area was from ()TA stations, the
lower the price was, and the higher the average household income was, the higher the
penetration rate was. Park(1971) also acknowledged that the cost. factors might limit the
number of services a system can provide. Work on the costs of cable systems suggested that
penetration on the Order of 40 to 50% were necessary to support advanced local origination.
Baer & Park (1972) conducted financial projections for the Dayton Miami Valley area
and revealed that financial results varied depending on subscriber penetration, monthly
subscriber fee, and characteristics of geographical area covered.
Woodard(1974) suggested a list, of criteria by which a franchise area's viability as a
cable market could be evaluated. They were: Size in terms of the number of subscribers.. cost
of plant, number of franchise, population density, penetration rate, community growth in
terms of new homes as potential subscribers, state of the economy of the community, peso=
of local college or university both as a potential programming source and as a measure of
culturally up-scale audience, cost-of-living index, estimated average subscriber billing,
availability of I'M radio stations, franchise terms, potential advertising time sales, and
application expense. Ile, also emphasized the availability and the number of local television
stations. I Ic recommended cable systems to give the subscribet s maximum number of
programmed channels as an incentive to subscribe.
Kent G. Webb's (1983) book titled The economies of cabledelevision is devoted to
various economic aspects of cable television. Especially relevant to this study is econometric
analyses estimating cost and demand Of cable television.
Sources of cost were categorized into equipment, programming cost, operating
expense, and franchise fee. lquipment cost consisted of headend, distribution plant,
subscriber interface, and studio fbr local origi»ation. Operating expense was mostly labor
12
cost, especially technical labor. lle estimated operating cost and depreciation cost, in his
econometric equation, on the basis of miles of plant and size of the system in terms of
subscriber count, l le concluded that cable system was a natural monopoly with declining
average total cost with the number of channels, number of subscribers, and size of the
geographical area (miles of cable). l le also pointed out that most dramatic is the declining cost
per subscriber given a cable system of a fixed channel capacity and length of plant. Part of the
reason was spreading headend cost. Since he used 1982 data, we should be cautious in
accepting the results as of today.
Among statistically significant socioeconomic variables determining demand of basic
cable were per capita income, index of home equipment, and education. Amonp the most
important determinants of demand for basic cable were the number, type, and quality of
signals carried by the system compared h. Lose available over the air in the local market.
Imported signals resulted in increasing penetration and consumer surplus while marv i intl cost
of adding an imported signal was quite low.
Pacey(1985) tested a model of the demand for basic service. Iler independent variables
were factors describing cable system, subscriber demographics, and local market
characteristics which she called environmental characteristics. OTA signals were separately
entered as primary network, duplicative network, independent, educational, and local
origination. What was unique about the study was that she included pPy television
characteristics in estimating demand for basic cable. Among the findings were that urban
subscribers were more likely to be responsive to subscription fee than rural and that demand
for basic cable was quite elastic with respect to the price
(!hannel diversity_ol.cabk': system_programming
7U)
of cable television.
13
Eastman(1989) lists 4 elements affecting system programming: Legal carriage
requirements, technology, economics/cost which are license fee, signal importation fee, spot
availability, promotional support, satellite placement, and marketing considerations meaning
demographic and psychographic composition of coverage area local audience. Demographic
factors arc commonly understood as a major determinant of the mix of cable networks.
Dejong & Bates's (1991) study on channel diversity defines diversity as the number of
channels. They tracked absolute and relative diversity according to the definition of
1,evin(1971) at three points of time. Absolute diversity was operationalized by the number of
different channel types carried by a system divided by the total number of channel types' for
the cable industry. Relative diversity.was operationalized by the number of different channel
types divided by the. channel capacity of the system. Diversity was measured at three points
of time, 1976, 1981, 1986, roughly responding to periods of high, moderate, and no
regulation. They found that. diversity increased over time. But., the growth in relative
diversity was substantially less than that of numlnr of channels, and the relative and absolute.
diversity measures indicated that the average cable systems offered less than half of its
potential for diversity. Thc authors believed that. greater channel capacity and regulatory
freedom fostered the growth and expansion of cable.
41'hey categorized available programming services into 32 different types followingindustry conventions.
!l'hey acknowledged that measuring diversity was problematic. They relied on industrysources for the typology of channel types. It is somewhat easier to categorize channels thanindividual program since each cable programming service, for their own marketing need ofpositioning, has its own identity. llowever, it does not eliminate the question of internalvalidity. Ii is an empirical matter whether the actual consumer perceives two programmingservices in the same channel type as substitutes.
14
I lowever, the authors did not provide any answers as to why cable had not lived up to
its full potential, as to why a system operator had channels not in use when there were more
than enough programming services to fill up to the channel capacity. Their research was
limited to be descriptive in nature. Channel capacity might remain an economically scarce
commodity despite the advancement of technology. This study aims to p.rovide answer for
that.
The relationship between channel capacity and channel diversity should be considered
with a caution that. capacity is given as.an exogenous variable Once constructed. It is possible
that. a system with large capacity programs only small number of channels because the overly
optimistic inlörmation estimated at the time of franchise application and construction can be
corrected over the course of operation as more. accurate infornmtion on the profit potential of a
specific market is revealed..
An econometric analysis of competitive effect of broadcast signals on the performance
of cable, controlling system and local market characteristics was done by Dertouzos &
Wildman (1990). Performance of cable system was operationalized in three ways: subscriber
counts, program service offerings, and prices of these services. System related control
variables were length of system, homes passed, age of headend, channel capacity, and whether
or not the system is managed by an MSO. Market demographics included ethnic composition
of population, projected population growth, employment, income, home and VCR ownership,
and geographical location of the system. The study concluded that five GI'A signals
constituted effective competition to local cable system. The effect of system and market
characteristics on basic cable programming was also dealt in this study. Channel capacity,
projected population growth, MSO, and to the lesser extent employment were statistically
significant variables influencing the number of basic services the system offers.
I 5
Smaller systems expand the number or basic networks rapidly with increases in channel
capacity. As capacity grows beyond fifteen, the percentage change in basic offerings increases
less rapidly.' These results of cross-sectional analysis mere similar to what Dejong & Rates
(1991) found in their analysis that increases in channel diversity were less than those in
channel capacity over time. '1'he results show that marginal value of an additional channel
tends to decrease as channel capacity expands. Additional subscribers picked up by one more
programming channel should be increasing at a decreasi»g rate. There. are other economic
factors limiting thc number of services carried in a system, which this study will find out.
Rural areas, areas with higher population growth projection, MS0 managed systems and
systems facing higher competition from OTA 'I'V carried more basic networks.
n their another study, Dertouzos & Wildman (1993) emphasiied that the cost of
running a cable system made critical difThrences between markets and that factors which
accounted for the systematic difference between systems should be accommodated when
studying cable television. According to their analysis, system age largely dictates channel
capacity which is a driving force behind channel diversity. In addition, younger systems are
more likely to have more service and/or less expensive in regards to its basic service because
operators can expect higher ancillary revenue tlirough technological capacity such as PPV and
local commercial insertions.
Thorpe(l 985) did a study of the effect of competition from non--cable programming
service on the market power of cable system. A part of the study explored the factors
afThcting programming decisions of a system:. the total number of cable channels programmed
and the number of pay television programs offered. Population of the franchise area and
study included top 20 basic and 4 superstations. The numbo of networks carried is2,1 at maximum.
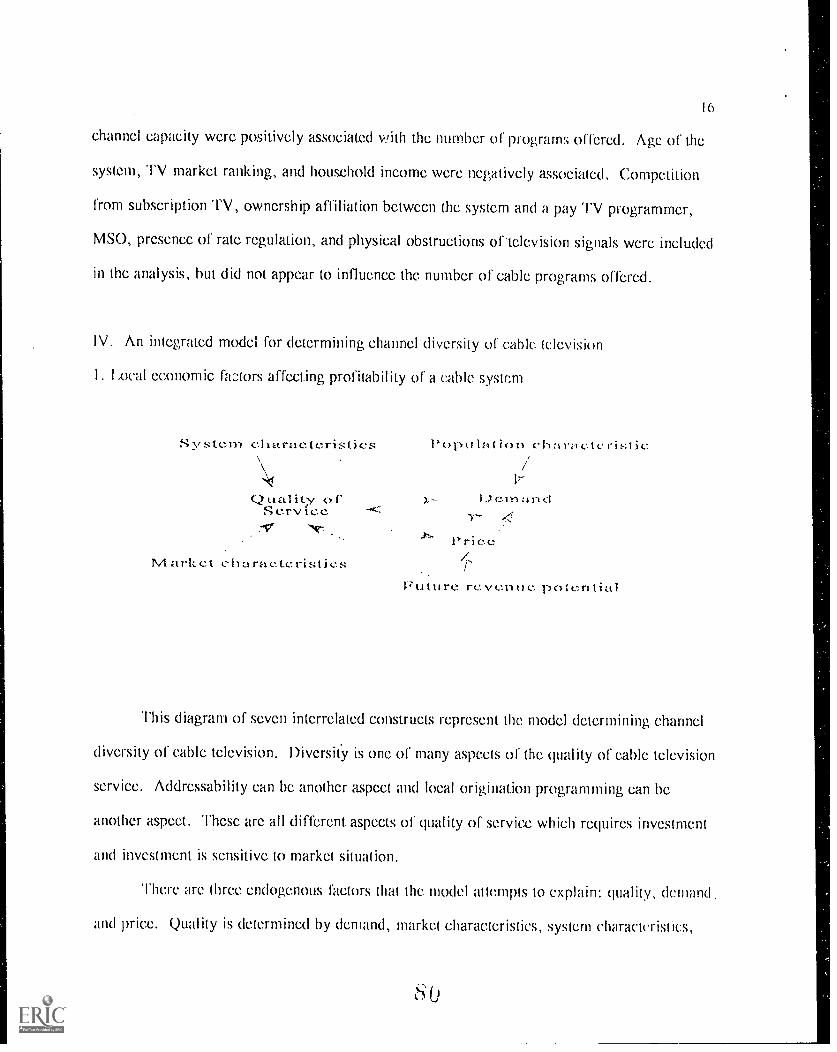
I 6
channel capacity were positively associated with the number of programs offered. Age of the
system, TV market ranking, and household income were negatively associated. Competition
from subscription TV, ownership affiliation between the system and a pay TV programmer,
MSO, presence of rate regulation, and physical obstructions of-television signals were included
in the analysis, but did not appear to influence the number of cable programs offered.
IV. An integrated model for determining channel diversity of cable television
I. I x.)cal economic fntors affecting profitability of a cable system
System ellaracteristics\,
Quality orService
Market characteristics
Population ehtsraelcvistic
anci4
Price
Future revenue potential
This diagram of seven interrelated constructs represent the model determining channel
diversity of cable television. DiversitY is one of many aspects of the quality of cable television
service. Addressability can be another aspect and local origination programming can be
another aspect. These are all different aspects of quality of service which requires investment
and investment is sensitive to market situation.
There are three endogenous factors that the model attempts to explain: quality, demand,
and price. Quality is determined by demand, market characteristics, system characteristics,
17
and future revenue potential. Demand is affected by quality of the service., price, and
population characteristics. And finally price is a function of market characteristics, system
characteristics, which together determine costs of running a cable system, and quality of the
service. Quality variable that will be analyied in this study is total number of programmed
channel. Dernand variable is the number of subscribing households each system has. Price is
operationalized as the price tor subscribing the most basic tier and the price for most
comprehensive basic package. Systems differ in terms of tiering basic cable package. Both
price measures vill be used initially to See which One fits better for the model.
Waterman & Weiss (1994) noted that per channel cost is fixed with respect to the number
or subscribers and represents the cost of maintaining and marketing an eytra channel and
contractinr, with the network, plus the opportunity costs or not carrying WmIle. third network that
is also available. And operators will add channels as long as marginal cost oladdhig a channel
equates with marginal revenue. With per channel cost fixed and marginal revenue declining in
larger channel systems, it is expected that channel diversity increases with the market Si/E,
measured by subscriber base, but at a decreasing rate. The primary relationship this study
attempts to probe is the one between quality of the service ;rid market siv.e. (demand).
iach theoretical construct in the above diagram is represe»ted by several variables.
The following variables affect cost and revenue for running a system. The variables and their
expected relationship with exogenous variables are discussed.
(I). Market characteristics
A. The number of local broadcast stations
Competition from other home entertainment media affects profitability of cable
systems. An operator, facing higher competition, is likely to increase the quality of service
including channel diversity. With other forms of multichannel service such as DBS or MMDS
still in the nascent stage, broadcast television is the key source of competition for cable
television operators.
R. The proportion of population dwelling in the urban environment
Other than broadcast televisiofi environment, there is a gap between urban and rural
areas in terms of general entertainment options. Urban environment will have a lot more
entertainment options alternative to cable television. On the other hand, urban lifestyle and
rural lifestyle might differ in terms of demand for television entertainment. I low urban and
rural markets differ in terms of cable television quality and (lemand will be examined in the
study.
C. Density
!lousing density is measured by the number of households passed by cable per line
mile. llousing density is a key factor determining operating cost of a system including cabling
costs. The systems located in denser housing area are likely to carry lower cost of maintaining
the system holding other factors constant.
I). Average wage

1 9
As with any other business, higher wage level increases cost of running a system.
I lowever, average wage also affects income level which has opposite effect on the profitability
of running a cable system.'
E. Income
Median household income in 1989 is used to measure the income level of the area. It
is known that those with higher income are more likely to subscribe cable. In addition, higher
income audience increases attractiveness of the medium to the advertisers.
(2) Fut tire revenue potential
A. Retail sales growth rate
Retail sales growth increases local advertising demand, resulting in the increase of
marginal revenue by adding a programmed channel. Average mail sales growth rate of the
arca over last 5 years is used.
B. Projected population growth rate
Systems located in the area with higher population growth projection have higher
incentive to increase quality of service since potential market is expanding. Higher population
growth will positively work for channel diversity.
(3). System characteristics
Illivariate correlation coefficient (r .63) between average wage and income was high, butnot so much as to cause serious multicollinearity problem in the regression.
20
A. Channel capacity
Channel capacity means the maximum number of channels that. the wire can transmit
within the Mtended service area. In Dertouzos & Wildman (1993), channeWpacity was
significant factor in determining the number of basic network a system carried. Channel
capacity physically limit the possible number of the service provided. Marginal value of
available but not in use channel can be higher in a system with smaller channel capacity.
Webb(1983) found out that the operating expense (excluding programming costs) was
not measurably different. for a 12-channel or 36-channel system. It means that the aveyage
operating expense per channel declined as the number of channel increased. _
According to_l_993 Myus Report, 20.6% of 603 cable system executives interviewed
said that they had no channel capacity expansion plan at the. time: That corresponds to 42.0%
of systems of under 0,000 subscribers and 26.4% of systems with less than 49 channel
capacity respectively while only 5.8% of the systems with 50,000 or more subscribers and
17.5% of systems with 49+ channels had no plans for expansion. Systems serving smaller
number of subscribers arc less likely to expand channel capacity.
R. Age of the system
Older systems are expected to have smaller channel capacity. Moreover, newer
systems are likely to have improved amplifier which can enlarge channel ea However,
considering the accumulated marketing efforts of older system, the penetration rate is likely to
have large subscriber group (probably at the saturation stage).
Age of the system also makes difference in other technological capabilities such as pay-
per view, addressability, and local commercial insertions. With the basic cable rate held
constant, system operators have higher incentive to increase nu mbei of channels offered in Ow
2 I
basic package because of the higher ancillary revenue from the subscribers(Derfuwos
Wildman, 1993).
Older systems are more likely to be located in poorer O'l'A television reception areas.
C. MSO management
It needs to be questioned whether MSO-managed systems are better for consumer
welfare in terms of programming service, that. is increased channel diversity. If MS() systems
are indeed better and efficient, channel diversity should increase as the size of the MS0 gets
larger holding other key factors constant. It is operationalind as the number or systems
nationwide managed by the given MSO.
E. Vertical integration
Systems vertically integrated with programming networks have higher incentive to
carry integrated network, which can add to the number of channels programmed. But on the
other hand they also have incentive to reduce the »umber of networks competing with the
integrated network for viewership. ln that case integrated relationship can negatively affect
channel diversity.
(4) Population characteristics / Demographics
Demographic variables which are expected to influence the demand of cable television
or Tv viewing behavior should be included. Previous research indicated that age, the number
of househokis with children, education, household sin, and income were among the key
demographic factors affecting demand for cable television.
22
Younger, higher-income, and higher-educated population is more likely to subscribe
cable. Also households with children and those with larger family are more likely to do so.
Diversity of the population should be positively related to channel diversity.
2. The model
As mentioned above, the two major dependent variables arc channel diversity(l'O'l'AC)
and the size of subscribing households(IIIISUB). However, one becomes an independent
variable to each other. As diversity increases there is higher incentive for a viewer to
subscribe cable as long as a viewer can derive utility from getting a diverse menu ol television
programming. I f a viewer derives utility only from getting a clear reception of ovei the air
signals. which indeed is known as one of major reasons for subseribinp cable, diversity might
not matter much for those viewers. I lowever, it is reasonable to assume -that a viewer
perceives the quality of cable television higher when there arc. more channels offered in the
service. On the other hand, as explained earlier, a system operator has higher incentive to
offer more channels when it has more subscribers to serve.
Therefore, according to this model of reciprocal relationship(simultaneous equation) the
variable 'diversity' (total number of programming services programmed in a system) is
explained by the number of subscribing households (I II MB) and all of the independent
variables. For example, the demographic variables such as 'AGH50' and 'Ill !SIZE' affects
channel diversity even though in the diagram above it looks like it only affects the number of
subscribing households. They affect channel diversity indirectly through the variable
In the same way, 'Ill NUB' can be explained by diversity and all other
independent variables in the model.
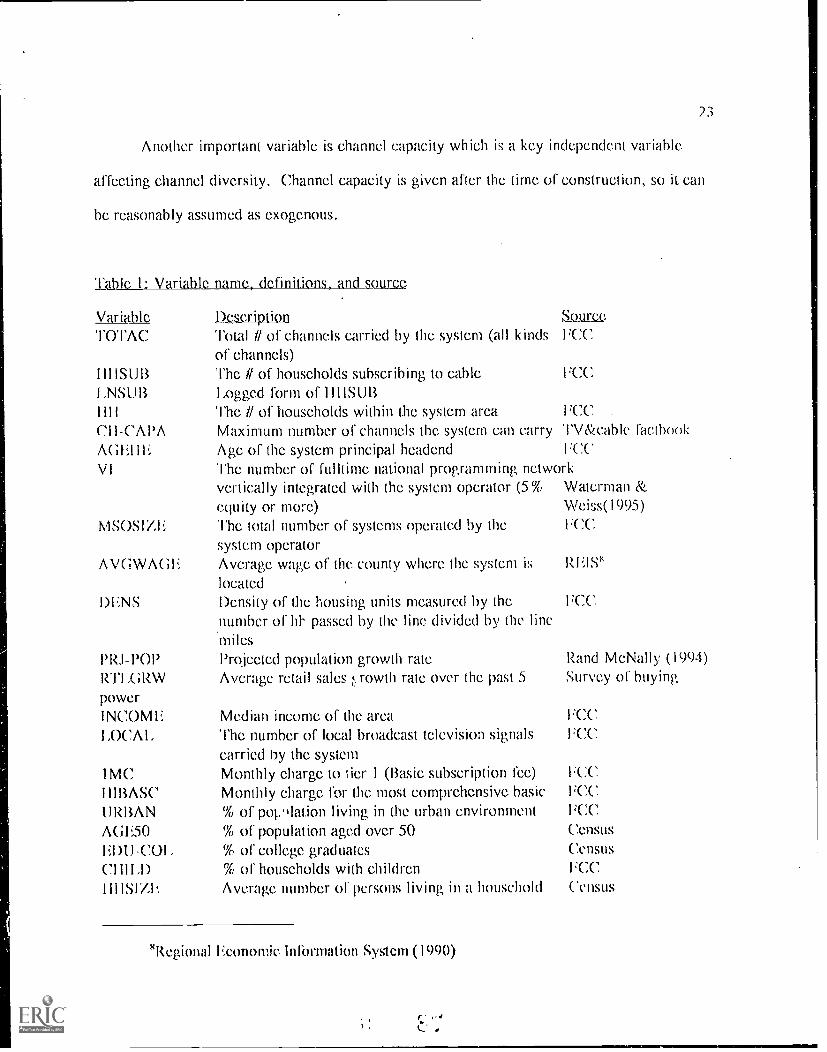
Another important variable is channel capacity which is a key independent variable.
affecting channel diversity. Channel capacity is given after the time of construction, so it can
be reasonably assumed as exogenous.
Tableat,1111' le name, definitions, and source
Variable Description SSR111W
Total it of channels carried by the system (all kinds l'CCof channels)The it of households subscribing to cable FCCI,ogged form of IllISUR
HI! The if of households within the system arca l'CCCll-CAPA Maximum number of channels the system can carry TV&cable lactbookAMIE Age of thc system principal headend 1:(
VI The number of fulltime national programming networkvertically integrated with the system operator (5% Waterman &equity or more) We iss(1995)
MSOSIZE The total number of systems operated by the FCCsystem operator
AVGWAGI Average wage of the county where the system is REIS'located
'DINS Density of the housing units measured by the l CCnumber of passed by the line divided by the linemiles
PRJ-POP Projected population growth rate Rand McNally (1994)RTI.GRW Average retail sales .rowth rate over the past 5 Survey of buyingpowerINCOMF Median income of the area FCCLOCAL The number of local broadcast television signals FCC
carried by the system1MC Monthly charge to tier 1 (Basic subscription fee) 1:CC
11113ASC Monthly charge for the most comprehensive basic FCCURBAN % of poplation living in the urban environment FCCAGE50 % of population aged over 50 CensusHDIJ -COI % of college graduates Census
'CHILD % of households with children l CC1111SIZE Average number of persons living in a household Census
'Regional Economic Inlormation System (1000)
The major hypothesis is that. subscriber base will be a strong predictor of channel
diversity holding the channel capacity (am! other economic factors) constant.
large subscriber base would make it. viable for a system to have more channels
programmed. Various factors affecting marginal cost and marginal revenue of adding a
programmed channel will also determine the channel diversity. Population (audience)
characteris will also matter.
The number of channels to program in a cable system will vary as a function of local
market condition, system-specific characteristics, and demographic characteristics. Since
relative revenue and costs are related to such observable factors, predictions could be made
about. the circumstances under which a system is more likely to increase channel diversity. As
capacity increases, there should be a point where consumers get less redundant arid truly
diversified service from the cable system of the area.
V. Method o data analysis
The study analy7es 1.CC cable *IN nktc; s.u_rvey database collected through December..
1992 and February, 1993. Since the period is pre-regulation (of 1992) it is assumed to reflect
market solutions without. (listorlions possibly introduced by regulation. There are 496 cases in
the final data set but this study used a subset, of random non-competitive systems which were
244 cases in total. Excluded cases were purposive sampling of top 100 systems, small
systems (less than 30% penetration) and overbuild systems. The unit of analysis is a cable
system.
Additional information was added to the original FCC database Channel capacity was
recorded from Televisim & Cable Factliliok (v61). Population growth projections by county
25
were recorded from Rand.MeNally Commercial &__Marketirr Atlas.(1994). Retail growth rate
over the past 5 years by county was compiled and computed from Survey of buying
power(1993. 1992991, 1990. 1989). Additional demographic information such as average
family size, education, and age group was added from 1990 Population 84. !lousing ,cCaus_.
Since cable systems are varied in terms of their profiles, a multivariate econometric
analysis is desirable to account for the differences among the local cable systems. l'conomic
factors(including audience factors) that might constrain channel diversity of a local system
could be fully explored through data containing local characteristics.
Two-stage least. squares estimate was used for the simultaneous equation multiple
;egression analysis. This particular type of regression estimate was necessary since the two
key dependent variables in the model arc at once independent variables to each other. Two
stage least squares estimate purges the correlated errors introduced by this mutual relationship
and correctly measures two equations determining each dependent variable.
V. Results
'1'he following model with three endogenous variables. TGI'AC, 1111St113, and
MC/111BASC (for th; pric,._ measure) was initially put to a test. It turned out that the
relationship between channel diversity and the number of subscribers was curvilinear.
Diversity increased as the subscriber basc increases at first and then beyond certain point did
not increase. Natural log of 1111SUB(l ,NSUB) was used in place of 1111SUB to make the
curvilinear relationship fit for the linear model. Transforming I II !SUB into INSI113 resulted
in a nice lineat relationship between the two kcy dependent variables.
tr.
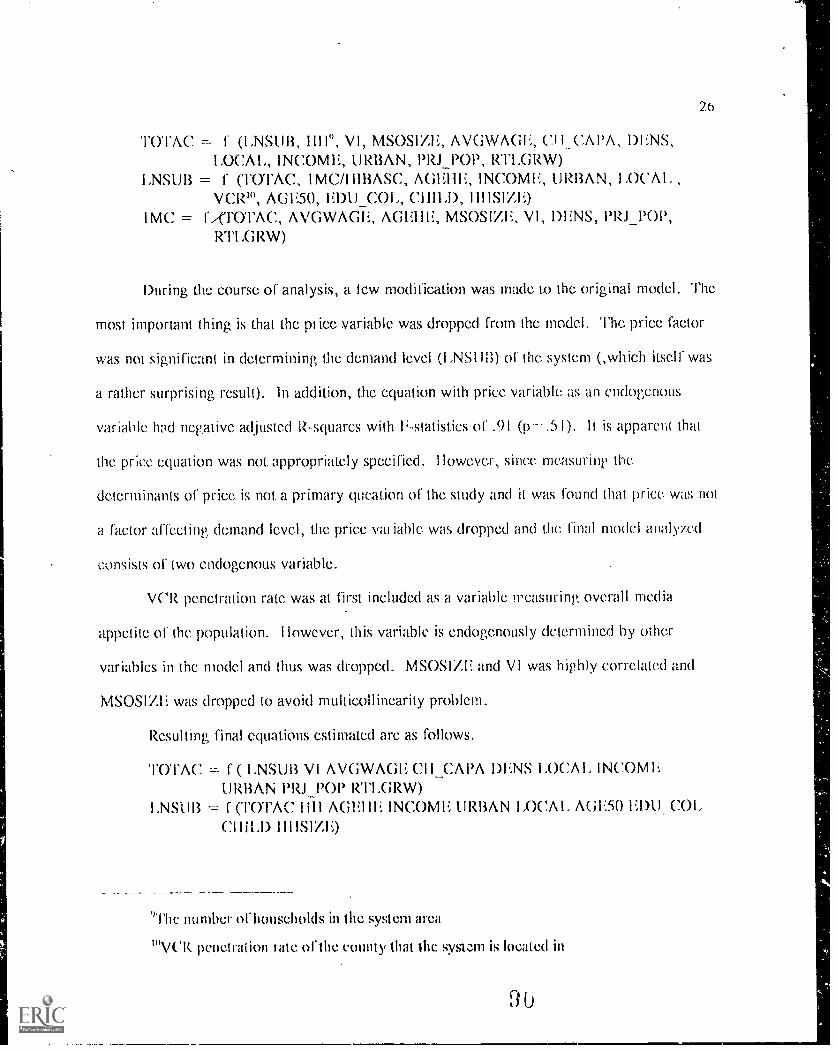
2()
TOTAC f (ENSUI3, Ill 14), VI, MSOSIZE, AVGWAGI;, CII CAPA, DENS,LOCAI INCOME, URBAN, PRJ_POP, RTI,GRW)
LNSUB = f cl'OTAC, 1MC/l IIBASC, AGEI1E, INCOME, URBAN, I AWAIAG1',50, EDU_COI (MA I IllS IM
1MC = f rornc, AVGWAGE, AGE1lI, MSOSIZE, VI, Dl;NS, PRJ_POP,RTI,GRW)
During the course of analysis, a few modification was made to the original model. The
most important thing is that the price variable was dropped from the model. 'I'he price factor
was not significant in determining the demand level (I ,NSI113) of the system (,which itself was
a rather surprising result). In addition, the equation with price variable as an endogenous
variable hmi negative adjusted R-squarcs with F-statisties of .91 (p- I). It is apparent that
the prk:e equation was not. appropriately specified. However, since measuring the
determinants of price is not, a primary queation of the study and it was found that. price was not
a factor affecting demand level, the price variable. was dropped and the final model analyz.ed
consists of two endogenous variable.
VCR penetration rate was at first included as a variable rreasuring overall media
appetite of the population. I lowever, this variable is endogenously determined by other
variables in the model and thus was dropped. MSOSIZI; and VI was highly correlated and
MSOSIZI; was dropped to avoid multicollinearity problem.
Resulting final equations estimated are as follows.
TOTAC = f ( 1,NSUB VI AVGWAGN CII_CAPA DENS I ,OCA I, INCOMEURBAN PRJ_POP RTI,GRW)f (TO'rAc. !ill AGM; INCOME URBAN LOCAL, AG1;50 EDU CDLCI liED IIIISIZE)
nunther of households in the system area
!Ivo<
9 0
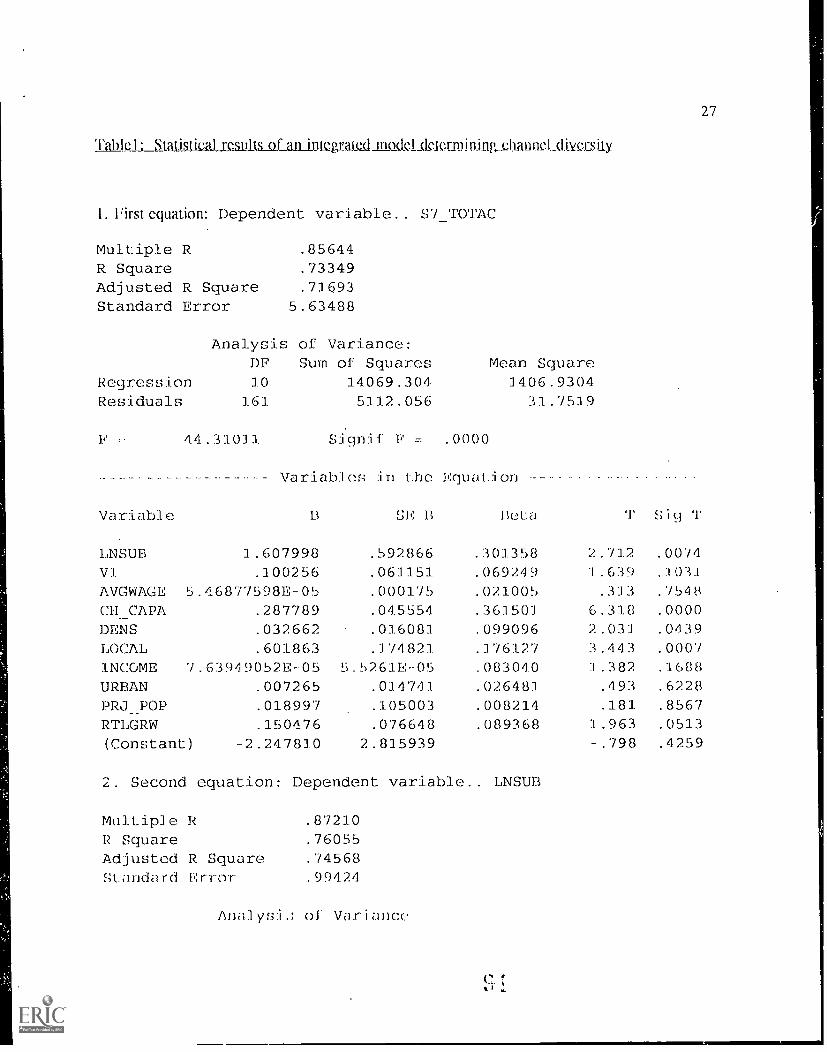
27
Tablet; Statistical results of_aldritcgratW incKlc)1 ck1EflJI1PIJ)flcl..(IlLLsiIy
L Firstapation: Dependent variable.. SV_TOTAC
Multiple R .85644R Square .73349
Adjusted P. Square .71693
Standard Error 5.63488
AnalysisDF
of Variance:Sum of Squares Mean Square
Regression 10 14069.304 1406.9304Residuals 161 5112.056 31.7519
44.31011 Signif F - .0000
Variables in Lhe EquaLion
Variable 11 Beta Siy T
LNSUB 1.607998 .592866 .301358 2.712 .0074
Vi .100256 .061151 .069249 1.639 .1031
AVGWAGE .6.6877598E- 05 .000175 .021005 .313 .7548
CH_CAPA .287789 .045554 .361501 6.318 . 0000DENS .032662 .016081 .099096 2.031 . 0639
LOCAL .601863 .174821 .1176127 3.443 000/
INCOME 7.63949052E-05 5.5261E-05 .083040 1.382 . 1608URBAN .007265 .014741 .026481 .493 .6228
PRJ_POP .018997 .105003 .008214 .181 .8567
RTLGRW .150476 .076648 .089368 1.963 .0513
(Constant) -2.247810 2.815939 -.798 .4259
2. Second equation: Dependent variable.. LNSUB
Multiple RR SquareAdjusted R SquareStandard Error
.87210
.76055
.74568
.99424
Annlysii oi Variance
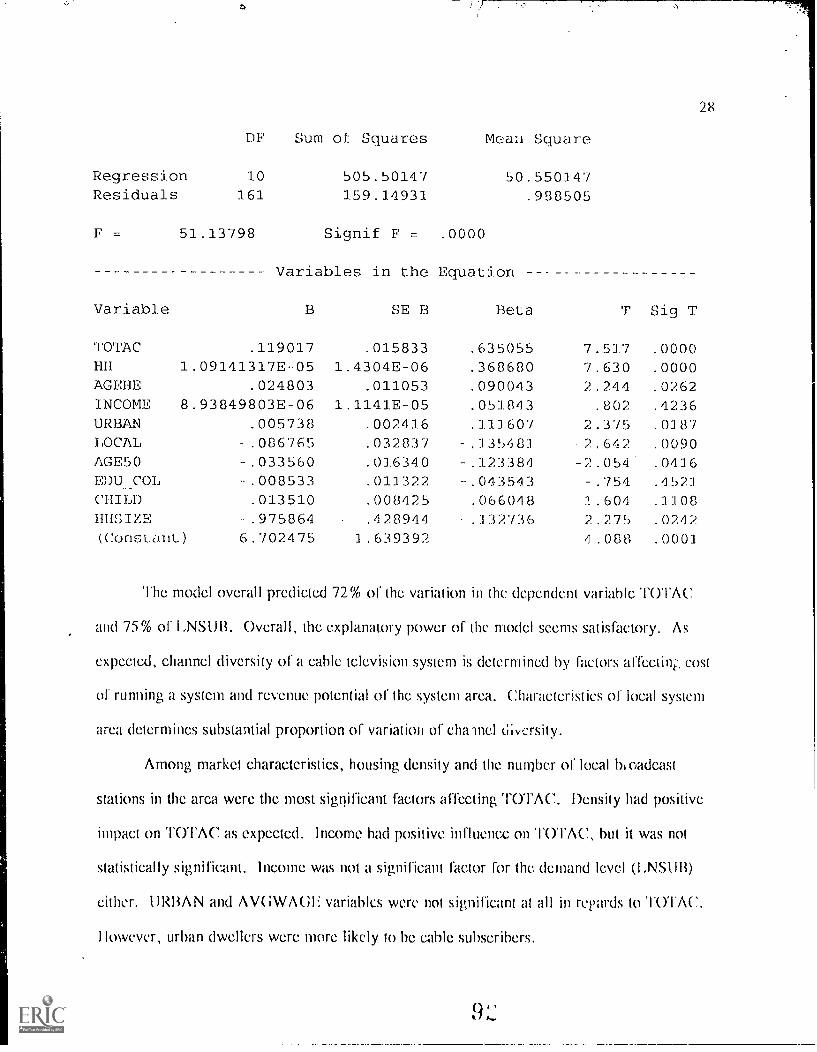
28
DF Sum of Squares MeaLi Square
Regression 10 505.5014/ 50.550147Residuals 161 159.14931 .988505
F = 51.13798 Signif F = .0000
Variables in the Equation
Variable SE B Beta T Sig T
TOTAC .119017 .015833 .635055 7.517 .000C)
HH 1.09141317E-05 .4304E-06 .368680 7.630 .0000AGEHE .024803 .011053 .090043 2.244 .0262INCOME 8.93849803E-06 1 .1141E-05 .051.843 .802 .4236
URBAN .005738 .002416 . 117607 2.375 .0387LOCAL -.086765 .032837 .135481 -2.642 .0090AGE50 -.033560 .016340 .123384 -2.054 .0416EDU COL -.008533 .011322 . 043543 -.754 .4521
CHILD .013510 .008425 .066048 :1.604 .3308HHSIZE -.975864 .428944 .132736 2.275 .0242
(Constnt) 6.702475 1.639392 4.088 .0001
The model overall predicted 72% of the variation in the dependent variable TOTAC
and 75% of I ,NS1113. Overall, the explanatory power of the model seems satisfactory. As
expected, channel diversity of a cable television system is determined by factors affectini:, cost
of running a system and revenue potential of the system area. Characteristics of local system
area determines substantial proportion of variation of chainel diversity.
Among market characteristics, housing density and the number of local b oadcast
stations in the area were the most significant factors affecting TOTAC. Density had positive
impact on TOTAC as expected. Income had positive influence on Tal'AC, but it was not
statistically significant. Income was not a significant factor for the demand level (I ,NIS111i)
either. URBAN and AVG\VAGI variables were not significant at all in repards to TOTAL
llowever, urban dwellers were more likely to be cable subscribers.
29
'l'he number of broadcast signals in the area also had positive impact. The strength of
competition must be prompting local cable operators to improve on the quality .of their service.
This positive impact of the number of local broadcast signals on cable diversity seems to come
from two reasons. A cable operator might have an incentive to increase channel diversity if its
competition (in this case, over-the-air broadcast signals available) is stronger and thus higher
quality service is necessary to get people to subscribe to cable. Also, it is likely that a cable
systcm's channel line-up includes more broadcast channels as there arc more local broadcast
channel available in the arca. lInfortunately, we cannot. separate out the two types of effect
with the data at hand.
Ownership related characteristics of the system -i.e. the extent to which the system is
vertically integrated with programming networks (VI) which is also highly correlated with the
size of the MS0- had positive -influence on TOTAC although p-value was not as high as
expected. kfliciencies realized from vertical integration and bargaining power advantage vis-
a-vis program suppliers seem to positively work for channel diversity. It might have even
bigger influence in which network gets to be selected in the system menu. An integrated
system will be more likely to include affiliated network with all other things equal.
Channel capacity was the most influential variable determining channel diversity with
the highest beta coefficient. Approximately four additional channel capacity increases one
more programmed channel. The influence of it was bigger than that of subscriber base.
23 out of total 244 systems in the data set had same channel capacity and total number
of programming. Upgrading channel capacity requires substantial fi nancial commitment and
also time. For those 23 cases, it can be either channel capacity (smaller than necessary)
constraining optimal TUI'AC or optimal TOTAC happens to be exactly same with the chaind
capacity the system has. Those 23 systems were removed from the data sct and the came
30
equation was measured. The regression result was pretty much the same and channel capacity,
followed by subscriber base, was the strongest predictor of TGIAC.
Future growth potential of the system area was represented by projected population
growth and average retail growth rate in the original model. Projected population growth rate
was not a significant factor. Retail sales growth rate had a positive relationship to the total
number of channels carried and was significant at .05 level. As of 1990, advertising revenue
only consists of 4% of cable system revenue, hut is projected to increase in the future.
(Sherman, 1994) If local advertising becomes a more common industry-wide practice, the
influence of it on channel diversity might go up in the future. As the contribution of local
advertising revenue to the cable system's total revenue gets larger, the influence of local
advertising market potential on diversity will increase.
Among demographic variables, age variable and household size were statistically
significant factors influencing the demand for cable television. The more there arc older
people in the area, the lower the subscription to the cable television. The result was consistent
with the previous research. On the contrary, household sin had significantly negative impact
on the demand I'm cable television, which was the opposite of the previous research. Income
and education were not significant factors. This seemingly inconsistent result suggests the
weakness demographic characteristics as reliable predictors of cable television demand.
Sparkes & Kang (1986) noted that as cable television changes from novelty to more widespread
medium the demographic differences between subscribers and non-subscribers tended to
disappear over time. Greenberg, ct al (1988) also noted that as penetration changes, subscriber
profiles are different in a system's life cycle. I ,aRosse (kr, Atkin (1988) found that the influence of
service and satisfaction was fitr more explanatory than traditional demographic or media-market
variables.
31
The quality of service measured by the number of programming networks carried by
the system was by far the strongest predictor of the demand for cable television. Based on
beta coefficient, it was even stronger than the explanatory power of 1111 (total number of
households iP the system area).
System age had positive impact on the number of subscribers as expected. Urban
population seems to have higher demand for cable television. The number of local broadcast
stations had negative impact on the demand for cable. Broadcast television is sure to be a
substitute for cable television, at least as of this time.
'10TAC and 1,NSUB had mutually positive influence to each other. I n addition, both
factors were very strong predictors for each other. The influence of subscriber base on
channel diversity is stmistically significant (Ty-value of t-statistie: .01). A system has more
programmed channels (higher diversity) when it serves higher number of subscribers. With
approximately 1.61% increase of the number of subscribers, one more programmed channel is
added to the system. It means that as we move from a small system to a larger system inore
and more subseriuers are needed to increase channel diversity. Afier beyond a certain level of
subscriber base, the increase of channel diversity becomes st;, nant. Since this is a
simultaneous equation model, the variables such as system age, and age of the population
which seemingly affect subseribership also exert influence on total number of channels
programmed indirectly through increasing or decreasing subscribership.
Also, the influence of TOTAC on subscriber size is statistically significant and positive.
The relationship holds with all other factors, local market and system characteristics, held
constant. Approximately 10.- programmed channel increase brings 1% increase in the
subscribership. TOTAc was the stiongest predictor lin- the subscription rate.
The channel diversity offered by the system is only One of many quality factors
considered by viewers at the moment of decision jo subscribe. Overall quality of operating
service provided to subscribers such as responsive service personnel, prompt phone answering,
appropriate dealing of complaint and convenient billing, which was not included in the model,
might explain some of the unexplained variation.
The relationship between system sin And channel diversity %,/as positive and mutually
reinforcing. The larger the system is, the higher the diversity level is. lligher diversity, in
turn, results in higher subscription. However, the effect of subscriber base tapered off as we
move to a larger sized systems. The effect of channel capacity was also strong and positive,
which holds true after holding all other factors constant.
VII. Discussion and future research
This study revealed that the same economic force that governed quality of other media
product is also at work for determining, cable channel diversity. A system serving larger
market in terms of subscriber base offers higher quality service, in this case higher channel
diversity, to its subscribers. The same force works in newspaper industry. Big city
newspapers have more diverse sections than suburban papers. 'I'he same is for international
trade of motion pictures; Countries with larger domestic. market produce and export films with
more diverse subjects (Wildman & Siwek, 1988). 'I'V programs with higher expected
audience have higher production budget to improve on quality than the others (for example,
network program vs local broadcast station production).
3 :3
Channel capacity puts apparent limit to the channel diversity. But systems with larger
subscriber base offered higher level of diversity even after controlling for the channel capacity
and many other variables.
Technological advance which abolishes physical channel capacity limit will not bring
about drastic increase in diversity; at least by itself. rzonornie constraints on diversity, local
market characteristics and subscriber base as prese»ted in this model, will remain the same in
the '500-channel world'.
It seems that how we divide areas served by a multichannel service provider matters
much in determining channel diversity as it is defined in this study. I lowever, since this study
did not extend to study the composition of programming line-up in the systems whether having
a large service area is always better or not cannot be answered. Traditiot'al policy goals such
as localism might not be better served by assigning large system areas. Study of the.
determinants of system programming composition, that is what determines the selection of
particular set of networks in a system, should be followed as a future research.
The notion of competition should he reconsidered. There can be conflicting arguments.
General economic theories on competition hold that competition is much better for improving
product quality and tuning to consumer needs. On the other hand, competition reduces rate of
return for thc producers by dividing the market. Based on the result of this study, that is
subscriber base being a strong determinant. for channel diversity, competition in the same
system area might not be always better for channel diversity since competing multichan»el
service providers are bound to divide up the subscriber base of the given area. The result
cannot be conclusive since the data consist of non-competitive systems only. A follow-up
study including competitive systems will be conducted. A variable indicating the strength of
overbuild competition such as the proportion of household passed which is also passed by any
r..
34
competitor in the system area can be included in the model and effect of multichannel
competition can be measured.
Overall, demographic variables were not so strong predictors of channel diversity.
Probably demographic variables exert stronger influence over which network to pick rather
than how many network to carry. It should be also the subject lbr future research.
Itelerence
Baer, Walter S. (1973). Cable television: A handbook for decision making. Santa Monica,CA: Rand.
Baer, Walter S. & Park, Rolla Edward. (1972). Financial projections for the DaytonMetropolitan area. In Johnson, Leland L. et al. Cable eammmications in tbeAktyton MiamiVa!ky Basic report. Santa Monica, CA: Rand.
Barnes, Beth Ellyn. (1990). Electronic media audience behavior in the multichannelenvironment: Patterns of demographic homogeneity and time spent viewing. lvanston, IIUnpubl ished P11. D. Dissertation.
Chipty, Tasneem (1993). I lorizontal integration for bargaining power: l',vide,nee from thecable televisinn industry.
Chipty, Tasneein (1994a). Vertical integration and market foreclosure:cable television industry.
kvidmicc from Mc,
Chipty, Tasneem (1994b). Vertical integration, market foreclosure., and efficiency: Evidencefrom the cable television industry.
Dennis, Roger. (Unknown). l',vanston Il and cable television. livanston, II.: Centel for UrbanAffairs, Northwestern University.
De jong, Allard Sicco & Bates, Benjamin J. (1991). Channel diversit) i» cable television.Journal of broadcasting & Ilectronic media, 35 (2), pp159- 166.
Dertouzos, James N. & Thorpe, Kenneth F. (1982). Newspaper groups: lconomics of scale,tax laws and merger incentives. Santa Monica, CA: Rand.
Dertuozos, James N. & Wildman, Steven S. (1990). Competitive effects of broadcast. signalson cable. Attachment to comments of NCTA in FCC filing: MMDocket. Nos. 89-600 and 90-4.
Dertuozos, James N. & Wildman, Steven S. (1993). Regulatory benchmarks foi cable rates:Review of the FCC methodology. June 21, 1993.
Dominick, Joseph, Sherman, Barry 1,., & Copeland, Gary (1990). Broadcasting/cable andbeyond: An introduction to modern electronic media. NY, NY: McGraw- I fill.
Eastman, Susan Tyler. ( 989). CAL systen, programming. In Eastman, S. T., Ilead, SydneyW., & Klein, Lewis (Eds.) Broadcast/cable priigramining:_,Strategis;s. and pritetiees. Belmont.,CA: Wadsworth.
Greenberg, Bradley S., fleeter, Carrie, D'Alessio, David, and Sipes, Sherri. (1988). Cableand noneable viewing style comparisons. In I leeter, Carrie, & Bradley S. Greenberg (1ds).Cableviewing. Norwood, NJ: Ablex.
Ilazlett, Thomas, W. (1994). Regulating cable television rates: An economic analysis. Aworking paper. Institute of governmental affairs. University of California, Davis.
aRosse, & Atkin, David J. (1988). Satisfaction, demographic, and media environmentpredictors of cable subscription. Journal 0.111roadiasling and Elcetronic_Media, 32, 403-13.
Varnell Mcafee. (1993). The growth and development of basic cable services arid a casestudy of 'MN. Dissertation. Ohio University.
evin, Ilarvey J. (1971). Program duplication, diversity, and effective viewer choices: Someempirical findings. American Economic Revic.w, 61 (2.), pp 81-88.
Myers reports: 9th annual survey of cable operator Executives on basic networks. (1994).Parsippany, NJ: Myers Communications Inc.
Nadel, Mark S. (1985). Comment: Multichannel video competition. In Noam, N. (Nd.) V ifloMediaSzomeAition. NY, NY: Columbia University Press.
"New network listings update" Catikaision Aug 8, 1994, 07-58.
Noam, Eli M. (1985). Economies of scale in cable television. In Noam, (FA) VideoMcdia Campefition. NY, NY: Columbia University Press.
Owen, bruce M. & Wildman Steven S. (1985). Program competition, diversity, andmultichannel bundling in the new video industry. In Noam, E. (Ed.) Valigt MediaCompetition. NY, NY: Columbia University Press.
Pacey, Patricia I,. (1985). Cable television in a less regulated market. Jciurnal of IndustrialEconomics, 34(1), pp81-91.
Park, Rolla Edward. (1971). Prospects for cable in the 100 largest television markets. SantaMonica, CA: Rand.
3 7
Rubinovitz, Robert. (1991). Market power and price increases for basic cable service sincederegulation. Washington, DC: leonomic Analysis Group, Antitrust division, US departmentof Justice.
Setzer, Florence & levy, Jonathan (1991). Broadcast. television in a multichannel marketplace.OPP working paper series. Washington, DC: Office of Plans and Policy, FCC.
Sherman, Barry L. 91994). Telecomm_unieations management: BroadcaqingLable_and thenew technologiQs NY NY: MeGraw-llill.
Sloan Commission. (1971). On the cable:Zile b.levision of abtmdanee. NY, NY: McGraw-
Smith, William. (1989). Freeze frame. garkciinp MediaDecisions. 24(4),April, p26
Solomon, llarvey (1989). Refranchising: Cities fight back. Chanhek, 9(4), p46 49.
Sparkes, V. & Kang, N. (1986). Public reactions in cable television: Time in the diffusionprocess. Journal of broadcasting, 30, 213-229.
Thorpe, Kenneth. (1985). Cable television, market power, and regulation. Santa monica,CA: Rand corp.
Vita, Michael, G. & Wiegand, John, P. (1993). Must-carry regulations for cable. televisionsystems: An economic policy analysis. Journal_ol_Broadcasiing.&Xlectronie Media, .37(1), 1--
19.
Vogel, Ilarold, L. (1990). Entertainment industry economics: A guide for financial analysis.Cambridge, 11K: Cambridge University Press.
Waterman, David & Weiss, Andrew A. (1993). Vertical integration, program access, and the1992 cable television act. Paper presented at ICA, Sydney, Australia, July 11-15, 1994
Webb., G. Kent. (1983). The economics of cable television. lexington, MA: lexington books.
Wildman, Steven S. (1994). The economics of audiencemaking. In Ittenia, James S. &Whitney, D. Charles (Eds.) Audiencemaking: }low the media create the audience. ThousandOaks, CA: Sage.
Wildman, Steven S. & Siwek, S. E. (1988). international traticin Mins and televisionprograms Cambridge, M A: 13all inger publishing.
op
Woodard, Jr., Charles, C. (1974). Cable television: Acquisition and operation of CATVsystems. NY, NY: McGraw-Hill.
Zupan, Mark A. (1989). The efficiency of franchise bidding schemes in the case of cabletelevision: Some systematic evidence. journal_of law and_economies, 12(2), p401-456.
Zupan, Mark A. (1989). Non-price concessions and the effect of franchise bidding schemeson cable company costs. Applied econonlics, 21, pp305323.
Marketing Cable Television: Programming and Interactive ServicePreferences of Cable Subscribers
Randy Jacobs, Ph.D.Assistant Professor
School of CommunicationUniversity of Hartford
West Hartford, CT 06117203-768-5186
Presented at the Association for Education in Journalism and Mass Communication,78th Annual Convention, August, 1995, Washington, D.C.
Cable Subscriber Programming Preferences 2
Abstract
Programming is arguably the most significant characteristic of cable television service. Over 600subscribers to system in a Northeastern city were surveyed to assess their preferences forprogramming types and interest in interactive services. Subscriber sentiment to add science,nature, and cultural programming was strong, as was the desire to reduce the number of shopping,religious, and pay-per-view channels. Interest in the interactive services was weak. Implicationsfor cable system operators are discussed.
0 :4
Cable Subscriber Programming Preferences 3
Marketing Cable Television: Programming and Interactive ServicePreferences of Cable Subscribers
Cable programming has long been recognized as significant to the success of cable service
in the consumer marketplace. Among the earliest cable subscribers, who often lived in
communities where reception was impaired, the primary motivation for subscribing was the
improvement in picture quality (Baldwin & McVoy, 1988). However, research suggests that by
the early 1980s the need for better reception was supplanted by the desire for more channels and a
greater variety of programming. For example, Metzger (1983) found in a national study of cable
subscribers that 41% subscribed for greater program variety and quality compared with 34% who
sought better reception. Metzger also found basic only subscribers were more likely to subscribe
for better reception while premium service subscribers were more likely to subscribe for program
variety. Similarly, Rothe, Harvey, and Michael (1983) studied cable subscribers to a large system
in one of the top 10 U.S. media markets and found the desire for more movies and more channels,
as well as variety were the most important decision factors in choosing to subscribe. The results of
more recent studies (e.g., Umphrey, 1989; Atkin, 1992) suggest these findings as still true today.
The desire for more program variety is not only important in the initial decision to subscribe
to cable service. Consumer behavior researchers have developed a disconfirmation model of
satisfaction formation that suggests consumer satisfaction is an important antecedent of product
repurchase decisions (Hunt, 1977; Oliver, 1980; Churchill & Suprenant, 1982). Following from
this model, cable television program variety and quality may play a role in subscribers' satisfaction
formation which is, consequently, an important antecedent of the subscription maintenance
decisions. Given the importance subscribers' place on the increased variety cable offers,
subscribers' negative perceptions of the variety offered by their cable operator (i.e., number of
channels and diversity of program types) would likely affect their satisfaction with their service and
subscription maintenance decisions. Research conducted to test this hypothesis is limited and the
results mixed. For example, while La Rose and Atkin (1988) failed to find a relationship between
program satisfaction and subscribers' intention to disconnect, Jacobs' (in press) study of cable
Cable Subscriber Programming Preferences 4
subscriber satisfaction revealed that program variety, and for some demographic segments program
quality, are determinants of subscriber satisfaction.
Still, in today's changing telecommunications environment all cable system operators
recognize the importance of subscriber satisfaction. As local cable system operators experience
increased competition from cable system overbuilds, telephone companies, and direct broadcast
satellite systems programming will grow in importance (Biirgi, 1995). The unique programming
on cable television has been shown to add to the perceived value of television consumption for
cable subscribers (Albarran & Umphrey, 1994). Similarly, the programming offered by a cable
system operator will be an increasingly significant factor in system operators' efforts to
differentiate themselves from competitors by adding value to their service.
As channel capacity grows system operators will be challenged to buy and create
programming and interactive services that meet the needs and expectations of subscribers. The
solution, however, is not simply adding programming unselectively, as capacity becomes
available. Research has shown that television viewers whose needs are being met by broadcast
offerings find no reason to subscribe to cable service (Becker, Dunwoody, & Rafaeli, 1983).
New channels added indiscriminately may fail to meet the needs of subscribers and attract buyers.
Therefore, general managers and marketing managers need to explore subscribers' preferences for
future programming and services. System operators need to listen to the voice of the consumer
and use consumer feedback to shape what the menu of services will look like. This will allow
system operators to make better programming decisions up front, saving the expense of replacing a
network or interactive service that proves unpopular (and unprofitable). In the same way that
program audience ratings for demographic subgroups enable advertisers to target their audiences,
analysis of preference data by demographic subgroups will assist system operators in marketing
programming and services in packages, tiers, or as a la carte offerings to target demographic
subgroups.
While some cable operators are undoubtedly actively researching consumer interest in
newly available cable programming and interactive services, relatively little academic or market
Cable Subscriber Programming Preferences 5
research data has been reported in the public domain. In searching for research on cable
subscribers' programming preferences for this study, just two reports were found in the trade
press. Tele-Communications Inc.'s tv! Network, which carries programming from about 20
different existing and aspiring cable networks, recently began soliciting viewer feedback to new
programming concepts via an 800 number (Katz, 1995). Obviously, this type of research Jesign
does not provide representative data. Nevertheless, so far the Outdoor Motorsports Channel and
The Military channel have received generally favorable ratings but Bloomberg Business News
fared poorly with 84% of callers indicating the programming was not very good and 88% saying
they did not want the service as a 24-hour channel. The Ecology Channel's quality ratings were
mixed. And in a related market study, Beta Research Corp. conducted a national survey of cable
operators to determine the cable networks they were most interested in adding to their offerings by
the end of 1995 (Granger, 1995). The channels general managers were most interested in adding
are the Sci-Fi Channel, History Channel, ESPN2, Learning Channel, Cartoon Channel, and Court
TV.
Some research has also been reported about consumer interest in interactive services. Over
a decade ago, Rothe, Harvey, and Michael (1983) queried cable subscribers about their interest in a
range of interactive services. Forty one percent reported they were very interested in
news/weather/sports on request and 39% were very interested in home security. Only 25% were
interested in home banking, 18% in home shopping, and 17% in financial information. The
authors concluded that consumers generally lacked awareness of these services and a recent market
study suggests not much has changed since the early 1980s. A telephone survey of 1,000 adults
conducted by Lou Harris and Associates for Privacy & American Business, a nonprofit journal,
indicates that consumers may be less interested in home shopping and movies-on-demand than
service providers expect (Ziegler, 1994). Just 40% of respondents expressed interest in ordering
sports programs or movies-on-demand, and only about a third said they want interactive shopping.
Nearly 75% of consumers surveyed were interested in customized news reports and 63% were
interested in health-care, government, and product review information services. A spokesperson
Cable Subscriber Programming Preferences 6
for Lou Harris suggested that these findings should be interpreted with care since many of the
consumers surveyed apparently had limited knowledge of interactive services.
The present study, based on a survey of cable subscribers to a single system in a tc, 25
cable market, addresses three research questions: What are cable television subscribers'
preferences for programming additions? How interested are cable subscribers in interactive
services? What relationships exist between subscriber demographics and interest in cable
programming types and interactive services?
Method
The data reported here were collected as part of a survey of subscribers to a large cable
system in a medium size city in the Northeast. Data were gathered in telephone interviews
conducted between July 18 and July 31, 1994 by trained communication graduate students.
A systematic random sample of telephone numbers was drawn from the system's database
of current subscribers. A minimum of two attempts were made to contact busy, no answer, and
machine answered numbers. Out of 894 valid attempts (excluding business numbers, no answers,
nd disconnects) there were 607 completed interviews and 287 refusals for a response rate of 68%
(Frey, 1989). The respondents were 41% male and generally middle-aged with 45% between 35
and 54 years of age. Thirty percent were over 55 years old. The sample was relatively affluent
with 30% earning between $50,000 and $74,999 and nearly 25% earning $75,000 or more.
Almost 50% had earned a college degree or higher. The average household size was 2.72 persons
and 47% of the households had three or more members. Among the respondents, 30% subscribed
to one or more premium (pay) channels.
The survey instrument was designed to gather data on subscribers' programming and
service expectations. Subscribers' programming preferences werc measured by asking them to
indicate for a comprehensive list of 15 channel types if they would like more, the same amount, or
fewer channels of that type (1=fewer channels, 2=same amount, 3=more channels). The
descriptions of channel types included an existing cable network example for each (e.g., "Sports
I t 4
Cable Subscriber Programming Preferences 7
channels like ESPN"). The channel types are listed in Figure 1. Interest in new, interactive
services was assessed by asking respondents to indicate for eight service concept statements how
interested they would be in receiving each service through their cable company (1=not at all
intemsted, 2=not very interested, 3=somewhat interested, 4=very interested). For example, the
concept statement for home banking read, "Home banking which would allow you to review your
accounts and make transactions." The eight services are listed in Figure 2. The demographic data,
summarized above, were collected to allow for more in-depth analysis. Ordinal scales were used
to measure education (1=did not graduate from high school, 2=graduated from high school,
3=some college, 4=graduated college, 5=some postgraduate work, 6=earned postgraduate degree),
household income (1=less than $10,000, 2410,000 to $19,999, 3420,000 to $34,999,
4435,000 to $49,999, 5=$50,000 to $74,999, 6475,000 to $99,999, 74100,000 to
$124,999, 84125,000 or above), and age (1=18 to 24, 2=25 to 34, 3=35 to 44, 4=45 to 54,
5=55 to 64, 6=65 and older). Household size was recorded as reported by the subscriber and
gender was noted by the telephone interviewer. Each subscriber's service level (1=basic only,
2=basic plus premium) was also recorded from cable system records.
The data were tabulated and analyzed using SPSSx (Norusis, 1990). The analysis began
with total sample frequency distributions for each iLem of interest. Then, to locate differences in
program preference and interactive service interest among demographic and service level
subgroups, a series of cross-tabulations and chi-square tests of association were computed.
Results
Programming Preferences
When given the opportunity to express their desire for more or fewer channels of the
different programming types on their cable system, subscribers were to some extent apathetic. For
most of the channel types--pay-per-view, premium, sports, news, music, children's, business,
women's, and foreign languagebetween about 45% and 55% of the subscribers indicated the
status quo (the same amount) was preferred. Still, as shown in Figure 1, subscribers do hold
Cable Subscriber Programming Preferences 8
strong programming preferences. There appears to be strong demand for additional science,
nature, and cultural programming. Between 33% and 40% of subscribers would also like to see
additional children's, news, sports, and women's channels. Conversely, subscriber sentiment to
reduce the number of shopping, religious, and pay-per-view channels is strong. Moreover, about
a third of the respondents would like to see the number of foreign language and music channels
reduced.
Figure 1 about here
The chi-square analysis of channel type preferences by subscriber demographics and
service level reveal the existence of some relationships between these variables. To aid in the
interpretation of the cross-tabulations the age, income, education, and household size data were
collapsed for the analysis into a reduced number of levels. "Same amount" responses were
removed from the analysis as well. The following descriptive groupings facilitate the reporting of
the significant findings.
Gender driven preferences. Not surprisingly, subscribers most interested in more sports
and women's channels are men and women, respectively. Only 50% of women want more sports
channels while 84% of men do (X2=40.99, d.f.=1, p<.001). Similarly, 86% of women want
additional women's channels compared with 57% of men (X2=26.71, d.f.=1, p<.001). And both
men and women would like more cultural programming but the proportion of women expressing
this desire (95%) significantly exceeds the 86% of men (X2=8.90, d.f.=1, p<.01).
Age driven preferences. Desire for additional music and public affairs programming is
related to subscriber age. Younger subscribers are more interested in additional music channels
than older subscribers (X2=20.69, d.f.=2, p<.001). Conversely, older subscribers are more
likely to request additional public affairs programming than younger subscribers (X2=20.40,
d.f.=2, p<.001).
Income driven preferences. Preferences for religious and women's programming appear to
vary with income. Higher income subscribers are less likely to want more religion channels than
1iO
Cable Subscriber Programming Preferences 9
lower income subscribers (X2=11.06, d.f.=3, p<.01). A similar association was found regarding
women's channels (X2=10.52, d.f.=3, p<.05).
Education driven preferences. Subscriber education was associated with just one type of
program preference--business. Better educated subscribers are more likely to be interested in
additional business and finance channels like CNBC than lesser educated subscribers (X2=15.18,
d.f.=3, p<.01).
In some instances, more than one variable emerged as associated with a programming
preference. For example, preferences for additional pay-per-view and premium channels vary with
subscribers' age and level of service. Desire for more pay-per-view channels increases with
subscription level (X2=7.93, d.f.=1, p<.01) and decreases with age (X2=9.36, d.f.=2, p<.01).
The same is true for premium channels. Subscribers are far more likely to be interested in
additional premium channels if they already subscribe to them (X2=47.39, d.f.=1, p<.001) and if
they are younger (X2=16.57, d.f.=2, p<.001). These subscribers may be best characterized as
"youthful adopters." Another example is children's programming which is more likely to be
favored by "young householders." Subscribers who are younger are far more likely to want
additional children's programming than older subscribers (X2=34.30, d.f.=2, p<.001);
subscribers with larger households are far more likely to want additional children's programming
than subscribers with smaller households (X2=30.27, d.f.=3, p<.001).
No significant demographic or subscription level differences were found in program type
preferences for news, shopping, education, and foreign language channels.
Figure 2 about here
Interest in Interactive Services
Subscribers interest in obtaining interactive services from their cable company appears to be
limited at this time. As indicated in Figure 2, only two services--movies on demand and interactive
news--attracted appreciable subscriber interest and even those services elicited "very interested"
Cable Subscriber Programming Preferences 10
responses from under 50% of respondents. Still, these services look promising when compared
with the less than 20% of subscribers who indicated they were very interested in any of the other
six concepts tested. The number of subscribers somewhat interested in these services could be
interpreted as encouraging, but those responses suggest much greater consumer uncertainty.
The chi-square analysis of interest in interactive services by subscriber demographics and
service level suggest some interesting associations among these variables. The most important
result was the consistently significant association between subscriber age and interest across all of
the interactive services described (p<.001). The younger the subscriber the more likely s/he is to
be interested in receiving the service from their cable company. Except for local telephone service,
in addition to age, other differences were found across demographic subgroups of subscribers.
Home banking is favored by subscribers who are better educated (X2=12.30, d.f.=3,
p<.01), have higher incomes (X2=11.21, d.f.=3, p<.01), and live in larger households
(X2=11.63, d.f.=3, p< 01). Interest in catalog shopping is significantly greater for women
subscribers (X2=5.46, d.f.=1, p<.05) with higher incomes (X2=12.15, d.f.=3, p<.01). Interest
in home security is related only to subscribers' current level of service. Premium subscribers are
more likely to be interested in security service than basic only subscribers (X2=5.19, d.f.=1,
p<.05). Interactive news is also related only to subscribers' level of service. Again, premium
subscribers are more likely to be interested in interactive news than basic only subscribers
(X2=4.67, d.f.=1, p<.05). Not surprisingly, movies on demand appeal to premium channel
subscribers (X2=5.25, d.f.=1, p<.05) and to the better educated (X2=11.78, d.f.=3, p<.01) .
Interest in video games is much greater for subscribers from larger households (X2=24.26,
d.f.=3, p<.001) with premium service (X2=18.89, d.f.=1, p<.001). And, interest in supermarket
shopping is greater for women (X2=13.55, d.f.=1, p<.001) from larger households (X2=7.90,
d.f.=3, p<.05).
Cable Subscriber Programming Preferences 11
Discussion
With cable system channel capacity increasing (Granger, 1995) and the number of cable
networks currently available and in the planning stages exceeding 100 (National Cable Television
Association, 1994), the planning and implementation of programming and interactive service
strategies is becoming increasingly difficult. An equally great challenge will be marketing a menu
of programming and services in a competitive environment. Perhaps the best way to simplify these
tasks is to solicit subscriber input in the process.
In addressing the research questions posed in this study, these results suggest a number of
important implications for cable system operators. First, let the cable subscriber assist in shaping
the programming menu. Subscribers to this system often opted against suggesting to increase or
decrease the number of channels of a particular type. This is not too dissimilar to*being asked by a
restaurant what items should be dropped from their menu and what new dishes should be added.
When going to a restaurant most diners do not want to do the chef s job; they want to be offered a
range of items several of which could suit their appetite. Nevertheless, most diners could tell you
if they want more seafood dishes or less red meat. Here, there was ample support for adding more
science/nature, educational, and cultural channels and reducing the number of shopping, religion,
and pay-per-view options. It is also interesting to note that there was limited subscriber support
for additional premium channels. While about 30% of subscribers take premium service, less than
15% of respondents indicated a desire for more premium options. Apparently, even those
subscribers who are drawn to these premium channels feel there is enough of a selection.
Since the evidence of consumer demand for interactive services is limited and contradictory
(Ziegler, 1994), these data suggest system operators should proceed cautiously in the introduction
of interactive services. With the exception of movies on demand, which is simply an evolutionary
step forward from pay-per-view, and interactive news, which many subscribers are likely familiar
with from hearing about or using on-line computer services, interest in the less familiar services is
clearly limited and weak. Moreover, these responses merely addressed concepts; there was no
mention of cost and a recent national random survey of over 1,000 hoeseholds by Hewlett-Packard
Cable Subscriber Programming Preferences 12
Co. suggests consumers are unwilling to pay any more for interactive services than they currently
pay for cable alone (Ziegler, 1994).
Consumers' willingness to adopt interactive services was tested in the videotex trials of the
early 1980s and little interest was cultivated (Baldwin & McVoy, 1988). The finding that younger
subscribers are more interested in interactive services is, reassuringly, consistent with much of the
research on the diffusion of innovations (Rogers, 1983). Still, cable operators need to recognize
these services as innovations that must possess certain attributes that are perceived favorably before
subscribers will adopt. Research conducted on one early videotex service found that perceptions
of the relative advantage of the innovation (the degree to which the innovation is better than the idea
or practice it replaces), and its compatibility with existing values and past experiences, are of
greatest importance when introducing interactive services (Bolton, 1983). Soliciting subscriber
responses to interactive service concept statements is obviously not sufficient to gauge their
intentions regarding these services. Clearly, more in-depth research on subscribers' perceptions of
interactive services is needed.
As for marketing cable television service in a competitive environment, these fmdings allow
system operators to understand consumer wants and indicate targeted marketing has value in
selling cable programming and services. Like cable audience ratings used by advertisers to locate
programming through which to reach their target consumers, system operators can use preference
research to identify the types of programming desired by subscribers. This will allow operators to
more effectively tailor and selectively promote their offerings to target groups such as men,
women, and young families. This will become even more important in future cable environments
that offer over 100 channels. How will consumers know what channels or services they prefer?
How will a subscriber know what's available and make an a la carte selection without information?
And how can system operators efficiently increase the buy rate for new programming tiers and
packages? Only extensive, ongoing local research will enable system operators to avoid costly
programming and marketing errors.
11 4
Cable Subscriber Programming Preferences 13
This study is limited in that it was conducted among subscribers to just one system in a
single market. Thus, these findings may not be generalizable beyond the sampled subscriber
population. Nevertheless, the findings begin to suggest how programming preferences vary
across subscriber characteristics and how limited subscriber interest in interactive services is at this
point in time.
Cable Subscriber Programming Preferences 14
References
Albarran, A.B., & Umphrey, D. (1994). Marketing cable and pay cable services: Impact of
ethnicity, viewing motivations, and program types. The Journal of Media Economics,1(3),
47-58.
Atkin, D.J. (1992). A profile of cable subscribership; the role of audience satisfaction variables.
Telematics and Informatiu, 9, 53-60.
Baldwin, T. F., & McVoy, D. S. (1988). Cable communication (2nd ed.). Englewood Cliffs, NJ:
Prentice-Hall.
Becker, L.B., Dunwoody, S., & Rafaeli, S. (1983). Cable's impact on use of other news media.
Journal of Broadcasting, E, pp. 127-139.
Bolton, T. (1983). Perceptual factors that influence the adoption of videotex technology: Results of
the Channel 2000 field test. Jou;nal of Broadcasting, 22, 141-153.
Burgi, M. (1995, February 6). Building blocks. Mediaweek, pp. 14-15.
BUrgi, M. (1995, March 27). Cable's promised land. Mediaweek, pp. 27-37.
Churchill, G.A. & Suprenant, C. (1982). An investigation into the determinants of customer
satisfaction. Journal of Marketing Research, 19, 491-504.
Frey, J. H. (1989). Survey Research, by Telephone (2nd ed.). Newbury Park, CA: Sage
Publications.
Granger, R. (1995, February 13). History channel, Sci-Fi score in Beta Survey. Multichannel
Newa, p. 26.
Hunt, H.K. (Ed.). (1977). Conceptualization and measurement of consumer satisfaction and
dissatisfaction (Report No. 77-103). Cambridge, MA: Marketing Science Institute.
Jacobs, R. (in press). Exploring the determinants of cable television subscriber satisfaction.
Journal of Broadcasting & Electronic Media.
Katz, R. (1995, February 20). tv! Network survey yields surprising result. Multichannel News, p.
24.
1
Cable Subscriber Programming Preferences 15
La Rose, R., & Atkin, D. (1988). Satisfaction, demographic, and media environment predictors of
cable subscription. Journal of Broadcasting & Electronic Media, 32, 403-413.
Metzger, G.D. (1983). Cable television audiences. Journal of Advertising Research, 21 41-47.
National Cable Television Association. (1994). Cable Television Developments. Washington, DC:
Author.
Norusis, M. J. (1990). SPSS Base System User's Guide. Chicago: SPSS.
Oliver, R.L. (1980). A cognitive model of the antecedents and consequences of satisfaction
decisions. Journal of Marketing Research, 11, 460-469.
Rogers, E.M. (1983). Diffusion of Innovatiou (3rd ed.). The Free Press. New York:NY.
Rothe, J.T., Harvey, M.G., & Michael, G.C. (1983). The impact of cable television on subscriber
and nonsubscriber behavior. Journal of Advertising Research, a 163-175.
Umphrey, D. (1989). A comparison of cable disconnecters and subscribers. Journalism Quarterly,
66, 628-631.
Ziegler, B. (1994, November 29). Surveyed consumers want interactive, but won't boost cable-
TV bills for it. The Wall Street Journal, p. B6.
Ziegler, B. (1994, October 5). Interactive options may be unwanted, survey indicates. The Wall
Street Journal, p. B9.
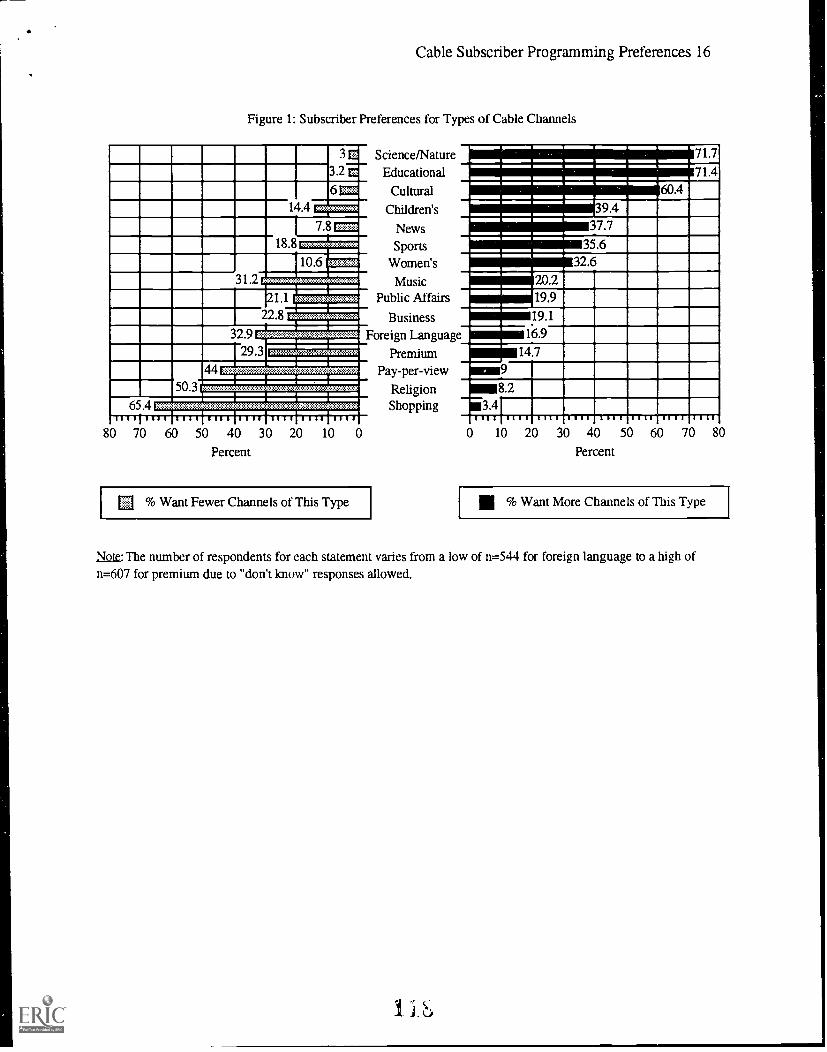
Cable Subscriber Programming Preferences 16
Figure 1: Subscriber Preferences for Types of Cable Channels
3 E3.2 a6 =
14.4 r
7.8=18.8
31.210.61
1 .1
22.8
32.91,
29.3
50.3
65.4Ill.! all
Science/NatureEducational
Cultural
Children's
NewsSports
Women's
MusicPublic Affairs
BusinessForeign Languag
PremiumPay-per-view
ReligionShopping
liii lii 1111 1111 lilt I I 1111
80 70 60 50 40 30 20 10 0
Percent
% Want Fewer Channels of This Type
71.7NMI ,
714NM60.4
11111111111=1111111
NMI37.7MI
35.6EMI32.6
MUIR 20219.9
19.1
16.9
14.7
8.23.4111111111
10 20till 11 II
30 401111 lUll 1111 1111
50 60 70 81
Percent
% Want More Channels of This Type
Note: The number of respondents for each statement varies from a low of n=544 for foreign language to a high ofn=607 for premium due to ''don't know" responses allowed.
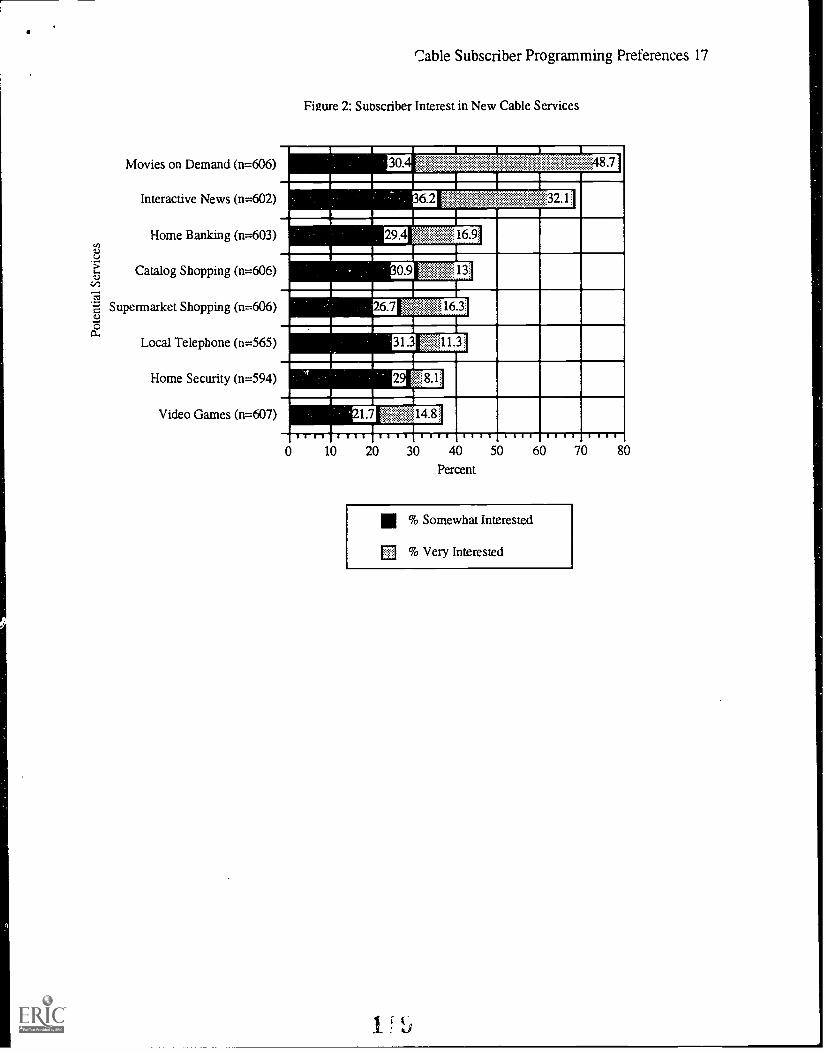
Movies on Demand (n=606)
Interactive News (n=602)
Home Banking (n=603)
Catalog Shopping (n=606)
Supermarket Shopping (n=606)
Local Telephone (n=565)
Home Security (n=594)
Video Games (n=607)
Cable Subscriber Programming Preferences 17
Figure 2: Subscriber Interest in New Cable Services
r
30 4871
36.21101poRgni:ii,
NM 13
76.3
1.7 Naiffi14.81
1
Fill 11I Till liii liii III 1111 Sill0 10 20 30 40 50
Percent
60
11111 % Somewhat Interested
El % Very Interested
70 80
Radio Format Changes 1
A STUDY OF RADIO STATION MANAGERS' ATTITUDES ONSTATION FORMAT CHANGES
A paper submitted to theAssociation for Education in Journalism and Mass Communication
Media Management and Economics Division
by
Max V. GrubbB.S.C. Ohio University 1979
M.A. Kent State University 1994Doctoral Student Ohio University
10309A Porter LaneAthens, OH 45701
(614) 797-3700
Email: mg274685Voak.eats.ohiou.edu
RUNNING HEAD: RADIO FORMAT CHANGES
Radio Format Changes 2
A BSTR ACT
A STUDY OF RADIO STATION MANAGERS' ATTITUDES
ON STATION FORMAT CHANGES
The radio industry currently operates in a different environment from the pre-1980s period. The
drive for deregulation led to changes in the types of management and in the competitive environment. This
study examines the dynamics of change management and radio station format changes. Force field theory
was used as the theoretical underpinning for exploring the dynamics of radio station format changes.
Personal interviews and a survey questionnaire were the methodologies used for this study.
Radio Format Changes 3
A STUDY OF RADIO STATION MANAGERS' ATTITUDES ON STATION FORMAT CHANGES
The radio industry has been operating under a regulatory atmosphere since its inception over 70 years
ago. Broadcast regulation originated with the Wireless Act of 1910 and the Radio Act of 1912 (Head,
Sterling, and Schofield, 1994, 156). The Radio Act of 1927 and the Communications Act of 1934 were
enacted to establish that the airwaves resource be used as a public trust and not as private property. Licenses
were issued to those who made a commitment to operate and use this scarce resource in the public interest.
The trusteeship approach to broadcast regulation was established with this legislation. This trusteeship model
would last until the deregulation of the early 1980s (Simmons, 1978, 27).
Today, the radio industry operates in a different environment from the pre-1980s period. The
deregulation of the 1980s brought about tremendous change for station managers. Deregulation included
changes in the number of stations owned, the length of time of ownership, and the addition of new radio
stations. The drive for deregulation led to changes in the types of ownership, the type of management, the
rumber of radio stations, and the competitive environment (Anderton and Sanders, 1992, 6).
One result of these changes is that radio station managers operated in increasingly competitive
conditions. To survive, radio managers needed to incorporate change as an integral part of the operations of
their organizations. Fierce competition for listeners and advertising revenue resulted in the need for radio
managers to adapt and change as their environments changed.
Change certainly is not limited to the broadcasting industry. Many companies have experienced
change in today's business world. Buzzwords such as reinventing, restructuring, and reengineering have been
used to describe businesses' response to change. Academicians and professionals have observed not only that
businesses need to change and adapt to new environments, but also that these businesses need to incorporate
change as a fundamental part of their organizations. Radio station managers' attitudes toward programming
change is the focus of this study (Byrnt.. 1992, 62).
Radio Format Changes 4
LITERATURE REVIEW
Radio station format changes and change management were the main topics of this research. This
section contains a review of the literature pertaining to these topics. It begins with an overview of the
development and changes in radio programming and formats. A review of the definitions and types of change
are then presented. Concluding this section is a discussion of change management.
RadiultatiQu2rogrammiug
The terms programming and formats are often used interchangeably in describing a radio station's
over-the-air product. O'Donnell, Hausman, and Benoit define programming as "the placement of elements
within the broadcast day" of a radio station. They define format as that which "pertains to the entire overall
strategy of the station" (O'Donnell, Hausman, and Benoit, 1989, 73).
Radio's programming 50 years ago was similar to television programming today. No one in the
1920s, 1930s, 1940s or early 1950s had a favorite radio station (N. Anthony, personal communication, March
20, 1993). What people did have were favorite programs. People would choose to listen to comedies, dramas,
mysteries, quiz shows, and musical programs on various radio stations. In this type of radio programming,
commonly called block programming, the radio station used, for example, a comedy show for one two-hour
block, then would air either dramas, variety shows or musical shows for the next hour or two. For their
programming, most of the stations relied on radio networks for delivery of these shows. Some independent
stations would program using local talent and have studio orchestras for local shows (Keith, 1987, 1-2). In the
1950s radio faced an unpleasant reality as television emerged and began offering the same type of
programming. In fact, many of the shows previously on radio had moved to television, and so had the
audience and advertisers. Radio networks' loss to television of national advertising caused them to cut back
programming offered to affiliate stations. With their listenership declining, local radio stations started to play

Radio Format Changes 5
more and more records as an inexpensive alternative to producing their own shows (Vivian, 1991, 185). As a
result, block programming, which depended on the radio networks, was abandoned as a strategy for radio
(Keith, 1987, 2).
At the time of the emergence of television, rock'n'roll also established itself in the field of music. Hit
playlists of record stores were being dominated by the new music (Keith, 1987, 2-31. Some radio stations
started airing this new form of pop music. Anthony reported that during this period the "all format" made its
appearance in radio. Radio would play one type of music, for example, top 40 or country, all day instead of
using block programming. In his book, Keith observed that a new period had begun for radio:
It was the dawning of a new era, of program specialization and selectivity. Radiobroadcasters began to narrow their programming to gain a share of the listeningaudience that would generate advertiser interest. The day when radio stations couldsuccessfully broadcast in a random fashion was coming to a close for all but a few
stations (Keith, 1987, 2).
The first format to appear was a form of hit rock 'n' roll music called top 40. The term was created in
reference to the airing of the top 40 favorite songs as determined by record sales. Keith identified
broadcasters Todd Storz and Gordon McLendon as the young program innovators of this format. This
format had a pre-determined recipe for what music was aired and mixed together. "No other format at the
time adhered so closely to a formula," Keith noted. Eventually Country, Beautiful Music and Middle-of-the-
Road formats would create niches for themselves among listeners. Block programming stations were
becoming extinct. The medium of radio was emerging from the 1950s with even greater strength (Keith, 1987,
2-3).
Competition grew as more licenses were issued by the FCC. While the number of AM station licenses
continued to increase during the 1960s, FM lagged behind. Up to this point, FM had been considered the
alternative band. According to Keith, AM owners treated their FM stations as veak step sisters. Despite its
superior stereo quality, FM was largely ignored during this time. One reason was that very few people had
Radio Format Changes 6
FM receivers. Also, FM was associated with the highbrow culture. It was described by some as the egghead
band, radio for the cultured. Hence, most broadcasters and listeners focused on AM and left FM in limbo
(Keith, 1987, 3-4).
In 1965, the FCC ruled that AM/FM stations could no longer simultaneously broadcast the same
programming. Prior to this, a number of AM stations had broadcast the same programming on their FM
stations. The FCC considered this an inefficient use of broadcast frequencies. This ruling initially applied to
cities with populatioas of 100,000 or more. Thereafter, FM started to attract a listenership with its own
programming (Keith, 1987, 4).
However, AM enjoyed tremendous success during the 1960s and early 1970s. It was not unusual for
an AM station to air 18 to 20 minutes of commercial time per hour. In fact, to squeeze more commercials into
a hour, AM operators were playing 45 rpm records at 47 or 48 rpm to shorten the music. Having few
listeners, FM could not sell its coMmercial inventory and thus had few commercials. By the mid-I960s,
people began to listen to FM because of its limited number of commercials, no-talk policy, and stereo quality
(N. Anthony, personal communication, March 20, 1993). By the late 1960s and early 1970s, FM started to
achieve listenership ratings that attracted the attention or station managers and advertisers (Keith, 1987, 4).
FM listenership continued to grow in the 1970s. FM ceased to be the weak step sister. In 1978, for
the first time, it attracted 51 percent of the radio listening audience. By the mid-1980s, FM would leave AM
far behind with 70 to 75 percent of the listeners. Today FM radio garners 90 percent of the radio listeners (N.
Anthony, personal communication, March 20, 1993).
In the 1970s, undeveloped FM stations were bought and moved closer to major markets to capitalize
on growing revenue possibilities. A 1961 FCC ruling had provided operators considerable flexibility ill
moving transmitter sites. However, the strict ildminist ration of 1-( 'C rules kept the pace or station
development slow. Then, in 1984, the FCC introduced Docket 80-90, which allocated new FM channels and
Radio Format Changes 7
issued new rules allowing "greater flexibility to alter existing FM technical facilities to penetrate larger nearby
markets" (Anderton and Sanders, 1992, 5). Docket 80-90 also included a use-it-or-lose-it provision. FM
stations not operating at full power for their Class were given three years to build up to minimum levels or be
permanently downgraded. This provision, along with the rest of Docket 80-90, changed the FM environment.
FM's growing audience and revenue potential, coupled with the use-it-or-lose-it directive, further fueled FM
station expansion (Anderton and Sanders, 1992, 5).
Radio programming in the late 1970s and early 1980s focused on creating smaller niches in the
audience market. This occurred in markets where radio stations encountered competition from other stations.
Stations started to narrow the focus of the music to reach a specific listener target. For example, now there
were three different Adult Contemporary (AC) formats. One station would have Soft AC, another a Hot AC,
and another a Middle-of-the-Road AC, splitting thrtx; ways what had been the broad Adult Contemporary
listenership (N. Anthony, personal communication, March 20, 1993).
It was during the 1980s that the demise of the trusteeship approach to broadcasting occurred. The
deregulation environment of broadcasting started this process. Docket 80-90, which added new FM
frequencies, was just one part of it. The early 1980s brought about a different concept of the public interest.
Government regulators now viewed liccnsees as marketplace participants rather than holders of a public trust.
The marketplace approach is based upon the view that, in order to profit, entrepreneurs must provide to
consumers goods of value and utility. This entrusts the entrepreneur to maximize fulfillment of societal needs.
As Zaragoza states, the entrepreneur is:
led by an invisible hand to promote an end which was no part or his intention hutwhich, in the course of pursuing this own interest[1...frequentl) promotes that of thesociety more effectively than when he really intends to promote it (Zaragoza, Bodorff andEmord, 1988, 30).
Those who advocate the marketplace approach stated that the trusteeship model prevents the broadcast
Radio Format Changes 8
spectrum from reaching its best and highest use, which can be only achieved through competition (Zaragoza
et al. 31).
J. T. Anderton noted in his book, LMA Handbook, that operators in the early 1980s developed
stations in markets with few or no stations and showed huge profit margins quickly. The financial community
was impressed. The buying and selling of stations accelerated during the 1980s as more money was invested.
Station prices were based on very high multiples of cash flow and the assumption that advertising
revenues would continue to grow as they always had. Thus stations were bought and sold on their business
potential. Many stations were heavily leveraged to fund and capitalize acquisition and development creating
heavy debt burdens (Anderton and Sanders, 1992, 5-7). Thus, in the late 1980s, new station owners had to
pay this debt and interest, they faced more competition with much greater financial pressures than heretofore
experienced.
For example, where a S4 million radio advertising market once had four stations receiving SI million
each, there now might be eight stations obtaining S500,000 of the radio pie. According to Anthony, 55
percent of the radio stations lost money in 1992. Many markets were saturated by radio signals and formats,
and numerous stations were heavily in debt. Advertising revenues remained static and actually decreased
slightly in the early 1990s (N. Anthony, personal communication, September 14, 1993).
An option that radio station managers are choosing to make their stations more competitive and
profitable is to change format. According to Robert Unmacht, editor of the Iv1 Street Journal, 40 to 45 format
changes by radio stations nationwide are tracked in his newsletter each week (R. Unmacht, personal
communication, December 14, 1993). This means that between 2,080 to 2,340 radio stations, approximately
23 percent of the 10,022 commercial radio stations in 1995, switch formats annually ( Broadcasting & Cable,
1995, 46).
Rooster Rhodes, Operations Manager and Program Director of KCAQ-EM, Oxnard, California,
JL 4
Radio Format Changes 9
indicated in a interview that a format change by a competitor might lead another station to switch its format
(R. Rhodes, personal communication, April 1, 1994). Long-time broadcaster Kim Colebrook said
"movement by someone else," in other words, a format change by a competitor, might lead a station to change
its format (K. Colebrook, personal communication, April 5, 1994). However, broadcast consultant Jerry
King stated that in his 25 years of experience he has seen this response to format changes happen only twice in
two markets (J. King, personal communication, April 4, 1994).
Radio stations operate in a dynamic environment. To remain competithe and profitable, radio
station managers have had to change and adapt to shifting conditions. Programming niches have divided the
listener base resulting in advertisers having numerous groups of listeners from which to choose. Stations
fiercely compete in an over-crowded market for the same programming niche and advertising dollar.
Anderton stated that "the result of these conditions is a far higher-than-normal station failure rate in the
industry"(Anderton and Sanders, 1992, 6). To survive, radio station managers had to change and adapt to
this new environment. The most common change is to the station's format.
Changsl
Harvard Business School professor Rosabeth Moss Kanter, Barry A. Stein, and Todd I). Jiek stated
that change is hard to define. They adopted the contemporary idea of change as being movement between
distinct states, which they characterized as discrete and fixed. Discrete and fixed states are identifiable and
separate from each other and are stationary. Change is described as motion between "state 1 at time 1 and
state 2 at time 2." This movement is seen as ubiquitous and multidirectional. Kanter. Stein and Jick described
planned organizational change:
Deliberate change is a matter of grabbing hold of some aspect of the motion andsteering it in a particular direction that will be perceived hy key players as a newmethod of operating or as a reason to reorient one's relationship and responsibilityto the organization itself, while creating conditions that facilitate and assist that
Radio Format Changes 10
reorientation (Kanter, Stein and Jick, 1992, 9).
Howard Carlisle stated that to understand the complexity of corporations and change, it is important
to have a systems view of organizations. Systems theory assumes that nothing exists in nature that is
unattached. To truly understand an organization, one needs to know the relationships that contribute to its
existence. Carlisle observed that "a system is an entity consisting of a composite whole formed of
interdependent parts or elements involving relationships that contribute to the unique characteristics of the
whole" (Carlisle, 1982, 62).
The emphasis is on the organization as a whole and the relationship among its constituent parts.
Relationships that exist among the elements can be studied and understood by the unique characteristics they
give the whole, and by their cause-and-effect interdependencies. Corporations are systems composed of' such
constituents as owners, managers, employees, vendors, competitors and customers. Changes in any one
component will affect the relationships among all the other elements in the organization's system (Carlisle,
1982, 59).
Leon Martel identified two basic kinds of change: structural and cyclical. He defined structural
change as a "fundamental transformation of some activity or institution from a previous state" (Martel, 1986,
32). Structural changes are almost always permanent and prompt other changes in the environment. The
transformation of the government's approach to broadcast regulation from the trusteeship approach to the
marketplace model would fit Martel's structural change definition (Martel, 1986, 39).
Martel described cyclical change as having a temporary nature. Cyclical change does not cause any
transformation in the structure of institutions or activities. The duration of cyclical change is limited, which
means that adjustments to it is temporary. Martel used economic growth rates as an example ofcyclical
change. He noted that a country will enjoy high annual rates of growth and then later realize a downturn in
growth (Martel, 1986, 39).

Radio Format Changes 11
Radio stations provide good examples of cyclical change. Stations often have periods where their
format was popular and the economy strong. Then listener's tastes change, a new competitoremerges with a
better format, or the economy becomes weak, often causing the station to lose money.
Organizations operate in an atmosphere of change. Whether the change is structural or cyclical,
businesses need to change and adjust to their environments. To accomplish this, companies need to analyze
the current environment, identify a need for change, and follow a process that implements planned change.
The following section presents and discusses the process of change management.
Change Management
According to Edgar Schein, Kurt Lewin is the father of planned change. Schein felt that it was most
useful to start understanding planned change by going back to the model first proposed by Lewin (Schein,
1980, 239). Lewin developed a way of examtning change called force-field analysis. According to Lewin,
change is not an event, but a "dynamic balance of forces working in opposite directions" (Hellriegel, Slocum,
and Woodman, 1986, 590). Lewin observed:
In discussing the means of bringing about a desired state of affairs one should notthink in terms of the "goal to be reached" but rather in terms of a change "from thepresent level to the desired one. The discussion thus far implies that a plannedchange consists of supplanting the force-field corresponding to an equilibrium at thebeginning level L, by a force-field having its equilibrium at the desired level L It
should be emphasized that the total force-field has to be changed at least in the areabetween L, and L, (Lewin, 1951, 224).
His theory originally was derived from a physics concept. For example, Einstein theorized space as a
system of distributed gravitational and electromagnetic forces. The distribution of such forces in an
environment "determines what an object with certain properties will do in that environment" (Riordan and
Riordan, 1993, 86).
Lewin's force-field theory asserts that the "properties of any given event are determined by its relation
Radio Format Changes 12
to the system of events of which it is a component" (Riordan and Riordan, 1993, 86). That is, a change
situation involves moving from a current condition to a desired condition. This situation is thought of as a
field in which "forces are facilitating change and forces are hindering change." This theory assumes that most
situations are held in equilibrium by these two opposing forces (Conner and Lake, 1988, 90).
For example, Corbett and Norman used force-field analysis to identify individuals' positive and
negative perceptions when a company introduced change in the form of new computer technology (Corbett
and Norman, 1991, 11). Stokes also stated that force-field analysis is a good management tool for
information systems professionals to use to identify facilitating and restraining forces when trying to attract
users to their systems (Stokes Jr., 1989, 31). Nicholas further identified force-field analysis as a "technique
that can be used to investigate which forces act on a current project or which might influence an upcoming
project, and to determine where emphasis is needed to increase a project's likelihood for success" (Nicholas,
1989, 38).
Hellriegel, Slocum and Woodman assert that using Lewin's model has two major benefits. First, it
requires managers to analyze the current situation, and second, to identify factors that can and cannot be
changed. "Managers often waste a great deal of time considering actions related to forces over which they
have little, if any control" ( Hellriegel et al., 1986, 591). For example, a radio station manager desiring to
improve profitability must analyze the current situation. Forces for and against the changes needed to
improve profitability would have to be identified and understood. The radio manager may need to change the
station's format. However, there may be many forces opposing this change such as owner's dislike of
proposed format, advertisers desires, and competitive pressures. Instead, the manager chooses to reduce
station expenses which has fewer and weaker opposing forces.
As Lewin observed: "To decide how hest to bring about such an actual change, it does not suffice to
consider One property. The total circumstances have to be examined" (Lewin, 1951, 224). The concept is
Radio Format Changes 13
useful in that it identifies and describes these forces, thereby facilitating management strategies to best manage
change.
To initiate change, management must change the equilibrium of the forces. Hel Hegel, Slocum and
Woodman observed that a manager might attempt change by:
a) Increasing the strength of the pressure for change.b) Reducing the strength of the resisting forces or removing them completely.c) Changing the direction of a force --- that is, change a resistance into a pressure
for change (Hellriegel et al., 1986, 591).
Lewin's Foree-field Theory: A Three-Step Model For Change
Kanter, Stein and Jick noted that most change theories are typically modeled after Lewin's three-part
process of change whereby an organization is moved from a flawed current condition to a desired condition
(Kanter et al., 1992, 375). Lewin's theory is composed of a three-stage model of change with the steps being:
unfreezing, changing and refreezing (Lewin, 1951, 228-229). Kanter, Stein and Jiek explained that the three-
part process of change embodied:
1) The company must be awakened to a new reality and must disengage from thepast, recognizing that the old way of doing things is no longer acceptable.
2) Next, the organization creates and embraces a new vision of the future, unitingbehind the steps necessary to achieve that vision.
3) Finally, as new attitudes, practices and policies are put in place to change thecorporation, these must bc "refrozen" or solidified (Kanter et al., 1992, 375).
The unfreezing step is the first stage of change and usually involves reducing the forces that seek to
maintain the status quo. Hersey described it as a "thawing-out process in which the forces acting on
individuals are rearranged so that now they see the need for change" (Hersey and Blanchard, 1988, 387). The
go& is to motivate and prepare individuals or groups for change.
Hellriegel, Slocum, and Woodman described the moving, or change, step as the development of new
behaviors, values, and attitudes through changes in organizational structures and processes (Hellriegel et al.,
J1. 11..)
Radio Format Changes 14
1986, 591). Hersey asserts that the change process occurs by one of two mechanisms: identification and
internalization. Identification occurs when role models are provided from whom individuals can learn new
behaviors. Internalization occurs when individuals are placed in an environment that demands new behaviors
of them if they are to operate successfully in that setting (Hersey and Blanchard, 1988, 382).
The third stage of the change process, refreezing, is described as the step that "stabilizes the
organization at a new state of equilibrium" (Hellriegel et al., 1986, 591). This is often done through
supporting mechanisms such as organizational culture, norms, policies, and structures. The concern with this
step is that the new behaviors of the individual or group do not disappear over time. (Hersey and Blanchard,
1988, 382-383).
Lewin's force field theory explains how forces initiate the process of change. Change is described as
movement from a current condition to a desired condition. This environment is characterized as a field where
there are forces facilitating change, and forces opposing change. Most situations arc held in equilibrium by
these two sets of forces. As noted earlier, some broadcasters suggested that a competitor's format change
might lead a station to change its format. According to the framework of Lewin's theory, this would imply
that a competitor's format change is a facilit tii g force. This study examined a competitor's forma( change as
a possible force that motivates radio station managers to change a station's format.
THE RESEARCH HYPOTHESIS
An examination of the materials on broadcast regulation, radio programming and formats, change,
and change management resulted in the development of a research hypothesis and related questions. Earlier it
was observed that when one station in a market changed formats it led another station in the market to
change its format. This observation suggests that one of the forces acting on the equilibrium of a station
operation is the competition's current format.
Radio Format Changes 15
A review of the literature suggests that the hypothesis for this study is:
Radio station managers will cite the format change of a competing station as a primary force for
considering a change of their station's format. The researcher's definition of primary force was that the factor
is observed as the first or second reason to consider a station format change; i.e., that it be evaluated as a
strong forcx and likely to influence a general manager to consider a station format change.
Related Questions
Lewin's foree-field theory suggests that there are many forces, p:-o and con, that maintain an
organization's equilibrium. While not directly related to the study, two related questions were investigated on
a preliminary basis for future research. They were:
How will managers evaluate a set of possible forces, in terms of their importance, for changing a
station's format?
How will managers evaluate a set of possible forces, in terms of their importance, for opposing a
station's format?
M ETHODOLOGY
Lewin's theory observed that the change of the strength of a force would alter the forces maintaining
the equilibrium and thus cause change to occur. The researcher hypothesized that a format change of a
competitor is one of the forces that influence a station manager to consider a station's form,it change.
The concept was operationalized through depth interviews and a survey questionnaire. The depth interviews
were conducted with individuals from different parts of the country, with various market size backgrounds,
and who had radio format change experience. The survey questionnaire was conducted by telephone with a
census of radio station general managers in Akron, Canton, Cleveland, and Youngstown.
The researcher used methodological triangulation for this study. This strategy permitted the
Radio Format Changes 16
researcher to explore, gather information, and construct a questionnaire on the topic with depth interviews.
The survey was conducted to measure the factors discovered in the interviews. This strategy was not intended
to show corroboration, but rather to better study and understand the attitudes of radio station managers and
the dynamics of radio format changes.
A purposeful sampling method was used for the depth interviews in selecting information-rich cases
for study. For the qualitative part of the study a snowball sampling method was used to recruit subjects for
interview (Patton, 1987, 56). The survey questionnaire used a census of four Northeastern Ohio markets for
study. A census of a small population was used since the survey questionnaire did not utilize established
measures and was untested (True, 1983, 83). Thus, one outcome of this study would be a questionnaire that
has been tested and is capable of being used to conduct future research with a larger sample.
The population surveyed in this study included radio station managers in the Akron. Canton,
Cleveland and Youngstown metropolitan markets. Station managers were selected from radio stations
reported in the Arbitron Company rating surveys. Radio station managers from stations reported in the Fall
1993 Arbitron, from the markets listed, formed the census . The total size of this census was 31. A total of 23
individuals participated in the research, 7 from Akron/ Canton, 9 from Cleveland, and 7 from Youngstown
(Arbitron, 1993, III).
The Qualitative Research: Depth Interviews
The researcher used depth interviews, a qualitative approach, as the pilot component of the study.
Wimmer and Dominick observed that depth interviews give investigators the opportunity to use broad
questions to gain information on a subject (Wimmer and Dominick, 1994, 154-155). The depth interviews
also were used to assist in constructing a questionnaire for the survey. The researcher interviewed eight
individuals for this study. These information-rich cases included persons with the following backgrounds: 1) a
vice president and executive sales director of a medium-market broadcast company, 2) operations manager
Radio Format Changes 17
and program director for a small-market radio station, 3) a vice president and general manager of a radio
station, 4) a radio broadcast consultant of a major national consulting firm, 5) a vice president and general
manager of a major market advertising agency, 6) a president of a national radio broadcast consulting firm, 7)
a vict: president of a national group of 13 radio stations, and 8) a president of a multi-media corporation
owning 15 radio stations.
The Quantitative Research: Survey Questionnaire
The researcher constructed the questionnaire for this study so that each radio station manager's
attitudes were measured using two Likert scales (Singletary, 1994, 84-85). In this study, respondents evaluated
factors that were identified in the depth interviews as motivating and opposing forces for a radio station's
format change. On one scale, respondents were asked to evaluate factors on a scale from 0 to 10 with 0 as 'not
a reason at all' and 10 'as the strongest possible reason' to make a format change. Since the survey was
conducted over the telephone, it was easier for respondents to remember and use this scale in their
evaluations.
The researcher then used another Likert scale to examine the same variables. Participants could
respond to factors with either highly likely, likely, neutral, unlikely, or highly unlikely. The results of this
approach assisted the researcher in gaining an understanding of the factors under examination and provided
information for more extensive research.
Babbie notes that the ultimate validity of a measure cannot be proven. It is difficult to say that a
measure truly reflects a concepts meaning. As for this study's measure to test if a competitor's format change
is a force that influences other station managers to consider a station format change, it has face validity.
Since this study did not use any established measures and the survey questionnaire was untested, there is no
way to assess the reliability of this research (Babbie, 1992, 130-131).
Radio F .1: mat Changes 18
Data Analysis
Depth Interviews
Inductive analysis was used to analyze the qualitative data. Patton identifies inductive analysis as
one method of organizing themes and patterns in the data. Once data is collected, the formal analysis begins.
He identifies inductive analysis as a method whereby "patterns, themes, and categories of analysis come from
the data; they emerge out of the data rather than being decided upon prior to data collection and analysis"
(Patton, 1987, 150). There are two kinds of patterns that materialize from the analysis of the data: (1) the
categories developed and articulated by the participants in the study, and (2) the patterns which people did
not label "and the analyst developed terms to described these inductively generated categories" (Patton, 1987,
150).
Survey Questionnaire
Univariate analysis was used by the researcher to study and interpret the meaning of the data
collected through the survey questionnaires. The analysis of the data involved descriptive statistics that
examined frequency distributions, measures of central tendency, and measures of dispersion of the data
(Babbie, 1992, 63).
Data analysis was accomplished using the Statistical Package for the Social Sciences (SPSS release
4.1) through the Kent State University mainframe computer. The following section details the results of the
analysis of the data collected from the depth interviews and survey questionnaire (Norusis, 1983).
RESEARCH RESULTS
Depth Interviews
Motivating Forces for Changing a Radio Station's Format
The researcher conducted the depth interviews during the first two weeks of April 1994. The

Radio Format Changes 19
researcher questioned participants and probed for reasons or forces that move radio managers to change the
formats of their radio stations. Out of this path of inquiry, the researcher identified nine factors that possibly
act on radio managers to make a station format change. The factors include slippage in station ratings, lack
of sales revenues, competitive moves such as format changes, the development of a hot new format, ownership
change of a competitor, ownership change of station, station research, marginal profits, and anticipated
format change of a competing station. None of the participants cited every item listed above. Each of the
respondents noted three or four factors. When combined, a list of nine potential factors was developed to
determine what leads radio station managers to consider a radio station format change. These factors were
slippage in ratings, lack of sales revenues, competitive moves, the development of a hot new format,
ownership change of competitor, own station o vnership change, station research; marginal profits, and
anticipated format change of competing station.
One of the most cited factors for changing a radio station's format was the lack of sales revenues. Six
of eight people noted the lack of sales revenues in the current format as a very strong reason to change
formats. Another most cited factor for changing a station's format was slippage in station audience ratings.
There were five respondents who cited falling audience ratings of a radio station's current format as a strong
reason to change. .
The most cited factor for changing a radio station's format was competith e pressures. All eight
participants described competitive pressures as a force in deciding to change a radio station's format.
Respondents noted that competitive moves such as format changes, changes to a hot new format, or attacks
by a competitor in a similar format would lead them to consider a station format change. It is important to
note, however, that only one of the individuals cited this as a very strong reason to change formats. Two
participants noted it as their secondary factor, and the remaining five people stated this as a third or fourth
lesser factor in contemplating a station format change.
1 ' t.
Radio Format Changes 20
Opposing Forces To Changing a Radio Station's Format
Upon completing the discussion on forces that might lead the participants to change a radio station's
format, the focus switched to factors that may lead them to reconsider their decision. The question was
framed: Given that the individual was contemplating a format change, what then would be factors or reasons
to reconsider changing a station's format?
The following factors were identified by the participants as reasons to not change a format:
ownership dislike of the proposed new format, current station advertisers, current loyal listeners, being unique
in current format, the cost of changing a station's format, weak sales force to sell new format, station
research, consultant's advice, and deep pockets of competitor. Unlike the forces for changing a radio station's
format, there was no factor that was identified by a majority of the participants. Some factors received
mention by three respondents: all the other factors were observed only once.
The forces against change identified by three participants included the station's current advertisers,
current listeners, and station research. The loss of current advertisers was noted by both the small-market
radio manager and the president of the company owning several stations. The president of the broadcasting
company observed that anytime a radio station changes format, it starts from ground zero and will need to
build another listener and advertiser base. His comment was that too many radio managers underestimate the
loss of business that occurs when changing a radio station's format.
Another factor identified by three individuals was current listener loyalt). Participants observed that
current listenership might lead the manager not to change a station's format, particularly if the potential
audience for the proposed format is questionable. One respondent commented that often it is a matter of
studying the current listeners and determining if the station can encourage them to listen longer, and during
other days and dayparts. Impiovements arc then made to the current format winch then leads to ;in increase
in the station's ratings. Consequently, the station avoids changing its format.

Radio Format Changes 21
Station research was another factor identified by three respondents as a reason to not to change a
radio station's format. They noted that research may reveal that potential listeners, advertising revenues, or
both for a proposed format may not be as great as first thought. In addition, station research may reveal that
improvements in the current format would build more listeners and advertising dollars than making the costly
move of changing the station's format. The remaining force identified by three participants was the cost of
changing a station's format. All three individuals noted that this is not a strong or primary force, but it is a
consideration that might make them not change the format.
One comment worth noting is that it all comes down to what can be described as the risk vs. benefit
ratio. All the risks and all the benefits have to be weighed and examined before changing a radio station's
format. His thoughts were that the factors mentioned to changing a format, pro and con, need to be weighed
against the potential benefit of making that change. Are the prospective revenue benefits worth the risk of
making a change?
Changing A Radio Station's Format
In exploring radio format changes and change management, the researcher asked the eight
participants to describe the process of changing a radio station's format. All the respondents observed that
format changes are dependent on the condition of the station and its market. No two situations are alike. In
their observations, planning, timing, and staff changes would be different for each station's format change.
Six of the eight people stated that once a decision is made to change a station's format, it is usually
executed quickly. The six respondents indicated the timing of a format change from when a decision is made
to implementation is between one and four weeks. They felt the timing was important because they feared the
decision would leak out and.give the competition time to gear up a combative marketing campaign. Two
individuals noted that they had changed a station's format in three to four days, although it is something they
would not recommend. In one case, the respondent observed that a station was offered a large amount of

Radio Format Changes 22
money by a competitor, with a similar format, to drop and change its current format in two hours. The
station agreed to do it, and in two hours dropped the current format. For three days the station played the
songs of one artist from the new format until a new music library arrived.
One participant said that when the station changed its format, he had hired telemarketers to handle
calls from listeners. Telephone calls were screened so that positive calls of praise were passed on to the
announcers. Negative calls were taken by telemarketers who listened, probed for reasons ofdissatisfaction,
and offered information to the caller/listener on how the format change improved the station's ability to serve
its listeners. The unhappy listener was then offered a dinner for two at a nice restaurant if he or she would
listen, try out the station's new format, and then call with feedback. The respondent noted that this approach
was extremely successful in handling and Converting irate listeners from the old to the new format.
Survey Questionnaire
The census was comprised of 20 males and 3 females. Twelve of the 23 had greater than 15 years of
radio management experience, 7 had between 10 and 15 years, I had between 5 and 10 years, and 3
respondents had less than five years of radio managemeht experience. Seven of the 23 individuals were
general managers of group owned stations. The other lb were general managers of radio stations that owned
no other stations outside their market. The ages of the respondents ranged from 22 to 74. The median age
was 49 with a mean age of 48.7. Four respondents refused to provide ages.
Sewnteen of the 23 participants had changed a radio station's format. The other six people had no
format-change experience. Of the I 7 who did, five individuals had experience changing a radio station's
format once, six people had changed formats two times, three people had changed formats three times, two
participants had changed formats four times, and one respondent had changed a radio station's format seven
times.
Radio Format Changes 23
The following sections provide results of the attitude measurements of factors for and against
changing a radio station's format. Data analysis involved descriptive statistics that included frequency
distribution, mean, mode, and standard deviation.
Possible Forces That Influence a Format Change
The researcher had the respondents evaluate potential factors that may influence a radio manager to
change a station's format using a 0 to 10 scale. A score of 0 meant the factor is not at all a reason and a score
of 10 was the highest possible reason to change a radio station's format.
The results of the survey questionnaire appear to support the results of the depth interviews. The
factor, a competitor's format change, received a mean score of 3.565. At first glance this would indicate that
radio general managers in the census rated a competitor's format change as a very low reason to consider
changing their station's format. However, the standard deviation is large, 2.761, which indicates the scores
were widely distributed from the mean. The range of reported scores was a minimum of 0 with a maximum of
8. The mode value was 0 with a frequency of 5. The values 2, 3, 5 and 8 had a frequency of 3.
While the results indicate that radio station managers in Akron, Canton, Cleveland, and Youngstown
cite a competitor's format change as a weak motivating force for a station format change, the range and
frequency distribution of the scores may indicate that the strength of this factor varies. Five of the radio
station general managers evaluated this factor with a 0, but the other 18 respondents measured the factor
between I and 8. While the mean score indicates this is a weak factor, the range and frequency distribution of
each of the scores exhibit strength that varies between 0, not at all a force, to 8, strong.
Radio station general managers in the census were asked to evaluate nine potential forces in the
survey questionnaire. Evaluations were accomplished using the same 11-point Likert scale. Slippage in
station ratings, lack of sales revenues, marginal profits, and station research Necked mean scores of 7 or
higher in measurement. But the standard deviation for each of the factors mean scores was large. This
Radio Format Changes 24
indicates that the scores were widely dispersed. However, the frequency distribution of each score showed
that the majority of the respondents evaluated these factors as 6 or higher.
T1 next segment of the survey used a another Liken scale to measure the attitudes of radio general
managers toward possible factors influencing a station format change. The scale used was I 'highly unlikely,'
2 'unlikely,' 3 'neutral,' 4 'likely,' and 5 'highly unlikely.' An examination of the results of the second Likert
scale measurements indicate that a competitor's format change is unlikely to lead a station manager to change
a station's format. The mean score was 2.304 with a standard deviation of 1.063. In this census, radio station
managers observed that it is unlikely a competitor's format change would lead them w consider a station
format change. However, the standard deviation is somewhat large exhibiting a wide dispersion of scores.
The mode was 2 (unlikely) with a frequency of 8. The range and frequency distribution of each score varied
from a score of 1 (Highly Unlikely) with a frequency of 6 to a score of 4 (likely) with a frequency of 4. There
were 5 respondents who cited the value of 3 (neutral) for this factor. Overall, 14 respondents rated this factor
at least unlikely, but 5 cited neutral and 4 responded with likely.
Evaluations were made for the other motivating factors that might influence a radio general manager
to change a station's format. The measurements exhibit the clearest results for lack of sales revenues with a
mean score of 4.652 and standard deviation of .714, marginal profits had a mean score of 4.130 and a
standard deviation of .968, and station research had a mean score of 3.783 and a standard deviation of .736.
The results indicate that the radio station managers in the census evaluated these factors as likely to motivate
them to consider making a station format change. Slippage in ratings also received a mean score of 4.087, but
the standard deviation was 1.240. The frequency distribution though showed that 18 of the 23 respondents
rated this factor likely or higher as a motivating force.
The other factors of competitor's format change, hot new formats, anticipated format change of
competitor, ownership change of competitor, and own station ownership change received mean scores that
1.1
Radio Format Changes 25
rated the factors unlikely to lead the radio station general managers in the census to consider a station format
change. However, the factors' mean scores had standard deviations that were large indicating a wide
dispersion of scores.
Possible Factors Opposing A Format Change
In the final segment of the survey, respondents, using a Likert scale, measured possible factors that
might influence radio sales managers to reconsider a station format change. The same Likert scale was used
again nigh ly unlikely,' 2 'unlikely,' 3 'neutral,' 4 'likely,' and 5 'highly likely.' The score reflected a radio
station manager's attitude towards potential factors that may cause a decision to change a station's format to
be reconsidered. The results of these measurements were inconclusive. Most of the mean scores for these
factors had large standard deviations indicating a wide distribution of scores.
Summary
The intention of this study was to examine one specific force that may influence radio station
managers to change formats. As it was, the small size of the census limited the ability of the rcsearch to
examine the hypothesis. What this study does find is that there are a number of forces that influence change,
as noted by Lewin. However, due to the study's limitations, the exact nature and strength of those forces are
unknown.
The results of this study do not support the research hypothesis. The data collected from the depth
interviews identified a competitor's format change as a potential force in influencing a radio station's manager
to consider a station format change. But most of the eight individuals interviewed noted the force as a third
or fourth reason. Analysis of the data gathered through the survey questionnaire showed that radio station
general managers in the census do not cite this factor as a primary force. A competitor's format change was
evaluated by the census as a weak influence in the consideration of a station format change. However, the
Radio Format Changes 26
dispersion of the scores indicate that the presence and/or strength of this force varies among the participants
in the census.
The pursuit of this research produced two related questions: what are the motivating forces that
influence a station manager to consider a station format change?, and what arc the opposing forces that
influence a station manager to reconsider a format change? The depth interviews identified nine potential
motivating forces. These forces were slippage in station ratings, lack of sales revenues, competitive moves, the
development of a hot new format, ownership change of competitor, own station ownership change, station
research, marginal profits, and anticipated format change of competing station.
The evaluations of radio general managers from the census exhibited the clearest results for lack of
sales revenues, marginal profits, and station research. These factors were identified as forces that would likely
influence the managers to consider a station format change. Slippage in station ratings was evaluated as a
likely force, but the dispersion measurements for this factor showcd the evaluations varied widely.
The other factors or competitive moves, hot new format, anticipated format change of competitor,
ownership change of competitor, and own station ownership change were rated as unlikely to lead the census
to consider a station format change. However, the evaluations were widely dispersed for all these factors.
This means that the strength and/or presence of these forces varied among radio managers in the census.
The depth interviews identified ten possible forces opposing a radio station format change. The
forces identified were: ownership dislike of prospective new format, current station advertisers, current loyal
listeners, being unique in current format, cost of changing a station's format, a weak sales force, station
research, cost of operating new format, consultant's advice, and deep pockets of competitor. Measurement
of these factors in the survey questionnaire were inconclusive. The dispersion of the scores made the results
unclear.
Radio Format Changes 27
Conclusion and Implications
Although the initial results of this study failed to confirm the research hypothesis, this conclusion
would be premature. The distribution of the scores from the survey questionnaire showed that the strength or
a competitor's format change varies in its ability to influence radio station general managers in the census to
consider a station format change. One possible explanation for these results is that the size of the census
surveyed was small. This could affect the ability of the descriptive statistics to provide clear results.
Comments offered by some of the respondents offer another interpretation. In evaluating the forces
of change, one respondent stated that "it depends on the corporate strategy" of what would lead a station
manager to consider a station format change. Another individual from Cleveland said that the only way his
station would change formats "is if it got bought," because the station is focused on serving the ethnic
community with ethnic-centered programming.
The comments suggest that one possible element influencing the distribution of survey scores in the
evaluation of forces is the mission or goals of each station. Lewin stated that change is movement from a
current condition to a desired condition. The researcher suggests that one component not considered in the
study is the radio station's current point of equilibrium and what, if any, is the desired point of equilibrium.
The desired equilibrium in the example of a radio station may be defined as its mission or goals.
The goals may range from a level of profitability to serving the needs of a specific listening audience
with specific information and entertainment. The respondent with the ethnic-centered programming served
the ethnic community. This station's mission was to serve this specific audience. No fitctor, according to the
articipant, would lead the station to change its format except if' it is sold. Another radio station general
manager may be influenced to change a station's format if its level of profitabilit) dropped below a certain
point.
An additional explanation for the results of' the survey questionnaire was that participants were asked
Radio Format Changes 28
to evaluate and rate potential motivating and opposing factors individually. One respondent commented that
"it's a combination of things that lead a radio general manager to make a station format change. A
participant from the depth interviews stated that the dynamics of radio station format change are complex.
Lewin observed that forces have various strengths and that the sum of these forces maintain the equilibrium.
Thus evaluating and rating each factor separately may be unrealistic and out of context.
While this study did establish that a competitor's format change as a possible motivating force among
the participants in the research, the strength of this factor is still unknown. A better question would be: when
is a competitor's format change a significant force in influencing a radio station manager to consider changing
a station's format'?, and what is its strength in relation to other factors?
The implications of this study: the presence and strength of forces that act on radio station managers
are dynamic and complex. The findings suggest that station managers do not have identical forces with
identical strengths acting on them. There appears to be other variables that determine the forces which create
equilibrium for a station.
There are limitations to this study that need to be noted. First, the results of the depth interviews
cannot be generalized. The nature of qualitative methods makes it difficult to generalize results. Naturalistic
inquiry is excellent for observing and gathering information on the experiences of participants. Patton
observed that the term generalization in qualitative research gives way to extrapolation. Extrapolations are
mild speculations on the likely applicability of results to other similar situations. They are thoughtful,logical,
and useful when based or data collected from information-rich sources (Patton, 1987, 168).
Data collected by the survey questionnaire is limited in its ability to be generalized. A census of radio
station general managers in Akron, Canton, Cleveland, and Youngstown was surveyed. Their input provided
Radio Format Changes 29
a better understanding of' the topic. It is unknown how this census reflects the attitudes of radio station
general managers in the U.S. Thus, the results can be generalized to the population of the census, hut
nowhere else.
The final limitation concerns the questionnaire used for the survey. The questionnaire did not use
established measures and was untested. Although it had face validity, there is no way of evaluating the
reliability of' this questionnaire.
Recommend a t ions
This research serves as a pilot study for gaining familiarity with the subject of radio station format
changes. The results indicated that the dynamics of radio station format changes are complex. The researcher
recommends that future studies investigate how the station mission or goals determine which motivating and
opposing forces influence a station format change. In addition, other variables such as market size, type of
ownership, and the general manager's experience should be examined to determine if there are any significant
relationships that decide the forces influencing or opposing radio station general managers to consider a
station format change.
Future research needs to be conducted concerning the second part of Lewin's force-field theory of
change in relation to station format changes. The first part of Lewin's force-field theory requires managers to
analyze the current situation and identify which forces can and cannot be changed. The second component,
which involves Lewin's three stage process of change, was not within the scope of this study However, during
the depth interviews the researcher did query participants on how station format changes were implemented.
Information collected did indicate suppOrt for Lewin's three stage process of change. hut further research is
needed.
Radio Format Changes 30
BIBLIOGRAPHY
Anderton, J.T., and Tony Sanders. (1992) LMA Handbook Springfield, MA: Radio Business Reports.
Arbitron Radio Market Report Fall 1993: Youngstown-Warren. (1993) New York: The Arbitron Company.
Babbie, Earl. (1992) The Practice of Social Research. 6th ed. Belmont, CA: Wadsworth Publishing
Company.
Broadcasting & Cable. (1995) January 30.
Byrne, John. (1992) "Paradigms For Postmodern Managers." Business Week. Bonus.
Carlisle, Howard M. (1982) Management: Concepts. Methods. and Applications Chicago: Science Research
Associates, Inc.
Connor, Patrick E., and Linda K. Lake. (1988) Managing Organizational Change. New York: Praeger
Publishers.
Corbett, Gail F., and Ronald J. Norman. (1991) "Implementation: The Operational Feasibility Perspective."
kurnaLsa_Smcmillianagsunsait. 42: 10.
Head, Sydney W., Christopher H. Sterling, and Lemuel 13. Schofield. (1994) Broadcasting in America 7th ed.
Boston: Houghton Mifflin Company.
Hellriegel, Don., John W. Slocum, and Richard W. Woodman. (1986) Organizational Behavior. 4 ed. St.
Paul, MN: West Publishing Company.
Hersey, Paul., and Kenneth H. Blanchard. (1988) Management of Organizational Behavior. 5th ed.
Englewood Cliffs, CA: Prentice-Hall, Inc.
Kanter, Rosabeth Moss., Barry H. Stein, and Todd I). Jick. 11992) The Challenge of Organizational Change.
New York: The Free Press.
Keith, Michael C. (1987) Radio Programming Consultancy and Formatics. Stoneham, MA Butterworth
Publishers.
Radio Form-. t Changes 31
Lewin, Kurt. (1951) Field Theory in Social Science. New York: Harper & Brothers Publishers.
Martel, Leon. (1986) Mastering Change The Key to Business Success. New York: Simon and Schuster.
Nicholas, John M. (1989) "Successful Project Management: A Force-Field Analysis." Journal or Systems
Management. 40; 1. January.
Norusis, Marija J. (1983) Introductory Statistics Guide: SPSSX. New York: McGraw-Hill Book Company.
O'Donnell, Lewis B., Carl Hausman, and Philip Benoit. (1989) Radio Station Operations Managemeni_and
employee Perspectives. Belmont, CA: Wadsworth Publishing Company.
Patton, Michael Quinn. (1987) How to Use Qualitative Methods in Evaluation. Newbury Park, NJ: Sage
Publications.
Riordan, Diane A., and Michael P. Riordan. (1993) "Field Theory: An Alternative to Systems Theories in
Understanding The Small Family Business." Journal of Small Business Management. 31.
Schein, Edgar. (1980) Organizational Psychology. 3rd ed. Englewood Cliffs, NJ: Prentice-Hall Inc.
Simmons, Steven J. (1978) The Fairness Doctrine And The Media. Berkeley, CA: University of California
Press.
Singletary, Michael. (1994) Mass Communication Research: Contemporary Methods And Applications. New
York: Longman Publishing Group.
Stokes Jr., Stewart L. (1989) "Getting a Foot In The Door: Scrutinize IS to Help Build a Strong Case For
Teaching Managerial Skills." Computerworld. October 23.
True, June Audrey. (1983) Finding Out: Conducting And Evaluating Social Research. Belmont, CA:
Wadsworth Publishing Company.
Vivian, John. (1991) The Media of Mass Communication. Needham Heights, MAI Allyn and Bacon.
Radio Format Changes 32
Wimmer, Roger D., and Joseph R. Dominick. (1994) Mass Media Research: An Introduction. Belmont, CA:
Wadsworth Publishing Company.
Zaragoza, Richard R., Richard J. Bodorft and Jonathan W. Emord. (1988) "The Public Interest Concept
Transformed: The Trusteeship Model Gives Way to a Marketplace Approach." Public Interest And
The Business of Broadcasting: The Broadcast Industry Looks At Itself eds. Jon T. Powell and Wally
Gair. Westport: Quorum Books.
28 1
BIBLIOGRAPHY
Anderton, J.T., and Tony Sanders. LMA Handbook Springliekl, MA: Radio Business Reports,
1992.
A Guide to Understanding And Using Radio Audience Measuremeas. New York: The Arbitron
Company, 1990.
Arbitron Radio Market Report Fall 1993: Youngstown-Warreh. New York: The Arbitron
Company, 1993.
Babbie, Earl. The Practice of Social Research. 6th ed. Belmont, CA: Wadsworth Publishing
Company, 1992.
Beer, Michael. Organization Change And Development. Santa Monica, CA: The Goodyear
Publishing Company, 1980.
Byrne, John. "Paradigms For Postmodern Managers." Business Week. Bonus 1992.
Carlisle, Howard M. Management: Concepts. Methods. and Applications Chicago: Science Research
Associates, Inc., 1982.
Connor, Patrick E., and Linda K. Lake. Managing Organizational Change. New York: Praeger
Publishers, 1988.
Corbett, Gail F., and Ronald J. Norman. "Implementation: The Operational Feasibility Perspective."
Journal of Systems Management. 42: 10, 1991.
DeVito, Joseph A. Human Communication: The Basic Course. New York: HarperCollins College
Publishers, 1994.
78 7
Fitz-Gibbon, Carol Taylor and Lynn Lyons Morris. How To Analyze Daut. Newbury Park, NJ:
Sage Publications, 1987.
Griffin, Em. A First Look At Communication Theory. New York: McGraw-Hill Inc., 1991.
Hagin, Linwood. Paper presented at the Broadcast Educators Association convention.
atcisioallaking In Radio Management: A Case Study of WIVK-AM's Format Change
From Country to News/Talk. April 1993. Unpublished.
Head, Sydney W., Christopher H. Sterling, and Lemuel B. Schofield. Broadcasting in
America 7th ed. Boston: Houghton Mifflin Company, 1994.
Hellriegel, Don., John W. Slocum, and Richard W. Woodman. Organizational Behavior. 4 ed. St.
Paul, MN: West Publishing Company, 1986.
Henerson, Marlene E.., Lynn Lyons Morris, and Carol Taylor Fitz-Gibbon. How To Mewsure
Attitudes. Newbury Park, NJ: Sage Publications, 1987.
Hersey, Paul., and Kenneth H. Blanchard. Management of Organizational Behavior. 5th ed.
Englewood Cliffs, CA: Prentice-Hall, Inc., 1988.
Huse, Edgar F., and Thomas G. Cummings. prganizational Development and Change. 3rd ed. St.
Paul, MN: West Publishing Company, 1985.
Kanter, Rosabeth Moss., Barry H. Stein, and Todd D. Jick. The Challenge of Organizational
Change. New York The Free Press, 1992.
Keith, Michael C. Radio Programming Consultancy and Formatics. Stoneham, MA: Buuerworth
Publishers, 1987.
1
/8 3
Kuhn, Thomas S. The Structure of Scientific Revolutions. 2nd ed. Chicago: The University of
Chicago Press, 1970.
Leedy, Paul. Practical Research Panning And Design. 5th ed. New York: Macmillan Publishing
Company, 1993.
Lewin, Kurt. Field Theory in Social Science. New York: Harper & Brothers Publishers, 1951.
Martel, Leon. Mastering Change The Key to Business Success. New York: Simon and Schuster,
1986.
Nicholas, John M. "Successful Project Management: A Force-Field Analysis." Journal of Systerns
Management. 40; 1. January 1989.
Norusis, Marija J. Introductory Statistics Guide. SPSSX. New York: McGraw-Hill Book Company,
1983.
O'Donnell, Lewis B., Carl Hausman, and Philip Benoit. Radio Station Operations Management and
Employee Perspectives. Belmont, CA: Wadsworth Publishing Company, 1989.
Patton, Michael Quinn. How to Use Qualitative Methods in Evaluation. Newbury Park, NJ: Sage
Publications, 1987.
Pringle, Peter K., Michael F. Starr. and William E. McCavitt. Electronic Media Management. 2nd
ed. Stoneham, MA: Butterworth-Heinernann, 1991.
Ray, Michael. "Introduction: What is the New Paradigm in Business'!" The New Paradigm In
Business. New York: The Putnam Publishing Company, 1993.
28 4
Riordan, Diane A., and Michael P. Riordan. "Field Theory: An Alternative to Systems Theories in
Understanding The Small Family Business." Journal of Small Business Management. 31.
1993.
Schein, Edgar. Organizational Psychology. 3rd ed. Englewood Cliffs, NJ: Prentice-Hall Inc., 1980.
Simmons, Steven J. The Fairness Doctrine And The Mednt. Berkeley, CA: University of California
Press, 1978.
Singletary, Michael. Mass Communication Research: Contemporary Methods And Applications.
New York: Longman Publishing Group, 1994.
SPSSX Basics. Chicago: SPSS Inc., 1984.
sp_s_sxjj_lias_auidcr. 2nd ed. New York: McGraw-Hill Book Company, 1986.
Stokes Jr., Stewart L. "Getting a Foot In The Door; Scrutinize IS to Help Build a Strong Case For
Teaching Managerial Skills." Computerworld. October 23, 1989.
The American Heritage Dictionary. Boston: Houghton Mifflin Company, 1985.
True, June Audrey. Finding Out: Conducting And Evaluating Social Research. Belmont, CA:
Wadsworth Publ .ning Company, 1983.
Vivian, John. The Media of Mass Communication. Needham Heights, MA: Allyn and Bacon, 1991.
Zaragoza, Richard R., Richard J. Bodorff and Jonathan W. Emord. "The Public Interest Concept
Transformed: The Trusteeship Model Gives Way to a Marketplace Approach." publiQ
lausaLAnsidhslau.5jusLaQ.Laraaticains*: The Broadcast Industry Looks At Itself eds. Jon
T. Powell and Wally Gair. Westport: Quorum Books, 1988.
AN INVESTIGATION OF FACTORS AFFECTING JOB SATISFACTION AND
CAREER MOTIVATION OF ON-AIR RADIO PERSONALITIES
A Paper Presented to
Association for Education in Journalism and
Mass Communication
Media Management and Economics Division
by
Kathleen A. FoxB.A., Aquinas College, 1992
M.A., Indiana State University, 1994Ph.D. Student, Ohio University
Investigation of Job Satisfaction
Kathleen A. FoxOhio University
Abstract
This study uses Herzberg's Two-Factor Theory, Vroom's
Expectancy Theory and London's Theory of Career Motivation to
analyze employee motivation. Radio personalities within the state
of Indiana were mailed questionnaires and interviewed by phone to
respond to questions regarding satisfaction and dissatisfaction
within their jobs. The stlidy found support for Vroom's Expectancy
Theory and partial support for Herzberg's Two-Factor Theory.
However, the study's findings did not replicate the London based
study of Noe, Noe, and Bachhuber concerning career motivation.
Investigation of Job Satisfaction 1
Review of Literature
The on-air radio personality, whose voice wakes people in the
morning, provides information about dangerous weather and
accompanies people to the beach, has touched American society
since the early twentieth century. The first licensed radio
station, KDKA, Pittsburgh, operated by Dr. Frank Conrad, began a
flurry of interest in the radio industry (Sterling & Kittross,
1990) . From that tentative beginning, the radio industry has
remained far from static. Changes in personnel and technology
created an even more complex business than originally thought.
This study is an investigation of the factors affecting job
satisfaction and career motivation of on-air radio personalities.
The research for this study of motivation draws upon Herzberg's
Two-Factor Theory, Vroom's Expectancy Theory and London's Career
Motivation for its theoretical underpinning. The purpose of this
study is to assist station Program Directors in understanding and
managing the motivational factors revealed by their subordinates.
The importance of worker motivation should not be
underestimated in the radio industry. Personnel serve an
important function in maintaining profitability at radio stations.
A radio station is a business that creates revenue through selling
advertisements. While the on-air radio personalities usually do
not sell the advertisements, their job is directly related to this
business function. For example, radio personalities often perform
the voice work for the advertisement. Indirectly, yet equally
important, a station's image is also shaped by the (on and off-
Investigation of Job Satisfaction 2
air) behavior of on-air personalities. The radio personality's
behavior may be influenced by the amount of job satisfaction or
dissatisfaction he/she may feel. Craig and Hindmarsh (1984) feel
there is a serious need for emphasis on motivation within the
broadcast industry.
Attend any meeting and you will hear still the "rah-rah" kindof motivation for sales people and on-air staff. It's this"let's sell one for the Gipper" attitude that needs to bechanged. Industry after industry is concerned about workermotivation. Business schools after business school spendconsiderable time discussing the need to examine causes ofbetter work performance. The broadcast industry has to beginexamining its conception of management and worker motivationfrom a more critical viewpoint (p. 21-22).
Unfortunately, the few broadcast management textbooks that
appear on the market report little on how to motivate radio
personnel. The textbooks provide explanations of the popular
motivation theories but provide little specific application to
broadcast employees (Willis & Willis, 1993; Sherman, 1987;
Pringle, Starr, & McCavitt 1995; Lavine & Wackman, 1988) . More
specifically, the books neglect to discuss how motivation theories
pertain to managing radio or television personalities.
For purpose within this study, work motivation is the sum of
the energizing forces, both internal and external, that account,
at least in part, for certain productive behavior in a person's
job (Hitt, Middlemist, & Mathis, 1989) . It is acknowledged by
researchers from many fields that motivation is a changing process
that naeds consistent attention. As society changes, people's
drives and motivations within their personal and work lives
Investigation of Job Satisfaction 3
change. Also, what motivates one person may not motivate another.
Therefore, this study focuses on the energizing forces that drive
individual workers instead of generalizing one worker's needs and
wants as every workers' needs and wants.
There are many theories of human motivation, and more
specifically, organizational employee metivation. The strongest
worker motivation theories are McGregor's Theory X and Y, Maslow's
Hierarchy of Needs, Herzberg's Two-Factor Theory and Vroom's
Expectancy Theory (Terpstra, 1979; Pardee, 1990; Craig &
Hindmarsh, 1984) . This study focuses on Herzberg's Two-Factor
Theory, Vroom's Expectancy Theory and London's Career Motivation
Theory in belief they will provide insight into the radio
personality's work attitudes.
Herzberg's Two-Factor Theory
According to Herzberg(1966), work-related variables
contributing to job satisfaction are separate from factors
contributing to job dissatisfaction. The factors that compose job
satisfaction, often called satisfiers, motivators or intrinsic
factors, are achievement, recognition, work itself, responsibility
and advancement. These are the components believed to motivate
employees within the work place. When satisfiers are absent,
motivation is prevented. When satisfiers are present, they lead
to satisfaction and motivation when the hygienes are also present
(Hitt, Middlemist & Mathis, 1989).
Herzberg (1966) found that the major work dissatisfiers,
often called external or hygiene factors, are company policy and
Investigation of Job Satisfaction 4
administration, supervision, salary, interpersonal relations and
working conditions. Dissatisfiers or hygienes do not motivate
employees, but when absent, increase dissatisfaction with the job.
When hygienes are present, they prevent dissatisfaction with the
job (Hitt, Middlemist & Mathis, 1989).
Satisfiers often produce long-term changes in job attitudes,
while dissatisfiers produce short-term changes in job attitudes
(Herzberg, 1966) . Contrary to conventional wisdom, Herzberg's
work showed that the opposite of job satisfaction is no
satisfaction rather than dissatisfaction; the opposite of job
dissatisfaction is no job dissatisfaction, not satisfaction with
one's job (Hill, 1986-1987) . In short, satisfaction and
dissatisfaction may be considered two different elements in the
motivation mix rather than two ends of a single continuum.
Herzberg's Two-Factor Theory, also called the Motivation-
Hygiene Theory, was empirically tested using accountants and
engineers as subjects (Herzberg, 1966). From the results of
Herzberg's extensive studies, the theory has been generalized to
other employee groups. Herzberg (1987) performed twelve
investigations of the theory on the following groups: lower level
supervisors, professional women, agricultural administrators, men
about to retire from management positions, hospital maintenance
personnel, manufacturing supervisors, nurses, food handlers,
military officers, engineers, scientists, housekeepers, teachers,
technicians, female assemblers, accountants, Finish foremen and
Hungarian engineers.
Investigation of Job Satisfaction 5
Some previous research has provided support for Herzberg's
Two-Factor Theory. Hill (1986- 1987) tested college faculty by
gathering information from over one thousand full-time faculty at
colleges and universities. Hill determined that Herzberg's theory
is applicable to institutions of higher learning.
Maidini (1991) tested the Two-Factor Theory and found support
for half of the theory. He tested the theory*on public and
private sections of personnel management using a questionnaire
based on the theory. The study concluded that motivators are
factors of satisfaction but hygiene factors also were causes of
satisfaction. Therefore, some of Maidini's results contradicted
the predictions of Herzberg's Motivation-Hygiene Theory.
While there has been much support for Herzberg's Two-Factor
Theory, there also has been some criticism. The critics (Hill,
1986-1987; Notz, 1975; Terpstra, 1979; Szura & Vermillion, 1975)
say efforts to validate the theory have inconsistent results,
therefore raising questions about the adequacy of the theory to
predict motivational factors. However, different jobs attract
different personnel, and people who may respond differently to
motivators. Consequently, studies performed on different
professions will yield different results. Herzberg's Theory may
be applicable to some professions and not others. This study will
seek to discover whether Herzberg's Two-Factor Theory can be used
to predict moLivational factors of radio personalities.
A. t
Investigation of Job Satisfaction 6
Vroom's ENpectancy Theory.
Another major theory of human behavior is vroom's expectancy
Theory. Vroom's (1970) Expectancy Theory has three beliefs:
people will perform their jobs if they believe they have the
ability to do the job; people will perform their jobs if they
believe they will be rewarded for their effort (expectancy); and
people will perform their jobs only if they will receive the
rewards they desire (valence) . Vroom's theory is a mathematical
equation expressed as Motivation = Valence X Expectancy (Craig &
Hindmarsh, 1984).
According to Vroom (1970), there are four classes of
variables that decide the attitude of a person toward his/her role
in an organization and the probability that he/she will leave it.
The first class of variables is that outcomes such as pay, status,
acceptance and influence attained by a person performing his/her
organizational role affect a person's attitude. Second, the
strength of the person's desire or avoidance for these outcomes
decides a person's attitude. Third, the outcomes believed by a
person to be equitable to others influences the person's attitude
(i.e. equal pay for equal work). Last, the extent these perceived
outcomes meet the person's expectations decides a person's
attitude.
Similar to Herzberg's Two-Factor Theory, Vroom's Expectancy
Theory has been criticized. Some researchers argue that there is
a difficulty in testing expectancy theory because it is difficult
to reduce employee attitudes to numbers(Butler & Womer, 1985;
Investigation of Job Satisfaction 7
Craig & Hindmarsh, 1984) . This study will employ open-ended
interview questions to avert this difficulty.
London's Career Motivation
One aspect of work motivation is an employee's desire to
further his/her career goals. While some of an employee's
motivation contributes to the general good of an organization,
career motivation gives the employee incentive to further his/her
own life (Noe, Noe & Bachhuber, 1990) Career motivation consists
of three individual characteristics: career identity, career
insight and career resilience (London, 1983; London & Mone, 1987).
Career identity describes the centrality of a career to an
individual's personal identity. In service jobs, career identity
describes the extent to which people define themselves through
their work (London, 1983; London & Mone, 1987) . For example, on-
air radio personalities may consider themselves artistic
performers. A great deal of radio personalities' work--radio
announcing-- may be considered a natural expression of who they
think they are.
Career insight is the extent to which people have ralistic
career expectations, knowledge of their abilities and specific
career goals (London, 1983; London and Mone, 1987) . For example,
some radio personalities may realistically feel they have the
talent to work in a large market while others may unrealistically
believe their skills, although no better than mediocre, will lead
them to a job in New York.
Investigation of Job Satisfaction 8
Career resilience describes the ability of a person to
maintain a career through adapting to changing circumstances
within the work environment (London, 1983; London and Mone 1987).
For example, a radio station may be bought by a different
corporation and change formats. Resilience describes the on-air
personality's ability to accept and adopt this change.
Noe, Noe and Bachhuber (1990) based a study upon London's
concepts of career identity, career insight and career resilience.
The study was performed through distributing a questionnaire
asking attitudes about career identity, career resilience and
career insight, to 400 employees working in health care, financial
services and computer-related industries. The study discovered
that individuals with high work role salience are more likely to
engage in career exploration. In other words, those employees
with distinctive jobs in society (i.e.. radio personalities) will
explore more within their careers. Also, work role salience and
job characteristics have the strongest relationship with career
motivation. Since radio personalities perform distinctive jobs
within society, Noe, Noe and Bachhuber's study may have strong
implications for their careers.
Career identity, career insight and career resilience provide
theoretical insight that Herzberg's Two-Factor Theory and Vroom's
Expectancy Theory do not. These three concepts provide an
understanding of the journey throughout a career while Herzberg
and Vroom's Theories look at specific facets of a particular work
environment. Herzberg's Two-Factor Theory presents the components
Investigation of Job Satisfaction 9
within an organization that drive a person to perform a particular
job. Vroom's Expectancy Theory narrows employee motivation by
examining the human desires that lead to specific tasks in the
work place. Noe, Noe and Bachhuber's study focuses on a person's
choices and desires throughout the course of a career while moving
from job to job.
On-air radio personalities often travel from job to job to
further their careers. Moving from one station or market to
another is often considered "moving up in the business." An
analysis needs to be executed to determine what motivates on-air
radio personalities throughout their careers in order to
understand the motivating factors within a particular job.
Perhaps, employees behave in a particular way within their jobs
simply to move toward their career goals.
Research Ouestions
This study's research questions are guided by Herzberg's Two-
Factor Theory, Vroom's Expectancy Theory and London's concepts of
career insight, career identity and career resilience. The
following research questions lead this study of employee
motivation.
RQ1: What factors internal to the organization serve as motivatorsfor air perf;onalities at a radio station?
RQ2: What factors external to the organization serve asmotivators for air personalities at a radio station?
RQ3: What factors internal to the organization serve asdissatisfiers for air personalities at a radio station?
RQ4: What factors external to the organization serve asdissatisfiers for air personalities at a radio station?
1°C;)
Investigation of Joh Satisfaction 10
RQ5: What outcomes do radio personalities desire in order toperform their job?
RQ6: What abilities do radio personalities feel will lead them todesired outcomes?
RQ7: To what extent do radio personalities have career identity?
RQ8: To what extent do radio personalities have career insight?
RQ9: To what extent do radio personalities have careerresilience?
Methodology
Subjects
Subjects were on-air radio personalities within the state of
Indiana. Two methods were utilized for this study and each
consisted of a different sample. One sample, receiving the
questionnaire, consisted of all two-hundred thirty-eight-radio
stations within the state of Indiana. Bacon's Radio/TV Directory
(1992) was used to obtain addresses of all Indiana radio stations.
The program director at each radio station was asked to distribute
the questionnaire to a morning or daytime air personality. Half
the sample was morning air personalities and half was daytime
personalities. Morning and daytime air shifts were thought to
provide an accurate representation of the variety of full-time
radio personalities. Part-time employees were not considered in
the study because they may have a different set of motivators than
full-time radio personalities. Seventy-two radio personalities
completed the questionnaire creating a thirty percent response
rate for the mail questionnaire. Fifty-three percent of the
1
Investigation of Job Satisfaction 1 1
respondents were morning radio personalities and forty-seven
percent were daytime personalities.
An interview format usually uses a much smaller sample than a
questionnaire. Therefore, the interview sample consisted of
twenty-five percent of the sample used for the questionnaire. A
stratified sample was used for the phone interviews. The phone
interview's sample was based upon the size of the radio station as
measured by transmitter power. A breakdown of radio station
transmitter wattage was used to determine a station's reach and
size. A random sampling within each station wattage category was
used to determine the actual stations phoned. While not the only
measurement of a station.'s size, wattage is a commonly used
measurement and a reasonable measurement for use within the study.
Each radio station phoned was asked to participate in the
study by having a morning or afternoon radio personality complete
a phone interview at a lacer time. If a radio personality was
unable or unwilling to participate in the study after three
contact attempts then he/she was discarded from the sample. Forty
of the fifty-nine subjects completed the interview creating a
sixty-eight percent response rate.
Method
Two methods were used to gather data from radio talent:
questionnaire and phone interviews. Using both research methods
allowed the researcher to gain all the advantages of using each
individual method.
Investigation of Job Satisfaction 12
The questionnaire (Appendix), derived from London's Theory,
was obtained from Noe, Noe and Bachhuber's (1990) study of career
motivation that includes career identity, career insight and
career resilience. The mail questionnaire was used to acquire
answers to research questions seven through nine. The
questionnaire used a five-point likert response scale from 1 = "to
a very small extent" and 5 = "to a very large extent." This study
retests the questionnaire developed for Noe, Noe and Bachhuber's
research of career motivation in the medical and computer
industries.
The questionnaire also included one open-ended question that
partially replicated Herzberg's study. Similar to Herzberg's
study, the respondents were asked to briefly describe the
incident/event in which they felt the greatest satisfaction at
their job. Not only was this question used in the mail
questionnaire but was asked during each phone interview. This
question added career information the scales did not measure.
The phone interview questions were created to find answers
for research questions one through six. The interview questions
investigated elements of Herzberg's Two-Factor Theory and Vroom's
Expectancy Theory. The phone interview questions were open-ended
and the researcher was allowed to probe for further information
when needed. An interview protocol provided structure to guide
the interviews yet allowed the researcher freedom to clarify and
elaborate.
Investigation of Job Satisfaction 13
The first step of the interview process was the mailing of
letters to program directors within the sample. The letter asked
for the station's cooperation with the study and offered the
results of the study upon request. Accompanying this letter was a
second letter from a well-known member of the Indiana Broadcasters
Association that stressed the importance of the study. An
appointment was then arranged to interview the station's morning
or mid-day radio personality.
Data Analysis
Indiana State University's Computer Center computated the
statistical information obtained from the questionnaire. The
center provided the mean and standard deviation for each question
and a factor analysis of all items within the questionnaire.
The phone interview responses were coded through a
thematization process. Groupings of similar responses were
determined through an extensive analysis of interview responses.
Interview responses were grouped and quantified whenever possible.
Results
This study tested three theor:.tical perspectives through
using radio personalities as subjects. The findings of this study
are grouped into two sections. First, the phone interview
questions (Appendix) tested Herzberg's Two-Factor Theory and
Vroom's Expectancy Theory. Second, the questionnaire tested Noe,
Noe and Bachhuber's study of career motivation.
The phone interview responses proved insightful in analyzing
the motivational factors of radio personalities. Research
Investigation of Job Satisfaction 14
Question one asked what factors internal to the organization serve
as motivators for radio personalities. During the interviews
respondents answered that they felt successful in their careers
because of the work itself. The aspects of the job enjoyed the
most were creativity, promotional activities, meeting listeners
and having a variety of job duties. Three personalities responded
creativity, three responded promotional activities, four responded
meeting listeners, and three personalities responded that job
variety was the aspect of the job enjoyed the most.
The radio personalities felt positively about the recognition
from co-workers and program directors and feedback from co-workers
was highly regarded. Thirty-five percent of the respondents
wanted more job responsibility tha_l they were given, fifteen
percent wanted less, and fifty percent were content with the
amount of job responsibility. Twenty-three percent of the
respondents sought advancuuent through station ownership, thirty-
five percent sought management positions,.fifteen percent wanted
positions outside radio, and twenty-seven percent had other
responses.
Research question two asked what factors external to
organization served as motivators for the radio personality.
Forty-percent of the respondents replied that they had never
received a tangible award for their job. Sixty percent had
received awards such as trade magazine awards, community service
awards and thank you cards. Feedback from listeners was a common
source of recognition recognized by the respondents. Talking with
Investigation of Job Satisfaction 15
listeners was a frequently mentioned enjoyable aspect of the work
itself. Fifty percent of the respondents felt their employment
pursuits could be achieved at their present station. The remaining
fifty percent felt they needed to leave the organization to
achieve their career goals. This percentage implies that half the
radio personalities felt they could not be fully motivated or
satisfied within their current organization.
Research question three asked which factors internal to the
organization served as dissatisfiers for air personalities.
Respondents felt the most discouraging aspects of their jobs were
working for a large corporation and communication breakdowns with
management.
In relation to their supervisors, radio personalities
reported little dissatisfaction. Ninety-five percent of the radio
personalities had daily contact with their supervisor while five
percent had monthly or biweekly contact. Eighty-one percent of
the respondents received oral feedback and nineteen percent
received both oral and written feedback from their supervisors.
Eighty-three percent of the respondents felt the amount and type
of feedback was appropriate, eight percent wanted more contact,
eight percent wanted better quality feedback znd three percent
wanted less contact with their supervisors.
Fifty-five percent of the radio personalities felt they were
adequately compensated for their work while forty-five percent
felt they were inadequately compensated. However, many who felt
adequately compensated noted that they were inadequately
Investigation of Job Satisfaction 16
compensated for the amount of work they do but felt adequately
compensated in comparison with others in the field, or within the
same market.
Eighty-seven percent of the radio personalities responded
that job security was important to them. Eighty-five percent
stated they had job security, but only thirteen percent had a
contract with their station. The radio personalities felt they
had security because of their talent, longevity of employment,
market size or verbal assurance from management.
Research question four asked which factors external to the
organization served as dissatisfiers to the radio personalities.
Air personalities responded that the major factors of
dissatisfaction external to the organization were job instability,
limited job openings and the fact that success in the business is
"all in who you know." Three respondents named job instability,
three mentioned limited job open1ngs and three personalities
mentioned "all in who you know" as dissatisfiers.
Research question five examined which outcomes radio
personalities desire in order to perform their job. The
interviews discovered that recognition and a specific market size
were desired by radio personalities. Forty-two percent of air
personalities mentioned a desire for recognition and thirty-two
percent had a desire to move to a specific market size. Radio
personalities spoke of desires to produce quality work and to have
that work recognized by supervisors and peers as distinctive.
There was no one market size desired by all radio personalities
Investigation of Job Satisfaction 17
but specific market sizes were often mentioned as desirable
outcomes by individual radio personalities. According to Vroom, a
person is motivated in future performance if these desired
outcomes are achieved.
Research question six asked what abilities radio
personalities feel will lead them to their desired job outcomes.
Five radio personalities mentioned confidence and seven mentioned
creative freedom as the abilities needed to further their talents.
The radio personalities felt confidence and creativity are
furthered through working every day at doing the best possible
job. Fifty-six percent of the respondents felt their talent fell
above the demands of their position and no one felt their talent
fell below the demands of the position. This percentage supports
Vroom's Expectancy Theory that states that a person must first
believe he/she has the ability to do a job, more effort will lead
to higher performance and this effort will lead him/her to desired
outcomes.
The last three research questions sought to test Noe, Noe,
and Bachhuber's study of career motivation. Each table reports
the questions, mean and standard deviations to assist in the
interpretation of the questionnaire results.
Research question seven asked to what extent radio
personalities have career identity. Questions 5, 10, 15, 22, and
24 of the questionnaire focused on career identity (see table
one).
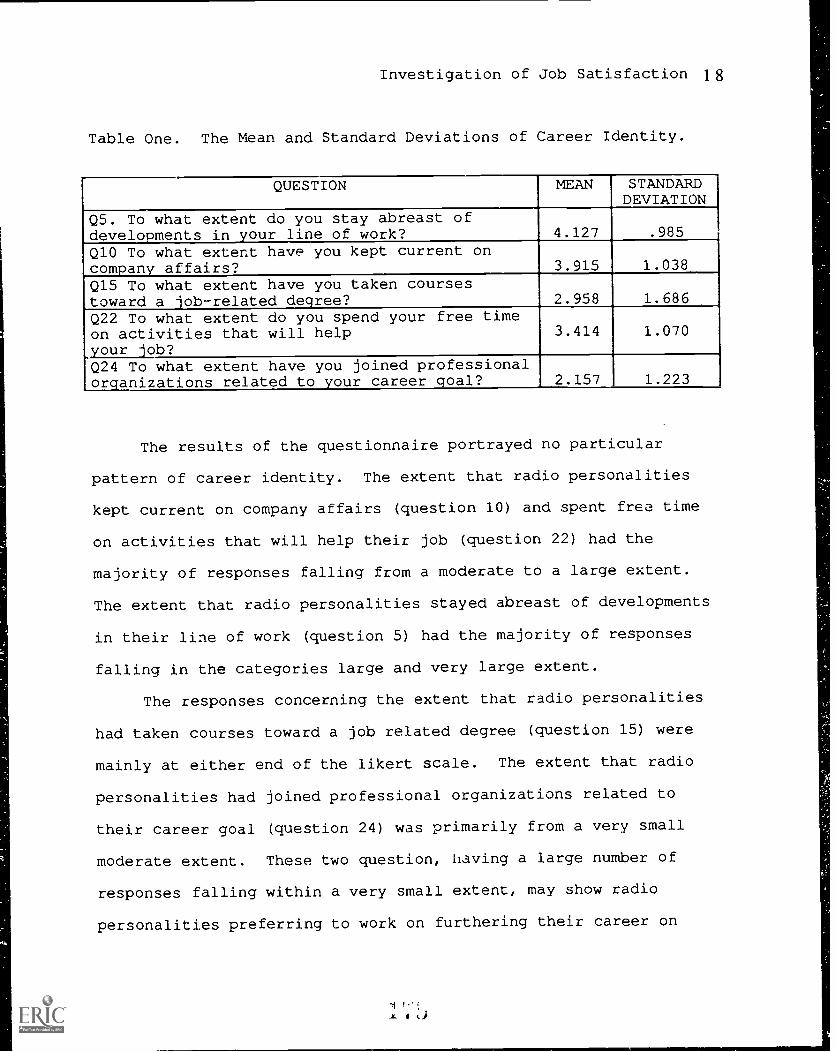
Investigation of Job Satisfaction 18
Table One. The Mean and Standard Deviations of Career Identity.
QUESTION MEAN STANDARDDEVIATION
QS. To what extent do you stay abreast ofdevelopments in your line of work? 4.127 .985
Q10 To what extent have you kept current oncompany affairs? 3.915 1.038
Q15 To what extent have you taken coursestoward a job-related degree? 2.958 1.686Q22 To what extent do you spend your free timeon activities that will help
job?3.414 1.070
1.223 1
.yourQ24 To what extent have you joined professional,organizations related to your career goal? 2.157
The results of the questionnaire portrayed no particular
pattern of career identity. The extent that radio personalities
kept current on company affairs (question 10) and spent free time
on activities that will help their job (question 22) had the
majority of responses falling from a moderate to a large extent.
The extent that radio personalities stayed abreast of developments
in their line of work (question 5) had the majority of responses
falling in the categories large and very large extent.
The responses concerning the extent that radio personalities
had taken courses toward a job related degree (question 15) were
mainly at either end of the likert scale. The extent that radio
personalities had joined professional organizations related to
their career goal (question 24) was primarily from a very small
moderate extent. These two question, having a large number of
responses falling within a very small extent, may show radio
personalities preferring to work on furthering their career on
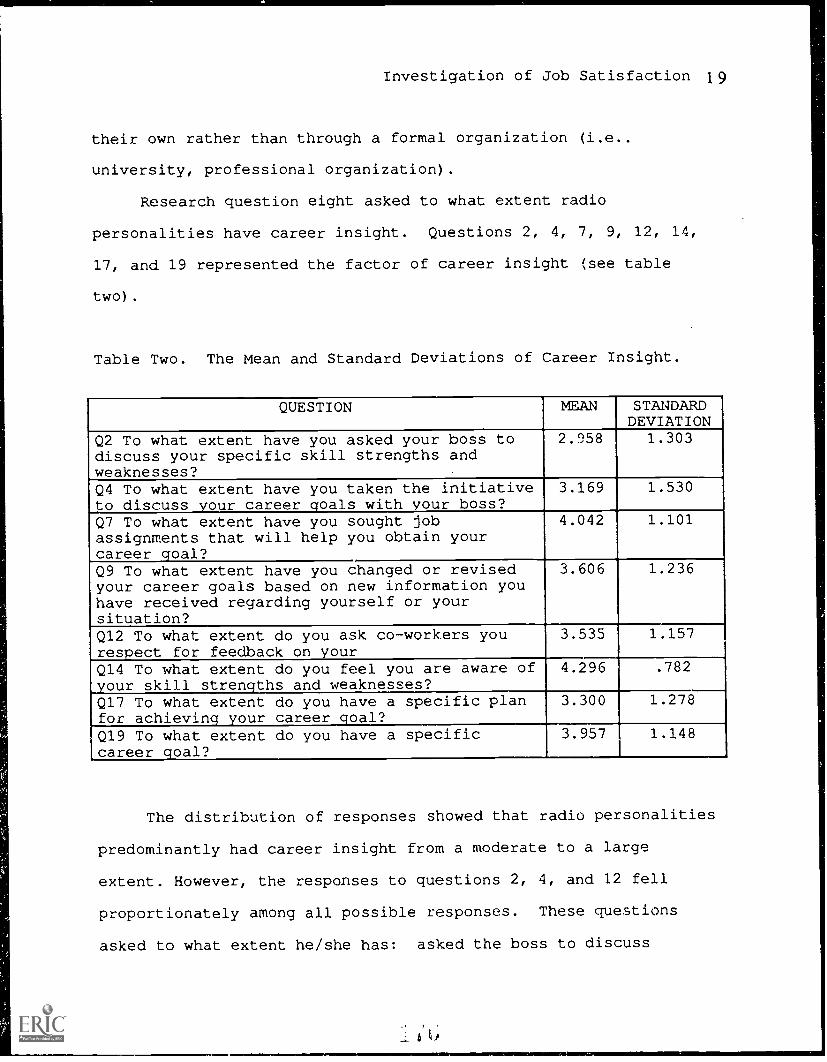
Investigation of Job Satisfaction 19
their own rather than through a formal organization (i.e..
university, professional organization).
Research question eight asked to what extent radio
personalities have career insight. Questions 2, 4, 7, 9, 12, 14,
17, and 19 represented the factor of career insight (see table
two).
Table Two. The Mean and Standard Deviations of Career Insight.
QUESTION MEAN STANDARDDEVIATION
Q2 To what extent have you asked your boss todiscuss your specific skill strengths andweaknesses?
2.958 1.303
Q4 To what extent have you taken the initiativeto discuss your career goals with your boss?
3.169 1.530
Q7 To what extent have you sought jobassignments that will help you obtain yourcareer goal?
4.042 1.101
Q9 To what extent have you changed or revisedyour career goals based on new information youhave received regarding yourself or yoursituation?
3.606 1.236
Q12 To what extent do you ask co-workers yourespect for feedback on your
3.535 1.157
Q14 To what extent do you feel you are aware ofyour skill strengths and weaknesses?
4.296 .782
Q17 To what extent do you have a specific planfor achieving your career goal?
3.300 1.278
Q19 To what extent do you have a specificcareer goal?
3.957 1.148
The distribution of responses showed that radio personalities
predominantly had career insight from a moderate to a large
extent. However, the responses to questions 2, 4, and 12 fell
proportionately among all possible responses. These questions
asked to what extent he/she has: asked the boss to discuss
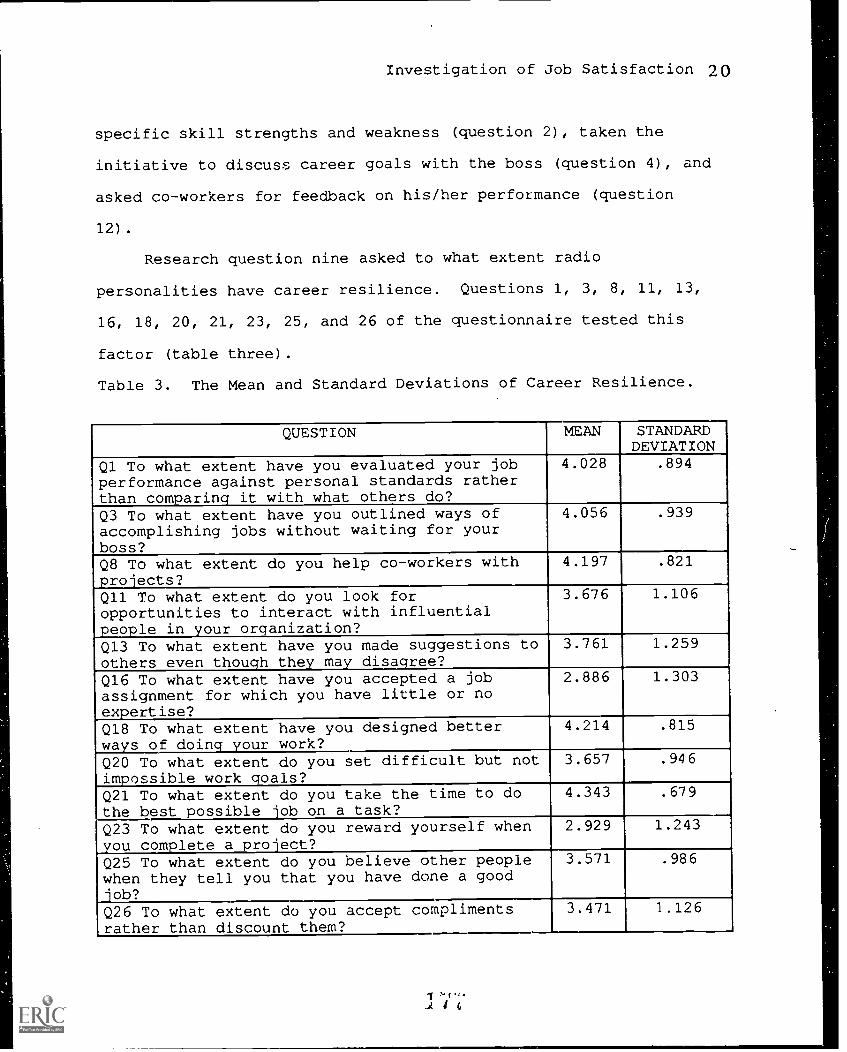
Investigation of Job Satisfaction 20
specific skill strengths and weakness (question 2), taken the
initiative to discuss career goals with the boss (question 4), and
asked co-workers for feedback on his/her performance (question
12).
Research question nine asked to what extent radio
personalities have career resilience. Questions 1, 3, 8, 11, 13,
16, 18, 20, 21, 23, 25, and 26 of the questionnaire tested this
factor (table three).
Table 3. The Mean and Standard Deviations of Career Resilience.
QUESTION MEAN STANDARDDEVIATION
Ql To what extent have you evaluated your jobperformance against personal standards ratherthan comparing it with what others do?
4.028 .894
Q3 To what extent have you outlined ways ofaccomplishing jobs without waiting for yourboss?
4.056 .939
Q8 To what extent do you help co-workers withprojects?
,
4.197 .821
Q11 To what extent do you look foropportunities to interact with influentialpeople in your organization?
3.676 1.106
i
Q13 To what extent have you made suggestions toothers even though they may disagree?
3.761 1.259
Q16 To what extent have you accepted a jobassignment for which you have little or noexpertise?
2.886 1.303
Q18 To what extent have you designed betterways of doin our work?
4.214 .815
Q20 To what extent do you set difficult but notimpossible work goals?
3.657 .946
Q21 To what extent do you take the time to dothe best ossible 'ob on a task?
4.343 .679
Q23 To what extent do you reward yourself whenyou complete a project?
2.929 1.243
Q25 To what extent do you believe other peoplewhen they tell you that you have done a good
3.571 .986
_job?Q26 To what extent do you accept complimentsrather than discount them?
3.471 1,126
_...._J
Investigation of Job Satisfaction 21
The frequencies showed that radio personalities largely had
career resilience from a moderate to a very large extent.
However, three questions had respondents answering anywhere
between a very small extent to a very large extent with
proportionately the same percentage of responses. These questions
asked to what extent he/she has: accepted a job assignment for
which he/she has little or no expertise (question 16), rewarded
him/herself when a project is completed (question 23), and he/she
accepts compliments rather than discount them (question 25).
Discussion
Research questions one through six provided the basis for the
phone interviews. Primarily, the interviews provided support for
Herzberg's Two-Factor Theory and Vroom's Expectancy Theory. The
interviews discovered that radio personalities strive for quality
work, recognition, a specific market size, and enjoyable job
duties. This corresponds to Herzberg's Two-Factor Theory that
states that work itself, recognition, and advancement are
motivators within the workplace.
The discouraging factors that radio personalities felt were
job instability, limited job openings, communication breakdowns
with management and that success in the industry is "all !_n who
you know." The response dealing with communication breakdowns
agrees with Herzberg's Two-Factor Theory that sees supervision as
a dissatisfier in the work piace. However, job pursuits are the
focus of the remaining responses and are considered a form of
Investigation of Job Satisfaction 22
advancement and the respondents saw these factors as a
dissatisfiers as well as satisfiers.
Radio personalities felt their talent fell equal to or above
the demands of their position, they had specific career goals and
hard work, confidence, freedom and creativity wcoild lead them to
their goals. This corresponds with Vroom's Expectancy Theory
which states that a person must first believe he/she has the
ability to do a job, more effort will lead to higher performance
and this effort will lead to the desired goals.
Research ciuestions seven through nine were the basis for the
questionnaire. The questions tested the extent radio
personalities had career resil'ence, career insight, and career
identity. Career insight responses produced no particular pattern
for radio personalities. Career .Lnsight responses primarily fell
from a moderate to large extent. Radio personalities had career
resilience largely from a moderate to very large extent. Radio
personalities as a whole appear to have career identity and career
resilience to some extent while the attribute of career insight is
an individual characteristic.
Some questionnaire results did not correspond with the phone
interview responses. The interview results showed that radio
personalities enjoy co-worker's feedback, and have positive,
friendly relationships with supervisors. However, the
questionnaire results did not show the majority of radio
personalities taking the initiative to discuss talents and
performances with supervisors or co-workors. The radio
Investigation of Job Satisfaction 23
personalities enjoyed hearing feedback from supervisors and co-
workers but would not ask for critical comments. The lack of
communication may be due to the fact that rising stars are
generally unwilling to share trade secrets with competitors
Conclusion
This study used phone interviews and a mail questionnaire to
investigate which factors motivate on-air radio personalities.
The subjects consisted of morning and afternoon radio
personalities in Indiana. The two methods discovered elements
that lead to or prevent job satisfaction.
The interviews found partial support for Herzberg's Two-
Factor Theory and full support for Vroom's Expectancy Theory.
However, the questionnaire's results did not reject or support
Noe, Noe and Bachhuber's study of career motivation.
Implications for Further Btudy
The results of this study are in no way to be considered a
comprehensive examination of work motivation. Large market radio
stations need to be researched. Large market radio personalities'
responses may alter and enrich a study concerning motivational and
career factors of radio personalities.
The sample consisted of morning and afternoon ra,..lo
personalities within Indiana. This sample touches mainly on the
small town radio station. The largest market within the study is
Indianapolis, the thirty-seventh market in the country, a medium
market size (Bacon's BadiplaY DixectDry: 1993, 1992). However, if
large market radio personalities, such as New Y7-k, Chicago and
Investigation of Job Satisfaction 24
Los Angeles, were sampled they could produce different results
than small towns. Therefore, the results do not represent all
radio personalities and should not be generalized beyond the small
and medium market radio station.
Although this study was unable to replicate the findings of
career motivation of Noe, Noe, and Bachhuber, the theoretical
perspective should not be ignored. This study of radio
personalities did not replicate their findings; however, studies
of other job classifications may support Noe, Noe and Bachhuber's
findings.
The results of a similar study could also be more precise
through separating variables such as market size, career longevity
or gender. For example, women radio personalities with families
may not desire moving to larger markets to advance their career.
A study that separates motivational factors such as age and gender
would assist in analyzing diversity among job attitudes.
Acknowledging diversity among individuals in the industry is the
first step toward understanding the motivational factors driving
the employee.
Investigation of Job Satisfaction 25
APPENDIX
Phone Interview Questions
What tangible awards have you received for your current job? Fromwho?
Are you successful in your career? Why?
What personal recognition have you received from others in yourcurrent job? From who?
What aspect of your job do you enjoy the most?
On a scale from 1 to 100, how much responsibility has been givento you in your job?On this scale what amount of responsibility do you want at yourjob?
To what position do you ultimately aspire?Can this be achieved at your present station? Market? Why or Whynot?
What has encouraged or discouraged you in your quest foradvancement?
Do you feel your talent has grown while working at this station?Why or why not?
Do you feel your talent/abilities is (inadequate to, equal to,above) the demands of your position?
What company policies or procedures have encouraged your growth?
What is the title of the position you repor,1 to?How often do you have contact? What type of feedback do youreceive: oral, written, other?Is this the amount and type of contact you would like with thisperson?
Describe in one word your relationship with your supervisor.
Do you feel adequately compensated for the work you do? Is thisthrough salary and/or fringe benefits?
In one word describe your relationship with your coworkers.
In what ways do your coworkers help your job?

Investigation of Job Satisfaction 26
What do you think the public's perception is of the status of your
job?
Is job security important to you?
Does your job have job security? What?
Briefly describe the incident/event which you felt the greatestsatisfaction at your job.
Investigation of Job Satisfaci=ion 27
BIBLIOGRAPHY
Bacon's Radio/TV Directory: 1993. (7th ed.). (1992).Chicago: Bacon's Information inc.
Butler, John K. & Womer, Norman Keith. (1985). Hierarchicalvs. non-nested tests for contrasting expectancy-valence models.Multivariate Behavioral. Research, 2a, 335-352.
Craig, J. Robert & Hindmarsh, Wayne A. (1984) . ManagementTheories and Broadcasting: A Handbook (ERIC Document ReproductionService N. ED 264 624).
Herzberg, Frederick. (1966) . Work and the Nacure of Maa.Cleveland: World Publishing.
Herzberg, Frederick. (1987) . One more time: How do youmotivate employees? Harvard auaineaa Review,65. 109-120.
Hill, Malcolm D. (1986-1987) . A theoretical analysis of jobsatisfaction/dissatisfaction. Educational Research Ouarterly, 10,36-43.
Hitt, Michael, Middlemist R. Dennis & Mathis, Robert L.(1989) . MalaagaManti Concepts and Effective Practices. St. Paul:West Publishing.
Lavine, John M. & Wackman, Daniel B. (1988). Managing MediaOrganizations. New York: Longman Inc.
London, M. (1983) . Toward a theory of career motivation.,Academy af Management gamiaN48, 620-630.
London, M. & Mone, E. M. (1987) . Assessing measures of workcommitment. Journal DI Occupational BahamiaK.a, 139-145.
Maidini, Ebrahim A. (1991) . Herzberg's two-factor theory ofjob satisfaction among public and private sectors. PublicPersonnel Management, 20, 441-448.
Pringle, Peter K., Starr, Michael F. & McCavitt, William E.(1995) . Electronic Media Management. Boston: Butterworth.
Noe, Raymond A., Noe, Ann Wiggins, & Bachhuber, Julie A.(1990) . An investigation of the correlates of career motivation.Journal af Vocational Behavior, 37, 340-356.
Notz, William W. (1975) . Work motivation and the negativeeffects of extrinsic rewards. AmariLan Psychologist, la, 884-890.
Investigation of Job Satisfaction 28
Pardee, Ronald L. (1990). Motivation Theories of Maslow,Herzberg, McGregor and McClelland. (ERIC Document ReproductionService No. ED 316 767).
Shermaa, Barry L. (1987) . Telecommunications Management. New
York: McGraw-Hill.
Sterling, Christopher H. & Kittross, John M. (1990) . StayTuned: A Concise History af American Broadcasting. California:Wadsworth.
Szura, John Paul & Vermillion, Mary E. (1975) . Effects ofdefensiveness and self-actualization on a Herzberg replication-.Journal af Vocational Behavior,7, 181-187.
Terpstra, David E. (1992) Theories of motivation-borrowingthe best. Personnel Management.24,49-51.
Vroom, Victor H., & Deci, Edward L. (eds.). (1970) Management
L. Motivation. Baltimore: Penguin Books.
Willis, Jim & Willis, Diane B. (1993) New Directions inMedia Management. Mass: Allyn & Bacon.
A Theoretical and MethodolNical Critique of the Principle of Relative Constancy
Michel DupagneSchool of Communication
University of MiamiP.O. Box 248127
Coral Gables, FL 33124-2030Phone: (305) 284-3500Fax: (305) 284-3648
E-mail: [email protected]
Paper presented to the
Media Management & Economics Division at the annual convention of
the Association for Education in Journalism and Mass Communication, Washington, DC.
August 1995
Abstract
After 20 years of empirical research, this paper revisits the theoretical assumptions of the
principle of relative constancy (PRC). This principle or hypothesis holds that consumers spend
a constant fraction of their income on mass media over time (constancy), although they may
modify their spending patterns within categories of mass media (functional equivalence). A
critique of the PRC literature reveals that whereas the assumption of functional equivalence can
be phrased in economic terms, there is no such validation for the assumption of constancy.
Methodological factors that may explain why PRC studies have offered conflicting evidence are
also discussed.
A Theoretical and Methodological Critique of the Principle of Relative Constancy
Since the now-seminal McCombs (1972)'s." Mass Media in the Marketplace," a growing
number of studies have tested the principle of relative constancy (PRC) in and outside the United
States. This principle or hypothesis holds that the proportion of income spent on the mass media
does not change significantly over time (constancy), although compensatory variations between
mass media categories may occur during the same period to leave room for the introduction of
new mass media goods/services (functional equivalence). It contributes to the study of mass
media and media economics by characterizing the long-run relationship between consumer mass
media expenditures and income as constant (or proportional). But despite mass communication
researchers' increasing interest in this topic, several important theoretical and methodological
questions remain before establishing the PRC as a theoretically-grounded, empirically-determined
hypothesis. Taken as a whole, this body of literature has reveaied mixed support for the
principle of relative constancy, and this begs the question why it is so. But more fundamentally,
existing studies have yet to validate the PRC in economic terms and draw connections between
this principle and standard economic theory. Unlike the ecology-based theory of the niche,
which has been successfully applied to the analysis of competition between mass media industries
(Dimmick, 1993; Dimmick & Rothenbuhler, 1984), the principle of relative constancy did not
benefit from a solid theoretical foundation when it was iitial1y proposed.
To remedy this gap in the literature, this paper examines whether the PRC can pass the
test of economic muster and why constancy studies have produced conflicting results. Such
validation, if supported, would strengthen the theoretical arguments of the PRC and would
recognize the PRC as a sound economic proposition. This study first reviews the existing PRC
literature, then offers a critique of that literature primarily based on microeconomic theory, , and
2
concludes with a discussion of new directions for mass media expenditurfs research. It focuses
exclusively on the evolution of consumer mass media expenditures, that is direct consumer
spending on mass media-related goods (e.g., newspaper, television set) and services (e.g. , cable
television).
The Principle of Relative Constancy
Although early studies have investigated the relationship between mass media
expenditures and the general economy (for reviews, see McCombs, 1972; Son, 1990), it was
not until the publication of a descriptive economic study by Scripps-Howard Research in 1959
that the concept of relative constancy became formally identified. Based on an analysis of mass
media expenditures from 1929 to 1957, Charles Scripps, chairperson of the Scripps-Howard
Newspapers board, concluded:
If we may suggest one broad generalization, it is that in spite of the increasingcomplexity of mass communications with the advent of new media, the pattern ofeconomic support has been relatively constant, and more closely related to the generaleconomy than to the various changes and trends taking place within the mass media fielditself.
The consistency evident in the pattern of economic support for the mass media seemssignificant. It suggests that mass communications have become a staple of consumptionin our society much like food, clothing, and shelter. Its stability in times of economicstress indicates that consumers feel that mass commimications is a necessary [sic] of life,although their selection of media may vary [emphases added]. (Economic Support, 1959,p. 6)
Whereas Scripps offered several stimulating ideas for interpreting the evolution of consumer
mass media expenditures in the United States (i.e., constancy, relationship to the general
economy, staple of consumption, and inter-media variations), he did not suggest any specific
hypothesis or statistical technique to test the viability of such assumptions.
McCombs (1972), and later Wood (1986), elaborated on Scripps' "explicit point of view"
3
(McCombs, 1972, P. 6), developed hypotheses, and used correlational and regression analysis
to test the relative constancy of mass media spending over time. As stated by Wood (1986), a
key issue of the relative constancy principle is the interpretation of Scripps' introductory
remarks.
Interpretations and Analyses
Constancy of Mass Media Expenditures: In his pioneering work, McCombs (1972)
restated Scripps' concept of constancy as follows:
His hypothesis asserts that the amount of economic support provided for masscommunication media consistently follows the ebb and flow of the general economy. Thi;
means that a relatively constant proportion of the available wealth--Gross NationalProduct, for example--will be devoted to mass media. When they have more money[i.e., income], consumers and advertisers will spend more on mass media. When theyhave less, they will spend less on mass media. The important point is that this ebb and
flow follows the general economy, not the competition and technological changes within
mass communication industries. (McCombs, 1972, p. 6)
In sum, a key assumption of the relative constancy is that total mass media expenditures will
grow or decline proportionate to the pace of the general economy. Regardless of income
changes, consumers will always devote about the same share of income to the mass media;
behaviorally, it is implicitly assumed that they will react fairly quickly to rising or declining
income by adjusting their mass media spending accordingly. To test this hypothesis, McCombs
and his co-authors correlated categories of media spending with time, controlling for inflation,
population growth, and personal income (McCombs, 1972; McCombs & Eyal, 1980; McCombs
& Son, 1986). The sign and magnitude of the corre!ation coefficients (from -1 to +1) indicates
the direction and strength of the relationship between mass media expenditures and time,
respectively. A perfectly monotonic (i.e., steady) increase and decrease across time would yield
a trend' of +1 and 4 , respectively (McCombs & Eyal, 1980). McCombs (1972) establishes
4
statistical significance for the relative constancy as follows:
If the probability (p value) of a given r's being a chance discrepancy from zero is equalto or less than five times in a hundred (p .05), the null hypothesis is rejected and theempirically reported value is accepted. But, if p > .05 then the empirical value isignored and the r considered to be zero. (p. 11)
In other words, if the coefficient is significantly different from zero at the .05 level, the trend
is considered non-zero. The reverse would support the principle of relative constancy,
evidencing "absence of movement over time" (McCombs, 1972, P. 18). Wood (1986) labeled
this interpretation of the relative constancy principle the "time-trend constancy hypothesis"
because time (i.e., physical time) is the primary predictor.
Functional Equivalence: McCombs also elaborated on the second key element of Scripps'
reasoning: functional equivalence (also called inter-media variations). He relied on past
research, especially Melvin De Fleur, to hypothesize that consumers will vary in their selection
of mass media. In Theories of Mass Communication. DeFleur and Ball-Rokeach (1989) use the
term "functional alternatives" to describe a complementary relationship between types of mass
media that catty the same function; on a broader level, this notion explains how consumers
change their patterns of mass media usage over time. "Ex i of these functional alternatives to
the newspaper has eaten into the circulation of the daily press. Each, in some sense, provides
news, information, or entertainment in a way that once was the exclusive province of the
newspaper" (DeFleur & Ball-Rokeach, 1989, p. 60). Formally stated, the concept of functional
equivalence holds that "an entertainment or activity will be displaced by the newer one provided
it serves the same needs as the established activity but does so more cheaply or conveniently"
[emphasis added] (Himmelweit, 1977, p. 12).
McCombs (1972) posits that the sociological notion of functional equivalence is consistent
5
with the premises of the relative constancy hypothesis. Limited by time and budget, consumers
must decide which of the competing media--which serve the same communication function (e.g.,
news, entertainment)--they should select. For McCombs (1972), functional equivalence is an
intrinsic part of the consumer decisionmaking process, whereby consumers make choices among
different but functionally equivalent types of mass media after considering their value
individually. Consequently, the principle of relative constancy assumes "a tremendous ebb and
flow of money among the various media" (McCombs, 1972, p. 6). For instance, an increase
in electronic media expenditures would yield a decrease in print media or moviegoing
expenditures, but the overall proportion of income devoted to mass media would remain
unchanged. To succeed in the marketplace, new communication technologies can only expand
to the detriment of old technologies (see McCombs, 1972).
Whereas the constancy assumption is generally tested using inferential statistics, the
functional equivalence assumption is checked using plots of mass media expenditure categories.
Wood's Critique: In a watershed article, Wood (1986) identified and discussed three
problems inherent in McCombs' analyses. First, because mass media expenditures are treated
as time-series data, those data are likely to be serially correlated (autocorrelated); therefore,
correlational analysis is an inappropriate statistical technique for testing the constancy assumption
of the PRC. If residuals at different points in time are correlated, successive observations will
then be related to each other (Ostrom, 1990). In the case of positively or negatively correlated
residuals,2 tests of significance and R2 values can lead to erroneous conclusions (Gujarati,
1988). Wood (1986) handled the problem of autocorrelation by first detecting it using the
Durbin-Watson test and then modifying the original ordinary least squares regression equation
6
to eliminate it.
Second, Wood questioned the validity of zero correlation for establishing constancy of
mass media expenditures over time. He argued that zero correlation coefficients could conceal
substantial variations in expenditures within the analyzed period.
Finally, he recommends using disposable personal income (DPI) rather than personal
income. DPI is a more suited variable for PRC studies (i.e., more precise measure of income),
because it consists only of private consumption and savings, thereby decreasing measurermnt
error and improving the testing of mass media expenditures-income relationships.
But perhaps more importantly, Wood (1986) presents a second model of relative
constancy. The "income-share constancy hypothesis" holds that "when income changes, the
share of income spent on media does not significantly change" (Wood, 1986, 41). Unlike
McCombs' partial correlation approach and the time-trend constancy interpretation, the income-
share interpretation does not include a time variable. To test both hypotheses, Wood ran
regression analyses using total mass media spending as the dependent variable.' According to
Wood and O'Hare (1991), the constant income-share proposition would be supported if the
intercept of the fitted function is not significantly different from zero (C = 00 + 01 Y + e).
If it is statistically significant, there is evidence that media spending as a fraction of income is
not constant and that consumers spend an increasing (or decreasing) portion of their DPI on mass
media.' For the time-trend constancy, if the coefficient of the time variable is not significantly
different from zero, holding DPI constant (C = )30 + 01 time + 02 Y + e), this would signify
the absence of significant increases or decreases in mass media expenditures and would support
the principle of relative constancy.
7
Research Findings in the United States
. After this theoretical and methodological description, what c In we conclude about the
principle of relative constancy from the existing empirical research? In support of a movement
of long-term constancy, some studies have reported that consumers' mass media expenditures
have remained relatively stable over several decades (McCombs, 1972; McCombs & Eyal, 1980;
Son, 1990; Wood & O'Hare, 1991). However, researchers also found that consumer spending
on mass media could deviate noticeably from constancy when they broke down the analysis by
decade (Wood & O'Hare, 1991) or more contextually when they considered the impact of
successful consumer electronics innovations on total media expenditures (Fullerton, 1988;
Glascock, 1993; McCombs & Son, 1986; Noh, 1994; Son, 1990; Wood & O'Hare, 1991). A
brief review of U.S. PRC studies follows.
McCombs (1972) analyzed consumer mass media expenditures from 1929 to 1968 and
found that the trend for total media spending (in constant dollars per household) was (r =---) .228,
p = .08, suggesting near constancy of media spending. Likewise, McCombs and Eyal (1980)
found a modest decline in media spending (in constant dollars per household) from 1968 to 1977
(trend = -.324). Several differences within mass media categories were apparent, though. The
trend for periodicals ( + .832) was opposite to that for books (-.876). The authors considered
these disparities as "short-term perturbations" (p. 158) and concluded that "even with a
proliferation of audio-visual communication services and devices during the past decade, the
historical patterns of spending on print and other mass media remain much the same" (McCombs
& Eyal, 1980, p. 158).
But more recent studies have revealed findings that contradict the relative constancy
8
principle. For example, McCombs and Son (1986) found that consumers increased their media
spending between 1975 and 1984 (trend = .652, p = .057). Whereas print media expenditures
decreased significantly from 1975 to 1984 (trend = -.752), electronic media expelditures
increased substantially during that 10-year period (trend = + .802). The authors suggest that
the diffusion of video cassette recorders is probably responsible for these deviations from the
relative constancy.' McCombs and Son (1986), however, found support for the functional
equivalence assumption of the relative constancy principle. From 1975 to 1984, increasing
expenditures on cable TV and electronic media were offset by a sharp decrease in expenditures
on print media.
Another study reported that innovators and early adopters diverted resources from other
media in 1949-1950 to accommodate the price of television receivers (Fullerton, 1988). In
regard to the relative constancy principle, the author states:
This sharp and brief interruption of the usual curve expected under the principle ofrelative constancy need not be taken as an indication that the principle is not generallysupported. The fact that the trend line quickly returned to a norwl pattern indicates thatthere is a band of equilibrium within which all media spending te..As to remain. Thesharp departure from the trend indicates, however, that innovators and early adoptersmay represent exceptions to the principle of relative constancy. (Fullerton, 1988, p. 82)
So despite these short-term departures, Fullerton (1988) concludes that the results confirm the
principle of relative constancy. Furthermore, the finding that some consumers diverted spending
from other media to television supports the functional equivalence assumption.
Using regression analysis with 1968-1981 data, Wood (1986) found that the time-trend
constancy and income-share constancy hypotheses differed in their results and that mass media
expenditures as a share of income fluctuated at different points in time contrary to the constancy
principle. The author argued that a long -term regression analysis could mask changes that took
9
place in specific decades. This statement implies that U.S. mass media expenditures may not
be a fully linear function of DPI, but may evolve by bursts perhaps provoked by the successful
adoption of new communication technologies.
Testing both the time-trend constancy and income-share constancy hypotheses from 1929
to 1988, Wood and O'Hare (1991) confirmed the long-term constancy of U.S. mass media
expenditures for both models. However, they also found that consumers devoted a larger share
of their income to mass media, wiTcially new media, from 1979 to 1988 without reducing their
spending on print and electronic media.
Using a similar approach, Son (1990) found mixed support for the two hypotheses (see
also Son & McCombs, 1993). Before running his regression analyses, he logarithmically
transformed and first-differenced the data to eliminate autocorrelation. He found that total mass
media expenditures from 1929 to 1987 did not increase as a share of income, vindicating the
income-share constancy interpretation. On the other hand, the time-trend hypothesis was not
supported because consamer spending on mass media increased over time when DPI was held
constant. This study suggests that the introduction of cable TV and the VCR has caused mass
media expenditures to rise between 1975 and 1987 (see also Glascock, 1993). Indeed, analyzing
the same Department of Commerce data from 1929 to 1974, Son (1990) found support for both
relative constancy models.
Research Findings Outside the United States
Only two PRC studies have been conducted outside the United States. Werner (1986)
foui.1 that Norwegians' mass media expenditures were relatively constant from 1958 to 1982 and
grew more slowly than expenditures on other leisure and educational activities. She concludes
1 9 C
10
that these findings support the principle of relative constancy. However, the author's assessment
stems from a description of six household expenditure surveys in current prices, and not from
a genuine analysis of aggregate media expenditures in constant prices. No formal testing of the
relative constancy principle using either correlational or regression analysis was performed.
Dupagne (1994) tested both the income-share constancy (C = )30 + 131 Y + e) and time- .
trend constancy (C = 130 + (3, time + 02 Y + e) hypotheses in the United Kingdom. applying
regression techniques (generalized least squares estimation) to consumer mass media
expenditures from 1963 to 1989. The analysis confirms a long-term constancy in mass media
spending, regardless of variations in disposable personal income and the passage of time. But
the results also showed that, in the 1980s, U.K. consumers devoted a greater share of their
income to the mass media, largely due to the introduction of video hardware and software.
Thus, both U.S. and U.K. consumers spent an increasing share of their income on new media
in the last decade.
Critique of the Relative Constancy Literature
It is clear that the PRC studies reviewed here, especially McCombs (1972) and Wood
(1986), have generated fresh ideas and proposed new methodologies, all contributing to refine
the analysis of mass media expenditures. But despite this pioneering empirical work, several
important theoretical and methodological concerns remain. For instance, recent research has
done little to investigate new theoretical viewpoints about the relative constancy or link it to a
particular economic or consumption theory; instead it has mostly relied on statements made by
Scripps in 1959. However, Scripps did not really develop a conceptual framework to support
his position. We are then left with a .proposition with little theoretical foundation. Another
11
concern emerging from the literature review relates to the great variability of the findings.
Whereas the assumption of functional equivalence has gained ample descriptive support in PRC
studies, the statistical evidence in support of the assumptioh of constancy has been mixed. Why
is it so? This section will address these and other theoretical and methodological issues.
Theoretical Issues
Recently, Demers (1994) has questioned the relative constancy's assumptions of fixed
mass media expenditures and time over the years. He contends that "there is no theoretical
reason to justify the argument that spending on mass media should remain relatively constant
through time, even if empirically it appears to have been that way" (p. 32). The author
maintains that the proportion of income spent on mass media would have increased over time,
had the mass media, like other goods, been widely available to the public prior to the 20th
century. He states:
Although it may be true that the proportion spent has remained relatively constant duringthe 20th century, a longer historical view naturally would force one to conclude that ithas increased. The reason is simple: For all practical purposes, only during the 19th and20th centuries have consumers and advertisers spent money on mass communicationsbecause mass media were not available before then. Mass media are the product of anurban, industrialized society. Thus, a long-term view suggests that relative spending onmedia and advertisiag has increased, albeit the trend need not take a monotonic form.(pp. 35-36)
In his second criticism, Demers (1994) recognizes that "time is a limited resource" (p.
36), but argues that "there is little evidence to suggest that time spent with media has reached
a threshold or has remained fixed or stagnant" (p 36). Citing several studies, he suggests quite
appropriately that consumers have expanded the amount of time spent on the media in the last
decades. But then he contends that if we accept the assumption that increasing time spent on
the media translates into increasing mass media expenditures, consumers, contrary to the
12
principle of relative constancy, should devote a greater proportion of their income to the mass
media.
Demers' first criticism is, of course, untestable because mass media is a fairly recent
consumption category, compared to food or housing. We will examine the notion of constancy
as a valid economic proposition later in the paper. The second criticism warrants some
discussion, because it raises the important question of time ceiling.
Time Ceiling: To justify the relative constancy of mass media expenditures, McCombs
(1972) contends that time and income are scarce resources that constrain the growth of consumer
mass media expenditures. His first point involves the scarcity of time--time spent on the mass
media cannot be extended ad infinitum:
For a time the consumer can increase the amount or the number of goods enjoyed pertime unit. He sips his martini, scans his newspaper and listens to the stereosimultaneously. But there must be some limit. Indeed, signs of the limit already areappearing. We are already in the age of half-read and unread newspapers. (McCombs,1972, P. 62)
In other words, consumers will reach a time ceiling or threshold at which point they will no
longer be abl.: to accommodate additional mass media activities, given their time allocation to
leisure. McCombs' argument implies that although the amount of time spent on the mass media
can be extended in the short term, it cannot be stretched beyond a certain level in the long term
because it is limited by the time devoted to other daily activities, such as working, sleeping, and
eatirg. Even if average consumers work less in the decades to come, or even sleep less, time
devoted to non-media-related activities cannot be indefinitely compressed within the notion of
20th-century Western lifestyle. Unless radical changes occur, Western consumers will continue
to spend a major part of their day working, eating, sleeping, doing household chores, and the
1:j 't)
13
like.
Empirical research shows that leisure time or time spent on the media in the United States
has risen since the 1960s (see Hamilton, 1991; Hornik & Schlinger, 1981; Ogan & Kelly, 1986;
Robinson, 1981, 1989; Vogel, 1990), although this trend may have attenuated in the late 1980s
(Robinson, 1989; Son,' 1990). But should we automatically posit that this increase in time will
cause mass media spending to increase as Demers (1994) seems to suggest? The evidence on
the relationship between increasing mass media use and increasing mass media spending has
been mixed. Whereas Wood and O'Hare (1991) found that U.S. consumers increased their
share of income spent on the mass media; especially on new media (e.g., cable and VCR) in the
1980s, Ogan and Kelly (1986) found that respondents did not report spending much money on
these new communication technologies. More importantly, Ogan and Kelly's findings showed
no evidence of a relationship between the amount of time respondents reported to allocate for
mass media use and the amount of expenditures they reported to spend on these media. Whether
these different conclusions are due to methodological variations or other factors remains to be
determined. Wood and O'Hare (1991) used secondary aggregate data from the Department of
Commerce; Ogan and Kelly (1986) relied on primary survey data collected in Indianapolis.
Although McCombs (1972) clearly perceives time as the ultimate constraint on mass
media expenditures, a second related reason for advocating the principle of relative constancy
is limited income. He states:
If indeed the goals or needs of each consumer are fixed, a voluntary consumptionmaximum eventually has to be reached. As income grows, more and more wants willbe gratified. Ultimately, the utility of additions to income and, especially consumption,will be zero. It can be argued, of course, that the tremendous growth of masscommunication--growth perhaps constrained only by the consumer's ability to finance it--refutes this notion of fixed wants. (McCombs, 1972, p. 62)
14
While McCombs alludes to some economic principles (e.g., time scarcity, income
scarcity) to rationalize the principle of relative constancy, rather than just taking it for granted
based on the pattern of empirical findings, he and other researchers fail to expose explicitly the
connection between economics and the principle of relative constancy. Wood (1986) mentions
in passing the relevance of the Engel law for the income-share constancy hypothesis, but he
provides little explication why it should be so. This is the most fundamental weakness of the
existing literature: a lack of any microeconomic justification for the principle of relative
constancy as a theoretically-driven economic proposition. So far arguments for or against the
constancy have originated from the mass communication literature. Given that the principle of
relative constancy describes an economic relationship between consumer mass media
expenditures and income, it would seem logical to put the principle of relative constancy and its
assumptions to the test of economic soundness. In other words, does economic theory confirm
the validity of the relative constancy principle?
Economic Theory - Scarcity: This economic principle holds that "goods are scarce
because there are not enough resources to produce all the goods that people want to consume"
(Samuelson & Nordhaus, 1989, p. 26). Stated differently, while consumers' wants are virtually
unlimited, goods remain scarce or finite in supply even for highly productive societies. Firms
can only produce so much. Unlimited wants are also constrained by limited income and time
(Eastwood, 1985).
McCombs (1972) is quite correct in using the scarcity rationale for justifying that
consumer spending on mass media will not be boundless. But scarcityconstraints on time,
income, and supply of goods--does not imply that consumers will be forced to spend a constant
15
fraction of their income on a particular good (e.g., beef, light bulb, newspaper) or consumption
category (e.g., food, housing, mass media). Such assumption does not necessarily hold up over
time, at least in the United States. Magrabi, Chung, Cha, and Yang (1991) report that consumer
spending on food has decreased dramatically since the beginning of the 20th century; that budget
share spent on housing has barely changed from 1901 to 1987; and that households have spent
less of their budgets on apparel but more on transportation over time. Rather the consequence
of scarcity is that consumers aie compelled to make choices in their daily life based primarily
on income, time, and preferences.
How consumers behave and purchase goods given these constraints falls under the
purview of demand (or consumer behavior) theory within microeconomics. Demand theory
assumes that consumers are rational--that is, they seek to maximize utility (i.e., total satisfaction
derived from the consumption of goods/services) subject to various constraints (e.g., income,
price of goods, time) (see Eastwood, 1985). The next logical step in this economic exposition
is to determine whether demand theory can apply to the constancy and functional equivalence
assumptions.
Economic Theory Engel Law: The relative constancy hypothesis assumes that the
proportion of income devoted to the mass media will remain unchanged over time. Regardless
of variations in income levels, this percentage will always be the same value, say 3% (this is
the thrust of the income-share constancy hypothesis). If this percentage is fluctuating--say 5%
the first year, 2% the second year, and 8% the third year--the pattern observed would be
evidence against the principle of relative constancy. Another way to state the same idea is to
say that mass media spending and income covary--that is mass media expenditures do not change
16
significantly relative to income. When income increases by 1%, we would expect mass media
expenditures to increase by 1% as well. As McCombs (1972) pointed out, for the constancy
hypothesis to be supported, mass media expenaitures and income would be expected to move
together--proportionately to each other. As income rises, consumer spending on mass media
should also increase (and vice versa). But is McCombs' reasoning congruent with the Engel law
(or curve), the traditional microeconomic model of consumer choice that addresses consumer
responses to changes in income?
Simply stated, the Engel law raises the following question: Assuming that the price of
a good X is fixed, how many Xs would be consumed for a variety of incomes? The Engel law
is tied to two important concepts, the budget line and the indifference curve, each deservim:
some development. In standard economic terms, consumer behavior is driven by the interaction
of preferences (indifference curve) and opportunities (budget line). Based on these conditions,
consumers can make choices. The budget line shows which baskets of goods consumers can
afford to buy, given prices and income, whereas the indifference curve depicts consumers'
preferences or tastes regardless of whether they can actually purchase those preferred goods (see
Landsburg, 1992). As a general rule, a change in income (increase or decrease) will produce
a parallel shift in the budget line. To determine consumer choices, we must draw the
indifference curve and the budge4: line on the same graph. Assuming that consumers are rational
(i.e., they behave in such a way to improve their welfare), they will then select the basket at the
point where their budget line is tangent to an indifference curve. This point, the consumer's
optimum, is the most desirable basket of all baskets on the budget line (see Figure 1 for an
illustration).7
17
Generally, Engel curves exhibit an upward slope (Landsburg, 1992). As consumers'
income increases, they tend to buy more of all goods. For normal goods, it is indeed the case.
A "normal" good (also called a superior good) is "a good that the consumer chooses to consume
more of when his income goes up" (Landsburg, 1992, P. 95). For instance, with rising income,
it is likely that consumers would purchase more consumer electronics products. On the othe:
hand, a good is said to be "inferior" when the consumer chooses less of the good even though
his or her income goes up. In this case, the Engel curve will slope downward. For instance,
a consumer is likely to consume less margarine or potatoes as his or her income rises.
The Engel curve provides a useful framework for analyzing the evolution of mass media
expenditures in economic terms and describing how consumers would adjust their level of mass
media expenditures in reaction to income changes. Furthermore, it can be directly linked to the
income elasticity of demand which estimates the percentage change in quantity in response to
a percen ige change in income, thereby enabling researchers to classify mass media goods into
inferior goods (income elasticity ax < 0), necessity goods (0 < ax 1), and luxury goods ((ax
> 1).8 The Engel law does not stipulate, however, that the relationship between expenditures
on a good and income ought to be proportional or constant.
Economic Theory Constancy: Earlier in this section, Demers (1994) was quoted to state
that "there is no theoretical reason to justify the argument that spending on mass media should
remain relatively constant through time, even if empirically it appears to have been that way"
(p. 32). In view of the foregoing economic discussion, we must conclude that he is right. The
constancy assumption of mass media expenditures has no economic foundation. The Engel
law/curve would suggest that increasing or decreasing changes in income translate into
18
corresponding changes in mass media spending, but it does not imply that the share of income
on mass media should be a constant. In hindsight, few economists would hypothesize a constant
relationship between income and expenditures on a good over time, whether this good is inferior,
a necessity, or a luxury, because they would have to assume that no variation exists around the
mean value--an unlikely prospect. For the constancy assumption of the relative constancy, we
are then left with previous empirical results for guidance. But that does not mean that the entire
PRC is atheoreticalin fact, as discussed below, the assumption of functional equivalence is
supported by economic theory.
Economic Theory - Functional Equivalence: The concept of functional equivalence can
be explained in economic terms by relying on the previous discussion. Because wants are
limited by such scarce resources as time and income, consumers must choose among
alternatives. They must reconcile their ability to buy (budget constraint) and their willingness
to trade (indifference). Let us suppose that consumers enjoy a fixed budget for the mass media
and, for the sake of argument, that there are only two media goods, newspaper and radio set.
The ability to purchase media goods will be determined by the budget share devoted to the mass
media and the prices of newspapers and radio sets. Assuming that consumers spend all their
fixed budget on the mass media, the only way to buy more of radio sets would be to buy less
of newspapers (see Eastwood, 1985). Within the budget constraint, market prices (relative
prices--e.g., how many newspapers consumers can purchase for a radio set) determine at .what
point consumers will substitute units of newspapers for units of radio sets or vice versa (marginal
rate of substitution). A key assumption of consumers' willingness to trade (preferences) is that
the locus of all bundles (all combinations of two goods) on a particular indifference curve
19
implies that consumers derive the same overall level of utility. So it is quite possible for
consumers to substitute more radio sets for newspapers and still obtain the same degree of
utility.
The concept of functional equivalence demonstrates why consumers alter their mix of
mass media vods assuming a fixed mass media budget. Functional equivalence can serve as
a useful theoretical point of departure to predict and analyze the pecuniary impact of new
communication technologies on traditional technologies (see Noh [1994] for a discussion of
functionality of VCR technology).
Methodological Issues
We could wonder why some studies reviewed in the first section offer conflicting results.
Second only to lack of theoretical justification, the issue of multiple constancy conceptualizations
muddles the results even further and casts more doubts on the validity of that assu.mption. As
indicated in the literature review, the principle of relative constancy can be conceptualized and
estimated in various ways and at different levels of sophistication. Although it can be beneficial
to use a multi-model approach to test the relative constancy from various perspectives, a lack
of a primary model can be confusing, especially if income-share/time-trend interpretations
produce different results (Wood, 1986). If those two models are on equal footing and differ in
their findings, then how do we conclude there is support or non-support for the principle of
relative constancy? Which interpretation is better? So far we lack a unified operationalization
of the constancy assumption. Future empirical research shouki establish at the onset which
model is the primary test of the constancy hypothesis and provide a rationale for this decision.
Four other factors may explain these discrepancies (see Son, 1990): DPI versus PI;
20
correlation versus regression; short-term constancy versus long-term constancy; and the handling
of serial correlation. The rationale for using disposable personal income and regression analysis,
instead of personal income and correlational analysis, has already been exposed above. But the
fourth and fifth reasons deserve some explanation. Son (1990) has argued that running analyses
with such a small sample size as 10 observations may lead to different findings than running the
same analyses with 50 observations. Indeed, studies using more than 25 observations uphold
the principle of long-term constancy (Dupagne, 1994; McCombs, 1972; Son, 1990; Wood &
O'Hare, 1991). However, for analyses with 10 observations, decreases or increases in media
spending--which result in deviations from the relative constancy--often happen (Dupagne, 1994;
McCombs & Son, 1986; Son, 1990; Wood & O'Hare, 1991). Statistically, analyses with only
10 cases invite criticism because the sampling error is very large. McCombs and Nolan (1992)
have critiqued Wood's approach to break down the constancy analysis per decade: "One can
dismiss these departures from constancy as random variations in small data sets (n = 10) given
the arbitrary division of the data into sets without any underlying historical unity in terms of
mass communication" (p. 47). Ironically, McCombs has analyzed 10-year mass media
expenditures series on two occasions (McCombs & Eyal, 1980; McCombs & Son, 1986) without
necessarily providing an adequate justification for selecting starting and ending data points the
way he did (McCombs & Eyal, 1980). Whereas in theory, collection of expenditure data must
depend upon historical and economic considerations, in practice it is often the availability of data
that guides the data-gathering process for these secondary analyses.
Yet, McCombs and Nolan (1992) have a point here: It is important to ground mass media
expenditures analyses in a relevant historical context. If communication researchers present a
?i"
21
compelling reasoning for selecting their sample of years the way they do, they make it more
defensible to use a small number of observations because the period under scrutiny may exhibit
certain unusual media-related or general spending characteristics that are worth statistical
exploration. For example, several constancy analyses have isolated the period from the late
seventies to the eighties, when the diffusion of video hardware and software in the marketplace
began, to investigate the evolution of mass media spending during that period (Dupagne, 1994;
McCombs & Son, 1986; Son, 1990; Wood & O'Hare, 1991).
A fifth reason for these mixed results might be the way the presence of autocorrelation
has been handled. Although Son (1990) and Wood and O'Hare (1991) use the same data sets
and regression models, they dealt with autocorrelation differently and arrived not unexpectedly
at different results. The specification of a correct model that meets the assumptions of bivariate
or multiple regression is essential in econometric analysis. The existing constancy literature has
focused primarily on eliminating serial correlation, but has done little to refine models or
identify the source of serial correlation'. Serial correlation more than anything else means that
the model is misspecified and/or that relevant variables might have been left out. If omitted,
important variables will be relegated to the error term. To the extent that these excluded
variables (e.g., price of radio sets), now part of the error term, might influence variables
included in the model (e.g., price of newspapers), a systematic pattern of the residuals might
appear, which would indicate a (false) problem of serial correlation (Gujarati, 1988).
Unfortunately, mass communication researchers have yet to expand constancy or mass media
expenditure models beyond the basic mass media expenditures-income relationship.
22
. Discussion
It is vital to realize from the onset that the relative constancy hypothesis is not an
economic theory per se; it is a proposition (or a set of generalizations) that originates from the
mass media literature, and has been conceptualized and tested as such within the communication
discipline. As demonstrated in the previous section, the principle of relative constancy is a
fairly atheoretical approach to the characterization of mass media expenditures over time; it is
primarily supported by empirical research. Are we then reaching a cul-de-sac or is it possible
to ameliorate our understanding of this important topic--mass media expenditures-income
relationships--in media economics by investigating mass media spending from an angle other
than through the PRC? This section discusses some theoretical and methodological suggestions
for future research on consumer mass media expenditures.
Theoretical Recommendations
Constancy: Because the constancy assumption of the PRC is not grounded in any
economic theory, one may argue that it should not even be tested. This lack cif theoretical
foundation should at least signal to communication researchers to consider abandoning (or
downplaying) the study of this assumption in favor of more promising theoretically-based mass
media expenditures-income models. This is not to say that the testing of the constancy
proposition is useless or irrelevant; as exploratory research, it has its role to illuminate potential
relationships between mass media spending and income. But the constancy research has limited
far-reaching implications due to its lack of proper theoretical grounding and offers few
opportunities to advance the subject of media economics theoretically and open new avenues for
mass media expenditure research. Since the 1970s, virtually all analyses of consumer mass
2., e E,
23
media expenditures have been conducted within the realm of the PRC. This paper has
reappraised the significance of the PRC in media economics, and suggests if not to sever ties
between the PRC and consumer mass media expenditures at least to pay greater attention to
alternative models of consumer mass media expenditures.
Future studies should explore other linkages between mass media expenditures and
consumption theories. This is where major theoretical contributions to the mass media
expenditures research can be achieved.. To a certain degree, the principle of relative constancy
falls under the broad umbrella of mechanistic Keynesian income-consumption tradition because
it assumes that consumers respond immediately to changes in income levels. If we apply the
Keynesian macroeconomic theory to the microeconomic context of the constancy hypothesis, the
absolute income hypothesis in the long term would suggest a near proportional relationship
between DPI and mass media expenditures (see Froyen, 1990). Likewise, Friedman's permanent
income hypothesis also assumes that consumers behave in a backward-looking fashion as they
revise their estimate of permanent income "based on how last period's actual income differed
from last period's estimate of permanent income" (Froyen, 1990, p. 398). The permanent
income hypothesis posits that
the reaction of current cot sumption to an increase or decrease in current income dependson the individual's expectations about whether the increase or decrease in income islikely to continue in future periods or is simply a windfall gain or loss. Permanentchanges in income levels are assumed to directly affect expected consumption, whereastransitory changes are assumed to have no effect on expected consumption. (Doran,1989, p. 262)
In contrast, when we consider the rational expectations perspective in conjunction with the
permanent income hypothesis, we assume that consumers estimate permanent income by using
"all information available prior to the current period" (Froyen, 1990, p. 398), thereby forming
Ari) i
24
forward-looking (rational) expectations. The rational expectations perspective suggests that
household consumption follows a stochastic (i.e., random) path (Hall, 1978). Because of the
random walk nature of consumption, no current variable but the current consumption level
should have predictive power for future consumption. Future work testing the permanent
income hypothesis and/or rational expectations perspective with aggregate measures of mass
media expenditures and wealth would offer valuable theoretical and empirical insights to predict
consumer behavior relative to mass media spending over time.
Functional Equivalence: The principle of relative constancy cannot be completely rejected
on theoretical grounds because the functional equivalence assumption can be validated in
economic terms. Functional equivalence is an importam 'MI& concept (product substitution)
that has practical implications for today's electronic media environment. Consumer electronics
firms and media companies in the United States and other Western countries are poised to
market such innovations as high-definition television and interactive television (as soon as
technical issues are resolved). Assuming little expansion of household budgets and time for
mass media in the near future,9 functional equivalence would suggest that "cannibalizing" among
electronic media activities and products might reach its full potential in the 1990s, because of
the introduction of new and competing services. For instance, a recent survey conducted by
Broadcasting & Cable indicated that of all cable subscriber respondents interested in interactive
TV (53.8%), nearly half (47.2%) reported that they would drop some existing cable services to
offset the cost of interactive services (Jesse 11, 1994). But such a sweeping conclusion could turn
out to be overly simplistic given what we know about the evolution of recent communication
technologies. Although cable TV and the VCR were found to be substitutes (Levy & Pitsch.
25
1985), the VCR did not displace cable TV but rather slowed down its diffusion between 1980
and 1990 (Noh, 1994). In the same vein, preliminary studies have suggested that direct
broadcast satellite (DBS) service and cable service are competing products, with cable
subscribers switching to DBS for improved signal quality and expanded programming options
(e.g., Brophy, 1995). Yet, only a minority of DBS subscribers cancel their cable service after
signing up with DBS providers--supposedly to maintain access to local broadcast television
signals (Stern, 1995). Future research should build on Noh (1994)'s analysis of functionality
of VCR technology and dissects the reasons for this apparent lack of functional equivalence
among certain forms of media. We would surmise a priori that this situation exists because
those options are not functionally identical (e.g., DBS providers do not transmit local television
programs). Again, demand theory and literature could prove useful by shedding some light on
whether mass media products and services are complements, substitutes, or unrelated.
Methodological Recommendations
The Scope of Mass Media: So far PRC researchers have conducted their studies and
collected data within the realm of conventional mass tedia in which messages are delivered to
large contingents of people simultaneously. Mass media industries generally include
newspapers, magazines, books, movies, recording, radio, and television. With the increasing
importance of on-line services, this textbook definition of mass media is unlikely to be adequate
in the 1990s and the next century, however. The growth of such personalized mass media as
the VCR and the personal computer and the "demassification" of such conventional media as
television, radio, and magazines may render the traditional mass media definition obsolete and
may redefine the notion of mass media as less "mass" but more "specialized" outlets. Future
26
researchers of consumer mass media expenditures should contemplate being more inclusive in
their definition of mass media by adding pertinent telecommunication-related categories to their
existing category system. For instance, such hardware as home computers and such software
as on-line services could qualify as mass media items, because they constitute the main consumer
components of the current information superhighway. Perhaps the focus of future mass media
expenditures work should be on information technology/services rather than just mass media.
In practice, however, taking into account spending on these and other relevant items is
an arduous task because such spending is unlikely to be listed as a separate category in the
national accounts of the statistical offices; rather it is likely to be subsumed in the general
category of appliances, telecommunication services, or "other," most of which may have no
bearing on the mass media. Obviously this problem is not new and constitutes a major drawback
of secondary analyses because it prevents researchers from reanalyzing and singling out the data
into more discrete sets. The reality of mass media expenditures research is that the availability
of data from national statistical offices often steers the scope of mass media expenditures (and
hence the definition of mass media), even though researchers would aspire to use more refined
data sets. In addition, national accounts departments are more inclined to view private
consumption patterns from a macroeconomic than a microeconomic perspective and therefore
are less prone to publish an itemized tabulatio.i of consumer expenditures. Researchers are then
left with the painstaking task of seeking expenditures data on individual products and services
from industry associations or consultancy groups, an option that does not stimulate consistency
across data.
Additional Regressors: If we accept the reasoning for shifting emphasis away from the
27
PRC to other models of mass media expenditures, it is imperative to extend mass media
expenditures models beyond a simple mass media expenditures-income relationship, so that we
can assess the impact of economic and non-economic predictors on the evolution of mass media
expenditures, as well as forecast short-term mass media spending based on the values of those
predictors. Whereas the existing PRC research has ignored the potential influences of variables
other than income on mass media expenditures, future studies should repair this omission by
incorporating such literature-guided independent variables as price, interest rate, and
unemployment rate in models of mass media expenditures. If variables that could intervene in
the process of consumer spending on mass media ard omitted, the mass media expenditure model
is likely to be misspecified and produce erroneous estimates.
Static Versus Dynamic Regression: Finally, future studies should develop dynamic
regression models to assess whether changes in mass media expenditures react immediately to
changes in income (or in other variable.$) or whether the effect of income is spread over several
time periods. A regression model is said to be dynamic if it contains a lagged dependent
variable; but dynamic behavior patterns are also represented when the model comprises lagged
independent variables (Doran, 1989). On the other hand, static models, which best characterize
the existing constancy literature, are those assuming "an instantaneous adjustment to the new
equilibrium values when prices and income change" (Ph lips, 1983, p. 155). Empirically, it
means that static models do not contain lagged variables (i.e., variables at time-1, time-2...).
But in reality, consumption, especially expenditures on such durables as consumer electronics
products, often responds to income changes incrementally over several time periods--months or
years. Ph lips (1983) has argued that a static approach to consumption theory does not really
2 i
28
offer a realistic picture of how consumers react to increases in income. In sum, dynamic models
should be favored over static models because they open the door to new conceptual avenues of
mass media expenditures research (e.g., the testing of the permanent income hypothesis and
rational expectations perspective requires the inclusion of lagged variables), as well as new
statistical approaches to mass media expenditures modeling (e.g., the use of autoregressive and
distributed-lag models).'°
Despite its existing theoretical and methodological shortcomings, consumer mass media
expenditures research constitutes a new and promising domain of mass media research. It
enables tis to better understand the evolution of mass media spending and the interplay between
mass media expenditures and other economic variables such as income. It also offers plenty of
opportunities for refinement. Some of these were detailed in this paper.
29
Notes
1.Trends are described as long-term increasing or decreasing movements in a time series (Hanke& Reitsch, 1992).
2.Positive serial correlation, the most frequently encountered type of serial correlation, occurswhen "a positive error in one period.... [is] associated with a positive error in the next period"(Pindyck & Rubinfeld, 1991, p. 49); negative serial correlation, on the other hand, occurs when"negative errors in one time period are associated with positive errors in the next, and viceversa" (p. 49).
3.Virtually all U.S. PRC studies use national aggregate data from the Department of Comm.rce.Mass media categories include: (1) newspapers, magazines, and sheet music; (2) books andmaps; (3) radio, TV receivers, records, and musical instruments; (4) radio and TV repairs; (5)motion picture admissions; and (6) other admissions (theaters, opera, and entertainment of non-profit institutions). Whereas McCombs and his associates performed correlational analyses usingthese individual categories as well as a combination of all six categories (total mass media),Wood ran regression analyses using total mass media spending as the only dependent variable.
4.Negative and positive constant terms indicate increasing and decreasing shares of DPI devotedto mass media, respectively.
5 .VCRs, radio sets, TV sets, and musical instmments were all included in the electronichardware category. So this category is actually an aggregate of old and new technologies.Typically, national statistical offices provide aggregate data for categories that include severalrecreational products. This situation illustrates the difficulty of isolating VCR expenditures fromother types of electronic media expenditures and assessing its individual effect on the overallmass media spending.
6.A 1989 survey of 7,154 respondents in the Houston metropolitan area revealed that cablesubscribers spent about the same amOunt of time with the mass media as non-subscribers,supporting the contention that the adoption of cable TV did not lead to a dramatic increase intime spent on the mass media (Son, 1990). Unexpectedly, he also found that VCR owners spentless time with the mass media than non-owners, although time devoted to VCR use was notincluded in the analysis.
7.Let us assume that the prices of X and Y are kept constant at $1 and $2 per unit, respectively.Figure 1.A shows the budget lines for incomes of $6, $10, and $20. With an income of -$10,a consumer can afford (1) 10Xs, (2) 5Ys, or (3) a mix of Xs and Ys (e.g., 4Xs and 3Xs), aslong as the sum of his/her purchases does not exceed $10. When we add the indifferencecurves, we can draw the consumer's optima for the three income levels (for the sake ofillustration let us assume that these tangential points represent quantities of 4, 5, and 8Xs,respectively). For instance, with an income of $10, the optimal consumption level of Xs wouldbe 5; with an income of $20, an individual would consume 8Xs. To estimate the Engel curvefor X, we report on another graph (quantity of X vs. income) how many Xs individuals consume
30
for incomes of $6 (4Xs), $10 (5Xs), and $20 (8Xs) (Figure 1.B).
8.Houthakker and Taylor (1970) estimated the short-term income elasticity (n) for various media-related expenditure items in the United States: books and maps, 1.67; newspapers andmagazines, 0.38; radio and television receivers, records, and musical instruments, 4.20; radioand television repair, 0.64; and motion pictures, 0.81. To illustrate, an income elasticity of 1.67for books and maps means that when consumers' income (personal consumption expenditures)increases by 10%, we expect spending on books and maps to increase by 16.7%. Long-termelasticity figures (n') were: books and maps, 1.42; newspapers and magazines, (not reported);radio and television receivers, records, and musical instruments, 2.99; radio and televisionrepair, 5.20; and motion pictures, 3.41. The difference between short-term and long-termelasticities lies in the degree of temporal adjustment needed to respond to income changes.Landsburg (1992) explains: "Following an increase in income, it usually takes time for peopleto fully adjust their spending patterns. Thus, we can estimate both a short-run and a long-runincome elasticity, reflecting an initial partial response to an income increase and the ultimate fullresponse. We expect the long-run elasticity to exceed the short-run elasticity" (p. 109) (see alsoThomas, 1987).
9.It was recently reported that the U.S. average household income in the early 1990s declinedby $2,000 from its 1989 level and that consumers had less leisure time in 1989 than in the mid1980s (Robichaux, 1993).
10.Whereas an autoregressive model includes one lagged dependent variable among its predictorvariables, a distributed-lag model contains one or several lagged independent variables on theright side of the equation (Gujarati, 1988).
31
References
Brophy, L. (1995, March 13). Sky high on DBS. Cable World, p. 20.
De Fleur, M. L., & Ball-Rokeach, S. J. (1989). Theories of mass communication (5th ed.). New
York: Longman.
Demers, D. P. (1994). Relative constancy hypothesis, structural pluralism, and national
advertising expenditures. Journal of Media Economics, 7(4), 31-48.
Dimmick, J. (1993). Ecology, economics, and gratification studies. In A. Alexander, J. Owers,
& R. Carveth (Eds.), Media economics: Theory and practice (pp. 135-156). Hillsdale,
NJ: Lawrence Erlbaum.
Dimmick, J., & Rothenbuhler, E. (1984). The theory of the niche: Quantifying competition
among media industries. Journal of Communication, 34(1), 103-119.
Doran, H. E. (1989). Applied regression analysis in econometrics. New York: Marcel Dekker.
Dupagne, M. (1994). Testing the relative constancy of mass media expenditures in the United
Kingdom. Journal of Media Economics, 7(3), 1-14.
Eastwood, D. B. (1985). The economics of consumer behavior. Boston, MA: Allyn and Bacon.
Economic support of mass communications media: 1929-1957. (1959). New York: Scripps-
Howard.
Froyen, R. T. (1990). Macroeconomics; Theories and policies (3rd ed.). New York: Macmillan.
Fullerton, H. S. (1988). Technology collides with relative constancy: The pattern of adoption
for a new medium. Journal of Media Economics, 1(2), 75-84.
Glascock, J. (1993). Effect of cable television on advertiser and consumer E lending on mass
media, 1978-1990. Journalism Quarterly, 70, 509-517.
32
Gujarati, D. N. (1988). Basic econometrics (2nd ed.). New York: McGraw-Hill.
Hall, R. E. (1978). Stochastic implications of the life cycle-permanent income hypothesis:
Theory and evidence. Journal of Political Economy, 86, 971-987.
Hamilton, R. F. (1991). Work and leisure: On the reporting of poll results. Public Opinion
Quarterly, 55, 347-356.
Hanke, J. E., & Reitsch, A. G. (1992). Business forecasting (4th ed.). Boston: Allyn and
Bacon.
Himmelweit, H. T. (1977). Yesterday's and tomorrow's television research on children. In D.
Lerner & L. M. Nelson (Eds.), Communication research--a half-century appraisal (pp.
9-36). Honolulu: The University Press of Hawaii.
Hornik, J., & Schlinger, M. J. (1981). Allocation of time to the mass media. Journal of
Consumer Research, 7, 343-355.
Houthakker, H. S., & Taylor, L. D. (1970). Consumer demand in the United States: Analyses
and projections (2nd ed.). Cambridge, MA: Harvard University Press.
Jesse 11, H. A. (1994, May 23). New yardstick for interactive TV. Broadcasting & Cable, pp.
6, 76-78.
Landsburg, S. E. (1992). Price theory and applications (2nd ed.). Fort Worth, TX: Dryden.
Levy, J. D., & Pitsch, P. K. (1985). Statistical evidence of substitutability among video delivery
systems. In E. M. Noam (Ed.), Video media competition: Regulation, economics ,. and
technology (pp. 56-92). New York: Columbia University Press.
Magrabi, F. M., Chung, Y. S., Cha, S. S., & Yang, S. J. (1991). The economics of household
consumption. New York: Praeger.
33
McCombs, M. E. (1972). Mass media in the marketplace. Journalism Monographs, No. 24.
McCombs, M. E., & Eyal, C. H. (1980). Spending on mass media. Journal of Communication,
31(1), 153-158.
McCombs, M., & Nolan, J. (1992). The relative constancy approach to consumer spending for
media. Journal of Media Economics, 5(2), 43-52.
McCombs, M. E., & Son, J. (1986, August). Patterns of economic support for mass media
during a decade of electronic innovation. Paper presented at the annual convention of the
Association for Education in Journalism and Mass Communication, Norman, OK.
Noh, G. Y. (1994, August). New media departure in the principle of relative constancy: VCRs.
Paper presented at the annual convention of the Association for Education in Journalism
and Mass Communication, Atlanta, GA.
Ogan, C., & Kelly, J. (1986, August). Time and money spent on the mass media in an age of
new communication technologies: A market study. Paper presented at the annual
convention of the Association for Education in Journalism and Mass Communication,
Norman, OK.
Ostrom, C. W., Jr. (1990). Time series analysis: Regression techniques (2nd ed.). Newbury
Park, CA: Sage.
Phlips, L. (1983). Applied consumption analysis (rev. ed.). Amsterdam: Elsevier Science.
Pindyck, R. S., & Rubinfeld, D. L. (1991). Econometric models and economic forecasts (3rd
ed.). New York: McGraw-Hill.
Robichaux, M. (1993, November 29). Highway of hype: Despite many claims for 500-channel
TV, long road lies ahead. Wall Street Journal, pp. Al, A5
34
Robinson, J. P. (1981). Television and leisure time: A new scenario. Journal of Communication,
31(1), 120-130.
Robinson, J. P. (1989, July). Time's up. American Demographics, pp. 32-35.
Samuelson, P. A., & Nordhaus, W. D. (1989). Economics (13th ed.). New York: McGraw-Hill.
Son. I. (1990). The impact of new electronic media on audience support for mass media.
Dissertation Abstracts International, 51, 3263A. (University Microfilms No. 91-05,666)
Son, J., & McCombs. M. E. (1993). A look at the constancy principle under changing market
conditions. Journal of Media Economics, 6(2), 23-36.
Stern, C. (1995, July 10). DBS and cable square off at the FCC. Broadcasting & Cable, p. 42.
Thomas, R. L. (1987). Applied demand analysis. New York: Longman.
Vogel, H. L. (1990). Entertainment industry economics (2nd ed.). Cambridge: Cambridge
University Press.
Werner, A. (1986). Mass media expenditures in Norway: The principle of relative constancy
revisited. In M. L. McLaughlin (Ed.), Communication yearbook 9 (pp. 251-260).'
Beverly Hills, CA: Sage.
Wood, W. C. (1986). Consumer spending on the mass media: The principle of relative
constancy reconsidered. Journal of Communication, 36(2), 39-51.
Wood, W. C., & O'Hare, S. L. (1991). Paying for the video revolution: Consumer spending
on the mass media. Journal of Communication, 41(1), 24-30.
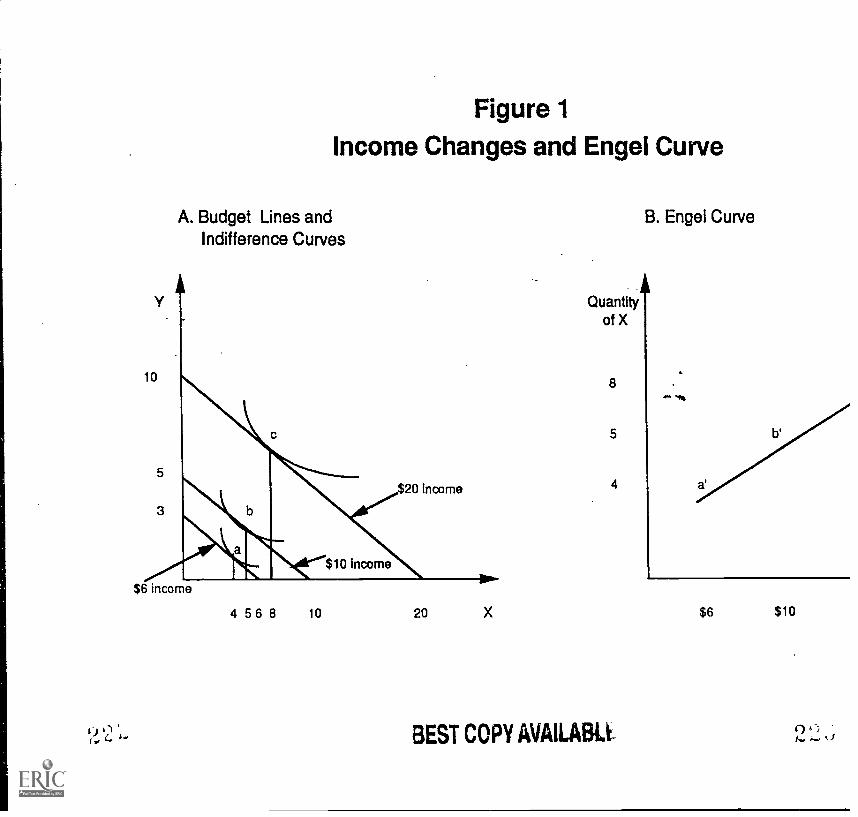
Figure 1
Income Changes and Engel Curve
A. Budget Lines andIndifference Curves
4 5 6 8 10 20 X
Quantityof X
8
5
4
BEST COPY AVAILABIS
B. Engel Curve
$6 $10
"Radio Station Characteristics and
the Adoption of Satellite-delivered Radio Programming"
A. Joseph Borrell
Graduate Student
Annenberg School for Communication, University of Pennsylvania
3620 Walnut Street, Philadelphia, PA 19104
E-mail: [email protected]
Note: This paper is a revision of a master's thesis submitted to the University
of Pennsylvania. The author wishes to thank Dr. Oscar Gandy and Dr. Joseph Turow
for their helpful comments on an earlier version of this paper.
RADIO STATION CHARACTERISTICS ANDTHE ADOPTION OF SATELLITE-DELIVERED RADIO PROGRAMMING
A. Joseph Borrell, III
The current edition of the M Street Radio Directory reports that nearly 20%
of all operating U.S. radio stations use satellite-delivered network programming
as their primary programming source. This paper, using a random sample of over
500 radio stations in the United States, offers a careful examination of what
type of radio station is likely to use satellite-delivered radio programming.
Overall, a station using satellite-delivered radio programming as its format was
more likely to be on the AM band, lower powered. serving a smaller community, and
under less experienced ownership than a station which did not rely on satellite-
delivered programming. The legal form of ownership was also a significant factor
in that stations owned by schools or persons were less likely to use satellite-
delivered formats than stations owned by corporations or limited partnerships.
Statement of Research Question and Hypothesis
Historically, an important feature of Federal Communications Commission
policy has been to license broadcast outlets to individual communities. The
reasoning behind this choice was to ensure that local cities across the
country had access to broadcast services that were responsive to their
community. As the Commission stated in 1965, a basic principle of American
broadcasting is to provide "a broadcast service which meets the needs of the
public in the area to be served... An important element in such a service is
the flexibility to change as local needs and interests change". (Kahn, 1978, p.
331). This policy preference. known as localism, is reflected in various FCC
policies. For example, when allocating new broadcast licenses. the FCC awards
a preference to potential new owners who live in the area of the proposed
station. Requirements for local news coverage and public affairs programming
also reflect this localism philosophy.
However, the growth of satellite technology, along with the introduction
of sophisticated automation equipment, has changed the character of radio
broadcasting. While traditional radio networks supply a few hours a day of
programming which local stations intermix with locally-produced programs,
today's satellite-delivered format networks often completely eliminate the
need for local programming. As Carroll & Davis (1993, p. 259) observed, these
satellite-delivered networks combine the services of a traditional radio
network (news and advertising) with that of a format programming service
(music and entertainment programs). Stations that join these new satellite
networks lose an important dimension of their local flavor.
This change in the character of the network-affiliate relationship has
important social implications for communities across the country because
radio's role as a local information source disappears when stations merely
Radio Station Characteristics 2
repeat programming from national broadcast networks. The local information
that once came from community-based radio stations is clearly not provided by
around-the-clock network programming produced outside of the community of
license. While news programming is obviously of central importance in this
policy, other cultural ties are weakened by repeated programming. Communities
lose a source of local entertainment, and local jobs are usually eliminated at
stations that join these networks. Music programming which once catered
exclusively to local preferences changes when a station joins one of the
satellite-delivered networks that feeds music designed for a national
audience. More importantly, says Dr. Rick Wright, a professor at Syracuse
University, "radio's greatest strength is its ability to be mobile and to
localize. You have to have a live local announcer who understands the
sociological context of the market to add that local flavor." (Boss, 1986)
So what are the factors that influence the decision by a station owner
to use satellite programming instead of locally-produced programs? The answer
to this question is a necessary first step in understanding why so many
station owners have joined these networks despite their obligation to serve
their local area. By identifying those factors which have contributed to this
growth of satellite-fed radio, regulators and lawmakers, representing the
interests of the public, can balance these factors with policies that
recognize the importance of locally originated programs such as news. Despite
the rapid growth of these satellite-delivered networks since 1980, no
significant research, by either academics or regulators. has been conducted
examining the relationship of these networks and their affiliate stations.
The central question of this paper is, "What type of radio station is
likely to use satellite-delivered programming?" The decision to use satellite-
Radio Station Characteristics 3
delivered radio programming is usually presented in the trade literature as a
desperate effort to save costs for a station that is losing money (Keith &
Krause, 1989, p. 255: Bunzel, 1991: Rosen, 1991), Out financial distress is
merely a symptom of a larger problem, an inability to compete with other more
powerful broadcasters. Therefore, the working hypothesis is that radio
stations which have less of an ability to compete, due to technical or
financial factors, will be more likely to use satellite programming.
Literature Review
Radio has been called the "forgotten medium" of the communications
industries. With the ascendancy of television during the postwar period, radio
became the overlooked stepchild of mass media research. While the overall
acceptance and use of radio is striking, this technology has become an
invisible appliance. For example, the average American household owns six
radios, and the average American adult spends over three hours a day listening
to the radio (Papazian, 1994, p. 421). Radios wake us up in our bedrooms, ride
around with us in our cars, and drone on at the office while we work. Radio
has a significant role in American life, and advertisers spend millions every
year using radio to influence potential consumers of their products. Several
books have been written over the years detailing the different aspects of the
transformation of the radio industry (for example. Fornatale & Mills, 1980:
Fowler & Crawford. 1987: Morrow & Baudo. 1987: Keith & Krause, .1989). However,
of these works, only Keith and Krause (p. 255) describe the use of satellite
programming, but they cover the subject only briefly. Therefore, most of the
background information for this project has been derived from industry trade
publications.
Radio Station Characteristics 4
There are several major corporate players in the field of satellite-
delivered format networks, such as the Capital Cities/ABC-owned Satellite
Music Networks and Unistar which is owned by Westwood One. These networks
provide live round-the-clock music, news and entertainment programming to
affiliates in a variety of programming formats using satellite technology.
Although these companies grew rapidly in the 1980's, an extensive literature
review found that no academic research has been conducted examining the role
that these format providers have had on the radio industry.
Satellite Music Network (SMN) was the first, and is the largest,
provider of these real-time deliverers of music programming to stations by
satellite. The company now distributes ten different radio station formats to
affiliates across the country. The current formats provided by Satellite Music
Network include two different versions of country, two rock formats, two adult
African-American targeted formats, two adult contemporary formats, and one
version each of nostalgia and oldies (Unmacht, 1994, pp. 843-844). For
example, SMN's "Stardust" format service consists of highly researched
nostalgia (also known as big band) 1",:jsk, interviews with musicians, news and
entertainment features ("SMN's Heart and Soul," 1985). A key difference
between these new radio networks and the traditional broadcast networks is
that these radio format networks are designed to totally eliminate the need
for any locally focused programming content such as news.
The innovation of satellite-delivered musical formats blurred the
typical distinction between the functions of a radio network and a local
station's programming department. Since the 1950's, the accepted notion was
that successful radio programming needed to be customized for the local
audience. Nevertheless, satellite-delivered programming, like that provided by
Radio Station Characteristics 5
SMN, proved that radio networks could provide reasonably popular, standardized
long-form programming at low cost across the country. 1-or stations
contemplating joining one of the network's formats, the incentives to take the
satellite feed are great. The typical radio affiliate of a satellite-delivered
network pays little for the programming. In fact, as with a traditional
network agreement, the station often can make money from a network agreement
because the network may split some part of the national advertising revenue
from commercials with its affiliates. However, unlike with a traditional
network which merely supplements local programming, with these newer long-form
radio networks, a station's cost of programming can decrease dramatically
because they do not need to hire staff such a:: deejays and program directors.
Instead, the station owner gains access to the network's stable team of proven
and popular air personalities. Automation equipment at the local station
smoothly inserts local commercials and legal identifications into pre-arranged
breaks in the network programming (Rodrigues, 1984; "Radio Programming,"
1986). However, not all satellite-delivered networks require the airing of
commercials. Indeed, some networks are explicitly designed for non-commercial
radio stations (Unmacht, 1994, pp. 843-849).
Political economy theory recognizes that owners have an economic
incentive to provide "the least expensive mix of content that protects the
interests of sponsors and investors while garnering the audience advertisers
will pay [for]" (McManus, 1993, p. 85). Clearly, economic reasons drive the
selection of radio programming. Advertisers, the sole source of revenue for
most radio stations, prefer a carefully researched and controlled environment
in which their commercials are played (Ang, 1991. pp. 53-56). With careful
control over programming on their affiliate stations. satellite-delivered
j
Radio Station Characteristics 6
networks are able to construct a narrow, but national, audience composed of
listeners to a particular well-defined format. Radio station audiences, a
variable of differing quality across the country, can be standardized and sold
on a national basis by a satellite network.
These satellite networks found willing affiliates in stations in danger
of bankruptcy. Imprudent levels of debt, together with increasing competition
from other media outlets, have led many radio stations into financial
distress. A failure to attract sufficient advertising is the major reason that
over 400 licensed radio stations are now off the air (Harris. 1994). Radio,
unlike most other industries, is uncommon in that, on the expense side of the
budget for a station, almost all costs are fixed. There is no additional cost
for gaining an additional listener since it costs as much to program a radio
station for one hundred or ten thousand listeners. By using satellite
programming, an unprofitable station may suddenly be able to turn a profit. As
competition for audiences from other media increased and the recession of
early 1990's decreased advertiser's spending, more radio stations chose to
reduce costs by using satellite programming as their primary programming
source (Rosen, 1991).
From the developmental history of satellite-delivered radio formats.
satellite programmed radio stations are presented as a "second best"
programming decision for stations that take the programming full-time. Unlike
in television where the major networks typically affiliate with the strongest
station, satellite-delivered radio networks, due to their lack of local
content, are considered second-rate programming choices. A larger audience
could be attracted by high quality local hosts but these stations, even if
they have the capital to pay the high salaries good radio personalities
Radio Station Characteristics 7
command, are usually limited in audience appeal by poor facilities. Thus.
these stations seem trapped by poor technical facilities and the limited
resources of their owners into using satellite-delivered radio programming.
Stations which already had successful programming were unlikely to
affiliate with these satellite networks because of the loss of control over
local programming that these networks entailed. Furthermore, since the
networks sell several minutes an hour of advertising time, as the station's
value as an advertising medium increases, so does the value of the time the
station devotes to network programs and their advertisements. This link
accounts for the differing penetration of satellite-delivered networks between
larger and smaller markets. In New York City, the largest market in the
country with some 60 stations, only one station, WFME-FM. uses full-time
satellite-fed radio programming. In contrast, the smallest defined radio
market. Kenai, Alaska. has seven stations serving a year-round population of
22.300. Three of these stations use automated satellite programming full-time
while two others use these services on a part-time basis (Unmacht, 1994, pp.
614, 667).
Consequently, competition plays a key role in the decision to use
satellite programming but, of course, this competition does not occur on a
level playing field. Some organizations, by virtue of larger size. better
Facilities, or media synergy, have more competitive ability than others. Other
scholars, concerned with whether this power affects the value of broadcast
services, such as advertising or the resale value of broadcast licenses, have
measured the relationship between a broadcast station's competitive ability
and what price that station can command in the marketplace.
Radio Station Character4stics 8
Owen (1973) tested the effect on television advertising prices when a
newspaper and a television station were owned by the same party in the same
market. His model attempted to measure the monopoly power accumulated by large
media owners. As a proxy for the station's competitive ability, his model
measured the market's population, average income, VHF-UHF status, network
affiliation, and ownership status. Owen's hypothesis was that stations with
better quality programs, larger coverage areas, demographically favorable
audiences, and powerful owners would have higher advertising revenues.
Blau, Johnson and Ksobiech (1976, pp. 197-207), in their estimation of
TV station economic value, divided their variables into internal and external
ones. Internal variables, defined as those variables largely under the control
of a station's management, were net broadcasting revenue, size of average
audience and amount spent on local programming. Their external Nariables
included broadcast channel, network affiliation, station age, type of
ownership, number of competitors and total number of homes in the market.
Since obtaining financial information for a sufficiently representative.sample
of radio stations would be difficult, using.the internal variables that Blau,
Johnson and Ksobiech obtained is beyond the scope of this study. However, the
external variables that this model uses for television are readily available
and are also relevant for the sister medium of radio because they measure the
coverage area of the station and the financial strength of the station owner
which has also been raised as an important factor in the use of satellite-
delivered radio programming.
Bates' (1991) study of the price of television time used four categories
of variables: station measures, market size measures, market quality measures,
and market penetration measures. By station measures, he referred to such
Radio Station Characteristics 9
variables as the number of competing stations within a market, station
coverage, VHF-UHF status, and network affiliation. The market size measures
are related to the number of people within the television market. Market
quality related to purchasing power of consumers within those markets. Market
penetration referred to availability of cable or UHF capable televisions.
Bates' (1995) study of radio station value uses similar independent variables
such as market size and quality measures, but to measure a radio station's
technical aspects, he uses station power, daytime-only status (for AM), tower
height (for FM), year of last sale, frequency, and the number of competing
stations. These station attributes "indicate the strength and degree of any
station's coverage area. For example, higher powered stations tend to have
greater coverage areas, and thus larger audiences, than do lower powered
stations" (p. 15). Bates' study of station value emphasizes the importance of
a station's signal reach. Station with greater reach have a larger potential
audience thus enhancing a station's economic well-being.
From this economic research on broadcasting, it is apparent that
specific radio station technical factors play a crucial role in determining
the economic prospects of a radio station. Thus, the following technical
factors are important to the station's competitive ability. First, whether the
station broadcasts on the AM or FM band. A second factor is the station's
transmitting power which measures the area that a station's signal can reach.
The frequency a station is assigned by the FCC affects how well a station is
received by a potential listener. Since FM signals travel in a "line of sight"
manner, the height above ground that an FM station's transmitting equipment is
placed plays a significant role in determining that station's potential
audience. For AM stations. limitations on the number of broadcast hours a
rl;
Radio Station Characteristics 10
station can transmit also limits its potential audience because, in order to
avoid interference, some AM stations are limited to broadcasting only during
the daytime. The a variables are related to the technical strength of the
radio station. They directly measure how powerful the station's signal is.
Stations with more powerful signals have a larger potential audience and these
stations are able to charge higher advertising prices to potential customers.
Of course, having a powerful signal is only useful if there are potential
listeners in that coverage area which advertisers want to reach. Stations in
sparsely populated areas are less appealing to advertisers than a similar
facility located in a big city. Estimating the population in the area served
by a radio station also serves to measure the size of a station's potential
audience. All of these variables indirectly measure the value of the audience
the station may potentially sell to advertisers.
A second group of variables serve to assess the financial situation of a
station's owner. Since access to financial information about each station
owner is difficult to obtain, an attempt was made to find proxies for this
information. The number of stations owned was a useful proxy for the financial
strength of the owner. This strength is measured in two ways. The first
measure is the ownership of stations in markets across the United States,
known as group ownership. A second measure of this strength is the number of
stations owned in the same market. An owner who owns more than one station in
the same broadcast service in the same geographic area is known as a
duopolist. The simple ability to own a number of stations indicates financial
strength. There are clear economies of scale in controlling several stations
due to cost advantages that come from operating efficiencies in combining
otherwise separate organizations. But it has also been hypothesized that
1 ",
ti
Radio Station Characteristics 11
market power leads to lower quality programming and distortions in the
advertising market. For example, it has been alleged that group owners receive
more favorable treatment than singly owned stations when negotiating with
networks and advertisers (Besen & Johnson, 1984, pp. 3-5). Again, the
traditional view is that "stand-alone" radio stations have less of an ability
to compete with entities that control several statibns. Besen & Johnson's
(1984. pp. 38-40) economic analysis of broadcasting suggests that an owner of
several stations within the same market potentially has more power over
programming and advertisers than an owner who controls stations located in
different markets.
Regulators have tried to balance the trade-off between allowing stations
to be economically efficient but controlling their collusive tendencies. These
trade-offs are at the heart of the related debate oVer the number of stations
that should be controlled by the same organization within the same market.
Deciding upon the appropriate limits to station ownership has concerned
industry analysts and regulators for years (for example, Besen & Johnson,
1984; Bagdikian, 1990). Indeed, Congress and the Federal Communications
Commission are currently considering drastic revisions to the current rules
over how many radio stations one party should be allowed to own. Before
deregulation, a single corporation was limited to owning only a small number
of stations. By 1984, the limit was substantially raised to 12 AM and 12 FM
stations (Bagdikian, 1990. p. 24). Since 1994, a single corporation can own
and/or control up to 40 different radio stations (20 AM's and 20 FM's) of
which up to four may be in the same market. Even this limit on the direct
ownership of stations has been usurped by loopholes in FCC rules which now
allow a media conglomerate to set up lease-type agreements with many stations.
IL.' 11
Radio Station Characteristics 12
It has been alleged that broadcasters are abusing these agreements to obtain
such large market shares that the programming market is no longer competitive.
For example, Jacor Communications uses satellite programming on two .of the
seven stations that it controls in Cincinnati, Ohio. Though Jacor can easily
afford to provide local programming on these stations, it uses generic
satellite-fed programming on these stations perhaps because no competitor will
change formats to provide a similar, but local, format and risk a long
programming and advertising battle with the well-financed Jacor (Neff, 1992;
Boyer, 1994: Paeth, 1994).
The formal hypothesis is that stations without sister stations, plagued
by higher operating costs than stations owned by larger companies, have owners
with fewer financial resources and should be more likely to use satellite-fed
services. However, with the evidence presented that a large concentration of
market share may lead some large group owners to use satellite programming, an
interesting alternative hypothesis emerges that 1 rge group owners, because of
their greater power over program suppliers and advertising markets, also are
heavy users of satellite programming.
Another measure of financial strength is whether a station's licensee
was a profit-seeking corporation or not. The corporate form of ownership is
almost a prerequisite for an organization to acquire large amounts of capital.
The corporate structure, with its limited liability and liquid ownership
structure, is the dominant form of organization over partnerships and sole
proprietorships among American businesses. Partnerships and proprietorships
are limited in their ability to raise capital because of the legal requirement
that owners are personally liable for all of the losses of the business
(Baumol & Binder. 1986. pp. 448-453). Schools and other non-profit
Radio Station Characteristics 13
organizations, limited by law to a public-service responsibility, are not
permitted to pay a return to their owners and so should also be less able to
compete for audience with for-profit corporations. Thus, the dominant form of
organization for a radio station.is as a corporation. A corporation's ease of
access to capital should make corporate owners less likely to use satellite
programming than other owners with limited resources.
A final proxy for financial strength was how long the station had been
owned by the same party. Several theories suggest why longer tenured owners
tend to be financially stronger owners. First, since media management skills
are costly to acquire, more experienced owners have an advantage over
neophytes in running a station, and stable ownership of a broadcast outlet
aids in the development of long-term goodwill with the community and with
advertisers (see Rosenblum, 1994). Pechman (1987, pp. 118-119) explains that
one effect of the United States' capital gains tax has been to discourage the
sale of profitable assets while simultaneously encouraging the immediate sale
of unprofitable assets. Applied to radio stations, this principle means that
radio stations which have greatly increased in value will be retained by their
owners for longer periods of time than less successful stations. With the
repeal of the anti-trafficking rule (the FCC rule that required station owners
to keep a newly acquired station for three years), stations became easier to
trade (Bates, 1989). One rationale for the anti-trafficking regulation was
that a station that suffered from frequent changes in ownership would have
lower quality local programming. The working hypothesis is that new station
owners, burdened by newly acquired debt and with less management experience,
have less of a commitment to the radio station's broadcast area than owners
Radio Station Characteristics 14
with longer ties to a community (Norback & Norback, 1980, p. 413; Bates, 1989)
and, therefore, will be more likely to use satellite-delivered programming.
Formal Statement of Variables
The dependent variable for this analysis will be the use of satellite-
delivered programming as the primary programming on a radio station as
indicated by the M Street Radio Directory. The choice to use satellite-
delivered programming as the main format for an individual station is a
dichotomous one, much like purchasing a car. As such, the evidence of the
choice is either a yes or no, coded as a "I" and "0" respectfvely. When coding
the data, the use of satellite programming as the primary programming source
is coded as a "one" while stations that were predominately locally programmed,
but may still use some satellite-distributed programming, were coded as
"zero." In cases where stations were indicated as being both'locally and
satellite programmed, the first designation in the M Street Radio Directory
was used. This coding convention was a conservative one in that it probably
understated the extent that satellite-delivered programming is used within the
industry because the directory coded morning drive programming first which is
often saturated with local news and traffic. Thus a station with local morning
programming but satellite programming the rest of the day (a common situation)
would be coded as locally programmed even if the majority of the day was
satellite-controlled. Of course, most radio stations use some amount of
network programming. The key feature the dependent variables seeks to measure
is when network programming is no longer simply a complement to a locally
produced radio station, but has in fact become the programming for the
station.
Radio Station Characteristics 15
The first five independent variables are related to a technical
assessment of the station. Typically, stations with poor signals have a
smaller coverage area and therefore a more difficult time being successful. To
indicate the technical strength of the station, factors such as the power and
frequency of the station need to be taken into account.
The first independent variable was the band the station is located on.
This variable was coded so that the variable "FM" would be equal to "one" if
the station was located on the FM band but "zero" if that station was on the
AM band. AM stations are expected to be heavy users of satellite programming
in part due to the fact that FM stations are more popular with listeners than
AM stations and AM stations attract an older audience that is less desirable
to advertisers (Borowski. 1986).
The second independent variable was the assigned frequency of the
station. This variable is particularly important for stations located on the
AM band. Stations located near the bottom of the dial, 550 kilohertz AM for
example, have signals which travel further than a station with the same power
further up the dial such as a station transmitting at 1450 kilohertz AM (Noll.
1982, pp. 34-39). Therefore, higher frequency AM stations should be positively
associated with satellite programming. For FM stations, the effect of
frequency, measured in megahertz, on transmitting area is less pronounced
though some stations at the very bottom of the FM dial are plagued by
interference with the audio of television channel 6 (Larson, 1988). Therefore,
these lower frequency FM stations may suffer from reduced coverage a,ea
compared to similar stations and thus be more likely to use satellite
programming.
Radio Station Characteristics 16
The third independent variable was the transmitting power of the
station. For AM stations, which are generally allowed less transmitting power
at night, the higher daytime power was used. A station's transmitting power
was coded as a percentage of the maximum power allowed by the FCC, 50
kilowatts for an AM station and 100 kilowatts for an FM station (Norback &
Norback, 1980, p. 411). A station with a higher transmitting power has a
larger potential audience than a lower powered station. Therefore, in
accordance with the hypothesis, this variable should be negatively associated
with the dependent variable.
The fourth independent variable, tower height above average terrain in
feet, was coded for FM stations only. FM stations with transmitting antennas
located at higher levels above average terrain have more coverage area than
other stations, and there should be an inverse relationship between tower
height and the use of satellite programming.
The fifth independent variable, daytime-only status, was coded for AM
stations only. Some AM radio stations are restricted to broadcasting between
local sunrise and local sunset in order not to cause int'erference to other
stations, since AM signals can travel great distances at night. This
limitation of broadcast time causes a daytime-only AM station to be a less
desirable broadcast property and, therefore, a more likely user of inexpensive
satellite programming.
The sixth independent variable is the size of the market. There has been
a clear difference in the utilization of satellite-delivered programming
across different sized markets. Smaller markets have less advertising revenue
available per radio station and would be more likely to use satellite
technology.
Radio Station Characteristics 17
Market population (in thousands of persons), as defined by the M Street
editors, was used as the estimate of market size. Unfortunately, many small
radio stations'do not serve a designated market area so, in this analysis of
market size, about a third of the stations in the sample were omitted. Another
problem associated with this estimation arises as the definition of market
changes from source to source. As Unmacht (1994, p. 611) notes, the very
definition of a market is influenced by the stations that pay for the
research. For exaMple, Wilmington, Delaware is part of the Philadelphia
television market but not part of the Philadelphia radio market.
The last four variables are related to the financial strength of the
station's owner.
The seventh independent variable is group ownership status. The formal
hypothesis is that small independently owned stations have less capital than
large group owners and may be more likely to use satellite programming but a
second alternative hypothesis is that this accumulation of capital by large
group owners allows them to use satellite programming and not be financially
affected. A group owner is defined as an entity which controls stations in
several markets across the country. The M Street Radio Directory provides a
clear account of which stations are owned by group owners. Group owners are
coded as "one" while independent owners are coded as "zero."
The eighth variable is the number of sister stations within the same
market. Again, the traditional view is that "stand-alone" radio stations do
not have sister stations to spread out the fixed costs of broadcasting and
should be more likely to use satellite broadcasting while a second competing
theory suggests that owners of multiple stations, with more channels to
program and more market power. may also be high users of satellite-
Radio Station Characteristics 18
programming. The coding of this variable was achieved by adding up all of the
stations owned or controlled by the same party in the same radio market. For
this variable, stations linked together by so-called "marketing agreements"
were also counted as being under the same ownership. For example, KMEZ-FM,
located in Belle Chas.se (New Orleans, LA), and controlled by Keymarket, which
also owns WWL and WLMG in New Orleans, was coded as having 2 sister sisters.
A ninth variable is legal form of ownership. For many reasons, stations
that are not owned by for-profit corporations have a limited ability to raise
capital. Corporations, with no fetters on capital accumulation, should be less
likely to use satellite programming. The first step in coding was to examine
the name of the actual licensee of the station. If the licensee was a person
or a small partnership (for example John & Mary Smith), the station was
considered to be not a corporation and coded as zero. If the license was held
by a corporation (for example, Smith, Inc.), the variable was set to one.
Limited partnerships were treated as different from traditional partnerships
and were classified as a corporate form of ownership. Limited partners are
passive investors, not personally liable for the potential losses, and not
involved in the daily affairs of the stations. This distinguished limited
partnerships from traditional sole proprietorships or partnerships in which
each owner is personally liable for the losses of the station (Rao, 1987, pp.
7-10). Markets have also developed in which limited partnership interests can
trade much like traditional stock markets thus eliminating the traditional
illiquidity of a standard partnership. Stations that were clearly controlled
by non-profit organizations (primarily schools) were considered non-corporate
owners.
Radio Station Characteristics 19
The tenth, and final, variable is the number of years owned by the same
party. Coding of this variable was taken to indicate the last time a
meaningful change of ownership took place. The M Street Radio Directory
provided the date of sale for most of the stations in the survey. This
database was supplemented by information derived from Broadcasting & Cable
Marketplace (Onaran, 1992). For a few stations in the sample, no sale had been
recorded and so the first on-air date was used as a measure of longevity of
ownership. Stations with less experienced management are hypothesized to be
heavy users of satellite-delivered radio programming.
Sample
The data set consists of 503 stations randomly selected from the 12,647
stations listed in the 1995 edition of the M Street Radio Directory. Some
supplemental data was taken from various editions of the Broadcasting & Cable
Marketplace, also known as Broadcasting Yearbook. Stations that were under
construction or off the air were eliminated from the sample. Given the
dependent variable is limited to one of two states, a logistic regression was
used to separate the effects of the independent variables.
The overall sample showed 17% of stations using satellite programming as
their primary programming source. This figure differs from the 20% penetration
rate for satellite networks given by Unmacht (1994, p. 19) because of this
study's more conservative definition of which stations are primary users of
satellite programming. For AM stations, 22% of the stations sampled used
satellite programming as their primary format compared with only 13% of the FM
stations.
Four different regressions were performed. The first was on the overall
sample. Due to a lack of market population estimates for some stations located
Radio Station Characteristics 20
in rural areas, a second logistic regression was performed with just those
stations that had population estimates available. Given the differences
between the technical aspects of AM and FM broadcasting. the third and fourth
regressions were conducted for FM stations onlj, and AM stations only,
respectively. The results of the models were satisfactory in that between 78%
and 87% of the statuses were correctly predicted by the equation generated by
the independent variables. All of the regressions have highly significant (2 <
.002) Chi-square statistics.
Results
Of the variables tested in the first regression, over the entire set of
data, only four variables had significant results (2 < .05). This means for
each of these results, it was calculated that, with at least 95% confidence,
there exists a meaningful relationship between the independent and dependent
variable. The appendices have full details on the statistical results.
The most powerful predictor of these four variables was the number of
years of same party ownership. As number of years of ownership increased, the
likelihood that the station would use satellite programming decreased. The
second most significant variable was the transmitting power of the station. As
the station's power increased, the likelihood of that station using satellite-
delivered programming decreased. Corporate ownership was also.significant
across the entire sample. If a station licensee was a corporation, it was more
likely to use satellite programming than non-corporate owners. Finally.
whether a station is located on the AM or FM band is important. Satellite
programmed stations are more likely on the AM band than the FM band.
In a second regression using only stations located in defined markets.
the population of the broadcast market was found to be marginally significant
Radio Stdtion Characteristics 21
(g < .06). As the market size increased, the use of satellite-delivered
programming decreased. As with the larger regression, the variables concerning
number of years owned, transmitting power, corporate ownership and band were
also significant in a similar pattern as the first regression.
Less straightforward were the results that came from the two regressions
which examined only FM or only AM stations. In the regression composed
exclusively or FM stations, two technical measures, station frequency and
tower height, were added. Neither variable was significant. However, a
station's transmitting power and the form of corporate ownership were
significant, supporting the original hypothesis. The regression indicated that
the number of years owned was not significant at the .05 level for FM stations
though a simple correlation between the dependent variable and the number of
years owned variable shows the hypothesized relationship is significant.
Despite a significant Pearson correlation between both daytime-only status and
the number of sister stations with the use of satellite-delivered programming,
the regression of AM stations confirmed only one significant variable, in
which as the number of years a station had been owned by the same party
increased, the less likely it was that the station would use satellite-
delivered radio programming.
Five variables were insignificant in all of the regressions in which
they appeared. The group ownership and the number of stations variables in the
regression did not lend support to the theory that satellite programming was
confined to small owners. However, there was no support for the competing
hypothesis either. No conclusion was reached about whether satellite
programming was associated with large owners of multiple stations. While a
station's transmitting power did have some explanatory power, a station's
Radio Station Characteristics 22
frequency did not. For the FM stations in the sample, the height of the
transmitting equipment did not have any relation to the use of satellite
programming and, for AM stations, limitations of broadcast hours also was not
conclusively associated, either positively or negatively, with the affiliation
of that station to a satellite network.
Conclusions
Overall, the most surprising finding was the indication that
corporations were more likely to use satellite programming. This result was a
revelation since one of the advantages corporations have is their superior
ability to raise capital: therefore, corporate-controlled stations would be
better able to compete against stations limited to non-profit status or to the
personal assets of the owner.
It was less surprising that AM stations would be more likely to use
satellite-delivered programming. Given the general distress found among AM
broadcasters, this result supports the original hypothesis of satellite
programming being associated with weaker broadcast outlets.
The number of years owned variable was in accordance with the
hypothesis. Longer-tenured owners are more likely to have locally-originated
programs than newer owners. The years owned variable though was not
significant in the regression for FM stations only. One possible explanation
for this variation is the fact that FM broadcasting is a newer technology. FM
stations on average are younger tnan AM stations and so years of incumbency
may be less important on that band.
The transmitting power finding for three of the regressions added
support to the hypothesis that satellite programming is largely associated
with weakly-powered stations.
(-
Radio Station Characteristics 23
The lack of individual variable explanatory power in the AM only
regression may be accounted for by the sampling methodology. Since the sample
only includes stations that are on the air, stations that have left the air
were excluded from the sample. Many low-powered AM stations, especially the
daytime-only ones, have left the air due to years of financial losses (Harris.
1994). Therefore, competition has already eliminated many of the weaker
players on the AM band and only stronger AM commercial stations still remain
on the air, thereby accounting for the lack of variation found in the
explanatory variables. A more complete model could have accounted for more of
this variation by including measures of market quality instead of simple
measures of market population.
Suggestions for Further Research
Since the type of owner was significantly related to the adoption of
satellite-delivered programming, further research is indicaid in this area.
Given the contemporary debate over public broadcasting, a good first step
would be to break down the non-corporate category used in the regressions into
non- profit owners and personal owners. Non-profit status, while limiting an
organization's ability to raise capital. also indicates an organization's
orientation to community service. Noll. Peck & McGowan (1973, p, 240) report
that television "stations operated by educators do show a marked tendency to
broadcast less national programming." Apparently, despite a history of limited
resources, non-profit educational television stations have been able to
produce local programming. While this research suggests non-profit
broadcasters are more likely to produce local programs, identifying these
broadcasters and confirming that non-profit educational broadcasters are more
likely to be local producers would prove informative for the public debate
Radio Station Characteristics 24
over the value of educational public broadcasting, particularly the value of
public radio.
A more complete analysis of the spread of satellite-delivered radio
programming will have to be conducted to provide guidance in answering the
question of whether there exists a link between concentration of ownership and
the use of satellite programming. The regression's did not show any significant
relationship between satellite programming and group ownership or ownership of
a number of sister stations. Thus, no conclusions could be made about whether
satellite programming predominated among stand-alone or group operators. A
good follow-up to this project would be a more complete analysis that would
identify different categories of group owners since this coding treated all
group owners the same and only counted the number of stations that an entity
controlled in a single market. For example, group owners could be
distinguished by the number of stations they control nationwide, estimated
percentages of total market revenue, or total corporate assets.
One particularly interesting result was the relation between years of
ownership and the use of satellite programming. Since the policy implications
of satellite programming are negative, then these results add credence to the
theory that the anti-trafficking rule lead to higher-quality, more locally-
oriented programming and that the repeal of this rule in 1984 was not in the
public interest. Despite the deregulatory trend in communications policy.
Jessell (1993) reported that the Federal Communications Commission is still
exploring whether the rule should be reinstated. However, while the previous
version of the anti-trafficking rule.specified a three year holding period, an
examination of this data set indicates that only after five years of ownership
was there a significant decrease in the usage of satellite programming. For
Radio Station Characteristics 25
this sample, stations that had changed hands during the 1990's (owned 5 years
or less) were much more likely to use satellite-delivered programming (p <
.0001) than stations with longer-tenured ownership.
Questions have also arisen over whether an increase in the sheer number
of radio stations has lead to a corresponding increase in public service by
these licensees. Many new U.S. radio stations have been licensed over the past
few years. The total count of operating U.S. radio stations has risen from
around 8,000 in 1977 (Broadcasting Yearbook) to nearly 12,000 (Unmacht, 1994.
p. 19). This increase, if related to the growth of satellite-delivered
programming, has important public policy implications since the Federal
Communications Commission (FCC) controls the number of channels available to
the American public. This research has lent support to the idea that satellite
programming is predominately concentrated on lower-powered stations. Since the
public policy implications of this type of automated programming are
unsatisfactory and in direct conflict with the preference for localism. the
FCC's frequency assignment policy could be modified to permit the licensing of
fewer, though higher-powered, radio stations. This change would have fewer
stations fighting for a limited amount of advertising revenue, thus,
potentially improving the profitability of marginal stations and lessening
their reliance on satellite programming. Simply increasing the power of all
U.S. radio stations, without decreasing the number of stations, would merely
lead to higher interference and fewer listeners.
Since advertisers' valuation of the audience is crucial for economic
success, more variables concerning the market and its population could have
been included. While this model excluded from the population regression
stations serving very small communities. Bates (1995) included them by
Radio Station Characteristics 26
hypothesizing that in these rural areas, stations served only the county where
the station was located. He then obtained population estimates for those
counties. Another explanatory variable could have been the quality of the
audience in a particular market. For example, average income levels, a figure
of great interest to advertisers, could be used to rate the buying potential
of a station's audience.
A model which fit the data better could have been constructed if better
technical information about a station's transmitting facilities were
available. For example, measuring the distance between the location of a radio
transmitter and the central city of the radio market would help determine how
well any particular station was able to cover its market area. In addition,
demographic information about the potential audience in different areas could
have been included to measure the value advertisers place on radio
advertisements broadcast in different geographic areas of the same regional
market.
The long decline of the AM broadcast band shows no signs of ending. As
mentioned above, many weak AM st'ations have signed off the air. Various
proposals. such as improving AM transmitting equipment and expanding the AM
dial to 1700 kilohertz, have been advanced to improve the borderline situation
of these stations. As this thesis has demonstrated, satellite programming is
more likely to be found on an AM station than an FM station. Any technical
improvements should, theoretically, increase the audience for an AM station
and reduce the band's dependence on these types of automated programming.
However, given the troubled introduction of AM stereo, small incremental
technical improvements will probably have little bearing on a station's
programming dilemma or the overall health of AM broadcasting.
Radio Station Characteristics 27
The broader conclusions of this study have parallels to recent
developments in radio's sister medium, television, and should be further
explored given the impact of cable upon viewers. For example, despite the fact
that the number of television channels has increased dramatically over the
past two decades, most television stations produce only a few hours of local
programming a week. Indeed, some newer television networks, such as the Home
Shopping Network and Univision, use round-the-clock satellite feeds to program
virtually all of the broadcast hours of their local affiliates. Unlike the
traditional networks, these newer networks typically affiliate with less
desirable newer and lower powered television stations ("When a network is not
a network 1989).
Of course, many questions still exist concerning the relationship
between satellite programming and raft stations. Different methodologies
could also be used to explain some of the variation found in the usage of
satellite-delivered programming. Surveys or interviews coul.d assess the
relationship between an owner's involvement in community service and that
owner's use of satellite-delivered programming on his or her station.
Replicating Blau, Johnson, and Ksobiech's measures of advertising revenue and
programming expenditures for a sample of radio stations would provide direct
measures of market power that this thesis only approximates.
Finally, an understanding of the trend found in the usage of satellite-
delivered programming would help explain some of the quandaries that this
thesis falls to answer. In particular, the question of whether satellite-
delivered programming is increasingly a resource for large group owners as
part of a market domination strategy could be answered by a time-series
tracking affiliation patterns. The design of the model. due to its static
Radio Station Characteristics 28
nature, does not directly address issues of how the decision to use satellite-
delivered programming is made. Rather, this thesis has simply tested to see
whether certain attributes are asrociated with satellite programming. The data
set tested was a cross-sectional one and does not incorporate a full sense of
the dynamic changes which have taken place in the radio industry over the past
two decades.
Radio Station Characteristics 29
References
Ang, I. (1991). Desperately Seeking the Audience. London: Routledge.
Bagdikian. B. (1990). The Media Monopoly (3rd ed.). Boston: BeaconPress.
Bates, B. J. (1989). Deregulation and Station Trafficking. Journal ofBroadcasting and Electronic Media, 33, 317-323.
Bates, B. J. (1991). Models, Methods, and Assumptions: The Usefulness ofa Multi-Mealod Approach to the Examination of Influence in TV Pricing. Journal
of Media Economics 4 49-66.
Bates, B. J. (1995). What's a Station Worth? Models for DeterminingRadio Station Value. Journal of Media Economics, 8, 13-23.
baumol. W. J., & Blinder, A. S. (1985). Economics: Principles andProblems. San Diego. CA: Harcourt Brace Jovanovich.
Besen, S. M., & Johnson, L. L. (1984). An Analysis of the FederalCommunications Commission's Group Ownership Rules (Rand Note No. N-2097-MF).
Santa Monica, CA: Rand.
Blau, R. T., Johnson R. C., & Ksobiech, K. J. (1976). Determinants of TV
Station Economic Value. Journal of Broadcasting, 20, 197-207.
Borowski, N. (1986. October 12). Satellites Signal New Wave in Radio.
Philadelphia Inquirer, p. Cl.
Boss. K. (1986, July 17). Radio's Satellite Networks Beam with Success.Chicago Tribune, p. Tl.
Boyer. K. (1994). "Broadcasters Seek More Market Share." GreaterCincinnati Business Record, April 11. p. 1.
Bunzel, R. (1991. September 30). Ailing Stations Buy Time with LMA's.
Broadcasting, 40.
Carroll, R. L.. & Davis. D. M. (1993). Electronic Media Programming:Strategies and Decision Making. New York: McGraw-Hill.
Fornatale, P., & Mills, J. (1980). Radio in a Television Age. Woodstock,
NY: Overlook Press.
Fowler. G.. & Crawford. B. (1987). Border Radio. Austin: Texas Monthly
Press.
Harris. L. (1994). How They Die...Tales from the Z File. In R. Unmacht(Ed.). The M Street Radio Directory 1995 Edition (p. 41). New York: M Street
Corporation.
C. t:)_
44.
Radio Station Characteristics 30
Jessell, H. A. (1993, October 18). Washington Watch. Broadcasting, p.
Kahn, F. J. (1978). Documents of American Broadcasting. (3rd ed.).Englewood Cliffs, NJ: Prentice-Hall.
Keith, M., & Krause, J. M. (1989). The Radio Station.(2nd ed.). Boston: Focal Press.
Larson, M. (1988, October 17). Rivals Negotiate Over Future Public RadioStation. Business Journal-Sacramento, p. 14.
McManus. J. (1993). Market-Driven Journalism: Let the Citizen Beware?Thousand Oaks, CA: Sage Publications.
Morrow, B., & Baudo, L. (1987). Cousin Brucie: My Lifein Rock'n'Roll Radio. New York: Beech Tree Books.
Neff, J. (1992, December 28). LOcal Radio Agreements: the (Air) Wave ofthe Future. Greater Cincinnati Business Record, p. 1.
Noll, E. M. (1982). General Radiotelephone License Handbook (7th ed.).Indianapolis, IN: Howard W. Sams & Co.
Noll, R. G., Peck, M. J., & McGowan, J. J. (1973). Economic Aspects ofTelevision Regulation. Washington, DC: Brookings Institution.
Norback, C., & Norback, P. G. (Eds.). (1980). TV Guide Almanac. New
York: Ballantine Books.
Onaran, E. A. (Ed.) (1992). Broadcasting & Cable Market Place. NewProvidence, RI: R. R. Bowker.
Owen, B. M. (1973). Newspaper and Television Station Joint Ownership.
The Antitrust Bulletin, 18, 787-807.
Paeth, G. (1994, April 23). Getting a line on radio: Hungry Jacor hooksbig market share. Cincinnati Post, p. Bl.
Papazian, E. (Ed.) (1994). TV Dimensions. New York: Media Dynamics.
Pechman, J. A. (1987). Federal Tax Policy (5th ed.). Washington, DC:
Brooking Institution.
Radio Programming tunes in the satellite sound (1986. May 26).
Broadcasting, p. 69.
Rao, R. (1987). Financial Management. New York: Macmillan Publishing.
Rodrigues, R. (1984, October 12). Beaming in on SMN. Radio and Records,
p.49.
Radio Station Characteristics 31
Rosen, C. (1991, January 12). Recession good for Satellite Programmers.
Billboard, p. 16.
Rosenblum, R. H. (1994). Be a Resource, a Counselor, a Friend, Not Just
a Time Peddler. In R. Unmacht (Ed.) The M Street Radio Directory 1995 edition
(pp. 39-40). New York: M Street Corporation.
SMN's Heart and Soul; John S. Tyler (1985. December 2). Broadcasting, p.
127.
Unmacht, R. (Ed.). (1994). The M Street Radio Directory 1995 edition.
New York: M Street Corporation.
36.
When a network is not a network.... (1989. March 6). Broadcasting, p.
rt)BEST COPY AVAILABLE
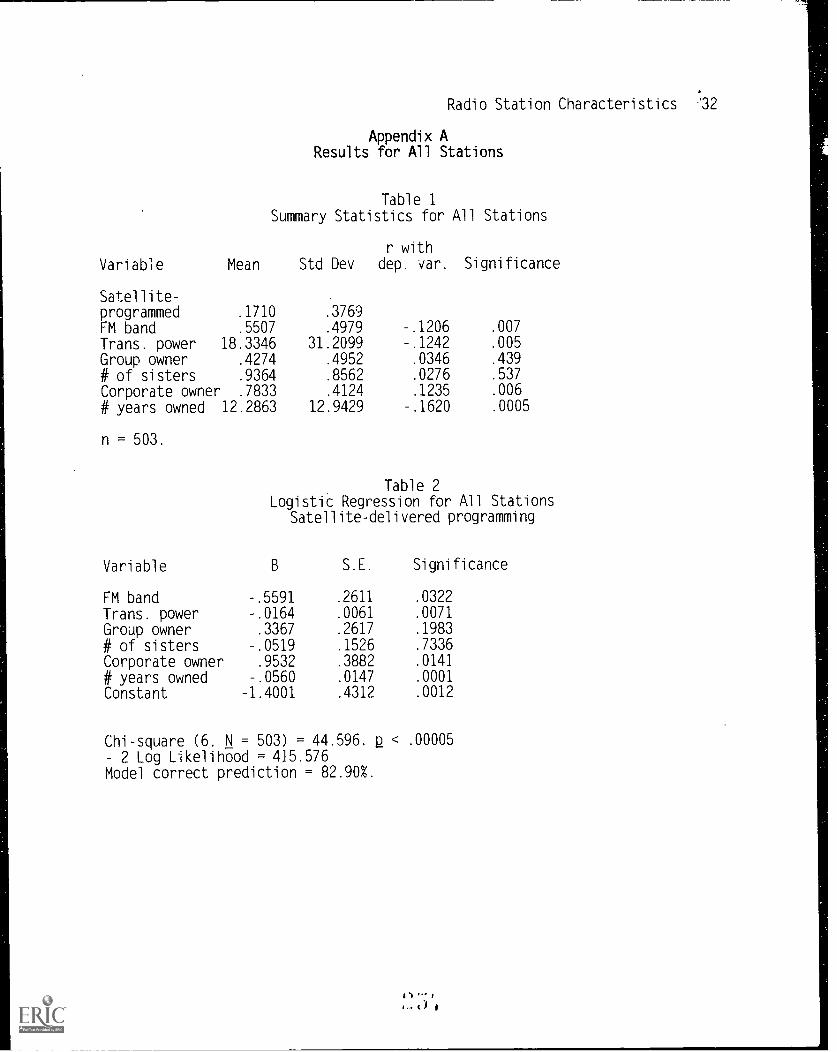
Variable
Radio Station Characteristics 12
Appendix AResults for All Stations
Table 1Summary Statistics for All Stations
r with
Mean Std Dev dep. var. Significance
Satellite-programmed .1710 .3769
FM band .5507 .4979 -.1206 .007
Trans. power 18.3346 31.2099 -.1242 .005
Group owner .4274 .4952 .0346 .439
# of sisters .9364 .8562 .0276 .537
Corporate owner .7833 .4124 .1235 .006
# years owned 12.2863 12.9429 -.1620 .0005
n = 503.
Table 2LogistiC Regression for All Stations
Satellite-delivered programming
Variable B S.E. Significance
FM band -.5591 .2611 .0322
Trans. power -.0164 .0061 .0071
Group owner .3367 .2617 .1983
# of sisters -.0519 .1526 .7336
Corporate owner .9532 .3882 .0141
# years owned -.0560 .0147 .0001
Constant -1.4001 .4312 .0012
Chi-square (6. N = 503) = 44.596. 2 < .000052 Log Likelihood = 415.576
Model correct prediction = 82.90%.
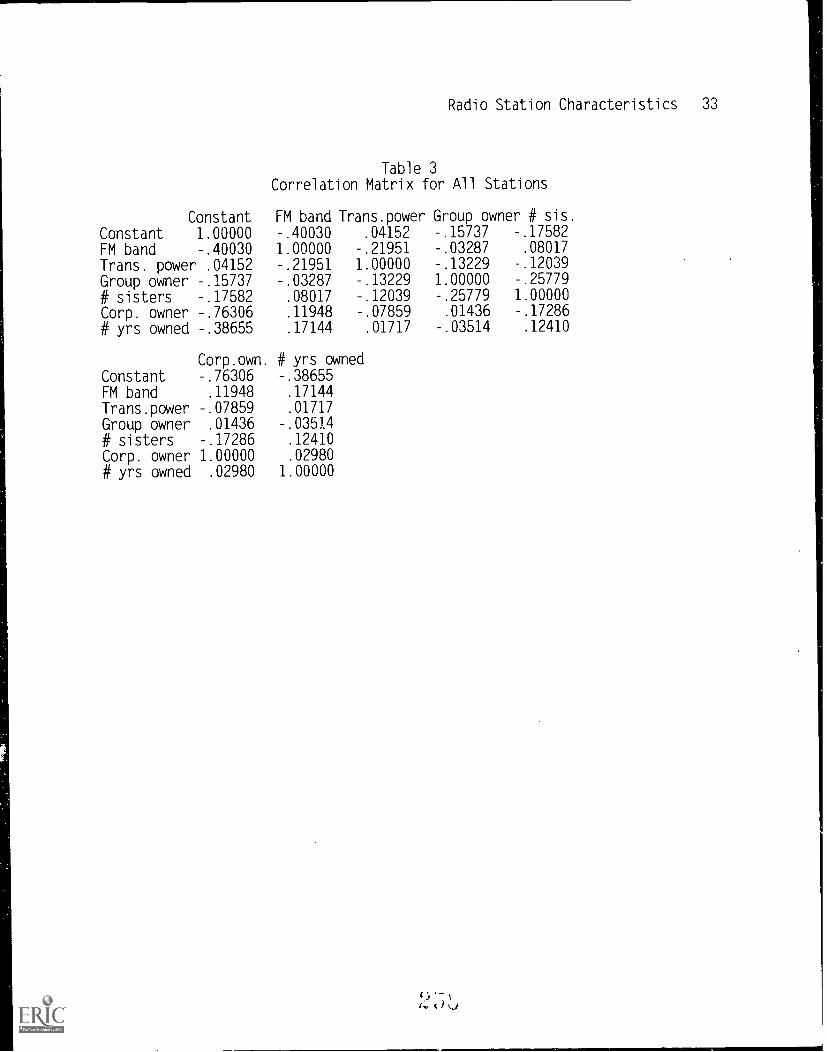
Constant
Radio Station Characteristics 33
Table 3Correlation Matrix for All Stations
FM band Trans.power Group owner # sis.
Constant 1.00000 -.40030 .04152 -.15737 -.17582
FM band -.40030 1.00000 -.21951 -.03287 .08017
Trans. power .04152 -.21951 1.00000 -.13229 -.12039
Group owner -.15737 -.03287 -.13229 1.00000 -.25779
# sisters -.17582 .08017 -.12039 -.25779 1.00000
Corp. owner -.76306 .11948 -.07859 .01436 -.17286
# yrs owned -.38655 .17144 .01717 -.03514 .12410
Corp.own.Constant -.76306FM band .11948
Trans.power -.07859Group owner .01436
# sisters -.17286Corp. owner 1.00000# yrs owned .02980
# yrs owned-.38655.17144.01717
-.03514.12410.02980
1.00000
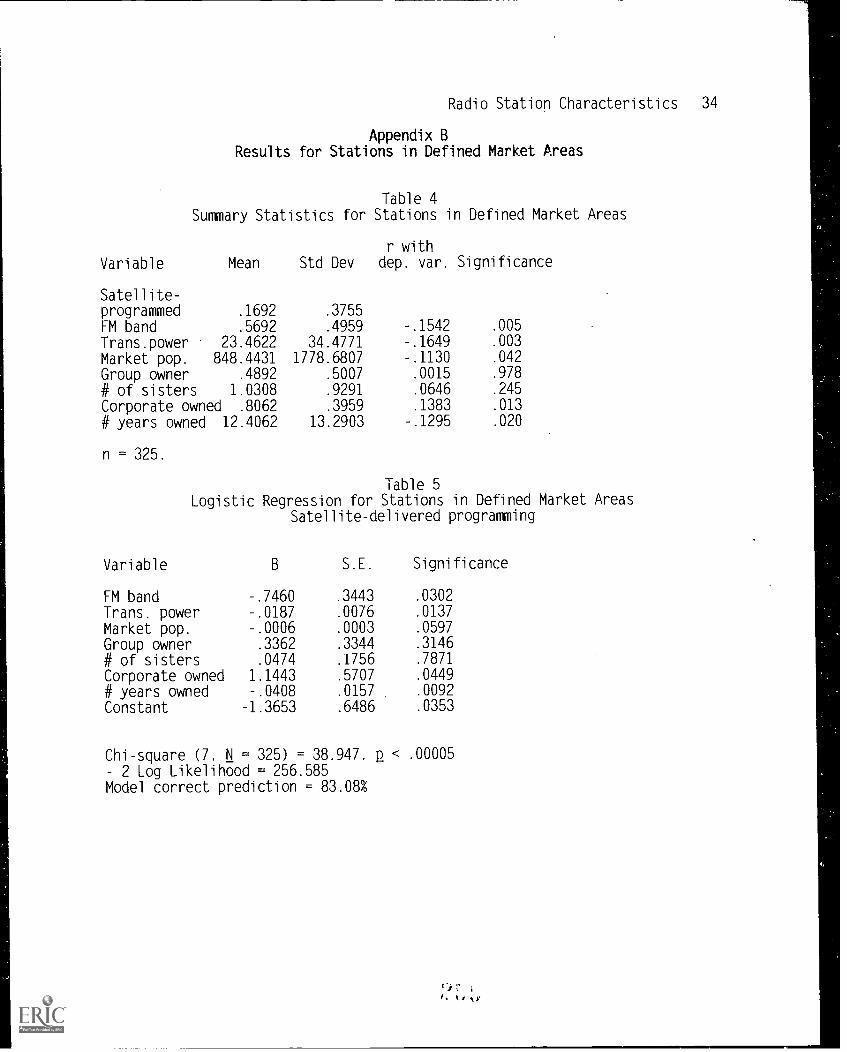
Radio Station Characteristics 34
Appendix BResults for Stations in Defined Market Areas
Table 4Summary Statistics for Stations in Defined Market Areas
Variable
Satellite-
Mean Std Devr with
dep. var. Significance
programmed .1692 .3755
FM band .5692 .4959 -.1542 .005
Trans.power 23.4622 34.4771 -.1649 .003
Market pop. 848.4431 1778.6807 -.1130 .042
Group owner .4892 .5007 .0015 .978
# of sisters 1.0308 .9291 .0646 .245
Corporate owned .8062 .3959 .1383 .013
# years owned 12.4062 13.2903 -.1295 .020
n = 325.
Table 5Logistic Regression for Stations in Defined Market Areas
Satellite-delivered programming
Variable B S.E. Significance
FM band -.7460 .3443 .0302
Trans. power -.0187 .0076 .0137
Market pop. -.0006 .0003 .0597
Group owner .3362 .3344 .3146
# of sisters .0474 .1756 .7871
Corporate owned 1.1443 .5707 .0449
# years owned -.0408 .0157 .0092
Constant -1.3653 .6486 .0353
Chi-square (7. N = 325) = 38.947, 2 < .00005
2 Log Likelihood = 256.585Model correct prediction = 83.082
4)1. i
I. 10
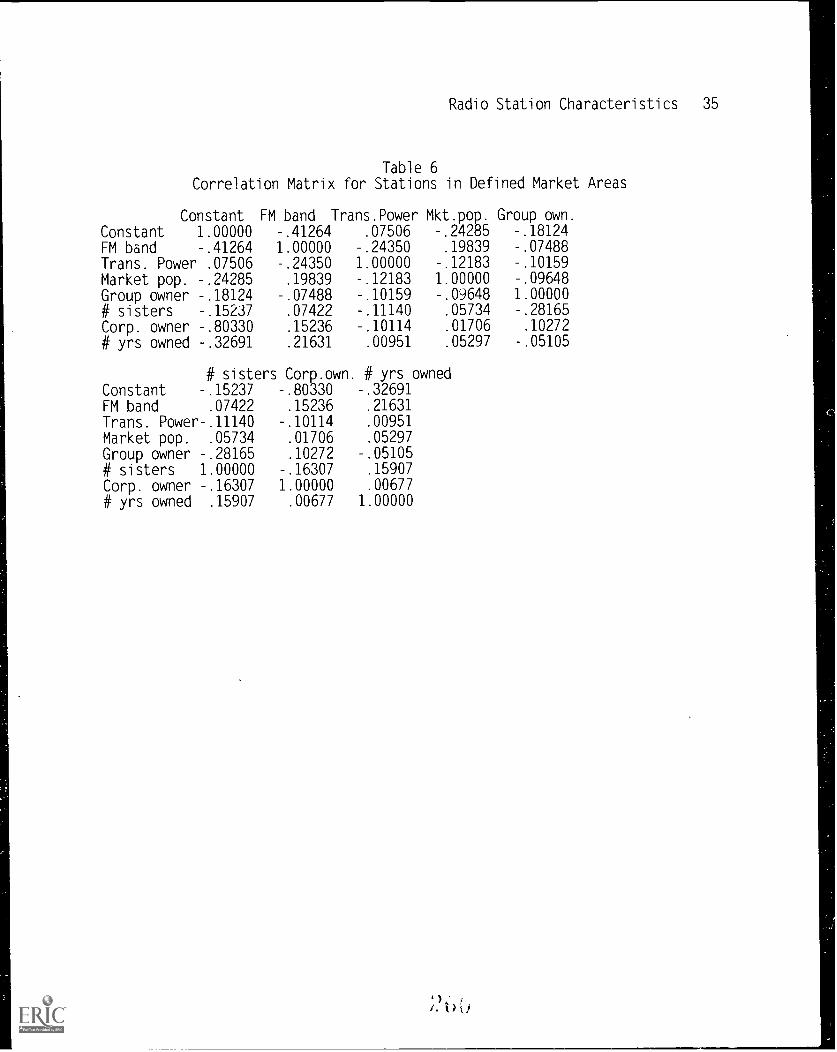
Radio Station Characteristics 35
Table 6Correlation Matrix for Stations in Defined Market Areas
Constant FM band Trans.Power Mkt.pop. Group own.Constant 1.00000 -.41264 .07506 -.24285 -.18124
FM band -.41264 1.00000 -.24350 .19839 -.07488
Trans. Power .07506 -.24350 1.00000 -.12183 -.10159
Market pop. -.24285 .19839 -.12183 1.00000 -.09648
Group owner -.18124 -.07488 -.10159 -.09648 1.00000
# sisters -.15237 .07422 -.11140 .05734 -.28165
Corp. owner -.80330 .15236 -.10114 .01706 .10272
# yrs owned -.32691 .21631 .00951 .05297 -.05105
# sisters Corp.own. # yrs ownedConstant -.15237 -.80330 -.32691
FM band .07422 .15236 .21631
Trans. Power-.11140 -.10114 .00951
Market pop. .05734 .01706 .05297
Group owner -.28165 .10272 -.05105
# sisters 1.00000 -.16307 .15907
Corp. owner -.16307 1.00000 .00677
# yrs owned .15907 .00677 1.00000
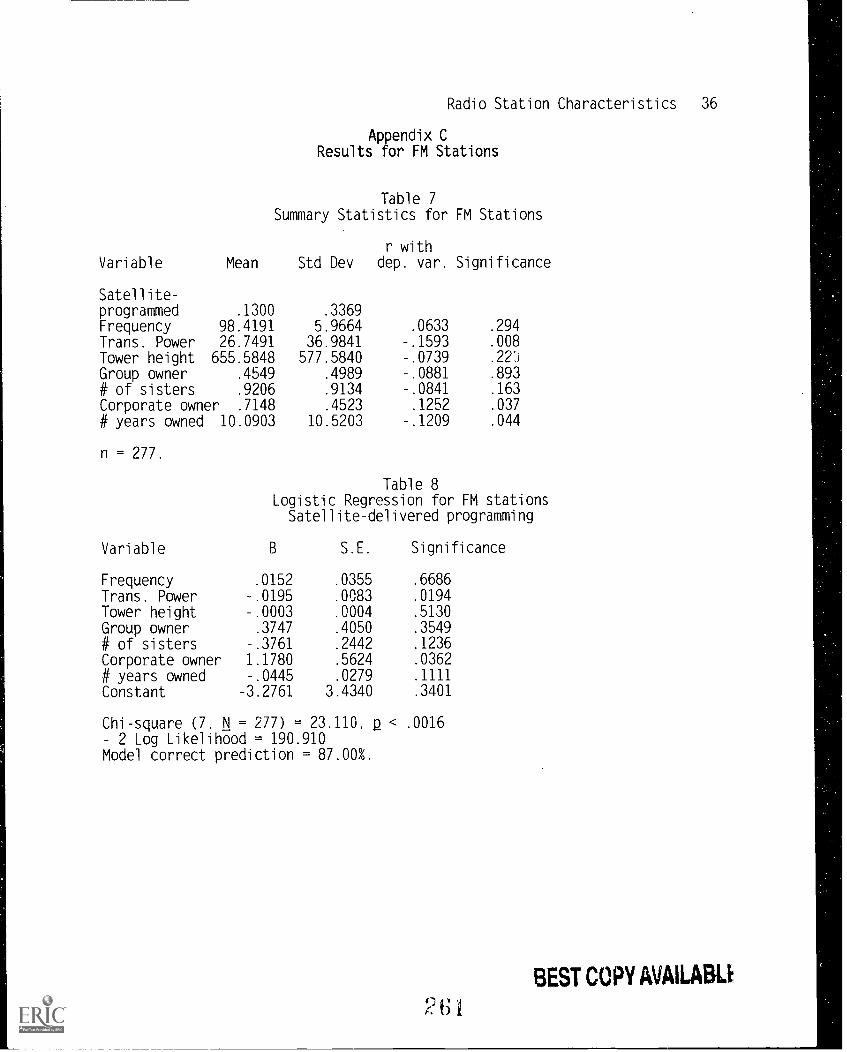
Radio Station Characteristics 36
Appendix CResults for FM Stations
Variable
Satellite-
Table 7Summary Statistics for FM Stations
r withMean Std Dev dep. var. Significance
programmed .1300 .3369Frequency 98.4191 5.9664 .0633 .294
Trans. Power 26.7491 36.9841 -.1593 .008
Tower height 655.5848 577.5840 -.0739 .22;)
Group owner .4549 .4989 -.0881 .893
# of sisters .9206 .9134 -.0841 .163
Corporate owner .7148 .4523 .1252 .037
# years owned 10.0903 10.5203 -.1209 .044
n = 277.
Table 8Logistic Regression for FM stationsSatellite-delivered programming
Variable S.E. Significance
Frequency .0152 .0355 .6686
Trans. Power -.0195 .0083 .0194
Tower height -.0003 .0004 .5130
Group owner .3747 .4050 .3549
# of sisters -.3761 .2442 .1236
Corporate owner 1.1780 .5624 .0362
ti years owned -.0445 .0279 .1111
Constant -3.2761 3.4340 .3401
Chi-square (7, N = 277) = 23.110, < .0016
2 Log Likelihood = 190.910Model correct prediction = 87.002.
BEST COPY AVAILABLE
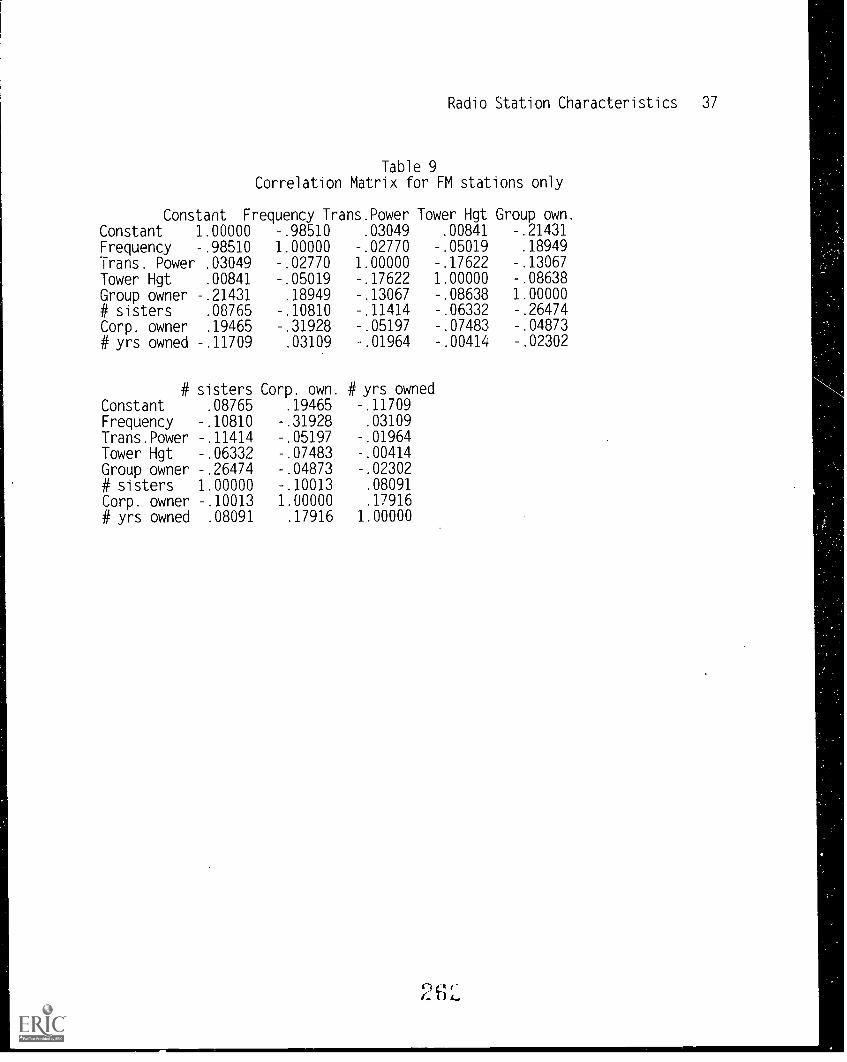
Radio Station Characteristics 37
Table 9Correlation Matrix for FM stations only
Constant Frequency Trans.Power Tower Hgt Group own.Constant 1.00000 -.98510 .03049 .00841 -.21431
Frequency -.98510 1.00000 -.02770 -.05019 .18949
Trans. Power .03049 -.02770 1.00000 -.17622 -.13067
Tower Hgt .00841 -.05019 -.17622 1.00000 -.08638
Group owner -.21431 .18949 -.13067 -.08638 1.00000
# sisters .08765 -.10810 -.11414 -.06332 -.26474
Corp. owner .19465 -.31928 -.05197 -.07483 -.04873
# yrs owned -.11709 .03109 -.01964 -.00414 -.02302
# sisters Corp. own.Constant .08765 .19465
Frequency -.10810 -.31928Trans.Power -.11414 -.05197Tower Hgt -.06332 -.07483Group owner -.26474 -.04873
# sisters 1.00000 -.10013Corp. owner -.10013 1.00000
# yrs owned .08091 .17916
# yrs owned-.11709.03109
-.01964-.00414-.02302.08091.17916
1.00000
1"-
c-.
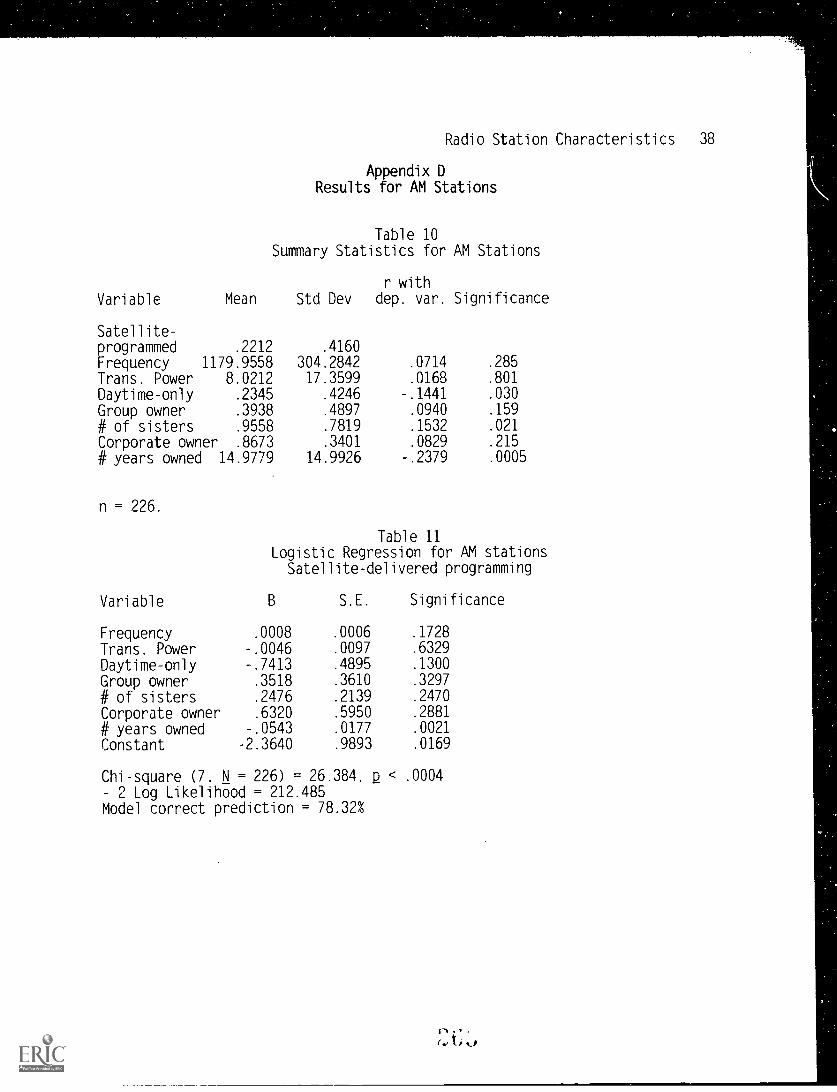
Radio Station Characteristics 38
Appendix DResults for AM Stations
Table 10Summary Statistics for AM Stations
r withVariable Mean Std Dev dep. var. Significance
Satellite-programmed .2212 .4160
Frequency 1179.9558 304.2842 .0714 .285
Trans. Power 8.0212 17.3599 .0168 .801
Daytime-only .2345 .4246 -.1441 .030
Group owner .3938 .4897 .0940 .159
# of sisters .9558 .7819 .1532 .021
Corporate owner .8673 .3401 .0829 .215
# years owned 14.9779 14.9926 -.2379 .0005
n = 226.
Table 11Logistic Regression for AM stationsSatellite-delivered programming
Variable B S.E. Significance
Frequency .0008 .0006 .1728
Trans. Power -.0046 .0097 .6329
Daytime-only -.7413 .4895 .1300
Group owner .3518 .3610 .3297
# of sisters .2476 .2139 .2470
Corporate owner .6320 .5950 .2881
# years owned -.0543 .0177 .0021
Constant -2.3640 .9893 .0169
Chi-square (7. N = 226) = 26.384. p < .0004
2 Log Likelihood = 212.485Model correct prediction = 78.32%
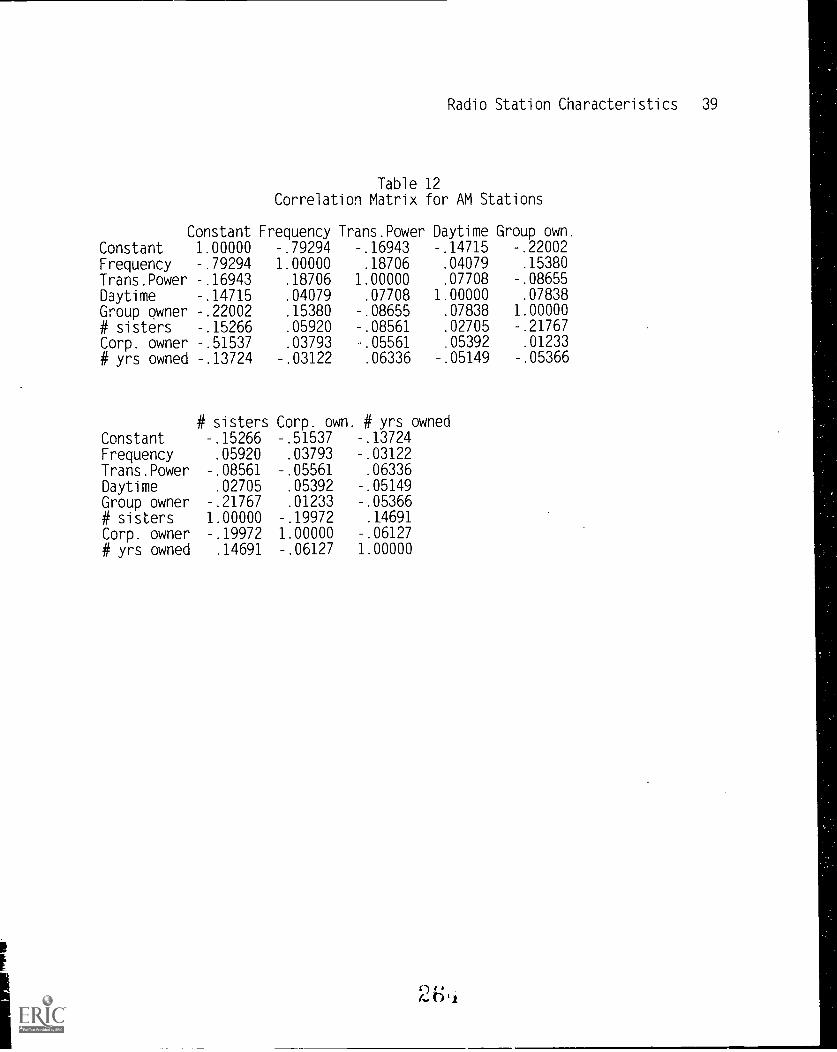
Radio Station Characteristics 39
Table 12Correlation Matrix for AM Stations
Constant Frequency Trans.Power Daytime Group own.Constant 1.00000 -.79294 -.16943 -.14715 -.22002
Frequency -.79294 1.00000 .18706 .04079 .15380
Trans.Power -.16943 .18706 1.00000 .07708 -.08655
Daytime -.14715 .04079 .07708 1.00000 .07838
Group owner -.22002 .15380 -.08655 .07838 1.00000
# sisters -.15266 .05920 -.08561 .02705 -.21767
Corp. owner -.51537 .03793 -.05561 .05392 .01233
# yrs owned -.13724 -.03122 .06336 -.05149 -.05366
# sisters Corp. own. # yrs ownedConstant -.15266 -.51537 -.13724
Frequency .05920 .03793 -.03122
Trans.Power -.08561 -.05561 .06336
Daytime .02705 .05392 -.05149
Group owner -.21767 .01233 -.05366
# sisters 1.00000 -.19972 .14691
Corp. owner -.19972 1.00000 -.06127
# yrs owned .14691 -.06127 1.00000
How Perceived Environmental Uncertainty InfluencesThe Marketing Orientation of U.S. Daily Newspapers
By Randal A. BeamSchool of JournalismIndiana University211 Ernie Pyle HallBloomington, IN 47405(812) 855-0725rabeamajournalism.indiana.edu
The use of readership research to shape editorial content is becoming increasingly commonat U.S. daily newspapers. This practice reflects a "marketing concept" of journalism, whichemphasizes tailoring a product to customers' wants and needs. Data from 78 daily newspaperssuggest that editors' uncertainty about their environment is a major influence on the strength of themarketing orientation of a newspaper. The data also suggest that uncertaint.y is not affected by
structural characteristics of the community in which the newspaper publishes.
Presented to the Media Management and Economics DivisionAssociation for Education in Journalism and Mass Communication
Annual ConventionAugust 1995 ,
Washington, D.C.
6/4/95How Perceived Environmental Uncertainty InfluencesThe Marketing Orientation of U.S. Daily Newspapers
The use of readership research' is becoming increasingly common in newspaper
newsrooms.' As daily newspapers have struggled to arrest a four-decade slide in household
penetration3and readership,4many have turned to readership research to learn what readers say
they want and need from their newspaper.5 Some papers then base content changes on the research
results. This reflects a "marketing concept" of journalism, which emphasizes tailoring a product
the newspaper to customers' wants and needs.
Adoption of a marketing orientation is not an altogether welcome development in U.S.
newsrooms. 6 Critics say it can lead to trivialized content and can diminish a newspaper's
commitment to public-affairs journalism. Journalists have linked a marketing orientation to a loss
of control over editorial decision-making and a decline in "professional" standards. Supporters
counter that newspapers need to have a strong marketing orientation ifthey are to survive and
prosper. They argue that a strong marketing orientation and public-service journalism are not
inherently contradictory.
This paper does not take sides in the argument about whether a marketing orientation is
good or bad for daily papers or society and, instead, focuses on forces that produce a strong
marketing orientation at a media organization. Drawing off of theories about complex
organizations, the paper argues that at newspapers at which editors experience high levels of
uncertainty about their organization's environment, a strong marketing orientation is most likely to
emerge. It examines this relationship using results of a survey of 167 editors at 78 U.S. daily
newspapers. It also explores relationships between community characteristics, environmental
uncertainty and a strong marketing orientation. The rapci purpose is to begin "unpacking" the
concept of a marketing orientation as it is applied at daily newspapers and to explore factors that
influence adoption of a marketing orientation at such papers. It is important to understand this
phenomenon because it bears directly on the kinds of information that daily newspapers choose to
publish. Though others have written about the development of a marketing orientation at daily
newspapers, they have tended to base their accounts on anecdotal experiences of a handful of
organizations. This paper goes beyond the anecdote, basing its findings on information collected
from a larger group of newspapers in a more systematic way. More broadly, these findings should
enhance what is known about the forces that shape the informaticn available to society, which has
berm a long-standing area of inquiry for media scholars.
2
Organizations and their environments
For more than five decades, organizational scholars have studied the relationship between
organizations and their environments.' Figuring out how to respond to, how to accommodate or
how to minimize uncertainty in that environment is a major task of people who manage
organizations, be they businesses, nonprofit institutions or government agencies.' The
environment is a concern because it is a source of both opportunities and dangers for an
organization. Failure to capitalize on an opportunity or to recognize a threat may hurt an
organization's performance or, in the long run, threaten its survival. As part of the process of
coping with the environment, managers spend considerable time and energy trying to monitor and
orchestrate relationships with important social actors in their organization's environment (e.g., end
users, suppliers, capital providers) because these relationships can be critical to the organization's
success.9 One of the managers' goals is to make these relationships more predictable that is,
less uncertain. Frequently, organizations focus on developing predictable relationships with end
users (customers) on the assumption that these relationships will influence the organization's long-
term success.
A Marketing Orientation
An organization that emphasizes meeting the wants and needs of end users can be said to
have a strong marketing orientation.w Kotler says the marketing concept "holds that the key to
achieving organizational goals consists of determining the needs and wants of target markets and
delivering the desired satisfactions more effectively and efficiently than competitors."" It assumes
that success is achieved by identifying the markets a firm wants to serve, determining what
customers in those markets seek with respect to the firm's products and developing a coordinated
program to meet those customers' wants and needs. A marketing orientation can be distinguished
from other basic business philosophies that emphasize, for example, production, product quality or
sales as central to an organization's success.
At news media organizations, the last decade has been one of great potential uncertainty,
particularly for those in the broadcast television and daily nev.spaper industries. Though daily
papers and broadcast TV continue to be the dominant carriers of news, entertainment and
advertising, their shares of audiences and advertising spending have eroded.'2 They face
formidable competitors (cable television, home video, direct mail and on-line services) in their core
3
businesses." And they glimpse new challengers (telephone and computer software companies) on
the horizon that would like to do what they do provide processed information to consumers.'4
Coincident with this changing environment, trade publications for the newspaper industry report a
growing emphasis on strengthening those organizations' marketing orientation by emphasizing
attention to readers' informational wants and needs. Articles have discussed how to "romance"
readers or how to use research to find out what readers say they want or need from their
newspaper. 15 Though newspapers have always paid attention to what readers want,'6 the practice
of using readership research to shape editorial content has become controversial forjournalists."
A strong ethic of public service has permeated the occupational culture of journalism, but this ethic
has rarely been defined in terms of identifying and meeting individual readers' wants and needs."
Rather, the public service ethic favors identifying and responding to broad social or Political needs,
which may or may not coincide with general informational wants and needs of readers or potential
readers. Some have framed a marketing orientation as antithetical to public-service journalism.'9
At a minimum, the use of readership (or market) research to shape editorial content is a new way
of doing business in many newsrooms.
A strong marketing orientation implies more audience influence on content decisions. It
stands in contrast to a "professional" decision-making model, which emphasizes dissemination of
information that journalists believe readers or viewers need to know. Under a strictly professional
decision-making model, journalists draw upon their expertise and training in deciding what
information their audience members must be given to negotiate their world; or, said another way,
the journalists control the information-selection process. A strong marketing orientation shifts the
focus away from the journalist's expertise and toward the reader's or viewer's informational
interests. News decision-making is based more on cues that audience members provide about what
they want or think they need from their newspaper or television station. A marketing orientation,
therefore, challenges the journalists' prerogative to unilaterally decide what's news. The
journalists, in effect, surrender some control over the information decision-making process. This
kind of deprofessionalization could be wrenching for an organization, which presumably would not
undertake it absent a compelling need.2°
The central hypothesis here is that conditions of high environmental uncertainty,
particularly with respect to readers or potential readers, provide that compelling need. A strong
marketing orientation will tend to emerge at daily newspapers at which editors are experiencing
high levels of uncertainty about their environment. Stated another way, as uncertainty about the
4
organization's environment increases specifically, uncertainty about readers an organization
will strengthen its marketing orientation. It will do so in an effort to make a crucial relationship
the relationship with its readers more predictable. Having a predictable relationship with
readers is essential to the long-term health of a newspaper because its readers are largely
responsible for revenue generation by the organization.2' They contribute directly to revenue
through purchase of the publication and indirectly to revenue when their attention is re-sold to
advertisers.
An additional task of this study is to explore other factors that may contribute both to
environmental uncertainty at a newspaper and to a stronger marketing orientation. Here, it is .
hypothesized that several characteristics of the organization's physical environment will lead to
editors perceiving high levels of uncertainty in their organization's environment. These same
factors may, as well, directly influence a strong marketing orientation.
Conceptual and operational definitions
Organization. The defmition of organization often is problematic because it's not
always clear where an organization ends and its environment begins. For this paper, Scott s
conceptual definition of organization is used. He defines organizations as systems of
interdependent activities linking shifting coalitions of participants in which the systems are
embedded in the environments in which they operate. 22 Because the focus of this research is news
decision-making, organization will be defined operationally as the news department of a firm
whose primary business is publication of a general-circulation daily newspaper.
Environmental uncertainty. The concept of environment has received much scholarly
attention. The research reflects two general ways of thinking about environment. One
conceptualizes an organization's environment as an objective, measurable reality that varies in
terms of its wealth, stability, heterogeneity and other so forth. The other conceptualizes
environment as a perceptual phenomenon essentially a mental construction of organizational
decision-makers. It assumes that for environmental factors to influence an organization's strategy
and structure, those factors first must be perceived by the organization's decision-makers. It
further assumes that the perceived environment can (and probably does) differ from the objective
environment, though it is the perceived environment that drives decision-making. Though the
perceived and objective environments aren't identical, neither are they unrelated. Indeed, the
objective environment presumably informs the perceived environment.
5
Both conceptualizations of environment as an objective reality and as a perceptual
phenomenon have been used widely in organizational research. A perception-based definition is
most appropriate here because this study examines the impact of the environment on an
organization's strategic decisions about news and information content. The perceived environment
is what managers would take into account in decision-making. Duncan has offered this classic
definition of the perceived environment, which is used here: The totality of the physical and social
factors that are taken directly into consideration in decision-making behavior of individuals in
an organization. 23
As a concept, uncertainty is as thorny as environment. Information theorists, decision
theorists and organizational scholars have embraced different conceptual approaches.24 Some have
treated the concept globally; others have identified specific dimensions or kinds of uncertainty.
The conceptual approach used here was adopted from Milliken, and it focuses on unceitinty as a
lack of predictability. She defines uncertainty as an individual's perceived inability to predict
something accurately.25
Environmental uncertainty, then, would be an individual's perceived inability to predict
something accurately about physical and social factors that are to be taken into consideration in
the individual's decision-making for the organization. Perceived environmental uncertainty
would be variable concept; that is, it would vary across individuals at a single point in time and
across time for a given individual.
These conceptualizations of environment and uncertainty present challenges for research in
which the organization is the unit of analysis. Both concepts are defined in terms of perceptions of
individuals in the organization. That raises questions about treating environmental uncertainty as
an organizational-level concept. Speaking strictly, an organization does not perceive; the
individuals who are part of the organization perceive. Organizations are, however, arenas for
collective activity, such as joint decision-making. If it is accepted that an organization's
environment can affect its decision-making, it seems reasonable to assume that senior managers
operate with some jointly held perceptions of that environment, presumably arising from their
collective experiences with the organization and its environment. These jointly held perceptions
would not be identical but should be similar and would constitute the organization's environment
for purposes of strategic decision-making. Indeed, data collected for this study suggest that
editors' perceptions of their environment are more similar than different.26
6
For this article, an index was constructed to assess the degree of environmental uncertainty
for a news department. The index was based on the responses of the editors surveyed, aggregated
by newspaper.27 Editors were asked to indicate their level of agreement with four statements about
the newspaper's "community." These statements probed the degree to which the editors believed
they knew what kinds of stories appealed to their community; felt they understood what the
community wanted in the newspaper; thought the kinds of people in the community had changed in
the last few years; and felt they knew what kind of role the newspaper played in the community.
The items were intended as a general measure of the degree to which the editors found their
community's informational wants and needs unpredictable. The responses of editors at a given
newspaper were averaged and summed to create the index. This created an organizational-level
estimate for each paper of its news department's perceived environmental uncertainty.
Marketing orientation. During the last decade, many newspaper firms (or their parent
companies) have dedicated themselves to becoming more customer-oriented.28 As stated above, a
marketing orientation is defmed conceptually as the degree to which achieving organizational
goals consists of determining the needs and wants of target markets and delivering the desired
satisfactions more effectively and efficiently than competitors. A news department's marketing
orientation should be reflected in its willingness to conduct and use readership reFearch to shape
editorial content, as opposed to relying solely on the "professional judgments" of reporters and
editors.29 Degree of marketing orientation is a variable that could vary across a group of papers at
a single point in time or for a single newspaper across time.
Four indices were used to assess different aspects of a newspaper's marketing orientation.
Three indices were based upon editors' responses to items asking about various categories of
content that newspapers publish. Specifically, the editors were asked to indicate the degree to
which readership research had influenced major decisions that the paper had made about
publishing that kind of content. Their responses were factor analyzed. The intent was to see if the
19 categories fell into coherent content dimensions. (It seemed possible that some kinds of content
might be more likely to be influenced by readership research than others.) Because of weak or
inconsistent factor loadings, four of the 19 content categories were eliminated from the final
solution. After removing those items, three relatively clean factors emerged from the analysis
(Table 1):
A Traditional Local Information Factor composed of content about local government,
other local affairs, neighborhood activities and local events calendars, as well as comics, sports and
7
"good news." This factor embraces, for the most part, the standard local content of most general-
circulation daily newspapers. This is clearly the case for content on local government, local
affairs, neighborhood affairs, local events calendars and much sperts and "good news." The
exception, of course, is comics. While not local, it is traditional .eare for most dailies.
A Traditional Non-local Information Factor composed of content about national and
international affairs. This factor embraces the standard non-local content of most general-
circulation dailies.
A Special-Interest Information Factor composed ofseveral kinds of content that trade
publications suggest newspapers have begun to emphasize relativelyrecently business, science,
personal health, personal finance, consumerism and entertainment. Trade publications suggest
newspapers are paying more attention to these kinds of content because of perceived 'reader
interest. Often, this content is directed at fairly specialized reader interests."
Results of the factor analysis were used to guide development ofthree organizational-level
indices on traditional local, traditional non-local and special-interestcontent.3' In creating these
indices, responses from editors within an organization were aggregated to create an organizational-
level "score" on each of the content-change items a score for a particular organization on a
particular item. These organizational-level indicators were summed to create the indices.
Presumably, organizations with the strongest marketing orientation would score highly on all three
indices the Traditional Local, Traditional Non-local and Special Interest indices.
The fourth index assessed the degree to which more-general content changes had been
made on the basis of readership research. This index was built from questions that asked editors to
assess the degree to which readership research had influenced changes in the paper's graphic
design, Page I content and beat structure, as well as its influence on decisions to emphasize and de-
emphasize recent certain kinds of content. Though these items were not subjected to content
analysis, the General Content Change Index was constructed in the same way as the three above.
Community Characteristics: The central relationship tested in this article is that a news
department's perceived uncertainty about its environment will lead to a stronger marketing
orientation. If support is found for that hypothesis, the questions then become, What are
antecedents of uncertainty, and what other factors influence a strong marketing orientation? The
hypotheses offered in the analyses that follow suggest that structural community characteristics
characteristics of the organization's objective environment produce uncertainty. Specifically,
8
these characteristics are hypothesized to potentially affect levels of perceived uncertainty and
marketing orientation:
The size of the community, measured by its 1990 population. The assumption is that
larger communities, which would tend to be complex and heterogeneous, would present a greater
source of uncertainty for editors than smaller communities, which would tend to be more
homogeneous than larger communities.
The education level of the community, as measured by the percentage of adults in the
community with college bachelor's degrees. The assumption is that more highly educated
communities would have more varied informational needs, which would tend to heighten editors
uncertainty about how to serve those needs.
The number of other general-circulation daily newspapers in the paper's home county.
The assumption is that in competitive environments, editors would have greater uncertainty about
how to effectively appeal to readers, who would have accessible alternative sources of
information.32
The percentage of the community population that is new to the area since 1985. The
assumption is that in-migration would tend to heighten uncertainty because the changing
community composition would make its informational needs less predictable to editors.
The percentage of minorities in the community. The assumption is that because
newspaper editors tend to be overwhelmingly white, 33 they would tend to be less able to predict
how to serve communities in which large segments of the population have different racial or
cultural backgrounds than theirs.
The degree to which the paper's circulation growth has kept pace with household growth
in the community. The assumption is that the failure of circulation to keep pace with household
growth would heighten uncertainty among editors about their understanding of the community's
informatjonal needs.
Method and Findings
The data analyzed in this article come from several sources. Information about the
organization's marketing orientation and its perceived environmental uncertainty is based on results
of the mail survey of editors, which was conducted during an ,c.ight-week period in 1991. Three-
hundred-and-sixty middle- and senior-level editors were contactecl at 100 U.S. daily newspaper
companies. The papers were selected using standard probability sampling techniques.34 Of the
9
360 editors contacted, 167 provided usable responses, for an individual response rate of 46.5
percent. These editors represented 78 newspaper firms, yielding an organizational response rate of
78 percent.35 The latter is the more critical figure, as the fmdings reported here describe
characteristics of the newspaper rather than of the individuals working at those newspapers.
Information on community characteristics was taken from the 1990 U.S. Census, except for data
about circulation performance. That was obtained from the Editor & Market Guide .36
Table 2 shows the means and standard deviations of variables included in the analyses that
follow. It also reports the reliability coefficients of the four content-change indices, which ranged
from acceptable (General Change and Perceived Environmental Uncertainty indices) to excellent
(Special Interest, Traditional Local, Traditional Non-Local content indices).
Path models were used to examine the impact of community characteristics and perceived
environmental uncertainty on the four content-change indices. This process was used to estimate
the path coefficients: Initial coefficients were computed for just-identified recursive models. The
models were trimmed of paths that did not meet or exceed the p < .10 significance leve1.37
Coefficients were re-estimated for these over-identified models. W, a goodness of fit statistic, was
computed for each mode1.38 The models are shown in Figures 1-4. Here is a summary of findings:
All four models explained a significant amount of variance in their dependent variables,
and no model needed to be discarded because the W statistic suggested a lack of fit.
In all four models, perceived environmental uncertainty had a significant positive effect
on a newspaper's marketing orientation, as predicted. That is, newspapers in environments of high
perceived uncertainty tended to be those most likely to report basing content decisions on
readership research.
In general, the structural community variables those indicators of the organization's
"objective" environment did not have a strong impact on perceived environmental uncertainty.
The single exception was competition from other daily newspapers. Its effect was positive, as
expected, at the p < .10 significance level. That is, as the number of other daily newspapers in the
paper's home county increased, so did perceived environmental uncertainty.
In three models, one of the structural community variables had a direct effect on a
marketing orientation indicator. In-migration had a positive effect on the use of readership
research to guide changes in traditional local and non-local content, and education had a positive
effect on the use of readership research to guide changes special-interest content.
10
Taken as a whole, the results support the central hypothesis of this study that perceived
environmental uncertainty positively affects the strength of the marketing orientation of daily
newspapers. As uncertainty about their community increases, editors collectively report a greater
likelihood that content decision-making is shaped by results of readership research, which
presumably seeks to measure readers' informational wants and needs. This is true for each of the
four indices of marketing orientation.
The results also suggest that while community structural characteristics can be associated
with a strong marketing orientation, this is relatively rare. Of the six structural characteristics
examined, only two education and the degree of in-migration into the community directly
affected any of the marketing-orientation indicators. In-migration was associated with the
influence of readership research on changes in traditional content. Because newspaper readership
tends to be associated with the strength of a reader's ties to his or her community,39 this
relationship might be expected. Newspapers in areas with relatively large numbers of new
residents, who presumably have relatively weak ties to their community, might strengthen their
marketing orientation to try to retain their audience. They may need to modify their content to
appeal to these newcomers, rzd readership research would provide guidance on how they might do
that. The data used in this study do not indicate how :he content at such newspapers was altered
just that it was. An over-time content analysis would give more insight into the nature of such
changes. The other important structural characteristic was education, which was associated with
the influence of readership research on special-interest content. This linkage is less obvious. It
may be that in communities with high education levels, newspapers confront an audience with a
more intricate set of informational wants and needs and with a capacity to fulfill those needs using
a variety of informational sources. This may stimulate a stronger marketing orientation as the
newspaper tries to adjust content to fit those needs. Also, many kinds of special-interest content
particularly that about science, business and personal finance are complicated, "high brow"
subjects that may he more attractive to a highly educated audience.
That said, the direct effect of structural characteristics is modest, and it may be best not to
make too much of it. Given that this was a fairly broad group of structural indicators, it would be
hard to argue that a newspaper's objective environment tended to influence greatly the development
of a stronger marketing orientation. Ncither did the objective environment appear to influence
perceived environmental uncertainty. Only the fairly crude indicator of competition showed any
correspondence with the Perceived Environmental Uncertainty Index, and this was the weakest
1 1
reported relationship found among all those tested. Though these findings may be surprising to
some, others have noted a lack of direct correspondence between objective and perceived
environments.40 While no one argues that individuals create their perceived environment from
whole cloth, for the objective environment to matter its cues must be perceived and interpreted by
an individual. Downey and Slocum4' argue that a variety of cognitive and social factors intervene
in this process to shape an organization member's perception of the environment. These factors
could account for the lack of influence that characteristics of the objective environment had on
editors' perceived uncertainty about their community. One need in future research is to explore
more fully the connections between a newspaper's objective environment, the objective
environment as perceived by editors, the editors' level of uncertainty about the environment and
factors that influence editors' perceptions about the environment.
In future studies, improvements also need to be made in conceptualization and
measurement to gain a stronger understanding of the relationship between uncertainty, the
environment and the strength of a media organization's marketing orientation. Specifically:
A more refined defmition of environmental uncertainty is necessary. Milliken has
suggested treating environmental uncertainty as multidimensional concept, not a unidimensional
concept, as was done in this paper.42 She distinguishes among three types of environmental
uncertainty state uncertainty, which pertains to perceived conditions of the environment; effect
uncertainty, which speaks to concerns about the potential impact of environmental conditions on
the organization; and response uncertainty, which addresses concerns about how an organization
might respond to environmental conditions. A more complex conceptualization of environmental
uncertainty may yield a better understanding about its effect on development of a strong marketing
orientation.
It may be helpful to treat the environment as multidimensional, too. That is, it may be
useful to think of a news department as having several environments -- its community of readers
or potential readers (as in this study), its firm, its parent corporation, its financial backei Each
group may constitute a component of the department's environment; some may be important
antecedents of uncertainty for newsroom managers, others may not.
A better understanding of factors that intervene to shape a newsroom manager's
perception of the mvironment is also essential. Presumably this would enhance our understanding
of the relationship between the objective environment and the perceived environment.
12
Methodologically, a broader set of indicators is needed to assess perceived environmental
uncertainty. The reliability of the Perceived Environmental Uncertainty Index was marginally
acceptable. A refined conceptual definition, of course, should help in the creation of improved
operationalizations.
Finally, exploring content differences between newspapers with weak and strong
marketing orientations is necessary to understand the impact that a strong marketing orientation
has on information available to society. Much is made of the presumed link between a marketing
orientation and public-service journalism at daily newspapers.' Virtually nothing is known about
this connection from systematic study including whether the link exists at all.
The limitations of this study aside, the results do provide evidence that newspapers differ
in the strength of their marketing orientation; that readership research may not influence all content
decisions uniformly; and that perceived environmental uncertainty appears to be an important
consideration in understanding the development of stronger marketing orientation at daily papers.
In those ways, the study does contribute to our understanding about the array of organizational
factors that affect how news is manufactured in society today.
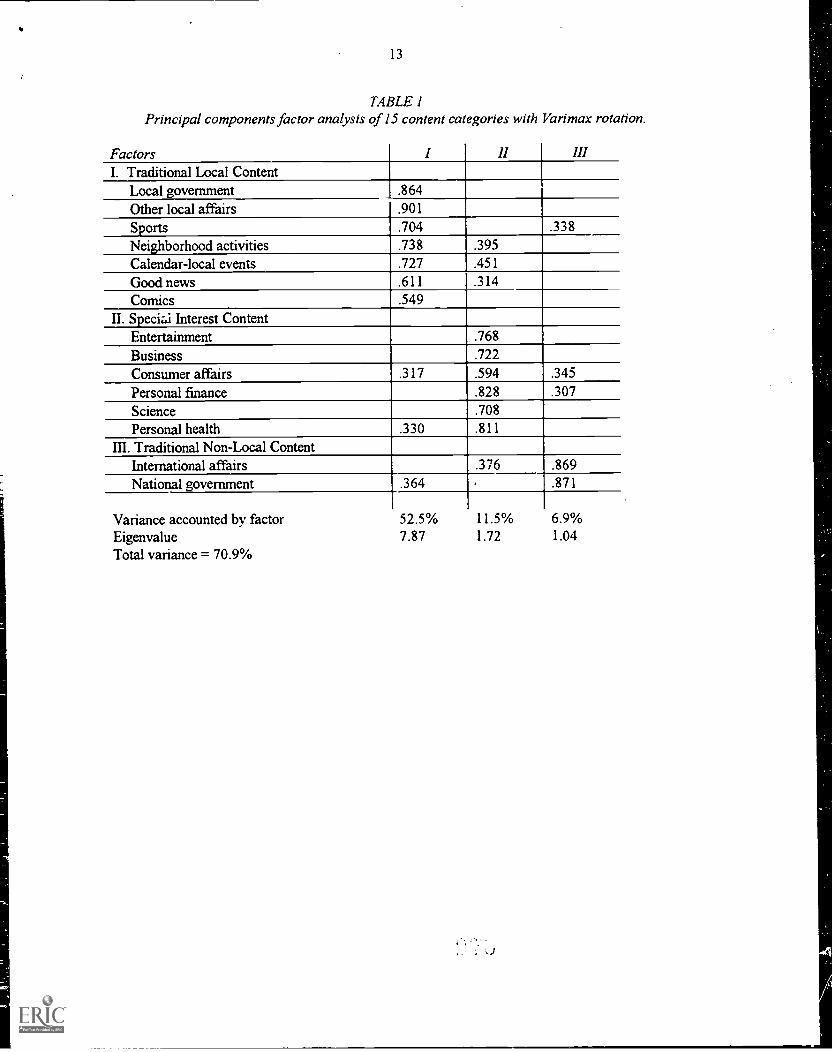
13
TABLE IPrincipal components factor analysis of 1 5 content categories with Varimax rotation.
Factors I II IIII. Traditional Local Content
Local government .864
Other local affairs .901
Sports .704 .338
Neighborhood activities .738 .395
Calendar-local events .727 .451
Good news .611 .314
Comics .549II. Speciz.i Interest Content
Entertainment .768
Business .722
Consumer affairs .317 .594 .345
Personal finance .828 .307
Science .708
Personal health .330 .811
III. Traditional Non-Local ContentInternational affairs .376 .869
National government .364 871
Variance accounted by factor 52.5% 11.5% 6.9%Eigenvalue 7.87 1.72 1.04
Total variance = 70.9%
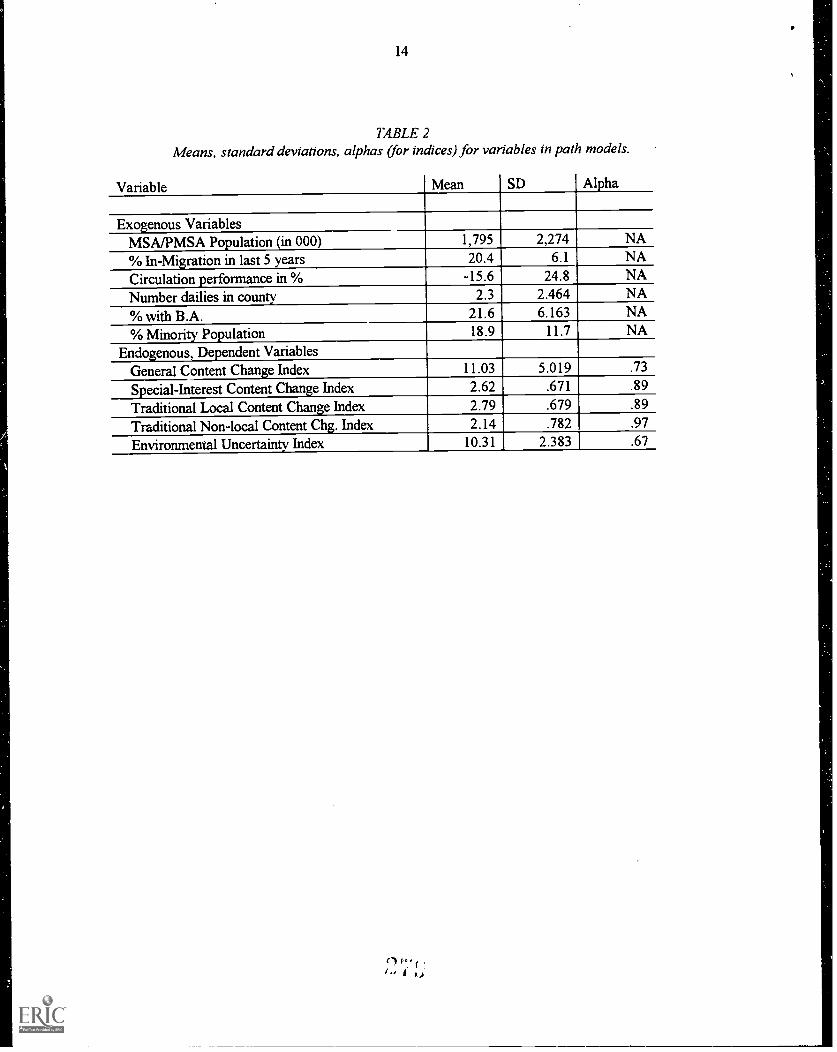
14
TABLE 2Means, standard deviations, alphas (for indices) for variables in path models.
Variable Mean SD Alpha
Exogenous VariablesMSA/PMSA Population (in 000) 1,795 2,274 NA
% In-Migration in last 5 years 20.4 6.1 NA
Circulation performance in % -15.6 24.8 NA
Number dailies in county 2.3 2.464 NA
% with B.A. 21.6 6.163 NA
% Minority Population 18.9 11.7 NA
Endogenous, Dependent VariablesGeneral Content Change Index 11.03 5 .019 .73
Special-Interest Content Change Index 2.62 .671 .89
Traditional Local Content Change Index 2.79 .679 .89
Traditional Non-local Content Chg. Index 2.14 .782 .97
Environmental Uncertainty Index 10.31 2.383 .67
pt.jf
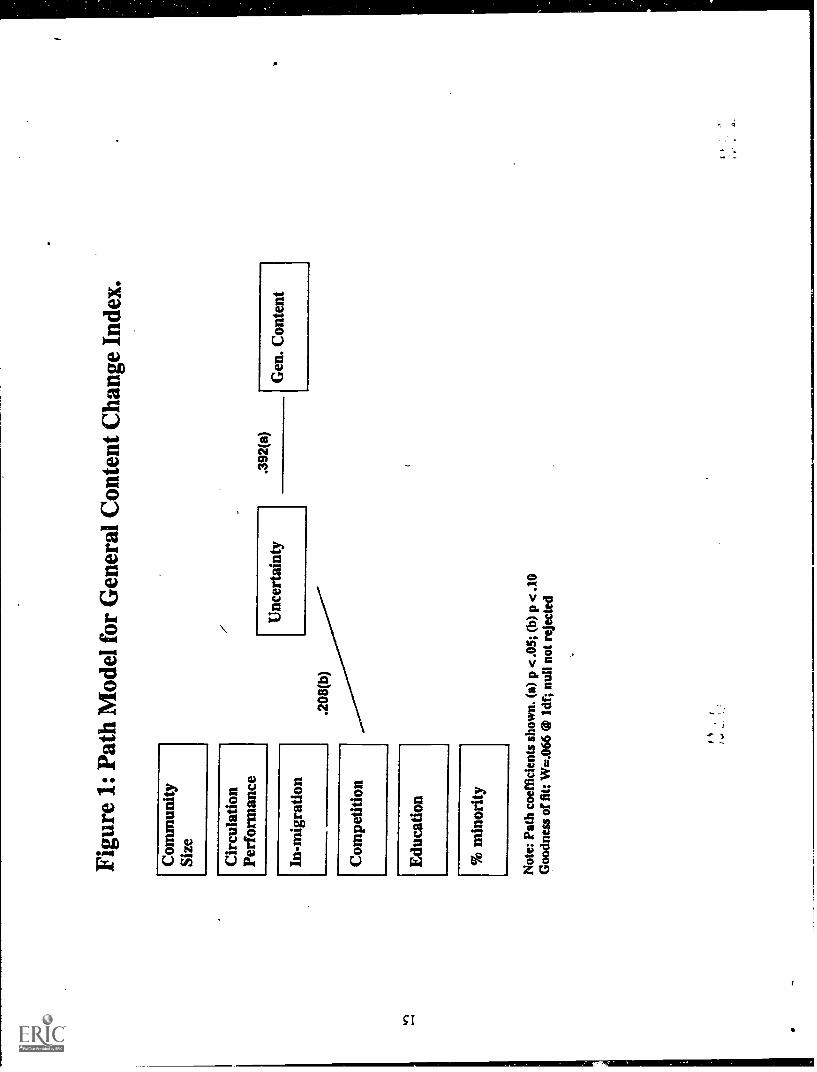
Figu
re 1
: Pat
h M
odel
for
Gen
eral
Con
tent
Cha
nge
Inde
x.
Com
mun
itySi
ze
/C
ircu
latio
nPe
rfor
man
ce.3
92(a
)U
ncer
tain
tyG
en. C
onte
ntIn
-mig
ratio
n
.208
(b)
Com
petit
ion
Edu
catio
n
% m
inor
ity
Not
e: P
ath
coef
fici
ents
sho
wn.
(a)
p <
.05;
(b)
p <
.10
Goo
dnes
s of
fit:
W=
.066
@ ld
f; n
ull n
ot r
ejec
ted
..
i
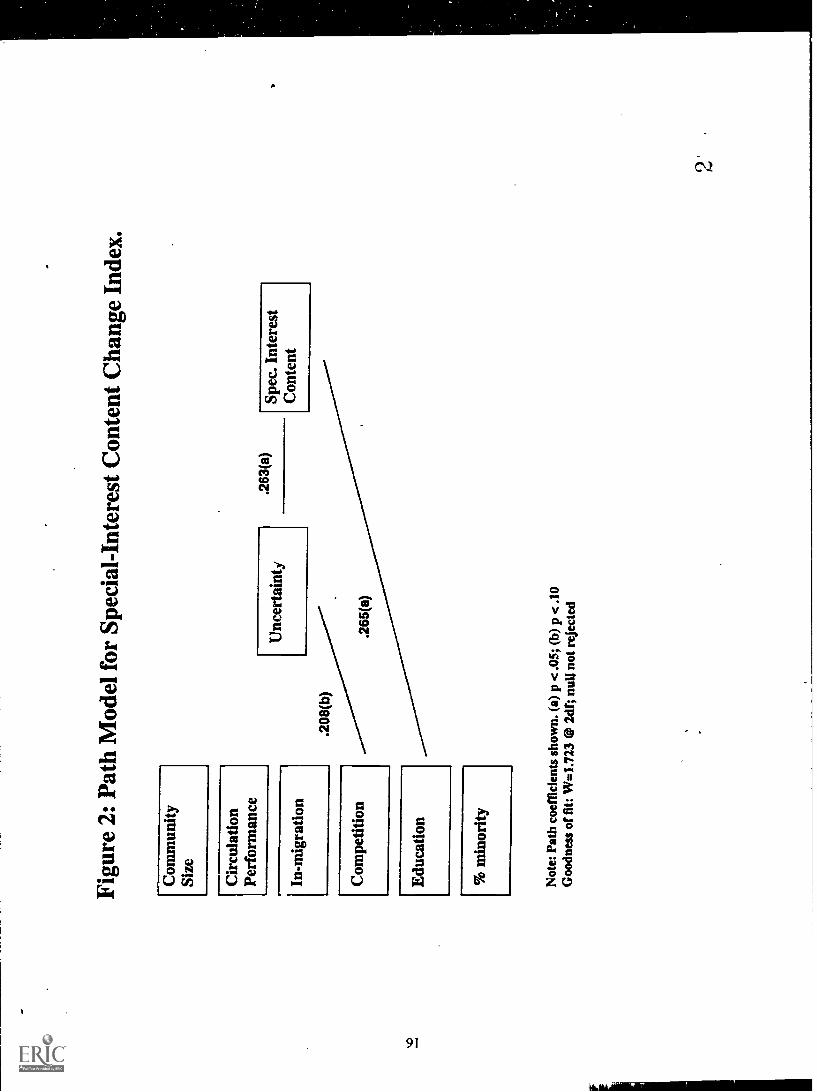
Figu
re 2
: Pat
h M
odel
for
Spe
cial
-Int
eres
t Con
tent
Cha
nge
Inde
x.
[Com
mun
itySi
ze
.208
(b)
.263
(a)
rPCir
cula
tion
erfo
rman
ce
Unc
erta
inty
Spec
. Int
eres
tC
onte
nt
1
In-m
igra
tion
.265
(a)
Com
petit
ion
Edu
catio
n
% m
inor
ity
Not
e: P
ath
coef
fici
ents
sho
wn.
(a)
p <
.05;
(b)
p <
.10
Goo
dnes
s of
fit:
W=
1.72
3 @
2df
; nul
l not
rej
ecte
d
,
2'
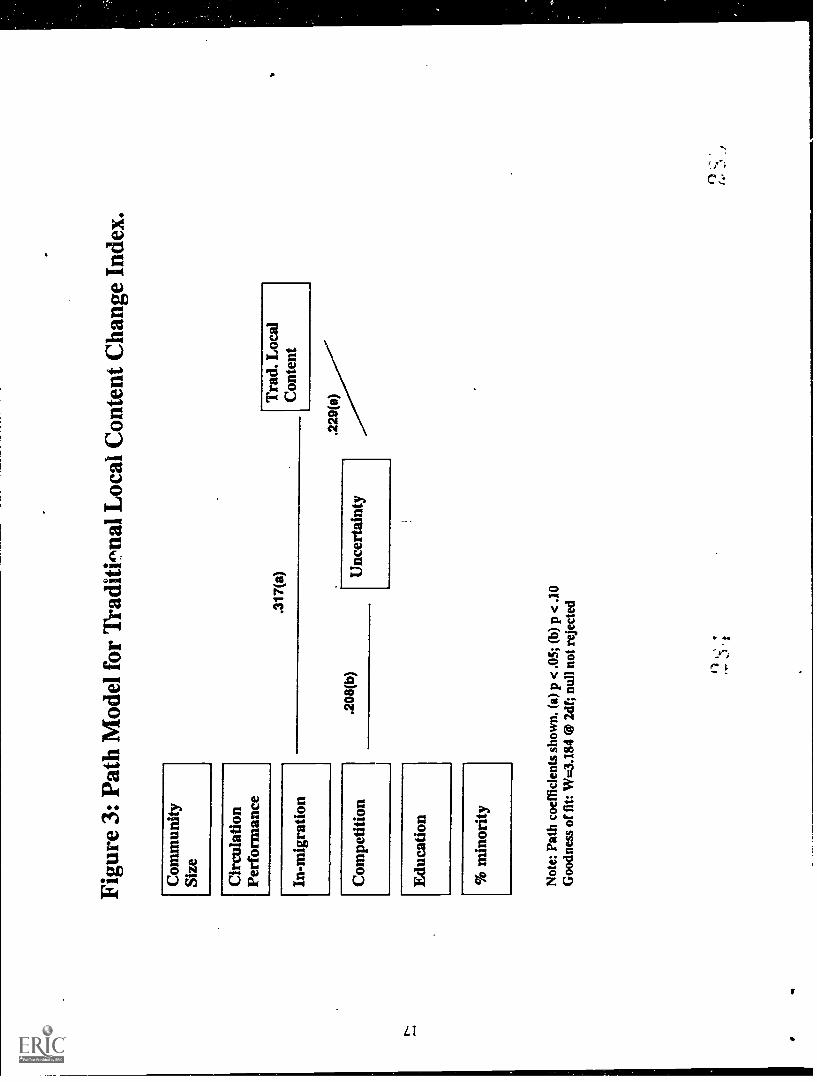
Figu
re 3
: Pat
h M
odel
for
Tra
ditio
nal L
ocal
Con
tent
Cha
nge
Inde
x.
Com
mun
itySi
ze
Cir
cula
tion
Perf
orm
ance
1
In-m
igra
tion
Com
petit
ion
Edu
catio
n
% m
inor
ity
.317
(a)
.208
(b)
Unc
erta
inty
Not
e: P
ath
coef
fici
ents
sho
wn.
(a)
p <
.05;
(b)
p <
.10
Goo
dnes
s of
lit:
W=
3.18
4 0
2dt;
null
not r
ejec
ted
Tra
d. L
ocal
Con
tent
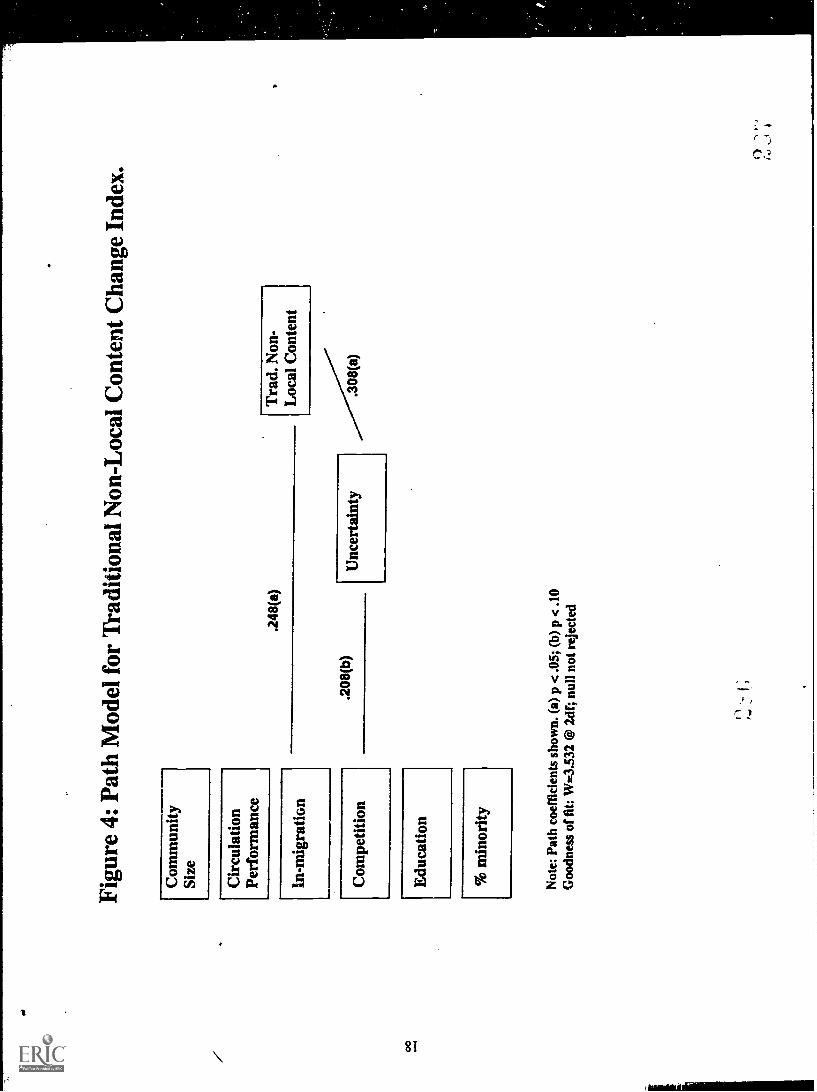
Figu
re 4
: Pat
h M
odel
for
Tra
ditio
nal N
on-L
ocal
Con
tent
Cha
nge
Inde
x.
Com
mun
ity 1
Size
Cir
cula
tion
Perf
orm
ance
.248
(a)
Tra
d. N
on-
Loc
al C
onte
nt[I
n-m
igra
tion
.208
(b)
.308
(a)
Unc
erta
inty
Com
petit
ion
Edu
catio
n
% m
inor
ity
Not
e: P
ath
coef
fici
ents
sho
wn.
(a)
p <
.05;
(b)
p <
.10
Goo
dnes
s of
fit:
W=
3.53
2 O
P 2d
f; n
ull n
ot r
ejec
ted

19
Readership research is one kind of market research.
John C. Schweitzer, "Marketing Research in the Newspaper Business." in Readings in Media
Management, Stephen Lacy, Ardyth Solm and Robert Giles, eds. (Columbia, SC: Media Management and
Economics Division of the Association for Education in Journalism and Mass Communication,
1992),153-180. Doug Underwood, nen MBA 's Rule the Newsroom (New York: Columbia University
Press, 1993). 110, 111-116; John H. McManus, Market-Driven Journalism: Let the Citizen Beware
(Thousand Oaks, CA: Sage Publications, 1994), 6-7.3 Don R. Pember, Mass Media in America, 6th (New York: Macmillan, 1992), 127.
4 Philip Meyer, The Newspaper Survival Handbook: An Editor 's Guide to Marketing Research
(Bloomington, IN: Indiana University Press, 1985), 8-10.
Larry S. Lowe and George deTarnowsky, "Newspaper Research: A Growing Consultant
Opportunity," Journal of Professional Marketing Services 10, No. 1 (December 1993), 45-54.
6Underwood, When MBAs Rule the Newsroom, 14-25; McManus, Marka-Driven Journalism, 1-
16.7 The environment plays a key role in open-systems models of organizations. For an extended
discussion on organizations and their environments, see W. Richard Scott. Organizations: Rational,
Natural and Open Systems, 3rd (Englewood Cliffs, NJ: Prentice-Hall, 1992). 123-316.
8 John Child, "Organizational Structure, Environment and Peiformance: The Role of Strategic
Choice," Sociology 6, No. 1 (January 1972): 2-22; Richard L. Daft and Karl E. Weick, "Toward a Model
of Organizations as Interpretation Systems," Journal of Management Review 9, No. 2 (1984): 284-295;
Gregory G. Dess and Nancy K. Origer, "Environment, Structure and Consensus in Strategy Formation: A
Conceptual Integration, "Academy of ManagementReview 12, No. 2 (1987): 313-330; H. Kirk Downey
and John W. Slocum, "Uncertainty: Measures, Research, and Sources of Variation," Academy ofManagement Journal 18, No. 3 (September 1975): 562-578; H. Kirk Downey, Don Hellriegel and John
W. Slocum Jr., "Environmental Uncertainty: The Construct and Its Application," Administrative Science
Quarterly 20, No. 4 (December 1975): 613-629; Robert B. Duncan, "Characteristics of Organizational
Environments and Perceived Environmental Uncertainty," Administrative Science Quarterly 17, No. 3
(September 1972): 313-327; Barbara W. Keats, "A Causal Model of Linkages Among Environmental
Dimensions, Macro Organizational Characteristics and Performance," Academy of Management Journal
31, No. 3 (September 1988): 570-598; Christine S. Koberg and Gerardo R. Ungson, "The Effects of
Environmental Uncertainty and Dependence on Organizational Structure and Performance: A
Comparative Study," Journal of Management 13, No. 4 (1987): 725-737; Angeline W. McArthur and
Paul C. Nystrom. "Environmental Dynamism, Complexity, and Munificence as Moderators of Strategy-
Performance Relationships," Journal of Business Research 23, No. 4 (December 1991): 349-361; Edwin
A. Gerloff, Nan Kanoff Muir and Wayne Bodensteiner, "Three Components of Perceived Environmental
Uncertainty: An Exploratory Analysis of the Effects of Aggregation," Journal of Management 17, No. 4
(1991): 749-768; Paul R. Lawrence and Jay W. Lorsch, Organization and Environment (Homewood, IL:
Richard D. Irwin, 1967); Donald L. McCabe, "The Assessment of Perceived Environmental Uncertainty
and Economic Performance," Human Relations 43, No. 12 (1990): 1203-1218; Raymond E. Miles,
Charles C. Snow and Jeffrey Pfeffer, "Organization-Environment: Concepts and Issues," Industrial
Relations 13, No. 3 (1974): 244-264; Danny Miller and Peter H. Friesen," Strategy-Making and
Environment: The Third Link," Strategic Management Journal 4, No. 3 (1983): 221-235; Frances J.
Milliken, "Perceiving and Interpreting Environmental Change: An Examination of College
Administrators' Interpretation of Changing Demographics," Academy of Management Journal 33, No. 1
(1990): 42-63; Frances J. Milliken, "Three Types of Perceived Uncertainty About the Environment: State.
Effect, and Response Uncertainty," Academy ofManagement Review 12, No. 1 (1987): 133-143; Delbert
M. Nebecker, "Situational Favorability and Perceived Environmental Uncertainty: An Integrative
Approach," Administrative Science Quarterly 20, No. 2 (June 1975): 281-294; Robert D. Russell and
Craig Russell, "An Examination of the Effects of Organizational Norms, Organization Structure and
Environmental Uncertainty on Entrepreneurial Strategy," Journal of Management 18, No. 4 (1992): 639-
r I
,

20
656; Mark P. Sharfman and James W. Dean Jr., "Conceptualizing and Measuring the OrganizationalEnvironment: A Multidimensional Approach," Journal of Management 17, No. 4 (1991): 681-700.
9 Francis J. Aguilar, Scanning the Business Environment (New York: Macmillan, 1967); DanielF. Jennings and James R. Lumpkin, "Insights Between Environmental Scanning Activities and Porter'sGeneric Strategies: An Empirical Analysis," Journal ofManagement 18, No. 4 (December 1992): 791-803; Danny Miller, "Environmental Fit vs. Internal Fit," Organization Science 3, No. 2 (1992): 159-178;William L. Renfro and James L Morrison, "Detecting Signals of Change: The Environmental ScanningProcess," The Futurist 28, No. 4 (August 1984): 49-53; Ram Subramanian, Nirmala Fernandes and EarlHarper, "Environmental Scanning in U.S. Companies: Their Nature and Their Relationship toPerformance," Management International Review 33, No. 3: 271-286; Henry Tosi, Ramon Aldag andRonald Storey, "On the Measurement of Environment: An Assessment of Lawrence and Lorsch'sEnvironmental Uncertainty Subscale," Administrative Science Quarterly 18, No. 1 (March 1973): 27-36;Rosalie L. Twig, "Dimensions of Organizational Environments: An Exploratory Study of Their Impact onOrganization Structure," Academy of Management Journal 22, No. 4 (December 1979): 672-693.
1° Morgan P. Miles and Danny R. Arnold, "The Relationship between Marketing Orientation andEntrepreneurial Orientation," Entrepreneurship Theory and Practice 15, No. 4 (1991): 49-65; PhilipKotler, Marketing Management: A. Planning, Implementation and Control, ith (Englewood Cliffs,
NJ: Prentice Hall, 1991), 4.11Kotler, Marketing Management, 16.12 Veronis, Suhler & Associates, The Veronis, Suhler & Associates Communications Industry
Forecast, 8th (New York: Veronis, Suhler & Associates, 1994).13 Veronis, Suhler & Associates, The Veronis, Suhler & Associates Communications Industry
Forecast.14 Wilson P. Dizard Jr., Old Media/New Media: Mass Communications in tho Information Age
(New York, Longman, 1994).15M.L. Stein, "Re-establisiiing Relevance for Readers," Editor & Publisher, March 5, 1994, 16-
17; Robert G. Picard, "Research and Development Still Misses Its Mark," Editor & Publisher, December19, 1992, 46-47, 56; Tim Triplett, "Marketing Research Guides Paper's Pulitzer-Winning Series,"Marketing News, May 23, 1994, 1,5; Mark Fitzgerald, "25/43 Project a Reader Success," Editor &Publisher, October 26, 1991, 10, 39; George Garneau, "Reaching 'At Risk' and 'Potential' Readers,"Editor & Publisher, May 4, 1991, 14-15,110; M.L. Stein, "Research for the Newsroom," Editor &Publisher, April 27, 1991, 15,18; Mary Alice Bagby, "Transforming Newspapers for Readers," presstime,April 1991, 18-25; Gene Goltz, "Reviving a Romance With Readers Is the Biggest Challenge for ManyNewsplpers," presstirne, February 1988, 16-22.
16 Audience interest is often listed as an important news value. See, for example, MelvinMencher, News Reporting and Writing (Dubuque, IA: William C. Brown, 1984,, 68.
17 Underwood, When MBA 's Rule the Newsroom, Xiii-XV.18 Commission on Freedom of the Press, A Free and Responsible Press (Chicago: The University
of Chicago Press, 1947); Stephen Klaidman and Tom L. Beauchamp, The Virtuous Journalist (New York:O:dord University Press, 1987).
19 Underwood, When MBAs Rule the Newsroom, 1993; Doug Underwood and Keith Stamm,"Balancing Business With Journalism: Newsroom Policies at 12 West Coast Newspapers," JournalismQuarterly 69, No. 2 (Summer 1992): 301-317.
20 For a discussion of this concept of professionalism, see Randal A. Beam, "JournalismProfessionalism as an Organizational-Level Concept," Journalism Monographs No. 121 (June 1990).
21 Jon Udell, The Economics of the American Newspaper (New York: Hastings House, 1978), 26.22 Scott, Organizations: Rational, Natural and Open Systems, 25.23Duncan, "Characteristics of Organizational Environments," 314.24Duncan, "Characteristics of Organizational Environments," 317.25Milliken, "Three Types of Perceived Uncertainty," 136.26 One way to assess the homogeneity of responses among editors at a given newspaper is to
conduct one-way analyses of variance on the items in which editors were asked about their perceptions of
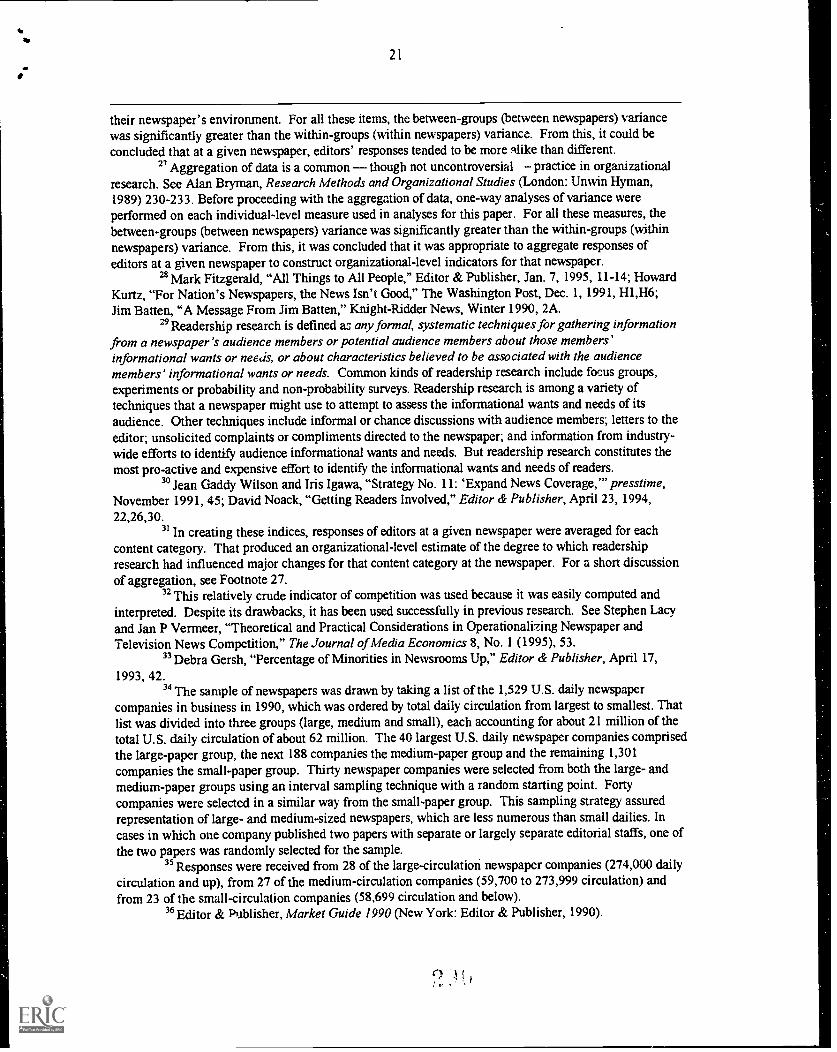
21
their newspaper's environment. For all these items, the between-groups (between newspapers) variancewas significantly greater than the within-groups (within newspapers) variance. From this, it could beconcluded that at a given newspaper, editors' responses tended to be more :Alike than different.
27 Aggregation of data is a common though not uncontroversial practice in organizationalresearch. See Alan Bryman, Research Methods and Organizational Studies (London: Unwin Hyman,1989) 230-233. Before proceeding with the aggregation of data, one-way analyses of variance wereperformed on each individual-level measure used in analyses for this paper. For all these measures, thebetween-groups (between newspapers) variance was significantly greater than the within-groups (withinnewspapers) variance. From this, it was concluded that it was appropriate to aggregate responses ofeditors at a given newspaper to construct organizational-level indicators for that newspaper.
28 Mark Fitzgerald, "All Things to All People," Editor & Publisher, Jan. 7, 1995, 11-14; HowardKurtz, "For Nation's Newspapers, the News Isn't Good," The Washington Post, Dec. 1, 1991, H1,H6;Jim Batten, "A Message From Jim Batten," Knight-Ridder News, Winter 1990, 2A.
29 Readership research is defined az any formal, systematic techniques for gathering informationfrom a newspaper's audience members or potential audience members about those members'informational wants or neccis, or about characteristics believed to be associated with the audiencemembers' informational wants or needs. Common kinds of readership research include focus groups,experiments or probability and non-probability surveys. Readership research is among a variety oftechniques that a newspaper might use to attempt to assess the informational wants and needs of itsaudience. Other techniques include informal or chance discussions with audience members; letters to theeditor; unsolicited complaints or compliments directed to the newspaper; and information from industry-wide efforts to identify audience informational wants and needs. But readership research constitutes themost pro-active and expensive effort to identify the informational wants and needs of readers.
39 Jean Gaddy Wilson and Iris Igawa, "Strategy No. 11: 'Expand News Coverage, presstime,November 1991, 45; David Noack, "Getting Readers Involved," Editor & Publisher, April 23, 1994,22,26,30.
31 In creating these indices, responses of editors at a given newspaper were averaged for eachcontent category. That produced an organizational-level estimate of the degree to which readershipresearch had influenced major changes for that content category at the newspaper. For a short discussionof aggregation, see Footnote 27.
32 This relatively crude indicator of competition was used because it was easily computed andinterpreted. Despite its drawbacks, it has been used successfully in previous research. See Stephen Lacyand Jan P Vermeer, "Theoretical and Practical Considerations in Operationalizing Newspaper andTelevision News Competition," The Journal of Media Economics 8, No. 1 (1995), 53.
33 Debra Gersh, "Percentage of Minorities in Newsrooms Up," Editor & Publisher, April 17,1993, 42.
34 The sample of newspapers was drawn by taking a list of the 1,529 U.S. daily newspapercompanies in business in 1990, which was ordered by total daily circulation from largest to smallest. Thatlist was divided into three groups (large, medium and small), each accounting for about 21 million of thetotal U.S. daily circulation of about 62 million. The 40 largest U.S. daily newspaper companies comprisedthe large-paper group, the next 188 companies the medium-paper group and the remaining 1,301companies the small-paper group. Thirty newspaper companies were selected from both the large- andmedium-paper groups using an interval sampling technique with a random starting point. Fortycompanies were selected in a similar way from the small-paper group. This sampling strategy assuredrepresentation of large- and medium-sized newspapers, which are less numerous than small dailies. Incases in which one company published two papers with separate or largely separate editorial staffs, one ofthe two papers was randomly selected for the sample.
35 Responses were received from 28 of the large-circulation newspaper companies (274,000 dailycirculation and up), from 27 of the medium-circulation companies (59,700 to 273,999 circulation) andfrom 23 of the small-circulation companies (58,699 circulation and below).
36 Editor & Publisher, Market Guide 1990 (New York: Editor & Publisher, 1990).
22
37 This significance level was chosen because of the relatively small sample size. The intent inselecting a significance level that is more generous than is customary was to avoid a Type II error.
38For an explanation of how W was computed, see Elazar J. Pedhazur, Multiple Regression inBehavioral Research: Explanation and Prediction, 2nd (New York: Holt, Rinehart and Winston,1982)616-623.
39 Keith R. Stamm, Newspaper Use and Community Ties: Toward a Dynamic Theory (Norwood,NJ: Ablex Publishing, 1985).
413 Child, "Organizational Structure, Environment and Performance," 1972; Daft and Weick,"Toward a Model of Organizations," 1984; Dess and Origer, "Environment, Structure and Consensus inStrategy Formulation," 1987; Downey, Hellriegel and Slocum, "Environmental Uncertainty," 1975;Milliken, "Three Types of Perceived Uncertainty," 1987.
41 Downey and Slocum, "Uncertainty: Measures, Research and Sources of Variation," 1975.42 Milliken, "Three Types of Perceived Uncertainty about the Environment," 1987; Milliken,
"Perceiving and Interpreting Environmental Change," 1990.43 Underwood, When MBA 's Rule the Newsroom, 1993.
Strategic Behavior and Competition in Cable TelevisionEvidence from Two Overbuilt Markets
Marianne BarrettAssistant ProfessorWalter Cronkite School ofJournalism and TelecommunicationBox 1305Arizona State UniversityTemr, AZ 85287-1305(602) 965-6612email: [email protected]
Strategic Behavior and Competition in Cable TelevisionEvidence from Two Overbuilt Markets
ABSTRACT
This paper uses evidence from case studies of Montgomery, Alabama and
Paragould, Arkansas to examine the strategic behavior of firms in these markets. It is
found that incumbents use a variety of tactics including price cutting and litigation to
deter entry by a rival. These tactics and their effects impact the ability of entrants to
come into a market and compete. These findings have implications for policy makers as
they explore whether to deregulate telecommunications.
9 0A., co' ti
Strategic Behavior and Competition in Cable TelevisionEvidence from Two Overbuilt Markets
INTRODUCTION
In February 1995 Sen. Larry Pressler introduced legislation that
would deregulate telecommunications and allow cable and telephone companies
into each others businesses. The objective of this legislation as well as that of the
Cable Television Consumer Protection and Competition Act of 1992 (the '92
Cable Act) is to open these markets to competition. Cable television in local
markets like local telephone service has historically been considered a natural
monopoly with competition infeasible in the long run. However, cable's natural
monopoly status was successfully challenged in the courts in cases such as
Preferred Communications, Inc. v. City of Los Angeles, Cal. Additionally, some
scholars have argued that the lack of competition in local markets has been due
more to artificial constraints placed on would-be entrants than on any "natural"
characteristics of cable television delivery.
While competition in cable television delivery is certainly desirable, it
may only be feasible under certain conditions. Economist Albert K. Smiley
(1986) modeled the competitive interaction of two cable operators with
overlapping franchises and found that both the degree of overbuilding and the
resulting welfare effects are highly sensitive to market conditions. Among thf.
market conditions cited by Smiley as impacting competition in cable television
delivery are intensity of demand, the cost of cabling the community and the
strategic interaction between firms. Because the first two factors are exogenous
and therefore outside cable operators' control, it is on the latter that would-be
competitors should focus. The entrant should anticipate that the incumbent firm
will not sit idly by but, will use a variety of tactics to prevent or forestall entry by
a rival.
Strategic Behavior and Competition in Cable TelevisionEvidence from Two Overbuilt Markets
At the time of the passage of the Cable Act of 1992, direct head-to-head
competition could be found in about forty communities in the United States. This
type of competition is commonly referred to as an "overbuild" and is defined as a
situation in which "cable television service is offered by two or more cable
systems in direct competition within the same service area." Two of these
communities are Montgomery, Alabama and Paragould, Arkansas. In
Montgomery, Montgomery Cable Vision, Inc., an independent operator is
overbuilding Storer (now TCI), an established multiple system operator.
Paragould, Arkansas is one of the few examples of a municipal overbuild
of a private operator. The City of Paragould through its Commission of Light and
Water (CLW) has been competing with Cablevision Systems, Inc. (the nation's
sixth largest mso) since March, 1991.
This paper uses evidence from case studies of Montgomery and Paragould
to examine the strategies and tactics employed by both incumbent and entrant
cable operators in competit we situations. The primary objective of the paper is to
provide insight into the likely behavior of firms in these situations and the impact
of that behavior on the feasibility of competition. This can then be used to inform
the public policy debate on telecommunications deregulation.
RATIONALE FOR THE STUDY
The case study was chosen as the method of inquiry because it enables the
researcher to take an in-depth approach to complex issues. Competition in cable
television is particularly well-suited to this method. In an article on franchise
bidding in cable television, economist Oliver E. Williamson (1976) quoted from
Bauer and Walters:
the complexity, instability and local variation of many economicphenomena imply that the establishment or understanding of relationshipsrequires that analysis be supplemented by extensive observation and alsothat the inquiry must oftcn extmd beyond statistical information to directobservation and use of primary sources.
.)
Strategic Behavior and Competition in Cable TelevisionEvidence from Two Overbuilt Markets
Thomas W. Hazlett, arguably the most widely published researcher on
competition in cable, followed Williamson's advice and examined two
duopolistic markets using the case study approach. Williamson's own case study
of the franchising process in Oakland, California in the late 1960s and early
1970s, G. Kent Webb's 1983 study of the franchise bidding process in
Philadelphia, and Hazlett's 1987-1988 study of the Sacramento, California and
Orange/Dade County, Florida overbuilds are the only academic studies that have
used this method to examine cable television. To date, only Hazlett's study has
looked at overbuilds. While much of the case law and other research concerning
cable overbuilds focuses on first amendment issues, this paper begins with
Smiley's findings and concentrates on the strategic interaction between incumbent
and entrant cable operators in two competitive situations.
STRATEGIC BEHAVIOR
In cases where two cable operators compete with one another, the market
can be described as a duopoly, a special case of oligopoly. Robert S. Pindyck and
Daniel L. Rubinfeld (1989) have stated, "in oligopolies, each firm must carefully
consider how its actions will affect its rivals and how its rivals are likely to react."
In oligopolistic situations, that strategic interaction involves competition through
price setting and/or product differentiation.
Price Setting
The Betrand model describes the type of competition that occurs in cable
television. This model assumes that firms produce a homogenous good but
compete by setting prices, with each firrn taking the prices of its competitors as
fixed and the firm with the lowest price capturing all the sales. In this case, each
firm has an incentive to undercut the price of its competitor until price is driven
down to marginal cost.
3
Strategic Behavior and Competition in Cable TelevisionEvidence from Two Overbuilt Markets
Smiley noted that when considering entry into a cable television market, a
potential entrant should anticipate that the incumbent's price will be reduced in the
post-entry equilibrium to meet the competitive challenge. Sharkey (1982 ) defined
this type of strategy as one which "explicitly uses price as a threat against
potential rivals." With this type of strategy, the incumbent firm "clearly indicates
that it is willing to lower its price temporarily if entry should occur and thereby
inflict short-run losses on both itself and on the entrant. After the rival has left, the
incumbent can then raise its price to the monopoly level and therefore recover its
short-nm losses."
The key purpose of this strategy is to deter entry. For it to be successful,
the incumbent firm must convince any potential competitor that entry will be
unprofitable. Pindyck and Rubinfeld state that there are a number of ways that an
incumbent can do this. For instance, it can threaten to expand output and fight a
price war to keep the entrant out. To make the threat credible, the incumbent can
make an irrevocable commitment that would alter its incentives once entry has
occurred. Investing now rather than later in the extra capacity needed to increase
output is an example of this type of commitment. The incumbent can also make
its threat credible if it has a reputation for irrationality. If through vicious price-
cutting, the firm has driven out every competitor in the past, even though it
incurred losses to do so, its threat of a price war would be believable. In fact, if
this were repeated in several markets, then that irrationality would become
rational. The reason is that short-term losses from the price warfare might be
outweighed by longer-term gains from preventing entry.
Hazlett (1990) found evidence of price cutting in his case studies of direct
competition in cable in several Florida markets and in Sacramento, California. "In
Florida, thc response of the overbuilt incumbent to entry by Telesat was to reduce
Strategic Behavior and Competition in Cable TelevisionEvidence from Two Overbuilt Markets
the prices of both pay and basic services although only in overbuilt areas." He
continues,
In Sacramento, the entrant, Cable America hoped to gain marketpenetration by offering 36 to 42 channels of basic service for a $10installation fee and $10 per month. This significantly undercut theincumbent, Scripps-Howard's 40 channel basic service which wasoffered for $14.50 per month. In response, Scripps-Howard sought toestablish a general policy: it would lower its price for basic service whileoffering free installation and three months of basic service at nocharge in every area where it faced direct competition. Moreover, itpledged never to be undersold by the entrant. After a rugged six monthsof competition, Scripps-Howard bought out Cable America for a priceseveral times the incumbent's capital costs. A third firm entered themarket and was immediately confronted by Scripps-Howard's selectiveprice-cutting strategy. The new entrant, Pacific West decided to make anissue of the discriminatory strategy through newspaper andradio advertisements suggesting that customers in sole-supplier areas demand the same low prices offered byScripps-Howard in overbuilt areas.
Merline, Davidson and Pierre (1990) also found evidence of selective
price-cutting. In a study of competitive versus noncompetitive markets, they
found that while the price of cable was lower to subscribers in areas with
competition, it was higher in directly adjacent areas without competition.
FINDINGS
In Montgomery, it appears that the principals William B. Blount, an
investment banker, prominent in Alabama politics, and Rush Rice anticipated that
the incumbent cable firm would engage in some form of selective price cutting
and as a result, drafted a uniform pricing ordinance to circumvent the incumbent's
ability to employ this type of strategic behavior. The ordinance (16-90)
subsequently passed by Montgomery City Council prohibits a cable franchisee
from establishing "rates so low for any class of subscriber or for any geographic
location as to prevent, discourage, restrict or diminish competition in the
furnishing of cable services." Although there was not an all-out price war wagcd
in Montgomery when Montgomery Cable Vision entered the market, Storer
lowered the price of its basic service of 29 channels from $18.25 per month to
5
Strategic Behavior and Competition in Cable TelevisionEvidence from Two Overbuilt Markets
$16.95 per month and added 25 channels. Storer's price and number of channels
was then comparable to what was being offered by Cable Vision. Subsequently
both companies engaged in aggressive marketing campaigns which includ
offering a few months of free service as an incentive to consumers to subscribe.
In Paragould, the city decided to enter the cable television business as a
result of its troubled relationship with its incumbent operator, Paragould
Cablevision, Inc., a system owned by Cablevision Systems. Much of the conflict
between the city and PCI centered on price. In December 1990, the Paragould
City Council adopted an ordinance (90-38) establishing a rate of $12.50 for a
basic cable service of 40 channels to be provided by City Cable. At the time, PCI
was charging $14.50 for 38 channels of programming. In addition to plans to
offer programming at lower rates than PCI, the city also intended to offer
complimentary services such as free remote controls and two free extra outlets.
At the time, PCI was charging $3.00 a month for a remote control and $3.00 for
each additional outlet. In full page ads titled "Cablevision Loves Paragould,"
PCI announced that beginning January 1, 1991, subscribers who had been with
the company for at least two years would be charged only $9.50 a month for basic
service. The company also planned to include American Movie Classics, then a
premium service, as part of the basic package and to provide free remote controls,
free installation, and to eliminate charges for additional outlets.
Since City Cable went on line in March 1991, the established price for
basic and pay cable services in Paragould has remained unchanged. However, as
is the case in Montgomery, both sides engaged in aggressive marketing
campaigns to attract and keep subscribers.
6
Strategic Behavior and Competition in Cable TelevisionEvidence from Two Overbuilt Markets
Product Differentiation
A second type of competitive strategy in oligopolistic markets is product
differentiation. In a discussion of competition in electric utilities, Primeaux
(1979) stated that the notion that a small price difference between competitors
would lead buyers to purchase from the producer charging the lower price
assumes that the product is homogeneous. However, this assumption "ignores
entirely the possibility that product differentiation is possible and that other
reasons such as good service and company reputation may also exist which
discourage an individual from switching to a lower priced producer." F. M.
Scherer (1970) stated that product differentiation includes service, physical
differences in the products supplied and the subjective images they impress on the
consumer's mind. Pindyck and Rubinfeld have noted that "product differentiation
can exist even for a seemingly homogeneous product." In this case,
"differentiation will be on the basis of such things as location and services."
With respect to cable television delivery, product differentiation is likely
to be donc on the basis of service. This includes attitudes of customer service
representatives both on the telephone and in person, response to customer
complaints, and the convenience of installation. In both Montgomery and
Paragould, cable operators use customer service as a way to differentiate their
products. In Montgomery although the city's cable ordinance contains a section
which outlines customer service standards, prior to Cable Vision's enuy,'Storer's
record was less than exemplary. Over a period of time, several subscribers wrote
to City Council to complain about Storer. Lack of good program selection,
trouble getting complaints answered and difficulty getting through to Storer
customer aervice representatives during periods of outage were the most common
criticisms. Additionally, in the spring of 1990, after it had been granted a
franchise, Montgomery CableVision commissioned a si udy "to assess the cable
7
Strategic Behavior and Competition in Cable TelevisionEvidence from Two Overbuilt Markets
television market in Montgomery, Alabama." When asked about the technical
quality of Storer's service, 63.1 percent of respondents said they had experienced
a problem with their reception "during the past month or so."
While one could argue that because the study was commissioned by
Montgomery Cable Vision, its results may not be completely objective, there is
other evidence to support the perception that Storer's service was substandard.
For example, in October 1990, Jack Gilbert, Storer's General Manager, conceded
that there were service outages and that these outages would continue through the
end of 1991. He noted that the outages were a result of Storer's efforts to rebuild
the system. He also conceded that "customers are often unable to get through
when they call to complain about the outages."
Although there may not have been a public outcry, there was enough
dissatisfaction with Storer's service to suggest that this was a dimension on which
Montgomery Cable Vision could compete. Recognizing this, from the outset the
company strove to provide superior service. According to Rice, Montgomery
Cable Vision Vice President, Our employees "are grilled on the service aspect of
our business. The customer is obviously worth a lot more to us than he is to them.
We offer convenient installation. We're there when you need and want us."
Nick Neely, Direct Sales Manager for the company reiterated Rice's
position on the importance of customer service. "The attitude of the customer
service representative is key. We try to catch the phone at the second ring. We
don't leave a person holding if a question needs to be referred... If (the) price is
competitive, the bottom line is service. Service makes the difference."
In Paragould, PCI and City Cable differentiate themselves with respect to
customer service in terms of response to complaints, convenience of installation
and general system reliability. When asked whether PCI's customer service had
changed with the presence of competition, Richard Hale, Paragould Cablevision
83
Strategic Behavior and Competition in Cable TelevisionEvidence from Two Overbuilt Markets
General Manager, noted that customer service had always been a top priority for
his company. In describing a program called "Service Plus" Hale said, "What this
basically says to a subscriber is, 'if we don't respond to a non-power service
outage within the next 60 minutes, we'll give you a credit for your next month's
bill." He also noted that the company had had the program in place for years but
had never formally marketed it until faced with competition. Additionally he
stated that while the company used to conduct subscriber surveys twice a year to
gauge customer satisfaction, "we now do them once a month."
To Jack Brinkley, City Cable Manager, his company's customer service is
one the key factors that distinguishes it from PCI. To be able to respond quickly
to calls from customers, Brinkley stated that City Cable runs its service
department 24 hours a day, seven days a week and noted, "no matter what it is,
you call us, within 30 minutes we're there." He also said,
my philosophy is if you have a good product, even ifit's more expensive, if you put service behind it,you'll have a good solid customer. . . . and it hasworked, because we are more expensive than our competition.
Because of the high level of cable penetration in Paragould, much of the
customer service detailed above relates to the restoration of service outages.
However, that service also relates to the ease and convenience of installation.
According to Brinkley,
When I first came to town, I had to wait a week to have my cable installed.But, now if you walk in there today and say I'd like to get hooked up thisafternoon at 3 o'clock, someone would be there to get you hookedup at three o'clock.
To Brinkley competition is responsible for the change.
Customer service is also differentiated in terms of general system
reliability. In designing a system to compete against PCI, Brinkley said that he
recognized that because of their corporate resources, anything the city could do,
PCI could do. "There's no technological competitive advantage that we can gain
9
Strategic Behavior and Competition in Cable TelevisionEvidence from Two Overbuilt Markets
that they can't match." As a result, "what we did was put together a good solid
system so if they matched it then everybody woukt have good quality service.
And that's what's been going on."
Smiley argued that product differentiation is not likely to be done on the
basis of program offerings because consumers would probably prefer to have the
entire menu of programming options available on one system. That being the
case, it is critical that entrants as well as incumbents have access to the
programming services that consumers find attractive. Congress recognized this
and adopted provisions which prohibit most exclusive programming contracts as
part of the Cable Act of 1992. Prior to the passage of the Cable Act, the entrants
in both Montgomery and Paragould had difficulty obtaining programming.
As it began to contract with programmers for services to offer on its
system, Montgomery CableVision encountered resistance from a number of
providers including HBO, CNBC, Bravo, and TNT. As a result and on the advice
of legal counsel, in August, 1990 Blount persuaded Councilor Rick McBride to
introduce an additional ordinance designed to clarify the types of anticompetitive
behavior prohibited by the January amendment to Section 5 of Ordinance 50-76.
Blount argued that the reason that those programmers refused to deal with
Montgomery Cable Vision was a result of "their common ownership by Storer's
parent or by other coercion." Among other things, the new ordinance, No. 48-90,
prohibited exclusive program contracts by making it unlawful for a cable operator,
distributor, or pro;.7,ram supplier "to restrain or attempt to restrain.. . the
production, control or sale of program material or program services used in the
provision of cable television service within the City."
The ordinance was adopted in September 1990. Subsequent to its
adoption, Storer filed suit in federal court against the city of Montgomery and its
mayor. That litigation is discussed below.
10 oisA-) ki al
Strategic Behavior and Competition in Cable TelevisionEvidence from Two Overbuilt Markets
In Paragould, initially City Cable had difficulty getting both TNN (The
Nashville Network) and the Cardinals Baseball. With respect to TNN, Brinkley
said, "They didn't take us seriously. . .. until we reached a 1000 subscribers, then
they took us seriously."
Acquiring the Cardinals Baseball was more troublesome and more costly.
The availability of a station carrying the Cardinal games had been a point of
contention between the city and its incumbent cable operator for a long time.
People in Paragould are diehard Cardinals fans and as a result, having an
exclusive contract for the games worked to the advantage of PCI. During the
summer of 1991, the Cardinal Sports Network's owners wouldn't negotiate with
City Cable and the system was excluded from carrying the games. Brinkley
stated, "That first year, they (PCI) killed us. They gave away a busload trip to the
Cardinal Games and they ran full page ads about the exclusivity (of the games) on
PCI." By the second summer, 1992, City Cable had resolved its dispute with the
Cardinal Sports Network and was able to carry the games.
Larry Watson, CLW Manager noted that access to programming is critical
and that City Cable was fortunate that PCI didn't have an exclusive contract with
Turner's networks. "I know we couldn't make it without Turner; without CNN,
Headline News, TNT."
While it is critical for an operator to provide a full complement of popular
channels, in both Montgomety and Paragould there is some product
differentiation with respect to program offerings.
In Montgomery, this type of product differentiation takes place in terms of
both the number and types of channels offered. According to Jack Gilbert,
General Manager of Storer Cable, with the city's approval, the company has
transformed an underutilized public access channel into a successful local
origination channel. Storer produces a controversial but popular local talk show,
11
304
Strategic Behavior and Competition in Cable TelevisionEvidence from Two Overbuilt Markets
offers a full range of local educational programs, and provides free cable to city
hall, local public schools and other public buildings.
In its franchise application, Montgomery Cable Vision outlined its
intention to set aside four to six local origination channels to provide "live and
taped coverage of local college, high school, junior high and recreational sporting
events." Subsequently, the company discovered that there wasn't sufficient
interest in this type of programming to justify its expense. As a result,
Montgomery CableVision has chosen not to compete with Storer on local
origination.
In its application, Montgomery CableVision also detailed its plan to
construct a 550 megahertz fiber optic system that would give the company the
capacity to expand up to 77 channels. Although the company decided not to
deploy fiber, the system is capable of transmitting 77 channels. As of February
1993, approximately 70 channels were in use. The excess capacity gives
Montgomery CableVision the flexibility of adding new channels as they become
available, offering more Pay-Per-View choices, and multiplexing others such as
Disney and Showtime.
Storer has the edge in cable radio and in being the exclusive Montgomery
outlet for TNT and ESPN's Sunday Night NFL package. It offers DMX (Digital
Music Express), a system which provides more than 30 channels of uninterrupted
CD-quality music for $9.95 a month. Alternatively, for a one-time charge, a,
subscriber may choose Superaudio, a nine-channel cable radio service.
Nick Neely, Montgomery CableVision Direct Sales Manager, believes that
with DMX and TNT Storer has been able to keep many of the subscribers that
would otherwise have switched to Montgomery CableVision. The latter is hoping
to add DMX in the near future and TNT when the provisions of the Cable Act of
1992 pertaining to exclusive contracts go into effect. For tilt- time being,
12
Strategic Behavior and Competition in Cable TelevisionEvidence from Two Overbuilt Markets
Montgomery Cable Vision emphasizes its ability to offer what Storer cannot
because of space limitations. These offerings include additional premium
channels, local weather radar and a 24-hour sports tracking service.
In Paragould, City Cable began doing local programming in the summer
of 1991 in effort to attract more subscribers. That programming includes a
weekly news show anchored by reporters from KAIT, the ABC affiliate in
Jonesboro, cooking shows, and other community events. The system also offers
live cnvemge of city council and quorum court meetings on a regular basis.
While offering local programming may be a way for a cable operator to
differentiate its product, it can be expensive. While admitting that City Cable had
gotten a bit carried away with local programming in the beginning and has since
scaled back a bit,,Brinkley also noted, "People watch that stuff. Maybe not a lot,
maybe it's only five or ten people. But, that's five or ten customers we have
because we've got something they like. That instills a good memory in those
people."
Hale stated that PCI had become involved in local programming over the
previous year but not to the extent that the city had.
We do local programming where subscriber interest would warrant it.City council meetings, quorum court meetings, Christmas Parades -- wedo those kinds of things. We don't get into some of the other types oflocal programming that the city does. We feel thenetworks do a much better job of that.
He also noted tnat local programming was never an issue prior to
competition. "I'm sure there is some interest out there. [But] it's usually a niche
appeal."
Delay Tactics
In cable television delivery, an operator must obtain a franchise from the
local government. The requirements contained in these franchises can become
barriers to entry. From his Florida and Sacramento studies, Hazlett learned that in
1330t;
Strategic Behavior and Competition in Cable TelevisionEvidence from Two Overbuilt Markets
addition to selective price-cutting by incumbents, entrants were also confronted
with a negative political climate. In 1987
The Florida Cable Television Association won passage of a statute whichrequires all new entrants to gain cable franchises and establishes strictstandards and extensive procedures for their issuance. Requirementsinclude a lengthy series of mandated public hearings and studies toestablish whether any public need exists for a cable entrant and to insurethat, if public need does exist, the second franchisee receives permissionto enter on terms no less onerous than those includedin the incumbent's franchise award.
The fact that the statute was passed at the behest of the Florida Cable
Television Association suggests that it was part of the strategic plan of incumbent
operators to delay entry by competing firms. A similar strategy was employed in
at least four other states. According to a Multichannel News report, in
Minnesota a statute was passed that while per sitting two or more operators to
obtain franchises, would compel overbuilders to be subject to the same
requirements as incumbent operators. Additionally, cities are free to require more
stringent provisions in other terms of the second system's franchise. Illinois,
Tennessee and Oklahoma adopted statutes similar to that enacted in Minnesota.
In the latter two states, the laws also include provisions designed to thwart entry
by utilities. In all four cases, the laws were drafted at least in part by state cable
. .
television associations and were supported by the cases. The incumbent operators
seek this type of legislation to ensure that entrants are not given preferential
treatment and because overbuilds result in lower penetration rates and higher
marketing costs. It has been suggested that some cities take the positions they do
because they fear that competition will result in a decrease in the franchise fees
received from cable.
While some of the requirements contained in the statutes outlined above
would ensure that entrants and incumbents be treated equally and fairly, others
such as the series of public hearings and studies mandated by the Florida law may
1430 'i'
Strategic Behavior and Competition in Cable TelevisionEvidence from Two Overbuilt Markets
serve no other purpose than to delay entry. Public hearings and studies are among
the more commonly used tactics employed by incumbents to thwart entry by
rivals. In Montgomery, although the city's cable ordinance is explicitly non-
exclusive, the original ordinance(50-76) required the city council to publish "its
intention to award.. .a franchise or franchises", solicit the filing of competing
applications, and accept applications "from all interested parties for a period of
sixty days." Blount successfully drafted and presented to council an amendment
that would eliminate this requirement. In a statement before city council
protesting the adoption of the amendments, Storer's attorney, , Thomas Lawson,
Jr., argued that determining whether a second cable operator would be beneficial
to the city of Montgomery could only be made "after a thorough analysis and
investigation." Lawson also noted that many cities had engaged consultants to
help them determine the advisability of granting a second franchise. Additionally,
he stated that "Storer would be willing to bear part of the costs of retaining a
consultant of the City's selection, perhaps with similar backing from Montgomery
CableVision to make an appropriate study and come up with recommendations.
In a March 1990 letter sent to the mayor and city council, Michael S. Tallent, then
President of Storer Cable Communications, followed up on Lawson's statement
and presented seventeen questions outlining the issuwhich the company felt the
city should consider prior to granting a second franchise. Many of the questions
related to Montgomery CableVision's assurances to the city and the company's
commitment to construct and operate a competing cable system in Montgomery.
Tallent's letter also states that "every major study ever done on a proposed
overbuild concluded that overbuilds are not economically viable in the long-run
and do not result in sustained competition."
Neither Lawson's statement nor Tallent's letter were able to persuade the
city council to delay awarding Montgomery CableVision a franchise.
15
31 )
Strategic Behavior and Competition in Cable TelevisionEvidence from Two Overbuilt Markets
Once a franchise has been awarded, a common tactic used by incumbents
is to engage the entrant in various types of litigation. That litigation, regardless of
the legal outcome, often has a chilling effect on would-be entrants. Such was the
case in both Montgomery and Paragould.
In Montgomery, in their first days as rivals, both companies employed a
variety of tactics as they attempted to attract or retain subscribers. In a letter to
Lewis King, then General Manager of Montgomery Cable Vision, Gilbert detailed
some installation complications that Storer had experienced since Montgomery
Cable Vision had begun installation and hook-up to subscribers. "Such action is
contrary to Alabama common law and statutory law and is violative of certain
regulations of the Federal Communications Commission. We demand that
Montgomery Cable Vision cease and desist its illegal activities."
The alleged illegal activities to which Gilbert referred were Montgomery
Cable Vision's use of existing internal wiring to connect customers. Storer
claimed that it had installed the wiring and as such the wiring belonged to Storcr.
King replied in a rather sarcastic letter to Gilbert.
You mention one instance in which you say our crews used internalwiring, possibly installed by Storer to connect a new subscriber of ours.In such an instance, if you believe that a subscriber has breached his orher agreement with you concerning ownership of internal wiring to receivecable transmissions from another source, then your recourse is against thesubscriber. If upon receipt of notice of termination by a subscriber, youwish to collect the internal wiring, please notify the subscriber of this factand make arrangements to collect the wiring promptly. We willgladly replace the subscriber's internal wiring ourselves.
Thank you for you letter, although it is unfortunate that you felt itnecessary to draft this correspondence in the form of a demand letter. Weappreciate your help during this transition period and you can be assuredthat we will do everything possible to make this process a smooth one forboth companies and our subscribers.
There was no further action by either party with respect to the ownership
of internal wiring.
16
301)
Strategic Behavior and Competition in Cable TelevisionEvidence from Two Overbuilt Markets
A similar issue arose in Paragould. In a suit filed against the city,
Paragould Cablevision alleged that City Cable's employees had been
disconnecting Cablevision's wires from customers who were switching to City
Cable. In response, CLW filed a motion asking the court to either dismiss the
suit or compel Cablevision to add the property owners, that is, the subscribers to
the suit. In April 1991, the court denied the motion to dismiss the suit but did
grant the alternative motion, compelling PCI to add the property owners to its suit.
In September 1991, PCI filed a motion to dismiss the suit stating that the company
"does not desire to proceed with the action at this time by naming property owners
as defendants as directed by the court."
While the internal wiring litigation can be viewed as being rather
frivolous, other forms of litigation cannot. As discussed above, Montgomery
Cable Vision encountered resistance from a number of providers including HBO,
CNBC, Bravo, and TNT as it began to contract with programmers for services to
offer on its system. In response to the adoption of the ordinance which prohibits
exclusive program contracts, Storer filed suit in federal court against the city of
Montgomery and its Mayor, Emory Folmar in September 1990. The lawsuit
alleged that both this ordinance and the amendment to Ordinance 50-76 adopted
in January 1990 requiring uniform pricing "were designed to prevent Storer from
effectively and fairly competing for cable subscribers."
According to an article in The Alabama Journal, in November 1990
Montgomery Cable Vision was allowed to intervene fully on behalf of the city
because, the company's "ability to compete with Storer and fulfill the terms of its
own franchisc agreement will be harmed if the court invalidates the two cable
television ordinances."
Although a summary judgement on the suit was issued in October 1992,
many questions remained unresolved. According to Storer's Gilbert, the
17
Strategic Behavior and Competition in Cable TelevisionEvidence from Two Overbuilt Markets
summary judgement left the ordinance intact but removed a line which said if
Storer had any exclusive contracts, the company would be in automatic violation
and would risk the loss of its franchise. Blount referred to the October ruling as
"very confusing". The case was tried in August 1993. Both sides conceded that
the litigation was extremely costly and that many of the issues in the suit were
rendered moot by the provisions of the 1992 Cable Act which require access to
programming and a uniform rate structure.
The suit substantially delayed Montgomery Cable Vision's entry into
significant portions of the city because of the costs incurred by the company in
litigation and because of the chilling effect the litigation had on capital.
According to Blount, "capital wouldn't come to us until they could see a
resolution of the court case ...we couldn't raise any money."
In Paragould, the city's incumbent operator, Paragould Cablevision, Inc.
filed three lawsuits against the city. The first only days before the city council
was to authorize the issuance and placement of bonds to finance the construction
of its cable system. This suit was filed against the city and CLW by PCI in
Greene County Chancery Court on January 18, 1990. In its complaint PCI stated
that it was .eeking to have the defendants, CLW "preliminarily and permanently
cnjoined from constructing and operating a cable television system in Paragould,
Arkansas." PCI alleged that the construction and operation of a cable television
system by CLW would constitute "an unlawful ultra vires act beyond the powers
conferred on CLW" as a municipal utility. Further, the issuance of bonds secured
by a tax to finance the system "would constitute and illegal exaction" under the
Arkansas constitution. PCI also argued that even if CLW had the authority to
construct and operate a cable system, the franchise agreement between the city
and CLW unlawfully delegated legislative powers to CLW.
Strategic Behavior and Competition in Cable TelevisionEvidence from Two Overbuilt Markets
In February 1990, Judge Howard Templeton denied plaintiff PCI's motion
for a preliminary injunction and granted the defendants' motion for summary
judgement. He said, under an Arkansas statute enacted in 1987, the city has "the
authority to construct and operate a cable television system." Additionally, under
al988 amendment to the Local Government Bond Act, "the city has the authority
to issue capital improvements bonds to finance the construction and installation of
a cable television system". Finally, Templeton stated, the city can legally and
properly delegate to CLW the authority to construct and operate a cable syste
"The franchise agreement entered into between the City of Paragould and
Paragould Light and Water Commission, as amended [in January, 1990] reflects
the delegation of administrative and ininisterial functions and is not . . . an
unlawful delegation of the city's legislative authority."
The second suit was filed in federal court less than two weeks later. In
this action PCI once again sought to enjoin the city and CLW from entering the
cable business. The complaint contained three counts. Count I, attempt to
monopolize, charged the city and CLW with anti-trust violations under Section 2
of the Sherman Act. The anti-trust charges were based in part on CLW's status as
a government-created electric utility monopoly and its ownership and control of
utility poles that are "necessary for the operation of PCI's cable system." Count I
also alleged that CLW would use its "leveraging power" to force PCI to pay for
the relocation of cable lines that would be necessary to make room on the poles
for a second cable system. PCI argued that
CLW's power to control the use of the poles, its monopoly power held inthe provision of electric service, its new status as a direct competitor withPCI and its announced inteqko proceed with the construction andoperation of a cable television system results in a dangerous probability ofsuccess in excluding competition from and monopolizing therelevant market.
With respect to the city, PCI asserted that its dual role as a competitor to
and regulator of PCI's operations suggested that the city, like CLW, would "enjoy
19
Strategic Behavior and Competition in Cable TelevisionEvidence from Two Overbuilt Markets
a dangerous probability of success in excluding competition from the relevant
market."
Count II of the complaint stated that parts of the 1983 franchise agreement
between the city and PCI violated PCI's First and Fourteenth Amendment rights.
Specifically, Paragraph 2.4 of the franchise agreement stipulated that PCI must
notify the city if the company were going to engage in any activity, including the
sale of local advertising, that would generate additional revenues for the company.
The franchise agreement also required PCI to negotiate with the city before
undertaking this type of activity. Implied in this stipulation was the likelihood
that the city would allow PCI to engage in additional income-generating activities
but would require any revenue from those activities to be included in the
calculation of the franchise fee.
From PCI's point of view, the fact that its franchise agreement with the
city required the notification and negotiation outlined above while CLW's did not(1;
constitute a "discriminatory media tax in violation of the First and Fourteenth
Amendments."
Count III of the complaint stated that when the city granted to CLW a
franchise that contained no prohibition against local advertising, the city breached
its contract with PCI.
In response, the city and CLW filed motions to dismiss. With respect to
the charges of anti-trust violations, the defendants' motions were based primarily
on the belief that both were protected under the state action immunity doctrine.
The defendants stated that their construction and operation of a cable television
system in competition with a private operator was an action contemplated and
permitted by the State of Arkansas.
By enacting the 1987 statute specifically authorizing cities to own and
operate cable systems at a time when "virtually every city and town was already
20SL,
Strategic Behavior and Competition in Cable TelevisionEvidence from Two Overbuilt Markets
receiving cable service through a private operator," the Arkansas legislature
recognized that a municipal system would probably compete with a privately-
owned system. The defendants also noted that because so many Arkansas cities
and towns operate their own utilities, "it is logical to assume that the legislature
recognized that municipal cable systems would likely be operated through such
entities" and that the cities would be both regulators andcompetitors.
Continuing to respond to Count I of PCI's complaint, the city and CLW
argued that even if the court found that the state action immunity was not
applicable, to find in favor of the plaintiffs would
stand anti-trust law on its head. ..By plaintiffs own admission, it, notDefendants is currently a monopolist in the very market that it allegesDefendants are attempting to monopolize, in which market Defendantscurrently have zero market share. And as a relief, Plaintiff seeks to haveDefendants excluded from the "relevant market." Thus, . . . Plaintiff isasking the court, under the guise of an attempt to monopolize c'aim, topreserve Plaintiffs current monopoly.
The city and CLW argued that Count II should be dismissed because the
issue of local advertising "does not state a claim under the first amendment" and
PCI's franchise agreement with the city was a voluntary contract, not subject to
equal protection under the Fourteenth Amendment.
The defendants also stated that Count III should be dismissed as a pendent.
claim because it involves claims based on state rather than federal law.
In May 1990, the court ruled in favor of the city and CLW and granted the
motions to dismiss. In dismissing the plaintiffs claims that the defendants
violated federal anti-trust laws, the court stated that the passage of two statutes
relating to cable television by the General Assembly of Arkansas authorized the
City of Paragould to enter into the cable television market. The statutes also
"reflected the state's policy to permit the city to 'displace competition' since the
'challenged restraint is a necessary and reasonable consequence of engaging in ihc
authorized activity." As a -^sult, "the clear delegation of control to cities over
21
Strategic Behavior and Competition in Cable TelevisionEvidence from Two Overbuilt Markets
their television systems expressed in the cited statutes makes the court's finding of
immunity for the city and its Light and Water Commission relatively
straightforward."
The court next considered the charges made by PCI against the city and
CLW in Count II of the complaint. The court noted that PCI's claim that the
franchise agreement provision in question effectively placed a restriction on all
advertising by the company was "a considerable leap." The court found that the
relevant sections of the franchise agreement were contractual in nature and did not
have the effect of "regulating speech of any kind." Because of the contractual
nature of the franchise agreement between the city and PCI, the court also found
that the absence of a similar provision in the city's agreement with CLW was not a
violation of the equal protection clause of the Fourteenth Amendment. The court
also noted that the absence of the provision in CLW's franchise agreement was not
a discriminatory media tax. "Contract modifications do not automatically become
tax questions merely because one party is a political subdivision with taxing
authority." The ruling of the District Court was subsequently upheld.
There is some evidence that the suits filed by PCI against the city and
CLW had a chilling effect on the city's ability to get financing. In a report to
Mayor Charles Part low and the Paragould City Council, regarding the bonds that
the city planned to issue to finance its cable system, Mark McBrydc, of Stephens,
Inc. an investment firm selected to administer the bond issuance wrote,
In making contact with the original investors, we found a significantnumber that would pass as a result of the continuing litigation. We believethe city will ultimately prevail and has the authority to levy up to6.5 mills as security for this bond issue. Stephens is willing to purchasethis financing at the interest shown within this report. Our intention is tohold thr bonds until litigation has been resolved. We believethis period could be between six months and two years.
In discussing the litigation, Donis Hamilton and Robert Thompson, attorncys for
CLW and the City of Paragould respectively, maintain that th: suits filed by PCI
22
Strategic Behavior and Competition in Cable TelevisionEvidence from Two Overbuilt Markets
against CLW and the city were part of Cablevision's competitive strategy. In a
videotaped statement, Thompson said,
I think you will find there was never much merit in these suits. They werepreemptive strikes. They were meant to frustrate the building of thesystem and create as much expense and trouble and to put the process offfor as long as possible.
In correspondence to the author Hamilton noted,
it is my general observation that these challenges to competition aremounted by private cable companies in the same identical way. Forexample, we compared the lawsuits against us with those (filed against thecity in its attempt to build a competing cable system) in Glasgow,Kentucky and found that they were virtually identical and filed invirtually the same order. I am told that similar challenges have beenmounted in the same way to cities in Florida attempting to establish cablesystems.
CONCLUSIONS
Smiley has said that when examining the feasibility of competition in
cable television delivery, it is critical to consider the strategic interaction between
firms. In particular, the entrant should anticipate that the incumbent will act to
thwart competition. The Montgomery and Paragould cases provide us with
evidence on the type of tactics that incumbents employ from price cutting to
litigation. These tactics and their effects impact the ability of entrants to come
into the market and compete. In the cases examined here competition has not
come easily. At a time when there is a movement towards deregulation of
telecommunication industries such as cable television, these strategic interactions
and their effect on the viability of competition must be taken into consideration.
It is critical that policy makers take note that incumbent firms in historically
closed markets do not let rivals enter without a fight.
233 v. ()A
List of References
Blount, William B.(1990, March 6).Montgomery Cable Vision and Entertainment, Inc.,Response to Storer Letter.
Blount, William B.,(1990, August 1.) Montgomery Cable Vision and Entertainment, Inc.,Memorandum to Mayor Emory Folmar and Council Re: Anti-Competitive Tacticsof Major Cable Operators and Programmers , Montgomery, Alabama.
Blount, William B.(1993). Chairman, Montgomery CableVision and Entertainment, Inc.Interview, Montgomery, February 22.
Brinkley, Jack. (1993). Cable Superintendent, Paragould City Light, Water and Cable.Interview, Paragould, February 17. Telephone interview, April 1.
Dawson, Fred. Cable Not a Natural Monopoly, But a Tough One. Multichannel News.
Cable Television Consumer Protection and CompetitionAct of 1992 (1992). U.S.C.A.Statutory Supplement, Public Law 102-385, St. Paul: West Publishing,December.
Gilbert, Jack. (1990, October 11). Storer Cable Communications. Letter to Lewis King,General Manager, Montgomery CableVision andEntertainment, Inc.
Gilbert, Jack. (1993). General Manager, Storer Cable. Interview, Montgomery, February24. Telephone interview by author, April 27.
Griffith, Charles.(1982, July 13.) Letter to Montgomery City Council, July 13, 1982.
Hale, Richard.(1993).General Manager, Paragould Cablevision, Inc. Interview,Paragould, February 18.
Hamilton, Donis.(1993). Attorney, Goodwin, Hamilton, Moore and Colbert, Interview,Paragould, February 17.
Hamilton, Donis.(1993, January 20). Letter to author.
Hayes, Elizabeth. (1990, September 7). Storer files lawsuit to stop new city regulations.The Alabama Journal 1(A).
Hazlett, Thomas W.(1990) Duopolisitic Competition in Cable Television: Implicationsfor Public Policy. Yale Journal on Regulation, 7:65: 65-119.
King, Lewis. (1990, October 16). Montgomery CableVision and Entertainment, Inc.Response to Gilbert Letter.
Lawson, Thomas, Jr. (1990, January 16.) Statement to Montgomery City Council.
McBryde, Mark, Stevens, Inc.(1990, June 13.) Report to Paragould, Arkansas, GeneralObligation Capital Improvement Bonds, Information Regarding Bond Pricing.
Merelman, Stephen.(1990, October 2S).Scorer managet says outages will continue. TheAlabama Journal , 2(A).
Merelman, Stephen.(1990, November 29).CableVision joins city in defending cablecompetition ordinances. The Alabama Journal, 2(A).
Merline, J. W., D. Davidson and E. Pierre.(1990 May). How to Get Better Cable TV atLower Prices. Consumers' Research, 10-17.
Montgomery, Alabama. Ordinance No. 9-90, An Ordinance to Amend Ordinance No.50-76, an Ordinance of the City of Montgomery, Alabama Adopted June 22,1976 Providing for the Construction, Operation, Regulation and Control ofCable Television Systems, January 16, 1990.
Neely, Nick. (1993). Direct Sales Manager, Montgomery CableVision and Entertainment,Inc. Interview, Montgomery, February 23.
Paragould, Arkansas. (1989, June 16.) An Ordinance Making Findings of Fact,Authorizing the Paragould Light and Water Commission to Purchase, Acquire,Construct, Equip, Operate, Maintain, and Extend a Community AntennaTelevision System, Sometimes known as a Cable Television System, on a Non-Exclusive Basis, Establishing a Citizen's Cable Television AdvisoryCommittee and for Other Purposes.
Paragould, Arkansas.(1990, January 22). Ordinance No. 90-10, An OrdinanceAuthorizing the Construction of Cable Television Facilities in the City ofParagould, Arkansas, Authorizing the Issuance of General Obligation CapitalImprovement Bonds for the Purpose of Financing the Cost of Construction,Providing for the Payment of the Principal and Interest on the Bonds;Prescribing Various Matters Relating Thereto; and Declaring anEmergency.
Paragould, Arkansas.(1990, December 10.) Ordinance No. 90-38, An OrdinanceEstablishing the Rates for the Sale and Distribution of Audio and VisualTelevision, Radio and other Signals and Related Services to be Furnished bythe Municipal Cable Television System as Administered by the Paragould Lightand Water Commission in Accordance with Referred Ordinance Adopted June 17,1986, and Ordinance 90-11, Adopted February 12, 1990; Declaring anEmergency and for Other Purposes.
Paragould, Arkansas.(1983, November 28.) Resolution No. 83-22, Resolution Authorizingthe Mayor and the City Clerk to Execute Certain Cable TV Franchise Agreementwith Paragould Cablevision, Inc.
Paragould Arkansas.(1988, June 6.) Resolution No. 88-10, A Resolution Directing theParagould Light and Water Commission to Proceed with the Acquisition,Construction, and Maintenance of an Extended Community Antenna TelevisionSystem, also known as a Cable Television System for the City of Paragould,Arkansas, and for other purposes.
Paragould Cablevision, Inc. v. City of Paragould, Arkansas and Paragould Light andWater Commission, Complaint, Civil Action No. 90-17, Greene County, ArkansasChancery Court, January 18, 1990.
3 1 a
Pc ragould Cablevision, Inc. v. City of Paragould, Arkansas and Paragould Light andWater Commission, Separate answer of defendant, Civil Action No. 90-17,February 2, 1990.
Paragould Cablevision, Inc. v. City of Paragould, Arkansas and Paragould Light andWater Commission, Order, Civil Action No. 90-17, February 26, 1990.
Paragould Cablevision, Inc. v. City of Paragould, Arkansas and Paragould Light andWater Commission, Complaint, Civil Action No. J-C-90-14, E.D. Ark., January29, 1990.
Paragould Cablevision, Inc. v. City of Paragould, Arkansas, etal., Motion to Dismiss,Civil Action No. J-C-90-14, E.D. Ark., February 20, 1990.
Paragould Cablevision, Inc. v. City of Paragould, Ark. 739 F. Supp. 1314 [1990] (E.D.Ark.).
Paragould Cablevision, Inc. v. City of Paragould, Ark. 930 F. 2d 1310 [1991] (8th Cir.).
Pindyck, Robert S. and Daniel L. Rubinfeld. (1989) Microeconomics, New York:Macmillan Publishing Company.
Preferred Communications, Inc. v. City of Los Angeles, Cal. 754 F. 2d 1396 [1985].
Primeaux, Walter J., Jr. (1979 Spring). Some Problems with Natural Monopoly. TheAntitrust Bulletin, 63-85.
Rice, Rush. (1992 and 1993). President of Montgomery CableVision and Entertainment,Inc. Interview, Montgomery February. 22. Telephone interview August 31 andApril 26.
Schnapf, Mrs. Arthur Frederick.(1984, March 24.) Letter to Montgomery, Alabama CityClerk.
Scherer, F. M. (1970) :tidustrial market structure and economic performance. Chicago:Rand McNally and Co.
Sharkey, William W.(1982). The Theory of Natural Monopoly, Cambridge: CambridgeUniversity Press.
Smiley, Albert K. (1986 June 5).Direct Competition Among Cable Television Systems.EAG Discussion Paper 86-9.
Southeast Research.(1990, May 31). A Marketing Study for Montgomery CableVision andEntertainment, Inc.
Stewart, Robert B.(1982, August 11). Letter to Storer Cable Communications .
Tallent, Michael S.(1990, March l).Storer Cable Communications. Letter to MayorEmory Folmar and members of Montgomery City Council.
Thompson, Robert.(1992). Counsel for the City of Paragould, Arkansas. Videotapedstatement, September.
3P0
Watson, Larry. (1993). Manager, Paragould City Light, Water and Cable. Interview,Paragould, February 17, 1993.
Webb, G. Kent. (1983). The Economics of Cable Television. Lexington: LexingtonBooks.
Vertical Integration and Consumer Welfarein the Cable Industry
Paper for Media Management and Economics DivisionAEJMC, 1996, Washington D.C.
Hoekyun Ahn, Ph. D. StudentMichigan State University
Dept. of TelecommunicationEast Lansing, MI 48824Phone: (517) 394-2182
e-mail: [email protected]
321
Abstract
Two economic theories compete with respect to the effects of vertical integration in
the cable industry. The efficiency theory suggests that vertical integration has resulted in a
better performance or economic value in terms of the cable subscription fee and the
accompanying diversity. Contrarily, the theory of market power through entry barrier and
resulting foreclosure suggests that the vertical integration has led to diseconomies and
inefficiencies for the cable firms and reduced content diversity for the consumer.
To test the direct consequences of vertical integration, this study compared the
consumer welfare of the integrated multiple system operators (MS0s) with that of the
nonintegrated MSOs in the two dimensions indicatedsubscription fees and content
diversity. It was discovered that in general, the consumer enjoys greater diversity and the
lower prices from the integrated MSOs but this effect was confounded by the differences
in the system size between the two groups. Interestingly, there appears to be a threshold
that the consumer benefits from vertical integration. Nonintegrated MSOs provide less
channel diversity and charge the highest prices per channel as do highly integrated MSOs.
The greatest consumer welfare arises from moderately integrated MSOs.
I. INTRODUCTION 1
II. PROCOMPETITIVE CONSEQUENCES OF VERTICAL INTEGRATION 3
1. EFFICIENCY-ENHANCING EFFECT 3
2. THE SOURCE OF PROGRAM DIVERSITY 5
III. ANTICOMPETITIVE CONSEQUENCES OF VERTICAL INTEGRATION 7
1. ENTRY BARRIER AND FORECLOSURE EFFECT 7
2. TilE SOURCE OF DISCRIMINATORY CONDUCT 10
IV. RESEARCH PROBLEMS, HYPOTHESES, AND METHODS 12
1. RESEARCH PROBLEMS AND HYPOTHESES
2. METHODS 16
V. RESULTS 18
1. GENERAL CHARACTERISTICS 18
2. SERVICE PRICE 223. DIVERSITY 27
VI. DISCUSSIONS 29
REFERENCES
APPENDIX 35
I. Introduction
The increase in concentration within the cable industry has been paralleled by a
growth in vertical integration. A recent study reports that vertical integration between
MSOs and cable program suppliers is extensive and the extent has markedly increased
since the mid-1980s (Waterman and Weiss, 1993b). In fact, vertical integration has long
been one of the major concerns in the realm of mass media, tracing back to the historic
Paramount case (U.S. v. Paramount Pictures, 1948) in the motion picture industry.
Hence neitber the phenomenon nor the controversies of vertical integration are unique to
the cable industry. But, partly because of the growing importance of its product, partly
because of the very numerous nonintegrated competitors, suppliers, and customers
interspersed throughout it, the,cable industry provides the most controversial, if not the
purest, example of the problems that arise when size and market dominance, are associated
with vertical integration.
For the policy maker, vertical integration raises issues of preserving freedom of access
by information providers to the public and of achieving maximum diversity of information
products (Brennan, 1990). For the economist, on the other hand, vertical integration raises
issuts of economic efficiency (Waterman and Weiss 1993a). Virtually all discussion
regarding vertical integration issues, thus far, seems to focus primarily on the former
areaaccess of program suppliers to the public (Klein, 1988; NTIA, 1988; FCC, 1990;
Watorman and Weiss, 1993b). As local monopolists, however, integrated MSOs have a
variety of other opportunities to behave differently towards affiliated and non-affiliated
networks when both are offered on its menu (Waterman and Weiss, 1993a). For example,
since the Cable Consumer Protection and Competition Act of 1992 and underlying
antitrust acts allow cable programming networks to charge cable operators differential
rates for their programming services for "legitimate business reasons," large integrated
MSOs can get volume discounts from their network affiliates. In reciprocity, the network
affiliates can be placed on better channel positions on the local systems.
To date, these issues have been treated from the point of the bilateral bargaining
relationship between the networks and the operators. In other words, the consequences of
vertical integration from the consumer's standpoint have been largely ignored or untested.
Thus, the present study seeks to be more inclusive by exploring the direct effect of vertical
integration on consumer welfare in the price and content diversity. How do consumers
benefit from this kind of vertical integration? Is massive vertical integration in any sense a
necessary or socially desirable consequence of the economic and physical characteristics of
cable television production and distribution? The answers to these questions are sharply
divided into two different theories.
Procompetitive Consequences of Vertical Integration
1. Efficiency-enhancing Effect
At least since Ronald H. Coase (1937), many economists have viewed the
abandonment of the market implied by vertical integration as a socially desirable
adaptation because vertical integration tends to reduce the misallocation of resources
(Spengler, 1950; Bork, 1954; Comanor, 1967; McGee and Bassett, 1976; Perry, 1978;
Williamson; 1971, 1974, 1979, 1985). For example, in current antitrust enforcement, there
is a general presumption that v6rtical mergers are not anticompetitive. The successive
monopoly model, frequently accredited to Spengler (1950) and Machlup and Taber
(1960), is a major intellectual impetus for that policy. It says that vertical integration
results in a reduction of the final good price by eliminating the double marginalization
(Salinger, 1991). In this view, therefore, integration eliminates a dead weight loss resulted
from double monopoly markups on product price and increases consumer welfare because
price of the final product is reduced in the direction of its marginal cost (Waterman,
1993).
Reinforcing this efficiency rationale is a more efficient contracting between buyer and
seller. In his well-known article, Coase (1937) suggested that there were a number of
costs of using the price mechanism, among which were the cost of finding out what the
relevant prices are and the cost of negotiating and concluding a contract. In cases where
the cost reduction is not obvious, Williamson (1971, 1974, 1979, 1985) uses "transactions
costs" theories to explain the vertical extent of a firm. According to Williamson (1985),
the economic institutions of capitalism have the main purpose of economiimg on
transactions costs. In this view, the routing of transactions inside firms raises profits
together with social welfare. Williamson therefore argues that integration serves to reduce
contracting costs or to avoid the risk of opportunistic behavior. By providing a setting for
joint profit maximization, vertical integration may eliminate or mitigate tbe exercise of
market power and lead to efficient input use. Long-term contracts may produce a similar
effect in eliminating the exercise of market power. However, in the presence of
uncertainty, it is difficult or impossible to write complete contracts that adequately cover
future contingencies and ex post adaptation to realized events may result in inefficient,
opportunistic behavior (Lieberman, 1991; Kerkvliet, 1991). Hence, vertical integration
through ownership is more assured than through contract. On the basis of these theories,
in fact, National Telecommunications and Information Administration (1988) asserts that
"vertical integration allows the cable firm to avoid the transaction costs of obtaining
programming" (NTIA, 1988, p. 90).
If there are transactions costs, particularly in a free market where transactions are
heterogeneous and the search for a buyer or seller may be lengthy, there may be an
incentive to combine a number of events or activities into one bundle by arranging long-
term contracts. A ntimber of sellers and buyers become one market unit by integration,
and the firm which arises does not have to himt for buyers and sellers in its internal
transactions as a result (Malmgren, 1961).
The main deficiency of these explanations, however, is that transactions costs are not
well enough defined so as to be measured, so the theory has not been successfiilly tested
quantitatively (Flaherty, 1981). In addition, even if firms are integrated to internalize both
technological and transactional economies, market imperfections caused by externalities,
imperfect competition, or imperfect information remain an important determinant of
vertical integration. Vertical integration in response to such technological or transactional
economies generally increases welfare. On the other hand, vertical integration in response
to market imperfections may increase or decrease welfare. Thus, public policy questions
become the primary interest (Peny, 1989).
2. The Source of Program Diversity
These efficiency theories provided by NTIA (1988) and the FCC (1990) correspond
io the contention that vertical integration has expanded the supply of cable programming
in an elastic fashion and thus significantly improved diversity of viewing choices for cable
subscribers. The FCC also states that vertical integration has increased not only the
quantity but also the "quality" of program services available to the viewing public. In the
views of NTIA and the FCC, horizontal concentration and vertical integration produces
significant benefits and good economic purchasing value for cable subscribers. The
correspondingly higher concentration levels in the cable industry have enabled cable
companies to take advantage of valuable economies of scale and foster investment in more
and better program sources, which in turn lead to more investment in programming, more
5 32';
original programming and a wealth of new viewing options for cable subscribers (FCC,
1990). Cable ownership concentration thus is considered an economic "good" rather than
a "bad," yielding superior performance for the industry. In more specific terms, MSOs are
said to provide critical financial support to sustain such companies as Turner
Broadcasting, The Discovery Channel, BET, and C-SPAN in their expanded programming
efforts. Thus, in their view, vertical integration by MSOs with significant subscribership
has contributed to program diversity by providing financial support for faltering services.
The proponents of vertical integration also note the so-called "synergies." In addition
to providing needed capital and a ready subscriber base for new programming services,
cable operators can more easily share information with producers about viewer taste,
reaction to programs and desire for new programs (Klein, 1989). More generally,
executives and managers who are skilled at cable system operation may also be skilled at
cable network operation (Waterman and Weiss, 1993b).
In sum, on the issue of service prices, it is argued that vertical integration is likely to
result in lower consumer prices. On the issue of the diversity, it is suggeked tbat all of
these advantages of vertical integration ultimately benefit the viewing public because they
are likely to result in an expansion of the programming that is available to the public and
to increased consumer satisfaction (Klein, 1989). As Brennan (1990) points out, media
monopoly may not lead to reduced diversity in program. In some situations, a monopolist
might find it profitable to provide more diverse programs at a faster rate than would its
competitors, to deter entry and protect its monopoly profit. For whatever reason, the
outcome is increased diversityat least in the short run.
III. Anticompetitive Consequences of Vertical Integration
1. Entry Barrier and Foreclosure Effect
Countering those arguments that vertical integration increases efficiency and welfare,
a number of economists (Stigler, 1951; Edwards, 1953; Adams and Dirlam, 1964; De
Chazeau and Kahn, 1959; Kahn, 1971; Litman, 1979, 1992; Eccles and White, 1988;
Rotemberg, 1991) pay more attention on inefficiencies and possible anticompetitive
consequences associated with vertical integration. It is argued, first of all, that not only are
internal transactions not ftee, but also integration may bring problems of coordination and
other managerial diseconomies. Thus, vertical integration is much more costly and riskier
than operating at a single stage; there may be considerable inefficiencies which result from
trying to operate additional stages at optimal levels. Often the economies of scale do not
coincide between adjacent stages (Litman, 1992). Diseconomies and inefficiencies
embedded in the vertical integration can have direct implication for the cable service
prices.
No doubt, integration and the concomitant abandonment of market transactions occur
only when this is privately profitable, either in the short run or in the long run. Firms
choose to integrate if the expected profit from doing so exceeds that of the separate
divisions acting independently (Green, 1986). However, there exist situations where, given
market imperfections, the firm's private profitability creates undesirable social by-
products. When the market is distorted, firms generally can earn rents. Thus, firms would
willingly tolerate organizational inefficiencies if such inefficiencies help them capture these
rents (Rotemberg, 1991). Thus, consumers can be made better off when there is vertical
79 ,
integration in the market system, only if competition insures and compels that such cost
savings are indeed passed on to consumers (Carlton, 1979). Unfortunately, however, cable
lacks competition in the local exhibition stage and hence structural imperfections cannot
compel good performance.
Furthermore, it is possible that vertical integration increases the difficulty of entry by
new firms, by increasing the capital and knowledge necessary to conduct several types of
operation rather than depend on rivals for supplies or markets (Stigler, 1951). Established
firms may use vertical integration strategically to increase finance requirements and
thereby to discourage entry if potential entrants feel compelled, as a condition of
successful entry, to adopt the prevailing structure to enter at multiple stagesas they may
if the industry is highly concentrated.
Integration confers advantages of a purely strategic character, by giving a company
more certain access than nonintegrated competitors enjoy to materials and markets, and by
protecting it against the squeezes on prices and margins that may afflict firms confined to
one particular stage of production. Therefore, to the extent that integration narrows the
alternatives intermediate markets offer to nonintegrated competitors, integration makes it
necessary for them to integrate as well (De Chazeau and Kahn, 1959; Comanor, 1967).
Hence vertical integration may breed vertical integration apart from any gains in efficiency
(Litman, 1979). It is particularly likely to do so if it carries no offsetting disadvantages. lf,
for example, integrated firms are very large and at the same time operate with
decentralization of management, they may enjoy the advantages of market specialization in
8 3,i()
their own department while retaining tile strategic benefits integration confers, of
protection, assurance, and balance (De Chazeau and Kahn, 1959).
Recently the increasing trend in vertical integration can be explained in part by the
increasing difficulty encountered by new programming networks in gaining a niche access
in the steadily expanding universe of competing cable services. Even though some
independent networks such as ESPN and USA are among those with the highest
subscribership, all of the independent networks with the highest subscribership and ratings
were established in the early years of cable before extensive vertical integration and a
variety of cable niche programming have been developed in the cable industry. They thus
had the built-in advantage of "being there first."
One example of integrated MSOs' abuse of power to curtail programming services
competing with their network siblings involves the attempt of NBC and Cablevision to
launch CNBC in 1989. In response to the new competition in news programming service,
a number of large MSOs insisted as a condition of carriage that CNBC not become a
general news service in direct competition with CNN, which is owned partly by TCI, Time
Warner, Viacom, and other MSOs (FCC, 1990).
By contrast. CNBC's contracts did not preclude it from providing programming that
might duplicate or compete with FNN, another consumer news service which were
independently owned. The outright intent of the contract was to protect CNN from direct
competition to its general news service and to allow CNBC to provide programming that
could compete with other unaffiliated program services.
9
2. The Source of Discriminatory Conduct
The apparent influence of vertical integration on information product retailers is
frequently observed. For example, ownership of cable programming could give a cable
operator the incentive to carry affiliated services to the exclusion of unaffiliated services.
Certain channels such as ESPN, USA, and HBO are, for all practical purposes, economic
"must carries" for all cable systems. Other network siblings constitute strategic "must
carries" for vertically integrated parent cable operations.
In the Waterman and Weiss studies (1993a; 1993b), MSOs vertically integrated with
cable networks have been found to carry their affiliated networks more frequently than
rival networks. More importantly, Waterman and Weiss reveal that when both affiliated
and rival networks are carried on a system, subscribership is often skewed toward the
former. Due partly to favored promotion and channel position, cable networks which are
vertically integrated enjoy significantly higher subscribership and correspondingly higher
ratings than new nonintegrated networks. Only three post-1984 Cable Act channels appear
among the 15 channels with the highest subscribership and ratings; all three, i.e., TNT,
The Discovery Channel, and Nickelodeon, are vertically owned (FCC, 1990). This implies
that there are many subtle advantages afforded to the integrated networks.
Moreover, almost all of the contracts between unaffiliated program services and cable
operators give the operators "deletion rights"i.e., the right to discontinue carriage of a
program service. Such deletion rights provisions, however, appear to be absent from
affiliation agreements between integrated MSOs and their own programming services. The
Nostalgia Network lost a chunk of its subscriber oase because Time Warner Cable decided
to drop the network from its giant New York City operation in January, 1994. The same
cable system dropped The Travel Channel a year before (Multichannel News, 1994).
Needless to say, these two programming networks are not financially affiliated with Time
Warner. Given the unequal distribution of power among the national MS0s, the biggest
players thus have virtual veto power over access and can also utilize reciprocity where
necessary to insure successful launches of new affiliated parent networks.
In sum, the network branch of the integrated firm might use its cable system ties
strategically to disadvantage existing or potential network rivals. The MSO branch of the
firm might use its network ties to create barriers to entry or otherwise disadvantage
alternative multichannel video distributors (Waterman and Weiss, 1993b). The inevitable
result is that vertical integration may reduce the supply of cable programming or limit the
diversity of program services available to cable subscribers (NTIA, 1988). Thus vertical
integration has implications of substantial significance for content diversity. Parent MSOs'
propensity of favoring affiliated networks may lead to a distorted programming package
rather than optimal mix of programming available to consumers.
However, there also are counter arguments to foreclosure effect and discriminatory
conduct by integrated MS0s. The cable industry generally relies on the Klein study (1989)
to rebut these types of accusations of program access abuse stemming from vertical
integration. Klein argues that MSOs do not discriminate against unaffiliated programming
networks. Even though Klein concedes that virtually all networks are carried more
frequently on integrated MSOs than on nonintegrated MS0s, he insists that the differences
are "quite small." (Klein, 1989, p.47).
I I
A more thorough and extensive study on this subject was conducted by Waterman
and Weiss (1993b). They found that integrated cable systems do tend to favor the
programming with which they have ownership ties, either by more frequent carriage of
those networks than would otherwise be expected, or by lowering pricing or more
vigorous marketing of their affiliated programming in the case of premium networks.
Nevertheless, their research findings did not support the view that vertical integration is
instrumental in preventing or retarding entry of alternative multichannel video delivery
systems into competition with established cable systems. Waterman and Weiss suggest
that integrated systems have little incentive, procompetitive or anticompetitive, to
disadvantage unaffiliated networks. They concluded that although vertical integration
could play an important role in the exercise of anticompetitive behavior in the cable
industry, "its role is fwidamentally ancillary to that of buying, that is, monopsony, power
of MSOs in the programming market- (Waterman and Weiss, 1993b, p. 2). It is this latter
contention which requires empirical testing and is justification for the present study.
IV. Research Problems, Hypotheses, and Methods
I. Research Problems and Hypotheses
To provide exploratory data and hopefully to resolve the apparent disputes on the
vertical integration in the cable industry, this study sought to find out the consequences of
vertical integration by looking at the standpoint of tbe consumer, not the cable operator or
the network. This can be expected to provide more fruitful results for three reasons. First.
discussions can provide much richer meanings when they are directed to the consumer
welfare rather than business welfare since the former should be the cornerstone for public
policy. Second, it is more productive to focus on the consumer welfare because economic
efficiency can be better measured in the final stage of production by observation of the
consumer rather than the business entity. In most cases, it is highly unlikely to get reliable
information on economic efficiency from the business itself Third; consumer welfare
should generally be a more objective criterion for the judgment on the issues. In fact,
continued disputes on the vertical integration stem from the fact that the consumer welfare
has been largely ignored so that an objective measure has been missing for the judgment of
competing arguments.
On the basis of aforementioned theoretical discussions, two research questions were
formulated:
(1) Do cable subscribers benefit from any cost efficiencies of the integrated MSOs?
HI: Cable subscribers of integrated MSOs pay equal or higher subscription
fees per channel, compared tr) those of nonintegrated MSOs.
In contrast to the successive monopoly model of Spengler (1950), when a multi-
product monopolist vertically integrates into the upstream stage, the final price may
increase or decrease. Salinger (1991) conceptualized three effects of vertical mergers in
multi-product industries such as the cable television industry. In his model, the monopolist
might either lower both prices of the good provided by the affiliated and the unaffiliated
finns, or lower the price of the good provided by the affiliated firm and raise the price of
the rival's good, or raise both prices. Since some and even all prices can increase, vertical
mergers in multi-product industries do not necessarily improve welfare (Salinger, 199 1, p.
545). In short, the effects of vertical integration are an empirical question (Litman, 1979;
Salinger, 1991).
(2) Do cable subscribers enjoy greater diversity from the integrated MSOs?
1-12: Cable subscribers of integrated MSOs enjoy a lower degree of channel diversity
than those of nonintegrated MSOs. The more heavily integrated the system is, the
smaller the diversity will be.
If the cable consumers did benefit from the vertical integration of the cable industry,
the subscribers of integrated MSOs should have greater diversity than those of
nonintegrated MSOs. It should be recalled that the proponents of vertical integration
argue that MSOs' investments in the upstream distribution stage have facilitated more
cable programming networks. Therefore, the subscribers of integrated MSOs deserve to
enjoy greater diversity.
Unfortunately, however, the unique structure of the cable industry appears not to
allow the subscribers to enjoy greater diversity. If there are transaction efficiencies from
the integration, the profit-maximizing incentives would command the monopolist to cam,
the affiliated networks, thereby narrowing his freedom of program choice. If the cable
monopolist find it more strategically profitable to "favor" the affiliated networks, or to
discriminate against the unaffiliated, it also Nvill result in restricted carriage decision. In
either case, the outcome will be the same: reduced channel diversity. Considering the
differences in the number of integrated networks among the MSOs, more heavily
integrated MSOs should show more reduced diversity.
This pattern can be strengthened by de facto monopoly situation in most local cable
markets. Thus the backward integration of local monopoly is likely to provide cable
subscribers with some grotesque, ungrateful services for a period of time. In this sense,
integration and long-term contracts are oftentimes associated with low quality
(Rotemberg, 1991). Eccles and White (1988) report that low quality and internal
transactions go hand in hand. They also suggest that transactions costs actually increase
when firms engage in internal transactions.
Several studies have attempted to measure the effect of market structure on program
diversity. As these have been extensively reviewed elsewhere (Litman, 1992) and are not
germane to the issue at hand, their results are omitted here. Nonetheless, two important
findings are worth mentioning. First, Owen, Beebe and Manning (1974) and Owen and
Wildman (1992) demonstrated that diversity was functionally related to market structure
and teclmological factors affecting the number of available channels, and the financing
method of generating revenues. More important is Litman's (1992) insightful finding that
diversity is a commodity. He aptly explicates that the abstract concept of program
'diversity' from the standpoint of assuming diversity is more like an economic product
than a policy or performance goal. As an economic product, it operates in a marketplace,
and like other similar products, generates positive utility to those who consume it. Most
importantly, "diversity obeys the laws of supply and demand" (Litman, 1992, p. 147).
Litman asserts that for the basic cable and other multichannel television industries on the
horizon, "diversity is the product itself 11).148).
2. Methods
Vertical integration refers to the situation where various firms in an industry
simultaneously operate at more than one stage of production. For this study, the term is
operationalized as the cable system operator's ownership of cable programming networks.
More specifically, vertical integration is defined as a cable system operator's having at least
5 percent share of the programming network's equity.
The largest 25 MSOs were divided into two groups. First, TCI, Time Warner,
Comcast, Cox, Newhouse Broadcasting, and Viacom consist of the integrated MSO
group. Bas.ed on the list of cable systems in Television and Cable Factbook 1993 Edition,
250 systems from these MSOs were selected based on a weighed random sampling
method.
Second, nine MSOs with no financial interest in cable programming networks consist
of the nonintegrated group. This group is composed of Cablevision hid., Adelphia
Communications, Falcon Cable, Sammons, and so forth. Again, 250 systems were
selected. Due to incomplete or out-of-date information on systems initially selected in the
sample, 59 cases were eliminated, resulting in the analysis of total 441 cases.
There still remain 10 MSOs that have ownership interests in more than one cable
programming network, but less than four. For comparison reasons, these MSOs are
excluded from the sample. This threshold of four networks is not arbitrary. No MSO in
this group is affiliated with top 25 cable networks in terms of subscribership reach. Rather,
they have ownership ties with minor networks such as Mind Extension University, Prevue
Guide, or Viewer's Choice Networks. Hence excluded in the present study are Cablevision
l 6
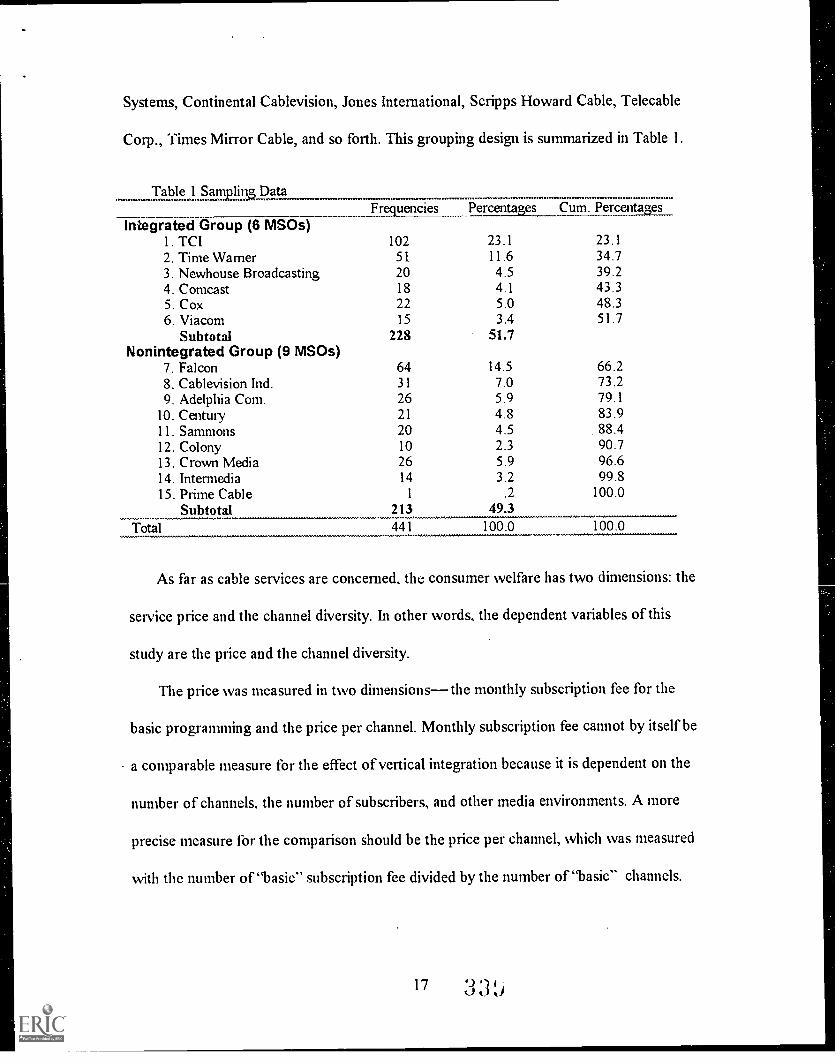
Systems, Continental Cablevision, Jones International, Scripps Howard Cable, Telecable
Corp., "limes Mirror Cable, and so forth. This grouping design is summarized in Table 1.
Table 1 Sans lins DataFrequencies Percentages Cum. Percentages
Integrated Group (6 MS0s)1. TCI 102 23.1 23.12. Tirne Wamer 51 11.6 34.73. Newhouse Broadcasting 20 4.5 39.24. Comcast 18 4.1 43.35. Cox 22 5.0 48.36. Viacom 15 3.4 51.7
Subtotal 228 51.7Nonintegrated Group (9 MSOs)
7. Falcon 64 14.5 66.28. Cablevision Ind. 31 7.0 73.29. Adelphia Com. 26 5.9 79.1
10. Century 21 4.8 83.911. Sammons 20 4.5 88.412. Colony 10 2.3 90.713. Crown Media 26 5.9 96.614. Intermedia 14 3.2 99.815. Prime Cable 1 .2 100.0
Subtotal 213 49.3Total 441 100 0 100.0
As far as cable services are concerued, the consumer welfare has two dimensions: the
service price and the channel diversity. In other words, the dependent variables of this
study are the price and the channel diversity.
The price was measured in two dimensions-the monthly subscription fee for the
basic programming and the price per channel. Monthly subscription fee cannot by itself be
a comparable measure for the effect of vertical integration because it is dependent on the
number of channels, the number of subscribers, and other media environments. A more
precise measure for the comparison should be the price per channel, which was measured
with the number of "basic" subscription fee divided by the number of "basic" channels.
Here the "basic" channel includes broadcast channels and advertiser-supported cable
channels but excludes the public-educational-governmental access channels.
Diversity is divided into two categories: absolute and relative. An absolute measure
indicates-only how many different channel types are found in a cable system. To promote
comparisons, however, Levin (1971, 1980) defined absolute diversity as the number of
different channel types carried by a cable system divided by the total number of channel
types for the cable industry. This measure indicates how close to the total potential
diversity any system gets. Following Levin (1971), "relative diversity" was defined in
terms of the number of different channel types divided by the channel capacity of the
system. This relative diversity indicates how many diverse programming services a system
carries within its available channel capacity. For the comparison of channel diversity across
systems, a single measure is more helpful. Average diversity developed by De Jong and
Bates (1991), is defined as the simple average of the absolute and relative diversity
measures.
V. Results
I. General Characteristics
Table 2 represents general system differences between integrated MSOs and
nonintegrated MS0s. The two groups show statistically significant differences in many
system characteristics. The most remarkable differences are the number of total basic
subscribers and the plant size. Integrated MSO systems are serving more than two times
larger areas than are the nonintegrated MSO systems, with the former having two and half
18 3 4
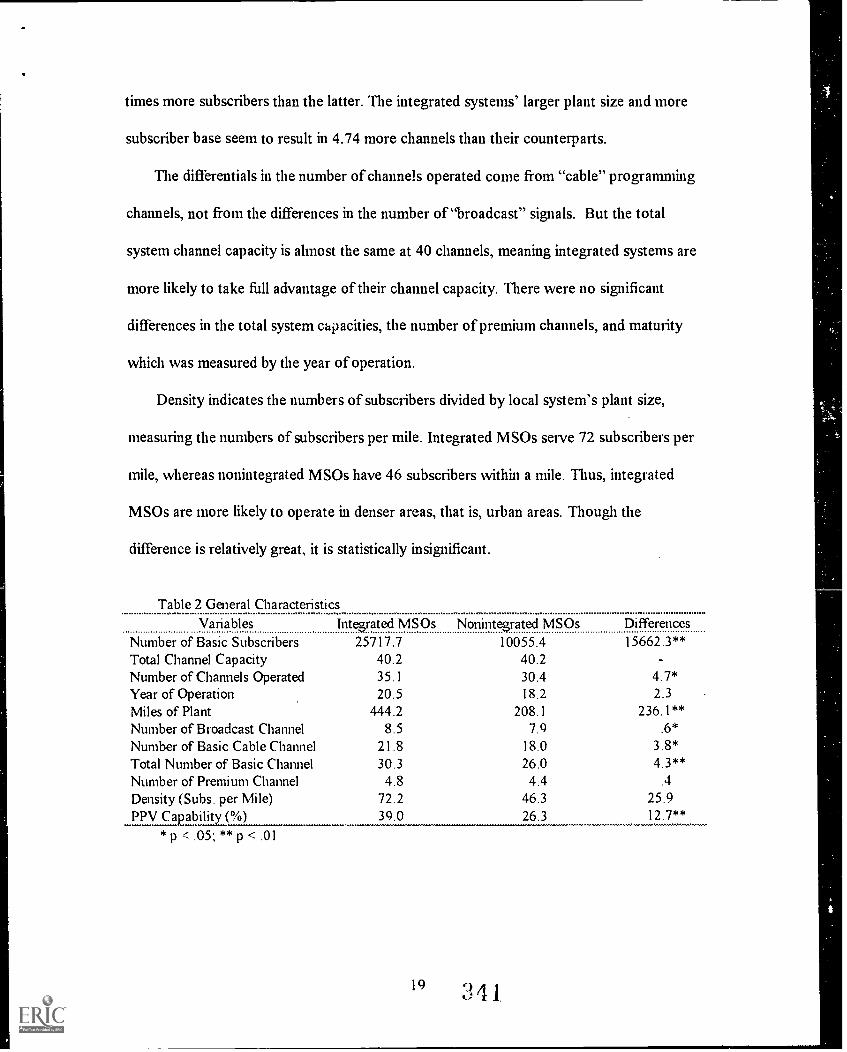
times more subscribers than the latter. The integrated systems' larger plant size and more
subscriber base seem to result in 4.74 more channels than their counterparts.
The differentials in the number of channels operated come from "cable" programming
channels, not from the differences in the number of "broadcast" signals. But the total
system channel capacity is almost the same at 40 channels, meaning integrated systems are
more likely to take fitll advantage of their channel capacity. There were no significant
differences in the total system capacities, the number of premium channels, and maturity
which was measured by the year of operation.
Density indicates the numbers of subscribers divided by local system's plant size,
measuring the numbers of subscribers per mile. Integrated MSOs serve 72 subscribers per
mile, whereas nonintegrated MSOs have 46 subscribers within a mile. Thus, integrated
MSOs are more likely to operate in denser areas, that is, urban areas. Though the
difference is relatively great, it is statistically insignificant.
Table 2 General CharacteristicsVariables Intezrated MSOs Noninte3rated MSOs Differences
Number of Basic Subscribers 25717.7 10055.4 15662.3**Total Channel Capacity 40.2 40.2Number of Channels Operated 35.1 30.4 4.7*Year of Operation 20.5 18.2 2.3Miles of Plant 444.2 208.1 236.1**Number of Broadcast Channel 8.5 7.9 .6*
Number of Basic Cable Channel 21.8 18.0 3.8*Total Number of Basic Channel 30.3 26.0 4.3**Number of Premium Channel 4.8 4.4 .4
Density (Subs. per Mile) 72.2 46 3 25.9PPV Capabiity (%)--------------- 39.0 26 3 _......__.....
* p < .05; ** p < .01
19 341
PPV capability represents the percentages of cable systems that offer the subscriber
pay-per-view options. To the extent that PPV capability represents technological
progressiveness, integrated MSOs are more technologically progressive (39%) than are
nonintegrated MSOs (26%).
The correlation coefficients among the variables included in the analysis are shown in
Table 3. As a whole, the number of subscribers is highly positively related with the plant
size (r = .8445, P < .001). The number of subscribers is moderately related with number of
basic channels (r = .4253, P < 001), and hence the absolute diversity (r = .4446, P < .001).
The price factors, such as the average basic subscription fee and the average price per
channel, showed lower relationships with the number of subscribers.
As commonly expected, channel capacir y of the cable system was a major factor for
the number of basic channels (r = .5971, P < .001), and hence the absolute diversity
measure (r = 5683, P < .001). The number of basic channels is highly positively related
with the absolute diversity (r = .9167, P < .001) and highly negatively related with the
average price per channel (r = - .7902, P < .001).
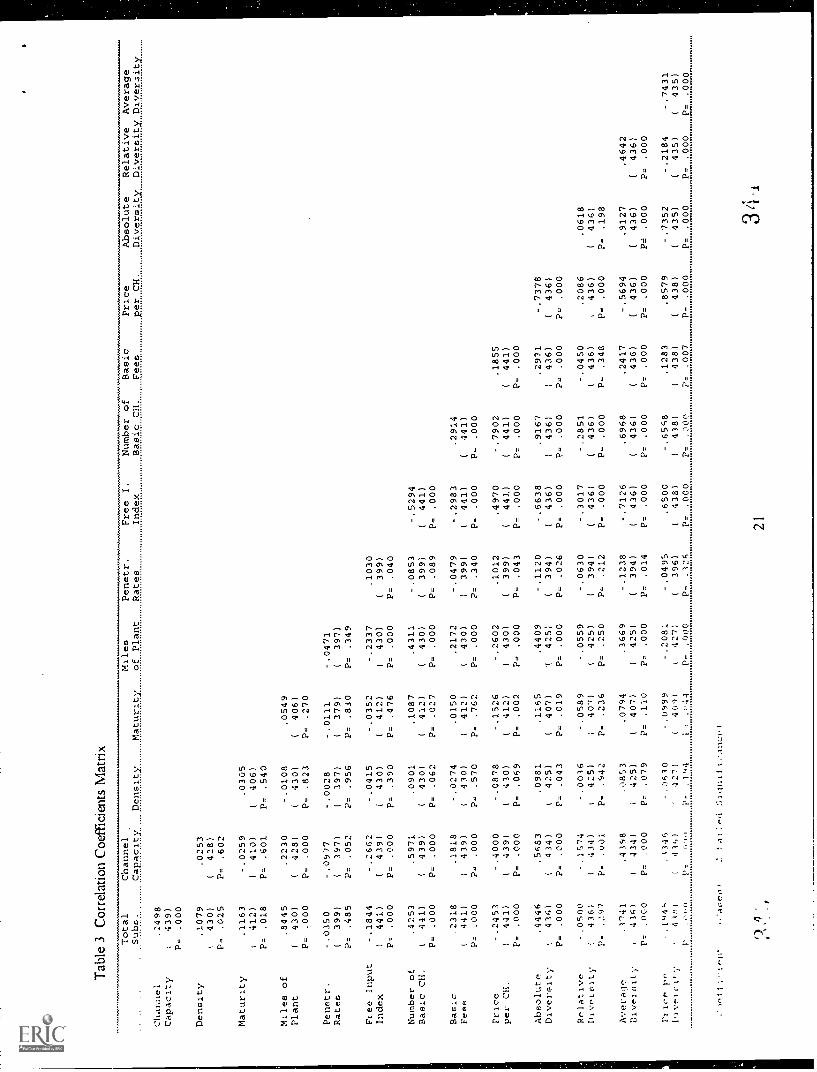
Tab
le 3
Cor
rela
tion
Coe
ffic
ient
s M
atri
x
Total
Channel
Sube.
Capacity
Density
Channel
.2498
Capacity
439)
Maturity
Number of
Basic CH.
Basic
Fees
Price
per CH.
Absolute
Diversity
Relative
Average
Diversity Diveraity
Miles
of Plant
Penetr.
Rates
Free I.
Index
P= .000
Density
.1079
.0253
i430)
(428)
P= .025
P= .602
Maturity
.1163
-.0259
.0305
t412)
(410)
(406)
P= .018
P. .601
P= .540
Miles of
.8445
.2230
-.0108
.0549
Plant
(430)
(428)
(430)
(406)
P= .000
P= .000
P= .823
P= .270
Penetr.
-.0350
-.0977
-.0028
-.0111
-.0471
Rates
(399)
(397)
(397)
(379)
(397)
Ps
.485
P. .052
P=
.956
P= .830
P= .349
Flee Input
-.1844
-.2662
-.0415
-.0352
-.2337
.1030
Index
(441)
(439)
(430)
(412)
(430)
(399)
P=
.000
P. .000
P=
.390
P= .476
P= .000
P= .040
Number of
.4253
.5971
.0901
.1087
.4311
-.0853
-.5294
Basic CH.
(441)
(439)
(430)
(412)
(430)
(399)
(441)
P..
.000
P= .000
P= .062
P= .027
P. .000
P= .089
P= .000
Basic
.2318
.1818
-.0274
.0150
.2172
-.0479
-.2983
.2914
Fees
(441)
(439)
I430)
(412)
(430)
I399)
(441)
(441)
P= .000
Ps .000
P= .570
ps .762
P= .000
P= .340
P= .000
P= .000
Price
-.2453
-.4000
-.0878
-.1526
-.2602
.1012
.4970
-.7902
.1855
per CH.
(441)
(439)
(430)
(412)
(430)
(399)
(441)
(441)
(441)
P= .000
P= .000
P= .069
P= .002
P= .000
P= .043
P= .000
P= .000
P= .000
Absolute
.4446
.5483
.0981
.1165
.4409
-.1120
-.6638
.9167
.2971
-.7378
Diversity.
436)
(434)
(425)
(407)
1425)
(394)
(436)
(436)
(436)
(436)
P= .000
P=
.000
Ps
.043
P= .019
P= .000
P. .026
P= .000
P= .000
P= .000
P= .000
Relative
-.0500
-.1574
-.0016
-.0589
-.0559
-.0630
-.3017
-.2851
-.0450
.2086
.0618
Diveisity
!436)
(434)
I425)
407)
(425)
I394)
I436)
(436)
(436)
,436)
(436)
P=
-297
P.
.v01
P=
.942
P= .236
P. .250
Ps
.212
P= .000
P= .000
P. .348
P= .000
P= .198
Average
.3741
.4398
.0853
.0794
.3669
-.1238
-.7126
.6968
.2417
-.5694
.9127
.4642
Diveteity
t436)
(434)
i425)
(407)
(425)
(394)
(436)
(436)
(436)
(436)
(436)
(436)
P=
.000
P=
.000
P=
.079
P= .110
P. .000
P=
.014
P= .000
P= .000
P= .000
P= .000
P= .000
P= .000
NICA 1,,,
-.1.44',
.1346
-.0610
-.0999
-.2081
-.0495
.6500
-.6558
.1283
.8579
-.7352
-.2184
-.7431
Divf.irity
144:i)
141,,)
427/
(40,4)
(427)
(396)
(438)
I438)
(438)
(438)
I435)
I435)
(435)
P=
.1q4
i'-,
.n44
P.
.000
P=
.124
P=
.000
P= .000
P.
.007
P= .000
P= .000
P= .000
P= .000
.Casr!ot
213
4I
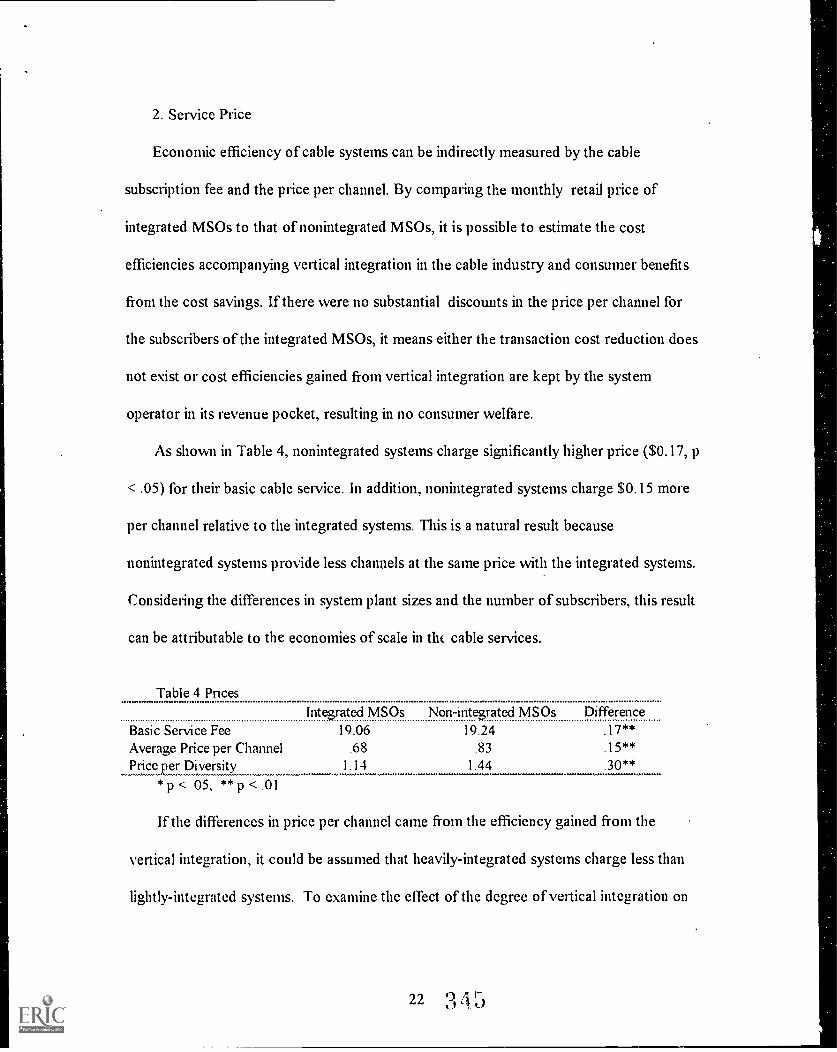
2. Service Price
Economic efficiency of cable systems can be indirectly measured by the cable
subscription fee and the price per channel. By comparing the monthly retail price of
integrated MSOs to that of nonintegrated MSOs, it is possible to estimate the cost
efficiencies accompanying vertical integration in the cable industry and consumer benefits
from the cost savings. If there were no substantial discounts in the price per channel for
the subscribers of the integrated MSOs, it means either the transaction cost reduction does
not exist or cost efficiencies 2ained from vertical integration are kept by the system
operator in its revenue pocket, resulting in no consumer welfare.
As shown in Table 4, nonintegrated systems charge significantly higher price ($0.17, p
< .05) for their basic cable service. In addition, nonintegrated systems charge $0.15 more
per channel relative to the integrated systems. This is a natural result because
nonintegrated systems provide less chamtels at the same price with the integrated systems.
Considering the differences in system plant sizes and the number of subscribers, this result
can be attributable to the economies of scale in tht cable services.
Table 4 Prices1ntsrated MSOs Non-intsrated MSOs Difference
Basic Service Fee 19.06 19.24Average Price per Channel .68 .83 .15**Pricuer Diversity 1.14 1.44 .30**
* p < 05, ** p < .01
If the differences in price per channel came from the efficiency gained from the
vertical integration, it could be assumed that heavily-integrated systems charge less than
lightly-integrated systems. To examine the effect of the degree of vertical integration on
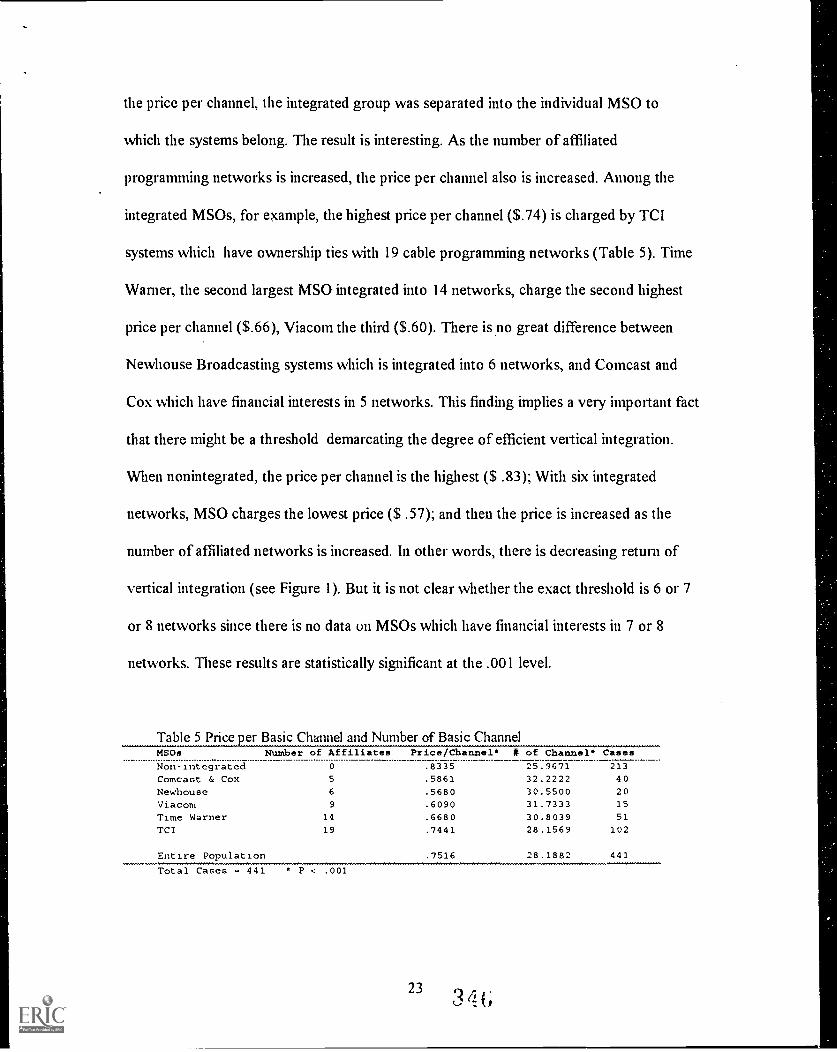
the price per channel, the integrated group was separated into the individual MSO to
which the systems belong. The result is interesting. As the number of affiliated
programming networks is increased, the price per channel also is increased. Among the
integrated MSOs, for example, the highest price per channel ($.74) is charged by TCI
systems which have ownership ties with 19 cable programming networks (Table 5). Time
Warner, the second largest MSO integrated into 14 networks, charge the second highest
price per channel ($.66), Viacom the third ($.60). There is no great difference between
Newhouse Broadcasting systems which is integrated into 6 networks, and Comcast and
Cox which have financial interests in 5 networks. This finding implies a very important fact
that there might be a threshold demarcating the degree of efficient vertical integration.
When nonintegrated, the price per channel is the highest ($ .83); With six integrated
networks, MSO charges the lowest price ($ .57); and then the price is increased as the
number of affiliated networks is increased. In other words, there is decreasing return of
vertical integration (see Figure I). But it is not clear whether the exact threshold is 6 or 7
or 8 networks since there is no data on MSOs which have financial interests in 7 or 8
networks. These results are statistically significant at the .001 level.
Table 5 Price icr Basic Channel and Number of Basic ChannelMSOs Number of Affiliates Price/Channel' # of Channel' Cases
Non-integrated 0 .8335 25.9671 213
Comcast & Cox 5 .5861 32.2222 40
Newhouse 6 .5680 30.5500 20
Viacom 9 .6090 31.7333 15
Time Warner 14 .6680 30.8039 51
TCI 19 .7441 28.1569 102
Entire Population .7516 28.1882 441
Total Cases = 441 P < .001
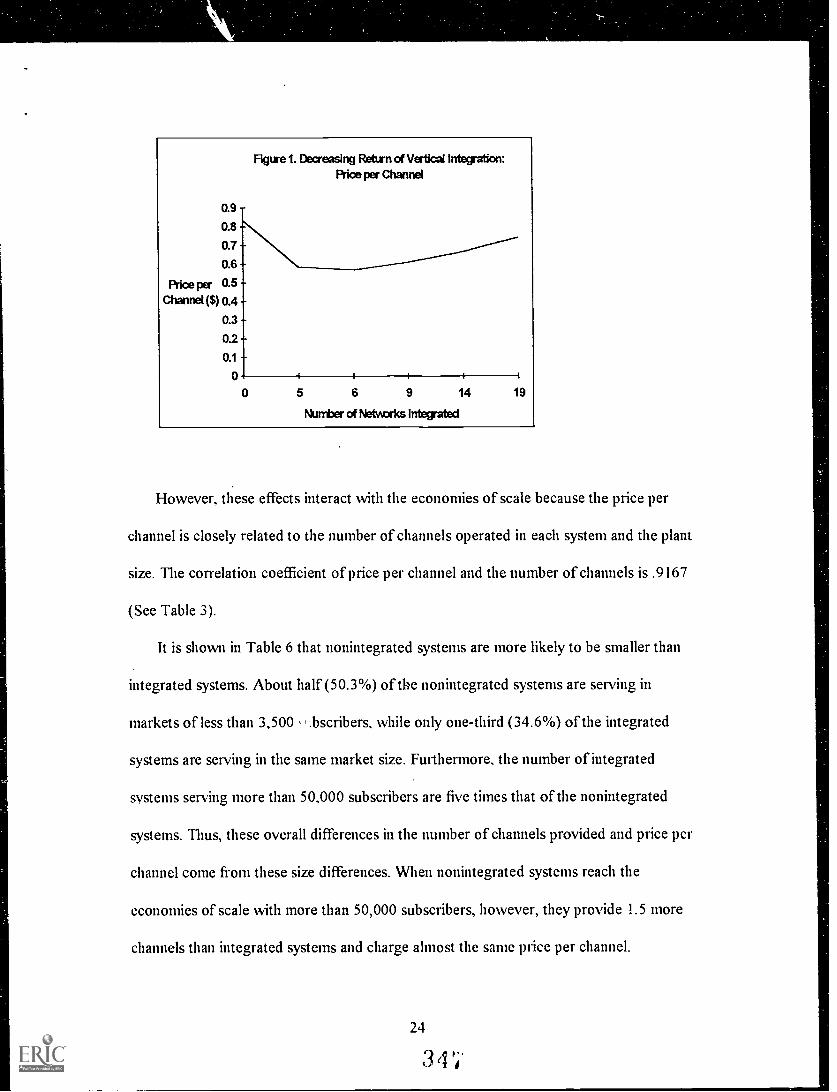
0.9 -
0.8 -
0.7 -
0.6 -
Rice per 0.5Channel ($) a4
0.3 -
0.2 -
0.1
Figtre 1. Decreasing Rehrn of Vertical lntegralico:Price per Channel
0 i I
0 5 6 9 14 19
Nunter of Netwcrks Integrated
However, these effects interact with the economies of scale because the price per
channel is closely related to the number of channels operated in each system and the plant
size. The correlation coefficient of price per channel and the number of channels is .9167
(See Table 3).
It is shown in Table 6 that nonintegrated systems are more likely to be smaller than
integrated systems. About half (50.3%) of the nonintegrated systems are serving in
markets of less than 3,500 bscribers, while only one-third (34.6%) of the integrated
systems are serving in the same market size. Furthermore, the number of integrated
systems serving more than 50,000 subscribers are five times that of the nonintegrated
systems. Thus, these overall differences in the number of channels provided and price per
channel come from these size differences. When nonintegrated systems reach the
economies of scale with more than 50,000 subscribers, however, they provide 1.5 more
channels than integrated systems and charge almost the same mice per channel.
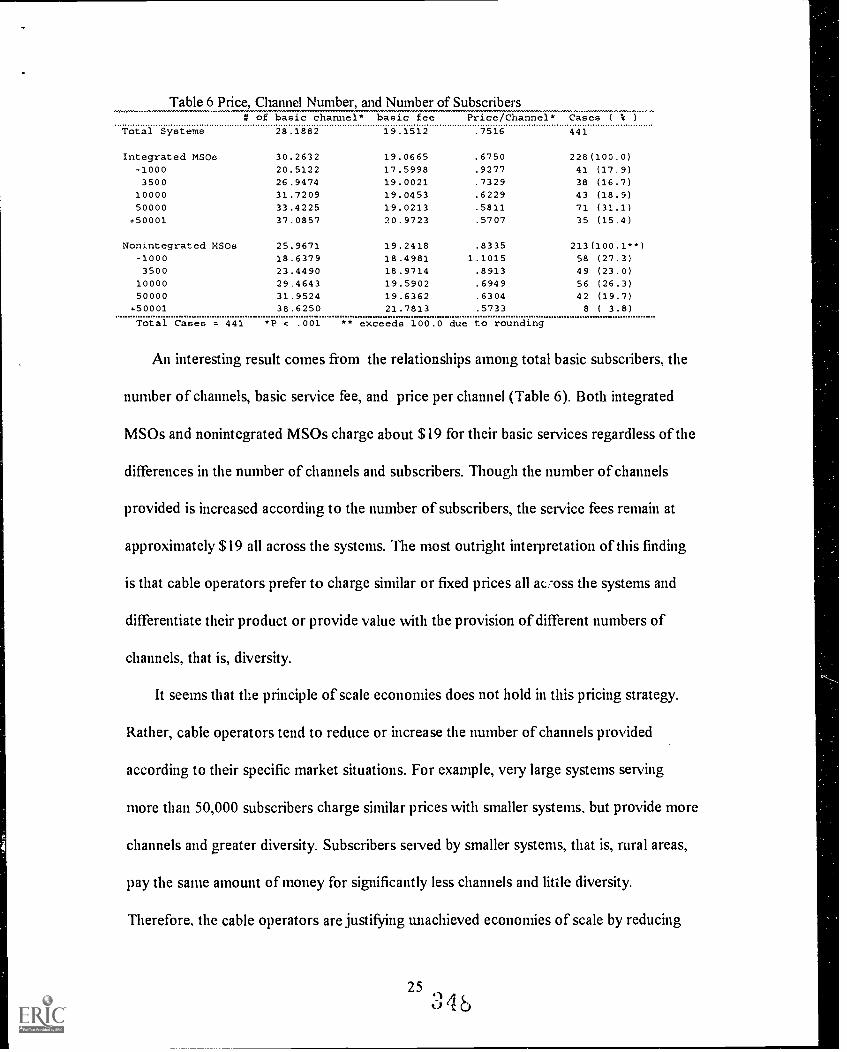
Table 6 Price, Channel Number, and Number of Subscribers
Total Systems
Integrated MSOs
# of basic channel* basic fee28.1882 19.1512
30.2632 19.0665
Price/Channel*.7516
.6750
Cases ( t )
441
228(100.0)-1000 20.5122 17.5998 .9277 41 (17.9)3500 26.9474 19.0021 .7329 38 (16.7)
10000 31.7209 19.0453 .6229 43 (18.9)50000 33.4225 19.0213 .5811 71 (31.1)+50001 37.0857 20.9723 .5707 35 (15.4)
Nonintegrated MSOs 25.9671 19.2418 .8335 213(100.1**)-1000 18.6379 18.4981 1.1015 58 (27.3)3500 23.4490 18.9714 .8913 49 (23.0)
10000 29.4643 19.5902 .6949 56 (26.3)50000 31.9524 19.6362 .6304 42 (19.7)
+50001 38.6250 21.7813 .5733 8 ( 3.8)
Total Cases = 441 *P < .001 ** exceeds 100 0 due to rounding
An interesting result comes from the relationships among total basic subscribers, the
number of channels, basic service fee, and price per channel (Table 6). Both integrated
MSOs and nonintegrated MSOs charge about $19 for their basic services regardless of the
differences in the number of channels and subscribers. Though the number of channels
provided is increased according to the number of subscribers, the service fees remain at
approximately $19 all across the systems. The most outright interpretation of this finding
is that cable operators prefer to charge similar or fixed prices all ac:oss the systems and
differentiate their product or provide value with the provision of different numbers of
channels, that is, diversity.
It seems that the principle of scale economies does not hold in this pricing strategy.
Rather, cable operators tend to reduce or increase the number of channels provided
according to their specific market situations. For example, very large systems serving
more than 50,000 subscribers charge similar prices with smaller systems, but provide more
channels and greater diversity. Subscribers served by smaller systems, that is, rural areas,
pay the same amount of money for significantly less channels and little diversity.
Therefore, the cable operators are justifying unachieved economies of scale by reducing
their programming costs rather than by charging higher prices. This strategy clearly
reflects the market power cable systems enjoy in rural areas, and the competition and
greater public scrutiny cable operators face in urban areas. In short, the cable operators
use the manipulation of diversity, while fixing the service fee at similar prices, in response
to each market condition. Litman's (1992) contention that diversity is commodity and
product itself can be better understood in this context.
Then, why do the cable operators prefer to manipulate diversity rather than price?
First, it seems that differentials in prices among markets are more sensitive and easily
detectable than are those in diversity. A slight difference in subscription fees for the "same
basic service" in the consumers' eyes may lead to complaints fiom the subscribers and
serious marketing problems for smaller systems. But differentials in diversity may go
undetected, thereby allowing the cable operator to avoid complaints from the consumer
and strict scrutiny from franchising authority, despite significant product differences
among markets. The result is that cable subscribers of small systems pay approximately
similar prices for half the number of channels of the largest systems.
Second, decisions of how many channels should be provided could be much easier
and more profitable. Tke cable operators do not need to deal with whimsy and fastidious
subscribers. They can easily find cheap or in some cases even free channels desperately
seeking out an access to the bottleneck of local monopoly. Stated differently, the cable
operators have the upper hand in dealing with diversity, while they should bear in mind
that they will get the narrow edge of the sword to increase the price.
3. Diversity
The diversity measures show strikingly similar results with the price measures. Table
7 shows that integrated MSOs are providing greater diversity than are nonintegrated
MSOs. Integrated MSOs provide their subscribers with approximately 18 different basic
program types, while nonintegrated MSOs offer slightly more than 15 program types (P <
.05). Integrated MSOs showed better performance in total diversity which includes basic
channels, premium channels, and PPV options. But the difference in total diversity came
primarily from the basic channels (2.43) since premium channels widened the gap only by
.13 different program type.
In terms of the absolute diversity which measures, without controlling the number of
channels, total different program types offered on a system, integrated MSOs show better
performance than their counterparts do. Though the difference is very small, it is obviously
significant from the viewpoint of statistics (P < .01). This is also a result of the differences
in the number of channels operated. No difference in relative diversity supports this
assertion. There is no significant difference in average diversity.
Table 7 Diversitylntesrated MSOs Non-intesrated MSOs Difference
Basic Diversity 17.77 15.34 2.43*Total Diversity 20.24 17.66 2.57**Absolute Diversity .63 .55 .08**Relative Diversity .58 .58 .00Averaff_pity_ .60 .57 .03
*p < .05; **p < .01
To investigate the effect of the degree of vertical integration on the diversity, the
same procedure was applied (Table 8). Here again, a decreasing return of vertical
integration appears to exist Figure 2). Compared to the integrated group, nonintegrated
27 3 5
MSOs provide less diversity. Among the integrated MS0s, however, the greatest diversity
was found in Comcast and Cox (absolute diversity = .7266, relative diversity = .6582),
whereas the least absolute diversity (.5838) and average diversity (.5809) were discovered
in TCI. In general, absolute diversity and average diversity are decreased as the number of
affiliated networks is increased (P < .001). But again, both measures of absolute diversity
and average diversity are highly likely to be confounded with the number of channels
operated. Nonintegrated MSOs provide the least different program types. In terms of
relative diversity, there seems to be no consistent pattern. Although nonintegrated MSO
group provides slightly greater diversity, the difference is insignificant.
Table 8 The Devee of Vertical Inteyation and DiversityMSOs Number of Affiliates Absolute** Relative Average** Cases
Nonintegrated 0 .5521 .5897 .5709 211
Comcast & Cox 5 .7266 .5899 .6582 40
Newhouse 6 .6414 .6014 .6214 19
Viacom 9 .6500 .5619 .6060 15
Time Warner 14 .6475 .5764 .6120 50
TCI 19 .5838 .5779 .5809 101
Entire Population .5937 .5850 .5893 436
Total 'Eases-7-441 Z-4-iosinT-E-ase-s-7F-or1.1-7-ct .07-1)
0.66 -
0.64 -
0.62 -
Average 0.6Diversity 0.58 _
0.56 -
0.54 -
0.52
Figure 2. Decreasing Return of Vertical Integration:Average Diversity
0 5 6 9 14 19
Number of Networks Integrated
2851
An important implication from this finding is that vertical integration tend to contract
an MSO's freedom of program choices. In other words, the natural propensity or
economic imperative to favor their affiliates in carriage decisions may lead to the reduction
of the absolute and average diversity since more integrated MSOs have less number of
options in terms of diversity. For example, if TCI were to favor its affiliates, TCI would
provide lower diversity than less integrated or nonintegrated MSOs because not every TCI
affiliate provides exclusively discrepant types of programming. In contrast, nonintegrated
MSOs can have much wider spectrum of programming options.
Table 8 seems to support this line of reasoning. The more integrated the system, the
less the diversity. Both absolute diversity and average diversity are decreased as the
degree of vertical integration is increased (P < .001). The lower absolute diversity and the
average diversity of the nonintegrated MSOs are a direct outcome of their less channel
capacities as indicated by correlation coefficient between those two variables (r = .5683, P
< .001 for the absolute diversity; r = .4398, P < .001 for the average diversity). Lack of
significant differences in the relative diversity supports this inference.
VI. Discussions
The monopoly position of local cable systems has been obtained through a declining
long-run average cost. When a business enterprise possesses monopoly power at one level
of production or distribution, vertical integrwion may enable it to extend that power to
earlier or later levels, or use it for strategic advantages of access or product foreclosure.
Such a case arises where a part of the integrated concern's field of operation lies in a
29 ,3 5
segment of the economy that is exempt from the general public policy of competition.
Cable business operates in a field which entry is limited by local governments.
The possibility of anticompetitive effects is remote as long as the vertically integrated
concern controls only small fraction of the business done at each successive level of
activity in the field of business in which it operates and so long as its size is not
significantly different from the size of its rivals. But when a vertically integrated concern is
a large one in the sense that it controls a substantial part of the total volume of business
done at one or more levels of activity in its field of business, the fact that a single business
unit extends over several successive levels becomes the source of special opportunities for
the exercise of business power (Edwards, 1953). Hence monopoly power can be
exacerbated.
Even in this case, however, the consumer welfare should be taken into account as an
important standard for the final judgment. The data analyzed in this study provide by no
means conclusive results. Instead, the findings show mixed meanings. While the integrated
MSOs provide the consumer with greater diversity and lower prices than their
nonintegrated copterparts, these effects are intertwined with the economies of scale.
Where comparable economies of scale have been achieved, the nonintegrated MSOs
showed a better performance in terms of the number of channels.
An interesting finding of this study is that within the integrated group, the consumer
benefited more from the moderately-integrated MSOs than from the heavily-integrated
MSOs. This means there exists a threshold that the consumer welfare cou'd be maximized
30
from the scale economies and the vertical integration in the cable services. Uncovering the
exact threshold is reserved for future research.
The FCC announced its new "cost-of-service" rules in 1994. In the new rate
regulation, the FCC established a uniform rate of return at 11.25%. Along with taxes on
the provision of cable service, franchise fees and the costs of meeting franchise
requirements, programming costs are included in external costs that will be exempted from
the base for the rate (CableWorld, 1994). In this new regulatory scheme, the extensive
vertical integration in the cable industry casts another implication. Uninhibited by
regulatory constraint, a cable monopolist could be expected to exercise full monopoly
power in the exhibition stage and would not have any incentive to integrate backward into
the distribution and the production stages. But if cable system is subjected to effective
rate-of-return regulation, a unique incentive for vertical integration into the upstream stage
is created: avoidance of rate-of-return regulation.
If regulation is restricted to the final stage of production and the finn is permitted to
integrate upstream into the supply industry, then it is possible for the firm to circumvent
the effect of the regulatory constraint completely by transfer pricing the internally supplied
intermediate product above its marginal production cost. The practical difficulties inherent
in allocating costs between the various levels of an integrated enterprise make the task of
the regulatory body extremely difficult even assuming that it can bring together the
records of the company from every level. Economisis (Adelman, 1949; Stigler, 1951;
Edwards, 1953, Kahn, 1971) have pointed out this possibility of avoiding the rate
regulation by adopting a vertical integration. Simply put, "by integrating backward, the
regulated firm can increase its profits and avoid input distortions" (Blair and Kaserman,
1983, p.111). Therefore, faced with increasing trend in, and combination of, vertical
integration and market concentration in the cable industry, much more vigilant
investigations are warranted than ever. This study could not reveal the effect of rate
regulation since the data were gathered before the new rate regulation. Future studies are
expected to do this task.
References
Adams, Walter and Dirlam, Joel B. (1964), "Steel Imports and Vertical Oligopoly Power,"American Economic Review, Vol.14, No.5, September, pp. 626-655.
Adelman, M. A. (1949), "Integration and Antitrust Policy," Harvard Law Review, Vol.63, November, pp 27-77.
Blair, Roger and Kaserman, David (1983), Law and Economics of Vertical Integrationand Control, New York: Academic Press.
Bork, Robert (1954), "Vertical Integration and the Sherman Act: The Legal History of anEconomic Misconception," University of Chicago Law Review, V.22, pp.183-84.
Brennan, Timothy J. (1990), "Vertical Integration, Monopoly and the First Amendment,-Journal of Media Economics, Spring, pp57-76
CableWorld (1994), April 18.Carlton, D. W. (1979), "Vertical Integration in Competitive Markets Under Uncertainty,"
Journal of Industrial Economics, Vol. 27, No. 3, pp. .189-209.Coase, Ronald H. (1937), "The Nature of the Firm," Economica, Vol. 4, November,
pp387-405Comanor, William S. (1967), "Vertical Mergers, Market Powers, and the Antitrust Laws,-
American Economic Review, May, Vol.57, No.2, 1)1).254-265.De Chazeau, Melvin and Kahn, Alfred (1959), Integration and Competition in the
Petroleum Industry, New Haven: Yale University Press.De Jong, Allard Sicco and Bates, Benjamin J. (1991), "Channel Diversity in Cable
Television," Journal of Broadcasting and Electronic Media, Vol.35, No.2, Spring,pp. 159- 166.
Eccles, Robert G. and White, Harrison C. (1988), "Price and Authority in Inter-ProfitCenter Transactions," American Journal of Sociology, V.94, S17-S51.
Edwards, Corwin (1953), "Vertical Integration and the Monopoly Problem," The Journalof Marketing, Vol. 17, No. 4, pp.404-410.
FCC (1990), "Rate Deregulation and the Commission's Policies Relating to the Provisionof Cable Television Service", MM Docket No. 89-600, FCC Record, Vol.5, No. 16,pp. 4962-5129.
Flaherty, M. Therese (1981), "Price versus Quantities and Vertical Financial Integration,"Bell Journal of Economics, Spring, Vol.12, No.1, pp.507-525.
Green, Jerry R. (1986), "Vertical Integration and Assurance of Markets," pp.177-207. inJoseph E. Stiglitz and G. Frank Mathewson, New Developments in the Analysis ofMarket Structure, London: The Macmillan.
Kahn, Alfred E. (1971), The Economics of Regulation: Principles and Institutions, Vol.II,New York: John Wiley & Sons, Inc.
Kerkvliet, Joe (1991), "Efficiency and Vertical Integration: The Case of Mine-MouthElectric Generating Plants," Journal of Industrial Economics, September, pp.467-481.
Klein, Benjamin (1989), "The Competitive Consequences of Vertical Integration in theCable Industry," Working Paper for the National Cable Television Association,Washington, D.C. June.
Levin, Harvey J. (1971), "Program Duplication, Diversity, and Effective Viewer Choices:Some Empirical Findings," American Economic Review, Vol.61, No.2, May, pp.81-88.
Levin, Harvey J. (1980), Fact and Fancy in Television Regulation, New York: Russel SageFound:tion.
Lieberman, Marvin (1991), "Determinants of Vertical Integration: An Empirical Test,"Journal of Industrial Economics, Vol. 34, No. 5, September, pp. 451-467.
Litman, Barry R. (1979). The Vertical Structure of the Television Broadcasting Industry:The Coalescence of Power, East Lansing, MI: Michigan State University.
Litman, Barry R. (1992), "Economic Aspects of Program Quality: The Case forDiversity," Studies of Broadcasting. February, pp.121-156.
Machlup. F. and Taber, M. (1960), "Bilateral Monopoly, Successive Monopoly, andVertical Integration," Economica, Vol. 27, pp. 101-119.
Malmgren, H. B. (1961), "Information, Expectations and the Theory of the Firm,"Quarterly Journal of Economics, Vol. 75, pp.399-421.
McGee, John S. and Bassett, Lowell R. (1976), "Vertical Integration Revisited," Journalof Law and Economics, Vol. 14, April, pp.17-38.
Multichannel News (1994), Jan. 10.National Telecommunications and Information Administration (1988), Video program
Distribution and Cable Television: Current Policy Issues and Recommendations,NTIA Report 88-233, June.
Owen, Bruce and Wildman, Steven (1992), Video Economics, Cambridge, MA: HarvardUniversity Press.
Owen, Bruce, Beebe, Jack and Manning, Willard (1974), Television Economics,Lexington, MA: Lexington Books.
Peny, Martin K. (1978), " Vertical Integration: The Monopsony Case," AmericanEconomic Review, Vol.68, No.4, pp.561-570.
Perry, Martin K. (1989), "Vertical Integration: Determinants and Effects," Richard L.Schmalensee and Robert D. Willig eds., Handbook of Industrial Organization, Vol.1,Amsterdam, Netherlands: Elsevier Science Publisher.
Rotemberg, Julio J. (1991), "A Theory of Inefficient Intrafirm Transactions," AmericanEconomic Review, March, pp.191-209.
Salinger, M. (1991), "Vertical Mergers in Multi-product Industries and Edgeworth'sParadox of Taxation," Journal of Industrial Economics, Vol. 34, No. 5, September,pp. 545-556.
Spengler, Joseph J. (1950), "Vertical Integration and Antitrust Policy," Journal of PoliticalEconomy, V.58, pp.347-352.
Stigler, George J. (1951), "The Division of Labor is Limited by the Extent of the Market,"Journal of Political Economy Vol.59, No.3, June, pp.185-193.
Television and Cable Factbook, 1993 Edition.United States v. Paramount Pictures (1948), 334 U.S. 131.Waterman, David H. (1993), "A Model of Vertical Integration and Economies Scale in
Information Product Distribution," Journal of Media Economics, Fall, pp.23-35.Waterman, David H. and Weiss, Andrew A. (1993a), The Effects of Vertical Integration
between Cable Television Systems and Pay Cable Networks, Los Angeles, CA:Department of Economics, USC, Unpublished Manuscript.
Waterman, David H. and Weiss, Andrew A. (1993b), Vertical Integration in CableIndustry, A Working Paper prepared for The American Enterprise Institute for PublicPolicy Research, September, 17.
Williamson, Oliver E. (1971), "The Vertical Integration of Production: Market FailureConsiderations," American Economic Review, May, pp.112-127.
Williamson, Oliver E. (1974), "The Economics of Antitrust: Transaction CostConsiderations," University of Pennsylvania Law Review, Vol 122, pp.1439-1496.
Williamson, Oliver E. (1979), "Assessing Vertical Market Restrictions: AntitrustRamifications of the Transaction Cost Approach," University of Pennsylvania LawReview, Vol 127, pp.953-993.
Williamson, Oliver E. (1985), The Economic Institutions of Capitalism, New York: FreePress.
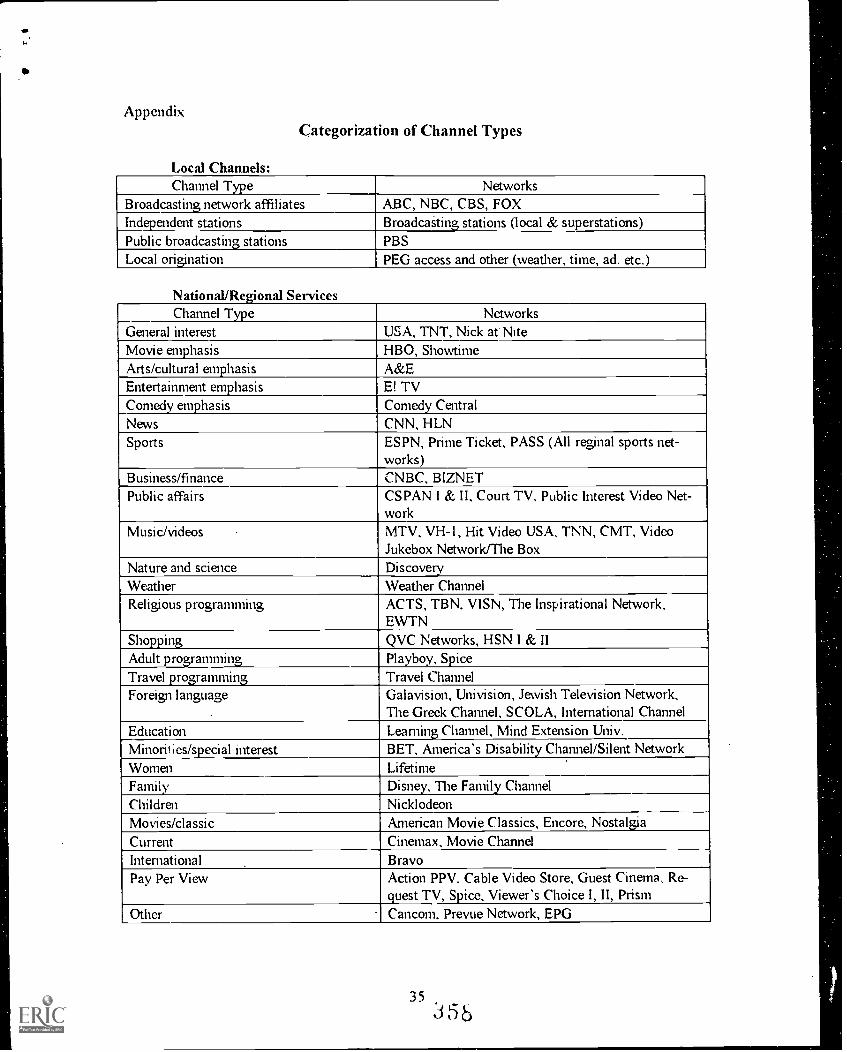
AppendixCategorization of Channel Types
Local Channels:Channel Type Networks
Broadcasting network affiliates ABC, NBC, CBS, FOXIndependent stations Broadcating stations (local & superstations)Public broadcasting stations PBSLocal origination PEG access and other (weather, time, ad. etc.)
NationaIJRerional ServicesChannel Type Networks
General interest USA, TNT, Nick at NiteMovie emphasis HBO, ShowtimeArts/cultural emphasis A&EEntertainment emphasis E! TV
Comedy CentralComedy emphasisNews CNN, HLNSports ESPN, Prime Ticket, PASS (All reginal sports net-
works)Business/finance CNBC, BIZNETPublic affairs CSPAN I & II, Court TV, Public Interest Video Net-
workMusic/videos MTV, VH-1, Hit Video USA, TNN, CMT, Video
Jukebox Network/The BoxNature and science DiscoveryWeather Weather ChannelReligious programming ACTS, TBN, VISN, The Inspirational Network,
EWTNShopping QVC Networks, HSN I & IIAdult programming Playboy, SpiceTravel programming Travel ChannelForeign language Galavision, Univision, Jewish Television Network,
The Greek Channel, SCOLA, International ChannelEducation Learning Channel, Mind Extension Univ.Minorities/special interest BET, America's Disability Channel/Silent Network
LifetimeWomenFamily Disney, The Family Channel
NicklodeonChildrenMovies/classic American Movie Classics, Encore, NostalgiaCurrent Cinemax, Movie ChannelInternational BravoPay Per View Action PPV. Cable Video Store, Guest Cinema, Re-
quest TV, Spice, Viewer's Choice I, II, PrismOther Cancom, Prevue Network, EPG
353 5 b