Marcos Kogan Integrated Plant Protection Center Oregon ...
250
1 Marcos Kogan Integrated Plant Protection Center Oregon State University Corvallis, Oregon 97331 U.S. by the year 2000. Critics complain that, depending on how one looks at IPM, either we already have exceeded that target, or in no way are we going to meet it. It all depends on how we define IPM and how we measure progress in IPM adoption. It would be useful to achieve consensus on a definition of IPM, but this is not easy. On the IPPC web site there is a compendium of IPM definitions (Bajwa and Kogan, 1997). At last count, the compendium included 67 published definitions. I would not be surprised if by the end of this conference, we did not hear of three or four new ones. Definitions usually are selected to suit one’s perspective or vested interests. I personally favor one that considers IPM primarily as a decision- making system for crop protection. I feel that IPM success hinges on the quality of the information that is available to support pest control decisions. A traditional pest control program becomes IPM when control (or management) decisions are based on the clear understanding of crop/pest ecological interactions and take into account not only the short term economic benefits to the producer, but also the long term benefits to the environment and to society. Through the course of this conference, we will have a chance to hear five guest speakers discuss some key issues that are being debated nationally and that may have a profound effect on the directions of agriculture in general, and IPM in particular, for many years to come. We will hear about the role of Extension in advancing IPM adoption, the impact of the Food Quality Protection Act of 1996 on pesticide use, the approaches being used to measure IPM adoption, and what we can expect Oregon has had a long and distinguished history of accomplishments in crop protection. F.L. Washburn, first entomology department head at State Agricultural College of Oregon, also taught the first course in economic entomology in 1889. Both Washburn and A.B. Cordley were Station entomologists and published on codling moth and San Jose scale in the late 1800s. Until 1911-12, little attention was given to pests of field crops; but soon after, work started on vetch, clover, alfalfa, field peas for seed, and hay. The department expanded with new faculty added and research focusing on all major fruit, vegetable, and field crops in the state (Richter, 1966). The first head of Botany and Horticulture was E.R. Lake (1888- 1891), and the first publication in plant pathology, “Investigations of Plant Diseases,” was issued in 1889. In 1894, Moses Craig published “Cause and Prevention of Plant Diseases” (Station Bull. No. 27). The name of the department was changed to Botany and Plant Pathology in 1909. Both entomology and plant pathology research and outreach at the College of Agricultural Sciences have contributed since then to solve insect pest and disease problems in agricultural and horticul- tural crops and in forestry. We are following in the steps of men and women who pioneered creative approaches to pest control when few control options were at their disposal. They compensated with keen observation of pest biology and resourcefulness. Much can be learned from these early professionals. This conference was conceived to offer a forum for all of us within the Oregon State University system, our counterparts and collaborators in other state agencies, and producers, commodity commission- ers, NGOs, and private consultants to assess where we are and where we should be going in IPM. We often are asked, “What is Oregon doing in integrated pest management?” We hope that as an outcome of this conference, we will be in a better position to answer this question. Nearly 30 years after first enunciated, the concept of IPM is undergoing severe scrutiny. The Federal administration established a goal to implement IPM on 75 percent of the land under agriculture in the “IPM is a decision support system for the selection and use of pest control tactics, singly or harmoni- ously coordinated into a manage- ment strategy, based on cost/ benefit analyses that take into account the interests of and impacts on producers, society, and the environment.” (Kogan, 1998).
-
Upload
khangminh22 -
Category
Documents
-
view
0 -
download
0
Transcript of Marcos Kogan Integrated Plant Protection Center Oregon ...

1
Marcos KoganIntegrated Plant Protection Center
Oregon State UniversityCorvallis, Oregon 97331
U.S. by the year 2000. Critics complain that,depending on how one looks at IPM, either wealready have exceeded that target, or in no way arewe going to meet it. It all depends on how wedefine IPM and how we measure progress in IPMadoption. It would be useful to achieve consensuson a definition of IPM, but this is not easy. On theIPPC web site there is a compendium of IPMdefinitions (Bajwa and Kogan, 1997). At last count,the compendium included 67 published definitions.I would not be surprised if by the end of thisconference, we did not hear of three or four newones.
Definitions usually are selected to suit one’sperspective or vested interests. I personally favorone that considers IPM primarily as a decision-making system for crop protection. I feel that IPMsuccess hinges on the quality of the informationthat is available to support pest control decisions. Atraditional pest control program becomes IPMwhen control (or management) decisions are basedon the clear understanding of crop/pest ecologicalinteractions and take into account not only theshort term economic benefits to the producer, butalso the long term benefits to the environment andto society.
Through the course of this conference, we will havea chance to hear five guest speakers discuss somekey issues that are being debated nationally andthat may have a profound effect on the directions ofagriculture in general, and IPM in particular, formany years to come. We will hear about the role ofExtension in advancing IPM adoption, the impact ofthe Food Quality Protection Act of 1996 onpesticide use, the approaches being used tomeasure IPM adoption, and what we can expect
Oregon has had a long and distinguished history ofaccomplishments in crop protection. F.L. Washburn,first entomology department head at StateAgricultural College of Oregon, also taught the firstcourse in economic entomology in 1889. BothWashburn and A.B. Cordley were Stationentomologists and published on codling moth andSan Jose scale in the late 1800s. Until 1911-12,little attention was given to pests of field crops; butsoon after, work started on vetch, clover, alfalfa,field peas for seed, and hay. The departmentexpanded with new faculty added and researchfocusing on all major fruit, vegetable, and fieldcrops in the state (Richter, 1966). The first head ofBotany and Horticulture was E.R. Lake (1888-1891), and the first publication in plant pathology,“Investigations of Plant Diseases,” was issued in1889. In 1894, Moses Craig published “Cause andPrevention of Plant Diseases” (Station Bull. No. 27).The name of the department was changed toBotany and Plant Pathology in 1909. Bothentomology and plant pathology research andoutreach at the College of Agricultural Scienceshave contributed since then to solve insect pestand disease problems in agricultural and horticul-tural crops and in forestry. We are following in thesteps of men and women who pioneered creativeapproaches to pest control when few controloptions were at their disposal. They compensatedwith keen observation of pest biology andresourcefulness. Much can be learned from theseearly professionals.
This conference was conceived to offer a forum forall of us within the Oregon State University system,our counterparts and collaborators in other stateagencies, and producers, commodity commission-ers, NGOs, and private consultants to assesswhere we are and where we should be going inIPM. We often are asked, “What is Oregon doing inintegrated pest management?” We hope that as anoutcome of this conference, we will be in a betterposition to answer this question.
Nearly 30 years after first enunciated, the conceptof IPM is undergoing severe scrutiny. The Federaladministration established a goal to implement IPMon 75 percent of the land under agriculture in the
“IPM is a decision support systemfor the selection and use of pestcontrol tactics, singly or harmoni-ously coordinated into a manage-ment strategy, based on cost/benefit analyses that take intoaccount the interests of andimpacts on producers, society, andthe environment.” (Kogan, 1998).
2
from the Federal and State governments to bringIPM closer to a global reality. We also will learnabout some very creative and cutting edge IPMwork being done here in Oregon. We hope that thisconference will reaffirm our confidence in thesoundness of the IPM concept and our commit-ment to make IPM a reality for the benefit of futuregenerations.
I would like to thank the University high administra-tion for its genuine support for IPM, as demon-strated by the presence at this opening session ofPresident Paul Risser and Dean Lyla Houglum,who will be offering welcoming addresses on behalfof Oregon State University. Thanks also to ourguest speakers for their willingness to share withus their experience and expertise in IPM and to theparticipants in the program and members of theaudience for the good work they are doing in IPM
around the state. Finally, I want to express myappreciation to my IPPC colleagues for the hardwork in helping organize this conference: MyronShenk, Allan Deutsch, Waheed Bajwa, Len Coop,and Linda Parks. Thank you all very much.
References
Bajwa, W.I. and M. Kogan. 1997. Compendium ofIPM Definitions. An electronic database.<http://www.ippc.orst.edu/IPMdefinitions/>
Kogan, M. 1998. Integrated Pest Management:Historical perspectives and contemporarydevelopments. Annu. Rev. Entomol. 43:243-270
Richter, P.O. 1966. A History of Entomology atOregon State University. Mimeo, Dept. ofEntomology Office, 47 pp.

3
I welcome you to this conference and to OregonState University. The chance to do that is morethan just a casual opportunity for me. I have had akeen interest in IPM for many years, and preparingthese remarks led me to think about integrated pestmanagement and its trajectory over the last 20 or30 years. It seems to me that this particular confer-ence is quite timely, mainly because it drawstogether in a kind of microcosm way much of whatis happening at this university, and, I think, at otheruniversities around the country as well. Theprogram of this conference reflects the integratednature of plant protection, bringing disciplinestogether to solve a common problem. This is also agoal for Oregon State University, and I want toextend my congratulations to the organizers—notonly for putting on the conference, but for the workthey do in promoting interdisciplinary cooperation incrop protection.
Thinking about integrated pest management overthe weekend, I reflected on its ecological founda-tions. I have the honor and the responsibility tolead a group entitled the Willamette RestorationInitiative, which looks at the Willamette Valley as acomplex ecological and sociological unit. Onemajor concern results from the fact that a numberof fish species now have been listed as endan-gered; e.g., some runs of salmon and steelhead.Those two listings have enormous potential im-pacts on the economy of the Valley, and sinceabout 70 percent of the population of Oregon livesin the Willamette Valley, it has large implications forhow we plan its future. Often in the past, we havefocused on water quality measures when evaluat-ing watersheds such as the Willamette Valley. Wemeasured variables such as turbidity and dissolvedoxygen, as well as chemicals in the water and inthe sediments. Pesticides always were a majorconcern. But to understand what happens in theriver, it is essential to assess what happens on thelandscape. Much of the water quality is defined bywhat happens in the riparian zones and the adja-cent lands. So, as I think about the future of theValley, I think that much of the success will dependon the degree to which we manage our pests inways that protect the river, as well as protect thelandscape. Our long-term success in the endeavorto restore the Willamette Valley will depend uponbroad public participation. I think, also, that it will
President Paul RisserOregon State University
depend to a large extent on how successful we arein integrated pest management. There are particu-larly sensitive issues related to potential conflictsbetween urban areas and agricultural areas. Thefinger frequently is pointed first at agriculture interms of sources of nitrates and pesticide pollut-ants, for example. But as we look at the Valley, it isclear that the issue arises not only in agriculture butalso in urban areas.
One of the challenges for integrated pest manage-ment is not just the solution of pest problems infield crops, horticultural crops, or fruit orchards, butof becoming a much more conspicuous part of theway we manage urban systems as well. So, I thinkthere is a challenge for us, and I hope that thisconference also will set the stage for expandingintegrated pest management in urban settings. As Isaid, integrated pest management, in some ways,mimics what is happening at this university in anumber of ways. We at Oregon State essentiallyare turning the university inside out—that is,making the whole state of Oregon our universitycampus, beyond the limits of Corvallis, the networkof Experiment Stations, and the Extension officesaround the state. We are taking the university tobecome partners in communities and to buildcapacity in those communities. That is a sort ofnew way of thinking about the land-grant mission,but it is one that I think represents the future.
As I think about this goal in all its details, I recog-nize that what is happening in this organization iswhat has happened in integrated pest manage-ment. IPM began by looking largely at individualpests and their biology, the physiology of crops,impacts of weather and climate conditions, and theinfluence of soils and below ground processes.Then, over the last decades, we have moved farbeyond that, so that environmental as well aseconomic and sociological considerations becomepart of the equation. In considering the sociology ofIPM, we must reflect more carefully on the role ofthe university and particularly of our ExtensionService, and the way in which we cultivate partner-ships with the private sector, both individualconsultants and corporations. So, IPM has becomean ever-more complicated topic, one which seeksto integrate—in new levels—both the economicsand the ecology of how we manage pests. I am not

4
surprised that there are so many definitions of IPM,because integrated pest management brings somany dimensions together under a single umbrella.This is also why we need to have such a confer-ence. As I said at the outset, it is timely because itlooks at the past accomplishments, then it tries tolook at future directions. And, as we do that, thoseof us here in Oregon have an extraordinary oppor-tunity to provide leadership. The program is rich
and varied, and it should provide the necessarystimulus for fruitful discussions. So, on behalf ofOregon State University, let me welcome you. Ihope you can infer from my comments my ferventdesire for us to think hard about IPM, and also myrecognition of just how important it has been, andthat it will be more important in the future. Thanksvery much and welcome.

5
On the front cover of the Conference’s program, Isee this wonderful representation of the integratedand interdisciplinary nature of IPM. It reminds methat the people we work with don’t really care whatdepartment or discipline they get the informationfrom; they care that they get the information theyneed in order to help deal with the issues they arestruggling with. It also is an illustration of theespecial opportunity that we have here to integratenot only multiple disciplines, but also the researchand Extension functions of the university. IPM hasprovided the perfect test for the research andExtension working group model. This model wasimplemented to help bring diverse fields together ina way that can deal with the complexmultidisciplinary problems of producers. Not onlyare the linkages internal to the university, they alsoare external.
Let me read a sentence from the 1998 OregonExtension Annual Report that goes to the FederalGovernment. I suspect that many of you feel thatwe just ask you for reports that don’t really goanywhere. Well, they do, and they serve veryimportant functions in our communication withlegislators and Washington administrators. Thisparticular report talks about the interdisciplinarynature of IPM. It also talks about external linkagesthat are established through IPM program activi-ties. The report states that “External linkagesinclude collaborators in the private sector—cropconsultants, farm advisors, field personnel ofcommercial firms, as well as professionals in otherstate government agencies, environmental concerngroups, and commodity commissions.”
So, IPM really is much more than just an internal,multidisciplinary effort. External connections areessential, as well. The Federal Government has agoal that 75 percent of all agricultural acreage willbe under IPM management by the year 2000. Thisis a very important goal, and it is something that wedo, in fact, need to work toward as we look to thefuture.
Opening Remarks for the Conference “IPM in Oregon”
Lyla HouglumExtension Service
Oregon State UniversityCorvallis, Oregon 97331
One of the things that you will see in this Federalreport is that IPM is not only multidisciplinary, but itis also multi-state. For Extension, this is becomingincreasingly important also, in that we are man-dated by the Federal Government to spend anamount equivalent to 25 percent of the Federalfunds that we receive, in projects that are multi-state. IPM is a good example of how we do this.
When I talk with legislators about the ExtensionService, I often talk about interdisciplinary projectsand multi-state projects. I don’t know how many ofyou have seen this briefing booklet that we puttogether for our legislative budget hearings. In thisbriefing booklet, there is much information, includ-ing brief success statements and descriptions ofsome successful programs. One of the items in thisbooklet is, “Extension teaches new approaches tocontrol insect pests in pears and cherries. Growersin Jackson and Hood River counties save up to$800,000 a year on pesticides and apply fewerchemicals in the environment.” One of the legisla-tors on our budget hearing committee picked up onthis and asked a question specifically about itduring our hearing. He wanted to know how we didit. How we went about actually saving growers$800,000. This provided an opportunity to talk a bitabout the basic principles upon which IPM isbased. This is just one illustration of how theprogramming you do not only benefits the grower,but also is of interest to legislators and helps us inthe budget process, as well.
When I travel across the state I get commentsabout Extension from growers. A few years ago, Iwas traveling down in southern Oregon and talkedwith different growers about Extension and whatthey value about Extension. One of the growerscame up to me and said, “You know, I don’t thinkwe need Extension anymore.” Usually when I hearthis kind of comment, I say, “Tell me more.” I like toget a sense for where the person is coming from.Well, what this particular grower said to me was, “Idon’t go to Extension for agricultural productioninformation anymore.” So we talked about that a

6
little and I asked him where he did go. “Well,” hesaid, “I go to the field reps.” Now, how many of youhave included field reps in your audience? Yeah,lots of you. How many field reps do we have in theaudience right here? Several of you. In fact, when Iask field reps around the state, “How do you feelabout Extension?” Their comment is, “Oh, mygosh, we need Extension. That is where we get ourinformation.” So, we are both an important part ofthe whole system. It is a system, however, that weneed to help people understand as we think aboutExtension and how Extension operates.
When I looked at the IPPC Web page, I also founda number of different definitions of IPM, but one ofthe things that I was curious about was the historyof IPM. The thing that was most interesting to mewas that I didn’t realize IPM had such a lengthyhistory. This particular paragraph intrigued me.“Dwight Isely provided the earliest record of IPMconcepts as a formal agricultural practice.” Isely’swork began in the 1920s. How many of you knewthat it was that long ago that IPM work began? He“pioneered modern pest control using principles ofscouting, economic thresholds, and trap crops,along with insecticides, to control boll weevil inArkansas cotton.” It also goes on to say, “IPM reallydid not gain momentum until the late 60s in theUnited States.” If you continue to go through someof the history, one of the things you will find is thatIPM Extension programs sponsored by the FederalGovernment weren’t introduced until 1971. This iswhere you begin to see the introduction of Federalmonies into IPM. Then, if you continue, you will findthat there is a fairly big gap until the Federal IPMInitiative was established in 1994. So, it really hasbeen a fairly lengthy history. It also has been acontroversial history over the years.
Now, we have a Federal mandate to include up to75 percent of the acreage under IPM by the year2000. According to the information I was able toaccess, we are about two-thirds of the way there.We probably have about 50 percent of the acreageunder IPM right now. But the level obviouslydepends on how one defines IPM. It was interest-ing to see on the IPPC the web page the differentdefinitions of IPM over the years.
I was interested in the definition that was presentedat the introduction. If you look back at the defini-tions in the 1960s, what you will find is a focus oneconomic development—on making sure a cropwas economically feasible for a producer. That was
the primary goal. Profitability was a primary IPMgoal in the early 1960s. If you look at how thedefinitions have changed over the years, though, inthe 90s you will see other key factors, such associal welfare and environmental sustainability,beginning to creep into the definitions of IPM. Letme give you a couple of examples of this. Here is adefinition from 1966. It says, “Integrated pestcontrol is a pest population management systemthat utilizes all suitable techniques in a compatiblemanner to reduce pest populations and maintainthem at levels below those causing economicinjury.” If you go through the definitions from the60s and 70s, the issue of economic injury showsup over and over.
If you look at some of the definitions from the 90s,though, you will see definitions that sound like this:“Integrated pest management or IPM is a system-atic approach to crop production that uses in-creased information and improved decision-makingparadigms to reduce purchase inputs and improveeconomic, social, and environmental conditions onthe farm and in society.” See how the words beginto change? Another one from 1997 says, “Themanagement of pests by integrating host-resistant,cultural, biological, and chemical controls in amanner that minimizes economic, health, andenvironmental risks.” Those kinds of words didn’tshow up in the definitions in the early 60s.
IPM also has become increasingly political andincreasingly a part of public issues. Even popularTV programs highlight IPM related issues. Forexample, the OPB show Oregon Field Guiderecently talked about controlling nonnative speciesof plants in watersheds by introducing insects fromthe plant’s original country.
You now can go to garden stores and buy bags ofladybugs or other “good” bugs to put in yourgarden. I’m not sure how effective this is, but it is avery common practice. The one that I see probablymost often is the cinnabar moth that is used ontansy ragwort in this part of the state.
IPM is going to become increasingly important inthe future. As we look at climate change, climatolo-gists are telling us that we are beginning a 25-yearcooler and wetter cycle. That is going to changehow we deal with diseases and insect populationsamong various crops. This is going to makeExtension and research in this area increasinglyimportant in the future. It also is going to take a

7
significant amount of work to meet the Federalmandate to have 75 percent of all agriculturalacreage under IPM by the year 2000. This really isa huge charge and a very important charge for theuniversity (see also Harold Coble’s paper).
So, I wish you well with the conference. As I look atthe program, I see many, many, many interestingworkshops planned. Again, along with PresidentRisser, welcome to Oregon State University. Thankyou very much.

8
Oregon State is one of the two land-grantuniversities that I had not visited before, but I amimpressed with what I have seen and heard so far.The fact that President Risser and Dean Houglumcould display such a high level of understanding ofIPM tells me a lot about this institution. I also ampleased that the program of this workshop includesgrowers, whose input at all levels, from planningthrough implementation, is essential for progress inIPM.
National IPM Coordinator andthe 75 percent Goal
The role of the IPM Coordinator in the USDA todayis to resolve what we facetiously call the “real Y2Kbug.” That has nothing to do with computers; but,rather, how to achieve the goal of 75 percent of theagricultural area in the U.S. under an IPM programby the year 2000, and to do the assessmentappropriately. The first order of business to do thisassessment was to reach a consensus on what isIPM. We needed to find a working definition of IPMfor growers, without trying to create yet anotherdefinition. When I arrived in Washington and startedthinking about how we were going to measure the75 percent goal, no operational definition was foundthat provided a good basis for measuring adoption.So, I will discuss our attempt to define what is abaseline for IPM and how to measure adoption,although this topic will be addressed in greaterdetail by others in this workshop. My main concern,however, is the direction of IPM beyond 2000 andthe 75 percent goal. I will give you some reasonswhy this is critical as well as talk about fundingmechanisms for IPM, because nothing gets donewithout appropriate funding.
Most current IPM definitions provide mainly a visionfor IPM—what IPM will do for us. We aren’t reallyusing the over 60 definitions that show up onIPPC’s website—except to the extent that theyprovide a vision of what IPM is or should be. Tomeasure IPM adoption, we needed a practicaldefinition that would give us measurable param-eters to assess the 75 percent adoption objective.
IPM on the National Scene
Harold CobleNational IPM Program Coordinator
USDA/ARS/OPMP
First, though, let me give the background for this75 percent goal. Back in September of 1993, theUSDA, EPA, and FDA, in joint testimony beforeCongress, decided that to promote adoption ofIPM, it was more desirable to use as a target thearea under IPM rather than a percentage ofpesticide use reduction. EPA and USDA signed amemorandum of understanding to work together totry to reach this goal. In December 1994, USDAlaunched the National IPM Initiative with severalobjectives. The USDA had some funding to goalong with that initiative, but to the present time,additional funding has been in the President’sbudget, but Congress always throws it out. This isa problem that we have to deal with. The goal wasto implement IPM on 75 percent of U.S. croplandacres by the year 2000; i.e., planted croplandacres, not including rangeland or forests. Theobjectives that the USDA had were primarily toensure availability of information and technology, tomeasure the adoption by growers, and to promotebiologically intensive IPM.
It was up to us to come to some understanding ofwhat is IPM in order to measure it. There areseveral ways to approach the problem basedmainly on the vision set forth as the basis of thecurrent definitions. Essentially, those definitionsestablish that IPM is a system based on theunderstanding of pest population dynamics, therelationships between pests and hosts, naturalenemies, and long term impacts of suppressionstrategies, with a goal of stabilizing pest popula-tions below economically damaging levels. Most ofus involved in teaching and research in IPM formany years understand what that means, but it isdifficult to communicate to growers what all ofthese definitions really mean. The key issue forgrowers is what they are actually supposed to bedoing in order to practice IPM. If we are to measureIPM, we must measure what growers arepracticing. And make no mistake, growers are theones who in the end turn IPM from a vision to areality. We in Research and Extension can do allwe want to get IPM technologies out in the field,but unless growers adopt them, it doesn’t reallymake any difference. We have to deal with it fromthe growers’ perspective. We must tell growers

9
what it is they are supposed to be doing to practiceIPM.
The practice of IPM comes down to a strategicapproach to managing pests, including prevention,avoidance, monitoring, and suppression with a goalof minimizing economic, health, and environmentalrisks.
Now, what is the real practical meaning of thosefour basic components? Prevention refers to theactions that keep a potential pest (disease, insect,or weed) from ever infesting a crop field or anorchard. There are practices that growers can use.If we tell them, “Use pest-free seeds or transplants,remove alternate hosts, clean your equipmentbetween fields when you are tilling or mowing, usefield sanitation measures such as removing old fruitfrom the orchards,” we are identifying preventivetactics. There also can be quarantine measuresimposed by the government. Growers understandthese measures and will support them. These aretactics that growers can put on the ground, thingsthat they can use. These are the kinds of defini-tions we have to have in order for the growers toimplement or to adopt IPM.
Avoidance is the approach taken if you alreadyhave a pest infestation in the field or the orchard.What can you do to avoid the full economic impactof the infestation? Tactics that avoid, or attenuate,pest impact include crop rotations, using host plantresistance, trap crops, even fallowing parts offields. Again, growers understand that these arepractices that they can put on the ground.
Monitoring involves the practices that allow us toknow what is in the field and when; this knowledgeis essential to allow us to chose the best method todeal with the pest. Monitoring includes surveys,scouting, and access to local weather information.Record keeping is an essential component ofmonitoring. New approaches of precisionagriculture aid in defining where pest problems are:data from the monitoring component help makeintelligent decisions. It always amazes me howmany growers make the effort to get goodinformation from the field and then don’t use thatinformation. They just go out and spray the wholefield even if they know that the infestation islocalized only in one corner of it.
Suppression refers to the actions taken after youhave used prevention practices and still have a
pest problem that you cannot avoid. You knowthere is a problem because you have done themonitoring. Actions now are needed to suppressthe pest. Cultural controls, physical controls,biological controls, and chemical controls, in thatorder, are the suppressive actions that may betaken. This is the way we present integrated pestmanagement to growers. And these are theelements or definitions that we will measureagainst to determine whether we have reached the75 percent goal.
We think that we are at about 50 percent of theagricultural acres under IPM. Many of the minorcrops—fruits and vegetables—are already at75 percent. That may not be good enough. Manygrowers may have the impression that IPM meansorganic agriculture. That is not what it means.Pesticide use in IPM is appropriate if usedaccording to the definitions that we proposed.Prevention and avoidance strategies, we know, areseldom sufficient, particularly in bad pest years.Cultural, physical, and biological controls may fail,so pesticides that are effective and economicalmay be needed to supplement the effect of theother control tactics. We may not have any broadscale viable alternatives in most situations in thenear future, particularly for weed control. If we aretrying to reach 75 percent implementation of IPMon cropland acres, what shall we use to replacepesticides in the immediate future? And, on a broadscale? So, pesticides will continue to be used inIPM for a number of years.
When we state that we are at about 50 percent ofacres under IPM, this is mostly low to medium IPMin terms of a continuum. The level depends on thecrop. It is higher on fruit and vegetable crops; i.e.,in the high value crops. Pest management is stillchemically intensive, but the risks associated withpesticide use are being reduced gradually. If weconsider the history of insect management, not toomany years ago we still were using products suchas lead arsenate. At that time, the introduction ofDDT was received as an improvement. Orga-nochlorine insecticides gradually were replaced bymore effective organophosphates and carbamates.Each new chemical family opened new opportuni-ties, but also brought about new problems. Today,new products are coming with opportunities toreduce the risks associated with their use. Are wewhere we need to be? Probably not, but we arereducing risks to the environment and to humanhealth.

10
When considering the 75 percent IPM adoption, wemust ask, Where are the acres? We have about335 million planted acres in the United States.Seventy percent of that acreage is in four crops:corn, soybean, cotton, and wheat. Less than2 percent of the acreage is in all vegetable and fruitcrops. So, if the goal is acreage based, where dowe put our efforts? Obviously, we must focus onthe major crops. But, even in these major crops,where are the pest problems? In 1996, 201 millionof the 234 million acres in corn, soybean, cotton,and wheat were treated with herbicides, 44 millionwere treated with insecticides (up to about60 million acres in 1997), and 1.7 million withfungicides, excluding seed treatments. Ninetypercent of all the pesticide use in these field cropsare in herbicides. Except for cotton, insecticide usein most other crops is not that large. In the past fewyears, insecticide use in corn is growing because ofgreater severity of root worm attacks. So, to reachthe 75 percent goal, we must concentrate in themajor acreage crops and we must stress weedmanagement. We must accomplish that bydeveloping strategies that include cultural, physical,and chemical controls. We emphasize detection ofweed problems, definition of what the weedproblems are, and then we should try to measurethe results of the implementation of this strategy.
Whether we will reach the 75 percent goal by theend of 2000 is questionable. What is certain is thatwe must approach achievement of the goal in anappropriate manner. We must measure the75 percent adoption against a definition based onthose four strategies and the tactics within thosestrategies. If it comes out to be short of the75 percent goal, so be it.
Regardless of the outcome, the important issue is:What do we do next? Obviously, we need toencourage movement along the IPM continuum.We want people on the continuum, but we wantthem to move along the continuum. That is moreimportant than simply being on it. We need toencourage the use of multiple pest-type thresholds.It’s fine to know the threshold for the Europeancorn borer or for cocklebur, or for some disease,but these pests occur together and they interact.Establishment of multiple pest thresholds forinteracting pests is a critical area for IPM toadvance to higher levels of integration. Anothercritical issue is minor acreage crops. In fact,targeting these crops is probably more important
than achieving the 75 percent goal in the majorfield crops. These minor acreage crops make upour basic food supply. We need to measure thesustainability of our IPM systems. Are they strong?Are they resilient? For the immediate future, wemust concentrate on the four major crops, and thereason is not just the 75 percent goal—it is mainlywater quality. Water quality is a major issue, andthe four major crops contribute the most to waterquality degradation. We then should focus on the10 or so fruit and vegetable crops that are mostimportant in human diet, particularly the diets ofinfants and children.
The Role of the USDA
Several USDA programs are oriented to promoteIPM through targeted funding. PMAP is the PestManagement Alternatives Program. PMAP is, in asense, our short term—what we call our “plug-and-play”—approach to replacing undesirable IPMtechnologies. If particular tactics need to bereplaced in an IPM program (an organophosphateinsecticide, for instance, that may be at riskbecause of Food Quality Protection Act (FQPA)implementation), PMAP supports studies that willallow removal of that OP from the program withoutreducing program efficacy. It is a short-term, 1- or2-year research and implementation program, afirst step in the replacement of tactical componentsof an IPM system.
The second step for FQPA implementation issupported by the Crops at Risk Program (CAR).Under CAR, an entire crop (e.g., peaches) will betargeted. Problems with peaches in Californiaprobably stem from the excessive use of OPinsecticides and B2 carcinogens that are comingnext in the Food Quality Protection Act. Under thisprogram, scientists consider the entire crop, tearthe IPM program apart, put it back together in asustainable manner, and test it in the field. So,PMAP operates at the tactical level to the crop, andCAR deals with the crop as a system.
The third step, then, is to consider the entirecropping system. The program is known as RiskAvoidance and Mitigation Program (RAMP). Weare asking for $10 million for RAMP. You mightconsider the entire Willamette Valley with the majorcrops that are grown here, consider which pestmanagement programs are in place, how theyneed to be improved in terms of environmental

11
quality, food quality, sustainability; this is a longterm program. We are looking at 4- to 6-yearprojects, and we also are looking at maybe 20 ofthese across the country.
We also have requested some increase inExtension formula funds, and in special grants. TheRegional Competitive Grants Program is stayingthe same at $2.7 million. In addition, there is theMethyl Bromide Alternatives Program coming out tothe states through CSREES for $5 million. Theseare the major IPM funding efforts at this time.These are in the President’s budget. The objective,obviously, is to get this through the appropriationsprocess.
A key feature of both the PMAP and the CARprograms will be the requirement for earlystakeholder input. The RAMP program, focusing ona cropping system, is a long term approachinvolving the strategic concept of PAMS. Weshould be able to define the systems withsuspected risk, define what the pest managementsystems are and which ones need to be improved,focusing on productivity, profitability, and environ-mental quality. This may be the first program toincorporate the idea of regional pest managementcenters.
An idea that has been floating in Washingtonprobably for 4 or 5 years, is the establishment ofvirtual IPM centers in various regions of thecountry. We’re not considering new buildings andmoney put into brick and mortar, but to identifyplaces where cropping systems or croppingapproaches can be defined—maybe consideringagroecological zones or cropping system zones.EPA has done a reasonably good job, for instance,of developing 12 or 13 of what they call field trialregions in the United States. These regions werebased on cropping system zones. There may besome overlap because of different zones that wewill develop. We probably will try to follow a modelthat was developed by the National ScienceFoundation. It is an industry/university cooperativeresearch center model. The reason is that it allowscenters to bring in a board of advisors thatrepresents the stakeholder groups that have aninterest in the region. It also allows the center tobring in grant funds from various sources: fromcommodity groups, from industry, from foundationsinterested in funding projects at a regional center.
The primary goal of developing regional centers isdecentralization from Washington. Pest manage-ment is not something that can be decided insidethe Beltway. The decisions on pest managementshould be based on the cropping system regions.That is where they are used. EPA may join in thisapproach to the regional centers, and it has evensuggested that it would be willing to have someregulatory decisions based within the regions. Anexample, cited by the EPA, is the work on insectresistance management programs with respect toBt crops. These IRM programs are very different inthe Midwestern corn growing area than they are inthe Southern cotton growing area, for instance. Soit would make sense for the people in the Midwestand the North Central region to make decisions oncorn, and it makes sense for people down in theSouthern region to make decisions on cotton.Centers also may participate in the developmentand evaluation of new technologies, becausesuitability of these technologies will differ fromregion to region. Management and dissemination ofinformation is probably one of the key roles that thecenters would play. There are times, for instance,that the Office of Pest Management Policy in USDAneeds information rapidly on a particular crop orfrom a particular region. If the expertise had beenorganized and identified within regions, it might beeasier to go to a regional office and get thatinformation than to go to each state individually.
I mentioned input on policy and regulatorydecisions and the ability to fund and manageresearch projects. There are many things that canbe accomplished through regional centers thatcould take some of the burden off of states to dorepetitive tasks, such things as a Section 18request going into EPA. If five states need aSection 18 on a particular pesticide, all five stateshave to do the application individually. Regionalcenters could do that application, instead of allindividual states having to be involved in it. Itdefinitely would speed things along when it got intoEPA. The Regional Center concept is now in thedevelopemental stage.
Question (C. Benbrook): I can’t resist the tempta-tion to ask you how, given the importance of weedsin IPM on major row crops like soybean, forexample, how would you envision the Roundup®
Ready soybeans scoring under the USDA PAMSconcept?

12
Answer: It depends on how it is used. If a growergoes out and plants Roundup® Ready soybeans,then automatically sprays, that is obviously notgood IPM. But if he uses Roundup® Readysoybeans with the idea that he is going to look atthat crop and determine whether he really needs touse a herbicide or not, then use it only where itneeds to be used, that is a good concept.Roundup® has better environmental characteristicsin terms of water quality than most other herbicidesthat are being used in soybeans right now. So, it issimply a matter of how it is used. It goes back tothe decision making process. One of the problemsis the cost involved in buying Roundup® Readyseed, and a lot of growers are understanding thatnow and are taking a closer look at that convenientapproach to weed management on their crop. So, ifthey realize that they have a weed spectrum thatRoundup® does a good job on, if they buy the seedand plant it in narrow rows, which is another one ofthe real critical things in terms of making Round-up® successful, if they do field monitoring and useRoundup® where it is needed, that is a goodapproach. If they just plant and spray withoutconcern for where they are spraying or why theyare spraying, that is not a good approach, andthat’s why the monitoring is essential.
Question (?):You talked about the big picture andthe long term sustainability of IPM systems. We arelooking at genetically engineered seed andconsolidation of the gene pool by internationalcorporations. At issue here is the sustainability of
the small system and what is, in the long run, theimpact of a few large multi-national corporationscontrolling the seed that is being planted. Wheredoes that fit into the big picture in the long termsustainability of farming systems?Answer: It’s a very serious question. I certainlydon’t have the answer but I can tell you that thereare a lot of people all over the country who areinterested in that and there is a lot of attentionbeing paid to it. It does concern us in terms of theIPM situation. Are we going to have access to all ofthe variability we need in terms of genetics downthe road represents a very critical question.
Question (?): In the GMO debate with EPA therehas been considerable emphasis given to theestablishment of refugia for resistance manage-ment. Some of the large corporations that werementioned before lobbied heavily to get thatresistance management part taken out of the rules.The requirement to leave 20 percent refugia incorn, cotton, or potatoes was accepted initially bythe large corporations, but as more of them got intothe game, that 20 percent margin share becamequite important. All at once now, resistancemanagement is taking a back seat to a policyprocess rather than the profit probability of theselarge crops. What do you think about this?Answer: Well, I happen to have a draft of the IRMapproach that came from the combined industrygroup and it’s back at 20 percent. I think theyrealize they were going to lose the fight with EPA ifthey didn’t get on the bandwagon, so there is some“give” occurring within the industry.

13
By 1977, the Cooperative Extension Service hadsupported the implementation of 52 (3-year) pilotIPM (integrated pest management) programsacross 33 states in a variety of cropping systems(Good, 1977). Evaluations of these pilot effortswere conducted by Federal agencies and externalgroups, and these conclusions were drawn:
• Pesticide usage can be reduced 30 to70 percent in situations where unwarranted orpoorly timed applications are made.
• In many situations, nonchemical means ofpest control can be substituted for or augmentpesticides.
• Use of certain pesticides may increase wherefarmers are unaware of losses caused bypests and where use of a pesticide is the mostfeasible control method.
• Situations develop where no combinations ofavailable pest suppression methods canprevent serious crop losses.
• Economic benefits to farmers and societyoccur from savings in costs of pesticides andtheir application, as well as increases in yieldandlor quality.
• Energy savings occur in both fuel andpetrochemical products used.
• Increased employment opportunities areprovided for youth who scout fields, as well asfor private sector professionals who advisefarmers.
• Fewer pesticides enter the environment andresidues of pesticides in food products areminimized. Many farmers increasingly arewilling to pay for improved advisory serviceswhen they are available.
The Role of Extension in Promoting IPM Programs
M.E. GrayProfessor & IPM Coordinator
University of Illinois
The overall success of these pilot IPM Extensionprojects quickly led to the annual Federal supportof Cooperative Extension Service IPM programs inmost states by the mid- to late 1970s. In 1977, at aNational Pest Management Workshop in KansasCity, Missouri, Joseph Good, Extension Service,USDA, Washington, DC, offered the followingthoughts on the future role of the Extension Servicein promoting integrated pest managementpractices: “Future implementation of lntegratedPest Management will depend on advancedresearch technology and availability of trainedpersonnel in both the public and private sectors. Tobe effective, the State Cooperative ExtensionService must acquire the necessary expertise andresources to conduct programs at the state, area,and county levels. Without continuing Extensionparticipation on a permanent basis, the programcannot advance. If not adequately developed, it willfalter or fail completely. The objective will beeducation rather than providing services. Trainingmust be provided to farmers, field scouts, countyExtension personnel, and others who advisefarmers. In the future, large farmers are most likelyto secure advisory services from private pestmanagement consultants and firms.”
With the hindsight of nearly a quarter century, it’ssafe to say that Joseph Good’s remarks were ontarget. Indeed, most state Extension IPM programsno longer provide field-level services directly togrowers. A survey of Extension IPM coordinators(Gray, 1995) revealed that 29 states no longerprovide direct scouting services for growers. In fact,41 Extension IPM coordinators indicated that theyprimarily conduct educational programs andprepare IPM resource materials. As Goodpredicted, many large-scale farmers and growerscurrently are securing much of their direct pestmanagement information from the private sector.The private sector has stepped into the one-on-onepest management advisory breach with producers.Increasingly, the private sector has becomeExtension’s direct audience. Ultimately, producersbenefit indirectly through the dissemination of pestmanagement information from private consultants,

14
certified crop advisers, and others in the seed andagrichemical industries.
The potential for conflicts of interest is obvious andfrequently is mentioned by critics of this system. Inaddition, producers often fail to see the advantageof supporting Extension IPM programs, becausepest management recommendations made togrowers most often are delivered from the privatesector. In certain instances, industry has attemptedto alert their customers to the importance ofuniversity Extension programs in providingeducational materials and programs for theiremployees. However, this message frequently islost or forgotten among producers.
Why can’t Extension programs provide as muchdirect contact with producers today? During thepast decade, the number of Extension specialistshas continued to decline, or at best has remainedconstant among the pest management disciplines.For instance, the number of Extension entomolo-gists decreased in 21 states and remainedunchanged in 18 others. Thus, by factoring inflationinto the equation, Extension entomology programshave lost ground in 39 states (Gray & Steffey,1998). Quite simply, there aren’t enough Extensionspecialists to provide the one-on-one contacts withfarmers and growers compared with the privatesector.
The traditional land-grant model, that of dissemi-nating research-based information to clientele,continues to be the envy of those throughout theworld who struggle with supplying abundant,healthy food to their growing populations. Thestandard components of this model consist ofExtension specialists interacting with producers tobetter understand their pest managementchallenges; Extension specialists conveying thisinformation to researchers on campuses;researchers solving these applied pest manage-ment problems; Extension specialists disseminat-ing the results of these scientific investigationsback to farmers; farmers finally implementingsolutions on their farms. The magnitude of thissuccess story has not been duplicated anywhereelse. Yet, despite nearly 85 years of cooperationamong Extension specialists and researchers, thisremarkable track record of impressive achieve-ments is undergoing a rapid transition. Producersincreasingly are becoming more interested inparticipating as full partners in the researchprocess. This includes not only the identification of
pest management problems, but also may involvecooperation in the design of experiments con-ducted on their farms and eventually the implemen-tation of the findings.
The increase in the popularity of participatory on-farm research programs in many states is atestament to the growing interest in this new model.Those producers who continue to prosperincreasingly are more sophisticated, very welleducated, computer-savvy, and looking for newpartnerships with Extension specialists atuniversities. As the number of producers continuesto decline nationally, so does the number of IPMExtension specialists on many campuses. Thecomplexion of research conducted by campusscientists also has shifted considerably during thepast I0 years in the direction of molecular biologyand away from field-level experiments. Thisdevelopment has placed much of the applied pestmanagement research in the arena of theExtension specialist. In fact, many tenure-trackExtension specialists clearly have identifiedresearch responsibilities in their official appoint-ments. Consequently, it is becoming less commonin many departments to find specialists with100 percent Extension appointments, especially forrecently hired Extension faculty. With these manychanges to the traditional land-grant model, newchallenges as well as opportunities must berecognized. In 1992, in response to thesedevelopments, Steffey and Gray (1992) offered thefollowing recommendation: “We suggest that acontinuum in which researchers, Extensionspecialists, and farmers are intimately involved inall phases of problem identification and resolutionis more appropriate today than the traditional linearmodel..... We should build on the strengths of ourtradition and change our model to meet today’snew challenges. Although the rules of the gamehave not changed, the game has.”
The results from a survey of Extension IPMcoordinators (Gray, 1995) reflected the reality ofthis changing land-grant model in the Federallysupported Extension IPM programs across thenation by the mid-1990s. Results revealed thatExtension IPM programs typically invested theFederal allocation into salary lines of employees,most often in the direction of nontenure trackappointments. However, 22 respondents indicatedthat, in their state, some tenure-track facultyderived full or partial support from the Federalallotment. Because of stable Federal funding for

15
Extension IPM programs in the 1980s (actuallydecreases in real dollars due to inflation), andmarginal increases in the 1990s, reduced programflexibility at the state level remains a reality.Despite the erosion in Federal support forExtension IPM programs since the early 1970s,IPM coordinators (44 of 45 of whom responded tothis question) indicated that they anticipated IPMgaining support from the general public throughoutthe 1990s.
Unfortunately, this anticipation has not translatedinto significant increases in funding from theFederal Government. In September of 1993(House testimony), the Clinton administrationchallenged the IPM community to implement IPMon 75 percent of the nation’s managed acres by theyear 2000. In an effort to respond to this loftychallenge, the U.S. Department of Agriculturelaunched (December, 1994) the so-called “IPMInitiative” which pleaded for the strengthening ofexisting partnerships and creation of newcooperative ventures between IPM research andExtension programs with other governmentalagencies, other universities, and, most importantly,with user groups in the private sector. During thesecond National IPM Symposium/Workshop (LasVegas, Nevada, April 1994), T.L. Nipp, AESOP,offered a warning regarding the renewed interestduring that time in IPM: “During the past 30 years,there have been repeated waves of support forIPM. Somehow, each time, we managed tofragment our interests and our coalitions, only tolose momentum and support and fade to thebackground again. Frankly, I am surprised that IPMis going to have one more chance. I don’t think thatthere will be another chance if we repeat themistakes of the past.” Five years after Nipp offeredhis stern warning, I believe it is accurate toconclude that considerable momentum has beenlost for increasing support of our Extension IPMprograms.
Why did the momentum of the mid-1990s forExtension IPM programs erode? Are the supportersof IPM so diverse and fragmented that we couldn’tall “hitch up to the IPM wagon”? There may besignificant truth to this suggestion. The IPMcommunity is a diverse group with urban and ruralsectors, 99 field crop and fruit and vegetablecomponents, and multiple disciplines withinuniversity IPM leadership structure. For instance,even among Extension IPM coordinators, there areconsiderable differences in academic backgrounds
(as of 1995): 31 entomologists, 6 plant pathologists,4 weed scientists, and 4 others in horticulture,nematology, chemistry, and invertebrate ecology. Adivergence of opinions always has existed amongExtension IPM coordinators regarding the primarygoal of Extension IPM programs.
In 1989, at the National IPM Symposium/Workshopin Las Vegas, Nevada, F.L. Poston, Director of theCooperative Extension Service at WashingtonState University, offered the following thoughtsregarding priorities for Extension through the1990s: “Clearly, Extension must take a leadershiprole in moving away from pesticide use. If thescenario I have described is correct, farmers willeventually be driven away from reliance onpesticides. This position may initially be unpopularwith farmers. If, however, my assessment of thefuture is correct, Extension will benefit greatly fromits leadership role.”
Did Extension embrace or reject this Extension roleoutlined by Dr. Poston through the 1990s? Thefollowing question was directed at Extension IPMcoordinators (Gray, 1995) and may help at least toprovide some insight regarding how Extensionresponded to Poston’s 1989 challenge: Do youbelieve that the chief goal of an IPM CooperativeExtension Service Program should be to reducepesticide use? Twenty Extension IPM coordinatorsanswered “yes,” while 23 indicated “no” to thisquestion (2 remained undecided). I suggest thatmany segments of the general public wouldmaintain that if the primary goal of an ExtensionIPM program is not to reduce pesticide use, itshould be (Cuperus et al., 1996; Hamilton et al.,1997; Potter and Bessin, 1998). A slim majority ofExtension IPM coordinators, as of 1995, believedotherwise.
Integrated pest management coordinators alsowere asked (Gray, 1995): Would you agree withsome critics that IPM has not delivered upon manyof the expectations of the early 1970s (mostprincipally that pesticide use would decline if IPMpractices were followed)? Eleven IPM coordinatorsanswered “yes” and 34 responded “no.” Yet, this isdespite the fact that herbicides are applied to 98,94, and 98 percent of the corn, cotton, andsoybean acres, respectively, within the UnitedStates (USDA-NASS-ERS, 1995), and insecticideuse in nonrotated corn remains significant (Pikeand Gray, 1992). Pesticide use by U.S.homeowners also is pervasive (69 million U.S.

16
households), with 2,4-D and chlorpyrifos commonlyused (Pesticide and Toxic Chemical News, 1994).Cate and Hinkle (1994) suggested “there is anunderstandable cynicism about IPM as a paradigmfor pesticide use reduction.” Without the generalagreement even among Extension IPM coordina-tors regarding what the primary goal of anExtension IPM program should be, it’s no wonderthat the momentum of the mid-1990s largely hasbeen lost.
Looking back, the early 1990s started off in theright direction regarding our efforts to increase IPMadoption among producers. In June, 1992(Arlington, Virginia) the USDA and the U.S.Environmental Protection Agency sponsored anational IPM forum. More than 600 participants,largely from the university and Federal sectors,sought to identify constraints and solutionsregarding the adoption of IPM practices bygrowers. The top constraints agreed upon by thosewho attended the forum included (Sorensen,1994):
• Lack of a national commitment to IPM.• Insufficient funding and support for IPM
implementation, demonstration, andfundamental infrastructure.
• Lack of funding and support for long-terminterdisciplinary research and Extensioneducation.
• Burdensome, expensive, time-consuming,unclear regulatory processes.
• Lack of funding for applied research, lack ofregulatory personnel to expedite productregistration, and lack of education promotionfor growers.
• The shortage of independent, trained IPMpractitioners.
• Inability of USDA and EPA effectively toaddress cross-cutting agricultural andenvironmental concerns.
• Insufficient education of the public about IPMand its benefits.
• Agricultural policies that were developedwithout considering IPM.
• Lack of common and specific goals for IPM.
The primary solutions to overcome theseconstraints were as follows (Sorensen, 1994):• Make a national commitment to IPM.• Increase public and private funding for IPM
research and Extension.
• Increase funding to the CooperativeExtension Service to provide long-termstability for IPM education.
• Combine research and Extensionprograms.
• Implement EPA’s safer pesticide policy.• Include social science and marketing
strategies in IPM development.• Reevaluate agricultural policies with IPM in
mind.• Establish an EPA ombudsman or problem
solver.• Establish a formal interagency IPM
taskforce.
Because relatively few producers attended thatnational forum, a series of regional workshopssubsequently were conducted to “get the pulse” ofgrowers regarding IPM constraints and potentialsolutions. In 1993, the National Foundation for IPMEducation, with the assistance of land-grantscientists at selected universities, organizedregional workshops for producers, who were askedto identify constraints to the adoption of IPM as wellas potential solutions to overcome the constraints(Sorensen, 1993). The production systemsfeatured at the regional workshops included:(1) fruits and vegetables in California, (2) corn andsoybeans in Illinois, Iowa, and Indiana, (3) applesin Pennsylvania, and (4) cotton in Texas andOklahoma. The EPA provided partial support forthe workshops. The objective of these workshopswas stated succinctly: to identify constraintsproducers face in using IPM and in moving awayfrom chemically based pest control to informationbased pest control. The following constraints werementioned by producers in at least three of theregional workshops (Sorensen, 1993):• A lack of incentives to use IPM or a perception
that the economic benefits of IPM programsdid not justify the increased demands onmanagement
• Differing agendas and conflicting messagesfrom governmental agencies
• Loss of funding for applied research• Lack of funding for IPM education and
research programs• Slowness of the EPA pesticide registration
system• Lack of availability of pesticides, thereby
limiting control options for growers and

17
reducing the flexibility that IPM programsneed to respond quickly to pest outbreaks
• Commodity programs that discourage croprotations, a key IPM tactic
• The need to market IPM more effectively• Problems with Delaney Clause restrictions,
which may limit pesticide availability• Lack of understanding by producers about the
total production system approach to IPM
The similarity is striking between those constraintsidentified by participants at the national IPM forumand growers at regional workshops. The road mapfor increasing IPM implementation was laid outclearly several years ago by growers, researchers,Extension specialists, and other leaders in IPM.Although progress surely has been made towardovercoming some of the constraints identified bygrowers and those who attended the national IPMforum, it is my assessment that many of the sameproblems that plagued the IPM establishment in theearly 1990s remain today. Most notable of theseconstraints are: (1) an acute and persistent lack offunding for Extension IPM educational programs,(2) shrinking resources for applied pest manage-ment research, (3) chronic confusion regarding thepesticide reregistration process, (4) uncertaintyregarding the future of many pesticides,(5) incongruity of many agricultural practices andpolicies with sound pest management strategies,(6) failure of “IPM” supporters to market IPMsuccess stories effectively to the general public(most members of the general public still do notrecognize what IPM stands for), (7) a general lackof agreement within the IPM establishmentregarding the primary goal and direction forExtension IPM programming, and (8) failure of IPMsupporters to carve out an “identity” for IPMprograms that is understood clearly by policymakers and legislators. These will remain dauntingchallenges into the next century.
How can the Extension Service provide moreeffective leadership in the promotion of IPMeducational programs? Doing so requires payingcloser attention to the many constraints andsolutions for increasing IPM adoption that werearticulated very clearly by producers at regionalworkshops throughout the U.S. (Sorensen, 1993).Ultimately, Extension has been asked to do morewith less for many years. Strategic alliances amongIPM Extension specialists across state lines willbecome imperative. Providing pest management
expertise across all commodities in each state wasabandoned many years ago. Extension entomolo-gists in 36 states routinely rely upon managementrecommendations from specialists in other states(Gray and Steffey, 1998). Rapid progress isoccurring in the more effective use of web-basedtechnology for the delivery of pest managementinformation. However, I believe we have hit thebrick wall in terms of stretching Extension IPMresources. New political support for IPM must begenerated at Federal and state levels if we are tocontinue delivering world-class pest managementinformation to our clientele. This will not be easy.Fred Poston (1989) at the National IPM Sympo-sium/Workshop offered the following remarks onthe importance of political support: “One of thegreatest criticisms of IPM stems from the fact thatpesticide use has increased dramatically during theIPM era. Although many reasons exist for thisphenomenon, it is a fact which has not escaped itsdetractors. Perhaps IPM’s greatest liability,however, rests with its age. There is nothing morepolitically impotent than an old program. Legislatorssell new programs as “fixes” for the future.Reemphasis of an old program offers little hope forthe future.”
Extension IPM coordinators must become strongeradvocates for their educational programs at allpolitical levels. As scientists, many coordinators arenot comfortable in the role of an advocate. In fact,in some states, advocacy by a scientist for a speificprogram is discouraged due to many competinginterests for a limited pot of resources. The realityis that program priorities at land-grant institutionsgenerally are not established through the lobbyingefforts of small collections of individual scientistswith vested interests. If Extension pest manage-ment programs are to expand and thrive into thenext century, increased political support ultimatelywill be required of the clientele we serve throughour pest management programs. In order togenerate this renewed political support, the IPMleadership at Federal and state levels mustarticulate a unified, easily understood, and crystal-clear mission to legislators, policy makers, andcitizens of an urban society.
Literature Cited
Cate, J.R. and M.K. Hinkle. 1994. Integrated pestmanagement: the path of a paradigm. NationalAudubon Society, Washington, DC.

18
Cuperus, G., G. Owen, J.T. Criswell, and S.Henneberry. 1996. Food safety perceptionsand practices: implications for Extension. Am.Entomol. 42(4):201-203.
Good, J.M. 1977. The future of pest management.pp. 169-170. In Proc. National Pest Manage-ment Workshop, Kansas City, Missouri,December 13-15, 1977, sponsored by USDAand State Extension Services.
Gray, M.E. 1995. Status of CES-IPM programs:results of a national IPM coordinators survey.Am. Entomol. 41(3):136-138.
Gray, M.E. and K.L. Steffey. 1998. Status ofExtension entomology programs: a nationalassessment. Am. Entomol. 44(1):9-13.
Hamilton, G.C., M.G. Robson, G.M. Ghidiu, R.Samulis, and E. Prostko. 1997. Seventy-fivepercent adoption of integrated pest manage-ment by 2000? A case study from New Jersey.Am. Entomol. 43(2):74-78.
Nipp, T.L. 1994. 1995 Farm Bill. pp. 60-65. In Proc.2nd National Integrated Pest ManagementSymposium/Workshop, Las Vegas, Nevada,April 19-22, 1994, sponsored by ESCOP PestManagement Strategies Subcommittee andES IPM Task Force.
Pesticide and Toxic Chemical News. 15 June 1994.22:8-10.
Pike, D.R. and M.E. Gray. 1992. A history ofpesticide use in Illinois. pp. 43-52. In Proc.18th Annual Illinois Crop Protection Workshop,March 3-5, 1992, Univ. of Illinois, CooperativeExtension Service, Urbana-Champaign.
Pofter, M.F. and R.T. Bessin. 1998. Pest control,pesticides, and the public: attitudes andimplications. Am. Entomol. 44(3):142-147.
Poston, F.L. 1989. Extension priorities for IPM inthe next decade. pp. 163-165. In Proc.National IPM Coordinating Committee.
Sorensen, A.A. 1993. Regional producer work-shops: constraints to the adoption of inte-grated pest management. Monterey, CA;Fresno, CA; Bloomington, IL; Gettysburg, PA;Lubbock, TX, March-April, 1993, sponsored bythe Office of Pesticide Programs, Office ofPrevention, Pesticides and Toxic Substances,USEPA with cooperation by the NationalFoundation for IPM Education, 60 pp.
Sorensen, A.A. 1994. Proceedings of the NationalIntegrated Pest Management Forum,Arlington, Virginia, June 17-19, 1992,sponsored by USDA Agricultural ResearchService and the Agricultural ResearchInstitute, 86 pp.
Steffey, K.L. and M.E. Gray. 1992. Extension-research synergism: enhancing the continuumfrom discovery to delivery. Am. Entomol.38:204-205.
U.S. Department of Agriculture, National Agricul-tural Statistics Service. 1995. AgriculturalChemical 1.

19
Introduction
I believe that most people at this meeting acceptthe notion that the best way to reduce pesticideuse, reliance, and risks on a sustainable basis is topromote adoption of biologically based IntegratedPest Management (IPM) systems. This surely isthe take-home message from progress made onfarms across Oregon and the western U.S. inrecent years.
The bottom line is clear: it is more cost-effective inthe long run to manage pests with a heavy dose ofinformation and biology than it is to try to crushthem with chemistry. There also is, of course, muchless collateral damage with biointensive IPM thanchemical-dependent control strategies.
Still, many barriers persist, slowing progresstoward biointensive IPM. Some relate to the pestmanagement knowledge base and others to thetool kit accessible to pest managers. On bothfronts, major progress is being made. It’s a goodthing, too, since challenges on American farms andranches also keep evolving.
Farmers want to change for a host of reasons. Themultiple shortcomings of chemical-based manage-ment systems are increasingly difficult to ignore,and the range and effectiveness of optionscontinue to grow. Resistance and secondary pestproblems are common. Regulators will continue todrive change, despite the ability of the agriculturalsector generally to slow the pace of implementationof new laws such as the Food Quality ProtectionAct (FQPA). And a growing percentage ofconsumers is seeking green options in themarketplace. One might expect, as a result, agolden era of innovation on the farm, a periodwhen farmers have little reason or need to lookback upon a past era of pest management that leftmuch to be desired.
Still, change in agricultural pest management is nothappening very fast, especially compared to otherinformation- and technology-based activities. In
Performance Criteria for Measuring IPM Results
Charles M. BenbrookBenbrook Consulting Services
Sandpoint, Idaho
parts of Oregon agriculture, it is happening hardlyat all. Some wonder why.
The Crux of the Challenge on the Farm
Biobased IPM systems are fundamentally andfunctionally different from chemical-dependent IPMsystems. Pest management systems are compos-ites of decisions and actions made by busy peoplein a very dynamic industry managing dynamicbiological processes. To change IPM systems,farmers and pest managers first must change theorganisms that thrive within farming systems. Thesecond step is managing the interactions amongorganisms and in relation to the crop. Pestmanagers and farmers must learn to manageinteractions across a dizzying, unpredictable arrayof conditions, while also meeting the qualitydemands of the marketplace and making anacceptable profit.
This ability depends on definitive knowledge of theecology of farming systems. It takes a new set oftools and attitudes and a willingness to spend timein the field. It takes the ability to identify effective,affordable, and nondisruptive courses of actionwhen populations approach economic thresholdlevels. Time is money, and both are stretched.Plus, the ecological sciences have been witheringon the vine, especially field based systemsresearch. And most of the pesticide industry’sinvestment capital has been flowing into biotech,buying seed and other companies, and defendingold, high-risk pesticides.
Momentum for change in the world of pestmanagement is growing from new roots, particu-larly ongoing problems with chemical-basedsystems and the pent-up demand amongconsumers looking to exercise freedom of choice inthe marketplace. The “new green mainstream,” toborrow Harvey Hartman’s term (Hartman, 1996), islooking for ways to support ecologically committedfarmers and food companies. Ecolabels haveemerged as a promising bridge linking consumerswith farmers and food companies that place apremium on safer production systems, resource

20
stewardship, and enhancing quality of life. In thePacific Northwest, the Food Alliance is makingsteady progress in offering consumers value-addedchoices (for more information, seewww.thefoodalliance.org/).
Reducing Pesticide Risks and Promoting IPM
Many organizations and government agencieshave adopted as their mantra the twin goals ofreducing reliance on high-risk pesticides andpromotion of biointensive IPM. The former goal isdesigned to draw the interest and support ofconsumers and environmentalists, the latter todraw the participation and cooperation of innova-tive farmers, farm organizations, food companies,and marketers.
Each of the programs I know of deals differentlywith the inevitable tensions between consumer-environmental and farmer-ag industry goals,agendas, and world views. In many cases, thesetting of concrete goals, coupled with thedevelopment of a measurement system to monitorprogress, has proven the decisive steps that havegiven growers, environmentalists, consumers, andthe ag industry reason enough to stay at the tablelooking for solutions rather than complaining aboutproblems.
A Credible Measurement Systemand Transparency
In many respects, agreeing on goals is the easypart. The hard part is translating goals intoconcrete, real-world actions that can be monitoredover time.
Everyone supports progress along the IPMcontinuum, but opinions differ on what this reallymeans and whether such progress will, in fact,reduce use of high-risk pesticides. In 1993, I washired by the Consumers Union to carry out aproject on IPM with the goal of trying to come upwith a well-grounded definition and IPM measure-ment system. The 1996 book Pest Management atthe Crossroads (PMAC) (Benbrook et al., 1996)sets out the basic framework of the IPM measure-ment system I have been working with and refiningfor the past 5 years. Those interested in the latestlarge-scale application of the measurement systemcan go to the June 1999 draft papers posted on thePMAC web site at http://www.pmac.net/potatipm.htm. These papers present the 1998 IPM
baseline for the Wisconsin potato industry: a majoranalytical accomplishment of the World WildlifeFund–Wisconsin Potato and Vegetable GrowersAssociation collaboration.
Why Measure?
The best way to reduce pesticide use, reliance, andrisks on a sustainable basis, while also cost-effectively managing pests, is to promote adoptionof biologically based IPM systems.
IPM systems exist in almost limitless variety alongwhat can be thought of as an IPM continuum.Biointensive IPM systems—the kind most peopleare willing to support—strive to lessen pestpressure through management of ecological andbiological processes and interactions. When pestsdo emerge as a threat to crop production andquality, such systems rely principally on biologicaland ecological means to reduce pest populationsbelow economic thresholds.
Monitor Trends
American Vegetable Grower has been compilingdata on the “Top 100 vegetable growers” for 11years. Two decades of incorporation of IPMpractices has changed greatly the way thesegrowers have managed their farms. “Crop qualityshould be the biggest motivation of IPM. Whenyou’re out there every day, you know what’s goingon in the field.” (Rick Melnick, “Shedding Light onIPM,” American Vegetable Grower, October 1998,pages 9-19).
Stemilt Growers, a company organized in the1960s, has been a pioneer in this area. In the early1990s, Stemilt Growers developed a point systemlinked to pesticide properties and hazards, helpinggrowers understand the environmental conse-quences of various changes in IPM systems. Giventhe stated goals of the Stemilt program, itsmeasurement system is one of the best in thecountry.
Recognize Changes in Efficacyand “Trade-offs”
Over the next decade, the FQPA is likely toprecipitate important changes in pesticide usepatterns and pest management systems. Asregulation and the availability of better alternativesdrive high-risk pesticides off the market, farmers
21
and pest managers will seek new ways to manageboth old and new pests.
Most will draw upon three basic options in craftingnew IPM systems: switching to different pesticides;reducing reliance on pesticides by moving towardthe biointensive end of the IPM continuum; andadopting emerging “high-tech” approaches, suchas crops genetically engineered to expressbacterial endotoxins or tolerate certain herbicides.
Each option will have a range of impacts—somepositive, others possibly negative—on diets,pesticide exposure, farmers, and rural communi-ties. A reduction in one kind of risk may beaccompanied by a rise in other risks. To make wisechoices, both the U.S. Environmental ProtectionAgency and pest managers need careful analysesof the consequences of alternative courses ofaction.
The need for better information to guide choices isacute. EPA faces dozens of key strategic choicesboth in the biotech and conventional pesticidearenas. The biotechnology industry aggressively ismarketing new transgenic plants that may wellincrease pesticide reliance and heighten the risk ofresistance. Reliable data on the long termeconomic and ecological consequences of thesechoices and decisions generally do not exist. Newrisk assessment tools are needed to keep pacewith changing technology and to assure that theFQPA and biotech decisions and policies reducerisks across the board.
A major part of the work of Benbrook ConsultingServices aims to generate new, data- and science-based analyses of risk trade-offs, a necessary stepin getting at the consequences of regulatorychoices and policies. We are examining alternativepest management systems that are available to fillin for high-risk pesticides targeted for phase-outunder the FQPA. The “FQPA Impact SimulationModel” we have created also projects changes inrisk levels and economic impacts.
Applications of this model to the apple and pearindustries in the West show, for example, thatreductions in miticide expenditures as a result ofprogress toward soft, mating-disruption-basedinsect pest management systems can more thanmake up for the increased costs associated withadoption of mating disruption technology. I amaware that some innovative Oregon fruit growers
have made the transition successfully to bio-basedIPM and have been pleasantly surprised byreduced late-season problems with mites.
Evaluate Programs and/or Returnon Investment
Practice-based programs are a good first step, butthey will, over time, face questions regarding actualaccomplishments in terms of reducing pesticideuse and risks. My sense is that 5 years down theroad, most ecolabel programs will incorporate away to document credibly their impacts onpesticide use and risks and on water quality, wherethat issue is on consumers’ radar screen. Onereason is that these are the issues the majority ofconsumers care about most deeply. Anotherreason is the growing presence of the organicindustry in the marketplace. Those with the clearestand most compelling message will competesuccessfully for the dollars of the green shopper.They will thrive and others are likely to fall by thewayside.
A strong case can be made for an increase inpublic and private-sector investments inbiointensive IPM systems, because of the manybenefits that will accrue to society as a result oftheir adoption. But the same case cannot be madeat the other end of the IPM continuum. Pesticidemanufacturers and others who profit from pesticidesales should bear most of the burden in developingand sustaining chemical-dependent systems.Indeed, society is likely to ask manufacturers andfarmers to cover more of the social and regulatorycosts stemming from pesticide-based systemsthrough fees, taxes, and other financial instru-ments.
Rewarding Progress is Key
Creating and capturing value in the marketplacewill, in the end, determine whether ecolabelingbecomes a stable part of the country’s foodmarketing system. Those willing to pay forbiointensive IPM adoption in the marketplace, orwith tax dollars, will need to be convinced that theyare getting what they are willing to pay for: reducedreliance on risky pesticides, along with improve-ments in water quality and worker and food safety.This is why the ability to distinguish between pestmanagement systems along the IPM continuum interms of reliance on high-risk pesticides will be

22
critical in establishing IPM adoption baselines andthen in measuring progress.
Considerable effort is underway to develop ways todistinguish between various levels of IPM adoption.An example is the four zones of adoption describedin Pest Management at the Crossroads: no IPM,low-level IPM, medium IPM, and biointensive IPM.Another key step is to capture differences inpesticide reliance, use, and risks across farms atvarious stages along the IPM continuum and overtime as progress is made toward biointensive IPM.
A common strategy is emerging that entails focuson the information and knowledge relied on inreaching a decision to use certain seminal pestmanagement practices, rather than counting thetotal number of practices used. This approach isunder development within IPM-labeling effortscarried out by WWF-WPVGA, The Food Alliance,and the Core Values apple program in NewEngland. (For details on these programs, see the“Measuring IPM Adoption” portion of the PMACweb page, http://www.pmac.net).
Knowledge-based strategies rest upon recordingand verifying grower responses to a set ofquestions linked to key pest management systemchoices. The questions are designed to identify thecompleteness of the information growers had whendeciding what practices to adopt, as well as howthey used the information in structuring andcarrying out field interventions—whether applying apesticide, using a cultural practice, releasingbeneficials, or doing nothing.
An example might help demonstrate this concept.Consider a common dilemma: whether to spray abroad-spectrum insecticide in the face of an early-season leafminer, thrip, or aphid infestation,knowing that the application will set off a number ofother secondary pests because of impacts on theirnatural enemies. Sometimes such applications, orother costly interventions, simply cannot beavoided; but in other cases, they can and shouldbe. Distinguishing the information a grower shouldhave and use in determining what to do in suchsituations is the focus of knowledge-basedcertification. Questions an annual programapplication, survey, or farm plan might explore are:
1. The scouting information the grower had andconsidered in making a decision to spray ornot spray
2. Specific field information used in conjunctionwith a forecasting model or expert system,such as the University of Wisconsin’sWISDOM program for potato pest and nutrientmanagement
3. Information and knowledge relied upon incarrying out interventions, and steps taken tominimize future problems and maximize thechances of success
Knowledge-based systems are promising for manyreasons beyond their simplicity and focus.Measuring IPM adoption is going to take effort andcost money, particularly if it is used to support IPM-labeling programs. Those designing and imple-menting such systems should do everythingpossible to keep system costs down and to designapproaches that serve as many useful ends aspossible.
Knowledge-based systems can do just that by alsofostering grower-scientist-practitioner dialogue onthe cutting edge of IPM implementation in the field.This approach can hasten refinement of scoutingtechniques, identifiy ecological interactions tomonitor and manage, enhance the effectiveness ofemerging tools and biopesticides, and create betterways to use decision-support tools and othersources of information.
At the end of each season during grower meetings,the results of the past season should be reviewedroutinely, as most programs do now. Growers orconsultants who feel they have found a better wayto deal with a common pest problem will be free tomake their case. The resulting exchanges amonggrowers, consultants, and researchers will highlightwhere there is consensus and where furtherresearch and experimentation are needed. In thisway, knowledge-based IPM measurement systemscan serve both as a verification tool and a way tofoster dialogue and creative problem solving.
Set Priorities: R&D, Education, Policy Change
Much of my work now is focused on developingand applying methods to measure progress towardbiointensive IPM—a common challenge facinggovernment agencies, grower groups, the foodindustry, researchers hoping to win and/or defendlarger budgets, and private foundations supportingcooperative IPM projects.

23
People recognize that managing pests is likedealing with diabetes or computer software.Science and technology are driving rapid change inwhat is possible. At the same time, Mother Natureis throwing her share of curve balls at farmers. Pestchallenges are not static. Progress made in oneyear can evaporate in a flush of whiteflies or beswamped by the pathogens that thrive in a wet fall.
Ecolabel programs must build this reality into theirgoals, performance standards, and monitoringsystems. Progress will not be made in every yearin reducing pesticide use and risks. Ecolabelprograms must accommodate slippage when ittruly is unavoidable. In return, the programs shouldask growers and pest managers to make acommitment to steady progress whenever andhowever it can be achieved.
Most ecolabel programs really have yet to deal withthis challenge, at least in a way consumersunderstand. They need a way to accept slippage(limited pesticide use) when unavoidable, butwithout opening the door to an endless series of“justified” setbacks. Successful programs willachieve incremental change yet accept periodicsetbacks through adherence to a common set ofprinciples, criteria, and decision processes.
First Steps in Measuring PesticideImpacts and IPM
1. Cornell University scientists propose the“Environmental Impact Quotient (EIQ).”
Filling what many saw as a key need, a team ofresearchers at Cornell University developed a wayto assess the relative risks of pesticides (Kovach etal., 1992). The team developed what has beencalled the Environmental Impact Quotient (EIQ), amodel that integrates various environmentalimpacts into a single value based on the rule“environmental impact is equal to toxicity timesexposure.”
2. The Clinton Administration sets a 75 percentadoption IPM goal.
In June, 1993, the Clinton administration embracedIPM as a national goal, although Congress has stillnot made achieving the goal a priority. TheAdministration captured the attention of farmers,food processors, environmentalists, and the
academic community with its pledge to get75 percent of cropland acreage under IPM by theyear 2000. The timing of this pledge was noaccident. On June 28, the National Academy ofSciences released a long-awaited report,Pesticides in the Diets of Infants and Children(NRC, 1993a). Heavy coverage of the NRC reportand reaction to it and the Administration’s pledgecontinued for months.
3. ERS/USDA release the first national assess-ment of IPM adoption and conclude thatapproximately 50 percent of acres are underIPM using “count the practices” criteria.
Between the June, 1993 IPM pledge and spring1994, senior USDA officials were grilled severaltimes on Capitol Hill about where the nation stoodin terms of IPM adoption. They had no basis toanswer even simple questions and so directed theEconomic Research Service (ERS) to develop amethod as quickly as possible for estimatingcurrent IPM adoption, based on data available inearly 1994. A September, 1994 report, Adoption ofIntegrated Pest Management in U.S. Agriculture,was released, the first of its kind (Vandeman et al.,1994). Analysts from the ERS acknowledged thatfurther work was needed in order to refine their IPMadoption criteria and measurement methods. Inreleasing the report, though, the USDA embracedthe importance of measuring IPM and started anongoing process toward better measurementmethods.
Measuring IPM Adoption in Cornand Soybean Systems in 1994
In a 1994 project (Benbrook, 1996), I used farm-level data on herbicide use patterns and preven-tion-oriented weed management practices in theUSDA’s cropping practices survey to dividesurveyed soybean and corn acreage into fourzones along what is called the “integrated weedmanagement” (IWM) continuum: “No,” “Low,”“Medium,” and “High” levels of integrated weedmanagement. These levels of adoption correlateroughly to those reported in the ERS report(Vandeman et al., 1994). Results are accessible athttp://www.pmac.net/wssa.htm and demonstratethe potential for reducing herbicide applicationrates, pounds applied, and acre-treatments asprogress is made along the IWM continuum.

24
Ongoing Efforts and Current Challenges
GPRA and AREERA compliance
The USDA’s Cooperative State Research,Extension, and Education Service (CSREES) hasinitiated discussions with land-grant partners onhow to respond to IPM measurement challenges inthe context of both Government Performance andResults Act (GPRA) and Agricultural ResearchExtension and Education Act (AREERA). A set ofIPM program evaluation “indicators” has gonethrough several drafts and is nearly ready forimplementation (see http://www.reeusda.gov/ipm/planning.htm).
EPA’s Pesticide Environmental StewardshipProgram (PESP)
EPA and USDA held a stakeholder workshop inFebruary, 1994 to gather ideas, suggestions, andconcerns about reducing pesticide use. A set ofprinciples emerged that were used to guidedevelopment of a new voluntary program, thePesticide Environmental Stewardship Program(PESP). PESP encourages progress along the IPMcontinuum through cooperative effort. (For a list ofcurrent partners and an overview, seewww.pesp.org/)
“Green Labeling” Programs
Several groups and programs are embracing theprinciples of IPM in the context of ecolabelprograms. Environmental and consumer groups,including the World Wildlife Fund, are exploringways to promote and reward IPM adoption throughmarketplace initiatives. (For a review of the genesisof WWF’s involvement, see Hoppin, 1996 at http://www.pmac.net/pollyipm.htm; for recent WWFactivities, see http://www.pmac.net/potatipm.htm).Yet, questions remain and views differ regardingwhat constitutes “IPM,” as made clear in MarcosKogan’s introductory remarks.
Some Arizona farmers enthusiastically aresupporting the principles of IPM and theirapplication in IPM-labeling. David Kerns, aUniversity of Arizona IPM specialist, explained whyin a recent issue of California Farmer:
“…to market crops certified as IPM grownwould be a boon for the Arizona vegetableindustry. The reason I want us as a state to
go ahead and develop this program is thenit can be designed to fit what works best forus, instead of possibly in the future havinga system forced upon us that doesn’t workin Arizona. I don’t believe the governmentwill be able to effectively mandate specificIPM practices from a national set ofstandards because pest populations,cropping patterns and agricultural practicesgreatly differ from one area to another.”(“Assurance Plan,” California Farmer, Mid-March 1999, pages 12-15.)
New York State and Cornell IPM Labels
New York-based Wegmans Food Markets hasdeveloped an Integrated Pest Managementprogram for labeling products in their stores.Wegmans developed crop-specific standards forIPM-labeled products in cooperation with CornellUniversity. Wegmans first introduced the IPM-labeled sweet corn in one of its stores in 1995.Since then, the program has continued to grow,with 53 of its 56 stores carrying IPM corn in 1998.“Last year, we got up to 40 growers in New Yorkand Pennsylvania. This year, we’re gettingadditional growers into the program,” commentedBill Pool, Wegmans’ food safety manager.Following a consumer survey, Wegmans discov-ered that customers are willing to accept blemishesas a tradeoff to reduced pesticide use on foodproducts. The program now is extending its reachto include IPM-labeled canned and frozenvegetables. (For more information, see “IPM CornGrown in Most Wegmans Food Stores,” IPMSOLUTIONS, April/May 1999).
Gerber Products Company
For years, the Gerber Products Company hasworked to eliminate pesticide residues from theirbaby food products. Indeed, the company has aclear and straightforward policy that everyoneworks to achieve: no detectable residues infinished product. Largely, they have succeeded, butit has taken a number of years and initiatives to doso.
One key ingredient is the issuance each year of alist of permitted and prohibited active ingredients.This list has gained a degree of notoriety and hasstimulated other companies to develop their ownlists. In recent years, the Gerber list has evolved toprovide more and more detailed instructions and

25
criteria governing when and how a pesticide can beapplied by Gerber’s contract growers. Theseinstructions are fine-tuned each year in order todeal with any residues found in finished product. Itis a very data-driven process.
The second core component of Gerber’s programis supporting grower efforts to develop and adoptbiointensive IPM. Gerber accomplishes thisthrough a variety of activities and cooperativeprojects. They maintain a staff of field agronomistsand pest management specialists that assistGerber growers evaluate IPM needs and imple-ment new technologies. Gerber leadership hasproven decisive in increasing research effort on keyfruit crops in Michigan and building farmer interestin IPM. Plus, they have shared production risks byhelping long-term growers market portions of theircrops that had to be treated with prohibitedpesticides.
Projecting the Impacts of the FQPA
Many people are working to project—andmanage—the impacts of the FQPA. I suspect thatrelatively few crop-pesticide combinations will beimpacted significantly, surely well less than 1 in 10.By “significant impact,” we mean label changessubstantially affecting 30 percent or more of acre-treatments. If EPA does a good job targeting high-risk uses, FQPA implementation could reduce risksby 98 percent or more from crop year 1996 levelswhile impacting less than 10 percent of crop use.
A flood of promising new biopesticides andreduced-risk products are well along in theregulatory pipeline, enough to render FQPAimplementation a moot point in many crops by thetime any FQPA-driven restrictions significantlyimpact pesticide use in the field. In addition, thepace of novel product discovery is picking up,especially in the area of biofungicides, wherealternatives are needed most. (For an overview,see the 1998 ESA-APS meeting paper accessibleat http://www.pmac.net/benbrookns.PDF).
The PAMS Concept and the Diversity Index
Ecological theory suggests, and field experienceconfirms, that IPM systems with a high degree ofdiversity in control tactics are the most resilient.IPM systems that weave together multiple tacticsspread out the burden of control.
In a system where a single tactic is relied on forcontrol, growers are vulnerable when, for whateverreason, the tactic breaks down. Row crop farmerswho use cultivation alone for weed managementdepend on being able to get equipment into fieldsat the right time to assure no yield loss to weeds.Neighbors relying on pre-emergence herbicidesrely on certain weather conditions to activate thechemicals and to maintain season-long control.Regardless of the tactic, there are combinations ofweather, technology, and pest pressure that arelikely to lead to problems.
The best way to assure cost-effective controlacross all conditions is to build redundantmechanisms of control into biointensive, preven-tion-based IPM systems. These insights led to theconcept of using a “diversity of control tactics”index as an indicator of IPM adoption. This ideafirst arose during the 1998 Integrated PestManagement Measurement Systems Workshopheld in Chicago, Illinois. The meeting wassponsored by the American Farmland Trust, theU.S. EPA, and the World Wildlife Fund.
IPM systems are comprised of four complimentarystrategies: prevention, avoidance, monitoring, andsuppression—the PAMS approach. Within each ofthese strategies, multiple tactics may be identified,some of which may be applicable only to certaincropping systems while others may be broadlyapplicable. In all crops and circumstances, though,IPM should include at least some tactics withineach of these four strategies.
The diversity index measures the extent to whichpest management burdens are spread across anumber of practices and tactics. Much work isneeded to refine the idea and determine howexisting and future National Agricultural StatisticsService (NASS) survey data, and other informationat varying levels of aggregation, can be used todevelop viable empirical measures of IPM systemdiversity. One approach would be to:
1. Determine the maximum potential diversity ofany IPM system by listing all viable tacticswithin each of the four major components.
2. Develop a method to quantify the diversity ofmeasures within each PAMS component,taking into account the intensity of reliance oneach tactic.

26
3. Use a matrix or equation to combine thediversity of tactics in each of the four PAMScomponents into a single measure of IPMsystem diversity.
A key variable in measuring system diversity is theintensity with which certain tactics are relied uponin a given PAMS component. For instance, most4-year crop rotations should be assigned a higherintensity value than a 2-year rotation. A farmerusing cultivation should receive higher intensityscores for more passes with a tillage tool.
Farmers understand the importance of access tomany options in managing pest populations. In thepast, especially in systems largely reliant onpesticides, farmers generally have applied differentpesticide-based options sequentially. When and asthe effectiveness of one chemical slips, othermaterials are chosen and incorporated intomanagement systems. While new options aredrawn upon, the system remains largely one-dimensional and vulnerable to future problems.
As reliance shifts from treatment with chemicals toprevention, greater redundancy in controlmechanisms often will be needed. Genetic andbiological control mechanisms are driven bycomplex crop and species interactions, which inturn are a function of the competitive balancebetween different pests, their natural enemies, andthe stage and vigor of crop growth. Variableweather and other exogenous factors can andoften do impact pest and beneficial organismpopulation dynamics. For this reason, growers whowish to avoid a return to heavy reliance onpesticides must build into systems a greaterdiversity of preventive control tactics. Whenproblems emerge, they must activate a greaternumber of control tactics.
In measuring suppression tactics within the PAMSconcept, a method will be needed to capture theintensity of pesticide use, measured by poundsapplied and the inherent toxicity of active ingredi-ents. The more narrow a farmer’s selection ofpesticides, the more toxic the materials, and/or themore pounds applied, the higher the estimate ofreliance on pesticides as a method of suppression.
Another key measurement goal is finding betterways to track IPM system resiliency. In an idealworld, specialists should be able to predict which
IPM systems or parts of systems are at risk offailure before major control failures occur. Inaddition, measures of system diversity may be anappropriate means to highlight research prioritiesand measure progress toward the attainment of theAdministration’s 75 percent IPM adoption goal.
Next Steps in Improving IPMMeasurement Tools
Several additional steps are needed to developmore accurate measures of pesticide toxicity anduse and IPM adoption. In calculating humanchronic risks, much new data will become availableas the EPA implements the FQPA. Within the next5 years, many pesticides are likely to be subjectedto detailed screens to assess capacity to impactthe endocrine system. New methods will beneeded to incorporate new toxicological informationinto the chronic mammalian toxicity factor.
A critical need is to factor in more effectively anumber of physical and chemical properties thatimpact the likelihood of human exposure occurringas a result of pesticide application.
In the ecotoxicity component of the equation, mucheffort will be required to improve aquatic and fishtoxicity parameters. More work is needed on aviantoxicity, focusing on subchronic and chronic effects.
Substantial work is needed to improve the data setsupporting estimates of “BioIPM Index” values.This index incorporates pesticide properties andfactors affecting the stability and performance ofIPM systems, such as impacts on beneficials,persistence, impacts on pollinators and soilmicroorganisms, and potential to trigger resistance.
Cooperative work is underway with Dr. PaulJepson, chair of the Department of Entomology atOregon State University. Dr. Jepson and col-leagues are developing an updated and improvedset of SIDEFX factor values capturing the impact ofpesticides on nontarget beneficial organisms.Again, this is an enormous undertaking. We arefocusing now on developing estimates for newlyregistered compounds, many of which are beingmarketed as “IPM friendly” because of their moreselective mode of action.

27
A Parting Thought
Continental Airlines Chairman Gordon Bethune hasstated, “What gets measured gets managed,”especially when tangible rewards are linked todocumented progress. He credits this simpleinsight in explaining how he helped reviveContinental Airlines, which teetered on the edge ofbankruptcy when Bethune took over as CEO.
The effort to develop improved IPM and pesticideuse measurement methods is a step towarddeveloping the capacity to track and rewardprogress toward lower risk, prevention-based IPM.Hopefully, improved measurement systems willtrigger broader recognition among the public andgovernment agencies of the need to invest in theknowledge and human skills that will, in the end,determine whether progress is made and whether itis sustainable.
Resources and Bibliography
Benbrook, C. 1996. Adoption of integrated weedmanagement systems by corn and soybeanfarmers in 1994: an application of a newmethodology to measure adoption of IPM andpesticide use and reliance. Paper presented atthe Weed Science Society of America AnnualMeeting, Norfolk, Virginia, February, 1996.
Benbrook, C., E. Groth, J. Halloran, M. Hansen,and S. Marquardt. 1996. Pest Management atthe Crossroads, Consumers Union, Yonkers,New York.
Hager, A.G. 1996. Weed resistance to herbicides:understanding how resistance develops inweeds is the first line of defense. In WeedControl Manual: volume 30. Meister PublishingCompany, Willoughby, Ohio.
Hartman, H. 1996. The Hartman Report: food andthe environment: a consumers’ perspective,Phase 1, Summer, 1996. The Hartman Group,Seattle, Washington.
Hoppin, P. 1996. Reducing pesticide reliance andrisk through adoption of IPM: an environmentaland agricultural win-win. PresentationFebruary 27, 1996 before the Third NationalIPM Symposium/Workshop.
Kovach, J., C. Petzoldt, J. Degnil, and J. Tette,1992. A method to measure the environmentalimpacts of pesticides. New York’s Food andLife Sciences Bulletin, 139:1-4.
Theiling, K.M. and B. Croft. Pesticide side-effectson arthropod natural enemies: a databasesummary. Unpublished Manuscript, OregonState University Department of Entomology.
Vandeman, A., J. Fernanedez-Cornejo, D. Jans,and B.H. Lin, 1994. Adoption of IntegratedPest Management in U.S. Agriculture.Agriculture Information Bulletin No. 707,Economic Research Service, Washington, DC

28

29

30

31

32

33

34

35

36

37

38

39

40

41

42

43

44

45

46

47

48

49

50

51

52

53

54

55

56
Introduction
Mating disruption-based codling moth controlstrategies involve early season placement of matingdisruption dispensers in the top third of apple orpear trees. The dispensers slowly release sexattractant pheromones to confuse male codlingmoths and prevent breeding. The first field scaleapplications of mating disruption in the U.S. oc-curred in 1993 and 1994 on a pear orchard site inthe Sacramento Delta area known as RandallIsland. This initial cooperative project betweenUniversity of California researchers and orchardowners demonstrated mating disruption as acodling moth control approach with significantpotential to minimize use of synthetic pesticides,maximize effects of natural control agents, andmaintain acceptable fruit yield and quality. At thattime, widespread voluntary adoption of matingdisruption seemed unlikely. The additional cost ofmating disruption and dispensers exceeded thecost of materials and application associated withthe alternative codling moth control strategy, two tofive or more applications of organophosphate (OP)insecticides, most commonly 2 or 2.5 lb of Guthionper application (Williamson et al.).
Best prospects for eventually realizing cost com-petitiveness appeared to be development ofprograms which created significant secondary pestcontrol cost savings by combining mating disruptionwith limited supplemental application of OP andother soft materials which minimally disruptedpopulations of predatory beneficials. Alternatively, itwas thought that decreases in dispenser cost ordecreases in the required numbers of matingdisruption dispensers to achieve adequate controlmight eventually make the practice cost effective(Beers et al., 1998).
To encourage development of cost effective matingdisruption approaches in the Pacific Northwest,beginning in 1995, the USDA sponsored fivecodling moth areawide program (CAMP) sites in theregion. At these CAMP sites, the USDA providedgroups of growers on contiguous orchard blockstechnical assistance with mating disruption, pest
The Economics of Mating Disruption in Pacific Northwest Apple and Pear
Jeffery ConnorAgriculture and Resource Economics
Oregon State University
monitoring, and, until 1997, subsidies on purchasesof mating disruption dispensers. The CAMP sitesserved as an opportunity to develop strategies foreffective and economical use of mating disruptionthrough cooperation between growers and researchscientists.
At least partially as a result of CAMP site experi-ence, the use of mating disruption on apple andpear acreage has grown by almost 40 percent peryear over the last 5 years. In 1997, an estimated60,000 acres of apple and pear were in matingdisruption with most of the acreage in centralWashington, 37,000 to 40,000 acres (Alway, 1998).While the acreage in mating disruption is large inabsolute terms, it only represented about 22 per-cent of central Washington apple and pear acreageand less than 10 percent of all U.S. apple and pearacreage in 1997.
Objectives
The central objective of this research is to investi-gate the extent to which mating disruption-basedpest control in Pacific Northwest apple and pear iscost competitive with multiple OP cover sprayapproaches. More specifically, the objectives are toassess (1) how the cost effectiveness of matingdisruption varies across major Northwest fruitgrowing districts, and (2) how the cost effectivenessof mating disruption is influenced by pest pressurewithin growing districts. Understanding the cost orsavings to adoption of mating disruption aids inunderstanding how cost effectiveness of policies toinduce further adoption of mating disruption can beimproved by targeting specific regions and types ofgrowers. The research outcome also allows a betterunderstanding of factors influencing voluntaryadoption on additional acreage and likely conse-quent reductions in organophosphate use in theregion.
Scope
The objective of this partial budgeting applicationwas to estimate expected average difference inprofit experienced by orchards using mating

57
disruption-based pest control and orchards usingOP based pest control. The partial budgetingmethodology has been applied widely to pesticideeconomics issues (see Norton and Mullen, 1994,for a review of many studies using the method).This application of partial budgeting involvesdeveloping pest control cost budgets for matingdisruption blocks and multiple OP blocks. Eachpartial budget is a tally of costs which vary acrosspest control treatment. Initial statistical analysis andbackground research showed that transitioning tomating disruption induces shifts in pest populationdynamics which do not settle to a new equilibriumfor several years. As a result, cost of the strategyappears to vary over the first several years in asystematic way. To capture the impact of thesedynamic effects on cost, multiple-year partialbudgets are used rather than a single representa-tive year budget. To include regional and practicerelated differences in the cost effectiveness ofmating disruption, four separate sets of partialbudgets were developed, two for apple and two forpear.
Partial budget estimates of pest control costrepresent the costs a grower would experienceusing the set of representative typical practices.While care is taken to ensure that the partial budgetestimates derived for this study are not systemati-cally biased, the estimates are not likely to repre-sent the actual cost that any one grower experi-ences. Instead, the costs of pest control experi-enced by regional growers follows a distribution.Some experience higher costs than average andothers lower costs. Initial interviews, surveys(Alway, 1997), and statistical analysis suggestedthat variation in codling moth pressure and leafrollerpressure are key determinants of the relative costeffectiveness of mating disruption. Fruit blocks withhigher codling moth pressure require more OPcover sprays to achieve adequate control, andconsequently greater savings are realized on suchblocks through reduced OP use if such blocks areplaced in mating disruption. To give a sense of howpest population pressure affects the net cost orsavings that would be realized if growers notcurrently in mating disruption adopted the practice,partial budget estimates are recomputed usingalternative assumptions about pest pressure andpest control strategies.
Methods
The first step in the partial budgeting process isspecification or deciding which factors influencecosts and (or) revenues differently across pestcontrol strategies, and which components of costand (or) revenue can be treated as constant.Published reports, survey findings, and interviewswith growers, Extension agents, Experiment Stationresearchers, and crop pest consultants in Washing-ton, Oregon, and California were used to determinewhich costs of apple and pear pest control varyacross pest control strategies in the region. Theresult of this process summarized in Figure 1 wasspecification of general cost categories assumed tovary across pest control treatment in this study, aswell as cost categories treated as constant.
As summarized in Figure 1, five factors are as-sumed constant in the partial budgets used in thisresearch. The assumption that factors 1 through 4do not vary with variation in pest control cost arerelatively uncontroversial maintained hypothesesthat are not tested statistically. It simply is assumedthat on well-managed farms, choosing to usemating disruption does not influence cost in thesecategories. Previous research suggests that someof these factors may influence pesticide use. Forexample, irrigation management practices havebeen shown to influence pest control practices insome settings. Typically, however, such “secondorder” interaction effects are small. Furthermore,more detailed surveys of management practicesand outcomes than could be collected for thisresearch effort would be required to estimate anysuch effects.
The assumption that revenue losses due to pestdamage do not vary across pest control strategiesis not standard in partial budget analyses of pestcontrol strategy economics. Generally, it is as-sumed that damage varies between strategies. Inthis study, statistical comparisons showed thatassuming no damage difference is justified in thisparticular case. Results of the statistical compari-son are summarized in Appendix 1: Basis for PartialBudgeting Assumptions.
The second step in the partial budgeting processinvolves developing meaningful quantitative esti-mates of how factors assumed to vary acrosstreatments of interest. The results of this process isthe set of assumptions about inputs used in pest

58
control summarized in Table 1. These assumptionsare based on: (1) statistical analysis of sprayrecords from samples of orchard blocks using bothmating disruption and multiple OP cover sprayapproaches to pest control, (2) secondary surveydata summaries, and (3) expert opinion. Proceduresused in developing assumption are described in
Appendix 1: Basis for Partial Budgeting Assump-tions. In short, partial budgeting assumptions werechosen to generate estimates which cover therange of cost effectiveness growers in a givenregion are likely to experience given the observedvariation in OP cover sprays for codling moth andnumbers of leafroller treatment.
Table 1A. Overview of partial budgeting analysis assumptions.Analysis / 1. Northern California Pear 2. Northern California Pear - 3. Southern Oregon Pear
Per acre treatment Reduced MD Rates# of OP cover sprays 1 - MD blocks 1 - MD blocks 1- MD blocks
4 - OP blocks 4 - OP blocks 3.5 - OP blocksMating Disruption 400 on MD blocks 300 on MD blocks 400 on MD blocksdispensers/a
Leafroller control 2 qt Lorsban 2 qt Lorsban 2 qt LorsbanPsylla & mite 7 oz Agrimek on MD blocks 7 oz Agrimek on MD blocks 20 oz Agrimek, 3 oz Apollo, 3 lbInsecticides 10 oz Argrimek on OP blocks 10 oz Argrimek on OP blocks Mitac, 8 oz Savey on OP blocksHorticultural Oil 20 gal on MD, 20 gal on MD, 14 gal on MD,
14 gal on OP 14 gal on OP 6 gal on OPCM monitoring traps 4 on MD blocks 4 on MD blocks 4 on MD blocksper 10 acre 2 on OP blocks 2 on OP blocks 2 on OP blocksLR monitoring traps 2 on MD blocks 2 on MD blocks 2 on MD blocksper 10 acre 1 on OP blocks 1 on OP blocks 1 on OP blocks
Figure 1. Costs treated as variable and those assumed constant.Factors which are treated as constant across pest control strategies
1. Production inputs not directly related to insect pest control (e.g., fertilizer, irrigation water, fungi-cides, herbicides)
2. Costs of operating and maintaining machinery not directly related to insect pest control (e.g.,tillage related machinery costs, irrigation system cost)
3. Costs of labor not directly related to insect pest control (e.g., labor costs of pruning, fertilizing,weed control, irrigation, fungicide and herbicide control)
4. Other fixed costs not directly related to insect pest control (e.g., land and building rents or mort-gages, taxes, general management overhead)
5. Revenue losses due to pest damage
Factors treated as variable across pest control strategies6. The costs of insect control materials used to control codling moth7. The costs of insect control materials used to control secondary pests which may be effected by
changes in codling moth control strategy8. Costs of labor and management used in insect pest control and monitoring9. Costs of operating capital assets used in insect control (e.g., sprayers and tractors used in spray
operations)10. Costs of borrowing operating capital used in pest control

59
Table 1B. Overview of partial budgeting analysis assumptions.Analysis / 4. Central Washington 5. Central Washington 6. Central Washington 7. Central Washington
Apple, High CM Apple, Low CM Apple, Moderate CM Apple, High CM Pressure &Per acre treatmet Pressure Pressure Pressure Increased LR Pressure# of OP cover sprays 2 year 1, 1.5 year 2, 1.5 year 1, 1 year 2 2 year 1, 1.5 year 2, 1.5 year 1, 1 year 2, 0.5
1 years 3 & 4-MD blocks 0.5 years 3 & 4, MD 1 years 3 & 4-MD years 3 & 4, MD blocks5 - OP blocks blocks blocks 5 on OP blocks
2.5 on OP blocks 3.5 - OP blocksMating disruption 300 year 1, 200 years 200 on MD blocks 300 year 1, 200 300 year 1, 200 years 2-4
dispensers/a 2-4 on MD blocks years 2-4 on MD on MD blocks blocks
Leafroller control 2 qt Lorsban 2 qt Lorsban 2 qt Lorsban 2 qt Lorsban on OP blocks
2 qt Lorsban &1.5 lb Dipel (Bt) on MD blocks
Horticultural Oil 5 gallons 5 gallons 5 gallons 5 gallonsCM monitoring traps 4 on MD blocks 4 on MD blocks 4 on MD blocks 4 on MD blocks per 10 acre 2 on OP blocks 2 on OP blocks 2 on OP blocks 2 on OP blocksLR monitoring traps 2 on MD blocks 2 on MD blocks 2 on MD blocks 2 on MD blocksper 10 acre 1 on OP blocks 1 on OP blocks 1 on OP blocks 1 on OP blocks
Results 1: Partial Budgets and AverageCost Comparison
Figures 2 and 3, as well as Tables 2 and 3, summa-rize comparisons of average cost of mating disrup-tion and multiple OP cover spray strategies. Tables4 through 9 contain partial budgets representingestimates of the cost of insect pest control forPacific Northwest apple and pear. While these pestcontrol cost estimates and comparisons do notrepresent the actual cost that any single growerexperiences, they do give an overall sense of howcosts of the two strategies compare.
Key findings that emerged are:
1. In Northern California, pear mating disruption isrelatively costly compared to the multiple OP coverspray strategy. High mating disruption dispenserdensities are required in the region, and the costsof dispensers, application, and additional monitor-ing is not fully offset by savings in OP materials andapplication costs savings or savings in secondarypest control cost, which are relatively modest in theregion. In the Sacramento Delta of NorthernCalifornia, prospects for further voluntary adoptionof mating disruption may be relatively limited.However, if reduced dispenser rate (300/acre)strategies prove to be effective, there is potentiallya relatively large sub-population of pear growersusing four to five cover sprays who may find therelatively small additional costs in the $20/acrerange to be acceptable.
2. In southern Oregon pear, the mating disruptionand foliar period horticultural oil program is verycost effective, despite requiring high mating disrup-tion dispenser densities, and modest savings in OPmaterials for codling moth control. The mostsignificant savings to mating disruption and foliar oilprogram in Southern Oregon are costs savings onsecondary pest control cost. Average expendituresby multiple OP cover spray growers in the region forpear psylla and mite control are very large. Horticul-tural oil and the additional natural predatory controlthat the less disruptive mating disruption approachprovide are an effective and very low cost alterna-tive to synthetic pesticides for control of psylla andmites.
3. In central Washington, the cost competitivenessof mating disruption is significantly influenced by thelevel of codling moth pressure at a given site. Inmany areas of central Washington, codling mothpressure is quite low, so savings from OP coversprays do not fully offset the cost of mating disrup-tion. In contrast, in high codling moth pressureareas of central Washington, where many OP coversprays typically are applied, savings from reducedOP use do appear to offset the additional costs ofmating disruption, even if additional leafrollercontrol inputs are required.
Results suggest that in settings where growers canuse 200 dispensers per acre in the first year andreduce supplemental OP applications to

60
approximately one-half per acre, and do not experi-ence increased leafroller cost, they can expect tobreak even by the 3rd year if they began at anaverage of 3.25 OP covers per season. Still, initialyear costs for growers using less than 3.5 coversprays are likely to be in the $30/acre range. AsTable 10 results indicate, growers using 5 or moreOP cover sprays are likely to realize savings if theyadopt mating disruption, even if an additionalleafroller treatment is required. These growersrepresent a significant percentage (greater than60 percent) of the small sample of growers in thearea south of Yakima used in this study to computemultiple OP cover sprays in high codling mothpressure settings.
4. In some parts of central Washington, a matingdisruption strategy involving significant reductions inorganophosphates for codling moth control canlead to increased leafroller pressure and conse-quently increased costs of leafroller control.
5. In central Washington apple, the decision toadopt mating disruption is frequently equivalent toan investment decision, in the sense that additionalcosts can be expected in the first years of matingdisruption, but offsetting savings can be expected infuture periods. This pattern of initial cost and latersavings is a result of the biology of mating disrup-tion. Establishing effective mating disruption controlrequires relatively high rates of dispensers andsupplemental OP sprays the first year. In lateryears, codling moth pressure tends to declinesystematically, so reduced dispenser densities andsupplemental sprays are required and cost drops.
Research Limitations
Data available for this study allows only limitedinferences to be drawn regarding distribution in the“population” of pest control cost of alternativestrategies for three reasons: (1) Available datacontain no individual observations characterizingvariation in several factors determining pest controlcosts, including variation in monitoring effort, laborcost, and how adopting mating disruption influencescosts of owning and operating capital assets; (2)While sample data describing variation in one of themost significant determinants of pest control cost inthe sample population (insecticide use) is available,the sizes of samples of conventional growers aretoo small to allow meaningful inferences regardingpopulation distribution of insecticide use levels.Samples used in evaluating each scenario in this
study are based on information from between 5 and9 blocks.
This research provides only estimates of theproducer cost of apple and pear pest control usingmating disruption and multiple OP pest controlstrategies. Producer cost is just one component oftotal economic impact of producers’ pest controlstrategy choices. No attempt is made to provideestimates of public and private external benefits(i.e., health and environmental benefits to theproducer directly or the public) in dollar terms.Methods for estimating certain categories of suchbenefits exist ( Beach and Carlson, 1993; Lohr andWetzstein, 1997). However, confidence that can beplaced in dollar value external benefit estimates islimited by uncertainty associated with estimatedimpact of pesticides on health and environmentalquality, and difficulty quantifying how the publicvalues environmental and health improvements.
This research also does not estimate costs orbenefits of widespread mating disruption adoptionto consumers in the form of changes in food pricesand resultant expenditures. In other words, themethodology is based on two simplifying assump-tions. One simplifying assumption is that significantacreage switching to mating disruption will notinfluence apple or pear prices significantly as theresult of market supply effects. This assumption islikely to introduce little bias in estimation because,as documented in the methodology section below,the effect of mating disruption on crop yield isminimal. The other simplifying assumption is thatconsumers do not perceive differences in thequality of fruit produced using mating disruptionand, consequently, are not willing to pay a premiumfor such fruit.
Northern California, -$65.28400 dispensers/acre
Northern California, -$30.30300 dispensers/acre+miticide savings
Southern Oregon $161.16
Table 2. Results summary: annual savings or costto mating disruption in Northern California pear,mating disruption and foliar oil in southern Oregonpear.

61
Years in mating disruption
Low CM pressure(2.5 OP covers)
High CM pressure(5 OP covers)
High CM pressure andincreased LR
Moderate CM pressure(3.5 OP covers)
Figure 4. Four-year projected net savings from adoption of mating disruption incentral Washington apple.
Figure 3. Projected net savings from adoption of matingdisruption in northern California and mating disruptionand foliar oil in southern Oregon pear.
NorthernCalifornia
400 dispensersper acre
NorthernCalifornia
300dispensersper acre +miticidesavings
SouthernOregon
Ann
ual p
er-a
cre
net s
avin
gs
$180.00$160.00$140.00$120.00$100.00$80.00$60.00$40.00$20.00$0.00
-$20.00-$40.00-$60.00-$80.00
-$65.28 -$30.30
$161.16
t
u
Ann
ual p
er-a
cre
net s
avin
gs
$40.00
$20.00
$0.00
-$20.00
-$40.00
-$60.00
-$80.00
t
t
t
t
1 2 3 4
u
u
u
u
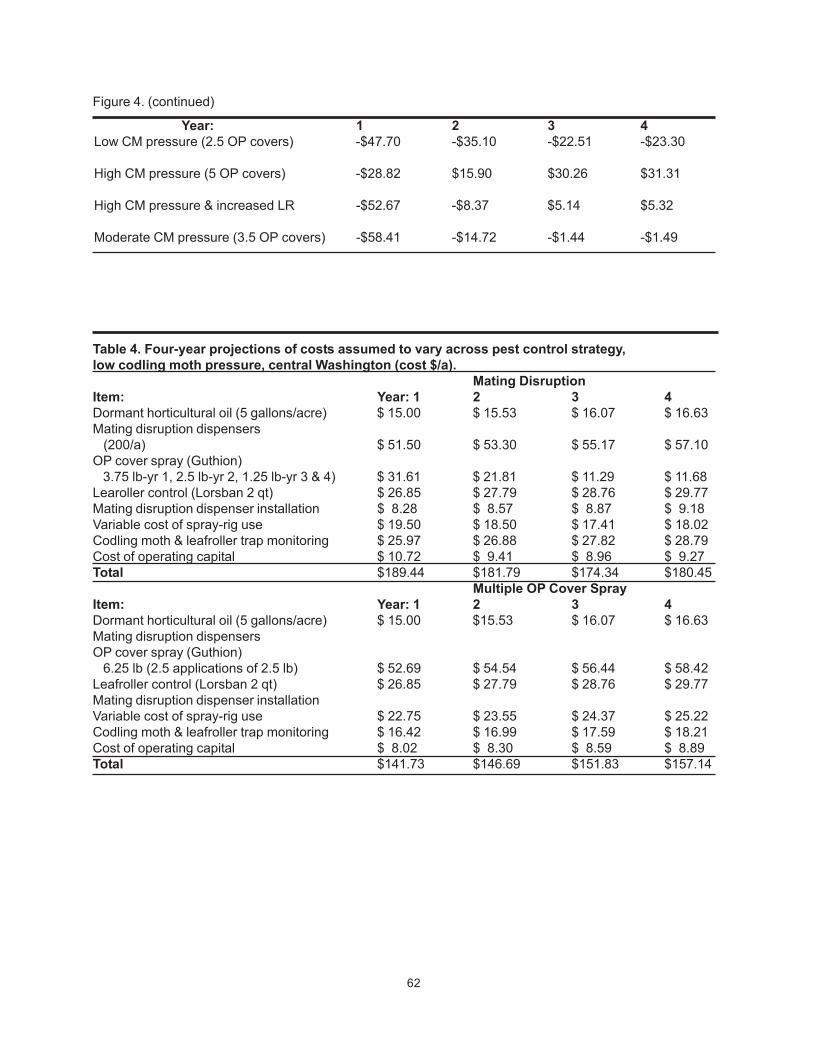
62
Year: 1 2 3 4Low CM pressure (2.5 OP covers) -$47.70 -$35.10 -$22.51 -$23.30
High CM pressure (5 OP covers) -$28.82 $15.90 $30.26 $31.31
High CM pressure & increased LR -$52.67 -$8.37 $5.14 $5.32
Moderate CM pressure (3.5 OP covers) -$58.41 -$14.72 -$1.44 -$1.49
Table 4. Four-year projections of costs assumed to vary across pest control strategy,low codling moth pressure, central Washington (cost $/a).
Mating DisruptionItem: Year: 1 2 3 4Dormant horticultural oil (5 gallons/acre) $ 15.00 $ 15.53 $ 16.07 $ 16.63Mating disruption dispensers (200/a) $ 51.50 $ 53.30 $ 55.17 $ 57.10OP cover spray (Guthion) 3.75 lb-yr 1, 2.5 lb-yr 2, 1.25 lb-yr 3 & 4) $ 31.61 $ 21.81 $ 11.29 $ 11.68Learoller control (Lorsban 2 qt) $ 26.85 $ 27.79 $ 28.76 $ 29.77Mating disruption dispenser installation $ 8.28 $ 8.57 $ 8.87 $ 9.18Variable cost of spray-rig use $ 19.50 $ 18.50 $ 17.41 $ 18.02Codling moth & leafroller trap monitoring $ 25.97 $ 26.88 $ 27.82 $ 28.79Cost of operating capital $ 10.72 $ 9.41 $ 8.96 $ 9.27Total $189.44 $181.79 $174.34 $180.45
Multiple OP Cover SprayItem: Year: 1 2 3 4Dormant horticultural oil (5 gallons/acre) $ 15.00 $15.53 $ 16.07 $ 16.63Mating disruption dispensersOP cover spray (Guthion) 6.25 lb (2.5 applications of 2.5 lb) $ 52.69 $ 54.54 $ 56.44 $ 58.42Leafroller control (Lorsban 2 qt) $ 26.85 $ 27.79 $ 28.76 $ 29.77Mating disruption dispenser installationVariable cost of spray-rig use $ 22.75 $ 23.55 $ 24.37 $ 25.22Codling moth & leafroller trap monitoring $ 16.42 $ 16.99 $ 17.59 $ 18.21Cost of operating capital $ 8.02 $ 8.30 $ 8.59 $ 8.89Total $141.73 $146.69 $151.83 $157.14
Figure 4. (continued)

63
Table 6. Four-year projections of costs assumed to vary across pest control strategy,high codling moth pressure, and increased leafroller pressure, central Washington.
Mating DisruptionItem: Year: 1 2 3 4Dormant horticultural oil (5 gallons/acre) $15.00 $15.53 $16.07 $16.63Mating disruption dispensers year 1: 1/2 @ 400/a,1/2 @ 200/a, years 2-4: 200/a $77.25 $53.30 $55.17 $57.10OP cover spray (Guthion) 5 lb-yr 1, 3.75 lb-yr 2, 2.5 lb-yr 3 & 4) $42.15 $32.72 $22.58 $23.37Leafroller control (Lorsban 2 qt + 1.5 lb Dipel) $50.30 $52.06 $53.88 $55.76Mating disruption dispenser installation $12.42 $8.57 $8.87 $9.18Variable cost of spray-rig use $22.75 $21.86 $20.89 $21.62Codling moth & leafroller trap monitoring $25.97 $26.88 $27.82 $28.79Cost of operating capital $14.75 $12.66 $12.32 $12.75Total $260.59 $223.57 $217.59 225.20
Multiple OP Cover SprayItem: Year: 1 2 3 4Dormant horticultural oil (5 gallons/acre) $15.00 $15.53 $16.07 $16.63Mating disruption dispensersOP cover spray (Guthion) 5 applications of 2.5 lb Guthion $105.38 $109.07 $112.89 116.84Leafroller control (Lorsban 2 qt) $26.85 $27.79 $28.76 $29.77Mating disruption dispenser installationVariable cost of spray-rig use $32.50 $33.64 $34.81 $36.03Codling moth & leafroller trap monitoring $16.42 $16.99 $17.59 $18.21Cost of operating capital $11.77 $12.18 $12.61 $13.05Total $207.92 $215.20 $222.73 230.53
Table 5. Four-year projections of costs assumed to vary across pest control strategy,moderate codling moth pressure, Central Washington (costs $/a).
Mating Disruptionitem: Year: 1 2 3 4Dormant horticultural oil (5 gallons/acre) $ 15.00 $ 15.53 $ 16.07 $ 16.63Mating disruption dispensers year 1: 1/2 @ 400/a,1/2 @ 200/a, years 2-4: 200/a $ 77.25 $ 53.30 $ 55.17 $ 57.10OP cover spray (Guthion) 5 lb-yr 1, 3.75 lb-yr 2, 2.5 lb-yr 3 & 4) $ 42.15 $ 32.72 $ 22.58 $ 23.37Leafroller control (Lorsban 2 qt) $ 26.85 $ 27.79 $ 28.76 $ 29.77Mating disruption dispenser installation $ 12.42 $ 8.57 $ 8.87 $ 9.18Variable cost of spray-rig use $ 22.75 $ 21.86 $ 20.89 $ 21.62Codling moth & leafroller trap monitoring $ 25.97 $ 26.88 $ 27.82 $ 28.79Cost of operating capital $ 13.34 $ 11.20 $ 10.81 $ 11.19Total $235.74 $197.85 $190.96 $197.65
Multiple OP Cover Sprayitem: Year: 1 2 3 4Dormant horticultural oil (5 gallons/acre) $ 15.00 $ 15.53 $ 16.07 $ 16.63Mating disruption dispensersOP cover spray (Guthion) 3.5 applications of 2.5 lb Guthion $ 73.77 $ 76.35 $ 79.02 $ 81.79Leafroller control (Lorsban 2 qt) $ 26.85 $ 27.79 $ 28.76 $ 29.77Mating disruption dispenser installationVariable cost of spray-rig use $ 32.50 $ 33.64 $ 34.81 $ 36.03Codling moth & leafroller trap monitoring $ 16.42 $ 16.99 $ 17.59 $ 18.21Cost of operating capital $ 9.87 $ 10.22 $ 10.58 $ 10.95Total $174.41 $180.51 $186.83 $193.37

64
Table 7. Four-year projections of costs assumed to vary across pest control strategy,Scenario 4: High codling moth pressure, central Washington.
Mating DisruptionItem: Year: 1 2 3 4Dormant horticultural oil (5 gallons/acre) $ 15.00 $ 15.53 $16.07 $16.63Mating disruption dispensers year 1: 1/2 @ 400/a,1/2 @ 200/a, years 2-4 (200/a) $ 77.25 $ 53.30 $55.17 $57.10OP cover spray (Guthion) 5 lb-yr 1, 3.75 lb-yr 2, 2.5 lb-yr 3 & 4) $ 42.15 $ 32.72 $ 22.58 $ 23.37Leafroller control (Lorsban 2 qt) $ 26.85 $ 27.79 $ 28.76 $ 29.77Mating disruption dispenser installation $ 12.42 $ 8.57 $ 8.87 $ 9.18Variable cost of spray-rig use $ 22.75 $ 21.86 $ 20.89 $ 21.62Codling moth & leafroller trap monitoring $ 25.97 $ 26.88 $ 27.82 $ 28.79Cost of operating capital $ 13.34 $ 11.20 $ 10.81 $ 11.19Total $235.74 $197.85 $190.96 $197.65
Multiple OP Cover SprayItem: Year: 1 2 3 4Dormant horticultural oil (5 gallons/acre) $ 15.00 $ 15.53 $ 16.07 $ 16.63Mating disruption dispensersOP cover spray (Guthion) 5 applications of 2.5 lb Guthion $105.38 $109.07 $112.89 $116.84Leafroller control (Lorsban 2 qt) $ 26.85 $ 27.79 $ 28.76 $ 29.77Mating disruption dispenser installationVariable cost of spray-rig use $ 32.50 $ 33.64 $ 34.81 $ 36.03Codling moth & leafroller trap monitoring $ 16.42 $ 16.99 $ 17.59 $ 18.21Cost of operating capital $ 11.77 $ 12.18 $ 12.61 $ 13.05Total $207.92 $215.20 $222.73 $230.53
Table 8. Four-year projections of costs assumed to vary across pest control strategy,pear production, northern California.
Mating Disruption Dispensers/AcreItem: 400 300Dormant horticultural oil (20 gallons/acre) $60.00 $ 60.00Mating disruption dispensers 400/a $103.00 $ 77.25OP cover spray (Guthion) 1 application of 2.5 lb Guthion $ 21.08 $ 21.08Leafroller control (Lorsban 2 qt) $ 26.85 $ 26.85Mite control (Agrimek 7 oz) $ 35.56 $ 35.56Mating disruption dispenser installation $ 16.00 $ 12.00Variable cost of spray-rig use $ 42.25 $ 39.00Codling moth & leafroller trap monitoring $ 25.97 $ 25.97Cost of operating capital $ 19.84 $ 17.86Total $350.55 $315.57
Multiple OP Cover SprayItem: 2Dormant horticultural oil (14 gallons/acre) $ 42.00 $ 42.00Mating disruption dispensersOP cover spray (Guthion) 4 applications of 2.5 lb Guthion $ 84.31 $ 84.31Leafroller control (Lorsban 2 qt) $ 26.85 $ 26.85Mite control (Agrimek 10 oz) $ 50.80 $ 50.80Mating disruption dispenser installationVariable cost of spray-rig use $ 48.75 $ 48.75Codling moth & leafroller trap monitoring $ 16.42 $ 16.42Cost of operating capital $ 16.15 $ 16.15Total $285.27 $285.27

65
Table 9. Projections of costs assumed to vary across pest control strategy,pear production with mating disruption and foliar oil, southern Oregon.
Mating Disruptionitem:Horticultural + foliar oil (14 gallons/acre) $42.00Mating disruption dispensers 400/a $103.00OP cover spray (Guthion) 1 application of 2.5 lb Guthion $21.08Leafroller control (Lorsban 2 qt) $26.85Mite controlPear psylla controlMating disruption dispenser installation $16.00Codling moth & leafroller trap monitoring$25.97Cost of operating capital $14.09Total $248.99
Multiple OP Cover SprayItem:Dormant horticultural oil (6 gallons/acre) $18.00Mating disruption dispensersOP cover spray (Guthion) 3 1/2 application of 2.5 lb Guthion $73.77Leafroller control (Lorsban 2 qt) $26.85Mite control (Agrimek 20 oz + Apollo 3 oz) $139.10Pear psylla control (Mitac 3 lb + Savey 8 oz) $103.12Leaf miner control (Pounce 8 oz) $9.68Mating disruption dispenser installationCodling moth & leafroller trap monitoring$16.42Cost of operating capital $23.22Total $410.15
Appendix 1.Basis for Partial Budgeting Assumptions.
Assumption 5: Revenue losses due to pest damageconstant across treatments.As summarized in Figure 1, five factors are as-sumed constant in the partial budgets used in thisresearch. The assumption that factors 1 through 4do not vary with variation in pest control cost arerelatively uncontroversial maintained hypothesesthat are not tested statistically. It simply is assumedthat on well-managed farms, choosing to usemating disruption does not influence cost in thesecategories. Previous research suggests that someof these factors may influence pesticide use. Forexample, irrigation management practices havebeen shown to influence pest control practices insome settings. Typically, however, such “secondorder” interaction effects are small and, in any case,more detailed surveys of management practices
and outcomes than could be collected for thisresearch effort would be required to estimate anysuch effects.
The assumption that revenue losses due to pestdamage do not vary across pest control strategiesis not standard in partial budget analyses of pestcontrol strategy economics. Generally, it is as-sumed that damage varies between strategies. Inthis study, statistical comparisons showed thatassuming no damage difference is justified in thisparticular case. Results of the statistical compari-son are summarized in Table 10. The table reportsdifferences in average percentage of fruit damagedby codling moth, average percentage of fruitdamaged by leafroller, and average percentage offruit damaged by other pests on samples of matingdisruption blocks and multiple OP blocks, as well asp-values for t-test comparisons of sample means.

66
Table 10 also reports estimated average revenuelosses from pest damage for samples of matingdisruption blocks and multiple OP blocks, and p-value results of t-tests comparisons. For thisanalysis, average revenue loss was computed intwo ways. Where data permitted, revenue loss fromall pest damage was estimated assuming all codlingmoth and leafroller damaged fruit was culled andreceived zero revenue, and fruit damaged by allother insects received 22 percent less income(average price difference between between fancyand grade A Washington apples from 1995-1997).Where only codling moth and leafroller damagedata were available, it was assumed that all dam-aged fruit was culled and received zero revenue.
Loss was computed for each observation revenueas:
Revenue loss all insect damage ={ (% CM damage + % LR damage) + 0.22 x %
other pest damage } x regional average yield (tonsper acre) x state average price ton
Revenue loss all CM and LR damage =(% CM damage + % LR damage) x regional
average yield (tons per acre) x state average priceton
The results summarized in Table 10 indicate thatavailable data strongly support the hypothesis thaton average over the sampled years, averagerevenue loss attributable to pest damage differ-ences were very small, and the assumption thatdifferences in pest damage across treatments doesnot effect revenue is justified.
Table 10. Results of hypotheses tests comparing damage difference on mating disruption andmultiple OP blocks.Data Sample Sample Statistical % Codling % Leaf % Other Estimated EstimatedDescription Size Measure Moth Roller Pest Revenue Revenue
Damage Damage Damage Loss, All Loss, CMPest and LR only
1. Central Washington n=90 Conv avg 0.26% 0.21% 0.53% $29.24 $19.36apples, 1996-1998 n=175 Md avg 0.08% 0.10% 1.18% $29.77 $7.93
p-value 0.01 0.02 0.03 0.90 0.001
2. Central Washington n=12 Conv avg 0.13% 0.07% * * $5.90pears, 1995-1998 n=20 Md avg 0.17% 0.05% * * $6.70
p-value 0.57 0.64 * * 0.82
3. Northern California n=18 Conv avg 0.08% 0.03% * * $4.43pears, 1996-1998 n=19 Md avg 0.10% 0.16% * * $10.5
p-value 0.65 0.05 * * 0.16
4. Southern Oregon * Conv avg 0.05% 0.00% 1.15% $2.42 $0.40pears, 1995-1998 * Md avg 0.49% 0.15% 0.42% $5.87 $5.07
p-value * * * * *
* Based on summary information; could not be tested statistically.

67
Assumed mating disruption dispensers and supple-mental OP use on MD blocks
Estimating assumed use of mating disruptiondispensers and supplemental OP application onMD blocks was a non-statistical process usingexpert opinion and the database of mating disrup-tion areawide program performance summarymeasures compiled by Alway (1998). This databaseis summarized in Tables 11 and 12. The information
in these tables and interviews suggested thatdensities of mating disruption dispensers as well assupplemental OP use have declined significantlysince 1995. Personal discussion with Jack Jenkins,the general manager of Pacific Bio-Control, supplierof the market-leading Isomate 2 dispenser, re-vealed that these reductions were not due tochanges in product efficacy. Formulation andefficacy of the product has remained the samesince 1995.
Table 11. Mating disruption dispenser density, number of OP cover sprays, and CM pressure at5 “original” CAMP sites.Site Location Fruit Year Codling moth MD OP cover
pressure (avg. dispensers sprays forseasonal trap /acre codling mothcatch)
Randall Northern Pear 1996 600 1 Island California 1997 18.9 400 1
1998 9.1 400 or 300 1
Medford Southern Pear 1996 400 1Oregon 1997 3.2 400 1
1998 7.9 400 1.75
West Central Apple 1996 400 Just less than 1Parker Washington 1997 400 Just less than 1Heights 1998 200 original 1 on 50%,
blocks, 400 borders andexpansion hotspots onblocks others
Howard Central Apple 1996 3.6 400 1 + border, hotFlats Washington 1997 0.31 just less than spots
1998 300 30% - 0200 to 250 75%-0, 25%-1
Oroville Central Apple 1996 4.3 400 1.75 (avg)Washington 1997 0.8 400 0.2 (avg)
1998 0.22 400 0 - originalblocks, 1 or 2on expansion

68
As Table 11 suggests, smaller reductions indispenser hanging density have been observed inSouthern Oregon and Northern California pearthan in Central Washington apple. Interviewssuggested that growers and project managers donot feel compelled to further reduce dispenserdensities in the pear regions studied, becausecodling moth pressure continues to be significant.This is reflected in the codling moth trap countnumbers for the Randall Island and Medford CAMPproject sites in 1997 and 1998.
Per acre dispensers rate at Randall Island de-creased in 1997 as the result of threshold discov-ery with increased experience rather than system-atic decreases in codling moth pressure resultingfrom mating disruption. Until 1996, growers hadused two dispenser hangings per year, one 400dispenser/acre hanging in the spring and a second200 dispenser/acre hanging late in the season. Thetwo hangings were used because both codlingmoth pressure and rates of pheromone release aredependent on temperature. It seemed that under
Table 12. Mating disruption dispenser density, number of OP cover sprays, and CM pressure at6 CAMP sites new in 1998.Site Location Fruit Year Codling moth MD OP cover
pressure (avg. dispensers sprays forseasonal trap /acre codling mothcatch)
South Shore Central Apple 1998 3.3 200, 400 on top 1 + border andWashington edge of slope hot spots
East Central Apple 1998 50% 200 50% 0,Wenatchee Washington 50% 400 50% 1 or 1 +
including some bordersorganic
Babcock Central Apple 1998 1.3 200 Just <50% 0,Ridge Washington Just >50% 1
Bench Central Apple 1998 4.2, 50% <2 250, 1 on mostRoad Washington 400 hot spots blocks, more
on a few
Elephant Central Apple 1998 17.1 200, 1 on mostMountain Washington 400 hot spots blocks, more
on a few
Lower Central Apple 1998 25, some 200 on 75%, Average of 2Roza Washington >200 300 or 400 on
25%
warm California growing conditions, the potential forsignificant codling moth exposure could result if asingle hanging were used. Experience through1996 convinced growers and site managers thatone hanging would provide very nearly full seasoncoverage and cost savings benefits would outweighrisks. Results of less than 0.5 percent CM damagein the 1997 and 1998 seasons confirm that 400dispensers and one supplemental OP spray provideadequate control in the region.
For both of the pear scenarios evaluated in theresearch, we assume that 400 MD dispensers/acreand one supplemental OP spray will remain stan-dard practice. This reflects experience in the regionto date and consensus of growers and the CAMPproject manager we interviewed.
In central Washington apple production, matingdisruption dispenser density declined significantlyfrom 1995 through 1998. The declines appear to bethe result of systematic declines in codling mothpressure at sites where mating disruption has been

69
implemented for multiple years, as well as thresholddiscovery with increased experience.
Experience at the Howard Flats CAMP project(summarized in Table 11) is indicative of generaltrends in low codling moth pressure orchardsettings in central Washington. At that site, wheregrowers averaged 2 to 3 OP cover sprays beforemating disruption, codling moth pressure declinedover the years. In 1998, no codling moths werefound in 75 percent of monitoring traps, MD dis-penser rates declined to 200 or 250 in most blocks,and no OP cover sprays were applied on 75 per-cent of the project blocks. In 1997 and1998, fruitdamage from codling moth observed at harvestwas minimal (<0.1 percent), indicating that thereduced dispenser density is highly effective.Experience at the West Parker Heights CAMP siteis illustrative of the similar but somewhat lessdramatic declines in MD disruption dispenser use incentral Washington regions with high codling mothpressure. In 1998, only about half of the growers,who had typically been applying 4 to 6 or more OPcovers before using mating disruption, applied acover spray despite reducing dispenser rates to200/acre. In 1998, fruit damage from codling mothobserved at harvest at both sites was minimal(<0.1 percent), indicating that the reduced dis-penser density is highly effective.
Table 12 summarizes the experience of sixareawide projects that began operation in 1998 andis indicative of a trend toward going into matingdisruption with lower dispenser densities thantypically had been the case 2 years earlier. At nearlyall of these sites, growers decided to use 200 (or atmost 250) dispensers per acre, except on blockswith a known history of particularly strong codlingmoth pressure, where 400 dispensers were typical.As Table 4 indicates, the most typical practice wasapplication of one OP cover spray at first-year siteswith a second applied to high pressure areas wherecodling moth trap counts indicated one wasneeded.
The experience in the region to date, and theconsensus of growers and the CAMP projectmanager we interviewed, suggested the followingassumptions for the apple scenarios 3 and 4. Forscenario 3, the low to moderate CM pressure applescenario, it is assumed that 200 MD dispensers/acre and 11¦2 supplemental OP sprays will remainstandard practice in the first year of mating disrup-tion implementation. It is assumed further that
dispenser densities and rates of supplementalsprays in following years will decline as indicated inTable 1. For scenario 4, high CM pressure, it isassumed that 400 MD dispensers/acre and twosupplemental OP sprays will remain standardpractice in the first year of mating disruptionimplementation. It is assumed further that dis-penser densities and rates of supplemental spraysin following years will decline.
Assumed cost of secondary insect pest control andthe cost of OP covers on non MD blocks
Data exploration of the samples of spray recordsfor CAMP and comparison blocks revealed that themajor pest focus of insecticide treatment other thancodling moth included leafroller, aphids, mites,campyloma, western tentiform leafminer, leafhopper, and pear psylla. Next, several prior hypoth-eses about how mating disruption affects second-ary pest control cost were developed for statisticaltesting based on site interviews and extensivesecondary pest sampling data from CAMP andcomparison blocks (Beers et al., 1998).
One prior hypothesis relating to central Washingtonapple orchards was that use of mating disruptionslightly increases secondary pest control costbecause additional insecticide expenditures arerequired to substitute for the forgone leafrollersuppression that multiple OP cover sprays provide.The second prior hypothesis was that cost of insectcontrol for other secondary pests in central Wash-ington apple probably is not different for blocks inmating disruption. The key hypothesis expressed bypear experts we interviewed was that secondarypest effects likely decrease secondary pest controlcost, primarily as the result of increased naturalcontrol of pear psylla, which allows reductions inexpenditures for pear psylla control insecticides.Furthermore, reduced use of psylla control materi-als disruptive to predaceous mites capable ofcontrolling twospotted spider mites may lead toreduced demand for mite control insecticides. Italso was believed that savings on secondary insectcontrol materials would be more pronounced inscenario 2 because horticultural oils applied in thefoliar period have significant larval and ovumsuppression capacity.
In order to test for differences in secondary pestcontrol cost on MD and multiple OP blocks, thesamples of spray records for each block type andCAMP site summarized in Table 13 were used.

70
Expenditures on insecticides targeted at the mostimportant insect pests were summed and com-pared using two tailed t-tests for populations withunequal variance. The data also were used toestimate average expenditures on organophos-phates on blocks not in mating disruption. Resultssummarized in Appendix: Statistical Analysis ofSpray Records Tables A.1 – A.5 suggest that priorhypotheses regarding secondary pest materialsexpenditures largely were confirmed.
In northern California, savings on pear psylla andmite control material were observed but were smalland not statistically significant at traditional confi-dence levels of 90 percent or more. In southernOregon, savings on pear psylla and mite controlmaterial were large and statistically significant.Additionally, southern Oregon pear growers using amating disruption and dormant oil strategy realizedsavings on materials targeted at aphids and leafminer. At both Northern California and SouthernOregon sites, larger and statistically significantlydifferent expenditures on horticultural oil wereobserved on mating disruption blocks.
In the high codling moth pressure areas of centralWashington studied (Oroville and West ParkerHeights), apple growers on mating disruption blocksspent more to control leafroller. At West Parker
Heights, the expenditure difference was highlystatistically significant, while at Oroville the differ-ence was statistically significant at the 80 percentconfidence level. In the low pressure area of centralWashington (Howard Flats), expenditures onmaterials for leafroller control were nearly identicalon mating disruption and multiple OP cover sprayblocks. As Tables A.3 and A.4 indicate, small andnearly statistically significant savings in othercategories of secondary pest control cost also wererealized by central Washington apple growers usingmating disruption. There is no obvious entomologi-cal reason for these differences. One possibilityconsistent with findings from past studies is that thedifferences are a result of the intensity of monitoringand use of threshold for these pest on CAMPblocks (Norton and Mullen, 1994).
In the partial budgets developed for this study, anysecondary cost insect control costs are included forany category where differences were found to bestatistically significant at the 90 percent level. Theimpact of including less statistically significantsecondary pest cost is discussed in results andconclusion sections.
Assumed costs of insect materials application
Applying both chemical pesticides and pheromonesentails costs: tractor and sprayer use costs, labor,and overhead. Because the use of inputs variesacross the two strategies compared here, applica-tion costs also were expected to vary. Using matingdisruption involves additional costs of installingmating disruption dispensers. Block specificinformation on the cost of dispenser applicationwas unavailable. Interviews suggest that it requiresabout 2 hours per acre of labor effort on average.Assuming that the full cost to growers of labor(wages, Social Security, disability etc.) is $8/hour,this translates into a cost of $16/acre. This estimateis similar to Knight (1995), who surveyed Washing-ton apple growers using mating disruption andfound an average cost of $12.30/acre for applica-tion by hand and $17.30/acre for application with atelescoping pole.
Furthermore, tractor and spray rig use (labor, fuel,maintenance, and depreciation) are not likely to bethe same on MD and OP blocks. Our prior hypoth-esis was that spray rigs and tractors used to pullthem would see less use on blocks in matingdisruption because fewer OP cover sprays are usedon such blocks. However, interviews with growers
Table 13. Mating disruption and comparisonblock spray record data samples.Site 1995 1996 1997 total
Howard FlatsConventional n=8 n=7 n=15 applesMD apples n=127 n=127 n=358West ParkerConventional n=4 n=8 n=8 n=20applesMD apples n=37 n=38 n=38 n=113MedfordConventional n=9 n=9 n=4 n=18pearsMD pears n=8 n=7 n=4 n=15Randall IslandConventional n=6 n=6 n=12applesMD apples n=5 n=5 n=10

71
and project personnel suggested that one less OPcover spray would not necessarily result in one lesstrip with spray equipment. Multiple materialsincluded in a tank mix often are applied, so thatsome trips which would include an OP for codlingmoth are likely still to take place on mating disrup-tion blocks.
In order to assess the extent of spray rig usereduction on mating disruption blocks, a t-test wasused to compare average numbers of trips withtank mixes including insecticides for the samples ofmating disruption and comparison blocks. Theresults presented in Table 14 show that statisticallysignificant reductions in spray rig use were ob-served on mating disruption blocks, with theexception of the Medford blocks, which is notsurprising, as mating disruption growers at this siteuse fewer OP sprays, but apply three foliar periodhorticultural oil sprays. The observed use reduc-tions at the two apple sites roughly correspond toone less trip for two less OP cover sprays, which
we assume in scenario 3 and 4 partial budget. AtRandall Island, approximately one less spray rig tripwas observed for three less OP cover sprays,which we assume in the scenario 1 partial budget.
Without detailed farm financial records, which werenot available for this study, it is difficult to knowwhat savings growers realize as the result ofreduced spray rig use. The 1993 Washington StateUniversity enterprise budgets for apple productionuse a per acre and sprayer cost of $15.39, a valuefor orchard total tractor and spray rig depreciation,repairs, maintenance, fuel, and labor divided byacres and spray rig uses. Because slight reductionsin spray rig use will not allow many growers toreduce significantly tractor and spray rig capacity orslow replacement, this average number probablyoverstates marginal savings. We use a moreconservative savings estimate of $6.50 per acreand spray trip which represents only the cost oflabor fuel and maintenance.
Assumed Cost of Pest Monitoring
Typical codling moth and leafroller monitoringpractices in apple and pear orchards involve settingtraps at the beginning of the season, visiting thetraps weekly to count moths, and periodicallychanging the pheromone lures in the traps. Inter-views with growers, CAMP project managers, andcrop pest management consultants suggested thata higher density of traps typically are used inorchards in mating disruption, and, consequently,the cost of monitoring on mating disruption likely ishigher. A survey of 25 central Washington pestmanagement consultants found densities of codlingmoth traps in mating disruption were typically oneper 2.5 acres though one per 5 acres was notuncommon. In multiple OP cover spray blocks,
densities varied from one trap for each 5 to 40acres, with typical densities of one trap per 5 to 7acres (Alway, 1998).
In this study, one codling moth trap per 2.5 acresand one leafroller trap per 5 acres on matingdisruption blocks are assumed, and one half thatdensity on multiple OP cover spray blocks. Toestimate costs of monitoring, six consultants ormanagers responsible for monitoring on significantacreage were interviewed to ascertain labor,materials, and overhead requirements associatedwith monitoring. Table 15 presents resulting esti-mates of monitoring cost on MD and OP blocks.
Table 14. Comparison of spray rig use on mating disruption and OP blocks.Scenario 1 Scenario 2 Scenario 3 Scenario 4based on based on based on based onRandall Medford Howard West ParkerIsland Flats Heights
Avg # of sprayer uses on MD blocks 6.64 6.10 7.52 7.57Avg # of sprayer uses on OP blocks 5.64 6.03 6.26 5.53p-value of t-test comparison of means 0.1 0.74 0.07 <0.01Assumed sprayer 1 for every None 1 for every 1 for every
use reduction three fewer two fewer two fewerOP covers OP covers OP covers

72
Table 15. Cost of codling moth and leafroller monitoring.Mating Disruption Blocks OP Cover Spray Blocks
Item $/unit Units $/acre Units $/acreCM trap materials $22.50 one trap / 2.5 acres 9.00 one trap / 2.5 acres 4.50LR trap materials $19 one trap / 5 acres 3.80 one trap / 5 acres 1.90CM, LR trap monitoring $8 0.66 hours/acre 5.35 0.44 hours/acre 3.52check and change lures $8 0.34 hours/acre 2.79 0.22 hours/acre 1.76Remove traps $8 0.11 hours/acre 0.93 0.08 hours/acre 0.64Overhead item 1, ATV $0.35 6 miles/acre 2.10 6 miles/acre 2.10Overhead item 2, Pickup $0.50 4 miles/acre 2.00 4 miles/acre 2.00
Total 25.97 16.42
Literature Cited
Alway, T. Areawide IPM Update – The Newsletter ofPheromone Based Orchard Pest Management.Various issues. 1997 and 1998. http://www.tfrec.wsu.edu/ipmnews/index.html.
Beach, E.D. and G.A. Carlson, 1993. “A HedonicAnalysis of Herbicides: Do User Safety andWater Quality Matter ?” American Journal ofAgricultural Economics. Vol. 75:612-623.
Beers, E., J. Brunner, A. Knight, B. Higbee, R.Hilton, P. VanBuskirk, S. Welter. Impact ofAreawide Codling Moth Control on SecondaryPests and Their Natural Enemies. 1998Progress Report. WSU Tree Fruit Researchand Extension Center. http://www.tfrec.wsu.edu. 1998.
Knight, A.L. The impact of codling moth matingdisruption on apple pest management inYakima Valley, Washington. J. Entomol. Soc.Brit. Columbia, 92, pp 29-38. December, 1995.
Lohr, L., T. Park, and M. Wetzstein. VoluntaryEconomic and Environmental Risk Tradeoffs inCrop Protection Decisions. Working PaperDepartment of Agricultural and AppliedEconomics, University of Georgia, Athens, GA.1997.
Norton, G.W. and J. Mullen. Economic Evaluation ofIntegrated Pest Management Programs: ALiterature Review. Virginia CooperativeExtension Publication No. 448-120. Blacksburg,VA Virginia Polytechic Institute and StateUniversity. 1994.
Williamson, E.R., R.J. Folwell, A. Knight, and J.F.Howell. Economic Analysis of Codling MothControl Alternatives in Apple Orchards.Washington State Cooperative ExtensionService, Extension Bulletin # 1789.
Table A.1. Results of testing for differences in expenditures on insecticides for secondary pestcontrol, Scenario 1.
Scenario 1: Northern California pear—data: Randall Island CAMP Project mating disruption and compari-son blocks, 1996–7.
Campyloma, General ovum,Target insect Leafroller Pear psylla Mites Lygus, Stink bug Larva suppression
MD blocks Avg. expenditure $0 $2.88 $52.17 $5.48 $80.32 Typical application Asana 8 oz. Agrimek 8 oz, Diazinon 4 lb Dormant
Apollo horticultural oil3 oz (1/4 of acre) (1/3 of acre) (20 gal)
OP blocks Avg. expenditure $17.50 $3.25 $69.34 $3.73 $61.10 Typical application Lorsban 2 qt Asana 8 oz Agrimek 10 oz, Diazinon 4 lb Dormant
Apollo horticultural oil(1/2 of acre) (1/2 of acre) (1/4 of acre) (15 gal)
Test of equalexpenditurep-value <0.01 0.72 0.19 0.58 0.06

73
Table A.3. Results of testing for differences in expenditures on insecticides for secondary pestcontrol, Scenario 3.
Scenario 3: Central Washington apple, low CM pressure—Data: Howard Flats CAMP Project matingdisruption and comparison blocks, 1995–6.
Campyloma, Lygus,Target insect Leafroller Stink bug Aphids
MD blocks Avg. expenditure $0 $2.88 $5.48 Typical application Lorsban 2 qt or Bt 1.5 lb
(1/8 of acre)OP blocks Avg. expenditure $25.99 $10.18 $1.3 Typical application Lorsban 2 qt Carzol 2 lb Provado on very
(1/4 of acre) limited acreageTest of equalexpenditurep-value 0.91 0.13 0.33
Table A.4. Results of testing for differences in expenditures on insecticides for secondary pestcontrol, Scenario 4.
Scenario 4: Central Washington apple, high CM pressure—Data: West Parker Heights CAMP Projectmating disruption and comparison blocks, 1995–7.
Campyloma, General ovum,Target insect Leafroller Mites Lygus, Stink bug Aphids Larva suppression
MD blocks Avg. expenditure $60.46 $0 $0 $15.33 $16.89 Typical application Lorsban 2 qt + Provado Dormant Horticultural Oil
Bt 3 lb 4 oz (5 gal)OP blocks Avg. expenditure $32.77 $11.63 $3.94 $25.18 $13.03 Typical application Lorsban 2 qt Agrimek 10 oz Carvol 1 lb Provado Dormant Horticultural Oil
or Vendex 3 lb (1/5 of acre) 7 oz (4 gal)Test of equalexpenditurep-value <0.01 0.17 0.16 0.17 0.61
Table A.2. Results of testing for differences in expenditures on insecticides for secondary pestcontrol, Scenario 2.
Scenario 2: Southern Oregon pear—Medford CAMP Project mating disruption and comparison blocks,1995–7.
Campyloma, General ovum,Target insect Pear psylla Mites Leaf miner Lygus, Stink Aphids larva
bug suppressionMD blocks Avg. expenditure $20.00 $0 $0 $0 $4.47 $41.21 Typical application Comply Agrimek 8 oz, Provado 10 oz Dormant
8 oz Apollo 3 oz (1/5 of acre) horticultural oil (1/4 of acre) (14 gal)
OP blocks Avg. expenditure $130.33 $111.94 $13.30 $1.11 $14.89 $18.17 Typical application Asana 10 oz Agrimek Pounce Provado Dormant
or Savey 8 oz Apollo 20 oz 12 oz (1/4 of acre) horticultural oil+ Mitac 3 lb + 3 oz (6 gal)Comply 8 oz (1/2 of acre)(1/3 of acre)
Test of equalexpenditurep-value <0.01 <0.01 <0.10 0.13 0.21 <0.01

74
Table A5. Organophosphate use on non-mating disruption blocks.Scenario 1 Scenario 2 Scenario 3 Scenario 4based on based on based on based onRandall Medford Howard West ParkerIsland Flats Heights
Avg. per acreexpenditure $80.83 $66.77 $48.73 $108.54
on organophosphatesTypical organophosphate Four 2.5 lb Guthion or Three and one-half Two and one-half Five and one-halfuse four 2 qt Penncap 2.5 lb Guthion 2.5 lb Guthion 2.5 lb Guthion

75
Integrated management of postharvest diseases ofpear presents a unique challenge, in thatpostharvest problems usually appear while theproduct is under the management of differentindividuals than those who must effect the controlmeasures. The grower’s task is consideredcomplete when bulk fruit is delivered to thepackinghouse; and, traditionally, growers regardpostharvest problems—such as decay—theresponsibility of the packing house and coldstorage operators. We have identified a diversearray of practices, each of which contributes toreduction of decay in stored pears, that focusprimarily on grower cultural practices. Thus, acritical aspect of implementation of this programhas been encouraging growers to understand theimportance of their cultural practices on thepostharvest quality of the fruit that they deliver topacking houses.
Our research began with independently assessingthe effects of fruit maturity at harvest, managementof fertilizer timing for low-nitrogen fruit, and calciumenrichment through orchard calcium chloridesprays, on postharvest decay susceptibility inpears. Pears harvested earlier, within the range ofharvestable maturity, had less decay than thoseharvested later. Fruit from trees fertilized 3 to6 weeks before harvest had less fertilizer nitrogenin the fruit than fruit from trees fertilized in spring,and correspondingly less decay. Calcium-enrichedfruit from trees sprayed with calcium chloride hadless decay than fruit from unsprayed trees. Each ofthese practices resulted in reduced decay, althoughthe level of control provided by each was relativelysmall. When the techniques were combined,however, the control was additive, and thecombined benefit more substantial (Sugar et al.,1994). The nitrogen available to fruit also may bereduced by lowering overall rates of nitrogenfertilization. Furthermore, fruit from trees with lowervigor and higher fruit density have been shown tocontain less nitrogen than fruit from higher vigortrees or those cropped less densely (Sanchez etal., 1995; Sugar, 1998).
Integrated Management of Postharvest Diseases of Pear
D. Sugar, K.A. Powers, and S.A. BasileSouthern Oregon Research and Extension Center
Oregon State UniversityMedford, OR 97502
After harvest, most pears intended for long-termstorage are treated with a fungicide, thiabendazole(TBZ), for prevention of decay. It is known thatcontrol is only partially effective, and that somespecies of decay fungi are not sensitive to TBZ.Furthermore, resistant strains of otherwise sensitivespecies exist. Several yeasts and bacteria havebeen identified that have potential for biologicalcontrol of pear decay fungi, either alone or incombination with TBZ. The next step in thedevelopment of an integrated program for peardecay was to combine the cultural practicesdescribed above with postharvest treatment with abiocontrol agent. Although several yeast specieshave been found to be effective on pear (Sugar andSpotts, 1999), our studies focused on Cryptococcuslaurentii. In addition to postharvest yeast treatment,the atmosphere of the storage room was includedas an experimental variable. Controlled atmosphere(CA) storage uses reduced oxygen levels tosuppress fruit respiration and prolong qualitymaintenance in stored fruit. We integrated thecultural practices described above with postharvestyeast, or yeast plus reduced rate of TBZ, andstorage in air or CA (2 percent oxygen, < 0.5 per-cent carbon dioxide). Again, the effects of alltreatment components were additive, and resultedin substantial decay reduction (Sugar et al., 1998).The most effective postharvest treatment was theyeast C. laurentii applied as a line spray incombination with one-tenth the label rate of TBZ.CA storage had only a slight benefit for decayreduction.
Subsequent work has focused on improvement ofthe storage component of the integrated program,evaluation of yeast treatments in the orchard priorto harvest, and integration of field yeast withcalcium and fungicide sprays. Substantial reductionin decay has resulted from short-term storage ofpears in high carbon dioxide atmospheres. Storageof pears for 2, 4, or 6 weeks in 12 or 20 percentcarbon dioxide with 5 percent oxygen resulted insignificant suppression of postharvest decay,especially that caused by the gray mold pathogen,Botrytis cinerea. Control improved with increasingcontent of CO2 and with increasing duration of

76
exposure. Pears may be sensitive to internal injuryfrom high CO2 storage, resulting in core browningand cavity formation in the flesh. We found thatCO2 injury was avoided in early-harvested pears. Inlater-harvested pears, injury increased with durationof exposure to high CO2 and with delay in initiationof the high CO2 atmosphere after harvest. CO2sensitivity was not visibly affected by calciumtreatments in the orchard or by the storageatmosphere following high CO2 treatment (CA vs.normal air). Several species of yeast and onebacterial biocontrol agent were combined withshort-term high CO2 storage. Biocontrol agentsappeared to be compatible with the high CO2atmosphere, and their effect on decay was additiveto that of the atmosphere (Benbow and Sugar,1997).
Application of yeast biocontrol agents in the orchard3 weeks prior to harvest showed that the yeastsCryptococcus laurentii, C. infirmo-miniatus, andRhodotorula glutinis survived well on the surfacesof pears despite late-summer heat and drought.The yeast Candida oleophila did not survive well.The objective of pre-harvest treatment is to positionthe biocontrol agents on the fruit surface where theyare available to colonize small wounds whichcommonly occur during harvest and transport andare important sites of infection for postharvestdecay (Spotts et al., 1998). We found that orchardyeast treatment did contribute to reduction inpostharvest decay at wounds, especially with theyeast C. infirmo-miniatus. C. laurentii, C. infirmo-miniatus, and R. glutinis are not yet registered foruse on pear.
Pear growers commonly apply the fungicide ziramduring the growing season to pears intended forlong-term storage. We found that populations of C.infirmo-miniatus appeared to be slightly reducedwhen applied 1 week after ziram treatment, ascompared to application to pears without ziram,although population means were not statisticallydifferent. Populations of this yeast were enhancedby application to pears which had received calciumchloride treatments.
In addition to these practices which may affectpostharvest decay, there are two importantfundamental concepts for decay reduction: avoidinginjury to fruit during harvest and transport, andsanitation in the orchard, packing house, andstorage facility to reduce pathogen availability. Withsome exceptions, wounds are required for
infections which lead to postharvest decay, andmost wounds occur during fruit harvest andtransport. Because of their shape and the nature oftheir stems, pears are especially susceptible topuncture wounding by stems of adjacent pears.Sanitation includes avoiding bringing soil into thepacking house on the skids of harvest bins,forbidding picking up fallen fruit from the orchardfloor, weed and ground cover maintenance toreduce orchard floor humidity, and regular cleaningof packing house floors and fruit-handling surfaces.
Development of an integrated program for peardecay control is a work in progress. However, a listof components known to be of value in reducingpostharvest decay follows.
Orchard Practices
• Managing fertilizer timing and dosage for low-nitrogen fruit; avoiding excess tree vigor
• Enriching fruit calcium through summer calciumchloride sprays
• Harvesting early in the range of harvestablematurity
• Applying ziram during the growing season• Applying appropriate biocontrol agents (when
registered) prior to harvest• Careful harvest and handling to avoid wounding• Sanitation
Packing house / Cold Storage Practices• Line spray treatment with a biocontrol agent +
TBZ• Short-term storage of early harvested fruit in
high CO2 atmospheres• Sanitation
Such diversity of methods directed at postharvestdecay should provide breadth of control (individualcomponents may differentially affect differentpathogen species) and stability (failure of onecomponent should not affect the performance ofother components). With participation of bothgrowers and packing house operators, a programsuch as we are developing can offer substantialbenefit to the pear industry.
Table A5. Organophosphate use on non-mating disruption blocks.Scenario 1 Scenario 2 Scenario 3 Scenario 4based on based on based on based onRandall Medford Howard West ParkerIsland Flats Heights
Avg. per acreexpenditure $80.83 $66.77 $48.73 $108.54
on organophosphatesTypical organophosphate Four 2.5 lb Guthion or Three and one-half Two and one-half Five and one-halfuse four 2 qt Penncap 2.5 lb Guthion 2.5 lb Guthion 2.5 lb Guthion

77
Literature Cited
Benbow, J.M., and D. Sugar. 1997. High CO2storage combined with biocontrol agents toreduce postharvest decay of pear. Proc. CA’97. Postharvest Horticulture Series No.16:270-276. Univ. of Calif., Davis, Dept. ofPomology.
Sanchez, E.E., H. Khemira, D. Sugar, and T.L.Righetti. 1995. Nitrogen management inorchards, pp. 327-380. In: Bacon, P.E. Nitrogenfertilization in the environment. Marcel Dekker,Inc., New York.
Spotts, R.A., P.G. Sanderson, C.L. Lennox, D.Sugar, and L.A. Cervantes. 1998. Woundhealing and staining of mature d’Anjou pearfruit. Postharvest Biol. and Tech. 13:27-36.
Sugar, D., R.G. Roberts, R.J. Hilton, T.L. Righetti,and E.E. Sanchez. 1994. Integration of culturalmethods with yeast treatment for control ofpostharvest fruit decay in pear. Plant Disease78:791-795.
Sugar, D. and R.A. Spotts. 1999. Control of bluemold decay in pear by four laboratory-grownyeasts and two registered biocontrol products.Plant Dis. 83:155-158.
Sugar, D. 1998. Integrated management ofpostharvest decay in pear: concepts andadvances. Proc. Ore. Hort. Soc. 89:62-66.
Sugar, D., D.G. Richardson, P.M. Chen, R.A.Spotts, R.G. Roberts, and T. Chand-Goyal.1998. Advances in improving the postharvestquality of pears. Acta Horticulturae 475:513-526.
Integrated management of postharvest diseases ofpear presents a unique challenge, in thatpostharvest problems usually appear while theproduct is under the management of differentindividuals than those who must effect the controlmeasures. The grower’s task is consideredcomplete when bulk fruit is delivered to thepackinghouse; and, traditionally, growers regardpostharvest problems—such as decay—theresponsibility of the packing house and coldstorage operators. We have identified a diversearray of practices, each of which contributes toreduction of decay in stored pears, that focusprimarily on grower cultural practices. Thus, acritical aspect of implementation of this programhas been encouraging growers to understand theimportance of their cultural practices on thepostharvest quality of the fruit that they deliver topacking houses.
Our research began with independently assessingthe effects of fruit maturity at harvest, managementof fertilizer timing for low-nitrogen fruit, and calciumenrichment through orchard calcium chloridesprays, on postharvest decay susceptibility inpears. Pears harvested earlier, within the range ofharvestable maturity, had less decay than thoseharvested later. Fruit from trees fertilized 3 to6 weeks before harvest had less fertilizer nitrogenin the fruit than fruit from trees fertilized in spring,and correspondingly less decay. Calcium-enrichedfruit from trees sprayed with calcium chloride hadless decay than fruit from unsprayed trees. Each ofthese practices resulted in reduced decay, althoughthe level of control provided by each was relativelysmall. When the techniques were combined,however, the control was additive, and thecombined benefit more substantial (Sugar et al.,1994). The nitrogen available to fruit also may bereduced by lowering overall rates of nitrogenfertilization. Furthermore, fruit from trees with lowervigor and higher fruit density have been shown tocontain less nitrogen than fruit from higher vigortrees or those cropped less densely (Sanchez etal., 1995; Sugar, 1998).
Integrated Management of Postharvest Diseases of Pear
D. Sugar, K.A. Powers, and S.A. BasileSouthern Oregon Research and Extension Center
Oregon State UniversityMedford, OR 97502
After harvest, most pears intended for long-termstorage are treated with a fungicide, thiabendazole(TBZ), for prevention of decay. It is known thatcontrol is only partially effective, and that somespecies of decay fungi are not sensitive to TBZ.Furthermore, resistant strains of otherwise sensitivespecies exist. Several yeasts and bacteria havebeen identified that have potential for biologicalcontrol of pear decay fungi, either alone or incombination with TBZ. The next step in thedevelopment of an integrated program for peardecay was to combine the cultural practicesdescribed above with postharvest treatment with abiocontrol agent. Although several yeast specieshave been found to be effective on pear (Sugar andSpotts, 1999), our studies focused on Cryptococcuslaurentii. In addition to postharvest yeast treatment,the atmosphere of the storage room was includedas an experimental variable. Controlled atmosphere(CA) storage uses reduced oxygen levels tosuppress fruit respiration and prolong qualitymaintenance in stored fruit. We integrated thecultural practices described above with postharvestyeast, or yeast plus reduced rate of TBZ, andstorage in air or CA (2 percent oxygen, < 0.5 per-cent carbon dioxide). Again, the effects of alltreatment components were additive, and resultedin substantial decay reduction (Sugar et al., 1998).The most effective postharvest treatment was theyeast C. laurentii applied as a line spray incombination with one-tenth the label rate of TBZ.CA storage had only a slight benefit for decayreduction.
Subsequent work has focused on improvement ofthe storage component of the integrated program,evaluation of yeast treatments in the orchard priorto harvest, and integration of field yeast withcalcium and fungicide sprays. Substantial reductionin decay has resulted from short-term storage ofpears in high carbon dioxide atmospheres. Storageof pears for 2, 4, or 6 weeks in 12 or 20 percentcarbon dioxide with 5 percent oxygen resulted insignificant suppression of postharvest decay,especially that caused by the gray mold pathogen,Botrytis cinerea. Control improved with increasingcontent of CO2 and with increasing duration of

78
Abstract
The apple ermine moth, Yponomeuta malinellus(Lepidoptera: Yponomeutidae), first was detected in1985 in British Columbia. It quickly spreadsouthward and reached Oregon in 1991. An appleorchard in northern Oregon was monitored during1997 and 1998 to determine ermine moth flightphenology and parasitism in the field. The erminemoth population and damage were moderate in theorchard. The peak flight period in the field wasbetween late June to July. The most dominantparasitoid in the field was Ageniaspis fuscicollis(Hymenoptera: Encyrtidae), a polyembryonic egg-larval parasitoid. Field parasitism increased tenfoldfrom 1997 to 1998. The parasitoid brood size andsex ratio in the field were evaluated during bothyears. Ermine moth cocoon cluster size also wasassessed in an attempt to determine densitydependent parasitism. Ageniaspis was released inthe apple orchard during 1992, 1994, and 1995 in aclassical biological control program. My studyshows that the parasitoid is well established and isincreasingly making an impact on the ermine mothpopulation.
Key words Biological control, polyembryonicparasitoid, parasitism, apple ermine moth,Yponomeuta malinellus, Ageniaspis fuscicollis.
Introduction
The apple ermine moth (AEM), Yponomeutamalinellus Zeller (Lepidoptera: Yponomeutidae), isan univoltine defoliator of apples in the temperateregions of the Palaearctic. AEM (Figure 1) causedwidespread damage to apples in Europe beforemodern pesticides were available (Affolter and Carl,1986).
AEM infestations in North America first weredetected in 1985 in British Columbia and thenorthern border of Washington State. The insectquickly spread southward throughout Washingtonand reached Oregon in 1991 (Unruh et al., 1993).
Apple Ermine Moth and ItsBiological Control in Oregon
Barry B. BaiOregon Department of Agriculture, Plant Division
Now 15 counties in Oregon are infested (Figure 2).AEM females lay eggs in clusters (Figure 3) in latesummer, and larvae, after hatching, stay in clustersto feed during spring (Figure 4). Heavy infestationscan cause complete defoliation of apple trees(Figure 5). A parasitiod biological control agent wasintroduced in Oregon between 1992-95 to battle thedestructive ermine moth.
This paper presents results of a study on AEMbiology and the effectiveness of the biologicalcontrol agent in Oregon. My specific objectives are(1) to determine the distribution of AEM cluster sizein the field and seasonal phenology of AEM,especially adult flight periods; (2) to determine theeffectiveness of the parasitoid by measuringpercent parasitism, sex allocation, and parasitoidbrood size in the field.
Materials and Methods
The study was conducted in an apple orchard onSauvie Island in Multnomah County, OR during1997 and 1998. The orchard was within historicalBybee Howell Park and has been managedorganically for many years. A polyembryonicparasitoid, Ageniaspis fuscicollis (AF) (Hy-menoptera: Encyrtidae), was introduced andreleased in the orchard during 1992-95.
Pheromone traps were used to monitor the AEMadult flight period in the orchard (Figure 6). Four tofive traps were deployed and checked weekly fromJune to August. The number of adult moths caughtin each trap was recorded during each check.
To assess the cluster size of AEM, the orchard wasvisited three to four times in spring. AEM cocoonclusters were collected randomly and taken to thelaboratory to count the number of individuals ineach cocoon cluster.
To evaluate parasitism by AF (Figure 7), field-collected AEM cocoons were examined carefully.

79
Parasitized AEM can be recognized easily bymummified larvae inside cocoons (Figure 8). Thenumber of these parasitized AEM was counted.Percent parasitism was calculated by dividing theparasitized individuals by the total number ofindividuals contained in a cluster.
Individual mummies were put in glass shell vialsbefore the parasitoid adults emerged. These vialswere held under normal laboratory conditions (20 ±3°C; 50± 10% RH). After emergence, the parasi-toids in each vial were counted and sexed. Fromthese, the parasitoid brood size and sex ratio werecalculated. Brood size was defined as number ofparasitoid offspring produced from one parasitizedAEM larva, i.e., one brood. Sex ratio was theproportion of males in one brood.
Results
AEM adults can be seen in the field from June toAugust. The peak adult flight period varies fromyear to year, likely due to the weather. In 1997, thepeak was between late June and early July;however, this peak was delayed for 2 to 3 weeks in1998 (Figure 9).
AEM eggs were laid in a cluster. The larvae fromthe same egg cluster feed and pupate together as agroup. The number of AEM contained in a cocooncluster varied from 1 to 86. The majority of cocoonclusters contained 10 to 40 AEM individuals (mean= 25) (Figure 10).
Field parasitism varied between 2 years. A mean of2.5 percent AEM were parasitized in 1997, whereasabout 10 times more (23.2 percent) were parasit-ized in 1998 (Figure 11). Percent parasitism tendsto decrease with the increase of AEM cluster size.
The polyembryonic parasitoid can produce 20 to160 individuals in a single brood (Figure 8). Majorityof the brood contained 60 to 120 offspring, with amean of 81 progeny per brood (Figure 12).
The parasitoid allocated either male or femaleoffspring within a host. In some cases, theparasitoid allocated mixed sexes in a single AEMhost. When this happens, a bigger brood size tendsto have a lower proportion of males (Figure 13).
Discussion
AEM is an exotic pest newly introduced in thePacific Northwest. The pest poses a threat to fruittree and nursery industries because of its directdamage and its significance in quarantine.
Oregon is the frontier of AEM’s southward spreadand distribution. Only part of the state is infestednow. The peak adult flight period of AEM in Oregonis in June or July.
AEM lay eggs in clusters. Larvae also feed andpupate in clusters. Although a cocoon cluster cancontain up to 86 individuals, an average cocooncluster has only 25 AEM.
The polyembryonic parasitoid, Ageniaspisfuscicollis, has exerted some effect on AEM sincethe biocontrol agent was introduced and released inOregon. Field parasitism can be as high as100 percent on some AEM clusters, and averageparasitism can reach 23 percent. However,variations between years are considerable. Percentparasitism generally decreases with cluster size ofthe AEM. These findings are consistent with theeffect of Ageniaspis fuscicollis on AEM in Europe(Kuhlmann, 1994).
The parasitoid can produce a large brood (mean of81 individuals per brood) in the field. The brood willbe either all males or all females. However,sometimes a brood with both sexes occurs. In suchcases, fewer males tend to be produced with biggerbrood sizes. From a biological control standpoint, abigger brood size means more parasitoid offspringavailable to parasitize target pests.
Literature Cited
Affolter, F. and K. Carl. 1986. The natural enemiesof the apple ermine moth Yponomeutamalinellus in Europe. CIBC Report, Delemont,Switzerland, 29 pp.
Kuhlmann, U. 1994. Spatial host use by Ageniaspisfuscicollis of patchily distributed apple erminemoths Yponomeuta malinellus. NorwegianJournal of Agricultural Sciences. SupplementXXX :337-345
Unruh, T. R., B.D. Congdon, and E. LaGasa. 1993.Yponomeuta malinellus Zeller(Lepidoptera:Yponomeutidae), a new immigrantpest of apples in the Northwest: phenology anddistribution expansion, with notes on efficacy ofnatural enemies. Pan-Pacific Entomologists69:57-70.

80
Figure 1. AEM adult on an apple leaf.
Figure 2. History of AEMs southward and eastward,spread and its current distribution in Oregon.
Figure 3. Egg clusters laid by female AEM in latesummer. Newly laid eggs are bright yellow, whileweek-old egg clusters become reddish in color. Theegg clusters eventually will turn gray, mimicking barkcolors.
Figure 4. A group of larvae feeding on apple foliage(top) and feeding damage on fruits (bottom).

81
Figure 5. A tree completely defoliated by the AEM (top)and close-up of defoliation damage (bottom).
Figure 8. Many individual parasitoids emerged from amummified AEM larva. Cocoon cut open to reveal themummy (photo courtesy of Ulli Kuhlmann).
Figure 6. A pherocon II type of trap baited with AEMpheromone placed in an apple tree.
Figure 7. A female Ageniaspis fuscicollis ovipositing intoa cluster of AEM eggs (photo courtesy of Ulli Kuhlmann).
Figure 9. AEM adult flight period in the field asindicated by pheromone trap catches in 1997 and1998.
JUNE JULY AUGUST
JUNE JULY AUGUST
TIME
NO
. AEM
/TR
AP
25
20
15
10
5
0
8
6
4
2
0
1997
1998

82
Figure 10. Frequency distribution of AEM cocoon cluster sizein the field.
Figure 11. Parasitism of AEM as influenced by the cocooncluster size.
Figure 12. Frequency distribution of Ageniaspis fuscicollis broodsize.
N = 202MEAN = 81.3STD ERROR = 2.1
AF BROOD SIZE (NO. OFFSPRING/BROOD)
FRE
QU
EN
CY
(%)
AEM CLUSTER SIZE (NO. AEM/CLUSTER)
Figure 13. Sex ratio of Ageniaspis fusciollis asinfluenced by its brood size.
SE
X R
ATIO
(% M
ALE
S)
N = 17.8MEAN = .38STD ERROR = .03
AF BROOD SIZE (NO. OFFSPRING/BROOD)
% P
AR
AS
ITIS
M
1997N=87MEAN=.026STD ERROR=.008
1998N=94MEAN=.232STD ERROR=.025
N = 181MEAN = 25.4STD ERROR = 1.2
FRE
QU
EN
CY
(%)
AEM CLUSTER SIZE (NO. AEM/CLUSTER)
0 10 20 30 40 50 60 70 80 90
0.3
0.25
0.2
0.15
0.1
0.05
0
0.3
0.25
0.2
0.15
0.1
0.05
0 0 20 40 60 80 100 120 140 160
19971998
1
0.8
0.6
0.4
0.2
00 20 40 60 80 100 120 140 160
1
0.8
0.6
0.4
0.2
00 10 20 30 40 50 60 70 80 90

83
Site Description
The 1999 CAMP project in Milton-Freewater,Oregon, involved 20 apple growers and included1,044 acres. The main site encompassed 541acres of apples just north and west of the city ofMilton-Freewater. The main site was flat, includednumerous stone fruit blocks within the CAMPboundaries, and was surrounded by more apples,stone fruit, and grapes. Residential suburbanhomes also were scattered throughout the mainsite. A second site, the grower-monitored site, wasjust southwest of the main site and encompssed503 acres of fairly contiguous apple orchardsowned by four growers. In the second site, thetopography was hilly, with apple orchards mostlysurrounded by wheat, grapes, and alfalfa, and noresidences within the CAMP area. Apple orchardswere adjacent to the grower-monitored site onportions of the north and west boundaries of theCAMP area.
Mating Disruption Implementation
Growers were responsible for the purchase andapplication of pheromone dispensers. Monitoringtraps and lures, monitoring of these traps, andcoordination of the entire program was providedthrough a 1-year, $40,000 USDA CAMP grant. Themajority of the growers used Isomate C+ at 200dispensers/a, but approximately 15 percent of thegrowers applied 400 dispensers/a because ofheavy codling moth pressure. On 15 percent ofthe acreage in the main site, NoMate® andCheckMate® were used. Most growers preferredthe “hoop” method for applying the Isomate C+pheromones.
With the exception of one grower, all growersapplied an initial cover spray for first generationtimed at 250 codling moth degree-days. Additionalcovers were applied if justified by trap counts or ifgrowers became overly concerned. In the mainsite, the average number of cover sprays appliedfor codling moth in 1998 was 4.2 and ranged from1 to 6 cover sprays; in 1999, the average number
Summary of Results—Codling Moth Areawide Management Program (CAMP)
Milton-Freewater, OR 1999
L. LampsonMilton-Freewater CAMP Coordinator
of covers was 2.5 and ranged from 1 to 5 covers, a40 percent reduction in cover sprays. In thegrower-monitored site, the average number ofcover sprays applied in 1998 was 3.5, ranging from1 to 4 covers; and in 1999, it was 1.8, ranging from1 to 3 covers, a 50 percent reduction.
Damage Assessments
In the main site, approximately 250 fruit wereexamined per acre (135,000 total fruit) for the binsample damage assessments conducted by theCAMP coordinator. In samples taken at harvesttime, 4 of the 20 growers suffered codling mothdamage in excess of 1 percent on some borders.In two of the border damage cases, bin piles werethe likely outside-infestation source. In the othertwo cases, the blocks had histories of high codlingmoth pressure and were small isolated blocks (1 to2 acres). There were two backyard trees that weretreated regularly by one of the growers but stillsustained unacceptably high levels of damage.
Growers with acreage both in the CAMP programand outside generally reported codling mothdamage to be higher outside the CAMP area.Within the CAMP program, only one growersustained unacceptable damage levels overall.This grower sustained 1.4 percent damage overall,but had failed to apply codling moth covers whenneeded in the last 5 weeks prior to harvest. Thegrower across the road, who also was exposed tothe same bin pile problems but regularly appliedborder sprays as indicated by trap counts, sufferedvery low damage.
In the grower-monitored sites, no regular fruitdamage assessments were made, but thinners andpickers looked for damage, and one of the packinghouses provided cull analyses. No codling mothsting damage was reported in any of the grower-monitored sites.
Obliquebanded leafroller damage varied between0.5 to 12.5 percent in fruit damage assessments.

84
This damage was similar to that found outside theCAMP borders. Lacanobia cutworm damage waslargely absent this year. Stink bug damageexceeded 30 percent on some borders.
Main Problems Encountered During Season
1. At the main site, the major problem encoun-tered was recurring infestation fromhomeowners’ “backyard trees” or neglected,unsprayed commercial orchards near theCAMP apple orchards. A total of 27 suchlocations were identified during the course ofthe season, and about 25 percent of the siteswere cleaned up by removing offending trees;another 25 percent are expected to be removedafter harvest. Various ways of dealing with theremaining problem sites are being addressedby the local horticulture society.
2. A second problem encountered was that thepheromone dispensers ran out of pheromoneby mid-September, a couple of weeks earlierthan preferred. Only one grower was requiredto apply an additional cover spray as a result ofthe pheromone depletion. However, as the1999 season had a very cool summer, growerscan expect that pheromones could be depletedby mid-August in a very hot year. In heavypressure areas, this could present a problemrequiring a final cover spray close to harvest forRed and Golden Delicious apples. Improve-ments in pheromone technology should solvethis problem eventually, but for the next coupleof years, insufficient pheromone could plaguegrowers in Milton-Freewater, which has thelongest growing season of fruit-growing regionsin the Pacific Northwest.
3. Some growers had trouble adjusting to sprayingbased on trap counts and found it difficult to
trust the trap counts. Two of the big growerschose to apply a full second cover, and one ofthese growers also applied a full third cover. Inboth cases, no fruit damage had been found,trap counts were elevated only in some traps,and border sprays probably would have beensufficient. For the first year of the program,these growers chose to take a very conserva-tive approach, figuring the extra treatmentswould improve chances for success withmating disruption next year.
4. Wherever bin piles were stacked, codling mothcounts were elevated and required additionalborder sprays. In two cases, significantdamage was experienced along the bordersclosest to the bin piles.
5. Close to harvest, a couple of growers decidednot to apply a cover spray, even though theirtrap counts were high. In both cases, trapcounts were quite high, and significant codlingmoth damage resulted.
6. In the grower-monitored site, there wereproblems with growers failing to monitor for thefull season. Growers failed to turn in regulartrap counts, or did not turn them in at all in onecase. Communication between the CAMPcoordinator and growers in these sites was notadequate.
Projected Future for CAMP in Milton-Freewater
All of the larger growers plan to put all their acreageinto codling moth mating disruption next year, whichwould double the current CAMP acreage. Some ofthe small CAMP growers may opt out of usingmating disruption next year, but it is projected that agreatly expanded CAMP program will continue in2000, funded entirely by the growers. Fears oflosing organophosphates through resistance and/orFood Quality Protection Act regulations help fuel thechange.

85
Prior to 1989, few Mid-Columbia growers werefamiliar with obliquebanded leafroller (OBLR) oncherries or any other crop for that matter. Althoughnative to the Northwest, OBLR was not previouslyrecognized as a pest of cherries. However, duringharvest of that year, a single grower in The Dallesbegan to find small worms infesting his harvestedcherries. When the Japanese inspector found thesesame worms on cherries bound for Japan, thepacking house took the fruit to the landfill andrefused to accept the remaining unharvested fruit.
In order to control the insect population prior to thenext harvest, multiple post-harvest applications ofparathion were applied in late summer 1989 withoutregard to the beneficial insect complex. It was thisone incident, more than any other, that highlightedthe need, in the mind of many growers, toimplement an Integrated Fruit Production (IFP)program on cherries in The Dalles. The clearmotivation was the fact that a massive insectpopulation had developed in an orchard withoutgrower or fieldman recognition of the situation.
For this reason, growers and university personnelbegan working on an IFP program. One of theprimary rationales for interest in this IFP programwas the realization that all orchard professionals,growers, fieldmen, and university personnel neededto become more aware of conditions within areaorchards. In addition, an IFP program would helpgrowers make better, more informed decisions.
However, before an IFP program could beimplemented successfully, a solid Integrated PestManagement (IPM) program needed to bedeveloped for all major cherry pests. Unfortunately,in 1989 we had a new cherry pest withoutknowledge of its identity.
Therefore, the first step in the process of develop-ing an IPM program for this pest was to properlyidentify the insect. This procedure, which includedrearing the larvae to the adult stage, took OSUentomologists 2 to 3 weeks. Once it was deter-
Implementing an IPM Program for Obliquebanded Leafroller on Sweet Cherry
Lynn LongHood River County Extension
Oregon State University400 E Scenic Drive #2.278
The Dalles, Oregon
mined that the insect in question wasobliquebanded leafroller, the next step was todetermine the population density of the insectthroughout the district. We knew we had a highinsect population in at least one block, but weassumed that there was a population of leafroller inother blocks that was non-detectable at the packingshed. That summer we immediately set out trapsand found the largest population in, and immedi-ately adjacent to, the orchard in question. Insubsequent years, as we continued to monitor thepopulation distribution, we found the populationmoving away from this center, eventually impactingthe entire district. In fact, by 1995 OBLR popula-tions had increased to the point where one packinghouse refused delivery of fruit from 19 of 40growers.
It took several years to determine the best IPMcontrol measures for OBLR. In this period, trialswere conducted and observations made thateventually provided us with the information weneeded to develop an effective IPM program.
Since we knew little about OBLR, we tried to relateits apple biology to cherries. This helped, but it wasfar from adequate. We needed to learn such thingsas timing of over-wintering emergence, scoutingtechniques, and threshold levels for both adults andlarvae. It was critical that we had an understandingof these factors, so growers would know whether ornot they had a problem developing within theirorchards. Eventually, we were able to develop arelatively reliable process based on scouting todetermine population densities of larvae within anorchard.
Since the conventional control program prior to ourwork included such chemicals as Penncap M andpyrethroids, it was obvious that we needed todevelop a soft, alternative method for controllingOBLR. Initially, we pursued two separate paths ofcontrol, Bacillus thuringiensis (B.t.) and matingdisruption. Initially, OSU scientists did not believe
86
that Bt would be an effective control measure.However, we soon found that OBLR was controlledvery effectively with applications of Bt, especiallywhen larvae were small. Bt’s are now the backboneof our spring and summer OBLR control program.Results of mating disruption work, however, did notprove as promising. Dispenser formulations, whileeffective, proved both expensive and laborintensive, while sprayable pheromone formulationshad unacceptably poor results.
After several years of research, we finally had aneffective IPM control program for OBLR. Thisprogram consisted of an early delayed-dormantspray followed by orchard monitoring to determinepopulation densities and the need for B.t. applica-tions.
Introducing this program to growers was anongoing effort that continues to this day. Scoutingtechniques and threshold management were newconcepts that took time for growers to learn andadopt. These concepts were taught over a period ofseveral years in workshops and tours, newsletters,and a published brochure.
The success of this research and educational effortis evidenced by successive years of problem freeharvest. In the year prior to program implementa-tion, the harvest of 48 percent of the growers fromone packing house was terminated due to highOBLR populations. Since implementation, therehave been no further harvest disruptions.

87
I am a fruit grower in Hood River, and also theowner of rented farms in Washington and Yamhillcounties. I also manage grower based organiza-tions which commit funds for supplementingresearch. Those include most tree fruits in theNorthwest. The amount of grower commitment tosupplement research is about $4 million annually.
From 1962 through 1990, I managed a large pear,apple, and cherry orchard north of White Salmon,Washington, near Hood River, OR. We tried manyexperiments, including attempting to spray less ornot at all on given plots in that isolated, higherelevation location. In each instance, after 1 to4 years, the plots “crashed” either from codlingmoth, mites, pear psylla, or other pests.
In 1989, we established a high density pear orchardon the east side of the lower Hood River Valley atabout 700 feet elevation. The orchard was notsprayed during its first two growing seasons. Afterthat, only very minimal sprays were used, principallyin the pre-bloom period. In 1992-94, one generalpesticide, Morestan, was used at the pink stage. In1995-1997, Comply was applied in the delayed-dormant stage for pear psylla. No other pesticideswere applied, except experimental use of Confirmand Bt’s for leafroller in 1997 and 1998.
Compared with neighboring orchards and the othertwo orchards we operate in the Hood Valley, costsof material and application were reduced greatly.Furthermore, we had no residues and no problemsscheduling worker re-entry around irrigation issues.And, we had minimal fruit injury through 1994. Asmall experimental planting of apples experiencedcodling moth damage starting in 1994. In 1996, webegan using pheromone mating confusion ties forcodling moth in the pears, which has beensuccessful.
USDA-ARS scientists from Yakima (Wapato) havebeen doing survey work in the orchard since 1996.They make periodic evaluations of pests andpredators. We also initiated a rotational mowingsystem in 1996. In 1997 and 1998, that was morespecific, with three principal regimes: mowing every
Two Steps Forward: One Step Back
G. IngGrower
Hood River, OR
10 days, mowing once a month, and no mowing.ARS scientists are learning the role of groundcover, pests, and predators. Compared toconventional orchards, this orchard has a muchbetter complex of predators and beneficials.Ground traps catch several times more carabidbeetles compared with conventional orchards.Those sections of the orchard with less mowinggenerally have more natural control agents. Leavingthe orchard floor unmowed has not caused thebuild-up of any damaging pests. There may besome benefits of a ground cover of broadleafmaterial as opposed to grasses.
Pear psylla, the most significant pest of pears, isnot an issue. There is an early season population,but psylla is virtually impossible to find post-bloom.Codling moth is controlled with pheromones. Aphidsare controlled. Twospotted and red spider mites arecontrolled, but each of the past 5 years have hadpopulations near the damage stage.
We have some problems. Leafroller has causedsome damage each of the past 3 years. Stink bugshave caused commercial damage. The 1998 cropwas severely damaged by pear rust mite, whichcaused some of the fruit to be unmarketable. Scabwas a serious problem on one variety in 1998 andcaused heavy economic loss.
Table 1 illustrates our chemical inputs versus acommercial orchard with a full program.Table 2 listsdollar loss from fruit damage where chemicalscould have prevented such loss.
While we are committed to a low spray operation,we find that we are now, after 10 years, about evenin benefit gained from not purchasing chemicalsversus having high quality fruit.
The situation is not altogether comfortable, and wellillustrates why growers in general spray to ensurecontrol of pests and high quality fruit. In oursituation, as long as the fruit damage is negligible,can be sorted easily at the packing house, anddoes not damage market quality, we can take somerisks and save costs of chemicals. However, when

88
a more serious fruit damage situation occurs, weincur high losses, and the packing operation is veryunhappy as is the sales entity.
Table 1. Pesticide inputs and fruit values.Pesticide Costs Per Acre:
l994 l995 l996 l997 l998COMMERCIAL orchard $ 474 4l4 438 448 459ING experimental orchard $ l0l l27 l42 l54 l28Savings: per acre $ 373 287 296 294 33lAdd’l savings-application $ 47 50 53 57 60
Total savings per acre $ 420 337 349 35l 39l
Table 2. Fruit values compared with commercial orchards.
1994 1995 1996 1997 1998BOSC—2 acres same same same same same Accumulated savings $3,696 Accumulated savings $1,848 per acre
STARKCRIMSON—2 acres:Fruit value loss $0 -644 -1386 -8l6 -10,697 Accumulated loss $0 224 1049 465 10,304 Total Accum. loss $12,046 Accumulated loss $6,023 per acre
RED ANJOU—2 acres:Fruit value loss $ 0 -104 -216 -140 -410Accumulated loss $870Accumulated savings $1413 per acre
Overall 6 acres:Accumulated savings——$11,088Accumulated loss of fruit values $12,9l4Accumulated combined loss——$1,826
NOTES:l. Prior to the l998 season, when rust mite decimated the Starkcrimson crop and damaged Red Anjous, theproject was very much on the plus side.
2. Our packing house has indicated it does not want to handle fruit with substantial commercial damagefrom pests.
3. There has been no evident enhancement of fruit quality caused by chemical non-usage.
We have been told that the packing operation doesnot want further deliveries of fruit with considerabledown grading from pest damage.

89
Significance of Nematode Management forPotato Production in the Pacific Northwest
The Pacific Northwest (PNW) is the largest potatoproduction area in the U.S. In 1997, Idaho, Oregon,and Washington produced 54 percent by weightand 47 percent by value ($1 billion) of all potatoesin the U.S., making potatoes one of the mostimportant cash crops in the region. While a largenumber of pests impact production, the mostimportant soil borne diseases of potato in thePacific Northwest are Columbia (Meloidogynechitwoodi) and northern (M. hapla) root-knotnematodes; corky ringspot disease (CRS) causedby tobacco rattle virus, which is vectored by stubby-root nematodes (Paratrichodorus allius); and earlydying, a wilting disease caused by the fungusVerticillium dahliae. Root-lesion nematodes are alsocommon, but the predominant species in the PNWpotato fields (Pratylenchus neglectus) does notappear to reduce yield significantly or interactstrongly with V. dahliae as reported for P.penetrans. In many fields, the pathogen of greatestconcern is Columbia root-knot nematode (CRN).While field infestation with V. dahliae can reduceyield significantly and thus, crop value, qualityreduction due to tuber infection by CRN can causecomplete crop loss due to rejection. Crop rejectionfrom tuber infection by northern root-knot nema-todes or CRS also may occur, but the acreageaffected is not as large as for CRN.
A large portion of the potato crop produced in thePNW must be protected from root-knot nematodes(primarily CRN) each year. Much of the acreage(25-50 percent, personal communication, Hafez,Ingham, and Santo) already is infested withnematodes, and uninfested ground may becomeinfested at any time through the transfer ofnematodes in soil on machinery, in canal water, orin infected seed, etc. Root-knot nematodes infectthe tubers to produce quality defects such as gallson the tuber surface and brown spots inside thetuber. The brown spots are caused when femalenematodes lay eggs in the tuber and surround themwith a protective gelatinous matrix that initiates ahost response by the tuber. Once an infected tuberis peeled, the spots may be visible over the entire
Nematode Management With and Without Nematicides: Opportunities and Challenges
R.E. InghamDepartment of Botany and Plant Pathology
Oregon State University
tuber surface, and found as deep as the vascularring, a quarter inch into the tuber. In addition,because Food and Drug Administration has zerotolerance for animal matter in processed potatoproducts, such as french fries, tubers with even alow level of infection must be rejected. If5 to 15 percent of the tubers in a field are infected,the entire crop from that field may be substantiallydevalued or rejected. At an estimated value of$3,100/a (based on average yield and market pricefor the Columbia Basin in 1997), the rejection of apotato crop grown on an average 130-acre irrigatedcircle means the loss of $406,000 to the grower.The total economic loss is considerably greaterbecause of the value-added dollars associated withpotatoes between grower and consumer.
One biological property of CRN that makes thisnematode so hard to control is its ability for rapidpopulation increase. In a long growing season,CRN populations may complete four to sixgenerations. Estimating a conservative 10-foldincrease per generation would mean that apopulation at the detection limit of 1/250 g soil atplanting would increase to several thousand/250 gsoil by the end of the growing season (Figure 1).Tuber infection and crop rejection are a certaintyunder these conditions. Furthermore, since CRNcan continue to develop at storage temperatures,infected tubers put into storage without symptomsmay express enough symptoms after storage towarrant rejection.
Management with Nematicides on Food QualityProtection Act Priority List of Pesticides
Because crop rejection may occur even with lowpopulation levels at planting, growers must try tokeep populations of CRN as low as possible. Atpresent, soil fumigation is the primary managementoption for nematodes, CRS, and early dying inpotato. Soil fumigants containing metham sodium(Vapam, Sectagon, etc.) are the only materials thatcontrol early dying and allow growers to maintainhigh yields in fields infested with V. dahliae. Thus,these products have been the fumigants of choicefor the areas where early dying is a chronicproblem. Usual application methods include

90
injection through an irrigation system (water-run),generally a center pivot, in ¾ to 1 acre-inch ofwater. Water-run metham sodium alone cannotcontrolM. chitwoodi, however (Table 1, 1994 and 1996).Chemigation rarely applies material deeper than 12-18 in into the soil, and surveys have documentedthat CRN can be found as deep as 6 feet. Migrationstudies also have confirmed that CRN can migratevertically as far as 4 feet during the growing seasonto cause significant tuber infection (Mojtahedi et al.,1991). Thus, the nematodes which survive belowthe depth of metham sodium penetration canmigrate upward into the fumigation zone once thematerial has dissipated.
Supplemental nematode control can be achievedwith nonfumigant organophosphate (ethoprop-Mocap) and/or carbamate (aldicarb-Temik, oxamyl-Vydate) nematicides applied before, at, or afterplanting. These nematicides remain active in thesoil longer than metham sodium, which isphytotoxic and must dissipate before planting.Thus, nonfumigants can intercept nematodesmigrating upward and reduce populations capableof infecting tubers. Ethoprop may be effective forcontrol of M. hapla (Ingham et al., 1991) or CRN inshort season potato, fields with low populationpressure, or when augmenting a green manurecover crop, but it cannot control CRN in longseason potato crops (Table 1, 1996). Aldicarbsuppressed infection under low population pressurein 1996, but did not control higher CRN pressure in1997. Multiple post emergent applications ofoxamyl through chemigation successfully sup-pressed CRN infection in 1996 and 1997 (Table 1).
The fumigant 1,3-dicloropropene (1,3-D, Telone II)has very good nematicidal activity injected to an 18-inch depth. The material diffuses upward anddownward, thus penetrating a larger and deepersoil volume than water-run metham sodium.Nematode control with 1,3-D is generally farsuperior to that achieved by metham sodium(Table 1). However, 1,3-D does not control V.dahliae or potato early dying, so metham sodium,as well as1,3-D, needs to be used in fields withboth pathogens. This is an expensive propositionfor the grower, since the use of full labeled rates (55gpa metham sodium and 20 gpa 1,3-D) at a cost of$374/acre plus ground preparation costs wasnecessary for the grower to have the option ofrequesting compensation from fumigant manufac-turers if fumigation did not control the targeted
problem. Several years of research by OregonState University and Washington State Universityresearchers documented that adequate control ofearly dying and CRN could be obtained whenreduced rates of metham sodium (40 gpa) and 1,3-D (15 gpa) were used in combination (see Table 1,1994 and 1997). This led to the development ofspecial joint labels by the manufacturers of the twomaterials that permitted reduced rates of eachfumigant when used together. This reduced ratelabel now saves growers nearly $100/a. Currentresearch also is attempting to increase theeffectiveness of metham sodium as a nematicideby injecting it into soil in a manner similar to 1,3-D.However, since metham sodium does not diffusethrough soil as well as 1,3-D, special shanks weredeveloped to inject the material at several pointswithin the soil profile during application. Initialstudies found that control of CRN by shanking-inmetham sodium was nearly equal to that by 1,3-Din 1994 but did not control CRN in 1997 (Table 1).
During the early part of the growing season, CRNjuveniles leave the soil to penetrate roots from thegerminating seed piece so that, by several weeksafter planting, no juveniles can be recovered fromthe soil (Figure 1). Once the nematodes completetheir development and begin to lay eggs, thenumber of second generation juveniles in the soilincreases very rapidly. These nematodes may infectpotato roots, producing subsequent generations, orinfect developing tubers. Developmental modelshave determined that the beginning of the secondgeneration occurs at approximately 900-1,100degree days (base 5C), with additional generationsat 500-600 degree day intervals (Pinkerton et al.,1991). Research on timing chemigation applicationsof the systemic nematicide oxamyl with degree-dayaccumulation has documented additional suppres-sion in plots fumigated with water-run (1996) orshanked-in (1997) metham sodium (Table 1).
Nematodes can be controlled successfully withthese chemical nematicides, but a substantialamount of these products is required for successfulpotato production in areas with long growingseasons and high disease pressure. For example,the amount of active ingredient used on the 30,000acres of potato grown in the Columbia Basin ofOregon during 1997 included 2.2 million lb ofmetham sodium; 927,000 lb of 1,3 D; 60,000 lb ofaldicarb; and 6,050 lb of ethoprop (McMorran andReed, personal communication). Only a smallamount of oxamyl was used. However, all

91
nematicides currently used in the potato industryare high on the FQPA priority list of pesticides fortolerance review by Environmental ProtectionAgency. Without these chemicals, potato productionin many fields throughout the PNW would not bepossible and the loss, or more restricted use, ofthese materials could result in abandoned potatoproduction fields.
Promising Alternatives to Management withNematicides
Plant ResistanceBreeding potato for resistance to nematodes maybe the optimal alternative for management of thesepests, but the availability of germplasm with thoseproperties is still many years in the future. A moreunique approach to using plant resistance is beingstudied at Oregon State University. In mostcropping systems, resistance is sought in the cashcrop which is damaged by the nematode. Theapproach in Oregon’s program has been to screenfor nematode resistance in rotation crops, eventhough these crops may not be damaged directly bynematodes. Resistance found in these crops canreduce nematode populations to nondamaginglevels before potato is planted, reducing the needfor nematode resistance in potato itself. Theinfluence of different crops on nematode reproduc-tion determines whether they are categorized asgood, poor, or nonhosts. Host status is quantified bya reproductive index, R, where R = final population/initial population. R values greater than 1 indicate agood host, those between 0.1 and 1.0 describepoor hosts, and those below 0.1 define non-hosts.Table 2 provides an example of how different cropsmay effect the reproductive capacity of CRN. Fieldcorn is used extensively in rotation with potato andis an excellent host for CRN. Less popular rotationcrops reduce CRN populations substantially.Greenhouse studies determined that wheat cvStephens is often a better host (R = 24.9) than fieldcorn cv Pioneer 3578 (R = 3.93) (Cardwell andIngham, 1997). However, since wheat is harvestedmuch earlier in the season, populations of CRNgenerally do not reach the same magnitude asunder field corn, where there is time for moregenerations to develop.
Green Manure Cover CropsSeveral plants may suppress different nematodes ifgrown as a cover crop and incorporated into the soilwhile vegetation is still green (Mojtahedi et al.,1993). This strategy can be used independently or
as a part of a crop rotation scheme and isincreasing in popularity as a nematode manage-ment strategy. Incorporation of green plant materialfrom most crops increases biological activity in soilthat may reduce nematode populations, but someplant materials are more actively antagonistic. Useof sudangrass and rapeseed has been particularlyencouraging in suppression of M. chitwoodi inOregon and Washington. Sudangrass leavescontain dhurrin that breaks down under microbialdecomposition to hydrogen cyanide, which isnematicidal. Rapeseed leaves, stems, and rootscontain glucosinolates which are not nematicidalbut are broken down by the enzyme myrosinase tonematicidal isothiocyanates, similar to the activeingredient in metham sodium. Green manure covercrops are most effective if they are also a nonhostfor the target nematode species (see Table 2).Table 3 illustrates how incorporation of sudangrassand rapeseed green manure cover crops can effectpopulations of CRN. While a fall incorporatedsudangrass green manure cover crop suppressedpopulations at planting to low levels, the suppres-sion did not persist throughout the season. Incontrast, a spring incorporated rapeseed greenmanure cover crop suppressed population growthuntil October (Ingham, 1993).
Cover Crops plus Nonfumigant NematicidesWhile green manure cover crops can reducenematode populations substantially, they may notbe sufficient in fields with very high initial densitiesor in areas with long growing seasons wheredamage occurs at very low preplant densities. Inthese instances, augmenting the nematodesuppression with a nonfumigant nematicide mayprovide such control, since there is a slim marginbetween what is acceptable and what is rejected.Table 3 demonstrates that the combination of thenematicide ethoprop and green manure cover cropswas more effective than either strategy alone. Whileinfection in the sudangrass-ethoprop treatmentwould not have been acceptable in this study, itappeared that nematode suppression did not breakdown until after August, and tubers harvestedearlier than October may have had very low levelsof infection. This may also have been true for therapeseed only plots.
Since nonfumigants are much less expensive thantypical rates of soil fumigants presently used in theregion, combining such materials with cover cropspotentially could reduce the cost of nematode

92
injection through an irrigation system (water-run),generally a center pivot, in ¾ to 1 acre-inch ofwater. Water-run metham sodium alone cannotcontrolM. chitwoodi, however (Table 1, 1994 and 1996).Chemigation rarely applies material deeper than 12-18 in into the soil, and surveys have documentedthat CRN can be found as deep as 6 feet. Migrationstudies also have confirmed that CRN can migratevertically as far as 4 feet during the growing seasonto cause significant tuber infection (Mojtahedi et al.,1991). Thus, the nematodes which survive belowthe depth of metham sodium penetration canmigrate upward into the fumigation zone once thematerial has dissipated.
Supplemental nematode control can be achievedwith nonfumigant organophosphate (ethoprop-Mocap) and/or carbamate (aldicarb-Temik, oxamyl-Vydate) nematicides applied before, at, or afterplanting. These nematicides remain active in thesoil longer than metham sodium, which isphytotoxic and must dissipate before planting.Thus, nonfumigants can intercept nematodesmigrating upward and reduce populations capableof infecting tubers. Ethoprop may be effective forcontrol of M. hapla (Ingham et al., 1991) or CRN inshort season potato, fields with low populationpressure, or when augmenting a green manurecover crop, but it cannot control CRN in longseason potato crops (Table 1, 1996). Aldicarbsuppressed infection under low population pressurein 1996, but did not control higher CRN pressure in1997. Multiple post emergent applications ofoxamyl through chemigation successfully sup-pressed CRN infection in 1996 and 1997 (Table 1).
The fumigant 1,3-dicloropropene (1,3-D, Telone II)has very good nematicidal activity injected to an 18-inch depth. The material diffuses upward anddownward, thus penetrating a larger and deepersoil volume than water-run metham sodium.Nematode control with 1,3-D is generally farsuperior to that achieved by metham sodium(Table 1). However, 1,3-D does not control V.dahliae or potato early dying, so metham sodium,as well as1,3-D, needs to be used in fields withboth pathogens. This is an expensive propositionfor the grower, since the use of full labeled rates (55gpa metham sodium and 20 gpa 1,3-D) at a cost of$374/acre plus ground preparation costs wasnecessary for the grower to have the option ofrequesting compensation from fumigant manufac-turers if fumigation did not control the targeted
problem. Several years of research by OregonState University and Washington State Universityresearchers documented that adequate control ofearly dying and CRN could be obtained whenreduced rates of metham sodium (40 gpa) and 1,3-D (15 gpa) were used in combination (see Table 1,1994 and 1997). This led to the development ofspecial joint labels by the manufacturers of the twomaterials that permitted reduced rates of eachfumigant when used together. This reduced ratelabel now saves growers nearly $100/a. Currentresearch also is attempting to increase theeffectiveness of metham sodium as a nematicideby injecting it into soil in a manner similar to 1,3-D.However, since metham sodium does not diffusethrough soil as well as 1,3-D, special shanks weredeveloped to inject the material at several pointswithin the soil profile during application. Initialstudies found that control of CRN by shanking-inmetham sodium was nearly equal to that by 1,3-Din 1994 but did not control CRN in 1997 (Table 1).
During the early part of the growing season, CRNjuveniles leave the soil to penetrate roots from thegerminating seed piece so that, by several weeksafter planting, no juveniles can be recovered fromthe soil (Figure 1). Once the nematodes completetheir development and begin to lay eggs, thenumber of second generation juveniles in the soilincreases very rapidly. These nematodes may infectpotato roots, producing subsequent generations, orinfect developing tubers. Developmental modelshave determined that the beginning of the secondgeneration occurs at approximately 900-1,100degree days (base 5C), with additional generationsat 500-600 degree day intervals (Pinkerton et al.,1991). Research on timing chemigation applicationsof the systemic nematicide oxamyl with degree-dayaccumulation has documented additional suppres-sion in plots fumigated with water-run (1996) orshanked-in (1997) metham sodium (Table 1).
Nematodes can be controlled successfully withthese chemical nematicides, but a substantialamount of these products is required for successfulpotato production in areas with long growingseasons and high disease pressure. For example,the amount of active ingredient used on the 30,000acres of potato grown in the Columbia Basin ofOregon during 1997 included 2.2 million lb ofmetham sodium; 927,000 lb of 1,3 D; 60,000 lb ofaldicarb; and 6,050 lb of ethoprop (McMorran andReed, personal communication). Only a smallamount of oxamyl was used. However, all

93
nematicides currently used in the potato industryare high on the FQPA priority list of pesticides fortolerance review by Environmental ProtectionAgency. Without these chemicals, potato productionin many fields throughout the PNW would not bepossible and the loss, or more restricted use, ofthese materials could result in abandoned potatoproduction fields.
Promising Alternatives to Management withNematicides
Plant ResistanceBreeding potato for resistance to nematodes maybe the optimal alternative for management of thesepests, but the availability of germplasm with thoseproperties is still many years in the future. A moreunique approach to using plant resistance is beingstudied at Oregon State University. In mostcropping systems, resistance is sought in the cashcrop which is damaged by the nematode. Theapproach in Oregon’s program has been to screenfor nematode resistance in rotation crops, eventhough these crops may not be damaged directly bynematodes. Resistance found in these crops canreduce nematode populations to nondamaginglevels before potato is planted, reducing the needfor nematode resistance in potato itself. Theinfluence of different crops on nematode reproduc-tion determines whether they are categorized asgood, poor, or nonhosts. Host status is quantified bya reproductive index, R, where R = final population/initial population. R values greater than 1 indicate agood host, those between 0.1 and 1.0 describepoor hosts, and those below 0.1 define non-hosts.Table 2 provides an example of how different cropsmay effect the reproductive capacity of CRN. Fieldcorn is used extensively in rotation with potato andis an excellent host for CRN. Less popular rotationcrops reduce CRN populations substantially.Greenhouse studies determined that wheat cvStephens is often a better host (R = 24.9) than fieldcorn cv Pioneer 3578 (R = 3.93) (Cardwell andIngham, 1997). However, since wheat is harvestedmuch earlier in the season, populations of CRNgenerally do not reach the same magnitude asunder field corn, where there is time for moregenerations to develop.
Green Manure Cover CropsSeveral plants may suppress different nematodes ifgrown as a cover crop and incorporated into the soilwhile vegetation is still green (Mojtahedi et al.,1993). This strategy can be used independently or
as a part of a crop rotation scheme and isincreasing in popularity as a nematode manage-ment strategy. Incorporation of green plant materialfrom most crops increases biological activity in soilthat may reduce nematode populations, but someplant materials are more actively antagonistic. Useof sudangrass and rapeseed has been particularlyencouraging in suppression of M. chitwoodi inOregon and Washington. Sudangrass leavescontain dhurrin that breaks down under microbialdecomposition to hydrogen cyanide, which isnematicidal. Rapeseed leaves, stems, and rootscontain glucosinolates which are not nematicidalbut are broken down by the enzyme myrosinase tonematicidal isothiocyanates, similar to the activeingredient in metham sodium. Green manure covercrops are most effective if they are also a nonhostfor the target nematode species (see Table 2).Table 3 illustrates how incorporation of sudangrassand rapeseed green manure cover crops can effectpopulations of CRN. While a fall incorporatedsudangrass green manure cover crop suppressedpopulations at planting to low levels, the suppres-sion did not persist throughout the season. Incontrast, a spring incorporated rapeseed greenmanure cover crop suppressed population growthuntil October (Ingham, 1993).
Cover Crops plus Nonfumigant NematicidesWhile green manure cover crops can reducenematode populations substantially, they may notbe sufficient in fields with very high initial densitiesor in areas with long growing seasons wheredamage occurs at very low preplant densities. Inthese instances, augmenting the nematodesuppression with a nonfumigant nematicide mayprovide such control, since there is a slim marginbetween what is acceptable and what is rejected.Table 3 demonstrates that the combination of thenematicide ethoprop and green manure cover cropswas more effective than either strategy alone. Whileinfection in the sudangrass-ethoprop treatmentwould not have been acceptable in this study, itappeared that nematode suppression did not breakdown until after August, and tubers harvestedearlier than October may have had very low levelsof infection. This may also have been true for therapeseed only plots.
Since nonfumigants are much less expensive thantypical rates of soil fumigants presently used in theregion, combining such materials with cover cropspotentially could reduce the cost of nematode

94
Mojtahedi, H., R.E. Ingham, G.S. Santo, G.L. Reed,and J.H. Wilson. 1991. Seasonal migration ofMeloidogyne chitwoodi and its role in potatoproduction. Journal of Nematology. 23:162-169.
Mojtahedi, H., G.S. Santo, and R.E. Ingham. 1993.Suppression of Meloidogyne chitwoodipopulations with selected sudangrass andsorghum-sudangrass cultivars as greenmanure. Journal of Nematology. 25:303-311.
National Potato Council. 1998. 1998 Potato
Statistics Year Book. National Potato Council.Englewood, CO. 80 pp.
Pinkerton, J.N. 1991. Population dynamics ofMeloidogyne chitwoodi on Russet Burbankpotatoes in relation to degree-day accumula-tion. Journal of Nematology 23:283-290.

95
Table 1. Effects of various fumigant and nonfumigant nematicide treatments on the percentage of tubersculled by Columbia root-knot nematode (Meloidogyne chitwoodi) infection. Umatilla Co., OR.
Treatment Percentage of culled tubers1
19943
Untreated check 90 a2
Water-run metham sodium at 55 gpa 30 b1,3-D at 20 gpa 2 aWater-run metham sodium at 55 gpa plus 1,3-D at 20 gpa 1 aWater-run metham sodium at 40 gpa plus 1,3-D at 15 gpa 0 a
19964
Untreated check 38 aWater-run metham sodium at 50 gpa 22 abShanked-in metham sodium at 50 gpa 1 bcWater-run metham sodium at 50 gpa plus 1,3-D at 20 gpa 0 c
Water-run metham sodium plus ethoprop at 12 lb a.i./a 34 aWater-run metham sodium plus aldicarb at 3 lb a.i./a 2 bcWater-run metham sodium plus oxamyl at 2 lb a.i./a (3x) 3 bc
19975
Untreated check 64 aShanked in metham sodium at 40 gpa 49 abShanked in metham sodium at 40 gpa plus aldicarb at 3 lb a.i./a 55 aShanked in metham sodium at 40 gpa plus Vydate at 2 lb a.i./a (5x) 2 bShanked in metham sodium at 40 gpa plus 1,3-D at 15 gpa 4 b
1Tubers with six or more infection sites 2Means within the same year that are followed by the same letter are not significantly different (P £ 0.05). 3Data from Ingham 1995 4Data from Ingham 1997a 5Data from Ingham 1998

96
Table 2. Effects of different summer crops on reproduction by Columbia root-knot nematode (Meloidogynechitwoodi) grown in field microplots for five months. Hermiston, OR. (Data from Ingham, 1991).Crop Reproductive Index (R)
Potato cv Russet Burbank 68.00Cereal corn cv Pioneer 3283W 22.66Field corn cv Pioneer 3732 12.38Popcorn cv Robust 30-77 0.77Sudangrass cv Trudan 8 0.04Rapeseed cv Cascade 0.03Pepper cv California Wonder 0.01Squash cv Butternut 0.00Muskmelon cv Superstar hybrid 0.00Lima Bean cv Henderson Bush 0.00
Table 3. Effect of green manure cover crops on populations of Columbia root-knot nematodes(Meloidogyne chitwoodi) (No./250 g soil) and potato tuber infection. (Data from Ingham, 1993).
Percent CulledTreatment April August October Tubers1
Wheat-Stubble3 186 b2 3,246 b 4,289 c 82 bWheat-Stubble-Ethoprop4 75 b 2,158 b 2,781 c 81 bWheat-Sudangrass5 2 a 145 a 951 bc76 bWheat-Sudangrass-Ethoprop 2 a 8 a 186 ab28 aWheat-Rapeseed6 0 a 6 a 28 a 13 aWheat-Rapeseed-Ethoprop 0 a 6 a 15 a 2 a
1Tubers with six or more infection sites. 2Means within the same column that are followed by the same letter are not significantly different (P £ 0.05). 3Spring wheat cv Pennewawa as stubble cover over winter before potato crop. 410 G formulation at 12 lb a.i./a broadcast applied and incorporated before planting potato. 5cv Trudan 8 planted after wheat harvest and incorporated on October 30 after first killing frost. 6cv Jupiter planted after wheat harvest and incorporated on March 3, 48 days before planting.

97
Table 4. Effects of cropping sequences on Columbia root-knot nematode (Meloidogyne chitwoodi) infectionof potato tubers. Hermiston, OR. (Data from Ingham, 1994). Cropping Sequence Percent1990 1991 1992 1993 Culls1
Potato Wheat3 Wheat4 Potato5 91 d2
Potato Wheat Wheat Ethoprop6-Potato 45 cPotato Wheat Wheat + Sudan
7 Potato 48 c
Potato Wheat Wheat + Sudan Ethoprop-Potato 47 cPotato Lima Bean8 + ? Supersweet Corn9 + ? Potato 19 b
Addition of rapeseed after lima bean and/or sudangrass after supersweet corn added no benefit
Potato Lima Bean + Rape10 Supersweet Corn + Rapeseed Potato <1 aPotato Lima Bean + Rape Supersweet Corn + Sudan Ethoprop-Potato <2 a
Potato Popcorn11 Lima Bean + ? Potato 2 a
Insufficient infection remained to determine if addition of rapeseed green manure and/or ethoprop beforepotato provided further benefit. Of the 30 plots, 21 had 0 percent culls, and only 3 plots had more than4 percent that may have been due to grassy weeds during the lima bean crop in those plots.
1Tubers with six or more infection sites. 2Means within the same column that are followed by the same letter are not significantly different (P £ 0.05). 3cv Pennewawa spring wheat in 1991 4cv Stephens winter wheat in 1992 5cv Russet Burbank 610G formulation preplant incorporated at 12 lb a.i./a 7cv Trudan 8 incorporated as green manure in the fall 8cv Maffi 15 9cv Crisp and sweet 710 10cv Humus incorporated as a green manure in the spring 11cv Robust 85-210
Figure 1. Degree Days (base 5°C) after Planting
3,000
2,500
2,000
1,500
1,000
500
0 0 500 1,000 1,500 2,000 2,5003,000
M. c
hitw
oodi
/250
g s
oil

98
AbstractRecent surveys of Willamette Valley sweet corn,snap bean, and cole crop growers indicate that themajority of the field scouting to determine insectpest populations trends is conducted by agricul-tural chemical field representatives. Narrow profitmargins have resulted in the consolidation ofagricultural chemical suppliers. Agriculturalprofessionals are more time-limited than in thepast. There is significant resistance to theintroduction of field scouting procedures thatrequire extra time in the field. In the absence ofaccurate field scouting, the concepts of pestpopulation monitoring and the use of actionthresholds in spray decisions have not been widelyaccepted in the Willamette Valley processedvegetable industry. Application decisions based onplant phenology are fast and easy to manage.Insecticide applications are relatively cheap. Therisk of crop damage and the damage to a fieldrepresentative’s reputation when a neededpesticide application is not made are very high.The OSU snap bean mold scouting programrequires three 15-minute field-scouting visits. Theprogram that was developed in the early 1980sand refined in the mid-1990s has not beenadopted. Regional monitoring of key lepidopteranpests, however, has been well received. Theresults are broadcast to the field representativecommunity. Population trends inform fieldrepresentatives as to when they need to intensifytheir site-specific field scouting procedures. A newtechnique using kairomone-laced yellow stickytraps to monitor the western spotted cucumberbeetle (Diabrotica undecimpunctata) activity atcritical periods during corn and bean cropdevelopment will be introduced in 1999. Thetechnique may be adopted, because it will savetime by replacing the traditional sweep methodscurrently used by the industry.
Introduction
With a farm gate value of 27 million dollars, snapbeans for processing are one of the mostimportant vegetable crops in Oregon (Miles, 1995).
Even Modest Labor Requirements Pose a Significant Constraint on theAdoption of IPM Monitoring and Scouting Procedures
Daniel McGrathExtension Service
Oregon State UniversitySalem, OR 97301
In a recent survey of Oregon vegetable growers,the majority of the respondents (91.2 percent) listedmold as the most difficult problem to control in snapbeans (McGrath and Kogan, 1996, unpublished).Ninety-eight percent of the respondents indicatedthat they used a single fungicide, Ronilan by BASF,to control mold during the 1995 and 1996 growingseasons. The Ronilan label has been uncertain(McGrath, 1989); registration for its use on snapbeans in 1997 followed 13 years of FIFRA Section18 emergency registrations.
Diabrotica beetles, referred to as “12-spot beetles,”damage developing snap beans, causing them tobe deformed. Many snap bean plantings routinelyare sprayed with insecticide at “pin bean” stageregardless of Diabrotica pressure. The majority ofplantings are sprayed with the broad-spectruminsecticide carbaryl. This effectively strips thecropping system of natural enemies and routinelycauses losses of important insect pollinators. Withthe recent decline in feral hives of Apis melifera dueto infestation by tracheal mites, the loss of feral ornative insect pollinators needs to be reduced.Recently developed synthetic analogs of cucurbitins(Diabrotica beetle feeding attractants and feedingstimulants) provide new opportunities for morebiological 12-spot beetle control strategies. Theseincluded insecticide/feeding attractant mixtures andenhanced effectiveness of feeding attractant-lacedyellow sticky traps for monitoring 12-spot beetlepopulations.
Agricultural field representatives use sweep nets toestimate Diabrotica populations before makingspray recommendations. The efforts are relativelyhaphazard. The action threshold is very low.Ironically, the commitment to monitoring of 12-spotbeetles with a sweep net interferes with the goal ofintroducing mold scouting procedures. Fieldrepresentatives were unwilling to make separatescouting trips across bean plantings for Diabroticaand mold. If the two scouting procedures could becombined, total effort could be reduced and thevalue of the scouting procedures increased.

99
No one involved with the processed vegetableindustry in Oregon is comfortable with the insecuresituation related to uncertain pesticide registrations.The industry is not static. From 1987-96 theindustry has evaluated alternative fungicides,fungicide combinations, and spray timing toimprove efficiency (Johnson and Powelson, 1981;Powelson, 1980; Powelson and McGrath, 1988).During 1990 and 1991, the industry evaluated theeffect of alternative planting arrangements on moldin snap beans (McGrath et al., 1991). During 1993and 1994, the industry evaluated the impact ofspray timing (Hunter and Lugwig, 1988; Lugwig,1990) and irrigation cut-off timing on molddevelopment (Abawi and Hunter, 1979; McGrath,1996).
In the early 1980s, OSU published an IPM manualfor snap beans. The risk assessment proceduresfor determining risk of gray mold, white mold, and12-spot beetle damage were based on severalyears of research that studied the correlationbetween observable parameters in bean productionand resulting bean quality. The mold scoutingprocedures have not been adopted. They requireda significant scouting effort (six to seven visits perplanting) and they led to a single high risk decisionto spray or not to spray. Sweeping bean fields for12-spot beetle using a 2 beetle per 20 sweep actionthreshold is now a common practice in theWillamette Valley.
During the 1995 and 1996 growing seasons, theprocessing industry began re-testing bean moldscouting procedures (McGrath, 1997) usingelements drawn from three scouting modes(Petzoldt and Koplinka-Loehr, 1990; Stewart andStevenson, 1990; and Winzierl et al., 1983). Theelements were assembled into an integratedscouting program with two goals: (1) reducescouting effort, and (2) increase the value ofinformation produced by the scouting effort (seeAppendix 1). Applied research on integrated controlof white mold (Sclerotinia sclerotiorum), gray mold(Botrytis cinerea), and the western spottedcucumber beetle (Diabrotica undecimpunctata) hasbeen conducted on complimentary scales, relativelysmall scale single component research trials, andfield scale simple paired comparisons.
Starting in 1996, a second project was initiated tomonitor disease and insect population trends in theWillamette Valley. The monitoring and reportingprogram called “Vegnet” includes a regional insect
trapping program and a communication network.Moth and insect trap counts as well as disease andpest observations by Ag professionals aresummarized and broadcast by FAX and email (seeAppendix 2). The Vegnet reports are designed tostimulate site specific field scouting during higherrisk periods.
Snap Bean Field Scouting Program
The OSU Snap Bean Scouting Program wasmodified. Limiting scouting to the three highest riskareas of the fields reduced scouting effort per field.Field visits leading to a spray decision were limitedto three. At the first spray decision (early bloom) thefollowing questions were addressed: Is this a highrisk planting? Does it need to be sprayed twice? Isthis a low risk planting? Can the grower use a moreeconomical one-spray program? Should the growerapply one spray at early bloom or wait a couple ofdays so that the single spray covers the higher riskperiod at canopy closure? Will this planting beresponsive to irrigation cut-off timing? Should thegrower dry the field out prior to nightfall? Is thisplanting at risk of heat-stress induced split set?Should the grower ignore mold and cool the fielddown with irrigation? Is this planting at risk ofDiabrotica beetle to the developing beans? At thesecond spray decision (pre-harvest spray interval)the following questions were addressed: Should thegrower apply a second spray? Is mold infectionspreading rapidly through the field? Should thegrower plan, if possible, to harvest early?
According to the scouting program, the majority ofthe bean plantings (69 percent) in the WillametteValley are at low risk of mold development.Approximately 18 percent of the low risk plantingsare sprayed twice with Ronilan. The grower couldskip the second spray, according to the scoutingprogram. In many cases, single spray programsare initiated too early in low risk plantings. Theresidual effectiveness of the fungicide (Ronilan) is 7to 10 days. Mold inducing conditions occurred aftercanopy closure when the Ronilan was no longer aneffective protectant. Twelve percent of the plantingswere identified as highly responsive to irrigation cut-off timing when not at high risk of heat-induced splitset.
A kairomonal attractant was made by mixing equalparts by weight of the chemicals beta-ionone,benzyl alcohol, and indole (Metcalf et al., 1987).

100
The attractant was applied to cotton dental wicks onyellow tangle-foot coated cups. The kairomonaltraps were monitored weekly beginning near firstbloom and continuing through harvest. The numberof 12-spot beetles caught with the traps wascompared to the number caught with sweep netsamples.
Regional Pest Monitoring
The intensity of insect pest infestations of vegetablecrops in the Willamette Valley varies from year toyear. In 1995 and 1998, there were high levels ofcabbage loopers (Trichoplusia ni) in broccoli andcauliflower. From 1996-1998, cabbage looper andbertha armyworm egg laying flights had two distinctegg laying periods per growing season using adegree day model available on the OSU IntegratedPlant Protection Center Web Page (http://www.ippc.orst.edu). The second egg laying periodof the looper was successfully forecast. Earlywarnings were broadcast. Field scouting intensified.Preemptive actions were taken in some fields. Theprocessors had advance notice that a higher levelof worms would be coming into the processingplants on harvested broccoli.
In 1996, bertha armyworm (Mamestra configurata)infestations were sudden and dramatic. The berthaarmyworm lays it eggs in tight clusters. After theworms hatch, they spread out in the field. The egglaying event is very difficult to detect with traditionalfield scouting techniques. Pheromone trappingprovided an early warning system in 1997. In 1997,there was a remarkable level of black cutworm(Agrotis ipsilon) activity. It was detected andannounced via Vegnet. Significant acerages ofsweet corn were saved.
During the winters of 1997 and 1998, a series ofregional workshops and focus sessions (McGrathet al., 1992) were held with participating growersand ag professionals. The results of appliedresearch were shared and discussed. Participantswere asked to evaluate the research and makesuggestions on how to improve the scoutingprogram. Ag professionals received training in theidentification of the adult and juvenile stages of keyvegetable pests, the use of pheromone traps, andthe use of computer based degree-day calculators.
Discussion
The OSU snap bean scouting program as a wholehas not been accepted by ag professionals in theWillamette Valley. Field representatives continue touse sweep nets to monitor Diabrotica beetle activity.One independent pest consultant is using thesymphylan pre-plant soil sampling technique forcorn and beans. To the author’s knowledge, no oneis using the mold scouting technique. The Vegnetdisease and insect pest monitoring program ispopular and growing. In 1996, the FAX newsletterwas sent to 75 terminals. In 1998, it was sent to150. The expansion was due to specific requests byag professionals and growers that they receive thenewsletter.
The use of kairomone-laced sticky traps as areplacement is still in the developmental stage. Agprofessionals greet the new technology withenthusiasm because it may save them time. The“action threshold” of 2 beetles per 20 sweeps isvery low and might be considered a “detectionthreshold.” The sticky trap monitoring device maybe just as accurate as the sweep net for detection.
Although beans are a very important crop toOregon vegetable growers, snap beans are still arelatively low margin processing crop. Eachfungicide spray costs about $25 per acre. It costsless than $10 per acre to add an insecticide to thetank. The market for processed snap beans is verycompetitive. Moldy beans and beans deformed bybug bites are difficult to separate from healthybeans in the processing plant. Poor quality beansfrom one grower reduce the value of the entirepack. So, growers cannot afford to under-sprayplantings that are at high risk of mold or insectdamage. Today in the Willamette Valley, scoutingprocedures for mold and 12-spot beetle are stillhaphazard, and they do not take full advantage ofavailable research results, but they get the jobdone. The field scouting procedures introduced byOSU that have been adopted, save the agprofessional time and labor. The labor-intensiveprocedures that increase accuracy have not beenadopted.
Future efforts at increasing the accuracy of spraydecisions for control of mold in beans probably willbe based on regional weather-based forecastingmodels (Stewart and Stevenson, 1990). Laborintensive mold scouting procedures probably will belimited to validation of regional forecasts. In

101
developing IPM procedures, the work and decision-making environment of the practitioner must be fullyunderstood and appreciated. IPM research andeducational activities should be conducted inconcert. In a truly collaborative research project,researchers, Extension personnel, and agprofessionals might work more closely together toimprove the development and the rate of adoptionof monitoring and scouting procedures.
Literature Cited
Abawi, G.S. and J.E. Hunter, 1979. White Mold ofBeans in New York. New York’s Food and LifeScience Bulletin, No. 77, January 1979.
Hunter, J.E. and J.W. Ludwig,1988. Effect of Rateand Timing of Ronilan Sprays on Control ofWhite Mold of Snap Beans, 1987. Fungicideand Nematicide Tests, American PhytopathSoc., Vol. 43.
Johnson, K.B. and M. Powelson, 1981. Fungicideevaluation for control of gray mold of snapbeans, 1980. Fungicide and Nematicide Tests,American Phytopath Society, Vol. 36.
Ludwig, J.W. and J.E. Hunter, 1990. Efficacy ofFungicides Applied After Inoculation for Controlof White Mold of Snap Beans, 1989. InFungicide and Nematicide Tests, AmericanPhytopath Soc., Vol. 45.
McGrath, D.M., 1997. Refinement and testing ofrisk assessment procedures for determiningthe risk of mold development in commercialsnap beans. In the Agriculture ResearchFoundation Annual Report to the OregonProcessed Vegetable Commission, OregonState University, Corvallis, Oregon.
McGrath, D.M., 1996. Twenty on-farm pairedcomparisons testing the impact of irrigation cut-off timing on mold development in snap beans.In the Integrated Plant Protection CenterFive-Year Report, edited by Marcos Kogan,Oregon State University.
McGrath, D.M., S. Eskelson, G. Crabtree, R.William, and D. Boquist, 1991. Interactionsbetween plant arrangement, weed manage-ment, disease control, and yield of snap beans.In Proceedings of the Oregon HorticultureSociety, Portland, OR. 4 pp.
McGrath, D.M., L. Lev, H. Murray, and R. William,1992. Farmer/Scientist Focus Sessions: AHow- To Manual, Oregon State AgriculturalExperiment Station Technical Paper #10,032.
McGrath, D.M., 1989. “The Future of Minor CropPesticide Registrations the Pacific Northwest.”In the Proceedings of the Oregon Hort. Soc.Annual Meeting, Portland, Oregon.
Metcalf, R.L., J.E. Ferguson, R.L. Lampman, andJ.F. Andersen, 1987. Dry Cucurbitacin-containing Baits for Controlling DiabroticiteBeetles (Coleoptera: Chrysomelidae). J. Econ.Entomol. 80:870-875
Miles, S., 1995. Oregon Crop Data. Dept. of Agand Resource Economics Office, Oregon StateUniversity, Corvallis, Oregon, December 28,1995.
Petzoldt, C. H. and C. Koplinka-Loehr, 1990. SnapBean Pest Management, a Guide to RegularField Monitoring in New York. Cornell Coopera-tive Extension Integrated Pest ManagementProgram.
Powelson, M.L. and D.M. McGrath, 1988.Evaluation of Foliar Fungicide Sprays forControl of White Mold of Snap Beans. InFungicide and Nematicide Tests—Results of1987, Amer. Phytopath Soc. Vol. 42.
Powelson, M., 1980. Fungicide evaluation forcontrol of gray mold and white mold of snapbeans, 1979. In Fungicide and NematicideTests, American Phytopath Society, Vol. 35.
Stewart, J. and W.R. Stevenson, 1990. White Mold -Predictive Model Documentation, 1990 Evalua-tion. Dept. of Plant Pathology, Univer. of Wiscon-sin, Madison.
Winzierl, R., P. Koepsell, G. Fisher, and R. William,1983. A Guide for Integrated Pest Managementin Western Oregon Snap Beans. OSU Extension,Oregon State University, Corvallis, OR 97331

102
Appendix 1: Snap Bean Scouting FormOSU Extension White Mold Scouting Project 1999Oregon Processed Vegetable Commission, OSU Integrated Plant Protection Center Cooperating.For more information contact: Dan McGrath (503) 931-8307; FAX (503) 585-4940 [email protected]
Grower Planting Date
Field
CROP HISTORY: Beans or other susceptible crops grown in the past 5 yrs:One time - score = 2 ; Two times - score = 4; Three or more times - score = 6;
1998__________1997__________1996_________1995_________1994__________ Score
HISTORY OF White mold has been a problem one or more times MOLD PROBLEMS: in past bean plantings - score = 10 Yes_____ No_____
VARIETY Romanos - score = 2, Others - score = 0
BASE SCORE Crop History Score plus Mold History Score plus Variety Score equals base score Total:
Drawing of Field plus Surroundings - Indicate Three Scouting Areas Within Field
Surrounding area
Field

103
OSU Extension White Mold Scouting Project 1999Oregon Processed Vegetable Commission, OSU Integrated Plant Protection Center Cooperating.For more information contact: Dan McGrath (503) 931-8307; FAX (503) 585-4940 [email protected]
MOISTURE CONDITIONS:Cool, wet weather at early bloom - score = 3; Afternoon or evening irrigation during bloom - score = 1;More than 2 irrigations between 1st and 2nd spray decision - score = 3
Date: Date: Date: Date:
Score: Score: Score: Score:
CANOPY CLOSURE:More than 18 inches “open” between rows - score = 0; 13 to 18 inches “open” between rows - score = 38 to 12 inches “open” between rows - score = 4 ; Less than 8 inches “open” between rows - score = 5 Inches:___________ Inches:___________ Inches:___________ Inches:___________
Score:____________ Score:____________ Score:____________ Score:____________
PRE-BLOOM GRAY MOLD POINT SOURCE COUNTS:Prior to 1st bloom, the highest daily average count of visibly sporulating gray mold “point source” per 15row feet: 1 to 2 - score = 2; 2 to 10 - score = 5; More than 10 - score = 8
Count:_____ Count:_____ Count:_____ Count:_____ Count:_____
Score:______ Score:______ Score:______ Score:______ Score:______
APOTHECIA COUNTS (Grand Total):Score Apothecia counts using the total number or grand total found on all sample dates.None - score = 0; 0 to 2 apothecia - score = 3; 3 to 5 apothecia - score = 6, More than 6 - score = 10
Count:___________ Count:___________ Count:___________ Count:___________
Score:___________ Score:___________ Score:___________ Score:___________
TOTAL SCORESAdd Base Score Add Base Score Add Base Score Add Base Score
Total Total Total Total

104
OSU Extension White Mold Scouting Project 1999Oregon Processed Vegetable Commission, OSU Integrated Plant Protection Center Cooperating.For more information contact: Dan McGrath (503) 931-8307; FAX (503) [email protected]
Date RecommendationHigh Risk - Stop scouting. A two-spray fungicide program maybe justified. Apply first spray at early bloom. Apply second spray7 to 10 days later.Moderate Risk - Continue scouting. A one- or two-spray fungi-cide program should be used depending on weather forcast andother risk factors. Apply first spray at early bloom. A second spraydecision will be required prior to the fungicide preharvest applica-tion interval.Low Risk - Continue scouting. A one-spray fungicide programmay be adequate. A single spray may be delayed until whenscouting indicates increased risk (due to weather forecast, apoth-ecia discovery, etc.) or just prior to canopy closure. A second spraydecision will be required prior to the preharvest application inter-val.12-Spot Beetle. This field has exceeded the action threshold for12- spot beetle.Apply first insecticide at early bloom. Continue to monitor popula-tions.Sweep net count/date: #_____/date ______ ; #_____/date _____;#_____/date_____Sticky trap counts: #_____/date ______ ; #_____/date _____;#_____/date_____Irrigation Cut-off Timing - This field will be highly responsive toirrigation cut-off timing. During bloom period, begin irrigationearly in the morning. Cut off irrigation in the early afternoon, intime for the foliage to dry out prior to nightfall.Second Spray Recommendation:

105
Corn earworm:
We still are catching only a few moths in our trapsaround the valley. Pressure appears normal to lowso far. The most conservative programs for control-ling corn earworm involve an insecticide applicationat first silk, regardless of the moth trap counts.Followup sprays are applied at 5- to 7-day intervalsif continuing moth trap counts reach 5-10 moths pertrap day. Willamette Valley trap counts are belowthis threshold so far.
Cabbage aphid flights:
Winged cabbage aphid catches remain very high.Check carefully for aphid infestations increasing inthe late broccoli and early cauliflower plantings.Aphids colonies are moving up into broccoli budsas the buds begin to elongate.
In one field, 7 days after an early spray, wingedcabbage aphids re-infested the planting at levelscomparable to the pre-spray counts. Be sure tocheck broccoli plantings about a week after apply-ing aphicides to be certain that the spray programgot the job done.
Diamondback moth:
Moth counts and egg laying by diamondback mothcontinue to be intense in the central and northernparts of the Willamette valley and in the Staytonarea. At current temperatures, the diamondbacksprogress from egg to pupa in about 2 weeks. Lookfor “window panes” on the broccoli or cauliflowerleaves. If you find larger 3rd and 4th instar
July 28, 1999
VegNet
VegNet is a pest and disease monitoring andreporting network serving the Willamette ValleyProcessed Vegetable Industry. VegNet issponsored by the OSU Integrated PlantProtection Center and the Processed VegetableCommission.Contact: Dan McGrath, OSU (503) 931-8307
diamondback larvae (about 1/3 inch long) and thebroccoli buds are elongating, you should be con-cerned. Once pupae are formed in the buds, it isvery difficult to clean them up prior to harvest.
Cabbage loopers and Bertha armyworm:
Moth counts continue to be low compared to the1998 growing season. If you scout fields, you willprobably find limited numbers of looper eggs,looper worms, and a few armyworm strikes.Pressure is normal.
12-spot beetles and mold:
Numbers continue to be high in most parts of theValley. Continue to sweep bean plantings prior tofirst bloom. Morning sweep counts generally will behigher than afternoon counts in the same field.Bright afternoon light drives the beetles lower in thebean canopy, where they are missed by the sweepnet. Two to 3 beetles per 20 sweeps is the “grayzone” right at the action threshold. Mold pressure inbeans has been low so far.
Weather during the planting period:
Some of the problems that we see in our corn andbean plantings at this time are associated with theweather conditions at planting (see attached).
Degree day accumulation based on 50°F mini-mums are behind about 8 days compared to the1998 growing season (see attached).
Dan McGrath, Salem, Oregon
Appendix 2

106
Vegnet August 1, 1999OSU Extension ServiceDan McGrath, Salem Oregon
1999 Degree Days (Min 50°F)
1998 Degree Days (Min 50°F)
1,400
1,200
1,000
800
600
400
200
0
Degree Day Accumulation
1-Jan
22-Ja
n
12-Feb
5-Mar
26-M
ar
16-A
pr7-M
ay
28-M
ay
18-Ju
n9-J
ul

107
u
u
Vegnet August 1, 1999OSU Extension ServiceDan McGrath, Salem Oregon
15 Apr 22 Apr 29 Apr 6 May 13 May 20 May 27 May 3 Jun 10 Jun
Weather during the 1999 planting period
Prec
ipita
tion
(inch
es)
Max
dai
ly te
mp
(°F)
u
uu
u
uuuu
u
uu
uuu
u
uu
uuu
uu
uuuuuuuuuuu uu
u
u
uu
u
u
uuuu
uu
uuuuu
u
u
uuuu
u
u
0.40
0.35
0.30
0.25
0.20
0.15
0.10
0.05
0.00
100
90
80
70
60
50
40
30
20
10
0
Daily Precipitation
Daily Max Temp (F)

108
Abstract
Gorse (Ulex europaeus L.) is a spiny, prolific, andhighly invasive exotic plant from Europe. AlongOregon’s southern coast, gorse has displacednative flora in state parks and thousands of acres ofotherwise productive pastureland, causing annuallosses of $2 million per year. Biological control wasimplemented because gorse is resistant to mostconventional weed control practices. In 1994, thegorse spider mite (Tetranychus lintearius Dufor)was released as an additional biological controlagent against gorse to complement the effects ofthe gorse seed weevil. We evaluated techniques tomonitor gorse infestations and mite colonizationusing spatial technologies: remote sensing,geographic information systems, and globalpositioning systems. Nine 1-hectare plots were setup at two study areas. Mites were released in threerandomly selected plots, one from each of thefollowing site classifications: (1) gorse-dominatedand wind protected, (2) gorse-dominated and windy,and(3) mixed-dominated plant communities. Standardcolor film proved best for recording spider mitedamage and gorse infestations, when in bloom.Spider mite colonies, surface area averaging0.6 m2, were detectable 14 weeks after release.Dispersion of mite colonies was greatest at thegorse-dominated and windy sites. After 16 months,the surface area of all associated windy colonieswas 49.12 m2 and the greatest distance traveledwas 39.6 m.
Introduction
Gorse is a member of the family Leguminosae andis a well-adapted, early pioneer plant species(Hoshovsky, 1986). It was introduced into Oregonbefore 1894. Gorse invades and dominatesdisturbed sites and early successional plantcommunities (Hoshovsky, 1986). Its leaves areminimized into slender, extremely sharp spines andcan form an impenetrable barrier 1 to 5 meters tall
D. Johnson
Rangeland Resources DeptOregon State UniversityCorvallis, Oregon 97331
Evaluation of Technological Methods to Monitorthe Spread of the Gorse Spider Mite in Oregon
A. Peters RuddellOregon State UniversityCoos County Extension
290 N CentralCoquille, Oregon 97423
N. HarrisRangeland Resources Dept
Oregon State UniversityCorvallis, Oregon 97331
E. Coombs
Oregon Dept. of AgricultureSalem, Oregon
(Coombs, et al., 1996). In Oregon, gorse occupiesover 20,000 hectares in at least nine counties,mostly on the coast, but with increasing frequencyat inland sites (Isaacson and Miller, 1992). Gorsehas major economic considerations such as theloss of grazing land, control costs in rights-of-way,limited access and use of recreation areas, andcompetition and interference in conifer plantations(Isaacson and Miller, 1992).
Biological control is a preferred managementtechnique in areas with extensive infestations,rugged terrain, and high economic costs associatedwith herbicides (Isaacson and Miller, 1992). Gorseseed weevil (Apion ulicis) was the first biologicalcontrol agent released in Oregon in 1956 (Ritcher,1966). Although the weevil attacks the seed pods,plant density has not noticeably decreased(Isaacson and Miller, 1992).
The biological control agent that causes the mostdamage in Europe and which has shown the bestresults in New Zealand is the gorse spider mite,Tetranychus lintearius (Hill et al., 1991). The gorsespider mite was released in California and Oregonin 1994 (Coombs et al., 1996; Peters et al., 1997).The mites quickly established colonies and werewidely distributed in the area.
The objectives of the study were to: (1) developmapping (monitoring) techniques of gorseinfestations, (2) monitor rate and distribution ofexpanding mite colonies, (3) determine biotic and/orabiotic factors governing mite colony spread, and(4) detect plant response to the biological controlagent. To understand better the populationdynamics and dispersal patterns of gorse and thegorse spider mite, we used near-earth remotelysensed data, geographic information systems, andglobal positioning systems. These techniques alsowere used to detect spatial patterns and determinerelevant forces forming them.

109
Materials and Methods
Study Sites. Nine sites were established at twostudy areas in Coos and Curry Counties. Sitesencompassed an area of 1 hectare and wereselected as either gorse-dominated and windy,gorse-dominated and wind protected, or mixed-dominance plant communities. The mixed-dominance sites consisted mainly of gorse andshore pine and were also relatively wind protected.Sites were staked and located using a differentially-corrected global positioning system giving a globalaccuracy of under 3 m (Trimble, 1992).
Remote Sensing. A 5.5-m x 2-m tethered helium-filled blimp and paired 35 mm cameras with remotecontrol film advance were used to obtain aerialphotographs. Aerial imagery for mapping gorseinfestation was obtained for all sites in March, 1996.The gorse plants were in heavy bloom and no othervegetation was flowering. Imagery for measuringcolony distribution was obtained in late June andlate September. In 1997, imagery was obtained inAugust and October. Before images were taken, anumber on a piece of cardboard,30 cm on a side, was fastened to the top of thegeo-positioned stake to identify the site and allowthe stake to be located visually in the image. A1-square-meter quadrat made of 1-inch PVC pipewas placed on the ground near the stake forcalibration of image scale for measurementpurposes. Photos were processed into either slidesor negatives then transferred to compact diskformat.
Spider Mites. In May 1996, spider mite colonieswere collected from random gorse plants at aprevious release site and transferred to our studysites. Initial colonies consisted of a 15-cm-longsegment of gorse shoot-tip heavily coated withwebbing and spider mites. The colonies were tiedloosely with baling twine to the inner branches ofgorse plants at the geo-positioned stakes.
Ground Verification. Ground verification is anessential component in remote sensing technique(Avery and Berlin, 1985). Vegetation classificationimages produced from aerial photography wereground verified using 100 random sampling pointsper image. Twenty-five random square meter gridswere used to estimate cover. Diameters calculatedfrom the imagery were compared to thosemeasurements obtained from ground-accessiblecolonies.
A t-test for separation of means was used in ouranalysis.
Results and Discussion
If in bloom, gorse was mapped easily using aerialphotography. Gorse begins to bloom in lateFebruary and March, before most coastal plantcommunities. The three visible wavebands (red,green, and blue) obtained from color film were mostvaluable for the gorse mapping. The infrared bandwas not as useful for this purpose. This agrees withthe results obtained by Everitt and Escobar (1996),who found color film more effective for mappingmany weed species. Computer classificationroutines were used to produce gorse distributionmaps. Ground verification was used to produceKappa Index of Agreement (KIA) values accordingto Eastman (1997). Site 6 had a Kappa score of0.69 and site 7 had a score of 0.89. KIA valueswere lowered by errors of omission exclusively. Thisresult was expected because the techniquemapped only flowering gorse and not gorse thatwas not in bloom. At site 6, gorse bloom wasestimated at 72 percent, and at site 7, bloom was95 percent. For purposes of mapping andestimating cover of gorse infestation, aerialphotography was an excellent tool.
We examined the usefulness of color and infraredphotography to locate spider mite colonies and forassessment of damage to gorse plants. Analysis ofspectral values obtained from vertical aerialphotography and from ground-based obliquephotography of healthy versus spider mite affectedgorse plants showed good separation of means forthe three visible bands. A spectral signatureanalysis that compares low, high, and mean valuesacross the four wavebands as well as a comparisonof means, showed no statistically significantdifferences between infrared values of healthygorse and spider mite colonies. Four images wereused in this analysis with four pairs of treatments.While there was some difference between meansfor the infrared band, the range of values wasalmost identical, making this band of little value fordetecting and classifying mite colonies. Infrared filmis more difficult to work with than color film,because it must be kept cool and loaded in totaldarkness (Avery and Berlin, 1985). For this reason,and because it did not produce any useful data forour monitoring, we do not recommend infrared film

110
for monitoring gorse or spider mite colonies.It was of some surprise that damage to the gorseplants was not evident on infrared film, sincereflection of this waveband is influenced by internalcell structure (Grant, 1987; Knipling, 1970). Itappeared that feeding damage caused by thespider mites did not cause the cell collapse noticedin other plant species. This may be the result of theminimization of leaf structure of gorse, which ismodified into a spine. The removal of chlorophyll bythe sucking mites was evident in color photos,which showed blanched gorse shoots around mitecolonies and heavy webbing produced by the spidermites.
Mite colonies were detected 14 weeks after releaseand showed distinct colonies averaging 25 cm indiameter. Windy site colonies occupied 0.62 m2 andprotected site had a colony 0.58 m2. Adverse windconditions did not allow scheduled flights for aerialphotography at some times during the year;therefore, no measurements were taken in June,1997. The gorse also can create imposing barriersto ground-based measuring techniques and wouldhave involved destructive cutting of gorse plants toreach colonies physically.
Good coverage of gorse sites was photographed inOctober, 1997. Through analysis, it was shown thatmites at the windy site traveled farther (36.23 m)and spread wider (49.12 m2) than at the protectedsite, where they traveled 7.38 m and spread19.04 m2. The predominant wind direction is fromthe north. Mite spread followed the prevailing winddirection except for the protected site, whichexhibited greater dispersal to the west than thewindy site.
The coastal area was a difficult location to use ourblimp/camera setup, and limitations to aerial photomonitoring of gorse existed. Overhead obstructionssuch as power lines and closed canopy forestsprecluded use. In addition, wind speeds greaterthan 25 km/hr resulted in blurred images, andtransportation of the blimp between sites generallyrequired deflation.
After two seasons of taking measurements, spidermite colonies became available to the generalpublic through distribution and educationalprograms. Attempts were made to isolate our studyareas from public releases. However, we discov-ered that our research sites had been planted withadditional mite releases from the public, and thestudy was terminated.
In May, 1998, a predatory mite was discovered inareas where the gorse spider mites were releasedon the southern Oregon coast, near the town ofBandon. Other areas of Oregon and Californiawhere spider mites were released do not have thisproblem. The predatory mite and its impact on thegorse spider mite is being evaluated now.
Summary
Spatial technologies proved to be powerful tools foranalysis of distribution dynamics of gorse and thegorse spider mite. Remote sensing allowed foraccurate mapping and measurement of gorse andgorse spider mite colonies that would not havebeen possible using only ground-based techniques.Using low altitude aerial photographs, gorse can bemapped during flowering, and gorse spider mitecolonies can be detected in late summer or fallbefore rains destroy the webbing. Spider mitewebbing can be seen in photographs taken at1:450. Color film was more useful in identifying mitecolonies than was black/white infrared film.Weather conditions on the coast included frequenthigh winds and rain, which limited when blimpphotographs could be taken. Researchers and landmanagers have expanded analytical and monitoringcapabilities using these new technologies.
Literature Cited
Avery, T.E. and G.L. Berlin. 1985. Fundamentals ofremote sensing and airphoto interpretation. 5thedition. Macmillan Publish. Co. New York, NY.472 pp.
Coombs, E.M., G.P. Markin, and C.E. Turner. 1996.Gorse Ulex europaus. In Biological Control ofWeeds in the West. Western Society of WeedScience, Bozeman, MT.
Eastman, J.R. 1997. Idrisi for Windows. User’sGuide. Version 2.0. Clark University, Worcester,MA. 386 pp.
Everitt, J.N. and D.E. Escobar. 1996. Use of SpatialInformation Technologies for Noxious PlantDetection and Distribution on Rangelands.Geocarto International. 11(3):63-80.
Grant, L. 1987. Diffuse and spectral characteristicsof leaf reflectance. Remote Sensing of theEnvironment. 22:309-322.
Hill, R.L., J.M. Grindell, C.J. Winks, J.J. Sheat, andL.M. Hayes. 1991. Establishment of gorsespider mite as a control agent for gorse. Proc.44th N.Z. Weed and Pest Control Conf.1991:31-34.

111
Hoshovsky, M. 1986. Element stewardship abstractfor Ulex europaeus. The Nature Conservancy,Arlington, VA. 30 pp.
Isaacson, D.L. and G. Miller. 1992. A comparison ofgorse (Ulex europaeus L.) in New Zealand andthe United States. Proc. Wash. State WeedConf. Nov. 4-6, Yakima. pp. 43-48.
Knipling, E.B. 1970. Physical and physiologicalbasis for the reflectance of visible and nearinfrared radiation from vegetation. RemoteSensing of the Environment. 1:155-159.
Peters, A., N.R. Harris, and D.E. Johnson. 1997.Mapping and Monitoring Gorse (Ulexeuropaeus L.) Distribution in Coos and CurryCounties, Oregon. Proc. Ann. Meeting Soc.Range Management, Rapid City, SD.
Ritcher, P.O. 1966. Biological control of insects andweeds in Oregon. Agric. Exp. Stat. Tech. Bull.No. 90. 39 pp.
Trimble. 1992. Trimble PFINDERTM Software User’sGuide. Version 2.3. Trimble Navigation, Ltd.,Sunnyvale, CA. 382 pp.

112
What is Integrated Production?
Integrated production is a system that produceshigh quality food and other products by usingnatural resources and regulating mechanisms toreplace polluting inputs and to achieve sustainablefarming (IOBC/WPRS, 1993).
Emphasis is placed on: (1) a holistic systemsapproach involving the entire farm as the basic unit,(2) the central role of agro-ecosystems, (3)balanced nutrient cycles, and (4) the welfare of allspecies in animal husbandry. The preservation andimprovement of soil fertility and of a diversifiedenvironment are essential components.
Biological, technical, and chemical methods arebalanced carefully, taking into account theprotection of the environment, profitability, andsocial requirements (IOBC, 1993).
Program Goal Statement
As winegrowers in Oregon, we acknowledge thatwe are, in many ways, truly fortunate. Our vines arefree of many of the pests and diseases that afflictvineyards in other regions of the world. Therefore,our chemical usage is rather limited at present. Ourpurpose, then, in crafting this program for Oregonvineyards, is to maintain and enhance theseadvantages which we currently enjoy.
The objectives and scorecard outlined below shouldnot be seen as an endpoint, but rather as thebeginning of an ongoing process. The Oregonvineyard is a dynamic entity, presenting us withfresh challenges requiring innovative solutions. Newpests will require thoughtful responses, whichpreserve the integrity of our program objectives.Better solutions to old and chronic problems needto be encouraged. Clearly this program should beperiodically reviewed and revised as necessary.
Finally, it must be emphasized that participation inthis program should be entirely voluntary. We haveno interest in compelling anyone to be a part of thisplan who is not committed to the objectives outlined
Integrated Production Program for Oregon Vineyards1999
A. McDonaldLIVE (Low Input Viticulture and Enology)
below. Although vineyards will be visited periodicallyto monitor compliance, the commitment of theparticipants will be assumed and relied on for thisprogram to be successful.
Program Objectives
1. To see the vineyard as a whole system.
2. To create and maintain a viticulture that iseconomically viable over time.
3. To maintain the highest level of quality in fruitproduction. Integrated Production should notrequire any compromise of quality standards.
4. To implement cultural practices and to solveproblems in such a way that minimizes the useof off-farm inputs, such as agriculturalchemicals and fertilizers, with the goal ofprotecting the farmer, the environment, andsociety at large.
5. To encourage farming practices which promoteand maintain high biological diversity in thewhole vineyard.
6. To encourage responsible stewardship of thesoil, its health, fertility, and stability.
Requirements
To meet these objectives, a grower practicingIntegrated Production must fulfill a certain numberof requirements that apply to the entire viticulturalsurface of the farm, specifically: (IOBC/WPRS,1996)
1. Commitment of grape growerThe grape grower or vineyard manager must:• Be qualified (trained) professionally for
managing the vineyard according to LIVEprinciples and guidelines.
• Commit to permanent education andactively participate in LIVE training courses.

113
• Maintain complete vineyard records onfertilization, pesticide application, pruning,soil management, etc.
2. Establishment of Vineyard
Choice of variety, clone, and rootstockThe choice must take into account integratedproduction principles (biodiversity, leastsusceptibility to diseases, healthy plantmaterial, certified stock, etc.), take intoconsideration local soil and climate conditions,and respect the existing regional viticulturallegal restrictions.
Training systemPreference must be given to training systemsallowing application of cultural techniquesfavoring:• production of high quality grapes• vine longevity• biological diversity (botanical and zoologi-
cal)• protection of soil against erosion• reduction in circumstances leading to
introduction or establishment of insectpests, diseases, and undesirable plants
• more efficient pesticide application• reduction of the amount of pesticide
applied• recycling of spray drift (recovery panels,
hooded booms, if available)
Analysis and preparation of soil prior to plantingBefore planting, the following analysis andimprovements must be carried out:• soil analysis: texture, organic matter,
macronutrients (at least P, K, and Mg)• basic fertilization with organic and mineral
components if necessary• improvement of land if necessary
(drainage, etc.)• thorough elimination of sources of disease
inoculum• elimination of noxious perennial weeds• devitalization (killing) before removing
major virus infested vines (fan leaf)• land left fallow with a green cover
Chemical soil sterilization is not permitted. Theregional Integrated Production organizationmay allow exceptions in some serious cases offan leaf or root rot, defining clearly whichproducts can be used. In this case, nematologic
analysis and virus testing by an officialinstitution before removal of the old vines aremandatory.
3. Cultural Practices in established vineyards:The Scorecard
The purpose of the scorecard is to provide aconcrete, situational measure of compliancewith the program objectives. A score of zeroin a particular case means compliance withthe program. Negative scores suggest theneed for improvement. Positive scoresindicate a grower has done especially well ina particular area. Unacceptable scores wouldneed to be corrected before compliancecould be certified.
We have tried to be as inclusive as possiblewhile not compromising the programobjectives. Often, we chose to give negativescores for questionable practices rather thanto absolutely forbid them. The goal of thesystem, after all, is not to exclude, but toencourage continual improvement over time.
Evaluation System
The certification is granted by the OregonIntegrated Production organization LIVE. Theparticipants in the Integrated Production programshave to follow a set of rules, which may varyregionally, but satisfy an international standard. Theperformance of the grape grower is evaluatedannually by means of a point system (scorecard). Ascore of zero in a particular case means that thegrower has complied with the program. Negativescores suggest the need for improvement.Unacceptable scores would need to be correctedbefore compliance could be certified.
Bonus-points (10 to 20) are given to solutions andactions aimed at improving grape quality, diversifi-cation of the agro-ecosystem “vineyard,” andreducing chemical inputs (pesticides, fertilizers,fuel, etc). One single unacceptable score will causethe disqualification of the respective grower.Additionally, the grower has to achieve at least50 percent of the maximum number of positive-points. For instance, a minimum of 140 points out of280 are necessary to participate in the OregonIntegrated Production association LIVE.
114
Control: The grower submits the complete recordson fertilizers, pesticides, and cultural practices andis subject to unannounced inspection at least oncea year for verification.
Label “LIVE”
The label “LIVE” is granted by the LIVE Organiza-tion to wines that fulfill the conditions for grape-growing and winemaking.
Requirements1. Wines with the LIVE label must be produced
from grapes originating from certified LIVEvineyards.
2. The wines must respect regional appellationrequirements. Blending with non-LIVE wines isnot allowed.
3. Chaptalization cannot exceed 3 kg/hl or1.7 Volume % alcohol unless an exemption isgranted by the LIVE organization for thatparticular vintage.
4. Total SO2 content cannot exceed 120mg/l.Exceptions: Barrel fermented wines and wineswith residual sugar which must conform toregional legal restrictions.
5. For all other criteria, the Federal, state orregional legal restrictions apply.
6. Wines must be evaluated by an independenttasting panel and must be clean and havevarietal character.
7. A wine analysis by an independent specialistmust accompany the wine sample for tasting. Itmust include percent of alcohol, TA, total andfree SO2. For all other criteria, the regional legalrestrictions must be respected.
8. The number of labels distributed is based onthe quantity of wine produced.
9. Wines are subject to random testing.10. Unauthorized use of labels is penalized with
sanctions.
Literature Cited
IOBC/WPRS. 1993. El Titi, A., E.F.Boller, and J.P.Gendrier, (Eds). Integrated ProductionPrinciples and Technical Guidelines. IOBC/WPRS Bulletin 16(1).
Schmid, A., ed. IOBC/WPRS Bulletin, Guidelinesfor Integrated Production in Viticulture, Vol.19(10) 1996.

115
Overview
Grape pest management in Oregon focuses onrelatively few diseases and insect pests comparedto other production regions. This probably is due inpart to the wine grape industry being relatively new,small (9,000 acres), and somewhat dispersed. Pestmanagement currently emphasizes just three majorproblems: the diseases powdery mildew andBotrytis bunch rot, and the insect phylloxera.
Disease control programs are aimed primarily atpowdery mildew (Uncinula necator), a ubiquitousand potentially crop-destroying disease requiringannual control efforts. Bunch rot (Botrytis cinerea)is a frequent problem with the potential to causeserious crop loss in years with rainy harvestperiods. Phylloxera (Daktulosphaira vitifoliae) is arecent pest in Oregon, having been found first in acommercial vineyard in 1990. It is a root-feedingaphid that ultimately kills Vitis vinifera (Europeanwine grape) vines grown on their own roots.
Several other diseases cause occasional andusually isolated problems. Crown gall(Agrobacterium vitis) periodically has causeddamage in years following cold injury from harshwinters. It also may be introduced into graftedplants at the nursery, or the disease can develop onfield-grafted vines previously infected but symptom-less prior to grafting. Eutypa dieback (Eutypa lata)has been diagnosed in a few older vineyards thathad large pruning cuts to remove unproductivewood. Eutypa is expected to increase as existingvineyards age and older vines require largerejuvenating cuts. Phomopsis cane and leaf spot(Phomopsis viticola) can weaken vines and reduceyield; it has been an isolated problem in a fewvineyards. Leafroll virus is present in many oldervineyards that were not established with certifiedvirus-free plants. In most cases, leafroll has notweakened vines enough to reduce fruit quality orproductivity.
To date, phylloxera is the only significant insect pestproblem, and it has changed Oregon viticulturedramatically. Because self-rooted vines ultimately
Wine Grape Pest Management in Oregon
E.W. HellmanNorth Willamette Research & Extension Center
Oregon State University
succumb to phylloxera feeding damage (andperhaps subsequent root-rotting pathogens), themajority of Oregon acreage, which is self-rooted,eventually will need to be removed and/or replantedusing vines grafted onto resistant rootstocks. Thenumber of Oregon vineyards infested withphylloxera has increased steadily since the initialdiscovery (Hellmar and Fisher, 1998). Grafted vinescost about three times as much as self-rootedvines, and often require more care to establishsuccessfully. Learning how to select appropriaterootstocks for a vineyard and how to managegrafted vines is an ongoing challenge for theindustry and researchers (Candolfi-Vasconcelos,1995; Candolfi-Vasconcelos et al., 1999a).
Several other insects have caused isolated, minorproblems. Southern Oregon vineyards morecommonly experience noticeable populations ofspider mites, leafhoppers, and thrips compared tothe Umpqua and Willamette valleys. Often theseinfestations do not increase to high populations untillate in the season, and may not require controlefforts. Sporadic, localized infestations of twig borerand black vine weevil sometimes have requiredinsecticide applications. The grape Erineum mite iscommon in western Oregon vineyards, but itgenerally is kept at low levels by sulfur applicationsused for powdery mildew control.
Pest Management Practices
Oregon grape growers take the first step in pestmanagement when they plan and develop theirvineyard. Disease management is facilitated greatlyby selection of an appropriate training system andvine spacing that enables maintenance of an open,well-exposed canopy. Canopy management duringthe growing season, using such techniques asshoot thinning, shoot positioning, hedging, and leafpulling, is critical for good disease managementwith certain training systems. Leaf pulling in the fruitzone is the first defense against Botrytis bunch rotand, combined with shoot positioning, providescontrol as effective as

116
fungicides alone in years of dry weather duringharvest (Candolfi-Vaconcelos et al., 1999b).Developing fruit exposed to direct sunlight producesthicker skin and epicuticular wax, which reducessusceptibility to Botrytis infection (Percival et al.,1994). Improved air circulation facilitates drying,which reduces the duration of a favorable infectionenvironment for both bunch rot and powderymildew. Open canopies also enable better spraycoverage, which improves the effectiveness offungicide applications. Phylloxera control alsobegins with vineyard planning, since resistantrootstocks are the only effective solution to theproblem.
Oregon’s favorable climate for powdery mildew,combined with the high susceptibility of Europeanwine grapes, requires that fungicides play a criticalrole in controlling the disease. The 1999 PestManagement Guide for Wine Grapes in Oregon(Candolfi-Vaconcelos et al., 1999b) lists 10 materialsthat can be used in a powdery mildew controlprogram. Having the choice of so many tools isboth unusual and a bit confusing. In the PestManagement Guide, OSU Extension has tried toprovide some guidance to growers with an examplestrategy for powdery mildew control. The strategyillustrates the timing of canopy managementpractices and fungicide applications. It indicates therole that each fungicide is capable of playing in thestrategy, primary or supplemental. It furtherillustrates the need to rotate among fungicideshaving different chemistry to avoid development offungicide-resistant mildew. A fungicide efficacy tableassists growers in selecting the most appropriatematerials to use in their program.
A similar example strategy for Botrytis bunch rotcontrol was prepared in 1999. The bunch rotstrategy strongly emphasizes canopy managementpractices. As stated earlier, shoot positioning andleaf pulling are the first defense against bunch rot.These canopy management techniques provide aless favorable environment for infection, increaseresistance to the pathogen, and enable better spraycoverage if fungicide applications are necessary.Reliance on fungicides for bunch rot control is alittle more tenuous than it is for mildew. Althoughseven fungicides are listed for bunch rot, only twoprovide moderate or good control. Pathogenresistance development is a concern, so growersare anxiously anticipating approval of newfungicides having different chemistry.
Insect pest management, other than a veryoccasional localized problem that may or may notrequire insecticide treatment, is not currently aregular production concern of Oregon growers.Phylloxera control is achieved through the plantingof vines grafted onto resistant rootstocks.
Looking to the Future
The relatively simple spectrum of disease andinsect problems presently in Oregon vineyards isexpected to become more complicated in the futureas the industry expands and becomes concentratedmore locally. Other diseases that potentially couldbecome established here include Young VineDecline, a recently recognized problem involvingseveral fairly common soil pathogens attackingyoung grafted vines that have been stressed(Pscheidt and Ocamb, 1999a). Downy mildew hasnot been reported here, but the western Oregonclimate would be highly conducive to diseasedevelopment if the pathogen is introduced (Pscheidtand Ocamb, 1999b). Fanleaf and other virusdiseases could be introduced with contaminatedplanting stock. Tomato ringspot virus and itsnematode vector (Xiphinema americanum) are bothendemic to the Willamette Valley, but the virus hasnot yet been isolated from Oregon vines (Martin,1998). Ring, root-knot, and dagger nematodescould become increasing problems, particularly inreplanted vineyards.
Phylloxera will destroy increasing numbers of self-rooted vines, but eventually most vineyards will beplanted with resistant rootstock. Leafhoppers,thrips, and spider mites could become morecommon problems as grape acreage increases.Future insect and mite problems perhaps could beminimized by widespread adoption of the new LowInput Viticulture and Enology (L.I.V.E.) integratedproduction program (Anon, 1998). The L.I.V.E.program promotes production practices thatpreserve or enhance native populations ofbeneficial insects that could keep pest populationsfrom rising to damaging levels.
Literature Cited
Anonymous. 1998. An integrated productionprogram for Oregon vineyards. Proceedings ofthe Oregon Horticultural Society. 89:195-198.
Candolfi-Vasconcelos, M.C. 1995. Phylloxera-resistant rootstocks for grapevines. pp. 12-18.In: Phylloxera—strategies for management in
117
Oregon vineyards. EC 1463. Oregon StateUniversity Extension Service.
Candolfi-Vasconcelos, M.C., P. Schonenberger, andS. Castagnoli. 1999a. Evaluation of phylloxera-resistant rootstocks for the cultivars Pinot noir,Chardonnay, Pinot gris, and Merlot. pp. 26-32.In: OSU Winegrape Research Wine AdvisoryBoard Progress Reports, 1998-1999. OregonWine Advisory Board.
Candolfi-Vasconcelos, M.C., W.D. Edge, G.C.Fisher, E.W. Hellman, J.W. Pscheidt, and R.D.William. 1999b. 1999 Pest Management Guidefor Wine Grapes in Oregon. EM 8413. OregonState University Extension Service.
Hellman, E.W. and J. Fisher. 1998. Update onphylloxera in Oregon vineyards. Proceedings ofthe Oregon Horticultural Society. 89:190-191.
Martin, R.R. 1998. Viruses of grapevine inOregon—what are the risks? Proceedings ofthe Oregon Horticultural Society. 89:192-194.
Percival, D.C., K.H. Fisher, and J.A. Sullivan. 1994.Use of fruit zone leaf removal with Vitis viniferaL. cv. Riesling grapevines. II. Effect on fruitcomposition, yield, and occurrence of bunch rot(Botrytis cinerea Pers.:Fr.) Am. J. Enol. Vitic.45:133-140.
Pscheidt, J.W. and C.M. Ocamb (eds.) 1999a.Grape—Young Vine Decline. pp. 161-162. In:Pacific Northwest Plant Disease ControlHandbook. Oregon State University ExtensionService.
Pscheidt, J.W. and C.M. Ocamb (eds.) 1999b.Grape—Downy Mildew. p. 158. In: PacificNorthwest Plant Disease Control Handbook.Oregon State University Extension Service.

118
Oregon State University worked to develop anIntegrated Pest Management program in the early1980s. The research and development phase of theprogram was funded through a USDA grant underthe leadership of Dr. Glenn Fisher, OSU ExtensionEntomology Specialist, and Jim Calkin.
Prior to the development of the OSU IPM program,the hazelnut industry relied on a calendar approachto control insect pests. Survey results from 1981and 1997 have shown that the OSU IPM programhas reduced significantly the amount of insecticides
Hazelnut IPM in Oregon
Jeff OlsenYamhill County ExtensionOregon State University
applied to hazelnut orchards. The cost savings areestimated at $1/2 million each year.
The program was developed using growers’orchards that ranged throughout the WillametteValley. All of the test site orchards were monitoredon a weekly schedule. Sampling schemes andaction thresholds were refined over a period of 4years. At the end of the 4-year development period,the program was transferred to the hazelnutindustry. Currently, the OSU Hazelnut IPM programis in widespread use by growers, consultants, andfarm supply fieldmen. Table 1 lists insect pests,sampling schemes, and action thresholds.
Filbertworm
The filbertworm is the most important insect pest inhazelnuts. Its life cycle is unusual, in that theemergence period for a single generation is ex-tended from late June into October. This makes theuse of pheromone traps even more vital in timingefficient controls.
The filbertworm overwinters as an inactive larva ina silken cocoon. These cocoons can be foundunder leaves and trash on the orchard floor or inany crack or crevice that they may find. There arealso some larvae that hibernate 1 to 2 inches underthe soil surface.
The larvae pupate in the cocoon in the spring, thenemerge as adults about 2 to 5 weeks after pupation.This emergence usually begins around mid-June
Table 1. Hazelnut IPM sampling methods and action thresholds.Insect Sampling Period Sampling Method Action ThresholdEuropean Larvae: March 15 3 terminals/tree and 3 leaf clusters/terminal. Each 20% infestation winter moth –May 31 terminal is a sampling unit.Big bud mite March–April By March 1, place Tanglefoot on twigs When consistent mite
surrounding blasted buds. Check for extremely movement is observed.small, white, cigar-shaped mites with a 20xhand lens.
Omnivorous April 15–June 3 bud cluster per tree 5% infestationleaftierFilbert aphid April 1–September 30 3 terminals per tree—newest fully expanded leaf April – 20/leaf
on each terminalMay – 30/leafJune – 40/leafJuly – 40/leafwith increasing population.
Obliquebanded Larvae: April–August Larvae: 3 terminals per tree and 3 leaf clusters Larvae: 20-25% infestation.leafroller Adult: Mid-May–Sept. per terminal. Each terminal is a sampling unit.
Adult: pheromone trap for each 5 acres. 6' height. Adult: 40 moths per week andfind larvae feeding on nuts.
Filbertworm June–September Adult: pheromone traps—4 for first 10 acres and 2-3 moths per trap or 5 mothsone for each additional 4 acres. Place traps in the in any one trapupper 1/3 of the canopy by mid-June.

119
and continues through October. Once the adultsemerge, they look for mates. Weather conditionsthat favor mating flights and egg laying are whentemperatures at dusk (1/2 hour before and 2 hoursafter sunset) are above 60ºF. The day after mating,egg laying occurs. Usually this is done during thesunniest part of the day. The eggs are laid one byone on leaves close to nuts. The eggs hatch in 8 to10 days. The newly hatched larvae then movearound and find a nut to feed in. They will feed inthe nut for about 2 to 4 weeks. Then, they eitherenlarge their entry hole or bore a new exit hole. Thelarvae form a cocoon to overwinter.
Occasionally, there is a partial second generation offilbertworm. This usually includes about 10 percentof the population. This occurs when there is astrong, early emergence.
Our threshold recommendations are based on fourtraps for the first 10 acres and one for each addi-tional 4 acres. Spraying is recommend when two tothree moths accumulate in each trap, or when anyone trap catches five moths cumulatively.
The traps should be placed in the top one-third ofthe tree canopy. This contrasts with the leafrollertraps, which are placed at a height of 6 feet. Theextra caps either should be refrigerated or stored ina freezer, and changed every 4 to 6 weeks. Thetrap bottoms should be changed when they have somuch soil and other insects that the sticky surfaceis limited.
Experience reveals that growers should be awareof the conditions surrounding their orchards. If anabandoned block, or one that is managed yetheavily infested, is within 1/2 mile of an orchard, itshould be observed closely. Traps should be placedin, or at least near, those sources of infestation.
Spot spraying can be employed successfully inspecific situations. Growers should spray at leastthe four to six outside rows nearest infested blockswhen their border traps show a strong flight of themoths. It would be best if growers could arrange totreat these sources of infestation. Sometimes,pregnant females from these infested blocks can flyinto the orchards and lay eggs that produce wormsin the nuts at harvest.
Filbert Aphid
The very first filbert aphids probably hitched a ridefrom their native Europe on filbert seedlingsshipped here in the late 1800s. Filbert aphid firstwas found in the U.S. in 1903. To manage filbertaphid in hazelnut orchards, OSU researched theaction thresholds for aphids and decided that asliding scale for the number of aphids per leafshould change with the month. In April, there are20 per leaf, rising to 30 in May, 40 in June, and40 with increasing populations in July.
The hazelnut industry’s approach to managing thefilbert aphid has changed since the early 80s. Theaphid parasitoid Trioxys pallidus was imported fromEurope to Willamette Valley hazelnut orchards. Ithas spread on its own up to 10 miles from otherknown sites where it first thrived. There were onlyfive original “seed” sites back in the mid-80s. Then,there were 60 more sites that had releases, onceenough wasps were reared at OSU.
Today nearly every orchard checked shows signs ofthe wasp’s presence. This usually is accompaniedby a reduction in the number of filbert aphids. Manygrowers report that they haven’t had to spray foraphids in many years. The OSU IPM programcreated a sampling scheme and action thresholdsfor growers to use in monitoring aphid populations.The parasitoid successfully established itself, andgrowers used the thresholds to confirm its success.
Here is a review of the aphid lifecycle. The filbertaphid overwinters as an egg on the tree trunk orbranches. The eggs usually begin hatching aroundthe beginning of March. Egg hatch continues for3 to 4 weeks. The young aphids that emerge fromthe eggs molt four times and then produce wingedadults. These adults give birth to young aphidswithout sexual reproduction.
During the season, there are as many as 10 gen-erations of aphids produced. The populations seemto decline naturally in the heat of the summer. Thenin the fall, the winged forms are produced. Thesewinged forms produce the egg laying forms thatcreate the overwintering population.
Another secondary problem comes with heavyaphid infestations: black, sooty mold. This is asecondary fungus that grows on the sweet honey-dew left on the leaf surface by aphids feeding. Thiscan reduce the photosynthetic capacity of the leaf.
120
Growers also report displeasure at working inorchards with sticky leaves caused by the honey-dew.
Leafrollers
There are two leafrollers in hazelnut orchards: thefilbert leafroller and the obliquebanded leafroller.The filbert leafroller is a native of Europe. It wasaccidentally introduced in 1915.
The filbert leafroller overwinters as an egg. Thoseeggs hatch in late March or early April. The newlyhatched larvae feed on both sides of the newleaves. They soon pull the leaf into a roll. Nicelytucked in their hideaway, they feed for 4 to 8 weeks.Then they pupate right there in the webbed leaf.This normally occurs in late May or early June inthe Willamette Valley.
The adults emerge from the pupae in late June orearly July. Their emergence continues until mid-August. But, the adults only live for 2 to 4 weeks.Before they die, they lay their eggs in masses onthe trunks and major branches, where they over-winter. There are an average of 50 eggs per mass.There is only one generation per year for the filbertleafroller.
The other leafroller in hazelnuts is theobliquebanded leafroller. The OBLR, as it is com-monly called, overwinters as an inactive andpartially grown larvae in the crevices and cracks ofthe tree bark and on the ground debris. As thetemperatures warm in the spring, the overwinteringlarvae start to become active. In March and April,the larvae feed on buds and new leaves. Then,during late April or May, the larvae pupate in theleaves. The pupation lasts for 4 to 6 weeks.
The adults emerge from the pupae in early Junethrough the middle of July. There is usually a sharpemergence peak in the middle of July. The adultsmate and lay eggs within a few days of emergence.
The eggs hatch within 2 weeks. The new larvaeoften can be found in the orchards by the first ofJuly. They will feed for 6 to 8 weeks. In addition totheir leaf feeding, they can cause nut damage atthis stage. They feed on the shell underneath thehusk, causing scarring and staining of the youngnuts. After their feeding stage they pupate insidesilk webs.
The adults of the second generation emerge 1 to2 weeks after pupation. This emergence usuallyoccurs from the first week in September throughearly October. The adults mate and lay eggs thathatch in 7 to 10 days. The larvae feed briefly, thenoverwinter until the following spring.
The thresholds for leafrollers are to spray when20 to 25 percent of the terminals have larvae; whilefor adults, we spray in the first generation whenthere are 40 moths per week. For the OBLR,growers should check the nut cluster for the secondgeneration larvae. If larvae are found feeding on thecluster, and the traps have high adult counts, then aspray is recommended.
The number of applications made to controlleafrollers has reduced from one per year to oneevery 4 years. This is a result of natural predationbuildup in the orchards early in the season. Sincethe aphid populations have declined below thresh-old levels due to Trioxys, the need for early seasonsprays has been reduced. Natural predators have,therefore, built up their populations, and leafrollersuppression has been a side benefit.
The Oregon hazelnut industry now has a longhistory of using IPM. The OSU Hazelnut IPMprogram has served the industry well, helpinggrowers both to avoid unnecessary sprays and tomake timely applications when they were trulyneeded. The initial investment in the program haspaid off handsomely, with the economic andenvironmental benefits continuing to accrue.

121
Farmers describe their enterprises as wholesystems with interactive relationships, feedbackloops, and time considerations. In contrast,university faculty see the world as disciplines andassume that the grower is responsible forintegration and implementation of technologies orresearch. Most disciplinary research, therefore,ignores interactions and relationships betweenorganisms or impacts of one practice on multiplecomponents of a functioning system.
Integrated pest management could provide thisframework for inquiry. This paper briefly describeswhat “whole systems” pest management (IPM)might look like. It explores the approach we used tointegrate the emerging sciences of ecology with thedisciplinary methodologies used by pest manage-ment specialists. The purpose is to explore theeffects of crop rotation, tillage, and cover cropresidues on the soil foodweb and multiple pestswithin the context of vegetable cropping systems.
Background
Allelopathy is defined as “the injurious effects ofone plant upon another” (Rizvi and Rizvi, 1992).The word suggests chemical regulation directlybetween plants, leachates from plants, or microbialrelease and/or transformations that impact plants.Scientists’ interests either focus on explaining thephenomena or employing the tactic in weedmanagement.
Barnes & Putnam (1986) described a Michiganfarmer’s observation that mustard failed to infest‘Wheeler’ cereal rye. Numerous students andcolleagues researched the hypothesis thatallelopathic toxins, some derived from micro-organisms, prevented mustard and other small-seeded weeds from germinating or emerging whenplanting large-seeded crops such as peas, beans,or corn into undisturbed residues of ‘Wheeler’cereal rye.
Impacts of Tillage and Cover Crop Residueson the Soil Foodweb and Multiple Pests in Vegetables
R.D. William, R.E. Peachey, A. Moldenke, R. Berry, E. Ingham, L. Harrison, and M. PowelsonDepartments of Horticulture, Entomology, and Botany/Plant Pathology
Oregon State University
Oregon research commenced to validate or adaptthe Michigan results in vegetable systemsbeginning in the early 1990s. Emergence of small-seeded weeds such as pigweed and blacknightshade decreased in plots containing residuesof ‘Wheeler’ rye, ‘Monida’ oats, ‘Micah’ barley, and‘Steptoe’ barley. While pondering the physiologicalresponse of several cereals causing similar weedsuppression, growers expressed interest in asystem that suppresses multiple pests includinginsects and diseases.
Symphylans are a root-feeding arthropod that dwellentirely in the soil. We hypothesized that covercrops also might affect symphylan populations.Results from several experiments conducted in thefield and laboratory caused us to re-examine ourmethods, and eventually our hypotheses. Why didtoxins from four cereal cultivars suppress twoweeds but result in erratic suppression ofsymphylans? Should we expect similar resultsamong three types of cereals? What researchassumption should we reconsider? What might belearned by combining farmers’ and researchers’perspectives?
A diverse group of three vegetable growers,disciplinary entomologists, weed scientists, and soilfoodweb ecologists with microbial and arthropodspecialties drew a diagram or representation of acover crop and soil habitat system for vegetableproduction systems (Figure 1). Soil foodwebecologists studied population dynamics ofarthropods at time intervals throughout the seasonand between years, while disciplinary scientistsasked about causal relationships associated withcontrol of pigweed, black nightshade, andsymphylan pests in snap beans and sweet cornrotations with wheat. Ecologists often focus part oftheir inquiry on keystone species. Although thisseems like a reductionist approach, keystoneevents in our system might include crop rotation,tillage, and cover crop residue.

122
Methods
All plots were fall-tilled and planted with a covercrop or left fallow. By late winter or very earlyspring, all plots were treated with glyphosate to killcover crops or existing winter weeds. Half of eachplot was tilled while the other half received nospring tillage; all were planted with a cross-slotplanter to minimize soil disturbance except alongthe planting line, where both seed and fertilizerwere placed in a narrow slot. Plot size ranged from6 by 11 m to 8 by 14 m with four or five replicationsrepeated on the same site for 3 years. Arthropodsamples were collected using a golf-green cutter(5 cm dia) or from 1,000 cm2 while weed countswere recorded from m2 areas within each plot.Results represent a compilation of severalexperiments; specific methods for each trial areavailable upon request or are in preparation forpublication.
Discoveries
Suppression of pigweed and nightshade wasgreater in untilled treatments compared to tilledsystems (Figure 2). In fact, observations and initialdata suggest that tillage may stimulate emergenceand eventual maintenance of the weed seed bankcompared to systems lacking disturbance in spring.‘Micah’ barley emerged faster and suppressedmore winter weeds than other cereals, even thoughbiomass, plant height, and survival during winterwere least. Although allelopathy can explain weedsuppression, overwhelming evidence suggests lackof spring tillage reduces pigweed and nightshade by0.70 percent. Adding a cereal residue mulch on thesoil surface contributes another 15 to 20 percent tototal weed control. Overwhelming evidence (85 to90 percent of weed suppression) suggests thatallelopathy explains a relatively minor amount ofweed suppression in these system. In fact, it maybe one of several other factors that explain theremaining 10 to 15 percent of weed suppression.
Figure 1. Diagrammatic representation of soil foodweb and cover crop system completed by three farmers, disciplin-ary entomologists, weed scientists, and soil foodweb ecologists.
Kelp mealBaits
Sampling
Symphylans
Biological Agronomiccrop
Economics
Social
Nematodes
Equipment/ planters
No till/tillage practicesOrganic matter
WeedsDisease
Predator mites
Food web dynamics
AggregatesTaxonomyBiology
Soil structure
Rearing
Macro and microbiotic
(fundamental)
Cover Crops
Habitat
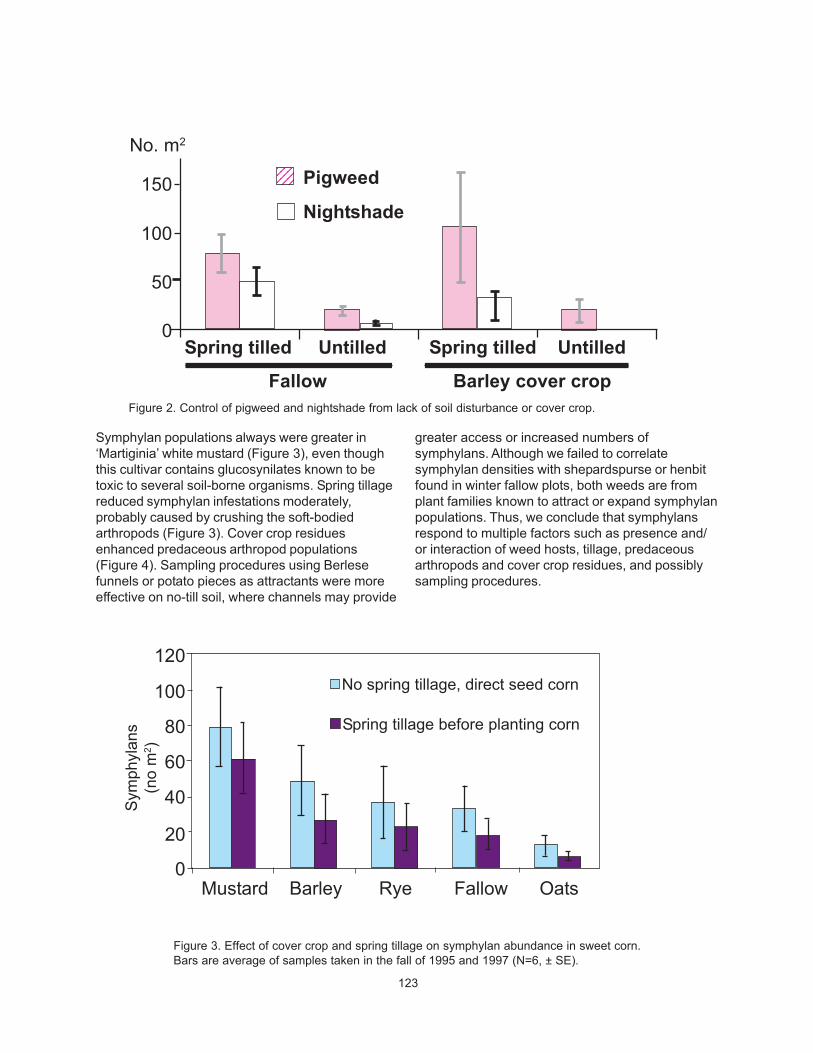
123
Symphylan populations always were greater in‘Martiginia’ white mustard (Figure 3), even thoughthis cultivar contains glucosynilates known to betoxic to several soil-borne organisms. Spring tillagereduced symphylan infestations moderately,probably caused by crushing the soft-bodiedarthropods (Figure 3). Cover crop residuesenhanced predaceous arthropod populations(Figure 4). Sampling procedures using Berlesefunnels or potato pieces as attractants were moreeffective on no-till soil, where channels may provide
greater access or increased numbers ofsymphylans. Although we failed to correlatesymphylan densities with shepardspurse or henbitfound in winter fallow plots, both weeds are fromplant families known to attract or expand symphylanpopulations. Thus, we conclude that symphylansrespond to multiple factors such as presence and/or interaction of weed hosts, tillage, predaceousarthropods and cover crop residues, and possiblysampling procedures.
Figure 3. Effect of cover crop and spring tillage on symphylan abundance in sweet corn.Bars are average of samples taken in the fall of 1995 and 1997 (N=6, ± SE).
Sym
phyl
ans
(no
m2 )
Spring tilled Untilled Spring tilled Untilled
Fallow Barley cover cropFigure 2. Control of pigweed and nightshade from lack of soil disturbance or cover crop.
Pigweed
Nightshade
123123123123
No. m2
150
100
50
0
Mustard Barley Rye Fallow Oats
120
100
80
60
40
20
0
No spring tillage, direct seed corn
Spring tillage before planting corn

124
Figure 5. Pigweed presence from tillage regimes conducted in spring for snapbeans followed by spring-tilled sweet corn in vegetable crop rotations.
Dual @ 1 lb
Dual @ 2 lb
ST beans - ST corn NST beans - ST cornST=spring tilledNST=no spring tillage
No. m2
4
3
2
1
0
Figure 4. Year and cover crop effects of predaceous arthropods. The cover crop treatments are ordered fromlowest drymatter to most in both years. Though there was a poor correlation between individual data points forpredaceous mites and cover crop drymater (R-0.42; p-0.021), this figure indicates a close relationship betweenmean values.
Predators(no. m2)
Cover cropdry matter(MT ha1)
Predaceous mitesCover crop dry matter (kg/ha)
As an integral part of inquiry, we might ask aboutother components of the system. For example, willthe spring no-till/residue system encourage newpests or pest complexes? We experienced moreslugs with the spring no-till residue system. Also,herbicide rates (Figure 5) were halved with thecross-slot planting of beans or sweet corn intospring no-till systems. Although we have monitoredDiabrotica and conducted trials to assess impactsof tillage and/or cover crops residues on Sclerotiniawhite mold in snap beans, no consistent hypotheses
have emerged. Growers express concern aboutbuying new planters, but when quizzed beyond theinitial question or issue of cost, major concerns arerevealed about the time required to learn a newsystem. In fact, they report that current economicsor skepticism among individuals requires assess-ment of research results over several years followedby their personal learning over another 6 to 10 yearsto make a new or modified system work on theirfarm.
350
300
250
200
100
50
0
150
8.0
7.0
6.0
5.0
4.0
3.0
2.0
1.0
0.0 Mustard Fallow Barley Oats Rye Mustard Fallow Barley Oats Rye 1995 1997
Cover Crop Treatment and Year
t
t
t
tt
t t
t
t
tt
a att

125
Interpretations
Although allelopathy may explain weed results, soilsare complex environments with physical, biological,and chemical variables that interact over time.Analysis and interpretation of foodweb datasuggests that tillage and fallow season cover cropsare key events in annual cropping systems. Thesepractices impact multiple organisms and systemdynamics over time. Allelopathy explains very littleweed suppression in our trials. Reducing herbicideuse required a change in the fundamentalproduction system toward reduced spring tillage.Perhaps we need to ponder questions aboutresearch methodologies along with consideringexpected results of choosing any one or combina-tion of approaches. Should we expect similarallelopathic results from several species or cultivarsof cereal cover crops, or are there other hypotheseswe should be considering? Shouldn’t soilarthropods respond similarly as weeds to allelo-pathic toxins, or do all arthropods metabolize toxinsor somehow avoid their impact? Can pesticides bereduced within current production systems, or isfundamental change required in the productionsystem to achieve this goal?
In our foodweb studies, data representing flows orrelationships over time complimented our causal orproof hypotheses for specific organisms. Ourpurpose was to suppress multiple pests within a soilecosystem while minimizing unintended conse-quences, such as creating new pest complexes orincreasing time management requirements byproducers. Combining inquiry among farmers,ecologists, and pest disciplines has raised morequestions than answers. As 21st century inquirersconsider ways to integrate research approachesfocusing on ecology, landscapes, causal proof, andhuman values, opportunities exist for exploringways to research and implement IPM as anintegrated science.
Literature Cited
Barnes, J.P. and A.R. Putnam. 1986. Evidence ofallelopathy by residues and aqueous extracts ofrye (Secale cereale). Weed Science. 34:384-390.
Rizvi, S.J.H. and V. Rizvi. 1992. Allelopath: Basicand Applied Aspects. Chapman and Hall,London.

126
Enhancing Biological Control with Beneficial Insectary Plants
J. Luna, M. Colley, and M. StabenDepartment of Horticulture
Oregon State University
Introduction
Beneficial insectary planting refers to introducingflowering plants intentionally into agriculturalecosystems to increase pollen- and nectar-resources required by natural enemies of insectpests. Several species of natural enemies, includingaphidophagous (aphid-feeding) hoverflies (Diptera:Syrphidae) and parasitic hymenoptera, depend onpollen and nectar for reproductive success andlongevity (Schneider, 1948; Jervis et al., 1993).Surveys of weed and wild-plant compositions inagroecosystems have associated florally abundant,non-crop habitat with higher numbers of pollen andnectar-feeding natural enemies in and around farmfields (Cowgill, 1989; Cowgill et al., 1993) andorchards (Leius, 1967). However, because ofagricultural practices such as frequent cultivationand herbicide applications, many farm fields havefew flowering plants present, which may limit thepotential benefit of these insects for biologicalcontrol.
Several studies have demonstrated the potential forestablishing flowering plants in or around farm fieldsto attract natural enemies and enhance biologicalcontrol of crop insect pests in adjacent fields (Kloenand Altieri, 1990; White et al., 1995; Hickman andWratten, 1996). However, natural enemies areselective in their feeding and show preferences forcertain plant species (Cowgill et al., 1993; Lunauand Wacht, 1994).
The goals of the reported research were to assessthe potential of selected flowering plants asbeneficial insectary plants and to evaluatestrategies for using insectary plants to enhancebiological control. Three field experiments wereconducted in 1997 to evaluate the relativeattractiveness of potential beneficial insectaryplants; one additional on-farm experimentevaluated the effectiveness of interplanting twospecies of insectary plants in a broccoli crop toenhance biocontrol of aphids.
Project Objectives
1. Evaluate relative attractiveness of selectedflowering plant species to adult aphidophagoushoverflies and parasitic hymenoptera.
2. Identify species of hoverflies associated withselected insectary plants.
3. Evaluate the potential of interplanting alyssumor cilantro in a broccoli field to attract hoverfliesand suppress cabbage aphid populations.
Procedures
Relative Attractiveness Studies. The relativeattractiveness of 11 flowering plants toaphidophagous hoverflies (Diptera: Syrphidae) andparasitic wasps (Hymenoptera: Ichneumonidae andBrachonidae) was evaluated at the Oregon StateUniversity Vegetable Research Farm. Flowersincluded seven annuals: annual alyssum (Lobulariamaritima), calendula (Calendula officinalis), cilantro

127
(Coriandrum sativa), mustard (Brassica juncea),Phacelia (Phacelia tanacetifolia), buckwheat(Fagopyrum esceulentum), and marigold (Tagetespatula), and four perennials: yarrow (Achilleamillefolium), Korean licorice mint (Agastacherugosa), fennel (Foeniculum vulgare), and perennialalyssum (Aurinia saxitalis.). Flowering plants weregrown in 1 m2 plots in a complete randomized-blockdesign with four replications.
Six of these plants also were evaluated forattractiveness to aphidophagous hoverflies at twoorganic farms (Denison Farm, Corvallis, OR andPersephone Farm, Lebanon, OR) including threeannuals: annual alyssum, phacelia, and cilantro;and three perennials: yarrow, Korean licorice mint,and fennel. At the two on-farm sites, flowers weregrown in 1 m2 plots in a complete randomized-blockdesign with three replications.
Relative attractiveness of flowering plants tohoverflies was assessed by conducting timedobservations of feeding-visit frequencies. Numericalabundance of parasitic hymenoptera (Brachonidaeand Ichneumonidae) wasps was estimated by timedvacuum sampling. Blooming times of plant speciesvaried, and evaluations were made only duringblooming periods.
A sweep net was used to collect hoverfliesassociated with each insectary flower species;representatives of these hoverflies were sent toGermany and identified by a hoverfly systematist.This reference collection then was used to identifyall hoverfly species collected in the experiments.
On-Farm Insectary Interplanting in Broccoli.Alyssum and cilantro were interplanted in a 30-acrecommercial broccoli field to asses the potential toattract adult hoverflies and suppress aphidpopulations on broccoli. Plots were 60 x 60 ft andtreatments included: alyssum interplanted with
broccoli, cilantro interplanted with broccoli, and abroccoli monoculture. The experimental design wasa complete randomized block design with threereplications of each set of treatments, with a 60-ftbuffer zone of untreated broccoli plants betweeneach treatment block. Alyssum and cilantro weretransplanted at the same time the brocolli wastransplanted into the field.
Adult hoverfly activity was monitored with yellowpan traps, and hover fly egg and aphid densities onthe broccoli were assessed by counts from60 randomly-pulled broccoli leaves within eachtreatment plot. All sampling was conducted on aweekly basis. Parasitism rates of the cabbageaphid by the aphid parasitoid, Dieretiella rapae, wasdetermined by counting aphid “mummies” on thebroccoli leaves.
Results
Relative Attractiveness Studies
In all, 15 species of aphidophagous hoverflies werecollected and identified. Although species variedsomewhat among the three experimental sites, thesix most common aphidophagous species ofhoverflies caught in sweep nets were: Meliscaevacinctella, Toxomerus marginatus, T. occidentalis,Sphaerophoria sulphuripes, S. pyrrhina, andScaeva pyrastri (Table 1). Attractiveness offlowering plants to hoverflies differed by dates andsites. Among early-season flowering species,cilantro was the most attractive to hoverflies,followed by alyssum and buckwheat. Mustard,buckwheat, and Korean licorice mint were mostattractive to parasitic hymenoptera. Among late-season flowers, fennel and Phacelia were mostattractive to hoverflies, but attractiveness toparasitic wasps did not differ among evaluatedplants.

128
In this study, as in previous studies, foraginghoverflies exhibited a high degree of selectivity intheir feeding (Table 2). Based on fixed time-of-dayobservations of hoverfly feeding, clearly certainplants evaluated in this study would be better suitedas insectary plants. This approach, however,ignores differences in diurnal nectar flow amongflowering plants, a factor that could have a majorimpact on relative attractiveness based on a singleperiod of observation. Also, likely factors that couldcontribute to erroneous results are differences in
hoverfly flight behavior under windy conditions.Although they are strong flyers, under windyconditions hoverflies have difficulty landing onflowers, and lower-growing plants (such asalyssum) would experience less wind than tallerplants like yarrow or fennel. The research site at theOSU Vegetable Research Farm was usually quitewindy during the late morning (when feedingbehavior was observed) and the winds usuallywould subside in late afternoon.
Table 1. Hoverfly species present at experimental sites and associated flower hosts in 1997.
Hover fly species Locationa Flower hostb
Allograpta micrura P clEupoedes fumipennis P fnE. lapponicus P O ag phMelanostoma mellinum P clMeliscaeva cinctella P D O bk fn yrParagus variables D yrParasyrphus insolitus D agScaeva pyrastri P D phSphaerophoria sulphuripes P D O al au ca cl mu yrS. opinator P D O fn ph yrToxomerus marginatus P D O al cl phT. occidentalis P D O ag al cl fn yr
a P = Persephone Farm; D = Denison Farm; O = OSU Vegetable Research Farm.b al = alyssum; ag = agastache; au = aurinia; bk = buckwheat; ca = calendula; cl = cilantro; fn = fennel; mu= mustard; ph = phacelia; yr = yarrow.
Table 2. Mean number of adult aphidophagous hoverflies (± SEM) observed visiting flowering plants per2 min at Oregon State University Vegetable Research Farm in 1997.
DateFlower 7 June 14 July 24 July 30 July 13 Aug 21 Aug 29 Aug 2 SeptAlyssum 3.8 ± 1.0aa 3.0 ± 1.1ab 1.3 ± 1.0b 1.0 ± 0.4ab - - - -Buckwheat 3.3 ± 1.1a 3.0 ± 1.0ab - - - - - -Calendula 0.8 ± 0.5b 2.3 ± 0.8ab 0.0± 0.0c - - - - -Cilantro -b 4.0 ± 1.1a 5.3 ± 1.0a 2.0 ± 0.6a - - - -Marigold - - 0.5 ± 0.5b 0.3 ± 0.3b 0.0 ± 0.0 0.0 ± 0.0 - -Mustard 1.0 ± 0.7b 4.0 ± 0.7a - - - - - -Phacelia - - - - 1.5 ± 0.7 - - -Agastache - - - 0.0 ± 0.0 0.0 ± 0.0 0.0 ± 0.0 0.0 ± 0.0 0.0 ± 0.0Aurinia 2.0 ± 0.9ab 1.3 ± 0.5b 0.8 ± 0.5b 0.3 ± 0.3b - - - -Fennel - - - - - 0.3 ± 0.1 0.00 ± 0.00 0.3 ± 0.3Yarrow - - - 0.3 ± 0.3b 0.3 ± 0.5 0.3 ± 0.3 0.5 ± 0.2 0.3 ± 0.3
aMeans followed by different letters within a column are significantly different at a = 0.05. b Dashes indicate plant was not > 50% in bloom. c Observations with 0.00 mean and 0.00 SEM are not included in analysis.

129
On-Farm Insectary Interplanting in Broccoli
In the interplanting study, Toxomerus occidentalisand T. marginatus were the two most abundanthoverflies caught in yellow pan traps. Throughoutthe season, more T. occidentalis were caught inpan traps in the alyssum plots than in controls(p < 0.05) (Figure 1). Analysis of pan-trap catchesby date suggest that increased hoverfly activityassociated with alyssum plots extended into theadjacent field (up to 15 m) on the date of peakhoverfly catches.
Aphid sampling revealed no significant differencesamong mean estimates of aphid densities on thebroccoli; however, the overall density of aphids inthe experimental blocks was considered a ratherlow level of aphid infestation. More hoverfly eggswere found in alyssum plots than in the control plotson the second to last sampling date (p < 0.05), whenthe aphid populations had began to increase(Figure 2). The species of hoverfly eggs found onthe broccoli leaves was not identified.
Figure 1. Mean number of female T. occidentalis caught in pan traps in treatment and control plots from 22 Juneto 25 July, 1997 (bars indicate standard errors).
3.00
2.00
1.00
0.00
22 June 25 June 5 July 19 July 25 July
alyssum
cilantro
control

130
Evidence of an association between hoverfly egglaying and aphid densities suggests that egg layingdid not occur until late season, because aphidpopulations had not built up to a critical point earlier.Several published studies have documented adensity-dependent oviposition response by somehoverfly species; however, other species lay eggson the leaves independent of aphid densities. Nooviposition behavior has been reported for thehoverfly species trapped in the reported experiment.
Significantly higher numbers of parasitized aphidswere found in the alyssum plots than in either thecilantro or control plots (Figure 3), with rates ofparasitism nearly doubling. Other studies haveshown D. rapae, the parasitoid of the cabbageaphid, to be distributed widely, so the effectsdemonstrated in this study could have implicationsacross many areas.
Figure 3. The percentage of aphids parasitized by Diaeretiella rapae on broccoli leaves in treatment and control plotsfrom 25 June to 23 July 1997. (Bars indicate standard errors.)
Figure 2. Mean number of hoverfly eggs found on broccoli leaves in treatment and control plots on 16 July and 23July, 1997. (Bars indicate standard errors.)
alyssumcilantrocontrol
alyssumcilantrocontrol
Per
cent
par
asiti
zatio
nM
ean
no. o
f hov
erfly
egg
s pe
r lea
f0.60
0.50
0.40
0.30
0.20
0.10
0.00
30
25
20
5
0
5
0 25 June 1 July 8 July 16 July 23 July

131
Conclusions
This work shows clear evidence of selectivity ofpotential insectary flowers by both hoverflies andparasitic hymenoptera. Some flowers appear to bestrongly attractive to these natural enemies, somewere distinctly less attractive, and some exhibitedno attractiveness whatsoever. Interpretation ofthese data must be tempered by the limitations of asingle time-of-day sampling period which couldmiss key periods of feeding behavior by somehoverfly species. It can be concluded, however, thatinsectary plants in these trials clearly serving asfood resources for hoverflies include annualalyssum, cilantro, buckwheat, mustard, phacelia,fennel, and yarrow.
The results also reveal a differential attractionamong hoverfly species to various insectary plants.In addition, the predominant species of hoverfliesocurring in western Oregon have been identifiedand a taxonomic reference collection developed,housed in the Department of Horticulture at OSU.This collection is available to anyone interested inhoverfly identification.
In the on-farm interplanting study, there was strongevidence that annual alyssum attracted morehoverflies into the experimental plot areas andmore hoverfly eggs were laid on the broccoli plants.There was also an “alyssum” effect extending up to45 feet outside the edge of the treatment blockswhich increased numbers of hoverflies trapped.
In this trial, there was no apparent effect of theinterplanted flowers on abundance of aphids on thebroccoli plants. Aphid population levels weregenerally low throughout the experimental plots.
These experiments clearly demonstrate thepotential of insectary plantings for increasingnatural enemy abundance and behavioral response(increased egg laying and parasitism) in acommercial-scale field setting. The experimentshave not, however, shown evidence of pestreduction through the use of insectary plants.Merely increasing natural enemy abundance oreven actually increasing parasitism rates (as in thecase of increased rates of parasitism of thecabbage aphid by D. rapae in this experiment)doesn’t necessary translate to a “biologicallysignificant” level of improved pest control whichreduces or eliminates the need for insecticidalcontrol.
Acknowledgments
Special thanks are extended to personnel atPersephone Farm, Denison Farm, and StahlbushIsland Farm for their participation in this project.We also thank Christian Kassebeer for hisinvaluable taxonomic identification of hoverflies.This project was funded in part by the OregonDepartment of Agriculture Center for AppliedAgricultural Research, the Food Alliance, theOrganic Farming Research Foundation, and theUSDA Sustainable Agriculture Research andEducation Program.
Literature Cited
Baggen, L.R. and G.M. Gurr. 1998. The influence offood on Copidosoma koehleri (Hymenoptera:Encyrtidae) and the use of flowering plants as ahabitat management tool to enhance biologicalcontrol of potato moth, Phthorimaea operculella(Lepidoptera: Gelechiidae). Biological Control11:7-11.
Cowgill, S. 1989. The role of non-crop habitats onhoverfly (Diptera: Syrphidae) foraging on arableland. Brighton Crop Protection Conference. pp.1,103-1,108.
Cowgill, S.E., S.D. Wratten, and N. W. Sotherton.1993. The effect of weeds on the numbers ofhoverfly (Diptera: Syrphidae) adults and thedistribution and composition of their eggs inwinter wheat. Ann. Appl. Biol. 123:499-515.
Hickman, J. and S.D. Wratten. 1996. Use ofPhacelia tanacetifolia strips to enhancebiological control of aphids by hoverfly larvae incereal fields. J. Econ. Entomol. 89:832-840.
Jervis, M.A., N.A C. Kidd, M.G. Fitton, T.Huddleston, and H.A. Dawah. 1993. Flowervisiting by hymenopteran parasitoids. J. Nat.Hist. 27:67-106.
Kloen, H. and M. Altieri. 1990. Effect of mustard(Brassica hirta) as a non-crop plant oncompetition and insect pests in broccoli. CropProtection. 9:90-96.
Leius, K. 1967. Influence of wild flowers onparasitism of tent caterpillar and coddling moth.Can. Entomol. 99:444-446.
Lunau, K. and S. Wacht. 1994. Optical releasers ofinnate proboscis extension in the hoverflyEristalis tenax L. (Diptera: Syrphidae). J. Comp.Physiol. 174:575-579.

132
Schneider, F. 1948. Beitrag zur Kenntnis derGenerationsverhaltnisse und Diapauserauberischer Schwebfliegen. Mit. Schweiz.Entomol Ges. 21:249-285.
White, A.J., S.D. Wratten, N.A. Berry, and U.Weigmann. 1995. Habitat manipulation toenhance biological control of brassica pests byhoverflies (Diptera: Syrphidae). J. Econ.Entomol. 88:1,171-1,176.
133
Objectives
1. Identify broadleaf plants with pollen andnectar attractive to a variety of beneficialinsects, which can establish well after fallseeding and begin to flower early the nextspring.
2. Establish replicated plots of these plants,alone and in a mix, for the purpose ofobserving growth and managementcharacteristics.
3. Identify the various insects attracted to eachplant.
Ultimate goal
Find a well adapted, easily grown cover cropmix which would host sufficient population ofbeneficial insects/mites for natural suppressionof twospotted spider mite and orange tortrixpopulations in raspberry.
Progress
Plots of the following plants were seeded andirrigated on September 23, 1997 at NorthWillamette Experiment Station (NWREC): Achilleasp. (yarrow); Hesperis matronolis L. (dame’srocket); Cherianthus allonii (wallflower); Phaceliatanecetifolia; Carum carvi (caraway); Avena sativa(Amity oat); and a mixture of all six. Germination,establishment, weediness, winter survival, and timeof flowering were monitored. Insects werevacuumed from blooms on sunny afternoons (noonto 2:00 pm) from early April to early June.
With the exception of the achillea and oats, all plotsbecame quite weedy. Wallflower was the first toflower (early April through May), followed byhesperis (mid-April through May), phacelia (late-April through May), ‘Amity’ oat (mid-May throughmid-June), and achillea (early June throughSeptember).
Evaluation of Potential Fall-Seeded Cover Crops for Weed Suppressionand Beneficial Insect Habitat
D. Kaufman,1 G. Koskela,1 L. Royce2
1North Willamette Experiment Station2Oregon State University
Insects were vacuumed from blossoms, identified,and classified as being potentially harmful, benign,or potentially beneficial. Because parasitic waspsare of special interest as potential biocontrol agentsof the orange tortrix, parasitic wasps were identifiedto family. Dogfennel (Anthemis cotula L.) and hairyvetch (Vicia villosa Roth) were the primary weeds inall plots. Blossoms from these weeds also werevacuumed and associated insects identified.Because of time constraints, June 9 was the lastsampling date; therefore, insect counts are basedon five sampling dates in the oats and dogfennel,two sampling dates in the vetch, and one samplingdate in the achillea. A summary of all insectsretrieved appears below.
Potentially harmful insects most often associatedwith the cover crops were leafhoppers, aphids, andplant bugs. Of the plants evaluated in this trial, the‘Amity’ oat appeared particularly attractive toleafhoppers, and phacelia appeared most attractiveto plant bugs. Benign insects most often associatedwith the cover crops included flies (mostly long-legged), midges, fungus beetles, fungus gnats, andseed beetles. A total of 36 braconid and26 ichneumonid wasps were recovered from ninesample dates in Cherianthus, with the highestproportion recovered in early May. In all, 65 bra-conid and 24 ichneumonid wasps were recoveredfrom 11 sample dates in Hesperis, with the highestproportion recovered in early-mid-May. ThePhacelia drew a great number of bees and alsoappeared more attractive to syrphid flies than theother plants. A total of 23 braconid, 10 ichneumonid,and 25 chalcid wasps were recovered from fivesample dates in ‘amity’ oat. The dogfennelappeared attractive to ground beetles andichneumonids. Because Achillea did not flower untilJune, it was only sampled once. However,observations during the summer showed consider-able insect activity, and achillea is reported to beattractive to parasitic wasps and syrphid flies.

134
Insects Associated with Flowering Cover Crops, NWREC, 1998
Plant Potentially Harmful Benign Potentially Beneficial
Cherianthus leafhoppers 93 flies* braconids 36 (5/4 18) 4/20-6/9 aphids 60 midges ichneumonids 26 (5/4 9) 9 sample plant bugs 15 fungus beetles chalcids 3 (all on 6/1) dates thrips 15 seed beetles ladybird beetles 6; spiders 10;
cucumber beetles 3 ground beetles 25; bees 24;lacewings 6
Hesperis leafhoppers 134 flies braconids 65 (5/6 34) 4/20-6/9 aphids 86 fungus gnats ichneumonids 24 (4/20-5/28) 11 sample plant bugs 22 fungus beetles chalcids 4; other hymenoptera 1; dates thrips 14 midges ladybird beetles 6; spiders 26;
ground beetles 19; bees 28
Phacelia plant bugs 84 flies braconids 22 (5/4 13) 4/30-6/9 leafhoppers 66 fungus beetles ichneumonids 6 8 sample aphids 47 midges chalcids 2; other hymenoptera 2 dates ladybird beetles 3; spiders 20;
ground beetles 25; bees 72;syrphid flies 9; lacewings 1;soldier beetle 1
‘Amity’ oat leafhoppers 265 midges braconids 23 5/26-6/9 aphids 84 flies ichneumonids 10 5 sample plant bugs 13 fungus gnats chalcids 25; other hymenoptera 6; dates thrips 18 fungus beetles ladybird beetle 5; spiders 16;
ground beetles 3; bees 10
Dogfennel leafhoppers 30 flies braconids 5 5/18-6/3 aphids 17 fungus beetles ichneumonids 24 (5/26 & 5/28) 5 sample plant bugs 9 midges ladybird beetles 3; spiders 4; dates cucumber beetles 4 ground beetles 54; bees 26
lacewing 1
Hairy vetch leafhoppers 27 flies braconids 9 5/26 & 5/21 plant bugs 7 seed beetles ichneumonids 2 2 sample thrips 17 fungus beetles ground beetles 3; bees 15; dates aphids 3 midges spiders 2
Achillea6/9 syrphid fly 1; spiders 7;
ground beetle 1; bees 1
*flies = mostly long legged fliesbees are a total of halictid, bumble, and honeybees
135
Introduction
Clubroot disease (caused by Plasmodiophorabrassicae) is one of the most serious soil-bornediseases of cruciferous vegetable crops in thePacific Northwest. It occurs in most of the majorcrucifer growing regions and is a serious threat tofresh market and processing industries. Further-more, soil-borne diseases like clubroot(Plasmodiophora brassicae) and soft rot(Sclerotinia sclerotiorum) force growers to avoidgrowing cruciferous crops on the same land onceinfested. For example, the considerable longevityof clubroot disease pathogen (resting spores of P.brassicae) in the soil (18 or more years) means thatthe major effect is often one of restricting theflexibility of crop rotations, as contaminated landcannot be used for cruciferous crops for fear ofincreasing the inoculum to grossly damaging levels.With the reduction in number of registeredpesticides that are effective in vegetables, growersare under pressure to find economic alternatives tomanage these pests.
Meadowfoam, Limnanthes alba, is a herbaceouswinter-spring annual, grown as a commercialoilseed crop in the Willamette Valley of Oregon. Itsunique oil consists almost entirely of long-chainfatty acids which are used in the manufacture oflubricants, plastics, and cosmetics (Kleiman andPrincen, 1991; Seddigh and Jolliff, 1994; Savonen,1997). Meadowfoam also has become a valuablerotation crop for grass seed growers. As arotational crop, meadowfoam allows for a “restingperiod” on heavily cropped soils, is an alternative tofield burning, and has become an important tool inseed certification programs (O. Gutbrod, OSUSeed Certification, personal communication). Theseedmeal remaining after oil extraction typicallywas discarded.
Limnanthes species produce large amounts ofsecondary metabolites such as glucosinolates andphytoecdysteroids, which have allelochemicalactivity. Glucosinolate degradation products havebeen shown to be potent biocides (Baratelt and
Field Evaluations of Meadowfoam Seedmeal to Control ClubrootDisease (Plasmodiophora brassicae) in Cruciferous Crops
W. Deuel and S. SvensonOregon State University
North Willamette Research and Extension CenterAurora, OR
Mikolajczak, 1989; Brown et al., 1991; Gamliel andStapleton, 1983; Delaquis and Mazza, 1995).Glucosinolate products also have been shown toinfluence bacterial and fungal populations (Brownand Morra, 1997). Use of glucosinolate-containingplants as green manures or soil amendments tosuppress weeds and soil-borne pathogens mayprovide alternatives to soil fumigants such asmethyl bromide (Vaughn, 1999).
Experiments conducted in greenhouses atNorthwest Transplants, Molalla, Oregon, andOregon State University (OSU) in 1998 examinedthe effect of meadowfoam residues (seedmeal andscreenings) for controlling clubroot disease incauliflower and Chinese mustard grown in pots(Deuel and Svenson, 1999). All treatments withmeadowfoam residue incorporations resulted in100 percent control of clubroot, compared to 70 to90 percent disease presence (clubbing of rootsystem) in controls for both plant species. Inaddition to complete control of clubroot, treatmentscontaining low rates of meadowfoam resulted intaller plants. The potential of meadowfoamseedmeal (MSM) for controlling clubroot ofcauliflower and mustard was examined in field trialsduring the summer/fall growing season of 1999.
Materials and Methods
Two field trials were conducted during the summer/fall (August-November) growing season of 1999.Each trial was a completely randomized blockdesign of nine replicate plots 8 m x 1.6 m (threerows per plot). Both trials were conducted at a sitenaturally infested with clubroot on crucifer growingproperty of Big “B” Farms, Aurora, Oregon.Meadowfoam treated plots were prepared by hand,spreading dry seedmeal uniformly within designatedplots at rates of 15,000 and 30,000 kg ha-1 followedby tiller cultivation for incorporation at 20 to 30 cmdepth. All plots were irrigated and allowed to standfallow for a 10 day “activation period.” Cauliflowerseedlings (Brassica oleracea var. botrytis ‘Snowball
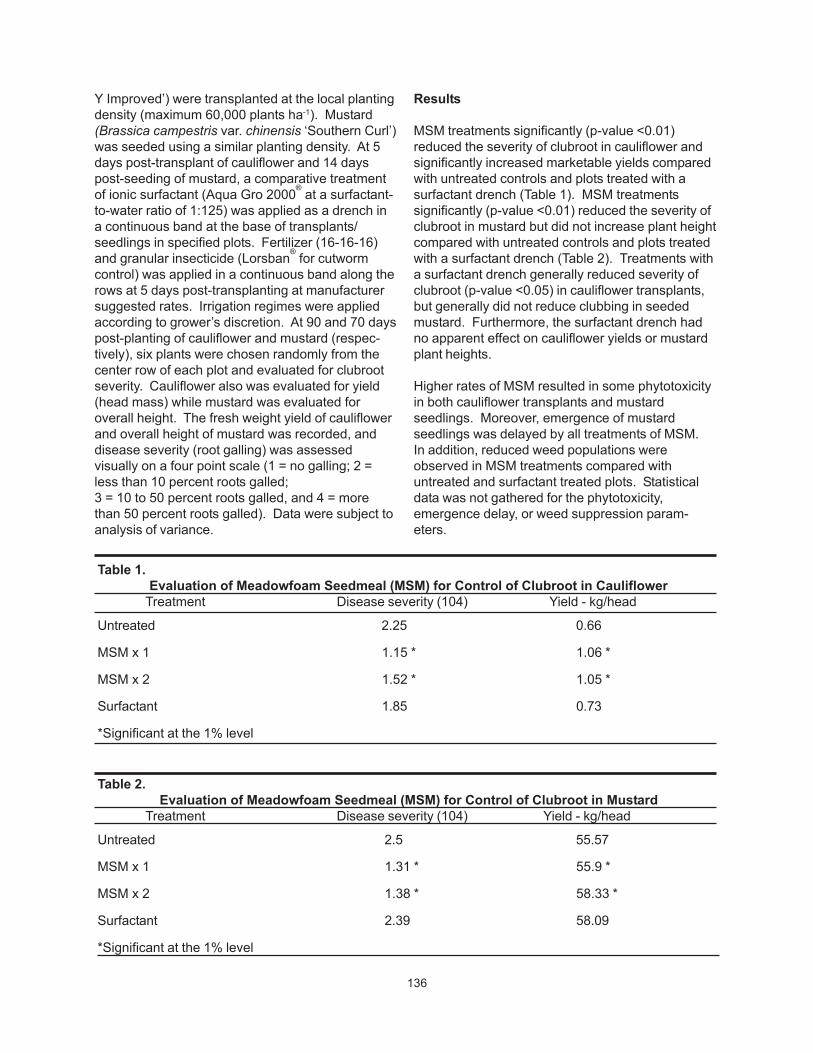
136
Y Improved’) were transplanted at the local plantingdensity (maximum 60,000 plants ha-1). Mustard(Brassica campestris var. chinensis ‘Southern Curl’)was seeded using a similar planting density. At 5days post-transplant of cauliflower and 14 dayspost-seeding of mustard, a comparative treatmentof ionic surfactant (Aqua Gro 2000® at a surfactant-to-water ratio of 1:125) was applied as a drench ina continuous band at the base of transplants/seedlings in specified plots. Fertilizer (16-16-16)and granular insecticide (Lorsban® for cutwormcontrol) was applied in a continuous band along therows at 5 days post-transplanting at manufacturersuggested rates. Irrigation regimes were appliedaccording to grower’s discretion. At 90 and 70 dayspost-planting of cauliflower and mustard (respec-tively), six plants were chosen randomly from thecenter row of each plot and evaluated for clubrootseverity. Cauliflower also was evaluated for yield(head mass) while mustard was evaluated foroverall height. The fresh weight yield of cauliflowerand overall height of mustard was recorded, anddisease severity (root galling) was assessedvisually on a four point scale (1 = no galling; 2 =less than 10 percent roots galled;3 = 10 to 50 percent roots galled, and 4 = morethan 50 percent roots galled). Data were subject toanalysis of variance.
Results
MSM treatments significantly (p-value <0.01)reduced the severity of clubroot in cauliflower andsignificantly increased marketable yields comparedwith untreated controls and plots treated with asurfactant drench (Table 1). MSM treatmentssignificantly (p-value <0.01) reduced the severity ofclubroot in mustard but did not increase plant heightcompared with untreated controls and plots treatedwith a surfactant drench (Table 2). Treatments witha surfactant drench generally reduced severity ofclubroot (p-value <0.05) in cauliflower transplants,but generally did not reduce clubbing in seededmustard. Furthermore, the surfactant drench hadno apparent effect on cauliflower yields or mustardplant heights.
Higher rates of MSM resulted in some phytotoxicityin both cauliflower transplants and mustardseedlings. Moreover, emergence of mustardseedlings was delayed by all treatments of MSM.In addition, reduced weed populations wereobserved in MSM treatments compared withuntreated and surfactant treated plots. Statisticaldata was not gathered for the phytotoxicity,emergence delay, or weed suppression param-eters.
Table 1.Evaluation of Meadowfoam Seedmeal (MSM) for Control of Clubroot in Cauliflower
Treatment Disease severity (104) Yield - kg/head
Untreated 2.25 0.66
MSM x 1 1.15 * 1.06 *
MSM x 2 1.52 * 1.05 *
Surfactant 1.85 0.73
*Significant at the 1% level
Table 2.Evaluation of Meadowfoam Seedmeal (MSM) for Control of Clubroot in Mustard
Treatment Disease severity (104) Yield - kg/head
Untreated 2.5 55.57
MSM x 1 1.31 * 55.9 *
MSM x 2 1.38 * 58.33 *
Surfactant 2.39 58.09
*Significant at the 1% level

137
Discussion
The potential of MSM treatments to reduce theseverity of clubroot in cauliflower and mustard wasdemonstrated in these trials. In addition, market-able yield of cauliflower was increased significantlywith MSM treatments. A comparative treatment ofsurfactant drench generally reduced severity ofclubroot in cauliflower transplants but had minimaleffect on clubbing of seeded mustard. The efficacyof a surfactant drench applied to a transplantcompared to a seeding may be a determining factorfor clubroot suppression. There were no significantdifferences between rates of MSM on clubrootseverity, plant height, or yield. However, the higherrate of MSM resulted in greater phytotoxicity anddelay of mustard seedling emergence (data notshown). Further field trials using reduced rates ofMSM should be conducted to determine optimalrates for avoiding phytotoxic effects in desired cropwhile providing maximum control of clubroot.
Clubroot (caused by Plasmodiophora brassica) is acomplex and difficult disease to culture and/ormaintain in a controlled environment. Thus, thecomplexity of this disease limits our understandingof factors controlling disease severity. Differencesin glucosinolate patterns between susceptible andresistant crop varieties are thought to play animportant role in host-pathogen interactions(Ludwig-Muller et al., 1997; Mithen et al., 1996).We suspect pre-plant stimulation (fungistasis) ofthe pathogen resting spores by glucosinolateproducts present in the meadowfoam residue asthe primary control mechanism. Discovery of aplant exudate mimic that effects fungistasis in amajor plant disease pathogen has far reachingimplications. However, further investigation isneeded to determine the factor(s) in MSMresponsible for reduced severity of clubroot.
The high rates of MSM used in these trials mayrepresent a cost prohibitive control of clubroot.Furthermore, the use of meadowfoam as a covercrop and/or green manure to obtain similar controlof clubroot is currently unknown. In manycruciferous production systems, few growers usegreen manure crops prior to planting cole crops inthe spring. Most sites are left fallow during thewinter. Growers and processors alike have voicedconcern over this present situation and are alsobecoming increasingly interested in findingsustainable systems that have additional benefits,such as those that improve soil tilth, increase
yields, and reduce pests. Meadowfoam covercrops and seedmeal applications show greatpromise as cost effective weed management toolsin many agriculturally important crops, and mayoffer additional benefits such as increased soilnutrients, plus suppression of insects, slugs,nematodes, bacterial pathogens, and other soil-borne organisms. The use of meadowfoam covercrops, green manures, defatted seedmealapplications, or in combination within multiplecommodities, also could minimize syntheticpesticide use, reduce the associated potential forenvironmental contamination, and contribute tosustainable agricultural production systems on alarge scale.
Acknowledgments
Funding for this project by the Oregon ProcessedVegetable Commission, Integrated Plant ProtectionCenter (IPPC), OMG/Natural Plant Products andvoluntary contributions/“in-kind” donations providedby Northwest Transplants and Big “B” Farms isacknowledged gratefully. Furthermore, we greatlyappreciate the wisdom and suggestions of NealLucht, Frank Battilega, and Bob McReynolds, andwish to acknowledge gratefully the assistance ofEvan Wilson, Allison Henderson, Cathy Sanford,Paula Little, Heidi Williams, and Monique Szedelyi.
Literature Cited
Bartelt, R.J. and K.L. Mikolajczak. 1989. Toxicity ofcompounds derived from Limnanthes alba seedto fall armyworm (Lepidoptera: Noctuidae) andEuropean corn borer (Lepidoptera: Pyralidae)larvae. Journal of Econ. Entomol. 82:1054-1060.
Brown, P.D. and M.J. Morra. 1997. Control of soil-borne plant pests using glucosinolate-containing plants. Advances in Agronomy, 61:167-229.
Brown, P.D., M.J. Morra, J.P. McCaffrey, D.L. Auld,and L. Williams III. 1991. Allelochemicalsproduced during glucosinolate degradation insoil. J. Chem. Ecol. 17:2021-2034.
Delaquis, P.J. and G. Mazza. 1995. Antimicrobialproperties of isothiocyanates in food preserva-tion. Food Technol. 49:73-84.
Deuel, W.A. and S.E. Svenson. 1999. Control ofclubroot on Chinese mustard and cauliflowerusing meadowfoam (Limnanthes alba) seedmeal or screenings. HortScience 34(3):473.

138
Gamliel, A. and J.J. Stapleton. 1983. Characteriza-tion of antifungal volatile compounds evolvedfrom solarized soil amended with cabbageresidues. Phytopathology 83:899-905.
Gutbrod, O. 1999. Personal communication.Oregon State Seed Certification Program.
Kleiman, R. and L.J. Princen. 1991. New industrialoilseed crops. pp. 127-132. In T.J. Applewhite(ed.). Proceedings, World Conference onOleochemicals into the 21st Century. AmericanOil Chemist’s Society, Champaign, Illinois.
Ludwig-Muller, J., B. Schubert, K. Pieper, S. Ihmig,and W. Hilenberg. 1997. Glucosinolatecontent in susceptible and resistant Chinesecabbage varieties during development ofclubroot disease, Phytochemistry, Vol. 44, No.3, pp. 407-414.
Mithen, R.F., H. Buhariwalla, and R. Magrath.1996. Advances in the study of the biology of
Plasmodiophora brassicae, Acta Hort. 407:385-391.
Savonen, C. 1997. Thar she grows. Oregon’sAgriculture Progress. 44(1):8-13.
Seddigh, M. and G.D. Jolliff. 1994. Pre-inductionage and post-induction temperature effects onmeadowfoam flowering. Crop Sci. 34:503-508.
Vaughn, S.F. 1999. Glucosinolates as naturalproducts (book chapter). Biologically activenatural products, CRC Press, Boca Raton, FL.pp. 81-91.

139
This research was funded, in part, by grants fromOregon Association of Nurseryman and NorthwestNursery Crops Research Center (USDA).
Introduction
Mites in the Tetranychidae, Eriophyidae, andTarsonemidae are major pests of commercialornamental nurseries. Historically, ornamentalproducers have relied on chemical applications tosuppress pest mites in these high-value plants(Brushwein, 1991; Mizell and Short, 1992). Analternative to chemical control of pest mites is theintroduction of predaceous mites (Phytoseiidae)into nursery crops. Recent studies have evaluatedthe use of Neoseiulus fallacis (Garman) to controlpest mites on ornamentals and have demonstratedthat inoculative releases can reduce populations tothe extent of eliminating miticide applications (Prattand Croft, 1999; Pratt and Croft, 1998).
Unfortunately, only limited attention has been givento identifying methods of releasing predatory mitesinto nursery systems. Although other methodsoccasionally have been used (McMullin, 1995),introduction of predatory mites usually consists ofpurchasing predators and distributing them, byhand, into infested foliage (Pratt, personal observa-tion). This procedure can be labor intensive andexpensive, especially when multiple releases perseason are required (Cashion et al., 1994;Brushwein, 1991). In addition, improper timing ofreleases has been implicated in many biologicalcontrol failures (Stiling, 1993; Beirne, 1975). Inornamental systems, releases of predatory mites inthe absence of prey might result in starvation of thepredator, and release of predators in abundance ofprey might cause unacceptable damage on theornamental crop.
Ramakers and Voet (1996) described an alternativemethod of rearing and dispersing predatory mitesfrom banker plants in greenhouse systems. Bankerplants are any plant addition that aids in develop-ment and dispersal of predators for control ofherbivorous pests. In castor bean banker plants,predatory mites fed on pollen and extrafloral
nectaries and dispersed from the host plants toother plants, suppressing pests such as thrips andspider mites for several months. To our knowledge,banker plants have not been evaluated for produc-tion and release of predatory mites in outdoorornamental plants.
Banker Plant Concepts
To give perspective to our research, it is importantto describe a “banker plant system.” The threebasic components are the predatory mite, thebanker plant and the prey or alternative food. Eachis dependent and influences the others in complexways (Fig. 1).
The PredatorDoes the predator suppress the pest in the
nursery crop? The ultimate objective is to controlspider mites in ornamental crops. Thus, the initialcriteria for selecting a predatory mite must be that itresponds and can suppress the spider mite pest inthe crop(s) of interest. Initial tests of predator-cropplant interactions must be conducted prior toincorporating a predator into a banker plant system.
Is the predator oligophagous? Preferably, theprey or the alternative food on the banker plant willbe different than the mite pest that feeds on theornamental crop. Thus, phytoseiid predatorspossessing a wide prey or food range might bemore easily integrated into a banker plant system(Pratt et al., 1999).
Will the predator numerically respond to theprey or alternate food in the banker plant? Thebanker plant and associated foods can potentiallyserve as a rearing unit for the predatory mite.Therefore, initial inoculations of the predator intothe banker plant system might be quite low if thepredator numerically responds greatly to the prey oralternate foods. The extent of onsite rearing of thepredatory mite often will reduce the costs of pur-chasing, transporting, and dispersing the predatorsappreciably.
Will the predator remain on the banker plant?Most arthropods are influenced by substrate types.For instance, predatory mites are affected by leaf
Banker Plants: Strategies for Release of Predaceous Mites to Control Spider Mitesin Outdoor Ornamental Nurseries
P.D. Pratt and B.A. CroftDepartment of Entomology, Oregon State University
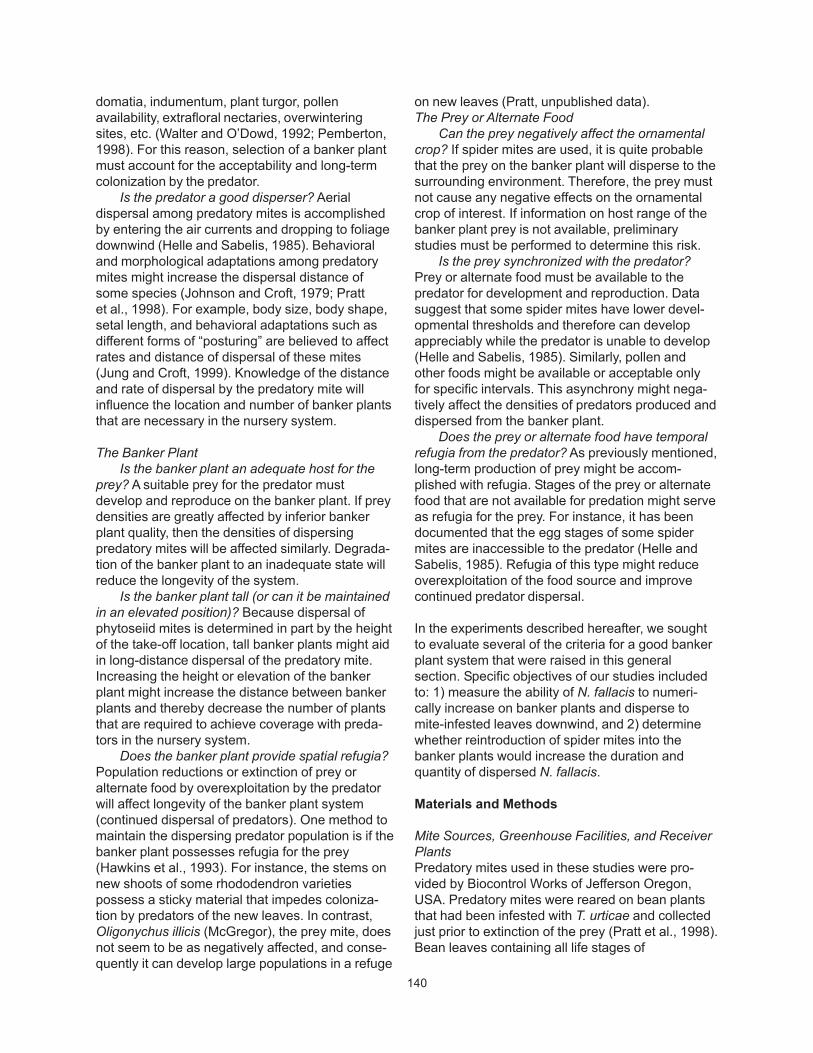
140
domatia, indumentum, plant turgor, pollenavailability, extrafloral nectaries, overwinteringsites, etc. (Walter and O’Dowd, 1992; Pemberton,1998). For this reason, selection of a banker plantmust account for the acceptability and long-termcolonization by the predator.
Is the predator a good disperser? Aerialdispersal among predatory mites is accomplishedby entering the air currents and dropping to foliagedownwind (Helle and Sabelis, 1985). Behavioraland morphological adaptations among predatorymites might increase the dispersal distance ofsome species (Johnson and Croft, 1979; Prattet al., 1998). For example, body size, body shape,setal length, and behavioral adaptations such asdifferent forms of “posturing” are believed to affectrates and distance of dispersal of these mites(Jung and Croft, 1999). Knowledge of the distanceand rate of dispersal by the predatory mite willinfluence the location and number of banker plantsthat are necessary in the nursery system.
The Banker PlantIs the banker plant an adequate host for the
prey? A suitable prey for the predator mustdevelop and reproduce on the banker plant. If preydensities are greatly affected by inferior bankerplant quality, then the densities of dispersingpredatory mites will be affected similarly. Degrada-tion of the banker plant to an inadequate state willreduce the longevity of the system.
Is the banker plant tall (or can it be maintainedin an elevated position)? Because dispersal ofphytoseiid mites is determined in part by the heightof the take-off location, tall banker plants might aidin long-distance dispersal of the predatory mite.Increasing the height or elevation of the bankerplant might increase the distance between bankerplants and thereby decrease the number of plantsthat are required to achieve coverage with preda-tors in the nursery system.
Does the banker plant provide spatial refugia?Population reductions or extinction of prey oralternate food by overexploitation by the predatorwill affect longevity of the banker plant system(continued dispersal of predators). One method tomaintain the dispersing predator population is if thebanker plant possesses refugia for the prey(Hawkins et al., 1993). For instance, the stems onnew shoots of some rhododendron varietiespossess a sticky material that impedes coloniza-tion by predators of the new leaves. In contrast,Oligonychus illicis (McGregor), the prey mite, doesnot seem to be as negatively affected, and conse-quently it can develop large populations in a refuge
on new leaves (Pratt, unpublished data).The Prey or Alternate Food
Can the prey negatively affect the ornamentalcrop? If spider mites are used, it is quite probablethat the prey on the banker plant will disperse to thesurrounding environment. Therefore, the prey mustnot cause any negative effects on the ornamentalcrop of interest. If information on host range of thebanker plant prey is not available, preliminarystudies must be performed to determine this risk.
Is the prey synchronized with the predator?Prey or alternate food must be available to thepredator for development and reproduction. Datasuggest that some spider mites have lower devel-opmental thresholds and therefore can developappreciably while the predator is unable to develop(Helle and Sabelis, 1985). Similarly, pollen andother foods might be available or acceptable onlyfor specific intervals. This asynchrony might nega-tively affect the densities of predators produced anddispersed from the banker plant.
Does the prey or alternate food have temporalrefugia from the predator? As previously mentioned,long-term production of prey might be accom-plished with refugia. Stages of the prey or alternatefood that are not available for predation might serveas refugia for the prey. For instance, it has beendocumented that the egg stages of some spidermites are inaccessible to the predator (Helle andSabelis, 1985). Refugia of this type might reduceoverexploitation of the food source and improvecontinued predator dispersal.
In the experiments described hereafter, we soughtto evaluate several of the criteria for a good bankerplant system that were raised in this generalsection. Specific objectives of our studies includedto: 1) measure the ability of N. fallacis to numeri-cally increase on banker plants and disperse tomite-infested leaves downwind, and 2) determinewhether reintroduction of spider mites into thebanker plants would increase the duration andquantity of dispersed N. fallacis.
Materials and Methods
Mite Sources, Greenhouse Facilities, and ReceiverPlantsPredatory mites used in these studies were pro-vided by Biocontrol Works of Jefferson Oregon,USA. Predatory mites were reared on bean plantsthat had been infested with T. urticae and collectedjust prior to extinction of the prey (Pratt et al., 1998).Bean leaves containing all life stages of

141
N. fallacis and a few individuals of T. urticae wereplaced in the canopy of each respective bankerplant at rates described below. The prey mites,including Oligonychus illicis (McGregor) andO. ununguis (Jacobi), were collected in mid Mayfrom field-grown ornamental plants. T. urticae wastaken from a laboratory culture that was periodi-cally mixed with field-collected specimens.
In the initial three studies, a pair of identical10 x 4 m greenhouse rooms with internal condi-tions of 26:21 (±10) ºC (D:N), photoperiod16:8 (L:D) h, and 75% (±10) R.H. were used. Four1 x 3 m benches were placed 1.5 m apart in eachof the greenhouse rooms. A 1.5-m-high muslincurtain was hung above each bench so that thecurtain created two isolated cubicles(1 x 1.5 x 1.5) on top of each bench. The bottom10 cm of the curtains rested in a 10-cm-deepwater moat within the benches, thus saturatingthe 4 muslin walls of each cubicle with water. Afan, placed against one of the walls of eachcubicle, produced wind speeds of approximately2.4 m/s .
Receiver plants consisted of a dense canopy oflima bean (Phaseolus lunatus L.) leaves coveringa circular area of 0.3 m diam (±5 cm) each. Thesereceiver plants were designed to catch predatorymites as they dispersed from banker plants (Prattet al., 1998). To make the receiver plants, a totalof 55 (±3) seeds were planted into a polyethylenebag (30 cm diam) that was filled with a pottingmixture of pumice, sand, peat moss, and soil(2:1:1:1) (Strong and Croft, 1995). Seeds germi-nated in 1 week, and 1 week later each leaf ofeach plant was inoculated with50-100 mixed life stages of T. urticae.
Dispersal from Banker Plants and Reintroductionof PreyTo determine whether the predator N. fallaciswould numerically respond to prey on a bankerplant and disperse downwind to receiver plants,we used the greenhouse system as describedabove. Sixteen arborvitae plants (Thujaoccidentalis ‘Pyramidalis’; height: 1 m ±5 cm,diam: 23 cm ±3 cm, potted in 3.8 L plastic con-tainers) were inoculated with 2,000 (±150)O. ununguis, and 30 days later populations hadincreased to 450 (±23) spider mites (all stages)per 6 cm terminal. Two arborvitae (placed in closeproximity to each other) and three receiver plantswere randomly assigned each of eight cubiclesthat served as replicate environmental units. The
arborvitae banker plants were placed in the trajec-tory of the wind between the fan and the receiverplants. The lateral distance separating the fan andthe receiver plants from the banker plants was30 cm. Five hundred mixed life stages of N. fallaciswere inoculated into each of the banker plants.Leaves of the receiver plants were viewed every dayfor 37 days, and the number of predatory mitesfound in receiver plants per replicate was recorded.When predatory mites were found on leaves of thereceiver plants, the leaf was excised and taken outof the greenhouse. Receiver plants were sufficientlydense with bean leaves that vacant areas in thecanopy were not created by destructive sampling.Because of possible oviposition from a few dispers-ing female predators that were not removed insampling, receiver plants were replaced every5 days (minimum development time of predator fromegg to adult; Pratt et al., 1998). Life stages ofdispersing N. fallacis were only recorded1 day after receiver plants were replaced. Relativedensities of predator and spider mites on eachbanker plant were estimated by removing theterminal 6 cm of foliage from three randomlyselected branches each week and recording mitesunder a 40X microscope.
Eight rhododendron plants (‘Ana Krushke’;height: 0.5 m ±6 cm, diam: 30 cm ±5 cm, 3.8 Lplastic containers, and 45 (±6) leaves per plant)were inoculated with ca. 500 O. illicis, and 30 dayslater populations had increased to 125 (±32) perleaf. Two plants were randomly placed in each of4 cubicles, as explained above, and 250 predatorymites (of all life stages) were released onto eachrhododendron. Sampling and replacement ofreceiver plants were preformed as in the arborvitaestudy. Relative densities of predatory and spidermites on the rhododendrons were estimated byscanning five randomly selected leaves on eachplant once a week under a 40X microscope.
Without the presence of any alternative foods suchas pollen or plant fluids, N. fallacis is dependent onspider mite prey for continued reproduction anddevelopment (McMurtry and Croft, 1997; Croft et al.,1998). For this reason, we suspected that dispersalof N. fallacis individuals into receiver plants would beminimal at the onset of the experiment, increase aspredators depleted the prey source, and would againdecline as prey were driven to extinction. Wequestioned whether the number and interval ofN. fallacis dispersants could be extended by reintro-ducing prey. We randomly selected 4 arborvitae

142
banker plants from the previous study andreinoculated each with ca. 50,000 T. urticae (mixedlife stages) 21 days after release of N. fallacis intothe banker plant. Reinoculation was accomplishedby placing spider-mite-infested bean leaves(P. lunatus) directly into the arborvitae foliage.Dispersal of N. fallacis from reinoculated bankerplants to receiver plants was compared to that of theremaining four untreated banker plants.
Statistical Analysis
Repeated measures analysis of variance (ANOVA)was used to compare the dispersants recovered inreceiver plants over time (von Ende, 1993). TheHuynn-Feldt adjustment was used when the covari-ance matrix of the data did not meet the assumptionof sphericity (SAS Institute, 1990). The dispersalindex was calculated by dividing the number ofindividuals dispersed per day by the total number ofN. fallacis inoculated into the system.
Results
Dispersal from Banker Plants andReintroduction of PreyIn tests run in replicated greenhouse cubicles, anaverage of 25 (± 6.08) N. fallacis individuals dis-persed from arborvitae banker plants into receiverplants on day 7, and 10 days later the averageincreased to 180 (±12.77) (Fig. 2). The number ofN. fallacis found in receiver plants decreased to18 (±4.83) over the next 5 days, and the cumulativenumber of dispersed individuals over the first21 days was 1,620 (±8.09). The dispersal index was0.02 or greater for days 7-21. After reintroduction ofspider mites into arborvitae banker plants on day 21,a 5-day decrease in dispersal of N. fallacis occurred,which was followed by a second dispersal event,peaking at 66 (±5.15) individuals. In the bankerplants where spider mites were reintroduced, thedispersal index was 0.02 or greater for8 days as compared to 3 days for the control. Whencompared with a repeated measures ANOVA, thereintroduction of T. urticae into the arborvitae bankerplants significantly increased the number ofN. fallacis found in receiver plants as compared tothe control (P=0.023, F= 41.89, df=1).
The number of dispersing immatures seemed toincrease over time, but in a delayed way comparedto the adult females (Fig. 2). Less than 1 percent ofthe total population of dispersing N. fallacis wereimmatures in the first 10 days of the experiment(Fig. 14). As the prey density decreased in the
arborvitae banker plants during the next 10 days,the proportion of immatures dispersing increasedto 75 percent of the total mites collected inreceiver plants.
The number of N. fallacis dispersing from rhodo-dendron banker plants into the receiver plants insmall greenhouse cubicles increased to 27 (±4.58) individuals on day 15 and remained above20 individuals dispersed for 4 days (Fig. 3). Thecumulative number of N. fallacis dispersed fromrhododendron plants during the entire study was368 (± 10.30). The dispersal index was 0.02 orgreater for days 12-25. During this study, new plantgrowth developed and was determined to beunsuitable for N. fallacis due to the sticky sub-stance on the branches and leaves. This sub-stance slowly deteriorated and on day 28 spidermites were found on the new growth of the rhodo-dendron. Predators were not found on this newgrowth.
Again, the ratio of immatures to adult femalesdispersing from rhododendron plants increasedover time (Fig. 3). When prey densities were highin the banker plants in weeks 1 and 2, only4 percent of the dispersants were immatures. Asprey densities decreased in banker plants onweeks 3 and 4, 81 percent of the predators foundin receiver plants were immatures.
Discussion
The inoculation of N. fallacis into spider-mite-infested arborvitae and rhododendron bankerplants resulted in an increase of predatory mitesand dispersal of biological control agents to spider-mite-infested plants downwind. With respect torearing of predators, approximately 1,000 more N.fallacis were collected fromreceiver plants than were initially inoculated intoarborvitae banker plants. These increases inpredators produced are conservative whenconsidering that some individuals might have beenlost in water or muslin barriers. In addition, >5 N.fallacis per day dispersed from arborvitae andrhododendron plants for 28 and 13 days, respec-tively. This long period of predatory mite releaseinto plants might aid in synchronization of predator-prey interactions for control of spider mites.
The reintroduction of prey into the arborvitaebanker plant increased the dispersal duration of

143
N. fallacis (Fig. 2). Further field studies are neededto determine whether reinoculation of spider mitesis necessary or whether repeated introductions ofspider mites or alternate food might create aperpetual, season-long banker plant. Also ofinterest was the 5-day reduction in dispersal ofN. fallacis directly after reintroduction of spidermites. Possibly, starving N. fallacis stoppeddispersing in response to spider-mite-induced plantvolatiles, or the physical presence of prey mighthave caused them to start feeding again and stopdispersing (Sabelis, 1985; Maeda et al., 1998).Neoseiulus fallacis also has been shown todevelop and reproduce when held with pollen andother alternative foods (Pratt et al., 1999; Zhangand Li, 1989). Addition of pollen might increase thenumber and duration of N. fallacis in the bankerplant similarly as when spider mites were added.
Immatures of N. fallacis seemed to increase theirrate of movement from plants as spider mite preydecreased in banker plants. These studies in asmall cubicle with a short distance between thebanker plants and receiver unit do not distinguishbetween active dispersal and dislodgment ofimmatures from the plant substrate. Immaturestages become more active in searching for foodas prey levels decrease and subsequently mighthave higher rates of dislodgment from the bankerplant. This explanation is consistent with within-plant movement studies of N. fallacis immatures(Croft et al., 1995). Another possible explanation,but a less likely one, is that immatures might enteran active aerial dispersal phase, similar to that ofthe adult females.
Integration of a banker plant system into anornamental nursery operation is a site-specificphenomenon. Although similarities exist among allsuch systems, each nursery facility has a uniqueset of factors that must be considered. Forinstance, the ornamental crops for which control isneeded, cultural practices, and physical layoutmust be considered in the banker plant design.One attribute of banker plants that is highly desir-able is plant mobility. By producing the bankerplants in plastic containers, the system can beredistributed spatially or elevated to increase long-range dispersal of the natural enemy. Also, mobilityof the banker plants might allow them to beremoved from direct application of fertilizers orharmful pesticides (Croft, 1990). Banker plantsalso can be developed from existing hedgerows
within the ornamental production facility. Variouscommercial nurseries have arborvitae surroundingportions of the production site, and, assumingthese hedgerows contain spruce spider mites,N. fallacis can be inoculated into the hedgerow.The use of an existing hedgerow would requirefewer adjustments to current cultural practices ofthe nursery.
References
Beirne, B.P. 1975. Biological control attempts byintroductions against pest insects in the field inCanada. Can. Ent. 107: 225-236.
Brushwein, J. 1991. Spider mite IPM: Using thepredatory mite, Phytoseiulus persimilis, tocontrol two-spotted spider mite, Tetranychusurticae. Florida Foliage 6-8.
Cashion, G.J., H. Bixler, and J.F. Price. 1994.Nursery IPM trials using predatory mites. Proc.Fla. State Hort. Soc. 107: 220-222.
Coop, L.B. and B.A. Croft. 1995. Neoseiulusfallacis: dispersal and biological control ofTetranychus urticae following minimal inocula-tion into a strawberry field. Exp. Appl. Acarol.19: 31-43.
Croft, B.A. 1990. Arthropod biological controlagents and pesticides. Wiley, New York. 723pp.
Croft, B.A. and A.W. Brown. 1975. Responses ofarthropod natural enemies to insecticides. Ann.Rev. Entomol. 20: 285-355.
Croft, B.A. and D.H. Slone. 1997. Equilibriumdensities of European red mite after exposureto three levels of predaceous mite diversity onapple. Environmental Entomology 26: 391-399.
Croft, B.A., L.N. Monetti, and P.D. Pratt. 1998.Comparative life histories and predation types:Are Neoseiulus californicus and N. fallacissimilar type II selective predators of spidermites. Environ. Entomol. 27: 531-538.
Croft, B.A., S.S. Kim, and D.I. Kim. 1995. Leafresidency and inter leaf movement of fourphytoseiid mites (Acari: Phytoseiidae) onapple. Environ. Entomol. 24:1334-1351.
Helle, W. and M.W. Sabelis. 1985. Spider mites:their biology, natural enemies and control,Vol.1B. Elsevier, Amsterdam. 458 pp.
Johnson, D.T. and B.A. Croft. 1979. Factorsaffecting the dispersal of Amblyseius fallacis inan apple tree ecosystem. Recent Advances inAcarology. 1: 477-483.

144
Jung, C. and B.A. Croft. 1999. Aerial dispersal ofphytoseiid mites: Influence of falling speed,body size, setal length and body weight. Exp.Appl. Acarol. In Press.
Maeda, T., J. Takabayashi, S. Yano, andA. Takafuji. 1998. Factors affecting the residenttime of the predatory mite Phytoseiuluspersimilis in a prey patch. Appl. Entomol. Zool.33: 573-576.
McMullin, E. 1995. A bullseye for bugs. TheGrower. Sept. pp. 8-9.
McMurtry, J.A. and B.A. Croft. 1997. Life-styles ofphytoseiid mites and their roles in biologicalcontrol. Annu. Rev. Entomol. 42: 291-321.
Mizell, R.F. and D.E. Short. 1992. Seasonaloccurrence and management of landscape andornamental pests in north Florida and SouthGeorgia. Proc. Annu. Fl. State Hort. Soc. 105:204-210.
Pemberton, R.W. 1998. The occurrence andabundance of plants with extrafloral nectaries,the basis for antiherbivore defensivemutualisms, along a latitudinal gradient in eastAsia. J. Biogeog. 25: 661-668.
Pratt, P.D. and B.A. Croft. 1998. Panonychus citrion ornamental Skimmia in Oregon, with assess-ment of predation by native phytoseiid mites.Pan. Pac. Entomol. 73: 163-168.
Pratt, P.D. and B.A. Croft. 1999. Expanded distribu-tion of the bamboo spider mite,Schizotetranychus celarius, and predation byNeoseiulus fallacis. Acarologia. In Press.
Pratt, P.D., L.N. Monetti, and B.A. Croft. 1998.Within- and between-plant dispersal and distri-butions of Neoseiulus californicus andN. fallacis in simulated bean and apple branchsystems. Environ. Entomol. 27: 148-153.
Pratt, P.D., P. Schausberger, and B.A. Croft. 1999.Prey-food types of Neoseiulus fallacis and literatureversus experimentally-derived prey-food estimatesfor five phytoseiid species. Exp. Appl. Acarol.23(7):551-565.
Ramakers, P.M.J. and S.J.P. Voet. 1996. Introductionof Amblyseius degenerans for thrips control insweet peppers with potted castor beans as bankerplants. IOBC Bulletin 19: 127-130.
Sabelis, M.W. and M. Dicke. 1985. Long-rangedispersal and searching behaviour, pp. 141-160. InW. Helle and M. Sabelis (eds.), Spider mites, theirbiology, natural enemies and control, Vol. 1B.Elsevier, Amsterdam.
SAS Institute Inc. 1990. SAS/STAT User’s guide,version 6, fourth edition, Cary, NC.
Schuster, R.O. and A.E. Pritchard. 1963. Phytoseiidmites of California. Hilgardia 34: 191-194.
Stiling, P. 1993. Why do natural enemies fail inclassical biological control programs? Am.Entomol. 39: 31-37.
Strong, W.A. and B.A. Croft. 1995. Inoculative releaseof phytoseiid mites into the rapidly expandingcanopy of hop for control of Tetranychus urticaeKoch. Environ. Entomol. 24: 446-453.
von Ende, C.N. 1993. Repeated-measures analysis:growth and other time-dependent measures. pp.113-137. In S. M. Scheiner and J. Gurevitch (eds),Design and analysis of ecological experiments.Chapman & Hall, New York.
Walter, D.E. and D.J. O’Dowd. 1992. Leaf morphol-ogy and predators: effect of leaf domatia on theabundance of predatory mites ( Acari:Phytoseiidae). Environ. Entomol. 21: 478-483.
Zhang, N. and Y. Li. 1989. Rearing of the predaciousmite, Amblyseius fallacis, with plant pollen. Chin. J.Biol. Control 5: 60-63.
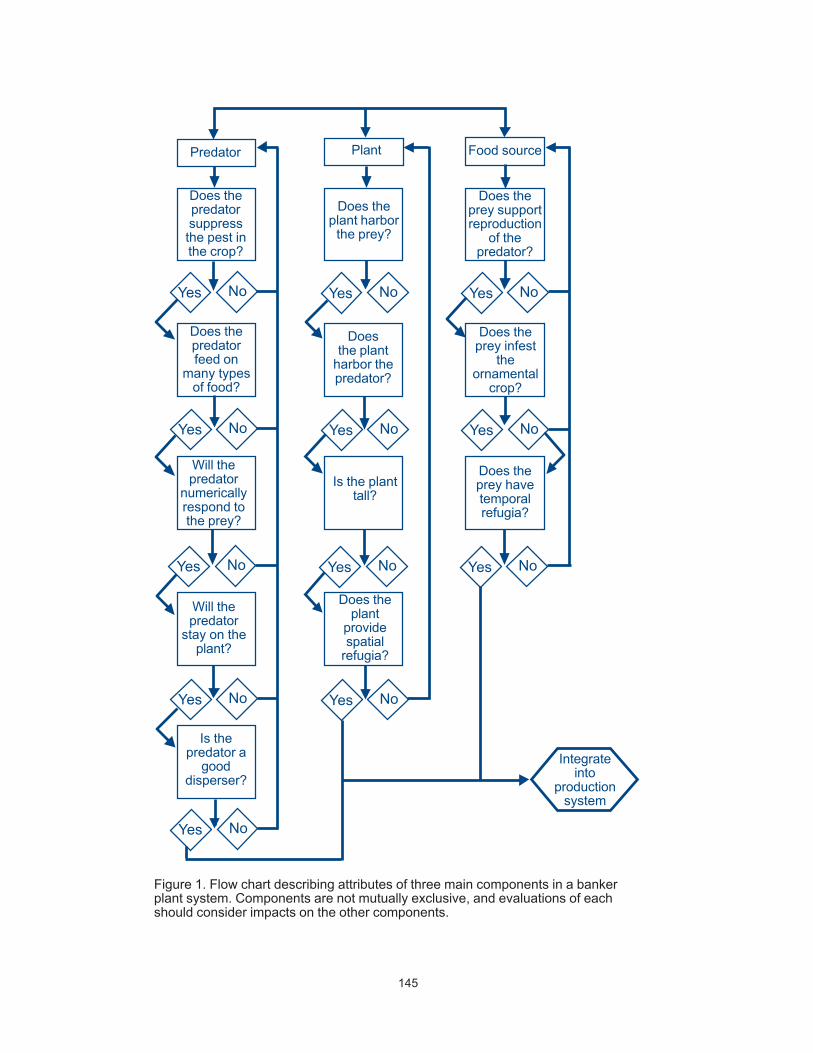
145
Yes No Yes No Yes No
Yes No Yes No Yes No
Yes No Yes No Yes No
Yes No Yes No
Yes No
Predator
Does thepredatorsuppressthe pest inthe crop?
Does thepredatorfeed on
many typesof food?
Will thepredator
numericallyrespond tothe prey?
Will thepredator
stay on theplant?
Is thepredator a
gooddisperser?
Does theplant
providespatial
refugia?
Is the planttall?
Doesthe plant
harbor thepredator?
Does theplant harbor
the prey?
Plant Food source
Does theprey supportreproduction
of thepredator?
Does theprey infest
theornamental
crop?
Does theprey havetemporalrefugia?
Integrateinto
productionsystem
Figure 1. Flow chart describing attributes of three main components in a bankerplant system. Components are not mutually exclusive, and evaluations of eachshould consider impacts on the other components.

146
Num
ber o
f N. f
alla
cis
200
160
120
80
40
0 1 11 21 31
Days
Figure 2. Dispersal of the predatory mite N. fallacis from T. occidentalis ‘Pyramidalis’banker plants to spider-mite-infested bean plants downwind. Reinoculation of thebanker plant was performed on day 21 and resulted in extending the dispersal intervaland number of dispersants of the predatory mite.
Adult females after reinoculation
Adult females in control (noreinoculation)Immatures (no reinoculation)
Date of reinoculation
Num
ber o
f N. f
alla
cis
30
25
20
15
10
5
01 3 5 7 9 11 13 15 17 19 21 23 25 27 29 31
Days
Figure 3. Number of N. fallacis dispersing from a rhododendron banker plant to receiverplants downwind.
Adult females
Immatures

147
Introduction
The objective of this trial was to evaluate andcompare the performance of single treatmentsagainst tank mixes of currently registered insecti-cides for the suppression of lygus bug (Lygushesperus) in alfalfa seed. Evaluations includedtreatment mixtures of organophospate andsynthetic pyrethroid materials. The rates and tankmixes used were common industry recommenda-tions for lygus bug control treatments during thecritical bloom or pollination period of crop develop-ment.
Material and Methods
Small 0.01 acre plots were established using arandomized complete block design with threereplications in a commercial alfalfa seed field.Treatments evaluated in the trial (Table 1) wereapplied using a CO2 backpack sprayer calibrated todeliver 20 GPA at ~30 psi. Tee Jet 8002 VS nozzleswere utilized. Lygus bug control was evaluated3 and 14 days post-treatment using a standardinsect sweep net to collect insect samples. Sweepsamples were preserved in small canning jarscontaining 70 percent ethanol, and collected insectswere counted in the lab. Population levels of allstages of lygus bug, pea aphids, and beneficialinsects were counted and recorded. Insecticideswere applied on May 15, 1998, timed to coincidewith the first spring hatch of insects and when mostof the population was in the small nymph stage ofdevelopment (instars 1 and 2) (Figure 1). The trialwas established targeting the first May hatch toavoid conflict with the grower’s lygus bug spray
Efficacy of Insecticide Mixtures to Control Lygus Bugin Alfalfa Seed
B. Simko and D.J. KrieghMalheur County Extension Office
Oregon State University
schedule. Insecticide treatments simulated therates and tank mixes typically used against thesecond, late June, or July pollination period lygusbug hatches.
Results and Discussion
At 3 days post-treatment, all treatments providedsignificant suppression compared to pretreatmentcounts. There was no treatment separation. Controlranged from 97 to 100 percent. At 14 days post-treatment, sweep samples indicated continuedgood suppression of lygus bug when compared tothe untreated check plots. Control for the treat-ments ranged from 94 to 100 percent (Tables 2 and3). There was no significant difference in theefficacy of the single treatments compared to thetank mixes for lygus bug control. All treatmentsprovided a high level of control of pea aphid at 3days post-treatment. At 14 days post-treatment,Dibrom, at 1 pt/acre formulated material, wassignificantly inferior to the other treatments in thecontrol of pea aphid. Beneficial populations were atonly trace levels in the pretreatment count,s soimpact of the treatments on predators andparasites could not be evaluated effectively. Underthe conditions of this trial, it appeared that all thetreatments were effective when applied topopulations of small lygus bug nymphs in a timelymanner. These observations support the conclu-sion that successful control of lygus bug hatchesdepends on frequent sweeping schedules andtimely insecticide sprays in addition to judiciousselection of active ingredients. No data werecollected on residual toxicity toward pollinators ofthe treatments, particularly of the active ingredienttank mixes.

148
Table 1. Lygus bug insecticides, tank mixes, and treatment costs, Sutton Farm, Ontario, OR, 1998.Treatment 1 Rate ai/acre Rate formulated/acre Cost $/acreDibrom 1.0 1 pt 9.13MSR 0.5 2 pt 16.25Capture 0.03 2 oz 7.83Warrior 0.016 2 oz 5.05Dibrom + MSR 0.5 + 0.375
1¦2 pt + 1
1¦2 pt 16.75
Dibrom + Warrior 0.5 + 0.161¦2 pt + 2 oz 9.61
MSR + Warrior 0.375 + 0.016 11¦2 pt + 2 oz 17.25
Untreated Control
1Registered Trademarks
Table 2. Efficacy of commercial insecticides on lygus bug in alfalfa seed, 3 days post-treatment, SuttonFarm, Ontario, OR, 1998.
Control compared toRate Average lygus per pretreatment
Treatment (volume/acre) 5-sweep sample population† (%)
Dibrom 1 pt 3.3 96.7MSR 2 pt 0.7 99.3Capture 2 oz 1.3 98.7Warrior 2 oz 1.3 98.7Dibrom + MSR 1¦2 pt + 11¦2 pt 3.3 96.7Dibrom + Warrior 1¦2 pt + 2 oz 1.7 98.3MSR + Warrior 11¦2 pt + 2 oz 0.3 99.7
†Pretreatment lygus bug population, 101 per 5-sweep sample.
Nymphs (%)
0 20 40 60 80 100
76.7% (Treatment Date)
90%
32%
May 9 = 277 DDUAverage 13/sweep
May 15 = 310 DDUAverage 20/sweep
May 28 = 358 DDUAverage 25/sweep
Figure 1. Lygus bug instar profiles at treatment date and two subsequent dates,Sutton Farm, Ontario, OR, 1998.
5th Instars
4th Instars
3rd Instars
1st & 2nd Instars

149
Table 3. Efficacy of commercial insecticides on lygus bug in alfalfa seed, 14 days post-treatment, SuttonFarm, Ontario, OR, 1998.
Percent lygus controlAverage lygus per compared to untreated
Treatment Rate 5-sweep sample checkvolume/acre
Dibrom 1 pt 7.0 94.5MSR 2 pt 5.0 96.1Capture 2 oz 2.0 98.4Warrior 2 oz 0.0 100.0Dibrom + MSR 1/2 pt + 1-1/2 pt 2.7 97.9Dibrom + Warrior 1/2 pt + 2 oz 1.3 99.0MSR + Warrior 1-1/2 pt + 2 oz 1.0 99.2Untreated Check 127

150
Abstract
Successful insect pest management in mintdepends on at least three components: samplingand monitoring, using treatment thresholds, andintegrating multiple control tactics when possible.
It is imperative that insect pest managementprograms be developed that employ insecticidesand acaricides only when necessary. It also isnecessary to integrate other tactics, such ascultural practices (flaming, plowing/tillage, croprotation, planting pest free roots), biological control,etc., into a comprehensive and regional integratedpest management program. Successful implemen-tation of insect pest management on mint dependson accurately sampling and monitoring pestpopulations to determine pest densities and theneed for intervention. The use of treatmentthresholds to avoid the unnecessary use ofinsecticides and acaricides is equally important, notonly to reduce production costs and environmentalimpacts, but to delay the development of pestresistance to insecticides and acaricides.
Decisions on how best to manage insect and mitepests on mint should be based on the best availableknowledge with the goal of integrating as manytactics as possible into the mint production system.Each pest is unique and may require differentmanagement strategies, but, in many instances,careful employment of multiple tactics can reducepest populations significantly below economiclevels. The use of insecticides and acaricides likelywill continue in the near future; but they should beused judiciously, to manipulate pest populations sothat other more permanent management tacticscan be implemented.
Insect and mite pests on peppermint can beseparated into three distinct regions in the PacificNorthwest (PNW) according to their abundance andseverity. The major pests in the western region,which includes western Oregon and Washington,are primarily soil insects such as mint root borer(MRB), strawberry root weevil (SRW), gardensymphylan, mint flea beetle (MFB), and cutworms,although spider mites are becoming more serious.
Integrated Insect Management in Mint
R. BerryDepartment of Entomology
Oregon State University
The central region includes areas east of theCascade Mountains, particularly central Oregonand Washington. The major pests in this region arespider mites, mint root borer, and, to a lesserextent, cutworms (redbacked cutworm speciescomplex), mint flea beetle, and strawberry rootweevil. The eastern region includes eastern Oregonand Washington and western Idaho. The majorpests in this region are spider mites and mint rootborer; and, to a lesser extent, mint stem borer,aphids, and cutworms.
Similarly, insect and mite pests in Oregon areimportant in the state’s western, central, andeastern regions. In general, two important pestsdominate in all Oregon production regions: spidermites and mint root borer. The design of an IPMprogram on mint must take into account theseregional differences as well as differences in pestbiology, growing conditions, and productionpractices in the different regions.
SPIDER MITESSRWMRBMFB
CUTWORMSLOOPER
MRBSPIDER MITES
SRWMFB
SYMPHYLANSCUTWORMS
LOOPER
SPIDER MITESMRB
CUTWORMSLOOPER
SRWAPHIDS
STEM BORER
Pests on Mint in the PNWWESTERN REGION
MRBSRW
SYMPHYLANSSPIDER MITES
MFBCUTWORMS
EASTERN REGIONSPIDER MITES
MRBCUTWORMS
APHIDSSTEM BORER
CENTRAL REGIONSPIDER MITES
MRBSRW
CUTWORMSAPHIDS
MFB

151
The major insect and mite pests on mint are: spidermites, mint root borer (MRB), strawberry root weevil(SRW), mint flea beetle (MFB), and several speciesof cutworms. Interestingly, most of the seriousinsect pests on mint are soil insects: MRB, SRW,MFB, and cutworms (redbacked cutworm speciescomplex, RBC), a phenomenon most likelyassociated with the nontillage practices used inmint production. Also, it is interesting to note thatspider mites were not a serious problem in westernOregon until about 20 years ago.
Following is a brief description of the life cycles ofthe major pests on mint to illustrate the damagingstages and current management strategies. Thereare several other pests that occur on mint that arenot discussed here: cabbage and alfalfa loopers,wireworms, aphids, mint stem borer, and gardensymphylan (see Berry, R. and G. Fisher, 1993: AGuide for Peppermint Insect and Mite Identificationand Management for a complete discussion ofpests on mint).
Twospotted Spider Mite (TSSM)This pest is a major threat to mint production in theNorthwest because growers currently rely almostexclusively on two acaricides. M. Morris (1998) hasdocumented TSSM resistance to Kelthane® inwestern Oregon, central Oregon, and Montana.TSSM resistance to Comite® has not yet beendocumented fully. TSSM overwinter as females insoil debris in and around mint fields. In milderclimates, TSSM may be found feeding on the lowerfoliage year around. Populations begin increasing inthe spring and may reach damaging levels as earlyas April or May in some regions. During thesummer, a complete generation from egg to eggmay be completed in 1 to 3 weeks, and there maybe as many as six to eight generations each year.
Currently, control of TSSM is based on the use ofComite® (1.6 - 2.0 lb ai/acre). Recommendations
are that growers not use Kelthane® because of theresistance problems and because it is extremelydisruptive to predator mites. M. Morris foundpredator mites (principally Neoseiulus fallacis) in allproduction areas (even during the winter), and hehas documented their effectiveness in suppressingTSSM for the entire season, if managed properly.One of the goals of his research is to develop amanagement program in which predator mites playa key role in the management of TSSM on mint.Management of predator mites on mint will dependon careful management and the registration of anacaricide that is “soft” on predators. M. Morris(1996) also found that spring applications ofVydate® against nematodes disrupts predator mites,but Orthene® does not. His observations areimportant to an understanding of how best tomanage predator mites to increase their effective-ness against TSSM. In western Oregon and
SPIDER MITE LIFE CYCLE
Adult females
Eggs
Nymphs, adults, eggs
Many overlapping generations
Adult females
J F M A M J J A S O N D
Months

152
Mint Root Borer (MRB)
MRB first was identified as a pest on mint inwestern Oregon in 1973 and in north centralOregon in 1974 (Berry, 1993). MRB is currently oneof the principal insect pests on mint in all productionareas in Oregon, Washington, Idaho, and Montana.MRB produces one generation each year. Larvaeare present in mint fields beginning in July andcontinuing through September. The most severedamage occurs when larvae feed within rhizomes inthe fall, usually after harvest in August and earlySeptember. Larval feeding damage kills plants andweakens the stand, which often results in substan-tial plant mortality during the winter. Currently,control of MRB is based on the use of Lorsban®
(2.0 lb ai/acre) or entomopathogenic nematodesapplied at 1.5 to 2.0 billion infective juveniles peracre (IJs/acre) against larvae after harvest. In both
Washington, spring and fall propane flaming for rustcontrol reduces the population of TSSM. Flaming inthe spring often delays the development of TSSMpopulations, and in many years no acaricidetreatments are necessary during the growingseason. However, propane flaming is not acommon practice in other production areas and
TSSM populations begin developing early in thespring and usually reach outbreak populationssometime during the growing season. Integration ofcultural practices such as flaming and carefulmanagement of predator mites may provide seasonlong control of TSSM without the use of acaricides.
instances, materials are applied through theirrigation system prior to the time larvae form theoverwintering stage. J.Takeyasu (1994) has shownthat both products effectively reduce MRBpopulations. However, preharvest applications ofbeneficial nematodes at 2.0 billion IJs/acre have theadded advantage of reducing MRB larvae beforethe most serious damage is done to rhizomes in thefall. Research on how to use MRB sex pheromonetraps (available commercially from Trece, Inc.) totime preharvest applications of BioVector iscurrently underway. Previous research in Oregon(Talkington and Berry, 1986) and Washington (Pikeand Glazer, 1982) showed that tillage (strip tillage inWashington, plowing and discing in Oregon)effectively reduced MRB; however, because of thedanger of spreading verticillium wilt, growers havebeen reluctant to adopt this practice.
Pre-pupae
Pupae
Adults
Eggs
Larvae*
Pre-pupae
*Optimum period to treat, if necessary
J F M A M J J A S O N D
MINT ROOT BORER LIFE CYCLE
Months
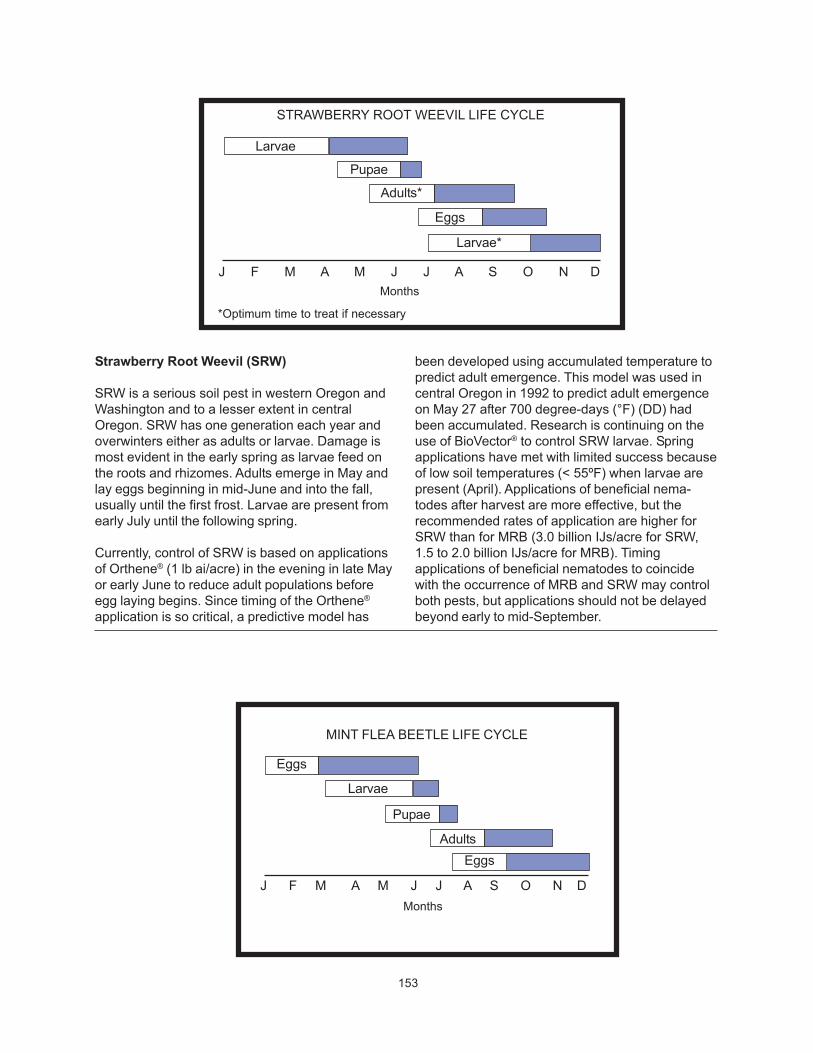
153
Strawberry Root Weevil (SRW)
SRW is a serious soil pest in western Oregon andWashington and to a lesser extent in centralOregon. SRW has one generation each year andoverwinters either as adults or larvae. Damage ismost evident in the early spring as larvae feed onthe roots and rhizomes. Adults emerge in May andlay eggs beginning in mid-June and into the fall,usually until the first frost. Larvae are present fromearly July until the following spring.
Currently, control of SRW is based on applicationsof Orthene® (1 lb ai/acre) in the evening in late Mayor early June to reduce adult populations beforeegg laying begins. Since timing of the Orthene®
application is so critical, a predictive model has
been developed using accumulated temperature topredict adult emergence. This model was used incentral Oregon in 1992 to predict adult emergenceon May 27 after 700 degree-days (°F) (DD) hadbeen accumulated. Research is continuing on theuse of BioVector® to control SRW larvae. Springapplications have met with limited success becauseof low soil temperatures (< 55ºF) when larvae arepresent (April). Applications of beneficial nema-todes after harvest are more effective, but therecommended rates of application are higher forSRW than for MRB (3.0 billion IJs/acre for SRW,1.5 to 2.0 billion IJs/acre for MRB). Timingapplications of beneficial nematodes to coincidewith the occurrence of MRB and SRW may controlboth pests, but applications should not be delayedbeyond early to mid-September.
J F M A M J J A S O N D
Larvae
Pupae
Adults*
Eggs
Larvae*
*Optimum time to treat if necessary
Months
STRAWBERRY ROOT WEEVIL LIFE CYCLE
J F M A M J J A S O N D
Larvae
Pupae
Adults
Eggs
Eggs
Months
MINT FLEA BEETLE LIFE CYCLE

154
Mint Flea Beetle (MFB)
MFB is a serious pest in western Oregon andWashington and to a lesser extent in centralOregon. MFB has a single generation each yearand damage occurs in the spring (early April to earlyMay) when larvae feed and tunnel in roots andrhizomes. Adults emerge in late June and early Julyand begin laying eggs in mid-July through the fall oruntil the first frost. Eggs overwinter and hatch inearly March
Currently, control of MFB depends on usingLannate® (0.68 - 0.9 lb ai/acre) against the adultsprior to the beginning of egg laying. Since timing iscritical for successful adult suppression, a model topredict adult emergence has been developed. In1992 in central Oregon, the model predicted peak
adult emergence on June 14 after an accumulationof 1,475 degree-days. Lannate® must be appliedwithin 14 days after adult emergence to preventoviposition. Entomopathogenic nematodes alsohave been evaluated to control MFB larvae, butbecause of low soil temperatures (< 55ºF) in thespring when MFB larvae are present, the practicehas met with limited success. Also, the availabilityof irrigation water in the spring is a limiting factor inmost production areas. Finally, Vydate® applied inthe spring to suppress plant parasitic nematodesalso may provide control of MFB larvae, but timingof application is critical. The model developed topredict MFB development showed that susceptiblestages of MFB larvae were present in late Marchand mid-April after an accumulation of 400 to600 DD.
Cutworms (Variegated and Redbacked)
The variegated cutworm (VC) is principally a pest inwestern Oregon and Washington, whereas theredbacked cutworm complex (RBC) (a complex ofat least eight different species) occurs in centraland eastern production areas.
Variegated Cutworm
This cutworm has two generations each year, withthe second generation causing the most damageon mint during July. Adults emerge as early asFebruary in some areas and begin laying eggs asearly as mid-March. Adult emergence can be
monitored using sex pheromone traps placed inmint fields in late March or early April. Larvae maybe present in early April, but the majority of damageto the mint foliage occurs in July. Larvae overwinterin crop debris around field margins or in othercrops.
Control of VC is accomplished with foliar applica-tions of Orthene® (1.0 lb ai/acre) or Lannate® (0.9 lbai/acre) timed to coincide with the occurrence ofthird or fourth stage larvae. Both insecticidesprovide excellent control if timed for the earlystages; however, as larvae reach maturity, theeffectiveness of both insecticides declines. Timingapplications of Orthene® with emergence of adult
J F M A M J J A S O N D
LarvaePupae
AdultsEggs
Larvae
Months
VARIEGATED CUTWORM LIFE CYCLE
PupaeAdults
EggsLarvae
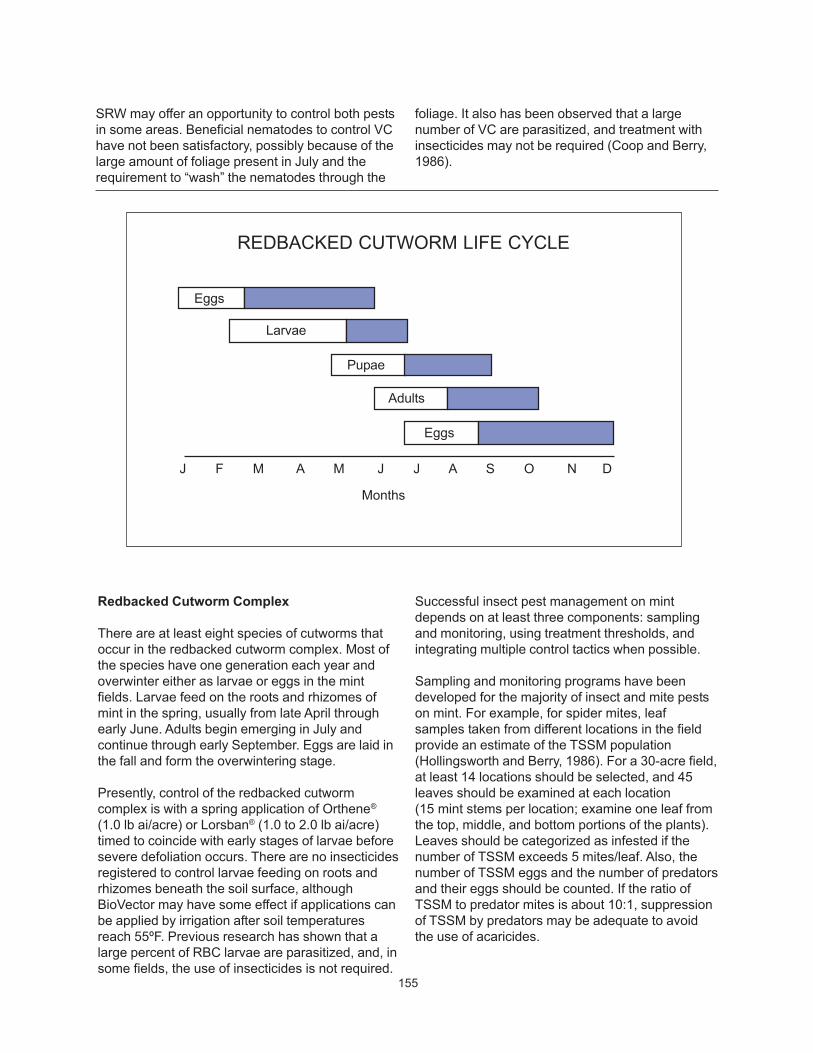
155
Redbacked Cutworm Complex
There are at least eight species of cutworms thatoccur in the redbacked cutworm complex. Most ofthe species have one generation each year andoverwinter either as larvae or eggs in the mintfields. Larvae feed on the roots and rhizomes ofmint in the spring, usually from late April throughearly June. Adults begin emerging in July andcontinue through early September. Eggs are laid inthe fall and form the overwintering stage.
Presently, control of the redbacked cutwormcomplex is with a spring application of Orthene®
(1.0 lb ai/acre) or Lorsban® (1.0 to 2.0 lb ai/acre)timed to coincide with early stages of larvae beforesevere defoliation occurs. There are no insecticidesregistered to control larvae feeding on roots andrhizomes beneath the soil surface, althoughBioVector may have some effect if applications canbe applied by irrigation after soil temperaturesreach 55ºF. Previous research has shown that alarge percent of RBC larvae are parasitized, and, insome fields, the use of insecticides is not required.
SRW may offer an opportunity to control both pestsin some areas. Beneficial nematodes to control VChave not been satisfactory, possibly because of thelarge amount of foliage present in July and therequirement to “wash” the nematodes through the
Successful insect pest management on mintdepends on at least three components: samplingand monitoring, using treatment thresholds, andintegrating multiple control tactics when possible.
Sampling and monitoring programs have beendeveloped for the majority of insect and mite pestson mint. For example, for spider mites, leafsamples taken from different locations in the fieldprovide an estimate of the TSSM population(Hollingsworth and Berry, 1986). For a 30-acre field,at least 14 locations should be selected, and 45leaves should be examined at each location(15 mint stems per location; examine one leaf fromthe top, middle, and bottom portions of the plants).Leaves should be categorized as infested if thenumber of TSSM exceeds 5 mites/leaf. Also, thenumber of TSSM eggs and the number of predatorsand their eggs should be counted. If the ratio ofTSSM to predator mites is about 10:1, suppressionof TSSM by predators may be adequate to avoidthe use of acaricides.
foliage. It also has been observed that a largenumber of VC are parasitized, and treatment withinsecticides may not be required (Coop and Berry,1986).
Eggs
Larvae
Pupae
Adults
Eggs
J F M A M J J A S O N D
Months
REDBACKED CUTWORM LIFE CYCLE

156
IPM ON PEPPERMINT***
SAMPLING AND MONITORINGUSE TREATMENT THRESHOLDSMULTIPLE CONTROL TACTICS
For most of the soil insects, such as MRB, SRW,MFB, and RBC, it is necessary to take soil samplesto estimate population density. Typically, square footsamples to a depth of about 2 inches are adequateto estimate most soil insect populations. In someinstances, soil samples may be examined directly inthe field to estimate the insect density; however, theuse of Berlese funnels increases the accuracy ofthe sample. Detailed sampling procedures for theseand other pests are outlined in the publication AGuide for Peppermint Insect and Mite Identificationand Management, Oregon State UniversityExtension Service, Corvallis, OR (Berry and Fisher,1993).
The use of insecticides and acaricides as part of anoverall insect/mite pest management program onmint undoubtedly will continue. However, thenumber of insecticides registered on mint is likely todecline during the next several years as the re-registration process progresses. Also, it is unlikelythat there will be a significant number of “new”
insecticides or acaricides available for registrationon mint, largely because of the high costs ofregistration and the reluctance of some manufactur-ers to pursue registration on minor crops. There-fore, it is imperative that insect and mite pestmanagement programs be developed that employinsecticides and acaricides only when necessary. Italso will be necessary to integrate other tactics,such as cultural practices (flaming, plowing/tillage,crop rotation, planting pest free roots), biologicalcontrol, etc., into a comprehensive and regionalIPM program. Successful implementation of pestmanagement in mint depends on accuratelysampling and monitoring pest populations todetermine pest densities and the need forintervention. The use of treatment thresholds toavoid the unnecessary use of insecticides andacaricides is equally important, not only to reduceproduction costs and environmental impacts, but todelay the development of pest resistance toinsecticides and acaricides.

157
USE ONLY WHEN JUSTIFIEDBASED ON SAMPLING AND THRESHOLDS
INSECTICIDES PESTS CONTROLLED
ORTHENE SRW, CUTWORMS/LOOPERSLORSBAN MRB, RBC, SYMPHYLANSLANNATE MFB, CUTWORMS/LOOPERSCOMITE SPIDER MITESKELTHANE SPIDER MITESDYFONATE SYMPHYLANSMALATHION APHIDS, MFB, SRW ADULTSBIOVECTOR MRB, SRW, MFB LARVAE
Numerous insect and mite management tactics areavailable to mint growers. For example, aspreviously noted, use cultural controls, such as:spring flaming, which reduces spider mites; and fallor spring plowing or strip tillage, which reduces mintroot borer. Planting disease, insect, and nematodefree mint roots may be the single most effectivepest management tactic available to mint growers.Many pests are spread from field to field in the rootstock; verticillium wilt, nematodes, weed seed, mintroot borer, mint flea beetle, strawberry root weevil,symphylans, redbacked cutworm, etc. The use ofbiological control tactics also is an importantconsideration in pest management on mint. Forexample, cutworms and loopers are parasitized
heavily, and, in many instances, insecticides are notrequired. Spider mite predators are abundant inmint fields in all production areas, and, in manyinstances, they successfully suppress populationsof TSSM without the use of acaricides. The use ofentomopathogenic nematodes is proving to be aneffective biological control for mint root borer andshows promise for control for strawberry root weeviland mint flea beetle as well. Otherentomopathogenic nematode species need to beevaluated. A 4- to 5-year crop rotation program alsocan reduce effectively many of the pest problemsassociated with mint production, especially thosepests that build-up in the soil, such as verticilliumwilt, perennial weeds, soil insects, nematodes, etc.
IPM TACTICSPLANT PEST FREE ROOTS
CONTROLS MRB, SRW, MFB, SYMPHYLANS, CUTWORMS
4- OR 5-YEAR CROP ROTATIONCONTROLS MRB, SRW, MFB, WILT, WEEDS, NEMATODES
PLOWING / TILLAGECONTROLS MRB, WEEDS, ENHANCES SOIL / NUTRIENTS
SPRING / FALL FLAMINGCONTROLS TSSM, RUST, WILT, WEED SEED
BIOLOGICAL CONTROLPARASITES CONTROL VC, RBC, LOOPERS
PARASITIC NEMATODES CONTROL MRB, SRW, MFB

158
Decisions on how best to manage insect and mitepests on mint should be based on the best availableknowledge with the goal of integrating as manytactics as possible—and practical—into the mintproduction system. Each pest is unique and mayrequire different management strategies, but, inmany instances, careful employment of multipletactics can reduce pest populations significantly
below economic levels. The use of insecticides andacaricides likely will continue in the near future, butthey should be used judiciously to manipulate pestpopulations so that other management tactics canbe implemented. In insect and mite management,biological control may be one of the most usefultactics, if properly integrated into a comprehensivepest management program.
PEST SAMPLE THRESHOLD MANAGEMENTVC SWEEP/GROUND 1-2 / SAMPLE ORTHENE / LANNATE
TSSM 45-LEAF SAMPLE 5-LEAF COMITE / KELTHANE
MRB * SOIL / RHIZOMES 2 - 3 /SAMPLE BIOVECTOR / LORSBAN
ADULTS PHEROMONES
SRW * 700 - 900 DDSOIL 1 - 2 SAMPLE BIOVECTOR
ADULTS ORTHENE
MFB * SOIL O.5 / SAMPLE BIOVECTOR / VYDATE
ADULTS 1,400 DD LANNATE
*SPREAD IN PLANTING STOCK
DECISION MAKING IN MINT IMP
Literature Cited
Berry, R.E. 1974. Biology of Pyrausta fumalis onpeppermint in Oregon. Ann. Entomol. Soc. Am.67:580-2.
Berry, R.E. and G. Fisher. 1993. A guide topeppermint insect and mite identification andmanagement. PNW Ext. Pub. 182.
Coop, L.B. and R.E. Berry. 1986. Reduction invariegated cutworm (Lepidoptera; Noctuidae)damage to peppermint by larval parasitoids. J.Econ. Entomol. 79:1,244-1,248.
Hollingsworth, C.S. and R.E. Berry. 1982.Regression sampling plan for twospotted spidermite (Acari: Tetranychidae) in Oregonpeppermint. J. Econ. Entomol. 75:497-500.
Morris, M.A., B.A. Croft, and R.E. Berry. 1996.Overwintering and effects of fall habitatmanipulation and carbofuran on Neoseilusfallacis and Tetranychus urticae in pepperint.Exp. Appi. Acarol. 20:249-257.
Morris, M.A. 1998. Biological control of Tetranychusurticae (Koch) on peppermint by Neoseiulusfallacis (Garman): density relationships,overwintering, habitat manipulation andpesticide effects. Ph.D. dissertation, OregonState University, Corvallis.
Morris, M.A., R.E. Berry, and B.A. Croft. 1999.Phytoseiid mites on peppermint and effective-ness of Neoseiulus fallacis to controlTetranychus urticae (Acari: Phytoseiidae,Tetranychidae) in arid growing regions. J. Econ.Entomol. 92:1,072-1,078.
Pike, K.S. and M. Glazer. 1982. Strip rotary tillage: amanagement method for reducing Fumibotysfumalis (Lepidoptera: Pyralidae) in peppermint.J. Econ. Entomol. 75:1,136-1,139.
Takeyasu, J. 1994. Control of mint root borer,Fumibotys fumatis, with the entomopathogenicnematode, Steinernema carpocapsae. M. S.Thesis, Oregon State University, Corvallis.
Talkington, M.L. and R.E. Berry. 1986. Influence oftillage in peppermint on Fumibotys fumalis(Lepidoptera: Pyralidae), common groundsel,Senecio vulgaris and soil chemical compo-nents. J. Econ. Entomol. 79:1,590-1,594.

159
Keywords: Tetranychus urticae, Neoseiulusfallacis, Phytoseiid, Mentha piperita
Introduction
Peppermint (Mentha piperita L.) is a perennial herbin the family Labiatae (Laminacea). During 1998,peppermint was grown on approximately123,000 acres in the U.S., mostly in Oregon,Washington, Idaho, Indiana, and Wisconsin. Themajority of peppermint is produced for its oil, mostof which is used for flavoring chewing gum,toothpaste, and other oral care products.
Peppermint is also a host for many arthropodspecies, several of which are economicallyimportant pests (Berry and Fisher, 1993). Presently,spider mites are the most common arthropod peston mint (Morrell et al., 1995; Morris and Lundy,1995), but this was not always the case. Prior to thelate 1970s, spider mites were not a serious threat topeppermint production and seldom reacheddamaging levels. By the early 1980s, spider miteshad become a more severe problem to this crop,especially in arid growing regions. In 1981, forexample, over 90 percent of the peppermint acresin central Oregon were treated for spider mites, and21 percent of those acres were treated twice.Research conducted by DeAngelis et al. (1983a)suggested that nighttime water loss and daytimewater stress, resulting from damage to epidermalcells and cuticle, were the most significant type ofspider mite injury to peppermint. Despite theadvances made in spider mite management duringthe 1980s (Hollingsworth and Berry, 1982 and1983), the severity of spider mites on this cropcontinued to increase. Because of the economicburden that spider mite management was placingon mint growers, and because miticides labeled forpeppermint could be lost through pesticideresistance or regulatory concerns (Glass, 1986), theU.S. Mint Industry, U.S. Department of Agriculture,and Environmental Protection Agency supportedresearch into biological control of spider mites onpeppermint during the 1990s.
We begin this paper by discussing the suitability ofpeppermint as a crop for implementing spider mite
The Importance of Integrated Pest Management (IPM) for the Successful Use ofPredator Mites to Control Spider Mites in Peppermint
M.A. Morris and J.Y. Takeyasu, Consultants
biological control and why integrated pestmanagement (IPM) is needed if biological control isto succeed on this crop. Next, the biological controlprogram for spider mites conducted by the U.S.Mint Industry during the 1990s is evaluated. Finally,constraints to further adoption of biological controlby mint growers is discussed.
The Biological Control Option
Peppermint is a suitable crop for implementingbiological control of most arthropod pests, probablybecause many natural enemies are well adapted tomint. Frequent irrigation often results in lush foliageand high humidity, which many natural enemiesprefer. Mint is also a perennial crop that allows timefor natural enemies to colonize and establishthemselves. Another reason is that cosmeticappearance is not an issue in peppermint grown foroil. Therefore, higher pest levels may be toleratedbefore potentially disruptive management practicesbecome necessary. Finally, mint pests have notbeen shown to vector pathogens that economicallydamage peppermint under commercial fieldconditions.
The potential for biological control of spider miteson peppermint was first explored in the early 1980s,although this strategy did not seem practical at thetime. Of the 18 spider mite predators (including fourphytoseiid species) identified from Oregonpeppermint fields, none were present in sufficientnumbers to control spider mites (Hollingsworth,1980; Hollingsworth and Berry, 1983; Hadam et al.,1986). Hollingsworth and Berry (1983) suggestedthat agricultural practices may have been respon-sible for low predator levels. Sampling dataobtained from 1989 to 1995, however, showed thatphytoseiid predator mites were distributed morewidely on peppermint in the western U.S. than waspreviously reported (Morris et al., 1999a). Of thephytoseiids collected, 99 percent were Neoseiulusfallacis. Although other species were detected, theirlevels were too low to control spider mites. Perhapsmint growers had modified their agriculturalpractices in ways that enhanced the survival of N.fallacis, or it adapted to peppermint agriculturalpractices. Results of cage
160
and pesticide exclusion studies showed N. fallaciswas capable of controlling spider mites in pepper-mint (Morris et al.,1999a). Moreover, this specieswas able to overwinter and provide control of spidermites for several seasons (Morris et al., 1996).Other attributes which make N. fallacis a goodcandidate for biological control include highfecundity, short development time, high preyconsumption, and good dispersal ability (Johnsonand Croft, 1975; Smith and Newsom, 1970a and1970b; Croft, 1975; Ball, 1980; Raworth, 1990;Coop and Croft, 1995; McMurtry and Croft, 1997).
Based on the suitability of peppermint as a crop forimplementing biological control, and the potential ofN. fallacis as a natural enemy of spider mites, theU.S. Mint Industry established a spider mitebiological control program in 1993. The goals of thisprogram were to reduce to 25 percent the numberof peppermint acres treated for spider mites in thewestern U.S., and to eliminate the need to treatmint fields for spider mites twice in a single season.
The importance of Integrated PestManagement (IPM)
Although N. fallacis is an effective natural enemy ofspider mites, IPM tactics are necessary if biologicalcontrol of this pest is to succeed on mint. The U.S.Mint Industry defines IPM to be “the intelligentselection of all available pest control tactics in amanner that is both cost effective and least harmfulto non-target species and the outside environment”(Morris and Lundy, 1995). The IPM tacticsconsidered crucial for the success of spider mitebiological control are grower education and training,the use of critical densities for spider mites and N.fallacis, intensive field monitoring, strategic use ofpredator mites and pesticides, and using a systemsapproach to mint pest management.
Grower Education and Training
The first step of this program was to explain clearlythe program goals to mint growers. For example,one goal was to reduce the use of miticides, noteliminate them. By discussing the capabilities andlimitations of biological control, including the impactof agricultural practices on predators, mint growerswere less likely to become disenchanted when theprogress of biological control was slower thanexpected. Moreover, when growers were trained toidentify spider mites and predator mites on mintleaves with a hand-lens, they were often more
supportive of spider mite biological control. Theyalso tended to be more patient and more likely toreduce disruptive agricultural practices, allowingpredators the time to reduce spider mite levelseffectively. Finally, growers who can identify pestsand their natural enemies under field conditions arebetter able to determine the need for, and quality of,biological control products and services.
Critical Densities and Field Monitoring forSpider Mites and Predator Mites
Determining a pest’s critical density (CD) is neededbefore an effective monitoring program can beimplemented (Nyrop, 1998). If an effective CD isnot established, growers have no way of knowingwhether or not a particular pest density is causingeconomic injury. This lack of knowledge can lead tounnecessary pesticide use. For peppermint,laboratory studies by DeAngelis et al. (1983b)showed that a density of 20 Tetranychus urticae perleaf could result in complete leaf loss. Becauseother factors such as temperature, duration offeeding, and soil type can affect the CD for spidermites, a conservative CD of 5.0 spider mites perleaf was established (economic threshold) forpeppermint (Berry and Fisher, 1993). Whentemperatures are cool, or when the peppermintcrop is strong and vigorous, higher spider mitelevels may be tolerated without economic injury(Morris, personal observation).
The critical ratio (CR) of a pest to its natural enemyalso may help growers decide whether or not tointervene with a pesticide (Helle and Sabelis, 1985;Nyrop, 1994). For several phytoseiid species onvarious crops, including N. fallacis on peppermint, aCR of 10 spider mites to 1 predator is oftensufficient to control spider mites (Croft, 1975; Croftand McGroarty, 1977; Morris et al., 1999a).Growers must be cautious, however, becausesometimes the CR may not adequately predictpredator/prey interactions. For example, theeffectiveness of a CR may vary depending ondiffering densities of the pest and its natural enemy(Nyrop, 1994).
Once the CD and CR are determined, monitoring isneeded to determine pest and predator levels in thefield (Kogan and Herzog, 1980; Binns and Nyrop,1992; Pedigo and Buntin, 1994). A spider mitesampling program has been developed forpeppermint by Hollingsworth and Berry (1992). Todetermine the CR for this crop, the number of

161
predator mites per leaf may be counted andreported along with spider mites (Morris, personalobservation). Once the decision is made tointervene with miticides or predators, periodicmonitoring is necessary to determine thetreatment’s effectiveness. Although it is theoreticallypossible to predict the outcome of biological controlfrom one sample (Croft, 1975; Nyrop, 1994),periodic monitoring provides insurance against therisk of being incorrect. Monitoring mint fields forother pests also may benefit spider mite biologicalcontrol; for example, by reducing the use of non-selective pesticides applied for pests other thanspider mites.
Augmentation with Predator Mites
Resident populations of N. fallacis often are presentin mint fields at levels capable of controlling spidermites (Morris et al., 1999a). In situations wherepredator levels are not adequate, augmenting withlow rates of commercially produced N. fallacis (500to 2,000 per acre) may be an economical approachfor re-establishing biological control. This approachassumes, however, that enough time is available forpredator levels to increase and adequately dispersethroughout the field (Coop and Croft, 1995; Croftand Coop, 1998). Another possible limitation ofusing N. fallacis in this manner concerns the timingof predator mite release. For example, applying lowrates of predator mites in the spring when spidermite populations are above 0.1 per leaf andtemperatures are cool, usually will not stop spidermites from reaching damaging levels, although thisstrategy usually avoids multiple miticide applica-tions during a single season. Releasing low rates ofpredators into newly established fields has been themost successful approach in peppermint. Byapplying predators when spider mites first begin tocolonize new mint fields, usually May through July,problem levels of spider mites the following springusually are avoided (Morris, personal observation).The success of this approach assumes thatgrowers can avoid disruptive agricultural practicesafter predators are released. The practice ofinundating mint fields with high rates (10,000 to60,000 per acre) of N. fallacis is not cost effectivepresently.
Strategic Use of Pesticides
Because biological control is not completelyreliable, pesticides are needed in those situationswhere natural enemies are not effective enough(Croft, 1990; Metcalf, 1994). For this reason,pesticides are likely to remain an important IPMtactic for mint in the foreseeable future; so, apesticide strategy that is compatible with naturalenemies was developed by the U.S. mint industry(Morris and Lundy, 1995). Important features of thisstrategy include: the use of pesticides only as abackup to biological control; when pesticideintervention is necessary, use only selectivecomponents as economically feasible; and, whenselective pesticides are not available, use leasttoxic ones selectively. This strategy applies to allkinds of pesticides used on mint, includingmiticides, insecticides, fungicides, and herbicides.Selective use of pesticides other than miticides isdiscussed in the following section on systeminteractions. Another part of the mint pesticidestrategy is to maintain pesticides currently labeledselective. For example, the U.S. mint industrysuccessfully has maintained propargite, the onlyselective miticide registered for use on mint. In theevent that propargite is lost, and for resistancemanagement purposes, mint labels for twoadditional selective miticides, hexythiazox andcyhexatin, are being pursued. Through educationalefforts, fewer mint growers now are using dicofol oroxydemeton methyl, two miticides which are notselective to N. fallacis (Croft, 1990; Kaufman et al.,1999). To determine whether or not a pesticide isselective to important natural enemies of aparticular crop, commodity groups probably shouldtest the pesticides themselves. Relying on pesticideselectivity data gathered for natural enemies of onecrop may not adequately predict the effect ofpesticides to the same or other natural enemies onanother crop (Morris, 1998).
Systems Approach to Mint IPM
A systems approach to IPM is necessary forunderstanding the interactions that take place withinagro-ecosystems (Croft and Hoyt, 1983; Ruesinkand Onstad, 1994). Spider mite levels in pepper-mint often are influenced by factors such as (1) themanagement of other pest complexes (e.g.,arthropods, diseases, nematodes, and weeds),(2) mint cultural practices (e.g. flaming andirrigation), and (3) the surrounding crops and othervegetation. By understanding these factors, farm

162
management practices sometimes can be adjustedto reduce the negative impact on spider mitenatural enemies.
The use of non-selective pesticides to control mintpests other than spider mites frequently results inspider mite outbreaks (Morris, 1998). For example,fall applied carbofuran, used for 8 years inpeppermint under an emergency exception forrootweevil control, severely can reduce predatormite levels and cause spider mite outbreaks thefollowing spring (Morris et al., 1996). Anotherexample concerns the use of chlorpyrifos in mint tocontrol soil cutworms and the mint rootborer.Broadcast applied liquid formulations of chlorpyrifosare very toxic to N. fallacis, whereas granularchlorpyrifos is less toxic (Morris, personalobservation), probably because granular formula-tions leave fewer residues on mint leaves. Similarly,changing the application of liquid bromoxynil frombroadcast to herbigation greatly improves theselectivity of this broadleaf herbicide. Timing ofpesticide application is another way to enhancepesticide selectivity. In addition to bromoxynil,several other mint herbicides are toxic to N. fallacis.Three of these—paraquat, oxyflorfen, andpendimethalin—usually can be applied safelyduring the dormant season when predators areinactive and protected in soil debris. The insecticideacephate, used in mint to control cutworms, is oftenless toxic to N. fallacis when applied in early springthan when applied later in the season (Morris,1998). In early spring, temperatures are often cooland N. fallacis usually is found feeding on abundantspider mites on the underside of lower mint leaves.This provides a kind of protective umbrella. Later inthe summer, however, predators are seekingactively to disperse or locate food higher in thecanopy, rendering them more vulnerable to contactwith pesticides.
Mint cultural practices also can affect spider miteand predator mite levels. One example is theirrigation program used. Surprisingly, N. fallacis wasdetected at high levels in arid mint growing regionsof the western U.S. (Morris et al., 1996). AlthoughN. fallacis is affected adversely by low humidity andhigh temperature (Kramer and Hain, 1989; Croft etal.,1993), it may survive on peppermint in aridregions because frequent irrigation provides asuitable microenvironment (Morris et al., 1996 and1999a). Flaming mint fields for disease control inthe fall is another practice that can impact spidermite control. Peppermint fields in central and
western Oregon often are fall-flamed to reducelevels of the soil pathogen Verticillium dahliae, oneof the major limiting factors to mint production in theU.S. (Horner and Dooley, 1965; McIntyre andHorner, 1973). Fall-flaming mint is also detrimentalto predator mites and can result in spider miteoutbreaks the following spring (Morris et al.,1999b). Reasons why flaming is harmful to N.fallacis include direct contact with flame, reducedhumidity, and destruction of overwintering habitat.
The other crops and surrounding vegetation foundin the agro-ecosystem where mint is grown alsocan affect spider mite management. For example,spider mites often increase on corn and carrot, thendisperse downwind and create spider miteproblems in mint (Morris, personal observation).Because sweet corn and carrot seed frequently aretreated with non-selective insecticides, few naturalenemies disperse along with spider mites.
Program Overview
Presented here are the results of the spider mitebiological control program initiated by the U.S. mintindustry during the 1990s. This evaluation is basedon grower surveys from mint growing regions of thewestern U.S. Data from the Midwest are notincluded, because spider mites are presently not asignificant problem there.
Between 1990 and 1995, there was a 31 percentdecrease in the number of peppermint acrestreated with miticides in the major mint growingregions of the western U.S. For individual growingregions, the percent of peppermint acres treatedwith miticides decreased by 14 percent, 16 percent,65 percent, and 16 percent, for central Oregon,Idaho, Washington, and western Oregon respec-tively (Table 1). The large decrease in miticide usein Washington can be attributed to a WashingtonMint Commission that effectively disseminatedinformation to their grower community, and toseveral large mint growers (more than 2,000 acres)who embraced biological control for economicreasons. Mint growers also have curtailed their useof dicofol (Table 2). Because dicofol is highly toxicto N. fallacis (Kaufman et al.,1999), reducing theuse of this miticide should create a better environ-ment for spider mite biological control.

163
Table 1. Changes in the percent of peppermint acres treated with miticides in the major growing regionsof the western U.S. from 1990 to 1995.
Mint growing 1990 mint grower survey 1 1995 mint grower survey 2Region Acres % treated Acres % treated
Central Oregon 18,300 100 15,500 86Idaho 19,800 85 23,200 69Washington 18,800 92 32,700 27Western Oregon 25,000 41 25,000 25
1Morris and Lundy, 1995; 2Jepson and Mason, 1996; Morrell et al., 1995; Lundy, 1997.
Table 2. Survey of miticide use (Comite [propargite] and dicofol) on U.S. peppermint from 1990 to 1997.
Mint growing region 1990 Survey1 1992 Survey2 1995 Surveys3
% acres treated % acres treated % acres treatedComite dicofol Comite dicofol Comite dicofol
Central Oregon 100 57 92 <1 86 <1Idaho 78 7 ** ** 64 5Montana 13 50 ** ** 55 5Washington 66 26 ** ** 25 2Western Oregon 33 8 58 14 25 <1
1Morris and Lundy, 1995. 2Jepson and Mason, 1996. 3Morrell et al., 1995; Rinehold et al., 1999; Lundy1997.
A greater reduction was seen in the number ofpeppermint acres treated twice each season forspider mites than for total spider mite treated acres.This result is observed best in central and easternOregon, historically the growing regions with themost severe spider mite problems. From the late1980s until 1994, over 85 percent of peppermintfields in these two growing regions were treated
twice each season for spider mites (Morris andLundy, 1995). This level has been reduced 50percent or more from 1996 to 1998 (Table 3). Moreimportantly, when independent mite monitoringprograms were implemented based on the methodsof Hollingworth and Berry (1982), the number ofacres treated twice for spider mites fell below 10percent (Table 3).
Table 3. Survey of Comite (propargite) use by peppermint growers in Central Oregon.Information 1996 Survey 1997 Survey 1998 Surveyssource % acres treated % acres treated % acres treated
none once twice none once twice none once twice
OSU survey1 20 33 47 14 36 50 * * *
Cathie Bennett2 45 29 25 35 57 8 52 39 9
Bryon Quebbeman3 53 46 1 49 45 6 35 64 1
1Rinehold et al., 1999. 2Based on 1,800 acres monitored by Bennett’s Scouting Service, Madras, Oregon.3Based on 6,500 acres monitored by Quebbeman’s Crop Monitoring, LaGrande ,Oregon.

164
Although miticide use on peppermint has beenreduced to levels well below those observed duringthe early 1990s, the goals of reducing the totalacres treated to 25 percent and eliminating theneed for multiple applications during a singleseason have not been met. Perhaps these goalsare not realistic. If, however, more peppermintgrowers adopt intensive field monitoring, augmentwith N. fallacis where needed, and avoid disruptiveagricultural practices, further reductions in miticideuse on mint probably can be realized. These datado suggest, however, that selective miticides will beneeded by mint growers to help control spider mitesfor some time to come.
Constraints to Adoption of Mint IPM andBiological Control
Despite the advances made in managing spidermites, this pest continues to be a serious problemto mint production in the western U.S. So why havesome mint growers failed to embrace the intensivespider mite management tactics outlined above?Several reasons are suggested here. First, thecomplexity of managing spider mites through fieldmonitoring and biological control is not economi-cally justified in the view of many mint growers.Miticides are perceived to be relatively inexpensive,and fewer than half of the mint growers haveexperienced miticide failure. Treating a mint fieldfor spider mites costs about $30.00 per acre permiticide application, including the application cost.As long as multiple miticide applications are notnecessary, or the price of mint oil remainsreasonably high, many growers are unlikely toadopt an IPM program for spider mites.
Second, mint growers often are reluctant to changetraditional pest management practices. For spidermites, this often means treating fields with non-selective miticides when mites first are detected.Even when intensive monitoring programs areimplemented successfully, such as to managesevere spider mite outbreaks, many growersdropped these programs once the spider miteproblem subsided. Innovative mint growers tend toremain with independent monitoring programsdespite changes in mint oil prices, while othersadopt monitoring programs when prices are highand drop them when prices decline.
Third, depending on field monitoring to make spidermite management decisions is perceived to be toorisky. In fact, intensive monitoring has missed
spider mite outbreaks in mint, leading to economicdamage before action was taken (Morris, personalobservation). This may have resulted fromerroneous monitoring data. Field scouts often areinexperienced and seasonal employees who, eitherintentionally or unintentionally, sometimes makemistakes entering monitoring data. Even experi-enced field scouts who monitor correctly, occasion-ally miss a spider mite problem due to chancealone. It is nearly impossible to design a samplingplan that is completely reliable (Pedigo, 1994).Treating a mint field with a miticide and notevaluating its performance through field monitoringis also risky. For example, propargite is usually noteffective enough to maintain spider mites belowdamaging levels in fields where predators havebeen severely depleted (Morris et al., 1999a). Also,dicofol was ineffective for controlling resistantspider mites in mint, and resistance to dicofol waswidespread in peppermint throughout the westernU.S. (Morris, 1998).
Fourth, a source of high quality predator mites isneeded in situations where resident populations ofN. fallacis are too low, and such sources are difficultto find (Morris, personal observation). Not only wasthe wrong species of predator mite found incontainers, but, in some cases, even the wrongfamily of mites were the only ones observed inshipments. Mixtures of phytoseiid species werecommon, as were fewer numbers of the correctspecies than was reported on the container. Suchdiscrepancies in quality could result in a badreputation for a pest management program thatdepends on commercial sources of naturalenemies, especially if no one knew the wrongspecies or count was responsible for the controlfailure.
Fifth, releasing N. fallacis in mint fields to controlspider mites is sometimes unreliable (Morris,personal observation), even when the species andthe numbers released are correct. Predators maynot establish effectively, increase in numbers, anddisperse throughout mint fields for reasons otherthan disruptive agricultural practices. For example,competition with other species may be responsiblefor the lack of predator performance (MacRae andCroft, 1996). As for evaluating any pest controltactic, follow up field monitoring is a good way todetermine if predators are working effectively.
Finally, the lack of effective pesticides or pesticideformulations that are compatible with natural

165
enemies has slowed the progress of biologicalcontrol in mint. Although the U.S. mint industry ispursuing aggressively the registration of selectivepesticides, such alternatives must be effective. Toallow natural enemies the time needed to controlpest populations successfully, mint growers need areliable pesticide backup in the event that biologicalcontrol is not successful. For example, Bacillusthuringiensis has never been effective enough atreducing cutworm populations in mint to replaceacephate or chlorpyrifos. More effective pesticideformulations also would help encourage thesuccess of biological control. For example,granular chlorpyrifos may be more effective atcontrolling soil pests in mint than are liquidformulations, and granular formulations are lessdisruptive to natural enemies on mint leaves(Morris, personal observation). Because thesuccess of biological control cannot be adequatelypredicted 14 to 30 days before harvest, a miticideor insecticide having a shorter pre-harvest interval(0 to 7 days) would reduce greatly the number offields treated with miticides and other pesticides.
Acknowledgments
I thank C. Bennett of Bennett’s Scouting Service,Madras, OR; D. Phillips of A.M. Todd Co., MadrasOR; and Lisa Hunt of Biological Control Works,Jefferson OR for their help with experimentalstudies. I also thank USDA/CSREES (96-3463-2788) and A.M. Todd Co. for research support.
Literature Cited
Ball, J.C. 1980. Development, fecundity, and preyconsumption of four species of predaciousmites (Phytoseiidae) at two constant tempera-tures. Environ. Entomol. 9:298-303.
Berry, R.E. and G. Fisher. 1993. A guide topeppermint insect and mite identification andmanagement. PNW Extension Publication 182.37 pp.
Binns, M.R. and J.P. Nyrop. 1992. Sampling insectpopulations for the purpose of IPM decisionmaking. Annu. Rev. Entomol. 37:427-440.
Coop, L.B. and B.A. Croft. 1995. Neoseiulusfallacis: dispersal and biological control ofTetranychus urticae following minimalinoculations into a strawberry field. Exp. andAppl. Acarol. 19:31-43.
Croft, B.A. 1975. Integrated control of apple mites.Extension Bulletin E-825, Cooperative
Extension Service, Michigan State University.12 pp.
Croft, B.A. 1990. Arthropod Biological ControlAgents and Pesticides. Wiley Intersci., NewYork. 723 pp.
Croft, B.A., J.E. Dunley, R.H. Messing, and W.B.Strong. 1993. Effects of humidity on eggs andimmatures of Neoseiulus fallacis, Amblyseiusandersoni, Metaseiulus occidentalis andTyphlodromus pyri (phytoseiidae): implicationsfor biological control on apple, caneberry,strawberry, and hop. Exp. Appl. Acarol. 17:451-459.
Croft, B.A. and S.C. Hoyt. 1983. IntegratedManagement of Insect Pests of Pome andStone Fruits. Wiley Intersci., New York.454 pp.
Croft, B.A. and D.L. McGroarty. 1977. The role ofAmblyseius fallacis (Acarina: Phytoseiidae) inMichigan apple orchards. Michigan StateUniversity Research Report No. 333.
Croft, B.A. and L.B. Coop. 1998. Heat units, releaserate, prey density, and plant age effects ondispersal by Neoseiulus fallacis (Acari:Phytoseiidae) after inoculation into strawberry.J. Econ. Entomol. 91(1):94-100.
DeAngelis, J.D., R.E. Berry, and G.W. Krantz.1983a. Photosynthesis, leaf conductance, andleaf chlorophyll content in spider mite-injuredpeppermint leaves. Environ. Entomol. 12:345-348.
DeAngelis, J.D., A.B. Marin, R.E. Berry, and G.W.Krantz. 1983b. Effects of spider mite (Acari:Tetranychidae) injury on essential oil metabo-lism in peppermint. Environ. Entomol. 12:522-527.
Glass, E.H. 1986. Pesticide Resistance: Strategiesand Tactics for Management. Nat. Acad.Press, Washington D.C. 471 pp.
Hadam, J.J., M.T. AliNiazee, and B.A. Croft. 1986.Phytoseiid mites (Parasitiformes: Phytoseiidae)of major crops in Willamette Valley, Oregon,and pesticide resistance in Typhlodromus pyriScheuten. Environ. Entomol. 15:1255-1263.
Helle, W. and M.W. Sabelis. 1985. Spider Mites:Their Biology, Natural Enemies, and Control.World Crop Pests, Vol 1B. Elsevier,Amsterdam. 458 pp.
Hollingsworth, C.S. 1980. Twospotted spider mite,Tetranychus urticae Koch, in Oregon pepper-mint, sampling and economic injury. Ph.D.thesis. Oregon State University, Corvallis.172 pp.

166
Hollingsworth, C.S. and R.E. Berry. 1982.Regression sampling plan for twospotted spidermite (Acari: Tetranychidae) in Oregonpeppermint. J. Econ. Entomol. 75:497-500.
Hollingsworth, C.S. and R.E. Berry. 1983.Twospotted spider mite (Acari: Tetranychidae)in peppermint: population dynamics andinfluence of cultural practices. Environ.Entomol. 11:1280-1284.
Horner, C.E. and H.L. Dooley. 1965. Propaneflaming kills Verticillium dahliae in peppermintstubble. Plant Dis. Rep. 49:581-582.
Hoy, M.A. 1982. Recent advances in knowledge ofthe Phytoseiidae. Univ. Calif. Div. Agric. Sci.Publ. No. 3284. 92 pp.
Hoy, M.A. 1985. Almonds (California). In: W. Helleand M.W. Sabelis (eds.), Spider Mites: TheirBiology, Natural Enemies and Control. WorldCrop Pests, Vol. 1B. Elsevier, Amsterdam. 299-310.
Jepson, R. and R.G. Mason. 1996. Survey ofpesticide applications on Oregon mint fields.Agricultural Experiment Station Special Report958. Oregon State University, Corvallis.
Johnson, D.T. and B.A. Croft. 1975. The dispersalbehavior of Amblyseius fallacis (Garman) in thelaboratory (Acarina: Phytoseiidae). Proc.North Central Branch-ESA. 30:52-54.
Kogan, M. and D.C. Herzog. 1980. Samplingmethods in soybean entomology. Springer-Verlag, New York. p. 587.
Kaufman, D., G. Koskela, M. Morris, and B. Croft.1999. Toxicity of selected pesticides to thepredator mite Neoseiulus fallacis in thelaboratory and in field observations instrawberry. Research reports: 58th annualPacific Northwest insect managementconference. pp. 29-32.
Kramer, D.A. and F.P. Hain. 1989. Effect of constantand variable humidity and temperature regimeson the survival and developmental periods ofOligonychus ununguis (Acarina: Tetranychidae)and Neoseiulus fallacis (Acarina: Phytoseiidae).Environ. Entomol. 18: 741-746.
Luckmann, W.H. and R.L. Metcalf. 1982. The pest-management concept. In: R.L. Metcalf andW.H. Luckmann (eds.), Introduction to InsectPest Management. Wiley Interscience. 577 pp.
Lundy, R. 1997. Grower pesticide use surveyupdates. Mint Industry Research CouncilBulletin no. 3. 8 pp.
MacRae, I.V. and B.A. Croft. 1996. Differentialimpact of Zetzellia mali (Acari: Stigmaeidae) onMetaseiulus occidentalis and Typhlodromus
pyri (Acari: Phytoseiidae). Exp. Appl. Acarol.20:143-154.
McIntyre, J.L. and C.E. Horner. 1973. Inactivationof Verticillium dahliae in peppermint stems bypropane gas flaming. Phytopathology. 63:172-175.
McMurtry, J.A. and B.A. Croft. 1997. Life-styles ofphytoseiid mites and their roles in biologicalcontrol. Annu. Rev. Entomol. 42:291-321.
Metcalf, R.L. 1994. Insecticides in pest manage-ment. In: R.L. Metcalf and W.H. Luckmann(eds.), Introduction to Insect Pest Management.Wiley Interscience. 577 pp.
Morrell, A., A. Schreiber, and R. Lundy. 1995.Pests, pest control, and fertilizer use inWashington mint. Food and EnvironmentalQuality Laboratory, Washington State Univer-sity.
Morris, M.A. 1998. Biological control of Tetranychusurticae (Koch) on peppermint by Neoseiulusfallacis (Garman): density relationships,overwintering, habitat manipulation andpesticide effects. Ph.D Diss. Oregon StateUniversity. 82 pp.
Morris, M.A. and R. Lundy. 1995. Pesticideenvironmental stewardship strategy for the U.S.mint oil industry. Mint Industry ResearchCouncil. 24 pp.
Morris, M.A., B.A. Croft, and R.E. Berry. 1996.Overwintering and effects of fall habitatmanipulation and carbofuran on Neoseiulusfallacis and Tetranychus urticae in peppermint.Exp. Appl. Acarol. 20:249-257.
Morris, M.A., R.E. Berry, and B.A. Croft. 1999a.Phytoseiid mites on peppermint and effective-ness of Neoseiulus fallacis to controlTetranychus urticae (Acari: Phytoseiidae,Tetranychidae) in arid growing regions.J. Econ. Entomol. In press.
Morris, M.A., R.E. Berry, and B.A. Croft 1999b.Influence of fall flaming on densities, distribu-tions and dispersal of Tetranychus urticae andNeoseiulus fallacis (Acari: Tetranychidae,Phytoseiidae) in peppermint. Environ. Entomol.In press.
Nyrop, J.P. 1994. Sampling to predict or monitorbiological control. In: Handbook of samplingmethods for arthropods in agriculture. CRCPress, Boca Raton. p. 714.
Nyrop, J.P. 1998. Sampling for IPM decisionmaking: Where should we invest time andresources? Presentation at 1998 APS/ESAJoint meeting, Las Vegas, NV.
Pedigo, L.P. and G.D. Buntin. 1994. Handbook of
167
sampling methods for arthropods in agriculture.CRC Press, Boca Raton. p. 714.
Raworth, D.A. 1990. Predators associated with thetwospotted spider mite, Tetranychus urticae, onstrawberry at Abbotsford, B.D., and develop-ment of non-chemical mite control. J. Entomol.Soc. Brit. Columbia. 87:59-67.
Rinehold, J. and J.J. Jenkins. 1994. Pesticide UseSurvey: Oregon pesticide use estimates forseed and specialty crops, 1992. EM 8568,Oregon State University.
Ruesink, W.G. and D.W. Onstad. 1994. Systems
analysis and modeling in pest management.In: R.L. Metcalf and W.H. Luckmann (eds.),Introduction to Insect Pest Management. WileyInterscience. 577 pp.
Smith, J.C. and L.D. Newsom. 1970a. Laboratoryevaluation of Amblyseius fallacis as a predatorof tetranychid mites. J. Econ. Entomol.63:1876-1878.
Smith, J.C. and L.D. Newsom. 1970b. The biologyof Amblyseius fallacis (Acarina: Phytoseiidae)at various temperature and photoperiodregimes. Ann. Entomol. Soc. Amer. 63:460-462.

168
Objectives
1. To evaluate the toxicity of a directed pesticidespray application to Neosieulus fallacis.
2. To complement field implementation researchusing releases of N. fallacis for control oftwospotted spider mites.
Progress
Colonies of twospotted spider mites and N. fallaciswere established in the laboratory at NorthWillamette Research and Extension Center duringthe fall of 1996 and ‘97. For the directed spraytrials, a pre-determined number of N. fallacis, alongwith an adequate number of twospotted spidermites to sustain them, were placed on small leafdisks which were sprayed with one of the followingpesticides at rates recommended for use instrawberries. In 1996: Vendex, Guthion, Diazinon,Thiodan (applied at the low rate recommended forcontrol of aphids and the high rate recommendedfor control of cyclamen mites), Lorsban,Metasystox-R, Alert, and Benlate. In 1997:Brigade, Kelthane, Aliette, Captan, Ridomil, Rovral,Thiram, Devrinol, and Simazine. The followingadditional herbicides were evaluated for toxicity byMark Morris: Goal, Poast, Sinbar. A summary ofour results appears below.
Among the insecticides/miticides, Alert, Brigade,Diazinon, Kelthane, Lorsban, Metasystox-R, andthe high rate of Thiodan were most toxic, resultingin 90 percent or greater mortality within 24 to 48hours of application. Among the fungicides,Ridomil was most toxic, resulting in 74 percentmortality. Although Benlate did not kill many N.fallacis, it resulted in a sharp reduction in egg layingamong females. This observation supports BrianCroft’s previous conclusion that Benlate sterilizesN. fallacis females. None of the other fungicidesappeared to affect egg-laying. Levels of mortalityamong the herbicides tended to be fairly low. Ofthe herbicides, only Goal resulted in reduced eggproduction by survivors. The rate of Sinbar used in
Evaluation of the Toxicity of Pesticides to Neosieulus fallacis in theLaboratory and in Field Observations
D. Kaufman,1 G. Koskela,1 M.Morris,2 and B.Croft3
1North Willamette Experiment Station2Consultant
3Oregon State University
this trial was based on the recommended rate foruse in mint and is several times the rate recom-mended for strawberries.
Results from directed sprays onto small leaf disksreflect the “worst case scenario,” because there isno way for N. fallacis adults to move quickly toavoid contact as they would be able to do in thenatural environment. Spray coverage is also muchgreater than in a field situation, providing no areasfree from direct spray contact. Because of this,sprays of these chemicals would probably not be asdisruptive to N. fallacis populations in a strawberryfield as they are in the laboratory. In an attempt tomonitor N. fallacis populations in a field situation,populations of N. fallacis were released into fivestrawberry fields with twospotted spider mites(TSSM) in late summer, 1997. Populations ofTSSM and N. fallacis were monitored in these fieldsthrough harvest, 1998. No dramatic changes inTSSM or N. fallacis populations were observedfollowing grower applications of Lorsban orMetasystox-R, despite their toxicity in laboratorytrials. The same strain of N. fallacis was used inthe field and the laboratory.
There are several factors (spray coverage, amountof contact of N. fallacis with spray residues, etc.)affecting exposure of N. fallacis to pesticides in thefield. The fact that the weather this spring was cooland wet also would have had a moderating effecton twospotted spider mite populations. The longlapse in time between N. fallacis release andstrawberry harvest makes it difficult to determinewhat proportion of N. fallacis present in the field inMay 1998 were progeny of the original populationreleased in September 1997.
All of these factors make it difficult to draw any firmconclusions from our field observations. Additionalwork is needed to correlate laboratory results withfield conditions.
Summary sheets of observations in the five fieldsmonitored are attached. Four of these fields bore

169
their first crop in 1998; one of these is organic. Theremaining field was in its second fruiting year. Ingeneral, there were greater numbers and a greatervariety of insect predators in the organic field. Theorganic field also had a significant number ofmummified aphids, indicating activity by parasiticwasps. The “ideal” ratio of TSSM to N. fallacis forgood control is 10:1 or lower. Although we rarelyachieved such narrow ratios, TSSM populations
remained relatively low in all five fields during spring1998. The only site to maintain recommendedratios during part of the spring was the organic field.This may be a reflection of the lack of pressurefrom pesticides. The lack of TSSM populationpressure is probably a reflection of cool, wetconditions. Had the weather been warm and dry, itis conceivable that the wide TSSM/N. fallacis ratiosmight not have been adequate to control TSSMpopulations sufficiently.
Toxicity of Strawberry Pesticides to the Predator Mite, Neosieulus fallacis
TREATMENT RATE (LB I/A) % MORTALITYInsecticide/Miticide
Alert 0.2 96Brigade 0.1 100Diazinon 0.5 100Guthion 0.5 18Kelthane 1.0 92Lorsban 1.0 100Metasystox-R 0.5 96Thiodan 1.0 47Thiodan 2.0 91Vendex 0.5 12
FungicidesAliette 5.0 lb prod/a 1Benlate 1.0 lb prod/a 6Captan 6.0 lb prod/a 4Ridomil 2.0 qt prod/a 74Rovral 2.0 lb prod/a 14Thiram 2.5 lb prod/a 9
HerbicidesDevrinol 4.0 6Goal 0.5 25Poast 2.5 lb prod/a 15Simazine 1.0 10Sinbar 1.5 26

170
Field Releases of N. fallacis and Twospotted Spider Mite Counts (TSSM), 1997-98
Field #2. Washington CountyDate 2-spots/leaf N. fallacis/leaf Ratio TSSM Eggs OtherAug. 27, 1997 8.4 Minute pirate bugSept. 24, 1997* 0.1 0.0125 8:1April 14, 1998
Lorsban appl.April 22, 1998 0.8 0.1250 64:1April 31, 1998 0.1 e aphids Thiodan appl.May 3, 1998 2.0 0.0140 143:1 eMay 28, 1998 5.0 0.0800 62:1e=eggs present, E=several eggs present
*Mite Counts within 3 weeks of N fallacis release:Date Flagged Release Sites Non-Release Sites
2-spots N. fallacis 2-spots N. fallacisSept. 24, 1998 0.1 0.025 0.125 0
Ratio 4:1
Field #1. Washington CountyDate 2-potsl/eaf N. fallacis/leaf Ratio TSSM eggs OtherAug. 1997 Lorsban appl.Aug. 27, 1997 * 20.0 0.025 800:1 Minute pirate bugSept. 24, 1997 3.0 0.100 27:1March 25,1998 3.0 0 e Aphids Lorsban appl.April 9, 1998 0.4 0 E AphidsApril 22, 1998 4.0 0 Aphids Agrimek appl.May 3, 1998 3.0 0May 29, 1998 8.0 0.080 100:1 E Green lacewinge=eggs present, E=several eggs present
*Mite Counts within 3 weeks of N fallacis release:Date Flagged Release Sites Non-Release Sites
2-spots N. fallacis 2-spots N. fallacisSept. 24, 1998 0.6 0.25 4 0
Ratio 2:1
Field #3 Organic, Yamhill CountyDate 2-spots/leaf N. fallacis/leaf Ratio TSSM Eggs OtherAug. 14, 1997 20.0 0.02 800:1 *MPB, SF, GL, LBSept. 23, 1997 9.0 0 *MPB, SF, GL, LBMarch 26, 1998 7.0 0 EApril 9, 1998 0.5 0.01 50:1 E Aphid mummiesApril 21, 1998 1.5 0.4 4:1 AphidsApril 29, 1998 2.0 0.4 5:1 Aphid mummiesMay 27, 1998 2.7 0.1 27:1 Aphids*MPB=Minute Pirate Bug; SF=Syrphid Fly; GL=Green Lacewing; LB=Lady Bird Beetle; adults and larvae present on all predators.e=eggs present, E=several eggs present
*Mite Counts within 3 weeks of N fallacis release:Date Flagged Release Sites Non-Release Sites
2-spots N. fallacis 2-spots N. fallacisSept. 23, 1998 8 0 11 0
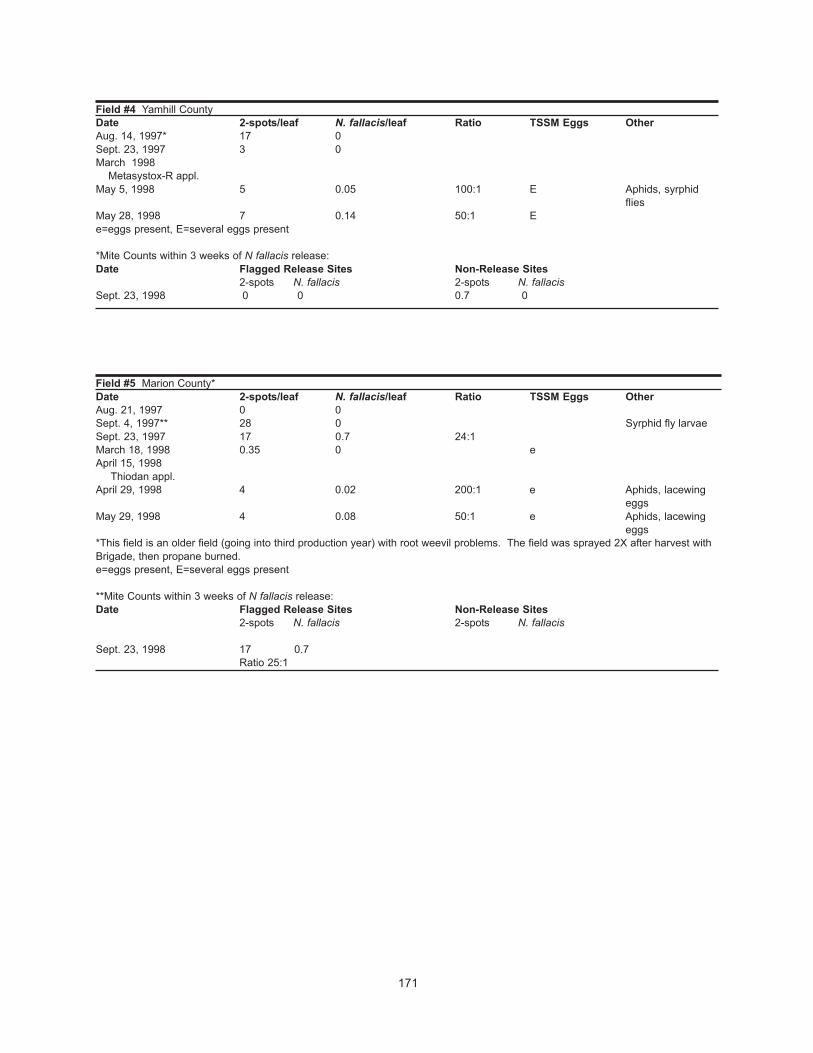
171
Field #5 Marion County*Date 2-spots/leaf N. fallacis/leaf Ratio TSSM Eggs OtherAug. 21, 1997 0 0Sept. 4, 1997** 28 0 Syrphid fly larvaeSept. 23, 1997 17 0.7 24:1March 18, 1998 0.35 0 eApril 15, 1998
Thiodan appl.April 29, 1998 4 0.02 200:1 e Aphids, lacewing
eggsMay 29, 1998 4 0.08 50:1 e Aphids, lacewing
eggs*This field is an older field (going into third production year) with root weevil problems. The field was sprayed 2X after harvest withBrigade, then propane burned.e=eggs present, E=several eggs present
**Mite Counts within 3 weeks of N fallacis release:Date Flagged Release Sites Non-Release Sites
2-spots N. fallacis 2-spots N. fallacis
Sept. 23, 1998 17 0.7Ratio 25:1
Field #4 Yamhill CountyDate 2-spots/leaf N. fallacis/leaf Ratio TSSM Eggs OtherAug. 14, 1997* 17 0Sept. 23, 1997 3 0March 1998 Metasystox-R appl.May 5, 1998 5 0.05 100:1 E Aphids, syrphid
fliesMay 28, 1998 7 0.14 50:1 Ee=eggs present, E=several eggs present
*Mite Counts within 3 weeks of N fallacis release:Date Flagged Release Sites Non-Release Sites
2-spots N. fallacis 2-spots N. fallacisSept. 23, 1998 0 0 0.7 0

172
Summary
Allium crops in the western U.S. regularly arethreatened by fungal diseases, especially thosediseases which are tolerant of or are favored byaridity. Fungal diseases of very short season greenbunching onions are well addressed with availablecontrol programs. For full-season bulb and seedonions, controls are available for fusarium basalplate rot (F. oxysporum cepae), pink root(Pyrenochaeta terrestris), downy mildew(Peronospora destructor), and purple blotch(Alternaria porri). When weather is highlyconducive, better anticipation of the rapidly actingdowny mildew and purple blotch epidemics wouldassist control. In areas in which both bulb andseed are produced, downy mildew tends to cyclefrom one crop to the other, and the industry wouldassist itself by eliminating close plantings.However, in some western regions, wild Alliumsalso may serve the same role. Botrytis neck rot (B.allii) and white rot (Sclerotium cepivorum) remaincritical factors in onion bulbs and seed production.White rot may occur in cooler regions or whereverAllium crops are overwintered. Because white rotis a permanent soil infestation which rapidlyincreases to incite field-wide losses, this diseasethreatens individual growers, critical mass ofregional production and product identity, and (in thecase of dehydration) contracting companies.
For garlic, hot water clove treatment reducedseedling vigor, which led to penicillium (P. hirustum)decay if planting was delayed. The impact ofpenicillium seed decay, along with fungicideresistance in the penicillium fungus, has beenreduced when alternatives to hot water seedtreatment are implemented for bulb nematode.Losses in the field can be reduced with bettertiming of fungicide applications for purple blotchand botrytis (B. porri, B. allii) and better selection ofseedstock for fusarium (garlic strains of F.culmorum). Previously rare, garlic rust (Pucciniaallii) was devastating in 1998, in association withunusual climatic conditions; impact in 1999 appears
Management of Fungal Diseases in Onion and Garlic
Fred CroweBotany & Plant Pathology
Central Oregon Agricultural Research Center850 NW Dogwood Ln.
Madras, OR 97741mailto:[email protected]
to be low, and is being controlled with an emer-gency approval of Folicur fungicide. As all garlic isoverwintered, white rot remains the largest obstacleto sustained garlic production for individualproducers, regions, and contracting industries.
Future needs and IPM: For pink root of onion,better varietal resistance and less dependence onsoil fumigants are desired. Varietal resistance iseven more important in high organic soils wherefumigants are ineffective.
Bulbs may be infected from airborne spores ormore directly from leaf infections which progress tothe neck prior to topping for botrytis neck rot inonion storage. Losses remain at 0.25 to 25 percent(rarely higher), primarily depending on spore loadsat harvest and conditions influencing bulb maturity.Fungicides applied near or at harvest are ineffec-tive. Field curing of necks prior to topping and heatcuring in storage can reduce neck rot greatly.However, the market favors large bulbs (ergo, largenecks), and high bulb prices sometimes requireforegoing good neck curing. These factors beyonda grower’s control chronically aggravate botrytislosses. This proportion might explain some neckrot incidence even when necks are well cured priorto topping. Even though seasonal systemicinfection is not an accepted concept in the westernU.S., perhaps this possibility should be revisited.
Once introduced into a field, white rot lingers atdamaging soil populations for decades. There is noknown source of breeding resistance, andtraditional fungicide use has proven ineffectiveagainst high soil populations. Infections may occurshallow or deep in the soil. The fungus spreadsplant-to-plant on root systems, and soil- and seed-applied fungicides near the bulb commonly do notlast season long. Typically, infested fields areabandoned for Allium production. Recent researchindicates soil populations of S. cepivorum may benearly eradicated with germination stimulants.

173
Stimulants are applied in the absence of an Alliumcrop; sclerotia germinate, then die from lack of aliving Allium food base. Integrating this approachtogether with fungicides applied at onion or garlicplanting is a promising area of research. Becausehigh sclerotial populations may rebound from just avery few infected plants, such integrated controlslikely will need to be applied regularly on infestedfields. For seed onions, the exceptionally longgrowing season may negate the effectiveness ofpre-plant fungicides.
Because S. cepivorum is inhibited above about75°F, production of spring planted, fall harvestedonions may be sustained in infested soils in regionssuch as the Columbia Basin, Treasure Valley, andSan Joaquin Valley. In these situations, rootinfections deeper in the soil profile do not penetratethe shallow, hot soil layer around bulb and stemplate. Reproduction in roots is very low. Suchcropping naturally stimulates most sclerotia butreduces the population of S. cepivorum, loweringthe white rot risk for subsequent overwinteredAllium crops in the same field
Introduction
This overview is not intended to provide detaileddifferences among regions and crops with respectto all Allium diseases. In general, diseases such asdowny mildew, purple blotch, fusarium plate rot,and pink root (of onion), and penicillium seeddecay, botrytis neck rot, and fusarium bulb rot (ofgarlic) are controlled reasonably in many yearsusing reasonably well-defined practices. Whenoutbreaks of these occur, losses may be substan-tial. In general, control programs including weatherprediction, fungicide applications, seed health, andselection are available and improving. This isespecially true with the new wave of highly effectivefungicides which have been introduced in recentyears, and others which likely will appear in the nextfew years. Except to point to particularly difficult orpending problems, discussion of these diseases willbe limited to the summary above. For additionalinformation, refer to the APS Compendium of Onionand Garlic Diseases (APS Press, 1995).
The Pacific Northwestern and Western states(California, Oregon, Washington, Idaho, andNevada) produce over 40 percent of the onions andnearly 100 percent of the garlic in the U.S. Muchsmaller production of leeks, shallots, chives, andother edible and non-edible Alliums also occurs.
With respect to Allium production, there are manyregional and sub-regional differences primarilycharacterized by climate, type of Allium crop grown,specific cropping season, and soil type. For somediseases, these differences have major influence.
Major types of Allium crops grown include:• Green bunching onions. Primarily south
central and southern California, coastal todesert climates.
• Full-season bulb onions. There are manytypes, ranging from short-season to long-season, mild through hot, even very hot fordehydrator types. For purposes of diseasediscussion, there can be distinct differencesbetween:a. Spring sown, fall harvested. This is typical
in the Columbia Basin of Washington andOregon, the Treasure Valley of easternOregon and western Idaho, the LakeLabish region and other areas aroundSalem, Oregon, and the Tulelake/KlamathBasin of Northern California and southcentral Oregon. This category can befurther subdivided betweeni. Hot summer production (Columbia
Basin, Treasure Valley)ii. Warm to cool summer production
(Lake Labish)iii. Cool to cold summer production
(Tulelake/Klamath Basin)b. Fall sown, summer harvested. This is
typical of the Walla Walla/Milton-Freewaterregion of northeast Oregon and southeastWashington.
c. Winter sown, summer harvested. Avariation which includes many acres of thedehydrator onions produced in the SanJoaquin Valley and the California desert.
• Onions for seed production. These may be:a. Seed-to-seed, sown in mid-summer and
harvested the following mid-summer(Central Oregon, Treasure Valley,Columbia Basin, northern and centralCalifornia, etc.)
b. Bulb-to-seed. In this variation, seed issown and a bulb is produced. The bulb isstored over winter and planted into thesame or another region for bolting.
• Garlic. All garlic is fall planted from cloves, andsummer harvested. Even though

174
garlic is grown from Washington through theCalifornia desert, all regions are muchalike with respect to fungal diseasesituations.
With respect to soil type, some diseases may act orrespond differently to control efforts if the soil isvery high in organic matter. In the western U.S.,peat soils (nearly 100 percent organic matter) arefound in the Lake Labish region and in theSacramento Delta area, although few onions areproduced in the Sacramento Delta in modern times.Relatively high organic soils (around 20 percent)are found in many fields in the Tulelake/Klamathregion.
Downy Mildew of Onions
This disease is characterized by the extreme speedat which it can spread. It is promoted by cooltemperatures, cloudy conditions, rainfall and/orsprinkler irrigation, and dew formation. In regions inwhich it occurs with some frequency, regularapplications of fungicides are made to preventepidemics from beginning. Once begun, the rate ofspread and the ability to apply additional effectivefungicides may depend on plant density, leafiness,canopy structure, etc. Any condition whichencourages high humidity, free moisture on foliage,poor canopy penetration by fungicides, etc., seemsto aggravate the situation.
With respect to integrated practices: Downymildew can be especially destructive on seedonions because: (a) the fungus may carry overfrom one season to the next, (b) it can be difficult toprovide good foliage coverage of effectivefungicides once scapes (seedstalks) haveelongated and canopies become relatively dense,(c) sprays may be curtailed during bee activity forpollination, and (d) the length of season allowsmuch recycling of spores. If bulb onions are grownnear seed onions, downy mildew activity in the seedcrop, especially if carried over from the previousyear, can cause an early epidemic spread in thebulb crops. In this situation, the regional level ofcontrol can be assisted by wide separation of seedand commercial crops, although such agreementand consensus may be hard to achieve. Workingagainst such cooperation is the fact that in someregions, wild Alliums are present in nearbyrangeland, and wild onion relatives may participatein downy mildew epidemics. Downy mildew seemsto occur least where there is a clear, onion-free gap
in the year, including the presence of wild Alliumsclosely related to domesticated onions.
Pink Root of Onions
Root infection by the soil-borne fungus P. terrestrisresults in reduced root systems and limited oniongrowth. This disease is worst where onions havebeen grown for many years, primarily because thefungus can grow on many other crops and plantsand does not decline readily in soil. Crop rotationlowers inoculum levels only marginally. The fungusis active at moderate to high soil temperatures.
Good genetic resistance is available and isbecoming more so, but the resistance is limited athigher soil temperatures (80°F). Resistant onionscan be seeded such that high soil temperatures areavoided early in their development, so that rootsystems are well developed prior to substantialdisease development; but this timing of seedingmay not fit with the desired onion maturity period forall regions.
Fumigants have been used to control pink root inmany regions, although these are ineffective in veryhigh organic soils. Because the long-term future ofall fumigant products remains uncertain, it is likelythat additional research on pink root will be requiredif and when fumigants are no longer available.
Botrytis Neck Rot of Onion (and Scape andUmbel Blight of Seed Onions)
Neck rot typically occurs in storage, but the bulbsare infected by B. allii in the field. Where onionsare marketed directly and consumed (e.g., WallaWalla Sweets) or processed without storage, neckrot is rarely a problem.
Spore sources are many, including rotting onions incull piles or in the field, or sclerotia on soil. Thecommon belief in the U.S. is that in nearly all years,all infection of commercial bulbs occurs at harvestwhen tops are cut, exposing damp neck tissues toinfection. The fungus then grows down the neckinto the bulb. (Similarly, on seed scapes andumbels, spores are believed to land, germinate,infect, and incite a local lesion, aided perhaps byany wounding present.) In general, this conceptaccounts for much of the disease seen in commer-cial onion crops, because when necks are well-cured prior to topping, a minimum of neck rotdisease results. Artificial drying of bulbs may

175
further reduce neck rot incidence, although if toomuch moisture is present during the dryingoperation, a secondary black mold (Aspergillusniger) can be created. For neck rot in onionstorage, losses may range from 0.25 to 25 percent(sometimes higher), primarily depending on sporeloads at harvest and conditions influencing bulbmaturity. Fungicides applied near to or at harvestare ineffective. For many onion types, the marketfavors large bulbs (ergo large necks), and high bulbprices sometimes require foregoing good neckcuring. These factors beyond a grower’s controlchronically aggravate botrytis losses. Carefulbalancing of onion variety and maturity, bulb size,and storage durations can allow some manage-ment of botrytis losses.
In a few years when cloudy, wet weather predomi-nates, bulbs may be found infected at the soil lineor basal plate in commercial fields, which elevatesthe damage in storage. In central Oregon seedonion fields, we commonly find infections at thebasal plate in many fields in the spring or earlysummer. This does not seem to create a problem ifthe plants are vigorous, but in an already weakstand of onions, such botrytis basal infections mayfurther weaken or even kill plants. Basal infectionsalso serve as another source of spores for scapeand umbel infections in seed crops, or for neckinfections for commercial bulb crops. Currently,there is no attempt to manage such basalinfections, although in central Oregon we didreduce plant losses in weakened stands bydirecting fungicide applications at the base of plants(data not shown).
Research in Great Britain indicated that B. alliispores infect green leaves all during the growingseason, growing systemically downward fromleaves into the neck (Maude & Presly, 1977a, b). Iftrue, neck infection may result, even when tops areallowed to dry completely in the field, although goodneck curing would reduce bulb infection. Similarly,if B. allii can grow asymptomatically in the plant,perhaps some scape or umbel blight might arisefrom infections which occur at some distance fromthe original infection and from much earlierinfection. Fungicides applied directly to scapes andumbels have provided poor control of scape andumbel blight. For bulb crops, necks already infectedfrom earlier leaf infections would not respond tosuch applications at or near harvest.
White Rot of Onions and Garlic (all Alliums)
Soil populations of S. cepivorum linger at damagingpopulations levels for decades; there is no knownsource of breeding resistance, and traditionalfungicide use has proven ineffective against highsoil populations. Infections may occur deep in thesoil, the fungus spreads plant-to-plant on rootsystems, and soil- and seed-applied fungicidesnear the bulb commonly do not last season long.Typically, infested fields become abandoned forAllium production. Recent research indicates soilpopulations of S. cepivorum may be nearlyeradicated with germination stimulants (Crowe, etal, 1990). Stimulants are applied in the absence ofan Allium crop; sclerotia germinate, and then thefungus dies from lack of a living Allium food base.Integrating this approach together with fungicidesapplied at onion or garlic planting (especially long-lasting fungicides applied deeper than traditional topreclude plant-to-plant spread among rootsystems), is a promising area of research.Because high sclerotial populations may reboundfrom a very few infected plants, such integratedcontrols likely will need to be applied regularly oninfested fields. For seed onions, the exceptionallylong growing season may negate the effectivenessof pre-plant fungicides.
Because S. cepivorum is inhibited above about75°F, production of spring planted, fall harvestedonions may be sustained in infested soils in regionssuch as the Columbia Basin, Treasure Valley, andSan Joaquin Valley. In these situations, rootinfections deeper in the soil profile do not penetratethe shallow, hot soil layer around bulb and stemplate. Reproduction in roots is very low. Suchcropping naturally stimulates most sclerotia butreduces the population of S. cepivorum, loweringthe white rot risk for subsequent overwinteredAllium crops in the same field. Example: in 1990,white rot occurred in an onion seed field in theTreasure Valley, raising concerns that this diseasewas perhaps recently introduced and might spreadthroughout the main commercial bulb crop.However, because white rot was so widespread inthe affected seed crop, this clearly was not the firstincidence of white rot in that particular field, whichhad been planted occasionally with seed onionsover several decades. Further, white rot wasknown to occur in many neighboring regions, withevery likelihood that sclerotia of S. cepivorum hadbeen introduced into the Treasure Valley manytimes over numerous years. Yet, white rot was

176
heretofore unknown in the regions’ main commer-cial onion bulb crops. Why was this so?
Soil temperature records for the Treasure Valleysuggested that it might be too warm at the bulblevel for white rot to occur. This is uncertain,however, because most temperature data shown toinfluence S. cepivorum was for constant tempera-tures in laboratory test systems, whereas diurnalfield temperatures fluctuate widely near the soilsurface. The Treasure Valley soil data indicated afluctuation swing both above and below theestablished threshold temperature for mycelialgrowth. To test this hypothesis, onions wereseeded in small plots in the infested field in April1991. Half of the onions were harvested in October1991, and no white rot was found on any harvestedbulbs. The other half was left to overwinter andwas harvested in July, 1992, at which point morethan 95 percent of the onions were dead or dyingfrom white rot infection on the bulb. During 1991,sclerotia were stimulated to germinate by onionroots, roots were infected below about 2 inches inthe soil, but no infections penetrated the upper soillayers to reach the stem plates. Between April andOctober, 1991, more than 95 percent of thesclerotial population was eliminated by naturalstimulated germination from onion roots. Ofcourse, with cool fall and spring temperatures,active S. cepivorum infections were no longerinhibited, and surviving sclerotia in the upper soillayers (and the few reproduced on roots) germi-nated to incite high disease in 1992.
Based on this and other field experience, itappears that development of S. cepivorum stopstotally when any daily temperatures fluctuate abovethe limit for mycelial growth. In the Treasure Valley,it seems likely that sclerotia have been introducedperiodically. But any white rot sclerotia introducedinto fields in which summer bulbs are grown mostlikely are eliminated; thus, the region sees only rarewhite rot occurrence in fields only planted tooverwintered seed onions. (Since the 1990 seedonion occurrence, white rot occasionally hasoccurred on garlic in home gardens in the TreasureValley.) Any switch in the Treasure Valley orColumbia Basin to widespread production of fall-planted, summer harvested onions or garlic wouldallow white rot to attack bulbs and reproduceabundantly, if S. cepivorum were present. Forcomparison, white rot is severe on overwinteredgarlic and winter-planted onions in the just-as-hotSan Joaquin Valley.
Soil temperature also seems to play a major role inwhite rot incidence and fungicidal control in theLake Labish region. In years with very warmsummers, the disease is inhibited during thesummer, only arising late in the season on thespring-seed onion crops. In those summers, whiterot incidence may be a few percent in untreatedfields, but nearly zero in fields in which preplantfungicides were used. In years with relatively coolsummers, white rot incidence may reach 40 percentin untreated fields, and perhaps 20 percent in fieldstreated with pre-plant fungicides. In this region,even the coolest summers partially contain white rotactivity, and this remains one of the few regions inthe world in which onion production can besustained in spite of the presence of regular whiterot activity. It is also one of the few regions in whichfungicides routinely have been beneficial.
Literature Cited
Compendium of Onion and Garlic Diseases. 1995,APS Press. H.F. Schwartz and S.K. Mohan,Eds. 54 pp. with photographs and illustrations.
Crowe, F.J., J. Debons, E. Redondo, T. Darnell, D.McGrath, J. Laborde, P. Koepsell, and M.Thornton. 1990. Use of germination syntheticstimulants of sclerotial germination as a methodof inoculum management of the Allium white rotfungus. pp. 140-159 (Biological and IntegratedControl section) In Proceedings of the 4thInternational Allium White Rot Workshop, June5-7, 1990, Neustadt/Weinstrasse, Fed. Rep.Germany.
Maude, R.B. and A.H. Presly, 1977a. Neck rot(Botrytis allii) of bulb onions. I. Seed-borneinfection in relationship to disease in the onioncrop. Ann. Appl. Biol. 86:163-180.
Maude, R.B. and A.H. Presly, 1977b. Neck rot(Botrytis allii) of bulb onions. II. Seed-borneinfection in relationship to disease in store andeffect of seed treatments. Ann. Appl. Biol.86:181-188.

177
Diseases are important limitations on winter wheatyields in Western Oregon. One of the most costlyspring diseases is Septoria, which has two species,S. tritici and S. nodorum. The disease is usuallypresent, and the fungi can survive on wheatresidue, volunteer plants, and some weeds. Newplants can be infected in the fall. If wet conditionspersist in the spring, with normal Willamette Valleytemperatures, S. tritici will be found on the leavesand is the area’s most common type of infection. Ifrains continue later into the spring and tempera-tures warm, this favors the development of the S.nodorum spores.
Genetic resistance to this disease would be themost effective, economical, and environmentallysound method of control, but at the present, noneof the commonly grown varieties have resistance.
In 1990, the Bayer Corporation started work todevelop a cereal disease diagnostic model thatwould enable growers to manage wheat diseasesmore effectively. This work was carried on in wheatproduction areas of the U.S. by company research-
Integrated Management and Optimization of Fungicides to Control Septoria in Winter Wheat
John Leffel, JL Agricultural ConsultingHillsboro, Oregon
ers, university plant pathologists, and otheragricultural scientists.
From this work, the Bayer Fungicide OptimizationSystem (BAYFOS) was developed. Using theproper fungicide at the proper time is an integralcomponent of the diagnostic system. It recom-mends that a fungicide only be applied when thedisease level triggers the diagnostic model for a“time to spray” decision. This can occur any timebetween Feekes 8.0 to 10.0.
The system allows for determination of the amountof infection on the lowest green leaf at a particularstage of growth, and as the wheat plant grows, theindicator leaf moves up. For Septoria, when25 percent of the indicator leaf is infected, thesystem is triggered, and it then is time to apply afungicide.
A grower should select a fungicide that allowsflexible application timing, and one that can be usedfrom early flag through heading. The BAYFOSsystem provides wheat growers with a cost-effective disease control program that maximizesthe potential for a positive return-on-investment.

178
Background
Economic and Environmental Impact
Septoria tritici and S. nodorum are the major foliardiseases of winter wheat in western Oregon.Winter wheat was grown on 61,000 acres in theWillamette Valley in 1998 and accounted for9 percent of state wheat production. Currentlygrown cultivars are susceptible or at best havemoderate resistance; it is estimated that over75 percent of acreage is sprayed annually withfungicide. At a minimum cost of $15 per acre forapplication and material, this disease represents a$685,000+ annual expense for growers plus theuse of at least 3,000 pounds of fungicide activeingredient in western Oregon fields.
Causal Organisms
S. tritici, leaf blotch, is most common. It is an earlyseason disease with wind-blown spores alreadypresent in the Valley in the fall prior to wheatplanting in October. It destroys leaf tissue and cancause head infections. S. nodorum, glume blotch,has been less common historically but is increas-ing in prevalence. The introduction of S. triticiresistant varieties may be playing a role in theincrease of S. nodorum, which is observedprimarily as a later-season head blight, although itcan cause leaf lesions as well. Both Septoriascause reductions in grain yield of 10 to 15 percentor more when not controlled. They both also causereductions in grain quality through shrunken grainand resultant poor test weights. In 1997 and 1998,growers observed test weights as low as 52 lb/bu(a typical weight is 58 to 60), even in some sprayedfields. In more typical years, test weights of 55 to56 lb/bu are not uncommon in severely infestedfields. Hence, in addition to a yield reduction perse, crop value also may be reduced significantly bythese diseases.
The incidence of Septoria appears to haveincreased through the 1980s to today’s severe
Alternative Strategies for Septoria Management in the Willamette Valley
R. Karow1, E. Marx1, P. Martinez2, S. Aldrich-Markham3, and S. Coakley2
1 Dept. of Crop and Soil Science, Oregon State University2 Dept. of Botany and Plant Pathology, Oregon State University
3 Yamhill County Extension and Dept. of Crop and Soil Science, Oregon State UniversityCorvallis, Oregon 97331
levels in some parts of the Valley. Possible reasonsinclude growth of a very susceptible variety,Stephens, since the late-1970s loss of dinosebherbicide (which was widely used on wheat andlikely sanitized fields in mid-winter) and changes inweather patterns. Mild, wet winters and wet springsand early summers favor Septoria. Work by Mundtand Cowger also suggests that S. tritici goesthrough several cycles of sexual recombination inwestern Oregon each year. It previously wasthought that Septoria only had one sexual cycle peryear. With additional opportunities for recombina-tion, selection for increased virulence is possible. Acase in point is the variety Gene, which wasreleased as a S. tritici resistant variety, but wasovercome by disease in less than 3 years.
Control Strategies
Plant Resistance
As with many diseases, horizontal resistance wouldbe the best control strategy. Several PacificNorthwest varieties—Yamhill, Hill81, Madsen,Foote—have some level of Septoria resistance, butall still are responsive to fungicide sprays. Sourcesof resistance are present in world germplasm(France, Germany, Eastern Europe) and are beingincorporated into locally adapted material.
Fungicides
Fungicide control work was started in the early1980s by OSU Extension and research faculty.Years of study showed that a single application offungicide at flag leaf emergence was generally themost effective both biologically and economically,with some exceptions. This is still the standardpractice to this day.
Benlate (DuPont) and Manzate (DuPont) were thefirst materials used and are still used today assecond application sprays. Tilt (Novartis;

179
propicanozile) was introduced in the late 1980s andbecame the product of choice, due both to ease ofuse and biological effectiveness. The first newproduct to be labeled since that time is Quadris(Zeneca Ag Products; Azoxystrobin), whichreceived a label in early 1999. DuPont, Novartis,and Bayer also have experimental materials at thefield evaluation stage that contain active ingredientssimilar to that in Quadris. Additional registrationsare anticipated in the next few years.
Threshold Determination Techniques
As both Septoria diseases are affected significantlyby rainfall (moisture is needed for spore germina-tion and rain splash speeds spore spread), sprayingmay not be necessary in all years. Over the pastfew years, south Valley fields have shown early,severe disease and have needed to be sprayed.But, many north Valley fields have shown lessdisease, and it may be possible to spray selectively;but reliable techniques for determining the need fora fungicide are not available. In 1998, we
evaluated two spray threshold measurementtechniques: the Bayer Disease Diagnosis System,which relies on an assessment of indicator leaves,and a Novartis On-site test kit, which is animmunoassay system.
Bayer Disease Diagnosis System©
Bayer Corporation has developed fungicide spraythreshold procedures for several cereal diseases.In each, the goal is to protect upper plant leaves byassessing disease levels on lower leaves andapplying fungicide when thresholds are reached.Thresholds for Septoria are a given number oflesions containing pycnidia (fruiting structures) onindicator leaves. Indicator leaves change as theplant matures. To test the Bayer system, replicatedplots of Stephens winter wheat—a highly suscep-tible cultivar—were established at Hyslop Farm andsprayed with fungicide when system thresholdswere reached. A data summary for this trial is givenin Table 1.
Table 1. 1998 Hyslop Farm Bayer Decision Aid trial (variety: Stephens SWW).Test
Yield weight Protein 1,000 K HeightTreatment (bu/a) (lb/bu) (%) (g) (cm)Aid - 3 spray 115 59.3 8.8 48.9 113Aid - 2 spray 93 57.5 9.5 43.4 119Standard 86 56.3 9.8 39.9 115Aid - 1 spray 74 53.4 10.9 37.2 115Control 62 51.5 11.4 33.6 114
Average 86 55.8 10.0 40.6 115PLSD (5%) 9 2.0 1.0 3.2 3PLSD (10%) 7 1.7 0.8 2.6 2CV 7 2 6 5 2P-value 0.00 0.00 0.00 0.00 0.01
The 1998 growing season was conducive toSeptoria, and threshold levels were reached on allassessment dates. Three fungicide applicationswere made and were economically viable. At $15per application and current wheat prices ofapproximately $3 per bushel, yield increases of atleast 5 bushels would be needed to recover spraycosts (assuming there is no crop damage throughuse of aerial sprays or tramlines). The “standard”spray timing is at flag leaf emergence and wasmore effective than a single spray at the firstthreshold level, but less effective than a double or
triple fungicide application (10 percent probabilitylevel) in this year. Typically, multiple fungicideapplications have not been justified economically.
Threshold trials also were conducted in YamhillCounty in cooperation with the Yamhill Countycrops agent and growers. Data from their trials areshown in Tables 2 and 3, respectively. A single “50percent headed” application also was made inthese trials. This type of application would betypical of a “salvage” spray if a grower missedearlier spray windows.

180
Table 2. 1998 Septoria trial in Yamhill County—Ellingson Site (Variety: MacVicar).Yield (bu/a) TW (lb/bu) Protein (%) Height (cm)
Bayer 1 and 2 103 61.7 8.7 107Flag/Bayer 1 91 61.2 8.7 10650% head 79 60.1 8.8 105Control 68 57.3 8.0 107
Average 85 60.1 8.6 106PLSD (5%) 3 0.5 NS NSPLSD (10%) 3 0.4 NS NSCV 2 0 8 1P-value 0.00 0.00 0.46 0.35
Table 3. 1998 Septoria trial in Yamhill County – Sweeney Site (Variety: Madsen).Yield (bu/a) TW (lb/bu) Protein (%) Height
(cm)Bayer 1 97 61.0 9.7 106Flag 95 59.9 9.7 106Bayer 1 and 2 95 60.6 10.0 10650% head 92 61.0 9.3 106Control 74 56.9 10.5 106
Average 90 59.9 9.9 106PLSD (5%) 5 1.5 NS NSPLSD (10%) 4 1.2 NS NSCV 3 1 7 2P-value 0.00 0.00 0.42 0.99
In the Ellingson trial (Table 2), the standard flag leafemergence and first Bayer threshold coincided.These sprays were significantly better than theunsprayed control or the 50 percent headed spray.The 50 percent headed spray was economicallyuseful, but did not bring yield nor test weight levelsto those of a properly timed spray. In this trial, as atHyslop, a multiple application was both statisticallyand economically significant.
In the Sweeney trial, all fungicide treatments weresimilar in effect and significantly improved yield andtest weight of harvested grain in comparison to theunsprayed control.
These tests indicate that the Bayer DiseaseDiagnosis System has promise. It has been usedsuccessfully in other parts of the country and hasbeen effective in trial work done in WashingtonCounty. We will conduct additional tests with theBayer system in 1999.
Novartis Crop Disease Diagnostics
Novartis Crop Protection has developed immunoas-say disease diagnosis systems for several wheatdiseases (Septoria, eyespot and fusarium) as wellas for corn and banana. These are ELISA (enzymelinked immunosorbent assays) or PCR (polymerasechain reaction) technologies. Septoria On-Site© is afield-based diagnosis system that can be com-pleted in less than 10 minutes once sample leavesare collected. Leaves are collected and macerated,and the expressed liquid is combined with assaysolutions in a syringe. A color reaction indicates thepresence of fungal tissue. Kits for both S. tritici andS. nodorum are available. Septoria Watch© is labbased system that can be used by a disease clinicor agrochemical dealer to test grower leaf samplesfor Septoria fungi.
We used a beta-test version of the Septoria On-Sitekits in 1998, but found them to be more subjective

181
than is desirable. Also, they were of little use in1998 as obvious disease symptoms were presenton leaves that were to be evaluated for incipientdisease infection. We will evaluate new versions ofthe field kits in 1999. If effective, these kits couldbe very useful. Each year we have a large numberof fields in the northern Willamette Valley that donot show disease symptoms at the late flag leafgrowth stage when a fungicide application shouldbe made to be most effective. Some of these fieldslater will develop severe disease infestations.
These kits may allow us to test these fields forincipient infections and to make better fungicideapplication decisions.
Conclusion
Plant resistance ultimately will be the solution to theSeptoria problem in western Oregon; but, untilresistant, adapted varieties are available, diseasethreshold and diagnosis tools likely will be useful inmaking wiser fungicide application decisions.

182
Feeding on Transgenic Bt-Potato Plants by Phytophagous Heteropteran Predators
Christine A. Armer1, Ralph E. Berry1, Marcos Kogan21Department of Entomology, Oregon State University
2 Integrated Plant Protection Center, Oregon State University
AbstractTransgenic potato plants have been developed
to express the toxin gene of the bacterium Bacillusthuringiensis tenebrionis (Btt). Although thesetransgenic plants provide control of the pestiferousColorado potato beetle (Leptinotarsa decem-lineata), the toxin also is available to nontargetorganisms feeding on the plant, including a group offacultatively phytophagous heteropteran predators.This study examines the effects on several preda-tors of feeding on Btt-potato plants. We examinedNabis spp., Geocoris spp., Orius tristicolor, andLygus hesperus feeding on leaf disks of Btt andnon-Btt plants, and found no detrimental effects onthe longevity of these predators. Thus, thesefindings suggest that direct plant-feeding by thesepredators should not reduce their capacity toprovide biological control of Colorado potato beetleand other potato pest insects.
Key words: Nabis spp., Geocoris spp., Oriustristicolor, Lygus hesperus, facultative phytophagy,Bt nontarget effects
Introduction: Bacillus thuringiensis tenebrionisToxin as a Plant-produced Insecticide
As insecticides become less frequently useddue to pesticide resistance and toxicity concerns,alternative methods for controlling agricultural pestsmust be found to maintain adequately high cropyields. The bacterium Bacillus thuringiensis (Bt)produces a toxic protein that kills a wide range ofinsects by destroying the integrity of the gut lining,which alters the balance of electrolytes in thehemocoel (Martínez-Ramírez and Real, 1996).B. thuringiensis first was studied for biologicalcontrol of lepidopteran pests in the 1920s and hasbeen used with limited success as a spray-applied“biological pesticide” (van den Bosch et al., 1982;Gould, 1998). The bacteria and their toxins degraderapidly in UV light, and application must be timedcarefully for effectiveness (Ferro, 1994). In the pastdecade, researchers have isolated the toxin genefrom different strains of B. thuringiensis and havesuccessfully expressed the bacterial gene in thegenome of several plants. Corn, cotton, tobacco,
potatoes, and eggplant, as well as other crops,have been transformed to express the toxin tocontrol caterpillar and beetle pests.
Potato plants have been transformed with theBacillus thuringiensis tenebrionis (Btt) CryIIIA delta-endotoxin gene (Perlak et al., 1993) to control theprimary pest of potatoes in the United States, theColorado potato beetle (Leptinotarsa decem-lineata). This insect costs U.S. potato growersapproximately $100 million annually to control(Perlak et al., 1993) and has developed resistanceto nearly all pesticides currently available (Ferro,1994).
With the use of Bt-expressing transgenic potatoplants, fewer pesticides will be used on potatocrops, which will allow natural enemies to surviveand provide additional control of pest insects. Awide range of natural enemies feed on the Colo-rado potato beetle and other pests of potatoes.Coccinellids, or lady beetles, carabids, lacewings,and several heteropterans are generalist predatorsthat feed on aphids, beetle eggs, and young larvaeon potatoes (Hazzard et al., 1991; Hilbeck andKennedy, 1996; Hough-Goldstein et al., 1993).These predators frequently are killed by the applica-tion of pesticides (Hilbeck and Kennedy, 1996), andwithout spray applications of manufactured pesti-cides, these predators can control the pestarthropods remaining after Bt application. However,if the Bt toxin adversely affects predators, theycannot provide maximum control of pest insectsremaining on the plants.
Bt Toxin Effects on Nontarget OrganismsThe application of Bt toxin as a spray negatively
affects many nontarget insects, including weedbiological control agents (James et al., 1993) andhoneybees (Flexner et al., 1986). Integration of thetoxin in the crop plant genome reduces the nontar-get species affected, but the toxin still can reachnon-pest insects. Keller and Langenbruch (1993)provide a list of species found to be insensitive tothe toxic effects of Btt. Most of the insect specieslisted are pests, with only one predator, Chrysoperlacarnea, having been tested. Although insect

183
members of seven orders were examined, noheteropterans were listed as species examined fornontarget effects.
Since Keller and Langenbruch’s 1993 compila-tion, several researchers concerned with nontargeteffects of the toxin have examined beneficialinsects feeding both directly on the transgeniccrops, and on prey fed on transgenic crops. Ladybeetles were not affected by consuming aphids fedon transgenic potato plants (Dogan et al., 1996),but lacewing larvae showed a delayed developmentand increased mortality when fed lepidopteran preyreared on transgenic corn plants (Hilbeck et al.,1998). Some predators feed on pollen to supple-ment a prey diet, and so can ingest the toxin inpollen from transgenic plants. A recent studyshowed no negative effects of feeding on pollenfrom transgenic corn plants by predatory ladybeetles, lacewings, and insidious flower bugs(Pilcher et al., 1997).
Some heteropteran predators actually have hadhigher populations in fields of Bt potatoes than innontransgenic fields (Reed et al., 1993). However,this seems to be due to a lack of prey in thenontransgenic fields. The Colorado potato beetlesdecimated the potato plants in the control(nontransgenic) fields, had no more food, and sothe beetle population fell to nearly zero and no foodwas available for predators (G. Reed, pers. com.).Therefore, the Bt toxin potentially could havedetrimental effects on predator populations, but notas negative as a complete lack of prey.
A key group of predators, members of theHeteroptera, feed directly on plants for moistureand low levels of nutrients (Coll, 1998; Naranjo andGibson, 1996). Several heteropteran predatorshave the ability to feed on the mesophyll of leaves(Cohen, 1990; Armer et al., 1998), where highlevels of toxin are expressed (~0.1% of total leafproteins, Perlak et al., 1993). Therefore, thesepredators would have access to high doses of toxinwhen feeding on plants. The study described belowexamines the effects of direct feeding on transgenicBt potato plants on the longevity of plant-feedingpredatory Heteroptera.
Testing Btt Effects on Predatory HeteropteraSeveral species of heteropteran predators are
common in potato cropping systems, includingGeocoris punctipes and G. pallens, Orius tristicolor,Nabis spp., and Lygus hesperus. The first four feedon lepidopteran eggs and small caterpillars, aphids,and small Colorado potato beetle larvae. Thesepredators are useful in reducing levels of the
Colorado potato beetle as well as the disease-vectoring green peach aphid. Lygus hesperus feedsheavily on plants, and is considered a pest in somecrops; this species was included as a positivecontrol to indicate effects on heteroptera that feedextensively on plants.
Insects were provided fresh leaf disks daily, andwere isolated without prey to force the predators tofeed more extensively on the leaf than they mightwith prey; insects often go without prey for severaldays in the field, so this situation is not unrealistic.Field-collected predators were used within a day ofcollection. Half the insects received transgenic Btleaf disks from greenhouse-grown Newleaf®(transgenic Russet Burbank variety) plants (seeArmer et al., 2000 for more detailed description).The other insects received control disks cut fromnontransgenic Russet Burbank leaves. Becauseimmature insects often are more susceptible totoxins than are adults (for example, see Zehnderand Gelernter, 1989), we tested both adults andimmature insects, as available.
No differences were found in longevity betweeninsects feeding on transgenic Bt plants andnontransgenic plants (Figures 1-4), p=0.11 to 0.90(Mann-Whitney U test). Orius tristicolor lived from1-6 days, Geocoris spp. individuals lived 1-11 days,Nabis spp. lived 1-13 days, and L. hesperus lived1-17 days on the leaf disks without prey. Althoughlongevity cannot be directly compared betweenfield-collected adults and immatures, nymphs didnot seem to be more susceptible to the Bt toxinthan adults (Figures 1-4).
We also examined transgenic plant-fed preda-tors with an ELISA for the Bt toxin to see whetherthe insects ingested the toxin. None of the nymphalor adult insects examined ingested or retainedsignificant amounts of the toxin. Additionally,experiments indicated that the predators did notdefecate significant amounts of active toxin (CAA,unpublished data).
Safety of Bt-transgenic Plants for HeteropteranPredators
The field use of transgenic potato plantsexpressing the Bacillus thuringiensis tenebrionisdelta-endotoxin should not reduce the longevity andcontrol potential of the facultatively phytophagousheteropteran predators examined here. Thepredators might be unaffected by the toxin simplybecause the toxin does not bind to receptors in themidgut (Pietrantonio et al., 1993). Because intacttoxin does not pass through the digestive system ofthese predators, they either break down the toxin to
184
an inactive form that is not recognized by the ELISAantibodies, or they only ingest minute quantities ofthe toxin. The ELISA results support either of thesetwo explanations, as do the studies on defecation ofactive toxins. The CryIIIA protein found in Bttenebrionis bacteria seems to be a protoxin thatmust be cleaved with chymotrypsin to be activatedto its toxic form (Martínez-Ramírez and Real,1996). However, the active toxin is expressed inNewleaf potato plants (J. Feldman, Monsanto Co.,pers. com.). The active toxin thus should beavailable to plant-feeding insects. The toxin proteindoes have an intestinal brush-border bindingdomain (Martínez-Ramírez and Real, 1996),binding only to appropriate receptor sites. TheCryIIIA toxin seems to affect only selected chry-somelids, which might be due to either gut enzymespecificity or binding domain specificity. The toxin ishighly host-specific, and some other chrysomelidpests, including flea beetles, are not affected by thetoxin (R.E.B., pers. obs.). These other insectspresumably do not have the appropriate toxinbinding sites; however, the toxin might affectnontargets feeding on organisms that do have theappropriate binding sites. The toxin found in Btcorn, CryIAb, might affect nontarget insects oncethe protoxin has been digested to the active form(Hilbeck et al., 1998) by the target insect, suggest-ing the CryIAb toxin specificity might not be causedby binding domain specificity.
The L. hesperus individuals examined hereshowed a trend found in other facultatively phy-tophagous heteroptera (Coll, 1998), in which earlyinstars can survive longer without prey than canolder nymphs. This might allow younger instars,which are too small to feed on most prey items, todevelop through the early stages before prey arenecessary for survival. The Nabis spp. early instarsstudied here did not survive longer periods withoutprey; differences between Nabis spp. andL. hesperus patterns of phytophagy and survival inearly instars might be due to evolutionary back-grounds of the two insects. Nabis spp. arecimicomorphs, and probably have been primarilypredaceous far longer than L. hesperus, apentatomomorph, has been a prey-feeder (Cohen,1990). Lygus hesperus seems to be more adaptedto feeding on plants, and so might be able to derivenutrients from the plant tissues that Nabis spp.cannot access. Differences in salivary and gutenzymes and plant feeding sites might affect whatnutrients, as well as what toxins, an organism hasaccess to. Thus, it is important to examine preda-tors of different evolutionary lineages for responses
to toxins in insect-resistant plants. Geocoris spp.are predators that belong to the pentatomomorphlineage of heteropterans (Cohen, 1990), and sothey might access nutrients and toxins that otherheteropteran predators, such as Nabis spp. andOrius spp., would not ingest. Immatures ofGeocoris spp. were not available for experimenta-tion at the time the above study was conducted.The possibility remains, although unlikely due to thereasons discussed above for lack of toxin effects onheteropterans, that Geocoris spp. early instarsmight be affected by Btt toxin when otherheteropteran predators are not.
Future Research Goals for Biocontrol Agent-Bt-transgenic Plant Interactions
Several benefits arise from toxin expression inthe plant (Rice and Pilcher, 1998). The plant isresistant to insect feeding at all times, not just aftera bacterial spray application. Nontarget insectspresent in the fields, but not feeding on thetransgenic plants, will not be affected by the toxinas would insects under a spray-application of thebacteria. However, the constant presence of anactive toxin expressed throughout the plant poten-tially increases the rate at which target insects willdevelop resistance to the toxin, and Coloradopotato beetle already has developed resistance tothe toxin in laboratory colonies (Whalon et al.,1994). Additionally, the toxins might affect non-heteropteran nontarget insects that do feed on theplants or on prey feeding on the transgenic plants.
Studying the effects of pest control methods onbeneficial insects clearly is important. As we losethe use of many insecticides, both biological andchemical, to pesticide resistance in pest insects,biological control agents will become more impor-tant in agriculture. Studies in the 1960s (Ridgway etal., 1967) indicated that beneficial heteropteranpredator populations were reduced with the use ofsystemic pesticides; these predators clearly feed onplants, and so any toxin in or on the plant that isactive against a pest also should be tested on thesebeneficial insects. Although our results indicate thetoxin expressed by transgenic Bt potatoes is nottoxic to the beneficial insects studied here, we mustcontinue testing new pest control methods onbeneficial predators and parasites. The toxinexpressed by the Bt-transgenic plants apparently isspecific to beetles, although other insect groups,such as the heteroptera, have not been testedextensively for susceptibility to the toxin. Futurework should focus on predatory beetles feeding onBt-fed hosts such as the

185
Colorado potato beetle. Dogan et al.’s (1996) studyof coccinellids feeding on Bt-fed aphids was apositive step in this direction; however, aphids feedon the phloem, where little toxin is available. Otherinsects that consume the mesophyll of the plant,where toxin expression is highest, should beexamined as prey for beetle predators. Hilbecket al’s (1998) work showed that mesophyll-feedingprey, such as lepidoptera, might be toxic to preda-tors.
The use of Btt toxin-expressing transgenicplants for beetle control seems to be compatiblewith the use of heteropteran predators in IPMsystems. The use of transgenic crops, whencombined with methods to slow the development ofpest resistance to the toxin (Whalon et al. 1994),should encourage the activity of biological controlagents in cropping systems. Fewer insecticides willbe applied to crops, so predator and parasitepopulations can increase to levels at which thesebeneficial organisms can provide additional controlof insect pests. The use of various intercroppingand weed management practices might increasethe abundance of natural enemies. Thus, the use oftransgenic crops, in combination with other prac-tices to encourage beneficial organisms, will allowus to reduce pesticide usage while better controllingarthropod pests.
References
Armer, C.A., R.E. Berry, and M. Kogan (2000)Longevity of phytophagous heteropteranpredators feeding on transgenic Btt-potatoplants. Entomologia experimentalis et applicata95:329-333.
Armer, C.A., R.N. Wiedenmann, and D.R. Bush(1998) Plant feeding site selection on soybeanby the facultatively phytophagous predatorOrius insidiosus. Entomologia experimentalis etapplicata 86:109-118.
Cohen, A.C. (1990) Feeding adaptations of somepredaceous hemiptera. Annals of the Entomo-logical Society of America 83:1215-1223.
Coll, M. (1998) Living and feeding on plants inpredatory Heteroptera. In: PredatoryHeteroptera: Their Ecology and Use in Biologi-cal Control. Thomas Say Publications inEntomology Proceedings. Coll, M. andJ.R. Ruberson (eds.). Entomological Society ofAmerica, Lanham, MD.
Dogan, E.B., R.E. Berry, G.L. Reed, and P.A.Rossignol (1996) Biological parameters ofconvergent lady beetle (Coleoptera:
Coccinellidae) feeding on aphids (Homoptera:Aphididae) on transgenic potato. Journal ofEconomic Entomology 89:1105-1108.
Ferro, D.N. (1994) Biological control of the Colo-rado potato beetle. In: Advances in Potato PestBiology and Management. Zehnder, G.W., ed.APS Press, St. Paul, MN.
Flexner, J.L., B. Lighthart, and B.A. Croft (1986)The effects of microbial pesticides on nontar-get, beneficial arthropods. Agriculture, Ecosys-tems, and Environment 16:203-254.
Gould, F. (1998) Sustainability of transgenic insecti-cidal cultivars: integrating pest genetics andecology. Annual Review of Entomology 43:701-726.
Hazzard, R.V., D.N. Ferro, R.G. Van Driesche, andA.F. Tuttle (1991) Mortality of eggs of Coloradopotato beetle (Coleoptera: Chrysomelidae) frompredation by Coleomegilla maculata (Co-leoptera: Coccinellidae). Environmental Ento-mology 20:841-848.
Hilbeck, A., M. Baumgartner, P.M. Fried, andF. Bigler (1998) Effects of transgenic Bacillusthuringiensis corn-fed prey on mortality anddevelopment time of immature Chrysoperlacarnea (Neuroptera: Chrysopidae). Environ-mental Entomology 27:480-487.
Hilbeck, A. and G.G. Kennedy (1996) Predatorsfeeding on the Colorado potato beetle ininsecticide-free plots and insecticide-treatedcommercial potato fields in eastern NorthCarolina. Biological Control 6:273-282.
Hough-Goldstein, J.A., G.E. Heimpel, H.E.Bechmann, and C.E. Mason (1993) Arthropodnatural enemies of the Colorado potato beetle.Crop Protection 12:324-334.
James, R.R., J.C. Miller, and B. Lighthart (1993)Bacillus thuringiensis var. kurstaki affects abeneficial insect, the cinnabar moth (Lepi-doptera: Arctiidae). Journal of EconomicEntomology 86:334-339.
Keller, B., and G.A. Langenbruch (1993) Control ofcoleopteran pests by Bacillus thuringiensis. In:Bacillus thuringiensis, An EnvironmentalBiopesticide: Theory and Practice. Entwistle,P.F., J.S. Cory, M.J. Bailey, and S. Higgs, eds.John Wiley & Sons Ltd., New York.
Martínez-Ramírez, A.C. and M.D. Real (1996)Proteolytic processing of Bacillus thuringiensisCryIIIA toxin and specific binding to brush-border membrane vesicles of Leptinotarsadecemlineata (Colorado potato beetle). Pesti-cide Biochemistry and Physiology 54:115-122.

186
Naranjo, S.E. and R.L. Gibson (1996) Phytophagyin predaceous Heteroptera: effects on lifehistory and population dynamics. In:Zoophytophagous Heteroptera: Implications forLife History and Integrated Pest Management,Thomas Say Publications in EntomologyProceedings. Alomar, O. and R.N.Wiedenmann (eds.). Entomological Society ofAmerica, Lanham, MD. 202 pp.
Perlak, F.J., T.B. Stone, Y. M. Muskopf,L.J. Petersen, G.B. Parker, S.A. McPherson,J. Wyman, S. Love, G. Reed, D. Biever, andD.A. Fischhoff (1993) Genetically improvedpotatoes: protection from damage by Coloradopotato beetles. Plant Molecular Biology 22:313-321.
Pietrantonio, P.V., B.A. Federici, and S.S. Gill(1993) Interaction of Bacillus thuringiensisendotoxins with the insect midgut epithelium.In: Parasites and Pathogens of Insects, Volume2: Pathogens. Beckage, N.E., S.N. Thompson,and B.A. Federici, eds. Academic Press, SanDiego.
Pilcher, C.D., J.J. Obrycki, M.E. Rice, andL.C. Lewis (1997) Preimaginal development,survival, and field abundance of insect preda-tors on transgenic Bacillus thuringiensis corn.Environmental Entomology 26:446-454.
Reed, G.L., K. Puls, A.S. Jensen, J. Feldman, andR.E. Berry (1993) The effect of Colorado potatobeetle control measures on nontargetarthropods. Proceedings of the 1993 Washing-ton State Potato Conference & Trade Fair,pp. 125-140.
Rice, M.E. and C.D. Pilcher (1998) Potentialbenefits and limitations of transgenic Bt cornfor management of the European corn borer(Lepidoptera: Crambidae). American Ento-mologist 44:75-78.
Ridgway, R.L., P.D. Lingren, C.B. Cowan, Jr., andJ. W. Davis (1967) Populations of arthropodpredators and Heliothis spp. after applicationsof systemic insecticides to cotton. Journal ofEconomic Entomology 60:1012-1016.
van den Bosch, R., P.S. Messenger, andA.P. Gutierrez (1982) An Introduction toBiological Control. Plenum Press, New York.247 pp.
Whalon, M.E., U. Rahardja, and P. Verakalasa(1994) Selection and management of Bacillusthuringiensis-resistant Colorado potato beetle.In: Advances in Potato Pest Biology andManagement. Zehnder, G.W., ed. APSPress, St. Paul, MN.
Zehnder, G. and W. Gelernter (1989) Activity ofM-One formulation of a new strain of Bacillusthuringiensis against the Colorado potatobeetle (Coleoptera: Chrysomelidae): relation-ship between susceptibility and insect lifestage. Journal of Economic Entomology82:756-761.
Acknowledgments: Many thanks to Dr. VaroGvakharia for help with protein extraction; toGlennon Rogan and Monsanto Co. for runningELISAs; to Robert Henderson and the OSU SeedCertification Program for providing seed potatoes;and to Jason Kilgore, Paul Pratt, Dan Slone, andKaren Wetherill for helping check longevity of theinsects.

187
non-BtBt
7
6
5
4
3
2
1
0
aver
age
long
evity
(day
s)
female male fifth fourth third second instar instar instar instar
44
4243 42
30 27
19 18
2830 16
20
Figure 1. Average longevity of Lygus hesperus feeding on transgenic Btt leafdisks and control Russet Burbank leaf disks. Numbers over bars indicatesample size.
non-BtBt
5
4
3
2
1
0
aver
age
long
evity
(day
s)
female male fifth fourth third second instar instar instar instar
4042
4644 29
27 1415 15 16
4 5
Figure 1. Average longevity of Nabis spp. feeding on transgenic Btt leaf disksand control Russet Burbank leaf disks. Numbers over bars indicate samplesize.

188
Figure 4. Average longevity of Orius tristicolor feeding ontransgenic Btt leaf disks and Russet Burbank leaf disks.Numbers over bars indicate sample size.
non-BtBt
5
4
3
2
1
0
aver
age
long
evity
(day
s)
female male
22
26 2726
Figure 1. Average longevity of Geocoris spp. feeding on transgenic Btt leafdisks and control Russet Burbank leaf disks. Numbers over bars indicatesample size.
non-BtBt
5
4
3
2
1
0
aver
age
long
evity
(day
s)
female male fifth instar
42 42
44 43
47

189
Abstract
The most important diseases affecting grass seedproduction in Oregon include rusts, choke, blindseed, ergot, leaf spots, and seed gall. Rust is themost serious disease, costing the industry over$7 million annually in fungicide costs alone. Recentprogress in disease prediction and development ofdisease resistance will provide an effective meansof reducing fungicide applications. An understand-ing of the biology and epidemiology of blind seeddisease has led to effective cultural controls tomanage the disease in the absence of field burn-ing. Research on these and other diseases indi-cates that an integrated approach, including timingof fungicide applications, disease resistance, andsimple cultural management practices (such asuse of disease-free seed, planting seeds at leastone-half inch deep, maintaining adequate fertiliza-tion, and harvest practices to reduce seed shatterand minimize seed left in the field) can provideeffective and economically sound control of adiverse array of pathogens affecting production ofgrass seed.
Introduction
Grass seed for forage and turf in the PacificNorthwest is an important commodity for domesticand export markets. About 80 percent of the U.S.temperate forage and turf grass seed is producedin the Pacific Northwest. The bulk of the productionis in Oregon, with over 400,000 acres planted tograss for seed (Sears, 1998). Grasses grown forseed in Oregon include bentgrass, fescues,ryegrasses, and orchardgrass. About 90 percent ofU.S. ryegrass production occurs in the WillametteValley of Oregon.
During the 1940s, blind seed disease, caused bythe fungus Gloeotinia temulenta, threatenedproduction of ryegrass seed in the WillametteValley. By the mid 1940s, field burning was foundto control the disease; and by the late 1940s, thepractice was accepted. This marked the beginningof field burning as a management tool for control ofblind seed disease. Field burning subsequently
Integrated Pest Management ofDiseases of Grasses Grown for Seed in Oregon
Stephen Alderman and William PfenderUSDA-ARS National Forage Seed Production Research Center
Corvallis, OR 97331
became the principal management tool not only forblind seed, but other diseases, weeds, insects, andfor removal of straw residues (Hardison, 1980).
In 1991, the Oregon Legislature passed legislationto limit field burning to 40,000 acres annually after1997. In response to concern about the reappear-ance of blind seed, surveys were conducted duringthe early 1990s to determine blind seed level ingrass seed produced in the Willamette Valley. In1997, several fields of tall fescue with a high level ofblind seed (up to 25 percent infected seed) werefound. Field burning was used to remove the highlevel of contamination, and information aboutcultural management practices to control thedisease was distributed to growers.
The single greatest threat to production of perennialryegrass and tall fescue is from a group of fungicommonly known as “rust fungi” (Puccinia sp.),because of rusty-colored lesions they produce onthe grass stems and leaves. Rust is a potentiallydevastating disease, and several fungicide applica-tions annually are essential for its control. Morethan $7 million a year is spent on fungicides tocontrol rust in grass seed production. However,recent progress in disease modeling shows prom-ise to predict optimal time for applications and toreduce the number of fungicide applications thatnormally would be applied. In addition, developmentof cultivars resistant to rust offer viable alternativesto costly fungicide applications.
Numerous other pathogens also can limit grassseed production, including fungi attacking thefoliage, fungi that attack the seed, and nematodesthat infect the roots or seed. Diseases such asFusarium head blight (Fusarium sp.), choke(Epichloë typhina), and seed gall (Anguina sp.)have increased in importance in recent years. Morethan 600 diseases of grasses have been reported(Conners, 1967; Farr et al., 1989). Development ofany of these diseases depends on a complexinteraction of host, pathogen, and environment.Conditions favoring some pathogens may be highly

190
unfavorable to others. Changes in productionsystems of grasses, including management ofstraw residue in the absence of field burning, mayprovide conditions favorable for some grasspathogens. Thus, new diseases and changes indynamics of existing diseases are expected tocoincide with changes in the production of grassseed and straw residue management. Control ofdiseases, as well as other pests, must be consid-ered in development of grass seed productionsystems in the absence of field burning.
In this paper, diseases affecting grasses grown forseed in Oregon are described in terms of thecausal agents, hosts infected, economic impact,general life cycle, and epidemiology, followed by adiscussion of current integrated managementpractices for control of diseases of grasses grownfor seed in the Willamette Valley.
Blind Seed Disease
Blind seed is a disease of grass seed caused bythe fungus Gloeotinia temulenta (Prill. & Delacr.)(Wilson, Noble, and Gray, 1954). Principal hostsinclude tall fescue, perennial ryegrass, and annualryegrass, although about 50 other species ofgrasses are susceptible (Hardison, 1962). Infectedseeds are difficult to detect, but the disease’spresence is manifest in reduced seed germination(Calvert & Muskett, 1945; Hyde, 1945; Wilson et al.,1945).
In Oregon, blind seed disease first was identified in1943 (Hardison, 1949), although low germinationwas noticed in 1941 (Hardison, 1957). By 1944,blind seed was found in 85 percent of certifiedsamples (Hardison, 1945) and about one quarter ofthe crop could not be certified (Hardison, 1948).Germination as low as 13 percent was reported(Hardison, 1945). By the late 1940s, field burningwas recommended to control blind seed (Hardison,1963). Post-harvest burning subsequently wasadopted and provided an economical and effectivemeans of blind seed control (Hardison, 1980). Alegislative mandate to reduce field burning acreageduring the 1990s renewed concern for the reap-pearance of blind seed. In 1995, a high level ofblind seed was found in several fields of tall fescuein Oregon (Alderman, 1996). However, theseappeared to be isolated cases, and recent surveys(Alderman 1991a, 1991b) have established apersistent but low level of blind seed in theWillamette Valley.
G. temulenta overwinters only in infected seed. Inthe spring, about the time grasses begin to flower,small, cup-shaped fruiting bodies emerge from theinfected, overwintered seeds. Ascospores areejected into the air and easily move around on aircurrents. Only spores which contact grass flowerscan infect the ovary or developing seed; no otherpart of the plant is infected. Within about 7 to10 days after infection, conidia are produced inlarge numbers and appear as a pinkish colored,sticky to waxy mass on the seed surface or emerg-ing from the lemma and palea (Alderman, 1992;Wilson et al., 1945). Under rainy, windy conditions,the conidia can be dispersed to healthy flowers,rapidly increasing the level of infection. Cool, rainyconditions favor spore production and dissemina-tion of spores; prolonging the flowering periodunder such conditions can increase the period ofhost susceptibility (Chestnut, 1958; DeTempe,1966; Gorman, 1940).
Only seeds are infected by G. temulenta, andinfected seeds are the only mechanisms for over-wintering of the fungus. Thus, the greater thenumber of infected seeds remaining in the fieldafter harvest, the greater the inoculum present thefollowing spring.
Choke
Choke of orchardgrass is caused by the fungusEpichloë typhina. The fruiting body of this fungusappears prior to emergence of seed heads. Adense fungal growth within the tiller effectivelyblocks the emergence of the seed head, resulting inreduced seed yields. On the outside of the tiller, thefungus produces a fuzzy fungal mat that encirclesthe stem and extends 1 to 5 inches in length. At firstwhite, it turns orange as it matures. This is thefruiting body in which large numbers of ascosporesare produced and ejected into the air. Choke is arelatively new disease in Oregon (Alderman et al.,1997; Pfender and Alderman, 1998), and there stillis much to learn about the mechanisms of infectionand the timing of events in the infection process.A survey conducted in the Willamette Valley during1998 determined that orchardgrass choke is nowwidespread in this crop; we found choke in all fivecounties where orchardgrass seed is produced, onvirtually all cultivars we examined (Pfender andAlderman, 1999). Research from France indicatesthat the fungus gains entry through the cut stems atharvest. Research is currently under way todetermine the dynamics of infection and to

191
investigate cultural and chemical means of diseasecontrol. Post-harvest residue management may bean important aspect in reducing spread of thisdisease within a field.
Choke has been known in the fine fescues, but hasnot been a significant disease problem. The fungusthat attacks orchardgrass differs from that infectingfine fescues.
Ergot
Ergot is caused by the fungus Claviceps purpurea(Fr.) Tul. C. purpurea infects about 200 species ofgrasses, including all of the grasses commerciallygrown for seed in Oregon (Bove, 1970; Brady,1962). Ergot is distributed widely through temper-ate regions and has been known since ancienttimes as a malady of grasses (Barger, 1931; Bove,1970).
The prominent feature of ergot is the elongated,hard, purple-black sclerotia which replace seed.The sclerotia generally extend beyond the glumeson infected plants. Sclerotia are the overwintering,or survival, mechanism for C. purpurea. A period ofseveral weeks of near freezing temperatures arerequired to break the dormancy of sclerotia(Mitchell & Cooke, 1968). In the spring, smallfruiting bodies grow from the sclerotia. Ascosporesproduced at the cap of the fruiting body are ejectedinto the air. Rainfall or high soil moisture is requiredfor fruiting and spore production (Alderman, 1993).The ovary is the only organ of the plant susceptibleto infection. Within a week after infection, conidiaare produced on the surface of the ovary and mixwith plant sap (Luttrell, 1980; Shaw and Mantle,1980). The sugary mixture of plant sap and conidiacommonly is called honeydew, not to be confusedwith the honeydew produced by aphids. In somecases, the honeydew is produced in such abun-dance that it can drip from the infected flowers.Insects, especially flies and moths, are attracted tothe honeydew and may play a role in spread of theconidia to healthy flowers. Rain and wind also candisseminate the conidia and increase the spread ofthe disease (Barger, 1931; Bove, 1970).
Within about 2 weeks after infection, sclerotia beginto appear (Luttrell, 1980; Shaw and Mantle, 1980).Maturity of sclerotia coincides with maturity of thegrass seed. As the grasses mature, sclerotia fall tothe ground to survive the winter, completing the lifecycle.
One interesting feature of ergot is that the ovarycan develop resistance to infection after fertilization(Cunfer et al., 1975; Darlington and Mathre, 1976).This must occur prior to infection by C. purpurea.Thus, conditions that delay pollination can prolongthe period of susceptibility. Grasses which have along flowering period have a longer window ofsusceptibility. Other grasses, such as Kentuckybluegrass, which develop without the normalfertilization process, can be infected severely byC. purpurea (Alderman et al., 1998).
Leafspot Diseases
There are several leaf-spotting fungi that occur ongrasses grown for seed in Oregon. These patho-gens generally are active in the early spring. Butmost of them do not persist into the early summer,and therefore they are of little importance to seedyield or quality. The only leaf spot disease currentlyconsidered to require management is scald oforchardgrass, caused by the fungusRhynchosporium orthosporum (Welty, 1991). Scaldis controlled by one or two fungicide sprays in thespring. Another disease complex, which includes aleaf spot symptom, affects hard fescues in theWillamette Valley. The etiology of this disease iscurrently unknown, but a pycnidial fungus has beenimplicated in the leaf spot phase. Further researchis required to assess the possible involvement of aroot-invading organism in the complex and todevelop appropriate disease management tactics.
Rust Diseases
Cool season grasses grown for seed are subject toa number of different rust diseases, caused byvarious species of the fungus genus Puccinia(Cummins, 1971). Stripe rust can cause economiclosses in bluegrass seed production, and crownrust sometimes is damaging to orchardgrass. Stemrust, however, causes the most economic damage.It can reduce yields of unprotected perennialryegrass or tall fescue by as much as95 percent or 40 percent, respectively. It causesserious losses in the fine fescues, and is becomingincreasingly common in annual ryegrass as well.We estimate that at least $7 million is spent bygrowers each year in the Willamette Valley forfungicide applications to control stem rust.
The stem rust pathogen (Puccinia graminis subsp.graminicola) survives over the winter as infectionson susceptible grass species. In mild winters, the

192
amount of disease may increase slowly betweenautumn and spring, but in extremely cold winters(temperatures below about 10°F) the overwinteringrust population may be reduced significantly(Pfender and Vollmer, 1999). Spores(urediniospores) released from pustules are blownin the wind. When nighttime temperatures becomewarm enough in the spring for infection, the rustepidemic can begin to gather momentum byrepeated cycles of urediniospores infection on thegrass crop. The rate of cycling, and hence theseverity of the epidemic, is affected by weather(temperature, humidity, leaf wetness) and byagronomic factors including grass species andcultivar.
Yield reduction in rusted plants is due to diversionof metabolites away from developing seeds andtoward infected leaves and stems, water stressfrom disruption of the plant cuticle, and loss ofphotosynthetic area. The greater the plant areaaffected, the more the seed yield will be reduced.Currently, stem rust is controlled primarily throughfungicide sprays. Well-timed applications of sterol-inhibiting fungicides (such as propiconazole ortebuconazole) can prevent serious yield loss (Weltyand Azevedo, 1994). Recently, strobilurin typefungicides also have shown good activity againstthis pathogen (Pfender and Burr, 1998a; 1998b).Alternating or tank-mixing these two types offungicide should reduce the chance that fungicide-insensitive strains of the stem rust pathogen willarise.
The ideal approach to control of stem rust isdevelopment of genetic host resistance. Efforts areunderway to select and improve resistant hostgenotypes (Welty and Barker, 1992; Welty andBarker, 1993); however, it will be many years beforeadequate resistance in commercial cultivars isachieved. A prerequisite for efficient developmentof resistance is an understanding of the geneticvariability in the pathogen population with respect tovirulence/avirulence genes. The pathology programat the National Forage Seed Production ResearchCenter (NFSPRC) is conducting research onpathogen variability, and the results will be used in abreeding program to develop germplasm forbreeding cultivars with durable rust resistance.
The current major focus of the rust pathologyprogram at NFSPRC is development of a warningsystem that can be used by grass seed growers asa decision aid for efficient and effective timing of
fungicide applications. Because all years are notequally conducive to stem rust epidemic develop-ment, such a warning system could limit fungicideuse to those times when it truly is needed. To thisend, we have initiated a research program toassess predictability of stem rust epidemic increaseas affected by weather, fungicide application, andagronomic factors. Such epidemiological studieswill be combined with research on the relationshipbetween disease severity and seed yield.
Preliminary results from 1 to 2 years of researchare:• In perennial ryegrass, yields decrease sharply
as diseased leaf area between the time offlowering and harvest exceeds 5 percent;20 percent disease during this time periodresults in 60 percent yield reduction.
• Severity of rust infection depends critically uponweather conditions during the night; leafmoisture of at least 2 hours duration isrequired, and infection increases exponentiallywith nighttime temperature above 36°F.
• Latent period (the amount of time elapsedbetween infection and development of a newgeneration of spores) is a critical determinant inthe rate of epidemic development. Latentperiod duration depends upon temperature, andwe are quantifying this relationship to enable usto gauge epidemic speed from temperaturedata.
• We are quantifying the effects of fungicides(propiconazole and strobilurin products) oninfection and pustule development, includingthe effects of various delay times betweeninfection and fungicide application.
We expect that additional epidemiological studies,including field plot research conducted over thenext several years in Corvallis and Hermiston, anda Valley-wide survey for early rust occurrence westof the Cascades, will allow us to develop the basicsof the disease warning system. The warningsystem then can be elaborated further throughadditional research comparing epidemiologicaleffects of a range of cultivars under a variety ofcultural conditions.
Seed Gall

193
Seed gall is a disease of grass seed caused by thenematode Anguina agrostis. The principle hosts forA. agrostis are species of Agrostis (bentgrass). Thenematode attacks the developing seed and canreduce seed yield as much as 75 percent (Jensen,1961). Symptoms are most pronounced when thepanicles are fully emerged. Each infected seed isreplaced by a slender, elongated, needle shapedblack gall. Each gall replaces a single seed. Thegalls fall to the ground and overwinter. The nema-todes molt while in the egg and emerge as second-stage juveniles. During midwinter to early spring,nematodes emerge, invade bentgrass plants, andfeed near the growing point (Courtney and Howell,1952; Pinkerton and Alderman, 1994; Southey,1973). In the plant, the nematodes migrate to theinflorescence primordia. They feed on ovules andundergo three more molts to become adults. Eachfemale can lay up to 1,000 eggs within a gall(Southey, 1973).
In galls stored dry, A. agrostis can survive decades(Southey, 1973). Under field conditions, the nema-todes do not survive more than a year in theabsence of a susceptible host (Jensen, 1961).
Anguina sp. in orchardgrass has been known since1947 (Jensen, 1961), although incidence andseverity appears to have increased in recent years.Anguina attacking orchardgrass is believed to be adifferent species than that attacking bentgrass(Southey et al., 1990). Nematode galls onorchardgrass are about the size of a seed, slightlyshrivelled, and purplish in color (Southey, 1969).They are difficult to detect visually. However,infected seed heads often are distorted. A bacte-rium can be associated with Anguina inorchardgrass, causing a crusty yellowish coating onthe galls.
Chewings fescue also can be attacked by Anguina.Chewings fescue screenings containing nematodegalls are poisonous to livestock (Jensen, 1961). Alaboratory test can be used to determine thepresence of Anguina in grass seed.
Integrated Management of Diseases AffectingGrass Seed Production
Management of grass diseases is integrated into allphases of crop production, from site preparationand planting to post harvest management, including
seed conditioning. In replacement of a grass fieldwith another grass, one should consider the poten-tial carryover of inoculum from one crop to another.Propagules or residue on the surface of the soilcould provide an inoculum source if the crop is no-till seeded. This may be of less concern if one isestablishing a grass field from a non-grass rota-tional crop.
An effective means of reducing surface contami-nants is through deep plowing to bury the residues.Plowing is especially effective in management ofblind seed and ergot since it buries many of thepropagules. Plowing was an important means ofblind seed control prior to the introduction of fieldburning.
Planting seed free of disease or diseasepropagules is recommended. Seed diseases, suchas blind seed, ergot, and seed gall, can be intro-duced into a field through contaminated seed andprovide a source of inoculum to establish diseasewithin a field.
Seed treatments, such as fungicides, may provide ameans of reducing seed-borne fungal contami-nants. Fungicides are considered effective inreducing blind seed. In addition to fungicidal seedtreatments, simply holding seed for 2 years isconsidered effective in reducing blind seed, sinceseed remain viable in storage longer than the blindseed fungus.
Whenever possible, disease resistant cultivarsshould be used. Disease resistance is the optimalchoice for disease control. Kentucky bluegrasscultivars with resistance to ergot have far less ergotthan susceptible cultivars. Disease resistance forrust control will be especially important in reducingour dependency on fungicides for disease control.
Planting seed at a depth greater than ½ inch isrecommended for control of diseases such as blindseed and ergot. Fruiting bodies cannot extend tothe soil surface if planted sufficiently deep, thuspreventing release of spores into the air.
Avoid moving propagules from clean to infestedfields. Infected seeds can be moved throughcontaminated soil, on shoes or clothing, equipment,on animals, in irrigation water, or by wind blowingpropagules from one field to another.

194
A healthy, vigorous crop provides greater resistanceto infection by fungi such as blind seed. Nitrogenfertilization in particular has been shown to reducethe severity of blind seed disease (Hampton,1987).
Management of weed grasses adjacent to fieldscan be important in reducing inoculum from areassurrounding the field. Preventing flowering in thesegrasses will reduce the contamination from ergot orother seed diseases. Herbicides have been used toeliminate hosts for grass seed nematodes. Scoutfor leafspot and rust diseases, and implement arust management program (outlined above underrust diseases).
Harvesting to remove as many seeds as possiblefrom the field is important in management of seeddiseases such as blind seed, ergot, and seed gall.Delayed harvest can increase seed shatter andreturn of seed to the field. In addition, combinesshould be set to remove as many lightweight seedsas possible from the field. Infected seeds, such asblind seed, can be lighter weight, and returningthese seeds to the field will increase inoculumlevels.
Harvest methods may need to be considered forcontrol of choke in orchardgrass. Since infectionsappear to occur at the time of harvest, manage-ment strategies such as chemical treatment ortiming of reclipping may provide options for control.The best management options for choke controlcurrently are being researched.
Seed conditioning can be an effective means ofremoving disease propagules such as light weightblind seeds, seed galls, and ergot sclerotia. Levelsof blind seeds or disease propagules within a seedsample can be determined through laboratorytesting.
Future Outlook
Management of grasses for seed production haschanged significantly during the past decade, as theindustry has moved away from open field burningas the primary management tool for controllingpests and diseases and for straw residue removal.Blind seed, which was an important disease duringthe 1940s, likely will not reappear as a majordisease of grasses under current managementpractices. Other diseases, however, will continue tobe problematic.
Rust likely will continue as the greatest threat tograss seed production, and fungicides will beessential for disease control until rust resistantcultivars are developed and used though much ofthe acreage. Long term control of ergot also will bemanaged best through disease resistance. Newdiseases, such as choke in orchardgrass, willcontinue to challenge plant pathologists in develop-ing effective, economically and environmentallysound disease management.
Future disease control strategies must consideroptions for management of grass seed productionin the absence of burning, as well as managementin terms of integrated control for diseases, weeds,rodents, insects, or other maladies. To this end, acomprehensive understanding of the biology,ecology, and epidemiology of grass pathogensrelative to grass management, and interactions withother biotic and abiotic stresses affecting seed, willbe essential to the integrated control of grassdiseases and the profitable production of thehighest quality of grass seed.
Literature Cited
Alderman, S.C. 1991a. Distribution of Clavicepspurpurea, Gloeotinia temulenta, and Anguinaagrostis among grasses grown for seed inOregon in 1989. Journal of Applied SeedProduction 9:44-48.
Alderman, S.C. 1991b. Assessment of ergot andblind seed diseases of grasses in theWillamette Valley of Oregon. Plant Disease75:1038-1041.
Alderman, S.C. 1992. Influence of temperature andmoisture on growth of Gloeotinia temulenta andinfection of annual ryegrass. Phytopathology82:196-200.
Alderman, S.C. 1993. Aerobiology of Clavicepspurpurea in Kentucky bluegrass. Plant Disease77:1045-1049.
Alderman, S.C. 1996. Occurrence of Gloeotiniatemulenta on tall fescue in Oregon. PlantDisease 80:105.
Alderman, S.C., W.F. Pfender, R.E. Welty, M.E.Mellbye, R.L. Cook, J.W. Spatafora, andM. Putnam. 1997. First report of choke, causedby Epichloë typhina, on orchardgrass inOregon. Plant Disease 81:1335.
Alderman, S.C., D.D. Coats, F.J. Crowe, and M.D.Butler. 1998. Occurrence and distribution ofergot and estimates of seed loss in Kentuckybluegrass grown for seed in central Oregon.Plant Disease 82:89-93.
195
Barger, G. 1931. Ergot and ergotism. Gurney andJackson, London, 279 pp.
Bove, F.J. 1970. The story of ergot. S. Karger,Basel (Switzerland), 297 pp.
Brady, L.R. 1962. Phylogenetic distribution ofparasitism by Claviceps species. Lloydia 25:1-36.
Calvert, E.L. and A.E. Muskett. 1945. Blind seeddisease of ryegrass (Phialea temulenta Prill. &Delacr.) Annals of Applied Biology 32:329-343.
Chestnut, D.M.B. 1958. Susceptibility of perennialryegrass to blind seed disease. Journal of theBritish Grassland Society 13:275-278.
Courtney, W.D. and H.B. Howell. 1952. Investiga-tions on the bentgrass nematode, Anguinaagrostis (Steinbuch 1799) Filipjev, 1936. PlantDisease Reporter 36:75-83.
Cummins, G.B. 1971. The rust fungi of cereals,grasses and bamboos. Springer-Verlag, NewYork. 570 pp.
Cunfer, B., D.E. Mathre, and E.A. Hockett. 1975.Factors influencing the susceptibility of male-sterile barley to ergot. Crop Science, 15:194-196.
Darlington, L.C. and D.E. Mathre. 1976. Resistanceof male sterile wheat to ergot as related topollination and host genotype. Crop Science16:728-730.
de Tempe, J. 1966. Blind seed disease of ryegrassin the Netherlands. Neth. J. Pl. Path. 72:299-310.
Gorman, L.W. 1940. Blind seed disease investiga-tions. N.Z. Journal of Science and Technology22:79a-83a.
Hampton, J.G. 1987. Effect of nitrogen rate andtime of application on seed yield in perennialryegrass cv. Grasslands Nui. N.Z. Journal ofExperimental Agriculture 15:9-16.
Hardison, J.R. 1945. Blind seed disease and plansfor control. Proceedings of the fourth annualmeeting of the Oregon Seed Growers League.pp. 15-20.
Hardison, J.R. 1948. Field control of blind seeddisease of perennial ryegrass in Oregon.Phytopathology 38:404-419.
Hardison, J.R. 1949. Blind seed disease of peren-nial ryegrass. Oregon Agricultural ExperimentStation Circular 177. 11 pp.
Hardison, J.R. 1957. Record of blind seed diseasecontrol in Oregon. Plant Disease reporter41:34-41.
Hardison, J.R. 1962. Susceptibility of gramineae toGloeotinia temulenta. Mycologia 54:201-216.
Hardison, J.R. 1963. Control of Gloeotiniatemulenta in seed fields of Lolium perenne bycultural methods. Phytopathology 53:460-464.
Hardison, J.R. 1980. Role of fire for disease controlin grass seed production. Plant Disease64:641-645.
Hyde, E.O.C. 1945. Ryegrass seed. Preharvestexamination for blind-seed disease and estima-tion of germinating capacity. N.Z. Journal ofAgriculture 70:271-276.
Jensen, H.J. 1961. Nematodes affecting Oregonagriculture. Oregon Agricultural ExperimentStation Bulletin 579. 34 pp.
Luttrell, E.S. 1980. Host-parasite relationship anddevelopment of the ergot sclerotium inClaviceps purpurea. Canadian Journal ofBotany 58:942-958.
Mitchell, D.T., and R.C. Cooke. 1968. Some effectsof temperature on germination and longevity ofsclerotia in Claviceps purpurea. Transactions ofthe British Mycological Society 51:721-729.
Pfender, W.F. and S.C. Alderman. 1999. Geo-graphical distribution and incidence oforchardgrass choke, caused by Epichloëtyphina, in Oregon. Plant Disease 83:754-758.
Pfender, W. and S. Alderman. 1998. Chokedisease of orchardgrass in Oregon. 1997 SeedProduction Research, OSU Ext/CrS 111:41-42.
Pfender, W. and R. Burr. 1998a. Comparison offungicides and initial spray dates in control ofstem rust on perennial ryegrass grown forseed, 1997. Fungicide and Nematicide Tests,53:471.
Pfender, W. and Burr, R. 1998b. Stem rust controlof perennial ryegrass: Comparison of fungi-cides, rates and initial spray dates. 1997 SeedProduction Research, OSU Ext/CrS 111:42-43.
Pfender, W. and S. Vollmer. 1999. Freezing tem-perature effect on survival of Puccinia graminissubsp. graminicola in plants of Festucaarundinacea and Lolium perenne. PlantDisease (In Press).
Pinkerton, J.N. and S.C. Alderman. 1994. Epidemi-ology of Anguina agrostis on highland colonialbentgrass. Journal of Nematology 23:315-323.
Sears, S. 1998. Oregon county and state agricul-tural estimates. Oregon State UniversityExtension Service Special Report 790, revisedJuly 1998. 13 pp.
Shaw, B.I., and P.G. Mantle. 1980. Parasitic differ-entiation of Claviceps purpurea. transactions ofthe British Mycological Society, 75:117-121.

196
Southey, J.F. 1969. A gall-forming nematode(Anguina sp.) parasitic on cocksfoot grass.Plant Pathology 18:164-166.
Southey, J.F. 1973. Anguina agrostis. C.I.H. De-scriptions of plant-parasitic nematodes, set 2,No. 20.
Southey, J.F., P.B. Topham, and D.J.F. Brown.1990. Taxonomy of some species of AnguinaScopoli, 1777 (Sensu Brzeski, 1981) forminggalls on Gramineae: value of diagnostic charac-ters and present status of nominal species.
Welty, R. and M. Azevedo. 1994. Application ofpropiconazole in management of stem rust inperennial ryegrass grown for seed. PlantDisease 78:236-240.
Welty, R. and R. Barker. 1992. Evaluation of
resistance to stem rust in perennial ryegrassgrown in controlled and field conditions. PlantDisease 76:637-641.
Welty, R. and R. Barker. 1993. Reaction of twentycultivars of tall fescue to stem rust in controlledand field environments. Crop Science 33:963-967
Welty, R. 1991. Effect of fungicides applied singlyand in combination on seed yield and three leafspot diseases in orchardgrass. Plant Disease75:1004-1008.
Wilson, M., M. Noble, and E. Gray. 1954. The blindseed disease of rye-grass and its causalfungus. Trans. Roy. Soc. Edin. 61, part II:327-340.

197
Since 1993, Mid-Columbia growers have beenestablishing and implementing an Integrated FruitProduction (IFP) program for cherries. The processhas included writing guidelines, conducting researchon insect and disease pests, and developingeducational material and other tools so that growerscan make educated decisions about their IPMpractices.
A key tool currently being developed in this processis a weather station network system. This network isa joint effort between the OSU Extension Service,Wasco County Fruit and Produce League, andDeschutes Digital, software developers.
There were several goals established for thisproject. Since the stations would be located inremote sites, they had to be solar powered. Theyalso needed to present real time weather data,which is particularly important during frost season. Inaddition, growers and other users needed to be ableto retrieve information easily and reliably. Mostimportantly, the information itself needed to beuseful to growers for informed IPM decisions.
As the developmental stage progressed, it wasrecognized that there were several importantweather station features that were critical for theoperation and success of the system. Multiplecloudy days occur at certain times of the year, evenin The Dalles. The stations, therefore, needed to beable to operate for extended periods of time on dark,mid-winter days without completely draining thebattery. In addition, since most of the orchards arelocated in remote, hilly regions, the stations neededto be able to communicate with the base station viaradio waves, and each station needed to be able toact as a repeater for other stations.
However, none of this is useful without easy accessto understandable information by growers. Twomethods of communication were chosen toaccomplish this goal. The first and most comprehen-sive interface involves posting information on theweb. Second, for growers who lack computer
Establishing a Grower Supported Weather Station Network
Lynn LongWasco County Extension Service
Oregon State University400 E Scenic Drive #2.278
The Dalles, Oregon
access or desire access from a remote site, suchas a pickup or an orchard block, information isavailable via an automated phone system. Besidesallowing remote access, the phone system acts asan advance warning system for frost. The systemwill call the orchard manager when the tempera-ture/humidity index drops below a user-definedthreshold.
As mentioned above, primary access is providedthrough a web interface at http://www.ifpnet.com.On the home page, growers will be able to view atable that gives them current data for each of theon-line weather stations in the district. Mostgrowers have blocks in several different regions ofthe district, so this gives them a quick overview ofclimatological data and how it varies from region toregion. Included here are temperature summaries,especially useful for frost control; wind speed, incase growers want to spray; and rainfall totals, etc.
The backbone of this system, however, is the IPMmodel summary. Incorporated into the system arepest models for cherry, apple, and pear. Cherrymodels include obliquebanded leafroller (OBLR),cherry fruit fly, western tentiform leafminer, andpowdery mildew. The pest models for apples andpears include OBLR, codling moth, fireblight, andapple scab. Weather data from each station isautomatically run through these models, andgrowers are able to see a summary of the nextevent to occur, such as egg hatch, pupation, etc.The number of degree-days until this event occursand the estimated date that the event will occur isdisplayed also. In addition, alert indicators will tellgrowers at a glance if any action is required. Theseindicators will be adjusted according to the modeland, in some cases, spray information that growersinput.
Important news updates also are available at aglance. The Extension agent, scientist, or industryleader will be able to post timely information andannouncements on the web in order to communi-cate rapidly with growers on important topics and

198
issues. Where a newsletter might take severaldays, information posted at this location will beavailable in just a few minutes, and it can beupdated just as quickly.
Finally, this page also displays the weather forecastfor The Dalles from www.weather.com.
For those who want more information aboutweather trends, this information is displayed inseveral ways, including the following:
• Graphically compares historical data for aparticular station.
• Graphically compares differences betweenmicroclimates of multiple stations.
• Compares high/low/average values fromprevious years.
More detailed information also is available on thevarious pest models.
• Graphically presents degree-day accumulationfor the model, highlighting critical events andthresholds.
• Recommends potential courses of action orpreventative measures.
• Tracks pesticide applications and changes themodel accordingly.
• Models can be separately configured for eachorchard block.
This last factor is important so that growers havethe ability to input spray applications, therebyaffecting the action step required.
This project is currently in the design and imple-mentation stage. Eight weather stations have beeninstalled throughout the district; however, buildingradios that will perform as specified has beenchallenging. Original equipment radios did not meetexpectations. The software itself is approaching thetest stage. We hope to have a limited but function-ing system up and running by late spring. At thattime, you will be able to view system progress andreal time weather and pest management informa-tion by pointing your browser to http://www.ifpnet.com

199
Introduction
The increasing presence of the Internet and WorldWide Web is rapidly changing the way integratedpest management (IPM) information is exchangedamong researchers, Extension agents, and endusers. In fact, as we learn how to use onlineresources, the communication gaps and slowfeedback mechanisms that we sometimes haveobserved in the past are giving way to near-instantsatisfaction of information needs. The goal is tohave more timely and better informed IPM decisionmaking and improved production systems.
Let’s review one definition of IPM:
“IPM is a decision support system for theselection and use of pest control tactics, singly orharmoniously coordinated into a managementstrategy, based on cost/benefit analyses that takeinto account the interests of and impacts onproducers, society, and the environment.” (Kogan,1998).
A decision support system consists of the collectedand integrated resources that provide a fullspectrum of information needed in problem solving.
The Internet already has become an importantsource of information for pest identification andmanagement, although the information mostly isscattered and poorly integrated. Note that theInternet is not a passing fad that will soon go away.In fact, the number of “hosts—that is, computerslinked to the Internet at any one time—has grownfrom 15 million in January 1996 to 30 million inJanuary 1998 to 45 million by January 1999. This isa growth rate unprecedented by any other newtechnology, past or present.
The purpose of this paper is to evaluate how onlinetechnologies are developing and how they canimprove delivery and exchange of IPM informationfrom the standpoint of decision support.
Online IPM should have several objectives:1) To provide up-to-date, accurate information in
areas including:
Online Decision Support for IPM
Len CoopIPPC and Entomology Department
Oregon State University
a) Problem identification and diagnosisb) Control tactics and methodologiesc) Decision support for determining if and
when action should be takend) Provide “real time” (or rapidly changing)
data, such as pest outbreak alerts,weather-based products, pesticideregulatory information, etc.
2) To decrease the complexity of pest manage-ment; to make it simpler by hiding complexity,by integrating diverse resources, and by savingtime
3) To shorten communication gaps between allparties involved
A summary of Internet-based technologies and howthey continue to develop is presented in Table 1.The Web started around 1991, but was not noticedmuch until around 1994-5, and some forms of IPMinformation were posted at that time. These includeconversions of many of the same extensionpublications traditionally produced in print form,such as management guidelines and pest factsheets. One relatively early online example (sinceJan. 1996) that is increasingly useful is TedRadcliffe’s IPM World Textbook (Radcliffe andHutchinson, 1999) located at http://ipmworld.umn.edu/.
Static Information
Most forms of online IPM information were, andcontinue to be, static; that is, based on text andgraphics only. Online static information mayrepresent several rather obvious advantages overprint versions, such as in saving paper and solvingthe problem of physical distribution of printedcopies. As the Internet soon will be ubiquitous,people will expect information to be available andaccessible at all times. Already the amount ofinformation available on the Internet exceeds that ofmany libraries combined, and more than 1.5 millionnew Web pages are added daily. In the realm ofIPM, according to the Database of IPM Resources,at http://www.ippc.orst.edu/cicp, there are over5,000 unique IPM related links available worldwide.

200
Table 1. Developmental stages of online IPM decision support.
1st User involvementcases Technology Direction & training
Static 1-way click onlypre95 Text1995 Graphics
Dynamic 1-way user input req.1996 Calculators1997 Models1996 Databases, general search engines
Interactive 2-way user initiated1990s email, chat1999 mail lists1999 web conferences2000? mail list archive, knowledge bases
Integrated multiway user initiated2000+ multiple seamlessly integrated
With primarily static information available, thedirection of information flow on the Internet hasbeen chiefly one-way, meaning that it is usedalmost like television, albeit with nearly infinitechannels. This is odd, in that the Internet wasdesigned to be used as a multi-way communica-tions medium. In fact, after just over 5 years inexistence, its multi-way capabilities remainunderdeveloped (at least for IPM). Static onlineresources do have an advantage by offering a shortlearning curve; usually, all that is needed is generalWeb training, how to use a Web browser, how touse general search engines, and then a good IPMWebsite to start from. The main challenge is simplyto find the right information, and much workremains in this realm—as anyone who now usesthe Web knows too well.
Dynamic Tools
The next stage of development in online IPMdecision support is the use of dynamic onlinecomputer applications such as calculators, models,and databases (Table 1). These are more than one-way, due to the need for user-selected inputs.Thus, users may need special knowledge andtraining to use dynamic tools correctly. On the partof the developer, these dynamic tools require muchgreater technological skill and training, which untilnow has not been expected of Extension informa-tion specialists. This is a factor that explains whydynamic tools are developing more slowly than
static resources, even though they exploit more ofthe potential of the Internet.
There are several Integrated Plant ProtectionCenter-developed, IPM-related examples of Web-based applications, such as an economic thresholdand sequential sampling calculator for strawberryroot weevil, at http://www.orst.edu/dept/entomology/ipm/eilcalc.html; a release calculator and guidelinesfor using the predator mite Neoseiulus fallacis tocontrol twospotted spider mites in strawberry, athttp://www.orst.edu/dept/entomology/ipm/mcalc.html; an online weather data and degree-daycalculator at http://osu.orst.edu/dept/ippc/wea/weacalc.html; and the Database of IPM Resources,at http://www.ippc.orst.edu/cicp/. The latter twoexamples are truly dynamic because theirinformation content changes on a daily basis,based on near-real time weather data, and from thechanging IPM resources on the Web, respectively.Another concept associated with online dynamictools is the “data warehouse,” which lets the useraccess a set of database-driven analytical tools,which in the future will be instrumental in IPMdecision support. A fairly modest example is a 1996Survey of Oregon Pear IPM practices, conductedby IPPC, which links statistical summary tools to adatabase of the survey results, located at: http://ippc.orst.edu/IPMsurvey/cfgph/pearsurvey.cfm.
Among the main reasons that many growers havestarted using computers and the Internet is the

201
availability of weather data and forecasts for IPMpest phenology models, frost control, irrigation, andother needs. Value-added weather data productsare critical for growers who must make informedmanagement decisions. Two central resources forIPM decision making in the Pacific Northwest arethe IPPC “IPM Weather Data and Degree-Days”Website, http://osu.orst.edu/Dept/IPPC/wea; andPAWS (Public Agricultural Weather System), http://index.prosser.wsu.edu/. For example, the IPPCWebsite has a variety of tools to aid in tracking andforecasting heat-driven events related to IPM. Thissite brings together 43 Agrimet, 41 NationalWeather Service, 18 Hydromet, and more than100 National Forest Service and other Federallands management weather stations, with morethan 19 models of insect pests, disease pests, cropdevelopment, and (soon) weed development, andother heat unit-driven event models. There is
documentation for the models, and features suchas the ability of users to upload their own weatherdata to the models, and ability to graph degree-dayaccumulations. Development models are storedand retrieved from an online database, which allowsnew species to be added very easily through a Webform interface. A product recently was added thatcan compute degree-day maps for any region withinOregon—the “Oregon Degree-Day MappingCalculator,” at http://ippc2.orst.edu/cgi_bin/mapmaker.pl. This product can compute andinterpolate elevation-corrected degree-days for theregion of choice using all the same optionsavailable for the standard degree-day calculators,plus mapping options such as the contour lineinterval, output legend, labels, and map size. Thecalculator and example map is shown for deviationsfrom average degree-days in Northwest Oregonfrom January 1 to April 4, 1999 (Figure 1).
Figure 1. Screen shot of online degree-day mapping calculator showing deviations from normal DDs,shown for northwest Oregon, January 1 through April 4, 1999, using a 41°F lower threshold.

202
This degree-day mapping tool uses Oregon ClimateService-developed PRISM maps (Daly et al., 1994,Website at http://ocs.orst.edu/prism/prism_new.html); a geographic information system(GRASS version 4.2, USACERL 1993); a degree-day calculator; up-to-date daily temperature datafrom all available stations (up to 160 total); andhistorical average temperature data from up to200 stations. Maps are delivered directly over theWeb 30 to 60 seconds after the “Make Map” buttonis selected.
The above examples demonstrate that dynamiconline resources are now available, either in thecase of general use tools (such as degree-daycalculators) or for a small number of specific pestsituations. However, much work is needed beforewe can claim to have good decision support toolsfor all major pests. In addition, dynamic tools at thistime are not tightly integrated with other onlineresources. As mentioned earlier, there is also agreater need to introduce and train end-users inhow to use dynamic tools such as models andcalculators.
Integrated Tools
The availability of some static and some dynamictools calls up the need for centralized, integrateddecision support systems that can provide end-users with a starting point and a direction to take asthey begin to solve pest problems. These may bederived from pest control guides, and may haveevolved from PC-software based systems, such asthe WISDOM potato decision program (Stevensonet al., 1989); and IPMP for peppermint IPM (Berryet al., 1995), which soon will be fully revised foronline use. There are presently few good onlineexamples that serve the Pacific Northwest. TheOnline Guide to Plant Disease Control (Pscheidtand Ocamb, 1999), at http://pnwhandbooks.orst.edu/guide1998/index.htm, provides an exampleof the integration of disease managementinformation with pictures of symptoms. The onlinePNW Insect Control Handbook (DeAngelis et al.,1999) is under development, and has a prototypeshowing how text and links to other resources maybe integrated, at http://ippc2.orst.edu/cgi_bin/pnw2.pl. Advantages that will become inherent forintegrated online decision tools include: (1) Theopportunity to be multi-regional, with contributorsfrom many states and disciplines; (2) The ability toupdate content at the proper temporal scale. Forexample, weather data may be updated in real-
time, pesticide registration status can changesuddenly but infrequently, whereas identificationphotos rarely change; (3) Tightly integratedfeedback and discussion abilities, which virtually willeliminate the currently “vertical” communicationstructure among research, Extension, and end-usercommunities (detailed next).
Interactive Tools
The final development in online decision supportincludes much higher levels of interaction, whereend-users may respond to and share informationonline. Currently, e-mail, e-mail list servers,newgroups (USENET), chat groups (internet relaychat or IRC), and Web-based conferencingsystems all are used to add interactivity toWebsites. A few very general local IPM-relatedonline conferencing groups currently exist, includingseveral mail lists related to issues in small fruitproduction, at http://osu.orst.edu/dept/infonet/mail.htm. As we have seen with mail lists in otherareas, it can be a challenge to develop and sustaineffective online group discussions. For IPMdiscussions, it may require recruitment of certainlist moderators to generate information andexamples of IPM questions and answers to modeleffectively this form of communication. Anotherform of online discussion is the Web-basedconference, which most primitively takes the formof a guest-book. These are Web pages that allowthreaded (topic-driven) discussions to occur. Newerversions integrate with e-mail, so that subscribersmay receive new postings via e-mail, and anyoneincluding non-subscribers simply can go to theWebsite and access recent postings or searcharchives. We have yet to see chat groupsintegrated with Websites for IPM, which couldprovide a nice conversational medium at certaindesignated times during the week. With thesetechnologies, a database of common problems andsolutions can be accumulated, providing yetanother technology to support IPM decisionmaking.
Also, the regular posting of pest sample data,model forecasts, and pest alerts may encourageadoption of such mail lists and Web-basedconferences. In other words, for interactive tools towork effectively, they should be integrated withother online resources. The relationship will besymbiotic: the support provided through interactivetools will hasten training and adoption of the staticand dynamic information resources. As we develop
203
early examples, this chicken or egg situation mayresult in slow initial acceptance, and it may be thesupport personnel (applied research and Extension)that show greatest reluctance to move in thisdirection. This is understandable, as we know theeffect that shrinking resources and increasingworkloads can have on learning and adopting newtechnologies. This is where the technologicallyenabled can step in and provide training andsupport and, most importantly, hide the complexitythat computer technologies initially exhibit.
In summary, as we plan for the future of IPMdecision support, we see that technology, particu-larly the Internet and Web, will become absolutelyessential tools that will change the way nearly allparties do their work. This will, in turn, bring theusers group closer together as a community, withthe common goal of speeding the adoption rate andrefining the goals of IPM. One element of the Webthat has been observed: it turns all users intoresearchers. We log on, ask a question, search foran answer, make judgments about the results, andlook for verification from independent sources.Hopefully, we become wiser for it, and make betterdecisions in crop and pest management. This isthe potential offered by these new technologies;and, ultimately, the use of non-selective pesticideswill continue to decline, the environment will benefit,and the safety of our food and fibre will increase.IPM is information intensive, and a seamlesslyintegrated, interactive approach that fully exploitsthe opportunities offered by the internet will one daybe taken for granted, when we perhaps will havetrouble visualizing how it was done during bygoneeras.
Literature Cited
Berry, R.E., L.B. Coop, G. Fisher, and M. Kogan.1995. Integrated Pest Management onPeppermint, Version 2.0 for Windows.Integrated Plant Protection Center computersoftware CS195.
Daly, C., R.P. Neilson, and D. L. Phillips. 1994. Astatistical-topographic model for mappingclimatological precipitation over mountainousterrain. J. Appl. Meteorology. 33:2:140-158.
DeAngelis, J., T. Miller, F. Niederholzer, J. Olsen, M.Shenk, P. VanBuskirk, C. Baird, J. Barbour, L.Sandoval, and A. Antonelli. 1999. PacificNorthwest Insect Control Handbook. OregonState University Extension and ExperimentStation Communications, Corvallis, Oregon.356 pp.
Kogan, Marcos. 1998. Integrated Pest Manage-ment: Historical Perspectives and Contempo-rary Developments. Annu. Rev. Entomol. 43:243-270.
Pscheidt, J.W. and C.M. Ocamb. 1999. PacificNorthwest Plant Disease Control Handbook.Oregon State University Extension andExperiment Station Communications, Corvallis,Oregon. 465 pp.
Radcliffe, T.B. and W.D. Hutchinson [Eds.]. 1999.Radcliffe’s IPM World Textbook. U. MinnosotaWebsite, http://ipmworld.umn.edu/ .
Stevenson, W.R., L.K. Binning, J.A. Wyman, D.Curwen, G.J. Rice, J.R. Zajda, J.E. Smidl, B. M.Thorson, and R.W. Schmidt. 1989. PCM—TheIntegrated Systems Approach To Potato CropManagement. User Guide For IBM and IBM-Compatible Personal Computers, Version 1.1.U. W. Madison IPM Program. 150 pp.
USACERL. 1993. GRASS (Geographic ResourcesAnalysis Support System) Version 4.1. User’sReference Manual. United States Army Corpsof Engineers Construction EngineeringResearch Laboratories. Champaign, Illinois.563 pp.

204
The integrated management of insect and mitepests in agriculture is based on correct identificationof potential pests, an understanding of their lifehistories, and which key agricultural and ecologicalfactors regulate their populations and influence their“pesthood.” Quantifying potential and actual in-fieldor orchard populations requires cost- and time-effective methods that can be related realistically toexpected crop injury and dollar loss. Satisfactoryand fairly simple control options must be available;consequences of their uses (non-control of otherpests or potential creation of other problems) mustbe known.
An entomological background, such as formalcoursework or concerted effort learning from orworking with an entomologist, is essential to insectpest management. Distinguishing pests andbeneficials, differentiating pest from non-pestpopulations, and recognizing and anticipating thosefactors that will create or diminish pest populationsin fields or orchards is no easy matter. Often,on-farm factors unaccounted for by initial researchto estimate populations of pests or “actionthresholds” influence the utility of sampling methodsand “action levels” for various insect and mitepests.
The Delay Between Development and the Adoption of IPM Practices in Oregon Agriculture
Glenn C. FisherExtension Entomology Specialist
Oregon State University
When dealing with farming practices and/orsystems, the transition from agricultural research touse has been accomplished traditionally and mostsuccessfully through the land grant Universitysystem of Extension delivery and implementationprograms. Extension agents and specialistsfacilitate this technology transfer. In Oregon,Extension FTE commitment by administration foron farm IPM demonstration and implementation ispractically non-existent. Agricultural Extensionagents left in the system now must cover multiplecounties, often become involved in issues andpolicies, and have little time to devote to IPMimplementation.
On-farm personal contact and pest controlinformation most often is conveyed to the farmer byprocessor or agricultural chemical field personnel, afew private consultants, and fewer Extensionpeople. To date, the most reliable, inexpensive,and consistent pest control, production of blemish-free produce, and top yields in Oregon have beenrealized with insecticides and miticides. For mostcrops, alternatives have yet to be demonstrated asbeing suitably cost effective with a consistency ofpest control on par with pesticides to many full timefarmers and their most pervasive and constantadvisors—field representatives for agriculturalchemical suppliers or wholesale buyers.

205
Abstract
The Database of IPM Resources (DIR) is acontinually updated and expanding informationmanagement and retrieval system for worldwideIPM information resources accessible through theInternet. This system is presently a compendium ofabout 2,000 documents, i.e., unique URLsdeveloped specifically for DIR. DIR has four maincomponents, including directories of Internet IPMresources, search engines, informational data-bases, and knowledge-bases. Currently, DIRcontains eight bibliographic databases, fiveknowledge-bases, and a database with more than5,000 documented Internet resources and theirhyperlinks searchable through its search engines.DIR is a database of “metadata” that functions asan information system, linking IPM researchers andpractitioners through a central network, which canbe used by anyone seeking crop protectioninformation. The basic goals of this system are: (a)to assist in IPM information dissemination, (b) toraise public awareness about new and emergingtechniques for agricultural, forest, livestock, andmedically-important pests, and (c) to providesupport for decision-making in IPM.
Database Management System for Internet IPM Information
Waheed I. Bajwa and Marcos KoganIntegrated Plant Protection Center (IPPC)
Oregon State University
Introduction
The Internet, a global network of computers, hasdeveloped over the past few years into a powerfulmedium for fast, worldwide dissemination of up-to-date information. Its instant nature and globaldomain provides a quick access to vast amounts ofinformation (Stinner, 1998a). In fact, access toinformation is the essence of the Internet (net).The net is not just a transmitter of information, it isalso a means for exchange of information and canbe used for storing, sorting, and analyzinginformation. Internet access is becoming ubiqui-tous, and as bandwidth improves, increasinglysophisticated graphics, audio, video, and animationelements can be included in the Internet-basedinformation systems. The net is expanding at aremarkable rate (Figure 1). In January, 1999, therewere about 44 million computers connected to theInternet (Network Wizards, 1999) serving anestimated 163 million individuals worldwide (GlobalReach, 1999), compared with about 1.5 millioncomputers serving an estimated 15 millionindividuals in 1993 (Miller, 1993).
Figure 1. Number of computers connected to Internet from 1991 to 1999 (Network Wizards, 1999).
Jan Jul Jan Jul Jan Jul Jan Jul Jan Jul Jan Jul Jan Jul Jan JulJan‘91 ‘91 ‘92 ‘92 ‘93 ‘93 ‘94 ‘94 ‘95 ‘95 ‘96 ‘96 ‘97 ‘97 ‘98 ‘98‘99
Number of Internet Hosts50.0045.0040.0035.0030.0025.0020.0015.0010.00
5.000.00
Mill
ions

206
Knowledge and information play a key role in pestmanagement decisions. Integrated pest manage-ment (IPM), a system for decision making in pestmanagement, is information-intensive, dependsheavily on accurate and timely information, anddemands quick transmission of information fromscientists to their clientele. On the other hand,researchers and Extension specialists need themost updated information to design new projectsand set future research goals and directions.Fortunately, there is a large volume of useful IPMinformation available on the Internet, scattered allacross the globe. These resources range fromtopics such as IPM definitions and basic conceptsto modeling and systems analysis. As awareness ofthe Internet increases worldwide, more people areparticipating, not only as users of the informationbut also as creators of new information; as aconsequence, the number of both IPM Internetservers and clients is increasing exponentially.
Unfortunately, finding information on a particulartopic is time-consuming and often frustrating,particularly when searching by one of the severalgeneral search engines (e.g., Yahoo, HotBot, AltaVista, Excite, Northern Light, etc.). Even the bestengines retrieve only 16 to 20 percent of therelevant information on any given topic. Thesesearch engines normally turn up thousands of links,only a few (or none) of which may fit the user’sneeds. Moreover, these search engine sites, attimes of peak traffic, may be overloaded, andattempts to connect may be refused. There areseveral other ways of locating information on theWeb. For example, many attempts have beenmade to compile Internet resources into listingswhich can be used as a reference point forinformation retrieval on a given subject. Althoughthese resources are useful, they generally focus onlocal/regional needs and lack complete coverage ofthe subject matter, global perspective, or importantfeatures such as searching utilities with properindexing and cataloging of keywords. There is,therefore, a dire need for a user-friendly retrievaland referral system to organize current IPMknowledge/information available through theInternet for easy and swift access.
To fill this increasingly wide gap between theaccumulated information and its accessibility tousers, we developed a “Database of IPM Re-sources” (DIR) as a key component of IPMnet, acooperative project of the Consortium for Interna-tional Crop Protection (CICP), the Integrated Plant
Protection Center (IPPC) of Oregon StateUniversity, and the National Science FoundationCenter for Integrated Pest Management (CIPM).DIR is a continuously updated and expandinginformation management, exchange, retrieval, andreferral system for global IPM informationresources accessible through the Internet. Thebasic goals of this system are: (a) to assist in IPMinformation dissemination, (b) to raise publicawareness about new and emerging techniques foragricultural, forest, livestock, and medically-important pests, and (c) to provide support fordecision-making in IPM. The first section of thispaper mainly focuses on the use of the Internet asan information delivery tool. The second partdiscusses the architecture and modeling of the DIRdatabase management system and its informationretrieval and referral capabilities.
Internet based-Information Delivery Systems
Internet Services and Recent Trendsin Information DeliveryThe most popular Internet tools, namely Telnet, FileTransfer Protocol (FTP), Gopher, and the WorldWide Web (WWW or Web), operate as client/server systems. All these are basically interactive.In an interactive program, a user interacts with aclient program (e.g., browser), which manages thedetails of how data is presented to the user. Theclient program interacts with one or more servers(e.g., Web server). The server receives a request,processes it, and sends a result back to the client.The advantage of the client/server model lies indistributing the work so that each tool can focus ona specialized task: the server serves information tomany clients while the client software for each userhandles the individual user’s interface and otherdetails of the requests and results.
The fastest-growing part of Internet is the WWW.The Web is easier to use (point and click) thanother Internet services (Stinner, 1998b). It is a trueglobal information system that provides a user-friendly interface to accessing online information(Green, 1995). The WWW uses the HyperTextTransfer Protocol (HTTP) to distribute hypermedia(a combination of hypertext and interactivemultimedia) information across the Internet. It canincorporate animation, graphics, sound, and videoto provide a media-intensive vehicle for publishinginformation (Peet, 1998). It is a network systemthat ties computers together using existingphonelines, Ethernet, and Fiber Optic networks.

207
The Web permits a flexible organization ofinformation including hierarchical menus, tables,and linked hypertext documents. Generally, searchengines are used to locate information in Webpages and databases that are accessible over theWeb.
An example of information delivery on the Internetis electronic text (etext)—comprehensive up-to-dateinformation available via the Web in the form oftext, images, movies, and sound files (Gordh,1998).These resources can be accessed directly througha Web browser. This service may be used as analternative to the purchase of expensive and rapidlyoutdated textbooks (Gordh,1998). Some informa-tion delivery systems are based on so-called“Hybrid Technology,” which combines WWWaccess with a CD-ROM. In this technology, imagesand an executable program (analytical processing)are stored on the CD-ROM and text is server-based. There are several advantages to thisscheme; the most practical is minimizing theamount of time spent downloading information.Thousands of still images, or about 75 minutes ofvideo, can be stored on a CD ROM.
The Web provides excellent interfaces for all kindsof interactive network databases. This featureallows the Web to be used as a network “front-end”for many kinds of analyses and data processing.Web-based models and Decision Support Systems(DSS) are becoming popular because little or noclient software is required, thus reducing softwaremanagement and distribution costs (Power andKaparthi,1998). Several Internet-based DSSs havebeen developed for industry, medicine, business,meteorology, and agriculture, including pestmanagement. For example, various weather-baseddisease and insect pest models are available onlinefor local forecasting of pest situations based on realtime, near-real time, and/or historical weather data.For example, the phenology model database ofUniversity of California Statewide IPM Project(UCIPM, 1998) contains information about, andmodels of, more than 100 plants, pests, andbeneficial organisms (predators and parasitoids).The Integrated Plant Protection Center (IPPC) ofOregon State University developed several onlineinteractive resources including real-time dailyweather data, various degree-days products(calculators, models, maps, and map calculator),and phenology models for pest managementdecision making in the Pacific Northwest (Oregon,Washington, and Idaho) (IPPC, 1996). The
potential for using the Web to integrate all types ofstatic and interactive (dynamic) information isunprecedented. No other medium offers such abilityas simultaneous real-time weather information,multimedia, analytical processing, and multi-waydiscussion and feedback.
Internet as an Information Delivery/Exchange Tool
Using the Internet as an information delivery toolmakes information accessible globally to anyperson at any time (Jensen et al., 1996a). The onlyrequisite is an Internet connection. The Webprovides a cost-effective (Channin and Chang,1997) means of delivering and exchangingquantitative and qualitative information via its user-friendly interactive interface. The Web is advancingquickly toward mass-media status in the world. Ithas sustained double- and triple-digit annual growthin the U.S. and throughout the world(Figure 1). Having started with a small number ofusers (less than 1 percent of the U.S. populationand less than 0.1 percent of the world population) in1990 (Gardner, 1999), the WWW currently hasapproximately 163 million users around the world(NUA Surveys, 1999). In the U.S., 28.3 percent ofthe population used the Internet in January, 1999,and the number is expected to grow to 48.6 percentin 2000 and 72.1 percent in 2005 (Gardner, 1999).The current share of different regions is as follows:North America, 55.5 percent; western Europe, 23.3percent; Asia Pacific, 15.5 percent; eastern Europe/Russia, 2 percent; Latin America, 1.8 percent; andMiddle East/Africa, 1.9 percent (Gardner, 1999).The Internet is projected to be four times bigger by2005, with a total of 716 million users: 32.1 percentin North America, 28.2 percent in western Europe,23.8 percent in Asia/Pacific, 6.1 percent in Russia,6.1 percent in Latin America, and 3.7 percent in theMiddle East/Africa (Gardner, 1999).
Internet is impacting cooperative research on aglobal scale (Green, 1995; King et al.,1998).Several international, public-domain databases arenow online and are available free of charge.Among these are several molecular biology andbibliographic databases such as Genbank andAgricola. GenBank is the U.S. National Institute ofHealth (NIH) genetic sequence database, anannotated collection of all publicly available DNAsequences (Benson et al., 1999). GenBank is part

208
of the International Nucleotide Sequence DatabaseCollaboration, which is comprised of the DNADataBank of Japan (DDBJ), the EuropeanMolecular Biology Laboratory (EMBL), and U.S.National Center for Biotechnology Information(NCBI). These three organizations exchange dataon a daily basis (Benson et al., 1999). TheGenBank database and related resources are freelyaccessible at: http://www.ncbi.nlm.nih.gov.AGRICOLA (AGRICultural OnLine Access) is adatabase of bibliographic records created by theU.S. National Agricultural Library and its coopera-tors. This database covers materials dating fromthe 16th century to the present. The recordsdescribe publications and resources encompassingall aspects of agriculture and allied disciplines.AGRICOLA can be searched via the Web at http://www.nal.usda.gov/ag98/.
At present, most information accessible via theInternet is static, electronic versions of informationalbrochures, fact sheets, Extension guides andpapers, etc. Many sites, however, are designed asinteractive systems that permit users to interact witha Web-based database through “form interface”comprising buttons, pull-down menus, and text-boxes. To submit a request, a user fills out a formand submits it to a Web server. The server forwardsrelevant portions to a CGI (Common GatewayInterface) application, an interface between theserver and the database. This program thengenerates an output to be sent back to the user asa new document. It is up to the application toformat the data it sends back for viewing as ahypertext document. The information is processedfor database searches, abd the requesteddocument is created “on the fly” and sent backwithout ever being stored. In effect, users see acustom-made, “virtual” document that was createdspecifically for them by an application program.This facility permits a far richer information systemthan would be possible with static documentretrieval. (Green, 1998).
The Internet is being used increasingly for multiwayinformation exchange (including feedback).Electronic mail or e-mail typically is used to sendshort textual messages between computer users.Clientele can access designated specialists/expertsvia e-mail. Internet News Groups permit users toread and post messages to various discussiongroups organized by topic. The most popular publicnews group is called USENET. Educational topicsrange from agriculture to zoology, but news groups
exist on almost every topic. News group postings(traffic) are very much like e-mail messages, butare grouped by topic for a given subject (thread).Internet’s Bulletin Board Systems (BBS) offer awide range of services such ase-mail, file downloads, and discussion groups. Theyare, however, smaller in scale and scope than newsgroups. Internet Chat is a real-time, text-basedcommunication program that allows groups of usersto talk to one another. Unlike News Groups andBBS, Chat does not create a record or log of whatis discussed. Chat is used best to get immediatefeedback from many users. FTP, another Internet-based tool, allows users to transfer or “FTP” filesover the Internet from one computer to another. Auser must gain access to another computercontaining the desired files using an FTP client orapplication. Many systems allow users to log inanonymously by simply providing an e-mailaddress. A user can log in with a secure name andpassword for more secure access to files. Mostcurrent Web browsers can access anonymous FTPsites by using the ftp:// and the server name inplace of the URL.
The Internet also is becoming a preferred means ofproviding data and analytical processing fordecision making via Online Analytical Processing(OLAP) applications. Now it is possible to run multi-source information integrated, multimedia, multi-threaded, site-specific automatic decision supportsystems on the Internet (Power and Kaparthi,1998). Such systems facilitate a user’s access tothe decision making process (Eastwood, 1998).Dynamic sites that include interactive models, GISbased decision systems, real-time weather, andmarket information are being developed rapidly andmade available on the Internet.
Internet-based IPM Information ResourcesIPM is an information-intensive system for thecontrol of pest populations whenever they impingeon human activity and well-being (or welfare). Itsresearch and implementation depend on thereliable supply of timely information. IPM research-ers, like other scientists, must rely on access todata from extant studies (Jensen et al., 1996b).They are more interested in setting up improvedchannels of communication and methodology forfinding information, rather than creating newdatabases (King et al., 1998). For example, manyscientists in the field of weed research, animportant part of IPM, believe that a researchernetwork and information system designed to enable

209
them to exchange data and access other researchmore easily is quite beneficial to their research(King et al., 1998). The Internet (particularly theWeb) has opened a vast array of data resources forIPM research, Extension, teaching, and learningthat was not readily available before. The Web isfast becoming a critical component of IPMinformation exchange. There are now thousands ofIPM sites online from all over the world. The futureof IPM delivery systems through the Internet isbright; Internet-based information exchange quicklyis becoming an absolute requirement for local,regional/areawide, and international implementationof IPM systems.
Currently, DIR provides a user-friendly interface tomore than 5,000 Internet IPM resources. Itpresents Internet IPM resources in a logical,structured, and searchable way that greatlyincreases the speed and success rate over the useof general search engines on the Web. DIRprovides access to relevant information on allaspects of IPM and supporting sciences, includingcrops, pests, control tactics, organizations,technical/scientific societies, educational andresearch institutions, and related topics in a formatthat is searchable and highly customized(Figure 2).
IPM Knowledge-bases& Databases
Database of IPM Resources (DIR)The Information Management & Retrieval System for Electronic IPM Resources
IPM Conceptsand Definitions
Info Resources byPest Categories
Info Resources byPest Control Tactics
Info Resources by CropCategories
Info Resources byRegions
Info Resources byTechnical Organizations
Arthropod Pests
Insects
Mites
Others
Mollusks
Nematodes
Plant Pathogens
Vertebrate Pests
Weeds
Biological Control
Chemical Control
Cultural Control
Genetic Control
Integrated Control
Legislative Control
Mechanical Control
Plant Resistance
Physical Control
Agronomic Crops
Cereals
Fiber Crops
Grain Legumes
Grass & Fodder
Oil & Oilseed
Horticultural Crops
Fruits/Nuts
Ornamentals
Vegetables
Africa
Australasia
Central America
East Asia
Europe
Middle East
North America
South America
South Asia
Southeast Asia
Funding Org.
International Org.
CABI
CGIAR
CICP
IOBC
Regional Org.
WARDSA
Asian Dev. Bank
European Weed Res.
210
With DIR directories and search engines, one canfocus quickly on the desired information, asdistilled from thousands of IPM Internet informationresources. All DIR databases and knowledge-bases are updated regularly and revised. Infomine(a scholarly resource guide for biological,agricultural, and medical sciences) of theUniversity of California designates DIR as a wellorganized, annotated Web virtual library of IPMinformation. Infomine is available at: http://infomine.ucr.edu/search/bioagsearch.phtml. DIRhas been named an “Outstanding Education-Related Site” on the Web by The Education Indexlibrary of IPM information. Infomine is available at:http://infomine.ucr.edu/search/bioagsearch.phtml.DIR has been named an “Outstanding Education-Related Site” on the Web by The Education Index(http://www.educationindex.com/index.html), anannotated directory of the best education-relatedWeb sites. DIR was awarded “Majon’s Web SelectAward,” a seal of excellence as described by WallStreet Journal, for demonstrated creativity, qualitydesign, and usefulness in purpose (http://www.majon.com/). DIR also has been named asan “Extraordinary Website” by the Plant PathologyInternet Guide Book (PPIGB), a subject orientedInternet resource guide compiled and maintainedby Dr. Thorsten Kraska, Institut fürPflanzenkrankheiten (Institute for Plant Diseases),University of Bonn, Germany (http://www.ifgb.uni-hannover.de/extern/ppigb/ppigb.htm).
DIR, a Model Database for InternetIPM Resources
Server ArchitectureThe DIR system is a precise (97.33 ± 0.24 percentsuccessful hits since January 1, 1997), fast[Agrisurf (www.agrisurf.com/], stable, and securesystem. The system is hosted on an IntelPentium-based machine with 128 Mb memory anda 3 GB of SCSI hard drive, including a UPS powermanagement system. The software component ofthe system includes Windows NT 4.0 (operatingsystem), MS-Access 7.0 (database managementsoftware), Netscape Enterprise 3.0 (serversoftware), and Cold Fusion Application Server. Thelocal network is connected through a firewall to theInternet and uses the standard TCP-IP protocol.
To guarantee data security, guidelines given byWjst and Immervoll (1998) are adopted andimplemented. The software is updated regularlywith the latest patches and versions, and audit
trails are enabled for file accesses and systemfunctions. Any user profiles, however, have beenavoided to ensure privacy of information retrieval.For data safety, backups are run weekly afterchecking for computer viruses and consistency ofthe database tables. There are always mirror copiesof the actual database that are not available to thepublic.
Database Design, Modeling, andWeb ConnectivityDatabases provide invisible, but essential, corefunctionality of data storage and manipulation(Date, 1995). The process of getting a full-fledgeddatabase on the Web requires three essentialcomponents: a relational database, a Web server,and an application server to glue everythingtogether. SQL (Structured Query Language)provides a common syntax for query building. TheOpen Database Connectivity (ODBC), a standardprotocol for SQL databases, provides an abstrac-tion layer between the application interface and thedatabase. Common Gateway Interface (CGI), aninterface between a Web and the other resourcesof the server’s host computer, is a mechanism thatallows Web clients to execute programs on a Webserver and to receive their output. CGI programsoften are used to produce HTML pages on the fly;they also are used to process the input from anHTML form. In general, CGI allows the Web to beused as a network “front-end” for many kinds ofanalytical and data processing (Green, 1998). Itcan handle complicated client requests such asdatabase access (through an ODBC), computation,and dynamic Web page generation. It can be usedto solicit and interpret user-supplied data, retrieverequested information, or process content whichhas been customized for a particular user.
DIR provides an interactive environment to itsusers. The core to this system is several relationaldatabases connected to the Internet via server-sideCGI programs and/or a middleware, Cold Fusion.Both CGI programs and Cold Fusion communicatewith the databases through ODBC. Cold Fusionworks similarly to the CG program for databasequerying, computation, and HTML page generation.DIR’s database interface is coded in CFML (ColdFusion Markup Language)- SQL. CFML-SQL is aprocedural language extension to SQL. With a fullrange of data types, conditional statements, andexception handling capabilities, CFML-SQLprovides the program logic not available indeclarative SQL language. CFML-SQL can bundle

211
related data-types and subprograms to promotereuse of common local variables and subprograms.
DIR’s design and schema permit informationretrieval on a particular subject with minimumefforts in as little time as possible. The maindatabase relies on a relational structure. Customdata type, primary and foreign keys, index field, andrelations all were planned to avoid redundant data
structure and repeated entries and to anticipatefurther growth (Wjst & Immervoll, 1998). Its entity-relationship diagram (E-R diagram) is given inFigure 3. This diagram illustrates classes in theDIR database model, along with their attributes andrelationships. In the diagram, an entity class isdenoted by a rectangle and its attribute by anellipse. The relationships are denoted by dia-monds.
An entity class is denoted by a rectangle and its attribute by anellipse, and the relationships by diamonds. SSR: supertype-subtype relationship; M-M: many-to-many relationship; 1 – M:one-to-many relationship; sub-of: hierarchical structures forentities of entity types crop, pest, tactic, disciplines and region;and refer-to: one resource entity refers to another resourceentity. res-sub: relationship between a subject entity and a
resource entity—this relationship makes an IPM resource (aResource entity) searchable with keywords stored in theSubject entity. A relationship of type tac-pst denotes which(control) Tactic is used against what kind of pests; crp-reg whatcrops are grown in which regions; and pst-crp, which pestsdamage what type of crops.
sub-ofsub-of
tac-pst
Discipline
Pest Tactic
Crop
pst-crp
Organization
res-sub ResourcesSubject
Sub #
sub-of
SSR
SSR
Active-Flag
Address
Category
Memo
ID Title
Descrip.
crp-reg
sub-of sub-of
Region Extension-Edu
Descrip.
M
M
MM
MM
M
M
M
M
M
M
M
SSR
SSRSSR
SSR
SSR
1
1
1
1
1
11
Figure 3. Entity-relationship (E-R) model for Database of IPM Resources (DIR).
refer-to
SubName
t
t
t
t
t
t
t
t
t
t
t
t
t
t

212
Access InformationDIR is available at http://ippc.orst.edu/dir/ and http://www.ipmnet.org/dir/. DIR is being accessed by553 ± 26 users (users are defined as different IPnumbers in the Web access log) per day (Figure 4).
Since its inception in 1996, DIR’s clientele andusage has increased exponentially (Figure 5).During the 12-month period of June, 1998 to June,
1999, the number of hits (page views) to all pageswas 144,860. During this period, there was anincrease of 158 percent in DIR clientele and 30percent in the page views. A comparison of DIRclientele and its usage in those 3 years is given inFigure 5.
Figure 4. DIR usage in 12 months between July 1998 and June 1999.
Figure 5. DIR clientele and usage over 3 years (June 1996 to June 1999)
Aver
age
hits
/day
Num
bers
/day
Jul Aug Sep Oct Nov Dec Jan Feb Mar Apr May Jun 98 98 98 98 98 98 99 99 99 99 99 99
700
600
500
400
300
200
100
0
uu
u uu
u
u
u u
u
uu
3 1 5344
268 284 258216
308
413 401
524
586549
400
350
300
250
200
150
100
50
0 1997 1998 1999
27
134
78
287
201
372Clients Page Views

213
Resources and ComponentsCurrently, DIR contains 8 databases, 5 knowledge-bases, and a database with more than 5,500documented Internet resources and their hyperlinkssearchable through its search engines (Table 1).The databases and knowledge-bases include:Compendium of IPM Definitions (67 definitions andliterature citations), a knowledge-base on Indig-enous Methods of Pest Control in East Africa,Database of Natural and Traditional Pest Control(East Africa), Codling Moth Information SupportSystem (CMISS), Database of IPM Textbooks,Database of IPM Literature (IPMlit), IPM Informatics(an interactive site on the use of computers and
information technology in IPM), Model Systems forInsect Phenology and Population Dynamics, andInternet-based Interactive Information Systems andseveral Specialty Bibliographic Databases.
As shown in Figures 6 and 7, the major contributorsto the resources of DIR are, by region, NorthAmerica (3,397); by country, U.S. (2,832); and bypest type, insects (1,582). Europe and Australasiaare represented by 555 and 317 records, respec-tively.
Table 1. Current Resources of Database of IPM Resources.
Resource Type Current Status
1. Directories of Internet IPM Resources Highly Customized 750 Directories
2. Searchable Database of Internet IPM Resource Simple & Advanced Search Engines-
5,000 documented Internet Resources
3. Informational Databases & Knowledge-bases Eight Databases & Five Knowledge-bases
Contributions by other regions, such as Africa(195), Asia (378), and South America (87), areconfined mainly to a few countries. Thesecountries include South Africa (41), Malaysia (33),Kenya (23), China (23), Japan (50), Argentina (11),and Brazil (45). Resources from internationalorganizations are 52 (Figure 6). Resources by pesttypes follow a pattern that reflects diversity (speciesrichness) as pests of agricultural crops (insects,1,582; plant diseases, 951; weeds, 412; mites, 239;nematodes, 213; vertebrate pests, 201; andmollusks, 46) (Figure 7).
How to Find Information with DIR?
DIR uses two main indexing approaches: searchengines and a main index of DIR directories (basedon various IPM topics).
Search EnginesCurrently, DIR has three types of search engines: akeyword search engine, a simple search engine,
and an advanced search engine. The keywordsearch engine can be used for single keywordsearches and is available from several DIR pages.The simple search engine can be used for simplekeyword and phrase searches with or without theword combination operator “AND.” The advancedsearch engine (ASE—pronounced Ace) is acustomized and efficient tool for narrowing (withword combination operators AND and NOT) orexpanding (with word combination operator OR)search parameters. This search engine is useful forretrieving information by region, country, language,organization, crop, pest type, and keyword with orwithout use of the word combination operatorsAND, OR, or NOT for all search fields. All thesesearching utilities ensure retrieval of the desiredinformation precisely and efficiently. To commencea search, the user submits one or more key wordsto the search engine which then returns a list ofdocuments containing those key words in their titlesor text.
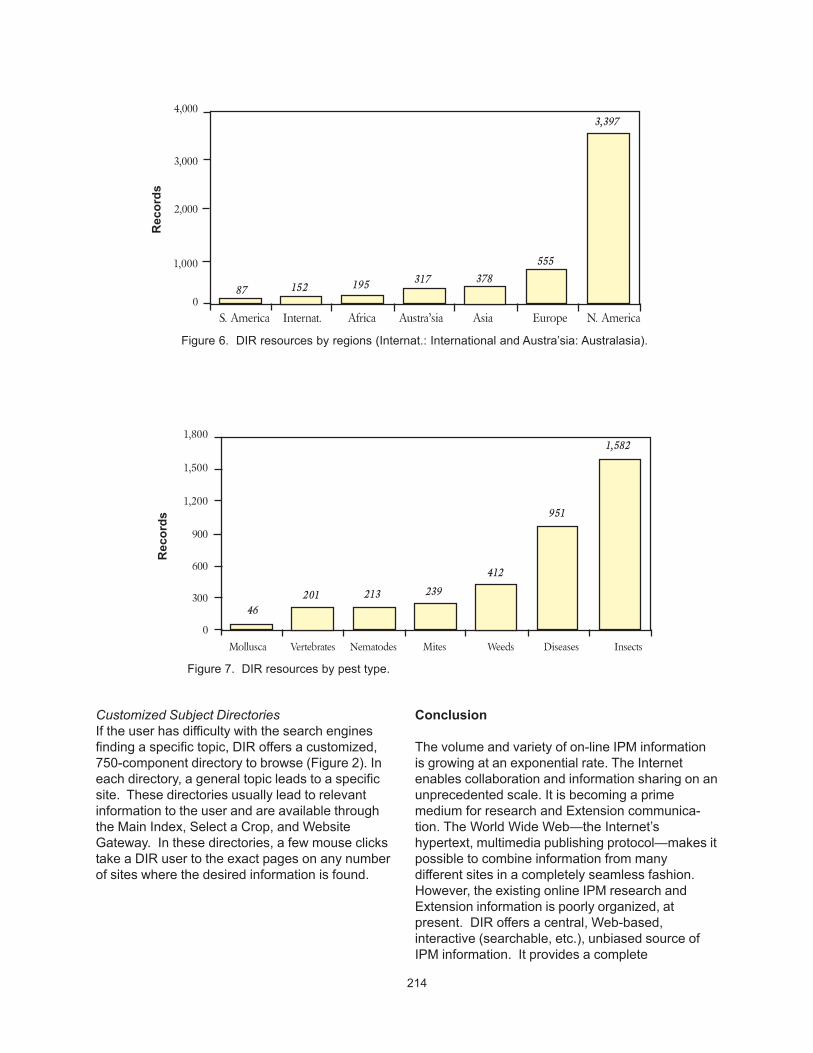
214
Figure 7. DIR resources by pest type.
Customized Subject DirectoriesIf the user has difficulty with the search enginesfinding a specific topic, DIR offers a customized,750-component directory to browse (Figure 2). Ineach directory, a general topic leads to a specificsite. These directories usually lead to relevantinformation to the user and are available throughthe Main Index, Select a Crop, and WebsiteGateway. In these directories, a few mouse clickstake a DIR user to the exact pages on any numberof sites where the desired information is found.
Conclusion
The volume and variety of on-line IPM informationis growing at an exponential rate. The Internetenables collaboration and information sharing on anunprecedented scale. It is becoming a primemedium for research and Extension communica-tion. The World Wide Web—the Internet’shypertext, multimedia publishing protocol—makes itpossible to combine information from manydifferent sites in a completely seamless fashion.However, the existing online IPM research andExtension information is poorly organized, atpresent. DIR offers a central, Web-based,interactive (searchable, etc.), unbiased source ofIPM information. It provides a complete
Figure 6. DIR resources by regions (Internat.: International and Austra’sia: Australasia).
1,800
1,500
1,200
900
600
300
0
Mollusca Vertebrates Nematodes Mites Weeds Diseases Insects
46201 213 239
412
951
1,582
S. America Internat. Africa Austra’sia Asia Europe N. America
4,000
3,000
2,000
1,000
087 152 195 317 378
555
3,397
Rec
ords
Rec
ords

215
information environment that quickly directs IPMpractitioners to relevant resources. Its overall goalis to promote global IPM development and adoptionthrough rapid access to information across theInternet with the least possible cost to the end-user.Few other services or systems on the Internetparallel the goals, objectives, and capabilities ofDIR. This database is designed to become a focalpoint on the Web for IPM researchers, Extensionspecialists, pest management practitioners,students, teachers, crop consultants, and policymakers.
Literature Cited
Benson, D.A., M.S. Boguski, D.J. Lipman, J. Ostell,B.F. Ouellette, B.A. Rapp, and D.L. Wheeler.1999. GenBank. Nucleic Acids Research27(1):12-7.
Channin, D.S. and P.J. Chang. 1997. Primer oncomputers and information technology. Part two:an introduction to computer networking.Radiographics 1997 Jul-Aug;17(4):988-92
Date, C.J. 1995. An introduction to databasesystems. Addison-Wesley Pub. Co., Inc. NewYork. 839 pp.
Eastwood, B.R. 1998. Agricultural databases fordecision support. HortTechnology 8(3):320-324.
Gardner, E. 1999. Net is advancing quickly towardmass-media status in United States. InternetWorld 5(15):13-14.
Global Reach. 1999. Global Internet Statistics.Global Reach. http://www.euromktg.com/globstats/index.html
Gordh, G. 1998. IT technology: taking it to thestreets. The role of ITT in tertiary education. pp.247-257. Symposium 10: Education for pestmanagement in the IT (information technology)age—Cal, WWW and other Acronyms. InZalucki, M.P., R.A.I. Drew, and G.G. White(Eds.) Pest management—future challenges.Australia: University of Queensland Printery.Vol. 2.
Green, D.G. 1995. From honeypots to a Web ofSIN—building the world-wide informationsystem. In: Tsang, P., J. Weckert, J. Harris, andS. Tse (Eds.): Proceedings of AUUG’95 andAsia-Pacific World Wide Web ’95 Conference.Charles Sturt University, Wagga Wagga, p. 11-18.
Green, D.G. 1998. Coping with complexity—the roleof distributed information in environmental andresource management (http://life.csu.edu.au/~dgreen/rt98/) (Environmental and InformationScience and Johnstone Centre, Charles SturtUniversity, Albury NSW 2640 AUSTRALIA)
IPPC. 1996. IPM weather data and degree days
(http://www.orst.edu/Dept/IPPC/wea/Jensen, A.L., I. Thysen, J.G. Hansen, T. Jensen,
B.J.M. Secher, and O. Juhl. 1996a. An informationsystem for crop production on World Wide Web,6th International Congress for ComputerTechnology in Agriculture (ICCTA ’96),Wageningen, Holland, 604-609.
Jensen, A.L., I. Thysen, and B.J.M. Secher. 1996b.Decision support in crop production via theInternet. In: B.J.M. Secher and J. Frahm (Eds.)Proceedings of the Workshop on Decision SupportSystems in Crop Protection, Münster, Germany, 4-8 November 1996, SP-Report, Danish Inst. Plantand Soil Sci. (1996), 15, 39-47.
King, R.P., S.M. Swinton, D.W. Lybecker, and C.A.Oriade. 1998. The economics of weed control andthe value of weed management information. pp.25-41. In: Hatfield, J.L, D.D. Buhler, and B.A.Stewart (Eds.) Integrated weed and soil manage-ment. Ann Arbor Press, Chelsea, Michigan. 385pp.
Kogan, M. and W.I. Bajwa. 1999. Integrated pestmanagement: a global reality. An. Soc. Entomol.Brasil 28(1):1-25.
Miller, S.E. 1993. The information age and agriculturalentomology. Bull. Entom. Res. 83: 471-474.
Network Wizards. 1999. Internet Domain Survey,January 1999- Number of Internet Hosts (http://www.nw.com/zone/host-count-history)
NUA Surveys 1999. Nua Internet Survey (http//www.nua.ie/)
Peet, M.M. 1998. Developing, converting, andmaintaining information-rich resources on theWorld Wide Web. HortTechnology. 8(3):307-312.
Power, D.J. and S. Kaparthi. 1998. The ChangingTechnological Context of Decision SupportSystems. pp. 41-54. In: Berkeley, D., G. Widmeyer,P. Brezillion, and V. Rajkovic (Eds.) Context-Sensitive Decision Support Systems. London:Chapman and Hall.
Stinner, R.E. 1998a. Globalization of IPM through theInternet. pp. 289-296. In: Zalucki, M.P., R.A.I.Drew, and G.G. White (Eds.) Pest management—future challenges. Australia: University ofQueensland Printery. Vol. 2.
Stinner, R.E. 1998b. Cotton and the Internet—a cottonfarmer’s guide to Internet access. NFC Center forIPM, NCSU, Raleigh. 12 pp.
UCIPM. 1998. UC IPM online (http://axp.ipm.ucdavis.edu/)
Wjst, M. and T. Immervoll. 1998. An Internet linkageand mutation database for the complex phenotypeasthma. Bioinformatics, 14(9):827-828.

216
Abstract
Successful management of Codling Moth (CM),Cydia pomonella L., depends heavily on accurateand timely information and demands a quicktransmission of information from scientists toclientele. The Internet has proved its potential asan effective information delivery/exchange system.In addition to the wide geographic availability ofmaterial, the Internet offers the advantage of veryquick delivery, and the material itself is usually ascurrent as possible. An Internet-based informationand support system, Codling Moth InformationSupport System (CMISS), recently has beendeveloped. CMISS is a comprehensive source ofbiological and management information on codlingmoth. This site uses both static (text, graphics, andtabular) information and dynamic (database-drivenand server-side programs) information, andrepresents the state-of-the-art for Web applicationsand decision support systems. CMISS currentlyhosts various databases and knowledge-bases ondifferent aspects of codling moth biology, ecology,and integrated management. It also providesinformation distillation on various aspects of codlingmoth phenology and population dynamics, includingmodeling parameters, etc. Its generalized degree-day calculator can be used from anywhere in theworld for forecasting codling moth phenology underlocal conditions. This calculator requires a localweather data file uploaded to the server from theclient computer. CMISS is available at http://ippc.orst.edu/codlingmoth/.
Introduction
The Codling Moth (CM), Cydia pomonella L., is acosmopolitan insect pest of deciduous fruits (Reedet al., 1985). Successful management of this insectdepends heavily on accurate and timely informationand demands quick transmission of informationfrom scientists to clientele. On the other hand,researchers and Extension specialists need thelatest reviewed information to design new projectsand set their future research goals/directions. Assuch, like other IPM programs, codling mothmanagement requires development of improvedmethods of accessing and disseminating informa-tion.
An Interactive, Knowledge-based System for Integrated Codling Moth Management
Waheed I. Bajwa and Marcos KoganIntegrated Plant Protection Center (IPPC), Oregon State University, Corvallis, Oregon, USA
Currently, different methods are being used foraccessing and disseminating information, such asprinted material in the form of paper hard copies,and electronic publishing like archiving material onCD-ROM, Websites on the Internet, etc. Printedmaterial, though a standard method of providinginformation, is bulky, making transmission toremote locations expensive (MacRae, 1996).Electronic publishing provides the ability to searchand index text, quick access to reference materials,and interactive multimedia capabilities. Informationon CD-ROM has the advantage of being randomlyaccessed and is easy to store and ship, but it isinherently static and unchanging. CD contentsrapidly become outdated. Internet, a powerful newinformation delivery and exchange tool, provides asignificant improvement over other informationsystems (Bajwa and Kogan, 1999). The Internetcarries several kinds of communication servicesincluding e-mail, file transfer protocol, and Usenetnewsgroups. The fastest-growing part of theInternet is the World Wide Web, a graphical, user-friendly (point and click) approach to accessinginformation. The Web is easier to use than otherInternet services. Information published on theInternet has a number of advantages overpublication of paper hardcopies or archivinginformation on CD-ROM. Information on theInternet is available immediately from all across theglobe (Stinner, 1998). In addition to the widegeographic availability of material, the Internetoffers the advantage of very quick, inexpensivedelivery, and the material itself usually is verycurrent. Also, Internet can provide a contact pointfor scientists/researchers working on similarproblems (MacRae, 1996). The number ofcomputers connected to the Internet has grownexponentially in the past few years—thus thescope, contents, and influence of online publishing.The potential now exists to reach more peopleelectronically than through hardcopy (MacRae,1996).
There are Internet resources on codling mothscattered all across the globe. While theseresources are useful, they generally focus on

217
site-specific information on pest control and lackcoverage of some important aspects like biology,ecology, phenology, modeling, etc. A soundknowledge of these areas is the basis for success-ful integrated management of this pest. To fill this
gap, an Internet-based interactive knowledge-based system, the Codling Moth InformationSupport System (CMISS) has been developed.This unique resource can be browsed at: http://ippc.orst.edu/codlingmoth/ (Figure 1).
Figure 1. Home page of CMISS.
Objectives and Scope
CMISS is a continuously updated and expandedinformation retrieval, exchange, and decisionsupport system for codling moth. CMISS providesinformation on biological and managementinformation on codling moth. This site uses bothstatic (text, graphics, and tabular) information anddynamic (database-driven and server-sideprograms) information, and represents the state-of-the-art for Web applications and decision supportsystems. An electronic information system likeCMISS provides efficient information management:development, updating, storage, retrieval, referral,and delivery.
CMISS currently hosts various databases andknowledge-bases on different aspects of codlingmoth biology, ecology, and integrated management.Among the databases, the Codling Moth Index(CMI), a general bibliographic database ofworldwide codling moth literature, containsapproximately 6,500 references. This databaseprovides nearly complete coverage of codling mothliterature from the years 1700 through 1999.CMISS also presents some specialty bibliographicdatabases, which cover topics like BiologicalControl, Chemical Control, Sex Pheromones ofCodling Moth, and Systems Analysis and Modeling

218
of Codling Moth Phenology and PopulationDynamics. The database on Systems Analysis andModeling of Codling Moth Phenology and Popula-tion Dynamics contains up-to-date information anda bibliography on modeling parameters extractedfrom worldwide codling moth literature. CMISSknowledge-bases like Bionomics, Control, SexPheromones, Historical Events, Frequently AskedQuestions (FAQ), and Quick Facts are based onarchival and current information and provide an up-to-date review of the subject matter.
The overall goal of CMISS is to provide informationsupport for research and Extension programsrelated to codling moth. This site is designed tobecome the focal point on the Web for researchand Extension specialists, pest managementpractitioners, students, teachers, crop consultants,and policy makers.
CMISS Resources
All CMISS databases are built on a “state-of-the-art” relational structure. They are updated andimproved regularly. In these databases, customdata types, primary and foreign keys, index fields,and relations all are planned to avoid redundantdata structure and repeated entries and toanticipate further growth (Wjst and Immervoll,1998).
FAQ (frequently asked questions)—Questionsabout historical aspects, biology, and integratedmanagement of codling moth.
Quick Facts—Knowledge-base on Quick Factsprovides swift access to biological and ecologicalparameters required for codling moth modeling,forecasting and risk assessment, zoogeography,bibliographic information, phenology modelinginformation, etc. The information in this knowledge-base is extracted from worldwide codling mothliterature and presented in tabular and graphicformat with appropriate bibliographic citations.
Guide to Historical Codling Moth Events—Various discoveries and events pertaining to codlingmoth biology, ecology, toxicology, and pestmanagement.
Bionomics of Codling Moth—A knowledge-base on codling moth biology, ecology (includingecological adaptation), phylogenic, zoogeography,and taxonomy.
Integrated Codling Moth Management—Thisknowledge-base provides a detailed account ofbasic and applied aspects of integrated codlingmoth management. It covers a wide array of topics
including biological, chemical, cultural, microbial,and semiochemical controls. It also providesinformation on application of geographicalinformation system (GIS) and the areawide pestmanagement concept to integrated management ofcodling moth.
Codling Moth Index (CMI) – A searchabledatabase of worldwide codling moth literature fromthe years 1700 to 1999 (almost 6,500 references).This bibliographic database contains referencesfrom journal/review articles, book chapters,conference papers, and technical reports, andgenerally includes abstracts when available. Thisdatabase is designed to allow convenient searchesby author, year of publication, title, publication(journal/book title), and keywords with and withoutuse of logical (Boolean) operators “AND,” “OR,”and “NOT.”
Specialty Databases – These searchabledatabases have a similar format as that of CMI.
Chemical Control of Codling Moth – Achronologically arranged bibliographic databasewith more than 1,000 references from the years1700 to 1998.
Biological Control of Codling Moth – Achronologically arranged bibliographic databasewith over 600 references from the years 1700 to1998.
Systems Analysis and Modeling of CodlingMoth Phenology and Population Dynamics – Aknowledge-base and searchable bibliographicdatabases of worldwide literature on the subjectmatter.
Generalized Phenology Model/Degree-dayCalculators – This calculator can be used fromanywhere in the world for forecasting the codlingmoth phenology under local conditions. Theprogram works by allowing the client computer toupload a local weather data file to the server.
Population Dynamic Model – An onlinepopulation dynamics model allows users todetermine the combined effects of multiple controlmeasures such as mating disruption and reducedrate of chemical insecticides.
Information Distillation on various aspects ofcodling moth phenology and population dynamicsincluding modeling parameters, etc. The modelingparameters are extracted from worldwide archivaland current codling moth literature.
Codling Moth Pherobase – A knowledge-baseon basic and applied aspects of integrated codlingmoth management by sex pheromones. Thesection on basic aspects covers topics likepheromone chemistry, endocrinology, olfaction

219
(including perception and mechanisms of phero-monal communication), effect of pheromone onsexual behavior, synergists and antagonist(antipheromones, inhibitors, masking agents, etc.),disruption of pheromonal communication, effects ofenvironmental cues (temperature, light, etc.) onfemale calling and male response, etc. The sectionon applied aspects encompasses aspects such ascodling moth monitoring and pheromonal control.
Searchable Database of Internet CodlingMoth Resources—This database provides links to
more than 250 online codling moth resources fromall over the world.
Worldwide Codling Moth Distribution—AnExample from CMISS. A few paragraphs fromCMISS on worldwide distribution of codling mothare given below to show the type of informationavailable through CMISS.
“The native home of the codling moth is consideredto be southeastern Europe, from which it spread tovarious parts of the world (Figure 2). Theophrastusmentioned this insect in his writings in 371 B.C.Cato, the great orator of ancient Rome, speaks of“wormy apples” in his treatise on agriculture writtennearly 200 years before the Christian era. In thefirst century A.D., both Columella and Plinydoubtless referred to this insect in their writing. Thecodling moth is now a cosmopolitan insectoccurring in almost every country where the appleis grown. It is evident that present distribution ofcodling moth is related to climatic factors as well asto food conditions. In view of the nature of the lifehistory of the codling moth, the most commonmode of its spread from one place to another isthrough the transport of infested fruit and packingmaterial. The boundaries of present day rangesare largely determined by temperature conditions.In most localities, the northern boundary is definedby the amount of heat in the summer, a sum of
effective temperature above 10°C of the order600 degree-days. Owing to the considerable coldresistance of the diapausing caterpillars and theiroverwintering beneath the snow, winter minimumsrestrict the range of the species only in the mostcontinental regions, e.g. eastern Siberia andCanada. In the tropical regions, the limits of therange are mainly determined by the overwinteringconditions and by absence of winter cooling that isessential to reactivation of the diapausing larvae;these limits coincide closely with the +10°Cisotherm of the coldest months.
“In Europe, northern limits of the codling mothextend through Scotland and Scandinavia, where itreaches latitude 640°N, and on through SouthernKarelia, Kirov and Perm, which correspond closelyto the limits of apple cultivation. There has been farmore distribution of this insect in Asia, mainly withinthe Commonwealth of Independent States (CIS).The codling moth has even followed the apple intoSiberia, and does serious damage in most
Figure 2. Codling Moth Distribution Map from CMISS.

220
localities. In the East, however, outside the CIS,the codling moth is found only in Chekiang andSinkiang Uighur (China). It is absent elsewhere inChina, and is an object of both internal and externalquarantine. The southern distribution limit of thecodling moth extends through the mountainousarea of North Africa (including Tunisia, Morocco,and North), across Israel, Syria, Iraq, and Iran,ending towards 300°N. In Pakistan, this pest camethrough Afghanistan, where it spread from Iran andthe Central Asian states. It has also been observedin the mountains of northern India (in the state ofHimachal Pradesh). In South Asia (Indo-Pakistansubcontinent), the infestation is confined to areasbetween 4,500 and 9,000 feet above sea level andthe pest thrives best between 5,000 and 7,000 feet.
“In the USA, codling moth was probably introducedfrom Europe in packages containing infested applesand pears. It was first observed in New England in1750, in Iowa in 1860, and in Washington (state) in1880. It is now found in almost every state whereapple/pear are grown. In Canada, it inhabitssouthern regions from New Brunswick toVancouver Island, approximately to latitude 50°N.In Mexico, this insect is distributed only in the north-central areas. The codling moth has also becomefirmly acclimatized in the southern hemisphere. Ithas spread in Australia and is destructive in thesoutheast of the continent, in Tasmania and in NewZealand. It once occurred in western Australia, but
was eradicated in 1958. In Africa, it is confined toSouth Africa as far as Pretoria and Orange River. InSouth America, it occurs in Argentina, Uruguay,Brazil, Columbia, Chile, and Peru.”
Literature Cited
Bajwa, W.I. and M. Kogan. 1999. DatabaseManagement System for Internet IPM Informa-tion. In: Proceeding for 1999 IPM Conference.IPPC, Oregon State University, Corvallis,Oregon.
MacRae, I.V. 1996. IPM Resources on the WorldWide Web. In: Radcliffe’s IPM World Textbook(Electronic Publication). http://ipmworld.umn.edu/chapters/macrae.htm (Visitedon July 26, 1999 at 11:00 AM)
Reed, D.K., N.J. Tromley, and G.L. Reed. 1985.Activity of Avermectin B1 against codling moth(Lepidoptera: Olethreutidae). J. Econ. Ent. 78(5):1067-1071.
Stinner, R.E. 1998. Globalization of IPM through theInternet. pp. 289-296. In: Zalucki, M.P., R.A.I.Drew, and G.G. White (Eds.) Pest manage-ment—future challenges. Australia: University ofQueensland Printery.
Wjst, M. and T. Immervoll. 1998. An Internet linkageand mutation database for the complexphenotype asthma. Bioinformatics, 14 (9):827-828.

221

222

223

224

225

226

227

228

229

230

231

232

233

234

235

236

237

238

239

240

241

242

243

244

245

246

247

248

249

250