CARRIER VOICE NETWORK MANAGEMENT CARRIER VOICE NETWORK MANAGEMENT
Upload
khangminh22Category
view
0download
0
ASIAN DEVELOPMENT BANK
MAPPING THE PUBLIC VOICE FOR DEVELOPMENT
AUGUST 2022
NATURAL LANGUAGE PROCESSING OF SOCIAL MEDIA TEXT DATAA Special Supplement of Key Indicators for Asia and the Pacific 2022

ASIAN DEVELOPMENT BANK
MAPPING THE PUBLIC VOICE FOR DEVELOPMENT
AUGUST 2022
NATURAL LANGUAGE PROCESSING OF SOCIAL MEDIA TEXT DATAA Special Supplement of Key Indicators for Asia and the Pacific 2022
Creative Commons Attribution 3.0 IGO license (CC BY 3.0 IGO)
© 2022 Asian Development Bank6 ADB Avenue, Mandaluyong City, 1550 Metro Manila, PhilippinesTel +63 2 8632 4444; Fax +63 2 8636 2444www.adb.org
Some rights reserved. Published in 2022.
ISBN 978-92-9269-701-3 (print); 978-92-9269-702-0 (electronic); 978-92-9269-703-7 (ebook)Publication Stock No. FLS220347-3DOI: http://dx.doi.org/10.22617/FLS220347-3
The views expressed in this publication are those of the authors and do not necessarily reflect the views and policies of the Asian Development Bank (ADB) or its Board of Governors or the governments they represent.
ADB does not guarantee the accuracy of the data included in this publication and accepts no responsibility for any consequence of their use. The mention of specific companies or products of manufacturers does not imply that they are endorsed or recommended by ADB in preference to others of a similar nature that are not mentioned.
By making any designation of or reference to a particular territory or geographic area, or by using the term “country” in this document, ADB does not intend to make any judgments as to the legal or other status of any territory or area.
This work is available under the Creative Commons Attribution 3.0 IGO license (CC BY 3.0 IGO) https://creativecommons.org/licenses/by/3.0/igo/. By using the content of this publication, you agree to be bound by the terms of this license. For attribution, translations, adaptations, and permissions, please read the provisions and terms of use at https://www.adb.org/terms-use#openaccess.
This CC license does not apply to non-ADB copyright materials in this publication. If the material is attributed to another source, please contact the copyright owner or publisher of that source for permission to reproduce it. ADB cannot be held liable for any claims that arise as a result of your use of the material.
Please contact [email protected] if you have questions or comments with respect to content, or if you wish to obtain copyright permission for your intended use that does not fall within these terms, or for permission to use the ADB logo.
Corrigenda to ADB publications may be found at http://www.adb.org/publications/corrigenda.
Notes: In this publication, “$” refers to United States dollars. ADB recognizes “China” as the People’s Republic of China.
Cover design by Princess Monique Abaya Po.
Printed on recycled paper

Contents
Tables, Figures, and Listings .......................................................................................................................v
Foreword ....................................................................................................................................................vii
Abbreviations .............................................................................................................................................ix
Highlights .....................................................................................................................................................x
Introduction ................................................................................................................................................. 1Some Advice on Reading this Report ................................................................................................................. 6
Communication and Language ...................................................................................................................8Communication .................................................................................................................................................... 8Language ...............................................................................................................................................................10Speech and Text ...................................................................................................................................................10User-Generated Content ....................................................................................................................................14Social Networks and Online Communities.......................................................................................................14
Addressing the Sustainable Development Goals through Natural Language Processing .................... 16SDG 1: No Poverty ................................................................................................................................................16SDG 2: No Hunger................................................................................................................................................18SDG 3: Good Health and Well-Being ................................................................................................................19SDG 5: Gender Equality .......................................................................................................................................21SDG 10: Reduced Inequalities ........................................................................................................................... 23SDG 11: Sustainable Cities and Communities ................................................................................................ 25SDG 13: Climate Action ...................................................................................................................................... 26
Data Preparation .......................................................................................................................................28Data Sources and Format ................................................................................................................................... 28Data Noise ............................................................................................................................................................ 30
Nonword Tokens .................................................................................................................................................30Stop Words ...........................................................................................................................................................34Language Use .......................................................................................................................................................38
Data Representation ................................................................................................................................ 42Representing Words and Documents Using a Term- Document Matrix .................................................... 42Establishing the Relevance of a Word to a Document through Term Frequency - Inverse Document Frequency ............................................................................................................................................................. 45
iv Contents
Text Analysis Using Natural Language Processing ................................................................................. 48Keyword Extraction ............................................................................................................................................ 48Document Clustering Using “k-means” .......................................................................................................... 53Topic Modeling Using Latent Dirichlet Allocation ......................................................................................... 59Case Study: Climate Change in Australia ........................................................................................................ 65
Background ..........................................................................................................................................................65Methodology ........................................................................................................................................................65Results ...................................................................................................................................................................70Discussion ............................................................................................................................................................73
Text Classification .....................................................................................................................................74Sentiment Analysis ............................................................................................................................................. 75SentiWordNet ...................................................................................................................................................... 75Valence Aware Dictionary and sEntiment Reasoner ...................................................................................... 78Linguistic Inquiry and Word Count ..................................................................................................................80Case Study: The COVID-19 Pandemic in the Philippines ............................................................................. 83
Background ..........................................................................................................................................................83Methodology ........................................................................................................................................................83Results ...................................................................................................................................................................87Discussion ............................................................................................................................................................ 91
Conclusions ................................................................................................................................................93Summary of Report ............................................................................................................................................. 93Limitations of the Bag of Words and Term Frequency - Inverse Document Frequency Models ............. 93Challenges in Handling User-Generated Content ........................................................................................ 94Data Governance and Ethics ............................................................................................................................. 95
References ................................................................................................................................................. 99
Libraries.................................................................................................................................................... 114

v
Tables, Figures, and Listings
Tables1 Natural Language Processing Techniques and Data Used to Gain Deeper Insights
for Poverty Reduction Strategies ................................................................................................................................ 162 Partial List of Topics Derived via Latent Dirichlet Allocation Topic Modeling
for Sustainable Development Goal 1 .......................................................................................................................... 173 Natural Language Processing Techniques and Data Used for Persephone Modeling
on Agriculture Research ............................................................................................................................................... 184 Natural Language Processing Techniques and Data Used to Gain Deeper Insights for Health Policies....... 195 Natural Language Processing Techniques and Data Used to Gain Deeper Insights on Gender Inequality ......236 Natural Language Processing Techniques and Data Used to Gain Deeper Insights for Policies
to Reduce Socioeconomic Inequalities .....................................................................................................................247 Natural Language Processing Techniques and Data Used to Gain Deeper Insights
for Policies on Sustainable Cities ................................................................................................................................258 Natural Language Processing Techniques and Data Used to Gain Deeper Insights for Policies
on Climate Action ..........................................................................................................................................................279 Samples of Incorrectly Encoded Content .................................................................................................................2810 Examples of Special Characters or Symbols .............................................................................................................3011 Suggested Transformations for, and Reasons for Further Processing of, Nonword Tokens............................. 3112 Examples of Texts With and Without Stop Words ..................................................................................................3813 Examples of Misspellings and Their Corrected Forms ............................................................................................3914 Comparison of Lemmatization and Stemming ......................................................................................................... 4115 Implementation Provisions to Calculate Term Frequency .....................................................................................4516 Output of Code for Keyword Extraction Using Term Frequency - Inverse Document Frequency ................4917 “n-grams” from the Line “the quick brown fox” ......................................................................................................5018 Keywords Extracted from the Source Based on Rapid Automatic Keyword Extraction ...................................5219 Extracted Keywords Using Rapid Automatic Keyword Extraction on the British Broadcasting
Corporation News Summary Corpus .........................................................................................................................5320 Sample Topic Model of Twitter Posts about Typhoon Haiyan ..............................................................................6321 Manually Labeled Topic Model of Twitter Posts about Typhoon Haiyan ...........................................................6322 Excerpt of the Document-Topic Distribution of the Topic Model of Twitter Posts about Typhoon Haiyan ... 6423 Definition of 15 Topics on Climate Change and the Top 30 Keywords for Each .............................................. 7124 Excerpt from the Valence Aware Dictionary and sEntiment Reasoner Lexicon ................................................7925 Sample of Linguistic Inquiry and Word Count Main Categories and Examples .................................................8226 Valence Aware Dictionary and sEntiment Reasoner Compound Scores
and Social Weather Survey Results ............................................................................................................................ 91
Figures1 Illustration of De Fleur’s Model of Mass Communication ....................................................................................... 82 Topic Model Analysis of Tweets, by Income of Individual .....................................................................................243 Zipf Plots from Text Corpora .......................................................................................................................................36

vi Tables, Figures, and Listings
4 Word Clouds Showing Changes After Lemmatization and Stemming ............................................................... 405 Visualization of a Term-Document Matrix ...............................................................................................................436 Term Vector ti and Document Vector dj ...................................................................................................................437 Sample Vector Models Showing Semantic Similarity ............................................................................................. 448 Term-Document Matrix Using Term Frequency - Inverse Document Frequency ............................................479 Candidate Keywords Extracted from the Source Using Stop Words as Delimiters ...........................................5010 Word Co-occurrence Graph Showing the Calculation of the Candidate Keyword Score ............................... 5111 Two-Cluster “k-means” Simulation ...........................................................................................................................5412 Within-Cluster Sum of Squares versus “k” Graph to Find the Elbow ..................................................................5713 Sample Silhouette versus “k” Plot ..............................................................................................................................5914 Key Concept of Latent Dirichlet Allocation ............................................................................................................ 6015 Graphical Notation of Latent Dirichlet Allocation Showing the Dependencies Among Model Parameters ... 6016 Topic Coherence Scores by Number of Topics to Determine the Optimal Number of Topics ......................6917 Top 10 Keywords for Each of the 15 Topics on Climate Change ...........................................................................7218 Sample WordNet Entry for the Word “Estimable” ..................................................................................................7619 SentiWordNet’s Graphical Representation of the Sentiment Properties of a WordNet Sense ......................7620 SentiWordNet Scores for the Word “Estimable” .....................................................................................................7721 Count of Tweets Related to COVID-19 in the Philippines, May–December 2021 ...........................................8722 Count of Tweets with Negative and Positive Sentiments about COVID-19, May–December 2021 .............8823 Count of Use of Selected Emojis in Relation to COVID-19, May–December 2021 .........................................89
Listings1 Encoding and Decoding Between Formats ...............................................................................................................292 Conversion of Nonword Tokens to Special Tags ......................................................................................................323 Removal of Nonword Tokens ......................................................................................................................................334 Creation of Customized Stop Word Lists ..................................................................................................................375 Stemming and Lemmatization of Words ................................................................................................................... 416 Word Vectorization Using Term Frequency - Inverse Document Frequency ...................................................467 Keyword Extraction Using Term Frequency - Inverse Document Frequency ....................................................488 Keyword Extraction Using Rapid Automatic Keyword Extraction ........................................................................529 Document Clustering Using the “k-means” Algorithm ..........................................................................................5510 Calculation of the Within-Cluster Sum of Squares and Generation of the Within-Cluster Sum
of Squares versus “k” Graph ........................................................................................................................................5611 Calculation of the Silhouette Value and Generation of the Silhouette versus “k” Graph ................................5812 Topic Modeling with Latent Dirichlet Allocation and Calculation of Topic Coherence ...................................6213 Sentiment Analyzer Based on an Example Sentence............................................................................................. 80

vii
Foreword
Sound economic research and policymaking depend on timely and granular data—the coronavirus disease (COVID-19) pandemic further heightened the need for real-time and comprehensive information for these purposes. High-quality data can inform us of the ways that knowledge is generated, how governance is perceived by the general public, and the process of policy formulation. Data are increasingly being generated at the personal level, with social media emerging as an important platform. As more and more people use social media to receive information and share their views, social media text data become a valuable source of timely and granular information that can be used to map and track the behavior, opinions, concerns, and expectations of citizens. Thus, publicly available social media text data from diverse social media platforms can be used to study sentiment or topics of concern in society. Analysis of such data can be conducted through the application of natural language processing (NLP), which is the core subject of this special supplement to Key Indicators for Asia and the Pacific 2022.
This report aims to introduce techniques and procedures of NLP, the computational preparation and analysis of text data, to map the public voice and aid development. First, the report introduces essential concepts of communication and elaborates on the theoretical foundations of natural language analyses. Second, the report reviews research on NLP of social media text data by showcasing studies that have applied the techniques to the Sustainable Development Goals. Third, the report reviews specific NLP techniques, including data preprocessing, and dicusses libraries and programming procedures. It also reviews concepts such as keyword extraction to identify relevant terms, topic modeling to detect common themes, and text classification to recognize language features. These NLP techniques are showcased in two case studies. The first shows how topic modeling can be applied to derive insights on the public debate over climate change in Australia. The second demonstrates how text classification can be leveraged to analyze public sentiment on COVID-19 in the Philippines. Finally, the report discusses the challenges and limitations, as well as the potentials, of NLP.
The data innovations introduced in this special supplement can support policymakers and researchers in Asia and the Pacific to better comprehend the public perspective on specific issues within the burgeoning volume of social media text data. As public sentiment and perceptions determine policy success, governments can apply these techniques to listen to online communities more effectively and adjust program implementation and communication strategies accordingly.
viii Foreword
The report is the end product of rigorous contributions from a variety of experts. The special supplement team was led by Daniel Boller, under the overall guidance of Kadra Saeed and Elaine S. Tan. Charibeth Cheng wrote the main report. Contributing authors of the case studies and the main report include Cedric Basuel, Stanley Lawrence Sie, and Alyssa Villanueva. Rhoda Abadia, Kelly Bird, Azel Gorne, Zhigang Li, Rosemarie Marquez, Ker Metanoia Oliva, Zelinna Pablo, Yasuyuki Sawada, Lei Lei Song, and James Villafuerte helped refine the results of the case studies and the main report. We also appreciate the support, direction, and feedback of the Asian Development Bank’s Pacific Department, the Philippines Country Office, and the Information Technology Department throughout the information-gathering process. Ma. Roselia Babalo, Joseph Albert Nino Bulan, Rose Anne Dumayas, and Melissa Pascua provided administrative and operational support and helped organize the workshops, launch events, and other related webinars and briefings necessary to deliver a quality publication. Princess Monique Abaya Po designed the cover of the supplement, and Joe Mark Ganaban provided layout, page design, and typesetting services. Paul Dent edited the report.
We hope this special supplement can equip governments, researchers, and development practitioners in Asia and the Pacific to take advantage of social media text data as a rich new source from which to derive insights on topics of concern in society and, ultimately, to accelerate inclusive and sustainable development.
Albert F. ParkChief Economist and Director GeneralEconomic Research and Regional Cooperation DepartmentAsian Development Bank

ix
API application programming interfaceBBC British Broadcasting CorporationBoW bag of wordsCOVID-19 coronavirus diseaseECQ Enhanced Community QuarantineGCQ General Community QuarantineHTTP Hypertext Transfer ProtocolIDF inverse document frequencyIT information technologyJSON JavaScript Object NotationLDA Latent Dirichlet AllocationLIWC Linguistic Inquiry and Word CountNLP natural language processingNLTK Natural Language ToolkitPRC People’s Republic of ChinaQ quarterRAKE Rapid Automatic Keyword ExtractionRSS Really Simple SyndicationSDG Sustainable Development GoalSWS Social Weather StationsTF term frequencyTF-IDF Term Frequency – Inverse Document FrequencyUGC user-generated contentUK United KingdomUS United StatesUTF-8 UCS Transformation Format 8VADER Valence Aware Dictionary and sEntiment ReasonerVSM vector space modelsWSS Within-cluster Sum of SquaresXML Extensible Markup Language
Abbreviations

x
• Social media and open communication platforms are becoming major sources of information for research. An analysis of social media text data can provide an understanding of public attitudes and behaviors on particular topics and issues. Policymakers can benefit in situations requiring rapid responses by using social media text data to “listen” to what individuals consider to be significant in their lives.
• Social media text data analysis has contributed in policy development to achieve the Sustainable Development Goals. Natural language processing (NLP) techniques have been utilized in research to analyze social media text data containing the public’s opinions, emotions, and online behaviors, providing valuable insights and helping governments develop better policies. For instance, sentiment analysis has been used to understand the public’s concerns or emotions, while topic modeling has been used to identify common topics reflecting the public’s opinions.
• Effectively preprocessing text data is important. Preprocessing helps to convert unstructured social media text data into a meaningful body of words without losing relevant information, while removing content that interferes with the implementation of techniques or algorithms of NLP.
• Detecting noises and irrelevant information in the text data is crucial in data extraction and analysis. Noises can come in several forms such as nonword tokens (digits, special characters, and punctuations) or stop words (words that occur frequently in the text that are not relevant to capture the content of the text). A noise that is dependent on the language used requires several preprocessing techniques, such as spelling correction, reverting inflected words back to their root form, to analyze the text.
• Beyond dictionaries, the information and context of words are encoded by examining their statistical properties in a volume of text. Vector space models allow words to be represented as high-dimensional vectors, which are sequences of numbers with a fixed length. Words encoded as vectors are then used as input in many NLP models.
• Several techniques and models are used to gain insights from a large volume of text. Keyword extraction identifies important words in a given text. Topic modeling detects the different topics and themes being discussed in a text. Text clustering and classification models generate and assign categories for each item in a large volume of text.
Highlights

xiHighlights
• A case study on Twitter posts that mention climate change by users in Australia demonstrates a wide variety of perspectives on the issue. Through this case study, topic modeling has revealed 15 different topics about measures to combat climate change and the public’s expectations of the government, which can guide policymakers in ensuring all stakeholders are involved when creating relevant policies.
• A case study on coronavirus disease (COVID-19) related Twitter posts by users in the Philippines demonstrates how using social media text data for NLP may track sentiments and complement (but not replace) traditional opinion surveys. Through sentiment analysis of the tweets, key pandemic-related events, such as surges in cases and application of movement restrictions, were identified to affect positive and negative sentiment trends. This can aid policymakers when considering containment policies.
• While NLP helps facilitate and accelerate the development of evidence- based policies, there are challenges that need to be considered each time it is put to use. Data-related issues such as representativeness and authenticity affect the creation of valuable insights. It is important to consider ethical principles when working on NLP projects involving social media text data.

1
Introduction
The success of a policy is closely linked to collective personal sentiment and which topics within a broad subject attract the public’s attention. These factors affect the implementation and outcome of a policy, which in turn influences how people feel. More closely understanding the popular discussion topics within a broad subject equips policymakers with granular knowledge to target and focus on aspects that motivate the general populous. Thus, the process of policymaking can be improved with the inclusion of systematic and quantitative analyses of a population’s publicly available interpersonal communications. In this publication, we will focus on the analysis of communications expressed publicly in social media,1 which are growing in importance. There are other channels, such as surveys, through which policymakers can infer a population’s sentiments and interests, but these will not be the focus of this report.
Communication connects humans and institutions. In the course of history, the mediums of communication have changed repeatedly. The origins of speech and language, the development of writing, the invention of the printing press, the explosion of audiovisual mass media, and the digital age of the internet typify the five periods of the history of communication (Bernabo 2017). The last period is the third information communication revolution, which began in 1951 with the invention of computers. With the introduction of the word processor (1964), e-mail (1965), search engines (1990), wikis (1994), instant messaging (1996), and online content collaboration (2011), human communication and interaction has changed rapidly. Meanwhile, the market for personal computers accelerated in 1976 and the rise of commercial internet service providers (ISPs) in the late 1980s (and early 1990s) increased the popularity of the worldwide web. Anything from a newspaper or a photograph to a musical album or a movie can now be accessed via the internet (Bernabo 2017). Indeed, the number of internet users worldwide increased from 413 million in 2000 to almost 5 billion at the beginning of 2022. Most internet users engage in social media, namely community- based digital channels as well as virtual communities and networks. These users spend, on average, about 7 hours per day online across all platforms, with social media accounting for the greatest single share of internet time, at 35% of the total time spent on the internet (DataReportal 2022a).
Social media sites have changed the course of life. The general public´s access to information or news, how they find partners, how they look for work, how they shop, and how they connect, among many other spheres of life, are all changing as a result of the rapid and widespread adoption of social media. Social media has surpassed radio, print news publications, blogs, and word-of-mouth as the most widely used news sources worldwide, with over 50% of consumers now using social media to access
1 The report’s authors did not access or analyze private and confidential communications.

2 Mapping the Public Voice for Development—Natural Language Processing of Social Media Text Data
information and news (Statista 2021). In a similar vein, social networks, in the form of online dating services, are today the most common way for heterosexual couples to meet (Rosenfeld, Thomas, and Hausen 2019). Likewise, online professional networks allow candidates to quickly connect with potential employers, with four people hired every minute on a platform such as LinkedIn (LinkedIn 2022). Additionally, a large swathe of people (47.5%) employ social media to keep in touch with their friends and family (DataReportal 2022b). Moreover, public institutions and the general public leverage social media as an intermediary to foster new thinking and promote particular societal issues or causes. For example, Springster, a mobile application created by Girl Effect, blended social media with traditional approaches to identify new and improved ways of generating positive change and improving female image- building in an online space (Rana 2020). Social media have also been used to drive social movements or coordinate medical resources during crises (Tufekci 2017) and enable speedier information-sharing, which is important for knowledge translation and dissemination. All of this ultimately affects political communication and public discourse (Garcia and Berton 2021).
Social media platforms (e.g., Facebook, LinkedIn, and Twitter) generate massive volumes of data every day (Jordan et al. 2018). Humans leave digital footprints when discussing their thoughts, feelings, and opinions on social media platforms, an analysis of which can provide an understanding of public attitudes and behaviors and allow researchers to characterize the current state of a community (Goodchild 2007; Rasmussen and Ihlen 2017). Policymakers and researchers may benefit from social media data in multiple ways. Policymakers can benefit in situations requiring rapid responses. At times when information from traditional survey data is delayed and/ or incomplete, they can also use social media data to analyze ideas, moods, and behaviors about a variety of phenomena such as health crises, disasters, and climate change (He et al. 2015). Researchers can use social media data to “listen” to what individuals consider significant in their lives as well as to derive insights into attitudes, beliefs, and behaviors for leaders and societal representatives to influence public policy (Samuel et al. 2020).
During a pandemic, timely data on well-being is especially important since it allows for swift policy responses to changing conditions. Samuel et al. (2020), for instance, conducted an analysis using Twitter data to identify public sentiment on fear linked to the rapid spread of the coronavirus disease (COVID-19). This research could support health practitioners and policymakers as well as state and federal governments in better understanding and identifying rapidly changing psychological risks (e.g., distress, anxiety, fear, and mental illness) in society. As a result, government agencies may design swift responses and efforts (such as counseling and internet-based psychological support mechanisms) to minimize and prevent negative emotional and psychological impacts, especially during times of crisis. Sarracino et al. (2021) applied sentiment analysis on Twitter data to develop timely and frequent measurements of well-being as well as other factors such as generalized trust, trust in institutions, loneliness,
3Introduction
and economic fear. The authors further emphasized that individual responses are critical to the effectiveness of health care services and influence the success of “exit” strategies to relax lockdowns and implement pandemic recovery plans. Boon- Itt and Skunkan (2020) concluded, similarly, that people had a negative sentiment toward COVID-19 based on sentiment analysis of posts on Twitter from Thailand. Moreover, the authors identified overarching themes, namely pandemic emergency, virus containment, and COVID-19 reports based on topic models. Xue et al. (2020), on the other hand, reported that most tweets from Twitter in the United States (US) referred to early detection of COVID-19 and a potential outbreak in New York City. Similarly, Amara, Hadj Taieb, and Ben Aouicha (2021) analyzed posts from Facebook about COVID-19. The authors found that most discussions were on the origins of the virus, how to combat it, and quarantine protocols as well as numbers of casualties and vaccine research. These findings suggest an opportunity to use social media messaging to aid the public and authorities in responding to a disease’s spread and in disseminating information on reports and vaccinations (Xue et al. 2020).
On the topic of COVID-19 vaccines, Hussain et al. (2021) used an approach based on artificial intelligence to assess public sentiments on Facebook in the United Kingdom (UK) and the US. The findings revealed that people showed enthusiasm but also voiced their concerns, eventually enabling the detection and prevention of fears as well as allowing policymakers to comprehend why particular social groups may be hesitant about being vaccinated. On the contrary, however, using text data collected from 13 Reddit communities in the US, Melton et al. (2021) found that these communities expressed more positive than negative sentiments regarding vaccine- related subjects. These findings revealed that it might be easier to implement effective messaging, digital initiatives, and new legislation to boost vaccine confidence among certain communities. Similarly, Villavicencio et al. (2021) used Twitter data to assess sentiments (positive, neutral, and negative) on COVID-19 vaccines in the Philippines. The authors noted that the findings might guide the Government of the Philippines in making informed judgments on fund allocation, vaccination provision, and vaccination rollout strategy.
The benefits of social media for disaster risk reduction are also evident, especially in monitoring the extent of unfolding disaster events, which are often difficult to verify but can be easily confirmed when people share their experiences through digital channels. Hence, social media can act as a crowdsourcing tool to collect information directly from victims and mobilize governments and emergency responders in their relief efforts (Jamali et al. 2019). For example, using Twitter data, Widyanarko and Hizbaron (2020) studied the urban response to a tropical cyclone in Indonesia. The findings revealed that cities responded positively to these devastating events by posting words of prayer and sorrow and organizing donations for victims.
Grunder-Fahrer et al. (2018) investigated disaster-related messages on both Facebook and Twitter in Germany. According to their findings, the majority of Facebook content focused on empathy and emotions as well as social involvement,

4 Mapping the Public Voice for Development—Natural Language Processing of Social Media Text Data
whereas Twitter was mostly utilized to share current and concrete information regarding the Central European flooding in 2013. The findings emphasize the value of social media in boosting social connections and concrete relief operations during response and recovery stages as well as providing coordinating points for disaster management. These results were also consistent with the study by Takahashi, Tandoc, and Carmichael (2015), which examined how different stakeholders used Twitter during and after Typhoon Haiyan in the Philippines. They found that Twitter was mostly used for the sharing of secondhand information, coordinating relief operations, and memorializing individuals who had been affected. Similarly, Vayansky, Kumar, and Li (2019) used sentiment analysis and topic modeling to examine geotagged posts on Twitter about Hurricane Irma. The authors noted that people had a more optimistic view when tweeting about help for and safety of others as well as conveying details of the hurricane’s physical characteristics.
In the context of disaster risk mitigation, Zhang et al. (2021) further suggested a topic- model-based framework using tweets from Twitter to extract demand for relief supplies and location information after Typhoon Haiyan hit the Philippines. The insights are crucial for the procurement of resources from governmental, international, and private entities that meet a disaster area’s specific needs. Efforts in response to future calamities should be improved to better comply with the demands of particular areas and enhance the overall distribution of services by assessing the overall sentiments and underlying topics (Vayansky, Kumar, and Li 2019).
Therefore, examining patterns in social media data during a disaster can help governments document both effective and ineffective information dissemination strategies, which can be helpful in future responses to best cater to the needs of communities seeking not only physical but also emotional support (Takahashi et al. 2015). Karimiziarani et al. (2022) analyzed Twitter data posted during Hurricane Harvey, which hit the US in 2017, and found that understanding the risk perceptions during the disaster period can enhance adaptation strategies for urban design and planning as well as deploy emergency responders to tweets containing information on damages, injuries, requests for help, and situational updates. This was also noted by Baro and Palaoag (2019), who evaluated disaster- related tweets in the Philippines to contribute to the government’s initiatives in reducing injuries, infrastructure damage, property damage, and loss of life.
Exploring how analysis of social media data might help in policymaking toward the Sustainable Development Goals (SDGs) is crucial, since the absence of timely data is a major impediment in this area. Many governments continue to lack adequate information on their own populations and, as social media become more widespread, their public data can play an increasingly essential role in the measurement of the SDGs (Hounkpevi 2020). For example, appeals for immediate action to address climate change and its impacts prompted Mighani (2020) to conduct a sentiment analysis of the global warming narrative and societal awareness using Reddit data.

5Introduction
The author identified an upward trend in posts reflecting global warming concerns and conspiracy theories starting 2019. These findings might be used to inform policies on environmental management and climate action. Bennett et al. (2021), meanwhile, established a framework to supplement US regional survey data with social media data and applied topic modeling with the objective of enhancing the characterization of climate change opinion. According to the study’s models, Twitter users in certain regions support climate science, while others strongly support climate change denial. This research suggests that framing policies to align immediate concerns with citizens’ beliefs, attitudes, and values can expedite the implementation of climate policies and, in turn, increase the flexibility of the US to cope with and tackle climate change.
In another area of the SDGs, namely gender inequality in the context of premature marriage, Syahirah et al. (2018) used social media data (e.g., Digg, Facebook, FriendFeed, Google, Twitter, and YouTube) to investigate global trends and emotions around the practice of child marriage. The authors revealed that 95% of sentiment is negative and opposes the practice, whereas the 5% of positive sentiment is based on a hazy understanding of tradition and religion. The findings can be used to support calls for legislation on the practice to be amended or repealed, as well as supporting policies that address violence against women and children. In another context of gender inequality, a study by Luo and He (2021) assessed gendered perceptions of transportation services in the People’s Republic of China (PRC) using data from Weibo microblogs. According to the authors, women’s voices are frequently ignored or silenced in traditional transportation planning (e.g., women are more worried about the comfort and safety of the transit environment). The results of the study can help develop gender-sensitive transportation strategies to improve women’s travel experience and avoid sexual harassment while commuting.
Given the widespread adoption and increasing pervasiveness of social media, this publication explores the utilization of natural language processing (NLP) for analyzing citizens’ online attitudes, opinions, and behaviors. This data innovation is critical in supporting governments in developing better policies, including mitigation measures to address COVID-19 and climate change. The report’s objective is to map the public voice for development by utilizing NLP (i.e., computational processing and analysis of natural language data) of social media text data.
In the first chapter, we introduce fundamental concepts of communication, including the theory of language as well as speech and text. These are necessary for a comprehensive understanding of the methodological prerequisites for the computational integration of natural language data, considering different branches of linguistics. We also discuss the specific premises of user-generated content (UGC) and natural language, as well as different types of users on social media, to obtain insights into content types and contributors of social media text data. We review research on NLP of social media text data in the context of SDGs in the second chapter. This showcases available resources and applications as well as insights on development
6 Mapping the Public Voice for Development—Natural Language Processing of Social Media Text Data
yielded in previous research. Moreover, we outline future research directions and opportunities for NLP in the context of development. In the third chapter, we elaborate on the data preprocessing required to convert unstructured social media text data to a meaningful text corpus for subsequent analysis. In this context, we discuss sources and formats of social media text data, including data encoding. Moreover, we elaborate on the handling of nonword tokens and stop words and consider language-dependent data preprocessing. We introduce protocols, including libraries and programming procedures, to implement the discussed data preprocessing using common standards. We then apply the foundations of NLP to analyze social media text data and derive valuable insights in the fourth chapter. In particular, we discuss the representation of words and documents using the term-document matrix and the analysis of the relevance of a word to a document through term frequency - inverse document frequency (TF-IDF). The fifth chapter discusses further NLP techniques, starting with keyword extraction to identify relevant terms. Moreover, we elaborate on document clustering using k-means and topic modeling using Latent Dirichlet Allocation (LDA) to identify common topics in social media text data. In the sixth chapter, we review methods for text classification to identify language features, including sentiment in social media text data. The chapter is accompanied by protocols, including libraries and programming procedures, to implement the techniques of NLP using common standards. It also showcases the applicability of techniques of NLP to analyze social media text data in the context of climate change (topic modeling) and COVID-19 (sentiment analysis). Finally, we conclude with a review of challenges and limitations of NLP as well as a discussion of future potentials and developments of NLP in the seventh chapter. Moreover, we elaborate on principles for data governance in the context of NLP and social media text data.
Some Advice on Reading this Report
Certain terms are used extensively in this report.
A “token” is a sequence of characters that are grouped together as a semantic unit for processing. The sequence is bounded by either punctuation marks or white spaces. A token may be a word, a portion of a word called a subword, a numeric value, or a sequence symbol.
A “word” is a token that is a single unit of natural language that has meaning. “Word“ and “term” are interchangeably used in this report.
A “document“ is a sequence of tokens.
A “corpus” is a collection of documents. A “dataset” in natural language processing is interchangeable with “corpus”.
7Introduction
The second chapter of the report (on communication and language) is a stand- alone section providing a summary of notable studies that utilized natural language processing and new data sources to provide information for improved policymaking. The listed works are for illustrative purposes and are neither exhaustive nor comprehensive.
It is advisable to read the fourth (data preparation) and fifth (data representation) chapters, which introduce key concepts and define terms that are used repeatedly in the latter parts of this report, prior to reading the sixth (text analysis using natural language processing) and seventh (text classification) chapters.

8
Communication and Language
In this chapter, we introduce fundamental concepts of communication, including the theory of language as well as speech and text as a basis for understanding the methodological prerequisites for applying computational techniques to natural language data.
Communication
Society is built on communication—the process of sharing information, ideas, and attitudes by individuals (Paicu 2017). Moreover, communication plays an important role in policy formulation and implementation as it is part of gathering evidence, building awareness, and mobilizing support for policy (Haider et al 2011). Social media, blogs, online reviews, survey responses, and internal documents are means of communicating sentiments, signals, messages, judgments, and reactions.
Shannon and Weaver’s widely publicized model of communication outlines communication as the process of transmitting messages in a linear and process- centered manner (Shannon and Weaver 1949). Recognizing that feedback is an integral of the process, Melvin De Fleur’s mass communication model expanded the Shannon- Weaver model by adding that communication is circular (De Fleur and Larsen 1958). Figure 1 shows an illustration of De Fleur’s model of mass communication. It is through feedback that organizations can confirm whether their intended message has reached their target audience.
Figure 1: Illustration of De Fleur’s Model of Mass Communication
Mass mediumdevice
Channel Receiver DestinationSource Transmitter
Channel
Noise
Feedback device
Transmitter SourceDestination Receiver
Source: Communication Theory. De Fleur Model of Communication. https://www.communicationtheory.org/de-fleur-model-of-communication/.

9Communication and Language
To further understand communication through the De Fleur model, the following elements, derived from Paicu (2017), are fundamental:
Message. The message occurs whenever a source attempts to share information with another individual. The process starts with an idea from the source who encodes the message into symbols that are used to express that idea. The symbols are words or objects that a source uses in an attempt to describe an object or concept. The message goes through the channels where the symbols evoke meaning in the mind of a receiver who decodes the message.
Source. The source (sometimes called the sender, communicator, or encoder) is the individual who decides which information, ideas, or attitudes to share with another individual. In gathering evidence for policy formulation, monitoring, or evaluation, communities can serve as sources reporting on a particular situation or providing feedback on policies that affect them.
Channel. The channel is the method in which the message is sent. Books, newspapers, internal documents, social media, and movies are communication channels where messages must be moved over greater distances than they do via interpersonal communication.
Receiver. The receiver (sometimes called the destination, audience, or decoder) is the individual with whom the message is intended to be shared. To properly communicate, it is essential that the receiver is listening and understanding the message properly. In policy formulation, monitoring, and evaluation, the receiver can be the organization that gathers the messages, signals, or feedback of the audience. In policy implementation, the receivers can be the communities that will adopt a policy and among whom awareness needs to be built.
The De Fleur model also highlights the presence of “noise”, which can occur at any stage of the communication process. When a message passes along a channel, the message encounters noise or interference. Noise is anything that makes it difficult for a receiver to accurately interpret the message sent by the source (MacLennan 2007). Grammatical errors, for example, are sources of noise because they prevent the receiver from correctly understanding the intended meaning of the message. Jargon, mispronunciations, and slang can also constitute sources of noise. These noises are usually present in the vast volumes of communication data found online. Natural language processing (NLP) can not only assist in the development of evidence-based policies but can also help “clean” noise. First, NLP systems can consolidate and refine vast amounts of shared sentiments, messages, judgments, and feedback. Second, they can reduce data’s inherent noise. Thirdly, they can provide quantitative support for assumptions, hypotheses, and newly discovered insights.

10 Mapping the Public Voice for Development—Natural Language Processing of Social Media Text Data
Language
Nowak, Komarova, and Niyogi (2002) defined “language” as an instrument or tool of communication that is a vital part of human behavior, society, and identity. Language use and power reside in the ability of individuals to share ideas and knowledge on a large scale and with high efficiency (Andrews 2003). Additionally, Shaumyan (2006) explained language as a system of signs (or symbols) where the signs must be understood by all members of a group; otherwise, communication between the members of the group would be impossible. Shaumyan further notes that the meanings of these signs differ for every language community.
Language is dynamic. The meaning of signs can change over time as language is also shaped by its users. Every language can create new words to describe new situations, expressions, concepts, or objects, particularly in the area of technology: an example is the term “artificial intelligence”. Moreover, words may also be coined intentionally or borrowed from other languages: English is an example of a language that has borrowed extensively from other languages (MacLennan 2007). According to the Summer Institute of Linguistics, the hierarchy of languages includes phonetics, phonology, morphology, syntax, semantics, and pragmatics (SIL International). Phonetics is the study of sounds that are produced by the human vocal system. Phonology is the study of phonetics in the framework of specific languages (Beigi 2011). Morphology refers to the relationship between form and meaning in the way in which words are constructed (Brown 2006). Syntax studies the internal relationships among signs. Semantics is the relationship between signs and what they signify within the world. Finally, pragmatics studies the signs in relation to their users.
Additionally, Meyers (1986) mentions that grammar, ontology, use, form, meaning, and context are key concepts of this hierarchy, and that syntax, semantics, and pragmatics cannot be isolated. To demonstrate this point, consider the statement “The view of an elephant is amazing” (Galmiche 1975). It could mean “To see an elephant is amazing” or “Elephants have amazing eyesight.” This example shows how ambiguity in the syntax affects the characterization of the deeper structures of a sentence, which, in this example, is semantics.
Speech and Text
While “speech” is often interpreted as an act of vocal utterance or communication through the use of language (Jabbarifar 2014), speech is also a process of communication between the speaker and the listener where language as a system (not just a tool) can be directly observed (Shaumyan 2006). This is in line with the views of language philosopher John Langshaw Austin, who sees speech as a goal- oriented communication system that performs three possible actions called “speech acts” as defined by a language.
11Communication and Language
In his 1962 book, How to Do Things with Words, Austin defined “locutionary” acts as the action of uttering words to provide information, or the basic performance of speech. Austin further explains that an “illocutionary” act is the action of saying something with the intention of giving an opinion, asking a question, requesting, promising, commanding, warning, advising, or giving permission. “Perlocutionary” acts are defined as the results or consequences intended to be achieved by saying something (Austin 1962). For instance, when a person says, “There is a dog in my house,” the speaker not only informs the receiver about the presence of an animal in their home (locutionary act), but also warns them to never consider trespassing into their home (illocutionary act). The perlocutionary act may be to influence someone not to go to their home.
Another linguistics philosopher, John Searle, proposed that there are only two types of speech acts: “direct speech acts” and “indirect speech acts.” Searle believed that, when a speaker wishes a goal to be performed through the use of language, it would require a series of actions. When using direct speech acts, the speaker assumes that the hearer understands the message and that this understanding will prompt the hearer to perform the desired action. For example, when a speaker utters, “Please switch on the cooler,” the speaker assumes the request is clear and is urging the hearer to do the action (direct speech act). On the other hand, indirect speech acts are situations where an illocutionary act is performed indirectly by way of performing another action. As an example, when a speaker says, “This room is very hot, isn’t it?”, while it is not directly said, the speaker is encouraging the hearer to switch on the cooler, which is an indirect speech act (Jabbarifar 2014).
Text is the written form of a language. Text implies the use of a system of decoding sounds, symbols, or concepts and also depends on the components of language (syntax, semantics, morphology, etc.). Text is created by generating ideas on certain topics, which are transformed into language representations and translated into linguistic units (words, clauses, and paragraphs). In this process, writers are able to integrate personal decisions, such as word choice or spelling, into the body of genre- specific knowledge in the form of text. The creation of text is a long and complex process, with significant individual differences, and embodies the writer’s choice of style, content, and register (Stavans and Tolchinsky 2020).
Since the turn of the millennium, the digital revolution has created a plethora of new platforms for the creation of text. Moreover, analyses of this publicly available text have the potential to refine and redefine approaches to policymaking. One advantage of using social media text data in policy formation is to “enhance the quality of government” by improving civic engagement, citizens’ participation in government, and customer service (Wahyunengseh, Hastjarjo, and Suharto 2018). A literature review by Sobaci (2016) regarding the advantages and disadvantages of social media use
12 Mapping the Public Voice for Development—Natural Language Processing of Social Media Text Data
(Facebook and Twitter) by local governments found that using social media for communicating with people to influence policies can (i) improve efficiency and productivity, (ii) improve local public services, (iii) improve policymaking, (iv) provide stronger local democracy, and (v) lead to better collaboration and knowledge management.
Improved Efficiency and Productivity
Social media have numerous benefits for improving the efficiency and productivity of government institutions, especially when it comes to challenges in sourcing and allocating resources. Apart from social media being able to fulfill many functions with negligible costs, they are also tools that institutions can use to pinpoint and/or recruit resources that are out of their control. Governments can also use social media to mobilize their resources in the fulfillment of public service and in promoting tourism. Furthermore, the use of social media can complement traditional methods when it comes to the implementation of government activities and services (Sobaci 2016).
Improved Local Public Services
The lack of public participation in governmental decisions is an important concern for policymakers, particularly when formulating and evaluating policies. However, social media have provided local governments with several channels for citizens (including those who are usually unheard) to report problems and communicate their opinions, recommendations, and criticisms to local officials. Social media have also allowed local governments to use the feedback as input into improving public services. In this manner, social media have provided governments with the opportunity to coproduce public services and manage their constituents’ expectations when it comes to rendering public services (Sobaci 2016). For instance, a study by Dicks et al. (2021) made use of social media monitoring to understand public perceptions around policies on the bovine tuberculosis eradication strategy in England. The study’s goal was to identify misinformation that would have affected vaccine policy support. The researchers found that social media activities increased rapidly after each government announcement and, thus, provided insights about key influencers, public engagement, and trending communications on the primary public concerns about the strategy. The researchers also learned that public perception was primarily influenced by news websites, charities, governmental bodies, and medical professionals. It was also discovered that the greatest confusion about the strategy stemmed from farming communities, where most of the disparity arose from differences in opinions.
13Communication and Language
Improved Policymaking
Through social media, local governments have the opportunity to involve their citizens in decision-making, problem-solving, community engagement, crowdsourcing, consultation, and cooperation on processes. The use of social media for improved policymaking can therefore lead to more rational and evidence-based decisions built on local knowledge and community preferences (Sobaci 2016). An example of using social media for policy improvement is England’s “Help a London Park” project. The initiative was a competition that allowed citizens in London to vote for a park that would receive £400,000 for improvement. Citizens were engaged to set up and create YouTube videos, Flickr photo albums, and blog articles in support of a particular park. The consultation project garnered more than 110,000 votes, with one park alone receiving 6,677 votes. The initiative used the power of the community to help the local government determine priorities for their investments by consulting with residents on where they felt the resources were most needed (Gibson 2010).
Stronger Local Democracy
Decisions made by local governments have a direct impact on citizens’ lives. Since the offices and operations of local governments are closer to citizens, it is more convenient and easier for citizens to inspect and hold local governments to account. By providing their constituents with updates and information about decisions and services, local governments can enhance transparency and accountability. The involvement of citizens and stakeholders in local decision-making processes also gives governments the opportunity to increase trust amongst their citizens (Sobaci 2016). For instance, the use of social media gave the Derbyshire County and Newcastle City councils in England an opportunity to engage citizens for their local elections. The two governments made use of Twitter and Facebook to disseminate information about the elections and announced the results on those platforms (Gibson 2010). Another example is from a study by Park et al. (2015), which conducted structured equation analysis on 398 questionnaire samples from citizens of the Republic of Korea who communicate with a central government department via Twitter. The analysis discovered that tweets from a high-level government official played a role in enhancing citizens’ perceptions of government credibility. Moreover, citizens’ trust in the government’s social media activity contributed to expanding citizen trust of the government, from the agency level to the national level.
Better Collaboration and Knowledge Management
Fragmentation of government functions and “silo” effects between departments are further concerns for local governments. The removal and mitigation of these issues can strengthen cross-agency cooperation and improve efficiency and productivity between agencies. By utilizing social media, especially in cases of emergencies and disasters, all levels of a government can be involved in broad collaboration of information-sharing

14 Mapping the Public Voice for Development—Natural Language Processing of Social Media Text Data
and the creation of collective intelligence. Rodríguez Bolívar (2015) conducted a study on the implementation of Web 2.0 technologies (such as social networking websites) for citizen participation and knowledge-sharing in the public sector. The researchers discovered that some policymakers saw the use of these technologies as tools that can help with sharing knowledge and best practices and improving interoperability among public administrations.
User-Generated Content
Lukyanenko, Parsons, and Wiersma (2014) defined user-generated content (UGC) as “various forms of digital information (e.g., comments, forum posts, tags, product reviews, videos, maps) produced by members of the general public.” In this way, everyday people act as casual content contributors. Many types of UGC channels such as blogs, online communities, and social networks have democratized the way online users participate and communicate (Brandtzaeg and Heim 2011). These platforms have become popular choices for people to post and share their comments, views, and personal experiences (Sultan et al. 2021). Thus, UGC is a valuable resource for policymaking and analysis (Haider et al. 2011). It can be mined to generate rich insights into how people are feeling with regards to important topical issues.
Social Networks and Online Communities
The terms “social network” and “online community” are often used synonymously. However, the main difference between the two lies in the relationships between users. Boyd and Ellison (2007) defined social networks as websites that allow individuals to (i) create a public or semipublic profile within the system, (ii) list users with whom the individuals share a connection, and (iii) view and explore their list of connections and other individuals in the system. Boyd and Ellison further contend that the nature of connections in these networks varies from site to site. In this regard, social networks such as Facebook, LinkedIn, LiveJournal, or Twitter put the individual in the center of the network. This forms relationships that are direct, one-to-one, and bilateral. Thus, the connections that exist in social networks are considered weak compared to online communities. While an individual may have a direct connection to another individual in a social network, it does not follow that the first individual would know the other people in the second individual’s network. Thus, indirect connections in social networks make it difficult to assume and predict the interests of people, including what they may find valuable or how they are educated (Howard 2010).
On the other hand, in online communities, the individual is not the center of the relationships and the relationship of an individual to others is considered only secondary. By definition, online communities have the following components according to Preece (2000):
15Communication and Language
(i) people who interact socially and may perform special roles such as leading or moderating;
(ii) a shared purpose, interest, need, information exchange, or service that is in line with the community’s reason for being;
(iii) policies in the form of tacit assumptions, rituals, protocols, rules, and laws that guide people’s interactions; and
(iv) computer systems that support and mediate the social interactions.
Preece’s definition, whereby computer systems are just one of the components of an online community, suggests that online groups are not automatically communities. A website may use a “forum” or “bulletin board”—as is the case with Google groups, Ning, Xing, and Yahoo groups—as one of its communication channels, but the presence of these systems is not sufficient for the website to be defined as a community (Howard 2010).
Shirky (2008) further supports Preece’s definition by emphasizing that communities are a collection of members who “have made a commitment to achieve the shared passions and goals of the group.” In communities, members agree to cooperate with one another through a shared set of means towards achieving a goal. Users who enter a community commit to a core set of values, interests, and communication practices. This gives communities more organizational structure, rules, and rituals compared to social networks. In this regard, while the individual commits to the group as a whole, the relationship structure paradoxically enriches the connections that the individual has with the community’s other individual members—making the connections more complex, predictable, and stronger. This allows communities to engage in more intricate and collaborative tasks and activities compared to social networks. With this in mind, social networks and online communities generate different types of social media data. In online community websites, the following data typically reflect the most valuable sources of information;
Author. The user who wrote the post and published it. Post date and time. The instance when the post was published. Post content. The actual content or message contained in a post. Post title. The subject or topic of a post.
With regards to the type of users from whom social media data are harvested, Brandtzaeg and Heim (2011) suggested that most of the discussions and contributions on social media came from 1% of users who were very active and generated the majority of content and system activity. This would have implications for the interpretation of the results of social media analyses.

16
In this chapter, we review research on natural language processing (NLP) of social media text data in the context of the Sustainable Development Goals (SDGs) to showcase available resources and applications as well as insights on development unearthed by previous research. The chapter focuses on SDG 1 (no poverty), SDG 5 (gender equality), SDG 10 (reduced inequalities), SDG 11 (sustainable cities), and SDG 13 (climate action) as these areas have attracted the most active NLP research to date.
SDG 1: No Poverty
Accurately measuring poverty is essential in the creation of policies to alleviate it. While previous measurements of poverty focused on monetary scenarios, it is now understood that poverty extends beyond such measurements and includes the lived reality of people’s experiences and the multiple deprivations they face. Thus, the Multidimensional Poverty Index has been used since 2010 to examine deprivations across 10 indicators in three equally weighted dimensions: health, education, and standard of living (UNDP and OPHDI 2020).
To enrich insights derived from surveys, help governments source new information regarding a population’s concerns, and determine socioeconomic variables that contribute to a group’s worries, a study by Rohrer et al. (2017) used at least 35,000 textual answers from completed questionnaires by participants of the German Socio-Economic Panel Study and determined keywords and topics to link a group’s life satisfaction and worries (Table 1).
Table 1: Natural Language Processing Techniques and Data Used to Gain Deeper Insights for Poverty Reduction Strategies
Study Desired Outcome NLP Techniques Used Data Used
J.M. Rohrer, M. Brümmer, S.C. Schmukle, J. Goebel, and G.G. Wagner. 2017. What Else Are You Worried About? Integrating Textual Responses into Quantitative Social Science Research.
Linking life satisfaction and worries of a group
Text classification
Topic modeling
More than 35,000 textual answers from completed questionnaires
NLP = natural language processing.Source: Compiled by the study team for the special supplement to Key Indicators for Asia and the Pacific 2022.
Addressing the Sustainable Development Goals through Natural Language Processing
17Addressing the Sustainable Development Goals through Natural Language Processing
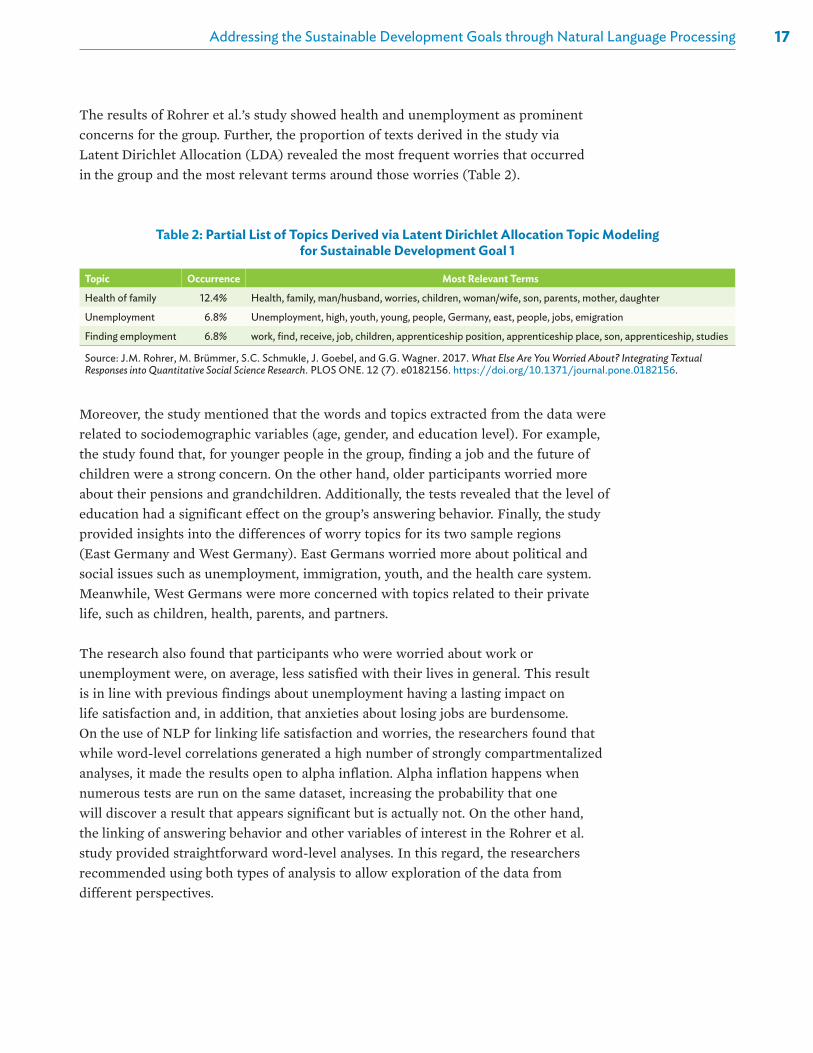
The results of Rohrer et al.’s study showed health and unemployment as prominent concerns for the group. Further, the proportion of texts derived in the study via Latent Dirichlet Allocation (LDA) revealed the most frequent worries that occurred in the group and the most relevant terms around those worries (Table 2).
Moreover, the study mentioned that the words and topics extracted from the data were related to sociodemographic variables (age, gender, and education level). For example, the study found that, for younger people in the group, finding a job and the future of children were a strong concern. On the other hand, older participants worried more about their pensions and grandchildren. Additionally, the tests revealed that the level of education had a significant effect on the group’s answering behavior. Finally, the study provided insights into the differences of worry topics for its two sample regions (East Germany and West Germany). East Germans worried more about political and social issues such as unemployment, immigration, youth, and the health care system. Meanwhile, West Germans were more concerned with topics related to their private life, such as children, health, parents, and partners.
The research also found that participants who were worried about work or unemployment were, on average, less satisfied with their lives in general. This result is in line with previous findings about unemployment having a lasting impact on life satisfaction and, in addition, that anxieties about losing jobs are burdensome. On the use of NLP for linking life satisfaction and worries, the researchers found that while word-level correlations generated a high number of strongly compartmentalized analyses, it made the results open to alpha inflation. Alpha inflation happens when numerous tests are run on the same dataset, increasing the probability that one will discover a result that appears significant but is actually not. On the other hand, the linking of answering behavior and other variables of interest in the Rohrer et al. study provided straightforward word-level analyses. In this regard, the researchers recommended using both types of analysis to allow exploration of the data from different perspectives.
Table 2: Partial List of Topics Derived via Latent Dirichlet Allocation Topic Modeling for Sustainable Development Goal 1
Topic Occurrence Most Relevant Terms
Health of family 12.4% Health, family, man/husband, worries, children, woman/wife, son, parents, mother, daughter
Unemployment 6.8% Unemployment, high, youth, young, people, Germany, east, people, jobs, emigration
Finding employment 6.8% work, find, receive, job, children, apprenticeship position, apprenticeship place, son, apprenticeship, studies
Source: J.M. Rohrer, M. Brümmer, S.C. Schmukle, J. Goebel, and G.G. Wagner. 2017. What Else Are You Worried About? Integrating Textual Responses into Quantitative Social Science Research. PLOS ONE. 12 (7). e0182156. https://doi.org/10.1371/journal.pone.0182156.
18 Mapping the Public Voice for Development—Natural Language Processing of Social Media Text Data
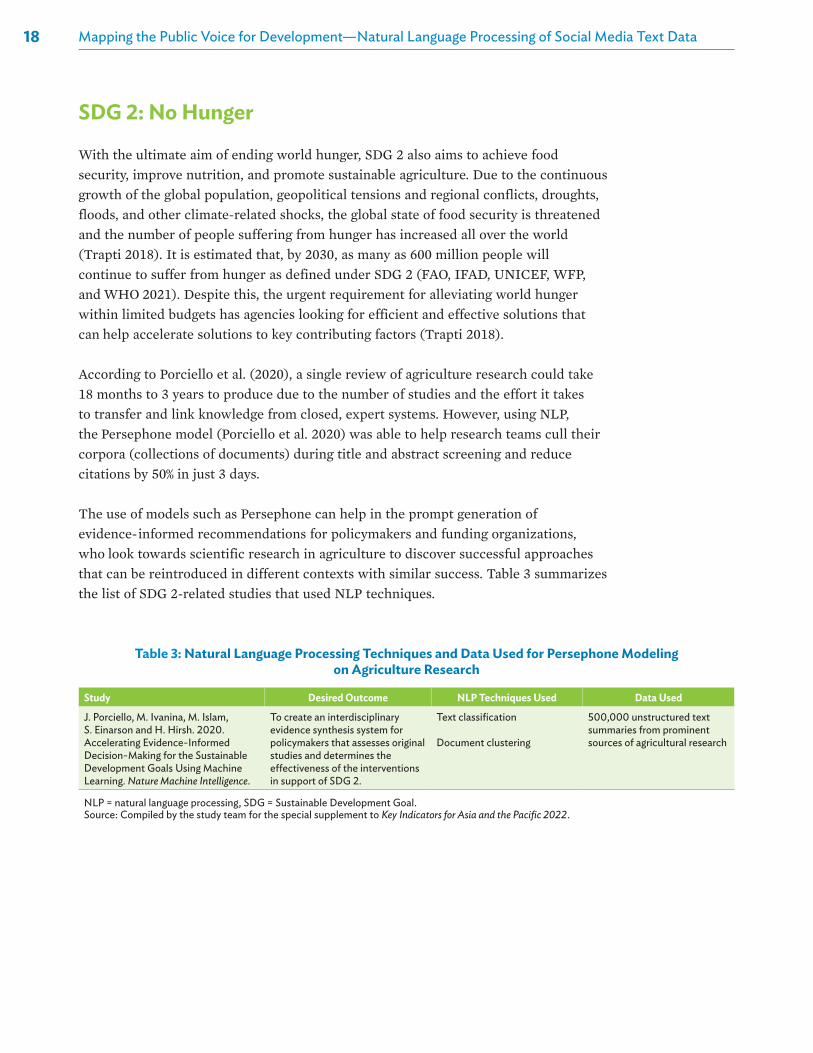
SDG 2: No Hunger
With the ultimate aim of ending world hunger, SDG 2 also aims to achieve food security, improve nutrition, and promote sustainable agriculture. Due to the continuous growth of the global population, geopolitical tensions and regional conflicts, droughts, floods, and other climate-related shocks, the global state of food security is threatened and the number of people suffering from hunger has increased all over the world (Trapti 2018). It is estimated that, by 2030, as many as 600 million people will continue to suffer from hunger as defined under SDG 2 (FAO, IFAD, UNICEF, WFP, and WHO 2021). Despite this, the urgent requirement for alleviating world hunger within limited budgets has agencies looking for efficient and effective solutions that can help accelerate solutions to key contributing factors (Trapti 2018).
According to Porciello et al. (2020), a single review of agriculture research could take 18 months to 3 years to produce due to the number of studies and the effort it takes to transfer and link knowledge from closed, expert systems. However, using NLP, the Persephone model (Porciello et al. 2020) was able to help research teams cull their corpora (collections of documents) during title and abstract screening and reduce citations by 50% in just 3 days.
The use of models such as Persephone can help in the prompt generation of evidence- informed recommendations for policymakers and funding organizations, who look towards scientific research in agriculture to discover successful approaches that can be reintroduced in different contexts with similar success. Table 3 summarizes the list of SDG 2-related studies that used NLP techniques.
Table 3: Natural Language Processing Techniques and Data Used for Persephone Modeling on Agriculture Research
Study Desired Outcome NLP Techniques Used Data Used
J. Porciello, M. Ivanina, M. Islam, S. Einarson and H. Hirsh. 2020. Accelerating Evidence-Informed Decision-Making for the Sustainable Development Goals Using Machine Learning. Nature Machine Intelligence.
To create an interdisciplinary evidence synthesis system for policymakers that assesses original studies and determines the effectiveness of the interventions in support of SDG 2.
Text classification
Document clustering
500,000 unstructured text summaries from prominent sources of agricultural research
NLP = natural language processing, SDG = Sustainable Development Goal.Source: Compiled by the study team for the special supplement to Key Indicators for Asia and the Pacific 2022.

19Addressing the Sustainable Development Goals through Natural Language Processing
SDG 3: Good Health and Well-Being
The coronavirus disease (COVID-19) pandemic has caused widespread suffering, destabilized the global economy, and upended the lives of billions of people (UN 2020a). Following this health crisis, the value of SDG 3 in reducing mortality rates and fighting diseases has been highlighted.
Universal health care coverage and increased access to quality essential care are vital goals for the success of SDG 3. In addition, SDG 3 aims to reduce illnesses brought about by hazardous chemicals, end epidemics (such as AIDS, tuberculosis, malaria, and tropical diseases), prevent substance abuse, train health workforces, and support research and development into vaccines and medicines (UNSD 2019). While it sometimes takes time to solve health issues, the creation of policies that strengthen identification, early warning, risk reduction, and management of risks (including health risks) both at the national and global level are necessary. Table 4 lists the studies in which NLP techniques have been applied in this context. For example, Weibel et al.’s (2017) study can help policymakers by generating information that can be used to identify vulnerable areas across numerous SDGs.
Table 4: Natural Language Processing Techniques and Data Used to Gain Deeper Insights for Health Policies
Study Desired Outcome NLP Techniques Used Data Used
N. Weibel, P. Desai, L. Saul, A. Gupta, and S.J. Little. 2017. HIV Risk on Twitter: The Ethical Dimension of Social Media Evidence- based Prevention for Vulnerable Populations. Proceedings of the 50th Hawaii International Conference on System Sciences.
Identify at-risk social structures for HIV contamination to prevent outbreaks and support countermeasures
Text classification
Keyword extraction
Geotagged tweets from a certain location
Tweets that indicate HIV transmission “risk words”
J. Xie, Z. Zhang, X. Liu, and D. Zeng. 2021. Unveiling the Hidden Truth of Drug Addiction: A Social Media Approach Using Similarity Network-Based Deep Learning. Journal of Management Information Systems.
To discover Opioid Use Disorder treatment barriers from patient narratives and address the challenge of morphs
Keyword extraction
Topic modeling
Text classification
Social media data
Reviews in online patient communities
D. Schillinger, R. Balyan, S.A. Crossley, D.S. McNamara, J.Y. Liu, and A.J. Karter. 2020. Employing Computational Linguistics Techniques to Identify Limited Patient Health Literacy: Findings from the ECLIPPSE Study. Health Services Research.
To develop novel, scalable, and valid literacy profiles for identifying limited health literacy patients
Term frequency
Grammar analysis
Lexical/Vocabulary analysis
283,216 secure messages sent by 6,941 diabetes patients to physicians within an integrated system’s electronic portal
Sociodemographic, clinical, and utilization data were obtained via questionnaire and electronic health records
NLP = natural language processing.Source: Compiled by the study team for the special supplement to Key Indicators for Asia and the Pacific 2022.

20 Mapping the Public Voice for Development—Natural Language Processing of Social Media Text Data
Weibel et al. (2017) made use of geotagged Twitter posts from a certain location to identify societies at risk for disease contamination and outbreaks. The study identified keywords correlated with HIV risk behavior in a local community (San Diego, California). The researchers found indicators of real-world contact between the Twitter users, which posed potential health dangers to the community. These indicators enabled the researchers to identify risk networks more reliably. In particular, the study made use of the follower-followees subnetwork within the HIV risk network to understand real-world user connections and prevention opportunities. Additionally, since user mentions are indicators of alternative communication between users, they could be used as an indicator of real-world connections between users. While the method qualifies opportunities for early intervention of HIV-vulnerable populations in other locations, and the possible use of the approach for other transmissible diseases, the researchers also noted that the study gave rise to ethical issues around the collection of the data and the insights that arose from the analysis.
NLP can also help with SDG 3’s “Prevention and Treatment of Substance Abuse” target by processing patients’ self-reports on social media to uncover their experiences and behavior. Xie et al. (2021) used NLP to identify treatment barriers mentioned in surveys conducted with samples ranging from 20 to over 4,000 patients. The results indicated three categories of barriers: (i) factors related to health care systems and regulations; (ii) factors related to health providers, such as lack of a Drug Enforcement Administration waiver, lack of institutional support, and lack of resources; and (iii) patient-specific factors, such as the fear of pain and lack of information on treatments. This approach can be used by clinical practitioners, policymakers, and researchers to better understand health disorders and treatment barriers when creating sound, evidence-informed policies for successful treatment, and to evaluate the effectiveness of implemented policies.
NLP can also be used to help build awareness and encourage adoption of implemented health policies. In a study by Schillinger et al. (2020), NLP was used to identify a population or an individual patient’s health literacy, or their capacity to obtain, process, and understand basic health information to make appropriate health decisions. Their results showed that poor cardiometabolic medication adherence, severe hypoglycemia, and greater comorbidity were associated with literacy factors, such as the readability and concreteness of words, and the age of exposure when a word was first introduced in a child’s vocabulary. Additionally, the results suggested that sociodemographic factors play an important role. The use of NLP in the Schillinger et al. study not only allows health care service providers to identify patients who are at risk for miscommunication, but it also helps policymakers identify areas of opportunity in delivering tailored health messages and self-management support initiatives.

21Addressing the Sustainable Development Goals through Natural Language Processing
SDG 5: Gender Equality
While the most prominent consequence of gender discrimination is the inability of some households to invest sufficiently in children’s education, the impact of gender inequality reaches far beyond negative educational impacts for children and lower birth levels for certain communities (Khurshid, Fiaz, and Khurshid 2020). In fact, studies show that gender inequalities have both direct and indirect impacts on broader economic growth. In systems that favor one gender for education, this lopsided investment is viewed as a misallocation of resources because highly competent but unfavored individuals are left underdeveloped. Such misallocation would reduce the quality of human capital, thereby potentially retarding economic growth (Khurshid et al. 2020).
One issue that acts as a strong indicator of gender equality is child marriage, which is a practice regarded by many to be long outdated. Despite these views, premature marriage is still widely (and legally) practiced throughout the world, even in developed economies. Using sentiment analysis and semantic analysis, Syahirah et al.’s (2018) study used social media data to explore the trends and sentiments surrounding the practice of child marriage all over the world. This study found that 95% of sentiment rejected the practice, while the 5% of positive sentiment stemmed from a vague understanding of tradition and religion. The results also revealed that traditional and religious beliefs and lack of legal protections are the main contributors of child marriage practices. Thus, Syahirah et al. (2018) called on governments to introduce and/or amend laws related to banning the practice and to create policies that adhere to the Convention of Elimination of Discrimination against Women and the Convention on the Rights of the Child.
One of the key challenges in achieving the SDG 5 targets is institutional bias. As the world pushes for gender equality, some may still view the increasing number of women in professional environments as degrading the prestige and/or quality of a profession. Such attitudes and perceptions can hinder progress towards gender equality. Hence, in the formulation, implementation, and monitoring of policies that support SDG 5, it is important to understand and consider gender attitudes that may contribute to a climate that discourages women from entering and staying in any professional field, which leads to the ongoing underrepresentation of women in management and executive roles (Wu 2020).
NLP can be utilized in analyzing text corpora that embody people’s cognitions, feelings, and actions on gender issues across time and geography. These digitized texts can include data about the condition of marginalized groups, people’s opinions, news articles, political speeches, legislative addresses, parliamentary debates, and even court cases. Analysis of this large volume of data through NLP can reveal unconscious bias and help measure gender bias in a society by providing insights about attitudes and perceptions towards gender equality in various intellectual and academic disciplines (Orgeira-Crespo et al. 2021).

22 Mapping the Public Voice for Development—Natural Language Processing of Social Media Text Data
With the aim of creating an algorithm that detects gender-noninclusive language in digitized text, a study by Orgeira-Crespo et al. (2021) analyzed a set of doctoral theses and determined the fields of knowledge that were the most biased. The study’s findings supported the assumption that such bias mainly stems from unconscious issues and that the authors of the analyzed academic texts continued to make evaluations based on stereotypes entrenched by traditions, life experiences, norms, and/or culture. While the study mentioned the possibility of these biases as involuntary and automatic, the researchers also suggested that the judgements may already have been present at the initiation of the theses: from setting the objectives, to the development of the arguments, to the final expression used in the documents. The study also discovered that factors other than academic field, namely age and gender, contributed to bias. For example, the study found a slight rise in the use of gender-noninclusive language as the ages of the authors increased.
In line with using NLP to analyze digitized texts for biases, DeFranza, Mishra, and Mishra’s (2020) study analyzed gender prejudice in online text corpora. Their study used “word embeddings,” which is a way to represent words in the form of real-valued vectors to encode meaning. Using word embeddings to study semantic associations in data sourced from Wikipedia and the Common Crawl project, the researchers found that, in certain languages and cultures, gender prejudice is rooted in positive words being more often associated with men than with women, resulting in men being evaluated more favorably. The researchers also noted that these gender prejudices existed cross-culturally.
In a similar vein, Xu et al. (2019) utilized NLP to analyze cultural products in the form of movies and books. Their objective was to reveal stereotypical gender roles that perpetuate gender inequality and are woven into morality tales that shape culture. While Orgeira-Crespo et al. and DeFranza, Mishra, and Mishra focused on the use of biased language, Xu et al. investigated the narrative structure—such as the constructed emotional dependency of female characters on male characters—present in the content.
Using word-embedding techniques, Xu et al. found that, from the thousands of books, movie synopses, and scripts analyzed, females were generally portrayed as happy. However, the study also highlighted that female were portrayed as being happier when they encountered males. This pattern was found to be strong across different genres and time periods in the datasets. When woven into stories, these types of structures can perpetuate the assumption that women depend on men in the pursuit of a happy and fulfilling life. Furthermore, the study revealed that male characters were portrayed to have adventurous lives, whereas females were portrayed to be more oriented to romantic relationships.
Despite some of the algorithms in these studies being used on academic texts, books, or movie scripts, the researchers believe that, with proper training of the models on different contexts and documents, the same techniques can be applied to analyze

23Addressing the Sustainable Development Goals through Natural Language Processing
digitized text in different environments. In the context of this report, these NLP techniques could be used to detect bias in documents, proposals, reports (especially on policy monitoring and evaluation), legislation, or even communication modalities such as speeches or social media text data (Table 5).
Table 5: Natural Language Processing Techniques and Data Used to Gain Deeper Insights on Gender Inequality
Study Desired Outcome NLP Techniques Used Data Used
S.S.S. Syahirah, F.B. Hamzah, M.B. Hashim, and Z. Samsudin. 2018. Child Marriage in the 21st Century: Sentiment and Semantic Analysis Via Social Media Intelligence. Proceedings of the 7th International Conference on Kansei Engineering and Emotion Research 2018.
To explore the practice of child marriage through social media intelligence method to measure its trend in this era
Keyword extraction
Sentiment analysis
Semantic analysis
More than 355 social media posts related to the discussion of child marriage from January 2017 until August 2017 on platforms such as Digg, Facebook, FriendFeed, Google, Twitter, YouTube, and many more.
P. Orgeira-Crespo, C. Míguez-Álvarez, M. Cuevas-Alonso, and E. Rivo-López. 2021. An Analysis of Unconscious Gender Bias in Academic Texts by Means of a Decision Algorithm.
To detect second-generation/unconscious gender bias
Text classification
Document clustering
More than 100,000 doctoral theses written in Spanish universities
H. Xu, Z. Zhang, L. Wu, C.J. Wang. 2019. The Cinderella Complex: Word Embeddings Reveal Gender Stereotypes in Movies and Books.
To explore, identify, and quantify stereotypical narrative structures in literature by connecting the frame of stories with their social acceptance
Keyword extraction
Text classification
7,226 books (Gutenberg Project)6,087 movie synopses (IMDb)1,109 movie scripts (IMSDb)
D. DeFranza, H. Mishra, and A. Mishra. 2020. How Language Shapes Prejudice Against Women: An Examination Across 45 World Languages. Journal of Personality and Social Psychology.
To test for gender prejudice in gendered and genderless languages
Text classification
Topic modeling and/ or Latent Dirichlet Allocation
Text data from Wikipedia and the Common Crawl project (which contains text from billions of publicly facing websites) across 45 languages
NLP = natural language processing, IMDb = Internet Movie Database, IMSDb = Internet Movie Script Database.Source: Compiled by the study team for the special supplement to Key Indicators for Asia and the Pacific 2022.
SDG 10: Reduced Inequalities
Validating public policies often requires institutions to provide quantified measurements of societal status. Hence, having socioeconomic data that will guide the formulation of public policies is crucial. However, gathering evidence for the design of these policies often requires costly efforts related to large-scale national surveys, which can be a challenge, especially for governments and institutions in developing economies.
In the case of SDG 10, the measurement of socioeconomic inequality is key to reducing its prevalence within communities and among both developed and developing economies. A possible new source of insights and method of measuring inequality is by using social media data to estimate the distribution of income and wealth across communities. The results may be used by policymakers to gather evidence in curbing social problems such as income inequality, segregation, and poverty.

24 Mapping the Public Voice for Development—Natural Language Processing of Social Media Text Data
Using publicly accessible social media data, it is possible to infer an individual’s income levels through the direct observation of economic activities that shape social behaviors. Studies have shown that income determines an individual’s frequently visited places, the people they interact with, and the topics of conversation they engage in. Based on this, Abitbol and Morales (2021) used mobility patterns, language usage, and social interactions found in Twitter activity data to expose behavioral patterns that characterize different socioeconomic groups and infer income predictors (Table 6).
Table 6: Natural Language Processing Techniques and Data Used to Gain Deeper Insights for Policies to Reduce Socioeconomic Inequalities
Study Desired Outcome NLP Techniques Used Data Used
J.L. Abitbol and A.J. Morales. 2021. Socioeconomic Patterns of Twitter User Activity. Entropy.
To examine how behavioral patterns in different socioeconomic groups can be used to infer an individual’s income
Text classification
Topic modeling
Topic analysis
Topic clustering
Twitter data: mobility patterns (geographic location), language usage via hashtag adoption, and social interactions via mentions
NLP = natural language processing.Source: Compiled by the study team for the special supplement to Key Indicators for Asia and the Pacific 2022.
Figure 2 shows the income distributions based on the topics identified through Abitbol and Morales’ topic model.
Figure 2: Topic Model Analysis of Tweets, by Income of Individual
€ = Euro.Note: The panel shows the income distributions of those who talk about the topics identified.Source: J.L. Abitbol and A.J. Morales. 2021. Socioeconomic Patterns of Twitter User Activity. Entropy. 23 (6). p. 780. https://doi.org/10.3390/e23060780.
38.020€38.944€
37.732€40.732€
37.680€36.364€
37.372€38.956€
38.976€37.762€
40.124€37.884€
41.020€37.154€
10.000 30.000 50.000Annual Income (€)
Urban interjection
Unmentioned Mentioned
Insults
Slang
Travel
Literature
Technology
Politics
70.000

25Addressing the Sustainable Development Goals through Natural Language Processing
SDG 11: Sustainable Cities and Communities
Participation by citizens is intrinsic in achieving the SDGs for smart cities. This is especially true in creating policies that ensure better lives for populations living in urban areas.
As a determinant of success for SDG 11, reducing the negative effects of disasters on cities is crucial. These effects include mortality rates, number of missing persons, and number of individuals affected by disasters in each urban population. Governments can use NLP to understand how the population is perceiving disaster risks, which may then be used to determine if stronger alert systems are necessary in vulnerable areas where people have lower risk perceptions.
The increased reliance on social media channels for information when natural hazards are occurring provides an opportunity for NLP to provide practical insights about people’s perception of a disaster event’s severity. This can be useful in building strategies that foster resilient communities and smart cities (Table 7).
Table 7: Natural Language Processing Techniques and Data Used to Gain Deeper Insights for Policies on Sustainable Cities
Study Desired Outcome NLP Techniques Used Data Used
M. Karimiziarani, K. Jafarzadegan, P. Abbaszadeh, W. Shao, and H. Moradkhani. 2022. Hazard Risk Awareness and Disaster Management: Extracting the Information Content of Twitter Data. Sustainable Cities and Society.
To develop a hazard risk awareness index that considers open-source hazard data and Twitter data to map the spatiotemporal distribution of hazard risk awareness over the areas affected by a disaster
Textual content analysis
Topic modeling
Text classification
18,331,877 tweets related to Hurricane Harvey
Demographic data from the United States Census Bureau data profile for Texas, which included county-scale population and percentage of households with internet access in 2017
North American Land Data Assimilation System (NLDAS-2) hourly precipitation and wind data for each county across the region during the study period (21 August 2017 to 2 September 2017)
P. Lee, G. Kleinman, and C.H. Kuei. 2020. Using Text Analytics to Apprehend Urban Sustainability Development. SSRN Electronic Journal.
To specify critical urban sustainability issues and identify underlying topical issues exhibited by text corpora
Topic modeling
Text classification
C40 city corpora of the Carbon Disclosure Project
M. Alonso-Parra, C. Puente, A. Laguna, and R. Palacios. 2021. Analysis of Harassment Complaints to Detect Witness Intervention by Machine Learning and Soft Computing Techniques. Applied Sciences.
To analyze textual descriptions of harassment situations collected anonymously by the Hollaback! Project for the automatic detection of a witness intervention inferred from the victim’s own report
Latent semantic analysis
Text classification
Corpus of victim’s free-text descriptions with economies and locations
NLP = natural language processing.Source: Compiled by the study team for the special supplement to Key Indicators for Asia and the Pacific 2022.

26 Mapping the Public Voice for Development—Natural Language Processing of Social Media Text Data
Analyzing data from a Harvard University tweet corpus provided for Hurricane Harvey, Karimiziarani et al. (2022) were able to understand how risk perceptions were formed. These perceptions could, in turn, be used to enhance adaptation strategies for urban design and planning. The researchers also analyzed the content of the tweets to determine main topics and worries during the disaster period. The results demonstrated the variations of concerns from day to day and by location.
Furthermore, since a considerable number of the tweets contained information about damages, injuries, requests for help, and situational updates, it is evident that such data could be used to provide additional information about damages, updates, and assistance required after a disaster has struck.
Another study that made use of NLP in assisting evidence-based policy formulation for the pursuit of SDG 11 came from Lee, Kleinman, and Kuei (2020). Using topic modeling, the researchers were able to determine economic opportunities, climate risks, incentives to reduce greenhouse gas emissions, and emissions reduction activities, derived from the C40 city datasets of the Carbon Disclosure Project. For example, the study found that Washington, DC residents appear to be particularly sensitive to threats to the sustainability of the city’s natural environment.
The information extracted from social media data through NLP can be used in providing directions for national, state or county, and local governments in moving towards sustainable city models and to help source evidence for urban development policy options that promote long-term sustainability.
In line with providing communities with access to safe and inclusive public spaces, initiatives such as the Hollaback! Project can help provide safety indicators for a city. The project aims to collect stories of harassment online and through a free app to elevate victims’ individual voices and find societal solutions. Another objective is to collect text data that can be used in gathering evidence about geographic locations where harassment occurs frequently. Because the data from the project contain crucial information about incidents of harassment—such as time of occurrence, language of reporting, or type of harassment—analysis of the data can generate insights to guide the development of policies that can best address the issues within certain communities (Alonso-Parra et al. 2021).
SDG 13: Climate Action
The adverse effects of climate change affect not only economies worldwide but also individual lives, especially the lives of those in poor communities and other vulnerable groups. Hence, measures to alleviate the adverse impacts of climate change also have the potential to help achieve other SDGs.
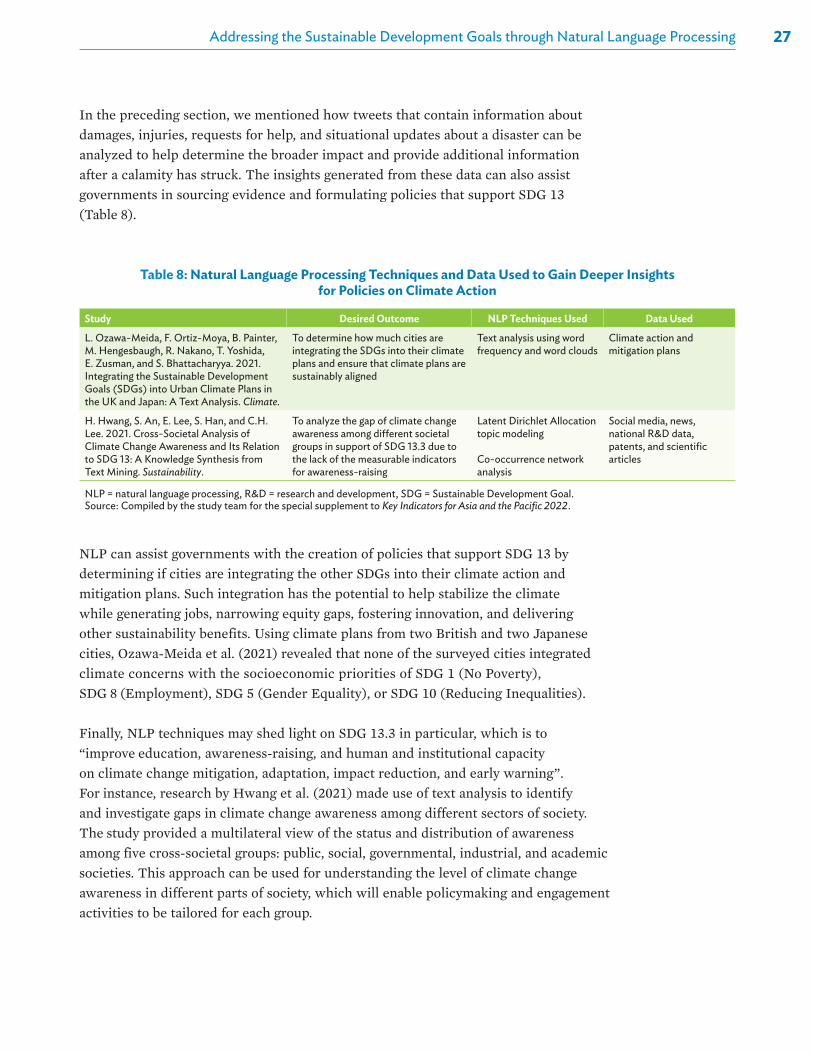
27Addressing the Sustainable Development Goals through Natural Language Processing
In the preceding section, we mentioned how tweets that contain information about damages, injuries, requests for help, and situational updates about a disaster can be analyzed to help determine the broader impact and provide additional information after a calamity has struck. The insights generated from these data can also assist governments in sourcing evidence and formulating policies that support SDG 13 (Table 8).
NLP can assist governments with the creation of policies that support SDG 13 by determining if cities are integrating the other SDGs into their climate action and mitigation plans. Such integration has the potential to help stabilize the climate while generating jobs, narrowing equity gaps, fostering innovation, and delivering other sustainability benefits. Using climate plans from two British and two Japanese cities, Ozawa-Meida et al. (2021) revealed that none of the surveyed cities integrated climate concerns with the socioeconomic priorities of SDG 1 (No Poverty), SDG 8 (Employment), SDG 5 (Gender Equality), or SDG 10 (Reducing Inequalities).
Finally, NLP techniques may shed light on SDG 13.3 in particular, which is to “improve education, awareness-raising, and human and institutional capacity on climate change mitigation, adaptation, impact reduction, and early warning”. For instance, research by Hwang et al. (2021) made use of text analysis to identify and investigate gaps in climate change awareness among different sectors of society. The study provided a multilateral view of the status and distribution of awareness among five cross-societal groups: public, social, governmental, industrial, and academic societies. This approach can be used for understanding the level of climate change awareness in different parts of society, which will enable policymaking and engagement activities to be tailored for each group.
Table 8: Natural Language Processing Techniques and Data Used to Gain Deeper Insights for Policies on Climate Action
Study Desired Outcome NLP Techniques Used Data Used
L. Ozawa-Meida, F. Ortiz-Moya, B. Painter, M. Hengesbaugh, R. Nakano, T. Yoshida, E. Zusman, and S. Bhattacharyya. 2021. Integrating the Sustainable Development Goals (SDGs) into Urban Climate Plans in the UK and Japan: A Text Analysis. Climate.
To determine how much cities are integrating the SDGs into their climate plans and ensure that climate plans are sustainably aligned
Text analysis using word frequency and word clouds
Climate action and mitigation plans
H. Hwang, S. An, E. Lee, S. Han, and C.H. Lee. 2021. Cross-Societal Analysis of Climate Change Awareness and Its Relation to SDG 13: A Knowledge Synthesis from Text Mining. Sustainability.
To analyze the gap of climate change awareness among different societal groups in support of SDG 13.3 due to the lack of the measurable indicators for awareness-raising
Latent Dirichlet Allocation topic modeling
Co-occurrence network analysis
Social media, news, national R&D data, patents, and scientific articles
NLP = natural language processing, R&D = research and development, SDG = Sustainable Development Goal.Source: Compiled by the study team for the special supplement to Key Indicators for Asia and the Pacific 2022.
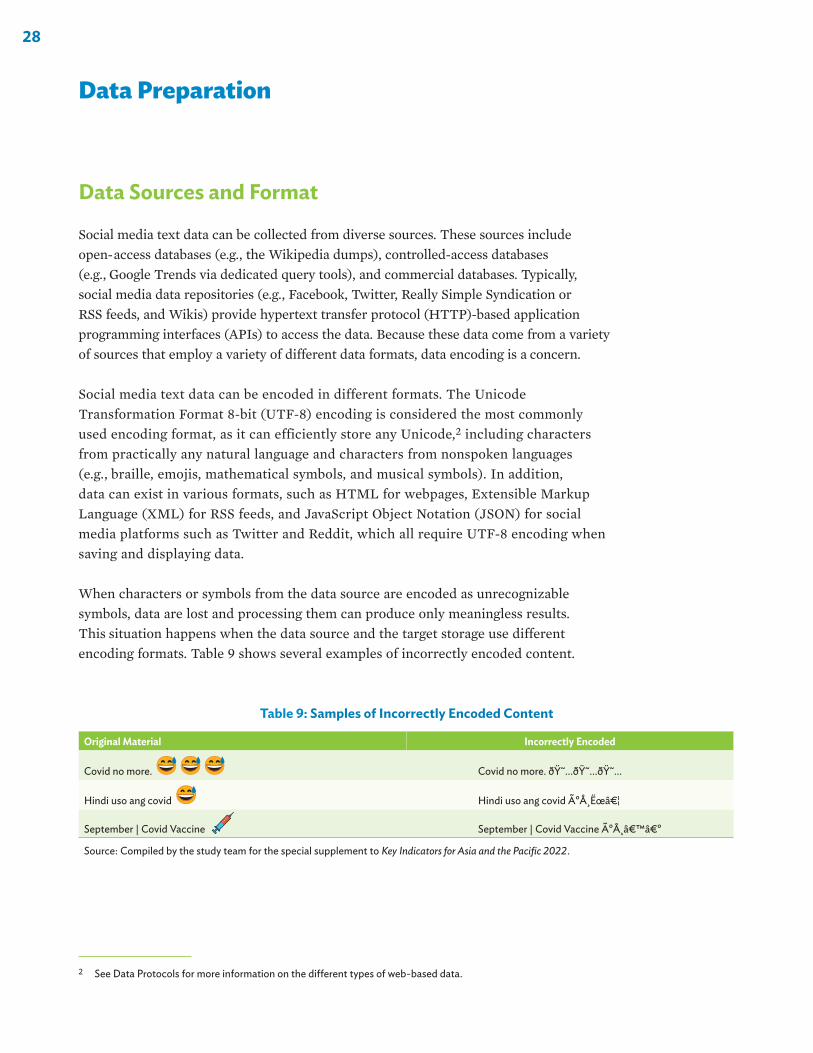
28
Data Sources and Format
Social media text data can be collected from diverse sources. These sources include open- access databases (e.g., the Wikipedia dumps), controlled-access databases (e.g., Google Trends via dedicated query tools), and commercial databases. Typically, social media data repositories (e.g., Facebook, Twitter, Really Simple Syndication or RSS feeds, and Wikis) provide hypertext transfer protocol (HTTP)-based application programming interfaces (APIs) to access the data. Because these data come from a variety of sources that employ a variety of different data formats, data encoding is a concern.
Social media text data can be encoded in different formats. The Unicode Transformation Format 8-bit (UTF-8) encoding is considered the most commonly used encoding format, as it can efficiently store any Unicode,2 including characters from practically any natural language and characters from nonspoken languages (e.g., braille, emojis, mathematical symbols, and musical symbols). In addition, data can exist in various formats, such as HTML for webpages, Extensible Markup Language (XML) for RSS feeds, and JavaScript Object Notation (JSON) for social media platforms such as Twitter and Reddit, which all require UTF-8 encoding when saving and displaying data.
When characters or symbols from the data source are encoded as unrecognizable symbols, data are lost and processing them can produce only meaningless results. This situation happens when the data source and the target storage use different encoding formats. Table 9 shows several examples of incorrectly encoded content.
2 See Data Protocols for more information on the different types of web-based data.
Table 9: Samples of Incorrectly Encoded Content
Original Material Incorrectly Encoded
Covid no more. Covid no more. 😅😅😅
Hindi uso ang covid Hindi uso ang covid ðŸ˜â€II
September | Covid Vaccine September | Covid Vaccine 💉
Source: Compiled by the study team for the special supplement to Key Indicators for Asia and the Pacific 2022.
Data Preparation

29Data Preparation
The different encoding formats may not only cause additional steps in the preprocessing of the text data but can also lead to a loss of information. For example, emojis (requiring specific encoding formats) can be used as a key factor in performing further analyses on the text data, such as sentiment analysis. To ensure that no information is lost due to data format incompatibility, it is necessary to select data storage solutions supporting the encoding format of the source data. Further, it is important to note that, once the data are saved to another form, it will be challenging, if not impossible, to convert these data back to their original values or forms.
In cases where data need to be stored in a format different from the source, they may be read in one format and stored in another format using existing programming language features, such as Python’s Unicode Support.3 Listing 1 shows examples of encoding and decoding procedures between different formats in Python.
3 Please refer to Data Protocols for more information on the different types of web-based data.
Listing 1: Encoding and Decoding Between Formats
Programming (Python)
1
2
3
4
5
6
7
f = open(‘file1.txt’, ‘r’, encoding=’utf-8’)
content = f.read( )
f.close( )
f = open(‘file2.txt’, ‘w’, encoding=’utf-16’)
f.write(‘some string’)
f.close( )
Description
(Line 1) Opening the file using Python’s built-in function open, by specifying the file name (‘file1.txt’), the mode of accessing the file (‘r’ for read), and the encoding format (‘utf-8’). This function returns a file object (f ), which contains several functions such as read and close.
(Line 2) Reading the content of the file and storing the content into variable content, using the function read from the returned file object (f ).
(Line 3) Closing the file after reading using the function close from the returned file object (f ).
(Line 5) Opening the file using Python’s built-in function open, by specifying the file name (‘file2.txt’), the mode of accessing the file (‘w’ for write), and the encoding format (‘utf-16’). This function returns a file object (f ), which contains several functions such as write and close.
(Line 6) Writing into the file using the function write from the returned file object (f ).
(Line 7) Closing the file after writing using the function close from the returned file object (f ).
Source: Methodology of the study team for the special supplement to Key Indicators for Asia and the Pacific 2022.
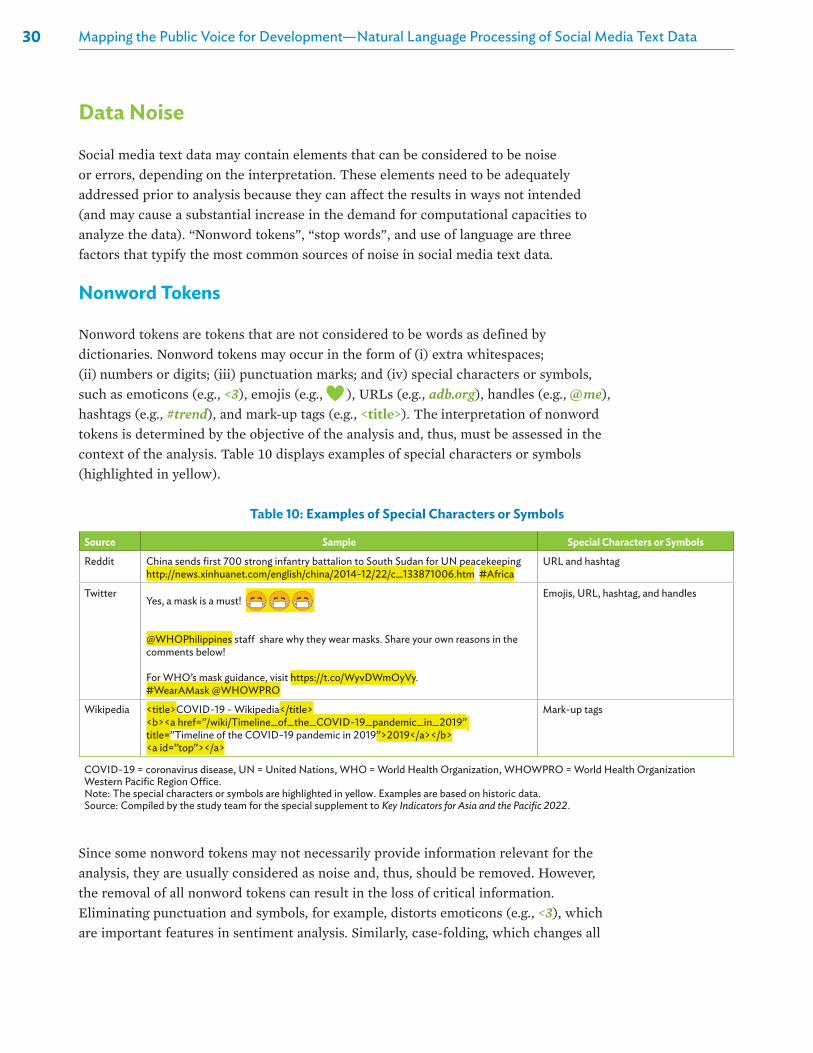
30 Mapping the Public Voice for Development—Natural Language Processing of Social Media Text Data
Data Noise
Social media text data may contain elements that can be considered to be noise or errors, depending on the interpretation. These elements need to be adequately addressed prior to analysis because they can affect the results in ways not intended (and may cause a substantial increase in the demand for computational capacities to analyze the data). “Nonword tokens”, “stop words”, and use of language are three factors that typify the most common sources of noise in social media text data.
Nonword Tokens
Nonword tokens are tokens that are not considered to be words as defined by dictionaries. Nonword tokens may occur in the form of (i) extra whitespaces; (ii) numbers or digits; (iii) punctuation marks; and (iv) special characters or symbols, such as emoticons (e.g., <3), emojis (e.g., ), URLs (e.g., adb.org), handles (e.g., @ me), hashtags (e.g., #trend), and mark-up tags (e.g., <title>). The interpretation of nonword tokens is determined by the objective of the analysis and, thus, must be assessed in the context of the analysis. Table 10 displays examples of special characters or symbols (highlighted in yellow).
Since some nonword tokens may not necessarily provide information relevant for the analysis, they are usually considered as noise and, thus, should be removed. However, the removal of all nonword tokens can result in the loss of critical information. Eliminating punctuation and symbols, for example, distorts emoticons (e.g., <3), which are important features in sentiment analysis. Similarly, case-folding, which changes all
Table 10: Examples of Special Characters or Symbols
Source Sample Special Characters or Symbols
Reddit China sends first 700 strong infantry battalion to South Sudan for UN peacekeeping http://news.xinhuanet.com/english/china/2014-12/22/c_133871006.htm #Africa
URL and hashtag
TwitterYes, a mask is a must!
@WHOPhilippines staff share why they wear masks. Share your own reasons in the comments below!
For WHO’s mask guidance, visit https://t.co/WyvDWmOyVy.#WearAMask @WHOWPRO
Emojis, URL, hashtag, and handles
Wikipedia <title>COVID-19 - Wikipedia</title><b><a href=”/wiki/Timeline_of_the_COVID-19_pandemic_in_2019” title=”Timeline of the COVID-19 pandemic in 2019”>2019</a></b><a id=”top”></a>
Mark-up tags
COVID-19 = coronavirus disease, UN = United Nations, WHO = World Health Organization, WHOWPRO = World Health Organization Western Pacific Region Office.Note: The special characters or symbols are highlighted in yellow. Examples are based on historic data.Source: Compiled by the study team for the special supplement to Key Indicators for Asia and the Pacific 2022.

31Data Preparation
letters to lowercase, will have a significant impact on the performance of a sentiment analyzer that may use word shapes for interpretations. Words whose letters are all capitalized (e.g., GREAT and WICKED) convey intensified emotions, which will be lost when the text is case-folded. Hence, case-folding is also not always recommended.
Not all nonword tokens are noise that needs to be removed. Sharou, Li, and Specia (2011) described two types of noise, namely “harmful noise,” and “useful noise.” Harmful noise consists of unwanted disturbances that are either harmful or useless, or both—harmful because it affects the intended meaning of the text and/or the performance of the NLP system, and useless because its existence serves no purpose. Examples of harmful noise are spelling errors, repeating words, and pause-filling words (e.g., “umm” and ”err”). On the other hand, useful noise conceals content that serves a purpose and conveys meaning that is crucial to the task and/or the performance of the NLP system. Examples of useful noise are emoticons, emojis, and internet jargon (e.g., LOL and FOMO). Useful noise should not be removed or replaced in the corpus.
In the case that nonword tokens are considered useful noise, rather than removing them, it may be preferable to convert the nonword tokens into another form, such as special tags. These special tags can be utilized as features, whereas the nonword tokens can be extracted and stored separately for subsequent analysis. Table 11 shows suggested transformations for nonword tokens and some reasons for further processing of them.
The initial step in transforming nonword tokens to special tags is to locate the tokens in the text data using regular expressions. A regular expression is a collection of characters that is used to extract and process characters, special characters, or substrings that follow a particular pattern. For instance, the regular expression @S+ would be used to locate user handles in the text data. Once discovered, in a second step, the nonword token is substituted with its specific tag and then saved to another file for subsequent processing. If emojis are considered harmful noise and have to be removed, rather than using regular expressions to locate them, libraries such as Python Package Index’s emot and emoji libraries are available as replacement. Listing 2 shows the implementation of the conversion of nonword tokens to special tags in Python.
Table 11: Suggested Transformations for, and Reasons for Further Processing of, Nonword Tokens
Nonword Token Special Tag Reason for Further Processing
Emojis and emoticons <emoji> May be used for sentiment analysis
URLs <URL> Reference on videos, images, and web pages that may provide additional information
Hashtags <hashtag> May provide insights on topics in the data
User handles <handle> May provide insights on people, events, and organizations
Source: Methodology of the study team for the special supplement to Key Indicators for Asia and the Pacific 2022.
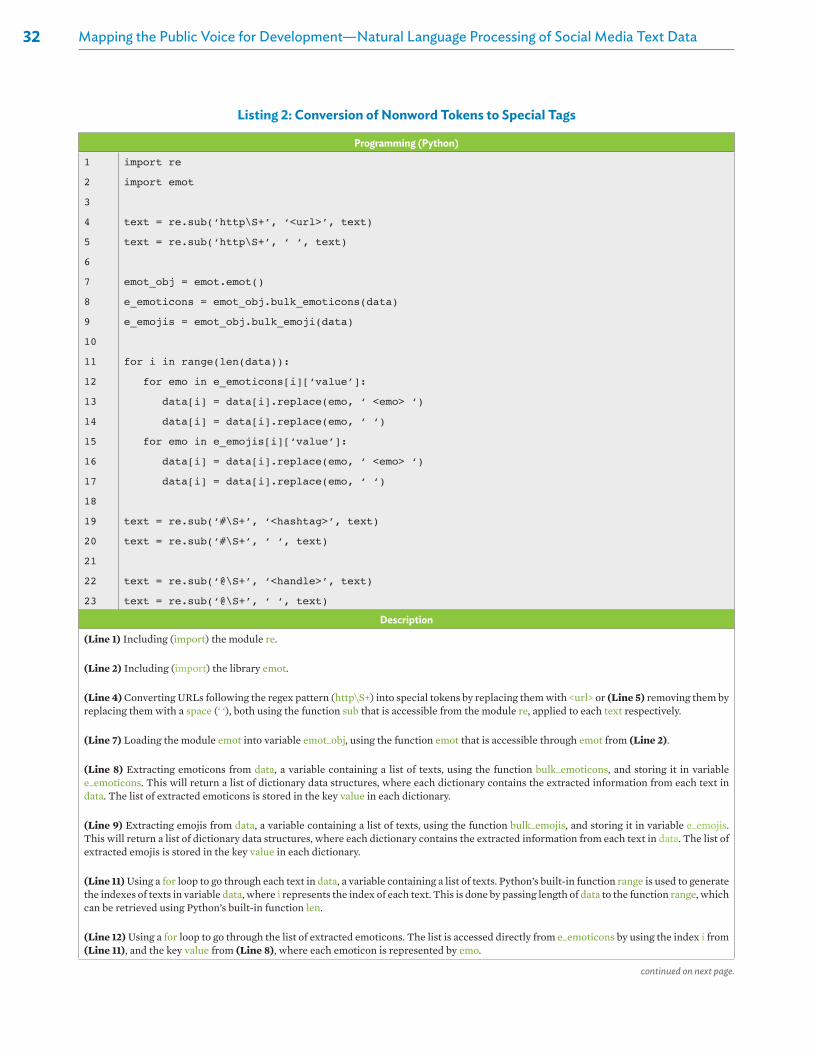
32 Mapping the Public Voice for Development—Natural Language Processing of Social Media Text Data
Listing 2: Conversion of Nonword Tokens to Special Tags
Programming (Python)
1
2
3
4
5
6
7
8
9
10
11
12
13
14
15
16
17
18
19
20
21
22
23
import re
import emot
text = re.sub(‘http\S+’, ‘<url>’, text)
text = re.sub(‘http\S+’, ‘ ‘, text)
emot_obj = emot.emot()
e_emoticons = emot_obj.bulk_emoticons(data)
e_emojis = emot_obj.bulk_emoji(data)
for i in range(len(data)):
for emo in e_emoticons[i][‘value’]:
data[i] = data[i].replace(emo, ‘ <emo> ‘)
data[i] = data[i].replace(emo, ‘ ‘)
for emo in e_emojis[i][‘value’]:
data[i] = data[i].replace(emo, ‘ <emo> ‘)
data[i] = data[i].replace(emo, ‘ ‘)
text = re.sub(‘#\S+’, ‘<hashtag>’, text)
text = re.sub(‘#\S+’, ‘ ‘, text)
text = re.sub(‘@\S+’, ‘<handle>’, text)
text = re.sub(‘@\S+’, ‘ ‘, text)
Description
(Line 1) Including (import) the module re.
(Line 2) Including (import) the library emot.
(Line 4) Converting URLs following the regex pattern (http\S+) into special tokens by replacing them with <url> or (Line 5) removing them by replacing them with a space (‘ ‘), both using the function sub that is accessible from the module re, applied to each text respectively.
(Line 7) Loading the module emot into variable emot_obj, using the function emot that is accessible through emot from (Line 2).
(Line 8) Extracting emoticons from data, a variable containing a list of texts, using the function bulk_emoticons, and storing it in variable e_emoticons. This will return a list of dictionary data structures, where each dictionary contains the extracted information from each text in data. The list of extracted emoticons is stored in the key value in each dictionary.
(Line 9) Extracting emojis from data, a variable containing a list of texts, using the function bulk_emojis, and storing it in variable e_emojis. This will return a list of dictionary data structures, where each dictionary contains the extracted information from each text in data. The list of extracted emojis is stored in the key value in each dictionary.
(Line 11) Using a for loop to go through each text in data, a variable containing a list of texts. Python’s built-in function range is used to generate the indexes of texts in variable data, where i represents the index of each text. This is done by passing length of data to the function range, which can be retrieved using Python’s built-in function len.
(Line 12) Using a for loop to go through the list of extracted emoticons. The list is accessed directly from e_emoticons by using the index i from (Line 11), and the key value from (Line 8), where each emoticon is represented by emo.
continued on next page.

33Data Preparation
(Line 13) Converting the extracted emoticon (emo) from Line 12 into special tokens by replacing them with <emo> or (Line 14) removing them by replacing them with a space (‘ ‘), both using Python’s string function replace, applied to each text at index i, respectively.
(Line 15) Using a for loop to go through the list of extracted emojis. The list is accessed directly from e_emojis by using the index i from (Line 11), and the key value from (Line 9), where each emoji is represented by emo.
(Line 16) Converting the extracted emoji (emo) from (Line 15) into special tokens by replacing them with <emo> or (Line 17) removing them by replacing them with a space (‘ ‘), both using Python’s string function replace, applied to each text at index i, respectively.
(Line 19) Converting hashtags following the regex pattern (#\S+) into special tokens by replacing them with <hashtag> or (Line 20) removing them by replacing them with a space (‘ ‘), both using the function sub that is accessible from the module re, applied to each text respectively.
(Line 22) Converting user handles following the regex pattern (@\S+) into special tokens by replacing them with <handle> or (Line 23) removing them by replacing them with a space (‘ ‘), both using the function sub that is accessible from the module re, applied to each text respectively.
Source: Methodology of the study team for the special supplement to Key Indicators for Asia and the Pacific 2022.
continued on next page.
Listing 2 continued.
In the case that the nonword tokens contain information not relevant for the analysis, these tokens can be removed in order to not distort (the implementation of ) the analysis and to decrease the computational prerequisites. Listing 3 shows the implementation of the removal of nonword tokens in Python.
Listing 3: Removal of Nonword Tokens
Programming (Python)
1
2
3
4
5
6
7
8
9
10
11
12
13
14
import re
special_tokens = [‘<url>’, ‘<emo>’, ‘<hashtag>’, ‘<handle>’]
words = text.split()
for i in range(len(words)):
if words[i] in special_tokens:
continue
words[i] = re.sub(‘\n’, ‘ ‘, words[i])
words[i] = re.sub(‘[^A-Za-z]+’, ‘ ‘, words[i])
words[i] = words[i].strip()
text = ‘ ‘.join([word for word in words if word != ‘’])
Description
(Line 1) Including (import) the module re.
(Line 3) Creating a variable special_tokens that will hold the list of special tokens (‘<url>’, ‘<emo>’, ‘<hashtag>’, ‘<handle>’) to be ignored during removal.
(Line 4) Converting text into a list of words using Python’s list function split and storing the list in variable words.

34 Mapping the Public Voice for Development—Natural Language Processing of Social Media Text Data
(Line 6) Using a for loop to go through each word in variable words from (Line 4). Python’s built-in function range is used to generate the indexes of words in variable words, where i represents the index of each word. This is done by passing length of words to the function range, which can be retrieved using Python’s built-in function len.
(Line 7) If the word at index i exists in the list of special tokens (special_tokens), (Line 8) skip the rest of the codes inside the for loop (codes inside the for loop can be identified by indentation level) using the keyword continue and continue to the next value of i or the next index.
(Line 10) Removing newline characters (‘\n’) by replacing them with a space (‘ ‘) using the function sub that is accessible from the module re, for each word at index i, respectively.
(Line 11) Removing digits, special characters, and punctuations following the regex pattern ([^A-Za-z]+) by replacing them with a space (‘ ‘) using the function sub that is accessible from the module re, for each word at index i, respectively.
(Line 12) Removing extra whitespaces using Python’s string function strip, for each word at index i, respectively.
(Line 14) Combining each word in words together into one string, making sure that no empty string (‘ ’) is included from words, and separating each word by a space (‘ ‘) using Python’s string function join. Inside the function join, Python’s list comprehension is used for faster processing of the loop.
Source: Methodology of the study team for the special supplement to Key Indicators for Asia and the Pacific 2022.
Listing 3 continued.
Stop Words
Stop words signify words that occur frequently in a text corpus and are often not relevant to capture the content of the corpus. In addition, stop words are nondiscriminative for text classification and keyword extraction because they provide limited additional information to the classifier. Stop words typically include determiners, pronouns, linking verbs, conjunctions, and prepositions. The identification of stop words, however, requires a detailed (case-specific) investigation of the applicable language in its entirety. Stop words are commonly considered to be noise and, thus, should be removed without negatively affecting the analyses.
The removal of stop words follows a two-step procedure. First, a list of stop words (i.e., a stop list) has to be compiled. Second, the stop words have to be removed based on the previously identified stop list. The compilation of stop lists can refer to two approaches, namely a predefined stop list or a customized stop list, outlined as follows.
Predefined stop list. Predefined stop lists may refer to numerous libraries, whereby the Natural Language Toolkit (NLTK) represents the most common library of stop lists. The NLTK is a suite of libraries for stop lists in 22 languages,4 including, for example, Arabic, French, and Spanish. The NLTK English stop list includes, for example, the words “I”, “yourselves”, “the”, “in”, “about”, “am”, and “did”. However, using a single stop list to process different text
4 NLTK version 3.7 has the stop lists for Arabic, Azerbaijani, Bengali, Danish, Dutch, English, Finnish, French, German, Greek, Hungarian, Indonesian, Italian, Kazakh, Nepali, Norwegian, Portuguese, Romanian, Russian, Slovene, Spanish, Swedish, Tajik, and Turkish.

35Data Preparation
corpora for diverse purposes can have downside consequences for the analysis, since a universal stop list for any language does not exist. The significance of a word in a text corpus varies according to the text corpus itself and the underlying research objective. For example, eliminating the interrogative pronouns “who”, “what”, “where”, “when”, “why”, and “how” might result in the omission of potentially insightful information about the types of inquiries expressed in the text corpus. Similarly, the pronouns “it” and “us” may be used in conjunction with the terms “IT solution” and “US government”, respectively, and are not considered as stop words in those contexts. Following this notion, customized stop lists offer an opportunity to consider contextual aspects.
Customized stop list. In cases where no predefined stop word list is available or specific language-dependent prerequisites have to be considered, a technique to compile a customized stop list is to sort the words according to their frequency in the corpus. The most frequent words are then manually screened for their semantic content in relation to the text corpus’s domain and the research objective. This technique is based on Zipf’s Law (Zipf 1935), which states that the number of times a word appears in a text corpus is inversely related to its rank in the frequency table. As a result, the most frequent word will appear approximately twice as frequently in the text corpus as the second most frequent word, and three times as frequently as the third most frequent word, and so on. Zipf’s Law demonstrates that a relatively small number of words account for a sizable portion of the text corpus, implying that those words have minor discriminative value. In this context, O’Keefe, McCarthy, and Carter (2007) revealed that the 2,000 most frequent words in a 10-million-word text corpus accounted for 80% of all the words. In determining the stop words for the stop list, one normally generates the top 1% of most frequent words, then manually selects which of those words are actually stop words. Figure 3 shows Zipf plots generated from differently sized text corpora, including Japanese web pages (Baroni 2005). Please note that when log( frequency) is plotted against log(rank), a line with a slope of –1 is obtained.
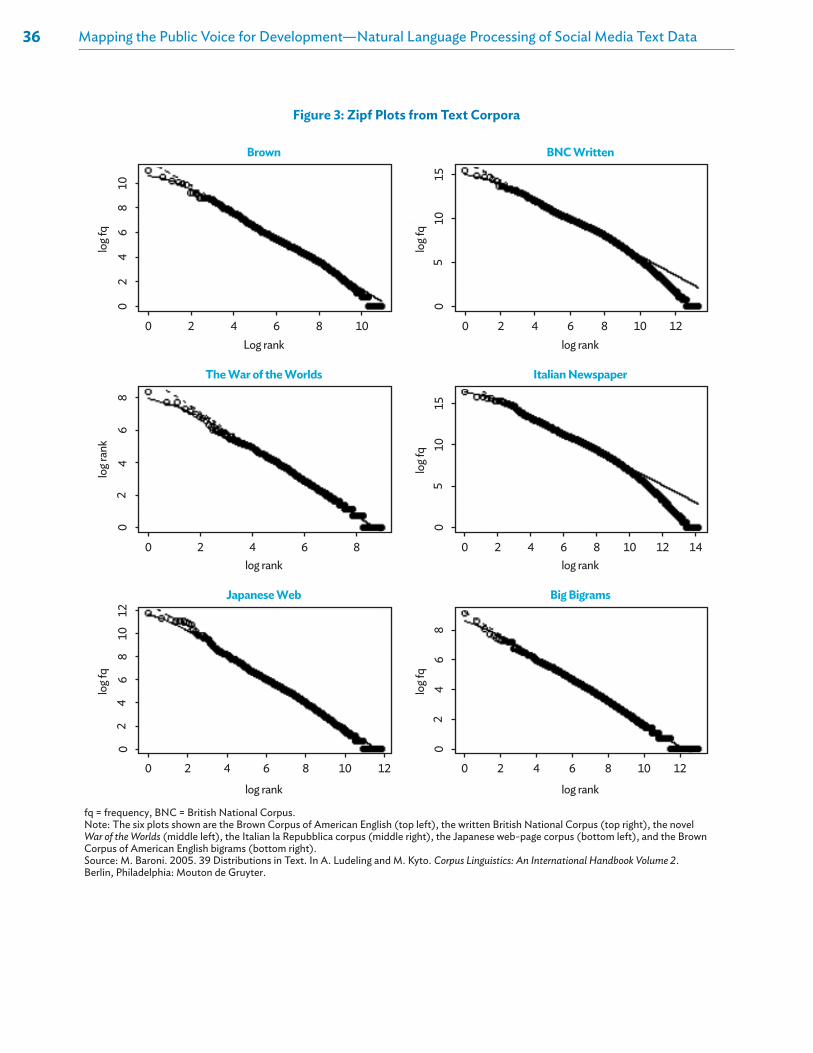
36 Mapping the Public Voice for Development—Natural Language Processing of Social Media Text Data
Figure 3: Zipf Plots from Text Corpora
fq = frequency, BNC = British National Corpus. Note: The six plots shown are the Brown Corpus of American English (top left), the written British National Corpus (top right), the novel War of the Worlds (middle left), the Italian la Repubblica corpus (middle right), the Japanese web-page corpus (bottom left), and the Brown Corpus of American English bigrams (bottom right). Source: M. Baroni. 2005. 39 Distributions in Text. In A. Ludeling and M. Kyto. Corpus Linguistics: An International Handbook Volume 2. Berlin, Philadelphia: Mouton de Gruyter.
Brown BNC Written
The War of the Worlds Italian Newspaper
Log rank
log f
q 10
86
42
08
64
20
86
42
015
105
015
105
0
128
106
42
0
0 2 4 6 8 10
0 2 4 6 8
0 2 4 6 8 10 12
0 2 4 6 8 10 120 2 4 6 8 10 12
0 2 4 6 8 10 12 14
log f
q
log r
ank
log f
q
log f
q
log f
q
log rank
Japanese Web Big Bigrams
log rank log rank
log rank log rank

37Data Preparation
A key concern in creating customized stop lists is the metric or rule to determine if a word is a stop word. While there is no standard rule, three factors must be considered: (i) the word’s frequency rank, (ii) the word’s semantic relevance to the text corpus, and (iii) the word’s actual frequency relative to the text corpus size. As mentioned previously, to generate customized stop lists, words in the text corpus are sorted in descending order of their frequency and manually screened for their semantic content. Stop lists can also be generated through term frequency - inverse document frequency (TF–IDF) weighting, as described in the next chapter.
Finally, a customized stop list can also refer to a predefined stop list. Listing 4 shows the implementation of a customized stop list based on a predefined stop list, i.e., NLTK in Python. It is important to note that some NLP solutions (such as RAKE described in the sixth chapter) may perform their own stop word removals, thus not requiring this specific preprocessing step.
Listing 4: Creation of Customized Stop Word Lists
Programming (Python)
1
2
3
4
5
6
7
import nltk
nltk.download(‘stopwords’)
from nltk.corpus import stopwords
stopwords_default = stopwords.words(‘english’)
stopwords_default.append(‘like’)
stopwords_default.extend([‘share’, ‘subscribe’])
Description
(Line 1) Including (import) the library nltk.
(Line 2) Downloading nltk stop words corpus by passing the keyword ‘stopwords’ to the function download that is accessible from the library nltk.
(Line 3) Including (import) the downloaded corpus stopwords from the library nltk.
(Line 5) Loading a list of predefined English stop words into variable stopwords_default, by passing the keyword (‘english’) to the function words that is accessible from stopwords in (Line 3).
(Line 6) Adding a new word (‘like’) to the existing list of stop words (stopwords_default) by using Python’s list function append.
(Line 7) Adding multiple words in a list form ([‘share’, ‘subscribe’]) to the existing list of stop words (stopwords_default) by using Python’s list function extend.
Source: Methodology of the study team for the special supplement to Key Indicators for Asia and the Pacific 2022.

38 Mapping the Public Voice for Development—Natural Language Processing of Social Media Text Data
Following the identification of stop words, the stop words can be removed from the text corpus. Table 12 shows the effect of stop word removal.
Language Use
This section discusses two important text normalization techniques: (i) spelling correction, and (ii) lemmatization and stemming. It is important to note that the dominant type of language in user-generated content (UGC) is vernacular language (i.e., a nonstandard language or dialect spoken in a given place or region). Thus, UGC will include content written in dialects and slangs. The multilingual nature of UGC can cause challenges in data preparation if electronic language tools are not available to preprocess or cleanse the data.
Spelling Correction
The most frequent source of language-related noise are words that are misspelled, including true misspellings or spelling variances (e.g., acronyms and shortcut words). Misspellings can be corrected by using open-source spellcheckers, such as the Python library pyspellchecker and symspellpy. Typically, these spellcheckers support numerous languages, including English, French, Portuguese, and Spanish. The majority of spellcheckers, however, assumes that the material is monolingual. Thus, spellcheckers may mistakenly categorize foreign terms as misspellings, given that social media text data are often multilingual. Additionally, spellcheckers may also flag new words and proper nouns as misspellings. Table 13 shows four examples of misspellings that have been wrongly corrected by two open-source spellcheckers, namely Python library pyspellchecker and symspellpy.
Table 12: Examples of Texts With and Without Stop Words
Original Text With Stop Words Text Without Stop Words
this be the sad tally of all that i ever view sad tally view
positivity rate and indoor dining be now allow positivity rate indoor dining allow
we owe every successful recovery of this pandemic to you frontline thank you for your hardwork sacrifice and grit salud kami sa inyo
owe successful recovery pandemic frontline thank hardwork sacrifice grit salud kami sa inyo
Source: Compiled by the study team for the special supplement to Key Indicators for Asia and the Pacific 2022.

39Data Preparation
Lemmatization and Stemming
The second type of text normalization technique includes the processes of lemmatization and stemming, and aims to address the issues presented by word inflections. Word inflection is the process through which the form of a word changes to indicate alterations in tense, person, number, gender, mood, voice, or case. For example, the word “play” can take on a variety of inflected forms depending on the context, including “plays”, “playing”, and “played”, but all have the same fundamental meaning.
Techniques around word inflections deal, in particular, with the spatial volume of text data. Despite its large size, a corpus may contain lot of similar words that add little information and therefore provide little benefit. Normalizing words, or reverting them to their root form, is a critical step in preparing a text corpus for subsequent analysis. When a language has rich word inflections, the application of NLP techniques becomes more challenging as the vocabulary increases in size while the semantic information remains confined. Lemmatization and stemming reduce the number of words in the text corpus, while retaining the same amount of information.
Lemmatization and stemming are two techniques for deriving the root form of words. Lemmatization is a process that utilizes a vocabulary or morphological analysis of words to extract the base or dictionary form of a word (i.e., lemma). For example, the words “dance”, “dances”, “danced”, and “dancing” are all lemmatized to the word “dance”. Stemming, on the other hand, is a heuristic method that eliminates the end of a word, with the objective of accurately removing derivational affixes, ultimately to obtain the root word. For example, the words “dance”, “dances”, “danced”, and “dancing” are stemmed to the word “danc”. Due to the rudimentary nature of the stemming procedure, the resulting stem may not necessarily result in an existent word as demarcated by dictionaries.
Table 13: Examples of Misspellings and Their Corrected Forms
Original TextSpelling Correction by Python
Library “pyspellchecker”Spelling Correction by Python
Library “symspellpy” Note
how about those work in heathcare business who…
how about those work in healthcare business who…
how about those work in healthcare business who…
Misspelled word was properly corrected
this be the first delivery of pfizer biontech vaccine and…
this be the first delivery of pfizer biotech vaccine. and…
this be the first delivery of pfizer biotech vaccine and…
A brand name was detected as misspelling and mistakenly corrected
i miss the life without covid i miss the life without couid i really miss life without covid A new word that is also a proper noun was not recognized by Python library pyspellchecker
nothing can stop our fight anymore support our goal of eliminate tb in the first ever virtual world tb day conference in the philippines
nothing can stop our fight anymore support our goal of eliminate to in the first ever virtual world to day conference in the philippines
nothing can stop our fight anymore support our goal of eliminate to in the first ever virtual world to day conference in the philippines
An acronym was considered a misspelling and mistakenly corrected
Note: Both the misspellings and their corrections are highlighted in yellow. The corrections were made by two open-source spellcheckers, namely Python library pyspellchecker and symspellpy.Source: Compiled by the study team for the special supplement to Key Indicators for Asia and the Pacific 2022.

40 Mapping the Public Voice for Development—Natural Language Processing of Social Media Text Data
Figure 4 (a) shows a word cloud, generated from an unprocessed 100-token document. The word cloud shows how derivationally related words (e.g., “involve-involved”, “control-controlled”, “said-saying”, “talk-talked”, “look-looking”, “speak-spoke-speaking-speech”, “make-making”, and “democracy-democratic”) are (prior to preprocessing) considered individually, despite the fact that several word groups convey very similar meaning. This creates the illusion that the document contains more content than it actually does. By treating derivationally related words as a single entity, the words’ representation should become more accurate.
Figure 4 (b) shows the resulting word cloud following lemmatization. The inflected words “involved”, “controlled”, “said”, “saying”, “talked”, “looking”, “spoke”, “speaking”, and “making” were removed as these words have been reduced to their respective root words, resulting in the combined representation of a group of derivationally related words.
Figure 4 (c) shows the word cloud after stemming, whereby the stems “involv”, “activ”, “democraci”, and “peopl” do not reflect words as demarcated by dictionaries.
Because it adheres to words demarcated by dictionaries, lemmatization is generally preferred over stemming for word normalization. Unfortunately, not all languages have support for lemmatization or even stemming, as most language services are available only for the major languages. Table 14 shows the differences in the results for stemming as compared to lemmatization. Listing 5 shows the implementation for stemming and lemmatization in Python.
Figure 4: Word Clouds Showing Changes After Lemmatization and Stemming
Note: Word cloud (a) was generated from a 100-token document. Word cloud (b) was generated after the original document was lemmatized. Word cloud (c) was generated after the original document was stemmed.Source: Methodology of the study team for the special supplement to Key Indicators for Asia and the Pacific 2022.
(a) (b) (c)

41Data Preparation
Listing 5: Stemming and Lemmatization of Words
Programming (Python)
1
2
3
4
5
6
7
8
9
10
import spacy
from nltk.stem import PorterStemmer
ps = PorterStemmer()
text = “the removal of the face shield mandate”
words = text.split()
stem_text = “ ”.join([ps.stem(word) for word in words])
nlp = spacy.load(“en_core_web_sm”, disable=[“parser”, “ner”])
lemma_text = “ ”.join([token.lemma_ for token in nlp(text)])
Description
(Line 1) Including (import) the library spacy.
(Line 2) Including (import) the class PorterStemmer from the library nltk.
(Line 4) Creating an instance of PorterStemmer named ps. This is done to gain access to the function stem that will be used to perform stemming on the word.
(Line 5) Creating a variable text with a sample string to process.
(Line 6) Converting text into a list of words using Python’s list function split, and storing the list in variable words.
(Line 8) Stemming each word in variable words using the function stem from variable ps in (Line 4), combining the stemmed words together into one string, separating each stemmed word by a space (‘ ‘) using Python’s string function join, and finally storing the string in variable stem_text. Inside the function join, Python’s list comprehension is used for faster processing of the loop.
(Line 9) Loading a small English pipeline (“en_core_web_sm”) that includes vocabulary, syntax, and entities into variable nlp. Both the parser (parser) and entity recognizer (ner) were disabled to reduce computation time as they were not used in the preprocessing.
(Line 10) Lemmatizing text by passing the variable to the loaded pipeline (nlp) from (Line 9), and extracting lemmatized tokens (token.lemma_), where token represents a word from text that has went through the pipeline (nlp). The extracted tokens were then combined them into one string, and each token is separated by a space (‘ ‘) using Python’s string function join, and stored in variable lemma_text. Similar to (Line 8), the extraction of lemmatized tokens used Python’s list comprehension for faster processing of the loop.
Source: Methodology of the study team for the special supplement to Key Indicators for Asia and the Pacific 2022.
Table 14: Comparison of Lemmatization and Stemming
Original Text Stemmed Text Lemmatized Text
the removal of the face shield mandate the remov of the face shield mandat the removal of the face shield mandate
…cases who arrived in the country from africa last month are in isolation, adds their samples were already sent to pgc
…case who arriv in the countri from africa last month are in isol add their sampl were alreadi sent to pgc
…case who arrive in the country from africa last month be in isolation add their sample be already send to pgc
show us show us show we
Note: The original words with their stemmed and lemmatized forms are highlighted in yellow. Python library Natural Language Toolkit was used to perform stemming. The Python library spacy was used to perform lemmatization. Source: Methodology of the study team for the special supplement to Key Indicators for Asia and the Pacific 2022.

42
Data Representation
Information on words, such as their meaning and relationships with other words, may be derived based on dictionaries and other lexical resources. However, not all languages have these lexical resources and there are resulting limitations in the coverage and scope of information on words. Moreover, and most importantly, the language of a dictionary (human language) is not native to the language of a computer. To enable computers to understand human language, the information must be represented in the language of computers.
Distributional semantic models, commonly known as vector space models (VSMs) of meanings, aim to address the limitations of traditional dictionaries. VSMs assume that the meaning of a word can be inferred from the word’s distributional properties in the entire corpus. Through the statistical analysis of the context of a word, VSMs dynamically build semantic representations in the form of high-dimensional vector spaces. They allow for the automatic extraction of word and document knowledge from a text corpus. Compared to dictionaries, VSMs have a higher recall (i.e., more words are found in the vector space) but a lower precision (i.e., the meaning of words is less precise).
Representing Words and Documents Using a Term- Document Matrix The intuition of VSMs of meaning comes from early linguistic work. Firth (1957) noted: “You shall know a word by the company it keeps.” In fact, humans derive the meaning of an unknown word based on its context. The “distributional hypothesis” in linguistics suggests that words that occur in similar contexts tend to have similar meanings (Harris 1954). The hypotheses of Firth and Harris are applied to algorithms for measuring semantic similarity that lead to vectors and matrices.
The “term-document” matrix is the most common simple VSM. The term-document matrix is a two-dimensional array of numbers, which describes the frequency of terms that occur in a collection of documents. Given a corpus with n terms and m documents, the term-document matrix is an n x m matrix, where the rows correspond to terms while the columns correspond to documents. Each element xi,j denotes the occurrence of term ti in document dj. Figure 5 shows a sample visualization of a term-document matrix.

43Data Representation
Each row is a count vector ti that corresponds to a term’s relation to each document in the text corpus. Similarly, each column is a count vector dj that corresponds to a document’s relation to each term in the vocabulary of the text corpus. Figure 6 shows the mathematical representation of the term vector and document vector, based on the term-document matrix.
A document is represented in the term-document matrix as a “bag of words” (BoW). A “bag” is a collection of items that may include duplicates. For instance, {a, a, a, b, b, c, c} denotes a bag containing the items a, b, and c. It is important to note that the order of the items is not considered in bags. Thus, the term-document matrix does not provide information on the order of words in a document. Following this notion, the bags {a, a, a, b, b, c, c} and {c, a, c, a, b, a, b} are equivalent. The vector x = <3, 2, 2> can be used to represent the bag {a, a, a, b, b, c, c} by specifying that the first element of x is the frequency of a in the bag, the second element of x is the frequency of b in the bag, and the third element of x is the frequency of c in the bag.
Figure 6: Term Vector ti and Document Vector dj
Note: The term vector ti in Figure 6 (a) is a one-dimensional array representing a term in the corpus, where each element xi,j corresponds to the number of times the specific term appeared in each document in the corpus. The document vector dj in Figure 6 (b) is a one-dimensional array representing a document in the corpus, where each element xi,j corresponds to the number of times each term ti appeared in that specific document.Source: Methodology of the study team for the special supplement to Key Indicators for Asia and the Pacific 2022.
Figure 5: Visualization of a Term-Document Matrix
Note: The term-document matrix is an n x m 2-dimensional array representing a corpus of n terms and m documents. The rows correspond to the terms in the corpus, while the columns represent the documents in the corpus. Each element xi,j denotes the number of times of term ti appeared in document dj.Source: Methodology of the study team for the special supplement to Key Indicators for Asia and the Pacific 2022.
documentdj
termti
x1,1 x1, j x1,n
xi,1 xi, j xi,n
xm,1 xm, j xm,n
xi,1ti xi, j xi, j
xm, j
xi,n
x1, j
dj
(a) (b)
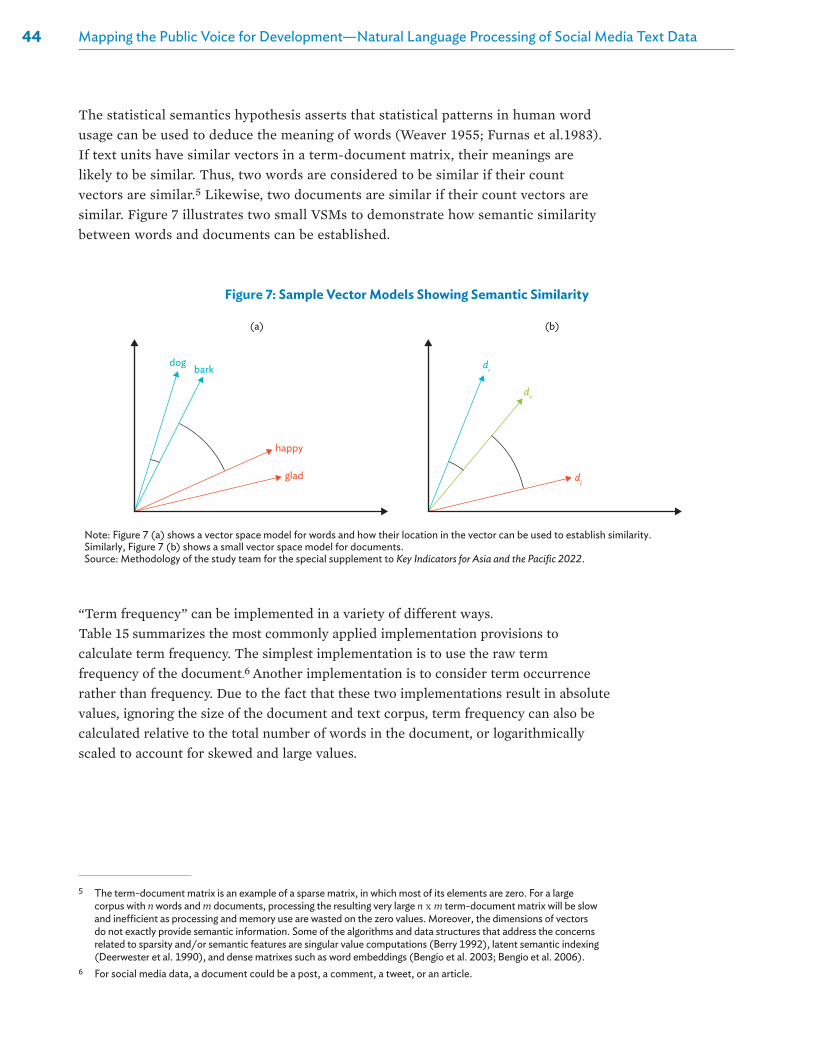
44 Mapping the Public Voice for Development—Natural Language Processing of Social Media Text Data
The statistical semantics hypothesis asserts that statistical patterns in human word usage can be used to deduce the meaning of words (Weaver 1955; Furnas et al.1983). If text units have similar vectors in a term-document matrix, their meanings are likely to be similar. Thus, two words are considered to be similar if their count vectors are similar.5 Likewise, two documents are similar if their count vectors are similar. Figure 7 illustrates two small VSMs to demonstrate how semantic similarity between words and documents can be established.
“Term frequency” can be implemented in a variety of different ways. Table 15 summarizes the most commonly applied implementation provisions to calculate term frequency. The simplest implementation is to use the raw term frequency of the document.6 Another implementation is to consider term occurrence rather than frequency. Due to the fact that these two implementations result in absolute values, ignoring the size of the document and text corpus, term frequency can also be calculated relative to the total number of words in the document, or logarithmically scaled to account for skewed and large values.
5 The term-document matrix is an example of a sparse matrix, in which most of its elements are zero. For a large corpus with n words and m documents, processing the resulting very large n x m term-document matrix will be slow and inefficient as processing and memory use are wasted on the zero values. Moreover, the dimensions of vectors do not exactly provide semantic information. Some of the algorithms and data structures that address the concerns related to sparsity and/or semantic features are singular value computations (Berry 1992), latent semantic indexing (Deerwester et al. 1990), and dense matrixes such as word embeddings (Bengio et al. 2003; Bengio et al. 2006).
6 For social media data, a document could be a post, a comment, a tweet, or an article.
Figure 7: Sample Vector Models Showing Semantic Similarity
Note: Figure 7 (a) shows a vector space model for words and how their location in the vector can be used to establish similarity. Similarly, Figure 7 (b) shows a small vector space model for documents.Source: Methodology of the study team for the special supplement to Key Indicators for Asia and the Pacific 2022.
dog di
dv
dj
bark
happy
glad
(a) (b)

45Data Representation
Establishing the Relevance of a Word to a Document through Term Frequency - Inverse Document FrequencyThe term-document matrix was developed and popularized in information retrieval (Salton 1963) to rank the relevance of documents in response to a query based on the BoW hypothesis (Salton et al. 1975). More recently, the term-document matrix has been used for a variety of purposes, including for text mining, clustering, and classification as well as feature extraction. Thus, term-document matrices constitute the foundation for the methodologies and techniques introduced in this report. The term-document matrix creates only a set of vectors containing the count of word occurrences in documents. It does not contain information on which words are more important than others. That limitation in establishing term relevance is addressed through the “term frequency - inverse document frequency” (TF-IDF) weighting.
The Theory of Term Importance (Salton et al. 1975) proposes that the importance of a term depends not only on its representativity or statistical representativeness (as expressed by its term frequency), but also on its specificity or rarity. Specificity is implemented as a weighting on the term frequency to denote the term’s discriminative characteristics. A term t in a document d receives a high weighting when the term t is frequent in document d, but is rare in other documents in the text corpus. The specificity (or rarity) is implemented through a numerical statistic, called the “inverse document frequency” (IDF). IDF is indicative of the significance of a term in the corpus (i.e., if the term is common or rare in the corpus), and is calculated as:
log $𝑁𝑁
1 + 𝑛𝑛!)
where N is the number of documents in the text corpus and nt is the number of documents where the term t appears.
Table 15: Implementation Provisions to Calculate Term Frequency
Term Frequency Calculation Formula
Raw frequency 𝑓𝑓!,#
Occurrence or boolean frequency𝑇𝑇𝑇𝑇 = $1, 𝑡𝑡 ∈ 𝑑𝑑
0, 𝑜𝑜𝑡𝑡ℎ𝑒𝑒𝑒𝑒𝑒𝑒𝑒𝑒𝑒𝑒𝑒𝑒3
Term frequency relative to the number of words in the document 𝑓𝑓!,#Σ!!∈#𝑓𝑓!!,#
Normalized term frequency by logarithm log(1 + 𝑓𝑓!,#)
Source: Methodology of the study team for the special supplement to Key Indicators for Asia and the Pacific 2022.

46 Mapping the Public Voice for Development—Natural Language Processing of Social Media Text Data
The product of the term frequency and the IDF, i.e., the TF-IDF weighting, is a statistical measure that is used to evaluate the importance of a term to a document in a corpus. The TF-IDF weighting of a term is highest when the term appears many times within a small number of documents. Consequently, the TF-IDF weighting of a term is lower when the term appears fewer times in a document, or appears in many documents (which may mean it is a common term, thus not so relevant). Finally, the TF-IDF weighting of a term is lowest when the term appears in almost all documents in the corpus (a hint that the term is a stop word). Listing 6 shows the implementation of word vectorization using TF-IDF in Python.
Listing 6: Word Vectorization Using Term Frequency - Inverse Document Frequency
Programming (Python)
1
2
3
4
5
6
7
8
9
10
11
12
13
14
15
16
from sklearn.feature_extraction.text import TfidfVectorizer
vectorizer = TfidfVectorizer()
vectors = vectorizer.fit_transform(data)
# resulting vectors
(0, 15)0.5157006599852059
(0, 97)0.5002331503466342
(0, 85)0.5189316650018784
(0, 88)0.3479073077008346
(0, 13)0.3057614378757394
(2, 23)0.2753102462761195
(2, 18)0.2368965816180022
(2, 19)0.28868278425470273
(2, 69)0.2664930811919658
(2, 83)0.5459496476439448
...
Description
(Line 1) Including (import) the class TfidfVectorizer from the library sklearn for feature extraction from the text.
(Line 2) Creating an instance of TfidfVectorizer named vectorizer. This is done to gain access to the different functions that can be used in dealing with vectorizing texts.
(Line 3) Learning the vocabulary and inverse document frequency (IDF) by passing variable data, a list of texts, to the function fit_transform that is accessible through variable vectorizer, where this returns a document-term matrix and stored in variable vectors.
(Line 5) Displaying a snippet of the document-term matrix (vectors).
Source: Methodology of the study team for the special supplement to Key Indicators for Asia and the Pacific 2022.
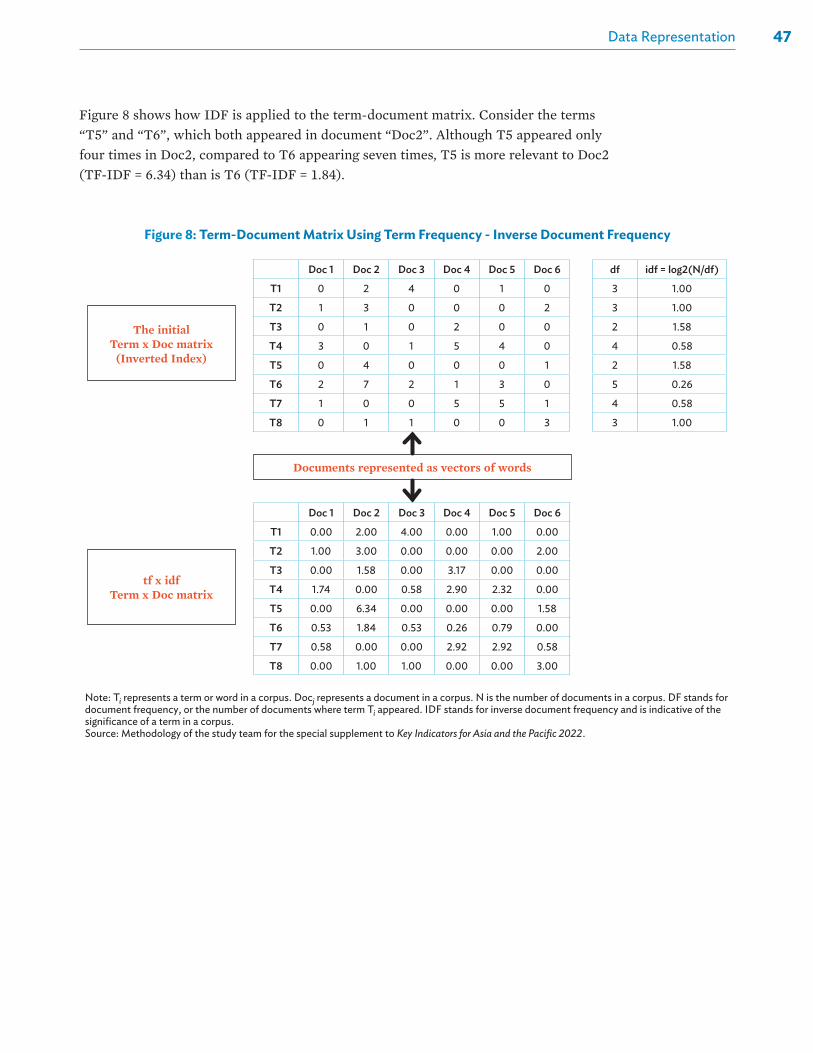
47Data Representation
Figure 8 shows how IDF is applied to the term-document matrix. Consider the terms “T5” and “T6”, which both appeared in document “Doc2”. Although T5 appeared only four times in Doc2, compared to T6 appearing seven times, T5 is more relevant to Doc2 (TF-IDF = 6.34) than is T6 (TF-IDF = 1.84).
Figure 8: Term-Document Matrix Using Term Frequency - Inverse Document Frequency
Note: Ti represents a term or word in a corpus. Docj represents a document in a corpus. N is the number of documents in a corpus. DF stands for document frequency, or the number of documents where term Ti appeared. IDF stands for inverse document frequency and is indicative of the significance of a term in a corpus.Source: Methodology of the study team for the special supplement to Key Indicators for Asia and the Pacific 2022.
Doc 1 Doc 2 Doc 3 Doc 4 Doc 5 Doc 6 df idf = log2(N/df)
T1 0 2 4 0 1 0 3 1.00
T2 1 3 0 0 0 2 3 1.00
T3 0 1 0 2 0 0 2 1.58
T4 3 0 1 5 4 0 4 0.58
T5 0 4 0 0 0 1 2 1.58
T6 2 7 2 1 3 0 5 0.26
T7 1 0 0 5 5 1 4 0.58
T8 0 1 1 0 0 3 3 1.00
Doc 1 Doc 2 Doc 3 Doc 4 Doc 5 Doc 6
T1 0.00 2.00 4.00 0.00 1.00 0.00
T2 1.00 3.00 0.00 0.00 0.00 2.00
T3 0.00 1.58 0.00 3.17 0.00 0.00
T4 1.74 0.00 0.58 2.90 2.32 0.00
T5 0.00 6.34 0.00 0.00 0.00 1.58
T6 0.53 1.84 0.53 0.26 0.79 0.00
T7 0.58 0.00 0.00 2.92 2.92 0.58
T8 0.00 1.00 1.00 0.00 0.00 3.00
The initial Term x Doc matrix
(Inverted Index)
Documents represented as vectors of words
tf x idf Term x Doc matrix
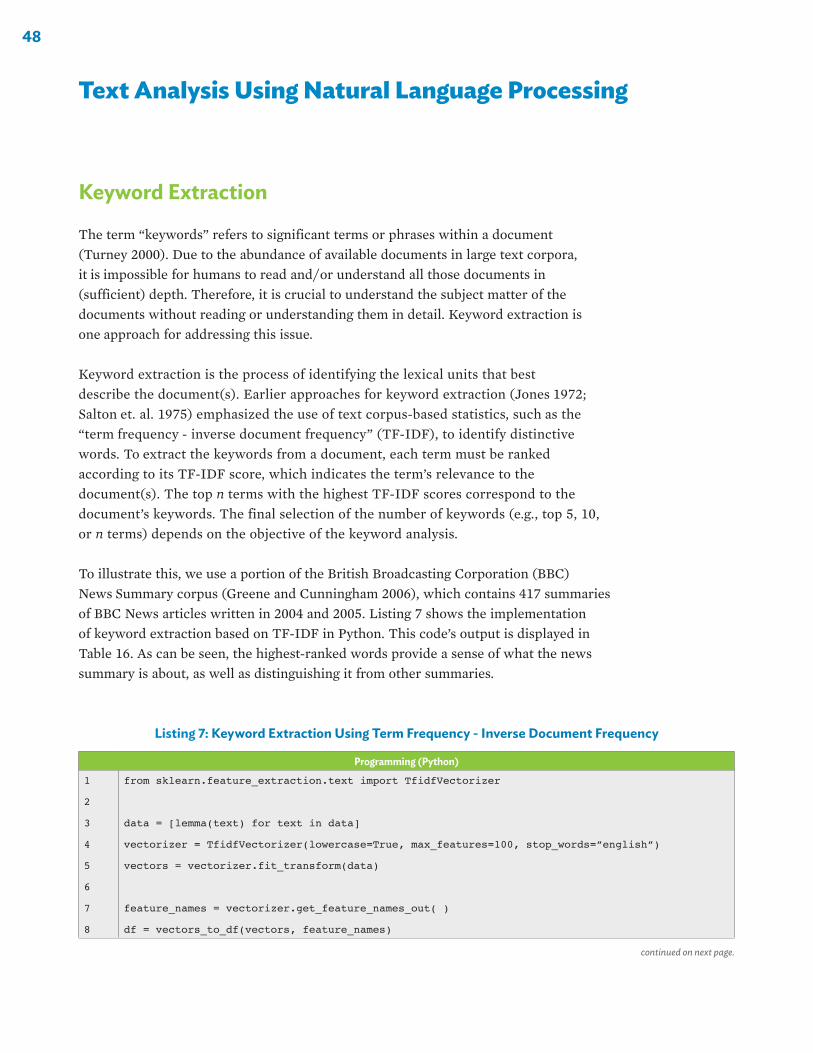
48
Keyword Extraction
The term “keywords” refers to significant terms or phrases within a document (Turney 2000). Due to the abundance of available documents in large text corpora, it is impossible for humans to read and/or understand all those documents in (sufficient) depth. Therefore, it is crucial to understand the subject matter of the documents without reading or understanding them in detail. Keyword extraction is one approach for addressing this issue.
Keyword extraction is the process of identifying the lexical units that best describe the document(s). Earlier approaches for keyword extraction (Jones 1972; Salton et. al. 1975) emphasized the use of text corpus-based statistics, such as the “term frequency - inverse document frequency” (TF-IDF), to identify distinctive words. To extract the keywords from a document, each term must be ranked according to its TF-IDF score, which indicates the term’s relevance to the document(s). The top n terms with the highest TF-IDF scores correspond to the document’s keywords. The final selection of the number of keywords (e.g., top 5, 10, or n terms) depends on the objective of the keyword analysis.
To illustrate this, we use a portion of the British Broadcasting Corporation (BBC) News Summary corpus (Greene and Cunningham 2006), which contains 417 summaries of BBC News articles written in 2004 and 2005. Listing 7 shows the implementation of keyword extraction based on TF-IDF in Python. This code’s output is displayed in Table 16. As can be seen, the highest-ranked words provide a sense of what the news summary is about, as well as distinguishing it from other summaries.
Text Analysis Using Natural Language Processing
Listing 7: Keyword Extraction Using Term Frequency - Inverse Document Frequency
Programming (Python)
1
2
3
4
5
6
7
8
from sklearn.feature_extraction.text import TfidfVectorizer
data = [lemma(text) for text in data]
vectorizer = TfidfVectorizer(lowercase=True, max_features=100, stop_words=”english”)
vectors = vectorizer.fit_transform(data)
feature_names = vectorizer.get_feature_names_out( )
df = vectors_to_df(vectors, feature_names)
continued on next page.

49Text Analysis Using Natural Language Processing
Description
(Line 1) Including (import) the class TfidfVectorizer from the library sklearn for feature extraction from the text.
(Line 3) Performing lemmatization on each text in variable data, where data is a list of texts, using a custom function lemma. Python’s list comprehension is used for faster processing of the loop.
(Line 4) Creating an instance of TfidfVectorizer named vectorizer, with the following parameters: lowercase (performing lowercasing on the text data), max_features (maximum number of feature names to be generated), and stop_words (English stop words or a list of stop words to be used). This is done to gain access to the different functions that can be used in dealing with vectorizing texts.
(Line 5) Learning the vocabulary and inverse document frequency (IDF) by passing variable data from (Line 3) to the function fit_transform that is accessible through variable vectorizer, where this returns a document-term matrix and stored in variable vectors.
(Line 7) Retrieving the list of generated feature names or important keywords using the function get_feature_names_out that is accessible through variable vectorizer.
(Line 8) Converting the vectors and feature names into a pandas DataFrame format using a custom function vectors_to_df by passing both variable vectors and feature_names into the function, and storing the resulting DataFrame in variable df.
NOTES:
custom function – user-defined function (a function that is created by the developer to perform a specific task).
Source: Methodology of the study team for the special supplement to Key Indicators for Asia and the Pacific 2022.
Listing 7 continued.
Table 16: Output of Code for Keyword Extraction Using Term Frequency - Inverse Document Frequency
TF-IDF Rank Document 1 Document 2 Document 3 Document 4 Document 5
1 network critical virus gadget google
2 irrigation flaw christmas mobile autolink
3 project leave zafi list user
4 saldarriaga security mail phone feature
5 centre hole infected th service
6 peru fix language laptop magazine
7 organisation microsoft line include choose
8 vital important subject device website
9 huaral pc translate position use
… ... … … … …
TD-IDF = term frequency - inverse document frequency.Note: The output shows how top-ranked words based on TF-IDF can be the basis in determining keywords in a document.Source: Methodology of the study team for the special supplement to Key Indicators for Asia and the Pacific 2022.
There are two limitations when using TF-IDF for keyword extraction. First, keywords are restricted to single-word entries. Single words are frequently used in a variety of contexts. For example, the keyword “code” may refer to “source code”, “zip code”, or “civil code”. While the other keywords in the document may disambiguate a word, it would be advantageous to extract key phrases related to “code” as well. The second limitation of keyword extraction using TF-IDF is that it cannot operate on single documents. The algorithm assumes the corpus consists of multiple documents and the keywords of each document can be determined based on the co-occurrence of words across all the documents.

50 Mapping the Public Voice for Development—Natural Language Processing of Social Media Text Data
Using “n-grams” rather than single words in the term-document matrix is a solution to the limitation of single-word keywords. An n-gram is a continuous sequence of n items in a corpus. Table 17 shows an example for the various types of n-grams for “the quick brown fox.” In calculating the TF-IDF of a 2-gram (or bigram), the term frequency would consider the number of occurrences of a particular bigram (e.g., “the quick”) in the corpus. The IDF is the inverse of the number of documents in which the same bigram (“the quick”) appeared. The use of n-grams is limited by the assumption that all potential key phrases will contain the same number of terms.
Rapid automatic keyword extraction (RAKE) as proposed by Rose et al. (2010) addresses the two limitations of TF-IDF in keyword extraction, namely keywords being only single-word entries and the inability to identify keywords on just a single document. RAKE also does not require the removal of stop words because it uses stop words and phrase delimiters to identify the most pertinent words and phrases in a text. RAKE follows a four-step procedure:
Step 1: The list of candidate keywords is generated by slicing a document into contiguous words separated by stop words. Figure 9 shows a sample document along with its candidate keywords.
Figure 9: Candidate Keywords Extracted from the Source Using Stop Words as Delimiters
Source: S. Rose, D. Engel, N. Cramer, and W. Cowley. 2010. Automatic Keyword Extraction from Individual Documents. Text Mining: Applications and Theory. 1. pp. 1–20.
source
candidate keywords
Compatibility of systems of linear constraints over the set of natural numbers
Criteria of compatibility of a system of linear Diophantine equations, strict inequations, and nonstrict inequations are considered. Upper bounds for components of a minimal set of solutions and algorithms of construction of minimal generating sets of solutions for all types of systems are given. These criteria and the corresponding algorithms for constructing a minimal supporting set of solutions can be used in solving all the considered types of systems and systems of mixed types.
Compatibility - systems - linear constraints - set - natural numbers - Criteria - compatibility - system - linear Diophantine equations - strict inequations - nonstrict inequations - Upper bounds - components - minimal set - solutions - algorithms - minimal generating sets - solutions - systems - criteria - corresponding algorithms - constructing - minimal supporting set - solving - systems - systems
Table 17: “n-grams” from the Line “the quick brown fox”
Type of n-gram n-gram Values
1-gram or unigram the, quick, brown, fox
2-gram or bigram the quick, quick brown, brown fox
3-gram or trigram the quick brown, quick brown fox
4-gram the quick brown fox
Note: n = 1, 2, 3, 4.Source: Methodology of the study team for the special supplement to Key Indicators for Asia and the Pacific 2022.

51Text Analysis Using Natural Language Processing
Step 2: The word co-occurrence graph for content words is generated to calculate candidate keyword scores. In addition to the term frequency freq(w) of a word, the degree deg(w) is derived from the word co-occurrence graph as the sum of the word’s row or column. deg(w) favors frequent and lengthy candidate keyword occurrences. freq(w) favors frequently occurring words regardless of the number of co-occurring words. deg(w)/freq(w) favors words that occur most frequently in longer candidate keywords. The candidate keyword score is then calculated as the sum of the freq(w) + deg(w) + freq(w)/deg(w). Figure 10 shows the process of calculating the candidate keyword score.
algo
rithm
sbo
unds
com
patib
ility
com
pone
nts
cons
train
tsco
nstr
uctin
gco
rresp
ondi
ngcr
iteria
diop
hant
ine
equa
tions
gene
ratin
gin
equa
tions
linea
rm
inim
alna
tura
lno
nstr
ict
num
bers
set
sets
solv
ing
stric
tsu
ppor
ting
syst
emsy
stem
sup
per
algorithms 2 1bounds 1 1
compatibility 2components 1
constraints 1 1constructing 1
corresponding 1 1criteria 2
diophantine 1 1 1equations 1 1 1
generating 1 1 1inequations 2 1 1
linear 1 1 1 2 1minimal 1 3 2 1natural 1 1
nonstrict 1 1numbers 1 1
set 2 3 1sets 1 1 1
solving 1strict 1
supporting 1 1 1system 1
systems 4upper 1 1
Candidate Keyword
score = freq(w) + deg(w) + deg(w)/freq(w)
minimal generating sets 8.7linear diophantine equations 8.5
minimal supporting set 7.7minimal set 4.7
linear constraints 4.5natural numbers 4
strict inequations 4nonstrict i nequations 4
upper bounds 4corresponding algorithms 3.5
set 2algorithms 1.5
compatibility 1systems 1criteria 1system 1
components 1constructing 1
solving 1
algo
rithm
sbo
unds
com
patib
ility
com
pone
nts
cons
train
tsco
nstr
uctin
gco
rresp
ondi
ngcr
iteria
diop
hant
ine
equa
tions
gene
ratin
gin
equa
tions
linea
rm
inim
alna
tura
lno
nstr
ict
num
bers
set
sets
solv
ing
stric
tsu
ppor
ting
syst
emsy
stem
sup
per
deg(w) 3 2 2 1 2 1 2 2 3 3 3 4 5 8 2 2 2 6 3 1 2 3 1 4 2freq(w) 2 1 2 1 1 1 1 2 1 1 1 2 2 3 1 1 1 4 1 1 1 1 1 4 1
deg(w)/freq(w) 1.5 2 1 1 2 1 2 1 3 3 3 2 2.52.7 2 2 2 2 3 1 2 3 1 1 2
Word co-occurrence graph
Figure 10: Word Co-occurrence Graph Showing the Calculation of the Candidate Keyword Score
Note: freq(w) is the term frequency of the word w. deg(w) is derived from the word co-occurrence graph as the sum of the word’s row or column.Source: S. Rose, D. Engel, N. Cramer, and W. Cowley. 2010. Automatic Keyword Extraction from Individual Documents. Text Mining: Applications and Theory. 1. pp. 1–20.

52 Mapping the Public Voice for Development—Natural Language Processing of Social Media Text Data
Step 3: The candidate keyword pairs are examined to determine if they are adjacent at least twice in the same document and in the same order. If so, a new candidate keyword is created by combining those keywords with the stop words found within them. The keyword score for the new candidate keyword is the sum of the scores of its constituent keywords.
Step 4: The candidates with the top n keyword scores are selected as keywords for the document, where n is one-third the number of words in the word co- occurrence graph based on the suggestion of Mihalcea and Tarau (2004). Table 18 shows the resulting keywords from the sample source in Figure 10.
Listing 8 shows the implementation for extracting keywords using RAKE in Python. Using a portion of the BBC News Summary corpus (Greene and Cunningham 2006), the extracted keywords are seen in Table 19, which can be compared to the keywords extracted via TF-IDF in Table 16.
Table 18: Keywords Extracted from the Source Based on Rapid Automatic Keyword Extraction
Extracted by RAKE
minimal generating sets
linear diophantine equations
minimal supporting set
minimal set
linear constraints
natural numbers
strict inequations
nonstrict inequations
upper bounds
RAKE = rapid automatic keyword extraction.Source: S. Rose, D. Engel, N. Cramer, and W. Cowley. 2010. Automatic Keyword Extraction from Individual Documents. Text Mining: Applications and Theory. 1. pp. 1–20.
Listing 8: Keyword Extraction Using Rapid Automatic Keyword Extraction
Programming (Python)
1
2
3
4
5
6
7
from rake_nltk import Rake
text = lemma(text)
r = Rake(include_repeated_phrases=False)
r.extract_keywords_from_text(text)
phrases_rank = r.get_ranked_phrases( )
continued on next page.

53Text Analysis Using Natural Language Processing
Description
(Line 1) Including (import) the class Rake from the library rake_nltk.
(Line 3) Performing lemmatization on variable text, which is a string, using a custom function lemma.
(Line 5) Creating an instance of Rake named r, with the parameter include_repeated_phrases (include all phrases only once).
(Line 6) Using Rake to extract the keywords or phrases from variable text by passing text into the function extract_keywords_from_text that is accessible through r.
(Line 7) Retrieving the extracted keywords or phrases using the function get_ranked_phrases that is also accessible through variable r, and storing them in variable phrases_rank.
Source: Methodology of the study team for the special supplement to Key Indicators for Asia and the Pacific 2022.
Listing 8 continued.
Table 19: Extracted Keywords Using Rapid Automatic Keyword Extraction on the British Broadcasting Corporation News Summary Corpus
RAKE phrase rank Document 1 Document 2 Document 3 Document 4 Document 5
1 chancay huaral valley also provide vital link
could leave pc open virus subject line say merry christmas
first flash mp player diamound multimedia
unique isbn number would link directly
2 system say carlos saldarriaga technical coordinator
eight critical security hole
anti virus firm sophos say
first successful digital camera casio qv
user search engine firm google
3 person receive infected e mail
monthly security bulletin
person receive infected e mail
pulsar quartz digital watch th
commercial site google say none
4 network self sustainable within three year
hole consider critical original zafi virus appear
less partisan publication would tell want
modify mr doctorow say
5 information network also allow farmer
warn pc user virus security firm interesting list psion organiser series
re select commercial website
6 flagship huaral org website
windows program one disable anti virus th position also many might
beta ie trial stage stone
7 community computer centre link
leave unpatched often
e mail currently tivo personal video recorder
user say autolink would
8 chancay huaral valley late security fix e mail address modern transportation system would
statement google say
9 ay mr saldarriaga critical patch microsoft
electronic christmas card
current high tech obsession
isbn number
… … … … … …
RAKE = rapid automatic keyword extraction.Source: Methodology of the study team for the special supplement to Key Indicators for Asia and the Pacific 2022.
Document Clustering Using “k-means”
One method for organizing a collection of documents is “clustering,” i.e., grouping the documents so that those in the same cluster are more similar to one another than documents in another cluster. “k-means” is one of the most popular machine-learning algorithms for document clustering (Mohamad and Usman 2013). k-means method aims to divide n observations (in this case, documents) into k clusters with each observation

54 Mapping the Public Voice for Development—Natural Language Processing of Social Media Text Data
assigned to the cluster comprising the nearest mean (i.e., the centroid). The k-means algorithm is based on the concept that clusters will be defined by k centroids, where each centroid represents the cluster’s center. The objective of k-means clustering is to identify these k clusters and their centers, while minimizing the within-cluster variation or total error.
Given an initial set of k centroids, the k-means algorithm employs a two-step iterative refinement technique.
(i) The first step is the “assignment”, where each document vector is assigned to the cluster with the closest centroid based on the shortest squared Euclidean distance.7
(ii) The second step is the “update”, where the centroids of each cluster are recalculated to move to the center of the assigned documents.
The k-means algorithm has converged or completed when the assignments no longer change.
Figure 11 illustrates a two-cluster k-means simulation, whereby the clusters are distinguished by the color and the current centroid is indicated by the starburst. In the first round, each data point is assigned to the centroid that is closest to it, then a centroid
7 Other distance measures can be used such as, but not limited to, Hamming distance, Manhattan distance, and Minkowski distance.
Figure 11: Two-Cluster “k-means” Simulation
Note: Clusters are distinguished by color and centroids are marked by starbursts. Source: J. Page, Z. Liechty, M. Huynh, and J. Udall. 2014. BamBam: Genome Sequence Analysis Tools for Biologists. BMC Research Notes. 7 (829). https://doi.org/10.1186/1756-0500-7-829.
Initial Seeding After Round 1
After Round 2 Final

55Text Analysis Using Natural Language Processing
is selected for each cluster based on the mean of all points in that cluster. As a result, the blue centroid shifts to the right after Round 1. In the second round, both centroids move to the new location, resulting in a division that is more accurate. Following two iterations, the clusters have reached a steady state and would not change regardless of the number of iterations performed.
k-means clustering can use different document clustering implementations, such as Euclidean distance and cosine similarity.8 Listing 9 shows the implementation for sklearn’s k-means clustering using Euclidean distance in Python. It takes as input the feature vectors generated by TF-IDF vectorization.
The k-means algorithm requires the user to specify the number of clusters (k). The Elbow Method and the Silhouette Method are the two most common techniques to specify k and these two methods are regularly combined.
In the Elbow Method, the proportion of explained variance is evaluated based on the number of clusters (k). This method employs the total within-cluster sum of squares (WSS) as a function of k. The WSS is a measure of the document variability
8 Other similarity algorithms include, but not limited to, the Jaccard Similarity Coefficient, Latent Semantic Indexing, and the different distance measures.
Listing 9: Document Clustering Using the “k-means” Algorithm
Programming (Python)
1
2
3
4
5
6
from sklearn.cluster import KMeans
model = Kmeans(n_cluster=true_k, init=”k-means++”, max_iter=100, n_init=1,
random_state=20)
model.fit(vectors)
order_centroids = model.cluster_centers_.argsort()[:, ::–1]
terms = vectorizer.get_feature_names_out()
Description
(Line 1) Including (import) the class KMeans from the library sklearn.
(Line 3) Creating an instance of KMeans named model, with the following parameters: n_cluster (number of clusteres, where true_k is the optimal number of clusters), init (initializatin method, uses “k-means++” to select initial cluster centers to speed up convergence), max_iter (number of iterations of the k-means algorithm), n_init (number of times the k-means algorithm will be run with different centroid seeds), and random_state (seed for reproducibility).
(Line 4) Computing for the k-means clustering by passing a vector (vectors) into the function fit that is accessible through variable model.
(Line 5) Getting the arithmetic mean of all points belonging to the clusters using the attribute cluster_centers_ that is accessible through variable model, and sorting them with the function argsort, before storing them in variable order_centroids.
(Line 6) Retrieving and storing the generated feature names or important keywords using the function get_feature_names_out that is accessible through variable vectorizer, which is an instance of TfidfVectorizer, and storing them in variable terms.
Source: Methodology of the study team for the special supplement to Key Indicators for Asia and the Pacific 2022.

56 Mapping the Public Voice for Development—Natural Language Processing of Social Media Text Data
within each cluster, i.e., how spread out the cluster is. A cluster with a small sum of squares is typically more compact than one with a large sum of squares. The greater the k, the smaller the WSS, because clusters that are more spread out can be divided into more clusters to get greater compactness. The optimal k is the value at which an additional k leads to an increase, or an insignificant decrease, in WSS. In the WSS- versus-k graph, k appears as a bend in the graph, explaining the name, i.e., “elbow” (Thorndike 1953). Listing 10 shows the implementation to calculate the WSS and generate the WSS-versus-k plot in Python. Figure 12 shows the resulting graph with an elbow, indicating that the optimal k is 9.
Listing 10: Calculation of the Within-Cluster Sum of Squares and Generation of the Within-Cluster Sum of Squares versus “k” Graph
Programming (Python)
1
2
3
4
5
6
7
8
9
10
11
from sklearn.cluster import KMeans
from kneed import KneeLocator
ssd = []
for k in range(2, max_k+1):
kmeans = Kmeans(n_clusters=k, random_state=20)
kmeans.fit(vectors)
ssd.append(kmeans.inertia_)
kl = KneeLocator(x=range(2, max_k+1), y=ssd, curve=”convex”, direction=”decreasing”)
elbow = kl.elbow
Description
(Line 1) Including (import) the class KMeans from the library sklearn.
(Line 2) Including (import) the class KneeLocator from the library kneed.
(Line 4) Creating an empty list named ssd to store the sum of squared distances.
(Line 5) Using a for loop to simulate different values of k, which represents the number of clusters. Python’s built-in function range is used to generate number series, where two arguments: the minimum number (inclusive) and the maximum number (exclusive), are passed into the function. In addition, max_k is the maximum number of clusters, and the +1 is used to ensure that max_k is included in the generated number series.
(Line 6) Creating an instance of KMeans named kmeans, by using k from (Line 5) as the value for the parameter n_clusters (the number of clusters to form), and any integer value for the parameter random_state (seed for reproducibility).
(Line 7) Computing for the k-means clustering by passing a vector (vectors) into the function fit that is accessible through variable kmeans (Line 6).
(Line 8) Retrieving the sum of squared distance value from the attribute inertia_ that is accessible through variable kmeans from (Line 6), and adding it to the list of sum of squared distances (ssd) using Python’s list function append.
(Line 10) Creating an instance of KneeLocator named kl to determine the elbow with the following parameters: x (the number of clusters to simulate), y (ssd values), curve (using “convex” to detect elbow), and direction (the line direction).
(Line 11) Retrieving the elbow value through the attribute elbow that is accessible through variable kl from (Line 10).
Source: Methodology of the study team for the special supplement to Key Indicators for Asia and the Pacific 2022.

57Text Analysis Using Natural Language Processing
If the data are not properly clustered, the elbow may not appear as clearly on the graph. In such ambiguous situations, the Silhouette Method can be employed. The Silhouette value is an internal evaluation metric that measures how closely a data instance matches the data within its cluster (cohesion) and how loosely it matches the data of neighboring clusters (separation).9 The Silhouette Method calculates the average silhouette for the entire sample for each value of k. The optimal number of clusters, k, is determined by the value that maximizes the average silhouette across a range of possible values for k (Kaufman and Rousseau 1990). A high Silhouette value is desired as it indicates that the data point has been positioned within the correct cluster. If a large number of data points have low Silhouette values, this may indicate that too few or too many clusters were created. Listing 11 shows the implementation to generate the Silhouette-versus-k plot in Python, while Figure 13 shows the resulting graph with a peak at k = 10.
9 The Silhouette score is calculated as (b-a)/max(a,b) where a is the average intracluster distance (or the average distance between each point within a cluster) and b is the average intercluster distance (or the average distance between all clusters).
Figure 12: Within-Cluster Sum of Squares versus “k” Graph to Find the Elbow
Source: Calculations of the study team for the special supplement to Key Indicators for Asia and the Pacific 2022.
Elbow Method for Optimal k Silhouette Analysis for Optimal k
Number of clusters Values of k
9,000
0.16
0.14
0.12
0.10
0.08
8,500
8,000
7,5002 3 4 5 6 7 8 9 10 11 12 13 2 4 6 8 10 123 5 7 9 11 13
SSD
Silh
ouet
te sc
ore

58 Mapping the Public Voice for Development—Natural Language Processing of Social Media Text Data
Listing 11: Calculation of the Silhouette Value and Generation of the Silhouette versus “k” Graph
Programming (Python)
1
2
3
4
5
6
7
8
9
10
11
12
13
14
15
16
17
from sklearn.cluster import KMeans
from sklearn.metrics import silhouette_score
import matplotlib.pyplot as plt
silhouette_avg = [ ]
for k in range(2, max_k+1):
kmeans = KMeans(n_clusters=k, random_state=20)
kmeans.fit(vectors)
cluster_labels = kmeans.labels_
score = silhouette_score(vectors, cluster_labels)
silhouette_avg.append(score)
plt.plot(x=range(2, max_k+1), y=silhouette_avg, marker=’bx-’)
plt.xlabel(‘Values of K’)
plt.ylabel(‘Silhouette score’)
plt.title(‘Silhouette analysis For Optimal k’)
plt.show( )
Description
(Line 1) Including (import) the class KMeans from the library sklearn.
(Line 2) Including (import) the metric silhouette_score from the library sklearn.
(Line 3) Including (import) the module pyplot from the library matplotlib as plt.
(Line 5) Creating an empty list named silhouette_avg to store silhouette average scores.
(Line 6) Using a for loop to simulate different values of k, which represents the number of clusters. Python’s built-in function range is used to generate number series, where two arguments: the minimum number (inclusive) and the maximum number (exclusive), are passed into the function. In addition, max_k is represents the maximum number of clusters, and the +1 is used to ensure that max_k is included in the generated number series.
(Line 7) Creating an instance of KMeans named kmeans, by using variable k from (Line 6) as the value for the parameter n_clusters (the number of clusters to form), and any integer value for the parameter random_state (seed for reproducibility).
(Line 8) Computing for the k-means clustering by passing a vector (vectors) into the function fit that is accessible through variable kmeans from (Line 7).
(Line 9) Retrieving the cluster labels of each point from the attribute labels_ that is accessible through variable kmeans from (Line 7), and storing it in variable cluster_labels.
(Line 10) Computing the silhouette score using the function silhouette_score from (Line 2), by passing a vector (vectors) and the cluster labels (cluster_labels), and storing the result in variable score.
(Line 11) Adding the computed silhouette score (score) to the list of silhouette average scores (silhouette_avg) using Python’s list function append.
(Line 13) Plotting the silhouette_avg using the function plot that is accessible from plt in (Line 3), with the following parameters: x (list of number of clusters to simulate), y (silhouette_avg values), and marker (a symbol to represent each point on the plot). The list of number of clusters to simulate is obtained using Python’s built-in function range, with the same configuration as (Line 6).
(Line 14) Setting the label of x-axis using the function xlabel that is accessible from plt in (Line 3).
(Line 15) Setting the label of y-axis using the function ylabel that is accessible from plt in (Line 3).
(Line 16) Setting the title of the plot using the function title that is accessible from plt in (Line 3).
(Line 17) Displaying the plot using the function show that is accessible from plt in (Line 3).
Source: Methodology of the study team for the special supplement to Key Indicators for Asia and the Pacific 2022.
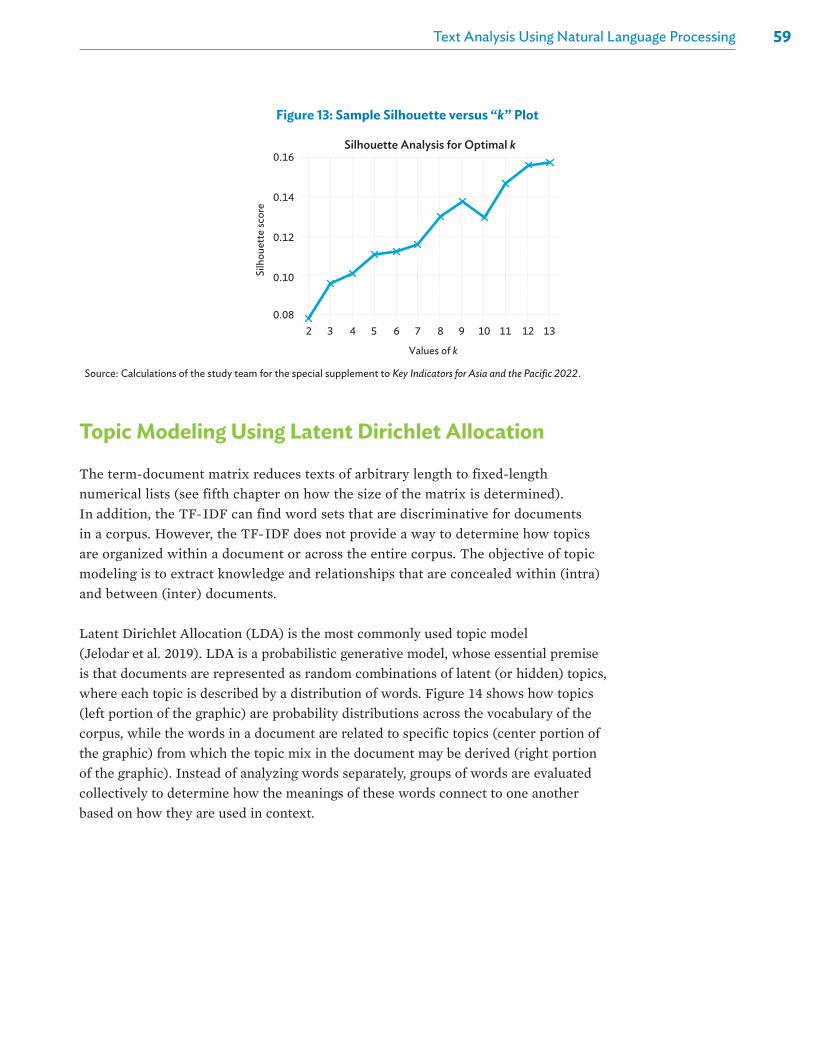
59Text Analysis Using Natural Language Processing
Topic Modeling Using Latent Dirichlet Allocation
The term-document matrix reduces texts of arbitrary length to fixed-length numerical lists (see fifth chapter on how the size of the matrix is determined). In addition, the TF- IDF can find word sets that are discriminative for documents in a corpus. However, the TF- IDF does not provide a way to determine how topics are organized within a document or across the entire corpus. The objective of topic modeling is to extract knowledge and relationships that are concealed within (intra) and between (inter) documents.
Latent Dirichlet Allocation (LDA) is the most commonly used topic model (Jelodar et al. 2019). LDA is a probabilistic generative model, whose essential premise is that documents are represented as random combinations of latent (or hidden) topics, where each topic is described by a distribution of words. Figure 14 shows how topics (left portion of the graphic) are probability distributions across the vocabulary of the corpus, while the words in a document are related to specific topics (center portion of the graphic) from which the topic mix in the document may be derived (right portion of the graphic). Instead of analyzing words separately, groups of words are evaluated collectively to determine how the meanings of these words connect to one another based on how they are used in context.
Figure 13: Sample Silhouette versus “k” Plot
Source: Calculations of the study team for the special supplement to Key Indicators for Asia and the Pacific 2022.
Elbow Method for Optimal k Silhouette Analysis for Optimal k
Number of clusters Values of k
9,000
0.16
0.14
0.12
0.10
0.08
8,500
8,000
7,5002 3 4 5 6 7 8 9 10 11 12 13 2 4 6 8 10 123 5 7 9 11 13
SSD
Silh
ouet
te sc
ore

60 Mapping the Public Voice for Development—Natural Language Processing of Social Media Text Data
Figure 15 shows the LDA parameters and their dependencies. For each document to be modeled by LDA, four initial stages are performed after data preparation, including stop word removal. First, the document’s total word count is determined. Second, a topic mixture for the document is selected from a fixed set of topics. Third, a topic is chosen based on the multinomial distribution of the document. Finally, a word is selected based on the multinomial distribution of the topic.
Figure 15: Graphical Notation of Latent Dirichlet Allocation Showing the Dependencies Among Model Parameters
Source: D.M. Blei, A.Y. Ng, and M.I. Jordan. 2003. Latent Dirichlet Allocation. Journal of Machine Learning Research. 3. pp. 993-1,022.
α:β:z::
M:N:w:
the parameter that controls per document topic distributionthe parameter that controls per topic word distributionthe latent topic assigned to a wordthe topic distribution in the corpusthe total documents in the corpusthe number of words in the documentthe word in a document
θθ
β
α z wN
M
Figure 14: Key Concept of Latent Dirichlet Allocation
Note: Documents are represented as mixtures of topics, where each topic is characterized by a distribution over words.Source: D.M. Blei. 2012. Probabilistic Topic Models. Communications of the ACM. 55 (4). pp. 77–84. https://doi.org/10.1145/2133806.2133826.
DocumentsTopics Topic proportionsand assignments

61Text Analysis Using Natural Language Processing
LDA is an iterative process. Each word in each document is randomly assigned to one of the topics t in the initial iteration. Except for the present word, all topic assignments are presumed to be accurate. Thus, LDA attempts to correct and adjust the current word’s topic assignment with a new assignment. Consequently, it iterates across every document d and every word w. The proportion of words in document d that are currently assigned to topic t is equal to p(topic t | document d), whereas the proportion of word w assignments to topic t across all documents is equal to p(word w | topic t). These two proportions are multiplied and assigned a new topic based on that probability. A large number of LDA iterations are conducted to select the new topic k until a steady state is reached. When the LDA convergence point is reached, topic and word distributions can be generated over the corpus.
Topic models can be assessed on topic coherence.10 Topic coherence assesses the semantic similarity between a topic’s highest-scoring words. Listing 12 shows the implementation of LDA with predefined functions, gensim, for calculating topic coherence in Python. A baseline coherence score is important in tuning the LDA model because it can be used to find the optimal set of parameters, which are the number of topics (k), the document-topic distribution (alpha), and the topic-word distribution (eta). Many LDA implementations, such as gensim’s LDA model, include predefined strategies for the selection of the document-topic distribution (alpha) and the topic- word distribution (eta), however the contents of the corpus and the number of relevant topics k are unknown prior to processing (Zhao, Zou, and Chen 2014). That is why LDA model development can be time-consuming, as it necessitates an iterative, systematic, and subjective comparison of various models in order to find the best set of model parameters. To determine the best k (number of topics), the coherence scores for a range of k values are compared.
LDA produces two outputs: the distribution of words per topic and the distribution of topics across the entire corpus. Table 20 shows a portion of the topic model developed in Soriano et al. (2016), where the distributions are based on Twitter posts gathered in 2013–2014 regarding Typhoon Haiyan in the Philippines. Each topic is represented by a collection of words, whose weightings are based on their distribution over the topic.
10 Perplexity is another evaluation metric to assess topic models. It measures how likely a model is to represent fresh, unexplored data.
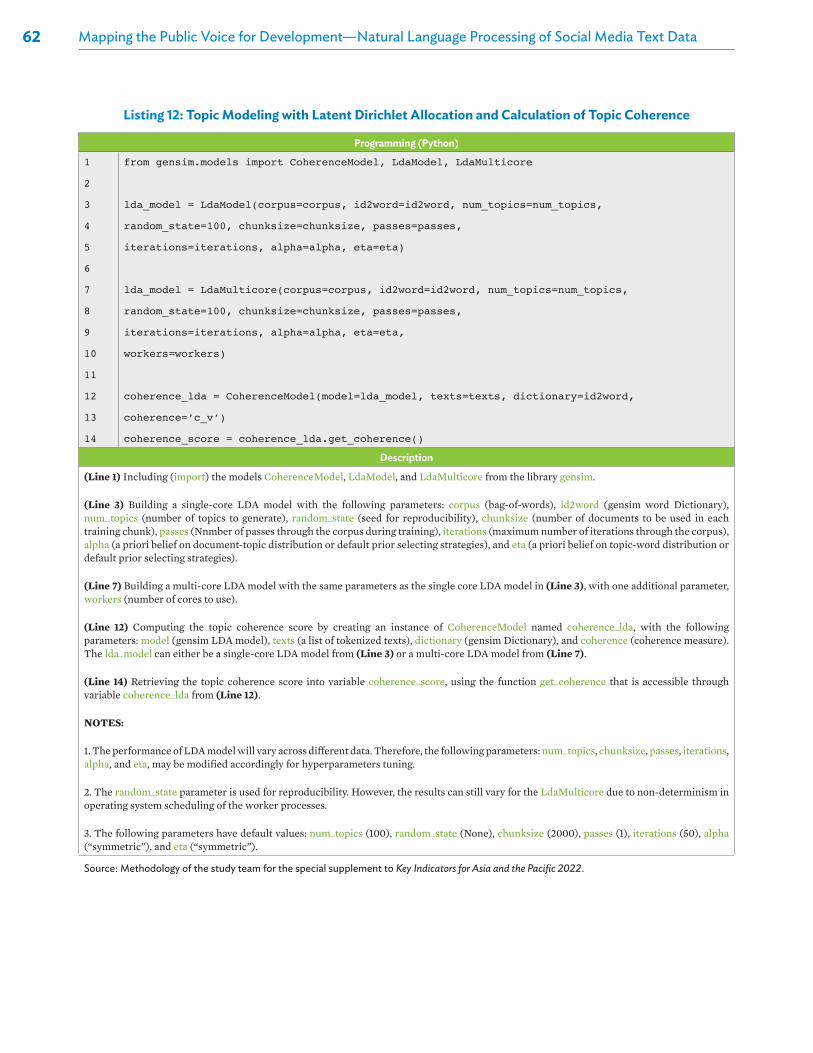
62 Mapping the Public Voice for Development—Natural Language Processing of Social Media Text Data
Listing 12: Topic Modeling with Latent Dirichlet Allocation and Calculation of Topic Coherence
Programming (Python)
1
2
3
4
5
6
7
8
9
10
11
12
13
14
from gensim.models import CoherenceModel, LdaModel, LdaMulticore
lda_model = LdaModel(corpus=corpus, id2word=id2word, num_topics=num_topics,
random_state=100, chunksize=chunksize, passes=passes,
iterations=iterations, alpha=alpha, eta=eta)
lda_model = LdaMulticore(corpus=corpus, id2word=id2word, num_topics=num_topics,
random_state=100, chunksize=chunksize, passes=passes,
iterations=iterations, alpha=alpha, eta=eta,
workers=workers)
coherence_lda = CoherenceModel(model=lda_model, texts=texts, dictionary=id2word,
coherence=’c_v’)
coherence_score = coherence_lda.get_coherence()
Description
(Line 1) Including (import) the models CoherenceModel, LdaModel, and LdaMulticore from the library gensim.
(Line 3) Building a single-core LDA model with the following parameters: corpus (bag-of-words), id2word (gensim word Dictionary), num_ topics (number of topics to generate), random_state (seed for reproducibility), chunksize (number of documents to be used in each training chunk), passes (Nnmber of passes through the corpus during training), iterations (maximum number of iterations through the corpus), alpha (a priori belief on document-topic distribution or default prior selecting strategies), and eta (a priori belief on topic-word distribution or default prior selecting strategies).
(Line 7) Building a multi-core LDA model with the same parameters as the single core LDA model in (Line 3), with one additional parameter, workers (number of cores to use).
(Line 12) Computing the topic coherence score by creating an instance of CoherenceModel named coherence_lda, with the following parameters: model (gensim LDA model), texts (a list of tokenized texts), dictionary (gensim Dictionary), and coherence (coherence measure). The lda_model can either be a single-core LDA model from (Line 3) or a multi-core LDA model from (Line 7).
(Line 14) Retrieving the topic coherence score into variable coherence_score, using the function get_coherence that is accessible through variable coherence_lda from (Line 12).
NOTES:
1. The performance of LDA model will vary across different data. Therefore, the following parameters: num_topics, chunksize, passes, iterations, alpha, and eta, may be modified accordingly for hyperparameters tuning.
2. The random_state parameter is used for reproducibility. However, the results can still vary for the LdaMulticore due to non-determinism in operating system scheduling of the worker processes.
3. The following parameters have default values: num_topics (100), random_state (None), chunksize (2000), passes (1), iterations (50), alpha (“symmetric”), and eta (“symmetric”).
Source: Methodology of the study team for the special supplement to Key Indicators for Asia and the Pacific 2022.
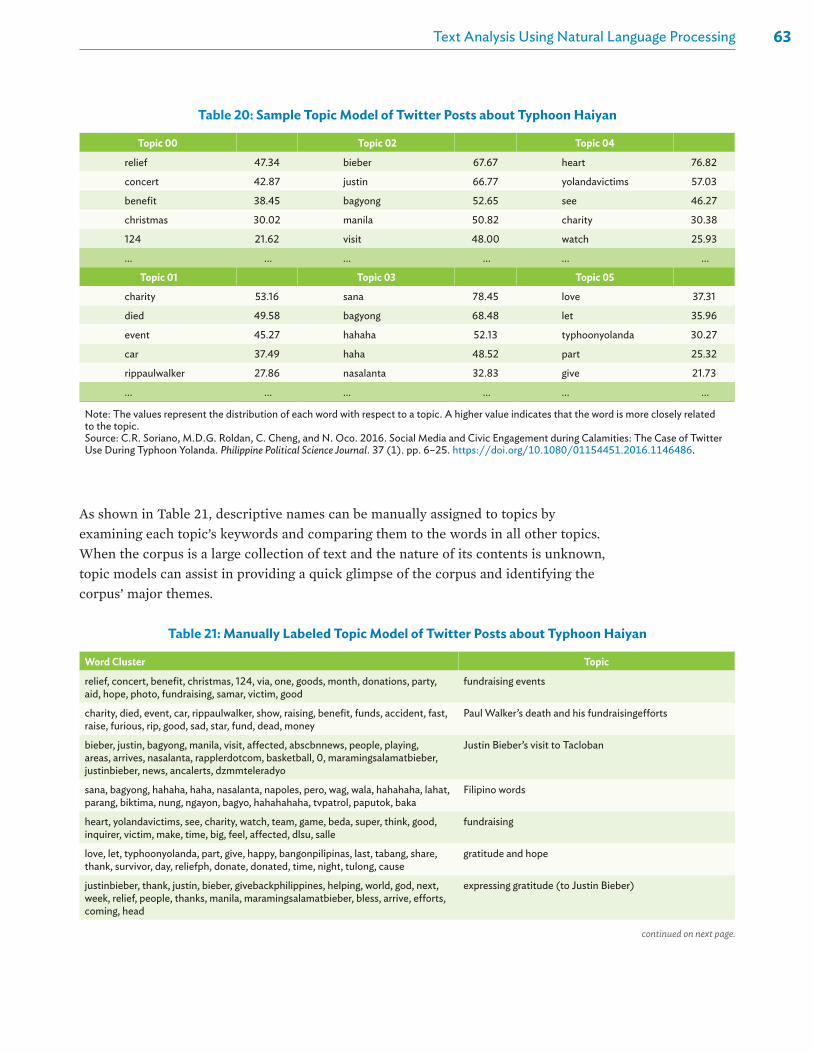
63Text Analysis Using Natural Language Processing
As shown in Table 21, descriptive names can be manually assigned to topics by examining each topic’s keywords and comparing them to the words in all other topics. When the corpus is a large collection of text and the nature of its contents is unknown, topic models can assist in providing a quick glimpse of the corpus and identifying the corpus’ major themes.
Table 20: Sample Topic Model of Twitter Posts about Typhoon Haiyan
Topic 00 Topic 02 Topic 04
relief 47.34 bieber 67.67 heart 76.82
concert 42.87 justin 66.77 yolandavictims 57.03
benefit 38.45 bagyong 52.65 see 46.27
christmas 30.02 manila 50.82 charity 30.38
124 21.62 visit 48.00 watch 25.93
… … … … … …
Topic 01 Topic 03 Topic 05
charity 53.16 sana 78.45 love 37.31
died 49.58 bagyong 68.48 let 35.96
event 45.27 hahaha 52.13 typhoonyolanda 30.27
car 37.49 haha 48.52 part 25.32
rippaulwalker 27.86 nasalanta 32.83 give 21.73
… … … … … …
Note: The values represent the distribution of each word with respect to a topic. A higher value indicates that the word is more closely related to the topic.Source: C.R. Soriano, M.D.G. Roldan, C. Cheng, and N. Oco. 2016. Social Media and Civic Engagement during Calamities: The Case of Twitter Use During Typhoon Yolanda. Philippine Political Science Journal. 37 (1). pp. 6–25. https://doi.org/10.1080/01154451.2016.1146486.
Table 21: Manually Labeled Topic Model of Twitter Posts about Typhoon Haiyan
Word Cluster Topic
relief, concert, benefit, christmas, 124, via, one, goods, month, donations, party, aid, hope, photo, fundraising, samar, victim, good
fundraising events
charity, died, event, car, rippaulwalker, show, raising, benefit, funds, accident, fast, raise, furious, rip, good, sad, star, fund, dead, money
Paul Walker’s death and his fundraisingefforts
bieber, justin, bagyong, manila, visit, affected, abscbnnews, people, playing, areas, arrives, nasalanta, rapplerdotcom, basketball, 0, maramingsalamatbieber, justinbieber, news, ancalerts, dzmmteleradyo
Justin Bieber’s visit to Tacloban
sana, bagyong, hahaha, haha, nasalanta, napoles, pero, wag, wala, hahahaha, lahat, parang, biktima, nung, ngayon, bagyo, hahahahaha, tvpatrol, paputok, baka
Filipino words
heart, yolandavictims, see, charity, watch, team, game, beda, super, think, good, inquirer, victim, make, time, big, feel, affected, dlsu, salle
fundraising
love, let, typhoonyolanda, part, give, happy, bangonpilipinas, last, tabang, share, thank, survivor, day, reliefph, donate, donated, time, night, tulong, cause
gratitude and hope
justinbieber, thank, justin, bieber, givebackphilippines, helping, world, god, next, week, relief, people, thanks, manila, maramingsalamatbieber, bless, arrive, efforts, coming, head
expressing gratitude (to Justin Bieber)
continued on next page.

64 Mapping the Public Voice for Development—Natural Language Processing of Social Media Text Data
Word Cluster Topic
walk, city, villamor, relief, worldwidewalk, iglesianicristo, inc, incworldwidewalk, volunteer, dswd, air, repacking, club, volunteers, center, worldwide, iglesia, world, cristo, base
fundraising (walk led by faith-based group Iglesia ni Kristo)
phl, rehab, efforts, death, toll, continue, super, ate, official, 6,190, school, dec, ancalerts, support, thanks, post-yolanda, watching, karen, ruins, starbucks
accounting for damage; gratitude
fastbreak2, benefitgame, allstars, basketball, themanansala, blue, eagle, gym, kieferravena, red, need, cross, leyte, hope, strong, real, believe, concert, nicoelorde
fundraising basketball game (initiated by a local university)
Source: C.R. Soriano, M.D.G. Roldan, C. Cheng, and N. Oco. 2016. Social Media and Civic Engagement during Calamities: The Case of Twitter Use During Typhoon Yolanda. Philippine Political Science Journal. 37 (1). pp. 6–25. https://doi.org/10.1080/01154451.2016.1146486.
Table 21 continued.
An additional output of LDA is the topic distribution within each document in the corpus. Table 22 shows a segment of the document-topic distribution of the topic model from (Soriano et al. 2016). As can be seen in Table 22, although each document may have numerous topics, there is often only one dominant topic. For instance, Document - 4036 has words from Topics 00 and 03, but its dominant topic is Topic 03 or “Justin Bieber’s visit to Tacloban” (from Table 21). Hence, a topic model’s document- topic distribution can be used to broadly classify or categorize individual documents, which can be useful for comparing documents within a corpus or analyzing the distribution of themes within the corpus.
Multiple strategies can be explored to effectively visualize the results of LDA. For instance, a line graph can show the document-word count distribution per topic. That line graph will show the size (in terms of number of words) of the documents that belong to each topic. Second, word clouds can also be used to depict the keywords of all the topics, with the size of the words proportional to their weighting or distribution) and colors can be used to differentiate topics. These word clouds can show the similarities and differences between the topics with respect to their keywords. Third, one may want to know the most-discussed topics in the corpus and this can be conveyed through charts that show the number of documents that belong to each topic. While it is possible to generate these visualizations from scratch, there are existing libraries for LDA model visualization such as the Python library pyLDAViz.
Table 22: Excerpt of the Document-Topic Distribution of the Topic Model of Twitter Posts about Typhoon Haiyan
Doc Id Topic 00 Topic 01 Topic 02 Topic 03 Topic 04 Topic 05 Topic 06 Topic 07 Topic 08 Topic 09
4036 0.11 0.00 0.00 0.89 0.00 0.00 0.00 0.00 0.00 0.00
4037 1.00 0.00 0.00 0.00 0.00 0.00 0.00 0.00 0.00 0.00
4043 0.00 0.00 0.71 0.29 0.00 0.00 0.00 0.00 0.00 0.00
4048 0.00 0.00 0.70 0.28 0.00 0.00 0.02 0.00 0.00 0.00
Doc Id = document identification.Source: C.R. Soriano, M.D.G. Roldan, C. Cheng, and N. Oco. 2016. Social Media and Civic Engagement during Calamities: The Case of Twitter Use During Typhoon Yolanda. Philippine Political Science Journal. 37 (1). pp. 6–25. https://doi.org/10.1080/01154451.2016.1146486.

65Text Analysis Using Natural Language Processing
Case Study: Climate Change in Australia
Background
Climate change poses major challenges for societies and ecosystems; it endangers the livelihoods of humans and threatens the balance in nature (IPCC 2022a). Combating climate change constitutes a core societal (i.e., public) responsibility (UNDESA 2021). Consequentially, mitigating climate change and alleviating its consequences require solutions to be developed and endorsed by the public (IPCC 2022b). Understanding the public voice—including, among other things, the opinions, ideas, and expectations of the public—can be critical to addressing relevant climate change issues and developing appropriate solutions, since joint responsibility can only be achieved through holistic understanding of the public voice.11
Social media, including online social networks, evolved as crucial intermediaries for communication. Mapping the publicly available communication content in social media (i.e., accessible social media text data) offers a promising approach to understanding the public voice. For that reason, this case study aims to map the public debate on climate change using social media text data based on natural language processing (NLP).
Within the case study, we will showcase an approach that allows us to study the public debate via social media on climate change in Australia. Specifically, we will apply topic modeling to analyze text content accessible via the social network Twitter. The case study follows a four-step procedure. First, we describe the collection of social media text data. Second, we explain the preprocessing of the collected data. Next, we elaborate on the analysis of the preprocessed data. Finally, we discuss the results of the analyzed data and draw some conclusions from those results.
Methodology
Data Collection
In the first step, the relevant social media text data were collected. The social network Twitter was chosen for the collection phase of the research because of the platform’s data availability and market penetration. In particular, Twitter is one of the most prominent social media platforms in Australia, with 5.8 million users as of December 2021 (Civic Web Media 2022), representing the second most popular platform in Australia as of March 2022 (StatCounter 2022). Tweets (i.e., posts on Twitter) were collected through the application programming interface Twitter Historical PowerTrack (Twitter 2022a). The search query for the Twitter data (Twitter 2022b) encompassed three elements, namely:
11 See Cherry et al. (2018) and Pisarski and Ashworth (2013) for examples.

66 Mapping the Public Voice for Development—Natural Language Processing of Social Media Text Data
(i) the nominated economy (Australia) using the operator [place_country:AU];
(ii) the nominated keywords (climate change and global warming) using the operator [\”climate change\” OR \“global warming\” OR #climatechange OR #globalwarming]; and
(iii) the nominated time period (15 January 2021 to 31 December 2021)12 using the operator [“fromDate”: “202101150000”, “toDate”: “202201010000”]
These elements took into consideration the research objective and data availability. The Twitter data were queried from August to December 2021. The data collection resulted in a sample of 8,641 tweets by 2,553 unique Twitter users in Australia. Please note that the Twitter Historical PowerTrack interface allows users to query public tweets only. Furthermore, tweets from verified accounts, such as news organizations and influencers, were excluded to include only information originating from the general public.
Data Preprocessing
The data preprocessing involved converting unstructured social media text data into a meaningful text corpus (i.e., transforming and/or removing elements that were irrelevant for the analysis, distorted the methodological implementation, or disturbed the computational application). The data preprocessing followed a five-step approach.13
(i) Duplicated tweets were removed. Duplicated tweets were defined as tweets that had the same content or texts; or retweets, where these tweets had the same content or texts as the retweeted tweets, prefixed with “RT @user:”.
(ii) URLs, emoticons or emojis, hashtags, and user handles (i.e., ‘@’ symbol followed by the username of a Twitter user who is mentioned in a tweet) were converted into special tokens. A token is a sequence of characters that are grouped together as a semantic unit for processing. It may be a word, subword, numeric value, or symbol. This procedure is necessary to extract specific tokens that may be used for separate analyses without losing information during the process.
(iii) E-mails (entire e-mail addresses) and special characters (newline characters, digits, nonalphanumeric characters, and extra whitespaces) were removed.
12 Please note that some social media text assessed in the case study may be driven or influenced by the month or season of the year.
13 The data preprocessing was implemented in Python (version: 3.7) using the libraries numpy (version: 1.21.6), pandas (version: 1.3.5), emot (version: 3.1), nltk (version: 3.7), and spacy (version: 3.2.4).

67Text Analysis Using Natural Language Processing
Note: It is important for steps (ii) and (iii) to be performed in the prescribed order. If the order is reversed, it is possible that tokens containing special characters—URLs, hashtags, user handles, and emojis or emoticons—may be removed before we get to extract or process them. By performing the conversion of special tokens in step (ii), all tokens are already converted into a uniform format, making it more efficient to exclude defined tokens in step (iii).
(iv) The special tokens (URLs, emoticons or emojis, hashtags, and user handles) were removed and lemmatization (transforming a text to its dictionary form),14 spellchecking, and lowercasing were performed.
(v) Stop words were identified and removed using term frequency to remove common words that appeared multiple times within the text corpus and were of limited benefit for the analysis. The process of identifying the stop words using term frequency is dependent on the data. In relatively homogenous texts, for example, we may identify no stop words when examining the top 10 words based on term frequency score. In other cases, such as in relatively diverse texts, we may identify multiple stop words. An alternative is to refer to a fixed term frequency, where we can assume that stop words occur at least 100 times, so we only search for stop words on words that occur 100 times or more.15
The data preprocessing resulted in a final sample of 8,045 tweets by 2,444 unique Twitter users. The possibility of different languages appearing in the data was also considered in the preprocessing phase, where most of the techniques used were language-agnostic, with an exception for the removal of stop words, lemmatization, and spellchecking.
Data Analysis
Topic modeling has been used to detect meaningful patterns and identify common topics in unstructured social media text data. Common clustering algorithms such as k-means usually group each document into clusters, where one document belongs to only one cluster and is assigned only one topic. On the other hand, Latent Dirichlet Allocation (LDA) topic modeling is a generative, statistical probability model that creates groups of words from text documents based on a probability model (Blei, Ng, and Jordan 2003). In LDA, a group of related words forms a topic, which is a multinomial distribution over the vocabulary that conveys the degree to
14 For example, “speaks”, “speaking”, and “spoke” would all be converted to “speak”.15 One may miss some stop words if the set target X is too low. It may also be challenging to go through a huge list of
words if X is too high. Rather than using an absolute threshold, the top x % of the most frequently repeated words may be considered. Another approach may start with the top X most frequent words, then check if the next X words still include stop words. The cycle ends when stop words no longer appear.

68 Mapping the Public Voice for Development—Natural Language Processing of Social Media Text Data
which a word is related to a topic (Blei 2012). It presupposes that all documents in a text corpus share a common set of topics. Documents are distinct from one another because each document presents the topics in a different proportion. For instance, a collection of news articles may include topics about politics, business, sports, technology, entertainment, and others; and one specific article may talk about technology, entertainment, and business. This procedure allows for a more realistic result, as in real data, because a single document may include elements related to different topics. Moreover, since LDA is a statistical model that considers word co- occurrence rather than meaning, it can also be used in analyzing non-English corpora (Wilson and Chew 2010; Pérez et al. 2018). Furthermore, the results generated from LDA can potentially enable supplemental analyses of the data, including time series analyses of topics (e.g., development of topics over time).
The data analysis for this case study followed a four-step approach.16 The LDA models were built using the library gensim (class: LdaModel, LdaMulticore) to enable further visualization of the topic models using pyLDAvis. The difference between the two classes refers to the number of cores used in building the topic models. Specifically, for a large corpus that is computationally demanding, the class LdaMulticore would be the preferable class to use to build the LDA model. The visualization of the topic models was generated using pyLDAvis (function: pyLDAvis.gensim_models.prepare). The four steps were as follows:
(i) The text corpus and word dictionary needed for the parameters for building the LDA model and generating the visualization of the topic models were created. In particular, the required parameters to build the LDA models are the generated text corpus and word dictionary. Aside from the required parameters, the number of topics to be generated (num_topics), a seed for reproducibility of the results (random_state), the document-topic distribution (alpha), and the topic-word distribution (eta) were established. The value of both alpha and eta can either be a float representing a priori belief for both document-topic and topic- word distribution, or a string (“symmetric”, “asymmetric”, or “auto”), which represents the default prior to selecting strategies. Moreover, following the standard methodology, the corresponding default values for the remaining parameters to the class LdaModel (chunksize=2000, passes=1, iterations=50) and LdaMulticore (chunksize=2000, passes=1, iterations=50) were applied. Additionally, the number of cores used through the parameter workers for the topic models for the class
16 The data analysis was implemented in Python (version: 3.7) using the libraries gensim (version: 4.1.2) and pyLDAvis (version: 3.3.1) for LDA topic modeling. According to pyLDAvis documentation, there are several libraries such as gensim or sklearn that can be easily integrated with pyLDAvis for topic model visualization. However, gensim was preferred due to its capability to easily provide the topic coherence score to evaluate the model. Meanwhile, pyLDAvis was used as it provides an interactive topic model visualization to help better visualize and interpret the generated topics.

69Text Analysis Using Natural Language Processing
LdaMulticore as an additional parameter were specified. The specific number of cores to use was based on the capability of the device used to build the model. The use case of LdaMulticore has benefits in reducing the time needed to build the LDA model and can be fully utilized when it is necessary to obtain results faster. However, it is important to note that the results generated are not fully reproducible due to nondeterminism in operating system scheduling of the worker processes.
(ii) The number of topics based on a conventional metric, namely topic coherence (degree of semantic similarity between high-scoring words in a topic), was established, whereby the optimal number of topics was determined based on the maximum value for the topic coherence. For this purpose, several topic models were simulated and the corresponding values for topic coherence of each topic model were determined for comparison. Figure 16 shows the topic coherence scores based on the selected number of topics. Subsequently, the optimal number of topics (N = 15 topics; topic coherence: 0.3019) was determined. N = 15 was selected for the number of topics, even though N = 30 holds a higher topic coherence score as shown in Figure 16. The reason for this was to prevent overlapping topics in the final results. Having many overlapping topics indicates that the model has generated too many topics.
Figure 16: Topic Coherence Scores by Number of Topics to Determine the Optimal Number of Topics
Source: Calculations of the study team for the special supplement to Key Indicators for Asia and the Pacific 2022.
0.00
0.05
0.10
0.15
0.20
0.25
0.30
0.35
0.40
30Number of topics
Cohe
renc
e sc
ore
25 20 15 10

70 Mapping the Public Voice for Development—Natural Language Processing of Social Media Text Data
(iii) After selecting the optimal number of topics, hyperparameter tuning was performed, specifically on the alpha and eta value, to further increase the topic coherence score of the model. Several other parameters were also modified to see their effects on the performance of the model. These parameters included the number of documents to be used in each training chunk (chunksize), the number of passes through the corpus during training (passes), and the maximum number of iterations through the corpus (iterations). Ultimately, the hyperparameter values (chunksize = 500; passes = 1; iterations = 50; alpha = 0.35; eta = 0.7) were selected after finetuning the model, with a better topic coherence score (topic coherence: 0.422).17
(iv) The optimal number of topics with the aforementioned parameters were used for the final LDA model and generated a visualization of the topic distribution.
Results
LDA topic models allow researchers to detect topics but do not describe these topics. Instead, such models describe each topic with identified terms, requiring a subsequent interpretation of each topic based on the identified terms (i.e., words). The interpretation of topics may be based on an automated process or human interpretation. In this case study, human interpretation was employed by reviewing the top 30 keywords for each topic on climate change. Another group of researchers may interpret the data differently; hence the keywords are listed in full for readers’ verification (Table 23).
The summarized topics are Topic 1: “Timely action / immediate action / call to action”, Topic 2: “Identify / report needs/problems to government, communication between people and government / find solutions”, Topic 3: “Make science and knowledge actionable”, Topic 4: “Check impact of action / Australian fires”, Topic 5: “Cost and effect of fossil fuel industry”, Topic 6: “Impact of elections and demand for policy measures / intervention”, Topic 7: “Temperature changes / threats”, Topic 8: “Responsibility of the leaders / propaganda / climate change deniers”, Topic 9: “Protecting threatened jobs / job security”, Topic 10: “Solution-finding for biodiversity / environment loss and damage”, Topic 11: “Economic factors / spending”, Topic 12: “Woman’s advocacy for climate change”, Topic 13: “Human concerns / fears / worries on climate change”, Topic 14: “Action vs inaction on climate change”, and Topic 15: “Truth-seeking / debate about the truth on climate change”.
17 The LDA model could be built using only the default parameters, by supplying the text corpus and word dictionary to the LdaModel or LdaMulticore class. The hyperparameter tuning was an advanced step taken to further polish and improve the model’s performance.

71Text Analysis Using Natural Language Processing
Table 23: Definition of 15 Topics on Climate Change and the Top 30 Keywords for Each
Topic Topic Labels Keywords
1 timely action, immediate action, call to action
need, action, time, real, great, world, let, big, help, work, happen, bad, covid, way, stop, thing, long, look, lead, lot, save, australian, start, nuclear, thank, pandemic, deal, power, energy, bushfire
2 identify/report needs/problems to government communication between people and government, find solutions
people, government, right, report, use, problem, come, find, address, issue, need, anti, feel, try, live, hope, leave, vaccine, lack, today, remember, planet, business, care, hot, child, kid, read, state, look
3 make science and knowledge actionable
know, good, world, science, country, far, continue, scientist, protest, reason, life, thing, government, decision, question, watch, care, mass, carbon, medium, rest, extinction, want, policy, public, debate, turn, nation, nature, charge
4 check impact of actions, Australian fires
year, think, impact, fire, love, ago, political, mean, word, research, wonder, bit, number, hold, ignore, contribute, support, past, attend, country, pretty, enjoy, warm, pm, drought, failure, issue, risk, ignorant, mention
5 cost and effect of fossil fuel industry
fuel, fossil, cost, need, effect, coal, disaster, high, govt, event, consequence, industry, gas, huge, world, emission, sea, power, stop, large, true, majority, agree, face, avoid, weather, new, war, reduce, animal
6 impact of elections and demand for policy measures/intervention
vote, plan, want, target, net, time, decade, new, tax, win, emission, increase, policy, late, denial, leadership, expect, like, believe, massive, area, result, coalition, fail, government, achieve, break, meet, stop, pay
7 temperature changes, threats flood, believe, temperature, sure, theory, level, renewable, set, cold, course, early, mean, wake, politician, work, threaten, control, planet, discuss, society, rise, low, scientific, cool, apparently, corporate, export, today, threat, group
8 responsibility of the leaders, propaganda, climate change deniers
leader, fact, health, actually, lie, talk, politic, denier, technology, election, drive, fool, lose, little, elect, view, labor, [removed word],a boy, poor, policy, trust, absolutely, list, read, pm, carbon, propaganda, management, pandemic
9 protecting threatened jobs, job security
future, job, hear, threat, protect, away, support, grow, sign, security, build, friend, invest, join, voter, stay, land, food, family, want, deni, action, fight, guy, piece, tech, safe, worker, rock, rate
10 solution-finding for biodiversity/environment loss and damage
run, understand, party, crisis, follow, environment, damage, water, environmental, existential, amazing, biodiversity, responsible, problem, reduce, solve, loss, happy, paper, concern, modelling, solution, generation, life, driver, policy, single, issue, kind, conversation
11 economic factors, spending money, cause, news, destroy, economy, ask, fund, matter, conservative, rich, story, allow, fall, dead, mind, spend, die, red, public, study, refuse, elite, self, respond, rule, reminder, left, end, accord, deserve
12 woman’s advocacy for climate change
deny, woman, pollution, include, speak, week, catastrophic, ecosystem, learn, emergency, [removed word],a appear, possible, wonderful, advocate, day, attitude, plastic, year, drop, farm, wear, river, health, imagine, publish, nd, funding, value, product
13 human concerns/fears/worries on climate change
human, record, worry, approach, car, fear, example, thread, form, worried, activity, support, healthcare, sustainable, undermine, induce, fine, type, test, urgent, ok, acknowledge, wealth, fix, seek, year, ridiculous, beat, radical, petrol
14 action vs inaction on climate change
act, inaction, earth, maybe, summer, natural, role, answer, warn, floor, population, totally, catastrophe, embarrassing, cross, honest, useless, office, code, good, agenda, probably, line, recent, improve, arrive, demonstrate, spread, actively, pro
15 truth-seeking, debate about the truth on climate change
truth, position, million, measure, share, game, room, factor, apply, prediction, argument, [removed word],a look, sort, religion, brilliant, influence, shoot, bias, researcher, urban, design, specie, snow, elephant, tackle, item, doom, sociopath, death
Note: The keywords were not further processed and/or transformed and, thus, represent the original results. a A word or phrase was removed due to its inappropriate content.Source: Methodology of the study team for the special supplement to Key Indicators for Asia and the Pacific 2022.
Using the analyzed social media text data, Figure 17 further refines the results to show the top 10 keywords (based on estimated term frequency) for each of the 15 topics.

72 Mapping the Public Voice for Development—Natural Language Processing of Social Media Text Data
Figure 17: Top 10 Keywords for Each of the 15 Topics on Climate Change
Notes: The keywords were not further processed and/or transformed and, thus, represent the original results.* The word/phrase was removed for its inappropriate content.Source: Calculations of the study team for the special supplement to Key Indicators for Asia and the Pacific 2022.
0 20 40 60 80Estimated term frequency Estimated term frequency Estimated term frequency
100 0 20 40 60 80 100 0 20 40 60 80 100
Topic 1let
helphappen
covidlot
savenuclear
heatsoonraise
Topic 2report
findaddress
antifeellack
rememberbusiness
hothumanity
sciencefar
continuescientist
protestreason
decisionmass
extinctionturn
Topic 3
Topic 4year
thinkimpact
loveago
wordbit
numberpast
enjoy
Topic 5fuel
fossile�ect
disasterhighgovt
eventconsequence
hugesea
voteplan
targetnet
decadetax
denialleadership
likeachieve
Topic 6
Topic 7flood
temperaturesure
theoryrenewable
setcold
coursewake
threaten
Topic 8leader
facthealth
actuallypoliticdenier
technologydrive
foolelect
futurejob
hearprotect
awaysign
investjoin
voterland
Topic 9
Topic 10run
understandfollow
damageenvironment
amazingbiodiversityresponsible
losspaper
Topic 11money
newsdestroy
economyask
fundconservative
storyallowmind
denywoman
pollutioninclude
speakcatastrophic
learnemergency
appearwonderful
Topic 12
Topic 13humanrecordworry
approachcar
fearexample
threadform
activity
Topic 14act
inactionearth
maybesummer
naturalrole
answerwarnfloor
positionmillion
measuresharegameroomapply
predictionargument
[removed word]*
Topic 15

73Text Analysis Using Natural Language Processing
Discussion
The objective of the case study was to showcase an approach allowing for a study of the public debate on climate change in Australia by applying topic modeling to analyze text content accessible via the social network Twitter. Thereby, the case study followed a four-step procedure, including the collection of the social media text data, the data preprocessing of the collected social media text data, the analysis of the preprocessed social media text data, and the introduction of the results of the analyzed social media text data. Next, we discuss the results and conclusions.
The LDA topic models identified 15 topics on climate change for Australia. Following the review of these topics, the public discourse on climate change in Australia focuses on policymaking and contributions by society. This is exemplified by Topic 2 (identify and/or report needs and/or problems to government, communication between people and government to find solutions); Topic 6 (impact of elections and demand for policy measures and/or interventions); and Topic 15 (truth-seeking and/or debate about the truth on climate change).
The identified topics on climate change allow researchers and policymakers not only to reflect on the concerns, ideas, and expectations of the public, but also to elaborate on approaches and measures to tackle climate change. One might consider, for example, further increasing the participation of the public in the process of policymaking on climate change (corresponding to the focus on policymaking and contributions by society). Notwithstanding, the development of approaches and measures to tackle climate change requires joint dialogue between all social groups and remains a fundamental responsibility of the entire society.
Even though the approach in this case study allows for a study of the public debate on climate change in Australia by applying topic modeling to analyze text content accessible via Twitter, two limitations should be noted. First, social media text data, despite their granularity in space and time, usually do not allow researchers to draw conclusions about the representativeness of the findings for the entire population because only limited information is provided by social networks on the sample population (i.e., users of social networks). This is acceptable insofar as the purpose of this study is inherently focused on the sample population, yet, at the same time, hinders a generalizing statement on the findings of this study (and other studies) for the broader population (society). One possible solution for addressing this limitation is to integrate diverse social media (i.e., social networks), targeting different groups in society, into the analysis and thus, potentially, enabling a more comprehensive mapping of the expression of opinions, ideas, and expectations of the public. The second limitation is that topic models (including LDA topic models), despite their capabilities to identify patterns in unstructured social media text data, usually do not consider context- dependent information such as location information. Furthermore, as the interpretation of the results were based on human interpretation and the collective knowledge of the research team, the labels of the topics may not be the definitive answers and may be subject to change when being interpreted by other groups of researchers.

74
Text Classification
Text classification is the process of assigning a document to a topic category. The objective of text classification, given a document d and a set of classes C with j classes or categories (i.e., topics) C = {c1, c2, ..., cj}, is to predict a class ci from C to which document d belongs. Text classification includes sentiment analysis, spam detection, document categorization, and language identification, among other things.
One technique for the classification of texts is to use a set of manually created linguistic rules (e.g., topics based on specific research objectives). These linguistic rules instruct the system to identify the appropriate category for a given text based on its semantic relevance. Each rule includes a pattern and an expected category. A collection of documents, for instance, must be categorized into four groups: sports, technology, politics, and entertainment. The words associated with sports may include “basketball”, “baseball”, “score”, “game”, and “foul”. The words associated with politics may include “president”, “government”, and “department”. For the technology and entertainment categories, a set of associated words must be identified accordingly. A simple rule such as “the document’s category is the one with the highest frequency of related words” may also be used to classify a given document. It is possible to formulate more complex rules, such as the requirement that a news article on sports should mention at least one type of sport in addition to other related terms. Keyword extraction and topic modeling can be used both for identifying the set of categories and formulating the rules. The topics generated by Latent Dirichlet Allocation (LDA) may serve as a basis for a set of predefined categories, while the words associated with a topic may be regarded as category-related words. In addition, keyword extraction can be used to determine the relevant terms in a text corpus that will serve as the basis of the rules.
Among the benefits of rule-based classifiers are that they are easily explained and understood and can be further customized. However, analyzing and evaluating rules for complex systems requires profound expertise in the field of interest and can be time- consuming. In addition, complex systems provide scalability concerns, as new rules can alter the outcomes of older ones. This is the reason why machine- learning methods are typically favored for more complex text classification. However, this method may require resources that may not be available, such as annotated training data.
Rather than relying on manually created linguistic rules, machine-learning text classification learns to categorize based on previous observations called “training data.” Training data are examples with prelabeled categories that are used by machine- learning algorithms to identify the various relationships between text fragments. The machine-learning algorithm learns automatically that a specific category is predicted for a specific input. The initial step in training a machine-

75Text Classification
learning text classifier is feature extraction, which is a method for transforming each text into a vector-based numerical representation, as explained in the sixth chapter. The machine- learning algorithm is then fed training data, which consists of pairings of the text example (e.g., “The Hawks won the game”) and its category (e.g., “sports”), to generate a classification model. The machine-learning algorithms used for text classification include Naïve Bayes, Support Vector Machine, Decision Trees, and Random Forest, among others. Once sufficiently trained with enough samples, the machine- learning model can start to make predictions. The same feature extractor is used to convert unseen text into feature vectors, which can be fed into a classification model to predict the category of the text.
Various text classification tasks have been accomplished using both rule-based and machine-learning techniques. The next section focuses on sentiment analysis since it is one of the most popular text classification tasks. It can serve as a reference for other applications such as spam detection, language identification, document categorization, and others.
Sentiment Analysis
Sentiment analysis is a type of text classification that categorizes texts based on contextual polarity or sentiment orientation. The objective of sentiment analysis, given a document d and a set of sentiment and/or polarity classes C = {c1, c2, …., cn}, is to predict the sentiment ci from C to which document d belongs. Many sentiment analysis approaches rely on sentiment (or opinion) lexicons. A sentiment lexicon is a collection of lexical features (e.g., words) that are classified in sentiment and/or polarity classes based on the semantic orientation (Liu 2010). While generating and validating sentiment lexicons is one of the most robust methods, it is also one of the most tedious and time-consuming. As a result, many sentiment analysis solutions refer to existing sentiment lexicons. We provide an overview of three common sentiment lexicons—SentiWordNet, Valence Aware Dictionary and sEntiment Reasoner (VADER), and Linguistic Inquiry and Word Count (LIWC)—including discussion on the use of each for sentiment analysis.
SentiWordNet
SentiWordNet (Esuli and Sebastiani 2006) is an automatically generated lexical database that is designed specifically for sentiment analysis and opinion-mining applications. SentiWordNet is derived from the English WordNet (Fellbaum 1998), a large database of words in the English language. Rather than being sorted alphabetically like a dictionary, WordNet is structured by concept and meaning, where nouns, verbs, adjectives, and adverbs are grouped into synsets. Synsets are collections of cognitive synonyms that each communicate a particular concept.

76 Mapping the Public Voice for Development—Natural Language Processing of Social Media Text Data
Figure 18 shows the three “senses” (or meanings) of the word “estimable”. The second sense of “estimable” means “deserving of esteem or respect” and is synonymous to “good”, “honorable”, and “respectable”, producing the first synset (estimable, good, honorable, respectable). The third sense of “estimable” is synonymous with “computable”, resulting in a second synset (estimable, computable). These semantic and lexical relationships link synsets together, resulting in a network of words, explaining the name WordNet.
SentiWordNet was derived from WordNet, comprising 147,306 synsets that were automatically annotated with three numerical scores related to the sentiment of the words in each synset. Figure 19 shows the graphical representation of the sentiment properties included in a WordNet sense, and these properties express the following information:
(i) the subjectivity-objectivity polarity, indicating whether a word has an opinionated nature (i.e., subjective) or a factual nature (i.e., objective);
(ii) the positive-negative polarity, indicating whether a word expresses a positive or a negative opinion; and
(iii) the strength of the positive-negative polarity, indicating the intensity of the positivity or negativity expressed by a word.
Figure 18: Sample WordNet Entry for the Word “Estimable”
Adjective
S: (adj) estimable (deserving of respect or high regard)S: (adj) estimable, good, honorable, respectable (deserving of esteem and respect) “all respectable companies give
guarantees”; “ruined the family’s good name”S: (adj) computable, estimable (may be computed or estimated) “a calculable risk”; “computable odds”; “estimable assets”
Source: Princeton University. WordNet: A Lexical Database for English. https://wordnet.princeton.edu/.
Figure 19: SentiWordNet’s Graphical Representation of the Sentiment Properties of a WordNet Sense
Source: A. Esuli and F. Sebastiani. 2006. SENTIWORDNET: A Publicly Available Lexical Resource for Opinion Mining. 5th Conference on Language Resources and Evaluation. Genoa: European Language Resources Association.
PN polarity
Objective
SO p
olar
ity
Positive
+ –
O
Negative
Term Sense Position

77Text Classification
Let us again consider the word “estimable”, which has three senses in WordNet. Figure 20 shows the SentiWordNet entry for “estimable”. As can be seen in the graphics, each sense now has three numeric scores, namely P, N, and O, representing the positivity, negativity, and objectivity scores of the sense. Each score ranges from 0.0 to 1.0, and their sum is 1.0. The score is indicative of the strength or intensity of each sentiment property. For example, the first sense, estimable(1), has P=0.75, N=0.0, and O=0.25; while the third synset, estimable(3) has both P=0 and N=0, with O=1. It can be inferred from the sentiment scores that the first sense is highly subjective and positive, while the third sense is highly objective.
Figure 20: SentiWordNet Scores for the Word “Estimable”
Note: The figure shows the three senses of the word “estimable” in SentiWordNet. “P” indicates the positivity score, “N” indicates the negativity score, and “O” indicates the objectivity score. Source: A. Esuli and F. Sebastiani. 2006. SENTIWORDNET: A Publicly Available Lexical Resource for Opinion Mining. 5th Conference on Language Resources and Evaluation. Genoa: European Language Resources Association.
+ –
O
+ –
O
+ –
O
estimable (1)deserving of respectP = 0.75, N = 0.0, O = 0.25
estimable (2)good, honorable, respectabledeserving of esteem and respectP = 0.625, N = 0.25, O = 0.125
estimable (3)computable, estimablemay be computed or estimatedP = 0.0, N = 0.0, O = 1

78 Mapping the Public Voice for Development—Natural Language Processing of Social Media Text Data
To use SentiWordNet in classifying a sentence, the P, N, and O values of each word in the sentence may be tallied to represent the sentence-level sentiment score. If the sum of O values is less than 0.5, the sentence is considered to express an opinion and may include a sentiment. The polarity with the higher sum (i.e., either the sum of P scores or the sum of N scores) determines the sentiment of the statement. SentiWordNet is useful for a wide range of sentiment analyses and opinion-mining tasks. The sentiment values of SentiWordNet were automatically generated and calculated using a mix of semi-supervised algorithms (Esuli and Sebastiani 2006). This automated process may result in some errors in the scores (Baccianella, Esuli, and Sebastiani 2010). A human- curated lexical resource, such as LIWC, may be preferable (Hutto and Gilbert 2014).
Valence Aware Dictionary and sEntiment Reasoner
VADER is an open-source lexicon and rule-based sentiment analysis tool that is specifically attuned to sentiments expressed in social media (Hutto and Gilbert 2014). In constructing the lexicon, an initial list of words was created, inspired by existing sentiment word-banks LIWC (Pennebaker et al. 2015), Affective Norms for English Words (Bradley and Lang 1999), and General Inquirer (Stone et al. 1966). Following this, lexical features common to sentiment expression in microblogs were added, including a full list of Western-style emoticons (e.g., :-), <3), sentiment-related acronyms and initialisms (e.g., LOL), and commonly used slang with sentiment value (e.g., nah, meh). The resulting lexical feature candidates were rated by 10 independent human raters, using a scale of –4 for extremely negative to +4 for extremely positive, with 0 as the neutral value. Lexical feature candidates that had a nonzero mean rating and whose standard deviation was less than 2.5 were included in the VADER lexicon. The final VADER lexicon contains around 7,500 lexical entries with validated valence scores that indicated both the sentiment polarity (positive or negative) and the sentiment intensity (–4 to +4).
Table 24 shows sample entries in the VADER lexicon. Each entry composes the token, the mean valence (or sentiment intensity), the standard deviation of the ratings, and the list of human ratings. The first entry in Table 24 (emoticon: :-&) has a valence score of –0.5 (indicating a slightly negative sentiment) while the fourth entry (the emoticon: :-)) has a valence score of 2.8 (indicating a moderately positive sentiment). The VADER lexicon can also be extended by adding new tokens. Following the procedure of the composition of the VADER lexicon, new tokens should be evaluated by 10 independent human raters using a scale of –4 for extremely negative to +4 for extremely positive, with 0 as the neutral value, whereby only tokens whose standard deviation does not exceed 2.5 should be added to the lexicon.

79Text Classification
The VADER Sentiment Analyzer is a rule-based sentiment analysis engine that uses the VADER lexicon. Aside from the lexicon, The VADER Sentiment Analyzer applies the following grammatical and syntactical rules in determining the sentiment intensity of a sentence:
(i) Punctuation, in particular the exclamation point (!), increases the sentiment intensity without altering the semantic orientation.
(ii) Capitalization, in particular words in which all letters are capital letters, emphasizes a sentiment-relevant word in the presence of other noncapitalized words and increases the sentiment intensity without altering the semantic orientation.
(iii) Degree modifiers (also known as intensifiers, booster words, or degree adverbs such as “very”, “extremely”, or “terribly”) affect the sentiment intensity by either increasing or decreasing it.
(iv) The contrastive conjunction “but” indicates a shift in the polarity of the text’s sentiment, with the sentiment of the text that follows the conjunction becoming dominant.
(v) Examining the three words before a sentiment word identifies nearly 90% of instances in which negation reverses the text’s polarity.
Given a sentence, the VADER Sentiment Analyzer generates four scores: the positive, negative, neutral, and compound scores, whereby the compound score is the sum of positive, negative, and neutral scores and is then normalized between -1 (most extreme negative) and +1 (most extreme positive). Therefore, the more positive a text is, the closer its compound score is to +1.
Table 24: Excerpt from the Valence Aware Dictionary and sEntiment Reasoner Lexicon
Number Emoticon Valence Score Standard Deviation Human Ratings
1 :-& -0.5 0.92195 [-1, -1, 0, -1, -1, -1, -1, 0, 2, -1]
2 :-( -1.5 0.5 [-2, -1, -1, -1, -2, -2, -2, -1, -2, -1]
3 :-) 1.3 0.45826 [1, 1, 1, 1, 2, 1, 2, 1, 2, 1]
4 :-)) 2.8 1.07703 [3, 4, 4, 1, 2, 2, 4, 2, 4, 2]
5 :-* 1.7 0.64031 [1, 2, 1, 1, 1, 3, 2, 2, 2, 2]
6 :-, 1.1 0.53852 [1, 1, 1, 0, 1, 1, 1, 1, 2, 2]
Source: C. Hutto and E. Gilbert. 2014. Vader: A Parsimonious Rule-Based Model for Sentiment Analysis of Social Media Text. Proceedings of the International AAAI Conference on Web and Social Media. 8 (1). pp. 216—225.

80 Mapping the Public Voice for Development—Natural Language Processing of Social Media Text Data
Listing 13 shows the implementation of the VADER Sentiment Analyzer based on one example sentence in Python. The example sentence, “This burger is great!”, results in a compound score of 0.6588, implying that the sentence expresses a positive sentiment. Moreover, 59% of the words in the sentence are positive, 40.6% of the words are neutral, and there are no negative words in the sentence.
Linguistic Inquiry and Word Count
LIWC is a proprietary text analysis tools that allows researchers to study emotional, cognitive, and structural components (Pennebaker et al. 2015). LIWC includes a dictionary consisting of approximately 6,500 terms classified into one or more of 90+ categories. These categories consist of:
Listing 13: Sentiment Analyzer Based on an Example Sentence
Programming (Python)
1
2
3
4
5
6
7
8
9
10
11
12
from vaderSentiment.vaderSentiment import SentimentIntensityAnalyzer
analyzer = SentimentIntensityAnalyzer()
sentence = ‘This burger is great!’
vs = analyzer.polarity_scores(sentence)
print(sentence)
print(vs)
# OUTPUT
This burger is great!
{‘neg’: 0.0, ‘neu’: 0.406, ‘pos’: 0.594, ‘compound’: 0.6588}
Description
(Line 1) Including (import) the class SentimentIntensityAnalyzer from the library vaderSentiment.
(Line 3) Creating an instance of SentimentIntensityAnalyzer named analyzer.
(Line 4) Creating a sample sentence in variable sentence.
(Line 6) Generating the polarity scores by passing sentence into the function polarity_scores that is accessible through variable analyzer from (Line 3), and storing the results in variable vs.
(Line 7) Displaying the value of sentence using Python’s built-in function print.
(Line 8) Displaying the value of vs using Python’s built-in function print.
(Line 10) Resulting outputs from the print statements in (Line 7) and (Line 8).
Source: Methodology of the study team for the special supplement to Key Indicators for Asia and the Pacific 2022.

81Text Classification
(i) 4 summary language variables (analytical thinking, clout, authenticity, and emotional tone);
(ii) 3 general descriptor categories (words per sentence, percentage of target words captured by the dictionary, and percentage of words in the text that are longer than six letters);
(iii) 21 standard linguistic dimensions (e.g., percentage of words in the text that are pronouns, articles, and auxiliary verbs);
(iv) 41 word categories tapping psychological constructs (e.g., affect, cognition, biological processes, and drives);
(v) 6 personal concern categories (work, leisure, home, money, religion, and death);
(vi) 5 informal language markers (swear words, netspeak, assent, nonfluencies, and fillers); and
(vii) 12 punctuation categories (e.g., periods and commas).
Table 25 shows samples of LIWC main categories and example words per category. LIWC produces four summary language variables that are also applicable to sentiment analysis. First, the Analytic Thinking variable measures the extent to which individuals use language that suggests formal, logical, and hierarchical thought patterns. Second, the Clout variable refers to the relative social standing, confidence, or leadership displayed by individuals in their writing. Third, the Authenticity variable shows the amount of spontaneity reflected in the text or whether the author regulates or filters what he or she says. The last variable, Emotional Tone, combines the positivity and negativity dimensions into a single summary variable, with greater values indicating a more positive tone (Pennebaker et al. 2015). LIWC-22 has translations of its proprietary dictionary in 15 languages.18
18 The LIWC dictionary has translations for Brazilian, Chinese (Simplified), Chinese (Traditional), Dutch, French, German, Italian, Japanese, Norwegian, Portuguese, Romanian, Russian, Serbian, Spanish, Turkish, and Ukrainian.

82 Mapping the Public Voice for Development—Natural Language Processing of Social Media Text Data
LIWC scans a given text and compares each word to its list of dictionary words, calculating the proportion of total words in the text that correspond to each dictionary category. For instance, given a 100-word document, LIWC may determine that five words are associated with the Positive Emotion category and one word is associated with the Drive category. LIWC would transform these figures into percentages, such as 5% Positive Emotion and 1% Drive.
LIWC has been extensively validated, both internally and externally, by psychologists, sociologists, and linguists over the course of more than a decade (Pennebaker, Francis, and Booth 2001; Pennebaker et al. 2007). Although its dictionary is proprietary, the dictionary and word lists are simple and can be easily examined and even extended. These characteristics make LIWC an appealing option for researchers in search of a dependable lexicon for sentiment analysis.
Table 25: Sample of Linguistic Inquiry and Word Count Main Categories and Examples
LIWC-22 Main Categories Examples
Linguistic Dimensions
Function words (pronouns, articles, prepositions, auxiliary verbs, adverbs, conjunctions, and negations)
it, to, the, up, no, is, has very, and, not, but
Other grammar (common verbs, adjectives, numbers, and quantifiers) eat, free, what, how, second, few, really, very, better, worst
Punctuation marks . , ( ) : ; ? ! “ ‘
Psychological Processes
Affective processes (positive and negative emotions, positive and negative tones, swear)
happy, cried, hurt, grief, annoyed, happy, joy
Social behaviors (prosocial, politeness, interpersonal conflict, moralization, communication social processes)
mate, daughter, dad, girl, mom, boy, his, buddy, neighbor, please, thank you, fight, argue, talk, explain
Cognitive processes (absolutism, insight, causation, discrepancy, tentative, certainty, differentiation, memory)
cause, know, think, effect, because, always, perhaps, but, else, should, would, never
Perceptual processes (see, hear, feel) look, heard, feeling, view, saw, listen, hear, touch
Biological processes (body, health, sexual, ingestion) eat, blood, pain, cheek, face, clinic, pill, love, lust, incest, dish, pizza
Drives (affiliation, achievement, power, reward, risk) ace, child, progress, friend, win, better, superior, bully, prize, take, danger, doubt
Time orientations (past, present, future) ago, did, today, is, now, soon, will
Personal concerns (work, leisure, home, money, religion, death) job, cook, chat, movie, kitchen, landlord, cash, owe, altar, church, bury, coffin
Informal language (swear words, netspeak, assent, nonfluencies, fillers) :), gunna, ty, [removed word],a [removed word],a btw, lol, agree, ok, er, umm, youknow
LIWC = Linguistic Inquiry and Word Count.a A word or phrase was removed due to its inappropriate content.Source: R. L. Boyd, A. Ashokkumar, S. Seraj, and J.W. Pennebaker. 2022. The Development and Psychometric Properties of LIWC-22. Austin, TX: University of Texas at Austin.
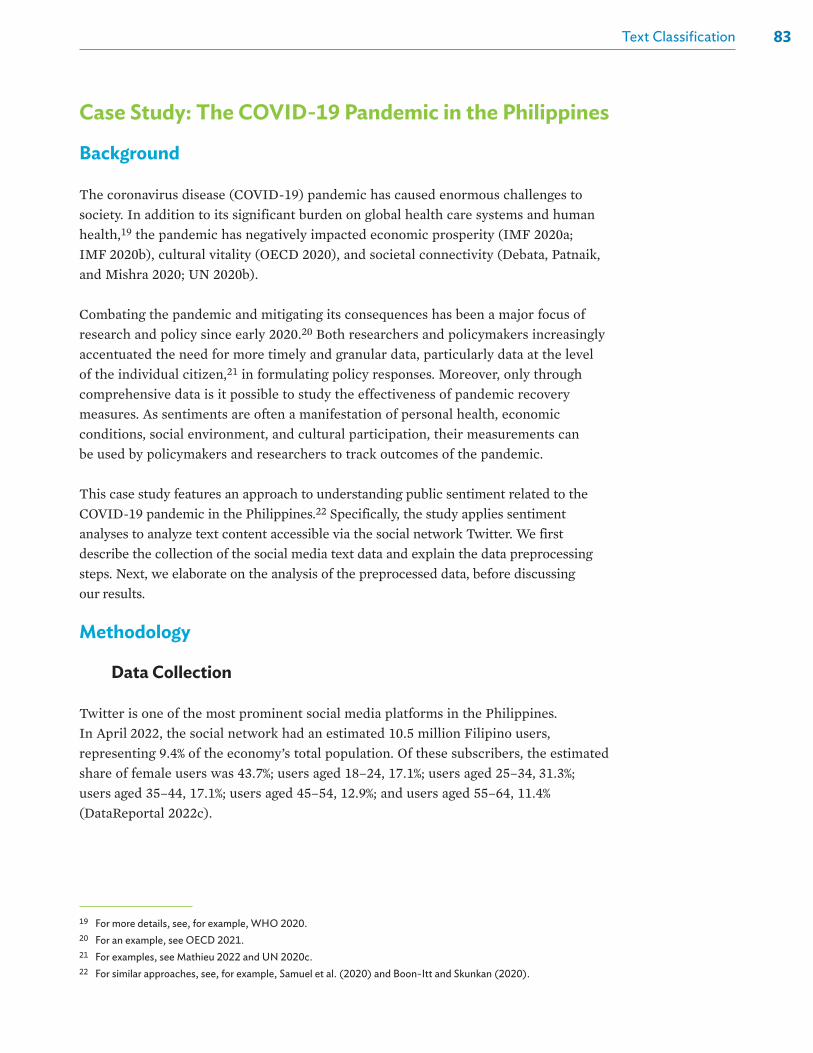
83Text Classification
Case Study: The COVID-19 Pandemic in the Philippines
Background
The coronavirus disease (COVID-19) pandemic has caused enormous challenges to society. In addition to its significant burden on global health care systems and human health,19 the pandemic has negatively impacted economic prosperity (IMF 2020a; IMF 2020b), cultural vitality (OECD 2020), and societal connectivity (Debata, Patnaik, and Mishra 2020; UN 2020b).
Combating the pandemic and mitigating its consequences has been a major focus of research and policy since early 2020.20 Both researchers and policymakers increasingly accentuated the need for more timely and granular data, particularly data at the level of the individual citizen,21 in formulating policy responses. Moreover, only through comprehensive data is it possible to study the effectiveness of pandemic recovery measures. As sentiments are often a manifestation of personal health, economic conditions, social environment, and cultural participation, their measurements can be used by policymakers and researchers to track outcomes of the pandemic.
This case study features an approach to understanding public sentiment related to the COVID-19 pandemic in the Philippines.22 Specifically, the study applies sentiment analyses to analyze text content accessible via the social network Twitter. We first describe the collection of the social media text data and explain the data preprocessing steps. Next, we elaborate on the analysis of the preprocessed data, before discussing our results.
Methodology
Data Collection
Twitter is one of the most prominent social media platforms in the Philippines. In April 2022, the social network had an estimated 10.5 million Filipino users, representing 9.4% of the economy’s total population. Of these subscribers, the estimated share of female users was 43.7%; users aged 18–24, 17.1%; users aged 25–34, 31.3%; users aged 35–44, 17.1%; users aged 45–54, 12.9%; and users aged 55–64, 11.4% (DataReportal 2022c).
19 For more details, see, for example, WHO 2020.20 For an example, see OECD 2021.21 For examples, see Mathieu 2022 and UN 2020c.22 For similar approaches, see, for example, Samuel et al. (2020) and Boon-Itt and Skunkan (2020).

84 Mapping the Public Voice for Development—Natural Language Processing of Social Media Text Data
For this case study, tweets were collected through the Twitter Historical PowerTrack (Twitter 2022a). The search query for the Twitter data (Twitter 2022b) encompassed three main elements, namely:
(i) the nominated economy (the Philippines), using the operator [place_country:PH];
(ii) the nominated keywords (those related to the COVID-19 pandemic, e.g., covid or sars-cov-2) based on a review of the literature and news coverage, using the operator [covid OR covid19 OR corona OR coronavirus OR ncov OR \”corona virus\” OR coronaviruses OR COVID19 OR \”COVID-19\” OR \”covid-19\” OR NCOV19 OR \”sars-cov-2\” OR sarscov2 OR \”sars cov 2\” OR #covid OR #covid19 OR #coronavirus OR #ncov OR #COVID19 OR #NCOV19]; and
(iii) the nominated time period (1 May 2021 to 31 December 2021), using the operator [“fromDate”: “202105010000”, “toDate”: “202201010000”].
These elements took into consideration the research objective and data availability. Note that keywords about COVID-19 variants (e.g., “alpha”, “beta”, and “delta”) were not included as the search terms were finalized before these became widespread. The Twitter data were queried from August to December 2021. The data collection resulted in a final sample of 28,294 tweets by 10,834 unique Twitter users. Please note that the Twitter Historical PowerTrack allows researchers to query public tweets only. Furthermore, tweets from verified accounts, such as news organizations and influencers, were excluded to include only information originating from the general public.
Data Preprocessing
The data preprocessing for this case study had the objective of converting unstructured social media text data into a meaningful text corpus (i.e., transforming and/or removing elements that were irrelevant for the analysis, distorted the methodological implementation, or disturbed the computational application). The data preprocessing followed a single-step approach.23 In particular, we removed extra whitespaces, URLs, hashtags, and duplicate tweets. The data preprocessing was kept to a minimum because information from special characters (including, for example, punctuation marks) affect the analysis of sentiment. Likewise, stop words were not removed since common words (e.g., “not”, “but”, and “very”) preceding a (defined) word might modify their meaning or intensity (e.g., “not good”, “but good”, “very good”), consequentially changing the sentiment. Note that, in this study, only English words are recognized
23 The data preprocessing was implemented in Python (version: 3.7.4) using the libraries json (version: 2.0.9), re (version: 2.2.1), and pandas (version: 0.25.1).

85Text Classification
by the sentiment analysis model, so Tagalog and other non-English words are ignored. The data preprocessing resulted in a final sample of 28,294 tweets by 10,834 unique Twitter users.
Data Analysis
Sentiment analysis has been demonstrated to be capable of assessing affective states and subjective information (i.e., the sentiment) in social media text data. Sentiment analysis can refer to diverse techniques, but dictionary-based approaches are the most common.
In this case study, the Valence Aware Dictionary and sEntiment Reasoner (VADER)—an open-source (open-access) dictionary- and rule-based sentiment classifier that mainly uses a curated lexicon of words to determine sentiment (Hutto and Gilbert 2014)—was applied to identify sentiment. VADER was developed considering the internet language. The algorithm considers lexical features (such as, but not limited to, punctuation, capitalization, emojis, and acronym usage) that are relevant in analyzing social media text data, with the ultimate objective of identifying positive, negative, or neutral sentiment in such text data.
The data analysis for this case study followed a three-step approach.24
(i) Words were compared with a human-annotated dictionary consisting of 7,502 words, acronyms, slangs, idioms, emoticons, and emojis, including their corresponding valence scores (Hutto and Gilbert 2014). VADER’s dictionary was annotated by 10 independent human raters, providing ratings for each item. Their individual ratings were then averaged to get their final valence scores, subject to data quality controls and evaluations to ensure reliability of the data.
(ii) The sentiment scores were calculated for each tweet, based on the identified (i.e., recognized) words. These sentiment scores were then adjusted to control for five25 main grammatical and syntactical cues that might affect the sentiment intensity: (a) punctuation, (b) capitalization, (c) degree modifiers, (d) the contrastive conjunction “but”, and (e) negation. For example, a tweet containing several exclamation points (e.g., “!!!”) will get a higher score relative to a tweet containing fewer exclamation points (e.g., “!”), requiring, in turn, testing for (extra) punctuations. The output of VADER comprises a set of four scores (for each tweet). The first three scores refer to the sentiment:
24 The data analysis was implemented in Python (version: 3.7.4) using the libraries pandas (version: 0.25.1) and nltk (version: 3.4.5)
25 Hutto and Gilbert (2014) outlined five main rules to get a better measure of sentiment intensity, but a quick check of the source code (Hutto 2014) reveals more preprocessing steps applied to text.

86 Mapping the Public Voice for Development—Natural Language Processing of Social Media Text Data
positive (“pos”), negative (“neg”), and neutral (“neu”) sentiment, which sum to 1. The first three scores exemplify the proportions of text assigned to the respective scores (i.e., sentiments). The fourth score, the compound score, is a normalized score, ranging from –1 to +1, intended to provide a single-dimensional measure of sentiment. Normalization is done for each tweet by applying a nonlinear transformation on the sum of the valence scores of the words, calculated separately from the three sentiment scores. The closer the score is to –1, the more negative the sentiment is, the closer the score is to +1, the more positive the sentiment is. Using a random subsample of 300 tweets related to COVID-19, it was found that VADER uses 10% of words in a single tweet to calculate sentiment scores. One reason is that VADER is able to recognize only English words using its dictionary, and as a result non-English words in tweets are not included when calculating sentiment scores.
(iii) Each tweet was classified into one of two sentiment categories (positive or negative) by comparing the individual sentiment scores. If the positive sentiment score was greater than the negative sentiment score, then the tweet was classified as positive. Similarly, if the negative sentiment score was greater than the positive sentiment score, then the tweet was classified as negative. Note that the compound score may also be used to classify sentiment, although it would require determining thresholds. For example, if the cut-off point was determined to be +0.5, then all tweets with compound scores greater than +0.5 would be considered positive.
The tweets assigned to the respective categories were aggregated on a daily level to derive the count of tweets by sentiment, allowing an overview of the sentiment trends over time to be obtained.
Moreover, aside from sentiment analysis, emojis—a common type of communication in social media and generally related to sentiment—were analyzed. The analysis followed a two-step approach.26 First, three emojis of interest were selected. This included the two most popular emojis in the tweets (based on a frequency analysis of all emojis in the tweets), namely the folded hands emoji and the crying face emoji, and the emoji most closely associated with the subject matter, namely the syringe emoji. The syringe emoji emerged as an important emoji in late 2021, according to Emojipedia (Broni 2022). As a second step in the analysis, the total number of each of the three emojis used each day was counted to obtain an overview of the emoji trends over time. Note that raw emoji counts were calculated. So, if the syringe emoji appeared four times in one tweet, then all four were counted for the total on that day.
26 Emoji analysis was implemented in Python (version: 3.7.4) using the library emoji (version: 1.6.1), which contains over 3,600 popular emojis from the Unicode consortium (Emojipedia 2022).

87Text Classification
Results
Figure 21 shows the 7-day rolling average of the daily count of tweets related to the COVID-19 pandemic, together with selected events. The Philippines implemented various levels of lockdowns as a measure to manage the COVID-19 pandemic, starting from community quarantines from 2020 to 2021 to the Alert Levels System (1 to 5, depending on rate of case transmission) starting September 2021 (IATF 2021). There was a spike in the number of tweets in the days following the Philippines’ move from General Community Quarantine (GCQ) to Enhanced Community Quarantine (ECQ) in mid-August 2021. At this time, the number of tweets reached approximately 250 a day. A decline in the number of tweets followed ECQ, until a resurgence again from late December 2021 as the Omicron variant was becoming dominant.
As a large percentage of tweets in the study were neutral (probably because most were news updates), there was a focus on those with positive or negative sentiment. Figure 22 shows the tweet counts for both negative and positive sentiments for May– December 2021. The figure shows similar trends or patterns for tweets associated with positive and negative sentiment, including comparable peaks. Most of the tweets associated with positive and negative sentiment occurred between the Philippines’ ECQ in mid-August 2021 and the announcement of Alert Level 4 status in mid-September 2021. Starting late December 2021, tweets associated with positive and negative sentiment increased again, coinciding with the detection of the Omicron variant in the Philippines. Tweets associated with positive sentiment numbered 840 during May– December 2021, whereas 825 tweets were associated with negative sentiment.
Figure 21: Count of Tweets Related to COVID-19 in the Philippines, May–December 2021
COVID-19 = coronavirus disease, ECQ = Enhanced Community Quarantine, MECQ = Modified Enhanced Community Quarantine, NCR = National Capital Region.Note: Only tweets mentioning COVID-19-related keywords were counted.Source: Calculations of the study team for the special supplement to Key Indicators for Asia and the Pacific 2022.
May 20210
50
100
150
200
250
ECQ
ann
ounc
emen
t
ECQ
(NCR
)
MEC
Q
Ale
rt L
evel
4
Ale
rt L
evel
3
Ale
rt L
evel
2
Om
icro
n va
riant
det
ecte
d
Seven-day moving average of daily tweet count
Jun 2021 Jul 2021 Aug 2021 Sep 2021 Oct 2021 Nov 2021 Dec 2021 Jan 2022
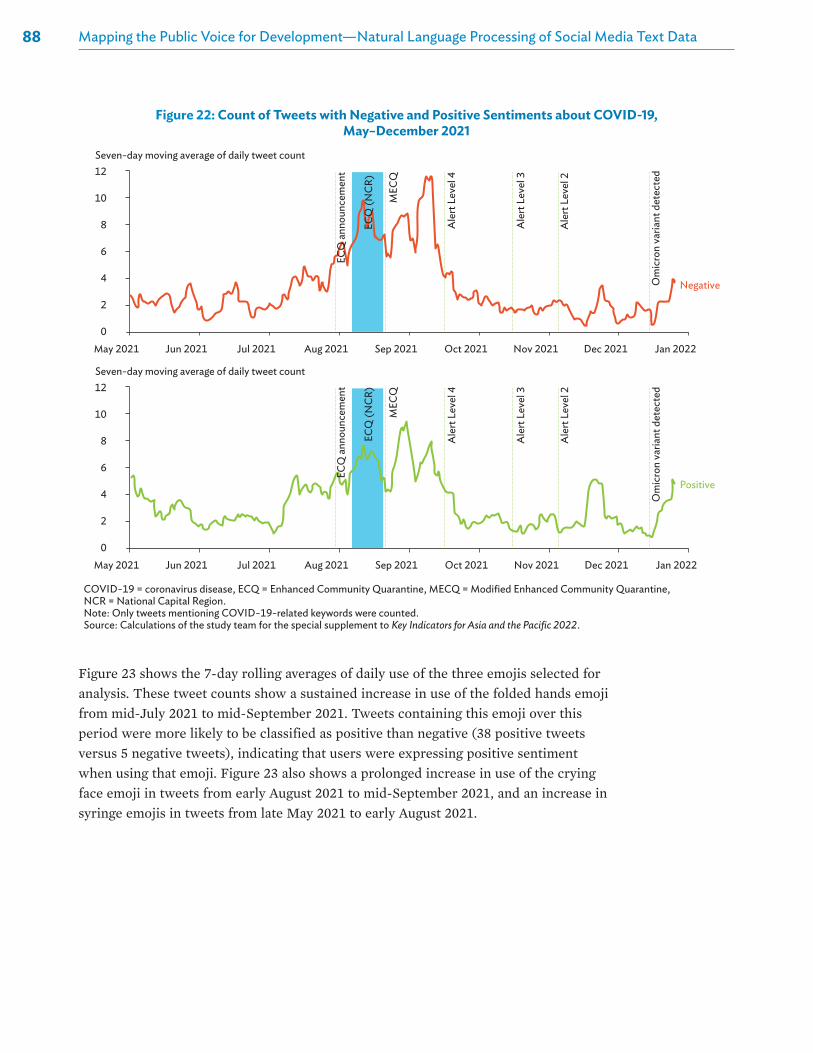
88 Mapping the Public Voice for Development—Natural Language Processing of Social Media Text Data
Figure 23 shows the 7-day rolling averages of daily use of the three emojis selected for analysis. These tweet counts show a sustained increase in use of the folded hands emoji from mid-July 2021 to mid-September 2021. Tweets containing this emoji over this period were more likely to be classified as positive than negative (38 positive tweets versus 5 negative tweets), indicating that users were expressing positive sentiment when using that emoji. Figure 23 also shows a prolonged increase in use of the crying face emoji in tweets from early August 2021 to mid-September 2021, and an increase in syringe emojis in tweets from late May 2021 to early August 2021.
Figure 22: Count of Tweets with Negative and Positive Sentiments about COVID-19, May–December 2021
COVID-19 = coronavirus disease, ECQ = Enhanced Community Quarantine, MECQ = Modified Enhanced Community Quarantine, NCR = National Capital Region.Note: Only tweets mentioning COVID-19-related keywords were counted.Source: Calculations of the study team for the special supplement to Key Indicators for Asia and the Pacific 2022.
May 20210
4
2
6
8
10
12
ECQ
ann
ounc
emen
t
ECQ
(NCR
)
MEC
Q
Ale
rt L
evel
4
Ale
rt L
evel
3
Ale
rt L
evel
2
Om
icro
n va
riant
det
ecte
d
Seven-day moving average of daily tweet count
Jun 2021 Jul 2021 Aug 2021 Sep 2021 Oct 2021 Nov 2021 Dec 2021 Jan 2022
Negative
Positive
May 20210
4
2
8
6
12
10
ECQ
ann
ounc
emen
t
ECQ
(NCR
)
MEC
Q
Ale
rt L
evel
4
Ale
rt L
evel
3
Ale
rt L
evel
2
Om
icro
n va
riant
det
ecte
d
Seven-day moving average of daily tweet count
Jun 2021 Jul 2021 Aug 2021 Sep 2021 Oct 2021 Nov 2021 Dec 2021 Jan 2022
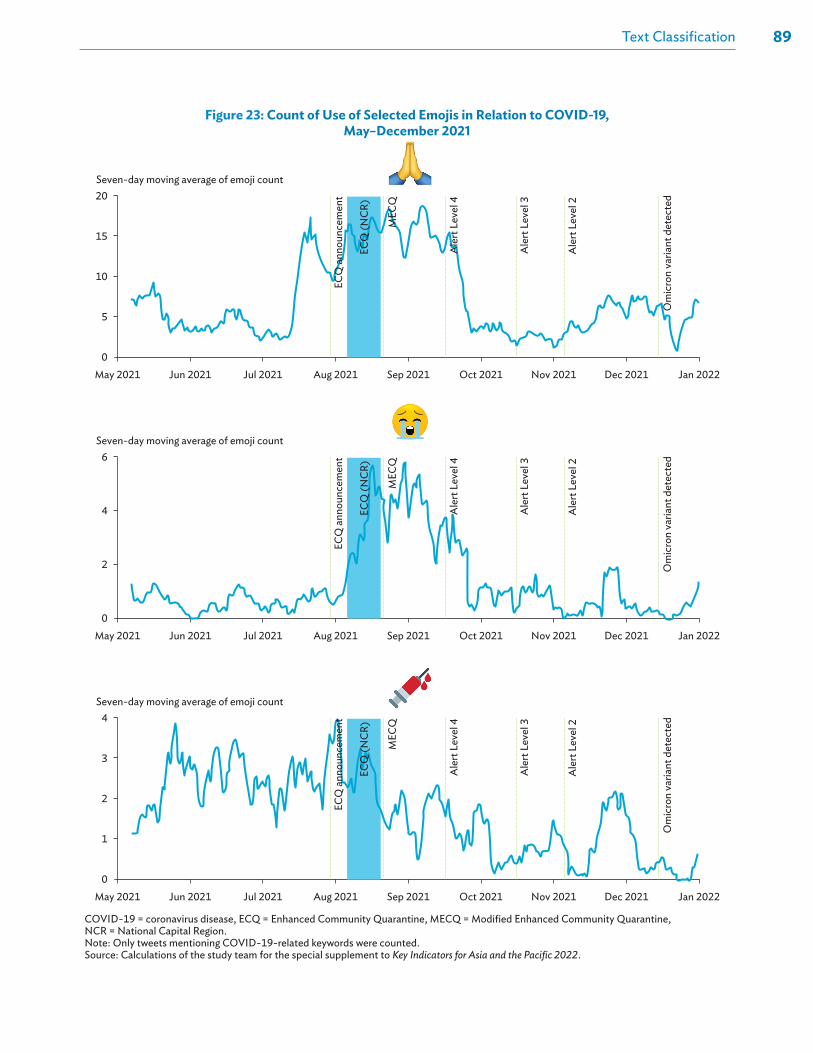
89Text Classification
Figure 23: Count of Use of Selected Emojis in Relation to COVID-19, May–December 2021
May 20210
5
10
15
20
ECQ
ann
ounc
emen
t
ECQ
(NCR
)
MEC
Q
Ale
rt L
evel
4
Ale
rt L
evel
3
Ale
rt L
evel
2
Om
icro
n va
riant
det
ecte
d
Seven-day moving average of emoji count
Jun 2021 Jul 2021 Aug 2021 Sep 2021 Oct 2021 Nov 2021 Dec 2021 Jan 2022
May 20210
2
4
6
ECQ
ann
ounc
emen
t
ECQ
(NCR
)
MEC
Q
Ale
rt L
evel
4
Ale
rt L
evel
3
Ale
rt L
evel
2
Om
icro
n va
riant
det
ecte
d
Seven-day moving average of emoji count
Jun 2021 Jul 2021 Aug 2021 Sep 2021 Oct 2021 Nov 2021 Dec 2021 Jan 2022
May 20210
1
2
3
4
ECQ
ann
ounc
emen
t
ECQ
(NCR
)
MEC
Q
Ale
rt L
evel
4
Ale
rt L
evel
3
Ale
rt L
evel
2
Om
icro
n va
riant
det
ecte
d
Seven-day moving average of emoji count
Jun 2021 Jul 2021 Aug 2021 Sep 2021 Oct 2021 Nov 2021 Dec 2021 Jan 2022
COVID-19 = coronavirus disease, ECQ = Enhanced Community Quarantine, MECQ = Modified Enhanced Community Quarantine, NCR = National Capital Region.Note: Only tweets mentioning COVID-19-related keywords were counted.Source: Calculations of the study team for the special supplement to Key Indicators for Asia and the Pacific 2022.

90 Mapping the Public Voice for Development—Natural Language Processing of Social Media Text Data
Integrating the Results with Social Weather Stations Surveys
To evaluate the work of the case study in a wider context, the findings from the social media text data analysis were related to survey results from the Social Weather Stations (SWS). The SWS is a Philippines-based research survey institute, conducting public opinion polls and surveys on various social indicators. Its relevant survey in relation to this case study is the Social Weather Survey. The Social Weather Survey is implemented on a quarterly basis via face-to-face interviews from a random sample of around 1,200 Filipino adults aged 18 years and older. The Social Weather Survey asks respondents questions on a number of social indicators, such as economic outlook and government satisfaction. There are, however, two questions asked in the Social Weather Survey that may enrich the insights produced in this case study.
One question asked in the Social Weather Survey is: “In your opinion, what will be the quality of your life in the coming 12 months? Would you say that your quality of life WILL BE BETTER, SAME, or WILL BE WORSE?”.27 The results during 2021 were as follows: The shares of optimists were 32%, 37%, 33%, and 45% for the first, second, third, and fourth quarter (Q) of 2021, respectively (SWS 2021a; SWS 2021b; SWS 2022). Apart from a dip in Q3, the overall trend for 2021 was one of growing optimism. Correspondingly, the shares of pessimists were 8%, 7%, 7%, and 3% for Q1, Q2, Q3, and Q4 of 2021, respectively (SWS 2021a; SWS 2021b; SWS 2022). The biggest drop in the difference between the proportions of optimists and pessimists—which happened when the Q3 survey was being conducted on 12–16 September 2021—coincided with the time when the highest number of positive and negative sentiments were being recorded on Twitter. This was when COVID-19 cases were high due to the Delta variant. Interestingly, these 5 days of surveying were part of the period when there was a sustained increase in use of the folded hands emoji, i.e., from mid-July to mid- September. Tweet activity during this period was also the highest.
Another pertinent question asked in the Social Weather Survey is: “Comparing your quality of life these days to how it was 12 months ago, would you say that your quality of life is BETTER NOW THAN BEFORE, SAME AS BEFORE, or WORSE NOW THAN BEFORE?”.28 A similar trend was observed in responses to this question as for the first question, although most people reported that their quality of life in 2021 was worse than in 2020. The shares of gainers were 15%, 18%, 13%, and 24% for Q1, Q2, Q3, and Q4 of 2021, respectively, again showing a dip in Q3 in an otherwise rising trend (SWS 2021a; SWS 2021b; SWS 2022). Meanwhile, the shares of losers were 53%, 49%, 57%, and 40% for Q1, Q2, Q3, and Q4 of 2021, respectively (SWS 2021a; SWS 2021b; SWS 2022). The greatest difference between gainers and losers, at –44%, was observed during the Q3 survey conducted on 12–16 September 2021, when the highest number of positive
27 The SWS refers to those who answered “will be better” as optimists, “same” as no change, and “will be worse” as pessimists.
28 The SWS refers to those who said their quality of life got better as “gainers” and those who said it was worse than before as “losers”.

91Text Classification
and negative tweets were being recorded. A steep improvement in the difference between gainers and losers, while still negative at –16%, was observed in the Q4 survey in mid-December 2021, as COVID-19 cases were declining, even though the first case of the Omicron variant had just been detected. The numbers of positive and negative tweets were lowest during this period.
Table 26 shows a comparison of Social Weather Survey results and VADER compound scores (average compound scores by sentiment, calculated by quarter). A trend of decreasing compound scores and optimist and gainer shares is observed from Q2 to Q3. Conversely, an increase across scores and shares for these measures is seen from Q3 to Q4. In general, sentiment analysis on tweets also reflects results from opinion surveys, even though they are not directly comparable because they are based on different contexts and refer to different samples of participants or users. Social media text data has the additional advantage of greater frequency.
Discussion
The information on public sentiment relating to the COVID-19 pandemic in the Philippines is potentially useful for policymakers when considering containment and recovery policies. For instance, similar patterns for both positive and negative sentiments during May–December 2021 suggest that Twitter users did not always respond one way to changes in the stringency levels of containment. That is, events appeared to have elicited both increases in positive and negative sentiments each time. This is consistent with the wide variation of people’s experiences of the pandemic. Greater stringency levels may have been welcomed as a protective public health measure for some Twitter users: for others, the increased levels of stringency elicited negative sentiments due to the impact on their livelihoods. Sentiment analysis can also provide another dimension to policy input: quantifying how Twitter users feel about the pandemic could indicate the level of social tolerance towards further curbs on personal
Table 26: Valence Aware Dictionary and sEntiment Reasoner Compound Scores and Social Weather Survey Results
Item Q2 2021 Q3 2021 Q4 2021
Average compound score (positive tweets) 0.57 a 0.55 0.59
Average compound score (negative tweets) –0.27 a –0.31 –0.26
SWS share of optimists 37% 33% 45%
SWS share of pessimists 7% 7% 3%
SWS share of gainers 18% 13% 24%
SWS share of losers 49% 57% 40%
Q = Quarter, SWS = Social Weather Stations.Note: Only tweets mentioning COVID-19-related keywords were counted.a May–June 2021 only.Source: Compiled by the study team for the special supplement to Key Indicators for Asia and the Pacific 2022.
92 Mapping the Public Voice for Development—Natural Language Processing of Social Media Text Data
mobility or the loosening of restrictions. By integrating social media sentiment analysis with other data sources, further analyses may yield more expansive insights and provide policymakers with information on which communities have disproportionate numbers of people reacting negatively to events.
In concluding, two limitations with this case study should be noted. First, the study’s observations are limited to Twitter users, which do not represent the entire population. Moreover, the text data analyzed were sensitive to the selection of keywords included. This implies that the sentiment is dependent on users who had the tendency to tweet based on the keywords specified. The data analysis methodology showcased may also add some bias in the measurement of sentiment as punctuation and emoji usage possibly varies by age group. Despite the fact that Filipino Twitter users are a significant portion of the population, we are unable to generalize our findings to the whole society. One possible solution is to expand the data collection to a diverse range of social networks, which serve different groups in society, so as to obtain a more comprehensive mapping of sentiment among social media users. The choice of which social media text data to use should then be aligned with the target demographic characteristics of the study population. The second limitation, as with the first case study in this report, is that the sentiment analysis here does not consider context- dependent information such as location information and Twitter interactions (like, retweet, reply, etc.).

93
Conclusions
Summary of Report
Natural language processing (NLP) helps to facilitate and accelerate the development of evidence-based policies. NLP systems can consolidate data, reduce noise inherent to that data, and assist in the extraction of shared emotions, messages, judgments, and feedback. It can provide quantitative support for hypotheses, assumptions, and discovered insights. This report discusses statistical techniques for structuring and representing text data in a computer-processable format. The “bag of words” (BoW) model, representing a corpus as a two-dimensional matrix of numbers, describes the number of times each term appeared in a collection of documents. The term- document matrix can be used to extract word vectors and document vectors, which represent a word and a document, respectively, in the corpus. These vectors can be further processed to identify keywords, key phrases, and topics as well as group together similar documents. The term-document matrix serves as the foundation for the methodologies and techniques presented in this report. Although the matrix can be used for a variety of purposes, it does not indicate which words are more significant than others. The term frequency - inverse document frequency (TF-IDF) weighting compensates for this limitation in establishing term relevance. While BoW vectors are easier to interpret, TF-IDF usually performs better, especially in machine-learning models. This report also presented NLP techniques for text analysis that are based on the BoW and TF-IDF models. These techniques include keyword extraction, document clustering, topic modeling, and text classification.
Limitations of the Bag of Words and Term Frequency - Inverse Document Frequency ModelsWhile the BoW and TF-IDF models may be used in many applications, both models have their limitations. First, both models suffer from the curse of dimensionality, a phenomenon that happens when high-dimensional data, such as those in a high- volume text corpus, are analyzed. Here, as the corpus’s vocabulary increases, so does the vector’s size. This phenomenon may lead the BoW and TF-IDF models to become computationally slow for large corpora and vocabularies, as well require a large amount of computer memory resources. Second, both models assume that each word provides different and independent evidence of a concept. “Typhoon”, “storm”, and “hurricane”, for instance, may all refer to the same event and appear in the same corpus, but, according to both the BoW and TF-IDF models, they are all distinct and independent words. Although the similarity between words can be determined by further processing, neither model inherently incorporates this functionality. Third, neither model takes sentence structure or word order into account. For instance,

94 Mapping the Public Voice for Development—Natural Language Processing of Social Media Text Data
the phrase “man bought defective phone” is equal to “defective man bought phone” under each model. Ignoring the word order in sentences or documents may result in incorrect data representation. This is where word embeddings come into play.
As with the BoW and TF-IDF models, word embeddings are based on the distributional hypothesis, which states that words occurring in similar contexts tend to have similar meanings (Harris 1954). However, word embeddings consider the words that precede and follow a word, presuming that the surrounding words provide context to the particular word. While BoW and TF-IDF models are also forms of embeddings, they are not referred to as embeddings because they involve sparse (i.e., the vector contains many zeros) and discrete (i.e., the elements in the vector are integers) vectors. The term “word embedding” is used to refer to dense real-valued vectors. As dense vectors, the dimensions of word embeddings are significantly smaller and are not dependent on the vocabulary size. Typically, word embeddings have 100, 200, or 300 dimensions. Studies may consider representing words and documents using embeddings, particularly when processing large text corpora.
Challenges in Handling User-Generated Content
Aggregating and analyzing text sources by means of NLP can be done with high efficiency. It is an opportunity to automate the generation of knowledge required for scientific research or decision-making based on evidence (Andrews 2003). While user- generated content (UGC) is an accessible and voluntarily contributed data resource, its use poses a number of data-related issues. The first challenge refers to the representation of data. While access to UGC is typically free, it is difficult to obtain complete and affordable “raw” data since most data sources are only accessible for a fee. One opportunity to access data includes using grants and programs offered by the data owners (e.g., CrowdTangle of Meta provides academic researchers access to some of the public data from “influential” Facebook pages and groups, Instagram accounts, and Subreddit). The second challenge is data velocity (i.e., the rate of increase in data volume and its relative accessibility). UGC, particularly social media data, is expanding at a rapid rate. While the massive increase in data presents technical challenges in terms of data retrieval and storage, the data must also be processed and, more importantly, utilized rapidly. The third and most relevant challenge is data authenticity. The internet’s participatory culture can be exploited to shape narratives and opinions. Manipulation may involve planting and/or amplifying particular narratives (Donovan and Friedberg 2019). People may post and/or interact with specific messages to increase the messages’ influence, with these actions possibly being coordinated on purpose. Additionally, digital tools such as “bots” may be used to automate this process. This poses a problem for the authenticity of the data and the discovered insights.

95Conclusions
To manage the huge volume of social media data, a large corpus can be divided into multiple, smaller subsets. This technique not only allows for more efficient processing but can also provide valuable insights into communities that share common demographic variables. Segmentation of social media data can be based on, for example, location, gender, and/or age as well as common opinions or interests being communicated. “Community detection” is the clustering of several users into groups in which the users within the group are more similar to one another than users outside the group (Tang and Liu 2010). For instance, the cohesiveness of a community may be based on the shared feelings of its members and their interactions with other members. These interactions may involve mentioning another user, following another user, and liking or sharing another user’s content. The enormous amount and variety of data in social networks can be structured in a more understandable way than when the data is processed as a whole. Lu et al. (2018) describes several community detection algorithms.
Data Governance and Ethics
The objective of NLP of social media text data is to derive valuable insights on citizens’ online attitudes, opinions, and behaviors. The responsible use of social media text data and NLP are, thus, of utmost importance to comply with ethical and technical standards and ultimately to enable a sustainable deployment of the insights derived. Jobin, Ienca, and Vayena (2019) developed, based on a comprehensive review of the literature on ethics guidelines around artificial intelligence, a set of five ethical principles (transparency, justice and fairness, nonmaleficence, responsibility, and privacy) that may also guide data science projects on NLP of social media text. In the following subsections, we briefly summarize 11 ethical principles identified by Jobin, Ienca, and Vayena (2019)29 in existing artificial intelligence guidelines.
Transparency
Transparency refers to efforts to improve the communication and disclosure of information about artificial intelligence by those developing or deploying such systems. Transparency is mostly promoted as a means to reduce harm and advance artificial intelligence. At the same time, some ethical guidelines emphasize its value for legal reasons or to encourage trust. Data use, human interaction with artificial intelligence, automated judgments, and the aim of data use or artificial intelligence system application are the principal domains of application.
29 The authors of this report appreciate the support of Jobin, Ienca, and Vayena (2019) and are grateful for permission to reference their publication The Global Landscape of AI Ethics Guidelines.

96 Mapping the Public Voice for Development—Natural Language Processing of Social Media Text Data
Justice, Fairness, and Equity
Justice is primarily defined as fairness as well as the prevention, monitoring, or mitigation of unwanted bias and discrimination. The preservation and promotion of justice are intended to be pursued through: (i) technical solutions; (ii) transparency; (iii) testing, monitoring, and auditing; (iv) developing or strengthening the rule of law and the right to appeal, recourse, redress, or remedy; and (v) through systemic changes and processes.
Nonmaleficence
Nonmaleficence refers to general calls for safety and security as well as the notion that artificial intelligence should never cause predictable or unintended harm. Discrimination, invasion of privacy, or bodily harm are all examples of harm. Technical solutions and governance strategies are the primary emphasis of harm- prevention guidelines. Proposed governance strategies include (i) active cooperation across disciplines and stakeholders, (ii) compliance with existing or new legislation, and (iii) the need to establish oversight processes and practices. To meet these requirements, technical solutions include in-built data quality evaluations or security and privacy by design.
Responsibility and Accountability
Responsibility and accountability is defined as acting with integrity and establishing the assignment of responsibility and legal obligation. Some guidelines recommend focusing on the underlying causes and processes that could contribute to possible harm, or emphasize the need for reporting potential harm and strive to promote diversity or introduce ethics into science, technology, engineering, and mathematics education. Various actors have been identified as being responsible for the behaviors and decisions of artificial intelligence.
Privacy
Privacy is viewed as a value to uphold as well as a right to be protected and it is commonly mentioned in conjunction with data protection and data security. Technical solutions, requests for additional research and awareness, and regulatory measures are the three types of suggested modes of achievement. Some guidelines suggest that privacy is linked to freedom or trust, while others suggest that it is linked to observance of laws and regulations.

97Conclusions
Beneficence
While promoting beneficence in ethical terms is frequently mentioned, it is rarely defined. Notable exceptions include the augmentation of human senses, well-being and flourishing, peace and happiness, socioeconomic opportunities, and economic prosperity. Strategies for the promotion of beneficence include aligning artificial intelligence with human values, advancing scientific understanding of the world, minimizing concentrations of political power or using such power for the benefit of human rights, working more closely with “affected” people, minimizing conflicts of interests, proving beneficence through customer demand and feedback, and developing new metrics and measurements for human well-being.
Freedom and Autonomy
While some sources emphasize freedom of expression or informational self- determination, as well as “privacy-protecting user controls”, others advocate for freedom, empowerment, or autonomy in general. Some documents define autonomy as “positive freedom”, such as the freedom to flourish, the right to democratic self- determination, or the right to form and develop connections with other people. Other publications are more concerned with “negative freedom,” such as freedom from technological experimentation, manipulation, or surveillance. Transparent and predictable artificial intelligence is thought to promote freedom and autonomy by neither “reducing options for and knowledge of citizens” and by actively improving people’s awareness of artificial intelligence by giving notice and consent.
Trust
Calls for trustworthy research and technology, trustworthy developers and organizations, and trustworthy design principles around artificial intelligence emphasize the importance of customer confidence on ethical issues. Overall trust in recommendations, judgments, and applications is crucial for artificial intelligence to fulfil its world-changing potential. To build trust, some artificial intelligence guidelines recommend that such technologies be transparent, comprehensible, or explainable, while others recommend that they fulfil public expectations.
Sustainability
Sustainability calls for the development and deployment of artificial intelligence with a focus on environmental protection, enhancing the planet’s ecosystems and biodiversity, contributing to more just and equal societies, and supporting peace. To attain this goal, artificial intelligence should be carefully designed, deployed, and managed to maximize energy efficiency and reduce environmental impact. Corporations are being challenged to develop policies that ensure accountability in the event of possible job losses as well as to use impediments as a driver of innovation.

98 Mapping the Public Voice for Development—Natural Language Processing of Social Media Text Data
Dignity
Dignity, which is intertwined with human rights, and means avoiding harm, forced acceptance, automated classification, and unknown human–technology contact, is becoming increasingly widespread in the field of artificial intelligence. It is also argued that artificial intelligence should respect, preserve, or even increase human dignity, but only if developers of such technology respect it first and new laws and regulations promote it.
Solidarity
According to several guidelines, a strong social safety net is required to absorb the impacts of artificial intelligence, as is the need to redistribute the benefits of technology so that social cohesion is not jeopardized. Sources also warn that data collection and related practices may weaken solidarity in favor of radical individualism.

99
References
J.L. Abitbol and A.J. Morales. 2021. Socioeconomic Patterns of Twitter User Activity. Entropy. 23 (6). 780. https://doi.org/10.3390/e23060780.
M. Alonso-Parra, C. Puente, A. Laguna, and R. Palacios. 2021. Analysis of Harassment Complaints to Detect Witness Intervention by Machine Learning and Soft Computing Techniques. Applied Sciences. 11 (17). 8,007. https://doi.org/10.3390/app11178007.
A. Amara, M.A. Hadj Taieb, and M. Ben Aouicha. 2021. Multilingual Topic Modeling for Tracking COVID-19 Trends Based on Facebook Data Analysis. Applied Intelligence. 51. pp. 3,052–3,073. https://doi.org/10.1007/s10489-020-02033-3.
M.W. Andrews. 2003. Language Learning and Nonlinear Dynamical Systems. http://citeseerx.ist.psu.edu/viewdoc/download?doi=10.1.1.58.9881&rep=rep1&type=pdf.
J. L. Austin. 1962. How To Do Things With Words: The William James Lectures delivered at Harvard University in 1955. Oxford, NY: Oxford At The Clarendon Press.
S. Baccianella, A. Esuli, and F. Sebastiani. 2010. SentiWordNet 3.0: An Enhanced Lexical Resource for Sentiment Analysis and Opinion Mining. http://www.lrec-conf.org/proceedings/lrec2010/pdf/769_Paper.pdf.
R. Baro and T. Palaoag. 2020. Disaster Sentiment Analysis: Addressing the Challenges of Decision-Makers in Visualizing Netizen Tweets. IOP Conference Series: Materials Science and Engineering. 803. 012039. https://doi.org/10.1088/1757-899X/803/1/012039.
M. Baroni. 2005. 39 Distributions in Text. In A. Ludeling and M. Kyto. Corpus Linguistics: An International Handbook Volume 2. Berlin, Philadelphia: Mouton de Gruyter.
H. Beigi. 2011. Phonetics and Phonology. In H. Beigi. Fundamentals of Speaker Recognition. Boston, MA: Springer US. https://doi.org/10.1007/978-0-387-77592-0_4.
Y. Bengio, R. Ducharme, P. Vincent, and C. Jauvin. 2003. A Neural Probabilistic Language Model. Journal of Machine Learning Research. 3. pp. 1,137–1,155.
Y. Bengio, H. Schwenk, J.S. Senecal, F. Morin, and J.L. Gauvain. 2006. Neural Probabilistic Language Models. In D.E. Holmes and L.C. Jain, eds. Innovations in Machine Learning: Studies in Fuzziness and Soft Computing Volume 194. Berlin, Heidelberg: Springer. https://doi.org/10.1007/3-540-33486-6_6.

100 References
J. Bennett, B. Rachunok, R. Flage, and R. Nateghi. 2021. Mapping Climate Discourse to Climate Opinion: An Approach for Augmenting Surveys with Social Media to Enhance Understandings of Climate Opinion in the United States. PLoS ONE. 16 (1). e0245319. https://doi.org/10.1371/journal.pone.0245319.
L. Bernabo. 2017. Communication History. In M. Allen, ed. The SAGE Encyclopedia of Communication Research Methods. Thousand Oaks, CA: SAGE Publishing, Inc. https://dx.doi.org/10.4135/9781483381411.n77.
M.W. Berry. 1992. Large-Scale Sparse Singular Value Computations. The International Journal of Supercomputing Applications. 6 (1). pp. 13–49. https://doi.org/10.1177/109434209200600103.
D.M. Blei. 2012. Probabilistic Topic Models. Communications of the ACM. 55 (4). pp. 77–84. https://doi.org/10.1145/2133806.2133826.
D.M. Blei, A.Y. Ng, and M.I. Jordan. 2003. Latent Dirichlet Allocation. Journal of Machine Learning Research. 3. pp. 993–1,022.
S. Boon-Itt and Y. Skunkan. 2020. Public Perception of the COVID-19 Pandemic on Twitter: Sentiment Analysis and Topic Modeling Study. JMIR Public Health and Surveillance. 6 (4). e21978. https://doi.org/10.2196/21978.
D.M. Boyd and N.B. Ellison. 2007. Social Network Sites: Definition, History, and Scholarship. Journal of Computer-Mediated Communication. 13 (1). pp. 210–230. https://doi.org/10.1111/j.1083-6101.2007.00393.x.
R. L. Boyd, A. Ashokkumar, S. Seraj, and J.W. Pennebaker. 2022. The Development and Psychometric Properties of LIWC-22. Austin, TX: University of Texas at Austin.
M.M. Bradley and P.J. Lang. 1999. Affective Norms for English Words (ANEW): Instruction Manual and Affective Ratings. https://pdodds.w3.uvm.edu/teaching/courses/2009-08UVM-300/docs/others/everything/bradley1999a.pdf.
P.B. Brandtzaeg and J. Heim. 2011. A Typology of Social Networking Sites Users. International Journal of Web Based Communities. 7 (1). 28. https://doi.org/10.1504/ijwbc.2011.038124.
K. Brown, ed. 2006. Encyclopedia of Language and Linguistics (second edition). Oxford: Elsevier Science.
C. Cherry, K. Scott, J. Barrett, and N. Pidgeon. 2018. Public Acceptance of Resource-Efficiency Strategies to Mitigate Climate Change. Nature Climate Change. 8 (11). pp. 1,007—1,012.

101References
Civic Web Media. 2022. Australia’s Most Popular Social Media Sites 2022. 17 January. https://www.civicwebmedia.com.au/australias-most-popular-social-media-sites/.
Communication Theory. De Fleur Model of Communication. https://www.communicationtheory.org/de-fleur-model-of-communication/.
Data Protocols. Web-Oriented Data Formats. http://dataprotocols.org/data-formats/.
DataReportal. 2022a. Digital 2022 Global Overview Report. https://datareportal.com/reports/digital-2022-global-overview-report.
DataReportal. 2022b. Global Social Media Statistics. https://datareportal.com/social-media-users.
DataReportal. 2022c. Digital 2022: The Philippines. https://datareportal.com/reports/digital-2022-philippines.
B. Debata, P. Patnaik, and A. Mishra. 2020. COVID-19 Pandemic! It’s Impact on People, Economy, and Environment. Journal of Public Affairs. 20 (4). E2372.
M.L. De Fleur and O.N. Larsen. 1958. The Flow of Information: An Experiment in Mass Communication. New Brunswick: Transaction Books.
S. Deerwester, S.T. Dumais, G.W. Furnas, T.K. Landauer, and R. Harshman. 1990. Indexing by Latent Semantic Analysis. Journal of the American Society for Information Science. 41. pp. 391–407. https://doi.org/10.1002/(SICI)1097-4571(199009)41:6<391::AID-ASI1>3.0.CO;2-9.
F. Dicks, T. Marks, E. Karafillakis, and M.A. Chambers. 2021. Vaccination as a Control Tool in Bovine Tuberculosis: Social Media Monitoring to Assess Public Response to Government Policy Development and Implementation. Vaccines. 9 (4). 314. https://doi.org/10.3390/vaccines9040314.
D. DeFranza, H. Mishra, and A. Mishra. 2020. How Language Shapes Prejudice Against Women: An Examination Across 45 World Languages. Journal of Personality and Social Psychology. 119 (1). pp. 7–22. https://doi.org/10.1037/pspa0000188.
J. Donovan and B. Friedberg. 2019. Source Hacking: Media Manipulation in Practice. https://datasociety.net/wp-content/uploads/2019/09/Source-Hacking_Hi-res.pdf.
Emojipedia. 2022. Emojipedia FAQ. https://emojipedia.org/faq/#:~:text=%F0%9F%91%89%20In%20total%20there%20are,%2C%20flag%2C%20and% 20other%20sequences.

102 References
A. Esuli and F. Sebastiani. 2006. SENTIWORDNET: A Publicly Available Lexical Resource for Opinion Mining. 5th Conference on Language Resources and Evaluation. Genoa: European Language Resources Association.
Food and Agriculture Organization of the United Nations (FAO), International Fund for Agricultural Development (IFAD), United Nations Children’s Fund (UNICEF), World Food Programme (WFP), and World Health Organization (WHO). 2021. The State of Food Security and Nutrition in the World 2021. Transforming Food Systems for Food Security, Improved Nutrition and Affordable Healthy Diets for All. Rome: FAO. https://doi.org/10.4060/cb4474en.
C. Fellbaum. 1998. WordNet: An Electronic Lexical Database (Language, Speech, and Communication). Cambridge, MA: The MIT Press.
J.R. Firth. 1957. Applications of General Linguistics. Transactions of the Philological Society. 56 (1). pp. 1–14. https://doi.org/10.1111/j.1467-968X.1957.tb00568.x.
G.W. Furnas, T.K. Landauer, L.M. Gomez, and S.T. Dumais. 1983. Statistical Semantics: Analysis of the Potential Performance of Keyword Information Systems. Bell System Technical Journal. 62 (6). pp. 1,753-1,806.
M. Galmiche. 1975. Sémantique Générative. Paris: Larousse.
K. Garcia and L. Berton. 2021. Topic Detection and Sentiment Analysis in Twitter Content Related to COVID-19 from Brazil and the USA. Applied Soft Computing. 101. 107057. https://doi.org/10.1016/j.asoc.2020.107057.
A. Gibson. 2010. Local by Social: How Local Authorities can Use Social Media to Achieve More for Less. https://media.nesta.org.uk/documents/local_by_social.pdf.
M. Goodchild. 2007. Citizens as Sensors: The World of Volunteered Geography. GeoJournal. 69. pp. 211–221. https://doi.org/10.1007/s10708-007-9111-y.
D. Greene and P. Cunningham. 2006. Practical Solutions to the Problem of Diagonal Dominance in Kernel Document Clustering. Proceedings of the International Conference on Machine Learning.
S. Grunder-Fahrer, A. Schlaf, G. Wiedemann, and G. Heyer. 2018. Topics and Topical Phases in German Social Media Communication During a Disaster. Natural Language Engineering. 24 (2). pp. 221–264. https://doi.org/10.1017/S1351324918000025.
Z.S. Harris. 1954. Distributional Structure. WORD. 10 (2–3). pp. 146–162. https://doi.org/10.1080/00437956.1954.11659520.

103References
W. He, H. Wu, G. Yan, V. Akula, and J. Shen. 2015. A Novel Social Media Competitive Analytics Framework with Sentiment Benchmarks. Information and Management. 52 (7). pp. 801–812.
A. Hounkpevi. 2020. Sentiment Analysis to Inform About the SDGs: Immigration in Colombia and Costa Rica. https://cepei.org/wp-content/uploads/2020/01/Sentimental-Analysis_V04.pdf.
T.W. Howard. 2010. Design to Thrive: Creating Social Networks and Online Communities that Last. Burlington, MA: Morgan Kaufmann Publishers.
H. Haider, C. Mcloughlin, and Z. Scott. 2011. Topic Guide on Communication and Governance. https://gsdrc.org/topic-guides/communication-and-governance/the-role-of-communication/.
A. Hussain, A. Tahir, Z. Hussain, Z. Sheikh, M. Gogate, K. Dashtipour, A. Ali, and A. Sheikh. 2021. Artificial Intelligence-Enabled Analysis of Public Attitudes on Facebook and Twitter Toward COVID-19 Vaccines in the United Kingdom and the United States: Observational Study. Journal of Medical Internet Research. 23 (4). e26627. https://doi.org/10.2196/26627.
C. Hutto. 2014. VADER Sentiment Analysis (source code). GitHub. 18 November. https://github.com/cjhutto/vaderSentiment.
C. Hutto and E. Gilbert. 2014. VADER: A Parsimonious Rule-Based Model for Sentiment Analysis of Social Media Text. 8th International AAAI Conference on Weblogs and Social Media. 8 (1). pp. 216–225. https://ojs.aaai.org/index.php/ICWSM/article/view/14550.
H. Hwang, S. An, E. Lee, S. Han, and C.H. Lee. 2021. Cross-Societal Analysis of Climate Change Awareness and Its Relation to SDG 13: A Knowledge Synthesis from Text Mining. Sustainability. 13 (10). pp. 55–96. https://doi.org/10.3390/su13105596.
Inter-Agency Task Force for the Management of Emerging Infectious Diseases (IATF). 2021. Finalized Guidelines on the Pilot Implementation of Alert Levels System for COVID-19 Response in the National Capital Region. https://www.officialgazette.gov.ph/downloads/2021/09sep/20210913-Certified-Guidelines-for-Pilot-Areas.pdf.
Intergovernmental Panel on Climate Change (IPCC). 2022a. IPCC Sixth Assessment Report: Climate Change 2022: Impacts, Adaptation and Vulnerability. https://www.ipcc.ch/report/ar6/wg2/.
———. 2022b. IPCC Sixth Assessment Report: Climate Change 2022: Mitigation of Climate Change. https://www.ipcc.ch/report/ar6/wg3/.
104 References
International Monetary Fund (IMF). 2020a. World Economic Outlook, April 2020: The Great Lockdown. https://www.imf.org/en/Publications/WEO/Issues/2020/04/14/weo-april-2020.
———. 2020b. World Economic Outlook, October 2020: A Long and Difficult Ascent. https://www.imf.org/en/Publications/WEO/Issues/2020/09/30/world-economic-outlook-october-2020.
T. Jabbarifar. 2014. The Importance Of Human Communication Systems and The Teaching Of The English Language. Journal of International Education Research. 10 (3). pp. 219–228. https://clutejournals.com/index.php/JIER/article/view/8741/8719.
M. Jamali, A. Nejat, S. Ghosh, F. Jin, and G. Cao. 2019. Social Media Data and Post-disaster Recovery. International Journal of Information Management. 44 (C). pp. 25–37.
H. Jelodar, Y. Wang, C. Yuan, X. Feng, X. Jiang, Y. Li, and L. Zhao. 2019. Latent Dirichlet Allocation (LDA) and Topic Modeling: Models, Applications, A survey. Multimedia Tools and Applications. 78 (11). pp. 15,169–15,211.
A. Jobin, M. Ienca, and E. Vayena. 2019. The Global Landscape of AI Ethics Guidelines. Nature Machine Intelligence. 1. pp. 389–399. https://doi.org/10.1038/s42256-019-008.
K.S. Jones. 1972. A Statistical Interpretation of Term Specificity and its Application in Retrieval. Journal of Documentation. 28 (1). pp. 11–21. https://doi.org/10.1108/eb026526.
S. Jordan, S. Hovet, I. Fung, H. Liang, K. Fu, and Z. Tse. 2018. Using Twitter for Public Health Surveillance from Monitoring and Prediction to Public Response. Data. 4 (1). 6. https://doi.org/10.3390/data4010006.
D. Jurafsky and J. Martin. 2020. Speech and Language Processing: An Introduction to Natural Language Processing, Computational Linguistics, and Speech Recognition (third edition draft). https://web.stanford.edu/~jurafsky/slp3/.
M. Karimiziarani, K. Jafarzadegan, P. Abbaszadeh, W. Shao, and H. Moradkhani. 2022. Hazard Risk Awareness and Disaster Management: Extracting the Information Content of Twitter Data. Sustainable Cities and Society. 77. 103577. https://doi.org/10.1016/j.scs.2021.103577.
L. Kaufman and P.J. Rousseeuw. 1990. Partitioning around Medoids (Program PAM). In L. Kaufman and P.J. Rousseeuw, eds. Finding Groups in Data: An Introduction to Cluster Analysis. pp. 68–125. Hoboken: John Wiley & Sons, Inc.
105References
N. Khurshid, A. Fiaz, and J. Khurshid. 2020. Analyzing the Impact of Gender Inequality on Economic Development in Pakistan: An ARDL Bound Test Cointegration Analysis. International Journal of Economics and Financial Issues. 10 (4). pp. 264– 270. https://doi.org/10.32479/ijefi.10028.
P. Lee, G. Kleinman, and C.H. Kuei. 2020. Using Text Analytics to Apprehend Urban Sustainability Development. SSRN Electronic Journal. https://doi.org/10.2139/ssrn.3536603.
LinkedIn. 2022. LinkedIn Talent Solutions. https://business.linkedin.com/talent-solutions.
B. Liu. 2010. Sentiment Analysis and Subjectivity. In N. Indurkhya and F. J. Damerau, eds. Handbook of Natural Language Processing (second edition). London/Boca Raton: Chapman and Hall/CRC.
Z. Lu, J. Wahlström, and A. Nehorai. 2018. Community Detection in Complex Networks via Clique Conductance. Scientific Reports. 8 (5982). https://doi.org/10.1038/s41598-018-23932-z.
R. Lukyanenko, J. Parsons, and Y.F. Wiersma. 2014. The IQ of the Crowd: Understanding and Improving Information Quality in Structured User-Generated Content. Information Systems Research. 25 (4). pp. 669–689. https://doi.org/10.1287/isre.2014.0537.
S. Luo and S.Y. He. 2021. Understanding Gender Difference in Perceptions Toward Transit Services Across Space and Time: A Social Media Mining Approach. Transport Policy. 111. pp. 63–73. https://doi.org/10.1016/j.tranpol.2021.07.018.
J. MacLennan. 2007. Interpersonal Communication for Canadians: An Interdisciplinary Approach. Oxford: Oxford University Press.
E. Mathieu. 2022. Commit to Transparent COVID Data Until the WHO Declares the Pandemic is Over. Nature. 22 February. https://www.nature.com/articles/d41586-022-00424-9.
C.A. Melton, O.A. Olusanya, N. Ammar, and A. Shaban-Nejad. 2021. Public Sentiment Analysis and Topic Modeling Regarding COVID-19 Vaccines on the Reddit Social Media Platform: A Call to Action for Strengthening Vaccine Confidence. Journal of Infection and Public Health. 14 (10). pp. 1,505–1,512. https://doi.org/10.1016/j.jiph.2021.08.010.
M. Meyer. 1986. From Logic to Rhetoric: Translated from the French Original Edition. Amsterdam, Philadelphia: John Benjamins Publishing Company.

106 References
S. Mighani. 2020. NLP Exploration of Global Warming Reddit Posts in Python Sentiment Analysis of Global Warming Narrative and Social Awareness. Towards Data Science. 4 August. https://towardsdatascience.com/global-warming-and-the-narrative-around-it-lessons-learned-from-nlp-exploration-of-reddit-posts-fb2918d500e9.
R. Mihalcea and P. Tarau. 2004. TextRank: Bringing Order into Text. Proceedings of the 2004 Conference on Empirical Methods in Natural Language Processing. pp. 404– 411. Barcelona: Association for Computational Linguistics.
I.B. Mohamad and D. Usman. 2013. Standardization and its Effects on K-means Clustering Algorithm. Research Journal of Applied Sciences, Engineering, and Technology. 6 (17). pp. 3,299–3,303.
M.A. Nowak, N.L. Komarova, and P. Niyogi. 2002. Computational and Evolutionary Aspects of Language. Nature. 417. pp. 611–617. http://dx.doi.org/10.1038/nature00771.
A. O’Keeffe, M. McCarthy, and R. Carter. 2007. From Corpus to Classroom: Language Use and Language Teaching. Cambridge: Cambering University Press.
Organization for Economic Co-operation and Development (OECD). 2020. OECD Policy Responses to Coronavirus (COVID-19): Culture shock: COVID-19 and the Cultural and Creative Sectors. https://www.oecd.org/coronavirus/policy-responses/culture-shock-covid-19-and-the-cultural-and-creative-sectors-08da9e0e/.
———. 2021. Priority Setting and Coordination of Research Agendas: Lessons Learned from COVID 19, Background Paper. https://www.oecd.org/sti/inno/Draft% 20background%20priority%20setting%20and%20coordination%20of%20research% 20agendascs.pdf.
P. Orgeira-Crespo, C. Míguez-Álvarez, M. Cuevas-Alonso, and E. Rivo-López. 2021. An Analysis of Unconscious Gender Bias in Academic Texts by Means of a Decision Algorithm. PLOS ONE. 16 (9). e0257903. https://doi.org/10.1371/journal.pone.0257903.
L. Ozawa-Meida, F. Ortiz-Moya, B. Painter, M. Hengesbaugh, R. Nakano, T. Yoshida, E. Zusman, and S. Bhattacharyya. 2021. Integrating the Sustainable Development Goals (SDGs) into Urban Climate Plans in the UK and Japan: A Text Analysis. Climate. 9 (6). 100. https://doi.org/10.3390/cli9060100.
J. Page, Z. Liechty, M. Huynh, and J. Udall. 2014. BamBam: Genome Sequence Analysis Tools for Biologists. BMC Research Notes. 7 (829). https://doi.org/10.1186/1756-0500-7-829.
107References
A. Paicu. 2017. Modern communication. Analele Universitatii “Constantin Brancusi” Din Targu Jiu.Serie Litere Si Stiinte Sociale. 4 (4). pp. 210–218. https://www.proquest.com/openview/5ef901e6a8784cf58af2f9e72201eed7/1.pdf?cbl=2029203&pq-origsite=gscholar.
M. J. Park, D. Kang, J. J. Rho, and D. H. Lee. 2015. Policy Role of Social Media in Developing Public Trust: Twitter Communication with Government Leaders. Public Management Review. 18 (9). pp. 1,265–1,288. https://doi.org/10.1080/ 14719037.2015.1066418.
J.W. Pennebaker, M. Francis, and R. Booth. 2001. Linguistic Inquiry and Word Count: LIWC 2001. Mahwah, NJ: Lawrence Erlbaum Associates.
J.W. Pennebaker, C.K. Chung, M. Ireland, A. Gonzales, and R.J. Booth. 2007. The Development and Psychometric Properties of LIWC2007. Austin, TX: LIWC.net.
J.W. Pennebaker, R.L. Boyd, K. Jordan, and K. Blackburn. 2015. The Development and Psychometric Properties of LIWC2015. Austin, TX: University of Texas at Austin.
J. Pérez, A. Pérez, A. Casillas, and K. Gojenola. 2018. Cardiology Record Multi-Label Classification Using Latent Dirichlet Allocation. Computer Methods and Programs in Biomedicine. 164. pp. 111—119.
A. Pisarski and P. Ashworth. 2013. The Citizen’s Round Table Process: Canvassing Public Opinion on Energy Technologies to Mitigate Climate Change. Climatic Change. 119 (2). pp. 533—546.
J. Porciello, M. Ivanina, M. Islam, S. Einarson, and H. Hirsh. 2020. Accelerating Evidence-informed Decision-making for the Sustainable Development Goals Using Machine Learning. Nature Machine Intelligence. 2. pp. 559–565. https://doi.org/10.1038/s42256-020-00235-5.
J. Preece. 2000. Online Communities: Designing Usability, Supporting Sociability. Industrial Management & Data Systems. 100 (9). pp. 459–460. https://doi.org/10.1108/imds.2000.100.9.459.3.
Princeton University. WordNet: A Lexical Database for English. https://wordnet.princeton.edu/.
A.N. Rana. 2020. Leveraging Big Data to Advance Gender Equality. https://www.ifc.org/wps/wcm/connect/24721437-3f10-4e7b-9177-eb067d188d4c/EMCompass-Note-86-Big-Data-and-Gender-v2.pdf?MOD=AJPERES&CVID=nbNtqBX.

108 References
J. Rasmussen and Ø. Ihlen. 2017. Risk, Crisis, and Social Media. Nordicom Review. 38 (2). pp. 1–17. http://dx.doi.org/10.1515/nor-2017-0393.
M.P. Rodríguez Bolívar. 2015. The Influence of Political Factors in Policymakers’ Perceptions on the Implementation of Web 2.0 Technologies for Citizen Participation and Knowledge Sharing in Public Sector Delivery. Information Polity. 20 (2–3). pp. 199–220. https://doi.org/10.3233/ip-150365.
J.M. Rohrer, M. Brümmer, S.C. Schmukle, J. Goebel, and G.G. Wagner. 2017. “What Else are You Worried About?” – Integrating Textual Responses into Quantitative Social Science Research. PLOS ONE. 12 (7). e0182156. https://doi.org/10.1371/journal.pone.0182156.
S. Rose, D. Engel, N. Cramer, and W. Cowley. 2010. Automatic Keyword Extraction from Individual Documents. Text Mining: Applications and Theory. 1. pp. 1–20.
M.J. Rosenfeld, R.J. Thomas, and S. Hausen. 2019. Disintermediating your Friends: How Online Dating in the United States Displaces Other Ways of Meeting. PNAS. 116 (36). pp. 17,753–17,758. https://www.pnas.org/doi/10.1073/pnas.1908630116.
G. Salton. 1963. Some Hierarchical Models for Automatic Document Retrieval. American Documentation. 14 (3). pp. 213–222. https://doi.org/10.1002/asi.5090140307.
J. Samuel, G.G.M.N. Ali, M.M. Rahman, E. Esawi, E., and Y. Samuel. 2020. COVID-19 Public Sentiment Insights and Machine Learning for Tweets Classification. Information. 11 (6). 314. https://doi.org/10.3390/info11060314.
F. Sarracino, T. Greyling, K.J. O’Connor, C. Peroni, and S. Rossouw. 2021. A Year of Pandemic: Levels, Changes and Validity of Well-Being Data from Twitter. Evidence from Ten Countries. IZA Discussion Papers. No. 14903. Bonn: Institute of Labor Economics (IZA).
D. Schillinger, R. Balyan, S.A. Crossley, D.S. McNamara, J.Y. Liu, and A.J. Karter. 2020. Employing Computational Linguistics Techniques to Identify Limited Patient Health Literacy: Findings from the ECLIPPSE Study. Health Services Research. 56 (1). pp. 132–144. https://doi.org/10.1111/1475-6773.13560.
C.E. Shannon and W. Weaver. 1949. The Mathematical Theory of Communication. Urbana: University of Illinois Press.
S. Shaumyan. 2006. Signs, Mind, and Reality: A Theory of Language as the Folk Model of the World. Philadelphia: John Benjamins Publishing Company.

109References
C. Shirky. 2008. Here Comes Everybody: The Power of Organizing Without Organizations. New York: Penguin Press.
SIL International. https://www.sil.org/.
M. Skoric, J. Liu, and K. Jaidka. 2020. Electoral and Public Opinion Forecasts with Social Media Data: A Meta-Analysis. Information. 11 (4). 187. https://doi.org/10.3390/info11040187.
Social Weather Stations. 2021a. Third Quarter 2021 Social Weather Report | September 12–16 National Survey. Quezon City.
———. 2021b. Second Quarter 2021 Social Weather Report | June 23–26 National Survey. Quezon City.
———. 2022. Fourth Quarter 2021 Social Weather Report | December 12–16 National Survey. Quezon City.
C.R. Soriano, M.D.G. Roldan, C. Cheng, and N. Oco. 2016. Social Media and Civic Engagement during Calamities: The Case of Twitter Use During Typhoon Yolanda. Philippine Political Science Journal. 37 (1). pp. 6–25. https://doi.org/10.1080/ 01154451.2016.1146486.
StatCounter. 2022. Social Media Stats Australia. https://gs.statcounter.com/social-media-stats/all/australia (accessed 30 April 2022).
Statista. 2021. Main Source of News in Selected Countries Worldwide 2020. https://www.statista.com/statistics/198765/main-source-of-international-news-in-selected-countries/ (accessed 9 May 2022).
A. Stavans and L. Tolchinsky. 2020. A Multidimensional Perspective on Written Language Development (Una Perspectiva Multidimensional del Desarrollo del Lenguaje Escrito). Journal for the Study of Education and Development. 44 (1). pp. 1–8. https://doi.org/10.1080/02103702.2020.1848094.
P.J. Stone, D.C. Dunphy, M.S. Smith, and D.M. Ogilvie. 1966. General Inquirer. Cambridge, MA: MIT Press.
M.T. Sultan, F. Sharmin, A. Badulescu, D. Gavrilut, and K. Xue. 2021. Social Media- Based Content Towards Image Formation: A New Approach to the Selection of Sustainable Destinations. Sustainability. 13 (8). 4241. https://doi.org/10.3390/su13084241.
110 References
S.S.S. Syahirah, F.B. Hamzah, M.B. Hashim, and Z. Samsudin. 2018. Child Marriage in the 21st Century: Sentiment and Semantic Analysis Via Social Media Intelligence. Proceedings of the 7th International Conference on Kansei Engineering and Emotion Research 2018. pp. 748–757. https://doi.org/10.1007/978-981-10-8612-0_78.
L. Tang and H. Liu. 2010. Community Detection and Mining in Social Media. Synthesis Lectures on Data Mining and Knowledge Discovery. 2 (1). pp. 1–137. San Rafael, CA: Morgan & Claypool Publishers. https://doi.org/10.2200/S00298ED1V01Y201009DMK003.
B. Takahashi, E. Tandoc, and C. Carmichael. 2015. Communicating on Twitter During a Disaster: An Analysis of Tweets During Typhoon Haiyan in the Philippines. Computers in Human Behavior. 50. pp. 392–398. https://doi.org/10.1016/j.chb.2015.04.020.
R. L. Thorndike. 1953. Who Belongs in the Family? Psychometrika. 18 (4). pp. 267–276.
B. Trapti. 2018. An Optimization Model for the World Food Programme’s “Protracted Relief and Recovery Operations” in Chad. Ann Arbor, MI: University of Missouri - Columbia ProQuest Dissertations Publishing.
Z. Tufekci. 2017. Twitter and Tear Gas: The Power and Fragility of Networked Protest. New Haven CT: Yale University Press.
P.D. Turney. 2000. Learning Algorithms for Keyphrase Extraction. Information Retrieval. 2. pp. 303–336. https://doi.org/10.1023/A:1009976227802.
United Nations (UN). 2020a. United Nations Comprehensive Response to COVID-19. https://www.unwto.org/sites/default/files/news/pdf/Comprehensive-COVID-report-mock-up-v4.pdf.
———. 2020b. Shared Responsibility, Global Solidarity: Responding to the Socio-economic Impacts of COVID-19. https://www.un.org/sites/un2.un.org/files/sg_report_socio-economic_impact_of_covid19.pdf.
———. 2020c. The Need for Data Innovations in the Time of COVID-19. https://unstats.un.org/sdgs/report/2020/the-need-for-data-innovations-in-the-time-of-COVID-19/.
———. 2021. The Sustainable Development Goals Report. https://unstats.un.org/sdgs/report/2021/The-Sustainable-Development-Goals-Report-2021.pdf.

111References
UN Department of Economic and Social Affairs (UNDESA). 2021. World Economic Situation and Prospects: November 2021 Briefing, No. 155. United Nations: Department of Economic and Social Affairs Economic Analysis. 1 November. https://www.un.org/development/desa/dpad/publication/world-economic-situation-and-prospects-november-2021-briefing-no-155/.
UN Development Programme (UNDP). Goal 5: Gender Equality. https://www.undp.org/malaysia/sustainable-development-goals#gender-equality.
———. Goal 6: Clean Water and Sanitation. https://www.undp.org/malaysia/sustainable-development-goals#clean-water-and-sanitation.
UN Development Programme (UNDP) and Oxford Poverty and Human Development Initiative (OPHDI). 2020. Charting Pathways Out of Multidimensional Poverty: Achieving the SDGs. https://hdr.undp.org/sites/default/files/2020_mpi_report_en.pdf.
UN Statistics Division (UNSD). 2019. SDG Indicators: Ensure Healthy Lives and Promote Well-being for all at all Ages. https://unstats.un.org/sdgs/report/2019/goal-03/.
Unicode. Unicode 14.0 Character Code Charts. http://www.unicode.org/charts/index.html.
I. Vayansky, S. Kumar, and Z. Li. 2019. An Evaluation of Geotagged Twitter Data during Hurricane Irma Using Sentiment Analysis and Topic Modeling for Disaster Resilience. 2019 IEEE International Symposium on Technology and Society (ISTAS). pp.1–6. https://doi.org/10.1109/ISTAS48451.2019.8937859.
C. Villavicencio, J.J. Macrohon, X.A. Inbaraj, J.H. Jeng, and J.G. Hsieh. 2021. Twitter Sentiment Analysis towards COVID-19 Vaccines in the Philippines Using Naïve Bayes. Information. 12. 204. https://doi.org/10.3390/info12050204.
R.D. Wahyunengseh, S. Hastjarjo, and D.G. Suharto. 2018. Social Media and Poverty: Paradoxes of Communicating Poverty Issues on Social Media. Bisnis & Birokrasi: Jurnal Ilmu Administrasi dan Organisasi. 25 (3). pp. 120–127. https://doi.org/10.20476/jbb.v25i3.10049.
W. Weaver. 1955. Translation. In W.N. Locke and D.A. Booth, eds. Machine Translation of Languages. Cambridge, MA: MIT Press. ISBN 0-8371-8434-7.
N. Weibel, P. Desai, L. Saul, A. Gupta, and S.J. Little. 2017. HIV Risk on Twitter: The Ethical Dimension of Social Media Evidence-based Prevention for Vulnerable Populations. Proceedings of the 50th Hawaii International Conference on System Sciences. pp. 1775–1784. https://mhealth.md2k.org/images/Pdfs/Weibel_etal.pdf.

112 References
M.J. Widener and W. Li. 2014. Using Geolocated Twitter Data to Monitor the Prevalence of Healthy and Unhealthy Food References across the US. Applied Geography. 54. pp. 189–197. https://doi.org/10.1016/j.apgeog.2014.07.017.
U. Widyanarko and D. Hizbaron. 2020. Urban Response Towards Tropical Cyclone Using Twitter in Indonesia. IOP Conference Series: Earth and Environmental Science. 451. 012098. https://doi.org/10.1088/1755-1315/451/1/012098.
A.T. Wilson and P. A. Chew. 2010. Term Weighting Schemes for Latent Dirichlet Allocation. Human Language Technologies: The 2010 Annual Conference of the North American Chapter of the Association for Computational Linguistics. pp. 465– 473. Los Angeles, California: Association for Computational Linguistics.
World Health Organization (WHO). 2020. Impact of COVID-19 on People´s Livelihoods, Their Health and Our Food Systems. 13 October. https://www.who.int/news/item/13-10-2020-impact-of-covid-19-on-people’s-livelihoods-their-health-and-our-food-systems.
A.H. Wu. 2020. Gender Bias among Professionals: An Identity-Based Interpretation. The Review of Economics and Statistics. 102 (5). pp. 867–880. https://doi.org/10.1162/rest_a_00877.
J. Xie, Z. Zhang, X. Liu, and D. Zeng. 2021. Unveiling the Hidden Truth of Drug Addiction: A Social Media Approach Using Similarity Network-Based Deep Learning. Journal of Management Information Systems. 38 (1). pp. 166–195. https://doi.org/10.1080/07421222.2021.1870388.
H. Xu, Z. Zhang, L. Wu, and C.J. Wang. 2019. The Cinderella Complex: Word Embeddings Reveal Gender Stereotypes in Movies and Books. PLOS ONE. 14 (11). e0225385. https://doi.org/10.1371/journal.pone.0225385.
J. Xue, J. Chen, C. Chen, C. Zheng, S. Li, and T. Zhu. 2020. Public Discourse and Sentiment during the COVID 19 Pandemic: Using Latent Dirichlet Allocation for Topic Modeling on Twitter. PLoS ONE. 15 (9). e0239441. https://doi.org/10.1371/journal.pone.0239441.
T. Zhang, S. Shen, C. Cheng, K. Su, and X. Zhang. 2021. A Topic Model-Based Framework for Identifying the Distribution of Demand for Relief Supplies Using Social Media Data. International Journal of Geographical Information Science. 35 (11). pp. 2,216–2,237. https://doi.org/10.1080/13658816.2020.1869746.
W. Zhao, W. Zou, and J.J. Chen. 2014. Topic Modeling for Cluster Analysis of Large Biological and Medical Datasets. BMC Bioinformatics. 15 (S11). https://doi.org/10.1186/1471-2105-15-S11-S11.

113References
W. Zhao, J.J. Chen, R. Perkins, Z. Liu, W. Ge, Y. Ding, and W. Zou. 2015. A Heuristic Approach to Determine an Appropriate Number of Topics in Topic Modeling. BMC Bioinformatics. 16 (S8). https://doi.org/10.1186/1471-2105-16-S13-S8.
G.K. Zipf. 1935. The Psychobiology of Language. Boston, MA: Houghton-Mifflin.

114
LIWC. Introducing LIWC-22: A New Set of Text Analysis Tools at your Fingertips. https://www.liwc.app/ (accessed 20 May 2022).
Python Package Index (PyPI). emot 3.1. https://pypi.org/project/emot/ (accessed 30 April 2022).
———. emoji 1.7.0. https://pypi.org/project/emoji/ (accessed 30 April 2022).
———. gensim 4.2.0. https://pypi.org/project/gensim/ (accessed 30 April 2022).
———. nltk 3.7. https://pypi.org/project/nltk/ (accessed 30 April 2022).
———. numpy 1.23.0. https://pypi.org/project/numpy/ (accessed 30 April 2022).
———. pandas. 1.4.3. https://pypi.org/project/pandas/ (accessed 30 April 2022).
———. pyLDAvis 3.3.1. https://pypi.org/project/pyLDAvis/ (accessed 30 April 2022).
———. pyspellchecker 0.6.3. https://pypi.org/project/pyspellchecker/ (accessed 30 April 2022).
———. spacy 3.3.1. https://pypi.org/project/spacy/ (accessed 30 April 2022).
———. symspellpy 6.7.6. https://pypi.org/project/symspellpy/ (accessed 30 April 2022).
Python Software Foundation. re 2.0.9. https://docs.python.org/3/library/re.html (accessed 30 April 2022).
———. json 2.2.1. https://docs.python.org/3/library/json.html (accessed 30 April 2022).
Libraries


ASIAN DEVELOPMENT BANK6 ADB Avenue, Mandaluyong City1550 Metro Manila, Philippineswww.adb.org
Mapping the Public Voice for Development—Natural Language Processing of Social Media Text DataA Special Supplement of Key Indicators for Asia and the Pacific 2022
This special supplement to Key Indicators for Asia and the Pacific 2022 introduces natural language processing techniques on social media text data and showcases these techniques in two case studies. The first case study analyzes public sentiments on coronavirus disease (COVID-19) in the Philippines while the second case study explores the public debate on climate change in Australia. The special supplement supports policymakers and researchers in Asia and the Pacific to better comprehend the public perspective on specific issues within the burgeoning volume of social media text data.
About the Asian Development Bank
ADB is committed to achieving a prosperous, inclusive, resilient, and sustainable Asia and the Pacific, while sustaining its efforts to eradicate extreme poverty. Established in 1966, it is owned by 68 members —49 from the region. Its main instruments for helping its developing member countries are policy dialogue, loans, equity investments, guarantees, grants, and technical assistance.
Copyright © 2022 FDOKUMEN