
MANAGEMENT INFORMATION REQUIREMENTS FOR ...
53
MASTER THESIS MANAGEMENT INFORMATION REQUIREMENTS FOR CUSTOMER RELATIONSHIP MANAGEMENT IN MUNICIPALITIES Rudo Denneman SCHOOL OF MANAGEMENT AND GOVERNANCE EXAMINATION COMMITTEE MAURICE VAN KEULEN CHINTAN AMRIT WALTER KLEINSMAN RAYMOND SLOT DOCUMENT NUMBER Version: 2012-08-07 9/8/2012
-
Upload
khangminh22 -
Category
Documents
-
view
2 -
download
0
Transcript of MANAGEMENT INFORMATION REQUIREMENTS FOR ...

MASTER THESIS
MANAGEMENT
INFORMATION
REQUIREMENTS FOR
CUSTOMER RELATIONSHIP
MANAGEMENT IN
MUNICIPALITIES
Rudo Denneman
SCHOOL OF MANAGEMENT AND GOVERNANCE EXAMINATION COMMITTEE MAURICE VAN KEULEN CHINTAN AMRIT WALTER KLEINSMAN RAYMOND SLOT
DOCUMENT NUMBER
Version: 2012-08-07
9/8/2012
I
Management summary
Management summary
This research project looks into the management information requirements of municipalities in the Netherlands, related to their customer relationship program. Information requirements engineering methodologies for data warehouses are reviewed and a method is proposed based on its perceived suitability for the municipality context. The used methodology by Winter and Strauch matches information requirements elicitation with analyses of the data sources to get an overview of requirements and whether they are attainable. Results are a list of management information requirement, representation requirements and an advice to Exxellence Group on how they can foresee in this demand.
The resulting list of management information requirements seems to indicate that the management of client contact centres would like to see more management information than what it currently prescribed by the Antwoord© concept on which they have based their management information needs for the most part. The list was sent back to municipalities to allow them to comment and rate the information needs on their usefulness. Also, the COPC standard on which the Antwoord© indicators are based and the Antwoord© indicators themselves were compared to the results. The results seem to cover almost all of the COPC metrics except for several process areas that are not as relevant in the municipality context. Also potentially interesting additions to the results that could be made from the COPC standard have been identified. The indicators from the Antwoord© concept score relatively high in the ranking of information needs and are a solid basis for measurements.
Overall, the information needs voiced by municipalities are on an operational level to measure performance of departments and individual employees over time. To satisfy the information needs, Exxellence group will have to combine data from several back-office source systems along with other information from other sources such as customer satisfaction surveys. These sources will have to be identified per municipality due to the large variance in the types of back-office systems that are used in different municipalities. A data warehouse schema should be created that matches the information needs. The sources of information used to fill the data warehouse can then be identified per municipality.
In addition municipalities will have to access their processes and the training level of their personnel to see whether they are able to correctly capture all the information required to satisfy the information needs.
Acknowledgement I wish to thank my supervisors Maurice van Keulen and Chintan Amrit from the University of Twente as well as Walter Kleinsman and Raymond Slot of Exxellence Group. I am grateful for the advice and support they offered during the project and for their feedback on this master thesis.

II
Table of Contents
Table of Contents
Management summary ....................................................................................................................................... I
Table of Contents ............................................................................................................................................. II
1. Introduction ................................................................................................................................................... 1
1.1. Context ................................................................................................................................................... 1
1.2. Research setting ..................................................................................................................................... 2
1.3. Research objective ................................................................................................................................. 3
1.4. Research questions ................................................................................................................................. 3
1.5. Research approach ................................................................................................................................. 4
1.6. Outlook ................................................................................................................................................... 4
2. State of the Art – BI and information requirements engineering .................................................................. 6
2.1. Business Intelligence as a tool to improve service quality ..................................................................... 6
2.1.1 Customer relationship management .............................................................................................. 6
2.1.2 COPC-2000 CSP Standard ............................................................................................................ 7
2.1.3 Data warehousing .......................................................................................................................... 7
2.1.4 Business process management and service quality ....................................................................... 8
2.1.5 Representation of management information acquired through business intelligence ................... 9
2.2. Information requirements engineering for data warehousing ................................................................ 9
2.2.1 Supply-driven information requirements engineering ................................................................ 10
2.2.2 Demand-driven information requirements engineering .............................................................. 10
2.2.3 Goal-driven information requirements engineering .................................................................... 11
2.2.4 Hybrid information requirements engineering methods ............................................................. 12
3. Problem analysis ......................................................................................................................................... 13
4. Research method ......................................................................................................................................... 15
4.1. Method selection .................................................................................................................................. 15
4.1.1 Project properties ........................................................................................................................ 15
4.1.2 Evaluation of method types ......................................................................................................... 15
4.2. Method description ............................................................................................................................... 16
4.2.1 Initialization ................................................................................................................................ 17
4.2.2 ’As is’ analysis ............................................................................................................................ 17
4.2.3 ‘To be’ analysis ........................................................................................................................... 18
4.2.4 Remaining steps .......................................................................................................................... 20
4.3. Expected results ................................................................................................................................... 20
4.4. Validation ............................................................................................................................................. 21
5. Results......................................................................................................................................................... 22
5.1. Initialization ......................................................................................................................................... 22

III
Table of Contents
5.1.1 Target users ................................................................................................................................. 22
5.1.2 Dominant application type .......................................................................................................... 22
5.2. ‘As is’ analysis ..................................................................................................................................... 23
5.2.1 Actual information supply ........................................................................................................... 23
5.2.2 Aggregate information map ........................................................................................................ 24
5.2.3 Source information systems ........................................................................................................ 25
5.3. ‘To be’ analysis .................................................................................................................................... 25
5.3.1 Information demand .................................................................................................................... 25
5.3.2 Aggregate information supply and information demand match .................................................. 29
5.3.3 Priorities ...................................................................................................................................... 30
5.4. Information needs compared to the COPC-2000 CSP standard ........................................................... 30
6. Solution within the eMAXX application suite architecture ........................................................................ 32
6.1. eMAXX application suite architecture ................................................................................................. 32
6.2. Proposed solution and considerations .................................................................................................. 33
6.2.1 Data sources ................................................................................................................................ 33
6.2.2 Data quality ................................................................................................................................. 34
6.2.3 Privacy......................................................................................................................................... 35
6.2.4 Presentation ................................................................................................................................. 35
7. Conclusions ................................................................................................................................................. 36
8. References ................................................................................................................................................... 38
Appendix A: Abbreviations and glossary ....................................................................................................... 41
Abbreviations .............................................................................................................................................. 41
Glossary ...................................................................................................................................................... 41
Appendix B: Original interview questions (Dutch version) ........................................................................... 43
Appendix C: Description of information needs .............................................................................................. 44
Appendix D: Results table .............................................................................................................................. 48
Appendix E: COPC-2000 metrics ................................................................................................................... 49

1
Introduction
1. Introduction
The objective of this master thesis is to look into the management information needs of the client contact centre of municipalities and how these information needs can be satisfied. Chapter 1: “Introduction” provides the context, research setting as well as the research questions. In chapter 2: “State of the Art – BI and information requirements engineering” the context is related to literature and overview of possible approaches to answer the research questions are given. The problems are analysed in chapter 3: “Problem analysis”. Based on these problems, the context and the research questions a method for the project is chosen and described in chapter 4: “Research method”. The outcome of applying the research method in this context are presented in chapter 5: “Results”. Chapter 6: "Solution within the eMAXX application suite architecture” clarifies how the resulting management information needs can be satisfied. Finally chapter 7: “Conclusions” discusses the results and provides some additional directions on further steps to be taken to implement a solution for the management information needs.
1.1. Context
To increase the quality of its service and decrease administrative burdens, the government of the Netherlands has devised the Antwoord© concept. The Antwoord© concept aims to achieve these goals by providing the public (citizens and organizations) with a single point of interaction for almost all their questions for the government. That single point of contact is the customer contact centre or Klant Contact Centrum (KCC) of municipalities [1].
Antwoord© also strives to provide the public with an answer to their inquiry in the first moment of contact in 80% of the cases. Furthermore in the remaining 20% of the cases the client (again: citizen or organization) will only be referred once to a different institution or municipality employee. In all cases the channel of contact can be anything from a personal visit at the front desk to an e-mail or filling out a form on the municipality’s website [1].
Inquiries by the public can include anything related to government services and range from reporting a loose tile on the pavement to arranging a marriage or requesting information about federal student loans. Organizations can approach the municipalities’ KCC to request building permits and subsidies or questions about legislation. There are two government institutions that are exempt from this, namely the tax office (Belastingdienst) and the unemployment office (Uitvoeringsinstituut Werknemersverzekeringen - UWV) [2].
To achieve this, KCC employees require access to vast amounts of information on all subject areas of the governmental services in addition to the information required for their own domain. This information is to be provided by a knowledge base (Kennisbank in Figure 1) which contains domain knowledge. Cases take a central position in the working method of the KCC. The approach has been dubbed “zaakgericht werken” which translates to a case oriented approach. The idea is to create a catalogue (zaaktypecatalogus) of case types that can all be dealt with in the same fashion. Furthermore this approach makes it easier to register the types of incoming cases and the contact channels through which they are received giving valuable insight into the costs of municipality processes [2].

2
Introduction
Figure 1: Municipality front, mid and back-office example for customer support
As support for the Antwoord© concept, many municipalities have bought or are building a range of software solutions. These can be categorized as either front-office, mid-office or back-office systems (see Figure 1 for an overview). The front-office includes a Klant Contact Systeem (KCS) which supports the KCC. The mid-office is responsible for storage of cases and case types from the KCS as well as storing data retrieved from back-office systems and workflow management. The back-office contains (legacy) data sources of the municipality as well as data sources provided by the government.
These data sources offer a wealth of information that the municipalities could use to measure their progress on the stated goals of efficiency and quality of service. However at this point many of the municipalities are either unaware of the possibilities that this information offers or are unable to access the information in a way that offers them and overview of their progress.
Most municipalities are now focusing on the goals and indicators provided by the Antwoord© concept, which in turn adopted the indicators from the Customer Operations Performance Center Inc. (COPC) which is currently the industry standard [1, 3]. The municipality context differs from most industry customer contact centres because of the larger diversity of questions and processes that it has to handle. Due to this, additional goals and indicators may be desirable. This project evaluates the information needs of the municipality KCC.
1.2. Research setting
Exxellence Group is one of the suppliers of front and mid-office suites for municipalities, namely the eMAXX suite. The eMAXX FrontOffice offers the public (again, citizens and organizations) a set of channels to contact the municipality. This set includes internet, telephone, mail, e-mail, chat, text messages and visitors at the city hall. Some of these channels require KCC employees to enter the client information into the KCS to start case handling, others are started automatically. These

3
Introduction
systems are also linked to national services, for example DigiD and e-herkenning (e-recognition) which allows the public to identify themselves.
The eMAXX MidOffice is the enterprise service bus (ESB) that offers services to the front-office. The mid-office contains the eMAXX ZaakSysteem which is responsible for keeping track of case types, case instances, case-related documents and workflow management. In addition to the ZaakSysteem the Gegevens Magazijn and Gemeentelijke Kernregistraties are also part of the mid-office. These hold information required by the KCS such as personal and location data. The Gegevens Magazijn is fed data from several back-office systems either on-demand or in batches. Communication between mid and back-office systems is facilitated by middleware created by Exxellence Group. In some cases the back-office is also the place where legacy documents are stored in the document management system (DMS).
Currently Exxellence offers several statistics based on the cases and the efficiency with which they are processed. Exxellence believes their clients are interested in more sophisticated analyses of their KCS and customer contacts. However it is unknown which information municipalities would find useful, especially in the context of the Antwoord© concept.
A further description of the eMAXX solution can be found in the architecture overview in section 6.1.
1.3. Research objective
The objective of the research project is to ascertain the business intelligence needs of municipalities in context of the Antwoord© concept, determine the required data sources to foresee in the information needs and advice Exxellence on how to realize this as a solution within the eMAXX suite. A goal-driven information requirements engineering framework by Winter and Strauch[4] is used to elicit the requirements and match them to available data (see chapter 3). The management information gathered can help municipalities to better manage their business processes and so increase their service quality (Figure 2 on p. 6). The focus is on eliciting information requirements of the KCC. The advice to Exxellence considers these needs and points out which needs can be accommodated by Exxellence group and how.
1.4. Research questions
Based on the context and the assignment provided by Exxellence, the main research question was defined as follows:
“What are the business intelligence needs of the municipalities in the Netherlands regarding the Antwoord© concept and which of these needs can be satisfied using a BI solution as part of the eMAXX suite?”
In other words, what are the municipalities’ thoughts about the indicators provided by the Antwoord© concept. Are these sufficient or should additions be made. Furthermore, which of these information needs can be accommodated by Exxellence and how this solution would be integrated into the current eMAXX architecture.
The main question is decomposed into the following sub-questions.
1. What are business intelligence (BI) and the Antwoord©
concept?
1.1. What is business intelligence according to literature?
1.2. What is the Antwoord©
concept?
2. What are the management information needs of the municipality regarding Antwoord
© concept?
2.1. Which methodologies are available to gather management information and BI requirements?
2.2. What are the main problems regarding the collection of management information in municipalities?
2.3. Which management information requirements analysis methodology is most suited for the
municipality environment?

4
Introduction
2.4. For which positions within the Antwoord©
concept is BI required?
2.5. Which management information is requested by the municipality for its own use as well as the public?
2.6. What are the requirements concerning the representation of management information in
municipalities?
3. What data is required to satisfy the management information needs of the municipality?
3.1. From which sources can the data required to satisfy the management information needs be extracted?
3.2. Is the sources’ data quality sufficient to provide meaningful management information?
3.3. Are there privacy constrictions regarding the use of the data sources for management information?
4. How can the BI representation be integrated into future versions of the eMAXX suite?
4.1. What is the eMAXX suite and its architecture?
4.2. Can the BI solution be integrated into the (extended) eMAXX architecture and how?
4.3. Can the data correctness of the source systems be improved using eMAXX?
1.5. Research approach
The research questions as specified in section 1.4 are focused on 1:Describing the context and relating it to literature. 2: Identifying requirement elicitation techniques for data warehousing, selecting the most suited method and applying it. 3: Analyse data sources. 4: Studying the eMAXX architecture and advising Exxellence on how they can best help municipalities to access the required management information.
The context description is based on literature about the domain and initial conversations with employees of municipalities and Exxellence Group. Furthermore a literature study is performed to relate the contexts to concepts from literature. The literature study will produce an overview of methods available that can be used in the study.
After selecting a method that suits the project context, a qualitative study is performed to determine the management information needs of municipalities’ customer contact centres using interviews and by studying documents and reports about the management information that is currently available. The interviews are conducted at ten municipalities which are all customers of Exxellence Group. The transcripts of interviews and the documents are coded to identify information needs.
From the codes a list of information needs is compiled. In addition to the explicitly named information needs, the list also contained suggestions of information needs that were not specifically named during interviews or documents but were derived. The list is sent back to the municipalities for feedback. Several municipalities responded and based on the feedback the list is prioritized based on perceived usefulness of the information needs.
With help of domain experts, possible sources for the required management information are identified. Based on these findings, an advice for Exxellence Group on how to satisfy the management information needs is given in section 6.2.
1.6. Outlook
The traceability matrix below indicates for each of the sub-questions in which section of the thesis they are answered.
Table 1: Research question traceability matrix
Sub-questions Section(s)
1.1 What is business intelligence according to literature? 2.1
1.2 What is the Antwoord© concept? 1.1
2.2 What are the main problems regarding the collection of management information in municipalities?
3

5
Introduction
2.1 Which methodologies are available to gather management information and BI requirements?
2.2
2.3 Which management information requirements analysis methodology is most suited for the municipality environment?
4.1
2.4 For which positions within the Antwoord© concept is BI required? 5.1.1
2.5 Which management information is requested by the municipality for its own use as well as the public?
5.3.1
2.6 What are the requirements concerning the representation of management information in municipalities?
6.2
3.1 From which sources can the data required to satisfy the management information needs be extracted?
5.3.2
3.2 Is the sources’ data quality sufficient to provide meaningful management information? 6.2.2
3.3 Are there privacy constrictions regarding the use of the data sources for management information?
6.2.3
4.1 What is the eMAXX suite and its architecture? 1.2, 6.1
4.2 Can the BI solution be integrated into the (extended) eMAXX architecture and how? 6.2
4.3 Can the data correctness of the source systems be improved using eMAXX? 6.2.2

6
State of the Art – BI and information requirements engineering
2. State of the Art – BI and information requirements engineering
Several of the Antwoord© concepts building blocks aren’t novel ideas. They are based on the idea of Business Intelligence (BI), customer relationship management (CRM), business process management (BPM) and data warehousing (DW). This first part of this chapter is an overview of these concepts and how they are interrelated (Figure 2). Also it discusses how BI can be represented. The second part describes literature about requirements engineering methods for data warehousing and business intelligence needed to elicit the management information requirements for the municipalities.
2.1. Business Intelligence as a tool to improve service quality
BI is most commonly defined as the technologies behind data gathering, data storage, analytics and knowledge management in order to support decision making [5-7] or in a broader definition as all activities and components of integrating data into knowledge [8, 9].BI can be used for a range of application such as order shipment, customer support, user profiling, claims analysis and fraud detection. Representation of BI often takes the form of spreadsheets or web applications to track key performance indicators [5]. More representation forms are discussed in 2.1.5.
For municipalities, customer support and improvement of customer support quality are the main drivers. Other uses might include managing processes by checking unsolved cases per case type, department or input channel as well as customer segmentation. As can be seen in Figure 2, CRM systems as well as data gathered in a data warehouse from the mid and back-office systems are possible sources for business intelligence. BI can also provide managers with process performance information to be used for monitoring and improving processes. Improved processes should then result in improved service quality for customers. As mentioned in the introduction, one of the primary goals of Antwoord© is improving the quality of the government services [1].
Figure 2: Concepts overview: Business intelligence to improve service quality
2.1.1 Customer relationship management
Customer relationship management (CRM) is an attempt to provide the customer with a more intimate experience of their contact with an organization. This intimacy was lost over time due to its cost ineffectiveness and the increase of sales volumes [10]. At the same time CRM gives organizations the opportunity to learn more about their customers’ preferences. CRM systems maximize the relationship between customer and organization by integrating contact channels and source systems to enable the organization to build a more personal relationship with its customers [11]. CRM systems help companies to increase performance through differentiation and cost reduction [12]. For governmental organizations the value of CRM lies in its ability to improve service quality and to reduce the costs of service [13].
The Antwoord© concept is similar to CRM in that it prescribes a single point of access for the public to access almost all government services through one system that integrates all channels of contact. This single point of access is the CRM system which is referred to as KCS in Antwoord©.
7
State of the Art – BI and information requirements engineering
Logging of all contact moments and integration with municipal back-office systems provides the KCS with the customer data to effectively maintain personal service for the public.
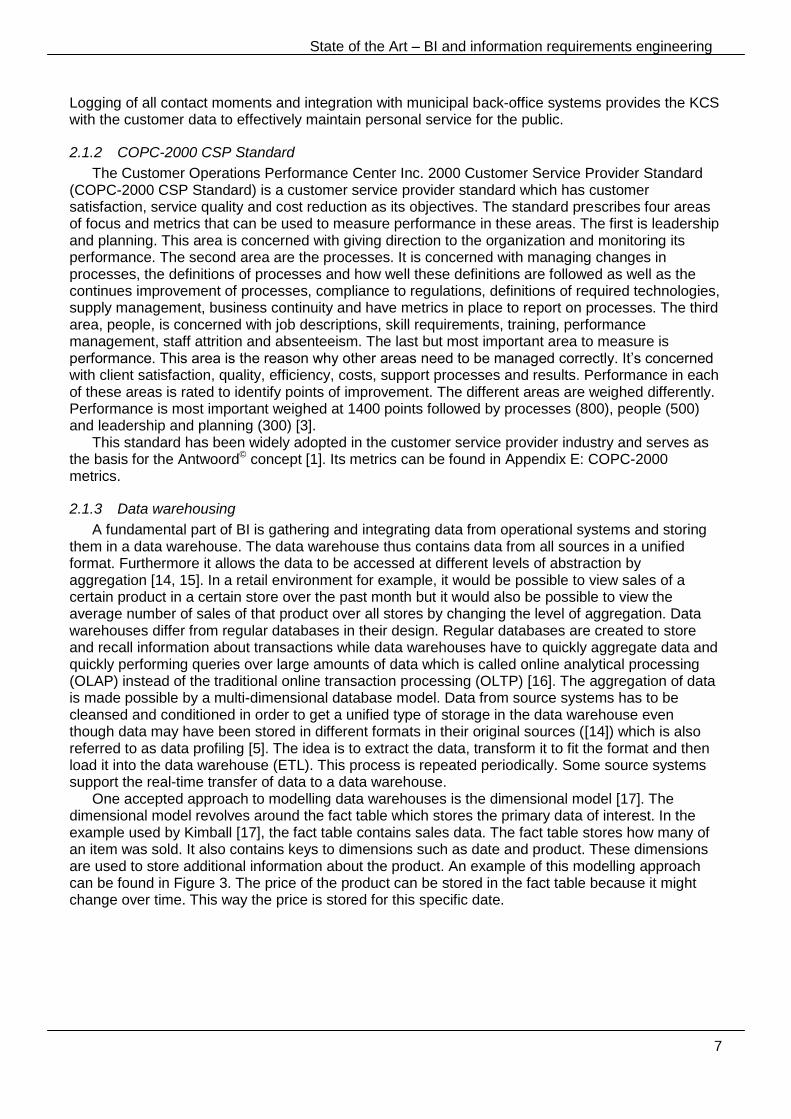
2.1.2 COPC-2000 CSP Standard
The Customer Operations Performance Center Inc. 2000 Customer Service Provider Standard (COPC-2000 CSP Standard) is a customer service provider standard which has customer satisfaction, service quality and cost reduction as its objectives. The standard prescribes four areas of focus and metrics that can be used to measure performance in these areas. The first is leadership and planning. This area is concerned with giving direction to the organization and monitoring its performance. The second area are the processes. It is concerned with managing changes in processes, the definitions of processes and how well these definitions are followed as well as the continues improvement of processes, compliance to regulations, definitions of required technologies, supply management, business continuity and have metrics in place to report on processes. The third area, people, is concerned with job descriptions, skill requirements, training, performance management, staff attrition and absenteeism. The last but most important area to measure is performance. This area is the reason why other areas need to be managed correctly. It’s concerned with client satisfaction, quality, efficiency, costs, support processes and results. Performance in each of these areas is rated to identify points of improvement. The different areas are weighed differently. Performance is most important weighed at 1400 points followed by processes (800), people (500) and leadership and planning (300) [3].
This standard has been widely adopted in the customer service provider industry and serves as the basis for the Antwoord© concept [1]. Its metrics can be found in Appendix E: COPC-2000 metrics.
2.1.3 Data warehousing
A fundamental part of BI is gathering and integrating data from operational systems and storing them in a data warehouse. The data warehouse thus contains data from all sources in a unified format. Furthermore it allows the data to be accessed at different levels of abstraction by aggregation [14, 15]. In a retail environment for example, it would be possible to view sales of a certain product in a certain store over the past month but it would also be possible to view the average number of sales of that product over all stores by changing the level of aggregation. Data warehouses differ from regular databases in their design. Regular databases are created to store and recall information about transactions while data warehouses have to quickly aggregate data and quickly performing queries over large amounts of data which is called online analytical processing (OLAP) instead of the traditional online transaction processing (OLTP) [16]. The aggregation of data is made possible by a multi-dimensional database model. Data from source systems has to be cleansed and conditioned in order to get a unified type of storage in the data warehouse even though data may have been stored in different formats in their original sources ([14]) which is also referred to as data profiling [5]. The idea is to extract the data, transform it to fit the format and then load it into the data warehouse (ETL). This process is repeated periodically. Some source systems support the real-time transfer of data to a data warehouse.
One accepted approach to modelling data warehouses is the dimensional model [17]. The dimensional model revolves around the fact table which stores the primary data of interest. In the example used by Kimball [17], the fact table contains sales data. The fact table stores how many of an item was sold. It also contains keys to dimensions such as date and product. These dimensions are used to store additional information about the product. An example of this modelling approach can be found in Figure 3. The price of the product can be stored in the fact table because it might change over time. This way the price is stored for this specific date.

8
State of the Art – BI and information requirements engineering
Figure 3: Star schema modelling example.
Data vault modelling is an approach advocated by D.E. Lindstedt in his Data Vault series [18]. It attempts to overcome problems associated with traditional data warehouse modelling by abstracting the stored information to business rule level. The idea is that business rules are modelled and then linked to the data. The model of business rules and keys is less likely to change than the underlying data structure. Data Vault modelling defines three levels of entities. Hub entities model business key entities, their origin systems and the time of loading. For example client account numbers loaded from systems across the organization. The customer business key would then link to all customers from different systems. This could mean that the same customer is included multiple times and ideally the duplicates would be linked. The link entities create links between different business keys. For example linking the customer to an order which would also be a business key. Finally the satellite entities contain information about a instances of a hub. An example design can be found in Figure 4.
Figure 4: Data vault modelling example with customer and order business keys.
New developments in real-time BI are based on Complex Event Processing (CEP) engines. CEP engines look for events or trends specified by the user issuing alerts when they occur. The input events are streamed towards the CEP engine before they are entered into the data warehouse and are therefore faster than traditional BI [5]. A limitation of current CEP systems is that they are unable to match historical event patterns with current event patterns although CEP engines are in development that match current event patterns with historical patterns from a database, for an example see DejaVu [19].
2.1.4 Business process management and service quality
One definition of BPM is “Supporting business processes using methods, techniques, and software to design, enact, control, and analyze operational processes involving humans, organizations, applications, documents and other sources of information.” [20]. Business process management revolves around the business process life-cycle comprised of four phases: diagnosis, process design, system configuration, process enactment [20]. Information gathered through BI can

9
State of the Art – BI and information requirements engineering
be used to analyse business processes during the diagnosis phase. Low granularity information is gathered which can be used by managers to analyse processes on a higher level [21]. In Antwoord©, elements of BPM can be found. For example Antwoord© prescribes the use of pre-defined cases, tracking of their progress and identifying possible areas of process improvement by monitoring their quality [1]. In addition, several key performance indicators are mentioned which are listed in Table 2. Additional service quality indicators could be part of the management information requirements.
2.1.5 Representation of management information acquired through business intelligence
In addition to the question which management information should be gathered there is also the issue of how it should be represented. There are several established ways to represent management information:
Dashboards are analogies to vehicle dashboards on which an overview of important information is
given. For business they present information aggregated from data about processes and financial
performance. For example revenue, profit, demand forecasts and performance indicators that show
progress of goals [22-24].
Balanced scorecards combine financial and non-financial performance indicators to give a balanced
overview of the organization. Often times four perspectives are used: Financial & market
characteristics, External relationships, Activities & processes and organization & culture which all
have their own performance indicators [25].
Spreadsheets present data in tables their uses include analysing cash flows, budgeting, planning and
resource allocation [26].
Reports provide information on given intervals. For example a weekly report can be generated by
the BI solution and published for users. Pre-set indicators are included every time the a report is
published [6].
Slice-and-Dice and Drill-Down is used to view data from different dynamical perspectives using
OLAP technology. This method used to determine the cause of exceptions in process as well as
forecasting the effect of changes [6].
Web analytics display how users interact with pages for example which pages generate the most
sales [5].
Ad-hoc queries are a complex method for extracting information from a BI solution. It involves
using SQL-queries specific to a certain business question [6].
Enterprise Search are a portal for users to perform searches over the combined enterprise data.
When preparing for a meeting with a customer, a user can perform a search and retrieve data from
multiple source systems that would otherwise require a search in each of these systems. For
example a user can retrieve financial data, e-mail, documents, and spreadsheets related to a specific
customer with one search [5].
2.2. Information requirements engineering for data warehousing
According to literature there are three phases in the data warehouse life-cycle: DW planning, data mart design and implementation and DW maintenance and evolution [27]. The subject of this research project is located partly in the first and second phases. The planning phase sets the scope and goals for the data warehouse as well as planning for the physical architecture and staffing. For this project the goals and scope are of importance because they could influence the requirements. During second phase, design and implementation, requirements analysis is performed as well as conceptual design, logical design, ETL process design and physical design. [27]. This project will mostly be concerned with the requirements analysis and conceptual design which are crucial since they are the main building blocks of the rest of the design [27]. However it will also deal with logical design and ETL process design if time permits. Physical design will be left out.
In order to determine the information needs of the municipalities a list of requirements will have to be gathered. There are many ways to gather requirements and a literature study is required to

10
State of the Art – BI and information requirements engineering
identify the methodology most suited for the municipality context. In literature, three groups of data warehouse information requirements engineering methods can be identified: supply-driven (data-driven), demand-driven (user-driven) and goal-driven (business-driven) [27-29]. See Figure 5. Some methods fall in more than one group and are described as hybrid methods.
Figure 5: Types of RE methods: Supply-driven, demand-driven and goal-driven
Supply-driven approaches to data warehouse requirements engineering focus on the sources of data
that are available. All sources are studied and documented and users identify data to be included in
the data warehouse based on their information desires. Due to the potentially large amounts of
unneeded data to be examined, this approach might be wasteful in some cases [30].
Demand-driven methods are based on the unravelling the requirements of users. The sources of
information required to foresee in these requirements are determined at a later point. A drawback of
this method is that combined sources of data can have more potential than what users are aware of
[30].
Goal-driven requirements engineering methods, also called goal-oriented requirement engineering
(GORE) methods [31], focus on the business goals acquired by interviewing top management [28].
Although similar to demand or user-driven it differs in being an top down approach instead of
bottom-up like demand-driven RE [27].
Hybrid methods are not strictly supply, demand or goal driven but include multiple approaches. For
many of the previously mentioned methods it could be argued that they do not belong to one group,
however the following methods perform two approaches simultaneous and are thus clearly hybrid
methods.
2.2.1 Supply-driven information requirements engineering
Moody and Kortink [32] present a supply-driven method that transforms entity-relationship (ER) diagrams into a multidimensional data schema. Entities are classified into three categories; transaction entities which store event data, component entities like customers and products and classification entities such as type of customer and product type. A star schema can be constructed from this by using a transaction entity as the fact table, component entities form the dimensions and the hierarchy created by the classification types can be used to drill down and roll up. Transformations for flat, terraced, snowflake and star cluster schemas are given as well.
2.2.2 Demand-driven information requirements engineering
Bruckner et al. [33] describe a method that lets users describe what they need to do with the systems instead of what they want the system to do. Requirements are defined at business, user and system level. Consensus between stakeholders is reached by creating use cases which are understood by stakeholders with diverse backgrounds.

11
State of the Art – BI and information requirements engineering
Data warehouse requirements definition method or DWARF stresses the importance of planning the management of requirements by specifying roles and standards, source integration principles, project boundaries and multidimensional requirements focus. The information requirements elicitation is performed through and iterative series of interviews, workshops, prototyping and scenarios. The requirements are then validated through prototyping and reviews [34].
Paim et al. [15] begin their method by setting up a requirements management planning in which project objectives, dimensional requirement focus, source integration premises and project schedule and management are established. Following is requirements elicitation by interviews, prototyping and interaction scenarios. The requirements produced in this phase are reviewed and compared to a checklist with criteria for DW requirements. The method provides a set of templates for documentation of requirements such as data warehouse vision, data mart use cases and traceability matrices aimed at clarifying the requirements to all stakeholders and ensure consensus between stakeholders. Validation is performed through a series of reviews and creating a prototype to reveal flaws.
An approach for information requirements engineering of data warehouse design is proposed by Winter and Strauch [4, 35]. Based on requirements from experts for an information requirements engineering method they combined methods found in case studies. The result is a method of combined activities from all four studies that cover all method requirements from experts. In summary the activities are identifying users, analysing the information supply, identifying information demand and matching this with the supply. The information demand is analysed from a higher level of aggregation (business questions) and then refined to lower levels that can be matched to the existing information supply. The existing information is determined by studying reports that are currently being used by the organization. Based on the current information supply and the information demand a gap analysis can be performed to see which information has to be added. These additions are prioritized to make sure the most important or information that requires the least effort can be added. The last two activities are creating a data schema based on the result of these activities and evaluating the data schema as to whether it reflects the data demand. The framework identifies the most successful steps that should be taken, not all of which are completely covered.
2.2.3 Goal-driven information requirements engineering
One goal oriented approach suggests that all goals can be translated to a set or related decisions. From these decisions the required information on which the decision should be based can be obtained. The information requirements are listed as decision-information pairs. These information requirements are then translated into SQL-like queries that describe an information scenario [36-38].
Mazón et al. [39] propose a model-driven method to model goals, information requirements and transform those models into a multidimensional model for the DW. Based on Kimball and Ross [17] they argue that the requirements engineering process should be goal-oriented because the organizational goals are the reason why the information for decision making is gathered. This approach prescribes three levels of goals that form a hierarchy; strategic goals, decision goals and information goals of which information goals are the most concrete. The next step is to create a computational independent model (CIM) of the goals and information requirements. The CIM is then transformed into a platform independent model (PIM) using query/view/transformation rules from the Object Management Group [40].This approach ensures that all goals modelled in the CIM are transferred to the PIM.
CADWA [41] is a goal-oriented requirements elicitation method that also defines requirements on different levels. The goals of the organization are represented in the organization business plan. Based on their tasks within the organization, user groups are given responsibility to translate the organization business plan into decision-makers macro business plans. Macro business plans contain the local goals necessary to achieve the goals in the organization business plan and user groups are responsible for conformity to the organization business plan. In the underlying level

12
State of the Art – BI and information requirements engineering
decision makers micro business plans state the operational requirements. On the lowest level of abstraction is the action plan that defines functional requirements for the DW based on the decision makers micro business plan. The requirements are visualized by a map that draws actions between start and goal to specify the actions that need to be performed to reach the business goal.
2.2.4 Hybrid information requirements engineering methods
Next to requirements elicitation, a holistic approach to managing requirements for data warehouses should ensure a successful DW project. Requirements can be viewed from different perspectives, the holistic approach starts at the business perspective where management voices ways how a data warehouse could improve the business (goal-driven). Requirements are then refined by looking at them from the user perspective. Finally the requirements are specified on a technical level by data warehouse specialists to make them testable and unambiguous. Requirements also are given a status to track their progress from requested to implemented or deleted in case the requirement is dropped [42].
For information requirements elicitation, Zepeda et al.[43, 44] also use a goal-driven approach that matches the goal driven requirements with data models acquired in by a supply-driven approach. They refine high-level business goals by creating a goal refinement tree that specifies sub goals. These sub goals are then proposed to stakeholders who can identify tasks that should be supported in order to attain the goals. The tasks are modelled as UML activity diagrams and initial information requirements are extracted from the task descriptions. Starting with the available data sources, entity relationship models are created and transformed into potential multidimensional data schemas through applying a set of transformational rules. The user information requirements are then matched to multidimensional data schemas to find the one that fits best after which the schema is refined by removing unnecessary dimensions.
Guo et al. [45] take elements from demand, supply and goal driven approaches to create a complete picture of what the data warehouse model should look like. The method defines four stages. One for every driver, and an integration stage. Key performance indicators (KPI) are derived during the goal stage, the demand-driven stage yields user requirements with measures and dimensions and the product of the supply-driven stage is the data schema of the enterprise. In the final stage, results of the previous stages are combined on an entity level. For example the data schema relating to customers is combined with the performance indicators for customers and the measurers relating to customers derived from user interviews.

13
Problem analysis
3. Problem analysis
Figure 6 shows the problem cluster created for the municipality context based on initial conversations with Exxellence Group and municipality employees. The problem cluster shows problems that occur at different municipalities and their relationships. Since the project spans multiple municipalities, the presence and scope of the problems can vary per municipality.
In the current situation it’s often only the larger municipalities that have an idea of which indicators they want to measure and even they are struggling to find more indicators based on their goals. Many smaller municipalities are not yet ready to start measuring or lack the resources to set up the required systems. More problems are caused by the numerous number of systems in which the information is stored. Some of these source systems data formats are proprietary and even though the data itself is owned by the municipality, the data cannot be extracted since the exact definition of data fields are only known to the supplier. Therefore municipalities are restricted to using the mostly off the shelf management information interfaces provided by the supplier and have to manually combine information from the different source systems. The multitude of vendors as well as the number of different systems for different municipalities makes finding a standardized solution almost impossible. Also much of the data required such as customer contacts need to be registered at the time they occur. Some of the smaller municipalities lack the skilled personnel to do this at the moment of contact. Also, many of the departments in municipalities are sceptical about their managers being able to see their workload and productivity. This causes resistance to adaptation of new systems that would facilitate registering and generating management information. In commercial client contact centres, personnel and data are rigidly controlled and personnel is trained to handle most of the first line issues. The scope of issues and inquiries directed at the first line municipality client contact centre personnel is much greater than that of most commercial organizations.
Four root causes were identified:
Information needs (partially) unknown
Personnel not used to strict performance measures
Personnel insufficiently trained
Many different product vendors
Of these four root causes, this research project focusses on the unknown information needs. Two
of the other core problems have to do with the ability and willingness to work in such a manner that management information can be obtained from the work processes. Some municipalities indicated that their personnel is not used to strict performance measures and is likely to oppose changes that make their efficiency more transparent. Furthermore gathering data for management information from work processes can only be successful if personnel is trained to register case and customer contact information properly in the source systems. These root causes can be influenced by the municipality and implementation of a management information solution should be accompanied measures to alleviate these problems. The initial set-up of a BI solution is made more difficult as well by the previously mentioned variety of data sources per municipality. However, the situation of a large number of sources is unlikely to change and is therefore labelled as being out of scope.

14
Problem analysis
Figure 6: Problem cluster with root causes

15
Research method
4. Research method
This section portrays the research method as well as results and validation of those results. The method is based on an information requirements engineering method by Winter and Strauch [4, 35]. The following section discusses why this method is deemed to be most suited to be deployed in the municipality context.
4.1. Method selection
As mentioned in Chapter 1 the focus of this research project is on BI information requirements elicitation and validation. Therefore the most important sub-question is question 2:
“ What are the management information needs of the municipality regarding Antwoord© concept?”.
Available methodologies were cited in 2.2, now the methodology that best suits the context has to be determined, explained in more detail and adapted for a better fit with the context and scope of the project.
4.1.1 Project properties
There are several aspects and constraints to this information requirement engineering project that are of influence on the selection of a suitable method. One of the objectives of this project is to get an overview of the management information needs of KCCs of multiple municipalities, not just one in particular. Consequently as much information as possible needs to be obtained within a single session with the municipality rather than taking an in-depth look at one municipality during multiple sessions.
As discussed in chapter 3, each municipality has a large number of back-office systems and processes from which data can be gathered. Furthermore, even though these sources might fulfil the same function within the municipality, the source systems are often different products from a variety of vendors. This makes analysing all processes, source systems and other information sources impossible to carry out within the time span of this project.
Initial contacts with municipalities have proven most useful in providing insight into the current situation. At this point, municipalities have some ideas about what they want based on the Antwoord© concept. They are however largely unaware of the additional possibilities that a data warehouse could provide in terms of management information that surpasses the daily operational needs and could help them make decisions on a strategic level.
The selection of the method is finalized under the assumption that municipalities share at least a set of their goals. The reasoning behind this is twofold. First most municipalities base their objectives on the Antwoord© concept. As the Antwoord© concept prescribes a set of objectives, indicators and norms it would be logical that municipalities share these objectives. Second, with few exceptions the municipalities all perform the same operational processes. The processes themselves can differ between municipalities but they are trying to accomplish the same tasks.
The final property of the project is that the intended users are the managers of the KCC. This enforces the need for a method that can be performed with a limited time invested by the potential users because of the fact that the people responsible for management information and its assessment are at the head of a large front-office organization and are on a very tight schedule. Although they appear to be very interested in the topic, they simply do not have the time available for multiple information requirements engineering sessions.
4.1.2 Evaluation of method types
The methodologies from 2.2 are divided into four categories: Demand-driven, supply-driven, goal-driven and hybrid methods. Due to the large number of data sources and the project targeting

16
Research method
multiple municipalities, supply-driven approaches are ruled out immediately. The workload of analysing every available data source in one municipality is far greater than can be allocated in the time available for this project. Moreover not every municipality uses the same source systems, increasing the amount of work even further. In terms of systems, data sources are also of limited use because of the proprietary data schemas used by vendors to store the data. If data sources are to be analysed it will be on a level of abstraction where types of sources are named with the data that can most likely be gathered from those sources.
The demand-driven methods as described in 2.2.2 require many iterative steps to come to a complete overview of the information requirements. Seeing how the intended users cannot accommodate the researcher with more than one or two sessions makes applying these methods difficult. Furthermore the initial contacts with municipalities pointed towards them being unsure over what their demands are.
Goal-driven approaches, essentially demand-driven approaches that start at a higher level of abstraction, have the same caveats as the other demand-driven approaches. They crave a large user commitment which makes them unrealistic for this project. However since the intended users lack a clear view of their own demand, a goal driven approach could give them a handle to identify information demand by refinement from goal level.
Hybrid methods try to breach the gap between supply and demand-driven approaches by analysing data and holding user sessions. Even though they might succeed in breaching the gap between user demand and the time consuming process of analysing data, this does not make them more suitable for our purposes
It seems that the constraints and set-up of this project do not fit within any of the defined methods. Therefore this project uses a framework mentioned under demand-driven methods that defines the steps that should be taken based on the evaluation of several projects. However it does not specify exactly how the steps should be performed and thereby leaves room for us to perform the steps in a way most suited for this project. In contrast, most of the other methods require steps to be performed as described because results are needed in a certain format to continue to the next stage in the project. The approach by Winter and Strauch [4, 35] is specifically meant for information requirements engineering in service of decision support. It prescribes that business questions should be matched to data supply from documents to identify which information is still missing. Seeing how we’re able to fill in the steps to fit the project following this framework seems to be the best approach to this project.
4.2. Method description
This section will describe the steps from the approach of Winter and Strauch [35] including how they filled in or adapted to suit the needs of this information requirements engineering project. Figure 7 shows the cycle of activities to be performed during the project. This project follows the defined steps from 1.1 up to 3.3. The remaining steps are deemed unfeasible to perform within this project. Section 4.2.4 explains why these steps are out of the projects scope.

17
Research method
Figure 7: Activity model by Winter and Strauch [35].
4.2.1 Initialization
1.1 Identify target users
Prescribed: Identify target users, per cycle if necessary. Application: Identify who will use the management information, these are the target users.
1.2 Identify dominant application type
Prescribed: The dominant application type is related to the type of user. The need of the user regarding the application has to be identified. For example managers could prefer regular reports compared to knowledge workers who would like to analyse the information in more detail using OLAP tools.
Application: Target users will be asked how they want the management information to be presented. Based on this a suitable application type is selected. Several ways in which management information can be presented were already discussed in 2.1.5.
4.2.2 ’As is’ analysis
2.1 Analyse actual information supply Prescribed: Study reports that are used in the organization at this moment including the
underlying data models. This helps to match information demand to supply and identify gaps between supply and demand.
Application: Due to the vast amount and different types of source systems it is infeasible to analyse all underlying data. However the documents provided by the municipalities can serve to

18
Research method
identify the information that is currently available. Furthermore we can analyse which information can be gathered from back-office or eMAXX systems by checking the information that is utilized by users. Preferable information will be gathered from eMAXX systems because this would result in the most generic solutions to be implemented in multiple municipalities. Also information about which data is available in back-office systems is limited because not all vendors offer detailed documentation. The data in back-office systems is property of the municipalities but the logic required to construct certain pieces of information is not made public by the vendor.
2.2 Create aggregate information map Prescribed: Create a data schema of the relevant information found in reports from step 2.1. Application: This step is not relevant for this project. The purpose of creating an information map
is to identify the information that is already available so it can be used later on to determine what information is still needed. However, since the subject of study is several municipalities, there isn’t one map of available information. The available data differs highly per municipality. The information found in documents is therefore simply included in the to-be overview of information demand.
2.3 Analyse source information systems Prescribed: Analyse whether the data sources are accurate enough to be used as source for
management information. Application: The prescribed stage is difficult to perform due to the high number of sources.
Municipalities will be asked about the accuracy of the data from source systems. Based thereon the advice to Exxellence Group will include remarks about the accuracy of data from source systems.
4.2.3 ‘To be’ analysis
3.1 Analyse information demand Prescribed: Identify the right business questions. Application: This method’s requirements elicitation phase only gives an example of how this step
could be performed, however Winter and Strauch state that the focus should be on business questions. Structured interviews appear to be the best method of requirements elicitation and not very dependent on analysts experience [46]. Several other methods suggest the business questions should be modelled on multiple levels [41-43]. Strategic, decision and user level goals will be defined here. Based on these considerations, the interviews conducted during this project are aimed at producing requirements based on higher level business goals which are refined to task level.
Other input required for this method are the actual information supply from source systems. Exxellence Group has indicated that this should be viewed on a case to case basis depending on the information need. Data available in or to the eMAXX suite is preferred since data schemas are known and can be utilized in all municipalities that use the eMAXX suite.
Interview questions In a preliminary conversation with a municipality employee a problem regarding the interview
method has been identified. Namely, it is very likely that KCC managers do not yet know on which requirements they have for the system. To facilitate the process of requirements elicitation a list of key performance indicators provided by the Antwoord© concept will be used to start the discussion and give the managers a starting point. The consideration here is that the managers should not be steered into one direction before coming up with their own answers. The list will therefore be discussed after managers have been asked to voice their own opinions. The performance indicators suggested by the Antwoord© concept can be found in Table 5. These indicators are collected per channel and can be rated on multiple aspects of one indicator . For example, customer satisfaction should make distinctions between waiting time and expertise. Further description of the KPIs can be found in Sturen op Antwoord© [1].The questions used during the interview were in Dutch since all of

19
Research method
the context and concepts are in Dutch. The interview questions below are the translated version. The original questions can be found in Appendix B: Original interview questions (Dutch version).
Questions
What are the goals within the Antwoord© concept?
o Which performance indicators are used to measure progress of these goals?
o Which management tasks have to be performed to achieve the business goals?
o Which management information is required to perform these tasks?
o When should this information be provided?
o Over which time period should this information be provided?
o What are the sources of this information?
o Is the information quality sufficient for the intended management information purposes?
o Are there restrictions in the use of sources (e.g. privacy)?
How should the management information be presented?
For the indicators which have not yet been discussed, which ones should be available on the
management information representation?
o Should any additions be made to this list?
o Which indicators should have priority?
o Which events require notifications towards managers?
Table 2: Antwoord© key performance indicators [1]. With translation
Kritische succesfactoren Critical success factors
Key performance indicators (eenheid)
Translation
Verbetering van dienstverlening Service improvement
Klanttevredenheid Customer satisfaction
Binnen service interval Client contact completed within service interval
Verlaten wachtrij Leave queue when trying to contact employee
Kritieke fouten Critical errors (lead to increased costs)
Niet-kritieke fouten Non-critical errors (procedural errors)
Klachten Complaints
Direct beantwoord Answered right away by first line support
Verbetering van de efficiëntie Efficiency improvement
Behandelduur Lead time per contact moment
Aantal klantcontacten Number of client contacts
Bezettingsgraad Percentage of work time used to execute tasks (occupancy rate)
Nauwkeurigheid voorspelling aanbod
Difference between predicted amount of work and actual amount of work
Operationeel verzuim Non-attendance
Opdrachtgevertevredenheid Employer satisfaction
Which management information is currently available?
Are you interested in providing written feedback on the contents of the requirements produces based
on this interview and interviews with other municipalities?
Do you have any questions for the interviewer?
20
Research method
Processing of data acquired from interviews and documents The management information requirements are based on the KCC business goals and tasks
related to these goals. To identify these goals, tasks and requirements across interviews, the interviews are coded using coding software made available by the university: Atlas.ti (v6.2) [47]. This way goals, tasks and requirements can be traced back to their source and context. In order to use this method, the interviews are taped and transcripts are made. In addition to the interviews, documents are collected from the municipalities indicating current information and requirements for the future. These documents are labelled as well and added to the information requirements.
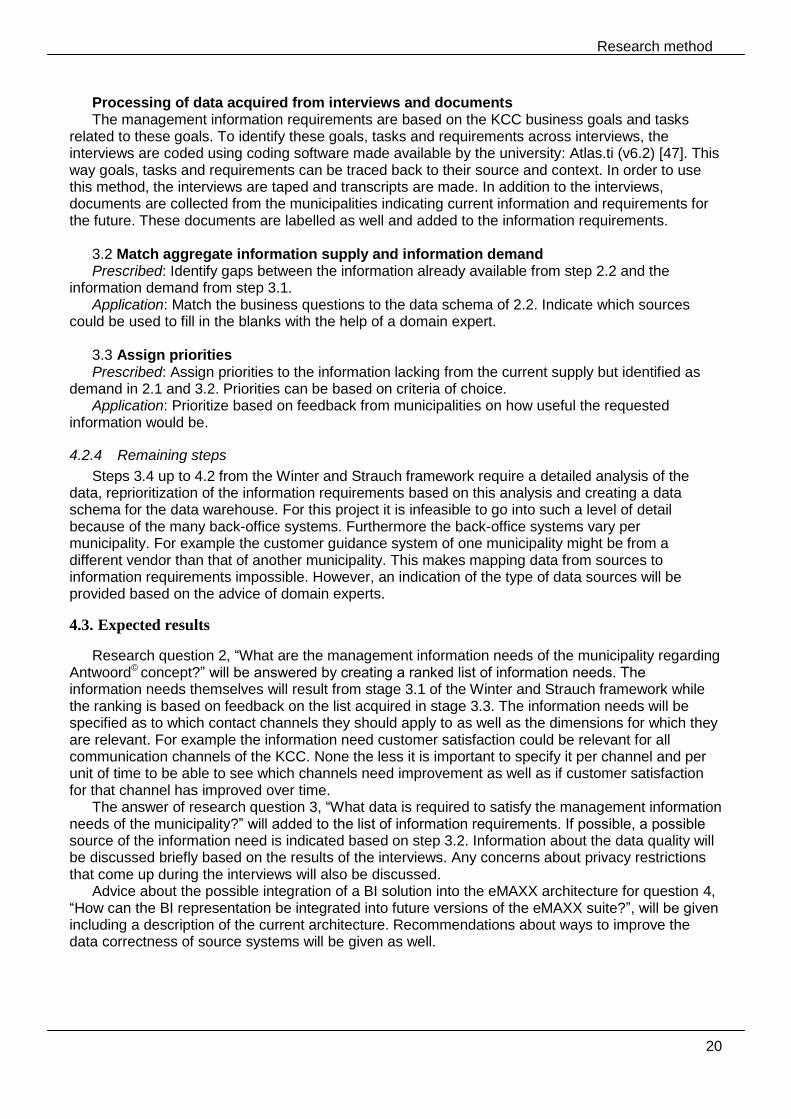
3.2 Match aggregate information supply and information demand Prescribed: Identify gaps between the information already available from step 2.2 and the
information demand from step 3.1. Application: Match the business questions to the data schema of 2.2. Indicate which sources
could be used to fill in the blanks with the help of a domain expert. 3.3 Assign priorities Prescribed: Assign priorities to the information lacking from the current supply but identified as
demand in 2.1 and 3.2. Priorities can be based on criteria of choice. Application: Prioritize based on feedback from municipalities on how useful the requested
information would be.
4.2.4 Remaining steps
Steps 3.4 up to 4.2 from the Winter and Strauch framework require a detailed analysis of the data, reprioritization of the information requirements based on this analysis and creating a data schema for the data warehouse. For this project it is infeasible to go into such a level of detail because of the many back-office systems. Furthermore the back-office systems vary per municipality. For example the customer guidance system of one municipality might be from a different vendor than that of another municipality. This makes mapping data from sources to information requirements impossible. However, an indication of the type of data sources will be provided based on the advice of domain experts.
4.3. Expected results
Research question 2, “What are the management information needs of the municipality regarding Antwoord© concept?” will be answered by creating a ranked list of information needs. The information needs themselves will result from stage 3.1 of the Winter and Strauch framework while the ranking is based on feedback on the list acquired in stage 3.3. The information needs will be specified as to which contact channels they should apply to as well as the dimensions for which they are relevant. For example the information need customer satisfaction could be relevant for all communication channels of the KCC. None the less it is important to specify it per channel and per unit of time to be able to see which channels need improvement as well as if customer satisfaction for that channel has improved over time.
The answer of research question 3, “What data is required to satisfy the management information needs of the municipality?” will added to the list of information requirements. If possible, a possible source of the information need is indicated based on step 3.2. Information about the data quality will be discussed briefly based on the results of the interviews. Any concerns about privacy restrictions that come up during the interviews will also be discussed.
Advice about the possible integration of a BI solution into the eMAXX architecture for question 4, “How can the BI representation be integrated into future versions of the eMAXX suite?”, will be given including a description of the current architecture. Recommendations about ways to improve the data correctness of source systems will be given as well.

21
Research method
4.4. Validation
The primary result to be validated are the information requirements that will result from answering research question 2. Results of research question 3 and 4 are to be seen as advice to Exxellence Group. To validate the results for question 3 and 4 would require the implementation of the system and an analysis of the finished product. Validating those results is out of the scope of this research project due to time constraints.
Validation of results of research question 2 is threefold. First of all the requirements are the product of interviews conducted at multiple municipalities who have similar business processes. Requirements are expected to correspond between different municipalities. Requirements that correspond between different municipalities are the information requirements that Exxellence Group is looking for because they can then create a uniform solution to foresee in these information needs. The second form of validation is to send users the list of requirements after the interviews for review. Feedback can then be used to improve the list of requirements. The final validation approach is to check the requirements with requirements from other industries. For example the standards could be compared to the COPC standard [3] for call centres or reviewed by a BI requirements expert. The COPC standard is especially relevant because it is said to be the basis for the Antwoord© concept [1].

22
Results
5. Results
This chapter presents the results of the application of the research method discussed in chapter 4. The results are stated per step of the framework by Winter and Strauch [35]. In section 5.4 the main result of this thesis, a list of information requirements from municipalities, is compared to the list of indicators from the Antwoord© concept and the COPC-2000 standard.
5.1. Initialization
5.1.1 Target users
The targeted users seem clear for this project. Since we’re looking at management information the target users are the KCC managers. Other employees such as team leaders and front-desk employees of the KCC could also make use of the information gathered from this project, however the managers should be able to decide which information could be relevant for these users.
In order to get an overview of general requirement of municipalities, multiple municipalities will be visited. Exxellence Group has provided a list of municipalities that are currently working with the Antwoord© concept and are at a stage in the project where they are considering the need for additional management information.
To ensure anonymity of the municipalities that participated in the interviews, only an indication of their number of inhabitants is provided in the graph below. 100,000+ inhabitants is the highest category because making categories above 100,000 would certainly give away the names of the two municipalities. Even creating categories per 100,000 inhabitants would make the municipalities easily identifiable because the range of inhabitants in the top ten of municipalities is currently 165,000-780,000.
Per municipality one person was interviewed. With two exceptions the function of the interviewee
can be described as KCC manager or manager of the public services. The two exceptions were a policy advisor and a team leader of a municipality call centre.
5.1.2 Dominant application type
During the interviews it became apparent that municipalities prefer a dashboard filled with the combined information from multiple sources. In this dashboard there should be multiple levels of
0
3
2
3
2
0
1
2
3
0-25 25-50 50-75 75-100 100+
Mu
nic
ipal
itie
s w
ith
in
nu
mb
er
of
inh
abit
ants
ran
ge
Number of inhabitants (x1000)
Distribution number of inhabitants

23
Results
information defined for different users. The KCC managers would like data on an aggregated level, the call centre team leader needs data on a more operational level. Individual employees could be interested in their performance and how it relates to the average performance, the norm or the performance of other employees. However the because the KCC managers are the primary users of the application, the dashboard for managers is the dominant application type.
5.2. ‘As is’ analysis
5.2.1 Actual information supply
The information supply that is already available to some municipalities through reports on a weekly or monthly basis has been included in the information demand. The current eMAXX suite contains a management portal. From this projects standpoint, the eMAXX management portal is the only common source of management information available to all municipalities that work with the eMAXX suite. Only two of the municipalities that participated in the interview do not use the KCS and don’t have access to the management portal. Therefore it is the closest to being an information source used by all municipalities. The information currently available in the management portal is as follows.
Cases per unit of time (day/week/month/year/specified period):
Number and percentage of cases
Number and percentage of cases per case type
Number of cases in state open/closed/waiting/ close to lead time limit/exceeded lead time limit
Number of cases per case type open/closed/waiting/ close to lead time limit/exceeded lead time
limit
For all channels and specific channels (desk, BurgerConnect, e-mail, internet, telephone, web form) per unit of time (day/week/month/year/specified period):
Number and percentage of cases
Number and percentage of cases per case type
Per case type and department and per unit of time (day/week/month/year/specified period):
Number and percentage of cases created by a specific employee
Number and percentage of cases for which a specific employee is responsible
In addition to the management portal Exxellence created a standard Cognos data warehouse
cube on top of the case management system with reports about cases and contact moments. The standard cube is at this moment in use at several municipalities. The reports provide the following information.
Number and percentage of contact moments created per channel per start date.
Number and percentage of contact moments created per month.
Number and percentage of contact moments created per time period.
Number and percentage of cases created per month.
Number and percentage of cases created per time period.
Number and percentage of cases created per channel per month.
Number of open cases per case type.
Number of open cases with planned completion date per case type.
Since version 2.9 of the KCS in the eMAXX application suite 4.5 (the current version is 5.0), the
Statistiek database (statistics database, see section and 6.1 for more details) is included in the KCS suite. The Satistiek database is available to all municipalities running KCS 2.9 and higher and contains the following information about usage of the knowledge base:
The number of times a question from the knowledge base is consulted.

24
Results
Which search terms are used in the knowledge base and how many times are they used.
Which questions are coupled with certain situations.
Which questions are coupled with certain topics.
Even though the actual information supply per municipality is dependent on the municipality,
there are several types of systems that are common among municipalities. Most notably a telephone exchange and customer guidance system. Management information often provided by these sources is provided below.
Telephone exchange The telephone exchange, in most municipalities a private branch exchange, provides mostly
operational data about customers that enter the telephone queue and the time it takes to handle the call and after call work.
Number of offered calls
Number of answered calls
Average wait time
Number of forwarded calls
Average call duration
Average handling time for after call work
Occupancy rate
Depending on the system these numbers could be specified per employee or telephone set and are specified week, day or parts of a day. Customer guidance system A customer guidance system tracks customers from the moment they enter the front-office and
take a receipt until the moment they have completed their business at the desk.
Number of clients
Number of clients per case type
Number of appointments
Average wait time
Occupancy rate
Website Some municipalities use Google analytics [48] to analyse customer behaviour on their website.
Keywords used to find website
Number of visitors
Number of visitors per region
Conversions per page
Visitor navigation
On-site search behaviour
5.2.2 Aggregate information map
Table 3 provides an overview of the available information in the management portal of the eMAXX suite, the standard reports of the Cognos data warehouse and the statistics database as discussed in the previous section. The telephone exchange, customer guidance system and website have been left out. The reason for this omission is the varying implementations of these systems at municipalities.

25
Results
Table 3: Available management information through the eMAXX management portal, standard data warehouse reports and
the statistics database.
Table omitted, available in confidential version.
5.2.3 Source information systems
Due to the large number of back-office systems that could be potential sources for management information and the fact that every municipality uses different systems and in different ways, it is impossible to go into detail about the data quality of these source systems. However, during several interviews, the interviewees indicated that an attempt at creating a KCC wide information system had been made but failed because of inaccurate data from source systems or problems with the definitions of what information from sources meant exactly.
Another concern with the data sources is how the municipalities fill them with data. Some municipalities do not use all the functions of the KCS for example. Not registering all contacts with customers can result in missing data required to generate the management information overview. Furthermore information about case handling is not always updated by the back-office organization.
5.3. ‘To be’ analysis
5.3.1 Information demand
The interview transcripts were coded to identify information requirements, presentation requirements, goals and possible data sources. In addition, the documents provided by municipalities about current and future management reports were coded.
Coding was carried out using Atlas.ti (v6.2) coding software. A total of ten interviews (137 pages) and 27 documents were coded. This resulted in approximately 600 codes. From these codes a list of goals and a list of information needs were created. Often multiple codes were linked to one information need. For example two codes, number of customers at the counter and number of customers on the website are combined into the management information need: number of customers. Number of customers should then be available for the website and counter separately.
As described in step 3.1 of the research method, goals should have been gathered and translated into indicators with the help of the interviewee. The interview questions were also ordered to facilitate this process. However, during the interviews, it became apparent that the interviewees had trouble translating these goals into concrete indicators to measure. Goals were named, some indicators were named as well but the link between them remained unclear.
A logical next step would’ve been to schedule more than one interview with every interviewee and focus on translating the goals into indicators. However due to the busy schedule of the interviewees this was impossible. Also, this process would’ve been very time consuming since the project scope included ten municipalities and therefore ten interviews all over the country. Twenty or thirty interviews did not fit into the schedule of the project either.
Goals By coding the interviews and documents the following goals were derived. Most goals are from
documents called “kwaliteitshandvesten” or quality charters. A quality charter specifies the level of service that a customer can expect from the municipality. Lead-times for most products or requests are specified as well as the waiting time per channel. It’s no surprise that most of the goals found during the interviews and from quality charters are about measuring and achieving a certain score for the related indicator.
No concrete norms for the indicators are given because they might vary per municipality. There’s one exception, namely the number of customer requests that should be resolved at first contact. This goal is based on the Antwoord© concept which specified its value should be above 80%.

26
Results
Customer service
80% first contact resolution of customer requests
Reduced administrative burden for the customer
Customer service is rated above a certain score for all channels
No more than x% of customers leaves the telephone queue
Wait time at the counter for x% of customers with an appointment is below y minutes
Wait time at the counter for x% of customers is below y minutes
Wait time at the telephone is below x minutes
Customers are treated correctly
Customer requests are completed within the time required by law
Customers are free to pick which contact channel they use
Customers are in control of their personal information
The availability of the website is above x%
Efficiency
The customer service centre is the central point of contact for customers
Continues improvement of customer service
The content of the supplied information is the same for all contact channels
Customers should be directed to the digital channel
The customer service centre controls the customer service process
Register questions for which the answer is not yet in the knowledge base
Work by appointment
Strategic
Reduce the number of (back-office) applications
Conform to standard processes
Customer orientation
Professional customer service
Deregulation
Improve customer guidance
Most of the goals categorized under customer service and efficiency can be seen as business
questions for which a single indicator can determine the progress towards this goal. However the goals categorized as strategic are harder to measure.
Information demand The information requirements can be found in Table 4. The table is a truncated version, the
complete version is available in Appendix D: Results. An X in any of the cells means that either at least one municipality has indicated a need for this information or it has been suggested by the researcher. The full version (in Dutch) of the table includes a column with the source of the information need which can be either interviews, the Antwoord© concept or a suggestion. Following is a description of the columns included in the shortened version.
Column descriptions Indicator / information demand This column describes the requested indicator of information. Following are the descriptions of
the information needs and indicators that can be found in Table 4. Can be found in Appendix C: Description of information needs.
Unit

27
Results
The relevant unit for a large part of the indicators is number, percentage or time. If that is the case, this column is marked. Some indicators are measured in other units. In case this isn’t clear from the description, it is mentioned in the comment.
Channel When one of these columns is marked, the information is relevant for that channel. Dimensions The information should be accessible per marked dimension and combination of marked
dimensions. When the indicator ‘number of customer contacts’ has marks in the columns of ‘channel’, ‘time interval’ and ‘case type’, this indicates that the number of customer contacts should be accessible per channel per time interval and per case type. For example the number of customer contacts for the telephone channel of the case type complain in March. Another example is the number of applications for a driver’s license on 24/04/2012 through the digital desk.
Channel: The channel dimension indicates that the information should be available per contact
channel. For example customer satisfaction for the front desk channel.
Time interval: This dimension means that the information should be available per unit of time (part
of the day / day of the week / week / month / quarter / year / ad-hoc specified period). For example
the number of incoming calls on Friday afternoon.
Case type: When this dimension is marked, the indicator should be accessible per case type. For
example the number of permits of a certain type requested at the front desk.
Employee: Indicates that information should be accessible per employee. For example the number
of cases handled by a certain employee.
Department: The indicator should be available per department. For example the number of
forwarded calls for to the community services department.
Sector: When the sector column is marked, the information has to be retrieved per sector. For
example the number of closed cases in the municipal service sector.

28
Results
Table 4: Highest rated information needs from interviews and documents
Table 4 omitted. (available in confidential version)

29
Results
5.3.2 Aggregate information supply and information demand match
For this step, the existing sources of information such as the eMAXX management portal and the standard data warehouse of Exxellence as described in 5.2.1 need to be matched to the information need. The first part of this section will discuss which information needs are satisfied by the current supply. The second part discusses which source types could be used to satisfy the remaining information needs.
Current information supply
Number of cases created – This information need is satisfied by both “Cases created” and “Contact
moments created”. Contact moments created are at this point simply a case type. So created cases per
case type can also yield the number of created contact moments.
Number of completed cases – Requires both “Completed cases” and “Open cases” as supply because it
also asks for the percentage of cases that was closed.
Number of open cases – Can be satisfied with “Open cases” with the exception of the percentage (see
number of closed cases).
Number of open cases with scheduled completion date – Can be satisfied with “Open cases with
completion date” with the exception of the percentage for which the total number of open cases is
required. Also, this information need should be available per employee and department.
Number of open cases exceeding norm time – Can be satisfied by “Cases exceeding lead time limit per
status (open/waiting/closed)”. This information need is only included in the complete list in Appendix
D: Results.
Completed cases which exceeded norm time – Can partially be satisfied by “Cases exceeding lead time
limit per status (open/waiting/closed)”. Still missing the percentage (total number of completed cases
required) as well as the dimensions channel and sector.
Number of consultations of a certain question in the knowledge base – Can partially be satisfied by the
information supply of the same name. The statistics database does not keep track of the channel that
the question originated from.
Which used search terms do not give any results from the knowledge base – Currently it is only known
which search terms are used in the knowledge base and how many times they are used. Whether they
result in an answer is unknown. The related information supply is “Search terms used in knowledge
base”. So only part of the data required for this information need is available.
Possible sources of information Clearly the current information supply lacks a large part of the requested information. Only eight
of the information needs from Table 4 can be (partially) satisfied with the current information supply available to all municipalities. Therefore possible sources of the other requested information have been identified with the help of domain experts (see Table 4). Due to the variety in sources and differences in sources per municipality, only types of sources can be named instead of specific sources. For example a possible source could be a customer guidance system instead of G-BOS which is a specific customer guidance system. Figure 8 shows which source types have been identified. The sources required for every information need can be found in the final column of Table 4 (complete version in Appendix D: Results).

30
Results
Figure 8: Data sources for information needs.
5.3.3 Priorities
To prioritize the information needs indicated in Table 4, the list has been sent back to the interviewees for feedback. For each indicator the interviewees are asked to rate the statement ‘this information is useful’ on a scale with the options strongly disagree, disagree, neutral, agree, strongly agree. The ratings given by the municipalities can be found in Table 4 as well. The column labelled ‘useful indicator?’ shows how many respondents filled in each rating. In total, five municipalities responded to the survey.
In general, care should be taken when calculating the average score from a five point Likert scale, because the distance between neutral and agree might be differ in the perception of each respondent as well as being different from the distance between for example agree and completely agree. However, in this case we’re simply looking for a way to order the information needs based on how useful municipalities would find the information. Thus the only conclusion drawn from the indicators is that in general the indicators at the top are found to be more useful.
5.4. Information needs compared to the COPC-2000 CSP standard
As mentioned in the introduction the Antwoord© concept is based on the COPC-2000 CSP standard. Also, one of the goals of this research was to see whether the list of indicators provided by the Antwoord© concept was an accurate depiction of the management information that is requested by municipalities or whether there existed additional information needs. There were more information needs rated as useful than there are indicators in the Antwoord© concept. From that we can conclude the need for management information is greater than the indicators provided by Antwoord©. However the list below shows that most indicators from Antwoord© are ranked relatively high on the list of results:
Customer satisfaction: 1

31
Results
First contact resolution: 2
Within service interval: 6
Complaints: 7
Leaving queue: 11
Critical errors: 13
Occupancy rate: 16
Average handling time: 29
Number of customer contacts: 31
Non-attendance: 40
Number-of-customers forecast accuracy: 46
Employer satisfaction: 48
Non-critical errors: 57
Appendix E: COPC-2000 metrics contains the COPC-2000 CSP metrics. Their corresponding
information needs have also included. When taking a closer look at the list, we can determine that most of the metrics of the COPC-2000 CSP standard are also included in the list of information needs except for a several processes defined by COPC. These processes are outbound calls, training, new programs, providing product, re-supplying marketing materials, controlling inventory, material receipt and put away and uptime of several systems. These are processes which either do not exist or have a low priority in the municipality context.
Some of the indicators from the COPC-2000 CSP standard out of the other categories might be useful to municipalities as well. For example the backlog metric which measures the average time that cases are overdue. Also the self-service rate indicates how many cases are handled without the involvement of CSS (customer support staff). This could be useful for municipalities as well for comparing the number of cases handled through the website instead of at the counter, by phone or through web chat.

32
Solution within the eMAXX application suite architecture
6. Solution within the eMAXX application suite architecture
An introduction to the eMAXX suite by Exxellence was given in section 1.2. This section describes the eMAXX application suite architecture as specified in the eMAXX application suite architecture blueprint [49]. Figure 9 shows the architecture with the most important components for this study.
6.1. eMAXX application suite architecture
Figure 9: eMAXX application suite architecture. Adapted from [49].
The architecture design consists of the front, mid and back-office. Front-office applications are responsible for interaction with the users composed of citizens, organizations and employees. The front-office’s eMAXX Klant Contact Systeem is the main interface for employees of the customer contact centre. Customer contacts are registered there, new cases can be created and the status of existing cases can be retrieved. The eMAXX digitaal loket lets citizens and organizations order products through the website using e-forms. Finally the management portaal allows the municipality’s managers to view the state of cases, employee productivity and the number of cases per channel as described in section 5.2.1. A relatively new addition to the front-office is the statistiek database (statistics database). The statistiek database is set up to be able to collect any data send to it. However at this moment it only collects data about the usage of the knowledge base such as which questions are queried, which answers are consulted and which questions are related to a certain subject.
The eMAXX mid-office is the layer responsible for workflow management and data storage. It also handles communication with external sources of data. Workflow management is realized by the Business Process Execution Language (BPEL) engine. A BPEL engine allows for the definition of nosiness processes that are executed using services. These services are provided by applications in the eMAXX suite. Processes are defined in the BPEL engine so that for every step in the process the correct service can be called.

33
Solution within the eMAXX application suite architecture
The eMAXX ZakenMagazijn stores information about cases such as the customer, employees that are work on the case, customer contact related to the case including the contact channel, case status, start date, planned end date and payment state. Documents related to the case can be stored in a 3rd party document management system. The types of cases available, the responsible department and norm time in which the case type has to be completed are defined in the eMAXX ZaaktypeCatalogus. There are several ways that the eMAXX ZakenMagazijn can handle cases. One of them is that cases and data about the cases are stored in the ZakenMagazijn. In that situation, the ZakenMagazijn has all the data about the case. Another possibility is that the ZakenMagazijn only stores information about the case up until the point it is entered into a back-office system. In that final situation there is no coupling between the ZakenMagazijn and the back-office system and the case is considered completed for the ZakenMagazijn at the moment it is handed over to the back-office system. Some back-office systems can be coupled with the ZakenMagazijn in such a way that case and status information can be retrieved from the back-office system. This is only possible when back-office systems offer web services for the ZakenMagazijn to connect to. Due to the variety of back-office systems and data formats, communication adapters specific to the back-office system have to be created to make the back-office system’s data format compatible with the ZakenMagazijn’s data format.
Data from other municipality back-office systems that has to be available to the mid and front-office systems such as customer information from the GBA is either loaded into the eMAXX GegevensMagazijn or accessible to the GegevensMagazijn through plug-ins. When back-office systems are not designed to be queried constantly, their data is loaded into the GegevensMagazijn using ETL. For several systems that are capable of processing these queries, plug-ins to query the data are available in the GegevensMagazijn. There are several advantages to accessing the data via the GegevensMagazijn even if the back-office system can be queried real-time. First of all the GegevensMagazijn can restrict access to the data based on the user or system that is requesting access. Furthermore data imported into or passing through the GegevensMagazijn is converted into a standardised format and made available via a web service.
6.2. Proposed solution and considerations
Data from a number of sources is required to generate the management information requested by municipalities. Figure 10 shows where the data sources identified in section 5.3.2 are located in the extended eMAXX application suite architecture. This section clarifies how the sources of data would be accessed in the ideal situation where all information from municipality back-office systems can be disclosed through the GegevensMagazijn and ZakenMagazijn. Furthermore data quality, privacy and presentation of the management information are discussed.
6.2.1 Data sources
There are two types of sources needed to supply all the management information that was requested by municipalities. The first one are surveys required to determine customer satisfaction and non-critical (procedural) errors. Depending on how this data is collected it might have to be entered manually. Second there are source systems such as the customer guidance, telephone exchange and other municipality back-office systems from which data will have to be disclosed in some way.
As discussed in the description of the eMAXX application suite architecture, there are several ways that information from municipality back-office systems can be accessed through the ZakenMagazijn and GegevensMagazijn. However these two systems do not always contain all information present in those back-office systems. In addition, the ZakenMagazijn and GegevensMagazijn do not have access to all source systems. For example the telephone exchange and financial administration are not accessible through these systems. For these reasons, the data warehouse will need to be linked directly to some source systems as well. Information can then be

34
Solution within the eMAXX application suite architecture
loaded into the data warehouse either through ETL or real-time updates via messages. For example data about the total number of customers would be a combined value from multiple systems.
Figure 10: Solution architecture extended with data sources
6.2.2 Data quality
Two of the research questions are related to the quality of data. The first is concerned with the quality of existing data in the source systems and whether it is good enough to satisfy the management information needs. During the interviews an inquiry was made as to the quality of the data sources. The large number of systems makes it impossible to give a conclusive answer to this question, however several concerns were voiced about the data quality of some source systems. For example there could be a discrepancy between the number of passports sold according to the customer guidance system and the back-office system for passports. This discrepancy could be caused by a family going to the municipality together and requesting several passports at the same time. The customer guidance system only registers one while the ZakenMagazijn registers all the requests. In these cases it is important to look at the source systems and analyse which system would give the most accurate data for the information need in question.
Next to the quality of data, municipalities have to decide whether they want to task their employees with registering all data required for management information. For example, some municipalities choose not to register all contacts with customers because this creates too much overhead for their employees. Considerations like these can also influence the data that is available for management information.
The second research question is concerned with the improvement of the quality of data in the municipality back-office systems. During the interviews it was mentioned that the best way to improve the quality of data in back-office systems is improving the source, namely the manual input. To do this, municipalities should be given the ability to trace which mutations in the back-office systems were performed by which employee. A related information need is “Erroneous GBA mutations”, which comes down to that when an error is encountered in the GBA it would be useful to identify the case or request responsible for the error. In that case the responsible employee can be

35
Solution within the eMAXX application suite architecture
made aware of his/her mistake. Informing employees that they made a mistake can help them avoid making a similar mistake in the future.
6.2.3 Privacy
The research question about privacy restriction of data in source systems led to the identification of two groups of people whose privacy has to be considered in this project. The first are the municipality’s citizens. The foremost concern about the privacy of citizens is which data is accessed from the back-office systems. However the interviewees agreed that the data required to answer their management information needs was unlikely to be based on personal information about citizens. One point of discussion was the idea to identify citizens who contact the municipality often. Some interviewees expressed the need to do this so they could find out why these citizens had the need to call the municipality that often. Others thought this crossed the line and that information on a personal level should not be made available.
Municipality employees are the second group whose privacy is at stake. Historically municipalities did not see their citizens as customers and thus customer service did not have priority. Although the management of municipality KCCs would like to change this view to a more customer oriented one, the organizational culture does not yet reflect these beliefs. The result is that some of the back-office organizations are resisting the introduction of a system that would make their performance more transparent claiming it is a matter of privacy. However in the current economic climate budget cuts are inevitable and back-office organizations will have to make their processes and performance more transparent.
6.2.4 Presentation
Section 2.1.5 gave several options for the presentation of management information. The municipalities suggested that a dashboard is the preferred way to display the information. Several wishes for the presentation of the manager’s dashboard that came up during the interviews are:
Indicators for which a norm value had been established would be given a colour that reflected performance. For instance green when the score was above the norm otherwise red.
Comparisons of several indicators. For example they would like to compare visitors on the website and the availability of the call centre. A flexible solution is preferred here where any two indicators could be compared. Also, a representation of an indicators value over time in graph form would be seen as a good addition to simply displaying the current scores or the scores for a certain period in the past.
Different management information should be available on different levels. Table 4 has a column where the municipalities state for which levels the information would be useful. Especially the information needs higher in the ranking are deemed to be useful information for all personnel involved in the customer service process.

36
Conclusions
7. Conclusions
We set out to see which management information is required by municipalities for their customer support centres, thereby trying to solve the ‘(partially) unknown information needs’ problem from the problem analysis. In doing so this study made several contributions to finding out which management information municipalities require and how this information can be collected from different data sources. In addition to uncovering more information needs than those proposed by COPC and Antwoord©, this study also went into more detail about the dimensions of the management information and the levels of municipality employees for who this information would be useful. Several research questions as well as the research approach were meant to delve deeper into the source systems required to adhere to the management information needs. However, this study turned out to be too broadly scoped to go into detail on source systems per municipality. Instead an overview of the information needs from several municipalities was provided. In short, a more detailed description of the required management information is given.
Many of the goals and information needs, that resulted from analysing interviews and documents,
are specified on an operational level. Most goals and information needs are indicators are useful to track performance of departments, channels and individual employees over time so processes that require improvement can be identified as well as employees who require additional training. For example customer satisfaction and first contact resolution for the indicators and goals such as “Wait time at the counter for x% of the customers is below y minutes”. Some of the strategic goals can be derived from the combination of several indicators. Examples of those strategic goals is “improve customer guidance” , “professional customer service” and “customer orientation”. Other strategic goals that were found are “Reduce the number of (back-office) applications” and “conform to standard processes”. These types of goals not as easily derived from the mostly operational indicators. Several information needs on a more strategic level were also found. For example the identification of news events that cause a sudden influx of customers and the identification of preferred contact channels for different customer types.
Municipalities used the Antwoord© concept and its indicators as a stepping stone to finding metrics for their customer support centres but during the interviews quite a few additional information needs were uncovered. The indicators provided by Antwoord© do however score quite high on the ranked list of information needs. Seven of the Antwoord© indicators are in the top 20 and except for non-critical errors, all the indicators are within the top 50.
When comparing the information needs of municipalities to the COPC-2000 CSP standard, we found that most COPC metrics are very call centre oriented. Also, COPC includes many metrics that are focussed on commercial targets such measures for outbound calls. This makes parts of the COPC-2000 standard not applicable to the municipality context. Most likely this is why the Antwoord©
concept omits a large part of the COPC metrics.
Not many of the newly discovered information needs can be satisfied using the current information supply provided by the eMAXX application suite. Municipalities make due combining management information from the different source systems. Right now the eMAXX application suite is one of these sources. A comprehensive solution would combine information from all of these sources and therefore require the import of data from many source systems into a data warehouse to generate the same management information but also give the flexibility to compare information from different sources and see how different processes influence each other. To get to a solution that is as generic as possible in a context where different municipalities use different source systems, the primary source of information should be systems of the eMAXX application suite itself. This however is not realistic for every information demand since not all information is contained within the eMAXX databases. Thus coupling with external systems are inevitable.

37
Conclusions
Next to the problems of unknown information needs and the large number of product vendors,
two more problems were identified namely that the personnel is not used to strict performance measures and some personnel is insufficiently trained to enter all the necessary information into the KCS. For any management information solution to reach its full potential, these problems will need to be addressed by municipalities as well.
In order to make this comprehensive solution where all management information is contained
within a single system more likely, Exxellence could apply itself to take over simple back-office processes from stand-alone applications. This is already a trend among suppliers of zaaksystemen (“case systems”). This would help to alleviate the problem named ‘many different product vendors’ in the problem analysis.
Additional effort has to be made to bring the KCC managers the information they requested so they can monitor and improve upon the KCC and municipality working processes. A start could be made by completing the steps omitted from the framework of Winter and Strauch. The remaining steps of the framework can be divided into two categories. The first category has steps 3.4, 3.5 and 3.6 and should be performed for every municipality. These steps prescribe taking a closer look at the information requirements with the highest priority. First analyse the source systems by checking whether the data quality is sufficient and how often their data should be updated. Next, the semantic meaning of the information requirements and the source data should be homogenized. New priorities can then be assigned to the management information requirements for example based on the feasibility to fulfil the requirements based on the information available in the data sources.
The second category contains steps 4.1 and 4.2 and can be performed once for all municipalities. Based on the information requirements, a data schema for the data warehouse can be created. In order to do this, the first goal should be to specify the required data for every information requirement. This schema can then be evaluated with end users. Once a data schema has been created and evaluated, the source systems for the data warehouse should be specified per municipality based on the data available in those municipalities.

38
References
8. References
[1] BRW Groep and M&I Partners, "Sturen op Antwoord©," ministerie van Binnenlandse Zaken en Koninkrijksrelaties and ministerie van Algemene Zaken, Eds., ed. Den Haag, 2009.
[2] G. Overeem, W. de Voogd, and M. Minderhoud, "Gemeente heeft Antwoord©," 2 ed. Utrecht: Hiemstra & De Vries, 2007.
[3] Customer Operations Performance Center Inc., "COPC-2000® CSP Standard," ed, 2011. [4] R. Winter and B. Strauch, "Information requirements engineering for data warehouse
systems," presented at the Proceedings of the 2004 ACM symposium on Applied computing, Nicosia, Cyprus, 2004.
[5] S. Chaudhuri, U. Dayal, and V. Narasayya, "An overview of business intelligence technology," Commun. ACM, vol. 54, pp. 88-98, 2011.
[6] S. Negash and P. Gray, "Business Intelligence," in Handbook on Decision Support Systems 2, F. Burstein and C. W. Holsapple, Eds., ed Heidelberg: Springer-Verslag, 2008.
[7] U. Dayal, M. Castellanos, A. Simitsis, and K. Wilkinson, "Data integration flows for business intelligence," presented at the Proceedings of the 12th International Conference on Extending Database Technology: Advances in Database Technology, Saint Petersburg, Russia, 2009.
[8] M. Golfarelli, S. Rizzi, and I. Cella, "Beyond data warehousing: what's next in business intelligence?," presented at the Proceedings of the 7th ACM international workshop on Data warehousing and OLAP, Washington, DC, USA, 2004.
[9] H. Baars and H.-G. Kemper, "Management Support with Structured and Unstructured Data—An Integrated Business Intelligence Framework," Information Systems Management, vol. 25, pp. 132-148, 2008/03/28 2008.
[10] P. Joe, "Customer Relationship Management (CRM) in financial services," European Management Journal, vol. 18, pp. 312-327, 2000.
[11] K. P. Injazz J. Chen, "Understanding customer relationship management (CRM): People, process and technology," Business Process Management Journal, vol. 9, p. 17, 2003.
[12] M. Reimann, O. Schilke, and J. Thomas, "Customer relationship management and firm performance: the mediating role of business strategy," Journal of the Academy of Marketing Science, vol. 38, pp. 326-346, 2010.
[13] S.-L. Pan, C.-W. Tan, and E. T. K. Lim, "Customer relationship management (CRM) in e-government: a relational perspective," Decision Support Systems, vol. 42, pp. 237-250, 2006.
[14] W. H. Inmon, "The data warehouse and data mining," Commun. ACM, vol. 39, pp. 49-50, 1996.
[15] F. Paim, A. E. Carvalho, and J. Castro, "Towards a Methodology for Requirements Analysis of Data Warehouse Systems," Proc. of the XVI Simpósio Brasileiro de Engenharia de Software (SBES2002), Gramado, Rio Grande do Sul, Brazil, 2002.
[16] S. Chaudhuri and U. Dayal, "An overview of data warehousing and OLAP technology," SIGMOD Rec., vol. 26, pp. 65-74, 1997.
[17] R. Kimball and M. Ross, The data warehouse toolkit, 2 ed.: Wiley and Sons, 2002. [18] D. E. Lindstedt. (2002, June 15). Data Vault Overview. Available: http://www.tdan.com/view-
articles/5054/ [19] N. Dindar, P. M. Fischer, and N. Tatbul, "DejaVu: a complex event processing system for
pattern matching over live and historical data streams," presented at the Proceedings of the 5th ACM international conference on Distributed event-based system, New York, New York, USA, 2011.
[20] A. ter Hofstede, W. van der Aalst, and M. Weske, "Business Process Management: A Survey Business Process Management." vol. 2678, M. Weske, Ed., ed: Springer Berlin / Heidelberg, 2003,
pp. 1019-1019. [21] D. Grigori, F. Casati, M. Castellanos, U. Dayal, M. Sayal, and M.-C. Shan, "Business Process
Intelligence," Computers in Industry, vol. 53, pp. 321-343, 2004.

39
References
[22] S. Clarke, "Your business dashboard: Knowing when to change the oil," Journal of Corporate Accounting & Finance, vol. 16, pp. 51-54, 2005.
[23] A. Marcus, "Dashboards in your future," interactions, vol. 13, pp. 48-60, 2006. [24] V. Hetherington. (2009, february 7). The Dashboard Demystified: What is a Dashboard?
Available: http://www.dashboardinsight.com/articles/digital-dashboards/fundamentals/the-dashboard-demystified.aspx
[25] I. Cobbold and G. Lawrie, "The development of the balanced scorecard as a strategic management tool," Performance Measurement Association, 2002.
[26] J.D. Pemberton and A.J. Robson, "Spreadsheets in business," Industrial Management & Data Systems, vol. 100, p. 10, 2000.
[27] M. Golfarelli, "From User Requirements to Conceptual Design in Data Warehouse Design–a Survey," Data Warehousing Design and Advanced Engineering Applications: Methods for Complex Construction, IGI Global, Hershey, pp. 1-16, 2009.
[28] S. Saroop and M. Kumar, "Comparison of Data Warehouse Design Approaches from User Requirement to Conceptual Model: A Survey," in Communication Systems and Network Technologies (CSNT), 2011 International Conference on, 2011, pp. 308-312.
[29] E. Malinowski and E. Zimányi, "Requirements Specification and Conceptual Modeling for Spatial Data Warehouses
On the Move to Meaningful Internet Systems 2006: OTM 2006 Workshops." vol. 4278, R. Meersman, Z. Tari, and P. Herrero, Eds., ed: Springer Berlin / Heidelberg, 2006, pp. 1616-1625.
[30] S. R. Gardner, "Building the data warehouse," Communicantions of the ACM, vol. 41, p. 9, 1998.
[31] A. van Lamsweerde, "Goal-oriented requirements enginering: a roundtrip from research to practice [enginering read engineering]," in Requirements Engineering Conference, 2004. Proceedings. 12th IEEE International, 2004, pp. 4-7.
[32] D. L. Moody and M. A. R. Kortink, "From enterprise models to dimensional models: A methodology for data warehouse and data mart design," DMDW’00, Sweden, vol. 5, 2000.
[33] R. Bruckner, B. List, and J. Schiefer, "Developing requirements for data warehouse systems with use cases," 2001, pp. 329-335.
[34] F. R. S. Paim and J. F. B. de Castro, "DWARF: an approach for requirements definition and management of data warehouse systems," in Requirements Engineering Conference, 2003. Proceedings. 11th IEEE International, 2003, pp. 75-84.
[35] R. Winter and B. Strauch, "A method for demand-driven information requirements analysis in data warehousing projects," in System Sciences, 2003. Proceedings of the 36th Annual Hawaii International Conference on, 2003, p. 9 pp.
[36] N. Prakash and A. Gosain, "An approach to engineering the requirements of data warehouses," Requirements Engineering, vol. 13, pp. 49-72, 2008.
[37] N. Prakash, D. Prakash, and D. Gupta, "Decisions and Decision Requirements for Data Warehouse Systems
Information Systems Evolution." vol. 72, P. Soffer and E. Proper, Eds., ed: Springer Berlin Heidelberg, 2011, pp. 92-107.
[38] N. Prakash, Y. Singh, and A. Gosain, "Informational Scenarios for Data Warehouse Requirements Elicitation
Conceptual Modeling – ER 2004." vol. 3288, P. Atzeni, W. Chu, H. Lu, S. Zhou, and T.-W. Ling, Eds., ed: Springer Berlin / Heidelberg, 2004, pp. 205-216.
[39] J.-N. Mazón, J. Pardillo, and J. Trujillo, "A Model-Driven Goal-Oriented Requirement Engineering Approach for Data Warehouses
Advances in Conceptual Modeling – Foundations and Applications." vol. 4802, J.-L. Hainaut, E. Rundensteiner, M. Kirchberg, M. Bertolotto, M. Brochhausen, Y.-P. Chen, S. Cherfi, M.

40
References
Doerr, H. Han, S. Hartmann, J. Parsons, G. Poels, C. Rolland, J. Trujillo, E. Yu, and E. Zimányie, Eds., ed: Springer Berlin / Heidelberg, 2007, pp. 255-264.
[40] OMG. (2005). OMG: MOF 2.0 Query/View/Transformation. Available: http://www.omg.org/cgi-bin/doc?ptc/2005-11-01
[41] C. Salinesi and I. Gam, "A Requirement-driven Approach for Designing Data Warehouses," 2006.
[42] J. Schiefer, B. List, and R. Bruckner, "A holistic approach for managing requirements of data warehouse systems," 2002, pp. 77-87.
[43] L. Zepeda, M. Celma, and R. Zatarain, "A Mixed Approach for Data Warehouse Conceptual Design with MDA
Computational Science and Its Applications – ICCSA 2008." vol. 5073, O. Gervasi, B. Murgante, A. Laganà, D. Taniar, Y. Mun, and M. Gavrilova, Eds., ed: Springer Berlin / Heidelberg, 2008, pp. 1204-1217.
[44] L. Zepeda and M. Celma, "A model driven approach for data warehouse conceptual design," in Databases and Information Systems, 2006 7th International Baltic Conference on, 2006, pp. 114-121.
[45] Y. Guo, S. Tang, Y. Tong, and D. Yang, "Triple-driven data modeling methodology in data warehousing: a case study," presented at the Proceedings of the 9th ACM international workshop on Data warehousing and OLAP, Arlington, Virginia, USA, 2006.
[46] A. Davis, O. Dieste, A. Hickey, N. Juristo, and A. M. Moreno, "Effectiveness of Requirements Elicitation Techniques: Empirical Results Derived from a Systematic Review," in Requirements Engineering, 14th IEEE International Conference, 2006, pp. 179-188.
[47] ATLAS.ti Scientific Software Development GmbH. (2012, 5 juli). ATLAS.ti: The Qualitative Data Analysis & Research Software. Available: http://www.atlasti.com
[48] Google. (2012, June 18). Google Analytics. Available: http://www.google.com/intl/en_uk/analytics/
[49] A. Boerma and R. Scholten, "Architectuur blauwdruk eMAXX ApplicatieSuite," ed. Hengelo: Exxellence Group, 2009.

41
Appendix A: Abbreviations and glossary
Appendix A: Abbreviations and glossary
Abbreviations
Abbreviation Phrase Translation (nl-en)
AHT Average Handling Time
BI Business Intelligence
BPM Business Process Management
CIM Computation Independent Model
CRM Customer Relationship Management
CSS Customer Service/Support Staff
DMS Document Management Systeem Document Management System
DW Data Warehouse
DWARF Data Warehouse Requirements deFinition
ER Entity-Relationship
ESB Enterprise Service Bus
ETL Extract Transform Load
GORE Goal-Oriented Requirements Engineering
IVR Interactive Voice Response
KCC Klant Contact Centrum Client Contact Centre
KCS Klant Contact Systeem Customer contact system
KPI Key Performance Indicator
OLAP Online Analytical Processing
OLTP Online Transaction Processing
OMG Object Management Group
PIM Platform Independent Model
RE Requirements Engineering
SQL Structured Query Language
UML Unified Modelling Language
UWV Uitvoeringsinstituut Werknemersverzekeringen
Unemployment office
Glossary
Term Definition
Antwoord© Concept designed to improve municipality customer service and efficiency (chapter 1)
Back-office A collection of (legacy) data source systems
Cycle time Norm time from case start to completion in which a case should be handled.
DigiD Governmental authentication system for Dutch citizens to prove their identity
eMAXX Prefix for applications of Exxellence Group
Front-office Collection of user interfaces
Gegevens Magazijn Database that stores data loaded from source systems to make the data accessible
Gemeentelijke Database that stores basic information about citizens and organizations

42
Kernregistraties such as name, address, date of birth etc.
Interactive Voice Response
Phone menus, speech recognition, voice mail
Kennisbank Knowledge base used by KCC employees to find information about domains, products and services in order to answer customer inquiries.
Mid-office Central systems that make data from the back office available for the front office as well as providing process logic for the front office applications.
Statistiek database Statistics database responsible for storing usage statistics of the knowledge base.
Telephone exchange System responsible for telephone guiding telephone traffic. In this case a private branch exchange which serves a particular organization or office as opposed to a carrier’s telephone exchange which serves a much larger area.
Zakenmagazijn Part of the eMAXX ZaakSysteem that stores information about cases and their status
Zaakgericht werken Case oriented approach (process oriented)
ZaakSysteem Mid-office system that stores case status information and handles workflows
ZaakTypeCatalogus Database with case type definitions

43
Appendix B: Original interview questions (Dutch version)
Appendix B: Original interview questions (Dutch version)
Wat zijn de doelstellingen binnen het Antwoord© concept?
o Met welke indicatoren wordt de voortgang van deze doelen gemeten?
o Welke managementtaken moeten volbracht worden om deze doelen te bereiken?
o Welke managementinformatie is nodig om deze taken uit te voeren?
o Wanneer moet de informatie beschikbaar zijn?
o Over welke termijn moet de informatie beschikbaar zijn?
o Wat zijn de bronnen van deze informatie?
o Is de informatie kwalitatief goed genoeg voor de managementinformatievoorziening?
o Zijn er restricties in het gebruik van de bronnen (bv. Privacy)?
Op welke manier moet de managementinformatie gepresenteerd worden?
Van welke domeinen zal het klantcontact als eerst via het KCC verlopen?
Voor zover nog niet behandeld, moeten de volgende indicatoren beschikbaar zijn in het
managementinformatierepresentatie?
o Zijn er toevoegingen aan deze lijst nodig?
o Welke indicatoren hebben prioriteit?
o Zijn er gebeurtenissen waarvan managers meteen op de hoogte gesteld moeten worden?
Table 5: Antwoord© key performance indicators [1]
Kritische succesfactoren
Key performance indicators (eenheid)
Verbetering van dienstverlening
Klanttevredenheid
Binnen serviceinterval
Verlaten wachtrij
Kritieke fouten
Niet-kritieke fouten
Klachten
Direct beantwoord
Verbetering van de efficiëntie
Behandelduur
Aantal klantcontacten
Bezettingsgraad
Nauwkeurigheid voorspelling aanbod
Operationeel verzuim
Opdrachtgevertevredenheid
Welke managementinformatie is op dit moment al beschikbaar?
Heeft u interesse om inhoudelijk schriftelijk commentaar te leveren op eisen die afgeleid worden uit
dit interview en interviews met andere gemeenten?
Heeft u nog vragen aan mij?

44
Appendix C: Description of information needs
Appendix C: Description of information needs
The appendix contains the descriptions of information in alphabetical order.
Alert when there's an influx of new cases of a certain type - Alert when a certain case type occurs
much more than regular.
Appointments created through the website - Is the website an important source of appointments or do
customers still prefer to call the municipality for appointments.
Availability in case of emergencies - In some cases the municipality services should be available
outside of opening hours. For emergencies such as a tree threatening to fall over onto a public road,
clogged sewers flooding roads, etc.
Availability per phone number - Wait time per phone number.
Availability telephone compared to number of visitors on the website - To see whether the website is
getting more visitors when phone availability is low.
Availability website - Uptime.
Average after-conversation handling time - The time an employee needs to handle the call after the
conversation. For example to register the case.
Average handling time - Average time required to help the customer. Interesting to analyse per
employee, case type or a combination of both.
Average hold-time - Average time a customer was put on-hold after the conversation has started.
Average total handling time per call - Call time (including hold-time) plus the time needed to register
a case afterwards.
Average wait time - What is the average wait time for customers per channel.
By appointment - Share of counter contacts that made an appointment for the contact.
Calls are only forwarded once - If the customer is forwarded, it should be to the correct person.
Calls forwarded immediately - Telephone number unreachable and thus immediately forwarded.
Calls forwarded within norm - When a case cannot be handled by 1st line support the call should be
forwarded within the norm time.
Case status requests - How often and through which channels do customers check on the status of their
case.
Cases per employee - How many cases did a certain employee handle and of which case types.
Complaints - Number of received complaints.
Completed cases which exceeded norm time - Number and percentage of cases that was not completed
within the specified acceptable time limit but was completed none the less.
Completed cases within norm time - Number and percentage of cases that was completed within the
specified acceptable time limit.
Correct answers - Are the given answers correct.
Critical errors - Errors that incur extra costs for the municipality. For example accepting an invalid
picture for a passport.
Current queue length - Useful for team leaders to see whether it is necessary to increase capacity at
this moment.
Customer age - Customer age might influence the customer’s choice of communication channel.
Customer satisfaction - Customer rating given to municipality service. Usually on a scale of 1-10.
Customers on time for their appointment - Which percentage of customers with an appointment is on
time.
Descent - Descent can influence purchasing behaviour.
Discontinued requests (step in the process where an order was cancelled) Digital counter: At
which step are orders cancelled. For example when trying to request a building permit, 40% or
requests is stopped at step 3. -> Is there something wrong with step 3?

45
Appendix C: Description of information needs
Education - Education can influence purchasing behaviour.
Employer satisfaction - Is the office for whom the customer contacts are handled satisfied with the
results.
Erroneous GBA mutations - When an error is encountered in the GBA it would be useful to identify
the case or request responsible for the error. In that case the responsible employee can be made aware
of his/her mistake.
Events that cause an influx of customers - Register which events (e.g. news) cause an increase in the
number of customers. The next time such an event occurs appropriate action can be taken.
Family composition - Family composition can influence purchasing behaviour.
Fault reports and work sites on a map (including planning) - Which work projects cause a lot of fault
reports. Might help to forecast future reports for similar work projects.
Fault reports on the same location (also over longer periods of time) - When there are multiple reports
from one location it could indicate something is going on. For example if pavement tiles keep moving
out of place at the same location, this could indicate a problem with the sewer system at that location.
First contact resolution - The question or issue is handled at the first contact (1st line support).
Follow-up appointments - Which case types cause a lot of follow-up appointments. For example a
customer did not bring the right documents to the appointment, do we need to change the
communication to the customer about this case type.
Follow-up call performed within agreed norm - When a customer is told he/she will be called back.
Does the follow-up call take place within the norm time.
Forwarded calls without a KCS case - Are all forwarded calls accompanied by a case so the back-
office does not need to ask the customer for information already provided to the front-office. E.g.
which employees forget to add a case.
Forwarded cases of which the status has been updated by the back-office - Per case-type one could
look at whether or not a status update is required from the back-office and whether this actually
happens.
Gender - Gender can influence purchasing behaviour.
Income - Customer in a certain income range might request different products.
Justified complaints - Justified complaints compared to total complaints.
Leaving queue - How many customers left the queue. Telephone: How many customers hang up before
the phone was answered. Counter: How many customers left the queue before their number was up.
Length of customer visit - Total time the customer spent at the municipality. From taking a ticket to
finishing business at the counter.
Marital status Marital status can influence purchasing behaviour.
Most frequent questions (from customers) - Which questions are asked most frequently. These
questions could be answered through the website or given a more prominent position on the website.
Most visited pages on the website - Which pages on the website receive the most hits. What are the hot
topics at this moment.
Non-attendance - Employees who are on the roster but did not show up.
Non-attendance compared to forecast - What is the difference between non-attendance and the non-
attendance forecast.
Non-critical errors - Procedural errors that do not incur extra costs. For example a customer is not
greeted correctly.
Number of appointments handled per counter - The number of appointments handled per individual
counter.
Number of calls forwarded to the back-office - Which employee or about which case types are calls
often forwarded to the back-office.
Number of calls outside of opening hours - Could be an indicator of the opening hours being unclear to
the public.

46
Appendix C: Description of information needs
Number of calls per phone number - In case the municipality uses multiple phone numbers. Which
phone numbers still receive a lot a calls? Even if only one central number should be used. Could
indicate the old phone number is still advertised on the website or somewhere else.
Number of cases closed after the call was forwarded to the back-office - Number and percentage of
cases closed after the customer’s call was forwarded to the back-office. Which cases are closed
immediately? Are these cases suitable to transfer to the front-office organisation.
Number of cases created - Are cases actually created when a customer contact has occurred.
Number of cases forwarded to back-office - Differs from the number of calls forwarded because cases
can also be forwarded without a call or a call can be forwarded without creating a case. Interesting to
view per case type, employee or a combination of both.
Number of completed cases - Number of completed cases per employee, department, unit of time, case
type or combinations of these dimensions.
Number of consultations of a certain question in the knowledge base - Which questions are consulted
most often in the knowledge base.
Number of contacts per customer - Which customers contact the municipality most often and about
which types of cases.
Number of contacts per type of customer profile - When customer profiles are created, which type of
customer often contacts the municipality and about which topics.
Number of customer contacts - Number of attempts to contact the municipality that actually lead to
contact.
Number of customers - Number of customers that attempts to initiate contact with the municipality.
Number of customers at the wrong counter - Do customers make mistakes when drawing a ticket and
thereby end up at the wrong counter. If so, for which cases.
Number of customers who live in a different municipality - For example fault reports can be reported
by citizens from other municipalities.
Number of e-mails per e-mail alias - When a municipality uses more than one e-mail address, one
could look at which addresses are used for which case types.
Number of lengthy conversations - Which employees are often involved in long phone calls. Are there
certain case types for which the phone calls is often longer than expected.
Number of no-shows - Customers that do not show up for their appointment.
Number of open cases - Number of cases that have not yet been handled.
Number of open cases exceeding norm time - Number and percentage of uncompleted cases which has
exceeded the acceptable time limit.
Number of open cases with scheduled completion date - Number of cases for which a completion data
has been added.
Number of open cases within norm time - Number and percentage of uncompleted cases which has not
yet exceeded the acceptable time limit.
Number of payments per payment method - What are the most used payment methods and for which
case types.
Number of products sold - Products paid for by customers. Interesting because customers might
purchase several products at a time. E.g. a family that purchases multiple passports.
Number of waiting customers exceeding norm - The number of waiting customers whose wait time
exceeds the norm at this moment.
Number-of-customers forecast accuracy - What is the difference between the number of customers
forecasted for a time period and the actual number of customers.
Occupancy rate - Percentage of total work time that an employee spends on handling customer
contacts.
Occupancy rate per employee specialisation (counter) - In case not all employees can perform the
same tasks, it can be interesting to see which specialisations have the highest work-load.

47
Appendix C: Description of information needs
Opportunity to explain complaint - Did the customer get a chance to explain the complaint in person.
Page visit paths including visit times - Which pages are visited most often or the longest. Which paths
do customers take through the website.
Payment method - Preferred payment method of this type of customer.
Perceived usefulness of the information on the website - Per subject whether the visitor found the
information on the website useful. (Survey on the website).
Preferred channel per type of customer - Do some customer types prefer one channel over others.
Products combinations that are often sold simultaneously - Certain products are often sold together.
An employee could use this information to offer a complementary product instead so the customer
doesn’t have to return on a separate occasion.
Purchasing behaviour - Purchasing behaviour associated with this customer profile.
Receipt acknowledgement sent in time - Acknowledgement of receiving a letter is sent within the norm
time.
Search behaviour on the website - What are the search terms used and which of these terms
does not yield the (intended) results.
Seasonal patterns customer numbers - Number of customers expected in a time of year. For planning
purposes. Also, which cases occur more at certain times of the year.
Time available - Does the customer have a lot of spare time or not. Does this influence their choice of
communication channel.
Time of spikes in wait time - At what times do spikes in wait time occur. For example, are there always
long queues on Thursday afternoon.
Uniform information provided through all channels - Does the customer receive the same information
regardless of the communication channel.
Wait time distribution - Numbers per categorized wait time (e.g. 5-15, 15-30, 30-60, 60+ min).
Which used search terms do not give any results from the knowledge base - Which subjects are often
looked up by employees in the knowledgebase without any results. Useful to identify subjects of which
the information is still missing from the knowledge base. Perhaps look at queries that do not result in
an answer being assigned to a case.
Within service interval - Does the wait time of the customer exceed the norm.

48
Appendix D: Results table
Appendix D: Results table
Table omitted, available in confidential version

49
Appendix E: COPC-2000 metrics
Appendix E: COPC-2000 metrics
This appendix contains the metrics as defined in the COPC-2000 CSP standard [3]. Please note that COPC uses the term end-user for what is called a customer in the rest of this thesis. COPC uses the term client to describe what was called employer in the rest of the thesis and refers to the organization for which customer service is handled.
Table 6: COPC-2000 CSP metrics linked to information needs from the results
Table 6 omitted, available in confidential version.