Mahindra Holidays & Resorts India Ltd. Dec 2018 - ASQ
48
1 Leading to higher Member Loyalty Mahindra Holidays & Resorts India Ltd. Dec 2018 And our quality journey… 2
-
Upload
khangminh22 -
Category
Documents
-
view
0 -
download
0
Transcript of Mahindra Holidays & Resorts India Ltd. Dec 2018 - ASQ
1
Leading to higher Member Loyalty
Mahindra Holidays & Resorts India Ltd.
Dec 2018
And our quality journey…
2

2
For more than 2 decades and more than a million hearts an year…
3
Making Every Moment Magical!
4

3
5
Domestic
International
Over the last decade…
6
• QMS in Member Relations & Resort
operations - ISO Certified
• Customer Feedback limited to member
interactions & holiday experience.
• Inducted into TMW (The Mahindra way)
Defined
• 360 degree feedback system – feedback from all
customer touch points.
• QMS in Administration - ISO certified
• Transactional CaPs introduced as new metric in all
member surveys
• Scope of the feedback extended to Post purchase
experience, onboarding, & Reservation & general
servicing
• Centralized Complaint Resolution Unit
Proactive
• IT – ISO certified in Information security
• Outsourcing of Centralized customer services.
• Food safety hygiene: BHC (Branch Hygiene
Code) certification for 10 resorts.
• CES – Customer Effort score as a metric
introduced.
Predictive
• Predictive system – Text analytics to understand
member VOC and read behaviors.
• Member Segmentation
• Identify customer dissonance through - DAS
(Disengagement alert system)
• Phase-1: Integrated Feedback system to understand
member behavior at various touch points.
2007-11
2012-14
2015-17
2018 onwards Reactive
* QMS – Quality Management System

4
7
Implementation procedures/Standards and
monitors adherence to system & standards &
measure of performance. Responsibility:
(Functional Level)
External Audits &
Process Compliance
Centralized function
assessing, compliance to
stated standards are
monitored & reported to
LT & functional Head
Top Management
review
a. Performance of
Quality measures
b. Status of Initiatives
Identification of Problems and solve using
Quality Tools & techniques. Responsibility:
(Functional/Corporate level)
The training on quality tools & techniques and
mentoring of projects is done centrally by
Business Excellence
C-SAT/CAPS at all customer
touch points
Customer Complaints
Implementation of
Systems/Procedures & Monitoring
output quality. Responsibility
(Corporate & Functional level)
Quality Control
Quality Improvement
Quality Assurance
Vision of the company
Quality Objectives
The Mahindra Way (TMW) Principles
8

5
The Mahindra Way (TMW)
9
FY -10 FY -11 FY -12 FY -13 FY -14 FY -15 FY -16 FY -17
FY18 - Cycle 10
Moved to Stage 5
(Ready to apply for
Deming Award)
Civic Award- Good Corporate Citizen,
2017
Best Social Media Brand – Hospitality
CII National HR Excellence
Award 2017
Winner- Creating Distinct Value
Certificate of excellence
TripAdvisor
27 Resorts In
India received
the certificate of
excellence
awards
DX leader – Operational
Transformation
Winner –
Mobile APP
TISS Leapvault – Gold Award
Winners
CLO
Award WINNER
Golden Peacock Award -
Sustainability
Rank 66 – GPTW 2018
10

6
Key benefits realized over the last 2 years
11
464
6420
12829
18791
0
5000
10000
15000
20000
FY 15 FY 16 FY 17 FY18
Co
un
t o
f k
aiz
en
s
Year
KAIZEN - SMALL IMPROVEMENTS
2891
4537
10084
0
2000
4000
6000
8000
10000
12000
FY16 FY17 FY18
ELEARNING MODULE - COUNT OF CERTIFICATIONS
66%
79%
92%
0%
20%
40%
60%
80%
100%
FY16 FY17 FY18
EMPLOYEES INVOLVED IN IMPROVEMENT ACTIVIT IES
Section 1
12

7
13
Vision of the company
Evolution of the Vision
Long Term Goals and Interim Milestones
Past strategic themes
Internal & External Gaps identification &
SWOT
Gaps identified through SWOT &
Benchmarking
Arriving at Strategic Priorities and
Initiatives
Translating Strategic Priorities & BSC to Strategic initiatives through X-Matrix
Identification of Strategic
Projects
Methodology
14
APC Methodology
Phase 1
BSC deployment
Can it be achieved
through incremental
approach
Standard Adequate
Standard Adhered
Standard available
Abnormality
detected
NO
NO
NO
Yes
Yes
Yes
Yes
NO
PDCA of previous
year SWOT
Strategy Formulation /BSC
BSC deployment
Disruptive improvement
initiatives
Implementation of the initiatives
through projects
Create or modify standards
Daily Work Management
Objectives Procedures
Monitor Performance -
Daily/Weekly/Monthly
Document control using
master tracker
Create or modify Standards
Communicate - Training/Refresher on
standards/Procedures
Implement standards - Regular training
Monitoring - Process measures at set
frequency (Daily/Weekly/Monthly)
Corrective
Actions
Phase 2
Identification of
Strategic
projects &
driven by CFT –
reporting to
Leadership
Phase 3
Standards & Role
Clarity
Phase 4
Monitoring,
Abnormality Handling,
revision & creation of
new standards

8
15
Our Strategic Priorities & Connect to Long Term Goals
Long Term Goals
Strat. Priorities
Net Member
Addition
Total
Income
Cost of
Acquisition
Inventory
Addition
Member
Engagement
A. Increasing the depth &
quality of member acquisition X X X
B. Create an experience
ecosystem X X X
C. Accelerating Resort Creation X X X X
D. Driving product innovation X X
E. Digitisation and Analytics
Driven Enablement X X X X
F. Creating Engaged &
productive Workforce X X X X
16
MHRIL Strategic priorities & Initiatives – FY17 & FY18
Strategic Priorities Strategic Initiatives
A. Increasing the Depth and
Quality of Member Acquisition
A1. Expanding geographical reach
A2. Improving quality of acquisition
A3. Innovation in lead management
B. Create an Experience
Ecosystem for members
B1. Year-round member engagement opportunities
B2. Significant improvement in booking experience
B3. Improved onboarding experience
B4. Innovate in-resort experience
C. Accelerating Resort Creation
C1. Unconstrained supply of room inventory through leasing/ inventory alliances with
high quality resorts
C2. Faster and high-quality room inventory creation with standardised processes
D. Driving product innovation D1. Expand the product offerings
D2. Strengthening core product offering
E. Digitisation and Analytics
Driven Enablement
E1. Using digitisation as a key service delivery mechanism
E2. Digitisation of internal processes
E3. Analytics for decision making in management, marketing and sales
E4. Analytics for improving member experience
F. Creating Engaged &
Productive Workforce
F1. Manpower Rationalisation & improving Span of Control
F2. Capability building initiatives & Providing internal growth platforms

9
17
Steps involved in Project Approval
Strategic initiatives
mapping to Goals – X Matrix
Identification of goals which
require disruptive improvement
Mapping key metrics along
with impact areas
Basis impact and need, Projects are prioritized
Project proposal to Steering Committee
Approval by head of Steering
Committee (MD & CEO)
18
Reasons for detractors
“Booking Experience” followed by “Availability related” are the major areas of dissatisfaction among members
Booking Experience Base - 157
Difficult overall to book a
holiday 59%
Website experience not up to
mark 23%
No communication or
proactiveness from CMH on
booking holidays
18%
Availability related Base - 84
Almost everything seems non-
available 56%
Season eligibility related 29%
Resort choice is an issue 15%
Base: 853 36%
1%
1%
2%
3%
5%
6%
7%
8%
8%
24%
44%
Others
Lack of personalization tomember
HFRP Related
Member Relations
TRS – (Travel Related Services)
Resort Related
Sales Related
Cost of the product
Annual Subscription fees is toohigh
Food Related
Reservation Rules
Non Availability
Availability related
Booking experience
Detractor analysis of FY15 & FY16

10
19
Category Strategic initiatives linked Goals Linked Metrics Linked
Booking
Experience
1. Significant improvement in booking
experience
2. Improved onboarding experience
3. Using digitization as a key service delivery
mechanism
1. Improve Loyalty Scores of members
to attract more referral sales
2. Digitization of booking experience
and self-help options
NPS, Resort
Occupancy,
Digital
Penetration
Availability
Related 1. Expand the product offerings
2. Analytics for improving member experience
1. Improve percentage of active
eligible members holidaying
2. Reduce reservation related
complaints
Unique Members
Holidaying,
Reservation
Complaints
Linkage to Strategic initiatives and BSC
20
81% 82% 82% 81%
19% 18% 18% 19%
0%
10%
20%
30%
40%
50%
60%
70%
80%
90%
100%
FY13 FY14 FY15 FY16
Resort Occupancy trend - FY13 to FY16
Resort Occupancy Not filled %
Stagnant Resort Occupancies – 19%
rooms going empty every year (1%
occupancy is approx. 10,000 Room nights,
1 Room night‟s average room revenue is
approx. INR 2000)
12%
30% 31% 33%
0%
5%
10%
15%
20%
25%
30%
35%
FY13 FY14 FY15 FY16
Member Experience Net Promoter Score trend
Though NPS Scores have improved, they
have been stagnant over the last 3 years

11
21
• Complaints on reservations high despite reduction
• Stagnant % website penetration (No. of bookings done online out of overall bookings)
3942
3452
2950
2301
0
500
1000
1500
2000
2500
3000
3500
4000
4500
FY13 FY14 FY15 FY16
Reservation Complaints
12%
27% 29% 28%
31%
0%
5%
10%
15%
20%
25%
30%
35%
FY12 FY13 FY14 FY15 FY16
Web Penetration Trend
22
Metric
Organization’s perspective Customer’s perspective
New Sales Revenue Maintenance
Fee Payments Self-care options
First Choice holidays
Lower booking effort
Resort
Occupancy L H H L H M
Net Promoter
Score H M H H H H
Reservation
Complaints H M M H H H
Web Penetration
trend H M H L H M
Degree of Impact
H – High M – Medium L - Low
Most metrics
play a key role,
both from a
member and the
organizations
perspective

12
23
Pre-sales Onboarding Holiday Reservation &
Servicing Holidaying
Lead Generation Verification Contact Centre experience Check-in experience
Appointment Membership Kit Reservations through website In-room Experience
Membership sign-up First EMI & ASF
Payment
Confirmation Voucher & pre-
holidaying Resort Amenities
First Holiday
Planning
Complaint & Service request
handling Food & Beverage
Check-out experience
Membership Life-cycle and impacting areas
Touch Points
24
Metric Category Current Level Target Level Impact
Resort Occupancy Main Measure 81% 85%
40,000 room nights per year – 15,000 families getting magical moments – INR 20 crores (USD 3 Million)
Net Promoter Score Main Measure 33% 60%
More than 2,00,000 feedbacks an year – leading to proportionate increase in referral sales
Reservation Complaints Counter Measure
2300 500 Thereby reducing Social Media negativity and increase in P:N ratio
Web penetration trend Main Measure 31% 60% Scalability, proportionate increase in number of bookings

13
Section 2
25
26
PROJECT STATEMENT
At Mahindra Holidays, the core expectation of a member is to holiday and it is important that the process of booking a holiday is simple
and effortless. It is also important to ensure transparency and improve the perception of choice/availability to members. This directly
impacts key measures such as Net Promoter Score, which plays a key role in a „Word of Mouth‟ business like ours. Other revenue metrics
such as Resort Occupancies are also affected. Current State: NPS: 33%; Occupancy: 81%. Expected State: NPS: 60%; Occupancy: 85%
PROJECT TYPE The project is a Continuous Improvement Project – aiming to ensure that reservation experience of members improves across all touch
points
ASSUMPTIONS/EXPECTATIONS PROJECT SCOPE
1. Cross functional resources will be available to complete the
project on time
2. Involvement of cross-functional team at every stage
3. Alignment of third-party vendors/resources on project objectives
4. Management support & approval of technology automation
related solutions
5. Effective change management throughout the project cycle
6. Project reviews with Project Champion and Sponsor
In Scope:
1. All reservation related processes
2. Website bookings
3. Contact Centre Reservations
4. Communications to members on reservations
5. Reservation related complaints
6. Reservation feedbacks
7. Reservation related policies
Out of Scope:
1. Any process apart from reservations
2. Any membership policies apart from reservation

14
27
BUDGET (Financial and/or Resource Constraints)
1. Any budgetary needs of the project (for any automation/systemic development) will be approved by the project sponsor (MD)
2. All project resources are already aligned to the project internally and with third-party vendors
3. The project aims at an increase in bottom line by at least INR 8 crores (as resort revenue). This is apart from all the other potential
increase in revenue possible through member referrals & payment collections resulting due to increase in member satisfaction
PROJECT SCHEDULE
This is a Continuous improvement project. The organization studied past projects of similar nature to arrive at timelines:
1. Plan: Problem definition: April-2016; Measure and Analyze: May 2016
2. Do: Solution Architecture and implementation in phases starting from June 2016 to January 2018
3. Check and Act: Starting Aprtil 2017, standardization and any further improvements to be done
RISK MANAGEMENT
Risks Mitigation
Lack of last-mile communication considering the scale &
scope of project
Communication plan to both members and internally to
overcome this
Lack of allocation of time by project team members Project part of everyone‟s Goal sheets along with benefits
Member/employee feedback on proposed changes Feedback management process strengthened with UAT
scenarios and member interviews to ensure feedback is
taken on time
28
Type of
Projects
Continuous
Improvement
Process
Improvement
Problem
Solving Design Transformational
Process Current Gap Impact on Members
Impact on
Organization
Booking process in the
reservation engine Lack of a waitlist option H H
Bookings through contact
centre and website
Experience not up to
expectations H H
Booking Refusal Management
Process not seamless
from Supply to Output H H
Variety of choice
In-city and other
destinations (apart from
our resorts) lacking
H
M
Bookings through contact
centre and website
First-time refusals high
for members H H
The matrix helped in
identifying the type of
project – where
existing processes /
technology had to be
leveraged to address
the gaps

15
29
In Scope:
1. All reservation related processes
2. Website bookings
3. Contact Centre Reservations
4. Communications to members on reservations
5. Reservation related complaints
6. Reservation feedbacks
7. Reservation related policies
Out of Scope:
1. Any process apart from reservations
2. Any membership policies apart from
reservation
30
1. Cross functional resources will be available to
complete the project on time
2. Involvement of cross-functional team at every
stage
3. Alignment of third-party vendors/resources on
project objectives
4. Management support & approval of
technology automation related solutions
5. Effective change management throughout the
project cycle
6. Project reviews with Project Champion and
Sponsor

16
31
Stage Plan Do Check & Act
Actions
Problem
Identification,
Measure and
Analysis
Solution
identification,
designing and
implementation
Standardization,
Communication
of solution, VOC
on changes
Timeline Apr-16 to May-16 Jun-16 to Jan-18 Apr-17 onwards
32
1. Any budgetary needs of the project (for
any automation/systemic development)
will be approved by the project sponsor
2. All project resources are already aligned
to the project internally and with third-
party vendors
3. The project aims at an increase in
bottom line by at least INR 20 crores (as
resort revenue). This is apart from all the
other potential increase in revenue
possible through member referrals &
payment collections resulting due to
increase in member satisfaction
17
33
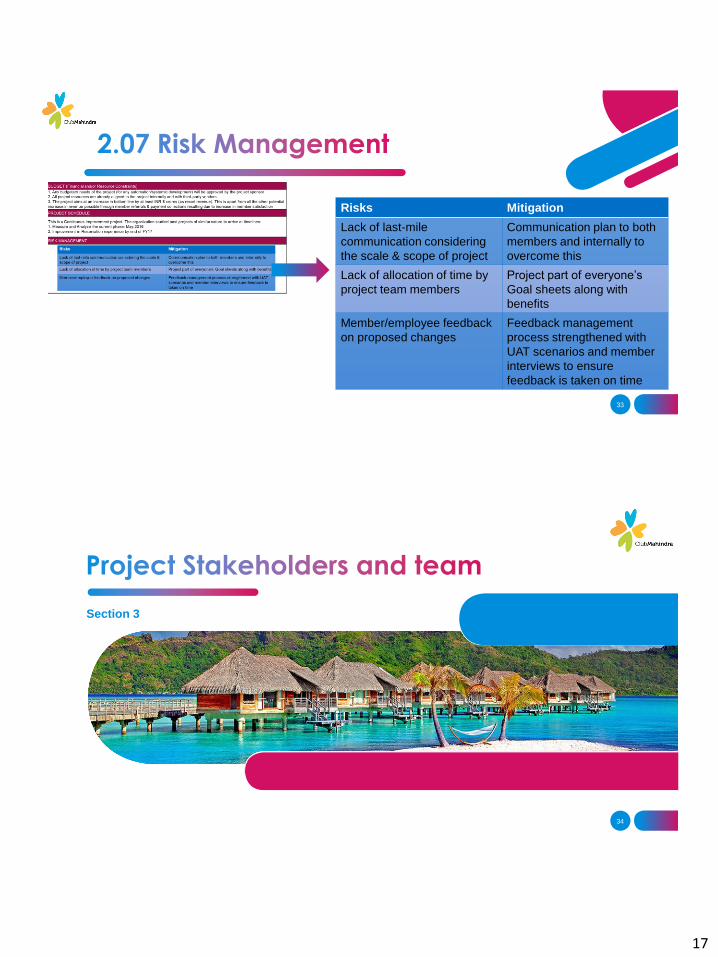
Risks Mitigation
Lack of last-mile
communication considering
the scale & scope of project
Communication plan to both
members and internally to
overcome this
Lack of allocation of time by
project team members
Project part of everyone‟s
Goal sheets along with
benefits
Member/employee feedback
on proposed changes
Feedback management
process strengthened with
UAT scenarios and member
interviews to ensure
feedback is taken on time
Section 3
34

18
35
• SIPOC for the process
• Key stake-holders at each stage
Processes involved
• Basis SIPOC, each sub-process is identified
• Special Point of Contacts (SPOCs) for each touch point
Sub-Processes • Team formation –
Cross-functional
• Stakeholder classification basis role
Project Team & Stakeholders
• Identification of Risk at various processes
• Mitigation planned proactively
Risks
Process for stakeholder identification of Projects in the organization
36
SIPOC – Reservation Process
Supplier Input Process Output Customer
Contact
Centre/Website Holiday Request Reservation Process
Holiday Confirmation
Voucher Member / Non
Member
Member / Non
Member Non Availability of
Rooms Reservation Process
Holiday Denial
/Refusals Member / Non
Member
Member / Non
Member Confirmed Holidays Reservation Process
Daily Reservation
Report Resort
Operations
Member / Non
Member Confirmed Holidays
Occupancy
Management Process Daily Occupancy
Report Senior
Management
Starts : Member Holiday Requirement Ends : Room Occupied / Empty, Refusals
Key Stakeholders:
1. Member Reservation Team
(Both internal & external
2. Inventory Management
team
3. Information Technology –
Reservation Engine,
Website
4. Strategic Projects
5. Vendors – Developing and
testing teams (External)

19
37
Influencer Executor
Stakeholders Type of Stakeholder
(Ranking) Description Role
Steering Committee Influencer Sponsor and Champion Drive strategic objectives
Drive organizational goals
Project toll-gate reviews
Member Experience Team Executor Subject Matter Expert Analysis of process
Brainstorming of solutions
Solution identification & implementation
Inventory Management Team Executor Subject Matter Expert Process changes implementation
Brainstorming of solutions
Solution identification & implementation
Information Technology Executor Project Coordination Systemic Vendor identification
Solution Conceptualization & Designing
Solution implementation
Strategic Projects Team Executor Vendor Negotiation & Project
Coordination Project Governance
Business Partner - Contact
Centre Executor Subject Matter Expert
Problem Bank
Brainstorming of solutions
Partners - Information
Technology Executor Development and testing Development and testing
Partners - Analytics Executor Analysis, Data interpretation and
model-building Analysis, Data interpretation and model-
building
Members Influencer End Customer End Customer
38
Influencer Executor
Project Sponsor
Mr. Kavinder Singh, MD&
CEO, Mahindra Holidays
Project Champion
Mr. Sujit Paul, Chief – Member
Experience and Business
Excellence, Mahindra Holidays
• Provides Strategic vision
• Guarantee commitment of team
• Remove roadblocks
• Ensures alignment with business
• Ensures resource allocation
• Decision making with Project Lead
Key Expectations of Sponsor and Champion:
• Toll gate reviews and sign-offs
• Guidance on additional skill-sets required
• Budgetary sign-offs required
• Additional resource allocation as & where required
Review Mechanism established
• Project update reports on email every week
• Fortnightly meetings with Project team along
with steering committee
• Daily reports on data points

20
39
Project Team Knowledge
Required Current Level Gaps Identified As Is To Be Training given
Sponsor
Quality tools
Awareness Yes
None High High Not applicable
Strategic Vision Yes
Influence and
Leadership Yes
Coaching and
Training Yes
Negotiation Yes
Champion
Quality tools
Awareness Yes
None High High Not applicable
Strategic Vision Yes
Influence and
Leadership Yes
Decision Making Yes
Process
Knowledge Yes
Basic Innovation
Tools for Idea
Generation
No Innovation Tools None High Basic Innovation
Tools
40
Project Team Knowledge Required Current Level Gaps Identified As Is To Be Training given
Black Belt
Advanced Statistical
Tools Yes
None High High Not applicable
Team Work Yes
Influence and
Leadership Yes
Coaching and Training Yes
Interpersonal
Relationships Yes
Project Management Yes
Innovation Tools Yes
Process Knowledge No Process Knowledge Low Medium Process walk through
Project Leader and
Team Members
Quality tools
awareness Yes High High
Innovation tools, Quality
Tools & techniques, Team
Building
Team Work Yes High High
Influence and
Leadership No Influence Strategy Low High
Coaching and Training Yes High High
Interpersonal
Relationships Yes High High
Project Management Yes High High
Innovation Tools No Low High
Vendors
Effective
Communication Yes High High
Innovative Thinking No Low High
Domain Knowledge Yes High High

21
41
Kick-off Workshop
• Direction setting by Project Sponsor
• Detailed 2 day workshop involving all project teams
• Project goals, roles and responsibilities clearly defined
• Project management guidelines set
Off-site for ideation
• A two day off-site of critical team members along with Champion and leader
• Focussed Brainstorming on Project deliverables & way forward
• Helped in bonding as a team
Sponsor‟s contribution
• Key decision making at appropriate time
• Support in terms of budgets
42
What
(Team
Routine)
Internal
Stakeholders
Governance
review
Project
review
Cross
functional
team huddles
External
Stakeholders Business
partner
review
Why
When
(Frequency)
Whom Who
(Members)
How
(Communication
Mode)
Type
(Communication
Type)
To discuss requirements,
progress against plan,
issues, milestone dates
and upcoming events
Monthly Steering
committee
Project
Sponsor e-mail One
Way
CTQ Tracking
and
monitoring
Fortnightly
Project
Sponsor,
Champion and
key project
team
Project team MIS &
dashboard
reviews through
conference calls
Two
Way
Tracking on movement.
Review last weeks plan
vs. closure and agree
on next
weeks plan
Weekly Key project
team
Project Lead &
Team
Skype calls,
emails,
WhatsApp,
conference calls,
Two way /
One Way
To discuss requirement,
and issues Weekly Business
partner
Project Lead
Conference
calls, emails,
in-person
meetings
Two way /
One Way
Detailed Communication Plan
Stakeholder
type

22
Section 4
43
44
TYPE OF PROJECT: The project aims at easing the existing reservation process for members by bringing in more transparency,
increasing self-help options, providing apt holiday options using analytics/technology, thereby increasing the resort occupancies and
member's Net promoter scores
DESCRIPTION OF PROJECT APPROACH: This project uses the continuous improvement methodology using PDCA to enhance reservation experience. We follow PDCA
approach to resolve all problems across the organization. The Project begins with Problem identification, Measure and Analysis of
issues to find the root causes, which then are prioritized. Solutions were identified for prioritized causes, designed, validated and
implemented. Implemented solutions were then communicated to all stakeholders and standardized
Method PLAN Do Check & Act
Stage Problem Identification, Measure and Analyze Solution - Validation & Implementation Standardization
Tools
used
VOC: to identify current GAPS using feedbacks from members Proof of Concept (POC) - to test the
effectiveness of actual solution
AS-IS & TO-BE process mapping;
change in SOPs Benchmarking: To identify GAPS as compared to the competitors & industry best
practices
SIPOC/Process Mapping: to better understand processes and cross-functional
linkages Pilot run - to check and fine tune the
processes Standardized automated VOC
mechanisms - to enable
monitoring of effectiveness APC (Annual Planning Cycle) Framework - Project identification
Impact Matrix - used for project prioritization Member Surveys: To know the
effectiveness of the solutions Life Cycle mapping - used to know project impact areas DWM implementation for new
processes 5W 1H - Project team routine mapping Statistical Techniques (for waitlist
probability): Logistic Regression &
Random Forest Brainstorming: to understand real issues/practices Automation of dashboards/reports
Fishbone/Cause & Effect Matrix: to identify causes and prioritize Statistical Technique (for Resort
Recommendation Algorithm):
Collaborative Filtering Communication to all internal and
external stakeholders 5-Why Analysis: to identify real root causes behind the above
Pareto: to identify vital high impact causes
Hypothesis Testing: (One Way Anova), Scatter Plot

23
45
Voice of Customer through
Feedbacks
Conversion of VOC to CTQ –
Key metrics
Benchmarking to arrive at gaps
Verification of Gaps through Brainstorming and Fishbone
Prioritization of Gaps
Data based verification of Gaps (Pareto,
Histogram)
Solution identification
Solution implementation
Communication Standardization Further gap identification
Continuous improvement
46
Method PLAN Do Check & Act
Stage Problem Identification, Measure and Analyze
Solutions - Design, Validation
& Implementation Standardization
Tools used
VOC: to identify current GAPS using feedbacks
from members Proof of Concept (POC) - to test
the effectiveness of actual
solution
AS-IS & TO-BE process
mapping; change in SOPs Benchmarking: To identify GAPS as compared to
the competitors & industry best practices
SIPOC/Process Mapping: to better understand
processes and cross-functional linkages Pilot run - to check and fine tune
the processes
Standardized automated VOC
mechanisms - to enable
continuous monitoring of
effectiveness
APC (Annual Planning Cycle) Framework - Project
identification
Impact Matrix - used for project prioritization Member Surveys: To know the
effectiveness of the solutions Life Cycle mapping - used to know project impact
areas DWM implementation for new
processes 5W 1H - Project team routine mapping Statistical Techniques (for waitlist
probability): Logistic Regression
& Random Forest Brainstorming: to understand real issues/practices
Automation of
dashboards/reports
Fishbone/Cause & Effect Matrix: to identify causes
and eliminate lower impact causes Statistical Technique (for Resort
Recommendation Algorithm):
Collaborative Filtering Communication to all internal and
external stakeholders 5-Why Analysis: to identify real root causes
behind the above
Pareto: to identify vital high impact causes
Hypothesis Testing (One-Way ANOVA), Scatter
Plot

24
47
Method PLAN Do Check & Act
Stage Problem Identification, Measure and Analyze
Solutions - Design, Validation &
Implementation Standardization
Tools used
VOC: to identify current GAPS using feedbacks from
members Proof of Concept (POC) - to test the
effectiveness of actual solution
AS-IS & TO-BE process mapping;
change in SOPs Benchmarking: To identify GAPS as compared to the
competitors & industry best practices
SIPOC/Process Mapping: to better understand processes
and cross-functional linkages (trained by MBB) Pilot run - to check and fine tune the
processes Standardized automated VOC
mechanisms - to enable continuous
monitoring of effectiveness
APC (Annual Planning Cycle) Framework - Project
identification
Impact Matrix - used for project prioritization Member Surveys: To know the
effectiveness of the solutions Life Cycle mapping - used to know project impact areas DWM implementation for new
processes(trained by MBB) 5W 1H - Project team routine mapping Statistical Techniques (for waitlist
probability): Logistic Regression &
Random Forest (trained by Data
Scientist) Brainstorming: to understand real issues/practices Automation of dashboards/reports
Fishbone/Cause & Effect Matrix: to identify causes and
eliminate lower impact causes (trained by MBB)
Statistical Technique (for Resort
Recommendation Algorithm):
Collaborative Filtering(trained by Data
Scientist)
Communication to all internal and
external stakeholders
5-Why Analysis: to identify real root causes behind the
above(trained by MBB)
Pareto: to identify vital high impact causes(trained by
MBB) Tool Used for Statistics: R, Python
Hypothesis Testing: to provide additional validation
(trained by MBB)
48
Category Stakeholders Strongly
Against Moderately
Against Neutral
Moderately
Supportive Strongly
Supportive Resistance
Identified How to
influence?
Internal
Member Experience
Team Y None NA
Inventory Management
Team Y None NA
Information Technology Y Prioritization
against other
projects
Clarity on
prioritization and
benefit
realization
Special Projects Team Y Multi-tasking
with other
projects
Impact on
customer and
business due to
the project
External
Business Partner -
Contact Centre Y None NA
Partners - Information
Technology Y None NA
Partners - Analytics Y
Agreeing to
business inputs
along with
analytical
outputs
Trend of key
metrices to
prove the point
Members Y None NA

25
49
As mentioned earlier, there was a project regime established to ensure the project team
meets every two weeks to discuss the project. Please find below the other steps taken:
1. Project Escalation Matrix: Was created & circulated to all team members & stake-holders
to express any concerns. Concerns will directly be highlighted to the Project leader &
champion
2. Member Surveys: Member surveys were implemented after every key implementation to
ensure that we get the VOC regarding the same
3. Penalties for partners: Partner pay-outs were determined by adherence to timelines too –
this ensured that the project timelines were not compromised unless agreed between both
the parties
4. AGILE methodology: Since the project involved multiple actions, parallel solutioning was
done so that delay due to sequencing is avoided
50
Category Stakeholders Involvement methodology Communication Methodology
Internal
Member Experience Team Weekly meetings to brainstorm and
discuss issues
Calling – Two Way
Meeting – Two Way
Inventory Management Team Weekly meetings to brainstorm and
discuss issues
Calling – Two Way
Meeting – Two Way
Information Technology Technology solutions discussed
threadbare and help in prioritization
Calling – Two Way
Meeting – Two Way
Special Projects Team Project prioritization matrix
established
Calling – Two Way
Meeting – Two Way
External
Business Partner - Contact Centre
To ensure all their gaps identified are
close-looped and status informed to
them
Calling – Two Way
Meeting – Two Way
Partners - Information Technology
To agree on time-lines clearly at
every stage and regular reviews to
avoid delays
Calling – Two Way
Meeting – Two Way
Partners - Analytics
Pilot all algorithms on the test data to
ensure that the accuracy rates are
good once implemented
Calling – Two Way
Meeting – Two Way
Members Frequent surveys on
implementations Feedback Surveys

26
Section 5
51
52
Stage: Plan, Problem identification

27
53
Customer Comment
(What Are They Saying?) Identifying the Issue
Customer Requirement
(What's the Measurable Target?)
Can't keep waiting at your contact
centre for my bookings Ease of Use
NPS Scores, Percentage of
bookings done digitally
Your website isnt just upto the mark Reliability NPS Scores, Percentage of
bookings done digitally
I am just not getting any bookings at
all, everytime I check, rooms are not
available
Choice NPS Scores, Unique Members
Holidayed
There are no rooms when I check
but when I go to your resorts, rooms
are available, how?
Reliability Resort Occupancy Rates
Stage: Plan, Problem identification
54
Stage: Plan, Measure
Metric/Organization Direct
Competitor Mahindra
Holidays
Complaints/Active base 4.57% 3.70%
Occupancy rates 77% 81%
NPS 18% 33%
Digital Penetration 24% 31%
0% 10% 20% 30% 40% 50% 60% 70%
HealthCareProfessional Services
RetailHospitality, Travels & Restuarants
ManufacturingAutomotive & Transportation
Financial ServicesConstruction & Engineering
Consumer ServicesInsurance
IT & SoftwareBanking
MediaCMH
Telecommunications
NPS across various industries
97% 92%
61%
47%
34% 33%
0%
20%
40%
60%
80%
100%
120%
TeslaMotors
Apple Amazon Samsung Microsoft CMH
NPS - comparison with other brands
60% 59%
50% 45%
33%
0%
10%
20%
30%
40%
50%
60%
70%
Treebo Westin OYO Thomas Cook CMH
NPS - comparison with Holiday brands

28
55
Process
Technology
Customer
Product
Poor NPS Scores on
Reservations
Too many guest
booking
Multiple
apartments
being given
Limited resorts
No in-city
experiences Non-interactive
system
Out-dated user
experience
No alternative
options for
refusals
Slow response
on peak dates
Lack of mobile
experience
Mismatch between CC
& Web
No action on
refusals
Same approach
to all members Transparency on
reservations
Low resort
promotions
Fraudulent
usage of
membership
Dormant members/Not
interested
Wastage due to
cancellations
Lack of support
on web
High exceptions
at Call centre Concern on
safety No benefit on
web
Stage: Plan, Measure
56
A mail was sent to the Key
Stake holders to Rate the
Causes as below
0 – Not Relevant
1 – Low Agreement
3 – Agreement
9 – Strong Agreement.
The Consolidated feedback
scores are shown in the
table
Stage: Plan, Measure
Causes Type Total Score
Outdated User Experience Technology 133
Lack of Mobile experience Technology 129
No Action on refusals Process 123
Same approach to all members Process 121
Fraudulent usage of memberships Customer 103
No In-city experiences Product 102
No Alternative options for refusals Technology 95
Slow response during peak dates Technology 87
Wastage due to cancellations Product 86
Multiple apartments being given Process 67
Too Many Guest bookings Product 65
Mismatch of demand vs supply Process 64
Transparency on reservations Process 62
Dormant members Customer 61
Limited resorts Product 61
Non-Interactive systems Technology 61
Low resort promotions Process 34
Lack of support on web Process 32
Concern of safety Product 30
High Exceptions at the Call Centre Process 30
No benefit on web Process 28
Members not interested Customer 26
Lack of Awareness Process 25

29
57
Point (Causes) Root Cause Dist % Cum %
Outdated User Experience Features of Website 8% 8%
Lack of Mobile experience Features of Website 8% 16%
No Action on refusals Reservation Process 8% 24%
Same approach to all members Reservation Process 7% 31%
Fraudulent usage of memberships Reservation Process 6% 37%
No In-city experiences Reservation Process 6% 44%
No Alternative options for refusals Reservation Process 6% 50%
Slow response during peak dates Features of Website 5% 55%
Wastage due to cancellations Reservation Process 5% 60%
Multiple apartments being given Reservation Process 4% 64%
Too Many Guest bookings Reservation Process 4% 68%
Mismatch of demand vs supply Reservation Process 4% 72%
Transparency on reservations Features of Website 4% 76%
Dormant members Product Offerings 4% 80%
Limited resorts Product Offerings 4% 84%
Non-Interactive systems Features of Website 4% 87%
Low resort promotions Features of Website 2% 89%
Lack of support on web Features of Website 2% 91%
Concern of safety Others 2% 93%
High Exceptions at the Call Centre Reservation Process 2% 95%
No benefit on web Lack of website promotion 2% 97%
Members not interested Others 2% 98%
Lack of Awareness Lack of website promotion 2% 100%
Stage: Plan, Analyze
58
50%
82% 90%
96% 100%
0%
20%
40%
60%
80%
100%
120%
0
0.1
0.2
0.3
0.4
0.5
0.6
ReservationProcess
Features ofWebsite
ProductOfferings
Lack ofwebsite
promotion
Others
Stage: Plan, Analyze

30
59
Stage: Plan, Analyze
Classification S. No Associated Cause Data for Validation Tool/Method
Used Remarks
Reservation
Process
D1 No Action on Refusals Refusal Conversion trend Bar Chart Stagnant refusals & conversions, need more
conversions
D2 Same Approach to all
members NPS Scores of members VOC Analysis
Huge variation of NPS observed basis holiday
categorization of members
D3 No in-city experiences Member Feedback data Member Survey More destinations in&around cities required
D4 No Alternative options for
refusals Customers are not able to view
alternate room types/ resorts View of website
Comparing the view of an call center agent Vs
Website
D5 No Alternative options for
refusals Member feel they are not getting first
choice @ website Graph
Shows the difference between Call center and
website, and need to much better experience
D6 Multiple apartments being
given Members find speaking to an agent
easy One way Anova
Clearly shows that on Sundays penetration
increase drastically
D7 Wastage due to cancellations Cancellation of reservations analysis Graph More than 50% of members planning 30 days in
advance cancel their reservations
D8 High Exceptions at the Call
Centre
Exceptions taken @ call Center are
extremely high & hence customers find
call center to give bookings Scatter Plot
As exceptions increases, the web penetration
percentage decreases
Features of
Website
D9 Outdated User Experience Not all features in the call center are
available in the website Sample check
There are lot of members who are calling for
features which are missing
D10 Lack of Mobile experience Member Feedback data Member Survey Mobile is clearly the way forward
D11 Slow response during peak
dates Members find the website very slow One Way Anova
Comparing web penetration on normal days Vs Slow
days
D12 Transparency on reservations Members feel website is not transparent View of website
D13 Non-Interactive systems Website Complaints Trend Complaints continue to be high on website
D14 Lack of support on web Why Customers Call? Pie Chart
60
Clearly, the number of
refusals remain stagnant
year on year, and the
number of members
given a holiday post
refusal also remains
stagnant
0%
2%
4%
6%
8%
10%
12%
115000
120000
125000
130000
135000
140000
145000
150000
155000
FY13 FY14 FY15 FY16
Refusals and Conversion
Refusal Count Given Holidays %
Stage: Plan, Analyze

31
61
NPS doesn‟t vary much
basis the category of
membership
Stage: Plan, Analyze
37% 36% 33% 32%
0%
5%
10%
15%
20%
25%
30%
35%
40%
Purple Red White Blue
NPS Score basis product type
49%
27%
14%
7%
0% 10% 20% 30% 40% 50% 60%
Holidaying & Not refused
Holidaying & refused
No Recent holiday
New members, yet to useproduct
NPS Score basis categories
There is high variation basis
holiday categorization
62
Stage: Plan, Analyze
More resorts required in and around cities
26%
24% 18%
15%
10%
5% 2%
Survey Results - Resort Choices
Inside cities Near to cities Drivable destinations
Beaches Hill Stations Heritage sites
Others
Me
mb
er R
eg
ion
Resort Region
53%
17%
29%
29%
19%
29%
70%
23%
37%
56%
13%
8%
42%
19%
10%
4%
4%
4%
7%
14%
1%
1%
2%
8%
1%
WEST
SOUTH
NORTH
EAST
INTL
West South North International East
Majority members travel in the same region

32
63
Agent is able to view
availability by
apartment whereas in
website member does
not get a view of
apartment wise
availability which
raises the question of
transparency
Stage: Plan, Analyze
64
Members find call center
providing higher chances of
providing first choice
holidays as against website
71% 72% 72%
73%
64% 65% 65%
64%
58%
60%
62%
64%
66%
68%
70%
72%
74%
FY13 FY14 FY15 FY16
First Choice Holidays
Call Centre Website
Stage: Plan, Analyze

33
65
Stage: Plan, Analyze
66
Stage: Plan, Analyze
86%
62% 53%
43% 47%
14%
38% 47%
57% 53%
0%
20%
40%
60%
80%
100%
120%
0 - 15 16 - 30 31 - 60 61 - 90 >90
Booking Lag - Confirmation Vs Cancellation
Confirmation % Cancellation %
More than 50% of members
who book 30 days in advance,
cancel their reservation

34
67
As number of exceptions
increases, web penetration
decreases
Stage: Plan, Analyze
68
S. No Feature Call Center Website
1 Confirm Bookings Yes Yes
2 Cancel Bookings Yes Yes
3 Take Exceptions Yes
4 Raise Wait-list Yes
5 View availability by apartment Yes
6 Show alternatives automatically Yes
7 Block reservations Yes
8 Edit Bookings Yes
9 Upsell using deals / offers Yes
10 Update special requests Yes
11 Cross-sell Resorts Yes Yes
12 Confirm multiple apartment types Yes
13 Confirm diff apartment each date Yes
14 Show point consumption Yes Yes
15 Explain Rules / objections real time Yes Yes
18 Special offer Bookings Yes
19 venue Comp Bookings Yes
20 Guest / Direct / Co-applicant Bookings Yes
21 HUS Yes Yes
There is a huge
difference between
features available at
the call center Vs
Website.
Stage: Plan, Analyze

35
69 Primary reason for detractor-ship is the website not
working on mobile
Stage: Plan, Analyze
37%
23%
21%
12%
6% 1%
Website Detractors Reach-out
Not working on Mobile Slow to respond
Very complex Not able to get my choice
Membership details not available Others
43%
57%
Login Source of members on website
Mobile Computer
We rechecked this through the source of login and
found that a healthy 43% were logging in through
mobile
70
Suspicion Statement Web penetration is low when website is slow.
Statistical Statement Ho : Mu (Slow) >= Mu (Normal)
Ha : Mu (Slow) < Mu (Normal)
Analysis One-way ANOVA
Results
One-way ANOVA: web% versus Website perf
Source DF SS MS F P
Website perf 1 765 765 5.92 0.017
Error 88 11360 129
Total 89 12125
S = 11.36 R-Sq = 6.31% R-Sq(adj) = 5.24%
Individual 95% CIs For Mean Based on
Pooled StDev
Level N Mean StDev +---------+---------+---------+---------
Normal 88 36.07 11.42 (-*-)
Slow 2 16.30 2.12 (---------------*---------------)
+---------+---------+---------+---------
0 10 20 30
Pooled StDev = 11.36
Inference
Since P is low, reject H0. Hence Web penetration is lower on days when
website is slow.
Stage: Plan, Analyze

36
71
Website complaints
continued to be high in spite
of marginal reduction YOY
1812 1639
1456 1421
0
200
400
600
800
1000
1200
1400
1600
1800
2000
FY13 FY14 FY15 FY16
Website Complaints
Stage: Plan, Analyze
72
Stage: Plan, Analyze
More than 75% of calls
coming to the contact centre
are reservation related

37
73
Touch Points Mahindra Holidays
Banks Insurance OTAs/Aggregators e-commerce
Organizations ICICI, Citi Bank Bazaar, Policy
Bazaar etc. MMT, AirBnB etc. Amazon, Flipkart etc.
Onboarding Manual Processes &
Multiple handoffs Digital
Contact Centre No IVR Self-service IVR + Voice Agents Primarily digital Only Digital
Website Limited servicing End to End servicing on website
Mobile App Not Available End to End servicing on Mobile App
Transactions (inlcuding
bookings) Limited transactions Highly customized according to need
Usage of AI for
transactions
Usage of AI +
Recommendation engines
for personalization
Clearly, most other products that customers are experiencing were going the digital way, to
simplify experience
Stage: Do, Solutioning
74
Point Root Cause Solutions
Outdated User Experience Features of Website Revamp the website to make it mobile
friendly and include all features
Lack of Mobile experience Features of Website Mobile app for reservations
No Action on refusals Reservation Process Revamped refusal process
Same approach to all members Reservation Process Segmented approach for proactive
holiday planning
Fraudulent usage of memberships Reservation Process Travel agent identification and rules
No In-city experiences Reservation Process Inventory Augmentation Program
No Alternative options for refusals Reservation Process Waitlisting for reservations
Multiple apartments being given Reservation Process Revision of reservation rules
Transparency on reservations Features of Website Resort Recommendation Engine on
website and mobile app
Identified between Jun-16 & Jul-16
Stage: Do, Solutioning

38
75
Conceptualization of new screens
POC and implementation
Member Feedback on website
Approval from Project Champion
Development completion
0%
5%
10%
15%
20%
25%
30%
35%
40%
45%
50%
Jan-16 Feb-16 Mar-16 Apr-16 May-16 Jun-16
Website NPS Scores
POC
implementation
Stage: Do, Implementation
76
Key Features
• Mobile friendly
• All reservation features
included
• Servers realigned to ensure
demand management
• Easy login and registration
options
Live in Oct-16
Stage: Do, Implementation

39
77
Member Survey
Results presented to Project Champion and Sponsor
Hiring of resources
Conceptualization of features
Development completion
71%
19%
10%
Is Mobile App required? – Feedback from members
Yes Website would suffice I prefer call centre
Stage: Do, Implementation
78
Key Features of the app
o Research the Resorts
o Making a Booking
o View Resort Activities & Events
o Feedback on the Stay
o Making Payments
o Giving a referral
o Service Requests
o Complaint handling
o Notifications
o Updating Data
o Offers Redemption
Live in Dec-16
Stage: Do, Implementation

40
79
Manual Waitlist enabled
Results tracked and shared
Basis results, automation enabled
Instead of waitlist number, prediction built in
Incorporated in reservation engine
Month Refusals at Contact
Centre Manual Waitlists Conversion
Apr-16 79546 7389
May-16 80154 7432
Jun-16 82155 7572
Jul-16 76151 7152
Aug-16 78668 7328
Sep-16 79384 7378
Oct-16 69341 8580 9449
Nov-16 64213 12540 8884
Stage: Do, Implementation
80
Automation live in Feb-17 & Prediction live in Jun-17
Base
variable
Derived
variables
Extraction
MS SSIS
SQL Script
Predictive Equation
Rule
Waitlist
Probability
(RUN)
Reservation
Resort Data Room Book Details Season Data Waitlist data Waitlist Room Book Details
Customer
Contract
Customer
Product Master
Staging Tables
TALISMA
CREST
Member places a WL
Input variables
to model
Staging-2
Key Features 1. Works on a Real time basis
2. Completely automated
3. A Predictive equation is
placed in reservation engine
4. Accuracy @ 75% *Talisma – CRM
CREST – Reservation Engine
Stage: Do, Implementation
Only VO/Holiday
company to have
an automated
waitlist model

41
81
Live in Aug-16
Refusals across all touch points
Automated alternative
options through emails instantly
Data shared to contact centre
Reach-out manually within 48 hours to plan
holidays
Repeat Refusals & Non-Holidayed
members prioritized
• Since this was funded through reduction in volumes at contact centre and was a beneficial
process to both members and business, this was initiated without any separate validation
Stage: Do, Implementation
82
Tenure < 18 months
• First Holiday Planning (FHP)
Tenure b/w 18 & 36 months
• First Time Not Holidayed Members (FTNH)
Tenure > 36 months
• Non Holidayed & Never Holidayed members (NHM)
FHP – 60% of eligible new
members holidayed
NHM/FTNH – 50% of eligible members
holidayed
• Since this was funded through reduction in volumes at contact centre and was a beneficial
process to both members and business, this was initiated without any separate validation
Live in Dec-16
Stage: Do, Implementation

42
83
71%
29%
Members on Website and App
Members getting refused first time Members not getting refused first time
• However, more than 40% of these
refused members got a reservation later
• This was resulting in a perception of
non-availability for members
• The issue was brainstormed in one of
the project governance meetings and a
solution proposal was drafted
• Solution: Instead of allowing members
to enter all search criteria and query for
availability, why not show all available
resorts up front, including a
recommendation algorithm?
Stage: Do, Implementation
84
Unique Features of the Solution
1. Fusion Algorithm - Checks real time
availability of each resort and factors
them in recommendation
2. Recommender‟ output is across three
time frames – 15 days, 30 days and 60
days – Unique Differentiation
3. Scalable data architecture – Cloud based
server where the AI engine processes,
refreshes and disseminates output
4. Dynamic recommender system,
refreshed weekly for each member
Live in Jan-18
Stage: Do, Implementation

43
85
Web Interface App Interface
Stage: Do, Implementation
86
Pre-Recommender
Members lands on website
Tries to Book on Booking Widget
with Fixed Resorts and Dates in
consideration set
Successful?
Explore Other
Resorts/ Dates?
End of Process
Y
N
Y
N
Post-Recommender
Members lands on website
Tries to Book on Booking
Widget with Fixed
Resorts and Dates
Examines the
Recommender Widget
and tries to book
Successf
ul?
Books
ahead?
End of Process
Explore
Others?
Y
N
N
N
Y
Stage: Do, Implementation

44
87
Solutions Cost of implementation (in
INR Lakhs) Annualized Benefit
(in INR Lakhs) Remarks
Revamp the website to make it mobile
friendly and include all features 16
120 20 seats reduced at contact centre due
to reduced volumes Mobile app for reservations 58
Revamped refusal process 0 14 Basis number of room nights
generated through refusal conversions
Segmented approach for proactive
holiday planning 0 106
Basis number of room nights
generated through Proactive holiday
planning
Travel agent identification and rules 0 WIP This is work in progress
Inventory Augmentation Program 0 WIP
We are collaborating with various
domestic and international hotel chains
to give various options to members -
completely cost neutral
Waitlisting for reservations 0 198 Basis number of room nights
generated through waitlist conversions
Revision of reservation rules 0 WIP This is work in progress
Resort Recommendation Engine on
website and mobile app 9 156
Basis number of room nights
generated through Recommendation
engine
88
81%
82% 82%
81%
85%
86%
78%
79%
80%
81%
82%
83%
84%
85%
86%
87%
FY13 FY14 FY15 FY16 FY17 FY18
Resort Occupancy
12%
30% 31% 33%
47%
55%
0%
10%
20%
30%
40%
50%
60%
FY13 FY14 FY15 FY16 FY17 FY18
Booking Experience NPS
• Resort Occupancies increased by 5% - 53242 RNs – INR 10.57 Crores increase in
resort revenue (approved by finance)
• NPS scores of reservations increased to 55% - leading to more satisfied members and
increased referral opportunities

45
89
6.59
5.28 5.07
4.41
3.62 3.51
0.00
1.00
2.00
3.00
4.00
5.00
6.00
7.00
FY13 FY14 FY15 FY16 FY17 FY18
Inbound Calls per member
3942
3452
2950
2301
733 498
0
500
1000
1500
2000
2500
3000
3500
4000
4500
FY13 FY14 FY15 FY16 FY17 FY18
Reservation Complaints
• Reduction in both inbound call volumes and Reservation complaints meant that the
man power dedicated for these activities could be used for more proactive reach-outs
to members
90
27% 29% 28% 31%
62%
85%
0%
10%
20%
30%
40%
50%
60%
70%
80%
90%
FY13 FY14 FY15 FY16 FY17 FY18
Digital Penetration on bookings
• A proof of members embracing the new technology implemented – the percentage of
bookings done through website and app has touched a new high of 85% in FY18

46
91
49% 53% 52% 53% 55%
60%
0%
10%
20%
30%
40%
50%
60%
70%
FY13 FY14 FY15 FY16 FY17 FY18
% of Active Members Holidaying
0%
5%
10%
15%
20%
25%
30%
35%
40%
45%
115000
120000
125000
130000
135000
140000
145000
150000
155000
FY13 FY14 FY15 FY16 FY17 FY18
Refusal Conversion
Refusal Count Given Holidays %
• All these have resulted in an increase in the number of active members holidaying –
aided by appropriate conversion of refusals as well
92
Automated reports to monitor digital penetration initiated

47
93
Daily reports to monitor resort occupancies initiated
94
Other steps taken to ensure:
• Automated feedback management portal initiated to continually monitor member
VOCs
• Additional features are being continually built into the website and mobile app
• All related SOPs updated and cascaded to all relevant stakeholders
• Key reservation metrics such as complaints, Resort occupancy and Unique
members holidayed included into the organization‟s or departmental BSCs.
• All front-end teams and stakeholders trained on all the new tools initiated

48
95
Category Remarks
Members SMS, Email, App & Web notifications
Internal Stakeholders
Changes in SOP, Trainings, Refreshers,
Internal email communications,
Townhalls