
LUNAR ORBITER III - NASA Technical Reports Server
175
NASA cR-66461 bj LUNAR ORBITER III MISSION SYSTEM PERFORMANCE i\ Prepared for the NATIONAL AERONAUTICS AND SPACE ADMINISTRATION Langley Research Center by THE d_o_rJA_OcoMpANY Distr_tion of this report is provided in the interest of infoz_atimn exchange. Responsibility for the contents resides in the author or organization that prepared it. Contract No. NA51.3800 Augu_ 11, 1967 BOE I NG DOCUMENT NO. D2-10075_3 , ¢ S SII°_",_.%N u M BER) D (NASA CR OR TMX OR AD NUMBER)
-
Upload
khangminh22 -
Category
Documents
-
view
0 -
download
0
Transcript of LUNAR ORBITER III - NASA Technical Reports Server

NASA cR-66461
bj
LUNAR ORBITER III
MISSION SYSTEM PERFORMANCE
i\Prepared for the
NATIONAL AERONAUTICS AND SPACE ADMINISTRATION
Langley Research Center
by
THE d_o_rJA_OcoMpANY
Distr_tion of this report is provided in the interest
of infoz_atimn exchange. Responsibility for the contents
resides in the author or organization that prepared it.
Contract No. NA51.3800
Augu_ 11, 1967
BOE I NG DOCUMENT NO. D2-10075_3 ,
¢ S SII°_",_.%N u M B E R )
D
(NASA CR OR TMX OR AD NUMBER)

1.0
CONTENTSPage
1Launch Operations ..................................................... ...
1.1 Spacecraft Processing ................................................. 11.1.1 Hanger "S" . ..................................................... I
1.I.2 Explosive Safe Area ......................................... 61.I.3 Launch Pad 13 ............................................... 7
1.2 Launch Conduct ........................................................ 71.2.1 Launch Criteria ................................................... 71.2.2 Countdown and Launch ............................................ 81.2.3 Weather .................. 10
1.2.4 Tracking Coverage ................................. _............... 101.2.5 Telemetry Coverage ............................................... 12
1.3 Launch Vehicle Performance .......................................... 121.31 Atlas Performance ................................................ 21
1.3.2 Agena Performance .................................... - ........... 21
2.0 Flight Operations .......................................................... 22
2.1 Flight Plan and Conduct ............................................... 222.1.1 Flight Plan .............. . ................................... 22
2.1.2 Flight Conduct ....................................... _............2.1.2.1 Flight Profile .............................................. 232.1.2.2 Nominal Mission .......................................... 31
2.1.2.3 Photo Data Acquisition .............. , ........... .......... 32
2.2 Flight Control .........................................................2.2.1 Mission Control .................................................... 33
2.2.2 Spacecraft Control ..................................................2.2.2.1 Command Programming ..................................
2.2.3 Flight Path Control ................................................2.2.3.1 Cotmtdown, Launch, and Acquisition ....................... 37
2.2.3.2 Injection Through IVlidcourm_ ... ........................ .... 382.2.3.3 Midcourse Through Deboost ............................... 432.2.3.4 Initial Ellipse ............................................ .. 482.2.3.5 Photo Ellipse .............................................. 55
3.0 Spacecraft Performance ................................................... 67
3.1 Photo Subsystem Performance ........................................ 693.1.1 Thermal Control ................................................... 693.1.2 Camera Film Advances ............................................ 79
3.1.3 Processor Operation and Resdout Film Handling ................... 793.1.3. I Processor Operation ....................................... 793.1.3.2 Readout Fllm_Handling. ................................... 90
3.1.4 Photo, Data Analysis ............................................... 903.1.4.1 White-Level Variation ..................................... 90
3.I.4.2 Video Analysis Reports .................................... 913.1.4.3 Whlte-Level Variation Plots ................................
3.1.4.4 Analysis of Data ...........................................
,l
,r w
II

D
CONTENTS (Continued) Page
3.1.5 Processing Variations Across the Spacecraft Film .................. 993.1.6 Problem Analysis ................................................. 99
3.2 Communications Subsystem Performance ......................... 1033.2.1 Launch Through Cislunar Injection ................................. 1033.2.2 Cislunar to Lunar Injection ........................................ 103
3.2.3 Lunar Injection Through Final Readout ............................ 1053.2.3.1 Telemetry Link ............................................ 1053.2.3.2 Video Link ................................................ 105
3.2.4 Component Performance .......................................... 1053.2.4.1 Transponder .............................................. 105
3.2.4.2 Signal Conditioner ......................................... 1083.2.4.3 High- and Low-Gain Antennas .............................. 1083.2.4.4 Traveling-Wave-Tube Amplifier ........................... 1113.2.4.5 Multiplexer Encoder ....................................... 1113.2.4.6 Command Decoder ........................................ 1113.2.4.7 Modulation Selector ........................... -............ 111
3.2.5 Computer Program Performance .................................. 1123.2.5.1 TRBL Program ........................................... 1123.2.5.2 SGNL Program ............................................ 114
3.3 Power Subsystem Performance ........................................ 1143.3.1 Launch to Sun Acquisition .......................................... 1143.3.2 Cislunar Through Lunar Injection .................................. 1143.3.3 Initial Ellipse Through Orbit Transfer .............................. 1153.3.4 Photo Ellipse Through Photo Taking ............................... 1163.3.5 Final Readout ..................................................... 117
3.3.6 Component Performance .......................................... 1183.3.6.1 Solar Array ............................................... 1183.3.6.2 Battery ..... .............................................. 1203.3.6.3 Charge Controller ......................................... 1203.3.6.4 Shunt Regulator ........................................... 120
3.4 Attitude Control Subsystem Performance .............................. 1203.4.1 Cislunar Coast ..................................................... 1223.4.2 A V Maneuvers .................................................... 1223.4.3 Photo Maneuvers .................................................. 1223.4.4 Readout ........................................................... 123
3.4.5 Component Performance .......................................... 125
3.4.5.1 Canopus Star Tracker ..................................... 1253.4.5.2 Sun Sensors ............................................... 125
3.4.5.3 Closed-Loop Electronics .................................... 1263.4.5.4 Reaction Control System ................................... 1263.4.5.5 Thrust Vectors Control System ............................. 1273.4.5.6 Inertial Reference Unit .................................... 127
3.4.5.7 Flight Programmer and Switching Assembly ............... 127
3.4.6 Nitrogen Consumption ............................................. 127
.e.Iii

CONTENTS (Continued)Page
3.4.7 Problem Areas ....................................................129
3.4.7.1 Thermal Problem ..........................................130
3.4.7.2 Tracker Glint Problem ....................................130
3.5 Velocity ControlSubsystem Performance ..............................130
3.5.1 ESA Spacecraft Fueling Operations ................................1313.5.2 Launch and General Mission Events Through Midcourse Maneuver.. 131
3.5.3 Lunar-Orbit Injection Through Final Readout ....................... 1323.5.4 Subsystem Time-History Data ..................................... 1323.5.5 Maneuver Performance ........................................... 135
3.6 Structures and Mechanisms ............................................ 1383.6.1 Launch Vibration Environment .................................... 138
3.6.2 Deployment and Squib Actuation ........... ........................ 1383.6.3 Camera Thermal Door ............................................. 138
- 3.6_6.4 Thermal Control ................................ _.......... 138
3.6.4.1 Battery Temperature Variation ............................ 15,53.6.4.2 Lower TWTA Temperatures ............................... 15,53.6.4.3 Thermal Problems ........................................ 155
3.6.4.4 EMD Thermal Coating Degradation ........................ 1553.6.5 Thermal-Design Differences Between Mission II and III ............ 158
4.0 Ground Data System Performance ......................................... 159
4.1 Space Flight Operations Facility ....................................... 1594.1.I Computer and Communications Complex ........................... 1594.1.2 SFOF Software .................................................... 159
4.1.2.1 System Software .......................................... 1604.1.2.2 SPAC Software ............................................ 160
4.1.3 FPAC Software System Performance ..............................160
4.1.3.1Flight Path Control Programs .............................1604.1.3.2Orbit Determination Programs ............................161
4.1.4 Ground Reconstruction Equipment (GRE) .........................161
4.2 Ground Communications System .............................._..,,.... 161
4.3 Deep Space Stations ....................................................162
5.0 Lunar Environmental Data ................................................164
5.1 Radiation Data ........................................................164
5.2 Micrometeoroid Data ..................................................164
Summary ofLunar Orbiter IIAnomalies .......................................165
iv

!.T_
Figure
I-i:
1-2:
1-3:
1-4:
1-5:
1-6:
1-7:
2-1:
2-2:
2-3:
2-4:
2-5:
2-6:
2-7:
2-8:
2-9:
2-10:
2-11 :
2-12:
2-13:
2-14:
2-15:
2-16:
2-17:
2-18 :
2-19:
II,LUSTRATIONS
Title Page
Lunar Orbiter Uprange Radar Coverage 11
Tracking Coverage 13
Ground Tracking for February 5, 1967 15
Telemetry Coverage 16
Lunar Orbiter Space Vehicle -_ 18
Lunar Orbiter Spacecraft 19
Launch Vehicle 20
Early Orbit Determination Results 38
EffectofMidcourse Time on AV Required 40
EffectofTime ofArrivalon Midcourse AV Requirement 41
Pre-Midcourse Encounter Parameter Summary 43
Midcourse Geometry 44
Midcourse Doppler Shift 45
Deboost Doppler Shift 47
Orbital Geometry at Deboost 49
Initial-Ellipse Conic Elements History 51
Transfer Doppler Shift 52
Orbital Geometry at Transfer 54
Perilune Altitude vs Longitude 56
Photo Orbit Traces for Primary Targets 57
Predicted Primary Photo Altitudes based on Transfer Design 58
Perilune Altitude vs Time 60
Inclination vs Time 61
Argument of Perilune History 61
Inertial-Node Longitude History 62
Predicted Primary Photo Altitudes Based on Real-Time EVAL
Runs 65
Perilune Altitude vs Longitude of Descending Node 66
Photo Subsystem Cislunar Temperatures 80
V

ape i
Figure
3-2
3-3
3-4
3-5
3-6
3-7:
3-8:
3-9:
3-10:
3-11:
3-12:
3-13:
3-14:
3-15 :
3-16 :
3-17:
3-18:
3-19 :
3-20:
3-21:
3-22:
3-23:
3-24:
3-25:
3-26:
3-27:
3-28:
3-29:
ILI,USTRATIONS
Title
Photo Subsystem Cislunar Temperatures
Photo Subsystem Cislunar Temperatures
Photo Subsystem Sunrise Temperatures
Photo Subsystem Sunrise Temperatures
Photo Subsystem Sunrise Temperatures
Photo Subsystem Sunset Temperatures
Photo Subsystem Sunset Temperatures
Photo Subsystem Sunset Temperatures
Camera Film Advances
H&D Curve for SO-243
White-Level Densities--Readout Sequence 010
White-Level Densities--Readout Sequence 098
White-Level Densities--Readout Sequence 087
White-Level Densities--Readout Sequence 105
White-Level Densities--Readout Sequence 070
White-Level Densities--Readout Sequence 007
White-Level Densities--Readout Sequence 095
Variation of Densities Along Framelets
GRE Film Density vs Spacecraft Density
Communications Subsystem Block Diagram
Typical Mode 3 Received Signal Strengths during Lunar Orbit
Transponder Temperature--RF Power and EMD Temperature
Transponder AGC Data
Priority Readout--Site III P-SB
Array Current and Temperature vs Time
Array Current and Temperature vs Time
Array Current and Temperature vs Time
Array Current and Temperature vs Time
Page
81
82
83
84
85
86
87
88
89
89
91
93
94
95
96
97
98
100
101
104
108
107
110
113
115
116
117
119!L
8
vi

I
Figure
3-30:
3-31 :
3-32:
3-33:
3-34:
3-35:
3-36:
3-37:
338:
3-39:
340:
3-41 :
3-42:
3-43:
3-44:
3-45:
3-46:
3-47:
3-48:
3-49:
3-50:
3-51:
3-52:
3-53:
3-54:
3-55:
liA.USTRATIONS
Title
Solar-Array Degradation
Spacecraft Battery Depth of Discharge
Attitude Control System Nitrogen Usage
Velocity Control System Available Nitrogen History
Velocity Control System Pressure-Time Histories
Velocity Control System Temperature-Time Histories
Velocity Control System Orbit Injection Maneuver--System
Pressures and Temperatures
Velocity Control System Orbit Injection Maneuver--System
Dynamics
Spacecraft Vibration--Peak Longitudinal Response (214X)
Spacecraft Vibration--Peak Lateral Response (210Z)
Random Response at Liftoff--Longitudinal Pickup (214X)
Random Response at Liftoff--Lateral Pickup (210Z)
Random Response at Transonic Longitudinal Pickup (214X)
Random Response at Transonic Lateral Pickup (210Z)
BECO Longitudinal Vibration (214X)
BECO Lateral Vibration (210Z)
SECO Longitudinal Vibration (214X)
SECO Lateral Vibration (210Z)
Longitudinal Vibration (214X)--Agena First Ignition
Lateral Vibration (210Z)--Agena First Ignition
Longitudinal Vibration (214X)--Agena First Cutoff
Lateral Vibration (210Z)--Agena First Cutoff
Longitudinal Vibration (214X)--Agena Second Ignition
Lateral Vibration (210Z)--Agena Second Ignition
Spacecraft Battery Temperature Difference
Spacecrafts 5 and 6 Solar Absorptivity History
Page
119
121
128
133
134
135
136
137
139
140
141
142
143
144
145
146
147
146
149
150
151
152
153
154
156
157
vii

I-II-2I-3
I-4
I-5I-6
1.72-I2-2
2-3
2-4
2-5
2-6
2-7
2-8
2-9
2-10
2-11
3-I
3-2
3-3
3-4
3-5
3-6
3-7
3-8
3-9
3-10
4-I
4-2
5-1
TABLES
Title Page
Spacecraft retests ................................................ 2
Spacecraft Special Tests ........................................... 2
Summary of Differences from Standard Flight Spacecraft .............. 4
Explosive Safe Area Tests ........................................... 6
Launch Area Tests ................................................. 7
Spacecraft Prelaunch Milestones .................................... 8
Ascent Trajectory Event Times ...................................... 17
Significant Event Summary ........................................ 24
Photographic Site Location ......................................... 25
Core Map Actual Photographic Activity ............................... 26
Film Budget Actual ................................................ 28
Mission Launch Period and Windows ................................. 31
Trajectory Sequence of Events ....................................... 36
Powered Flight Trajectory Events .................................... 37
Pre-Midcourse Orbit Determination Encounter Parameter Summary ...... 39
Orbit Determinations Used for Photo Site Command Conferences ........ 59
Frame Exposure Summary ......................................... 63
Harmonic Model vs Site ............................................. 64
Key Events ....................................................... 68
Photo Data Summary .............................................. 70
Transponder Power Discontinuities ................................. 109
Spacecraft Load Currents ............................................ 118
Attitude Control Subsystem Data During Photo Operations .............. 124
Velocity Control Subsystem Maneuver Performance ................... 131
Propellant and Nitrogen Servicing Summary Velocity Control Subsystem. 131
Engine Valve Temperature Maximum Conduction ..................... 137
Gimbal Actuator Position ........................................... 138
Spacecraft TWTA Temperatures ..................................... 156
Lunar Orbiter SPAC Program Execution ............................. 160
Communications Down Time---(%) .................................. 162
Radiation Data-Record Mission III ................................... 164
VIII

LUNAR ORBITER III FINAL REPORT
MISSION SYSTEM PERFORMANCE
1.0 I,AIjN(:II ()I'ERATI()NS
The Launch operations Plan CLOP), Lock-
heed Missiles and Space Company Document
LMSC-A751901C, dated March 31, 1967, pro-
vided the primary planning for overall space
vehicle program direction through the lunar
preinjection phase of the Lunar Orbiter III
flight. This document served as the basis for
directing the activities required to achieve
and evaluate flight objectives, launch criteria
and constraints, and implementation of pre-
flight tests, checkouts, and launch of the
space vehicle.
The same basic launch operations plan wasused for the Mission III launch as was used
during the first two missions. A description
of the launch operation organization and sup-
porting launch/postlaunch tracking and com-munication facilities iscontained in the Lunar
Orbiter Mission I Final Report, Section 3.3.1,
"Launch Operation Plan" and 3.3.2, "LaunchBase Facilities."
1.1 SPACECRAFT PROCESSING
Spacecraft 6 arrived at Cape Kennedy on
August 26, 1966, to serve as backup for the
Mission II flight article, Spacecraft 5. Upon
arrival, it was moved to Hangar "S" to initi-
ate processing of the spacecraft for the
backup function per Boeing Document D2-
100406-2, Volume II. This spacecraft was
accepted by NASA on October 18, 1966. After
the November launch of Mission II, Space-
craft 6 was placed in storage until needed for
Mission III. Spacecraft 7 arrived at Cape
Kennedy on November 21, 1966 to be prepared
for use as a backup unit for Mission III.
1.1.1 Hangar "S"
On January 2, 1967, the spacecraft was re-
moved from storage and retested per D2-
100717-1 at Hangar "S," as indicated in Table
1-1. In addition, Table 1-2 lists the special
tests performed. These groups of tests were
performed to ascertainthat all subsystems
were still satisfactory, and to test those sub-
systems modifed as a result of Mission I and
II experience. Refer to Table 1-3 for a sum-
mary of differences from Lunar Orbiter I,
designated the standard flight spacecraft.
The following discrepancies were disclosed
during retest.
• The accelerometer in the IRU Serial
No. 110 failed during component level
tests in Seattle, so IRU Serial No. 113
was installed in the spacecraft.
• The TWTA Serial No. 23 was replaced
due to suspect test history.
• A damaged micrometeoroid detector
was replaced.
• The Canopus star tracker was re-
moved for a special engineering teston the baffles.
• A bent solar panel actuator arm was
found. The actuator was replaced.
• The film-advance motor in the photo
subsystem was replaced due to erraticfilm-advance behavior.
All retests and special tests were satisfac-
torily concluded.

Table l-I:SPACECRAFT RETESTS
PARAGRAPH TEST TITLE
Note:
6.1
6.2
6.5
6.6
6.7
6.9
6.10
6.12
6.13
6.14
6.17
6.20
6.21
6.23
6.25
Spacecraft-Hangar "S" DSIF-71 Checkout
Spacecraft Alignment Verification
Pre-"Power On" Check
Initial Test Setup
Initial Conditions/Readiness Test
Radiation Dosage Scintillation Counter FCO
Attitude Control Functional Test
Volocity Control Subsystem Test
Power Subsystem Performance
High-Gain-Antenna Position Control, Camera Thermal Door
Operation, and Antenna Deployment
Solar Panel Test and Low-Gain-Antenna Alignment
Photo Subsystem FCO
Photo Subsystem Removal
Equipment Mounting Deck Reflectance Test
Camera Telephoto Shutter Test
Test paragraphs referred to in this table are part of Boeing Document
D2-100717-1, Spacecraft Retest Procedures--ETR--Lunar Orbiter.
Table 1-2:SPACECRAFT SPECIAL TESTS
PARAGRAPH TEST TITLE
6.8.10
6.24.1
6.10.1.A
6.10.4.6
6.2.4.7
6.13.1
6.24.2
6.24.3
6.24.4
Ranging, Mode II, and RF Probe
Command Time Delay
Plug (1'254) Verification Test
Voltage Calibration of Star Tracker Test Set (Serial No. 2)
and Canopus Star Tracker (Serial No. llG2)
Transponder Modulation Index Test
Transistor Panel and Power Resistor Test
Plugs {P475 and P461) Verification Test
Verify Correct Operation of ACS Portion of CountdownProcedure
Plug (P372) Verification Test
2

Table !-2 : SPACECRAFT SPECIAL TESTS (Continued
PARAGRAPH TEST TITLE
6.24.5,.6,.9
6.24.11
6.24.12
6.24.13
6.10.4
6.20.4.6
6.24.14
6.24.16
6.20
6.2.3
6.14.5
6.17
D2-I00457-I
Sec. 3,7, and 14
D2-I00717-I
Para. 6.26.1
D2-I00717-I
Para. 6.26.2
D2-I00717-I
Para. 6.26.3,6.20.4, 6.26.5, 6.26.6
Note:
Solar Panel Illumination Test
EMD Paint Coupon Test
Plugs (P251, P254, and P354) Verification Test
Photo Subsystem (P/S No. 6) V/H Test
Canopus Star Tracker (Serial No. 09G2) Performance Verification
Verify Ranging with DSIF-71
Programmer Memory Core Verification Test
Photo Subsystem (P/S No. 5) Spacecraft V/H Test
Photo Subsystem (P/S No. 5) FCO
Photo Subsystem (P/S No. 5) Alignment Verification
Low-Gain-Antenna (Serial No. 009) Deployment Test
Solar Panel Tests and Low-Gain-Antenna Alignment
Photo Subsystem (P/S No. 5) Performance
and Focus Measurement Tests
Canopus Star Tracker 9G2 Star Map Output VoltageVerification
Transponder "Tap" Test and DSIF-71 Reference
Frequency Test
RF Investigative and RangingTests
Test paragraphs noted in this table are part ofBoeingDocumentD2-100406-2,
Volume II, Spacecraft "6" Test Procedures--ETR--Lunar Orbiter unlessotherwise noted.

Table I-3: SUMMARY '_F I)IFFERENCES FROM STANDARD FLI(iHT SPACECRAFT
SU IISYS'I'EMS
PHOTO StTBSYSTEM
I)ART NUMBER *
l,unar
Orbiter I
l,unar
Orbiter II I
STRUCTURES AND
MECHANISMS
Thermal Coating
CouponInstallation
Paint
Coupons
Equipment
Mounting Deck
1200- !00
25-51848-1
1200-100
25-55218-1
Low-Gain
Antenna Microswitch
25-51848-4
No Part Number Change
No Part Number Change
1512469-903
(10-70053-1)
1512469-905
(10-70053-1)
ATTITUDE CONTROLSUBSYSTEM
IRU Inertial
Reference Unit
REMARKS
Incorporated ECM LO-I-0567
Thermal Coating Coupons
Incorporated ECM LO-I-0558
EMD overcoating - changed
types of coupons
Incorporated ECM LO-I-0558
EMD overcoating
Incorporated ECM LO-I-0562
provide safety lock on low-
gain antenna microswitch
Incorporated ECM LO-I-0544
elimination of noise spikes
in IRU, RIM - incorporated a
capacitor in the IRU
Incorporated ECM LO-I-0515 IRU
Gyroscope Backup Program -
changed supplier of gyroscope
Reference Eastman Kodak Photo
Subsystem No. 5 preshipment
Data Package 2-1572-02-2907
dated Oct. 22, 1966, for
configuration differences from
P/s 4 and 5. Incorporated
a 0.21 _ 0.02 neutral-density
filter to the 80-mm lens per
ECM-LO-I-0571

l_D b
Table I-3: SUMMARY OF
SU BSYSTEMS
COMMUNICATIONSUBSYSTEM
Command Decoder
Address Plugs
Low-Gain
Antenna
POWER SUBSYSTEM
Solar Panels
Power Transistor
Panel
DIFFERENCES FROM STANDARD FLIGHT SPACECRAFT
PART NUMBER *
Lunar
Orbiter 1
1726659-501
Lunar
Orbiter II!
1726659-503
25-50937-1225-50937-II
No Part Number Change
INo Part Number Change
REMARKS
Each spacecraft has a "one of
a kind" address plug
Incorporated ECM LO-I-0557
stray-lighttest--paintedantenna with non-reflective
paint
Incorporated ECM LO-I-0557
stray-lighttest
Incorporated ECM-LO-I-0542
replacement and rework of
transistor assembly
* The part numbers noted under the Part Number column are part number differ-ences if a difference exists.
5

I.I.2 ExplosiveSafeAreaOn January 14, 1967,the spacecraft was
moved to the Explosive Safe Area (ESA_ for
flight fueling and final testing. A listing of
tests performed at the ESA is shown in Table
I-4. After performance of the regulator and
leak check, the fuel, oxidizer, and nitrogen
were loaded during January 16 to 18.
After the DSIF-71 test without shroud on
January 23, the thermal barrier was in-
stalled. However, during final checks on thebarrier it was discovered that Micromete-
Table I-4: EXPLOSIVE
PARAGRAPH
6.1.1.2
6.1.3
6.1.4
6.1.5
6.1.6
6.1.7
6.1.8
6.1.9
6.1.10
6.1.11
6.1.12
6.1.13
6.1.14
6.1.15
6.2
oroid Detector MT-717 was punctured. The
decision was made to launch the spacecraft
without replacing the detector. Following
installation of the spacecraft shroud t launch
vehicle nose cone_, the DSIF test with shroud
and Agena adapter was conducted without
incident on January 25. The encapsulated
spacecraft was then transported to Pad 13
for mating with the launch vehicle.
During ESA operations, considerable diffi-
culties were encountered from erratic opera-
tion of the facility crane.
SAFE AREA TESTS
TEST TITLE
Photo Subsystem Launch Preparation
Spacecraft Regulator and Leak Test
Propellant Servicing
Nitrogen Servicing
Photo Subsystem Installation and Alignment
Weight and Balance Verification
Battery Verification
Camera Thermal Door Verification
Spacecraft Operational Check with DSIF-71
Ordnance Check and Hookup
Agena Adapter Installation
Thermal Barrier Installation
Nose Fairing Installation
Spacecraft Operational Check with DSIF-71
through Shroud and Agena Adapter
Transport Spacecraft to Pad 13
NOTE: Test paragraphs referred to in this table are part of Boeing Docu-
ment D2-I00406-2, Volume III, Spacecraft "6" Test Procedure-ETR-Lunar
Orbiter.

i
I.I.3 Launch Pad 13
After successful completion of the space-
craft-Agena matchmate on the launch pad,
tests were conducted to verify impedance
and interface compatibility. Table 1-5 lists
scheduled and unscheduled spacecraft testsconducted in the launch area.
When an attempt was made to apply power to
the spacecraft, no indication of spacecraft
power was evident. Investigation disclosed
that a shorting bar on the chart recorder,
which was used to record bus voltage and
current, was shorting out the ground power
supply. As a precautionary measure, the
ground power supply was replaced with a
spare. Ground power was then applied to the
spacecraft, and the pad checkout completed
satisfactorily. Upon completion of these tests
the spacecraft was ready for simulatedlaunch.
1.2 LAUNCH CONDUCT
The launch plan, activities, facilities, and
participating organizations were similar to
those for Missions I and II. Specific informa-
tion may be obtained from Section 3.3,
"Launch Operations," of the Mission I final
report.
1.2.1 Launch Criteria
Launch criteria and space vehicle prepara-
tion were governed by the Launch Operations
Plan, LMSCIA751901A. Although Spacecraft 6
had been tested and used as a backup to
Spacecraft 5 for Mission II, it was neces-
sary to retest it for Mission III in accordance
Table 1-5: LAUNCH AREA TESTS
DOCUMENT NUMBER TEST TITLE
bJ
D2-100406-2,Volume IV
D2-100626-3,Volumes Iand V
D2-100626.3,Volumes IIand V
D2-100626-3,Volumes IIland V
Not Recorded
Not Recorded
|11
Spacecraft to Adapter and Agena Matchmate
Lunar Orbiter Spacecraft Third Flight
Spacecraft Initial Pad Tests
Lunar Orbiter Spacecraft Third Flight
Spacecraft Operational Readiness Test*
Lunar Orbiter Spacecraft Third Flight
Spacecraft Simulated Launch
Transponder Threshold Test**
Power Supply Transient Test**
* Performed as a part of the simulated launch
** Trouble isolation tests conducted on the launch pad to
identify anomalies which occurred during the scheduledtests

i t
with the requirement of Section 5.0 of Boeing
Document D2-100111-3, Spacecraft Test Sp_!-
fication - Eastern Test Range - Lunar Orbiter _.
Significant milestones described in Table 1-6were satisfactorily completed by Space-craft 6 in preparation for launch.
1.2.2 Countdown and Launch
The spacecraft did not participate in the joint
flight acceptance composite test IJ-FACT)
on January 27, 1967 for Mission III. During
the test, an Agena voltage-controlled oscil-
lator IVCO) 1461717-135 failed, a faulty Agena
helium sphere temperature transducer was
discovered, and a broken wire in the AGE
cable to the squib simulator circuitry wasdisclosed. The VCO and the transducer were
replaced and the wire was repaired afterthe test. The test started at T-230 minutes
and concluded satisfactorily at a plus count
of 2167 seconds. All objectives were met.
The simulated launch test was conducted
Table 1-6: SPACECRAFT
January 31, 1967. The spacecraft count was
picked up at T-520 minutes at 10:50 GMT.
After power was applied to the spacecraft and
the rf link established between the space-
craft and DSIF-71 at T-420 minutes, there was
a noticeable variation of as much as 15 db
below normal in the "up" link rf power to the
spacecraft. This situation continued until ap-
proximately T-28 minutes in the count, when
the signal suddenly increased approximately
8 db and the operation was normal through
the plus count.
At T-60, a spacecraft internal power check
was initiated. At T-55, an attempt was made
to reapply ground power, with no results. It
was found that the ground power supply had
failed. Subsequent investigation revealed that
the failed power supply was an unmodified
version of the standard power supply in use.
The spare ground power supply replaced the
failed unit. During the changeover and sub-
sequent ground power turn-on, power transi-
PRELAUNCH MILESTONES
COMPLETION DATE
January 2, 1967
January 3, 1967
January 14, 1967
January 18, 1967
January 21, 1967
January 23, 1967
January 23, 1967
January 25, 1967
January 25, 1967
January 26, 1967
January 31, 1967
February 4, 1967
EVENT
Spacecraft removed from storage
Photo subsystem arrived at ETR
Spacecraft moved to explosive safe area
Spacecraft fueling
Photo subsystem installed in spacecraft
DSIF-71 checks without the shroud
Spacecraft matchmated to Agena adapter
Shroud installation
Spacecraft checkout with DSIF (Shroud on)
Spacecraft matchmated to Agena
Simulated launch
Final countdown and launch commenced

_t
ents were observed and a photo subsystemfilm advance was noted. After determina-
tion was made that no damage had been done
to the photo subsystem, the count was re-
sumed and the test continued through the
plus count without further incident. This
problem caused 73 minutes of unplanned hold
time during the simulated countdown.
The following minor problems were encoun-tered.
• Readouts by the Agena beacon indi-
cated a signal strength 2 db below
downrange requirements. The beacon
was later removed and a bench power
reading confirmed satisfactory sig-
nal strength.
• An interlock circuit "program open
loop" light was observed. Investiga-
tion revealed that the door covering
the manual constant setting switches
was open. Closing the door correctedthe situation.
• A switch malfunctioned in the auto-
matic checkout sequence circuit of
the track checkout equipment panel.
Installing a spare panel corrected the
problem.
• An intermittent flashing of the track
transmitter confidence circuit light
was traced to the automatic frequency
control circuit. This was corrected by
adjusting the confidence circuitrytolerance.
• During Lox tanking of the Atlas boost-er, oscillations of the Lox boiloff
system yielded vibrations on the
spacecraft EMO of approximately 7
g's peak to peak at a frequency of
approximately 23 Hz.
Tests were conducted with the spacecraftvan after the simulated launch test to investi-
gate the rf level variations. These tests
showed no anomalies in the spacecraft trans-
ponder. Checks were also made in the pad
complex wiring, at which time the rf switchthat directs the rf to the DSIF-71, the van, and
DSIF-71-van was suspected and replaced.This switch was bench tested and indicated no
problems. Further investigation resulted in
a request to boresight the 10-foot parabolic
antenna on the complex with DSIF-71, after
which a gain in signal of 10 db was noted.
On February 1, an rf verification test was
conducted on the spacecraft with satisfactoryresults.
On February 2, a test was conducted on the
spacecraft to exercise the external power
supply and repeat that portion of the space-
craft countdown internal power checks where
the trouble had been experienced on the simu-
lated launch test. Ground power supply prob-
lems were again encountered when returning
to ground power after the internal power
checks. The spacecraft simulator was
brought to the complex and connected to the
complex wiring at the Agena-spacecraft
interface. When the power supply was turned
on the first two times, similar problems were
experienced, and trouble shooting continued
with the spacecraft simulator. The launch
attempt scheduled for February 3, 1967 was
cancelled and processing of the backup space-
craft, Lunar Orbiter Serial Number 7, wasinitiated.
Trouble shooting continued on February 3.
After initial duplication of the power supply
problem with the spacecraft simulator, 20
further attempts failed to reproduce this
problem. The power supply remote control
panel on the blockhouse console was re-
placed. A test was run on the spacecraft
simulator and the spacecraft was put through
that portion of the test where all the prob-lems had been encountered. These tests were
completely successful and the launch was re-
scheduled for the following day. Prior to
turning power on the spacecraft, it was
9

discovered that the Agena umbilical pull-away connector was not properly cocked.The umbilical was disconnectedfrom the,vehicle, recocked,andreconnected.
The spacecraft count waspicked upat T-520minutes. After power was supplied to thespacecraft at T-420minutes,there wassomefluctuation in rf signal between the space-craft and DSIF-71. Prior to T-315 min-utes, whenthe traveling-wave-tubeamplifier_TWTA)waschecked,a requirement for theTWTA to beabove45°Fwas imposed.Space-craft air conditioning was dumped and thenitrogen purge was started to meet this re-quirement. At cooling air shutdown,varia-tions in rf signalwere noticed.The air condi-tioning was cycled on and off with corre-spondingvariations in rf signal. The TWTAwas finally checked successfully at aboutT-250minutes, causing the rf silent periodat T-255minutes to bedelayed for approxi-mately 5 minutes. From this point, a normal
spacecraft countdown was conducted to lift-
off. Primary spacecraft air conditioning was
lost at about T-30 minutes and a switchover
to the backup system was accomplished with-out incident.
1.2.3 Weather
Weather during the launch operation was
favorable. Upper wind shears were within
acceptable limits. At liftoff, the following
weather parameters were recorded.
Temperature ....... 54.3°F
Relative Humidity ...... 94%
Visibility ............. 10 milesDew Point ............. 53°F
Surface Winds ......... Calm
Clouds ............... Clear Skies
Sea-Level Atmospheric
Pressure... 29.970 inches of Mercury
1.2.4 Tracking CoverageThe Air Force Eastern Test Range t AFETR _,
Deep Space Network (DSNy, and Manned
Space Flight Network IMSFNI are the ele-
ments of the Tracking and Data System
(TDS_ that together support the tracking
and telemetry requirements for the Lunar
Orbiter III launch.
Tracking during the launch phase consisted
of C-band tracking of the launch vehicle and
reception of VHF and S-band telemetry from
the launch vehicle and spacecraft, respec-
tively. Figure 1-1 shows AFETR and MSFN
uprange coverage for any launch day.
Tracking data provided to AFETR during
the launch phase established (1) the Agena
orbit and the normalcy of spacecraft cis-
lunar injection in real time, and (2) launch
vehicle performance evaluation. This was
done by first tracking the Agena stage and
then, after separation, both the spacecraft
and Agena. Since the separation velocity
was small, tracking of the Agena stage both
prior to and subsequent to separation was
valuable in determining an early spacecraft
trajectory.
Other elements of the TDS received the
tracking data to prepare acquisition and pre-
diction data for the Deep Space Stations
(DSS). Prediction data based upon actual
launch vehicle performance was used dur-
ing initial acquisition by all stations.
The tracking data supplied by the uprange
AFETR and MSFN radars were processed by
the real-time computer system (RTCS) at
the AFETR, and station predictions were
generated in real time for the AFETR,
MSFN, and DSS farther downrange. The
AFETR forwarded the tracking data direct-
ly to Goddard Space Flight Center (GSFC)
so the GSFC could generate prediction data
for the MSFN stations. These data were also
relayed to the Space Flight Operations Fa-
10

\
\
\
\
0
\
\
\
0
c_L.
c_
f,.,
c_
c_L.
_L
f,.
.,.,i
.QTN
O
.°
._mo
11

cility 4SFOF) for use with I)SS data in cal-
culating the spacecraft trajectory. The MSFN
transmitted Bermuda and Carnarw)n track-
ing data to the AFETR. The AFETR retrans-
mitted their raw tracking data and that of
the MSFN stations to the SFOF in near-real
time.
Tracking coverage for various portions of
the near-Earth phase of the launch tra-
jectory is shown in Figure 1-2.
The ability to satisfy the near-Earth phase
tracking and telemetry requirements was
strongly dependent upon trajectory char-
acteristics and TDS facilities during that
phase. The most dominant trajectory char-acteristic was the variable location of the cis-
lunar orbit injection point. With the injec-
tion taking place uprange--i.e., in the At-
lantic Ocean--the support problems were
quite different than for an injection far down-
range in the Indian Ocean as experienced
during Mission I. An Earth map with injec-
tion loci for the February launch period is
presented in Figure 1-3. The injection point
for the launch of February 5, 1967, on an azi-
muth of 81.6 degrees, was near the western
edge of Africa in the Atlantic Ocean.
12.5 Telemetry CoverageElements of the TDS received and recorded
spacecraft and launch vehicle telemetry
during the near-Earth phase of the mission
(see Figure I-4). Spacecraft telemetry was
received and recorded via the Agena S-band and VHF links.
The Kennedy Space Center (KSC) telemetry
station supported all vehicle checkout and
the launch on both vehicle links. Local sig-nals were used until T+435 seconds, at which
time Agena data was switched to the sub-
marine cable signal from Antigua. All ve-
hicle events through first burn of the Agena
were recorded and reported in real time.
In addition, the Canary Island MSFN station
relayed the velocity meter information tothe KCS. All second-burn events were also
recorded in real time. The various AFETR
second-burn relays were not needed on thelaunch azimuth that was flown.
1.3 LAUNCH VEHICLE PERFORMANCE
The first stage of the launch vehicle was
an SLV-3 /Atlas t, Serial Number 5803. All
SLV-3 flight objectives were satisfied.
Position charts indicated the vehicle flight
to be low and left from liftoff until approxi-
mately T + 240 seconds when the vehicle ap-
proached nominal. It remained near nominal
throughout the powered flight. The perform-
ance of all Atlas systems was satisfactory.
Atlas-Agena separation was properly accom-
plished, and good telemetry data was obtain-
ed for Atlas systems analysis.
The second stage of the launch vehicle was
an Agena-D, Serial Number 6632. Agena per-
formance was satisfactory throughout the
flight. A velocity meter cutoff terminated
Agena first and second burns. First burn was
approximately 1.2 seconds longer than nom-
inal; second burn was 0.4 second longer than
nominal. Agena telemetry yielded the ex-
pected responses, with the exception of longi-
tudinal acceleration measurement A-9, which
indicated the wrong polarity prior to launch.
Significant ascent trajectory events and
times in seconds relative to initial vehicle
2-inch motion are covered in Table 1-7.
The configuration of the Atlas-Agena launchvehicle for Mission III was identical to the
Lunar Orbiter Mission I and Mission II
launch vehicles except that new light weight
engine boots were employed on the Atlas.
Performance of the boots apparently was sat-
isfactory since thrust section temperatures
12

i
aOZ--"
|°
r
L.
o
m
..
L
_0
]3

" CO ¢0 =O ,WD GO U
_, m, ,=,, _ I_=°z- _ _ _ . _ -i iim i I
Z0
.<
8,,.J
z= z_ _ _ _= 20 ° 0 ° vO Oz O0 o
o*
I...
==oml
14

0 0 0 0 0
J_Q;
E-
Q;
°_
IS

l,..-
l,..I
o,uL
! !
I,ff,zu_5"I"--
_.N
DO@0L4,J U. a
zO
I,--
l---i
Ii
i
ZON
Or
0,....4
I,,--
o '-r
_F.. Oo
_ |
o _i..,Z
o' _.9._,_ 8_ 0
Z
o
o
0o L i
O
'7
I I I I
< 0 <O <
_. z_ _, o-.,I -.8 ...I ...I
<< <0<0<0<0ZZ Z=Z=Z=Z=
O0 0 Z
• ° ° °
IZ >Z-- -- ._
u 19
il
5"r--°" r_- z z z.._ z
=
0 _"'
< ,,,Z
-" 0-'2_ Z
Z0
0
mI',4
0
[...
.°
16

Table 1-7: ASCENT TRAJECTORY EVENT TIMES
EVENT TIMES ( _- SEC)
Liftoff (2-inch motion)
BECO
Jettison Booster
Start Agena Auxiliary Timer
SECO
Start Primary Sequence Timer
VECO
Jettison Nose Shroud
Atlas-Agena Separation
Agena First-Burn Ignition (90% pc)
Agena First-Burn Cutoff**
Stop Primary Sequence Timer
Restart Primary Sequence Timer
Agena Second-Burn Ignition (90% pc)
Agena Secon-Burn Cutoff***
Spacecraft-Agena Separation
Agena Yaw Maneuver
Stop Yaw Maneuver
Fire Agena Retro Rocket
Retro Rocket Burnout
appeared nominal throughout flight. Details
of the Atlas-Agena configuration are present-
ed in the Mission I final report (Boeing Docu-ment D2-100727-1, Volume I), and in the
NOMINAL ACTUAL
0117:01.120GMT
129.9 129.78
132.9 132.99
270.21 270.48
288.3 288.02
293.88 297.36*
308.7 309.21
311.0 311.43
313 0 313.57
368.03 371.64
522.807 527.38
578.5
1090.21 1090.49
1105.36 1105.65
1193.73 1194.37
1358.2± 1358.55
1361.21 1361.46
1421.21 1421.46
1958.21 1958.55
1974.99
* Primary sequence timer started 3.48 seconds late
** First-burn duration:nominal, 154.7 seconds;actual, 155.9 seconds
*** Second-burn duration: nominal, 88.4 seconds; actual, 88.8 seconds
Lunar Orbiter C Launch Report (Lockheed
Document LMSC 274220). The general spacevehicle system configuration is shown in
Figures 1-5, 1-6, and 1-7.
17

/
IF
m
m
Figure 1-5:
SPACECRAFT AREA (TBC)
LMSC STA 247(S PACECRAFT/AGENASEPARATION PLANE)
,AGENA VEHICLE (LMSC)
< --LMSC STA 526GD/C STA 502
--GD/C STA 645
-ATLAS VEHICLE (GD/C)
_GD/C STA 1133
_GD/C STA 1310
Lunar Orbiter Space Vehicle
18

HIGH-GAINANTENNA
VELOCITYCONTROL EN_
ATTITUDECONTROL
FUEL
CAMERA THERMAL
SOLAR CAMERA LENSPANEL
UPPER STRUCTURALMODULE
SHIELD
COARSESENSOR
TANK
MICROMETEOROID
'ORSTO3 EMD
FLIGHT TEMPERATURE
LOW-GAINANTENNA
EQUIPMENT MOUNTING
PTO6,READOUTTHERMAL FINPLATE TEMPERATURE
(WITHIN PHOTO SUBSYSTEM)
PHOTOGRAPHKSUBSYSTEM
PTO7PHOTO SUSSYSTEMENVIRONMENTTEMPERATURE (LOWER)
COARSE SUN
LOW-GAINANTENNA
DETECTOR
FLIGHT
FUEL
)PUSSTARTRACKER
INERTIALREFERENCE
UNIT
RADIATIONDOSIMETER
VELOCITYCONTROL ENGINE
THRUSTERS
TANK
EMDTEMPERATURE
PANEL
RADIATI(
DOSIMETER
TRANSPONDERTEMPERATURECTO2
BATTERY""
C HARG ECONTRC
EMDTEMPERATURESTO2
ETO3 IIAl"r ERYTEMPERATURE MODULE 2
NOTEt SHOWN WITH THERMAL BARRIER REMOVED
BATTERY
MULTIPLEXERENCODER
ANTENNA
'CTO1I"WTA
:OMMANnDECODER
//
/
HIGH-GAINANTENNA
Figure 1-6" Lunar Orbiter Spacecraft
19
Fllfure 1.1-2: Lunar Orbitm, 8pscecndt

LO 2 BOILOFF
VALVE
LO 2 TANK
PRESSURIZATION
LINE
FUEL
(RP-1)
ANTIVORTEX
PLATE
VERNIER
EN
BOOSTER
SKIRT
FAIRIN(
.
_ADAPTER (TYPICAL)
FORWARD (LO2)
BULKHEAD
LIQUID OXYGEN
TANK
_SH
BAFFLE ASSEMBLY
EQUIPMENT POD
LO 2 FILL & DRAIN
LINE
BULKHEAD
ENGINE
Figure 1-7" Launch Vehicle
2O

1.3.1 Atlas Performance
The Atlas launch vehicle, Serial Number
5803, had three primary objectives and one
secondary objective in support of Lunar
Orbiter Mission III. The primary goals were:
• Place the upper stage into proper coast
ellipse:
• Initiate or relay commands properly
for separation of upperstage vehicle
and start the Agena primary timer;
• Relay commands to the Atlas-Agena
interface to jettison the shroud and
start the secondary timer of thelaunch vehicle.
The secondary objective was determination
of Atlas performance by using telemetrydata.
All objectives were successfully achieved.
1.3.5 Agena Performance
The second-stage Agena vehicle, Serial Num-
ber 6632, had two primary objectives and one
secondary objective in support of Lunar
Orbiter Mission III. The primary goals were:
• Inject the spacecraft into a lunar-coin-
cident transfer (cislunar) trajectory
within prescribed orbit dispersions;
Perform Agena attitude and retro-
maneuvers following Agena-spacecraft
separation to ensure that the Agena
would not, to the specified probabilities,
intercept the spacecraft, pass within 20
degrees of the center of the Canopus
tracker field of view, or impact theMoon.
The secondary aim of the Agena vehicle was
to provide tracking and telemetry data for
evaluation of Agena performance.
All objectives were satisfied. Evaluation of
orbital data of the Agena after retro ma-
neuver indicate that the Agena arrived in the
lunar vicinity approximately 6 hours after
the spacecraft and was approximately 17,000
km beyond lunar capture. Based on available
data, the Agena vehicle is now in a long life-
time Earth orbit with apogee of 428,662 km
and perigee of 24,611 kin.
A detailed technical description of flight
parameters is contained in Document LMSC!
A858188, Lunar Orbiter C Agena Vehicle 6632
Flight Performance Analysis Report, pre-
pared by Space System Division of the Lock-
heed Missiles and Space Company.
21

2.0 FI,I(;II'I'
This section describes Lunar Orbiter Mission
llI flight operations from liftoff at Cape Ken-
nedy. Florida, at 01:17 GMT on February 5,
1967 through the completion of final readout
during Orbit 154 at 07:17 GMT on March 3,
1967. Included are a comparison of the flight
plan with the actual mission, a discussion of
the operational controls used to control the
spacecraft trajectory and performance, and
descriptions of airborne and ground systems
performance.
Mission III from liftoff until Orbits 149 and
150 on March 2, 1967 was nominal and closely
followed the flight plan. An anomaly in the
photo subsystem during the readout sequence
during Orbits 149 and 150 prevented the com-
pletion of readout of all of the exposed film;
however, approximately 75 per cent of allfilm was read out.
The Flight Operations organization remained
essentially unchanged from that used in Mis-
sion II. A high return of experienced person-
nel provided the basis for manning this orga-nization.
Operational techniques developed in Missions
I and II were used in conducting Mission III.
Although some modifications to these tech-
niques may be required prior to Mission IV,
the techniques required little modification
prior to or during Mission III.
2.1 FLIGHT PLAN AND CONDUCT
This section describes the Lunar Orbiter
Mission III flight plan and summarizes the
nominal mission design. Flight conduct is
discussed, identifying conditions encoun-
tered in flight which necessitated deviations
from the planned nominal mission. An out-
line of the control techniques that were imple-
mented for mission control, spacecraft con-
trol, and flight path control is also included.
( )I'E R ATI( )NS
2.1.1 Flight Plan
The flight plan for Lunar Orbiter Mission III
was in major respects parallel to Missions I
and II, due to the similarity of target distribu-
tion on the lunar surface. The Mission III
flight plan was predicated on a nominal mis-
sion design, designated P-9A.
The P-9A mission launch was planned for 0
hours, 22 minutes, 09.0 seconds GMT on Feb-
ruary 3, 1967 at a launch azimuth of 78 de-
grees. A 90-hour cislunar trajectory was
planned with midcourse corrections at 28hours and 70 hours from launch. The mission
design included a mandatory first midcourse
correction, rather than an optional correc-
tion as in earlier missions. A plane change
of 13.04 degrees at injection was required.
Approximately 6 days waiting time was al-
lowed from initial orbit injection until orbit
transfer. An additional 2 days was allowed
from orbit transfer before photography of
the first photo site. Forty-four sites were
selected for photography. Twelve potential
Apollo sites distributed within the area of
interest ( + 5° latitude and + 45° longitude) on
the lunar surface were designated as primary
sites (IIIP-1, IIIP-2, etc ). Thirty-two addi-
tional sites were designated as secondary
sites ( IIIS-1, IIIS-2, etc. ).
The photography plan required exposures to
be made during nearly every orbit from initi-
ation through completion of photography. A
total of 212 exposures was planned (211 ex-
posures were used).
Priority readout was scheduled on virtually
every orbit between photo sites. Readout
scheduling provided for transmission of high-
er priority exposures during this period.
Subsequent to completion of photography, an
ll-day period was allocated for complete
22

readout of the proposed 212 frames, thereby
dictating a total mission duration of 32 days.
A summary of planned activities occurring
after injection is provided by Table 2-1.
Z.l.g Flight Conduct
Few significant flight plan deviations were
required in the conduct of this mission. Minor
changes to prelaunch planning were made as
required to optimize the mission in real time
as a function of actual flight profile.
Additional details regarding flight para-
meters and spacecraft performance will be
included in later sections Times of signifi-
cant mission events are summarized in Table
2-1.
2.1.2.1 Flight Profile
Liftoff was delayed 1 day by a ground power
supply failure at the Eastern Test Range.This failure resulted in an inadvertent one-
frame film advance in the photo subsystem
due to a power transient. This single-frame
advance did not bring the leader-to-film
splice under tension; the only impact was the
necessity for a ten-frame, rather than ll-
frame, initial film advance to position the
film for photography. The flight proceeded
nominally through the cislunar and initial
orbit phases and no significant flight plan
deviations were required prior to initiation
of photography.
Site photography was performed as planned,
with the exception of numerous minor
changes to site locations and one secondary-site deletion for technical causes. Reasons
for the majority of site changes were to en-
sure coverage of specific areas such as the
Surveyor I landing area, and to optimize
photo data acquisition in real time. Site co-
ordinates were changed for 13 of 20 prime-
site photo orbits, and one additional photo
pass was added. These changes were for
Sites IIIP-2b, -4, -5a, .Sb, -7a, -ga, -gb, -9c, -11,
-12a, -12b.1, -12b.2, and -12c. Secondary-site
coordinates or photographic procedure
changes were required for 10 of 33 photo pass-
es, including two deletions and one addition.
Affected sites were IIIS-2,-4, -8, -12,-14, -21.5,
-20, -23, -25, and -32. Photographic site loca-
tion as actually photographed is provided by
Table 2-2. Also, it was determined that use
of the V/H sensor was inadvisable on certain
secondary targets. These changes neces-
sitated revisions to both core map loading
and the film budget plan, as well as abbrevi-
ated reaction time for computations of space-
craft attitude and camera-on times. Experi-
ence levels of operations personnel allowed
incorporation of these changes to the rela-
tively complex photographic plan to be met
on a time scale, which could have proven in-feasible in earlier missions. Revised core
map loading and film budget plans are in-eluded for additional detail as Tables 2:3
and -4.
Priority readout was initiated at every op-
portunity during the photographic phase of
the mission. During these readouts, the first
spacecraft anomaly was observed--some
framelets were repeatedly reread when the0.1-inch film advance became erratic. It
was determined that this "hangup" condition
was correctable by temporary termination ofreadout.
As empirical evidence indicated some degree
of predictability of hangup, a partially suc-
cessful preventive procedure was developedfor final readout: schedule readout termina-
tion after each 19 inches of film readout. In
this way, it was frequently possible to avoid
this abnormal subsystem operation. The
phenomenon continued throughout priority
readout until the Operations team was direct.
ed to delete the final secondary site, IIIS-32,
and perform an early Bimat cut.
23

Planned
36:01:17:00
36:01 : 19:10.6
36:01:19:13.0
36:01:21:50.3
36:01:22:10.5
36:01:22:12.6
36:01:22:14.5
36:01:23:07.7
36:01:25:43.9
36:01:35:26.5
36:01:36:54.8
36:01:39:39.4
Table 2-1 : SIGNIFICANT EVENT SUMMARY
Time
Actuall
36:01:17:01.1
36:01:19:09.9
36:01:19:13.1
36:01:21:49.1
36:01:22 : 10.3
36:01:22 :12.5
36:01:22:14.7
36:01:23:12.7
36:01:25:46.5
36:01:35:26.8
36:01:36:55.5
36:01:39:39.7
36:01:41:30.4
36:01:50:00.0
36:12:03:30
36:17:05:00
37:14:43:42.4
37:15:00:00.0
37:15:08:05.4
39:21:38:38
39:21:54:19.0
39:22:11:07.3
43:18:00.'52
43 : 18:13:26.6
45:18:18:00
46:10:00:40.6
54:08:36:41.6
54:09:34:00.0
Event
Liftoff
Booster Engine CutoffBooster Jettison
Atlas Sustainer Cutoff
Atlas Vernier Cutoff
Shroud Separation
Atlas-Agena Separation
Agena First Ignition (90% Pc)
Parking Orbit Injection
Agena Second Ignition (90% Pc)
Cislunar Injection
Spacecraft Separation
Deployment Start
Sun Acquisition Start
Canopus Acquisition
Bleed Propellant LinesStart attitude maneuver for midcurse
correction
Engine ignition-- zLV5.11 M/S
( 16.7 f/s) Engine burn time 4.4 seconds
Complete reverse attitude maneuver
Start attitude maneuver for lunar injection
Engine ignition-- a V704.3 M/S
(2310.1 f/s) Engine burn time 542.5 seconds
Complete reverse attitude maneuver
Start attitude maneuver for orbit
transfer
Engine ignition-- _V50.7 MIS
( 168.3 f/s) Engine burn time 33.7 seconds
Read out test film
Start site photography
Cut BimatStart final readout
Photo Subsystem Anomaly
24

Table2-2
I'I(IMAItY SITES
th'lnt Site No I.-ngitmle I-'ttitude
44 III1" I .1.5 15E 2' 55'N
45 I' 2a 42 25' E 0 rdr S
46 I' 21) 42 41'E O 55' S
fall I'3 20 15'E 3 20'N
51 I'4 27 27' E 037'N
52 l'.5a 24 31' E 0 27' N
53 I' 51: 24 31' E tl 27' N
54 1'6 21 30'E 0 20' N
61 i: 7zi | 17'W I tr2' N
6.: l'-Tb 1 20'W 0 55' N
77 I'8 19 50"W 0 _'S
_0 i'.9,i 23 II'W :l _rs
I{I 1'.gb 23 IIW o 3 09'S
_2 I'-_.k' 23 ll'W 3 _)'S
56 l'-t0 42 IH)' W I 45' N
8'; i'-ll 36 56W 3 ITS
:_0 P-12b 2 ."_'e I)ii'l_'tion (?l_le
9i P 12a 43 52'W 2 23'S
92 l'-12b I See I)irection Ct_le
.,43 !' 12c See l)irl_L'tIon Ct_e
PHOTOGRAI)HIC SITE LOCATION
Fl'anle
16 Fast
8 Fast
4 Fast
4 Slow
8 Fast
# Fast
8 Fast
4 Slow
8 Fast
8 Fast
8 Fast
8 Fast
8 Fast
8 Fast
8 Fast
8 Fast
4 Fast
16 Fast
4 Fast
8 Fast
Ih rt,_.tion Itt,lliark_( 'ode ( :,xh'
( ._k.,t.Nott,s ;
a A
b A
g Ah A
b A
g Ab A
b A
g Ab A
a. A.
g A
j. Ab A.
g. A.b A
m. A
b A
ft. A
k. A.
SECONDARY SITES
t _:blt Site No. Longitude Latitude
44 lll_l 47 I0'E l 50' S
4; S-2 -104 E
43 S-3 38 45' E 4 30' S
49 S-4 24 31' E 0 27' N
55 S.5 24 12'E 0'35'S
S-6 620'E 7'45' N
57 S-7 650'E 3"40'N
.38 S-8 26 25'E 11'20' S
59 S-9 17 35'E 1"35' S
61 S-10 13 30'E l 30'S
62 S-II 1 26'W 0"55' N
-- S.12 Deleted
63 S.13 020'W 5 00'N
66 S-14 9 00'W 5 00' N
67 _15 5 30'W 0 40'N
69 S-18 5 40'W 020'5
70 S-t7 4 05' E 4"'45'S
71 S-IS 8 O2'W I '50'S
72 S.19 3 40'W 3"20'S
74 S-21 26 00' W 0 30'S
74 S-21.5 _ 126 E
75 _22 22 05'W r I0"N
76 S-20 27 45'W 7r'4_'N
78 _Z1 17 14'W ,V 31' S
79 S-24 23" 15'W 3"O5' S
83 S-35 4200W 1"45' N
IM S-26 37.50 W 8' 10'N
87 S-37 37 t0'W 3' 20'S
MI S-2S 43' 55' W 2"20'S
94 S.20 60" 3,1' W 500'S
96 _30 64".'Lh'W 7" 00' N
97 S-3l 67' 00' W r50' N
Frame
l)irection RemarksCode Code
! see Notes )
4 Fast h. D.
1 I. D.
1 e. D.
1 f C.
1 e. D.
l e, D.
4 Slow a. D.
! d. D.
I e. D.
4 Slow b. B.
! f. C.
i
t
4 Sh)w
I
4 Slow
4 Fast
4 Slow
I
1
I
I
4 Slow
1
I
I
I
1
I
!
I
e,
e.
h.
b.
b.
e.
b.
f.
O.
b.
C-
O.
f
f.
e.
f.
f.
e.
c.
a.
D.
B.
D.
D•
B.
D.
B.
C.
D.
B.
D.
D.
C.
C.
D.
C.
C.
D.
D.
I).
N{ )'I'FS
I )Wectlon ( _odl,
a. Taken vei'til'al on orbit which passes
nearest to site. C(.,_.'dinates may not _.,
be within telepllotocoverage
b. Camera pointcd at site from nearest orbit
--using cross track tilt If m_:essa,'y
c. Oblique photo liM)king North
d. Oblique photo looking ,'_uti:
e. Oblique photo l(H_king normal to orbit
f. Oblique photo llxJking westerly
g. Telephoto convergent, stereo using cross
track tilt to point camera at site.
h. Using same attitude as site IIlP-I.
i. 5% telephoto sidelap with equal cross
track tilt front each orbit.
J. 10 to 15% telephoto sidelap with P-gc
k. Convergent stereo overlap with first 8
frames of 16 frames from site III P-12a.
I. Wide angle field of view contains S/C
shadow. -
m. 35_ telephoto sideiap with frame num-
bers, I0, II, 12 and 13 of Site lllP-12a
16 frame sequence using cross track tilt
as required
n. 25% telephoto sidelap with frame num-
bers 10.5, 11.5, 12.5, 13.5 and 14.5 of Site
lllP-12a 16 frame sequence using cross track
tilt as required.
o. Oblique looking south. Take at 20" from
IM terminator using roll maneuver only.
Remarks Code
A. Provide additional data now needed to
select Surveyor sites in support of Apollo
and other candidate sites for first Apollo
mission.
B. Provide data necessary to screen other
candidate landing sites for Surveyor.
C. Provide oblique views of promising Apollo
landing sites.
D. Provide data of scientific interest.
General
• Orbit numbers have been adjusted from
PgA to agree with Mission !!1.
25

Table 2-3
(;()RE MAP
15
17.*
18
19
20
21
22
22 Update
23
23 Update24
25
26
27
28
29
3O
ORBITIX)ADED
42
44
45
46
48
50
52
54
55
56
5758
6O
62
64
66
68
70##
CORE MAP ACTUAL PHOTOGRAPHIC ACTIVITY
ORBITSINVOLVED*
4344
45
46
4746
49
50
5152
5354
55
56
56
57585859
60
6162
6364
6566
6768
6970
71
PHOTO SITES
Film AdvanceP-1,S-I#
P-2a
P-2b
S-2S-3
S-4
P-3
P-4
P-5a
P-5bP-6
S-5
S-6
CAMERAMODE
(10 framesF16, F4
F8
F4
S1S1
S1
$4
F8
F8
F8$4
S1
Sl
V/HMODE
On
On
On
OffOff
Off
On
On
On
OnOn
On
On
Store S-6
S-7S-8S-8S-9
S-10S-11
S-13P-7a
P-7bS-14
S-15
S-16S-17
S-18
Camera and
$4S1
V/H ModeS1
S4
Sl
Sl
F8
F8Sl
S4
Sl
S4
F4
V/H modes
OnOff
On
On
Off
Off
On
On
On
On
On
On
On
CARRYOVER
FROMPREVIOUS MAP
P-l, S-1
P-2a
P-2b
S-3
P-3
P-5a
P-6
S-6
S-8
S-11
P-7a
S-14
S-17
* To Sunrise of the following Orbit** Data for both maps to be presented at same preliminary and final command conferences.# No attitude change between P-1 and S-1
## Part of Map ma_, have to be loaded on following orbit
26

Table 2-3 CORE MAP ACTUAl, PHOT()(;RAPHIC ACTIVITY
ORBIT ORBITSCORE MAI' I,OADED INVOLVED *:PHOTOSITES CAMERAMODE
30
31
32
32 Update
33
33 Update
34
35
36
37
38
39
39 Update
40
40 Update
41
42
43
7273
73 7475
75 76
77
76 77
77 7879
78 79
79 80
81
81 82
83
83 84
85
85 86
87
87 88
89
89 9O
91
90 91
91 92
93
92 93
93 94
95
95 96
97
97 98
99
To Sunrise of the following orbit
(Continued)
S-19
S-21, S-21.5S-22
S-20
P-8
$4
SI,S1S1
S1
F8
Store P-8 Camera Mode
S-23 $4S-24 S1
V/HMODE
On
Off, OffOn
Off
On
On
Off
Store S-24 Camera
P-9a
P-9b
P-9c
S-25
S-26
P-10
S-27
S-28
P-11
P-12b.2
P-12a
I'
Store P-12a camera mode il
P-12b.1 F4
P-12c F8
Store P-12c camera mode
S-29
S-30
S-31
, S1
i $1
S1
and V/H Modes
F8 Oni
F8 On
F8 On
S1 J Off
S1 Off
F8 On
S1 Off
S1 Off
F8 j On
F4 On
F16 : Oni
On
On
i Off
I
IOff
On
Readout and bimat cut in this Map
I I .
CARRYOVERFROM
PREVIOUS MAP
S-22
P-8
S-24
P-9b
S-25
S-27
P-11
P-12a
P-12C
I
27
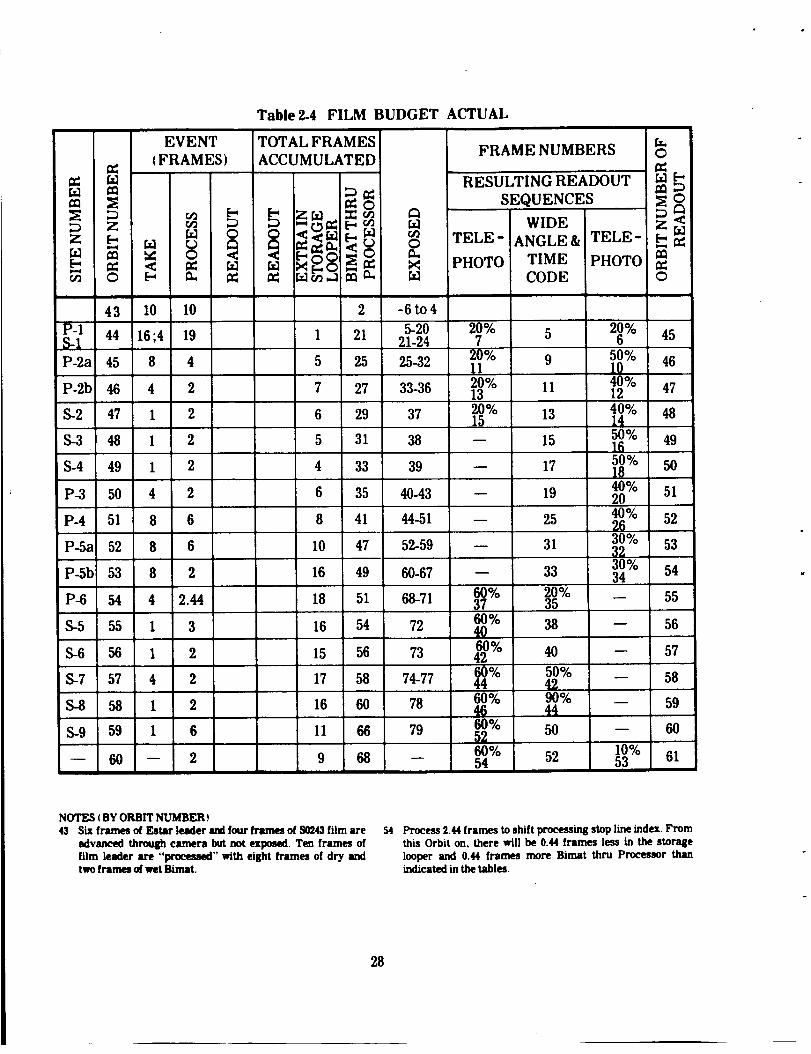
Table2-4 FILM BUDGET ACTUAL
EVENT TOTAL FRAMES FRAME NUMBERSIFRAMES) ACCUMULATED
a_ 0 RESULTING READOUT _i D a: SEQUENCES _
D _ --r_ _ _ WIDE __ _ <_-_ ["_ _ TELE- ANGLE& TELE- _
O_ ["< a,n_ _ _ __ _ PHOTO CoDETIME PHOTO 0_
43 10 10 2
P-1 44 16;4 19 1 21S-1
P-2a 45 8 4 5 25
P-2b 46 4 2 7 27
S-2 47 1 2 6 29
S-3 48 1 2 5 31
S-4 49 1 2 4 33
P-3 50 4 2 6 35
P-4 51 8 6 8 41
P-5a 52 8 6 10 47
P..5b 53 8 2 16 49
P-6 54 4 2.44 18 51
S-5 55 1 3 16 54
S-6 56 1 2 15 56
S-7 57 4 2 17 58
S.8 58 1 2 16 60
S-9 59 1 6 11 66
60 -- 2 9 68
-6 to 4
5-20 20% 5 20%21-24 7 6 45
25-32 20% 9 50% 46|1 10
33-36 20% Ii 40%13 12 47
37 20% 13 40% 4815 14
38 -- 15 50%1650%
39 -- 17 1840%
40-43 -- 19 2040%
44-51 -- 25 2630%
52-59 -- 31 3230%
60-67 -- 33 34
68-71 60% 20%37 35
60% 38 __72 40
60% 40 _73 42
60% 50% _74-77 44 42
60% 90% _78 46 ,t4
60% 5O --79 p_
60°/0 52 10%-- 54 53
49
50
51
52
53
54
55
56
57
58
59
60
61
NOTES (BY ORBIT NUMBER)43 Six frames of Estar leader and four frames of S0243 film are
advanced through camera but not exposed. Ten frames offilm leader are "processed" with eight frames of dry andtwo frames of wet Bimat.
54 Process 2.44 frames to shift processing stop line index. From
this Orbit on, there will be 0.44 frames less in the storagelooper and 0.44 frames more Bimat thru Processor thanindicated in the tables.
28

Table 2-4 FILM BUDGET ACTUAL (Continued)
EVENT TOTAL FRAMES
(FRAMES) ACCUMULATED FRAME NUMBERS _D
'5 = RESULTING READOUT _
_ _ _ _ _ Z_ _0 SEQUENCES ___ _ _'_ -_ [" _ _ TELE- ANGLE &i TELE-_ _ _ _ ["_ _ ' WIDE '
_ [., _ _ _ _ PHOTO TIME PHOTO0 _ _l_ m _, _ CODE 0
S-10 61 4 6 7 74 80-83 6_ % 58 20% 6259
S-I1 62 1 2 6 76 84 60% 60 30% 6362 61
S-13 63 1 3 4 79 85 60% 63 30% 64• _ 64
P-Ta 64 8 3 9 82 86-93 60%_8 666740% 65
P-7b 65 8 2 15 84 94-101 60% 68 40% 6670 69
S-14 66 1 2 14 86 102 _% 70 40% 6771S-15 67 4 3 15 89 103-106 60% 73 40% 68
75 . 74
-- 68 -- 5 10 94 -- 50% 78 50% 69
S-16 69 1 3 8 97 107 %' 7981 50% 7082
50% 50% 71S-17 70 4 4 8 !01 106-111 _7 85
S-18 71 4 2 10 103 112-115 _% 87 50% 72, 88
50% 92 50% 73S-19 72 4 5 9 108 116-119 94 93
-- 73 -- 2 7 110 -- 50% 94 50%96 95 74
_S-21 50% .... 50%S-21.E 74 l, 1;1 2 , 7 112 120-121 98 96 97 75
S-22 75 1 2 6 114 122 15000% 98 50% 7699
S-20 76 1 2 5 116 123 10502°/° lO010150% 77
P..8. 77 8 2 11 118 124-131 15004°/'° 102 10350% 78
50% 109 1_0°/o 79S-23 78 4 7 8 125 132-135 111
29

Table2-4 FILM BUDGET ACTUAL (Continued)
Z
EVENT TOTAL FRAMES
(FRAMES) ACCUMULATED FRAME NUMBERSRESULTINGREADOUT
_: _ _ SEQUENCES Q
_..9 ,-- _ = _ ._. _ WIDE Z_
_ _ _ '_ "_ [--,_ _,,-,*"_!_a_=__ -_ ,_["_ _ TELE - ANGLE & TELE-O _ _ _ _ !X_ _ _ _ PHOTO TIME PHOTO
a. _ _z ,u__ _ m a, _ CODE o
S-24
P-9a
P-9b
P-gc
S-25
S-26
P-10
S-27
S-28
P-11
P-12h2
P-12_
P-12b.1
P-12c
S-29
S-30
S-30
S-31
79 1 4 5 129 136 50% 113 50%115 114 8050% 50%
80 8 4 9 133 137-144 119 117 118 81
81 8 5 12 138 145-152 15204_ 122 50% 82123
82 8 2 18 140 153-160 50% 50%126 124 125 83
83 1 5 14 145 161 50% 50%131 129 64130
84 1 6 9 151 162 50% 50%137 135 136 85
85 _ 2 7 153 50% 50%-- 139 137 138 86
86 8 6 9 159 163-170 50% 50%145 143 144 87
87 1 3 7 162 171 1_ °/° 146 50% 8814788 1 4 4 166 172 50% 50%
150 15-]- 89152
89 8 3 9 169 173-180 50% 153 50%155 154 90
90 4 9 4 178 181-184 16_% 162 50%163 91
91 16 4 16 182 185-200 50% 166 50% 92• 168 167
92 4 8 12 190 201-204 500/0 174 50% 93176 "173
93 8 5 15 195 205-212 50% 179 500/o 94181 180
94 1 2 14 197 213 50% 181 50% 95183 182
95 _ 5 9 202 -- 50% 186 50% 96188 187
50% 190 50% 9796 1 4 6 206 214 192 191
50% 189 50% 9796 1 3 7 205 214 19! 190
97 1 2 6 207 215
BIMAT CUT
30

LAUNCH DATE
(GMT)
February 2-3,1967
4
5
6
7
8
Table 2-5:MISSION LAUNCH PERIOD AND WINDOWS
NOTES:
LAUNCH ASIMUTH
RANGE
(degrees)
73.7-82.8
76.5-87.2
80.2-94.1
84.5-103.2
92.5-114.0
90.0-114.0
LAUNCH WINDOW
(GMT)
Begin End
23:31"-01:16
00:25 -02:12
01 :II -03:07
01:52 - 04:0202:54 -04:58
02:33-05:07
1. For the first 5 days in the period, launches at times earlier
than those indicated (more northerly launch azimuths) may
be possible if transit time is adjusted at midcourse to satisfy
the arrival time constraint,
LAUNCH WINDOW
(hrs,Min)
1 45
1 47
1 56
2 10
2 04
2 34
. AFETR tracking and telemetry coverage commitments are
not included. Consideration of this constraint may causefurther reduction in the launch windows.
*P-9A Mission Window
On completion of Bimat cut, final readout
was initiated. During this phase, in which
the hangup preventive procedure was em-
ployed, only isolated incidents of the film
advance anomaly were observed.
Final readout progressed normally until
Orbit 149.Upon attempting initiationofread-
out at thistime, an anomalous cessationof
readout electronicsoperation was observed.
Simultaneously, telemetry indicated the oc-
currence of nonstandard logic stateswithin
the photo subsystem, accompanied by ab-
normal power loading and thermal condi-
tions. Corrective commands were trans-
mitted as indicated by real-time analysisof
availabledata, and readout was re-initiated.
Readout capability was found operational,
but itwas subsequently found that film ad-
vance from the readout looper to the supply
reel was not operable. Readout of additionalfilm was therefore limited to the four-frame
capacity of the readout looper. Numerous
experiments were run attempting to regain
the film advance capability, but the anomaly
persisted. The primary mission was then
terminated with readout of spacecraft film
approximately 75% complete.
2.1.22 Nominal Mission
Trajectory and Orbit Parameters
For planning purposes, a nominal mission
was designed based on a specific launch timewithin one of the six windows of the launch
period of February 2 through 11, 1967. All
launch windows within the period are sum-
marized in Table 2-5. Significant trajectory
31

and orbit data parameters for the P-9A mis-
sion plan follow.
Launch
Launch Date and Time: Day 34 t Feb.
31,1967; 00:22:09 GMT
Launch Azimuth : 78 degrees
Earth Parking Orbit Coast Time: 6
minutes, 45.0 seconds
Cislunar Trajectory
Injection Time: Day 34 (Feb. 3), 1967;00:39:01 GMT
Injection Location: 25.11 ° N; 24.32 ° W
Transit Time: 91.954 hours
Lunar Arrival
Date and Time of Closest Approach:
Day 37 (Feb. 6), 1967 ; 20:36:14 GMT
Inclination of Approach Hyperbola:
19.33 degrees
Perilune Altitude of Approach Hyper-bola: 862 km
Lunar Orbit Injection
Injection Time: Day 37 (Feb. 6), 1967;20:25:31
Lunar Location of Injection: 18.96°N;43.26 ° E
Altitude of Injection Point: 1057 km
Plane Change: 13.04 degrees
AV: 811.0 meters per second
Initial Ellipse
Apolune Altitude : 1850 kmPerilune Altitude: 200 km
Inclination: 21.00 degrees
Period: 3 hours, 37 minutes, 13 seconds
Longitude of Ascending Node at Injec-tion: 20.25 ° W
Argument of Perilune at Injection:
174.49 degrees
Longitude of Sun at Injection:144.74 ° W
Orbit Transfer
Transfer Date and Time: Day 43 (Feb.
12), 1967; 16:32:43 GMT
Lunar Location of Transfer: 0.76 ° S;101.41 ° W
Altitude of Transfer Point: 1838 km
a V : 26.10 meters per second
Final Ellipse
Apolune Altitude: 1838 kmPerilune Altitude: 59 km
Inclination : 21.00 degrees
Period : 3 hours, 28 minutes, 15 seconds
Longitude of Ascending Node at Trans-fer: 99.43 ° W
Argument of Perilune at Transfer:
177.93 degrees
Longitude of Sun at Transfer: 144.08 ° E
2.1.2.3 Photo Data AcquisitionAll photos were scheduled subsequent to
orbit transfer with the VIH sensor on. In the
majority of cases the primary sites were
scheduled to be photographed using the fast
repetition rate, with multiple sequences of
4, 8, or 16 frames. Often a primary target con-
sisted of sequences exposed on two or three
consecutive orbits, For secondary sites eitherone or four frames were scheduled. With one
exception, a three-axis spacecraft maneuver
was required for each site. The location of
primary and secondary sites ensured that at
least one exposure would be made in any 8-
hour period. This precludes the possibility
of improper film advance distances which
might otherwise result from the film assum-
ing the shape of system rollers and thereby
inhibiting the proper operation of friction
drive mechanisms. The photographic plan
also included an ll-frame film advance just
prior to photography of the first site, to ad-
vance the leader-to-film splice from the sup-
ply reel to the takeup reel. Provisions were
also made to minimize the time the film splicewas under tension.
Processing was planned in accordance with
previously established operating constraints.
To avoid processing degradation resulting
from Bimat dryout, at least two frames of
processing were scheduled for every orbit
32

(catastrophic failure could result from fail-
ure to process at least two frames every 15
hours). Processing was limited to the period
beginning 5 minutes after sunrise and ending
5 minutes before sunset. Since the length of
processing periods dictated which exposures
were available for priority readout, process-
ing periods were scheduled to permit readout
of high-priority photos.
Priority readout was planned for almost
every orbit from initiation of photography
through completion of processing. In addition
to previously established readout constraints
contingent on temperatures, signal strength,
and power levels, new constraints were estab-
lished on TWTA operation as a result of analy-
sis of Mission II TWTA failure. Approximate-
ly 11 days were allocated for final readout of
all spacecraft film subsequent to Bimat cut.
2.2FLIGHTCONTROL
2.2.1 Mission Control
Mission control activities are those required
to integrate such operational areas as SPAC,
FPAC, DSS, and data systems into a func-
tional unit to successfully meet flight plan
objectives.
Mission control procedures and personnel for
Mission III were in major respects similar tothose of Mission II.
The on-line direction of mission operations
was performed by the assistant space flight
operations director (ASFOD). The position
was staffed in a dual capacity (ACE-2,
DEUCE-2) during all mission operation per-
iods (except for the final readout phase, when
only the ACE-2 position was manned). The
major problem area encountered was the dif-
ficulty in maintaining close liaison with such
areas as SPAC at critical periods. This con-
dition will be alleviated prior to Mission IV
by procedural changes.
The command coordinator position was oc-
cupied by experienced personnel and no
significant difficulties were encountered.
Mission event coordinator activities were
performed similarly to Mission II in an effi-
cient, trouble-free manner. Close adherence
to the flight plan precluded extensive revi-
sions to the sequence of events document
(SEAL). A total of 21 issues was made
throughout the mission. The DSS sequence of
events underwent minor changes prior to
Mission III to improve the teletype scripts
and reduce transmission time. No problemswere encountered.
2.2.2 Spacecraft Control
The following paragraphs describe the com-
mand programming and photography con-trols that were established to meet the re-
quirements of the flight plan (reference
Section 2.1) Procedural changes subsequentto Mission II were minimal due to the simi-
larity of Mission III to earlier flights, and
consisted primarily of improvements and re-
finements to proven methods as a result of
flight experience The organizational struc-
ture remained unchanged. This section dis-
cusses personnel activities involved in the
implementation of these controls, and in-
cludes recommendations for increased effec-
tiveness in future missions.
2.2.2.1 Command Programming
Summary--As of 15:30 GMT on March 2, a
total of 3615 commands had been prepared,
transmitted to Lunar Orbiter III, and prop-
ly executed by the flight programmer. Pro-
cedures used in command preparation were
the same as those followed in Mission II. In
general, command activity proceeded
smoothly and on schedule. However, an im-
proper sequence of commands did result in
loss of the time code on Site IIIP-I photos.
33

Premis._ion ,4ctivity'---A core map plan defining
the contents of each core map and the loading
schedule during photography was prepared
for overall coordination of command activity.
Some operational problems were encoun-
tered during Mission III:
• Too many methods of command direc-
tion;
Countdown and Mode 2 commands for Mis-
sion III had been prepared and sent to the
appropriate stations during the final readout
phase of Mission II. Launch plan commands
were sent to DSS-71 during Mission III train-
ing.
Sending commands to the DSS only after
the final command conference;
Delaying the start of final command
conferences until FPAC was ready to
present a command update;
Mission Activity--Command preparation was
conducted in essentially the same way as
during Mission II, with two command pro-grammers per team. A conference room for
their uninterrupted use resulted in better
coordination of efforts and greater flexibility
in dividing tasks among the programmers.
An improper sequence of commands result-
ed in loss of time code data on Site IIIP-1
photos. The sequence for Sites IIIP-1 and
IIIS-i photography was revised by SPAC di-
rective to replace the stored-program com-
mand with a real-time command to change
the shutter speed between those sites. There
was an interval of 3 minutes, 38.8 seconds
between the camera-on times of IIIP-1
and IIIS-1. Allowing about 45 seconds for
IIIP-1 photography and 52 seconds of V/H
sensor operation prior to IIIS-1, there re-mained about 2 minutes in which to execute
the real-time shutter speed change. To pro-
vide the 2-minute transmission window, two
"wait time" commands immediately afterthe first "camera-on" command were re-
placed by a "compare time" command. This
decision was made without recognition that
a "wait time" was necessary to obtain the
time code. With the targets so close together
it was, in fact, not feasible to implement a
real-time shutter speed change.
• Scheduling of real-time command acti-
vity during flight programmer loadingtransmission windows.
The first problem caused a moderate amount
of confusion in command preparation. There
were too many kinds of directives (mission
directives, operations directives, and SPAC
directives) and they were too frequently
allowed to substitute for a command prepara-tion directive. Some of these directives were
received too late to permit adequate study of
the impact of the directive or of the command
preparation requirements. The loss of the
IIIP-1 time code discussed above was a con-
sequence of this tardiness.
The latter three problems unnecessarily
jeopardized the transmission of commands
in a timely manner As soon as the command
programmer has informed the SPAC direc-
tor that he is ready to support the final com-
mand conference, the assistant SFOD should
authorize sending the commands to the DSS.
This avoids a delay in initiating command
transmission to the spacecraft after the
commands are approved and also obviates
the possibility of a computer failure prevent-
ing the commands from getting to the DSS.
During the L.O. III mission, the final com-
mand conference was delayed several timesbecause FPAC had announced that a com-
34

mand update was forthcoming. As a result,the command transmission windows were
frequently cut into. The conference should
always start no later than the scheduled time
so that command transmission is not held up.
Real-time command activity for attitude
reference updating was scheduled duringcommand transmission windows. In two in-
stances, the start of transmission of a map
was delayed until completion of the attitude
updating. Once, this resulted in the trans-
mission window closing before the complete
map had been transmitted. As a result, the
command sequence had to be reprogrammed,
the command generation program rerun, anda new transmission window scheduled. Real-
time command activity at such times should
be avoided In future missions, attitude up-
dating will be scheduled in the mission se-
quence of events whenever possible.
Photo Control--For data on photographiccontrol during Mission III refer to Volume IIof this document.
2.2.3 Flight Path Control
From launch through completion of photo-
graphic readout, maintaining control of the
spacecraft trajectory (or flight path) is the
responsibility of Flight Path Analysis and
Command (FPAC). Responsibility for con-
trol of the mission from pre-launch checkout
through about launch plus 6 hours belongs to
the DSN FPAC. After the spacecraft has
been acquired and is supplying good tracking
data to the SFOF (about launch plus 6 hours),
the DSN FPAC team is relieved by the proj-
ect FPAC team. At this point the project
FPAC team assumes the responsibility for
flight path control for the remainder of the
mission. Within both teams the tracking data
analysis function is carried out by JPL ana-
lyst. A description of the two FPAC teams is
contained in the Mission I final report, BoeingDocument D2-100727-1.
Flight path control by the FPAC team entails
execution of the following functions.
1 ) Tracking Data Analysis--( 1) Monitoring
and passing judgment on the quality of
the incoming radar tracking data (dop-
pler and range). This raw tracking data
is the sole link between the spacecraft
and FPAC, and is the basis for determi-
nation of the current position and veloc-
ity of the vehicle. (2) The preparation of
tracking predicts to support the DSS in
spacecraft tracking.
2) Orbit Determination--A process of find-
ing a trajectory that best "fits" the
tracking data. This includes the tasks
of editing the raw tracking data into a
form acceptable to the orbit determina-
tion computer program (ODP), and sub-
sequent operation of this program to
obtain that trajectory best fitting the
data--usually a lengthy task that con-
sumes large blocks of computer time.
3) Flight Path Control--When the orbit
determination process yields a trajec-
tory, the flight path control function isinitiated to determine the need for a
corrective maneuver or the design of a
planned maneuver. Thus, this function
is principally one of guidance, control,
and prediction.
FPAC executes these functions to design
maneuvers that will best achieve the objec-
tives of the nominal flight plan that is fur-
nished to FPAC by the mission design group
and provides the criteria, ground rules, and
constraints that must be observed in any
manueuver design. The computer programs,
or FPAC software system, used for maneu-
ver designs is identical to that used during
Mission I, with the exception of some inter-
nal modifications to individual programs. A
description of the FPAC software system is
contained in the Mission I final report, Boe-
ing Document D2-100727-1.
35

p
From a trajectory point of view, the mis-
sion can be subdivided into the following
phases.
1)Countdown, Launch, and Acquisition
2)
Phase--Covers the period from FPAC
entry into the countdown through DSN
acquisition of the spacecraft and subse-
quent handover from DSN FPAC team to
Project FPAC team.
Injection through Midcourse--From
completion of the second Agena burn
through completion of the midcourse
maneuver. This phase overlaps the ac-
quisition portion of the previous phase.
31 Midcourse through Deboost--From end
of midcourse burn through completion
of the deboost maneuver.
4_ Initial Ellipse--From end of deboost
burn through the transfer maneuver.
5) Photo Ellipse--From end of transfer
burn through completion of photo read-out.
Table 2-6 lists the principal FPAC events andtheir times of occurrence (GMT) within these
phases. The orbit determination and flight
path control functions executed in these
phases will be discussed in the following sub-sections.
Table 2-6: TRAJECTORY SEQUENCE OF EVENTS
Launch and Acquisition
Feb. 4, 14:00 FPAC
Feb. 5, 01:17
Feb. 5, 01:25
Feb. 5, 01:36
Feb. 5, 02:35
Feb. 5, 04:35
begins prelaunch
checkout of software sys-tem.
Launch
Agena first burn com-
plete. Start 578-sec coast.
Agena second burn com-
plete. Cislunar injection.
First DSS-41 two-way
doppler data.DSN FPAC hands over
control to Project FPAC.
Injection through MidcourseFeb. 5, 06:15 Calculated
Feb. 5, 10:30
Feb. 6, 05:45
3.8 m/secmidcourse for execution
at cislunar injection plus
20 hours, 5.4 m/sec at plus40 hours.
Selected midcourse ma-
neuver time of Feb. 6,
15:00
Calculated 5.11 m/sec
midcourse for execution
Feb. 6, 15:00
Midcourse through
Feb. 7, 04:20
Feb. 8, 07:30
Feb. 8, 21:54
Initial Ellipse
Feb. 8-, 23:15
Feb. 12, 16:00
Feb. 12, 18:13
Photo EllipseFeb. 12, 22:00
Feb. 15, 10"01
Feb. 23, 02:11
Mar. 3, 07:17
at Feb. 6, 15:00Start midcourse burn.
Deboost
Determined second mid-
course not required.
Completed design of de-boost maneuver.
Start injection burn.
Obtained first post-de-boost orbit determination
(OD No. 4102).
Completed design oftransfer maneuver.
Start transfer burn.
Obtained first posttrans-fer orbit determination
(OD No. 5302).
Start of photography.
End of photography.Termination of readout.
NOTE : All times are in GMT.
36

2.2.3.1 Countdown, Launch, and Acquisition
Project FPAC entered the countdown proce-dure at launch minus 5 (T-5) hours on Febru-
ary 4, 1967. Check cases of the project FPAC
user programs were run on both computer
strings. These were completed at T-4 hours
on the project IY) and DSN iX) strings. No
problems were encountered on either string.
Frequency reports from ETR (DSS-71) were
received on schedule and frequency para-
meters were supplied to the real-time com-
puter system (RTCS) for DSIF predicts. All
liftoff predicts programs (PRDL) cases were
run as required.
Launch occurred on Feb. 5 at 01:17:01:12
GMT at a launch azmuth of 80.8 degrees.
Table 2-7 lists the major powered-flight
events ("Mark events") from liftoff through
completion of Agena retro.
The early orbit determination results ob-
tained by project FPAC, DSN FPAC, and
the RTCS of AFETR, all projected to lunar
encounter, are shown in Figure 2-1.
Three hours after liftoff, spacecraft acquisi-tion was verified. FPAC control was then
handed over to the project by the DSN.
DSIF stations used for tracking during Mis-
sion III were:
STATION STATION IDENTIFICATION
Goldstone (ECHO) DSS-12
Woomera DSS-41
Johannesburg DSS-51Madrid DSS-62
Table 2-7:
Mark
0
1
2
3
4
5
6
7
8
9
10
II
12
13
14
15
16
POWERED-FLIGHT
Event
Liftoff Feb. 5,
Atlas Booster Engine Cutoff (BECO)
Atlas Booster Engine Jettison
Start Agena Secondary Timer
Atlas Sustainer Engine Cutoff (SECO)
Start Agena Primary Timer
Atlas Vernier Engine Cutoff (VECO)
Shroud Separation
Atlas-Agena Separation
Agena First Ignition
Agena Shutdown (Parking Orbit Injec-
tion)
Agena Second Ignition
Agena Second Shutdown (Cislunar Injec-
tion) IAgena-Spacecraft Separation
Begin Agena Yaw
End Agena Yaw
Agena Retro Rocket Fire
TRAJECTORY EVENTS
Actual Time (GMT)
01:17:01.12
01 : 19:10.83
01:19:13.70
01:21:31.68
01:21:49.80
01:21:58.48
01:22 :10.48
01:22:12.58
01:22 :14.68
01:23 :12.76
O1:25:48.55
O1:35:26.80
01:36 :55.50
01:39 :39.67
01:39:42.6
01:40:42.6
01:55:39.7
37

J-10
INCH VEHICLE 3 _ DISPERSION
_- IMPACT BOUNDARY
102MOON 104
\
10 20 30
I IOOOO 0100" j'*-'- DAY 040--
Figure 2-1" Early Orbit Determination Results
2.2.3.2 Injection through Midcourse
Events during the injection through mid-
course phase of the mission followed the
premission plan. No anomalies were encoun-tered.
Orbit Determination--Table 2-8 shows the
chronological sequence of the lunar encoun-
ter parameters obtained from the six projectorbit determinations performed before mid-
course. Final design of the rnidcourse maneu-
ver used OD 1216, which was based on 24.5
hours of two-way lock doppler data from
DSS -12, -41, -51, and -62. The fit of the doppler
data to the orbit solution was excellent.
Range unit data was available during this
data span but was used only as a check and
was not included in the data fit. Range unitresiduals were on the order of 200 meters.
(Appendix B, Volume VI of this document
contains the inflight orbit determinationresults. )
Midcourse Design and Execution--Within 2
hours after cislunar injection, projected
lunar encounter parameters (see Figure 2-1)
indicated that the second Agena burn had re-
sulted in a trajectory well within the mid-
38

Table 2-8 PRE-MIDCOURSE ORBIT DETERMINATION
ENCOUNTER PARAMETER SUMMARY
Orbit B.T _ B.R Timeof Closest Approach
Solution (kin) (km) (GMT)
1102"
1104"*
XX06
1208
1210
1312
1114
1115
1216
1218
Nominal
Aimpoint
4864.7 -1937.3 Feb. 8, 21:39:01
5108.4 -1885.3 21:47:52
This number was skipped5068. -1813.0 21:46:40
5074. -1809.0 21:46:49.6
5048.3 -1768.5 21:47:03.8
5075.2 -1813.1 21:46:53
5075.4 -1795.2 21:46:54.2
5076.8 -1801.0 21:46:53.9
5076.5 -1803.8 21:46:54.3
5590. -2460.0 22:06:00
This very early solution was based on
only 20 minutes of DSS-51 tracking.
This early solution was based
hours of DSIF tracking; subsequent
solutions used longer tracking arcs.
on 1.67
course capability of the spacecraft. It also
became apparent that although a midcourse
maneuver would be required, midcourseexecution time would not be critical and an
early midcourse would not be necessary.
The criteria used in designing the midcourse
maneuver were:
1) Delay the maneuver as long as practi-cable to minimize the effect of mid-
course execution errors on lunar en-
counter conditions ;
2) Perform the first midcourse maneuver
at least 50 hours before orbit injection
to allow time for a second midcourse;
3) Minimize the AV required for lunar el-
lipse injection (deboost), transfer, andmidcourse with a maneuver at the
selected midcourse time.
OD 1208, based on 2.5 hours of tracking data,became available within 5 hours after cis-
lunar injection. This OD solution was used for
a study of midcourse execution time, correct-
ing both the time of flight to the nominal en-
counter time (February 8, 22:06:00GMT),
and the miss parameter (B.T and B.R) to
those computed in the midcourse targeting
program. Figure 2-2shows the resultsof this
study.The midcourse maneuver could easily
39

A
LJ
><]
14.1
OUm
6
5
4
m
STA12 I [ STA62
I _A4_ I
Mkk:ourse Design toCorrect Miss ParametersAnd Time of Arrival
Note :
LU
_3LUU')a_
0UC3w
LId
5UI&J
X
2200 0000 0200 0400 0600 0800 1000 1200 1400DAY 036 = I_I - DAY 037
MIDCOURSE EXECUTION TIME (GMT)
STA 12 3
1600 1800
Figure 2-2: Effect of Midcourse Time on aV Required
4O

be delayed until 40 hours after cislunar in-
jection without requiring excessive aV for
the maneuver.
Optimization of deboost, transfer, and mid-
course aV is done automatically by the FPAC
software programs for a given midcourse
45
4O
35
3O
iiU?m
uu 25 u-q'_ U"
c
><_ 20Ill
OU
15 •
10 "
execution time and specified lunar encounter
time. By varying the arrival time for a se-
lected midcourse execution time, it is possible
to minimize the total aV for midcourse, de-
boost, and transfer. The results of this analy-
sis are shown in Figure 2-3 for a midcourse
.
o
Figure 2-3'
Note : Based on a Midcourse Maneuver
at Day 037 1500 GMT 1967
mI--
Jiv
<I&l
,qn
<
<
IH
I I I
2100 2200 2300 0O00
DAY 039 = _i
ARRIVAL TiME (GMT)Effect of Time of Arrival on Midcourse 4V Requirement
OlOODAY 040
41

executed at approximately 37.5 hours after
cislunar injection. The minimum AV in this
case is obtained by correcting the arrival
time to the earliest allowable time. On the
basis of the data contained in Figures 2-2
and 2-3, it was decided to correct the time of
arrival to the nominal arrival time with a
first midcourse maneuver executed approxi-
mately 37.5 hours after cislunar injection.
The execution time, February 6, 15:00 GMT,
was chosen on the basis of desirable two-
station viewing during and after the burn.
DSS-12 viewing began 18 minutes before
engine ignition to overlap with DSS-62.
A backup first midcourse maneuver
for February 6, 21:00 GMT, was also designed
but was not needed.
The midcourse maneuver specified by FPAC
was:
sunline roll = 39.94 degrees
pitch = 123.39 degreesAV = 5.11 m/sec.
ignition time = February 6, 15:00:00 GMT
This attitude maneuver was selected from
12 possible two-axis maneuvers on the basis
of (1) maintaining Sun lock as long as pos-
sible, (2) viewing DSS line-of-sight vector
not passing through any antenna null regions,
and (3) minimizing total angular rotation.
OD 1216 was used for the midcourse final
design.
Midcourse targeting resulted in the following
set of encounter parameters. The preflight
nominal and pre-midcourse values are also
given. These data are presented graphically
in Figure 2-4.
Figure 2-5 shows Earth-Moon-spacecraft
geometry at the time of the midcourse ma-
neuver, and direction of the desired velocity
change. Engine ignition occurred at Febru-
ary 6, 15:00:00 GMT and the engine burned
for 4.3 seconds, resulting in a doppler shift
of 55 cps. The doppler data observed during
the burn indicated a nominal burn as shown
in Figure 2-6.
ENCOUNTER PARAMETERS
B.T (Km)
a_
B.R (Km)
TCA (GMT)
V (km/sec)
Nominal
(Preflight Design)
5590.
-2460.
Feb. 8,22:06:00
0.8204
I
Pre-Midcourse
(Actual)
5077.
-1801.
Feb. 8, 21:46:53.9
0.8227
Post-Midcourse
(Maneuver Design)
5604.6
-2465.2
Feb. 8, 22:06:00
0.8188
42
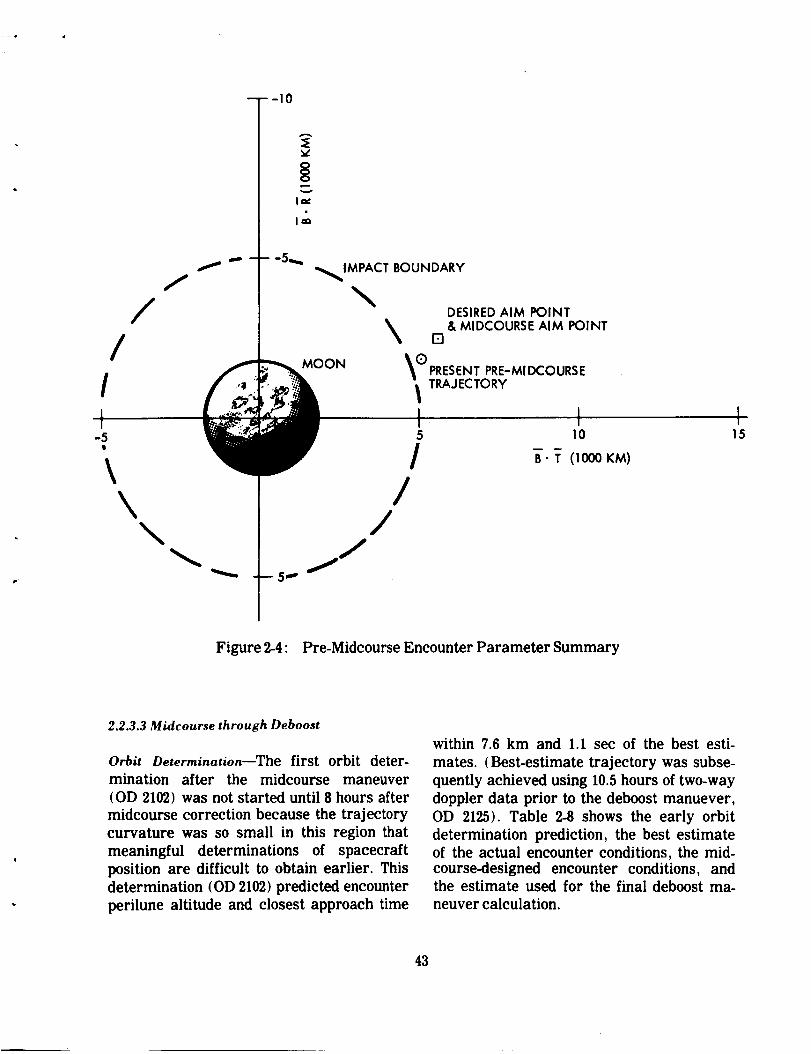
--- -10
f
/II
f
i_.
iI
--5 _
\
_IMPACT BOUNDARY
\DESIREDAIM POINT
X & MIDCOURSE AIM POINT[]
QMOONPRESENTPRE-MIDCOURSE
"_ TRAJECTORY
t !5 10
B- T (1000 KM)
I15
Figure 2-4: Pre-Midcourse Encounter Parameter Summary
2.2.3.3 Midcourse through Deboost
Orbit Determination--The first orbit deter-
mination after the midcourse maneuver
(OD 2102) was not started until 8 hours after
midcourse correction because the trajectory
curvature was so small in this region that
meaningful determinations of spacecraft
position are difficult to obtain earlier. This
determination (OD 2102) predicted encounter
perilune altitude and closest approach time
within 7.6 km and 1.1 sec of the best esti-
mates. (Best-estimate trajectory was subse-
quently achieved using 10.5 hours of two-way
doppler data prior to the deboost manuever,
OD 2125). Table 2-8 shows the early orbit
determination prediction, the best estimate
of the actual encounter conditions, the mid-course-designed encounter conditions, and
the estimate used for the final deboost ma-
neuver calculation.
43
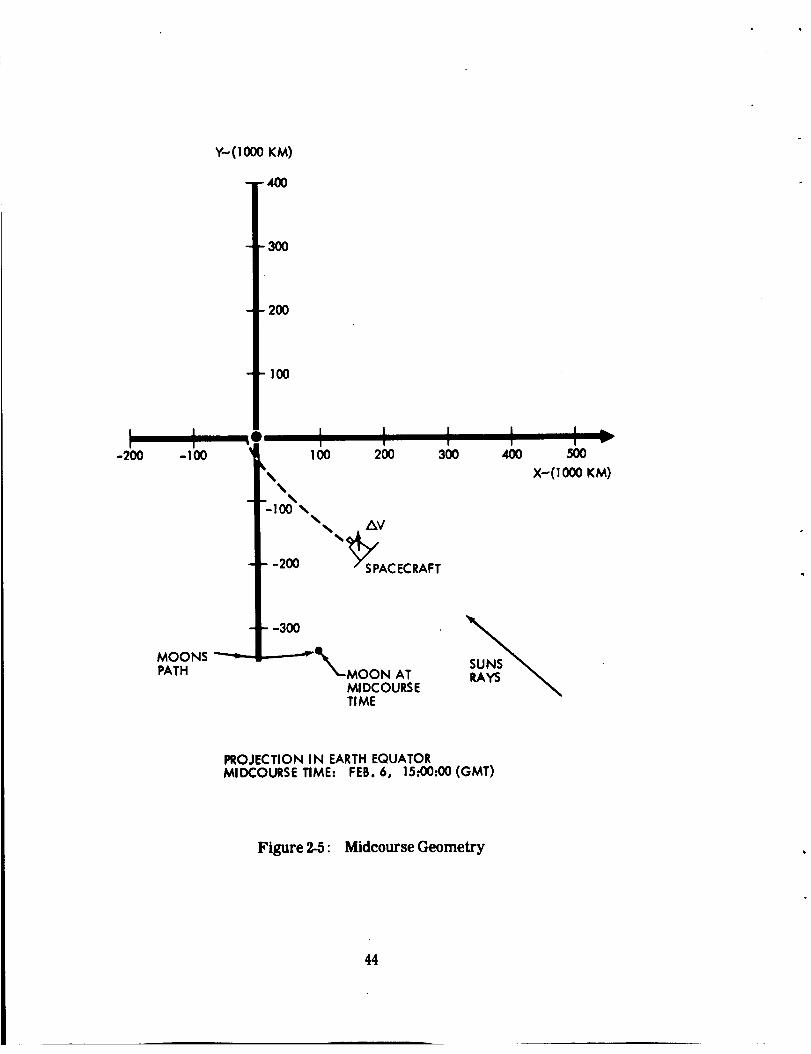
Y-,(I 000 KM)
-400
I-200
I-100
300
2OO
100
I I I100 200 300
\
-100
_V
-200 CECRAFT
v
5OO
X_(1000 KM)
MOONS_TH
-3OO
MOON ATMIDCOURSETIME
PROJECTION IN EARTHEQUATORMIDCOURSE TIME.. FEB. 6, 15:00:00 (GMT)
Figure 2-5: Midcourse Geometry
44

v
Z
OU
a,.Q.Oa
1019450
1019440
1019430
1019420
1019410
1019400
1919390
1019380
1019370
PREDICTEDDOPPLERo ACTUAL DOPPLER
VIEWING STATION DSS62
1454 1455 1456 1457 1458 1459 1500 1501 1502 1503 1504 1505
DAY 037 (GMT)
Figure 2-6" Midcourse Doppler Shift
45

ENCOUNTER CONDITIONS
ElementsMidcourse 1st OD
Designed (OD 2102)
Perilune Air i tude (km) 2224.7 2237.1
Time of Closest Approach 00.0 05.739:22:06 GMT
13.'r. (km) 5604.6 5620.3
13.R (km) 2465.2 -2477.2
13 (km) 6122.8 6142.0
Final Deboost Best
Calculation Estimate
(OD 2212) {OD 2125)
2237.3 2229.5
22.2 04.6
5618.9 5607.1
-2462.4 -2478.7
6149.2 6130.5
The above table shows that the orbit determi-
nation used for the deboost maneuver calcu-
lation (OD 2212) predicted perilune altitude
7.8 km too large and time of closest approach17.6 seconds too late. These errors are on the
order of 10T comPared to expect uncer-
tainties. Examination of the other real-time
orbit determinations indicates that this orbit
determination is competitive with regard to
perilune altitude error but the time of closest-
approach error was significantly larger thanfor the other determinations.
OD 2212 was chosen over the other determi-
nations available at the time for the follow-
ing reasons :
1) The determination fit the 37 hours of two-
way doppler data after midcourse verywell.
2) This determination predicted a value of
13.q' that was consistent with the previ-ous determinations.
There were two factors that introduced some
uncertainty into the choice of this determina-
tion:
1) The range unit residuals were on theorder of 4 km.
2) The time of closest approach changed
from the neighborhood of 22:06:06 to22:06:22.6.
The range residuals mentioned abovedeserve some discussion. A serious effort
was made during this mission phase to use
the range unit data generated by DSN, in-
cluding it as a data type in the orbit deter-
mination fits on a weighted equivalent basis
with the two-way doppler data. In the early
determinations (up to midcourse +24 hours),
this technique was fairly successful. A very
good fit onthe ranging data could be obtained
and an acceptable fit on the doppler data
was obtained. However, as more, data was
added, particularly with the amount of data
included in the OD 2212 determination (37
hours), the fit of the doppler and ranging data
deteriorated markedly. It was decided at
that point not to use the range data in the fit
but to rely exclusively on the two-way dop-
pler. This was the philosophy followed in
OD 2212. Operational procedures have been
modified to preclude this problem in thefuture.
Several hours before the deboost maneuver,
a set of engine-burn doppler predicts was
46

computed.This computation used the deboost
maneuver orbit determination and the pre-dicted nominal orbit conditions after the
engine burn. These predicted doppler data
were plotted in the region of the burn. The
actual doppler shift data were plotted on the
same curve during the maneuver from the
incoming raw TTY data, Figure 2-7.
Deboost Design and Execution--The deboost
maneuver was executed February 8 at21:54:19 GMT and concluded the cislunar
cruise portion of Mission III by injecting the
spacecraft into the initial lunar ellipse.
OD 2212, based on 37 hours of tracking data,
was used for the design of the deboost maneu-
ver. The design philosophy was to guide the
spacecraft from its approach hyperbola into
an ellipse such that the ellipse inclination and
apolune altitude resulted in the preflight
nominal values. Attention was also given to
holding the remaining ellipse parameters--
ascending node longitude ( _ ), argument of
perilune (_,), and perilune altitude (hp)--as close to nominal as possible. The Boeing
C-2 lunar harmonics were used during the
deboost maneuver design.
The elements of the designed initial ellipse
1OOOO
9OO0
8OOO O
8 7oo0
6o00
m
O ACTUAL DOPPLER
5000 O VIEWING STATION DSS 12
4OOO
2146 2148 2152 2156 2200 2204 2208
DAY 039 (GMT)
Figure 2-7: Deboost Doppler Shift
47

and the preflight nominal values are given
below:
Element Design Nominal
h a (km) 1849.97 1850.00(km) 213.38 200.00
h In (deg ) 21.05 21.00
,_ (deg) 176.22 176.22
ft (deg) 311.70 311.16
Time 2/8/67 22:03:19.6 22:39:7.2
The engine ignition was designed to occur atFeb. 8, 21:54:19 GMT. The required maneu-ver was:
roll 30.88degrees
pitch -125.88degrees
A V 704.3m/sec
The attitude maneuver was selected from the
12 possible two-axis maneuvers on the basis
of (1) maintaining Sun lock as long as pos-
sible, (2) DSS vector not passing through any
antenna null regions, and (3) minimum total
rotation angle.
A series of fly-by maneuvers was al so d e-
signed to be used in the event of engine failureat deboost. These maneuvers consisted of an
initial three-axis attitude maneuver to point
the camera axis along the local vertical at
a time when the Moon fills the wide-angle
camera frame, about 70 minutes after the
intended deboost. Then five consecutive pitch
maneuvers followed with the exposure of
seven frames, the last of which was to occurwhen the Moon filled the narrow dimension
of the telephoto frame, at about 9 to 10 hours.
Finally, a three-axis maneuver would be per-
formed to expose a photo of the Earth and theMoon at 9 to 10 hours after the intended de-
boost. At least 45 minutes was allowed be-
tween the time to start deboost and the time
at which the fly-by sequence would have had
to be initiated. This would have allowed a
maximum length of time to attempt to ignite
the engine, had a problem been encountered.
The deboost attitude maneuver was com-
pleted 10 minutes before engine ignition.
The actual engine burn occurred at Feb. 8,
21:54:19.0 GMT and the burn lasted for 542.5
seconds, producing a doppler shift of 2725
cps. See Figure 2-7 for a plot of the doppler
data during the deboost maneuver.
The geometry at maneuver time is shown in
Figure 2-8. At Feb. 8, 20:51 GMT, Station 41
rose to begin the two-station view period with
Station 12. Engine ignition occurred 63
minutes later. View of the spacecraft from
DSS-12 and -41 was occulted by the Moon 21minutes after thrust termination.
Inspection of the early initial-ellipse orbitdeterminations indicated that the orbital
elements resulting after the burn were not
exactly those predicted in the deboost design.
The differences were greater than had been
witnessed in Missions I and II.
2.2.3.4 Initial EllipseOrbit Determination--Immediately following
doppler shift monitoring during the deboost
maneuver, incoming tracking data was
logged and edited in preparation for a quickdetermination of first-orbit elements. The
objective was to ensure that the stations
would promptly reacquire the spacecraftwhen it emerged from behind the Moon. It
was necessary to determine the new orbit,
calculate a set of DSS doppler predicts based
on this determination, and send these pre-
dicts to the station before first emergence of
the spacecraft. The first orbit determination
(4102) was accomplished at deboost + 40
minutes using about 20 minutes of two-stationview. This determination, coupled with the
48

SUN
ULT
(FEB. 8, 2304)G
36 MINUTES
.. "_
-°'41' "" ' '"
F2 MINUTES
23 MI N UTES
2 MINUTES
7 MI NUTES
A SUNSET (FEB. 8, 2133)
B ENGI NE IGNITION
C SUNRISE
D ENGINE CUTOFF
E EARTHSET
F PERILUNE
G EARTHRISEA,
EARTH
PRIMEMERIDIAN
21 MINUTES
ORBITAL GEOMETRYAT DEBOOST
Figure 2-8: Orbital Geometry at Deboost
49

near-nominal deboost doppler shift, gave anindication that the deboost was near nominal.
Station predicts based on this determination
were computed by the DSN but were not
sent to the stations because they agreed with-
in 100 of the nominal predicts. A comparison
of the designed postxieboost orbital elements,
the best estimate of these elements (OD 4312),
and the first orbit determination results (OD
4102) is shown in the following table.
Orbital Elements _ ._ _ -
Perilune Altitude 213.38 210.76 210.26
Apolune Altitude 1849.97 1803.93 180"2.1
Inclination 21.05 20.99 20.94
Longitude of Asc. Node 311.70 311.07 310.33
Argument of Perilune 176.22 176.99 177.3
No difficulties were encountered in the initial
orbit determination.
Orbit determination activities during the 4
days from deboost to transfer consisted of
routine updating of the spacecraft state vec-
tor and support of the orbit transfer maneu-
ver design. A complete set of lunar gravita-tional harmonics was not evaluated in Mis-
sion III as it was during this phase in Mission
I. The procedure that was followed used the
LRC 9/4/66 lunar harmonics as a basic har-
monic set and "tailored" these harmonics
to the particular lunar gravitational field
being experienced by solving for the eight
higher order tesseral harmonics C32, C33,
C43, C44, $32, $33, $43, and $44. This proce-
dure gave a good fit on the data and producedconsistent values of orbital elements. Plots
of the orbital elements determined during
this phase are shown in Figure 2-9. The orbit
determination reports detailing the solutions
are presented in Appendix B, Volume VI of
this document.
Ranging unit data were not used in the fitting
process at any time during this mission phase
but the range unit residuals were consis-
tently displayed as an indicator of orbit deter-
mination quality. The maximum value of
these residuals was approximately 200
meters, which was within the accuracy of the
lunar ephemeris used.
The orbit determination used for the transfer
calculation (OD 4234) used 14.3 hours of two-
way lock doppler tracking data from DSS.12,-41, and -62. The placement of the data rela-tive to the transfer time is shown in the fol-
lowing figure.
20h05 m 10h24 m
OD DATA ARC PROJECTION
(OD 4234) AHEAD
2/11 2/12 FER 16h13m
This determination put the transfer calcula-
tions on a firm footing because the projec-tion to transfer was shorter than the data arc
used. This situation provides a good orbit
determination basis for performing a maneu-ver calculation. Further details of this de-
termination are given in Appendix B.
Several hours before the transfer maneuver,
a set of engine-burn doppler predicts was
computed. This computation used the latest
orbit determination results and the predicted
norminal orbit conditions after the engine
burn. These predicted doppler data were
then plotted in the region of the burn. The
actual doppler shift data were plotted on the
same curve during the maneuver from the
incoming raw TTY data. The resulting curve
(Figure 2-10) showed that the expected
doppler shift was obtained, giving a quickindication that the maneuver was nominal.
5O

ASCENDING NODELONGITUDE (DEG)
310
290 -
270 -
b
In
OO
C_
oO
O
O
I i i I
l.--
ORBITINCLI NATIO N(DEG) 22[21
20 i
O O O O
I I I I
ARGUMENT OFPERILUNE (DEG)
179
178
177O o
O
PERILUNEALTITUDE (KM)
220
210
2OO
O39
Figure2-9:
00
iO4O
0
00
I I I ' I041 042 043 044
DAY (GMT)
InitialEllipseConicElements History
51

990,400
990,300
990,200
990, !00 -
!_ _0,_
_ 989,9OO
I,,-
989,800
989,600
989,500 n
P
18s13..00
THRUSTTERMINA'
Q ACTUAL DOPPLERPREDICTEDDOPPLER
IGNITION
l i I I18t13t30 18sl4_)0 lOz14s30 18:15:00
GMT ON FEB. 12 (DAY 043) 1967
Fi&q_re 2-10: Transfer Doppler Shift
52

Transfer Design and Execution--The primarytask of the flight path control group during
the initial-ellipse phase of Mission III was
the design of an appropriate transfer maneu-
ver. The transfer from initial to photo ellipse
was executed on February 12, 1967, at
18:13:26.6 GMT and resulted in a photo ellipse
nearly identical to the designed ellipse. This
event concluded nearly 4 days in initial orbit
and initiated the principal phase of the mis-
sion: photograph 12 potential Apollo landingsites.
The design of the transfer maneuver was
based on the following round rules.
1) Minimum perilune altitude of 48.0 km;
2) Illumination angles between 60 and 80
degrees at primary targets;
3) Transfer at least 24 hours prior to first
photo;
4) A minimum of 30 minutes between end
of Earth occultation and start of engineburn.
A set of lunar harmonic coefficients
generated by NASA-Langley, designated
LRC 914/66 harmonics, was modified by the
orbit determination group and used during
the transfer design. The maneuver designwas based on a state vector from Orbit De-
termination Solution 4234.
Orbit 26 of the initial ellipse was selected
for the transfer, allowing between 18 and 19
orbit revolutions from transfer to first photo.
As a precaution, a backup maneuver was
also designed. This maneuver was to be
executed only in the event that the prime
transfer maneuver could not be performed.
The backup maneuver would have been exe-cuted two orbit revolutions later than the
prime transfer.
The transfer maneuver was designed by tar-
geting to the three parameters: t l_ perilune
radius tRp); (2) latitude of perilune (_,);and t3) longitude of the ascending node i a ).
To reduce the computer time required for
the search program, the desired values of
the targeting parameters were specified at
the first perilune following the transfer
maneuver. The desired perilune radius,
1792.87 kin, was selected to satisfy the mini-,mum perilune altitude constraint of 48 km
approximately midway through the photo
activity. The desired perilune latitude, 0.596
degree, centers the perilune trace properly
with respect to the photo sites. The desired
longitude of the ascending node, 257.93
degrees, optimizes the lighting angle of the
photo targets. By choosing the transfer true
anomaly of 206 degrees, the apolune radiuswas held at the nominal value and orbit in-
clination changed only slightly. The time of
the maneuver satisfied the tracking time
constraint and the required aV, 50.73 m/sec,
was well below the budgeted 302.0 m/sec.
The attitude maneuvers required to performthis transfer were:
sunline roll 51.74 degrees
pitch 19.86 degrees
Selection of this attitude maneuver sequence
was based on maintaining Sun lock as long
as possible and compliance with antenna
constraints with a minimum of angular rota-tion.
The orbital geometry at the time of transfer
is shown in figure 2-11. The predicted conicelements at the first perilune after the trans-
fer maneuver, Orbit 26, are given below with
the desired nominal values from premissiondesign.
53

TRANSFER
EARTHAND
PRIME MERIDIAN
SUN
PERILUNE
ORBITAL GEOMETRYAT TRANSFERFeb. 12a 1813 GMT1967
Figure 2-11" OrbitalGeometry atTransfer
54

Pretransfer Preflight
l_l_ment Prediction Nominal
Apolune radius 3584.46 km 3578.14 krn
Perilune radius 1792.93 km 1792.87 km
Inclination 20.87 deg 21.05 deg I Seleno-
Argument of perilune 178.33 deg 178.34 deg [ graphic-Longitude of ascending 257.93 deg 257.93 degl of-date
node .l coordinates
All elements above are given for February
12, 19:29:07.933 GMT.
The predicted conic elements before and
after the impulsive transfer maneuver are
given below to indicate the change in each
caused by the maneuver. All elements are
given for February 12, 18:13:43.286 GMT.
]_lement Pretransfer PosttransferRa (kin) 3533.35 3584.53Rp (kml 1954.17 1792.87
, (deg) 20.94 20.87"] Selenographic
,.,(deg) 179.58 178.30 J of-datet_(deg) 258.74 258.64 coordinates
Prior to acceptance of this final transfer ma-
neuver design, various alternative sets of
search parameters were investigated: Rp,
rt,_; Rp, _,, ,;Rp, ,, x;Rp, a, ,;Rp,
period, _. In each case, some conic element
was allowed to deviate to satisfythe search
parameters. No other set of search para-
meters gave resultsas satisfactoryas the set
used in the final design, Rp, j,, _.
Predicted results of the transfer design are
shown graphically in the figures which follow.
Figure 2-12 shows the perilune altitude (re-ferred to the nominal lunar radius of 1738.09
km) as a function of descending-node longi-
tude in the area of photo activity. Figure 2-13
is a plot of the primary photo orbit traces and
includes the targeted perilune trace. Figure
2-14 indicates the spacecraft altitude above
the nominal lunar radius at photo time for
each of the primary targets, as well as the
lighting incidence angle for each primary
photo event.
2.2.3.5 Photo Ellipse
The photo ellipse phase of Mission III ex-tended from transfer burn termination
through photo readout termination.
The principal FPAC tasks in this phase in-
cluded :
1)A high-quality orbit determination
prior to each primary photo event,which was the basis for design of
camera pointing maneuvers and
camera-on times.
2) Design of secondary-site photomaneuvers on a noninterference basis
with primary photo activity.
3) Trajectory predictions, including sunrise and set times and Earth occulta-
tion periods.
Orbit Determination--Immediately after mon-
itoring the transfer maneuver doppler shift,
tracking data were logged and edited in pre-
paration for the first orbit determinationafter the burn. This calculation used 1.33
hours of two-station view doppler data; by
T+I00 minutes, the calculation was complete
and the results reported. This calculation--
together with the excellent agreement ob-
served between the predicted and actual
doppler shift during the burn--indicatedthat a nominal maneuver had occurred. The
following table shows the designed post-
transfer conditions, the first estimate of
these conditions obtained at T+I00 minutes
(OD 5302), and a more definitive estimate
(OD 5106) obtained at T+7.5 hours.
55

ElementsDesigned Post-
transfer ConditionsFirstEstimate
(OD 5302)
Best Estimate
(OD 5106)
hp (kin) 54.84 54.92 54.85
ha (km) 1846.37 1847.15 1847.35
(deg. ) 20.87 20.86 20.91
(deg.) 257.93 258.75 257.86
(deg.) 178.33 178.12 178.88
t,M
k-
.30kill
z
tAl
L -20
- 10
0I . I ,i il ii I, , I
-50 -40 -40 -20 -10 0 10
LONGITUDE OF DESCENDING NODE {DEG)
I2O 3O 4O
Fllum I-I|: Perilune Altitude vs Longitude
N

LONGITUDE (DEG)
PRIME MERIDIAN
U
Figure 2-13" Photo Orbit Traces for Primary Targets
57

IIIP-12c
IIIP-126.1
IIIPo12a
IIIP.-12b.2
IIIP-11
IIIP-IO
IIIF-gc
IIIF.-?b
1111_9a
1111_8
111_Tb
IIIF-Ta
IIIIL6
1111_Sb
IIIF-Se
IIIP-4
IIIP-3
1111_2b
1111_2a
III1_1
I
///Ill/H/1/H//////////////////H/H/HIll llJ
I I l I I0 10 20 30 40 50
S/C ALTITUDE AT PHOTO TIME (KM)
(RMooN - 1738.09 KM)
I6O
68.87
69.59
71.84
73.13
68.72
78.92
67.20
68.74
70.63
72.52
75.19
76.95
71.71
70.46
72.22
71.06
80.11
64.60
66.63
75.73
IncidenceAngle(Deg)
!_ 1.14: Pl_dicted Primary Photo Altitudes based on Transfer Design
58

No difficulties were encountered in the ini-
tial orbit determination and no backup orbit
determination procedures were necessary.
Plots of orbital elements obtained during
this phase are shown in Figure 2-15 through
2-18.
This mission phase was the most active of
all the phases. A total of 50 orbit determina-
tions were made before Bimat cut; 30 of these
were used to directly support command con-
ferences. Table 2-9 shows the orbit determina-
tion runs used to support command confer-
ences for each photo event. Details of each
of these orbit determinations may be found in
Appendix B, Volume VI of this document.
Photo Design--In Mission III, all photo activ-
ity occurred during the second or photo
ellipse. There were 156 frames exposed for
primary photo sites and 55 frames exposed
for secondary sites.
Volume II of this document contains a de-
tailed listing of photo information, includ-
ing actual camera-on times and spacecraftattitude maneuvers. A summary of frames
exposed is given in Table 2-10.
The orbit determination procedures used
during this phase were similar to those used
in initial ellipse. That is, a basic set of lunarharmonic coefficients (LRC 11111166 set)
was tailored to the particular gravitational
field being experienced by solving for eight
of the higher order coefficients (C32, C42,
C33,C43,S32,S42,S33,S43).This procedure pro-
duced good fits to the tracking data, no diver-
gence problems were encountered, and theresultant orbital elements were consistent.
The data arc used was four orbits in length.
Perilune data was used in the fit and the dopp-
ler data oscillations near perilune observed
previously in Missions I and II were again
present. No ranging data were included in
I ii
Table 2-9:
ORBIT DETERMINATIONS USED FOR
PHOTO SITE COMMAND CONFERENCESi m
Photo Site
Number
Orbit Determination
Number
PCC* FCC**
IIIP-1, S-1 5114 5320
P-2a, P-2b 5320 5124
S-2, S-3 5124 5126
S-4, P-3 5126 5228
P-4, P-5a 5228 5332
P-5b, P-6 5332 5134
S-5, S-6 5134, 5236 5238
S-7, S-8 5238 5340S-9 5340 5144
S-10, S-II 5342 5146
S-13, P-7a 5146 5248
P-7b, S-14 5248 5352S-15 5352 5356
S-16, S-17 5356 5158-A
S-18, S-19 5158-A 5260
S-21, S-21.5, S-22 5260 5364
S-20, P-8 5364 5168
S-23, S-24 5168 5272
P-9a, P-9b 5272 5005
P-gc, S-25 5005 5176
S-26 5176 5278
P-IO, S-27 5278 5380
S-28, P-11 5380 5382
P-12b.2, P-12a 5382 5284
P-12b. 1, P-12c 5284 5286
S-29 5286 5388
S-30,S-31 5388 5192
* PCC -- Preliminary Command Conferenc_
**FCC -- Final Command Conference
I
59

el)
4D=P
]S4111:I OLOHd OL il]dSNVtlli mlm aWl* ill) IB Im_ O _ aim liB* n i i i i li1= n mln= mmm i i mum _ am mNID n i i
I i I I i I I '
(W)i) :JQI"LLI,LIYilNr'llli:Jd
Pillure Z-15: Perilune Altitude vs Time
o I-
¢,,F-
=.=.
',,O I=¢--"l(q-
04 I--
q,
J.
4,
q)©,
-)IIIg| .al I
0
6O

25.0
0ui
Z0I.-..,(Z
uZ
24.0
23.0
22.0
21.0
20.0
19.0
18.0
I' I I43 45 47
GMT
eeee e ooo_
18 IFEBRUARY 1967
I I ._ i49 51 55
Figure 2-16:
e ® ® ®
I I26 28 :_
ii 4
57 59 I
Inclination vs Time
o
I I I I i4 6 8 I0 12
MARCH 1967 • JI i I i I
63 65 67 69 71GMT
O14ai",
X_LL
OI--
z:E:3oI{
201
197
193
189-
185
181
eeklwe177
12 14I_i -
I I43 45
o._ o°_
i i i16 18 20FEBRUARY 1967I I I
47 49 51GMT
Figure 2-17:
I I I I I22 24 26 28 2
_-!.I I i I
53 55 57 59i
61GMT
Argument of Perilune History
o
I I i4 6 8 10MARCH 1967 .JI I I I
63 65 67 69
61

I I I?
lonlll_ llloN 9
e

FrameNumbers
5 through 20
21 through 24
25 through 32
33 through 3637
38
39
40 through 43
44 through 51
52 through 59
60 through 67
68 through 7172
73
74 through 7778
79
80 through 8384
85
86 through 93
94 through 101102
103 through 106
107
Table 2-10: FRAME EXPOSURE SUMMARY
Photo OrbitSite Number
IIIP-1 44
IIIS-1 44
IIIP-2a 45
IIIP-2b 46
IIIS-2 47
IIIS-3 48
IIIS-4 49
IIIP-3 50
IIIP-4 51
IIIP-5a 52
IIIP-5b 53
IIIP-6 54
IIIS-5 55
IIIS-6 56
IIIS-7 57
IIIS-8 58
IIIS-9 59
IIIS-IO 61
IIIS-11 62
IIIS-13 63
IIIP-7a 64
IIIP-7b 65
IIIS-14 66
IIIS-15 67
IIIS-16 69
IIIS-17 70108 through 111
the fits because none was taken after photo-
graphy started. Orbit determinations were
done for both the preliminary and final com-
mand conferences. In most cases, recalcula-
tion of the camera-on times and maneuver
angles with the new state vectors caused
significant changes to these quantities. Ap-
pendix B contained in Volume VI of this docu-
ment, includes a tabulation of the maneuver
angle and camera-on-time changes associa-
ted with updated orbit determinations. A
summary of the data arc lengths and predic-
tion intervals for each photo site may also be
found in Appendix B.
The DSIF procedure of using the backup
Frame Photo OrbitNumbers Site Number
112 through 115 IIIS-18 71
116 through 119 IIIS-19 72
120 IIIS-21 74
121 IIIS-21.5 74
122 IIIS-22 75
123 IIIS-20 76
124 through 131 IIIP-8 77132 through 135 IIIS-23 78136 IIIS-24 79
137 through 144 IIIP-9a 80
145 through 152 IIIP-9b 81
153 through 160 IIIP-9c 82161 IIIS-25 83
162 IIIS-26 84
163 through 170 IIIP-IO 86171 IIIS-27 87
172 IIIS-28 88
173through 180 IIIP-II 89
181 through 184 IIIP-12b.2 90
185 through 200 IIIP-12a 91
201 through 204 IIIP-12b.1 92
205 through 212 IIIP-12c 93213 IIIS-29 94
214 IIIS-30 96
215 IIIS-31 97
receiver during photo readout
again proved successful.
m
sequences
Although tracking data obtained during photo
readout were two to ten times more noisy
and had more frequent blunder points 'aused
by photo readout interference, they werenevertheless useable data. Data were
sampled at 20-second intervals durirg these
periods--instead of the normal eJ-second
rate-and then compressed to 60-second in-
tervals by the editing programs. This proce-dure resulted in a smoother data stream for
orbit determination use. The presence of
blunder points inherent in this phase required
that the tracking data be processed care-
63

fully, which increased computation time by
about 20%.
The lunar harmonics used for the design of
each photo maneuver were either those desig-nated LRC 11/11/66 or LRC 11/11/66 harmonics
modified by the various orbit determination
solutions. The modifed LRC lull harmonics
were assigned numbers identical to the orbit
determination solution with which they were
associated.
Table 2-11 shows the harmonic model used
for the final design of attitude maneuvers and
timing for each photo site.
To minimize the timing error in the camera-
on times, the state vectors were updated,
using ODPL, to within a few minutes of the
expected camera-on times. Thus, the mean
element trajectory program was used over
only a short span of time. After the design
of each photo maneuver, the camera-on time
Table 2-11
III
and attitude maneuvers were checked using
the program EVAL with the integrating tra-
jectory option.
All photos exposed during Mission III oc-
curred on the preflight design orbit numbers.
It was not necessary to make real-time ad-
justments to the photo orbit numbers.
Figure 2-19 shows the spacecraft altitude
(based on a mean lunar radius of 1738.09 km)
at photo time for each primary photo event.
Also given are sunlight incidence angles.These data were extracted from the indivi-
dual real-time photo maneuver designs.
Figure 2-20 shows perilune altitude (abovethe mean lunar radius) as a function of des-
cending-node longitude, as-predicted during
transfer maneuver design as well as from
real-time photo maneuver designs. The dif-
ference between the two curves indicates
that the modified LRC 914/66 harmonics used
in the transfer design did not represent the
perilune history perfectly.
SITE NUMBERS
P-l, S-1
P-2a, P-2b, S-2, S-3, S-4, P.3
P-4, P-Sa, P-5b, P-6, S-5, S-6
S-7, S.8, S-9, S-10, S-11, S-13, P-7a, P-7bS-14
S-15, S-16, S-17
S-18, S-19
S-21, S-21.5, S-22
S-20, P-8
S-23, S-24
P-ga, P-gb
P-go, S-_
S-_
P-10, S-27
S-_, P-11
P-12b.2, P-12a
P-12b. 1, P-12e
S-m
S-_, S-31 ,
HARMONIC MODEL VS SITE
HARMONIC MODEL
5320
5114
5001
5OO2
5OO3
LRC 11/11/66
526O
5362
5168
5272
5OO5
5176
5278
5382
5284
5286
5192
84

IIIP-12C
IIIP-12B. I
IIIP-12A
IIIP-12B.2
IIIP-11
IIIP-10
IIIP-9C
IIIP-9B
IIIP-9A
IIIP-8
IIIP-7B
IIIP-7A
IIIP.-6
IIIP-SB
I I IP-SA
IIIP-4
IIIP-3
IIIP-2B
II IP-2A
IIIP-I
'���������������������������������������Ilia
t////////////////ll///I///////////////////J
W//////////////////////////////////////_
lll///lll//lllll///llllllll/lllll//lllllnJ
W//III/II/II/////////III///IIIIIIIIIIIIIZ
'///1/1/1/Ill////////////////////////////////IlIA
//I/I/I/////I/I/I//I//I///I/I///IIIIIIIII_
WI///I/IIIIIIIIII//IIZ/////////II//IIIII
ll//lll/Nl/I/lll///I/l{I/lll//lll//llllNllJ
S/C ALTITUDE AT PHOTO TIME (KM)
(RMoon = 1738.09KM)
Figure _19: Predicted Primary Photo Altitudes Based on Real-Time EVAL Runs
68.99
69.77
71.95
73.20
68.53
79.02
67.09
68.62
70.47
72.51
75.24
76.96
71.92
70.52
72.30
71.13
81.06
64.68
66.71
75.73
IncidenceAngle(Deg .)
65

-5O
A
v
LU -- --30
r_
I--..I
LU -- -20
Z
m
LLI¢1.
o10
I I-40 -30
I I 0 i-2O -10 0 10
LONGITUDE OF DESCENDING NODE (DEG)
I I J2O 3O 4O
Figure 2-_0: Perilune Altitude vs Longitude of Descending Node
N

3.0 SPACECRAFT PERF{)RMANCE
The performance of the individual sub-
systems aboard Lunar Orbiter III is sum-
marized in this section. A brief description
of each subsystem is also presented. For
more detailed configuration and functional
information on each subsystem, consult the
Mission I final report, Boeing Document D2-100727-3, Volume III, Mission Operational
Performance. The key events of the primary
mission are tabulated in Table 3-1.
Launch through Cislunar Injection--Launch
vehicle liftoff occurred at 01:17 :01.120 GMT
on Day 38 (February 5, 1967). The first-and
second-stage boosters performed as pro-
grammed and Lunar Orbiter III was injected
into the cislunar trajectory at the end of the
Agena second burn approximately 20 minutes
after liftoff. Separation from the Agena fol-
lowed approximately 3 minutes later.
Cislunar Injection through Lunar Injection--
DSS-51 (Johannesburg) acquired the vehicle
in one-way lock 29.1 minutes after launch.
Approximately 1.6 minutes later DSS-51
acquired two-way lock and remained in con-
tact for 6.5 hours. DSS-41 (Woomera)ac-
quired the spacecraft in three-way lock at50.5 minutes after launch on the basis of two
good data frames at 56 minutes after liftoff,
antenna and solar panel deployment and Sun
acquisition were verified. Handover fromDSS-51 to DSS-41 occurred 73 minutes after
launch with no difficulties encountered.
A star map maneuver was initiated 10 hours
35 minutes after liftoff and Canopus was
located successfully. The propellant line
bleed and propellant squib valve firing events
were conducted successfully at approxi-
mately 16 hours after liftoff to prepare the
velocity control subsystem for the midcourse
correction maneuver. The spacecraft was
then pitched 36 degrees off Sun to reduce
overheating and minimize thermal paint
degradation.
The midcourse maneuver was successfully
accomplished 37 hours 43 minutes after
launch with a velocity change of 5.09 meters
per second. The spacecraft was returned to
its 36-degree off-Sun attitude until the orbit
injection maneuver:
Injection of the spacecraft into lunar orbit
was performed at 92 hours 37 minutes after
liftoff. The velocity control rocket engine
operated for 542.5 seconds, producing a velo-
city change of 704.3 meters per second, as
programmed. The spacecraft achieved an
initial orbit with an apolune of 1802.1 km, a
perilune of 200.2 kin, and an orbital inclina-
tion of 20.94 degrees to the lunar equator.
Initial Ellipse through Transfer into Photo
Ellipse--After three orbits on-Sun the space-
craft was pitched 28 degrees off-Sun to im-
prove the thermal balance. The Sun was
reacquired during Orbit 22 in preparationfor the transfer maneuver to the final orbit.
During Orbit 26, 185 hours after launch, the
transfer maneuver was performed, placing
the spacecraft in a final orbit with an apolune
of 1847.35 km, a perilune of 54.85 km, and an
inclination of 20.94 degrees.
Photo Ellipse through Photo Taking--To verify
photo subsystem operation, the Goldstone
film was read out by DSS-12 and -62 during
Orbit 39 and by DSS-12 and -41 during Orbit
42. First photos were taken during Orbit 44,
followed shortly by the first priority read-out.
Site photography progressed normally. How-
ever, during Orbit 67 priority readout, an
intermittent film advance hangup problem
67

'!
Table 3-1 : KEY EVENTS
GMT
Day Hour Min Sec Event
036
¢2-5-67)
01 17 01.120
01 36 55.5
01 39 39.7
01 41 30
01 41 56
01 46 I0
01 47 43
02 07 02
02 35 02
11 52
17 08
17 20 31
037 15 O0 O0
(2-6-67)
039 21 54 19.0
(2-8-67)
043 18 13 26.6
(2-12-66)
046 10 O0 38
(2-15-67)
046 11 56 28
(2-15-67)
054 02 11 22
(2-23-67)
054 06 36 42
054 09 35 56
061 15 45 33
(3-2-67)
062 07 17 12
(3-3-67)
Liftoff
Cislunar Injection
Spacecraft-Agena Separation
Antenna Deployment (Predicted)
Solar Panel Deployment (Predicted)
DSS-51 One-way R.F. Lock
DSS-51 Two-way R.F. Lock
DSS-41 Three-way R.F. Lock
DSS-41 Two-way R.F.Lock
Sun Presence ( time unknown)
Canopus Acquisition
Bleed Propellant Lines
Propellant Squib Valve Actuation
Ignition--Midcourse Maneuver,
a V = 5.09 raps, Burntime 4.3 sec.
Ignition--Lunar Orbit Injection,
V = 704.3 raps, Burntime 542.5 sec.
Ignition---Orbit transfer maneuver,
AV = 50.7 mps, Burntime 33.7 sec.
First photographic exposure, Site P-I
(Orbit 44)
Start first Priority Readout, Site P-I
(Orbit 45)
Last Photographic Exposure Site S-31(Orbit 97)
Bimat cut (Orbit 98)
Start Final Readout (Orbit 99) ,
Readout Drive Anomaly (Orbit 149)
End Readout (Orbit 153-154)
was encountered. Methods were developed
to alleviate this problem and the last photo,
Site S-31, was taken during Orbit 97. Two
hundred eleven photos were taken of 51 sites
during the photo period. Bimat was cut duringOrbit 98, 437 hours after launch. A total of
36.48 photos was received during priorityreadout.
Final Readout--Final readout was initiated
3 hours after Bimat cut during Orbit 99 and
progressed normally through Orbit 146,
averating 2.7 frames per orbit. In Orbit 149,
an anomaly within the photo subsystem
caused the logic to change state and filmreadout did not start when commanded.
Further attempts to start readout using nor-
68

mal commandsresultedin inadvertentopera-tion of the film advancemotor, causing itto stall and subsequentlyburn out. Afterthis failure film could not be advancedandreadout was terminated after receipt of thefour photosstored in the storage loopers.Atotal of 132photos were read out of the 211photostaken. Of this total, 20.97photoshadbeentransmittedduring priority readout.
3.1 PHOTO SUBSYSTEM PERFORMANCE
The photo subsystem is designed to photo-
graph the lunar surface, process the exposed
film, scan the processed film with a flying-
spot scanner, and provide video signals to the
communications subsystem for transmissionto Earth.
The Mission III photo subsystem was
equipped with a 0.21 neutral-density filter in
front of the 80-mm lens. The resultant 80-mm
lens transmissivity was 59%. The 610-mm
lens transmissivity was 65%. NASA pro-
vided shutter speed calibration data. The
following values were used for operational
purposes.
CAMERA 610-mm LENS 80-mm LENS
1/25 35.7 milliseconds Nominal
1/50 18.7 milliseconds Nominal
1/100 9.2 milliseconds Nominal
Photo subsystem performance was generally
satisfactory from launch through the Orbit
149 anomaly. Real-time analysis indicated
photo quality better than that of Missions I
and II. Measured exposures were good within
limitations imposed by the mission plan. A
difference between the measured and pre-
dicted spacecraft film densities is not attri-
buted to any system malfunction. This sub-
ject is discussed under "Photography
Control" (Volume II of this document). The
neutral-density filter in the wide-angle cam-
era equalized the two cameras satisfactorily.
The observed density differences were less
than 0.1, except for marginal-exposure situ-ations. See Volume II of this document for
Mission III film densities.
The photo video chain performed normallyuntil Orbit 149. White-level variations were
somewhat smaller than those encountered
during Mission II, probably because the
Bimat temperature was maintained at a
lower level during Mission III.
No detailed analysis of V/H sensor perfor-
mance was attempted, due to the large cross-
track tilts used for many of the prime photosites. However, telemetry observations of
V/H ratio, during the mission, generally fell
within 3% of the predicted values. A devia-
tion of this size is within combined telemetry
and sensor tolerances, and had no effect on
photographic quality.
Film handling within the photo subsystem
was not as good as in preceding missions.
The processing rate was nominal; however,
the camera film advance showed some small
effects of film set. There was no mission
degradation resulting from the few abnormal
film advances. The readout looper hangupsare discussed in more detail under "Read-
out Film Handling." The hangups, which
occurred throughout the mission, may havereduced the total amount of data retrieved
from the spacecraft, but had no effect on
photo quality.
Photo operations are summarized in Table3-2.
3.1.1 Thermal Control
Thermal control of the photo subsystem dur-
ing Mission III may be discussed in three
phases of the mission.
• Countdown and cislunar phase;
• Orbit cruise phase;
• Final photo readout phase
69

Table3-2:PHOTODATASUMMARY
EXPOSUREGMT
"COMMENTS :
1. NO time recorded onS/C film for Frmm_ 140.
2. _ing started in Goldsto_ header.3. Bimat defect 719-713.
Pl--_m.t% T, 43.7%WAJl--ll% TPIA 100_ WA
P T4,1%T _.1% WA8 _T _SWA
46:13 :_J_:M.58
70

PHOTO
Tadde 3J: PHOTO DATA SUMMARY (Coral/ruled)
EXPOSUREGMT
46:13:32:17. _t
M :17:01 :14.37
FRAMELETS "COMMENTS:1. PSL at 303 at 42.M2. GRE 08 Fan Fsilure emmed kine line to be obscur_l by mm_.
Replay of FRW0 tape Rt/sfsetory.
71

Table 3-2: PHOTO DATA SUMMARY (C(mtinued)
PHOTOEXPO6URE
GMT
72

Table3-2:PHOTODATASUMMARY(Continued)
PHOTO
FRAMELETS
355fj07747/_271_Ma
441t_
m4/lm
EXPOSURE
GMT
48:10:45:47.47
48:14:12:15.49
48:21:09: 8.69
48:21:09:11.59
48:21:03:19.59
48:21:09:27.69
49:00:35:14.28
49 i04:03:04.03
49:07:32:09.51
49:07:32:11.87
49:07:32:14.17
49:07:32:16.37
49:07:32:18.87
49:07:32:20.T/
O :07:32:23.17
49:07:32:25.37
49:11:01 : 10.37
49:11:01:12.37
49:11:01:14.37
49:11:01:16.47
49:11:01:18.47
49:11:01:20.47
49:11:01:22.57
FRAMELETS *COMMENTS:
I. R/O Sequence 27 erratic,#307 repeated 22 times.
463/001 2.R/O Sequence 28 erratic,_,622repeated 6 times.
590f/33 3. R/O sequence 29 erratic, #282 repeated 13 times, #248732/358 repeated 8 Umes.
357/007 4. R/O Sequence 31 erratic, #175 repeated 14 timw.
MIIMI 6. Blmat pull off _'.85.|, R/Olwq, II0, #169 repeat_l a Umes,
om/wo
SB 100%WA
59-76% T, 100% WA
73

PHOTO
Table 3-2: PHOTO DATA SUMMARY (Continued)
me/183
ill/Ill8
II/Ildl
884/INIll/Nt
044/48O
480/18
lit/018
Ill/
496/001
*COMMENTS :1. Frame smeared in direction of flight.2. Framelet 397scanned 7 times.3. Framelet 076scanned 19 times.4. #064 scanned 6 times, #886scanned 12Umes.
EXPOSUREGlvrr
40:11:01:24.57
49:14:S:0_.57
49:17:58:00.67
49:17:58:09.17
49:17:58:17.67
49:17:58:26.17
58:00:58:15.58
50:04:23:53.68
50:04:28:02.58
50:04:58:11.49
50:04:28:20.88
50:07:55:44.50
50:07:58:49.98
50:07:53:49.38
50:07:58:51.711
50:11:95:49.67
50:11:23:57.07
50:11:24:06.37
58:11:24:13.67
50:18:18:34.57
50:19:23:00.23
50:21:45:50.07
51:01:13:17.5
51:04:44:32.23
51:04:44:34.23
74

PHOTO
Table 3-2: PHOTO DATA SUMMARY (Continued)
*COMMENTS :
I. R/O Sequence 41 erratic,#362 scanned 35 times.
2.R/0 Sequence 43 erratic,#808 scanned 30times.
3.R/0 Sequence 83,#535 scanned 11times.
4. R/O Sequence 82, #876 scanned I0 times.
5. R/O Sequence, 0192 scanned II times.
i, RI0 Sequent_ 0_, RIO stopped at #MS, #M4Ksnned 14 tinws (137,M),
1, R/O Sequence 0SS, R/O Jtopped ,t IU,O6, e4N_anned 10 times, I_L at 135.83.
EXPOSURE
GMT
51:04:44:35.26
51:04:44:38.26
51:04:44:40.35
51:04:44:42.36
51:04:44:44.36
51:04:44:48.35
51:08:14:20.27
51:08:14:20.67
51:08:14:38.57
51:08:14:48.57
51:11:42:42.36
51:15:10:50.08
51:15:10:53.28
51:15:10:35.08
51:15:10:50.68
51:15:11:01.28
51:15:11:03.08
51:15:11:08.58
51:15:11:08._
51 : 18:39:52.08
51:18:39:54.28
51:18:39:56.38
51:18:39:50.56
51:18:40:00.66
51 :18:40:02.86
75

¢ p
PHOTO
740/066
lll/OlO
355/111t
8831715
Ul/II
Table 3.2: PHOTO DATA SUMMARY (Continued)
FRAMELETS
EXPOSURE
GMT
51:18:40:4.96
51:18:40:07.19
51:22:06:45.07
51:22:06:40.17
51:22:06:50.37
51:22:06:52.57
51:22:06:54.77
51:22:06:56.97
51:22:06:59.17
51:22:06:01.37
52:01:33:37.87
52:05:02:01.35
52:11:59:21.58
52:11:59:14.06
52:11:59:26.48
_:11:_:_._
52:11:59:31.38
59:11:59:33.78
52:11:59:36.18
52:11:50:38.68
5"/:15:31.02.$
52:18:55:12.57
52:22:27:58.87
52:22:28:01.17
52:22:28:03.57
•COMMENTS:
I.RIO Sequence 51 erratic,shortscan advances; #803 scanned 6 times.
2. Sequence 71, hangup 813 scanned 13 times.
3. Sequence 74, hangup 678 scanned 13 times.
4. R/O Sequence 77, @699 scanned 11 times, @5711scanned 12 times.
5. PSL at 157.81 (#491).
6. R/O stopped during 078 at #307, IM,O.
76

PHOTO
FRAMELETS
Table 3-2: PHOTO DATA SUMMARY (Continued)
FRAMELETS "COMMENTS:
EXPOSURE
GMT
52:22:28:5.8"/
52:'_:S :8.17
52:22:28:10.67
52 :'_ :28:12.9'7
52:22:28:15.27
53:01:55:14.15
53:01:55:16.55
53:01:55:18.95
53:01:55:21.35
53:05 _23:53.06
53:05:23:55.46
53:05:23:57.86
53:05:24:00.26
53:05:24:02.56
53:05:24:04.96
53:05:24:07.36
53:05:24:09:76
53:05:24:12.16
53:06:24:14.56
53:05:24:16.96
53:05:24:19.36
53:05:24:21.66
53:05:24:24.06
53:05:24:26.46
53:05:24:28.86
I.RIO Seq. 51erratic,#803 scanned 6 times.
2. RIO Sell. 52 erratic: #565 scanned 13+ 24 times,
3.RIO Seq. 53 erratic,#822 scanned I0 + 24 times.
4. R/O Seq. 54 erratic: #457 scanned 6 times,5. R/O Seq. 55 erratic,
41,RIO Seq. e8 erratic, d,0M repeated III tllne4, @0MS ropeat.
el P times, #841 mlmt_l U times,R/O termllmtedrutarted.
77

Table3-2:PHOTODATA SUMMARY(Continued)
EXPOSURE
GMT
53:06:53:I2.M
53:08:53:14.66
53:08:53:17.06
53:06:53:19.46
53 :12:21:42.28
53:12:21:45.06
53:12:21:47.88
53:12:21:51.88
53:12:21:53.58
53:12:21:56.38
53:12:21:59.18
53:12:22:02.07
53:15:46:56.47
53:22:43:04.17
54:02:11:23.89
FRAMELETS *COMMENTS:
78

Prior to the cislunar phase, the photo sub-
system thermal environment was controlled
as required during prelaunch pad testing. At
035:17:18:36 the photo subsystem heaters
were uninhibited. At 035:19:40:41, the heaters
were inhibited and remained in that state
throughout the cislunar phase. During cis-
lunar, the photo subsystem thermal environ-
ment was basically slaved to the equipment
mounting deck temperatures. Spacecraft
pitch angles were selected to keep the space-
craft and consequently the photo subsystem
temperatures at acceptable levels. Average
Bimat temverature during this phase wasmaintained at a very acceptable 48°F level.
Just prior to orbit injection, the heater in-
hibit was removed (at 039:20:40:00) to pro-
vide the photo subsystem with a source of
heat during the injection night period and
the following orbital night periods. At this
point solar eclipse was on and, consequently,
only the night heaters were active. This ther-
mal control method, along with desirable
pitch angles, provided the photo subsystem
with an acceptable and stable thermal en-
viornment. During this phase, Bimat tem-
peratures averaged about 63°F.
Seven orbits prior to Site I photos, normal
cycling of the day and night photo subsystemheaters was initiated (at 045:09:29:22). It
was done at this time to thermally stabi-
lize all photo subsystem components in anti-
cipation of site photos. This cycling of the
heaters was continued throughout the re-
mainder of the mission and provided ac-
ceptable thermal control. The thermal his-
tory of the system is presented in Figures
3-1 through-9.
3.1.2 CAMERA FILM ADVANCES
The average camera film advance for Mis-
sion Ill was 11.70 inches or 130_+I edge num-
bers as reported in the data package for PS-5.
The edge numbers reported in the readout
analysis logs are listed in Table 3-1. Data on
the film advances are plotted in Figure 3-10
for Frames 80 through 215. The plot shows
that film advance through the camera was
quite accurate and that any errors were dueto film set and not mechanical encoder errors
since the errors are a short advance followed
by a long advance on the first or secondadvances. There was an anomalous film ad-
vance with no "camera on" command
during operational readiness test ORT-1
prior to the final countdown; this advance
was attributed to a ground power fluctua-
tion. The first film advance to place live film
in position for exposure was planned to be an
11-frame advance but this was changed to
10 frames due to the inadvertant pre-count-
down advance. Since readout is incomplete
up to Frame 79, the data is not plotted forthose frames, but no errors other than film
set errors were detected. Camera film handl-
ing was satisfactory during Mission III.
3.1.3 Processor Operation and Readout Film
Handling
3.] .3.] Processor Operation
The average processor rate for Mission Ill
was 2.42 inches per minute, well inside the
2.40 +-0.I0 inches-per-minute specified rate.
At least two frames were processed each
orbit to minimize Bimat dryout effects.
Data from the prelaunch film loading was
used for the H & D curve for the flight film
during the mission. The analysis conducted
by the video engineers and data supplied
later from Eastman Kodak, has resulted in
H & D curve is shown in Figure 3-11. Several
interesting characteristics of this curve may
be noted from its shape. Gamma is about 0.99
over the dynamic range that could be read
out by the photo subsystem. There is a long
"toe" on the curve and Bimat processing
variations were less noticeable than on prior
missions. Focus and gain changes duringreadout were not required as often as on
79

M.0
o
I
: i: °!o
o

+
lB.
,q.
o I%
I,i.0
81

o
0
82

83

o
I',,.
,,.'_
gt
84

o_ ,
0
i
z_I=-
o _N
#
8
85

IIIIII
uJ
z _
0
_ e4
o
o

_ I_ R ,,9
ii.0
8?

[ 1+/ /
,+++++_ r ., +I + _ -
/ I :' I :''_"' ", _,,,\4,,,., ,. ,_'..| _• I ..I
0 '(Yl!: 1--++_o
/ ! ; IlL • / ,_; "8
/ / +' _ .._"+i _ I
,_,,, ,_ ,{ _ _

PHOTOSITES
s-J4 r s-21 s-31s _o ?" s..30---.,I
" 5-15 / S-21.5 titI I,s-,: \ \ \-,s-,7_':_l//.:-2oV s-_ s--, ,ll.2 ,I.
_I_,.,,.,.AX\\_,.... . ..... .IIU/,-,,/D.;,,...... .. ,,-,.,-,<.,,.,o.,.,,.,,.,.,.,,_,,,.,=,_,_.... 1_-_ _K _-_- - _" it- _.- M -,'_"A" _-.lll_ ...................
i30 .... .... . .....
_s:',_gO 90 I00 I I0 120 130 140 150 160 170 180 190 iO0 210
FRAME NUMBERNOMINAL ADVANCE = 130 i I EDGE NOS.
I!._"
SPEC. UMTS: 11690".,- 0.117"OR 12B TO I$3EDGE NOS.
1.60
1.4C
1.20
1.00
O_0.0o
0.60
0.41)
0.20
Figure 3-10: Camera Film Advances
--.-- lillE-LAUNCH (CORRECTED)
...... EKC
• .'"J"
.. ;S*.o °° S
eo" J,°.'S*
............... ._--_,".,,......o el,m. tim,oil o e_ °
"I I I I I I1, 2 3 4 5 6
II I I I
LOGI0 E
/ .S"
** s
i_,.'""#
...i//
:1;o
.../;#
.."2/,;#
-/.°_"
o.._o oe
I I I [Ix_[7 8 9 STOP
I I I1_
T.65 1".95
Figure 3-11: H&D Curve for SO-2,L1
89
previous missions. Also, this is the first mis-sion in which the Bimat life was not exceed-
ed. After Orbit 54 the processing schedule
was maintained to place the stop lines in the
wide-angle subframes.
Some film advance irregularities were ob-
served in the readout looper during pro-
cessing when the loopers were emptied dur-
ing the countdown, and during the first pro-
cessing period of the mission. This was at-tributed to the lack of friction on the leader
in passing through the system. After SO-243.
film entered the system, readout looper and
take-up looper operation was normal duringthe remainder of Mission III. Bimat cut was
performed normally. The last three attempts
at priority readout were completely unsuc-cessful
3.1.3.2 Readout Film Handling
Priority readout was conducted normally as
scheduled in the flight operations plan until
Readout Sequence 25 in Orbit 68. At that time
telemetry indicated that normal film advance
was interrupted. Postmission analysis and
photo subsystem testing indicated that film
movement was being obstructed by one of
the readout looper mounting screws. The
following plan was developed by the opera-tions team to continue with readout.
1) Transmit "R/O electronics on" com-
mand after four telemetry frames
showing no film advance.
2) Execute the command after 10 tele-
metry frames showing no filmadvance.
3) Wait 10 minutes, transmit and execute
the "RIO drive on" command.
This procedure was used successfully until
Orbit 98 when three attempts at priority read-out were made with no film advance. Due to
this condition and the possible consequences
if further readout were tried, Bimat was cut
one orbit sooner than planned, canceling the
last secondary photo site. The mission con-tinued into the final readout mode with no
abnormality until Readout Sequence 68 when
again the film advance stoppage occurred.
The flight operations team developed a
second plan to continue readout by emptying
the readout looper when telemetry indicated
19 inches of film in the looper or when stop-
page occurred. Final readout continued in
this manner, averaging 2.7 frames per orbit,
until the anomaly discussed earlier in this
section occurred. The plans developed to
overcome the film advance problem were
completely successful in that there was no
loss of data directly attributable to this prob-lem.
3.1.4 Photo Data Analysis
3.1.4.1 White-Level Variation
For purposes of this discussion, "white level"
is defined as the GRE video output level as
observed on an oscilloscope when the OMS is
in the "focus stop" position. This position is a
controlled-density area of approximately 0.30
readout density, provided the spacecraft
film has been properly processed. A density
of 0.30 will Droduce a white level of 5.0 volts.
A density greater than 0.3 will produce a
white level of less than 5.0 volts. The focus
stop position, therefore, is used to measure
spacecraft photo video chain (PVC) gain pro-
vided the spacecraft film at this point is be-
lieved to have been processed properly. To
determine these spacecraft film areas of
proper processing, periodic white-level re-
ports were given verbally to the photo data
analyst or were included in the video analysis
reports. These reports confirmed the signifi-
cant variations between the processing stop
line (PSL) and the Bimat pull-off line (BPO).
Therefore, no gain changes were to be made
while scanning in this area. These areas could
be reasonably predicted because the PSL is
in this area. These areas could be reasonably
J
9O

located at the processor index. The proces-
sor indices are tabulated in the film status
log and are reproduced in the photo data
summary (Table 3-2).
The processor index is defined as that point
where the fresh Bimat and the undeveloped
spacecraft film initially come into contact.
It is manifested on the spacecraft film bya straight line across the frame about one-
fourth of a framelet in width. The actual
location of a processor stop line is uncertain,
however, until it is actually read out alongwith a frame edge. This did not occur until
Readout Sequence 018. Therefore, the pro-
cessor indices up to this time were not pre-
cisely known. This accounted for the im-
proper gain increase command sent at the
start of Readout Sequence 010 (Figure 3-12),
resulting in abnormally high spacecraft gain.
The BPO is not tabulated but can be con-
sidered to be about one frame pair (i.e., a
telephoto and a wide-angle pair) in ahead of
the PSL. It is caused by the Bimat obliquely
leaving the Bimat supply reel and, there-
fore, is manifested on the spacecraft film by
an oblique line, highly curved at one end,
crossing about seven framelets.
3.1.4.2 Video Analysis Reports
The video analysis reports prepared bythe video engineers include the mea-
sured white level at specific points
5.8
Figure 3-12"
STEP2
STEP5
I STEP B
27
FRAME NUMBER
803OO 2O 4O 60 8O 4O020 4O 6O
EDGE NUMBER
White-Level Densities--Readout Sequence 010
8O 50O
91

and certain measured GRE densities.
The procedure for reporting the video analy-
sis reports is covered in Section 10 of the
Tracking Instruction Manual, Volume III.
Essentially, reports are made at the time of
observation of the spaces between the tele-
photo and the wide-angle frames, and at 10
and 20 minutes into the telephoto frame.
The measured GRE densities are edge data
Steps 2. 5, and 8. During priority readouts,
video analysis reports were made for each
readout. During final readout, video analy-
sis reports were made for selected readouts
only. usually one readout per station view
period
3.1.4.3 White-Level Variation Plots
The data from the video analysis reports are
plotted on the white-level variation plots.
Selected plots are included in this section for
analysis.
Several of the plots also show edge data step
densities from the readout analysis logs and
density variations along the center of a
framelet. The edge data steps are shown as
data with the appropriate step number. The
density variations are plotted using the left-
hand density scale and an outline of a frame-
let. A discussion of these density variationsis covered further in a section below.
3.1.4.4 Analysis of Data
Several phenomena should be observed on
the white-level variation plots. First, there
is a variation for almost every readout, even
when processing effects are felt to be insig-
nificant (Figures 3-13 and 3-14). Much of this
variation is believed to be caused by the limit-
ed precision available in acquiring the data:
the video engineer must take the reading
from an oscilloscope of a rapidly changing
pattern. The white level is reported only to
the nearest 0.1 volt. Steps 2, 5, and 8, however,
follow the white level report very closely. The
scale, therefore, used to plot the variation
tends to exaggerate the variations
Secondly, there is a significant variation
that starts just before the PSL {Figures 3-15_
-16, -17, and -18). Typically, the white level
increases as the PSL is approached, de-
creases shortly afterwards to a minimumbetween the PSL and the BPO, and rises as
the BPO is approached, then tends to leveloff.
Thirdly, the minimum white level appears to
be a function of the interval of processing
the total Bimat age. For example, the first
few frames processed, Readout Sequence 007,
Figure 3-17, were processed by Bimat in
which the interval of processing was long,
whereas for the last few frames processedthe minimum white level is less. It is as-
sumed that dryout is more pronounced in the
outside layers of the Bimat than in the inner
layers. As the Bimat ages, all of the Bimat is
dryer and the additional dryout in the area
between the processor index and the Bimat
supply reel pull-off is less
Bimat effects are caused by the following.The Bimat imbibant is better retained while
the Bimat is on its supply reel than when itis in the diffusion channel between the Bimat
pull-off and the processor index. The Bimat
in this region tends to dry out. Although the
Bimat process is supposed to go to comple-
tion, more than likely only the developing
action does as it is accomplished very quick-
ly. The fixing action, however, has a much
longer time requirement (hence the long
time on the processing drum) and film that
is not entirely fixed will exhibit a greater
density than completely fixed film. This
greater density in the spacecraft film ac-counts for the decrease in white level.
92
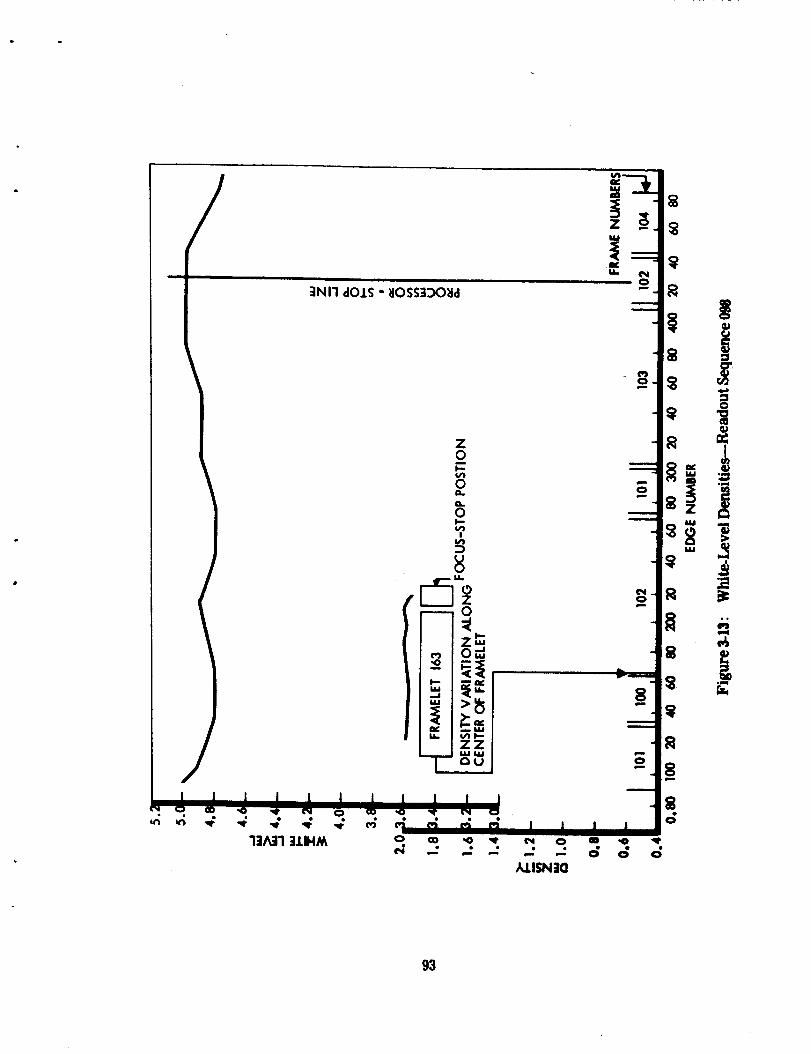
_a
8=INI1 dOlS - _IOSS=I:)O_Id
93

I I IN 0 OD ",O
¢_I
Q..L,L,
I=-
i
l.IJI.=.
1
----2
I I I . i I . i i i
1:1A:11 311HM o ,o _ ,o_q ,-" -" ,-" -* -* c_ c; o
,M.ISN3C]
o
o
C3"
"O
-, I
Z
°_
0.
°_,,,i
94

13A31 311HM
O_
GO
_.ISN3C]
95

-l:lO-'1"Ind J.VWI_
:IN I1 dOJ.S -_OSS3::)O_td
1_A31 _IIHM )_LISN:Ia
Io
a.,..
m
I Ico ,,o
c_ c_ c_
'z i_ .
.,

97

' ' ' i I i i i _ i I
ltAtl _IIIHM
8
/
/
e; .... • c; c_ c;
AJ.ISN:JO
98

In relation to readout and processing the
phenomena discussed above are not defects.
Rather. they are variations which must be
expected when temperature-dependent photo
processing is carried out in a less than idealenvironment This data is presented as a
guide to future photo subsystem operations.
None of the data indicates performance qual-
ity below the standards required for the mis-
sion.
3.1.5 Processing Variations Across the
Spacecraft Film
Although white-level measurements indicate
processing variations along the edge of a
frame, there is no evidence obtainable in real
time to indicate processing variations across
the frame. Therefore, density measurementswere made on six framelets from six GRE
rolls: three framelets represent Bimat dry-
out areas, and three represent areas where
Bimat dryout does not appear significant. The
ten density measurements were made in thecenter of the framelet to reduce the effect of
the density variation caused by the W pattern
of the video signal.
The framelets that were chosen were those
with no exposure: those between a telephoto
and a wide angle and those between a wide
angle and a telephoto which also have a time
code exposure. The white-level plots for
Readout Sequences 004, 007, 077, 083, 095,
and 098 demonstrate GRE density variation
along the selected framelet and the framelet
location. Figure 3.19 shows the GRE densities
converted to spacecraft film densities (Read-
out density) using the "measured" curve
shown in Figure 3-20.
The upper set of curves represents varia-tions in densities where the white-level read-
ing indicates Bimat dryout, while the lower
set of curves represents the smaller density
variations in an area where Bimat dryout
would appear to be insignificant.
Several conclusions may be drawn from the
data. First, there appears to be more density
variation where Bimat dryout is expected.
Second, the density of "focus stop" position
is considerably different than those further
into the framelet and is in the right direc-
tion and magnitude to decrease the white
level. Third, although the data are quite lim-
ited, it does indicate trends and more data
should be accumulated. Fourth, readings to
determine proper exposure of the spacecraftfilm should be restricted to those framelets
in which Bimat dryout is not expected tobe
significant. Fifth, the focus stop density fur-
ther confirms that gain adjustments should
only be made in areas of proper Bimat
processing.
3.1.6 PS Problem Analysis
At 15:12:42 during Orbit 149, "readout elec-
tronics on" was commanded. The following
telemetry frame (15:13:034) indicated the
command was verified by the PS and that
the readout electronics were coming on
normally. PEO6, the photo multiplier supply
voltage value, was -1828 volts--the same as
in previous readouts--and PEO3 indicateda normal line scan tube (LST) cathode cur-
rent of 17.62 microamps. The LST high-volt-
age supply which is delayed by 30 secondshad not come on at this time. The next tele-
metry frame (15:13:26.5) indicated readoutelectronics had turned off with all video
telemetry channels going to their preturn.on
readings. The video engineer at DSIF-41
noted that the high-voltage supply had come
on 4 to 5 seconds prior to loss of video. Dur-
ing this same telemetry frame (15:13:26.5),
the following changes were noted: PC-12,command verification for focus and video
gain commands, went from a "I" to "0",
and PB05, platen count, changed from "20"to "19".
99

z
1
c_
' I I I I I
c; c; c; c_ c; c;
AIISN:_O :)/S /IJ.ISN:lO 3/$
!
,y' =c
-.-_
__21
I
I
"i
E
100

1.1,.I
\
NOMI NAL MEASURED
0.2 0.4 0.6 0.8 1.0 1.2
SPACECRAFTFIlM DENSITY R,/O FILM DENSITY
Figure 3-20: GRE Film Density vs Spacecraft Density
101

At 15:18:04, "R/O electronics on" was execut-
ed and had no effect. This was the first indi-
cation that the PS logic had changed state in
some manner. At 15:35:45 "solar eclipse off"
was executed. At this time a 2-amp increasein load current occurred, which is an ab-
normal amount.
Readout electronics was then commanded
on and came on normally at 15:39:10. The
first "R/O drive on" command occurred at
15:40:40. The following commands were then
required to optimize the video signal: five
video gain increases and one focus increase.
This indicates that both the focus and gain
counters had returned to their preset condi-
tion, which is Step 8 for focus and Step 4 for
gain. Before the counters were reset, the
gain was at Step 7 and focus at Step 10. After
optimization on this readout, gain was at
Step 9 and focus was at Step 9. Readout pro-
ceeded normally with normal film movement
into the readout looper. At about 16:08, a
1.2-amp decrease in load current was noted.
Heater power was then commanded off and
on with no change in load current because
the PS heaters are inhibited during readout.At 16:47:23, "R/O drive off" was executed.
Following telemetry frames indicated that
film was not moving out of the readout looper.
Readout electronics was turned on again at
16:51:36. The second "R/O drive on" com-
mand was executed at 16:53:57 and readout
again proceeded normally. At 16:58:37, "R/O
drive off" was executed and again the film
did not move out of the readout looper. At
this point it was decided to use the turn-on
sequence recommended in the PS referencehandbook for turn-on in the "Bimat clear"
mode. The following sequence of "solar
eclipse on," set single frame rate, "camera
on," "solar eclipse off," and "camera on"
were executed beginning at 17:24:20. Follow-
ing the second "camera-on" command, one
frame of film should have been advanced;
however, telemetry indicated there was no
film advance and the shutter counter, in-
stead of indicating a single count, kept cy-
cling until "V/H sensor off" command was
executed at 17:40:30, which turned off the
camera memory. At this time the readout
looper emptied normally as the film was
pulled back onto the takeup reel by the takeup
motor. "Solar eclipse on" was then executedat 17:45:51.
From the telemetry data it is concluded that
a power dropout or transient from some un-known source occurred about 30 seconds
after readout electronics was turned on at
15:12:42. This transient apparently generated
a preset pulse which placed the PS in the solar
eclipse mode, which in turn caused the read-
out electronics to turn off. In addition, both
gain and focus counters were reset. As ex-
plained in the PS reference handbook, when
power is interrupted in the final readout mode
after "Bimat cut" and is then reapplied, an
ambiguity in the film handling logic can oc-
cur. The film advance motor logic can come
on in the wind-forward direction while the
film supply motor and brake logic comes on
in the reverse direction. When "solar eclipse
off" is given, the film advance motor canthen come on in the forward direction but
cannot move film because the supply motor
brake is on. It is apparent that this is what
happened in this case. The logic to the filmadvance motor switched to the "wind for-
ward" state while film supply motor logic
and takeup motor logic remained in the final
readout state. When "solar eclipse off" was
given at 15:35:45, the film advance motor
came on and stalled--as shown by the 2-ampincrease in load current. At 16:08 the load
current dropped by 1.2 amps. This is the prob-able time the film advance motor failed. All
subsequent events can be explained assum-
ing a film advance motor failure. The readout
proceeded normally because the takeup
I02.b
i
4

motor logic did not change during the power
interruption. When readout was turned off,
the readout looper did not empty because the
film advance motor had failed and the supply
motor did not have sufficient torque to pull
film through the camera and turn the arma-
ture of the film advance motor. The film
advance motor failure explains why film was
not advanced following the "camera on"
command. The shutters continued to operate
because no "end of sequence" signal wasreceived from the film advance encoder that
controls the amount of film advanced per
frame. The shutters stopped operating when
the camera memory was turned off by the"V/H sensor off" command.
After photo subsystem status became ap-
parent, considerable effortwas devoted to
furthertestingand tomaximizing thereadout
looper contents.The minimum readout index
reached was 79.00.
3.2 COMMUNICATIONS SUBSYSTEM
PERFORMANCE
The Lunar Orbiter communications sub-
system consists of the components shown in
Figure 3-21. This subsystem basically serves
to transmit telemetry and video data to Earth,
to receive spacecraft commands from Earth,
and to receive and transmit ranging signals.
The communications subsystem performed
satisfactorily throughout the mission. All
photo data presented to the communications
subsystem was successfully processed and
transmitted by the spacecraft throughout
the mission. At the completion of the regular
mission (Orbit 153-1M), all components of
this subsystem were functioning satisfac-
torily.
3.2.1 Launch Through Cislunar Injection
Launch vehicle liftoff occurred at 036:01:
17:01.12 GMT with the subsystem performing
normally. Telemetry data received via the
Agena interface provided real-time data atSFOF from liftoff to 22 minutes after launch
with only 5 minutes of unusable data. Cislunar
injection occurred at a TFL of 19.9 minutes
and the communications subsystem was
functioning normally in modulation Mode 3
when real-time data reception was lost at22.3 minutes after launch.
3.2.2 Cislunar to Lunar Injection
Cislunar injection occurred 19.9 minutes
after launch and 9.2 minutes prior to the first
S-band acquisition by the DSN. Acquisition
reports received from the DSN show that
DSS-51 (Johannesburg) acquired the space-
craft 29.1 minutes after launch at a signal
strength of -132.0 dbm on the "S"-band ac-
quisition-aid radar. This acquisition occurred
6.5 minutes after Agena-spacecraft separa-
tion, 4.6 minutes after the start of spacecraft
antenna deployment, and 2.9 minutes after
the initiation of Sun acquisition. DSS-51
established two-way phase lock with the
spacecraft 30.7 minutes after launch at a
signal strength of -101.5 dbm and remainedin contact for about 6.5 hours. (DSS-51 ac-
quired the spacecraft prior to the stored-
program Mode 4 switchover.)
DSS-41 (Woomera) acquired the spacecraft
in three-way lock at a signal level of -145 dbm50.5 minutes after launch and 2.2 minutes
before Mode 4 switchover. No signal strength
for either DSS-41 or -51 was reported at Mode
4 switchover (52.7 minutes after launch);
however, at 67 minutes after launch DSS-41
reported -109.4 dbm. These signal levels cor-
respond to the expected levels before andafter Mode 4 switchover.
Real-time telemetry data became available
again at SFOF at 036:02:23:30GMT or 66.5
minutes afterliftoff(two frames ofgood data
were received 56.0 minutes after launch).
103

1114

The data was from DSS-41(three-way station)
and the communications subsystem measure-
ments indicated that the spacecraft signal
strength (AGC) and static phase error (SPE)were within allowable command limits. The
data also indicated that both antennas and
all solar panels were deployed.
The spacecraft began a +3fg)-degree roll
maneuver 52.7 minutes after launch and com-
pleted the maneuver approximately 12 min-
utes later. Signal levels during the rollmaneuver were not available; however, there
were no problems reported in connection with
the receivers maintaining rf lock. Handoverfrom DSS-51 to DSS-41 occurred 73 minutes
after liftoff and no problems were encoun-
tered. DSS.41 commanded Mode 4 off by RTC
90 minutes after launch, and a resulting sig-
nal strength decrease of approximately 7db
occurred. Approximately 1 hour after hand-
over, DSS-41 began ranging and continued
to range for about 2.5 hours. Three hours 40
minutes after launch, handover back to DSS-
51 was effected. (This was required becauseDSS-41 set before DSS-62 rose). DSS-62 ac-
quired the spacecraft, three-way, 4 hours 3minutes after launch and handover from
DSS-51 was accomplished 33 minutes later
without problems.
During the cislunar trajectory two high-gain
antenna maps were obtained while 360-de-
gree roll maneuvers were being performed
for star mapping operations. The antenna
maps show that the spacecraft roll position,
as determined by the attitude control sub-
system and antenna boresight, agree within
2 degrees.
3.2.3 Lunar Injection Through Final Readout
3.2.3.1 Telemetry Link
Downlink telemetry operation was satis-
factory throughout the mission. It was noted,
however, that after lunar injection the level
of signals received from the spacecraft dur-
ing Mode 3 telemetry operations decreased
considerably during sunset periods when the
spacecraft temperatures decreased quite
rapidly. Shortly after this situation was not-
iced, DSS signal levels were recorded every10 minutes for ten orbits in an effort to corre-
late any factors that might be contributing to
these signal level changes. The results of this
investigation only showed that (1) the down-
link power level did indeed decrease with de-
creasing temperatures and (2) the uplink
signal level (transponder AGC) did not follow
the variations of the downlink signal. During
the same period, the Deep Space Stations
made several measurements of telemetry
modulation index, and the conclusion from
these tests was that the modulation index re-
mained essentially constant at 1.4 radians.
Figure 3-22 summarizes, to some extent, the
variations in ground receiver signal levels
throughout the orbital phase of the mission.
It should be noted that the decreases in signal
strength presented no problems with telem-
etry reception, and the signal strength mar-
gins for telemetering reception varied from1.5 db below to 8 db above the nominal link
design through the orbital phase of the mis-sion.
3.2.3.2 Video Link
The performance of the video link was satis-
factory throughout the mission. Signal levels
recorded at the Deep Space Stations during
readout varied from -98.5 to -91.5 dbm, which
correspond, respectively, to video margins of1.0 db below and 6.0 db above the nominal link
design. Throughout the mission readout per-
iods were not degraded or jeopardized by low
signal levels from the spacecraft.
3.2.4 Component Performance
3.2.4.1 Transponder
Transponder performance was satisfactory
105

.i
tJ
o<
II
s°X
• •
02:" .-a,. tk,i
X I-.-._
%
i
(w_a-)($J..tVMn'ilW)Ot:_::) ::)Or _^::), ONO (4 o) _O.t::)
@
z

throughout the mission even though two
anomalies were observed. The following dis-
cussion summarizes transponder performance.
The telemetered transponder output power
indication telemetry channel (CELO) varied
inversely with temperature with typicalvalues of 584 mw at 61°F and 543 mw at 87°F.
Shortly after lunar injection it was noted
that the power output exhibited a pair of dis-
continuities in its power-versus-temperature
profile during each orbital period. One of the
discontinuities appeared shortly before sun-
rise, when the power decreased approximate-
ly 4 mw during its normal increasing trend.
The other discontinuity occurred shortly
after sunrise, when the power increased ap-proximately 8 mw during its normal decreas-
ing trend (see Figure 3-23). The discontinu-
ities and temperatures at which they oc-
curred were quite consistent throughout most
of the mission. A tabulation of a portion of
585
58C
23
56O
555
550
i
• I II/"% s S
IIIIIll
:, ,I .Z..", ii • i
°'-' Yr"7i 1"/,i i ........iCE'°'
62 _,: i I I I " ............
60- "\ ! i" \ I I I /2205 - YAW +19.7 :
i/. 2_ - P,TCH-3.0: X I I I //_,:_z_z//_.10- 58- : % _aeoiielmtaoialeoPITCH +3.0: I J/ i
"/2211- yaw-19.756 - ,: X [ ,(._ / 22:14 PITCH +30 4,
" _" I ]T-__ ,, /: % I
i 4- " • < '(
..,c % I _z _ I
_I"- 'I _0 _ I- 501 / I I I_' I I i I l I I I 1 [ I II
TIME (GMT) DAY O51Figure 3-23: Transponder Temperature--RF Power and EMD Temperature
107

the above discontinuities is given in Table
3-3. The foregoing discontinuities presented
no operational problems in connection with
the transponder; however, the TWTA opera-
tion and performance appeared to be affect-
ed. A complete discussion of TWTA perfoi'm-ante and constraints as related to
transponder output power discontinuitieswill be found in the TWTA section of this
report.
The transponder AGC, CEOS, reflected the
effect of increasing range on the uplink signal
strength during cislunar flight as well as
changes in ground transmitter power levels.
In most cases, CEO8 tracked the reported
changes in ground transmitter power within1 db. Command modulation was clearly evi-
dent on CEOS: one tone causing a decrease
of about 2 db, and two tones causing a de-
crease of 3 to 4 db. Ranging modulation
caused the uplink carrier power (CEO8) to
decrease by approximately 8.5 db as expect-
ed. CEO8 was also found to vary with trans-
ponder temperature; during a typical orbital
temperature cycle of approximately 20 de-
grees, changes of 3 to 4 db were noted forCE06.
Throughout the orbital phase of the mission
it was noted that the sensitivity of the trans-
ponder AGC measurement appeared to be
slowly increasing (i.e., a particular DSS
transmitter power and transponder tempera-
ture at the end of the mission produced an
AGC value 8 to 10 db higher than compar-
able transmitter power and transponder
temperature at lunar injection similar toh
previous missions). Figure 3-24 summarizes
the change in AGC sensitivity over the orbital
phase of the mission.
The transponder static phase error (SPE),
Clg06, displayed an approximately sinusoid-
al variation (at one cycle per orbit) during
each orbit of the mission, with the average
total excursions being equal to about 5.2
degrees. This variation was dependent on
two factors; namely, doppler changes in
spacecraft received frequency, and trans-
ponder temperature (CTO2) changes. De-
pending on the spacecraft's orbit configura-tion, these two factors can be either
cummulative or subtractive in their effect
•on CEO6. During the mission, the amplitude
of CEO6 was generally centered about 0
degree SPE with equal positive and nega-
tive excursions. No problems with SPE were
encountered throughout the mission.
3.2.4.? Signal Conditioner
Signal conditioner operation was satisfactory
throughout the mission. CE09, the signal con-
ditioner voltage measurement, varied from4.68 to 4.76 volts--within the specified _+ 1%
tolerance band.
3.?.4.3 High- and Low.Gain Antennas
Both the high- and low-gain antennas per-
formed satisfactorily throughout the mi_._ion.
The antennas were deployed by stc .............
gram command after Agena separatio::_
fication of successful deployment w_ _i
tained from telemetry measurements, _/._and CC05. These are discrete channels th_i
indicate 0 when the antenna is in the stowf '._,
position and I when the antenna has deploye_;At launch CCO4 (low gain) and CCO5 (higt_
gain) indicated 0; after acquisition by Woom-
era, both indicated 1. The gain of each anten-
na was nominal, as expected. Based on DSS
received signal levels and the communica-
tions system link analysis, the gain of the
directional (high-gain) antenna was approxi-
mately 24.5 db and the omnidirectional (low-
gain) antenna exhibited a gain pattern simi-
lar to that shown in Boeing Document
D2-36355-1, Lunar Orbiter Low-Gain-Antenna
Development.
108

Table 3-3: TRANSPONDER POWER DISCONTINUITIES
GMT ORBIT CE10(mw) CT02 ST01
69 050:00:48: 40 567.7 - 575.8 72.2 30.1
70 :04:15:38 567.7 - 575.8 72.2 27.1
71 :07:46:04 567.7 - 575.8 72.2 30.5
77 051:04:56:44 567.7 - 575.8 69.6 49.0
78 :08:35:14 567.7 - 575.8 70.9 60.8
79 :12:12:34 563.6 - 575.8 N/A 66.3
80 :15:31:06 567.7 - 575.8 70.5 66.2
81 :18:58:04 567.7 - 575.8 70.1 52.2
82 :22:26:58 567.7 - 575.8 70.5 50.8
83 052:01:55:29 567.7 - 575.8 70.5 49.9
84 :05:28:36 567.7 - 575.8 70.5 50.8
85 :08:49:03 567.7 - 575.8 69.2 50.4
86 :12 : 16:02 567.7 - 575.8 69.6 49.0
87 :15:52:13 567.7 - 575.8 70.5 50.8
88 :19:22:39 567.7 - 575-8 70.5 52.2
89 :22:41:11 567.7 - 575-8 69.2 49.5
90 053:02:08:55 567.7 - 575.8 69.6 49.9
91 :05:35:54 567.7 - 575.8 69.2 49.0
92 :09:04:25 567.7 - 575.8 69.2 47.2
93 :12:34:04 567.7 - 575.8 69.6 49.0
94 :15:59:31 567.7 - 575.8 69.2 49.9
95 :19:29:11 567.7 - 575.8 69.6 49.9
96 :22:56:55 567.7 - 575.8 69.2 46.6
97 054:02:25:26 567.7 - 575.8 68.4 47.7
08 :05:55:08 567.7 - 575.8 69.2 46.1
102 :19:37:14 567.7 - 575.8 70.1 41.3
103 :23:10:45 567.7 - 575.8 70.1 46.1
104 055:02:38:06 567.7 - 575.8 70.1 47.2
105 :06:04:42 567.7 - 575.8 70.5 45.4
106 :09:31:40 567.7 - 575.8 70.5 43.6
107 :12:59:02 567.7 - 575.8 70.9 42.7
108 :16:25:37 563.6 - 575.8 71.4 40.4
109 :19:51:27 563.6 - 571.7 71.8 37.6
II0 :23:25:20 563.6 - 571.7 70.9 44.0
III 056:02:55:00 563.6 - 575.8 70.9 45.4
112 :06:26:12 567.7 - 575.8 70.5 46.6
113 :09:54:43 563.6 - 575.8 70.5 4S.6
114 :13:22:27 563.6 - 575.8 70.9 47.7
115 :16:49:49 571.7 - 575.8 70.9 46.8
116 :20:17:11 563.6- 575.8 70.9 44.9I
I09

O0Z _-
=x
"m
°,
.=
_j
%:
%
A_
u,J * •
X
"-
. .
L
=EM.II--
%.
Z
%
.?
-8
J
m
m
z &u _IX
8
(_a - ):)or IlaNdX
a]znvwllON
110

The high-gain antenna respondedsuccess-fully to all rotation commands.The antennarotated through a full 360 degrees during the
course of the mission, in addition to several
30-degree rotations to compensate for pitch-
ing off the sunline. In all rotations the en-
coder that telemetered the rotation angle
(CD 01 ) functioned correctly.
3.2.4.4 Tra rcling. I_'a ve.Ttt be ,4 mplifier
During the mission the TWTA was com-
manded on and off for 114 cycles with a total
operating time of 155 hours.
3.2.4.5 Multiplexer Encoder
The multiplexer encoder performed satisfac-
torily throughout the mission. There was no
indication of any failure or anomaly in theexternal/internal clock, and the telemetry
properly indicating that all channel gates op-
erated; CE01 signal conditioner zero refer-
ence and EE08 precision power supply volt-
age were constant at O M V and 20.00 V.D.C.,
respectively, indicating correct coding of an-
alog channels; CC01 spacecraft identifica-
tion, CC03 command verification word, CC06
telemetry. All telemetry channels performedc,,...._,..,: marker were ,.,,,, ,.,.,* c,,,,...... o,,,_*_"**_'_,,fin-
ish, indicating correct programming in the
multiplexer encoder. Occasional samples ofthese measurements indicated a switch to in-
ternal clock; however, closer examination re-
veals that this condition appeared generallyin an area near a bad data frame and that the
programmer did not enter the halt mode (in-
dicating no clock switch occurred). It is con-
cluded, therefore, that if any faults occurred
they were transient in effect, that their oc-
currence was in no way progressive and that,
considering the long-term performance of
the multiplexer encoder, they did not in any
way degrade the performance or affect the
operation of the mission.
3.2.4.6 Command Decoder
The command decoder performed precisely
as planned throughout the mission. There
were no errors in any of the verified words
that were executed into the flight program-
mer. The threshhold of command operation
appeared to be approximately -123 dbm car-
rier signal at the spacecraft, which was with-
in 2 dbm of the expected value.
3.2.4.7 Modulation Selector
Modulation selector operation was satis-
factory throughout the mission. No prob-
lems or anomalies were experienced.
Average TWTA operating time during
priority readout was 41.3 minutes per orbit.
This time represents the total mission, in-
cluding the two launch countdowns. After
Bimat cut in Orbit 98 until Orbit 149, final
readout was conducted with an average
TWTA operating time of 129.3 minutes per
orbit. From Orbit 149 to 154, the TWTA was
operated occasionally with an average oper-
ating time of 77 minutes per turn-on. The
following represents a summary of the TWTA
telemetry data.
,_.^ ,_._,r. _^.^_,^. tempe c'ro.1• ._ , ,, • _ ,.v,,_ rature, ,
rose exponentially during each cycle as ex-
pected. The maximum temperature attained
during each orbit of priority readout was
between 142.7 and 169.9°F, and during eachfinal readout between 168.7 and 177.9°F. At
TWTA turn-on, the temperature of the equip-
ment mounting deck beneath the TWTA was
between 46.8 and 72.9_F for both priority
and final readout. Following the launch, the
TWTA was never commanded on with a deck
temperature below 45°F, as a result of Mis-
sion II experience.
The TWTA power output, CE02, was satis-
factory for all TWTA operations up to the first
readout (Goldstone test film in Orbit _9-40).
At that time it was observed that the CE02
indicated power output, was following the
111

trend of TWTA temperature (CT02). This
condition, which was also present in ground
testing, became progressively worse through-
out the mission. In Orbit 154-155, turn-on
power was indicated as 11.28 watts and turn-
off power as 19.93 watts. This power increase
was not reflected in the DSS received signal
strength, which was essentially constant
throughout each readout period. It is, there-
fore, concluded that the actual TWTA output
power was not changing appreciably, and
that there was evidently a malfunction in
the CE02 telemetry circuitry.
The TWTA helix current, CE04, was satis-
factory and normal until Orbit 78 readout.
Prior to this time, the helix current measure-
ment indicated approximately 5.1 ma and
was quite stable throughout each readout
period. From Orbit 78 on, however, the helix
current turn-on values ranged from 5.2 to
6.97 ma, and the current decayed over the
readout period to the normal value of 5.1 ma;also, the helix current was much more erratic
than it had been earlier in the mission. The
time required for CE04 to decrease to its
normal value varied from 10 to 25 minutes,
depending on the turn-on value and tempera-tures. From an examination of considerable
data later in the mission, it appeared that
the high helix current at turn-on was most
dependent on transponder power (CE10) at
turn-on, as well as transponder temperature
(CT02). Specifically, it was found that ifthe TWTA were turned on before the occur-
rence of the transponder two-count discon-
tinuity after sunrise, the helix turn-on cur-
rent would be high (6.5 to 6.97 ma) and would
remain at that high level until the CE-10 dt_
continuity occurred. After the transponder
power "jumped," CE04 would begin to de-crease until it reached its normal value of
approximately 5.1 ma. After this correlation
was discovered, TWTA turn-on was delayed,
throughout the remainder of the mission,
until CE10 had decreased by one count fol-
lowing the two-count discontinuity (the one-
count decrease was normally about 15 to 20
minutes after the two-count increase). The
maximum helix turn-on current during read-
out was 6.97 ma, which occurred in Orbit
144-145.
• The TWTA collector current, CE05, closely
followed CE04 except that its variations
were opposite those of CE04, as expected.The normal value of CE05 was 47.1 ma.
(CE04 was 5.1 ma).
The TWTA collector voltage, CE03, was
normal throughout the mission. This voltage
had a tendency to increase very slowly over a
readout period, with typical values being
1219 volts at turn-on and 1225 volts approxi-
mately 40 minutes after turn-on. Figure 3-25
shows TWTA parameters for a typical read-
out period.
3.2.5 Computer Program Performance
3.2.5.1 TRBL Program
TRBL is the computer program used,
in part, by the communications subsys-
tem analyst to determine the rotation angle
(CD01) and corrective boresight maneuvers
for the high-gain antenna when the space-
craft is pitched off _the sunline. The pro-
gram uses predicted vehicle attitude (i.e.,
roll, pitch, and yaw)and transforms the
INTLILIFL trajectory data in accord-
ance with this attitude. The program
then _ ro_tion angle and correction n'_
ne_,ers from the _ traj_ory dat_
The program ran successfully during the
entire mission and no changes are planned
prior to the next mission.
112

u
_ x..Z.
0
uZ
u--- . ..........................'".".'.".'. ................................... O_UU
_9Lu I,,-
o8 ................... I 0 0
_i - ................ j .._-.................................. u>=vo.._.
"'-: '< o2
:-" .<_
._......... _._
i&,,
t
113

3.2.5.2 St;NI, Progr.m
The SGNL program
fully throughout the mission.
culations performed by the
yielded results that were well
limits allowed. No changes to
planned prior to the next mission.
3.3 POWER SUBSYSTEM PERFORMANCE
The Lunar Orbiter spacecraft uses a solar
cell battery power system consisting of four
identical solar panels, a battery charger
to control the charging current applied to
a nickel-cadmium battery, and a shunt
regulator to load the solar array and limit
the array bus voltage. For further details
on operation of the electrical power sub-
system, refer to Mission I final report,
(D2.100727-3, Volume III).
operated success-The cal-
programwithin the
SGNL are
Mission Performance SummarT'--Power sub-
system performance during Mission III was
completely satisfactory. No constraints were
imposed on flight operations beyond the re-
quirerrent that array illumination be suff_ent
tomeet thedemands imposed by _ elec-
tricalloads and energy balance requirenmnts.
3.3.1 Lauch to Sun Acquisition
External power was removed from the
spacecraft 6 minutes before liftoff and
from that time until Sun acquisition all
electrical loads were supplied by the space-
craft battery. The array deployment and
Sun acquisition sequences were not dis-
played on telemetry, but it is estimated
that the batteries discharged approximate-
ly 3.1 ampere-hours for a 23.8% depth of
discharge. Initial receipt of telemetry data
via the Deep Space Network primary sitesoccurred 66 minutes after liftoff. The ar-
ray was deployed and supplying 13.33 amps
at 30.56 volts with an array temperature of
approximately I00 ° F. The charge con-
troller went into the constant potential
mode of operation 84 minutes after liftoff,
and within another 26 minutes the charge
current was down to 1.32 amps with the bat-
tery temperature at 60°F.
3.3.2 Cislunar through Lunar Injection
For the first 16 hours of cislunar flight, the
spacecraft was flown with the array normalto the Sun-vehicle axis. The maximum ar-
• ray output was 13.40 amps at 30.56 volts
with the array temperature approximately
100°F. During this time spacecraft loads
accounted for about 107 watts of power and
the shunt regulator had to dissipate ap-
proximately 250 watts.
To reduce spacecraft temperatures, the
spacecraft was subsequently pitched 36 de-
grees off Sun and the array output was re-
duced to 10.7 arnps at 30.56 volts with the
array cooling to 75°F. The battery charging
current fell to 1.02 amps with a correspond-
ing battery temperature of 84°F.
The Sun was again acquired, 33 hours and
21 minutes after liftoff, in preparation forthe midcourse maneuver. The midcourse
maneuver required that the spacecraft be
pitched 123.4 degrees off Sun so that space-
craft loads were supported by the battery
for 14 minutes, until the reverse maneuver
was performed and the spacecraft broughtback on Sun. With the midcourse maneuver
completed the spacecraft again was pitched
36 degrees off Sun. Spacecraft loads
stabilized at 3.7 amps, except when the tank
deck heaters were energized, causing the
load current to increase to 5.6 amps.
The photo subsystem "heater inhibit" was
removed approximately 1 hour before the
orbit injection maneuver and the load cur-
rent increased 0.6 amp. On February 8,
(Day 039), at 21 hours and 31 minutes GMT,
the spacecraft entered the Moon's shadow
114

for the first time and the injection maneu-
ver was performed using the battery. Dur-
ing engine burn, the load current peaked
at 7.93 amps while at other times during the
occultation, the current varied from 4.0 to
4.25 amps. Total discharge capacity was
estimated to be 3.28 ampere-hours for a
25.2% battery depth of discharge. Minimum
bus voltage, which occurred during engine
burn, was 23.36 volts.
3.3.3 Initial Ellipse through Orbit Transfer
Typical battery performance during theinitial orbits (1 to 25) is shown in Figure
3-26. Battery depth of discharge was ap-
proximately 27% and the overcharge ratiowas 1.8 to 2.0.
For the first three orbits the spacecraft
was on Sun and maximum array output was
13.40 amps at 30.56 volts with an average
panel temperature of 102°F. During Orbit
4, the spacecraft was pitched 28 degrees off
Sun, thus reducing the array output to 11.95
amps and the average panel temperature to89°F. The load current with tank deck
heaters energized averaged 5.84 amps and
with the battery charging current tapered
to 1.83 amps; the shunt regulator was dis-
sipating 124 watts at 30.56 volts.
The Sun was reacquired during Orbit 22 in
preparation for the injection into the photo
ellipse. Array output just prior to this in-
jection maneuver was 13.27 amps at 30.56
| _ _ "-- "-' "" _ BATTERY SUNSET SUNRISE • SPACECRAFT 8
3°1- 3"01 I I_ ''c_NT J I 9°°''T '°_f !.. 2.0 ///
I," L /I/ _-2.01-/• I I / I V"VOLT_EI /
_26 u 1+t+.+.oVI I /,.,,.o+IX, I
"I"°I I I I"='1/ I '',_,,,,o, I IJ I,, ! "
0 I 2 3 4
TIME AFTERSUNRISE ( HOURS )
Figure 3-26: Array Current and Temperature vs Time
115

volts with an array temperature of 101"F.
The injection maneuver required the space-
craft to be pitched 19.9 degrees off the sun-
line, reducing the array output to 12.49
amps: this was still more than sufficient to
supply all spacecraft loads and the bus
voltage was maintained at 30.56 volts
throughout the injection sequence.
3.3.4 Photo Ellipse through Photo Taking
After one orbit on Sun the spacecraft was
pitched 30 degrees off Sun during Orbit27. From then until the ten-frame film ad-
vance in Orbit 43, the spacecraft was
pitched from 17 to 35 degrees off Sun for
temperature control. In Orbit 43, the Sun
was reacquired with the attitude control
system operating in a 0.2 degree deadband.
Figure 3-27 shows the solar array per-
formance during this orbit; the dotted por-
tions of the curves indicate the period of
Earth occultation where data from other
orbits was used to determine the shape of
the curves. Maximum array output was
13.27 amps at 30.56 volts with an array
temperature of 100°F; minimum array cur-
rent was 12.25 amps at 30.56 volts with the
array temperature a maximum at 210°F.
II ARRAY13.o I CURRENT
/'-4""I i ARRAY
12.4 ARRAYCURRENT
12.2ARRAYI
TEMPERATURE I12.0 I
I I11.8 EARTH
OCCULTATION
11.6 I Iii
NOTE: ARRAY ORIENTEDNORMAL TO THE
SU_ LIVEWITHINO. DEAD BAND
0
I I SUNSET
I iI
0
Figure 3-27:
SUNRISE
2 3
TIME AFTERSUNRISE (HOURS)
Array Current and Temperature vs Time
220
180
140
100
-100
-140
-180
-220
116
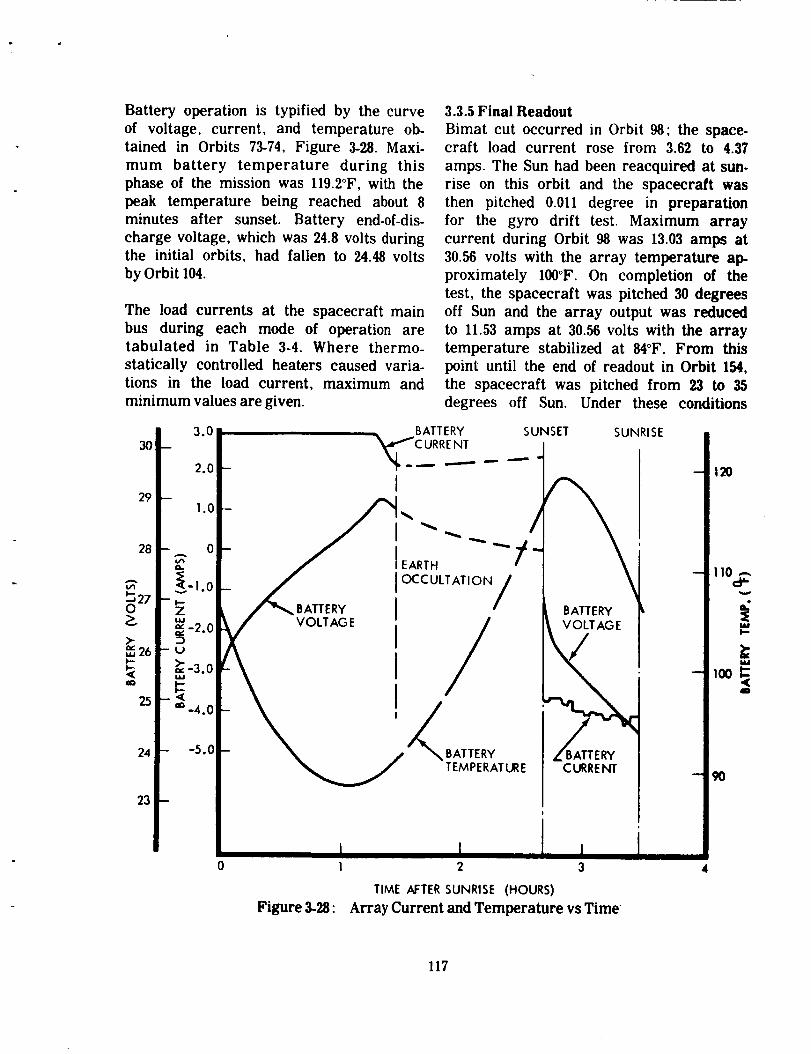
Battery operation is typified by the curve
of voltage, current, and temperature ob-
tained in Orbits 73-74, Figure 3.28. Maxi-
mum battery temperature during this
phase of the mission was 119.2°F, with the
peak temperature being reached about 8
minutes after sunset. Battery end-of-dis-
charge voltage, which was 24.8 volts duringthe initial orbits, had fallen to 24.48 volts
by Orbit 104.
The load currents at the spacecraft main
bus during each mode of operation aretabulated in Table 3-4. Where thermo-
statically controlled heaters caused varia-
tions in the load current, maximum and
minimum values are given.
3.3.5 Final Readout
Bimat cut occurred in Orbit 98; the space-craft load current rose from 3.62 to 4.37
amps. The Sun had been reacquired at sun-
rise on this orbit and the spacecraft was
then pitched 0.011 degree in preparation
for the gyro drift test. Maximum array
current during Orbit 98 was 13.03 amps at
30.56 volts with the array temperature ap-
proximately 100°F. On completion of the
test, the spacecraft was pitched 30 degrees
off Sun and the array output was reduced
to 11.53 amps at 30.56 volts with the array
temperature stabilized at 84°F. From this
point until the end of readout in Orbit 154,
the spacecraft was pitched from 23 to 35
degrees off Sun. Under these conditions
3O
29
A 28
26I--'
25
24
23 - i0
BATTERY
B_ATTERY_ BATTERY
TEMPERATURE C URRENT
|
i I I I1 2 3
TIME AFTER SUNRISE (HOURS)
Figure 3-28: Array Current and Temperature vs Time
120
I lOc_
117

OPERATIONAL
MODE
Cruise
Photo Standby
Camera On
Table 3-4-SPACECRAFT LOAD CURRENTS
DAY
PHOTO SPACECRAFT LOAD
..HEATERS EE07 {Amps)
X
NIGHT INHIBITED Min. Nom. Max.
DAYTIME
X 3.753.49 3.62
3.37 3.49
3.49 3.49
5.11 5.17
6.20 6.32
6.26 6.56
4.18 5.84
3.81
X 3.93
TWTA On X 5.78
R/O ElectronicsOn X 6.56
R/O Drive On X 6.68
Processing X 6.26
NIGHTTIME
Photo Standby X 4.06 4.12 4.18
Canopus Tracker On X 4.25 4.31 4.37
the power subsystem was able to supply all
the normal spacecraft loads and maintain
the bus voltage at 30.56 volts during day-
light.
In Orbit 149 an anomaly occurred within
the photo subsystem. During attempts to
escalate the problems, the maximum load
current was 8.05 amps, which caused the
bus voltage to drop as low as 29.28 volts
for one telemetry frame.
3.3.6 Component Performance3.3.6.1 Solar Array
Mission III is the first of the Lunar Orbiter
missions to be accomplished under a de-
creasing solar intensity. Solar ari'ayperformance, when normalized to a
standard solar intensity, would be a dupli-
cation of the preceding missions with,
similar normalization. Orbit 43, plotted
in Figure 3-27 as typical, shows the char-acteristic profiles of output current and
panel temperature. But because the solar
intensity decreased during the mission, the
output was accordingly reduced by ap-
proximately 1% in addition to the decrease
caused by the degradation from environ-
mental exposure and thermal cycling. The
decreasing output from all causes is
illustrated by the four curves of array cur-
rent versus temperature, Figure 3-29. Toillustrate array output as a function of
array degradation and solar intensity,
Figure 3-30 was plotted with these para-
meters normalized in percent of their
values at initial orbit injection. Array de-
gradation is the difference between the
decrease of array output and the decrease
in solar intensity. From this figure it ap-
pears that the rate of solar array degrada-
tion becomes constant at slightly over 2%
after approximately 100 orbits.
118

u
13.4
13.2
13.0
12.8
12.6
12.4
12.2
12.0
I
-160
+3--
ORBIT43
ORBIT ORBIT
25 154
I I i I I I I
-120 -80 -40 0 40 80 120
ARRAY TEMPERATURE (0 F)
Figure 3-29: Array Current and Temperature vs Time
I
150
J I
2OO
A
t¢v
+2
+1
I ALL PARAMETERS NORMALIZED|WITH VALUES AT J
INITIAL ORBIT INJECTION J
ORBITS
50 I00
ARRAY DEGRADATION
150
Figure 3-30: Solar-Array Degradation
119

Although the accuracy of solar array temp-
erature and current telemetry is approxi-
mately _+2.2% and, thus, greater in magni-
tude than calculations of degradation, thecalculations are considered valid because
they are based on the ratio between two
values of output current from the same
panel at the same indicated temperature.
Thus, the degradation calculation accuracy
becomes a stronger function of the repeat-
ability of the telemetry and a weaker func-
tion of the absolute accuracy of the tele-
metry.
3.3.6.2 Batte_
Battery performance was satisfactory
throughout Mission III although battery
temperatures tended to be higher than in
Mission II and were more comparable to
those experienced in Mission I. In addition,
during the cislunar phase of the mission the
temperature differential between the two
battery modules was varying from 3°F to as
high as 11.4°F as the attitude of the space-
craft was changed. Later in the mission when
the spacecraft was in lunar orbit the module
temperatures were more in accordance with
one another and the temperature difference
was generally just 1 or 2 degrees. The maxi-
mum batterytemperature of 122.2°Foccurred
92 hours after launch during lunar orbit in-
jection.The end of discharge voltage was
24.8volts during the initiallunar orbitsand
had fallento 24.48voltswhen the end of dis-
charge was lastseen inOrbit 103.
The battery depth of discharge throughout
the mission is shown in Figure 3-31.From
Orbits 75 through 154,part or allof the bat-
tery discharge data was occulted, and pre-
dicted values of battery discharge current
and temperature were used to calculate the
depth of discharge. This accounts for the ap-
parent greater variationindepth ofdischarge
during thisperiod. At other times, the vari-
ance is a function of the telemetry accuracy
only.
3.3.6.3 Charge Controller
The charge controller on Lunar Orbiter
III performed as expected, with the charge
being limited to 2.877 amps during the con-
stant current mode of operation. About 80
minutes after sunrise the battery voltage
and temperature sensing circuits in the
charge controller caused it to go into the
constant potential mode of operation, de-
creasing the charge rate. As in previous
missions, the cooler the battery at this
time the more pronounced the effect of the
taper charge. Minimum charge rates of
1.80 and 2.41 amps were obtained at bat-
tery temperatures of 74 and 100°F, respec-
tively.
3.3.6.4 Shunt Regulator
This unit operated properly throughout
the mission. Dissipating as much as 250
watts at times, it limited the bus voltage
to 30.56 volts whenever the array outputexceeded the load demand.
3.4 ATTITUDE CONTROL SUBSYSTEM
PERFORMANCE
The Lunar Orbiter III attitude control sub-
system performed with accuracy satisfying
all mission objectives. Any problems that
occurred were accommodated by changes
in operational procedures. Operationalconsiderations to control temperatures
required an off-Sun attitude for about two-
thirds of the mission. Use of the Canopus
star tracker was restricted to sunset per-
iods except during cislunar flight. The
revised operational procedures met per-
formance requirements while maintaining
an acceptable nitrogen consumption of
7.0 pounds for the photographic mission.
120

3OLEGEND:
I +VARIANCECALCULATED VALUE
I -VARI ANCE
18 -
Figure 3-31-
ii Ir
i I i50 100 150
ORBIT NUMBER
Spacecraft Battery Depth of Discharge
The attitude control subsystem maintains
control of the attitude of the spacecraft
with respect to inertial and celestial refer-
ences. Control with respect to celestial
references (conventional limit cycle) is ac-
complished using Sun sensors in the pitch
and yaw axes and a Canopus tracker in the
roll axes for position reference. Rate damp-
ing is provided by a single-axis floated
gyro in the rate mode. Control of the space-
craft with respect to inertial reference
(inertial hold) is by means of the gyros in
the rate-integrating mode for all three
axes. Lead-lag networks on the output of
the gyros are used for rate damping. Ma-
neuver commands are relayed by the flightprogrammer and switching assembly to the
closed-loop electronics. Maneuvers are
performed with the gyros in the rate mode.
Integration of rate-mode output is used to
measure and control maneuver angles. Con-trol torques are generated by nitrogen thrust-
ers located on the engine-mount deck. Con-
trol of pitch and yaw attitude during engine
burn is by means of actuators that vector the
engine in response to rate-integrating-mode
output of the gyros. Throughout the mission,
the attitude control subsystem maintained
stable operation for both reaction controland thrust vector control.
121

During Mission III, the attitude control
subsystem performed its many design
tasks within specification. It received com-
mands through the flight programmer to
perform 383 single-axis maneuvers duringthe mission. Maneuver accuracy of the sub-
system was within the design tolerance.Attitude maneuver rates for all axes were
within the design limits of 0.55 _0.05 de-
gree per second for maneuvers in narrowdeadband. Maneuver rates in the wide
deadzone ranged from 0.05 to 0.061 degree
per second.
The attitude control subsystem maintained
spacecraft orientation with respect to the
Sun and Canopus on command within +0.2
and 2.0 degrees, depending on the selecteddeadband. Deadband accuracies were with-
in telemetry resolution for narrow andwide deadzones.
Attitude control was maintained with the
spacecraft pitched from 15 to 45 degrees
away from the Sun for approximately 56%of the mission. Drifts in the inertial refer-
ence were within design limits, which re-
duced the frequency of updating thisreference.
Stable thrust vector control of the space-
craft attitude was maintained through
three velocity control engine burns. Space-craft-burn termination occurred within the
design tolerances as far as could be de-
termined from the telemetry resolution.
Operational methods used to control space-
craft attitudes by mission phases to cir-
cumvent problems and meet mission re-
quirements are presented below.
3.4.1 Cislunar Coast
The cislunar portion of the mission requireda 36.degree pitch off the Sun to reduce over-
heating and delay thermal paint degrada-
tion. A minus 36-degree pitch maneuver was
performed after Canopus had been initiallylocated. This attitude was maintained until
the midcourse maneuver sequence. After
the midcourse maneuver, a plus pitch 36-
degree maneuver was performed; this at-
titude was maintained until the lunar orbit
injection sequence. Both 36-degree pitch
maneuvers were performed in wide dead-
zone to conserve nitrogen gas and at the
same time calibrate the pitch coarse Sun
sensors. To prevent possible loss of the
reference star due to tracker "glint," Cano-
pus was not acquired in a closed loop during
the cislunar phase of the mission. Canopus
reference was maintained by rolling the
spacecraft to place Canopus in the tracker
field of view after each pitch maneuver.
3.4.2 AV Maneuvers
The midcourse correction, lunar orbit in-
jection, and orbit transfer maneuvers were
performed based on a closed-loop Sun refer-
ence for the pitch and yaw axes. The roll-
axis reference was established by an open-
loop roll update maneuver from 2 to 5 hours
prior to the start of the roll maneuver for
the velocity correction. The roll axis drifted
through a near zero-error condition at a pre-
determined gyro drift rate, at the time the
roll maneuver for the velocity correction was
initiated. Roll errors--with respect to Cano-
pus--for midcourse, injection, and transfer
were -0.12, -0.29, and -0.08 degree, respective-
ly.
3.4.3 Photo Maneuvers
In general, each photo site required a three-
axis maneuver, usually a roll, yaw, and
pitch sequence. There were 41 three-axis,
8 two-axis, and one single-axis maneuvers
to the photo attitude, and as many reversemaneuvers back to the celestial references.
All photo maneuvers were performed with
the spacecraft in narrow deadzone. The
122

pitch and yaw axes were lockedon the Sunprior to the photo sequence, thereby en-suring a reference point with a ±0.2-degreetolerance with respect to the Sun. Acquisi-tion of Canopus at the start of the photosequencecould not be done becauseof theCanopus tracker glint problem. It wasnecessary,therefore, to turn the tracker onduring thesunsetperiodprior to thephotoandacquire Canopusfor 3 minutes to establisha roll reference. The tracker was turned off4minutesbeforesunrise.The photo maneuversequencewas initiated10to 15minutes after the Canopusreferenceupdate. Due to the Canopus update se-quence, the following errors with respectto Canopuswereincurred.
1) The roll gyro did not obtain a perfectupdate, i.e., zero-roll error whenswitched from the rate mode (Canopustracked in a closed-loopmode) to theinertial-hold mode at the time thetracker was turned off. This error was
always less than ±0.2 degree (deadzone
accuracy) but represents a normal
spacecraft operational mode.
2) Roll gyro drift angle between tracker
off and the start of the photo roll ma-
neuver; this error amounted to ap-
proximately -0.03 degree.
3_ Position of roll gyro relative to space-
craft deadzone at the start of the photo
roll maneuver, i.e., when the roll gyroswitches from the inertial-hold mode
to the rate mode; this error was always
less than + 0.2 degree.
Table 3-5 contains a tabulation of the initial
roll errors, with respect to Canopus, at the
start of the photo roll maneuver. The high-est initial roll error recorded was +0.36
degree for Site IIIS-13.
Table 3-5 also contains the deadzone dur-
ing the photos. These data do not define
camera pointing errors, but represent the
position of the spacecraft in the deadzone
while the shutter was opened.
Attitude maneuver rates during the photo
taking sequence were well below the _ 0.01
degree per second design limit. These dataare also tabulated in Table 3-5.
The crab-angle sensor was not used as an
attitude reference at any time. This table
also defines the average values of crab
angle during the shutter-open sequence.
3.4.4 Readout
Off-Sun operation was required through-
out readout to satisfy thermal requirements
and retard thermal-paint degradation. A
minus 30-degree pitch maneuver was per-
formed while locked on Canopus at the be-
ginning of readout. The minus 30-degree
pitch maneuver was chosen to satisfy all
constraints. Automatic updating of the
roll axis by acquiring Canopus was con-
tinued. It was necessary to monitor the
yaw axis to keep Canopus within the
tracker yaw field of view and at the same
time satisfy antenna pointing constraints.
The pitch axis required periodic update
maneuvers to maintain the spacecraft with-in readout limits.
Roll and yaw data were readily available
during readout because the spacecraft
position error did not exceed sensor tele-
metry saturation limits. The pitch axis,
however, reached a Sun sensor telemetry
saturation level at _ 29.0 degrees. It was
therefore necessary to calibrate solar panel
array current versus total angle off the Sun
to determine pitch attitude. Knowing the
total angle off-Sun and yaw angle, pitch
angle could be determined. This procedure
123

-I
Table 3-5"
I'I I()'I'()
SITE
I'I-$1
P2a
I '2b
$2S-3
S-4
P-3
P-4P-5a
P-5b
I'-6
S-5
S-6
S-7
S-8
S-9
S-10
S-If
S-13
P-7aP-Tb
S-14S-15
S-16
S-17
S-18
S-19
S-21
S-21.5
S-22
S-20
P-8
S-23S-24
P-9a
P-9b
P-9c
S-25
S-26
P-10
S-27
S-28P-II
P-12b.2
l'-12a
P-12b.l
P-12c
_29
S-_
s.31
ATTITUDE CONTROL SUBSYSTEM DATA DURING PHOTO OPERATIONS
NUMi]EI{
()1,"
FRAMES
16-4
8
4
I
I
I
48
8
8
4
11
4
1
1
4
1
1
8
8
1
4
1
4
44
1I
I
!
8
4
18
8
8
I
1
8
1
!
8
416
4
8
I
!
I
INITIAl,
i{()1,1.
: EI¢.I{()I{
deg. )
*0.ff26
0.098
0.0:_
0.148
0.076
,0084
,0.079
0.075
,0.I17
,0.108
*0.0160.093
, • 137
-0.008
O.137
*0.016
- 0O80
+0.113
_0.093
-0.176
-0.052
0.066,0.050
-0.028
-0.259
-0.033-0.042
-0.126
-0.387-0.042
0074
-0 066
,0.108
*O. 137
,0.040
,0.027
-0.056
-0.157-0.032
.0.147
--0.340
,0.141,0.021
0.046
'0.115
*0.006
*0.209
0.104
0.172
MAX. ItA'rE I)LIItlN(; I'11( )'1'(
(deg/se(' I
R()I.I,
, .0(H0
*0018
.0010
0
.0041
0
O018
0
t .0010
O021
.0011
0
, .0012
0
.0027
.0020
-.0065
-.0064
.0021
*.0010
0
- 0022.0020
0
-.0018
.0093
-.00160
0
, .0020
+ .0024, .0010
+.0008
¢.0008
, .0010
*.0010
0
, .0012
* 0020
¢.0010
-.0043
.0038
0
0
• .0022
,0014
-.0012
, .0026
PITCll YAW
* .0014 O019
0 *O012
,O012 .0011
.0014 , .0011
0 0
, .0024 .00l I
* 0020 .0013
- 0018 , .0023
.0010 .0010
0 0
0 0
.0009 0*0022 ...0011
*O012 0
.0023 .0013
.0017 , .0023
, .0013 .0020
0 ,.0009
0 .0012
+.0020 0
0 , O0120 .0022
, .0015 0022
0 ..0009
0 +.0010
0 +.0010
- .0014 - .0017
*O021 _.0010
.0016 0
0 0
.0020 -O014
-.0010 , .0024
0 .0023
_.0011 0
0 , .0010
, O017 0
0 -.0011
, .0010 0
*0007 O012
0 0
, O013 0
0 0
- .0012 +.0011
-.0011 _.0009
0 0
*.0014 -O013
.0020 * .0008
*.0006 - .0007
I)EAI)Z()NE VAItlA'rI()N
I)URIN(; I'1 I()'1'()
( deg. J
ROI J.
.13
.IB
.15
*.13
.12
.13
.16
.15
.16
.15
_.(_
, .17
.18
" .15
.14
.12
0
, .08
- .04
- .15
+.12
.11
".14
.10
0-.17
.11_.16
-.18
- .08
-.12
--.12
.16
-.15
-.16
-.14
.16
-.15-.05
-.16
--.0_
.17
.17
.17
' .!0--.15*.13
-.08
AVEI{A(;ECRAB AN(;I,E
I)URIN(; I'll()'r(}{deg. )
Iq'l'CII YAW
.11 , .12 35
.16 .16 .35
.14 , .14 .90
*.15 .16 .53
.13 , .14 53
04 *.10 .25
*.02 _.II 20
*.17 -.09 .20
.14 ,.12 .45
'. 14 -. 18 *22
, .14 .16 .13
1.12 .18 .80
-.10 , .i7 .40
•13 *. 16 .53
-.12 .16 .I.4,. 17 , .04 .15
.12 , .11 .53
,.14 .13 .53
,.16 , .16 .90
.06 ,. 16 35
+. 14 .12 95
, .09 *.16 30
' .15 ' .16 .60
, .12 .18 .53
-. 18 -.08 .35
-.16 -.14 -.30
- .16 _.14 -.53
+.i2 -.16 -.53
-.04 *. 14 , .05
-.12 _.14 53
-.06 ,.16 25
.10 -.14 +.25
-- +.18 .53
, .15 -.15 , .30
, .17 -.08 ,.15
*.16 -.13 .55
• .17 +.16 - 53-.16 ' .16 " .53
-.il *.15 105
-.16 _.16 .53
-.12 ,.16 .53
, .16 .13 , .25
, O8 - .10 ,30
+06 -.12 ' 25
+ .14 .18 ' 25.17 , .16 -1.4
, .12 -.14 -.53
-.15 , .14 53
124

proved to be accurate within _ 0.3 degree,
averaging over a period of several days.
3.4.5 Component Performance
"¢.LA. I C.noptts Nt.r Tr¢.'ker
The Canopus tracker was first turned onat 036:08:06, approximately 7 hours into
cislunar flight. Result of the first star map,at 036:08:13, was uncertain because of data
loss during the maneuver, however, a
second roll of 360 degrees at 036:09:44 was
successful in establishing a roll reference.
At 036:11:52, the spacecraft was rolled
+125 degrees to Canopus and a tracker off-
on cycle was performed to observe andtrack the star.
Canopus was tracked without controlling
the spacecraft in the closed-loop modethroughout cislunar. The tracker lost
Canopus six times during this period: once
when the squibs were fired, four times
with no apparent spacecraft disturbance,
and once just prior to injection when the
Moon aibedo caused a pronounced glint
problem. Each time track was regained
by performing an off-on cycle.
Star map signal was initially 3.7 volts,
decayed to 2.6 volts through cislunar, andrecovered to 3.25 volts by the end of the
mission. Following injection the tracker
was operated only in the dark.
During sunset of the fourth orbit, at
040:11:39, Canopus was acquired in the
closed-loop mode. For the remainder of
the mission the basic operational proce-
dure was to operate the roll axis in the
sensor mode fusing celestial references)
so that Canopus would be acquired each timethe tracker was turned on.
A star map was performed at 041:02:08.
Results of this map agreed well with the
apriori maps.
Through GMT 061 the tracker had been on
for a total of 79 hours, having gone through
158 on-off cycles.
3.4.5.2 5.n Sensors
The Sun sensors
for Mission III,
reference for a
situations.
performed as expected
providing a celestial
variety of nonnominal
The initial Sun acquisition took place auto-
matically within the required 60 minutes
from launch. During the initial Sun acquisi-
tion as soon as the telemetry data was good
(56 minutes after launch), it was observed
that the Sun had already been acquired in
pitch and yaw. The exact time of acquisition
could not be determined. Reacquisition of theSun after Sun occultation of attitude ma-
neuvers was performed approximately
126 times; 121 of these acquisitions were
done in the narrow deadband and five were
done in the wide deadband. Every acquisi-
tion went as expected.
The Sun sensor readings while occulted from
the Sun are presented below.
SUN SENSOR OUTPUT DURING
SUN OCCULTATION
MODE PITCH YAW
(deg) (deg)
Fine Observed T/M
Ground Test
Coarse
+0.002
-0.093 to+0.097
-0.044
-0.140to
+0.052
Observed T/M -0.11 +0.24
Ground Test -0.397 to -0.343 to+0.750 +0.814
*NOTE: Resolution of the telemetry for
coarse mode is 0.3 degree.
These values are close to those observed dur-
ing ground testing and are useful in ascer-
taining null shift in sensor position readings
when viewing the Sun.
125

The capability of switching between fine,
coarse and fine, and coarse only Sun sensors
proved invaluable for "off Sun" operation.
The ability to stay off Sun for extended per-
iods using the coarse Sun sensors greatly
reduced nitrogen consumption. Yaw Sun
sensor degradation due to a large pitch atti-
tude was approximately the same as ob-
served for Missions I and II. This degrada-
tion at a pitch angle of 30 degrees is approxi-
mately 0.75. Moonlight on the coarse Sun
sensors caused shifts in error output for vari-
ous portions of the orbit as on previous mis-sions with no effect on the mission.
Two Sun acquisitions were performed in thewide deadzone. Rates were observed to be
0.105 and 0.178 degree per second. The ex-
pected rate is 0.60 + 0.50 or 0.10 to 1.1 degree
per second.
3.4.5.3 Closed-Loop Electronics
The closed-loop electronics performed
without incident throughout the mission.
The closed-loop electronics successfully
selected, on command from the pro-
grammer, the inertial reference unit, Sun
sensors, and Canopus star tracker, closing
the loop between sensor outputs and vehicle
dynamics.
The minus pitch Sun sensor limiter had a
very "hard" limit at 29 degrees, while
the plus pitch Sun sensor limiter had a
"soft" limit at 29 degrees.
The minimum impulse circuit or "one
shot" appeared to be operating between
11 and 14 milliseconds throughout the mis-
sion (typical values for Missions I and II
also). A value of 11 milliseconds is nominal.
The minimum impulse circuit allowed
"approximate single pulses" of 50, 50, and
20% of the time during limit cycle operation
for the roll, pitch, and yaw axes, respec-
tively. This type of operation was possible
in the inertial-hold and gyro-rate modes
for both the 2.0-and 0.2-degree deadband.
3.4.5.4 Reaction Control System
The reaction control system thrusters per-
formed satisfactorily during the mission
The thrusters operated approximately
17,000 times during the mission; 1654 opera-tions were for attitude maneuvers and the
remainder were for limit cycle operation.
The individual thruster performance was
evaluated for as many of the spacecraft ma-
neuvers as possible. Actual, predict values,
and specification values for each axis aretabulated below:
THRUSTER PERFORMANCE
Roll
Pitch
Yaw
0.069 _=0.004
0.065 + 0.003
No data
Z
0.063 + 0.003
0.056 + 0.003
0.058 ± 0.003
0.051 to 0.070
0.045 to 0.062
0.045 to 0.062
The observed thrusts are higher than the pre-
dict values. There were no yaw maneuvers
that allowed a yaw thrust determination.
However, the yaw thrust was probably ap-
proximately 0.065 pound. The roll and pitch
thrust values are within specification toler-
ance but tend to be high. These slightly high
thrust values in no way degraded the mission
or the maneuver accuracy, and nitrogen
consumption was not increased perceptibly.
Slight cross coupling was observed during
maneuvers and limit cycle ; however, in view
of the data observed, it is impossible to esti-
mate the magnitude of the cross coupling or
126

evento determine if it is causedby thrustermisalignmentor gyrocrosscoupling.
3.4.5.5 Thrust I color Control System
Control of spacecraft attitude during the
three engine burns were performed as re-
quired by the thrust vector control system.Residual rates after each burn were lower
than predicted maximums for stable TVC
limit cycle operation.
Travel of the center of gravity from nominal
was small and compares closely with Mission
II. Maximum excursion of the actuators for
all of the burns were: pitch -0.2 to +0.21 de-
gree and yaw +0.02 to +0.35 degree.
3.4.5.6 Inertial Reference Unit
The inertial reference unit performed satis-
factorily throughout the mission. The gyro-
rate-integrating-mode drifts were low and
stable. Over the duration of the mission roll,
pitch, and yaw were: -0.12+0.01 +0.15x0.03,
0.02 + 0.03 degree per hour, respectively.
Spacecraft maneuver errors as determined
from 360-degree maneuvers are tabulatedbelow.
Roll +360
Roll -360
Pitch +360
Yaw +360
Yaw -360
[-Z
360.19
-359.74
360.45
360.56
-359.89
+0.19
+0.26
+0.45
+0.56
+0.11
O
0.05
0.07
0.13
0.16
0.03
These errors are partly attributable to gyro-
rate-mode error and partly to voltage to fre-
quency converter error, which are not separ-
able in telemetry data.
Gyro-rate-integrating-mode output was found
to agree with the tracker/Sun sensor position
output within 0.03 degree, which is about theresolution of the measurement involved.
Gyro wheel currents were nominal and
stable. Gyro thermal control was normal withno indication of heater saturation.
No direct method of evaluating accelero-
meter performance is available. At this
writing computations have not been per-
formed that will allow comparison of actual
and commanded aV magnitude.
3.4.5.7 Flight Progra miner,4 nd
S witching ,4ssembly
The command relay function of the flight
programmer and switching assembly is
essential for proper spacecraft attitude
controL. The flight programmer responded
correctly to every command received from
the command decoder during the mission.
n,_ Uo,-,_h...,_ .9 (Day am_., 19g,g, rt_ul_tirnt_ t_c_rn_
mands and 2349 stored program commands
had been received as of 1530 GMT. Repeti-
tive execution of stored program com-
mands account for an estimated total of
14,000 commands executed correctly by the
programmer. Total programmer clock
drift was -0.16 second. The programmer
breadboard was used satisfactorily at the
SFOF to follow the mission sequence of
commands and to maintain a check of flight
programmer operations during spacecraft
occultation periods. All stored-programcommands that were to be transmitted to
the spacecraft were first checked on thebreadboard.
3.4.6 Nitrogen Consumption
Nitrogen consumption for the attitude con-
trol system for Mission III is presented in
Figure 3-32. Missions I and II usage is also
presented for comparison.
127

I
Z0
I i I I I I
(SONrlOd) _o','sn i_N W:IISAS 70_IINOD 30n1111v
I
Ro
o
oo
o
o
m
ZO
t_
O
e-,,
in
Ov
o
Z
m
0
0
e4
r_

Nitrogen usage for Mission III is sub-
stantially more (1.20 pounds) than for Mis-
sion ll. Mission III did have ll more photo
maneuvers and 69 more pitch-off thermalmaneuvers than Mission II. Other than
those differences, Missions II and III were
very similar in gas usage.
At Day 062, the amount of unaccounted nitro-
gen since launch at Day 036 was approxi-
mately 0. l0 pound : this is 0.003 pound per day.
The slight disturbance (0.004 pound per day)that occurred in one to three axes whenever
the tracker was turned on during Mission II
did not occur during Mission III.
The total nitrogen quantities used for Lunar
Orbiter photo missions follow.
Attitude ControlSystem
Velocity ControlSystem
Leakage
Total
Initial N 2 atLaunch
N 2 for ExtendedMission
7.80
3.38
1.13
12.31
15.10
2.79
Nitrogen
5.50 7.00
3.14 2.70
0.0 0.0
8.64 9.70
15.15 15.17
6.51 5.47
The maneuvers performed on Mission III
for launch through 062:07:17 GMT are givenbelow.
MISSION IIIMANEUVERS
Purpose of_aneuver
o: [-_9
a_
Star Map 0 4 0 0
Attitude 5 4 0 1Update
Thermal 0 0 10 57Pitch Off
Velocity 0 6 0 6Change
PhotoManeuver 0 104 0 94
Other 2 3 0 5
Subtotal 7 120 10 163
Total 127 173
Celestial
Acquisitions
Canopus Acquisitions
Sun Acquisitions
Deadband Closures
0
0
0
0 0
0 82
0 0
0 3
83
0 0 3 3
1 5 6 30
0 10 57 10
0 12 12
0 280 286
2 8 17
17 66 358
383 358
bJ_2
i
19 127
5 127
< <Z
108
116
9
WDZ = Wide Deadzone
NDZ = Narrow Deadzone
3.4.7 Problem Areas
During Mission III, there were problemswith equipment in or related to the attitude
control system, or in other subsystems that
resulted in a nonnominal operation of the
attitude control system. Summarized be-
low are the problems and their effects on themission.
129

1.,1.7. I Tberm_d I'roMem
Again on Mission III, spacecraft overheat-
ing was encountered, resulting in operating
the spacecraft in a pitch off-Sun attitude for
approximately 65% of the mission. As a
result, 73 maneuvers were required for
pitch-off maneuvers and updates of the
inertial reference as compared to 151 ma-
neuvers during Mission I and 25 maneuvers
during Mission II. There were a greater
number of thermal maneuvers performed
during this mission because of the pitch-off
requirements during the photo mission that
were not required on Mission II.
3.4.7.2 Tracker Glint Problem
Tracker glint continued to be present onMission III as well as Missions I and II.
During Mission III, Canopus track was lost
six times tall of which were during the
cislunar phase with the spacecraft in the
Sun). Canopus track was regained each
time by cycling the tracker off, then back
on. The sixth loss of Canopus occurred
about 5.5 hours prior to lunar orbit injec-
tion when reestablishment of the Sun/Cano-
pus reference was performed. Severe glint
continued for about 1.5 hours, making Cano-
pus track impossible. The tracker regained
lock on Canopus 1.5 hours after initial Cano-
pus loss and a successful injection burn was
obtained. If Canopus track could not be re-
gained, a possible error of 1.5 degrees may
have resulted in the orbit injection man-
euver. Following orbit injection the tracker
was used only in the shadow of the Moon
without glint problems.
3.5 VELOCITY CONTROL SUBSYSTEM
PERFORMANCE
The velocity control subsystem (VCS)
is a liquid bipropellant, pressure-fed, ex-
pulsion-bladder propulsion system using
a single 100-pound thrust, radiation-cooled,
gimbal-mounted rocket engine for mid-
course, orbit-injection, and orbit-
transfer maneuvers. The propellants
are N204 and Aerozene 50 (a 50-50 mixture
of hydrazine and UDMH). Nitrogen gas is
the pressurizing medium.
Operation and performance of the VCS
was well within specification throughout
the mission. Three propulsive maneuvers
•were conducted in support of the primary
mission; these were: 5.09-mps midcourse,
704.3-mps orbit injection, and 50.7-mpsorbit transfer.
Prelaunch propellant and nitrogen ser-
vicing operations were accomplished with-
out difficulty. There were 275.873 pounds
of propellant and 15.17 pounds of nitrogen
loaded; the spacecraft launch weight was
856.71 pounds. Based on this data, the nomi-
nal velocity increment capability of the
VCS was determined to be 1010.6 mps with a
3-sigma tolerance of +43 mps.
Flight-data-performance analysis indicates
that during the midcourse maneuver, the
rocket engine average thrust was ap-
proximately 10'2.5 pounds; thrust deter-mination was difficult because of the short
(4.3 seconds) operating time. Delivered
thrust during the orbit-injection maneu-
ver was calculated to be 99.85 pounds. Dur-
ing the transfer maneuver, the delivered
thrust was 100.3 pounds. The engine specific
impluse was determined to be ap-
proximately 276.5 to 277.5 seconds during
all three maneuvers. A total velocity
change of 760.09 mps has been imparted to
the spacecraft with a total engine operat-
ing time of 580.5 seconds.
The sections following present the various
aspects of the velocity control subsystem's
operation during the flight of Lunar Orbiter
III as supported by the SPAC at the SFOF.
130

This includesdiscussionof the launch count-
down and flight events. Emphasis is placed on
flight operations and VCS performance dur-
ing propulsive maneuvers. Before entering
into the discussion of system operation and
its characteristics, it is pertinent to brieflysummarize, in tabular form (see Table 3-6),
the results of the three propulsive maneuvers.
Table 3-6"
VELOCITY CONTROL SUBSYSTEM
MANEUVER PERFORMANCE
Midcourse
Predict
Actual
Injection
Predict
Actual
Transfer
Predict
Actual
5.11 4.5 ± 0.5
5.09 4.3
704.3 540.5 i 10
704.3 542.5
50.7 33.4,1.6
50.7 33.7
lu
99.6 273.2
=102.5 ._276
100 I 276
99.85 277
101.3 277
100.3 277
3,5.1. ESA Spacecraft Fueling Operations
After completing all Hanger S checkouttests, the Mission III spacecraft was trans-
ferred to the explosive safe area (ESA) for
fueling and pressurization, further testing,
and encapsulation into the nose shroud.
The propellant and nitrogen servicing AGEfunctioned without incident. Table 3-7 sum-
marizes the servicing quantities that were
loaded on board January 18, 1967.
After completion of velocity control subsys-
tem servicing, the complete flight-configura-
tion spacecraft was weighed and balanced;
launch weight was determined to be 856.71
pounds. Calculations were performed to
ascertain the velocity increment capability
Table 3-7:
PROPELLANT AND NITROGEN
SERVICING SUMMARY VELOCITY
CONTROL SUBSYSTEM
Fuel
m-Board, ( lb ) 94.123
Jllage Volume, (in 3) 63.0
'ressure, (psig) 45
'emperature,(°F ) 64
Oxidizer Nitrogen
181.75 15.17
118.89 -
45 3535
60 62
of the spacecraft based on the aforemen-
tioned weights and the rocket engine per-
formance as determined from ground test.
The a v capability was found to be 1010.6
with a 3 sigma tolerance of + 43 meters persecond.
3.5.2 Launch and General Mission Events
Through Midcourse Maneuver
The launch countdown was initiated on Feb-
ruary 4_ (Day 035) with power turn-on occur-
ring at 17:13 GMT; all velocity control sub-
system parameters were normal. The veloc-
ity control subsystem countdown test was
successfully conducted at 20:28 GMT, result-
ing in pitch- and yaw-actuator deflections of
-0.958 and +0.232 degree, respectively; maxi-
mum engine valve temperature was 70.6°F.
Vehicle liftoff occurred at 0117:01.120 GMT on
Day 036. Real-time telemetry loss occurred as
expected until acquisition of the spacecraft
by DSS-41 ; the spacecraft separated from the
Agena at 0139:39.67 GMT.
Upon acquisition by DSS-41 at 0213 GMT (Day
036), it was verified that the propellant tanks
had been pressurized to normal values of
193.6 and 193.8 psia, fuel and oxidizer, respec-
tively. By 1708 GMT, the gradually increasing
thermal environment had increased the pres-
sure levels to 195 and 198 psia, fuel and oxidiz-
er, respectively.
131

The next significant velocity control
subsystem event concerned bleeding the
propellant lines between the engine and
the then closed propellant-squib valves.The bleed event occurred at 1708 GMT on
February 5 (Day 036);the engine valves
were open for 30 seconds, thereby increas-
ing valve temperature by ll.3°F, as
expected. This activity was followed by
propellant-squib-valve actuation at 1720:31
GMT; propellant-tank-pressure decay
down to 194 psia provided positive confirma-tion of valve actuation.
The midcourse maneuver for trajectory
adjustment was designed for engine igni-
tion to occur at 1500:00.0 GMT on February
6 (Day 037), thereby imparting a velocity
change of 5.11 raps. The maneuver was
conducted without incident; a velocity
change of 5.09 raps was achieved with an
approximate engine operating time of 4.3
seconds. The slight difference between
desired and achieved velocity resulted
from round-off techniques in the command
generation programming; the flight pro-
grammer actually commanded the magni-
tude of 5.09 raps that was achieved.
3.5.3 Lunar-Orbit Injection through Final
Readout
The orbit-injection maneuver was pro-
grammed for engine ignition to occur at
2154:19.0 GMT on February 8 (Day 039);
the desired velocity change was 704.3 raps.
The maneuver resulted in orbital elements
that were well within the required
tolerance. Engine operating time was de-
termined to be 542.5 seconds; engine valve
temperature was 70 to ?7°F during engine
operation, and reached a maximum value
of 112.4°F approximately 1 hour followingthe maneuver.
The maneuver to transfer from the initial
orbit to the photographic reconnaissance
orbit was performed with engine ignition
occurring at 1813:26.6 GMT on February
12 tDay 043). The desired velocity change
of 50.7 raps was achieved with an engine
operating time of 33.7 seconds. Trackingdata indicated that the desired perilune
altitude was achieved with an error of ap-
proximately 0.1 kin. This maneuver com-
pleted the propulsive requirements
necessary to fulfill the primary objectives
of Mission III. At the end of the photo mis-
sion operations on March 3 (Day 061), the
spacecraft had a remaining velocity change
capability of 250 to 260 mps, and ap-
proximately 6.0 pounds of nitrogen for
attitude control purposes; the nitrogen
shutoff-squib valve had not been actuated.
3.5.4 Subsystem Time--History Data
Figure 3-33 presents the quantity of nitro-
gen gas remaining in the storage vessel
as a function of time throughout the
primary phase of the mission. The gas
weight data is calculated on the basis of
the storage tank's known volume, pressure,
temperature, and compressibility factor.
The data points are plotted at 6-hour in-
crements and represent a 6-hour average
centered about the plotted time. For refer-
ence, a nominal mission budget and a
significant-events code is included in the
plot. The actual consumption rates are
worthy of special mention. Note, for in-
stance, the extremely small usage during
the period between orbit injection andtransfer. This results from two factors:
(I) small gyro-drift rates, thereby requir-
ing only six maneuvers for attitude update
and thermal control; and (2) conducting
those maneuvers in the wide deadzone.
Consumption during site photography is
observed to be greater than the nominal
budget. This follows from the fact that
the budget is predicated on photographing
II sites; whereas, during Mission Ill there
132

A
Z
O
a.
Z
OOI'--u
Z
EVE_ITS: 0 1 2 3 4000 I
14 _II
II
12 iO_oI
oo%
10 / .. °%°_r_NO-RESERVE BUDGET_''_ o
NOMINAL MISSION _ _o_8 O-
0%O
6
4
2
' I I I
36 41 46 51
5
EVENT CODE:0. LAUNCH1. MI DCOURSE2. INJECTION3. TRANSFER4. STARTPHOTO5. END PHOTO ; STARTREADOUT6. END READOUT7. STARTEXTENDED MISSION
JACTUAL
i56 61
GREENWICH MEAN TIME ( DAYS )
Figure 3-33: Velocity Control System Available Nitrogen History
133

were 51 sites photographed in 55 orbits.
Nitrogen consumption during site photo-
graphy is calculated to be 0.632 pound per
day.
In Figure 3-33 note the increase in usage
rate beginning at approximately Day 051;
this results from the fact that, following
the reverse attitude maneuvers away from
a site, a fourth maneuver was included to
pitch the spacecraft off the sunline. Low
consumption rates are again apparent
during final readout; {i.e., 0.049 pound per
day). Even though the ACS was in the nar-
row deadzone mode, gyro drift rates were
minimal to the degree that only 12
maneuvers were required for attitude up-
date.
Figure 3-34 shows the variations in sub-
system pressures during the flight. The
fluctuations in propellant tank pressures
.are essentially the result of whether the
spacecraft was locked on the Sun, or
pitched off the Sun. The pressure profiles
throughout the mission are nominal.
ooo
0 !210F OXIDIZER, AP03 200 "._
190 _ "_-- FUEL, AP02 180 _-
N
gI I II I I I I lO
36 41 46 51 56 61
GREENWICH MEAN TIME (DAYS)
Figure 3-34: Velocity Control System Pressure-Time Histories
134

Figure 3-35 plots subsystem temperature/time histories in a similar manner l l2-hour
increments only l. Local temperature
values were generally in the region of 40
to 8fie during the flight, varying some-
what when the spacecraft was pitched on
and off the sunline. Propellant tank heaters
were used during the initial orbital phase
of the mission to keep propellant-tank-
deck temperature (ST04) above a value of40_'F. The heaters were activated on 21
occasions for a total on time of 1408
minutes; the average value of 67 minutes
per cycle produced an average temperature
increase of 4.7°F. All temperatures re-
mained well within acceptable limits.
7O
60-
50-
40-
i00-
g 9o-
TANK DECK, STO4
3.5.5 Maneuver Performance
During the primary photographic missionof Lunar Orbiter III, the velocity control
subsystem provided three propulsive ma-
neuvers for alteration of the spacecraft's
trajectory or orbital elements. These con-
sisted of midcourse, orbit-injection, and
orbit-transfer maneuvers; 760.09 mps of an
on-board nominal velocity increment capa-
bility of 1010.6 mps were expended. The
subsystem performance summary is pre-
sented in Table 3-6.
The orbit-injection maneuver (the most
representative) indicates that the system
!
I I 1 i36 41 46 51
GREENWICH MEAN TIME ( DAYS )
Figure 3-35: Velocity Control System Temperature-Time Histories
J I
56 61
135

had a delivered thrust of 99.85 pounds at
a specific impulse of approximately 277
seconds. For comparison, the engine on the
spacecraft demonstrated the following
performance characteristics during the
acceptance test.
Test Data
(5 sec) (70 see)I
Thrust 99.6 99.7
Specific Impulse 279.3 278.8Mixture Ratio 2.001 1.995
s
The engine acceptance test data is
normalized to a standard propellant
temperature of 70°F. An average value
of propellant temperature (ST04) during
flight, and specifically preceding the in-
jection maneuver, was approximately
53°F. Adjusting the acceptance test per-
formance for actual temperatures indi-
cates an anticipated flight specific im-
pulse value of 276.1 seconds. The agree-
ment between predicted and actual
performance is well within the capability
to evaluate flight telemetry results. It is
possible to infer an average operating mix-ture ratio; this is accomplished by
adjusting flight conditions with the proper
influence coefficients, and then comparing
with acceptance test data. For the orbit-
injection maneuver, the estimated
operating mixture ratio was found to be].99.
Figures 3-36 and -37 present velocity control
subsystem telemetry data obtained during
60I- _ _ NITROGEN TANK, AT01
•- ,
195 '_,
iFUEL TANK, AP02 ] N=185 "x
186 0
I ,,,, I I i , I I I0 I00 200 300 400 500 600
TIME FROM IGNITION (SEC)
Figure 3-36: Velocity Control System Orbit Injection Maneuver--System
Pressures and Temperatures
136

O AW ACTUATOR, A
o.
g
i -0.1
PITCH ACTUATOR, AD01
u
0
0 100 200 300 400 500 600
TIME FROM IGNITION (SEC)
Figure 3-37: VelocityControlSystem Orbit InjectionManeuver--System Dynamics
the orbit-injection maneuver; Figure 3-36
shows pressure and temperature data, and
Figure 3-37 plots dynamic data in the form of
gimbal actuator positions and accelerometer
output. It can be stated that the data, and
their trends, are nominal and as expected.
Engine valve temperature during and fol-
lowing each maneuver was normal. A brief
summation of maximum valve temperature
(AT03), resultingfrom thermal conduction,
ispresented inTable 3.8.
Table 3-8:
ENGINE VALVE TEMPERATURE
MAXIMUM CONDUCTION
oF
Midcourse. 84.8
Injection 112.4
Transfer ....... 100.1im
The maximum value generally occurred
60 to 90 minutes after maneuver comple-tion.
137

Table 3-9 summarizes gimbal actuator posi-
tion before and after each maneuver.
Table 3-9:
GIMBAL ACTUATOR POSITION
Launch
Midcourse
InjectionTransfer
Pitch, (deg.)
Pre- Post-
-0.040 -0.040
-0.063 0.191
0.191 -0.040
-0.017 0.115
Yaw, (deg.)
Pre Post
0.053 0.053
0.009 0.053
0.053 0.210
0.254 0.187
The slight discrepancies between the conclu-sion of one maneuver and the beginning of
the next are reflections of the resolution char-
acteristics of the data.
3.6 STRUCTURES AND MECHANISMS
A brief discussion of factors relating to thestructures and mechanisms of Lunar
Orbiter III follows. This involves a
presentation of vibration data observed
during launch, the deployment and squib-
actuation sequencing, and camera-
thermal-door operational history. No
micrometeoroid impacts were recorded;
one detector (DM-17) was punctured before
emplacement of the spacecraft on thelaunch vehicle.
3.6.1 Launch Vibration Environment
Figures 3-38 through -53 present vibration
data (as recorded from Agena telemetry)
from liftoff at 01:17:01.120 GMT to Agena
second cutoff at 01:36:55.5 GMT. For com-
parison, the upper envelope of spacecraftsinusoidal FAT vibration is included. The
flight data peaks fall well below the peaks
of the FAT envelope. These data are com-
parable to that observed during Missions
I and II.
3.6.2 Deployment and Squib Actuation
Following spacecraft separation from the
Agena at 01:39 GMT, the deployment se-
quence was initiated. Based on the stored-
program commands, antenna deployment
was initiated at 01:41:30.4 GMT, solar panel
deployment commenced at 0141:56.2 GMT,
and the nitrogen isolation-squib valve was
actuated at 0142:47.8 GMT. On receipt of
first good data from DSS-41 at 02:13 GMT,
it was verified that all deployment events
• had been successfully accomplished. The
VCS propellant isolation-squib valves were
successfully actuated at 1720:31 GMT.
As of the conclusion of the primary mission,
the nitrogen shutoff-squib valve had notbeen actuated.
3.6.3 Camera Thermal Door
No abnormalities were observed in actua-
tion of the camera thermal door. The unit
cycled satisfactorily on each of the 51 photo-
graphic sites.
3.6.4 Thermal Control
The thermal control subsystem of the
Lunar Orbiter spacecraft is a passive
system with the equipment mounted on a
Sun-oriented equipment mounting deck
(EMD). Heat generated by equipment is
conducted to the EMD, where it is radiated
to the space environment. The EMD is
coated with a low-solar-absorptance paint.
Thermal control is achieved by varying
the attitude of the EMD with respect to
the Sun. The equipment is enclosed
in multilayer blanket insulation and sup-
plemental heating is supplied, as needed,
to the propellant tanks and photo subsystem
by electric heaters.
Spacecraft temperatures were maintained
within prescribed temperature limits
throughout the mission - with the exception
of Orbit 149, during which the film-drive-
motor failure occurred. During this period,
from 061:16:00 to 061:18:00 GMT, the
138

100 _---UNFILTERED
Av.<L.
0
Z0
LU
I.IJ
U
lC
.1
0
o
x BECO• SECOC] AGENA FIRST IGNITIONA AGENA FIRSTCUTOFF0 AGENA SECOND IGNITION
V
I
FLIGHT DATA VS FATRESPONSEENVELOPE
10 100
FREQUENCY (Hz)
Figure 3-38: Spacecraft Vibration--Peak Longitudinal Response ( 214 x)
139

100 f J-- UNFILTERED
z_X
ZO -D
uJ I
ia.i
u
J
B
m
D
r7z_
x BECOo SECOo AGENA FIRST IGNITIONz_ AGENA FIRST CUTOFFo AGENA SECOND IGNITION
FLIGHT DATA VERSUS
FAT RESPONSE ENVELOPE
I I I I I lllJ I I I I ' l.'j i i
10 100
FREQUENCY (Hz)
I I
Figure 3-39: Spacecraft Vibration--Peak Lateral Response ( 210 z)
140

-!10
-210
ENVE LOPEFAT RANDOM
_HTDATA
10-5
LIFTOFF TO LIFTOFF + 3.0 SEC.
I0
Figm e3- :
100 1000 100(]0
FREQUENCY (Hz)
p
Random Response at Liftoff--Longitudinal Pickup (214 x)
141

10-1
10"_
"e-FLT DATA
LIFTOFF TO LIFTOFF + 3.0 SEC.
I0 100 1000
FREQUENCY (Hr.)
Figure 3.41: Random Response at Liftoff--Lateral Pickup (210 z )
142

-t-
O
10-2
__ 10-3
Z
a
I,m
n_
W,I
1o-4
10-5
10m
m
m
m
m
m
m
pm
bm
m
m
m
m
m
m
m
m
m
ENVELOPE OF FAT RANDOM J
(T+49 SEC. TO T+59 SEC.)
Figure 3-42:
FREQUENCY (Hz)
Random Response at Transonic Longitudinal Pickup (214x)
143

10-2
10-3
@e
!o-4IitlZM.i
a
10.5eL.
10-6
ENVEFAT RANDOM
T + 49 SEC. TO T + 49 SEC.
10"710
Figure 3-43:
100 FREQUENCY (Hz)
Random Response at Transonic Lateral Pickup (210 z )
000
144

I ,tA/_. o_Tg__t_
T
0.57g . - 13 Hz
) _L
GAIN 10UNFILTERED
GAIN 1(
--T- •
G
GAIN 301m
GAIN 30 0.19e ,,J 40 80 Hz I
TAPETRACK 4
Figure 3-44: BECO Longitudinal Vibration (214x)
145

• 0.795
GAIN 10 _ UNFILTERED
t0.57g
GAIN 0_0.2 - 15 Hz
O. 19g
1
GAIN 30 12 - 30 Hz
0.57g
GAIN 10 20 - 50 Hz
0. ISEC. _ ..e-- 0.19 g
GAIN
40- 80 Hz
BECO LATERALVIBRATION (2102)
TAPETRACK 2
Figure 3-45: BECO Lateral Vibration (210z)
146

GAIN" 10
GAIN 10
GAIN 30
GAIN 30
GAIN 30
/_ 0.57 g
__ 0 Hz
°.,SE '--II--
TAPE TRACK 4
Figure 3-46: SECO Longitudinal Vibration (214x)
147

0.57 g
GAiNi10
0.19g
UNFILTERED
0.2- 15 Hz
0.19g
12-30 Hz
0.19g
0.1 SEC.--_J _-- 0.19g
20 - 50 Hz
I40-80 HzG
TAPE TRACK 2
Figure 3-47: SECO Lateral Vibration (210z)
148

,t
- 15HzGAIN 30
i
IJ
0.57 g
_,A,.jAAALt II
_,,,,--vvq,,_iGAIN 3O
.[AAA._L,_A.,A-.,A_L_.AAIv_vv,_lU'V'v.v',,I"t__'t_.Vv
LtXl-lJ,-,, JAAI-,,,..,-,,.-lyVv'Vwv,-,"wvV,v,", ,,'-,-"-
20 - 60 Hz
TAPETRACK 4
Figure 3-48" Longitudinal Vibration (214x)--Agena First Ignition
149

,_ ,-
0.19g0.57 g
GAIN 30 0.2 - 15 Hz
i . i i i
0.19g
,, . t
GAIN 30 0._9 g _ .e- 0.1 sec 0.2 - 50 Hz
GAIN 30 12 - 30 Hz
GAIN 30
0.19g....... Jl
, 20- 60 Hz
TAPE TRACK 2
I - l II II II i I " -- I _ " |11 I -
Figure 3.49: Lateral VlbraUon ( 210z )--Agena First Ignition
150

1.9g
GAIN 3 UNFILTERED
0.57 g
GAIN 10
0.57 g
/GAIN 10 12- 30 Hz
0.57 g
.e-- 0.1 sec
t
GAIN 10 20 - 60 Hz
• m i il • II
Figure 3.50:
j_r
TAPE TRACK 4
I III i __ l j I I I I I I " •
Longitudinal Vibration (214X)--Agena First Cutoff
151

0.57 g
.=,,-,,.^./_,.L,n.,AAI.A.=A^_,^r_A,^.^A,, _.__-._._--._"-""v-'v _v"i_ rvIi V'V,V"",/v", n Uv_vv ,-v .--,.
GAIN 30 - 12 - 30 Hz
|
0.57 g
GAIN 10 20 - 60 Hz
TAPETRACK 2
I I I I - _ "- " II .... I II = = I I I
Figure S-51: l_teral Vibration (210z)--Agema First Cutoff
152

1.9g
UNFILTERED
0.57 g
GAIN 10
GAIN 3
0.2 - 15 Hz
g
0.2 - 50 Hz
_ 0.1 sec
0.57 g
GAIN 10 12- 30 Hz
0.57 g
GAIN 10 20 - 60 Hz
!
TAPE TRACK 4
I I I I in I | I I iJ I II I I ill IIII ............... L _ _
Figure 3-52" Longitudinal Vibration-( 2_,)_Agena:_ Ignition
153

0.57 g
0.19g
v v
GAIN 30 0.2 - 15 Hz
0.57 g.i
GAIN 10 0.2 - 50 Hz
0.19_
i_ _ _ 0,1 sec
GAIN 10 - 20 - 60 Hz
TAPE TRACK 4
Figure 3-53: Lateral Vibration (210z)--Agena Second IgniUon
154

..J
temperatures of PT01 and PT02 increased
to a maximum of 88.8 and 93.9°F, respec-
tively. The normal temperature levels
for these channels during preceding orbits,
with approximately the same spacecraft
attitude {31 to 34 degrees off Sun) were
in the 73 to 7S°F range.
Excessive EMD thermal-coating degrada-
tion occurred similar to that experienced
during missions II and Ill. However, this
degradation caused no impairment of the
spacecraft mission objectives because its
effect on the spacecraft was offset by pitch-
ing the spacecraft off the sunline to a pre-
determined angle. This attitude maintained
temperatures at the desired level.
3.6.4.1 Battery Temperature Variation
Battery temperatures of the S ! C space-
craft were consistently higher than
previous missions. Peak battery tempera-tures for Module I on Mission II varied
from 70 to l14°F compared with 82 to 129°Ffor Mission III. The reason for this dif-
ference in peak temperatures may, inpart, be due to the reduction in conversion
efficiency during battery charging at the
higher temperatures. This caused a greater
portion of the energy to be converted into
heat, which tended to perpetuate the high
temperatures.
\
Another interesting phenomenon is shown
in Figure 3.54. The battery temperatures
during Mission II were nearly equal,
whe_, __ HI, Battery 1
(ET02)_ i'_matoly 6 to 10°F higher
than Battery 2 (E'_). This differencepersisted until sometime after Orbit 76
when the temperature difference between
ET03 and STM increasedto a value nearly
equal to that between ET02 and ST02,
bringing ET03 up to within I to 20F of ET02.
It is noted that this change occurred when
the spacecraft was pitched 30 degrees off
Sun after being on Sun for more than 30
orbits. This temperature differential may
be attributed to an EMD gradient. During
the early orbits, Module 2 was the coolest;
it was also closest to the TWTA that was
off. Following Orbit 110 the TWTA was on
almost continuously, raising the tempera-
ture of that portion of the EMD. This caused
the temperature of Module 2 to rise to
within 2 degrees of Module 1.
3.6.4.2 Lower TIFTA Temperatures
TWTA temperatures were substantially
lower for Mission III than. for Mission II.
Typical data for these missions during
Orbit 109-116 are presented in Table 3-10
for comparison. It may be seen that the
TWTA temperatures (CT01) were con-
sistently above 180°F for Mission II com-
pared with only 171 to 174°F for Mission
III. The readout times, spacecraft attitude,
and deck-coating degradation were ap.
proximately the same in each case. The
TWTA temperatures for Mission III were
lower, due to a better thermal bond be-tween the TWT and the case of the TWTA.
The TWTA used during Mission III was
chosen for its low collector temperature(CT01).
3.6.4.3 Thermal Problems
Spacecraft thermal problems are discussed
below with regard to their effect on space-
craft operational procedures.
The principal thermal problem was high
temperature with the spacecraft normal
to the Sun and was caused by degradation
of the EMD thermal coating.
3.6.4.4 EMD Thermal Coating Degradation
The extent of thermal-coating degradation
on Mission III was larger than anticipated
from laboratory tests of thermal.coating
155

30
TIME (HOURS)
Figure3-54- Spacecraft Battery Temperature Difference
ORBIT
109
110
111
112
113
114
115
116
Table 3-10
CT01 (°F)
II Minion III
180.8 173.8
180.8 173.8
180.8 173.8
180.8 171.2
180.8 171.2
180.8 171.2
180.8 172.5
180.8 173.8
SPACECRAFT TWTA TEMPERATURES
ST01 (°F)
II III
92.6 99.1
93.9 99.8
93.9 99.8
93.9 97.8
93.9 97.8
93.3 98.4
93.3 99.1
92.8 99.8
CT01 & ST01
TEMP. DIFF.(°F)
II III
88.2 74.7
86.9 74.0
86.9 74.0
86.9 73.4
86.9 73.4
87.5 72.8
8'7.5 73.4
88.2 74.0
TWTAOPERATING
TIME (rain.)
II III
127 146
128 131
135 136
136 132
137 132
138 130
139 131
138 .134
CT01fTWTA Temperature
ST01=Equipment-Mounting-Deck Temperature
ATTITUDE
(deg.)
II III
28 27.1
28 26.5
28 30.0
28 29.7
28 29.1
31 28.5
31 27.8
31 27.2
156

samples. A similar discrepancy between
laboratory and flight data was experiencedon Missions I and II.
Figure 3.55 compares the absorptivity of
the thermal-control coating of Mission II
with that of Mission III. Absorptivity
values, calculated for two cislunar, one
initial orbit, and two photo orbit conditions
are plotted on the curve. In general, the
Mission III data points are very similar
to Mission II for the same period. The ab-
sorptivity based on ST03 is approximately
0.004 higher than the absorptivity based onST01.
The thermal coatings used on the EMD
surface facing the Sun were different forMissions II and IIl than for Mission I. Be-
cause of the excessively large EMD
thermal-coating degradation experienced
with Mission I, a new coating was applied
for Missions II and III that laboratory re-
sults indicated would be superior to the
Mission I thermal coating. The Mission I
coating was designated B-I056 and the
.33
.32
.31
.30
o S/C 5 BASED ON ST01 L_'IMISSIONIIt
_ S/C 5 BASED ONST03_ S/C 6BASED ONST01 '"ISSIONlloS/C6 BASED ONST03
"27| I-TRANsLuNAR ORBIT 55 "__ °_
::l.d 1.21 jOR!ITE_.TION
.20
0 100 200 300 400 500 600 700 800
MISSION TIME (HOURS)
Figure 3-55: Spacecrafts 5 and 6 Solar Absorptivity History
157

Missions II and III coating was designatedB-1056 with an overcoat of S-13G. Theactual performance of the Missions II andIII coating was superior to that of MissionI.
Although these degradation rates are suf-ficiently low and do not become a majorproblem during a 30-day mission, thedegradation rates would impose a severelimitation on the spacecraft during an ex-tended mission lasting up to 1 year. Theprimary interface for the spacecraft-thermal-coating system is with the electri-
cal power subsystem. This limitation is
imposed by the requirement that the space-craft be oriented off the sunline at a suf-
ficient angle to maintain satisfactory
temperature levels. The electrical power
subsystem is then marginal due to reduced
incident solar energy on the fixed solar
panels.
Paint Sample Degradation--Ltmar Orbiters
II and Ill have carried coupons of sev-
eral candidate thermal.control paints in
an effort to determine their performance
in the space environment. In general,
the results of these evaluations have been
unrewarding because all paints testedhave exhibited similar characteristics. The
change in temperature, which is a func-
tion of solar absorbtance, has been at vari-
ance with results obtained during ground
test where many of the tested paints appeared
to offer significant improvements over the
original B-1056.
A review of flight test data indicates that
heat additions, from sources other than the
EMD, are responsible for coupon tempera-
tures running approximately 12°F higher
than the EMD itself. This explains why
all of the paint samples r_an at nearly the
same temperature. Radiation from the solar
panels appears tO be a principal source of
this energy.
3.6.5 Thermal.Design Differences BetweenMissions II and HI
There were no significant thermal-designdifferences between Missions II and Ill.
A minor difference, which would have no
effect on the spacecraft thermal per-
formance, was a recessed mounting of the
paint samples to reduce thermal-edgeeffects.
158

4.0 (;R()IlNI) DATA SYSTEM I'ERF(_RMAN(;E
The Lunar Orbiter ground data system pro-
vides the facilities and equipment required to
receive, record, process, and transmit data
and commands between the Space Flight
Operations Facility (SFOF) and the space-
craft. In addition, all facilities necessary
to sustain mission operations were provided
by a complex consisting of three primary
DSS's, the SFOF, and the ground communi-
cations system. Separate facilities were pro-vided at Eastman Kodak, Rochester, New
York, and at Langley Research Center,
Hampton, Virginia, to process and evaluate
the photo data obtained.
All of these facilities provided the required
support. A few failures occurred; however,
there were no serious consequences because
they happened during noncritical times and
adequate backup was available. Each area is
discussed separately in the following sec-tions.
4.1 SPACE FLIGHT
OPERATIONS FACILITY
The SFOF provided the mission control cen-
ter and the facilities to process and display
data to support operational mission control.
Facilities were provided for the ground re-
construction equipment and for analysis of
the reconstructed lunar photographs; there
were also facilities for reproduction and
distribution of operational data and for micro-
filming all computer program output. The
performance of the entire data system at the
SFOF was satisfactory.
4.1.1 Computer mad
Communleatlms Complex
The telemetry processing station (TPS) and
the internal communications system at the
SFOF provided tracking and telemetry data
from teletype and the high-speed data line
to the SFOF computers, and teletype data to
the operations areas. The computer complex
provided telemetry data processing, track-
ing data processing, command generation,and command verification. The central com-
puter complex consists of three computer
strings, each containing an IBM 7094 com-
puter coupled to an IBM 7044 input-output
(I/O) processor through an IBM 1301 disk
file memory and a direct data connection
(DDC). The entire system performed excep-
tionally well, losing only a few frames of
data that were not detrimental to the flight.
All three computer strings (X, Y, and W)
were used to support Mission III. All strings
and associated equipment performed ade-
quately with no particular hardware prob-lems.
The computer strings were used as follows.Mode 2 (hr)
X-String 344
Y-String 383.5
W-String 37.5
The total amount of Mode 2 time used was 765
hours. Of this total, 253 hours were used in
dual Mode 2; 1 hour in triple Mode 2.
Dual Mode 2 was used only during critical
mission phases. Only the normal amount of
support equipment failures were experienced
and were corrected as they occurred.
4.1.5 SFOF Software
The software system for Mission III con-
tained changes from the Mission II software.
The system was demonstrated successfully
and frozen prior to the Mission III training
exercises. The software system worked ex-
ceptionally well. One minor problem causedthe common environment in the seal area to
be scrambled; this occurred twice during the
159

mission. There was no explanation although
cons]_rable analysis was done.r.
4.1.2.1 System Software _
The SFOF mission-independent software
system performed satisfactorily throughout
Mission III. There were considerably fewer
communication errors than during the previ-ous two missions due to a correction in the
IBM 7044 software system. This minimized
the computer downtime and data loss.
4.1.2.2 SPAt: Software
SPAC software consists of the IBM 7094 com-
puter programs that monitor the status from
and predict the performance of the space-
craft subsystems. It includes a program that
prepares and simulates command sequences
to be transmitted to the spacecraft computer;
a program that coordinates mission plan-
ning; and a program that updates the IBM
7044 calibration coefficients. There were
no major program changes between missions
resulting from Mission III performance due
to their satisfactory and acceptable per-forrnance.
Table 4-1 shows a tabulation of all SPAC pro-gram executions. Unsuccessful executions
are divided into two groups: input and system
errors. Input errors include incorrect mes-
sages and option switches entered from the
input console and mispunched input cards.
System errors are the system hardware andsoftware failures. There were no unsuccess-
ful executions due to SPAC software failure
during the mission.
4.1.3 FPAC Software System PerformanceSeveral modifications were made to the
FPAC software system between Mission_ II
and III to correct some computational in-accuracies and increase the usefulness
and convenience of the programs. The per-
formance of all FPAC computer programs
during Mission III was satisfactory. A de-
Table 4-1: LUNAR ORBITER SPAC
PROGRAM EXECUTION
,'--]c.f_
z
CEUL 789 11 5 805
DATL 550 18 4 572
TIML 441 19 2 462
COGL 274 3 3 280
TRBL 204 13 2 219
SEAL 130 3 1 134
QUAL 113 4 0 117GASL 103 8 1 112
HUBL 88 9 0 97
UTAB 44 1 0 45
SIDL 35 3 0 38
SGNL 35 0 0 35
CORL 16 6 0 22
COOL 9 4 0 13
TOTALS 2831 102 18 2951
% of TOTALS 95.93 3.46 0.61 100.
scription of the changes that were made arediscussed below.
4.1.3.1 Flight Path Control Programs
During Mission II it was found that two of
the targeting subprograms, post-midcourse
guidance (PMG) and pre-injection guidance(PIG), require different conversions for in-
put argument of perilune. A program changewas made before Mission III to correct this
confusing situation. Performance of user
programs using these revised subprograms
during Miasion Ill was satisfactory.
160

A thoroughcheckonthe midcoursecommandprograms indicated an error presentin bothMCIL and GCML. Although the effects ofthis error were small, the correction wasmade and the programs performed satis-factorily for Mission III.
User program GCTL was modified to print
out a description of the orbit prior to and
following the maneuver. These data, con-
tained in the end condition (ENDCO) array,
were of great assistance to the guidance and
maneuver analysts.
4.1.3.2 Orbit Determination Programs
The DSN provided the project with new links
for the tracking data edited programs, TDPX
and ODGX.The result was a net loss in capa-
bility because the new TDPX links prevented
use of the rejected data file. This was not a
serious problem but was an inconvenience
that was worked around during the mission.
ODGX worked as in previous missions and,
thus, the same difficulty in processing
ranging data when bad angle was being re-
ceived waspresent. A successful workaround
was developed for this problem also.
Several changes were made to the orbit
determination program, ODPL, for Mission
III. These changes fell into two categories:
(I) correction of minor computational errors
and {2) operating convenience features. The
program errors corrected involved five
quantities in the Boeing special output of
Moon encounter parameters and their sta-
tistics. Convenience features primarily
involved orbital parameters with other
FPAC programs. All changes worked suc-
cessfully and the convenience features par-
ticularly aided orbit determination analysts
to adhere to the tight computer schedule
imposed by the mission design.
A new version of the orbit determination
starter program, LFDL, was received at
the SFOF prior to flight (too late to be in-
cluded in the flight software system but
available for an off-line operation). This
program was not needed during the flight
but tests before the flight indicated that all
significant changes worked as planned. These
changes involved primarily a special print-
out feature that allows manual editing of
the tracking data to eliminate blunder points.
The blunder points, if not eliminated, pre-
vent LFDL from fulfilling its purpose.
4.1.4 Ground Reconstruction
Equipment (GRE)
GRE performance was satisfactory; there
were no major problems encountered during
the mission. The GRE was only manned dur-
ing the priority readout portion of the mis-
sion. The primary function of the GRE was
the reconstruction of video data for early
photo and site analysis and for publicity re-
leases. In addition, the video signal was
analyzed using a density averaging technique
to determine the exposure value. The expo-
sure value was used by the photo analysts for
exposure and readout control. The video
signal was also routed from the ground-re-
construction interface equipment to the Sur-
veyor scan converter to be compatible withthe SFOF television monitors and commer-
cial television.
Before Mission Ill, the GRE was relocated
and the film processor was plumbed for tapwater (distilled water was used in Mission
II). There were no problems resulting fromthe move.
4._ GROUND COMMUNICATIONS SYSTEM
The ground communications system pro-
vides for the transmission of voice, teletype,
and high-speed data between DSIF sites and
the SFOF. One high-s .peed data line (HSDL),
one voice line, and three teletype lines are
161

providedbetween each station and the SFOF.
The primary source of spacecraft perform-
anee telemetry data is the HSDL. One or two
teletype lines are provided as a backup for
the HSDL depending on the priority assigned
to the second teletype line. The remaining
TrY lines are used for tracking data, com-
mand transmission and verification, andadministrative data.
Overall performance of the ground commu-
nications system was good. Little data was
lost with the backup capability that was pro-
vided. Table 4-2 shows the percentage of down
time of the ground communications elements.
Table 4-2:
COMMUNICATIONS DOWN TIME - (%)I I
HSDL TTY VOICE
DSS-12 0.1 0.06 0.06
DSS-41 1.8 0.9 0.5
DSS-62 2.2 1.1 0.5
Ground communications between DSS-12 and
the SFOF were excellent. The maximum time
of HSDL outage was 9 minutes. At no time
was the HSDL and TTY lines down simulta-
neously.
Ground communications between DSS-41 and
the SFOF were good. The HSDL was down
for periods ranging from I to 42 minutes. Onthree occasions the HSDL was down in ex-
cess of 30 minutes. The TrY lines provided
backup coverage on all occasions. All com-
munications lines were down three times for
a total of 18 minutes over the entire mission.
This does not include 44 minutes when, the
85.foot antenna was inoperative. Total line
outages did not occur during critical periods.
Ground communications between DSS-62 and
the SFOF were satisfactory.HSDL outages
ranged from I to 50 minutes. There were four
outages of more than 30 minutes, three be-
tween 20 and 30 minutes, and nine between
I0 and 20 minutes; TTY backup was avail-able for all but one 10-minute interval. There
were four periods totaling 30 minutes when allTTY lines and the HSDL were down. The total
line outages did not occur during critical
mission periods.
4.3 DEEP SPACE STATIONS
Lunar Orbiter operations were transferredfrom DSS-61 to DSS-62 between Missions II
and Ill. This resulted in a greater than nor-
mal effort in checking the ground equipment
and bringing it up to operational readinessbefore Mission IV.
Performance of the ground equipment at
the Deep Space Stations was satisfactory.
The mission-dependent equipment, including
the GRE, operated nominally with a normal
number of minor problems that were correct-
ed as they occurred. There was one exception
in which a power failure at DSS-62 caused the
loss of approximately 20 feet of GRE film in
the film processor at the time. Only one GRE
film was affected; the second film was not
damaged. Subsequently the film processor
was rewired to critical power rather than
utility power. There were no recurring equip-
ment failures and only a few significant oper-
ational problems associated with mission-
independent equipment. The maser amplifier
was used on all passes by all stations, with
the exception of one pass over DSS-41 whenthe PARAMP was used.
The only significant problems at DSS-12 oc-curred when the 85-foot antenna had to be
shut down due to high winds and when the
FR 900 capstan drive motor failed. The an-
tenna was stowed for approximately 90 min-
utes until the wind decreased while trackingcontinued with the 35-foot antenna; no data
162

"ii "_
was lost during the shutdown. The FR 900
capstan drive failed near the end of a video
readout. Repairs were not completed before
the next pass the following day and the unit
did not have playback capability. However,
due to overlapping coverage, D88.41 and
DSS-62 were able to provide sufficient re-
cording capability so that no FR 900 datawere lost.
There was only one significant failure at
DSS-41. This occurred when the 85-foot an-
tenna was tumble to move due to the loss of
the main input hydraulic feed. Approximate-
ly 25 minutes of telemetry data were lost be-
fore DSS-62 rose and acquired the spacecraft.
DSS-41 reacquired the spacecraft on the same
pass after bleeding the hydraulic lines.
DSS-62 had several significant difficulties.
Telemetry data were lost on two occasions
for 12 and I0 minutes, respectively, when a
fuse was blown in the antenna declination
drive and a station power overload occurred,
causing a circuit breaker to trip and shut off
power. The video readout following the power
failure was delayed 6 minutes. An apparent
SDS 920 computer failure prevented trans-
mission of a sequence of Mode I commands
to the spacecraft; the commands were, how-
ever, successfully transmitted in the backup
transmission (Mode 3). During one pass apower meter was broken and the station was
unable to determine their transmitter power;
this required adjusting the uplink transmit-
ter power by monitoring the spacecraft AGC
reading. During the same-pass the station
was unable to calibrate their PARAMP be-
cause of a test transmitter problem. ThePARAMP would have been usable in an
emergency but was not needed.
163

5.0 I,UNAR ENVIR()NMENTAL DATA
5.I RADIATION DATA
During Mission III, the radiation dosimetry
measurement system functioned normally
and provided data on the Earth's trappedradiation belts and on the radiation environ-
ment encountered by the spacecraft in transitto and near the moon. Data obtained from the
dosimeters is shown in table 5-I.
Initial Dosimeter I, (DF04), readings indi-
cated that the spacecraft received a total
dose of 0.75 rad while penetrating the innerVan Allen belt. The outer belt resulted in
no additional increments in DF04. Dosi-
meter 2 (DF05) was not turned on until after
the Earth's trapped belts were passed.
For the next few days, the DF05 dosimeter
indicated that a residual flux of low-energy
protons from the solar particle event of
January 28 was still present near the Earth-
Moon system. This flux declined below the
RDMS threshold by about February 8. From
that time until March 31, only the normal
cosmic-ray dose and dosimeter noise havebeen recorded.
On February 13 (Day 44, 17:43 GMT), a very
large optical flare, Class 4, was observed by
Sacrameno Peak. This flare, which was un-
expected because it did not develop from a
sizable sunspot group, resulted in enhanced
i
Table 5-I : RADIATION DATA - RECORD -
MISSION IIII
GMT Detector Reading
36:02:00 DF04 0.75
36:07:35:41 DF05 Turn On
37:01:03:37 DF05 0.5
37:10:29:39 DF04 1.0
37 :17:33:35 DF05 1.0
38:13:30:02 DF05 1.5
39:17:50:29 DF05 2.0
41:04:49:49 DF04 1.25
45:11:23:48 DF04 1.50
48:12:55:12 DF05 2.5
49:10:30-12 DF04 1.75
53:12:21:47 DF04 2.00
57:08:10 DF04 2.25
59:12:22:10 DF05 3.00
60:07:49:09 DF64 2.5
63:22:49:16 DF64 2.75
68:00:21 DF04 3.00
low-energy proton fluxs in the vicinity of
Pioneer VII, but the particle energies were
not adequate to affect Lunar Orbiter dosi-
merry or film.
-5.2 MICROMETEOROID DATA
No micrometeoroid hits were recorded dur-
ing Mission III. One detector, number 17,
was punctured prior to launch.
164

SUMMARY g)F I,UNAR
The following paragraphs discuss the three
principal malfunctions that occurred duringMission III:
I) Traveling-wave-tube amplifier
a) High TWTA current at first turn-on ;.
b) Tw'rA power output variations;
c) High 'rWTA helix current during orbitsIgl and IU;
2) Faulty film advance during priority read-
out;3) Final-readout malfunction.
TWTA MALFUNCTIONS
High TWTA Helix Current at First Turn-On
On Day 036 (February5) of Mission Ill, the
TWTA was commanded on for the first time 6
hours and 53 minutes after launch. The telem-
etry indication of TWTA helix current indicat-
ed 8.8 milliamps anddecayed after 1.5 minutes
to 5.1 miUiamps and remained at this level
throughout an on-time of 35 minutes. The
second time the TWTA was commanded on
was at 8 hours and 24 minutes after launch;
the helix current, at turn-on, was between
6.1 and 6.9 milliamps. The normal value at
turn-on should be 5.75 milliamps, gradually
stabilizing at approximately 5.3 milliamps.
A detailed analysis of this anomaly, whichinvolved research of test records from Lunar
Orbiter thermal vacuum testing, indicates
that the cause was either the result of
mechanical stresses induced by the launch
environment and were subsequently relieved
by operating temperature cycles, or the re-
sult of slow internal pressure decay (out-gasing) after mm_.
r , .
As a result _ this _y, s constraint dic-
tating the tum.ou time for the TWTA will be
developed. The!_ will he dependent
on time from Immeh, sllowlng ample timefor the Tw'r to _ly mltgas.
()RBITER III AN{)MAI,IES
TWTA Power Output Variations
Telemetry indication (CE02) of TWTA out-
put power was excessively temperature sen-
sitive. During photo readout in early orbits,
the telemetry power output indication varied
from approximately I0 watts at turn-on to 16
watts at turn-off. This variation graduallyincreased with the number of orbits. At the
time of the last photo readout, telemetry
power output was 9.45 watts at turn.on and20.4 watts at turn-off.
Telemetry voltage is obtained from the diode
power monitor in the filter/monitor assembly
located within the TWTA proper. An adjust-
able probe extracts a small amount of the S-
band energy present at the filter input. The
rf signal is rectified by two Type IN831Apoint-contact diodes connected in series
across the probe to ground.
Although the diode monitor indicates total
power and would be affected by an increase
in TWT harmonic content, it is believed that
the variation in telemetry power output re-sults from a gradual shift in the diode rectifi-
cation characteristics with temperature.
Research of spacecraft test records indi-
cates that the above phenomenon is unique
to this TWTA and was exhibited during ther-
mal/vacuum testing. The power output variedfrom 10.5 watts at turn-on to 16.9 watts at
turn-off in this case.
High TWTA Helix Current
During Orbits 141 and 143
When the TWTA was commanded on duringOrbit 141, the helix current at turn-on was
6.75 milUamps. Normal value, about S.75
milliamps at turn-on, will gradually stabilize
at 5.3 milliamps. After the Orbit 141 turn.ou,
the helix current gradually decreased for the
165

t p
next 29 minutes to 5.84 milliamps, then ab-
ruptly decreased to 5.41 milliamps. The same
pattern was followed in Orbits 143 and 144,
but not Orbit 142, although there was essen-
tially no difference in turn-on procedures. At
the time the abrupt O.4-milliamps decrease
occurred, TWTA temperature was 150.6°Fin all three cases.
The changes in helix current described above
are possible due to corresponding change in
rf drive from the spacecraft transponder. It
should also be noted that there are many fac-
tot's that can cause helix current variations.
However, based on tests and analysis con-
ducted to date, it is concluded that variations
of this magnitude do not affect the life of thetube.
FAULTY FILM ADVANCE
DURING PRIORITY READOUT
During priority readout and also during the
final readout sequence, the film movement
through the photo subsystem optical mechan-
ical scanner would stop. The stoppage events
were irregular and did not establish a pat-
tern throughout the mission. It was always
possible to resume readout by executing com-
mands to terminate readout, which emptied
the readout looper assembly. Once the looper
was empty, readout was again initiated andwould continue.
Extensive testing was conducted to deter-
mine the cause of film stoppage; the most
plausible was that of an overlength mount-
ing screw on the readout looper assembly.
The long screw caused the teflon separators
to press against the film and act as a brake._t
A test was conducted on a readout looper
assembly with the long screw installed, andthe film tension was found to be 0.25 to 0.5
pound below the specified value. It is pre-sumed that this reduced the drive-friction
level to a marginal value, so small changes
in some other factor could cause slippage.
Following this malfunction the remaining
photo subsystems were inspected and foundto have short screws installed throughout.
FINAL READOUT MALFUNCTION
On Day 061 (March 2) at 15:12:40.4 (the be-
ginning of the normal readout sequence in
Orbit 149), the camera readout electronics
turned on momentarily and then turned off
without a command being sent to the space-
craft. Video came on momentarily (approxi-
mately 1.4 seconds), following a delay of ap-
proximately 22 seconds after readoutelectronics turned on. A second attempt to
command "readout electronics on" had nega-
tive results. A "solar eclipse off" command
was sent. The readout electronics were en-
abled and the third attempt to turn electronics
on was successful. Optimization of the video
signal was unusual in that one "focus in-
crease" and five gain commands were re-
quired before active scanning was started
(15:56:50). With readout in progress, a load
current 1.25 amps in excess of that usually ex-
perienced during readout was noted. Read-
out progressed normally until 16:47:31.2,when readout was turned off to dump the read-
out looper. When readout was terminated,
the readout looper did not dump. Readout
was restarted and a second attempt was
made to dump the looper by terminating
readout. The looper again failed to empty.
All subsequent attempts to empty the readout
looper failed.
The telemetry data indicated the "R/O elec-tronics on" was commanded at 15:12:40.4
during Orbit 149. An analysis of the signal
strength data indicated the readout elec-
tronics turned on at approximately 15:12:42
and the high-voltage power supply came onat 15:13:8.6. The video remained on for 1.4
166

secondsand then turned off without being
commanded.
Subsequently readout was successfully ac-
complished; however, when "R/O drive
off" was commanded the readout looper
failed to empty.
Further analysis of the telemetry data indi-
cated that several logic circuits changed
state, concurrent with the loss of video, as
a result of an apparent voltage transient.
Because of excessive spacecraft current for
approximately 33 minutes, following the tran-
sient (during successful readout), and the
subsequent inability to empty the readout
looper it was assumed the film-advancemotor was burned out.
Tests performed on Spacecraft 2 with PS-3
installed eliminated the possibility of the
transient having occurred external to the
photo subsystem. Details of this test were
reported to NASA by Boeing Letter 2-1553-
70-040, March 22,1967.
The following analyses were performed to
isolate the source of the failure in the photo
subsystem:
I) DC- to - DC converter--All circuits and
components were analyzed. Any one of
six components (dne Zener diode andfive transistors) could have been in a
temporary failure mode, which wouldresult in the transient on the +6.5 volt
output necessary to trigger the logiccircuits that were inadvertently reset
during Mission HI.
2) Commemd Omtroi Programmer (CCP)
--The preset pulse, platen count, and
film-advance circuits could have been
triggered by the transient on the +6.5volt line.
3) Thermal Analysis--
a) Calculations based on spacecraft
telemetry and parts reliability dataindicate the insulation in the film-
advance motor would fail at 380°C
after 30 minutes. Telemetry data in-
dicates the motor failed "open"
after approximately 33 minutes.
h) Calculations based on data from a
simulated flight configured film-
supply motor indicate the stabiliza-
tion temperature reached was approx-
imately ll2°C.Since the insulation inthis motor is the same as in the film-
advance motor, the film-supply
motor could operate in a stalled con-
dition indefinitely without damage
to the windings.
Additional details of the photo subsystem
analysis may be found in the minutes of the
NASA/Boeing/EK meeting, EK L-025044,
March 30, 1967.
Because the analysis did not yield a specific
cause of failure, and because no design or
hardware deficiency was discovered, modifi-
cation of the remaining photo subsystem is
not recommended. SPAC personnel have
been alerted to the need for recognition ofexcessive load current should a similar
situation arise. Prompt return to "solar
eclipse on" will ensure no motor damage.
The logic can be reset by established pro-cedures.
167