LTC Research Paper - Minds@UW
280
University of Wisconsin-Madison 175 Science Hall 550 North Park Street Madison, WI 53706 http://www.ies.wisc.edu/ltc/ Research Paper U.S. ISSN 0084-0815 LTC Research Paper Land Tenure, Land Markets, and Instituional Transformation in Zambia edited by Michael Roth with the assistance of Steven G. Smith LTC Research Paper 124, originally published in October 1995
-
Upload
khangminh22 -
Category
Documents
-
view
1 -
download
0
Transcript of LTC Research Paper - Minds@UW

University of Wisconsin-Madison175 Science Hall
550 North Park StreetMadison, WI 53706
http://www.ies.wisc.edu/ltc/
Research PaperU.S. ISSN 0084-0815
L T C R e s e a r c h P a p e r
Land Tenure, Land Markets,and Instituional Transformation in Zambia
edited by
Michael Roth
with the assistance of
Steven G. Smith
LTC Research Paper 124,originally published in October 1995

LAND TENURE, LAND MARKETS,AND INSTITUTIONAL TRANSFORMATION
IN ZAMBIA
edited byMichael Roth
with the assistance ofSteven G. Smith
All views, interpretations, recommendations, and conclusions expressed in this paper are thoseof the authors and not necessarily those of the supporting or cooperating organizations. Andyrecommendations or suggestions herein doe not represent the official position of the Government ofZambia.
LTC Research Paper 124 Prepared for the Land Tenure CenterUniversity of Wisconsin-Madison
October 1995

Copyright ® 1995 by the authors. All rights reserved. Readers may make verbatim copies of this document for non-commercialpurposes by any means, provided that this copyright notice appears on all such copies.

TABLE OF CONTENTSPage
Lists of Tables and Figures vii
List of Acronyms x
Preface xi
Chapter 1: Legal Framework and Administration of Land Policy in Zambia 1I. Introduction 1
A. Issues 1B. Outline of report 2
II. Colonial policy and settlement 4III. Agrarian structure 5IV. Arable land and crop expansion 7V. Land tenure 14
A. Tenure on State Lands 15B. Reserve and Trust Land administration 18C. Urban, housing, and improvement areas 22D. Agencies responsible for land policy 23E. Subdivisions 24
VI. Demand for leasehold properties 26A. Current registrations and lease transfers 26B. Potential leasehold demand 27C. Factors influencing demand for title 28
VII. Proposed land policy reforms 33A. MMD Manifesto 33B. Ministry of Lands proposal 34C. 1993 Land Policy Conference 35D. Assessment 37
VIII. Proposed actions 40A. Land tenure reforms 40B. Land administration 43C. Research 43
Annex 1.1: Resolutions of the conference 45
Chapter 2: Land Administration: Processes and Constraints 47I. Current framework for land administration 47II. Lessons from the African experience 50III. State leasehold process 52IV. Overcentralization and overarticulation 57V. Institutional coordination 59VI. Ignorance of correct procedures 60VII. Survey standards and the 14-year lease 61VIII. Land management principles: plan and market 63IX. Problems of confidence and vision: Trust and Reserve Lands 63X. Policy debate: July 1993 Land Policy Conference 66XI. Recommendations 67Annex 2.1: Guidelines for determining the size of landholding 76

Chapter 3: Agrarian Structure, Land Markets, and Property Transfers 79I. Introduction 79II. Agrarian structure 79
A. Land base 79B. Crop land utilization 80C. Livestock grazing utilization 83D. Type of farming unit 85E. Parcel holdings 85
III. Current structure, commercial farm sector 87IV. Changes over time in farm structure 90V. Private transfers 95VI. Official land transfers 98
A. Regional distribution of transfers 99B. Average values 103C. Lease issuances 103D. Mortgages and the credit market 104
VII. Land use 104VIII. Size distribution of leases 106IX. Foreign offers 108Annex 3.1: Number of commercial farms, by province 110Annex 3.2: Area of commercial farms by province, 1976-1990 111Annex 3.3: Private transfers, commercial sector, 1976-1990 112Annex 3.4: Property transfers, national total 113Annex 3.5: Issuances of leases, national total 113Annex 3.6: Reentries and surrenders, national totals 114Annex 3.7: Liens and mortgages, national total 114
Chapter 4: Land Valuation and Taxation 115I. Introduction 115II. Transfer taxes, fees, and other transactions costs 116
A. Transfer tax 116B. Incidence and shifting of the transfer tax 118C. Revenue yield and tax evasion 118D. Registration fees or stamp duty 119E. Planning department scrutiny fees 119F. Revenues of the Lands Department 119
III. Taxation of rural and urban improvements ("rates") 122A. Form of taxation 122B. Speculation 122C. Setting rates 123D. Rate valuations 124E. Nominal and effective rates of taxation 125
IV. Valuation of land and improvements in Zambia 126A. Valuation process 126B. Impact of the "Watershed Speech" 127C. Reappearance of the market 128
V. Determination of ground rents 129A. Existing policy 129B. Proposed mechanisms for setting ground rents 131
iv

C. Preliminary suggestions for ground rents in 1994 and thereafter 134VI. Proposed tax reforms 135VII. Land development fund 136
A. Proposals and assessment 136B. Legal reforms: The draft law 139
VIII. Summary, conclusions, and recommendations 143A. Summary and conclusions 143B. Recommendations 144
Chapter 5: Land Tenure and Agricultural Development in Customary Areas:Results from Eastern and Southern Provinces 149I. Introduction 149II. Overview of LTC/ICRAF Study 149III. Land tenure 151
A. Land administration 151B. Land acquisition 152C. Rights to land 156D. Transfer rights 157E. Exclusion rights 158F. Tenure security 159G. Concept of ownership 160H. Land disputes 161I. Documentation 161
IV. Agricultural development indicators 162A. Credit and use of oxen 162B. Land improvements 163C. Tree products and tree planting 164
V. Tenure and agricultural development 165A. Methodology 165B. Results 167
VI. Summary and implications for further research 169A. Summary 169B. Implications for further research 171
Chapter 6: Settlement Programs 173I. Introduction 173II. Historical rationale for settlement schemes 174
A. Land alienation and reservation schemes 174B. Agricultural settlement schemes 176C. Schemes for Angolan refugees 177D. Postindependence settlement schemes 177
III. Institutions involved in the settlement program 180IV. Settler selection procedures and assistance provided 181V. Structure and growth of settlement schemes 185VI. Present administration of settlement programs 191VII. Access by women and minority groups 192VIII. Desertion of settlement schemes 194IX. Type of production on schemes 194
v

X. Settlement schemes and conservation issues 194XI. Concluding remarks 195Annex 6.1: Ministry of Agriculture and Water Development settlement scheme 196
Chapter 7: Land Use Patterns and Growth in Commercial Input Use, Productivity, andProfitability by Farm Size Category 199I. Introduction 199II. Data sources 199III. National production trends 202IV. Commercial farms sector 204V. Noncommercial farms sector 214VI. Revenues and expenditures 218VII. Conclusions 225
Chapter 8: Zambia's Agricultural Data System: A Review of theAgricultural Time Series Data 227I. Criteria for evaluating an agricultural data system 227
A. Cost-effectiveness 227B. Efficiency 228C. Timeliness 228D. Accuracy 228E. Types of surveys 229
II. Review of Zambia's agricultural time series data 231A. MAFF agricultural data series 231B. Central Statistics Office agricultural data series 234C. Comparison of MAFF and CSO estimates 242D. Publishing agricultural estimates 245
III. Suggestions and recommendations 246A. Improving cost-effectiveness 246B. Improving efficiency 247C. Improving timeliness 247D. Improving accuracy 248
IV. Summary 249Annex 8.1: Graphs illustrating variation in commercial farm estimates 252Annex 8.2: Maize time series data published by the CSO, commercial farms 253
vi

LISTS OF TABLES AND FIGURES
Page
Table 1.1: Land tenure classification, Zambia, 1937 and 1950 5Table 1.2: Land tenure classification, Zambia, 1973 and 1987 6Table 1.3: Leases of State Land by type of lessee 7Table 1.4: Number of farm units by size and province 8Table 1.5: Rate of land utilization, commercial farm sector 9Table 1.6: New farm blocks and areas under development 10Table 1.7: Rates of growth in crop production 12Table 1.8: Crop area, commercial and noncommercial farms 13Table 1.9: Issuances, transfers, and mortgages of leases 27Table 1.10: Lease applications brought forward to district councils 28Table 1.11: Direct agricultural financing, Zambia National Commercial Bank 32Table 1.12: Credit by number of farms, Zambia National Commercial Bank 33
Table 2.1: Structure of revenue of the Lands Department: Consent application fees 56
Table 3.1: Arable land area 81Table 3.2: Percentage of total farm unit cultivated, 1987-88 82Table 3.3: Percentage of total commercial farm units cultivated by farm size 83Table 3.4: Cattle holdings and estimated rates of grazing intensity 84Table 3.5: Distribution of rural households by type of agricultural activity and province 86Table 3.6: Distribution of crop-growing farming units by parcel holdings and province 86Table 3.7: Number and size of farms, commercial farm sector, 1990 88Table 3.8: Provincial breakdown of number and size of farms, commercial farm sector 89Table 3.9: Private transfers, commercial sector, 1988-90 average 96Table 3.10: Small farms (0-79 ha), private transfers, 1981-1990 97Table 3.11: Regional disaggregation of principal property transfers and leases 100Table 3.12: Regional disaggregation of land values and sizes transferred 102Table 3.13: Percentage of transfers, by land use and province 105Table 3.14: Numbers of leases by size category, 1990-93 totals 107Table 3.15: Regional disaggregation of leases by farm size, 1990-93 percentages 107Table 3.16: Foreign offers registered, average 1990-92 109
Table 4.1: Analysis of Lands Department revenue, Zambia, 1985 to 1992 121Table 4.2: Hypothetical example of rate determination in a city 123Table 4.3: Ground rent charges for nonagricultural lands 130Table 4.4: Ground rent charges for agricultural lands 130Table 4.5: Ground rent charges for land in mining areas 130Table 4.6: Annual ground rents, residential plots, by location 133Table 4.7: Ground rents in 1989 prices for typical types of leases on farmland 134
Table 5.1: Characteristics of sampled households 150Table 5.2: Percentage distribution of households by method of land acquisition 153Table 5.3: Prevalence of household rights over farmland in male-headed households 157Table 5.4: Percentage distribution of husbands and wives by selected rights of use and
transfer 158Table 5.5: Distribution of households by perceived owner of land 160
vii
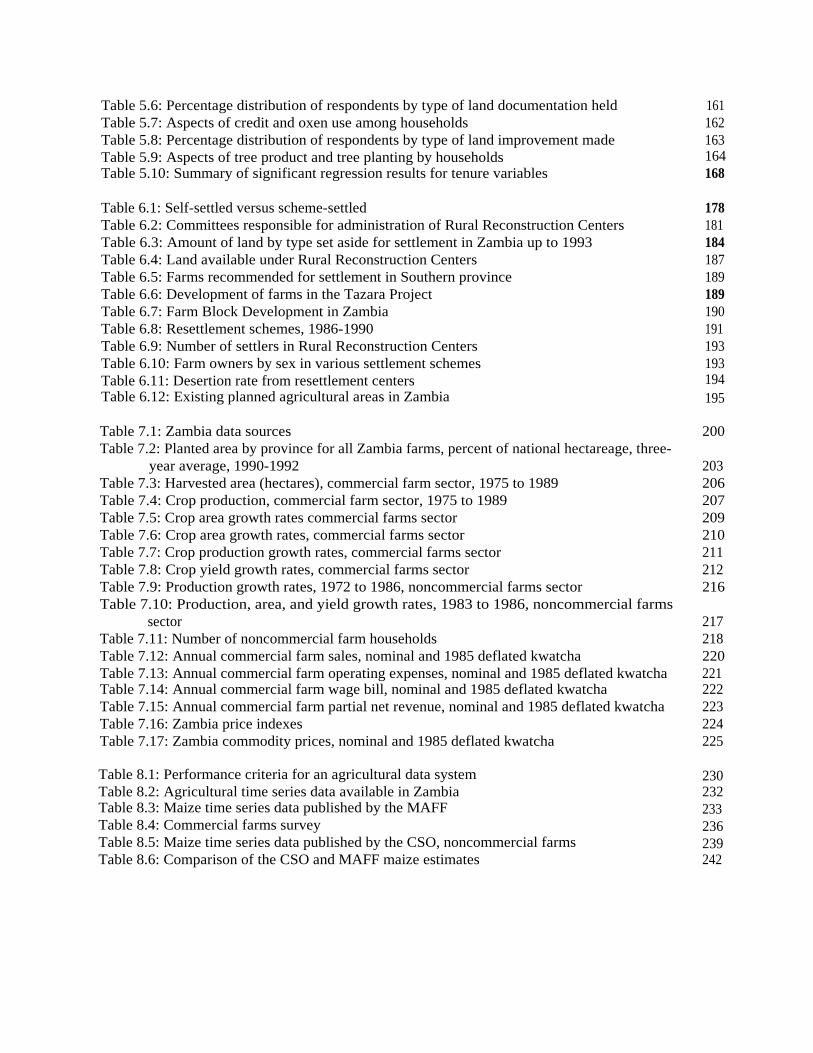
Table 5.6: Percentage distribution of respondents by type of land documentation held 161Table 5.7: Aspects of credit and oxen use among households 162Table 5.8: Percentage distribution of respondents by type of land improvement made 163Table 5.9: Aspects of tree product and tree planting by households 164Table 5.10: Summary of significant regression results for tenure variables 168
Table 6.1: Self-settled versus scheme-settled 178Table 6.2: Committees responsible for administration of Rural Reconstruction Centers 181Table 6.3: Amount of land by type set aside for settlement in Zambia up to 1993 184Table 6.4: Land available under Rural Reconstruction Centers 187Table 6.5: Farms recommended for settlement in Southern province 189Table 6.6: Development of farms in the Tazara Project 189Table 6.7: Farm Block Development in Zambia 190Table 6.8: Resettlement schemes, 1986-1990 191Table 6.9: Number of settlers in Rural Reconstruction Centers 193Table 6.10: Farm owners by sex in various settlement schemes 193Table 6.11: Desertion rate from resettlement centers 194Table 6.12: Existing planned agricultural areas in Zambia 195
Table 7.1: Zambia data sources 200Table 7.2: Planted area by province for all Zambia farms, percent of national hectareage, three-
year average, 1990-1992 203Table 7.3: Harvested area (hectares), commercial farm sector, 1975 to 1989 206Table 7.4: Crop production, commercial farm sector, 1975 to 1989 207Table 7.5: Crop area growth rates commercial farms sector 209Table 7.6: Crop area growth rates, commercial farms sector 210Table 7.7: Crop production growth rates, commercial farms sector 211Table 7.8: Crop yield growth rates, commercial farms sector 212Table 7.9: Production growth rates, 1972 to 1986, noncommercial farms sector 216Table 7.10: Production, area, and yield growth rates, 1983 to 1986, noncommercial farms
sector 217Table 7.11: Number of noncommercial farm households 218Table 7.12: Annual commercial farm sales, nominal and 1985 deflated kwatcha 220Table 7.13: Annual commercial farm operating expenses, nominal and 1985 deflated kwatcha 221Table 7.14: Annual commercial farm wage bill, nominal and 1985 deflated kwatcha 222Table 7.15: Annual commercial farm partial net revenue, nominal and 1985 deflated kwatcha 223Table 7.16: Zambia price indexes 224Table 7.17: Zambia commodity prices, nominal and 1985 deflated kwatcha 225
Table 8.1: Performance criteria for an agricultural data system 230Table 8.2: Agricultural time series data available in Zambia 232Table 8.3: Maize time series data published by the MAFF 233Table 8.4: Commercial farms survey 236Table 8.5: Maize time series data published by the CSO, noncommercial farms 239Table 8.6: Comparison of the CSO and MAFF maize estimates 242

Figure 1.1: General notes on farm subdivisions 26Figure 1.2: Land tenure resolutions, 1993 Conference on Land Policy and Legal Reform 37
Figure 2.1: Organizational chart of Ministry of Lands 48Figure 2.2: Survey Department fees and charges 54
Figure 3.1: Number of total farms by province, 1976-1990 92Figure 3.2: Area of total farms by province, 1976-1990 92Figure 3.3: Number of 0-79 ha farms by province, 1976-1988 93Figure 3.4: Area of 0-79 ha farms by province, 1976-1988 93Figure 3.5: Number of total farms by farm size category, 1976-1988 94Figure 3.6: Area of total farms by farm size category, 1976-1988 94
Figure 4.1: Central American experience with tax declarations, bank credit,and compensation 117
Figure 7.1: Changes in areas of principal crops, cumulative distribution,1975 to 1989 204
Figure 7.2: Changes in areas of principal crops, excluding maize, cumulativedistribution, 1975 to 1989 205
Figure 7.3: Commercial farms production of maize, wheat, and soybean, 1975 to 1989 205Figure 7.4: Noncommercial farm production of maize, millet, groundnuts, and cassava,
1971 to 1976 and 1982 to 1986 214Figure 7.5: Noncommercial farms production of maize by province, 1971 to 1976 and
1982 to 1985 215Figure 7.6: Zambia cereals production 216
Figure 8.1: Comparison of the CSO and MAFF maize estimates 244
ix

LIST OF ACRONYMS
CPI consumer price index
CSO Central Statistics Office
GOZ Government of Zambia
GRZ Government Republic of Zambia
ICRAF International Centre for Research in Agroforestry
LTC Land Tenure Center
MAFF Ministry of Agriculture, Foods and Fisheries
MMD Movement for Multiparty Democracy
MOL Ministry of Lands
x

Preface
The Government of Zambia is embarking on an ambitious program of legal and administrativereforms in land policy. Although the need to liberalize the land market is universally shared, the ideason how to accomplish this transformation are not. Two decades of underinvestment in field research haveresulted in the present situation of micro-level data on land tenure and farm-level production,consumption, and resource management inadequate to guide policy decisions. This report was preparedto help assess the state of knowledge and identify important land policy issues as a foundation forrecommending future research directions and to facilitate informed policymaking. Some will feel that thecurrent state of research is adequate and that the report does not go far enough with policy advice. Otherswill disagree with the level and nature of policy recommendations that are given. Should this report haveerred in either direction, it is due to the very difficult task of finding the appropriate balance, rather thanto any willful decision by the research team.
The research was carried out between September 1993 and March 1994 with funding from theUS Agency for International Development (USAID) in Lusaka. Further comments and suggestions wereincorporated between March and September 1994. An action plan for land tenure and administrativereforms based on these research findings was developed in close collaboration with the Ministry of Lands(MOL) and is contained in a follow-up document entitled "Land Reform and Institutional Transformationin Zambia: Recommendations for Policy Change" (July 1994). That action plan has now beenincorporated into a master planning document for the MOL, and its recommendations are under reviewby USAID/Zambia for possible financial support.
As will be seen, many Zambian authors have made important technical contributions through theirrespective chapters and more generally to the report. The Land Tenure Center (LTC) is grateful for theirsupport and that of the staff of the MOL who so generously gave their time in responding to the manyquestions and calls for data. Important comments on the report were also received from the landcommittee (S.P. Mulenga, T. Bull, L. Handahu, S.M.J. Zaloumis, and T.H. Phiri), David Straley ofUSAID, the Overseas Development Agency, G.H. Sichalwe of the Department of Resettlement, andvarious senior officers in the Central Statistics Office. The authors would also like to gratefullyacknowledge those people who willingly gave interviews or assisted with the analysis. Special thanks aredue David Musona, who managed in-country travel, banking, and other logistics, and Jane Dennis andSteven Smith, who spent considerable time on editing and assembly. There are no doubt manyknowledgeable individuals in Zambia who should have been contacted for contributions but were not. Ifresearch deficiencies have resulted, we can only hope that such an oversight can be corrected in futureresearch endeavors.
Michael RothProject Director
20 September 1994
xi


Chapter 1:
Legal Framework and Administration of Land Policy in Zambia
by
Michael Roth, A.M. Khan, and M.C. Zulu'
I. Introduction
A. Issues
The current system of land legislation, based on antiquated English law, is badly in need ofmodernization. Private landownership is effectively repressed if not prohibited by Zambia's currentlegal framework, and land cannot legally have value.' Lack of private ownership and a land marketostensibly constrains the development of formal credit and real estate markets, while delays and costsin processing leasehold issuances and property transfers purportedly constrain land markets and inhibiteconomic growth. The system responsible for officially delivering titles and managing state lands isseverely constrained by limited surveying capacity and the weight of thousands of applications, manyof which have been pending for years. Market reforms are increasing the profitability of agricultureand the demand for agricultural holdings at the same time that improvements in wealth and populationpressures are increasing the demand for residential property. The historical, political, and economicfactors that have led to a highly urbanized Zambian population and emphasis on mining are beginningto wane in favor of peri-urban and rural settlement. Zambia has a highly urbanized population; yet,it has, arguably, an abundant supply of arable land that, for complex historical reasons, remainsuncultivated. However, institutional constraints to agricultural expansion are manifest. Urban dwellers,whose links to ancestral lands have eroded with time, reportedly experience difficulties acquiringsufficient land through customary authorities and/or do not want to depend on their control. Many turnto the Ministry of Lands (MOL) for an allocation and for land sizes in excess of those provided bytraditional authorities; yet, considerable delays are caused by current registration bottlenecks andproblems with land identification.
Associated with the above agrarian expansion and land tenure constraints are issues that haveimplications for economic growth and equity. Are land rights adequate to encourage investment inbuildings and other fixed land improvements? Are land markets overly constraining land access,particularly for lower-income families in the residential real estate market and smallholders in theagricultural land market? Is the growth in demand for land speculative or productive? Are thelandholders residing on the land or are they absentee? Are legal provisions or transfer fees overlyconstraining the transfer of land among existing landholders or to potential market entrants? Whatmechanisms are appropriate for facilitating the emergence of land markets after nearly two decadesof socialism? What policies are needed to create a land market that is conducive to economic growth?
' Michael Roth is associate research scientist with the Land Tenure Center and Department of Agricultural Economics,University of Wisconsin-Madison. A.M. Khan is chief registrar of Lands-Deeds, and M.C. Zulu is commissioner of lands,Ministry of Lands, Lusaka.
2 See the section "Tenure on State Lands" (p. 14, below) for counterarguments asserting that land could legally have valueunder the Land (Conversion of Titles) Act, 1975, but that the law was incorrectly applied or interpreted in practice.

2
Why are there delays in the registration system, and how ought they be corrected? Is expandedregistration a panacea, or have abuses at central and local levels resulted in land grabbing, landconcentration, and inefficient land utilization by elites in pattern with the experiences of other Africancountries at similar stages of development? Is the veritable land rush underway creating resourcedegradation problems on arable farm land? What natural resource concerns are emerging in newlyopening frontier areas?
The Movement for Multiparty Democracy (MMD) government is calling for theinstitutionalization of a modern, coherent, simplified, and relevant land code and land administrationsystem that: ensures the fundamental right to private ownership of land; creates a more efficient landdelivery system; restores the confidence of investors; merges the now disparate pieces of legislationfor reserve and trust lands; facilitates the varied development needs of the country; attaches economicvalue to undeveloped land; encourages private real estate agency business; promotes the regularissuance of title deeds to productive landowners in both rural and urban areas; and, clears the currentbacklog of cadastral surveys and mapping.' This paper was contracted by the US Agency forInternational Development and the MOL to identify current land market constraints as a basis fordesigning an action plan to assist the government with land policy reforms.
B. Outline of report
This chapter provides a general overview of the history of land policy in Zambia and critiquesselected pieces of land legislation that define the legal framework governing land rights and landmarkets in the country. Legal and institutional impediments to the development of a market-orientedland policy are identified along with concrete recommendations for short- and long-term legal andinstitutional reforms. An institutional profile of ministries and agencies responsible for designing,promulgating, and implementing the various dimensions of land policy is briefly reviewed. Principalland policy issues confronting policymakers in Zambia are identified, setting the stage for moredetailed analyses of land administration processes, leasehold demand, land markets, and land valuationin subsequent chapters.
Chapter 2 presents a thorough review of land registration procedures starting with the rolesand activities of the chiefs and rural councils` and ending with the issuance of the title certificate bythe Commissioner of Lands. Emphasis is given to evaluating the issuance of leaseholds in previouslyundemarcated State, Reserve, and Trust Lands. The chapter further examines the causes of delays inthe leasehold process, explores ways for streamlining registration processes, proposes legislative andadministrative changes, and identifies future research needs.
Chapter 3 focuses on the assimilation and analysis of data on official title issuances andtransfers in State, Reserve and Trust Lands. Data are assembled on the number and size of propertytransfers and land prices as a basis for gauging land value and economic ground rents. Changes inagrarian structure based on available regional and national data from annual surveys are also evaluatedto assess the net growth in the number of farming units by land tenure category, trends in farm size,and growth of demand for leasehold property.
3 Since the MMD government came to power, value to land has been recognized and amendment to the law is being effected.° Herein, the term council or rural council is used in place of district council. The latter, while frequently cited in
regulations, is discontinued as two or more councils sometimes exist in the same district.

3
Chapter 4 deals with issues related to the emergence of a land market in urban and agriculturalproperties in Zambia. Technical and financial problems confronting private investors and the realestate industry are reviewed for private transfers. The chapter also reviews alternative methods foradministering government land policy in undeveloped areas, including options for land development,land distribution via allocation or auction, land price determination, valuation of leasehold rents, andproperty taxation. It further reviews the existing and potential institutional arrangements for setting,collecting, and disbursing proceeds from land sales and rental fees. Finally, it evaluates the financial,legal, and management issues associated with the establishment and operation of a land developmentfund (LDF) proposed by the MOL to assist with financing land development.
Chapter 5 is a synthesis of a land tenure study recently completed by the International Centrefor Research in Agroforestry (ICRAF) in collaboration with the Land Tenure Center (LTC) and theUniversity of Zambia. That study, involving a survey of 200 agricultural producing households inEastern and Southern provinces, is one of the few studies in recent years that details customary landtenure arrangements. Although the study focused on linkages between tenure and on-farm treeplanting, the formal questionnaire included general indicators of agricultural productivity anddevelopment as well. The chapter briefly discusses the research methodology used, followed byempirical findings on land acquisition, land rights, and land conflicts. Empirical results are alsopresented of an econometric analysis of linkages between land tenure institutions and selectedproductivity indicators including oxen mechanization, use of chemical fertilizers and credit, andpresence of various long-term improvements on land, including trees.
Chapter 6 reviews the nature and scale of past settlement schemes and assesses theirperformance based on archival research, and analysis of primary and secondary data. The market forprivate transfers and administrative allocations on newly opened lands will provide the principalmechanisms through which people can acquire lands in agricultural areas. However, due to pasthistorical factors and economic hardship, some segment of the population seeking land for farmingwill be unable to effectively use these mechanisms because of lack of purchasing power or the meansto resettle. The Government of Zambia (GOZ) has a long history of settlement programs that couldaccommodate these disadvantaged populations. The desirability of continuing or expanding thismechanism depends on the scale and performance of past schemes.
Chapter 7 uses available time series data to analyze national and regional changes in land use,productivity, and profitability of agriculture, both spatially and temporally, for the commercial andnoncommercial farm sectors. This chapter was intended as a more forward-looking analysis ofeconomic forces influencing the profitability of farming in Zambia, the rate of expansion in theagricultural frontier, and the resource issues that are likely to emerge in the context of agriculturalextensification. The chapter instead highlights the difficulties of using aggregate time series data forsuch analyses due to structural biases and inconsistencies in the data. Relatively straightforwardquestions—such as "How fast in area terms is the agrarian sector expanding?"—are rendered nearlyunanswerable by erratic swings in the data stemming partially from unreliable statistical methods andreporting.
Interpretation of data in the above chapters depends crucially on data quality and length andbreadth of data time series. Chapter 8 provides an overview of official time series published byvarious agencies in Zambia, including the state of their availability for analysis and the methodologyused to collect the data. Data presented in this and previous chapters underscore the difficulty ofmaking policy decisions given the very weak and tenuous base of empirical research on property

4
rights, agrarian structure, resource management, land use, and market access in both the state andcustomary sectors.
The Overseas Development Agency (UK) has made considerable investments in Zambia's landdelivery system and government valuation department. Likewise, the Swedish InternationalDevelopment Agency (SIDA) has made considerable investments in Zambia's land surveying systemand the analysis of economic ground rents. In recognition of their quality efforts and studies, thisreport deals only superficially with land surveying and mapping. Readers are encouraged to contactthose agencies for their respective reports. Any future work by USAID in land tenure reform andpolicy in Zambia should be tightly coordinated with their endeavors.
II. Colonial policy and settlement
Zambia's present system of State, Reserve, and Trust Lands is a legacy of the early colonialperiod. Emissaries of Cecil Rhodes and the British South Africa Company arrived in Barotseland in1884 to make a treaty with the then-paramount chief Lewanika. Treaties concluded with most of thechiefs in Zambia during the 1890s guaranteed "African" rights to large areas of tribal land in exchangefor mineral concessions. The 1911 Northern Rhodesia Order in Council instructed the company toassign to the African population (of Northern Rhodesia) sufficient land for their use and occupation.Missionaries, miners, and traders began to settle, reaching a population of roughly 1,500 Europeansby 1911. The company divested its control of the territory in 1924, and a governor was appointed bythe British sovereign. Under its agreement with the crown, the company retained its mineral rightsin exchange for territory. The 1928 Northern Rhodesia Order in Council formally established areasof crown land to be reserved for white settlement under English Land Law and reserve areas forAfrican occupation under customary tenure arrangements. (Section 5, "Land Tenure" [p. 14ff, below]covers in greater depth changes in statutory law from colonial times to the present.)
White settlement initially took place in a rather haphazard manner, first by the company andlater under crown governance. A series of Native Reserves Commissions between 1926 and 1928established a more regularized system of settlement by whites, and the systematic evacuation of crownland by African residents, who were forcibly crowded into reserves. Much land was left unclassified(table 1.1), and came to be known as the "silent lands," set aside for the anticipated influx of whitesettlers that never materialized (Bruce and Dorner 1982).
A postwar influx of ex-soldiers in 1919 brought the number of white farms along the rail lineto about 250. This figure remained static into the 1940s, resulting in substantial areas of crown landleft idle. Overcrowding in the reserves continued to worsen, leading in 1938 to the Pimm Commissionopenly stating that the reserves policy had been a disaster. The 1947 Northern Rhodesia (Native TrustLand) Order in Council provided for a fundamental reversal in policy. Whereas previously crown landwas reserved for white settlers, under the 1947 order it was defined as that amount required for amore realistic and limited number of white settlers, with the remainder reserved for native "African"occupation. Around 100 million acres of formerly unassigned land, forest and game land, andunutilized crown land were transferred to native "Africans" in the name of a new land category, TrustLands. By 1950, the crown land reserved for Europeans had shrunk to 4.6 million acres, while theland reserved for "Africans" (Reserve and Trust Lands) had increased to around 171 million acres.

5
Table 1.1: Land tenure classification, Zambia, 1937 and 1950 (million acres)
Land category 193T 1950°
Reserve Land:Barotseland 37.0Other reserves 34.0
Unassigned 94.0Crown (European) land 9.0 4.6Forest and game land 5.0 1.0African land:
Reserve Land 7i.0Trust Land i00.0
Unalienated crown land 4.7
Total i79.0 181.3
a. Robin Palmer, "Land in Zambia," in "Zambian Land and Labour Studies," vol. i, Occasional Paper no. 2(Lusaka, National Archives, n. d. ), p. 64.
b. Robin Palmer, op. cit. supra, 64. The discrepancy between the i937 and i950 is carried over from officialsources.
A number of important developments followed in the post-World War II period. First, a waveof settlers did eventually acquire farms; over a thousand white farms were established by the 1960s,with a substantial reduction in the area of unalienated crown land. Second, prior to the 1930s,allocations of crown land involved mainly freehold property. Beginning in the 1930s, more and moresettlers were granted long-term leaseholds rather than freeholds, giving way entirely to leaseholds by1944. With independence in 1964, crown land became State Land, while Reserves and Trust Landretained their pre-independence classifications (table 1.2). As late as 1987, the former European sectorcomprised only 6 percent of the nation's total land area.
III. Agrarian structure
State Land, or the former commercial sector, has been the geographical focus of commercialfarming in Zambia. The country historically has relied heavily on the commercial farm sector for thefood surplus to feed its highly urbanized population and work force. Large numbers of expatriatefarmers emigrated in the 1960s for several reasons: Zambian independence, marketing policies thatseriously eroded profits, major land incentives offered by Zimbabwe and South Africa, and stringentregulations governing expatriation of profits. Sales of freehold farms and assignments of leaseholdsincreased in the years immediately preceding independence and continued into the 1970s.Approximately 1,185 European farms with a total area of 3.79 million acres existed in 1961.Approximately 460 European farmers left the country within two years after independence (Arntzenet al. 1982). By 1970-71, the commercial farming sector had declined to 1,076 farming units, ofwhich 643 were classified as "African" and 433 as "non-African" (agricultural census). By 1981, thenumber of "non-African" commercial farming units by most counts had fallen to around 300 (Bruceand Dorner 1982).

6
Table 1.2: Land tenure classification, Zambia, 1973 and 1987 (million hectares)
1973° 1987"
State (formerly crown) Land: 4,080,647 4,518,953Freehold 1,015,791Leasehold 1,284,788Land under tribal occupation 509,396Unalienated land 125,102Inundated by water 216,250Forest reserves 546,570Protected forest reserves 382,750
Reserves° 27,314,000 27,297,500Trust Land` 38,977,530 43,447,900National parks and wildlife areas 5,826,300
Total 76,198,477 75,264,353
a. International Rural Development Division, Swedish University of Agriculture, Forestry and VeterinaryMedicare (Uppsala, April 1976), Zambia Sector Study, Preliminary Report, par. 3.1.1 (mimeo).
b. Includes 689,691 hectares of Protected Forest Areas.c. Includes 4,250,889 hectares of Protected Forest Areas and 29,153 hectares of Forest Reserves.d. Ministry of Lands and Natural Resources, "Ministerial Statement in Parliament on 4th August, 1987 on Land
Alienation in Reserves and Trust Lands" (1987).
The mass emigration of Europeans, as in Mozambique, depleted the agricultural sector ofmuch of its skilled labor and capital. The Zambian government, in order to maintain the productivityof the sector and to feed its heavily urbanized population and work force, undertook a variety ofagricultural programs. In some cases, parastatals took over land under leases for direct farmingoperations. In other cases, settlement schemes were established which subdivided large commercialoperations (in some cases failed parastatal operations) into smaller units of widely varying size.
Bruce and Dorner (1982) provide data on the number, area, and size of leaseholds existingat the end of the 1970s (precise years are unavailable due to inconsistent updating of data from fourseparate cadastre strips from the mid-1970s through 1981) (table 1.3). Private leaseholds constitutedthe largest share, representing 60.4 percent of the total. Government leases held by ministries andparastatals represented the next largest category (26.5 percent). The remainder of the leasehold landwas held by settlement schemes (3.1 percent), cooperatives (0.3 percent), and religious/educationalinstitutions (2.2 percent), or were vacant (2.2 percent) or in nonagricultural uses (5.3 percent).
Following independence, the agricultural sector witnessed a rapid expansion in the number ofsmaller "medium-scale" and "emergent" commercial farms (table 1.4). 5 As of 1989, the farmingsector comprised 740 large-scale farms (> 60 hectares), 25,230 medium-scale farms (20-60 hectares),119,200 emergent commercial farms (10-19 hectares), and 387,000 smallholder and mainly"subsistence" farms (1-9 hectares). The number of "emergent" farmers increased from 25,000 in 1965
5 Data reported on number of farms in chapter 3 (table 3.4) indicates farm numbers greatly in excess of these figures. Noinformation is available on the methodology for calculating these data.

7
to about 120,000 in 1990 (World Bank 1993a, p. 40). However, while the group of "emergent"commercial farmers, who rely on oxen plows, improved seeds, and fertilizers to produce a largemarketed surplus, is substantial (21 percent of total farming units) and growing, smallholderagricultural production, which is dependent on simple hand tools and subsistence farming, stillaccounts for 73 percent of all farming units. Most large-scale farms (97 percent), and to a lesser extentmedium-scale farms (75 percent) and "emergent" farms (66 percent), tend to be concentrated alongthe rail line and major road arteries in the Southern, Central, Lusaka, and Copperbelt provinces. Only14 percent of smallholder households are located in these provinces; the majority reside in Northern(29 percent), Western (22 percent), Luapula (19 percent), and North-Western (14 percent) provincesthat are less well connected to urban and market centers and where the marketing and physicalinfrastructure remain less developed.
Converting "smallholder" households into "emergent" commercial farmers is of strategicimportance. While in the past, commercial farms produced sufficient marketed surplus for the urbanpopulation, shortfalls in maize and food riots in the 1980s have underscored the need for morebroad-based agricultural development. However, such conversion of smallholders into an "emergent"class of commercial farmers will require substantial public investments in rural infrastructure to enabletheir integration into the marketplace.
IV. Arable land and crop expansion
Of Zambia's roughly 75 million hectares (table 1.2), approximately 16 million hectares areconsidered suitable for rough livestock grazing, and 9 million hectares are considered to be arable landwith good potential for crop cultivation (Ministry of Agriculture, Food and Fisheries 1993). Only 1.3million hectares are currently under crop cultivation, or roughly 14 percent of the nation's arable land.Almost all of Zambia's highest-quality arable land (about 1.4 million hectares) is currentlyconcentrated in already densely-populated areas and generally in the state sector (World Bank 1993a).
Table 1.3: Leases of State Land by type of lessee, late 1970s
Number ofleases
Total arealeased (ha)
Percent ofarea leased
Average size ofhousehold (ha)
A B C B/A
Private 1,674 1,232,987 60.4 737Governmental 502 541,902 26.5 1,079Settlement schemes 61 62,241 3.1 1,020Cooperatives 10 6,580 .3 658Religious/educational 69 45,677 2.2 662Vacant 74 44,387 2.2 600Nonagricultural 228 107,500 5.3 471
Total 2,618 2,041,274 100.0 780
Source: Bruce and Dorner, Agricultural Land Tenure in Zambia: Perspectives, Problems and Opportunities,LTC Research Paper no. 76 (Madison: Land Tenure Center, University of Wisconsin, 1982), p. 11.

8
Table 1.4: Number of farm units by size and province, 19896
L Large-scalecommercial(> 60 ha)
Medium-scalecommercial(20-60 ha)
Emergentcommercial(10-19 ha)
Smallholderhouseholds
(1-9 ha)
Southern 330 9,000 51,000 6,000Central 300 7,500 21,000 18,000Lusaka 90 2,000 4,500 14,000Copperbelt 500 2,000 18,000Eastern 20 6,000 23,000 8,000Western 10 5,400 85,000North-Western 70 2,900 53,000Luapula 60 2,000 73,000Northern - 90 7,400 112,000
Zambia 740 25,230 119,200 459,000
a. Estimates provided by the Ministry of Agriculture and reported in World Bank, "Draft Economic Report forZambia CG Meeting" (1993), p. 40.
b. The discrepancy between the column sum (387,000) and the total indicates a discrepancy of 72,000households.
However, a recent study commissioned by the Ministry of Agriculture, Foods and Fisheries(MAFF) and the World Bank (DHV Consultants BY, Netherlands, and Wood Consultants andInvestments Ltd., Zambia, 1993), hereafter referred to as the MAFF/WB report, indicates that asmuch as 43 percent of the potentially arable land in the commercial farming sector is beingunderutilized for crop production (table 1.5). 6 According to the study, many farms owned by theGovernment Republic of Zambia (GRZ) and many of the Zambia National Service Farms are poorlymanaged and undercapitalized; the prison farms are only marginally better. Parastatals, includingfarms held by Zambia Agricultural Development Ltd., Cold Storage Board, and Indeco, were alsofound to be experiencing high rates of underutilization. Other areas found to be class I underutilizedfarms are settlement schemes (Munyama, Mpimo in Kabwe, Chinjarain, Chipata) and most previously-owned TBZ (Tobacco Board of Zambia) farms (Mukonchi, Chibwe, etc.). However, high degrees ofunderutilization were also found in the private sector. Among private farms currently underutilizedwere those owned by civil servants, parastatal employees, and armed forces personnel who managetheir farms as absentee landlords or leave their operation to relatives who lack basic farm-managementskills. According to the study, the combination of inexperience and undercapitalization coupled withvarying degrees of indebtedness have resulted in vast tracts of prime land lying idle.
6 The land has been cleared but not cropped and is being used for rough grazing, including grassland on prime arable land.Determining whether livestock production is an "inefficient" land use relative to crop use would be difficult to assess withouta domestic resource cost analysis, but the data suggest that substantial expansion of crop agriculture on lands in the commercialsector is possible without further expansion onto virgin soils.

9
Table 1.5: Rate of land utilization, commercial farm sector
Rate of underutilized land (%) Land area (%) under
ProvinceArea of
farmsWell
veryor
wellModerately
under-Grossly
or simplyResettle-
ment Squatterassessed
(ha)utilized utilized under-
utilizedschemes
Lusaka 227,691 46.6 10.2 33.6 9.5Central:
Kabwe 140,486 21.3 11.3 60.6 6.9Chisamba 121,800 45.1 4.3 47.3 3.3Mukushi 151,050 63.4 7.2 29.4Big Concession 91,569 - 100.0
Southern:Livingstone 43,777 31.9 21.7 46.4 -Kalomo 216,890 62.8 22.0 15.1 -Choma 175,276 64.4 3.1 16.8 15.2 .5Monze 76,378 48.3 15.3 35.8 .7Mazabuka 164,515 59.4 .7 7.5 30.8 1.7
Northern:Mbala 53,446 31.3 24.1 26.9 - 17.6
Eastern:Chipata 49,240 28.7 19.8 18.1 33.4 -Katete 92,744 56.4 2.5 26.6 14.5 -
Copperbelt 183,159 15.8 3.6 70.2 10.4 -
Source: DHV Consultants By, Netherlands, and Wood Consultants and Investments Ltd., Zambia, 1993.
With the exception of several parastatal farms and settlement schemes, the commercial farmingblocks in Southern province were the best utilized (table 1.5). Eastern-province blocks were found tobe generally well utilized due to their relatively high population densities. The commercial blocksaround Lusaka contained a mixture of some of the "best" and "worst" utilized farms in the country.The entire Big Concession Block in Mumbwa was found to be grossly underutilized due largely to lackof basic infrastructure. The Kabwe farm block was also found to be grossly underutilized due to "thesaga of the TBZ assisted tenant scheme." Many commercial farms in Copperbelt have recently beenopened, hence the reason for large areas of underutilized land there. The Mbala farm block inparticular was found to be underutilized due to poor soils and numerous absentee landlords.
Of the total of over 400 farms visited in the course of the study, 222 had underutilized landtotalling 364,583 hectares. The largest proportion was located in the Copperbelt, but large areas ofunderutilization were also found around Lusaka, the Big Concession, Kabwe, and Chisamba. Of thetotal number of assessed farms (visited and unvisited), 687,886 hectares were determined to beunderutilized. Assuming that 60 percent of this area is good arable land, an heroic assumption giventhe dearth of data on land use quality, the study concludes that a total of roughly 400,000 hectarescould be brought into cultivation without opening new lands.

10
The study recommends that: (a) all parastatal farms be privatized immediately; (b) governmentshould adopt stringent but realistic criteria for selecting farmers based on sound management, proventrack record in farming, solid financial base, and sound farm development plans; (c) land tenurereforms should be implemented to permit private ownership, confer tenure security, and facilitatetransfers; (d) government should consider an economic ground rent (rates varying by agroecologicalzone) to induce greater land utilization; and (e) government should establish a land agency to smoothlyhandle land transfers.
The GRZ has also been identifying new farm land for agricultural expansion (table 1.6). InLusaka province, an area of about 30,000 hectares was identified along the Kafue Flats, but the landbase is fragile, requiring special management. The area in Central province east of Mukonchi,according to the study, offers good scope for development. Two further areas south of Mkushi offergood potential for development. Overall, the study concludes that about 1,470,000 hectares of newland can be opened for agricultural production, and that some of these lands (79,384 hectares) arecurrently being opened up for settlement with mixed success. Success, according to the study, usuallydepends on the provision of basic infrastructure—roads, water, and utilities. Given the high level ofland underutilization already existing on state lands, the study concludes there is no immediate needto identify new farm blocks, while the existing blocks—namely Mansha, Mkushi South, Mupamadzialong the Tazara, the Mtirizi/Chipangali West in Eastern province, and Mukonchi East in Centralprovince—have high potential for development.
Table 1.6: New farm blocks and areas under development
Area (ha)New farm block Gross Under development
Lusaka west, Lusaka province 30,000 0Mukonchi East Bank, Central 28,000 0province 10,000 1,000Mtirizi, Eastern province 28,000 1,000Chipangali West, Eastern provinceTazara blocks: 78,000 0
Cl: New Mkushi 215,000 11,216TZC2: Munte 90,500 870TZC3: Katikulula 125,000 0TZC4: Mupamadzi 120,000 20,000TZC5: Kanchibya 100,000 28,798TZC6: Mansha 300,000 0TZC7: Kasama 65,000 0TZC8: Mbala 95,000 0TZC9: Isoka
Copperbelt province: 22,000 4,000Mpongwe 30,000 10,000Munkumpu 30,000 0Munkumpu South State Farm 66,000 2,500Mwinuna 28,000 0Lukanga North State Farm 10,000 0Mikata
1,470,500 79,384Total
Source: DHV Consultants BY, Netherlands, and Wood Consultants and Investments Ltd., Zambia, 1993.

11
Why such a large supply of arable land has not been brought under cultivation, despite Zambiahaving one of the highest rates of urbanization in Africa, is fundamental to assessing the potentialexpansion of crop and livestock agriculture. A number of factors have had an important influence.First, the British colonial policy of forced resettlement of the "African" population into the reserves,and later forced labor for the mines, combined to uproot the vast majority of the rural "African"population. Second, once uprooted, the vitality of the copper industry until the late 1970s helped topull labor into urban employment and keep people in the cities. Third, the urban bias in agriculturalpolicies, which subsidized consumers and implicitly taxed producers until the late 1980s, providedfurther disincentives to farming or returning to rural life. Finally, for much of the urban population,one or two generations removed from their rural roots, the lack of physical infrastructure (roads,hospitals, schools, comparable housing) and utilities in rural areas would now mean a high social costin moving.
The culmination of these historical processes is a highly urbanized population—one of thehighest in Africa. The urban population was estimated at 3.284 million in 1990, or 42 percent of thetotal population of 7.818 million. With population growing at an annual rate of 3.8 percent in urbanareas and 2.9 percent in rural areas, the total population is projected to reach 10,816,440 by the year2000, with the urban population increasing to 44 percent of the total (Ministry of Agriculture 1993,p. 9).
Zambia's economy has undergone a transition since independence. The mining sector as apercentage of GDP has declined from 41 percent in 1965 to 8 percent in 1991. Over the same period,the share of the agricultural sector remained fairly constant at around 15 percent but has increasedslightly to about 18 percent in recent years (Ministry of Agriculture, Food and Fisheries 1993). Witha decline in the copper industry, an abundance of arable land, and recently implemented marketingand price reforms that have begun to reverse the former urban bias in agricultural pricing policy infavor of rural producers, agriculture is positioned to become the engine of growth for future outputexpansion.
Despite what would appear to be a rather immobile urban population, Zambia's area of cropland, according to one source, has witnessed an extremely high rate of expansion since the 1970s.Data compiled by the World Bank from 1974 to 1990 (table 1.7) show an extremely high rate ofgrowth in agricultural production, but mostly from opening new lands. The World Bank report doesnot provide statistics for total cropped area. However, the rates of growth for maize (10.0 percent),sorghum (19.4 percent), millet (14.9 percent), and groundnuts (23.7 percent) (these being the mostimportant crops cultivated, table 1.8) provide a good indication of the rate by which new arable landis being brought into cultivation. After weighting these percentages by crop areas in table 1.8(1986-87 figures), the calculation shows that crop area is expanding at an average rate of 12.5 percentper annum, resulting in a doubling of crop area every 6 years.
Independent estimates of growth rates calculated in chapter 7 show far more modest rates ofgrowth. The growth rate analysis suggests that total crop area in the commercial sector declined at anaverage annual rate of 0.6 percent for the period 1975 to 1989, while maize area declined 4.1 percentannually on average. Maize production declined between 3 and 7 percent per annum depending on thefarm size category studied. (Dramatically higher rates are observed among small farms in thenorthwest region, but the base of cultivated area is relatively small). Published estimates of area and

12
production figures for the noncommercial sector are extremely limited. Production data were locatedfor the period 1972 to 1986 after which date publication ceased; area estimates were published
Table 1.7: Rates of growth in crop production, 1974-1990
Principal cropsYield growth rate Production growth
rate (%)Area growth rate (%) (%)
Maize 10.0 (1.9) 8.3Millet 14.9 (1.8) 12.7Sorghum 19.4 4.3 24.0Paddy rice 22.0 2.6 24.0Wheat° 78.2 18.0 64.0Mixed beans 23.0 0.4 22.6Groundnuts 23.7 (1.0) 17.8Cotton 42.1 1.6 42.1Tobacco (V) 1.1 (3.3) (2.4)Tobacco (B) 30.6 (4.1) 24.5Soybeans 29.1 (1.9) 25.1Sunflower 15.9 2.7 19.8
a. The growth rate for wheat would appear to be incorrect as the estimated growth rate in yield plus theestimated growth rate in area should more or less equal the estimated growth rate in production.
Source: World Bank, "Draft Economic Report for Zambia CG Meeting" (1993), p. 39.
only for the period 1983 to 1986. Based on these data, maize production in the noncommercial sectorgrew at an average annual rate of 1 to 7 percent annually over the period 1972 to 1986, dependingon the region examined. Both sets of data for the commercial and noncommercial sectors areconsistent with statistics reported by the US Department of Agriculture which suggest a growth ratein cereals production in Zambia of roughly 1.1 percent annually over the period 1961 to 1989. Theseresults suggest profound disparities between the World Bank analysis and the empirical analysis inchapter 7. Differences stem partially from the World Bank analysis beginning with the year 1974, amomentary trough in output, and their use of forecast (not actual harvested) data. Overall, the analysisin this paper suggests a far more modest rate of agrarian expansion, though the highly volatile natureof both forecast and Central Statistics Office (CSO) survey data cannot be overemphasized.
Rates of growth in area, production, and yields have important implications for thesustainability of resource management in arable areas and the conservation of natural resources inprotected areas:
► A high rate of growth in area combined with stagnant yields would suggest that the greatestoutput gains in the short to intermediate term (10-15 years) would be expected from crop areaexpansion, particularly if an enabling land tenure environment is present. Data in table 1.7would suggest this conclusion, while independent estimates in chapter 7 would suggest farmore cautious estimates of expansion growth. Further the data in table 1.7 would suggest aconducive environment for land tenure and an ease in opening or expanding the agricultural

13
frontier. The data in chapter 7, showing stagnant area growth, do not refute this hypothesis,but likewise do not support it.
► A rapid rate of growth in area would raise important questions about: the sustainedpreservation of land reserves for forests, parks, and wildlife; and environmental concerns ofdeforestation and declines in soil and water quality, particularly in situations of land scarcity.The data in chapter 7 do not indicate an immediate cause for concern, although the issue maybe important.
► Declining productivity measured by falling yields per hectare over time provides a weakindication that soil mining is occurring, and/or that addition of soil supplements andtechnology growth are not sufficient to offset the natural decline in soil fertility arising fromcultivation. The data in table 1.7 and chapter 7 would weakly support both hypotheses, thoughagain statistical inferences are difficult due to wide fluctuations in the data.
Table 1.8: Crop area, commercial and noncommercial farms
1986—1987 1990—1991
Non-CF(000 ha)
CF(000 ha)
Non-CF(000 ha)
CF(000 ha)
Maize (including seed) 699 78 535 44Millet 70 0 88 0Sorghum 63 0 44 0Rice 22 0 11 0Wheat 10 8 na naGroundnut 107 na 125 3Sunflower 48 5 32 5Soybeans 27 14 15 38Mixed beans 35 na 53 1Cotton 33 1 na naTobacco 8 7 na naCoffee 1 3 na naSugarcane 3 11 na naFruits 3 5 na naOther crops 88 2 na naMixed crops 137 0 na 0
Total 1,354 134 na 91
Source: Ministry of Agriculture, Food and Fisheries, "Assessment of Potential Land For Expanding AgriculturalProduction in Zambia" (1993), p. 3.
At a more fundamental level, there is an urgent need for ground truthing of aggregate datatime series through field-level research and data collection. There is a dearth of information on manybasic questions. Is the customary land tenure system facilitating or constraining agriculturaldevelopment? How are customary systems and statutory tenure curtailing or facilitating the agrarian

14
transformation? Is the current leasehold system properly performing its role of clearly adjudicating,recording, and guaranteeing rights, or instead is it causing unacceptable levels of disputes anddisplacement of landholders under the customary system? Is tenure insecurity under either systemadversely limiting investment incentives and credit access?
Some weak evidence is provided on the performance of the various land tenure systems in theremainder of this paper, but a gross underinvestment in research on land rights, their intra-householddistribution, agrarian structure, land markets, and land tenure security inhibits concrete conclusions.It would seem a reasonable conclusion that the leasehold process discussed further in chapter 3 andresettlement programs in chapter 5 have been important factors in bringing new entrants intoagriculture and new land into farming. Yet, data on leasehold numbers and CSO data on number offarms are published only at a provincial level, which is far too aggregated to assess these issues in arigorous way. The process of land settlement or crop area expansion also has fundamental implicationsfor the sustainability of resource management, farm size, market access, and the environment; here,too, the information is rather superficial and largely anecdotal.
V. Land tenure'
Zambia's legal system is based on common law imported from Britain (Chinene et al. 1993).The Royal Charter executed on 29 October 1889 paved the way for the introduction of English lawin the country. Through the North-Western Rhodesian Order in Council of 1889 (for Barotseland) andthe North-Eastern Rhodesian Order in Council (outside Barotse territory), English law was made toapply. A host of other legal regimes in Zambia make reference to English law, including theSubordinate Courts Act Cap 45 of the Laws of Zambia (SECTION 14), and the High Court Act, chapter50 of the Laws of Zambia (SECTION 13.9). However, the Application Act (chapter 4 of the Laws ofZambia) is the most prominent integration of English law. According to this act, common law, thedoctrines of equity (c) statutes which were in force in England on the 17th day of August 1911, andany later English statutes applied to Zambia, are made in force in Zambia. Chinene et al. (1993) notethere are doubts over which 1911 English statues apply, but these provisions and the decisions reachedin English courts elsewhere in the Commonwealth have considerably shaped Zambian law.
Despite the application of common law in Zambia, most Zambians still conduct their activitiesin accordance with customary law. No single body of customs prevails across the country; in fact,local variations are common. The term customary law encompasses a host of different prevailing tribalcustoms. Although customary law has been superseded by legislation in many areas, it continues toplay a considerable role in the development of land tenure concepts and structure in tribal areas.However, land legislation enacted in Zambia by the colonial government and the post-independenceparliament has had the single most important influence on land law and land rights in the country.
Common law, equity, and statute law mainly apply in State Lands, whereas customary lawapplies to Reserve and Trust Lands except where land in these categories has been converted to StateLand. In 1928, the Northern Rhodesia (crown lands and Native Reserves) Order in Council waspromulgated, creating two categories of land: Crown Land and Native Reserves. Generally, Crown
7 Parts of this section draw heavily on chapter 2, "Review of Land Tenure under Legal and Customary Systems," in Chineneet al. (1993).

15
Land consisted of land earmarked for European settlements and mining along a narrow strip of about20 to 30 miles on either side of the railway line from Livingstone to the Copperbelt, including thinpockets of land near Chipata, Mbala, Mukushi, Mumbwa, and Mwinilunga.
A. Tenure on State Lands
Land alienation for white settlers along the rail line was initially framed in terms of freeholdtenure for a preliminary period of 5 years during which personal occupation and development of thealienated land was mandatory. In other areas, farms were alienated to settlers for periods notexceeding 99 years, while leases for ranches over 6,000 hectares were issued for terms not exceeding30 years (Chinene et al. 1993). Considerable disaffection with freehold tenure arrangements eventuallyled to a review of land policy by the Eccles Land Tenure Committee in 1943. The committeerecommended that the freehold system be displaced by a 99-year lease on grounds that it ensuredgreater control over land by the state. The Legislative Council approved this in 1946. Extensivechanges in the ownership of state agricultural land accompanied the Land Ordinance in 1956 thatintroduced the "concept of progression" whereby a farmer who performed satisfactorily could upgradetenure from leasehold to freehold. This ordinance was later repealed and succeeded by the presentAgricultural Lands Act.
The present framework for the administration of State Lands (former European sector) forcommercial farming is the Agricultural Lands Act of 1960 (CAP 292). This act provides for theestablishment of an Agricultural Lands Board appointed by the minister of Lands and NaturalResources and prescribes its composition, membership, powers, and functions.' It also provides forthe alienation of agricultural land, preparation of schemes, application process for allotted land,criteria for reviewing applications, duration of lease, rents, and conditions of use. It further providesfor the development of tenant farming schemes, including scheme creation, conditions for terminatingresidency, and regulations. The act is framed to carry forward, and deal with, fee simple titles andleaseholds in State Land from previous registrations (SECTION I.3). 9 New allotments to applicants aredecided upon by the Land Board (SECTIONS II.4 to II.9), and, if approved, alienated by the presidentto the lessee for a duration of 30 years (SECTION III.19). Every lessee is required to take up personalresidence on the holding within 6 months of the commencement of the lease, or as otherwise agreedby the board (SECTION III.21). Use conditions are specified, including (as approved by the board)annual cultivation of some portion of the plot, maintenance of stock, or development ofdipping/spraying facilities, paddock fencing and water supplies as considered adequate by the board(SECTION 111.21). The lessee, while allowed to use timber from the holding for own farming ordomestic purposes, is prohibited from selling or removing any timber without the president's consent(SECTION II1.23). A lessee is not entitled to assign, sublet, mortgage, charge, encumber, enter intoa partnership, or part in any way with the holding without the prior consent of the president (SECTIONIII.24).
New leases of scheduled State Lands must be approved by the board, which is to considergeneral policy directions from the minister, age of applicant, the applicant's character, the applicant's
The agricultural lands board is defunct and hasn't been convened in years. Furthermore, land allocations are proceedingwithout it (see chapter 2 for elaboration).
9 Although the provision was drawn to carry forward and deal with fee simples, this is now subject to SECTION 5 of the Land(Conversion of Titles) Act, 1975, which terminated freehold property.

16
willingness to personally occupy and develop the holding, and his or her capital resources andqualifications to develop an agricultural holding (SECTION III.17). Preference is to be given toapplicants who do not already hold State Land (SECTION III.18). Once an allotment is made and a rentlevel set by the board, the lease is executed by the president in whom the title is vested. This authorityhas been delegated to the Commissioner of Lands. In case of failure to comply with the provisionsof the act or conditions of the lease, the board, after giving written notice of the failure and providingan opportunity for remedial action, may terminate the lease. Upon termination, for expiry or otherreasons, the minister on the recommendation of the board authorizes compensation for unexhaustedimprovements (SECTION III.22). However, the act envisages the renewal of most expiring leases(SECTION 111.30).
The Land (Conversion of Titles) Act of 1975 (CAP 289, hereafter referred to as theConversion Act) vested all land in Zambia absolutely in the president (SECTION 4) and converted allfreeholds into leaseholds (SECTION 5). The act converted any fee simple titles or leaseholds still ineffect at the time of the act to leaseholds not exceeding 100 years (SECTIONS 5 and 6). Upon expiry,a lease may be extended for a further 100 years or less as the president may see fit (SECTION 12.i).Lessees are not entitled to assign, sublet, mortgage, charge, encumber, or part in any way with theholding without the prior written consent of the president in writing (SECTION 13.1). The presidentis also granted powers of fixing the maximum amount to be received, recovered, or secured for land(SECTION 13.3). However, in fixing prices, the president must disregard any value of land apart fromthe unexhausted improvements thereon (SECTION 13.3). 10 Thus, idle land without improvementscannot have value, and the benefits of investments in land accrue to the leaseholder, but not the valueof the land created by location or presence of public investment. Mortgages on land are possible butonly on the value of unexhausted improvements on the land (SECTION 10). Also, the minister may,by regulations, prescribe the maximum area of agricultural land, and different maxima may be soprescribed for different areas, districts, or provinces (SECTION 17). Further under the First Scheduleto the act, the lessor or the state maintains the right of possession of all mineral oils and preciousstones and right of entry on all lands to prospect for and mine such minerals (SECTION III.3). Also,the lessee is not allowed to let the land remain idle for a period of more than three years except withwritten consent of the lessor (SECTION III.6).
These two acts in effect create two systems of review and control of leases and leaseholdtransactions: State Land "scheduled" under the Agricultural Lands Act; and other State Land. In thefirst case, any leasing of land must first be approved by the Agricultural Lands Board, then referredto the Commissioner of Lands. As regards State Lands not scheduled under the Agricultural Act, theboard has no role. Here it is the Commissioner of Lands, acting under delegated authority of thepresident who approves or refuses applications. As Bruce and Dorner (1982) suggest, there is nological basis for this distinction between "scheduled" and "unscheduled" State Land, and consolidationis advised. Also, improvements on the leasehold must be valued to comply with the legal requirement
Michelo Hansungule (personal communication) of the School of Law, University of Zambia, asserts that the use of theterm may rather than must or shall implies that the president need not set prices in every case. If a maximum price is not set,then the provision does not come into play. SECTION (13(3) theoretically would allow a transaction where a willing buyer anda willing seller freely negotiate a price without recourse to the president, but the law has been neglected in practice. InHansungule's view, SECTION 13(3) was intended to allow the Commissioner of Lands to decide whether a presidential invitationto fix prices was warranted, and, if so, a price would be set without regard to land value. However, successive commissionersapparently read the provision as applying to all land probably because of the prevailing mood against land markets and concernsof land speculation at the time.

17
that compensation be paid only on the basis of unexhausted improvements in the land, not the landitself. As the MOL lacks a valuation department, this task must be performed by the ValuationDepartment of the Ministry of Local Government and Housing—a cumbersome and time-consumingprocess.
The Lands and Deeds Registry Act of 1914 (CAP 287) provides for the registration ofdocuments, the issue of Provisional Certificates of Title and Certificates of Title, and the transfer andtransmission of registered land. Every lease for a period of more than one year must be registered,as must any assignment of, mortgage, or charge upon such a lease (SECTION II.4). Any document notregistered in the designated time period is null and void (SECTION 1I.6). Any proprietor of a lease of14 years or more must first apply for a Provisional Certificate of Title. After 6 years, the proprietorof the lease may apply to the registrar for a final Certificate of Title (SECTION 111.43).
Before any title certificate (provisional or final) may be issued, the applicant must submit asurvey diagram which complies with the requirements of the Land Survey Act of 1960. The act makescomprehensive provisions for the registration and licensing of land surveyors, provides for the mannerin which land surveys are carried out and the diagrams and plans connected therewith, provides forthe protection of survey beacons and other survey markers, provides for the establishment and powersof a Survey Control Board responsible for the registration and licensing of land surveyors, and for theexercise of disciplinary control over such surveyors.
The act imposes high and rigorous standards of ground survey. The Land Survey Division ofthe MOL, with severely limited staff for meeting these standards, is badly behind in survey work.Currently, the MOL estimates a backlog of roughly 30,000 applications in various stages. To avoidlong delays in the issuance of title certificates, the Survey Division and the registry have for manyyears adopted a policy of accepting, for registration, leases of up to 14 years if accompanied by anadequate sketch plan (thereby sidestepping the rigorous standards of fixed-boundary survey). Once aLand Survey Act survey is conducted, the 14-year lease is surrendered, a 99-year lease is granted,covered by a final Certificate of Title. This practice is common, and is the mechanism for grants ofland in settlement schemes. Its legality, however, is an open question because of the lower surveystandard. In addition, the majority of the above backlog cases are reportedly 14-year titles for whichsurveys were never undertaken. The pending expiry of these leaseholds is raising anew the issue ofsurveying bottlenecks and added registry work associated with either renewing them as 14-year leasesor converting them to a 99-year basis.
These procedures, involving six different sections in three different ministries (the AgriculturalLands Board, the Commissioner of Lands, the Land Registry Section and the Land Survey Section,all in the MOL, the Land Use Planning Branch in the Ministry of Agriculture, and the ValuationBranch in the Ministry of Local Government and Housing) are far more complex than can be justified.This complexity, coupled with severe understaffing, results in extended delays in leasehold transactions(see chapter 2 for further analysis of the registration process).
The Town and Country Planning Act (CAP 475) is the legal framework for the control andregulation of all development of statutory leaseholds. Submission and approval of these plans can bean onerous exercise, as indicated by a recent ODA (1989) study:
The system often fails to plan and program the release of land to meet demand ordevelopment policy and to program and coordinate the release of funds for plan

18
implementation including the opening up and servicing of land....The developmentplan system...is over-demanding in its requirements of plan content and procedure ofpreparation for the modest planning guidelines needed for the development ofrelatively small rural provincial and district centers. Staff resources in the Departmentof Town and Country Planning have found it difficult within their day-to-dayworkload, to keep up with the monitoring, updating and new plan preparation neededfor these centers....A more simplified system is required but one which neverthelessis capable of measuring land requirements and providing a framework for andencouragement of public and private investment.
The Town and Country Planning Act omits from planning control and plan preparationimportant peri-urban areas on the city fringes. Curiously, the requirement of a development planapproved by planning authorities in Reserve and Trust Lands has also been excluded. The requirementfor planning permission is mandatory and extensive. The term "development" is defined by statute(SECTION 24, CAP 475) and by common law, but in effect is determined on a case by case basis.Land use conditions are also specified in towns. Although the act provides for the preparation ofregional plans, none to date have been prepared (ODA 1989).
The Lands Acquisition Act of 1970 makes provisions for the compulsory acquisition of landand property. No compensation is payable in respect of undeveloped or underutilized land (SECTION
IV.15). In assessing compensation, the value of property is the amount by which the unexhaustedimprovements would be realized if sold on the open market (SECTION III.12). A right of appeal to theNational Assembly exists against the amount of compensation determined by the minister. There isno appeal on matters involving decisions to compulsorily acquire property, since this is at thediscretion of the president. This act has been severely abused in the past as government hasexpropriated land with inadequate levels of compensation, in some cases for public works, but in othercases for reallocation to private individuals. Charges of fraud, corruption, and bribery have beenwidespread in association with the implementation of this act.
B. Reserve and Trust Land administration
The administration of Reserve Land is governed by the Zambia (State Land and Reserves)Orders, 1928 to 1964 (hereinafter referred to as the State Land and Reserves Orders). Under theseorders, the land in the reserves is set apart for the sole and exclusive use of the indigenous people ofZambia. This provision according to the Ministerial Statement in Parliament (4th August 1987) onLand Alienation in Reserves and Trust Lands is intended to protect the villagers and their customaryrights to land. The president can make grants or dispositions of land to Zambians and rural councilsfor periods of up to 99 years. In the case of nonnatives, terms are limited to 99 years for publicpurposes, 33 years for missionary societies and charitable bodies, and 5 years in any other case(SECTION 6A.1). The president must in all cases consult the rural council (SECTION 6A.4). The lesseecannot, without written consent of the president, assign or sublet the leased land or appoint any personother than a native approved by the assistant district secretary to be in charge of the land (SECTION
10, The Reserves Regulations). Also, according to the Reserve Grant Regulations, a lease cannot bedisposed of by will except if a law permits, that its disposal by intestacy shall be governed by a lawpassed by parliament, and that the land granted cannot be subdivided without the consent of thepresident unless a law permits (no such laws exist in any of the three cases). The nature of rights andinterests that can be acquired in reserves is nowhere explicitly stated, although from the powers of thegovernor it is implied that what was intended is customary tenure (Chinene et al. 1993).

19
As a result of overcrowding and resource degradation in the reserves, and demands byEuropeans for more land for settlements, Governor Young in 1938 introduced a new concept of NativeTrust Lands. Unlike its predecessor in Nyasaland, which declared the whole of unalienated land asTrust Land, it was decided in Zambia that areas of alienated land which showed promise for Europeanfarming and mineral deposit would be retained as crown land. Once ecological and geological surveysdetermining these criteria were completed, the remainder of the land would be declared Native TrustLand. By the 1947 Trust Land Order in Council, 57 percent of the country was declared Trust Lands,and the net area under crown lands was subsequently reduced.
The above restrictions pointed out for the reserves do not apply to Trust Land areas. Theadministration of Trust Land is governed by the Zambia (Trust Land) Orders, 1947 to 1964(hereinafter referred to as the Trust Land Orders). The president can grant a Right of Occupancy ofup to 99 years to a non-Zambian and demand rent for the use of the land. While Zambians and districtcouncils can own title, non-Zambians are also allowed provided that they qualify as investors or areapproved by the president as provided under Act No. 15 of 1985. While fee simple and rights ofoccupancy with rent are mentioned, the president now makes such grants in leaseholds. No transferof Trust Land to anyone for more than 5 years is valid without consent of the president. Furtherrestrictions are placed on transfer, disposal by will, and subdivision. The governor (forerunner to thepresident) more or less enjoyed the same powers of administering land as in the reserves. The twoprovisions—99-year leases and grants of land to nonnatives—imply a felt need to distinguish betweenthe Reserve and Trust Lands. As with the reserves, interests and land rights in the Trust Lands fellto customary law and administration thereof to traditional authorities (chiefs).
While the Conversion Act would seem to invoke fundamental legal changes in the Reserve andTrust areas, it was enacted without repealing the Orders in Council. The practical effect has been thatland matters in Reserve and Trust areas continue to be interpreted in light of the orders. Under theLocal Administration Act, 1980 to 1992, chiefs were statutory members of rural councils, a policyfollowed by the 1985 administrative circular in which the Department of Lands stipulated therequirement of consent of the chief before an application of leasehold on customary land. Thisarrangement has essentially afforded customary leaders a legalized means of effectively resisting landalienation, which according to Zambia's National Farmers Union is an important factor underlyingthe low rate of land alienation in Reserve and Trust areas.
The policy of land reservation through the Native Reserves and Trust Lands did not untilrecently apply to land in Barotseland proper. According to the Barotseland North-Western RhodesiaOrder in Council of 1899, land in the central regions of Barotse were set apart for the litunga andtheir people. Under the terms of the Barotseland Agreement of 1964, the litunga 's powers over landin Barotseland as governed by customary law were recognized and guaranteed, as they were inARTICLE 8(2) of the Independence Constitution of 1964. Land in Barotseland continued under thedomain of the litunga and Lozi customary law until the Western Province (Land and MiscellaneousProvisions) Act of 1970 which vested all land in Western province in the president as a reserve underthe State Lands Orders. Regardless of these legal changes, the traditional authorities in Westernprovince have been the most reluctant to encourage or permit their subjects to hold state title deeds(personal communications, Commissioner of Lands). The litunga is in fact issuing title deeds that,while offering proof of customary rights, have no legal grounding in the eyes of government. Thereis substantial evidence (see Times of Zambia, 25 May 1993) of tensions emerging between local andcentral authorities over control of land rights.

20
[According to the acting] MMD chairman of Sesheke...three investors wanted...to setup cigarette and tomato sauce...factories [but] because of [a] mix-up between thecouncil and the royal establishment...these people have not come back....But ChiefInyambo denied...he was blocking efforts by councillors to give land toinvestors.... [According to the chief's advisor, the chief] was not at loggerheads withthe councillors because they were not...supposed to be involved in...issuing...land inhis area....The investors were being misled [by the Sesheke council] into selectingareas of their choice which were already occupied by villagers and then...being takento the senior chief for consent. The process of allocating traditional land is thatheadmen should [first] be approached. These report to the Silalo indunas who take theapplications to the Kuta, [who] finally informs the chief to sign. [The MMD chairmanindicated] that because of the previous mix-up..., investors [are now being] referredto the Litunga of Western Province.
Such problems act to stifle the initiative of "outsider investors," meaning all non-Lozi investorsincluding foreign nationals and Zambians from other parts of Zambia. However, even Lozis cannotget statutory title deeds to their customary land.
The government is currently encouraging an "open-door" policy to spur capital creation,whereby foreign investors are encouraged to develop farms and businesses in Zambia. The currentsituation of high debt loads, declining donor aid, and slow economic growth are expected to dampencapital expansion from internal public and private sources for the foreseeable future. Foreign investorsseek guidance on suitable land for settlement from the MOL, which then directs them to the councils.Investors leave disgruntled when the MOL is unable to designate clearly defined, demarcated, andregistered areas of land for settlement, or when negotiations are held with the chiefs which mustsubsequently be turned down by the MOL.
The Ministerial Statement in Parliament on 4 August 1987 on Land Alienation in Reserves andTrust Lands provides clarification on the role of chiefs and the importance of leasehold property. Itstates that "there is no need to consult Chiefs before granting land on title deeds in the customary(Reserves and Trust) area." Rather the statement points out that ART. 6A(4) of the State Lands andReserves Orders and ARTICLE 5(2) of the Trust Land Orders stipulate "that only the District Councilsmust be consulted" (p. 2). However, "since it is recognized that the Chief can make a grant of landunder customary law and since the Chief is the custodian of traditions and customs of his community,it is important that he is consulted so that any alienation of land in the Reserves and Trust land areasdoes not infringe on the customary rights and interests of the community....[B]eing custodians ofcustomary law and rights, [they] know better which members of their communities hold land undercustomary tenure or which land has been set aside for settlement, communal grazing, traditionalfarming or indeed for any other use" (p. 3).
It goes on to point out that some chiefs "regard the title deed as something that would makethem lose control over land and their subjects. Hence they are very reluctant to recommendapplications for land. [However,] there is a growing number of other progressive Chiefs whounderstand the law and procedures for applying for title deeds. These Chiefs have taken the lead inacquiring title deeds to their personal holdings" (p. 3).

21
An alternative view on the role of the chiefs is provided by the Zambia National FarmersUnion (n.d.):
One of the main problems of improving access to individual titles in the traditionalareas is the attitude of the chiefs....Some chiefs refuse [to give their consent] fearingloss of status and respect....There may be a case for removing the chiefs' power ofveto, but this should only be...a last resort. They still have a significant role in ruralsocieties, and removal of their power could both weaken this role and createopposition to...farming progress....On balance, it is probably desirable thatthey...retain [control over] land, but...there may be need for education and perhapssome sort of appeal procedure—possibly to provincial committees of chiefs.
Circular No. 1 of 1985, "Procedure on Land Alienation," hereafter referred to as simply thecircular, lays out the procedures for preparation of layout plans, allocation of stands, matters relatedto unscheduled agricultural lands, matters related to Reserve and Trust Lands, and applications forland by non-Zambians. The councils are responsible, on behalf of the Commissioner of Lands, forprocessing applications, selecting suitable candidates, and making recommendations (SECTION 3). Inthe Reserve and Trust Lands, the powers of the president in making grants or dispositions of land arelimited by the requirement to consult the local authorities affected by such grants or dispositions(SECTION D.(i)). Local authority, in the circular, had been administratively understood to mean thechief and the rural council (SECTION D(ii)). To ensure this practice, the Commissioner of Lands willinsist upon the written consent of the chief concerned. The circular stipulates, for the time being, thatleases cannot exceed 250 hectares of land for farming purposes in the Reserve and Trust Lands, andrural councils are advised not to recommend alienation of land in excess of this amount (SECTION
D(v)).
Under Amendment 2 to the Conversion Act (see p. 16) no land can be alienated to anon-Zambian (foreigner) without written approval by the president. To obtain approval, anon-Zambian must first submit his/her application to the council. The council is given wide powersto request information about the intended development as is deemed necessary (s. E(ii)). Whenrecommending the application to the Commissioner of Lands, the council is required to give fullinformation on the intended development plan, extracts of the minutes of the committee of the councilresponsible for land matters, extracts of the minutes of the full council, and four copies of theapproved layout plan duly endorsed and stamped by the Chief (SECTION D(iii)).
With the rigorous survey standards required for 99-year leaseholds, the many steps andprocedures required by the leasehold process, the different levels of national and local bureaucracyinvolved, and one central registry to process applications, it is clearly understandable why there arelong delays in processing leasehold applications. Advancements in survey technologies anddecentralization of registry services can reduce registration costs and expedite surveying time.However, the issue remains whether, and to what extent, the involvement of chiefs in the registrationprocess creates bottlenecks and will continue to do so even after actions are taken to improve thetechnical aspects of registration delivery." The strengths of the current system lie in the checks andbalances imposed on the actions of both the chiefs and government, but inherent in the process are
" To some extent, the chiefs consent is a false issue. A newcomer would find it very difficult to operate in most Reserveand Trust areas without the chiefs consent and forbearance.

22
many tedious steps that lead applicants through a maze of administrative channels (see chapter 3 formore details).
C. Urban, housing, and improvement areas 12
The Legislative Council in 1957 set up a committee to examine tenure conditions in respectto urban and peri-urban areas. That committee according to Chinene et al. (1993) recommended thatgovernment adopt a policy of freehold tenure in urban areas except African townships and Africanhousing areas located in European municipalities and townships. It was further recommended thatunalienated land should be granted as freeholds to municipal councils. These recommendations led tothe Crown Grants Act, which was later repealed by the Housing (Statutory and Improvement Areas)Act of 1974 and the Conversion Act of 1975.
President Kaunda in 1975 announced fundamental changes in land policy to the sixth NationalCouncil of UNIP on grounds that freehold tenure impeded the country's development and led toexcessive speculation by landlords (see, for example, Chinene et al. 1993). All freehold titles wereto be converted to statutory leaseholds of 100 years duration or less; all unutilized tracts of farmlandwere to be taken over immediately by the state; a requirement of presidential consent was introducedbefore any dealings in land; sale of land in urban areas was abolished save for dealings inimprovements on the land; all vacant and undeveloped land in and around major centers was to bemunicipalized; and real estate agencies were ordered to close down. The supporting framework forthese changes—the Conversion Act of 1975—took effect the following year.
The Housing (Statutory and Improvement Areas) Act of 1974 still provides for the control andimprovement of housing in declared areas. The minister is granted powers to declare any area of landwithin the jurisdiction of a council to be a Statutory Housing area as long as the land is held in feesimple, and a housing plan prepared by the council is approved by the surveyor general (SECTION 4).The council, with the minister's approval, can subdivide the land, effect improvements, and lease anypiece to any person for such a term and conditions as are approved by the minister (SECTION 5 (1)(a)-(c)). The council is prohibited from selling or conveying any freehold estate, leasing more thanone piece of land to any one person, or leasing to any person who is engaged in the business ofbuying, selling, letting, or developing immovable property (SECTION 5 (1) (i)-(iii)). Upon paymentof a prescribed fee, a council certificate of title for land is issued to an individual (SECTION 7 (1)) orlegal entity (SECTION 5 (2)). Where two or more persons are entitled as tenants in common toundivided shares, only one certificate of title shall be issued (SECTION 7 (3)), although the councilregistrar is given powers to issue a separate certificate for each person's share upon payment of a fee(SECTION 7 (4)). The registrar is prohibited from registering any document purporting to transfer landnot having received the council's prior consent (SECTION 42). A person is liable to a fine (K500) orimprisonment (not to exceed 2 years) (SECTION 45) if such person applies a rent, fee, purchase price,or other charge in excess of charges prescribed in the act, erects a structure without prior approvalof the council, or illegally occupies or uses the land (SECTION 44 (a)-(d)). The act further describesthe regulations for registration of titles under part III, and for the declaration of improvement areasunder part VIII.
' Z Parts of this section draw heavily on chapter 2, "Review of Land Tenure under Legal and Customary Systems," byMichelo Hansungule, in Chinene et al. (1993).

23
The rights of squatters and the landless were also implicitly addressed by this legislation. In1968, the Ministry of Local Government instructed local authorities to lay out basic site and serviceschemes for squatter settlements (ministerial circular No. 29 of 1968). Settlers were issued LandRecord Cards as verification of their rights to individual plots, but the cards lacked legal grounding,leaving settlers fearful of eviction (Chinene et al. 1993). Under the Housing (Statutory andImprovement Areas) Act, the minister was authorized to declare an "improvement area," and theCommissioner of Lands was granted authority to issue titles to the local authority, which in turn couldissue occupancy licenses and titles to settlers. Once a general sketch plan by a settler is produced,occupants are allocated serial numbers indicating their plots which suffice for registration and issuanceof title (i.e., 14-year leases). The Housing Act is the only legislative enactment on squatters in thecountry, but applies only to urban areas while squatting is common in state lands. Officials contendthat occupancy licenses confer security of tenure, and the title is sufficient for collateral. Data onnumber of mortgages by 14-year and 99-year lease (in chapter 3) provide weak evidence to thecontrary.
D. Agencies responsible for land policy
The MOL is responsible for formulating and ensuring proper administration of land. All landregardless of location is vested in the president (and the minister of Lands) on all land mattersincluding granting of land, fixing ground rent, and determining the conditions under which land isheld. The Lands and Deeds Registry is responsible for registering all interests in land and for issuingtitle deeds. The Town and Country Planning Department in the Ministry of Local Government isresponsible for zoning, certain large local authority plans, and determining "proper" land use. TheMinistry of Environment is responsible for the control of land use for forestry, factories, and otheruses, and for formulating conditions under which land can be used in certain areas. It is alsoresponsible for approving the consolidation and subdivision of land based on its environmentalinterests.
The Land Use Planning Section of the Department of Agriculture, Ministry of Agriculture,is involved through its central, provincial, and district offices with the preparation of farm plans andfarm layouts, settlement planning, land allocation and demarcations, site preparation, land use and landsuitability assessment. It receives directives from the planning section of the department to find sitesand prepare layouts for agricultural schemes and projects. It also gives advice to applicants forindividual farm holdings based on conservation principles, i.e., suitable land use, farm size, farm andfield boundaries, and location of services and facilities (ODA 1989).
The workload in providing such advice for new individual holdings as well as the increaseddemand for lease titles will continue to expand. Without changes, farm planning advice and landapplication processes are likely to be overstretched, leading to further delays in land allocation andregistration. The expansion in numbers of small-scale and medium-scale commercial farms is erodingthe structure of a few large commercial-sector farms that the agency was designed to service. One canonly expect the commercial farm sector to become more dispersed and extended through subdivisionsand opening of new lands. The department will no longer be able to afford the intensity of planningwork per farm that has characterized its operations since colonial times. If the department is to keeppace with these trends, fundamental changes will be needed. Options include, but are not limited to:(a) greatly simplifying land use planning and the work entailed in lease approvals; (b) reducing thevolume of work by perhaps eliminating reviews of subdivisions; (c) prioritizing work toward farm

24
appraisals for divestiture and opening new lands for resettlement; and/or (d) expanding personnel,equipment, transport, and land mapping capabilities through additional infusion of funds.
The Government Valuation Department is responsible for assisting councils in levying ratesfor local revenue generation, for monitoring and advising on legislative and procedural reforms (e.g.,the current government considerations on replacing the property transfer tax with the capital gainstax), for capital valuations of private sector housing, and for general advisement on ground rents,office allocation, land allocation, land identification, economic ground rent, land value, and sale ofgovernment housing. The GRZ also has approximately 15,000 government houses. The GovernmentValuation Department (GVD) sees a continued and growing role at the policy and implementation levelin assisting GRZ policy to introduce phased economic rentals, and to provide funds to manage theportfolio more effectively (GVD 1993). It remains unclear to what extent the GVD will or should beresponsible for fixing prices for land allocations by the Lands Department or setting economic groundrents for leasehold property. The Lands Department would argue that a separate capacity within theMOL ought to be developed to assist the Commissioner of Lands in these areas, particularly foragricultural properties. Alternatively, it could be argued that a merger, or greater integration, offunctions is needed.
The institutions responsible for implementing the various functions of land policy are currentlyhighly dispersed with inadequate coordination among ministries. As indicated in chapter 3, theCommissioner of Lands must rely on a nearly autonomous Surveys Department for surveying andmapping. Decisions on subdivision must come from the Ministry of Environment. Land use planningappraisals are made by the land use planning section of the Ministry of Agriculture, while nodepartment has the capacity for conducting research on land policy. It is too much to expect thevarious ministries to make expeditious decisions in a seamless fashion. An overhaul of departmentsresponsible for land policy is needed, with careful attention given to clarifying roles andresponsibilities. In some cases, the establishment of new line departments (land policy analysis) maybe needed. In other cases, mergers or consolidation may be justified.
E. Subdivisions
Various attempts were made in the course of this work to determine the rationale and criteriafor decisions related to land subdivisions. As indicated earlier, the Ministry of Environment isresponsible for the control of land use and for formulating conditions under which land can be usedin certain areas. The land use division of the Ministry of Agriculture is responsible for advising onland use decisions for agricultural properties including making site evaluations and project plans fornewly opened lands. Policy related to subdivisions has important land market implications, particularlyif subdivisions are tightly controlled and constrain land access. Unfortunately, no data could be locatedon applications for subdivisions involving either of these ministries or the MOL. Data on number ofapproved lease subdivisions are reported in chapter 3, but these data would not necessarily reflect theexistence or scale of problems should subdivision policy be constraining transfers. Furthermore, noofficial circular could be located that clearly articulates the criteria used to make actual decisions onwhether to permit subdivisions in individual cases. The "General Notes on Farm Subdivisions," dated1978, in figure 1.1 was extracted from ministry files and, according to certain ministry personnel, isstill effectively used.
According to these notes, a number of considerations must be taken into account before anyfarm subdivision can be implemented. Such considerations may be based on land capability, farm size,

25
water potential, and the viability of the units to be subdivided. Except for land close to urban areas,allotments cannot be less than 10 hectares; in outlying areas, subdivisions would not normally be lessthan 80 hectares; and under certain circumstances, subdivisions may not be allowed in cases wherethe resulting portions are less than 500 hectares.
Subdivision limitations in general are difficult to justify on economic grounds. Farm sizesaimed at providing a minimum economic return are nearly impossible to set as yields or productivitychange with technological advances, and prices of inputs and outputs fluctuate with supply anddemand. Small farms, through part-time farming, may be quite effective in maintaining income paritywith larger farms and non-farm employment may actually increase the private flow of capital intoagriculture. Furthermore, designing farm size limits that carefully account for changes in incomesamong region (based on differences in soils, climate, and prices) are nearly impossible to make, andin practice tend to be either badly done, or not done at all, resulting in regional imbalances. Concernsabout uneconomical farm sizes developing from subdivisions are also not justified. In the presence ofan unconstrained land market, profitable farmers should be able to expand their parcel (farm)holdings, while likewise farming units with underutilized land should have the flexibility to downsize.Granted, land markets in the past did not permit this flexibility. But, in the future economy whereprices are permitted to adjust in response to market forces, the old system of applying subdivisionpolicy to a limited number of commercial farm holdings will no longer suffice and runs the risk ofcurtailing growth.

26
Figure 1.1: General notes on farm subdivisions
1. 10 ha (25 acre) subdivisions should be confined to an area within 5 km of the latest Lusaka boundary. Thesubdivisions should all be on arable land with either high borehole potential or having a perennial streamwithin reach. Beyond 5 km from the Lusaka boundary, subdivisions should not go below a minimumeconomic agricultural holding. Thus each unit to be subdivided should remain large enough to remaineconomically viable as well as self-sustaining.
2. As a general rule, the size of the units to be subdivided should be calculated on the soils (as well as landuse capability) and borehole or water potential. For example, deep Makeni red soils over dolomite with highwater potential could be subdivided to 40 ha (100 acres). Similar subdivisions can be carried out on deepcolluvium or alluvium soils with perennial streams through the land.
3. Sandy soils derived from schist and with low water potential fall into two categories: (a) farms over muvaor cheta schists on the periphery of dolomite areas can be subdivided into 10 ha (25 acre) plots within 5 kmof Lusaka. Beyond this distance, these soils should not be subdivided to less than 80 ha (200 acres) per unitof arable land; (b) basement complex schists usually with low borehole potential, high erosion hazard, andlong soil rotation required should not be subdivided to less than 160 ha (400 acres) of arable land.
4. Farms with large areas that are non-arable (classes V, VI, and VII) will need special planning to maintaintheir agricultural viability. Cattle ranching is best suited for these classes. But as for farms close to Lusakawhere stock theft is rife, forestry should be considered. A green forestry belt for rock areas west and southof Lusaka should be seriously considered. The carrying capacity of the above-named classes is one livestockunit for 4 ha and the minimum economic herd size is 125 livestock units. Therefore the minimum sizesubdivision of the above classes (V, VI, and VII) should be 500 ha (1,250 acres). This should be taken as aguide as each farm will need to be considered individually. For instance, if a proper subdivision only coversclass V (dambo), then even 551 ha will not be viable as cattle will have nowhere to graze during the rainyseason when the dambo is too wet for cattle grazing.
5. The units to be subdivided should remain large enough so that proper rotation and soil conservationpractices may be carried out. Moreover, very small units far away from Lusaka are considered to beuneconomic. In addition, one should take into account the physical shape of the farm in relation to the arableunits before considering subdividing the farm. The implication here is that the physical shape of a farm willultimately influence the manner in which subdivisions should be carried out as well as taking into account thepositions of the arable units.
VI. Demand for leasehold properties
A. Current registrations and lease transfers
Despite intentions to increase the number of leaseholds nationwide, the number of titles hasplateaued in recent years. The number of new title issuances ranged from 1,491 to 1,757 annuallybetween 1990 and 1992 (table 1.9). (More recent and complete data at the provincial and nationallevels are represented in chapter 3.) The MOL reports that these figures are down somewhat fromearlier years, but nonetheless it is not expected that the supply of new titles would increasesubstantially from these levels due to capacity constraints. Surrenders of title or repossessions by thestate for reasons of death or failure to meet land use plans or pay rents has been steadily increasing,from 219 in 1990 to 281 in 1992. Assignments or transfers of existing leases have also been steadilyincreasing, from 845 in 1990 to 1,242 in 1992. These data shed some doubt on the hypothesis thattransfer fees and subdivision policy are absolutely constraining transfers. As the pool of existing leases

27
expands with registration, the demand for reissuing leases via surrenders or assignments will placeever greater demands on the registry.
Table 1.9: Issuances, transfers, and mortgages of leases, 1990 to 1992
1989 1990 1991 1992
Issuance of state leases (including reserve leases) 1,491 1,757 1,701Surrenders and certificates of reentry 219 203 281Assignments (transfers of leases) 845 924 1,242Mortgagee' 879 707 677 692Agricultural charges 10,947 1,530 517 2,137
a. Total value of mortgages was K809.7 million in 1989, K695.1 million in 1990, and K653.2 million in 1991.Source: MOL.
Unfortunately, lack of time series data on official transfer fees preclude any analysis of theelasticity or inelasticity of land transfers (how transfers change with adjustments in the level of transferfees). A high elasticity would imply a strong positive response to a reduction in transfer fees(elaborated on in chapter 4), a negative response would imply only a limited potential land marketresponse, perhaps due to subdivision policy. Without such an analysis, only weak conclusions can bedrawn from the data in table 1.9: land transfers (assignments) are low. While subdivision policy maybe constraining land markets, it is not an absolute constraint as transfers appear to be easing with time.(Ministry officials note that many if not most subdivisions have been approved in recent years;landholders taking excessive time to work through the various administrative procedures, however,may be dissuading potential market participants from selling land.)
At present, there are between 70,000 to 100,000 titles issued nationwide (MOL estimates).Most are residential properties, but a large number are agricultural properties, mainly registrationsby "emerging" and "medium-scale" farmers (see chapter 3). New applications for title brought forwardto the Land Allocation Committee" provide a fairly good indication of the overall split betweenagricultural and non-farm demands for title. During the first 5 months of 1993, a total of 2,486applications for title were made to the councils: 58.5 percent were for residential property, 33.7percent for agricultural property, 7.3 percent for commercial and industrial property, and 0.5 percentother. (See chapter 3 for a more complete and detailed regional breakdown.) Of the agriculturalleasehold applications, over 71 percent originated in the councils located in the urban and peri-urbansettings of Lusaka and Copperbelt provinces. Whether this demand stems from higher populationdensities, nearer access to the registry, greater demand for tenure security, or enhanced credit accessis not possible to sort out from existing data.
B. Potential leasehold demand
The above estimates of current lease issuances and transfers reflect only the "flow" of workby the MOL and exclude lease applications in process and known future demands. Besides the 1,750
13 This agency appears to be fulfilling the functions of the board in the Agricultural Lands Act.

28
or so leases issued annually by the government, the MOL estimates that it has a current backlog of30,000 applications in various stages. Based on the number of lease applications brought forward tothe councils (table 1.10), applications are currently coming in at a rate of 6,000 per annum. Inaddition, the MOL foresees a large increase in the demand for title: 17,658 new registrations ofsmall-scale and medium-scale farms on planned farmlands (on an area of roughly 730,350 hectares)mainly along the Tazara corridor; 6,210 cases of pending titles in settlement schemes on 338,700hectares; and 1,020 titles on an area of 59,390 hectares associated with land demarcation surveys donein 1992 (internal MOL data). Another 18,000 titles are envisioned associated with the survey andsettlement of smallholders on parastatal farms currently being considered for privatization in Lusaka,Central, and Northern provinces.
Table 1.10: Lease applications brought forward to district councils,1 January to 31 May 1993
Residential Commercial Industrial Agricultural Others
Northern 63 7 - 25 1Luapula 19 7 25 1Central 218 13 1 85Southern 144 37 1 58 2Lusaka - 477 -Eastern 70 10 2 30 2North-Western 30 5 9Western 120 8 1 8Copperbelt 190 33 12 122 3Lusaka 600 30 15 - 2
Total 1,454 150 32 839 11
Source: MOL.
As with the administration of the Land Acquisitions Act, there are widespread rumors of graftand corruption in the leasehold process extending from the chiefs up to the MOL. Regardless ofwhether these claims are true, the situation where demand for title is greatly outpacing the system'scapacity to process leaseholds creates a fertile environment for those with influence or wealth to abusethe system, as has been the case under the sporadic registrations systems in southern Uganda before1975 and in Somalia throughout the 1980s. While the average time to process an application accordingto the MOL is 2-3 years at present, these estimates are biased in that they count only those leases thatultimately get issued and not the ones that have remained in the system for much longer without beingprocessed. Under current conditions, many applications may never result in title.
C. Factors influencing demand for title
Why such a large demand for title? Two reasons, sometimes inseparable, are repeatedlymentioned by official sources: the demand of the leaseholder for enhanced tenure security forinvestment; and the greater security afforded to lenders of capital from title as collateral.

29
1. Tenure insecurity and investment demand in Zambia
Until independence, chiefs held responsibility for all land in the Reserve and Trust areas. Withthe nationalization of land after independence, the chiefs lost most of their legal responsibilities forland allocation, although they retained some status as titular heads. The government in 1985, partlyto gain favor with the chiefs and partly in recognition of their custodianship of customary law andrights, decided in practice that the chiefs ought to be formally consulted on decisions of leaseholdmatters (SECTION V.B). Formerly, an individual wishing land, would go to his or her native villageor parents' village and ask the chief for an allocation. This process appears to be no longer possiblein many areas for two reasons.
► Ties between the urban population and the chiefs have weakened considerably with time.Children, whose parents and grandparents are one or more generations removed from rurallife, in some cases find that chiefs no longer recognize their traditional rights to land and inother cases simply do not want to subject themselves to the chiefs authority. Applicants arerequesting land allocations from the MOL partially for convenience, cost, freedom of control,and the assistance they get in finding new land.
► Colonization and state nationalization of land have undermined the chiefs' role in thecustomary tenure system, particularly in the peri-urban area, and further created ambiguityregarding who holds ultimate responsibility for land allocation. Individuals seeking land toestablish a commercial farm or a game ranch are directed by the MOL to the chiefs and ruralcouncils. Chiefs in certain areas are willing to designate lands, but other chiefs who have seentheir control over land erode with time lack the willingness to do so. Once allocations aremade by the chiefs, the MOL still maintains the right to disapprove any contract negotiated.
Very little rigorous empirical work has been done on the issue of tenure security in Zambia.Examples are reported, however, of people being unwilling to invest in the land because of concernsthat the chief will reallocate or sell the land of a current holder to another. Inheritance law under theindigenous system also appears to confer tenure insecurity, in that the landholder does not haveassurance that land or property can be passed onto kin. In one case reported by his son, the father wholived on the land for more than 20 years one day discovered that the chief had sold the entire farmto an outsider. The son tried to register the land as a leaseholder to keep the sale from going throughbut without success. Two other cases have been reported where chiefs sold large blocks (one of 56,000hectares, the second of 14,000 hectares) of land to outside investors. In both cases the sale failed tomaterialize because of the land ceiling imposed by the district authorities when the buyers tried toregister the land. Nevertheless, such occurrences can have a ripple effect on communities throughoutthe region.
Some individuals, having established residences, become concerned about the possible loss oftheir home and improvements in the land. The steep investments required to open new lands—landclearing, boreholes, fencing, and buildings for livestock and place of residence—increase the felt needfor title to increase security of rights. In addition to investors' inability to acquire land, those whomanage to borrow land from fellow villagers fear that the land can be grabbed back by the ownerswithout notice of justification (see, for example, the following article published in the Zambia DailyMail, 1994).

30
For a long time, would-be investors in Western province have been complaining aboutthe tenure system which they accuse of failing them to acquire land fordevelopment....For those who manage to borrow land from fellow villagers, [the]possibility of the owners...grabbing [it] back is more than 80 per cent. [A]teacher...complained that the land...he had borrowed was later grabbed from him bythe owner.... [A]fter a successful season which saw his family harvest quite a numberof bags of rice, the owner suddenly withdrew the land on the pretext that his familywas under land pressure....[D]espite these rigidities,...certain influential individualshave broken the barrier and [claimed]...massive pieces of land.
It is certainly a matter of concern that borrowers are feeling insecure in their rights, butlenders as owners are within their rights to repossess the land. The more important issue is the lackof long-term transfer rights and contracts that provide security for both lender and borrower. It alsois difficult to assess from the anecdotal evidence whether the landholders being evicted are localinhabitants or recent arrivals. All that is evident is that certain landholders are experiencing tenureinsecurity under customary tenure arrangements. In other instances, land grabbing by outsiders,sometimes armed with official titles, is precipitating tenure insecurity in rural areas as illustrated inthe following article (Daily Mail, 14 January 1994):
In Zambia...land is being dished out to foreigners and investors without consideringthe long-term consequences such action will have on the people ....Zambia has entereda phase where land grabbing is escalating at an alarming rate....In Chief Kabamba'sarea, for instance, Serenje district council has already given out 4,800 hectares of landto a South African investor on grounds...this will bring development to the district....North-Western province which is probably the richest in terms of forest resources issaid to be attracting many foreign investors....Traditionally,...people managedagriculture based on land rotation.... However, things have been changing over the lastfew years. People from outside the province are coming to stake claims to land in thename of development and local people cannot fight Lusaka businessmen or SouthAfrican investors.
There is no doubt that tenure insecurity is occurring in some cases where title is absent inZambia. But that question in itself is not sufficient to encourage widespread titling. The spotty andanecdotal information available simply isn't detailed enough to determine whether the insecurity isarising in the more densely populated areas, in instances of high or rapid commercial development,on the expanding frontier of the agricultural zone, or whether title itself may in some cases begenerating the tenure insecurity through improper adjudication of rights.
Three sources of tenure insecurity thus seem to be present or at risk of occurring. First, theleasehold system itself is the cause of large land allocations to outsiders that, when driven by pressuresto "privatize," can result in tenure insecurity for those lacking title or the means to acquire it. Second,there is the misadministration of the customary sector by some chiefs on Reserve and Trust Lands,characterized by chiefs allocating or selling large tracts of land to outsiders, chiefs reallocating orselling land of existing claimants to a higher bidder or someone with influence, or chiefs preventingone from bequeathing land to heirs or otherwise preventing the transfer of land to another. Third,there is the potential risk of conflict between registered and customary systems. Sporadic titlingsystems relying on voluntary registration are susceptible to generating landlessness or displacementof rights by existing holders, particularly in situations of rising land value, acute land scarcity, and

31
situations where the state is either unable (due to fiscal constraints or excessive work) or unwillingto completely adjudicate all rights of landholders.
2. Credit access
It is difficult to conclude from the data on existing mortgages and agricultural charges placedon titles that registration has had a significant effect on credit access. Agricultural charges includecredit issued under the Agricultural Act for crops and farm implements. Mortgages include creditdisbursed for land purchase and long-term capital improvements. As indicated in table 1.9, mortgageswhere title was secured for collateral generally remained stagnant or declined from 1989 to 1992,ranging from a high of 879 to a low of 677. Agricultural charges have varied widely. From a highof 10,947 charges in 1989, the total dropped to 517 in the drought year of 1991, before reboundingto 2,137 in 1992. Compared with the total number of commercial farms nationwide (145,170 in 1989,table 1.4), the number of agricultural charges does not seem particularly impressive. However,compared with the 740 large-scale farms which likely possess title, the data would suggest a stronglinkage between title and credit access. Which farms are acquiring the credit is a crucial question.
There is no doubt that perceptions of title being needed to gain access to credit has been animportant factor driving leasehold demand. Discussions with two agricultural lending banks give someinsight into the perceived importance of title in enhancing credit access.
Lima Bank is a state bank with no private capital or private investors. Its principle operatingobjective is disbursing agricultural credit to increase production and incomes in rural areas. Credit ispredominantly given to small farmers; 96 percent of the total clients are small farming units, 3 percentare medium-scale farming units, and 1 percent are large-scale commercial farming units. In the currentyear, the bank disbursed K8 billion of credit, 85 percent being short-term seasonal loans, 10 percentmedium-term loans and 5 percent long-term loans. Sixty percent of this credit went to roughly 18,000smallholders nationwide. The remaining 40 percent was disbursed to roughly 3,000 medium- andlarge-scale farmers. Demand for credit increased sharply around 1980 with the increase in the largenumber of "emergent" farmers entering commercial agriculture. While the bank used to extend creditwithout title as collateral, and still does to a limited extent, it is now reaching the point where title isa prerequisite. In normal years, the bank experiences 30 percent loan losses on its seasonal loans, onehalf of which is usually recovered through legal action, late repayments, or foreclosures on property.Rarely has the bank had to engage in foreclosures, however. For those loans secured by title,titleholders are reportedly extremely reluctant to part with the title once they have it and resort toother sources to pay back loans. In the 1970s, the bank had to advertise foreclosed farms for sale orauction. However, because of a very robust land market, the bank no longer has to advertise. A listof potential buyers is maintained by the bank that is purportedly much longer than the supply offoreclosed properties, and properties are liquidated quickly. 14
The Zambia National Commercial Bank has the backing of 98 percent public capital and 2percent private capital from shareholders. The bank's agricultural portfolio is smaller than that of
" Whether this process of foreclosing on farms is good or bad is not easy to assess. There is always the possibility that farmsare resold to insiders and those with political influence. One wonders whether properties should not be foreclosed via an auction,even if fair market value is not paid, to minimize the potential for corruption and any appearance of impropriety. Separatesources in the ministry indicated that foreclosures were in fact nearly impossible to achieve.

32
Lima Bank and has been erratic in recent years due to the drought. About K2.8 billion were disbursedin the last agricultural season. Of this total, roughly 60 percent went to 120 large commercial andcorporate farmers, and roughly 40 percent to 1,025 smallholders and 52 "emerging" commercialsmallholders (table 1.12). All credit has a 5-year term or less to minimize exposure to inflation.Defaults vary in the vicinity of 15 percent in normal to good years, but can be 40 percent or worsein drought years (as occurred in 1989-91) (table 1.11). Most of the credit being extended tosmallholders is not secured by title. Rather, the individual's credit history is the principle guarantee.For newcomers, credit will initially be disbursed for seasonal inputs sufficient for 2 hectares of land(approximately K250,000 for a package of inputs). If repayment is made, the borrower is eligible toincrease the size of borrowing the next season to an amount sufficient to buy inputs for 4 hectares,and so on up to around 40 hectares. Beyond that size limit, more intensive capital inputs (i.e.,tractors) are generally needed and the bank is reluctant to extend such credit without title as collateral.While smallholders do get access to credit without title, it takes a considerable number of years tobuild the credit history and to reach medium commercial size.
Table 1.11: Direct agricultural financing, Zambia National Commercial Bank
Amount of credit Recovery rateNumber of clients (K1,000) (%)
1987/88 1,374 47,475 831988/89 2,340 110,000 871989/90 2,737 304,768 601990/91 1,238 391,493 651991/92 1,140 743,552 451992/93 1,197 2,825,402
Source: Zambia National Commercial Bank.
In the past, banks were able to effect charge and stop orders that enabled the bank to claimthe crop in the field to ensure repayment, or to place a lien on crop sales at the local cooperative.With market liberalization, however, farmers have the freedom to sell where they wish, greatlyreducing the effectiveness of such orders as collateral. Title's role in guaranteeing credit has increasedas a result. Title helps to secure the loan in case of default. Even without foreclosure, the landholderis unable to go to another bank to get credit as long as the title is held by the former bank. Sooneror later, the borrower will have to repay the loan to regain borrowing status.
Both banks expressed the need to help the rural population for sake of development and, nodoubt, partially due to development mandates imposed by government. Both banks are expected to beprivatized soon. It would be difficult to predict how the agricultural component in either bank'sportfolio will fare after privatization. Both banks have reported sizable defaults in recent years, yetboth report profitable operations from their agricultural lending activities. It is difficult to see how theLima Bank, which charges 47 percent interest on its loans, can earn income in an inflationenvironment well in excess of 100 percent, along with the 15 percent losses reported earlier. Eitherlending operations are being subsidized through indirect transfers from the state or its capital base iseroding. On the positive side, both banks feel that land title is a strong form of guarantee and that astrong land market enables easy liquidation of foreclosed property, thereby reducing lending costs.

33
Table 1.12: Credit by number of farms, Zambia National Commercial Bank
Total farmingunits (#) SSF (#) ECF (N) LCF (N) C (#)
1987/88 1,374 1,266 - 100 5 31988/89 2,340 2,142 180 10 81989/90 2,737 2,500 200 20 171990/91 1,239 1,100 84 38 161991/92 1,140 1,015 60 45 201992/93 1,197 1,025 52 79 41
SSF =small scale farmers. ECF =emergent commercial farmers. LCF=large commercial farms. C=corporatecompanies.
Source: Zambia National Commercial Bank.
These structural developments in the financial market have important implications for futuretitle demand. Should agricultural lending by banks stagnate in the new private market era, then astrong case can be made for the emergence of credit rationing to titleholders. In Kenya, for example,it is nearly impossible to get an agricultural loan without title, but roughly 2 percent of titleholdersget credit. Once one moves out of the registered former white highlands in Kenya, and the areas oflarge-scale commercial farming, the use of commercial credit declines sharply for a number ofreasons: economies of size in mechanization and demand for intensive capital investment by largefarms; the diseconomies associated with smallholders gaining access to credit; and the difficulty bankshave had in foreclosing on leasehold properties in rural areas. There are preliminary indications thatcredit demand is beginning to outpace credit supply in Zambia. While Lima Bank, for example,extended K8 billion in credit in the last season, it received applications for more than K20 billion.
Should the pace of title issuances outpace the growth in credit supply, future credit access willdepend heavily on three factors: title ownership, farm size, and non-farm incomes or other forms ofcollateral that banks might use as a guarantee. Larger farms with title and other sources of capital willcontinue to get credit. But small "emerging" farmers will be squeezed on the one hand by tenureinsecurity from lack of title (due to administrative bottlenecks), and on the other by lack of capital thatis necessary to undertake the land improvements to make farming profitable.
VII. Proposed land policy reforms
A. MMD Manifesto
The MMD government in its manifesto called for the following reforms in its land policy:
The MMD shall institutionalize a modern, coherent, simplified and relevant land lawcode intended to ensure the fundamental right to private ownership of land as well asto be an integral part of a more efficient land delivery system. To this end an MMDgovernment will address itself to the following fundamental land issues. A review ofthe Land (Conversion of Titles) Acts of 1975 and 1985, the Trust Lands and ReservesOrders-in-Council of 1928-1947, the Land Survey Act, and the Town and Country

34
Planning Act, in order to bring about a more efficient and equitable system of tenureconversion and land allocation in customary lands; land adjudication legislation willbe enacted and be co-ordinated in such a way that confidence shall be restored in landinvestors; the land planning system and related legislation shall evolve such landstrategy as not only to merge Reserve and Trust Lands, but also to meet varieddevelopment needs in the country. The MMD government will attach economic valueto undeveloped land, encourage private real estate agency business, promote theregular issuance of title deeds to productive landowners in both rural and urban areas,and clear the backlog of cadastral surveys and mapping.
B. Ministry of Lands proposal
In response to the policy directives issued by the MMD government, the MOL in thedocument "National Conference on Land Policy and Assistance From The Donor Community in theImplementation of Proposed Projects" proposes to strengthen the operations of the Lands and Surveydepartments through reorganization, increasing capacity, staff training, and identifying more land fordevelopment. The government is giving very high priority to the issuance of title deeds to facilitateits program of privatization and liberalization. The cabinet has already approved a proposal foramendments of land laws and a change in land policy to make land easily available to both local andforeign investors. Real estate agencies should be allowed to operate freely in bringing buyers andsellers together. It is the government's policy also to increase revenue; in accordance with this aim,monetary value for land will be introduced by charging an economic ground rent on leaseholdproperty. It is envisioned that an efficient land registration system and proper records would simplifyconveyancing procedures and issuance of title deeds and facilitate revenues. Only 4 percent of thenation's land area is on the register. The MOL is actively seeking or identifying land within urban,peri-urban, and rural areas to meet the surging demand for land nationwide. In essence, thegovernment's policy is to amend the land laws and decentralize the functions of both the Lands andSurvey departments to facilitate issuance of title deeds.
1. Land tenure reforms
The MOL, in a 10th September 1993 memorandum, "Amendment to Land Laws," has draftedamendments to the Land Titles Act and the Lands and Deeds Registry Act. There is need to updateand modernize legislation, instill greater harmony in the laws, remove inconsistencies, and create amore unified body of legislation. What remains to be done, according to the MOL, is the drafting ofnew land laws after existing laws have been reviewed and, most importantly, to see through theirimplementation in the next three to four years.
2. Decentralization
The Lands Department now consists of two separate units: the Commissioner of Lands' Officeand the Lands and Deeds Registry. The forger's function is to allocate land while the latter's mainfunction is to register documents and issue certificates of title. The bottlenecks in issuance and transferof land title stem from three sources: (1) delays in application from the councils to the central registry;(2) delays and costs associated with channeling leases through one central registry in the country; and(3) onerous leasehold procedures. The MOL proposed that both functions of land allocation andregistration be decentralized to two additional sites in the next five years. A regional office hasrecently been set up in Ndola in the Copperbelt to cater to the four provinces in the northern half of

35
the country. By 1994, it is proposed that another regional office be established in Lusaka for the fiveprovinces in the southern half of the country. By 1995, a third fully decentralized office is plannedfor either Kasama or Chipata. A direct link will need to be established between the decentralizedoffices and the central registry. Assistance is requested by the ministry in the form of equipment,computer software, staff training, and personnel. As it would be impossible to transfer all documentsfrom the current central registry to the regional offices, it is proposed that a system be developedwhereby relevant documents and title deeds can be scanned and information stored in optical memoryconnected to a desktop computer. 15 The MOL is requesting workstations, laser printers, scanner,modems, desktop computers, photocopy machines, facsimile machines, typewriters, safes, cabinets,and other office equipment.
3. Land identification body
An urgent need is felt by the MOL to create a formal body with committees in all theprovinces to carry out the function of land identification for future agricultural expansion. This body,at both headquarters and provinces, would comprise senior members from the relevant ministries anddepartments. The body would also be expected to advise on general land policy matters. A sectionwithin the Lands Department would be needed for the demarcation of identified land and thepreparation of layout plans. The MOL further hopes that through an act of parliament, legal powerswill be granted to strengthen the body's role in coordinating and implementing such a landidentification program. 16
4. Personnel, training, coordination, and implementation
Trained labor will be needed to operate and manage the system of decentralized offices andthe computer-aided registry system. At present, only three public and seven private licensed surveyors(plus or minus one or two) can be found nationwide. A program is envisioned that trains both existingstaff and new recruits. The government has already committed to doubling the size of the MOL's staff.Additional financial assistance is requested of donors to support a project coordinator andimplementor, an experienced land lawyer, two officer's experienced in land management and land lawto assist on short term consultancy, one officer experienced in estates management to establish anestate management section with a view to generating revenue from fixing rents on land, and oneofficer qualified in surveying methods and making plans for identification of land for issuance of titledeeds. The principal aim is to find a suitable, cheaper, but reliable method of leasehold registration.Scholarships and training are needed in land administration, land valuation, planning and surveying,and land laws and registration. Vehicles are needed. Finally, additional assistance is required forshort-term consultancies, seminars, and conferences.
C. 1993 Land Policy Conference
The National Conference on Land Policy and Legal Reform (20-22 July 1993) specified anumber of reforms, some of which required immediate action while others were to take place overmany years. The MMD called for immediate repeal of Act No. 15 of 1985 which prohibited land from
15 The rationale for this is unclear. Records in the registry systems of most developed and developing countries aredecentralized.
16 Chapter 2 discusses in some detail the concerns associated with this proposal.

36
being granted, transferred, alienated, or leased to non-Zambians, and repeal of Section 10 of the 1975Land Act which stated that bare land per se has no commercial value (Place and Twinomukunzi
1993)27)17 Furthermore, reentry of private real estate firms would be encouraged to improve landmarket efficiency. Other reforms were proposed that would be initiated within a period of one year:(a) Combine Reserve and Trust Land categories into a single customary land category; (b) allow foruniform 99-year leaseholds on all land; 18 (c) identify unutilized land to be made available to allinvestors; 19 (d) permit mortgaging and leasehold transfers of one year to take place withoutpresidential consent; (e) formally recognize customary rights; ZO (f) increase the rent or tax chargedon leaseholds; (g) extend an automatic renewal of 99-year leaseholds provided that lease conditionsare met; (h) facilitate requests for leaseholds in customary land; (i) allow for leaseholds of separateunits in buildings; and (j) repeal all undesirable land legislation and replace with two primary acts:Land Act (covering State Land and Customary Land) and Registration Act. With respect to landdelivery, the MMD called for decentralization, creation of a land development fund (LDF) for localpublic investment from ground rents, and acceptance of cheaper survey techniques.
A number of papers referred to "major land reforms" being undertaken in the longer runwithout specifying their nature. The conference concluded with 10 resolutions or principles on landtenure presented in figure 1.2 (the entire text of the resolutions is reproduced in annex 1.1 below).
'7 A lively debate followed on the issue of opening land to foreigners. Chiefs and church groups expressed serious concernsabout "truckloads" of foreigners seeking land and the risk of wealthy foreigners and rising land prices resulting in a high degreeof foreign land control.
18 Lengthy debates followed on the issue of leaseholds versus freehold. Many professionals and the Farmers' Union assertedthe need for freehold property to minimize insecurity as the expiration of the leasehold draws near, and out of distrust thatgovernment would not keep its pledge for automatic renewal. Counter arguments were raised by nearly all political parties thatthe freehold system would create dispossession for the poor, lead to excessive concentration of land holdings, and result inunderutilization of land. Fear of foreign control was a principal factor in support of leaseholds over freeholds.
19 Some participants argued that rights exist over almost all land in customary areas, and some chiefs questioned whetherland in customary areas can be found without disturbing villagers. The MMD assured the chiefs that villages would not bedisrupted, while at the same time chiefs were charged by government officials and the church as being greedy or uncooperativein helping to locate land for resettlement or allocation.
20 One proposal from the Faculty of Law called for a Record of Rights in rural areas that would simply record existing rightsto land.

37
Figure 1.2: Land tenure resolutions, 1993 Conference on Land Policy and Legal Reform
1. METHODOLOGY. Both short-term and long-term approaches are needed in tenure reform, forexample, seminars in the short term and establishment of a Commission of Enquiry in the longerterm. It is recommended that a working group be established immediately to devote more time tothe issues raised and that a permanent body be established over time.
2. CLASSIFICATION OF LAND. The classification of land should reflect both national andcustomary interests and should consist of two classes: State Land and Customary Land. The tenureshould be a 99-year leasehold in State Land and the duration should vary according to intended usein Customary Land.
3. REGISTRATION SYSTEMS. There should be a decentralization of both land administration andsurveys. There should also be continued computerization of title registration and the developmentof a land information system.
4. ALLOCATION AND ADMINISTRATION OF LAND. The administration of land should beimproved through decentralization of activities. All relevant parties must be consulted prior toundertaking decisions. Allocation boards should be established at the local level.
5. ROLE OF CHIEFS. The role of chiefs should be formally recognized and the governmentshould make efforts to enable them to better conduct their tasks.
6. LAW REFORM AND CONSOLIDATION OF LEGISLATION. The Orders in Council 1928-64should be repealed. The Commissioner of Lands along with other selected participants shouldidentify all statutes related to land and review them for the purpose of revision. The outcomeshould be a single bill dealing with land and another for registration.
7. STATUS OF WOMEN. The universal principle of equality for women and other disadvantagedgroups should be formally recognized.
8. SECURITY AND CREDIT. The government should explore the development of alternativefacilities to improve access to credit.
9. LAND UTILIZATION AND REGULATION. Professional assessments of land use should bemade on commercial and farming land. Land use rules should be enforced. Urban settlementsshould be improved or relocated to alternative sites. Efforts should be made to improve conditionsin rural areas to mitigate migration. The Land Development Committee should be strengthened.Taxation and rent charges should be used to discourage underutilization of land.
10. LAND VALUATION. The market should determine the price of land in State Land. InCustomary Land, valuation procedures should evolve according to local conditions.
D. Assessment
The government's proposal to liberalize the land market and expand the supply of leaseholdsis a sound policy. Leasehold tenure of 99 years, while less satisfactory than freehold tenure, canprovide adequate security for long-term investment and credit. However, leasehold will not confer the

38
same sense of ownership as freehold property, and the concerns expressed by the Farmers' Unionabout government expropriation without due process are reasonable. If the government is to adoptleaseholds as its main land tenure instrument, then land use regulations and the Land Acquisition Actneed to be carefully rewritten to ensure that landholders do not perceive genuine risk of loss ofproperty. The resolutions in figure 1.2 are not comforting in this regard. Such resolutions as providingleaseholds of variable duration in customary areas, making professional land assessments, andenforcing land use rules act to create insecurity, increase the costs of farming, and create yet moregovernment bureaucracy in the land market. Eliminating land use conditions, levying an economicground rent pegged to market value, and reducing costs in the land market would act to reducespeculation, increase land utilization, and reduce demands for government oversight of landuse—demands that it likely will never keep due to scarce resources.
It is extremely difficult to estimate the true demand for title as title acquisition in the past washighly subsidized and linked with free land access—a policy environment conducive for anyone ofsound mind to request land title and a plot of land. Once ground rents are increased nearer to theireconomic value and their collections are enforced with penalty of repossession upon default (after 3years on non-payment), it would be expected that the current demand will be curtailed, and reentriesand surrenders will increase, a process that is already occurring. Nevertheless, demand-size policiesalone will not suffice; it is important to increase the efficiency of survey and registration servicesthrough decentralization and administrative reforms.
The long overdue program of decentralization to the Ndola office and eventually to districtlevels would help increase the supply of titles to smallholders and "emerging" small-scale farmers andhelp reduce the costs and delays associated with registration at present. The institutional capacity forland administration (land survey and registry systems) is weak. The current capacity is more or lessthe same as that of the pre-independence era when the various ministries had only to deal with themanagement of leaseholds on State Lands (6 percent of total land area). The MOL is now being askedto extend its services to the Reserve and Trust Lands in all nine provinces. Staffing, facilities andequipment simply are not sufficient for the MOL to expand its scope of operations to the entirecountry (yet it is crucial that it does) or to keep pace with the flood of demand for new leaseholdssince independence. Actions will need to be taken to expand the staffing of public sector surveyors,but there is also a critical need to expand private sector involvement in land surveying. The conferenceresolutions again raise a number of concerns about the government's ability to reduce registrationdelays. Such resolutions as "consulting all relevant parties prior to undertaking decisions" andintegrating chiefs into land matters, while politically necessary, run counter to the need to reduce stepsand streamline the process. Controls are necessary to ensure customary rights on land held undercustomary law, but once land has been identified, the procedure for allocation and registration needsto be considerably simplified.
In areas with higher population densities and a better-developed transportation network, thecustomary tenure system does not appear to be providing the tenure security necessary for long-terminvestment. Customary systems seemed to have weakened for three reasons: (1) rising land values,increased competition for land, and increased rent-seeking by chiefs and others controlling landallocation; (2) little incentive to make long-term improvements without clearly defined long-term landuse and testacy rights; and (3) increased central government control and reduced powers of localleaders. While the extension of leasehold tenure is appropriate for these situations, the governmentwill need to deal with customary land rights outside leasehold areas, and carefully consider how tominimize overlapping rights and conflicts between the customary and leasehold systems. Conflicts

39
under a sporadic system of registration will inevitably arise and will worsen with increases in growthof leasehold issuances. Customary systems in most rural areas are generally superior in ensuring asubsistence livelihood and tenure security. But in practical terms, even with massive investments inleasehold registration, government's long-term targets call for the registration of only 20 percent ofthe nation's land area. The government has no other recourse but to design a strategy for strengtheningthe ability of the customary system to govern the remaining lands. The recommendation of the MMDgovernment to move more slowly with land tenure reform in customary areas and to engage in along-term program of research to better understand customary land rights, transfers, and disputeprocesses is a sound approach.
Although the State Lands will continue to draw attention to the necessity of intensifying theproductivity of existing cultivated area, the long-term future of Zambian agriculture lies in the farmore extensive Reserve and Trust Lands. Here resolution of the most fundamental tenure problemswill need to go hand in hand with major investments in public infrastructure and marketing. The realchallenge lies in planning the effective development of these lands. Land use surveys, community andregional development plans, along with field research on land use patterns, management practices,market access, and land tenure are needed. In addition, government will need a stronger revenue baseto provide the infrastructure necessary to open up rural areas and to plan the development of newagricultural lands. Roads, schools, clinics, and utilities will be needed to either encourage urbandwellers to move to more remote areas or to keep settlers on the land. To provide these funds, thegovernment proposes the establishment of the Land Development Fund (LDF) to support suchinfrastructure and regional development. 21 Such development expenses would normally be providedout of the central budget, but the limited size of the overall budget combined with overly restrictivepast allocations to the MOL has forced the ministry to rethink ways to raise revenues and earmarkfunds for development. The funds would be derived from economic ground rents charged on leaseholdproperty. Much more thought needs to be given to such issues as the structure of land taxes/rentsnationwide, valuation of property in the absence of well-functioning markets, and fiscal managementto ensure accountability and transparency.
The government sees itself as a facilitator of development. It envisions an increase in thenumber of titles nationwide from roughly 70,000 to 100,000 at present to somewhere in the range of500,000 to 1,000,000. No long-term date has been set for achieving this target. Eighty percent ofthese titles would fall in the peri-urban zone and 20 percent in rural commercial areas. Opening therural areas would require money for land clearing, construction of roads, extending utilities, and theprovision of boreholes, clinics, and schools. The experience of past settlement schemes has apparentlybeen one of some settlers returning to the city because of lack of adequate physical and socialinfrastructure. The urban population, now accustomed to the amenities of urban living, cannot beexpected to move easily to rural areas. The government thus sees its role as creating an enablingenvironment in rural areas and providing incentives to help families move.
The proposal to increase the economic ground rent to support the state in opening new landsand in paying for physical infrastructure is an area of concern. Any form of annual rent increases the
21 Rents on current leaseholds are reportedly approaching K1 billion per annum. By increasing the number of leaseholds from70,000 to 500,000 or 1,000,000, the MOL envisions the potential for generating huge financial resources that can then bedirected to develop rural infrastructure and open new lands. The costs of leasehold issuances and rent collection would have tobe kept modest relative to revenue generation for such a surplus to occur. A financial analysis is advised to assess the viabilityof such a system.

40
disincentives for registering land or re-registering transfers of leasehold property. The use of leaseholdrents to pay for general rural development expenditures imposes on leaseholders a disproportionateshare of the cost burden. There is further risk of double taxation resulting from ground rents andproperty taxes being levied on the same piece of property (chapter 4). The MOL may be correct inarguing that it now has a record-keeping system that makes a land-based tax feasible, and at a loweradministrative cost than alternative forms of taxation. However, these claims should be discounted anda push made for a more careful and general review of the tax system (of which the land tax would bea part), for an evaluation of alternative approaches for financing rural development, and for a generalinstitutional review of agencies (including the rural councils) and their appropriate roles in taxcollection and expenditures. In the end, the MOL may play a greater role in tax collection, but everyattempt should be made to divorce the land rent for purposes of enhancing property rights fromgeneral taxation of land value.
The MOL's plan to pay up front the costs of developing new lands then recouping the coststhrough annual leases is problematic on another front. The leaseholder would bear none of thedevelopment costs, or at least would be required to put little personal capital into the holding. Oncethe title is in hand, the leaseholder is eligible for short- to medium-term credit. Should the banksforeclose, the government or the bank is left bearing all the costs of land development, while theleaseholder gains tremendous financial leverage from investing little or no personal capital in the land.Rather than amortizing the development costs into the lease rent, a strong argument can be made forauctioning properties to recoup part of the development expense from the land purchaser up front.Such a policy would limit land demand, but would help minimize risks of land speculation solely forthe purpose of increasing credit access.
VIII. Proposed actions
A. Land tenure reforms
There is wide consensus within government of the need for land tenure reform to increaseprivate sector development, private and foreign investment, and capitalization of the farm andnon-farm sectors. The existing land legislation needs to be comprehensively reviewed with the overallaim of simplifying the legislation, achieving a more unified body of legislation, and identifyingfundamental changes necessary to facilitate the development of the land market. Indicative changes,that are by no means exhaustive, are outlined below:
Zambia (State Land and Reserves) Orders, 1928 to 1964. This act as currently writtensuffers from at least three major deficiencies. First, while it addresses the role of district councils andthe conversion of land into leasehold property, it administratively ignores the land rights of nativesand nonnatives to customary lands outside of leased land. Second, the term "native" is ambiguous anddifficult to argue in a court of law. Third, restrictions limiting leasehold property of charitableorganizations to 33 years and nonnatives to 5 years of occupancy does not provide sufficient durationfor long-term investments or planning. In addition, the Commercial Farmers Bureau raises concernsabout the commissioner's powers to set legal area maximums on leasehold property. The ceiling of250 hectares, according to the Bureau, is too small for large-scale commercial farming, particularlyfor beef cattle or game ranching. The central issue that government must address is whether it wishesto control the size of farms, particularly if the demand for land by foreigners increases in responseto current Zambian policies aimed at attracting foreign investment.

41
Land (Conversion of Titles) Act of 1975. Currently, the State Land and Reserve Ordersgovern the tenure on Reserve and Trust Land while the Conversion of Titles Act governs the tenureon State Land. There is need to both modernize this legislation and to create one comprehensive actdealing with land in State, Reserve, and Trust areas. Several specific changes are also in order: (1)customary rights on non-leasehold land in the Reserves and Trust lands need to be articulated,including the role of chiefs; (2) greater attention needs to be given to issues of dispute resolution;currently, disputes can only be taken to the high court creating administrative bottlenecks; (3)provisions preventing the valuing of land (i.e., permitting value to be charged on only the unexhaustedvalue of improvements) need to be revised to permit the market to establish land prices fordetermining "fair" and "just" compensation and for setting lease rents; (4) any restrictions on landtransfers need to be thoroughly reviewed with the aim of liberalizing land markets includingabolishment of presidential consent; (5) as a term lease of 99 years is usually quite sufficient forlong-term tenure security as long as use conditions are not attached to the lease, it is recommendedthat land use conditions be eliminated; and (6) careful consideration should be given to aprogressive system of rents/taxes on leases to prevent excessive land accumulation and landunderutilization. zi
Land Registry Act and Survey Act. The current legislation lays out rigorous surveystandards for preparing maps for leases. Attention is currently given to consideration of newtechnologies (general boundaries surveys approach, modern computer and GPS mapping) to reducesurveying costs and to speed surveying time. First, legislation will need to be updated to accommodatethese new technologies. Second, a legal base is needed that will accommodate registration ofdocuments by computer and introducing and enabling the registration of separate units of blocks offlats or offices (sectional registrations). Third, the problem of the 14-year leasehold will need toaddressed. Either the relaxed survey requirements need to be provided for in the legislation (i.e.,permitting simpler sketch maps), or eliminated to unify leaseholds around a standard 99-year lease.Fourth, the duration of the 14-year lease should be increased, preferably to 99 years.
Land Acquisition Act. The sweeping powers granted to the president should be reduced, andthe rights of landholders clarified and strengthened to reduce abuses associated with land expropriation(and on the basis of "unreasonably" low compensation) that occurred in the past. Compulsoryacquisitions for the public good should be based on willing buyer/willing seller provisions, and shouldprovide for right of appeal.`
Subdivision policy. Because policies aimed at curbing subdivisions tend to restrict the landmarket, this study would tend to repeal any subdivision legislation that may exist. However, shouldthere be valid reasons for government monitoring and control of subdivisions, the onus should be on
' The National Lands Committee, in its 27 April 1994 comment to this report, maintains that such land use covenants areessential and should even be fortified. Furthermore, lease renewal should not be automatic but instead based on fulfillment ofthe covenants contained in the lease.
23 The MOL sees also the need for a provision enabling the land development fund. A strong case has not yet been madewhy such a fund is needed versus funneling ground rents through the central government to be allocated along with other publicfunds. See chapter 4 for further elaboration on the strengths and weaknesses of this proposal.
24 The Land Committee, in its comments to this report of 27 April 1994, proposes that the act be modified so that: the onlyland to be repossessed is that required for public use or a national scheme; the lessee is served with adequate notice, at least6 months; the compensation should be based on the current market value of the land; and the appeal should be with the SupremeCourt where it has not been resolved in the lower courts.

42
government to provide the resources to make the appraisals on a timely basis, and a limited time frameshould be specified in the regulations for completing its decision, barring which the landholder hasthe right to move forward with the transaction. Clear and verifiable data should be kept on numberof applications, and the number and location of approvals and rejections. Should the data indicate aconstrained land market, a very strong case would have to be made for retaining such a policy.
It is remarkable that Zambia is still working with land, property, and inheritance laws that arebased on 1911 English law that even the British saw fit to reform in 1925. In addition to the abovelegislation, an entire replacement is needed of the Conveyancing Acts, Statute of Frauds, Probate andother inheritance laws, laws of Property Act, Chancery Amendment Act, Common Law ProcedureAct, and Laws of Equity, Married Women's Property Act, and Land Registration Act, among others.Land tenure reforms resulting in amendments to a few provisions is not the answer. Rather, awholesale revamping and modernizing of the entire set of antiquated property, inheritance, andregistration laws is needed. In addition, careful reviews need to be made of the Town and CountryPlanning Act, Local Government Act, Forestry Act, Landlord Tenants Acts, Law of Succession, andPower of Attorneys Act.
There is a temptation in light of the current atmosphere of policy reforms and desire forprivate investment to rush forward with legal reforms. Such motivations, while understandable, arefraught with risk. Land tenure, particularly in the customary areas, is a sensitive issue, and soundpolicy advice is hampered by a dearth of field-level research. A number of key amendments to existinglegislation in the short-run are advised (e.g., amendments permitting land to have value, convertingleases to 99-years in duration, and easing subdivision requirements). However, focusing too much onshort-term changes runs the risk of undermining the process of wholesale reforms that are needed, andmisdirecting energies away from producing a comprehensive and quality body of legislation. Already,draft legislation has been prepared by several groups in Zambia in absence of careful review,advisement, and consensus building. The current rush to adopt a few key amendments has opened thedoor for various ministries to push amendments and legal changes based on self-interest (e.g., relaxingrestrictions on foreign ownership to increase private capital investment). Meanwhile the MOL feelscompelled to undertake reforms that dispel notions that it is sitting idle on land matters. This situationhas all the makings for bad policy: dispersion of land functions among multiple agencies, multipleministries suggesting legal reforms, widespread demands for immediate policy changes and quickfixes, a sense of urgency, a ministry that feels compelled to act, and basic disagreements betweencentral and local authorities regarding responsibilities in land policy.
The approach recommended by the World Bank is probably the best strategy under thecircumstances: adopt a few key amendments to free up the land market in the State Lands (permittingland to have value, facilitating subdivision and real estate transactions, reducing land and propertytaxes). These legal actions would be followed by a more gradual period of research in state lands andcustomary areas, institutionalization of a land policy and research unit, increasing the capacity for landdelivery, and carefully designing and promulgating a comprehensive set of legislation over a four tofive year period.
A gradual approach is not likely to appeal to the business community. The MOL mustcurrently bear the brunt of accusations that it is dragging its feet on land policy matters—anenvironment that is far from conducive for setting thoughtful policy. It is recommended thatgovernment assert the need for a longer-term approach, clearly specify a strategy for reforms, thendesignate an interministerial committee to coordinate land policy and collectively bear the heat for not

43
moving quickly on land reforms. This strategy is not intended to put foreign investment or privatecommercial interests on hold. Land titles may still be issued to viable commercial interests and evenbe given special treatment but in moderate measure, with transparency, and with careful monitoring.
A special body with wide powers for designing new legislation under wide advisement shouldbe appointed (e.g., the standing law reform commission, a land tenure reform commission, or the lawschool) with the sole responsibility for drafting the new legislation. The current process whereby aperson or department designs and submits for review legislative acts is not the process of legal reformsthat this study recommends. Hearings and local workshops with interested parties should be held tohear the views of citizens on land policy needs, legislation outside Zambia should be thoroughlyreviewed, legislation should be drafted, hearings and local workshops should again be held to reviewthe legislation, changes will again need to be made, and finally the legislation will have to be enacted.This process, while requiring considerable effort, will stand a much better chance of developing apolicy that is acceptable to government, the people, and the business community alike, than thetop-down legislation that is easily enacted by government but is rendered ineffective by noncomplianceand illicit activity.
B. Land administration
Specific proposals on decentralization and land administration are presented in chapter 3, andon land valuation, in chapter 4.
C. Research
The process of land tenure reform will need to be complemented by a program ofpolicy-relevant research. The below-mentioned research activities are indicative, and neither exhaustivenor mutually exclusive. Chapter 3 covers further research issues related to land registration, chapter4 on land markets, and chapter 7 on data.
1. Land tenure in customary lands. There is an inadequate understanding of landrights, inheritance, dispute processes, land markets, and resource management in the customary areasthat will need to be alleviated before any legal changes affecting rural areas are considered. Detailedfield-level research is needed in different areas of the country and under various socioeconomiccontexts (peri-urban versus rural). Answers need to be sought to such indicative questions: Is tenuresecurity robust or weakening, and by whom, for whom, and where? Is tenure insecurity constrainingcommercial and agricultural investment? To what extent are chiefs encumbering land transfers,undermining security of transfers, or resisting title? To what extent is the expansion of the leaseholdsystem undermining the security of producers under customary arrangements? Do women andminorities have equal and free access to land or are they constrained by customary norms andtraditions?
2. Land tenure at the periphery of titled areas. The conversion of customary landinto State Land represents a second priority area of research. Land is converted through the processof sporadic land allocations and acquisitions, demarcations, and allocations of newly opened lands andthrough resettlement schemes. It is at the periphery of these transfers that potential conflicts betweenstate and customary tenures will be evident and where equity issues will be most manifest. Priorityquestions include: What are the characteristics of groups and individuals acquiring land in resettlementschemes and newly opened farming areas? To what extent have women and minorities been able to

44
participate in the land-acquisition process? What is the relationship between titling, agriculturalexpansion, land utilization, productivity, and credit use?
3. Informal settlement. In addition to formal structured programs aimed at movingpeople from urban to rural areas, spontaneous settlement is occurring through informal markets asindicated by the rapid increase in small- to medium-scale emergent farmers. Land use planners in theMOL contend that the result is irregular and dispersed settlements that increase private and social costsin the longer run through inefficient land use, poor resource management, and higher land disputesfrom encroachment. The highly aggregated CSO data would not provide sufficient detail on landmarket processes or resulting land degradation problems should they exist. A rigorous program offield study is required to evaluate rates of agrarian expansion, how land is being acquired, whatproperty rights are being transferred, whether tenures are secure, and how productivity and marketaccess compare with those people involved under more formal modes of settlement.
4. Productivity and resource management on newly opened lands. The ability tofunction in the land market will depend on size and access to capital, thereby influencing the viabilityof smaller farms. To the extent that title is increasing access to financial services and farm size isenhancing access to markets and technology, targeted smallholder assistance would be required toensure land access and maintain competitiveness in the marketplace. High rates of land underutilizationand absenteeism on settlement schemes would suggest the need for measures to improve on settlerselection and to increase land utilization through land market reforms and enhanced market access.Nowhere in the data available is there detailed information on types of agricultural activities, output,input use or incomes of the settlers, or indicators of land resource conservation. Among priorityquestions are the following: How do land use and market access vary among regions and farm-sizecategories, and what factors explain the differences? To what extent is land underutilization andproductivity (customary and state areas) caused by land market constraints and inadequate propertyrights to land and water versus other factors? What scale-economies exist in Zambian agriculture? Isthe expansion that is occurring from opening new lands resulting in unacceptable levels or risk ofenvironmental degradation? How are differences in resource access, technology, extension services,input distribution, commodity marketing, and tenures affecting resource management?
5. Gender. The Zambian constitution or land legislation do not make explicit genderbiases. Nevertheless, there is anecdotal evidence suggesting voluntary or involuntary biases in landadministration under both formal and informal tenures that are affecting women's access to land, title,land markets, and participation in settlement schemes. In-depth empirical research at all levels of landadministration is needed to assess the scope and depth of the gender problem. Biases may requireeither explicit legal provisions ensuring and protecting women's rights, administrative changes in thecurrent process of formal land allocation and title, or special programs to assist women and minoritiesin gaining access to land.

45
Annex 1.1: Resolutions of the conference
I. Methodology
1. On the subject of Land Policy and Legal Reform, it is important to adopt short-term andlong-term approaches.
2. In the short term, use should be made of seminars, workshops, and random researchstudies as a method of consultation.
3. In the long term, appointment of a commission of enquiry is a more appropriate and longestablished method of exhaustively probing, by way of wider consultation, all pertinentissues and problems relating to the subject of land.
4. In the current and urgent context of the exercise there is need to constitute a representativegroup of about fifteen (15) from participants in this conference to devote a little moreattention to the issues raised in the papers presented and resolutions agreed to beforesubmitting fmal conclusions.
5. There is need of establishing a permanent body which would supervise, monitor, and studyrecurrent issues relating to land on a more systematic and routine basis.
II. Classification of land type or interest and duration in customary land and state land
1. That it be recognized that historical and colonial considerations in the molding of thecurrent categories of land are out-dated, that therefore consideration be given to thereclassification of land to serve contemporary needs and requirements of the country.
2. That the nature of the interest in the reclassified land tenure system reflect customary aswell as national interest thereof bearing in mind that interest in perpetuity may poseproblems of regulation and the reversion of the residue to the National State of Zambia.
3. That there be two classes of land, namely state land and customary land, and the respectiveinterests be a ninety-nine (99) year lease with provision for automatic renewal andcustomary interests that can be subject to specific grants of specific durations to bedetermined according to the purpose for which the grant is made.
III. Land registration system
1. There is need to strengthen the land registration system by decentralizing both the functionsof the Lands Department and Survey Department to the provincial level.
2. Multi-holding of land should be introduced to facilitate acquisition of sectional titles.3. There is a need to develop a land information system.4. There is need for legal provision to support computerized registration of titles.
IV. Allocation of land and land administration
1. The land allocation system be strengthened and improved upon through decentralizationof functions and powers of the Commissioner of Lands by provision of adequate personnel,facilities, and resources.
2. In the allocation of land all relevant institutions and authorities be consulted to take partin influencing decisions on the subject.
3. That in the customary land sector in particular, consultation should be extended to thetraditional authorities.
4. Land allocation boards be set up at provincial and district levels to advise on allocation ofland.
V. Role of chiefs
That the role of Chiefs in policy formulation and their participation in allocation of land in thecustomary sector or domain be explicitly recognized and further provision, administrative orotherwise, be made to enhance their participation in planning and development of land at both districtand provincial levels.

46
(Annex 1.1: Resolutions of the conference, cont.)
VI. Law reform and consolidation of statutes relating to land
A. Minor amendments1. State, Reserves, and Trust Land Orders of 1928-1964 be immediately repealed and a new
land bill initiated to take account of the new classification of land and the interest therein.2. That the Commissioner of Lands in consultation with all interested groups, in particular
the Ministry of Legal Affairs, Law Development Commission, and Law Association ofZambia, identify all statutes relating to land which require immediate revision and effectthe necessary amendments.
B. Major law reform and policyThat a completed consolidation of Land Laws and Statutes be undertaken culminating ina comprehensive land bill and land registration bill discarding all outstanding anomalies.
VII. Status of women and vulnerable groups
That the universal principle of equality be applied to the ownership of land by women and vulnerablegroups which entail a prohibition of discrimination of women and vulnerable groups in the ownershipof land.
Further, administrative and legislative measures, if necessary, be put in place to remove anydiscriminating practices and other laws.
VIII. Security and credit facilities
Government should urgently explore access to financial facilities which have been beyond the reachof either land holders or developers outside the formal commercial sector.
IX. Land utilization and regulations
1. Agricultural, commercial, and emergent farmers:a. Professional assessment of land use in all categories of land should apply before
allocation.b. National land use plans should be adopted to reinforce utilization of all
categories.c. Existing regulations of land use in all categories of land should be enforced.
2. Urban and rural human settlements:a. Existing settlements should be upgraded whereas new ones should be regulated
and planned for to curb rural-urban migration.b. Government should also allocate those settlements where upgrading is impossible
to more orderly planned ones.c. Conducive conditions should be created in rural areas to retain people.
3. Land development fund: We strongly recommend that this fund be created to improveinfrastructure in rural areas to facilitate settlement.
4. Taxation, consideration of ground rent: Taxation and ground rent should encouragedevelopment and discourage underutilization of land.
X. Land value
1. In State Land, market forces should determine the price. In certain circumstancesGovernment should provide concessionary price for land to those vulnerable groups of thepopulation.
2. In customary land, a system of pricing, if need be, should be left to evolve according torural conditions.

Chapter 2:
Land Administration: Processes and Constraints
by
John Bruce, Fortune Kachamba, and Michelo Hansungule'
I. Current framework for land administration
All land in Zambia is vested in the president, in trust for the people of Zambia, under theLand (Conversion of Titles) Act, 1975 (see p. 16), SECTION 4. The president has delegated landadministration to the Commissioner of Lands under Statutory Instrument No. 7 of 1964 and GazetteNotice No. 1345 of 1975, as amended. Land in Zambia is divided into State (formerly crown),Reserve, and Trust Lands, as well as park reserves.
The Commissioner of Lands administers the State Land, appropriated by the colonial powerfor settlement of whites. The commissioner allocates this land as farms and agricultural smallholdings,and as stands for buildings and other uses, all under leasehold. There is also a state-farm andparastatal sector. The entire State Land amounts to less than 6 percent of the total land area ofZambia, but it is relatively good-quality land, advantageously located near the rail lines. All land inmunicipalities is also State Land. The larger municipalities now administer land independently underthe Housing (Statutory and Improvement Areas) Act, 1976, i.e., statutory land and housing land.
In the Trust and Reserve Lands access to land is governed by customary law and institutions.The Reserve Lands were set aside for the original inhabitants of Zambia by the colonial authorities.The Trust Lands were at one time destined for white settlement but white settlement did notmaterialize to the extent anticipated. In both the Reserve and Trust Lands, land has been in the handsof traditional land users. The government, following the example during the colonial period, has forthe most part continued to rely on traditional authorities for the allocation of that land to farminghouseholds. However, the Commissioner of Lands also allocates land in these areas directly to otherusers, such as outside investors.
The work of the MOL consists of the allocation, survey, and registration of leasehold titlesin the State, Trust, and Reserve Lands, and in both urban and rural land. Under the legal breakdownof responsibilities, allocation is handled by the Lands Department (headed by the Commissioner ofLands), survey by the Survey Department (headed by the surveyor general), and registration by theLands and Deeds Registry (headed by the Chief Registrar) under the Commissioner of Lands. Seefigure 2.1 for an organization chart. Recently, the former minister created a committee chaired by thedeputy permanent secretary to review allocations, and asserted authority in the P.S. to makeallocations, but this has no basis in law.
' John Bruce is former director of the Land Tenure Center and adjunct professor in the College of Agricultural and LifeSciences at the University of Wisconsin-Madison; Michelo Hansungule is lecturer in land law, School of Law, with theUniversity of Zambia; and Fortune Kachamba is a senior legal officer in the Ministry of Lands.

Figure 2.1: Organizational chart of Ministry of Lands
Minister of Lands
Permanent Secretary
Deputy Permanent Secretary
Lands DepartmentCommissioner of Lands
Survey DepartmentSurveyor General
AdministrativeServices
DeputyCommissioner
Registrar ofLands and Deeds
SurveyServices
CadastralServices
MappingServices
Admin-istration
Chief LandsOfficer
ComputerRegistry
AssistantRegistrar
Regional & ProvincialOffices
Regional andProvincial
Officers

49
The ministry has historically carried out its functions in a highly centralized fashion, anddespite a several-year-old policy of decentralization, it continues to do so. Lack of funds and lack ofqualified staff are cited as causes of the slow progress. As will be seen later, some ministry staff arenow posted to each province, but decision-making and record-keeping have not yet been decentralized.
Leasehold was the dominant tenure for titling from the colonial period. The very small amountof freehold land, amounting to less than 1 percent of the land, was converted to 100-year leaseholdby the Conversion Act. Leasehold tenure is today available from the state as follows. Thecommissioner grants leases of up to 99 years on State Land. In Reserve Lands, Zambian nationals canalso receive leases up to 99 years in duration. In the Trust Lands, they can be granted a right ofoccupancy up to 99 years.
There are significant restrictions upon the right of noncitizens to hold land. Under AmendmentNo. 15 of 1985 to the Conversion Act, no noncitizen may receive a lease, unless the noncitizen is aninvestor within the terms of the 1993 Investment Act, and the application has been approved in writingby the president. In Reserve Lands, "nonnatives" cannot receive lands for more than 5 years, exceptin the case of a religious or charitable organization, in which case the lease can be for up to 33 years.There are no special restrictions as regards the Trusts Lands, but the president's consent is necessaryin all cases.
The leases are heavily concentrated in the State Land, where a 99-year lease is typical. To beregistered, a 99-year lease requires a survey which complies with the relatively rigorous accuracyrequirements provided for under the Survey Act. The MOL does not have the necessary technicallycompetent staff to meet the demand for survey at this standard. When a Survey Act survey is notfeasible, a 14-year leasehold is granted and registered on the basis of a sketch map (see section VIIbelow). The 14-year leases have been widely used in a number of contexts: in settlement schemes onState, Trust, and Reserve Lands, on land in municipalities, and for leaseholds granted in the Trust andReserve Lands.
Leases are granted with only a charge for services. Ground rents, despite several increases,have been so nominal that they have not been worth collecting. The rents remain nominal becauseraises do not keep pace with inflation. Ground rents are paid sporadically, tending to be paid onlywhen the land is to be mortgaged or transferred, by which time the value of the rent has beendecreased by inflation. There are no penalties for late payment. Current ground rents are presentedelsewhere in this report.
Land is administratively allocated. When State Land becomes available, it is advertised andapplications for leasehold requested. Availability generally comes about through abandonment orresumption by government for failure to comply with leasehold conditions, but there is also a smallamount of unallocated State Land. The land can be allocated to anyone who is Zambian; beyond that,there are no clear legal criteria. A Land Allocation Committee within the ministry advises onallocation decisions (see section III below).
On Trust and Reserve Lands, a similar procedure is followed in settlement-scheme situations.But in most instances outside the settlement scheme context, a sole applicant for the lease identifiesthe land requested. A new ministry regulation seeks to require at least three applicants for eachleasehold, but this may not be practical in Trust and Reserve Land situations, and it is clearlyinappropriate where the applicant is already the customary owner. The ministry requires that the chief

50
of the area where the land is located consent in writing to the lease and that the local council must alsoconcur in the lease.
The appropriate size for allocation is decided according to administrative guidelines developedwithin the ministry. They call for an estimation of the applicant's present and anticipated income, andrelate it to investment costs, an evaluation of the applicant's management capability, and landavailability in the area concerned. The guidelines are undated, but they envisage appropriate sizes forranching (2,000 hectares), mixed farming (1,000 hectares), dairy (100 hectares), horticulture (200hectares), and small stock (100 hectares). The guidelines predate the 250 hectare limitation in the landcircular of 1985, but that limit can be and is surpassed with the consent of the minister.' Theguidelines are reproduced in annex 2.1.
Lessees can assign their leases to others or mortgage them only with the consent of theCommissioner of Lands (SECTION 13 of the Conversion Act). In the case of scheduled farms underthe Agricultural Lands Act, the Agricultural Land Board is required to approve such transactions, butit is now defunct and the consent is provided by the commissioner. There is no requirement ofconsultation with the chief or council.
Leasehold documents require certain development of the land by the lessee. Failure to meetthese conditions constitutes breach of the lease, allowing termination after six months' notice to thelessee of the government's intention to terminate. The ministry appears to read these conditions as notonly requiring the initial investment specified, but the maintenance of that investment over the life ofthe lease. At the same time, because of a lack of staff and transport, there is no systematic inspectionfor compliance with these conditions, and breaches are commonly identified by persons seeking tohave the land taken from the lessee and made available to them.
II. Lessons from the African experience
At independence, a great many countries in Africa opted for state ownership of land andleasehold tenure rather than freehold tenure. The latter was associated with white ownership of landin many countries. State leasehold, if sufficiently long-term, was considered to provide adequate tenuresecurity and economic incentives to households for land development, while at the same time allowingthe state to maintain control of the landholding structure. To some, there were parallels to customaryland tenure, with the state assuming the role of the chief, holding land in trust for its people andallocating it according to need (Bruce 1989).
The experience with state leaseholds has been troubled, however. The problems do not stemfrom the necessary characteristics of a leasehold (since it is possible to draft a lease which is virtuallya freehold except in the most formal sense), but rather lie in the policies which are implementedthrough leasehold tenure.
2The National Lands Committee in its 27 April 1994 comments to this report suggested a maximum of 100 hectares
per applicant because land is limited and there is danger that chiefs become carried away with promises of development andbegin allocating large tracts to local and foreign investors.

51
In most leasehold systems (including that of Zambia), land is provided at little or no charge,and subsequently the value of the land is not allowed to be reflected in transactions. Land may be said,as was the case in Zambia, to have no value, indicating that government as a matter of policy refusesto recognize its value. This raises several problems. There are distortions in land use created whenmarket forces are not allowed to determine the allocation of land. Land near Lusaka is often underusedprecisely because it has been treated as a free good. There are problems with urban elites, bothgovernmental and commercial, grabbing land from rural people. Because the land is virtually a freegood, cost puts no brake on their ambitions. In some counties, such as Guinea-Bissau, thislandgrabbing has been extensive (Bruce and Tanner 1992), and in a number of countries it has causedserious, often interethnic, conflict (Bruce 1989; Platteau 1992; Binswanger et al. 1993).
Such systems, almost inevitably, have serious corruption problems and encourage rent-seekingbehavior. The tendency towards corruption is strong because a limited amount of a valuable good isbeing administratively rationed and allocated virtually for free. The gap between the real value—whatsomeone would pay to get the land—and the value recognized by government is the amount whichthose seeking land will be willing to pay in bribes.
In addition, because state leasehold systems do not rely on market forces to exert economicpressure for land development, they must instead rely upon contractual development conditions.Development conditions have in practice proven very problematic. If they require a specific type ofdevelopment, for instance a coffee farm or a petrol station, they are too rigid and impose economicallyirrational limits on behavior as rapidly changing economic circumstances alter the most profitable useof land. On the other hand, if the development conditions are vague, they are difficult to enforce.There is a tendency for holders to be harassed by reports of noncompliance from those seeking toreplace them on the land, and again there is great potential for corruption in the evaluation ofcompliance. In many countries, political dissent has caused a review of the dissenter's compliance withdevelopment conditions. In fact, there has been almost complete failure in most countries tosystematically and fairly evaluate the fulfillment of development conditions. The requisite staff andresources, especially transport, are usually not available. Alternatives to development conditionsinclude less-direct land use controls, such as zoning enforced through fines, plus mechanisms such aseconomic ground rents which exert pressure on landholders to either place their land in economicallyprofitable uses or, if they cannot afford to do so, to transfer the land to someone who can develop it.
Finally, the experience with leasehold systems shows that it is simply difficult to find theresources for a national system of land administration. It is one thing to implement a leasehold systemin a settlement scheme, quite another to imagine the costs and staff requirements of bringing all theland in a country under such a system. Even a freehold system requires an administrativeinfrastructure—the cadastral and registry system—and cannot be expanded without concern for costs.
In light of these problems, there is a growing realization that it is not feasible to broadlyreplace indigenous tenure systems with leasehold (and to a lesser extent freehold) in the short or evenintermediate term. The need is to identify what the priority areas should be for the limited tenure"replacement" which can be afforded. Replacement is likely to be most effective in rather limitedgeographic areas where market forces, including produce markets for relatively high-value commercialcrops and rural financial markets, are well developed. For other areas, the need is for tenure-changestrategies which stress more evolutionary processes and may involve continued reliance for some timeon the relatively cost-effective customary institutions of land administration.
Zambian experience and needs will be examined with these issues in mind.

52
III. State leasehold process
The process of getting an initial lease of land from the ministry is set out in the ministry'scircular No. 1 (see p. 21). The circular is a set of instructions addressed to all provincial permanentsecretaries and district executive secretaries. It includes the forms to be used in applying for land andimposes certain important limitations. There is a basic pattern which is common regardless of thelocation of the land, but details differ.
For Trust and Reserve Lands, the applicant for a lease begins with the local headman andchief in whose territory the land is located. The State Land and Reserves Orders, SECTION 6A(1), andthe Trust Land Orders, SECTION 5(2), require that the president consult local authorities beforegranting a lease or a license in their area. The circular requires that the chief consent to a lease andthat the lease be considered by the appropriate subcommittee of the rural council and then approvedby a meeting of the full council. In the case of a resident villager, there is no need for the headmanto identify his land, only to review the lease application.
For a stranger or nonvillager seeking land, the process begins with the headman of a particularvillage (there may be a dozen or many more in a chiefs area) who receives the application for landunder a lease.' Applicants seeking land may go to a particular headman because they have friendsthere or someone (e.g., a district agricultural officer) indicates the village has good land available.After discussion in the village, if inclined to recommend the land and lease, the headman takes theapplicant to meet the chief. There may be 2-5 chiefs in a district. After discussion with council, thechief may give consent to the application. This usually takes the form of a simple letter to the localcouncil.
Before the application can be presented to the council, however, there must be a sketch planof the land for which application is made. This will generally be done by an agricultural assistant fromthe Ministry of Agriculture's Land Use Planning Office, who usually comes from the provincial officefor this purpose. The assistant has access to a 1:50,000 topographic map, on which the applicantlocates the land. The assistant then visits the parcel, verifies the location, and clears a 2-4 meter swatharound the boundary. Sometimes this is done in the presence of the headman, at other times in his orher absence. This is a critical step in making sure everyone understands which land and how muchis involved. A sketch map is prepared at the office based on the field visit and the topographic mapbase. The applicant will have the sketch plan signed by the chief. Until recently, the Ministry ofAgriculture provided this service for free but now has begun to charge for its services.
In the case of settlement schemes on Trust and Reserve Lands, the land for the entiresettlement is obtained from the chief at the outset. The chief is not involved in the process further,nor in subsequent leases to the settlers. The parcels are demarcated and assigned to the settlers. Atthe end of a two- or three-year probationary period they can apply for leases to the Commissioner ofLands through the council.
In the case of any State Land, there is no need for a chiefs consent. It is the municipal surveyofficer who will do the sketch map, or failing such an officer, a staffer from Town and Country
As indicated in chapter 5, either the headman or the chief may be responsible for allocating land, depending on theregion. Hence in certain instances the application process may start with the chief.

53
Planning, often from a Regional Planning Authority. While the wording of the circular suggests thatthere are likely to be predemarcated stands to be allocated, this is often not the case.
In all the above situations, a sketch map is the basis for a 14-year lease. If a 99-year lease isdesired, the applicant must apply for a survey by the Survey Department of the MOL, either fromLusaka or a provincial office, or from a private surveyor (see section VII below). The former is moreexpensive, the latter involves long delays. The ministry's charge is K40,000/day, including bothfieldwork and office work, plus expenses such as transportation, accommodation, and food as maybe necessary. It is not possible to give a specific figure for these costs, which tend to be negotiatedon a case-by-case basis. Moreover, some elements are provided directly by the applicant, for instance,use of a vehicle. (See figure 2.2 for a list of ministry fees.)
The process up to this point will have taken several months, sometimes years, since theprocess involves convincing local people of one's serious intentions to develop the land.
At the council, a K2,000 fee for paper is charged. The application is first considered by thePlans, Works and Development Committee, a subcommittee of the council. The committee willinterview the applicant and may visit the parcel, especially if none of the councilors is familiar withthe location. This committee will make its recommendation to the full council, which must give finalapproval. The full council may meet only every three or four months, partly because this time frameis so stipulated in Council Standing Orders, and partly because of the costs of bringing councilorsfrom different parts of the district. The result is considerable delays in application approvals. Acouncil may, if it chooses to do so, meet on special issues or hold extraordinary sessions.
The council then forwards the application to the ministry's provincial office or the ministry'sheadquarters in Lusaka. The provincial office lands officer is not actually in the line of authority forland allocation, and if it receives an application from council, it can only inspect the paperwork tomake sure that it is in order then pass it on to the Lands Department in Lusaka. For settlements, thepaperwork goes through the provincial agricultural officer.
The applications normally travel by mail, which is regarded as reliable and reasonably prompt.When the office concerned has no stamps, the application may wait to be hand-carried by an officialtravelling to Lusaka. On arrival in the Lands Department, it goes to the Registry, which gives theapplication a temporary number and sends it to the relevant regional office in the Lands Department.Within the Lands Department in Lusaka, the work is divided into a Northern region (Eastern,Western, Copperbelt, and North-Western provinces, and part of Lusaka province) and a Southernregion (Southern, Central, Luapula, and Northern provinces, and part of Lusaka province).
The regional officer reviews the file to determine if everything is in order. Roughly one inten is returned to the district because of problems with paperwork. If there is no such problem, theregional office sends the file through the Registry to the Land Department's Folio Section (the MapRoom). All files moving between offices in the ministry move through the Registry, primarily toensure that the location of a file can be determined at any time, but also, since records arecomputerized, to allow the relevant acts to be recorded in the computer file at the Registry. In theFolio Section, the map accompanying the application is plotted onto a master map on which all otherleased parcels are shown to make sure the parcel is available and that there are no overlaps withexisting parcels. This process in the Lands Department takes about one week.

54
Figure 2.2: Survey Department fees and charges, 1 August 1993
Cadastral fees1) Daily rate. Excluding subsistence and transport costs, for each survey team including related office anddrawing work shall be 40,000.00 (prorated when more than one parcel).2) Subsistence. A land surveyor engaged on a survey away from headquarters shall, when free board andlodging are not provided, charge reasonable hotel or subsistence expenses.3) Transport. Actual costs to include fuel and oil or public transport used in the course of the survey.Surveyor general's charges1) Land surveyor's license. In accordance with subsection 9 of the act shall be 3,000.00. Surveyor generalmay remit this fee for a license issued to a land surveyor in government service but the fee shall become dueshould the surveyor leave government service and continue to practice in Zambia.2) Taxing account. For taxing a land surveyor's account, the fee shall be , 2.5 percent.3) Examination fee. Examination of survey records, general, and working plans the fee shall be 1,600.00 eachstand; 1,600.00 each lot or farm in urban areas, and 3,200.00 each lot or farm outside urban areas.4) Cadastral drawing charge. For work involved in the preparation of certified true copies of plans ordiagrams, the compilation of plan and diagrams where fieldwork is not required, the drawing of plans anddiagrams for private surveyors, and any other miscellaneous drawing work, the charge shall be 1,600 per hourfor each draughtsman excluding materials (at cost).5) Photogrammetric survey charge. Aerial triangulation, plotting, and other office-based photogrammetricwork shall be 48,000.00/day per photogrammetrist excluding materials and new aerial photography (at cost).Noncadastral feesPrinted Maps: price payable by all map users within Zambia including departments (postage at cost).
Topographic Maps 1,000.00Street Plans and Tourist Maps 1,500.00ICAO Charts 1,500.00
Miscellaneous and Atlas ChartsInternational and Regional 1,500.00National 1,000.00Prices payable by all map users outside Zambia US$10.00
Dyeline prints (charges per square decimeter for paper/film)Materials supplied by Survey Department 30.00/90.00Materials supplied by customer 10.00/40.00
Photographic products ( Materials supplied by customer/client, half the total cost shall be charged)Contact prints 1,700.00Paper P/DM 2 120.00 (single weight)/140.00 (double weight)l m x lm paper 12,000.00 (single weight)/14,000.00 (double weight)Diapositives 25cm2 2,000.00Film P/DM2 200.00Dyeline paper copy P/DM 2 100.00Ozalar film P/DM 2 250.00Computer printouts of survey data 800.00 per pagePhotocopies 80.00 per A4 page and 160.00 per A3 pageNonstandard services (survey and mapping projects, other than cadastral, including field survey, cartography,and map-related photo-reproduction or photogrammetry)Field survey, each field team per day 40,000.00Cartographer, per day excluding materials 20,000.00Photo reproduction staff, per day, excluding materials 20,000.00Photogrammetrist, per day, to include stereo plotting but excluding materials US$110.00Photogrammetrist, per day (planning, sorting, and preparations) 12,000.00
All figures in Zambian currency unless otherwise noted. Source: Survey Department, PO Box 50337, Lusaka.

55
If the parcel is available, the file is sent via the Registry to the Surveys Department, whereit is checked against a master map in the Property Registration Section (Plan Room), then given anumber and returned via the Registry to Folios for the number to be noted. This may take one month.Folios then sends the file back to the regional office for presentation of the case to the Land AllocationCommittee (LAC), which meets weekly. The LAC will advise the commissioner who makes the finaldecision. The new committee chaired by the deputy permanent secretary has taken over this function,and makes its recommendations to the permanent secretary. (For "scheduled farms" listed in aschedule or annex to the Agricultural Lands Act, the appropriate agency for the allocation would bethe Agricultural Lands Board, but this board no longer functions.) If the allocation is approved, theregional office or headquarters then sends a letter of offer to the applicant by post, stipulating theamount of the lease charges the applicant is expected to pay. This takes a minimum of two weeks, andoften much longer.
If State Land is involved, especially in a town, planning permission may be needed before anoffer can be made. If the council where the land is located is itself a Planning Authority, this will havebeen handled earlier, but it may be necessary for the applicant to pay certain service charges to theauthority before he or she can get a certificate of title. If the council is not a Planning Authority, theoffer is an offer in principle and requires the applicant to obtain planning permission. Only when thatpermission is obtained and communicated to the Commissioner of Lands will an offer be given. Thetime to obtain planning permission will vary considerably depending on the particular planningauthority. The Lusaka provincial planning authority is quite prompt, but one also hears of other casesin which the time needed could be as much as five months. It can be much longer if the land must berepossessed before it can be reallocated.
If there is not a need to obtain planning permission, the applicant accepts the offer by payingthe lease charges. Unless there are special reasons for delays (such as the applicant having difficultyfinding the funds for the payment or confusion as to the roles played by different agencies, as whenthe council is also the planner), this is usually accomplished about two months after the letter of offeris mailed. Once the offer is accepted, the regional office requests the Surveys Department to preparea sketch plan for the lease agreement itself. Where the land has been surveyed, the regional office willrequest a survey diagram rather than a sketch plan. On receipt of the plan, the regional office preparesa lease agreement for the successful applicant and mails it to him or her to sign. Another two monthsmay elapse.
The applicant signs the lease and returns it to the regional office and sends it through theRegistry for the commissioner's signature. After signing, it is sent through the Registry to the ChiefLands Officer, who witnesses the signature and returns it through the Registry to Folios. Foliosrecords the lease and then sends it on to the Lands and Deeds Registry for registration. There, thelease is received by the Lodgement Desk and then forwarded to the registrar. The registrar reviewsthe lease for completeness and, if it is complete, signs a processing schedule. The lease is entered inthe register. A title deed is prepared by the registrar and sent to the Commissioner of Lands, whosends it to the regional office who mails it to the applicant. This process, after the applicant returnsthe signed lease to the ministry, may take ten days.
The process is largely the same for the different categories of land, except that chief'spermission must be obtained for Trust and Reserve Lands and planning permission becomes an issuein many State-Land contexts.

56
The processes for consents to transactions concerning leases are more expeditious. Alltransactions concerning leases must have the state's consent under SECTION 13 of the Conversion Act.The consents are available only in the head office of the ministry. No consents from chiefs or districtauthorities are necessary. The structure of consent fees at various periods from 1985 to newlyproposed rates for 1994 are summarized in table 2.1.
Table 2.1: Structure of revenue of the Lands Department: Consent application fees$
Year Assign/sell transfer SubleaseMortgage/
_ charge Subdivide
101 /01 /85 K100 K100 K50 K50
01/01/88 i) K100 for CMV belowK100,000.ii) K300 for CMV betweenK100,000 and K300,000.iii) K500 for CMV aboveK300,000.
i) K100 for annual rentK10,000 and below.ii) K300 for annual rentbetween K10,000 andK30,000.iii) K500 for annual rentabove K30,000.
K100 K100
01/01/91 i) K300 for CMVK100,000 and below.ii) K600 for CMV betweenK100,000 and K300,000.iii) K1,000 for CMV aboveK300,000.
i) K600 for annual rentK10,000 and below.ii) K600 for annual rentbetween K10,000 andK30,000.iii) K1,000 for annualrent K30,000 and above.
K250 K1,000
01/07/91 i) K600 for CMV K10,000and below.ii) K1,200 for CMVbetween K10,000 andK30,000.iii) K2,000 for CMV aboveK30,000.
K2,000 K500 K5,000
01/01/94 K25,000 K25,000 K5,000 K50,000
a. The consent application fees came into effect on 26th January 1985. Prior to that date all consent applicationsfor dealings in land were free of charge. Figures in the table are the respective fees as they were beingreviewed upward from time to time.
For an assignment or transfer of the lease, the applicant must pay a K2,000 consent fee (1993rate). He or she must produce photocopies of the national registration card of the buyer, if anindividual, or, if a company, form 23 from the company's registry, and copies of the nationalregistration cards of all the shareholders. Alternatively, an investment certificate from the InvestmentCentre can be produced to establish that the applicant is a Zambian or qualified to hold land inZambia. The applicant must also show that the ground rent is paid up to date and that he or she is not

57
in breach of any of the covenants in the lease. The file is sent to the Valuation Department in theHousing Conglomerate for assessment of the "unexhausted value of improvements." A propertytransfer tax of 5 percent of the value must be paid. The commissioner will grant consent if theapplicant has fulfilled these conditions. The process may take five weeks to one year. The onus ofregistering the transaction is on the parties to the transaction.
Consents are similarly required for subleasing, mortgaging, and subdividing leaseholds. Theconsent fee for subleasing is K2,000, for mortgaging K500, and for subdividing K5,000 (1993 rates).The process is the same, except that in the case of a subdivision the applicant must provide anapproved sketch plan showing the proposed subdivisions. In the case of a subdivision, the onus is onthe individuals to get the proposed subdivisions numbered and surveyed by the surveyor general.
In general, the processes for consents are fairly straightforward. Rather, the issue is why theyare needed at all, except perhaps as a means of collecting ground rents and the property transfer tax.If land values were recognized and self-declaration of the consideration used as the basis for a propertytransfer tax, the declared price could by law be made the base for compensation in case of a takingby the government, and underreporting would cease to be a major problem.
The basic problems lie in the process for initial grants of lease. No one step seems to take anunreasonable amount of time, yet in the field, one regularly hears stories of files that have been sentto Lusaka and then nothing heard for years. The various parts of the MOL tend to blame one anotherfor delays, and the ministry as a whole emphasizes the delays that occur before the application evenreaches the ministry and the delays caused by reliance on staff from other ministries or themunicipalities. The process usually goes well enough so long as all is in order, but once a mistake isnoted and the case moves back down through the system, it often goes into administrative limbo. Itwas estimated a few years ago that there are between 25,000 and 50,000 applications pending, somefrom many years ago (ODA 1989).
IV. Overcentralization and overarticulation
The leasehold system is too centralized, and the procedures for leasing reviewed above involvefar too many separate stages and decision-makers. Each step in and of itself is not very timeconsuming, but at each stage there are possibilities for delay caused by backlog of work, absence ofofficials, clerical error, or any number of other reasons. The process emphasizes precise compliancewith all requirements, and so it is not uncommon for files to be sent back down the chain to remedyerrors and omissions. Once confusion develops in this many-staged process, it is very difficult toresolve. Troubled cases cycle up and down in the system, fraught with misunderstanding of what isrequired, and very substantial amounts of time must be devoted to them over several years before theyare finally resolved.
Part of the answer lies in decentralization. When applicants can come to the office in theLands Department where their papers are being processed, confusion can more readily be resolvedthan through an exchange of documents through the mail. Though it is not in theory necessary, thoseseeking action by the ministry very often have to follow up in person. Proximity to the client is animportant factor and reduces follow-up costs to the client. These considerations also apply to someextent, though less forcefully, to the work of the Land and Deeds Registry. For the Department of
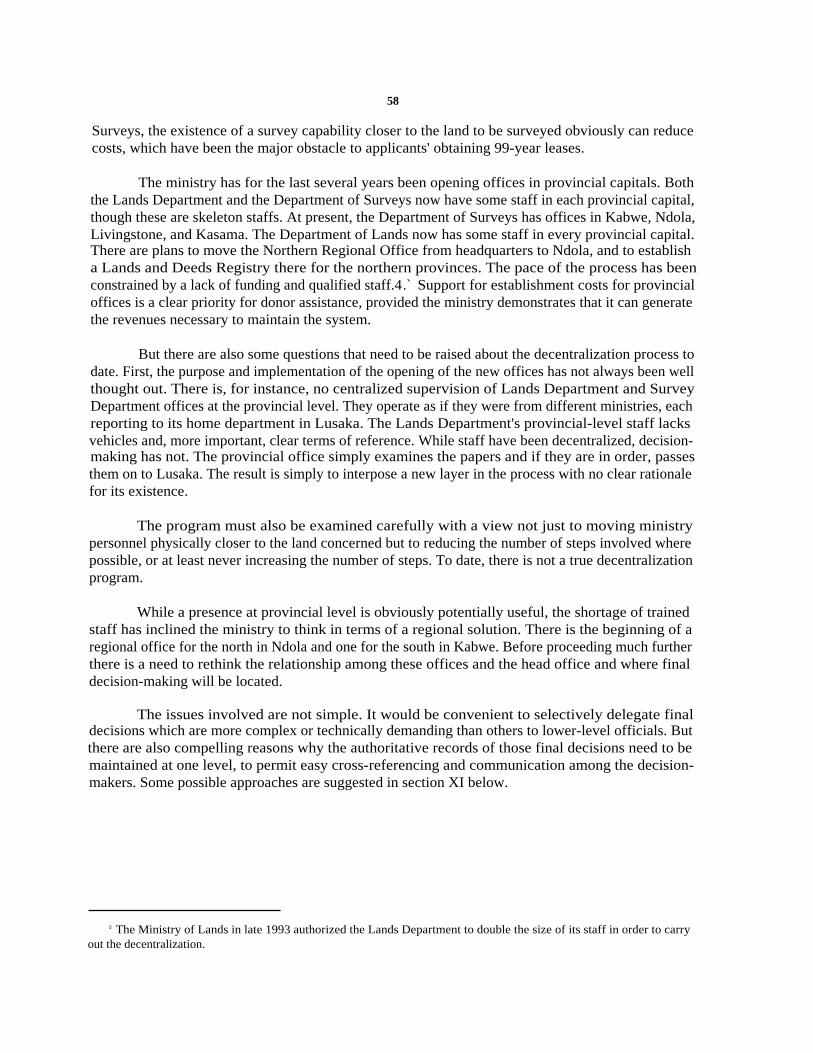
58
Surveys, the existence of a survey capability closer to the land to be surveyed obviously can reducecosts, which have been the major obstacle to applicants' obtaining 99-year leases.
The ministry has for the last several years been opening offices in provincial capitals. Boththe Lands Department and the Department of Surveys now have some staff in each provincial capital,though these are skeleton staffs. At present, the Department of Surveys has offices in Kabwe, Ndola,Livingstone, and Kasama. The Department of Lands now has some staff in every provincial capital.There are plans to move the Northern Regional Office from headquarters to Ndola, and to establisha Lands and Deeds Registry there for the northern provinces. The pace of the process has beenconstrained by a lack of funding and qualified staff.4.` Support for establishment costs for provincialoffices is a clear priority for donor assistance, provided the ministry demonstrates that it can generatethe revenues necessary to maintain the system.
But there are also some questions that need to be raised about the decentralization process todate. First, the purpose and implementation of the opening of the new offices has not always been wellthought out. There is, for instance, no centralized supervision of Lands Department and SurveyDepartment offices at the provincial level. They operate as if they were from different ministries, eachreporting to its home department in Lusaka. The Lands Department's provincial-level staff lacksvehicles and, more important, clear terms of reference. While staff have been decentralized, decision-making has not. The provincial office simply examines the papers and if they are in order, passesthem on to Lusaka. The result is simply to interpose a new layer in the process with no clear rationalefor its existence.
The program must also be examined carefully with a view not just to moving ministrypersonnel physically closer to the land concerned but to reducing the number of steps involved wherepossible, or at least never increasing the number of steps. To date, there is not a true decentralizationprogram.
While a presence at provincial level is obviously potentially useful, the shortage of trainedstaff has inclined the ministry to think in terms of a regional solution. There is the beginning of aregional office for the north in Ndola and one for the south in Kabwe. Before proceeding much furtherthere is a need to rethink the relationship among these offices and the head office and where finaldecision-making will be located.
The issues involved are not simple. It would be convenient to selectively delegate finaldecisions which are more complex or technically demanding than others to lower-level officials. Butthere are also compelling reasons why the authoritative records of those final decisions need to bemaintained at one level, to permit easy cross-referencing and communication among the decision-makers. Some possible approaches are suggested in section XI below.
° The Ministry of Lands in late 1993 authorized the Lands Department to double the size of its staff in order to carryout the decentralization.

59
V. Institutional coordination
Another reason for the poor performance of the system is that the MOL must rely onnumerous other government agencies. Difficulties in coordination with those agencies account forconsiderable delay and confusion. The point is not to place blame, as too much time is already spentpointing fingers. Rather, it is important to understand what flaws in the system lead to such greatdelays.
Having to rely on planning approval and services from local authorities is a first problem areaidentified by ministry staff. For the planning of stands for various purposes, the Lands Departmentrelies on Municipal Planning offices, where they exist, or alternatively on the Department of Townand Country Planning in smaller towns and in rural projects such as settlement schemes. When theLands Department makes an offer in principle relating to an area for which a plan exists, the applicantmust obtain planning permission before a final offer can be made. This is often a source ofconsiderable delay over which the ministry has no control. In addition, these local authorities areresponsible for servicing plots. Unserviced plots are commonly allocated in towns, and rates arecharged even before services are provided. This has caused problems in the implementation ofdevelopment conditions, allowing leaseholders to plead the town's failure to provide services as anexcuse for nonfulfillment of the conditions.
A second problem area involves the MOL's dependence on the Ministry of Agriculture stafffor preparation of sketch plans for 14-year leases. The Survey Department cannot meet the demandfor Survey Act surveys, and in fact few holders are anxious to incur the cost for such surveys. Sincethat department has failed to move quickly to develop a program utilizing less precise but more cost-effective survey methods, the Lands Department has relied upon the staff of other ministries toproduce sketch maps. In small towns, this is the town and country planning staff, but in rural areasthey are prepared by the provincial staff of the Ministry of Agriculture, usually based in theDepartment of Lands and Irrigation in the ministry's provincial office. In some areas, the preparationof such sketch plans has become their major role. This reliance on the staff of another ministry meansthat the MOL lacks control over the rate of land delivery in rural areas. On the other hand, the sketchmaps prepared appear adequate for the 14-year leases, and in fact for longer tenure. The issue appearsto be why this function, in the case of rural lands, should not be performed by the Survey Department,rather than a section of the Ministry of Agriculture.'
Problems of coordination exist within the MOL as well, constituting a third problem area. TheLands Department and Survey Department within the ministry have not always worked well togetherto provide cost-effective access to land. In particular, the Survey Department has enjoyed a remarkabledegree of autonomy, with the surveyor general at an equivalent level with the Commissioner of Lands.The department delayed for decades the introduction of more cost-effective methods of parceldemarcation and identification used successfully in other countries for rural titling, such as the generalboundaries system linked to aerial photography. The Survey Department must be seen as an integralpart of the land-delivery system, as a service section for the Lands Department which actuallyallocates land. In the process of decentralization, it is important that the provincial or regional offices
5 One answer is that the Ministry of Agriculture has staff posted in all districts, while the Survey Department has acritical shortage of staff. Under current restructuring plans, consideration is being given to transferring some staff from theland use planning section of the Ministry of Agriculture to the Survey Department.

60
have integrated management at that level rather than separate lines of authority running back to therespective departments in Lusaka.
A further area of concern is the requirement of consent by chiefs and councils for certainleases. Because the MOL does not generally have a presence at the district level, it relies heavily onlocal political institutions for decisions about the availability of land, the viability of proposed landdevelopment, and the reliability of proposed lessees. This is not just an administrative convenience.It is entirely appropriate that local authorities, in closer contact with local opinion, should makedecisions about land allocation in their areas. These decisions should not be centralized in the MOL.On the other hand, some important questions can be asked about the present arrangements. There issignificant demand for leaseholds in some Reserve/Trust Land areas, especially near towns and alongmajor roads. The popular attitude toward leasehold tenure from the state is effectively blocking thedevelopment of leasehold tenure in these areas. This may be expressed as opposition from chiefs, butit has a broader base and extends to some councils. The councils may delay or ignore leaseapplications, and in one case a council suspended consideration of applications for leases two yearsago. When the councils are willing, they lack the staff and administrative systems necessary to playtheir role properly.
A number of other problems hamper the land administrative system as well. In the areasvisited, the poor state of rural infrastructure and the rather desperate financial situation of ruralcouncils was striking. Both the chiefs and councils have a virtual veto over any application for a leasein a Reserve/Trust area. Further, they do not have a good working relationship, and there is often adifference of perspective about the utility and future of leasehold tenure. At present, there is no forumfor discussion and compromise, which would lead to the development of a common vision of thefuture of land tenure in these areas. This problem is discussed further in section IX below, but in time,there will need to be significant institutional changes at the local level to permit effective landadministration.
VI. Ignorance of correct procedures
Another source of problems is the widespread public ignorance of correct procedures. As faras the local participants are concerned, all the procedures of which they need be aware are outlinedin one document: the MOL's circular (see p. 21). But some officials at both district and provinciallevel are not familiar with the circular and could not locate a copy in their offices. In addition, the factthat many important steps in the process involve staff of government agencies other than the MOLmakes these procedures more difficult to communicate. This appears to be a particular problem insettlement schemes, in which Ministry of Agriculture or Directorate of Settlement personnel are theprimary source of information on how settlers can apply for leasehold titles after the successfulcompletion of their probationary periods.
It also seems that no attempt has been made to provide chiefs with copies of the circular. Allconsulted at village and district level expressed enthusiasm for the possibility of seminars and populareducation on leaseholds and titling. One chief remembered a 1988 Pickwe seminar at which theseissues had been discussed. While the wider distribution of the circular is one element in such aprogram, it would be important to produce and distribute more informal instructions. These shoulddiscuss not only procedures, but the rationale for the system. Translation of such materials into locallanguages should be considered.

61
The lack of understanding of the system is strikingly pervasive. In a full meeting of theChibombo Rural Council at Kabwe, councilors were unable to repeat the procedures governingapplications for titles. Often, they confused their powers over land with those of the Commissionerof Lands. None of them knew that Trust and Reserve Lands, just like State Land, was vested in thepresident. Nor were they aware of the existence of the circular.
Similarly, officers of Chongwe Rural Council east of Lusaka did not have a clearunderstanding of the titling process in settlement schemes. They considered that they did not have theauthority to process applications for titles in resettlement schemes, although no applications for suchtitles can be considered by the commissioner unless recommended by the council.
In a random interview of ten civil servants and ordinary citizens, nine thought a house couldbe bought in the same way as a car, i.e., without the requirement for a deed. Of those nine, fiveabsolutely rejected the suggestion that the MOL played a role in property transfer at all. One of themconfessed to having already paid the full purchase price to a vendor for a house and land in Ngwererefarming area even before the transaction was completed.
The Swedish International Development Agency (SIDA) has discussed an awareness campaignas an important component in its future assistance with the ministry. It is an important initiative, butit is important that the work be approached not just as a one-way transfer of information. The ministryand its staff need to engage in serious conversations with rural people about the advantages anddisadvantages of leasehold tenure and titling and be willing to modify its actions accordingly. But theministry has no capacity to do this alone. Villagers need to be presented with the advantages anddisadvantages of various customary tenures as well as statutory tenure and be granted choice to maketheir best educated decisions. The University of Zambia's law school and other extension servicescould play an important role in performing these functions.
VII. Survey standards and the 14-year lease
A further source of problems in the system of land administration concerns appropriate surveystandards and the 14-year lease. The Lands and Deeds Registration Act (CAP 287) in SECTION 12requires a diagram under the Survey Act (CAP 293) to be presented with any document relating toland presented for registration. The Survey Regulations, 1971, define normal acceptable standards oferror in terms of maximum acceptable misclosure of a traverse, requiring different standards fordifferent types of land: a maximum of 1:12,000 for surveys to determine the position of townshipcontrol or reference points, 1:8,000 for surveys in townships, and 1:4,000 for all other cases,including agricultural lands. These are relatively rigorous standards of accuracy and can be achievedonly by well-trained survey staff.
Due to a shortage of such staff, the ministry's inability to provide surveys to that standardbecame the major bottleneck in the system of land delivery and titling. In 1973, the backlog of surveywork was estimated as twenty to thirty years surveying at present staff levels (Swedish University ofAgriculture 1976). To deal with this problem, the MOL has increasingly resorted to a 14-year lease,for which it requires only a sketch plan instead of a Survey Act survey. The legal basis for this is notclear, but the reasoning seems to be that a more limited tenure could make do with a lesser degreeof accuracy. The 14-year leases have been utilized in a wide range of cases: urban developments,

62
settlement schemes, isolated parcels placed under leasehold in Reserve/Trust areas, and anycircumstance in which a Survey Act survey would take too long or cost too much.
The 14-year leases are of very questionable value. It is clear that they have done nothing toprovide better access to credit (see chapter 3), it is doubtful that there is much of a market in them,and they provide only limited security of tenure. The option of a 14-year lease may have hamperedthe ultimate obtaining of 99-year leases by creating a longer and more complex road to that end. Itis further difficult to justify them as a reasonable response to a lack of well-trained survey staff, asthey have been presented.' One must justify titling in terms of its economic and financial impacts,and a 14-year lease seems to have little of either. Their widening use appears prompted by anoveremphasis on accuracy and classic ground-survey methods.
As has been noted in consultancy reports going back more than ten years, the surveyorgeneral's office has insisted on an unnecessarily high and uneconomic standard of accuracy and hasbeen slow to adopt new methods such as the marking of boundaries on aerial photos for situations withlower accuracy requirements (e.g., Swedish University of Agriculture 1976; Bruce and Dorner 1982).While it is sometimes suggested that greater flexibility requires legal changes, the standards of surveyare in regulations which could be changed by the minister. The Survey Act (SECTION 38) does allowuse of aerial photography as a basis for boundaries, provided the surveyor general gives prior writtenpermission. And SECTION 12 of the Lands and Deeds Registry Act gives the surveyor general theability to allow lesser standards of accuracy where a normal survey is impractical, by approving asufficiently detailed plan as a basis for registration.
The reason given for the backlog in survey work—a lack of qualified personnel—would lessenin importance if more appropriate standards and methods of survey are accepted.
A 1993 draft amendment of the Lands and Deeds Registry Act prepared by the MMDcommittee on land issues provides for description of land in a document presented for registration tobe by a plan or "verbal description" which satisfies the surveyor general. The verbal description istoo extreme a reaction to the past; what is needed is simply a clear statement of the surveyor general'slegal discretion to utilize whatever survey means appropriate and economic in a particular situation.This will include use of aerial photography in some situations, but for some work there should soonbe a shift to survey by GPS (global positioning system), which relies on hand-held units to establishprecise position by fixes from multiple satellites. That technology could be particularly important forisolated parcels in Reserve/Trust lands, where the geodetic network for conventional survey is poorlydeveloped.
The sketch plans prepared for the 14-year leases and located on the 1:50,000 contour mapsprovide a perfectly acceptable standard of accuracy for large parcels of low-value rural land. Basedon broadly accepted international standards, they are an acceptable basis for the registration of 99-yearleases. For urban areas, where access to survey should be relatively easy, the survey should be doneeither to Survey Act standards or by aerial photography, which results in some size distortion but isentirely reliable for boundary verification. There, on more high-value land, 99-year leases should havebeen issued, with conditions concerning later upgrading of survey standards. The recommendations
e To some extent, more work is placed on the limited numbers of learned staff, as the volume of turnover is high.

63
below suggest the conversion of all 14-year leases to 99-year leases. A proposal for 30-year leasesdoes not go far enough.
VIII. Land management principles: plan and market
Zambia's land management style has been that of a planned economy with direct administrativecontrol, rather than through managed markets and control of land use through regulation as in marketeconomies. It has involved state ownership of land; administrative rather than market determinationof land allocation; reliance upon development conditions; restrictions on transactions; and undervaluingof land in the context of both transactions and taxation. These policy decisions have impoverishedZambia's public sector and undermined development in its private sector. The government has denieditself income from the country's most valuable resource—land. The MOL, anxious for donorassistance, has failed to generate the revenues that could easily have come from land. Ground rentsare uneconomic and not regularly collected. Land is allocated for nominal amounts.
There is substantial evidence that the current system is not allocating land to those who willuse it efficiently. The MAFF/World Bank 1993 evaluation of use levels on State Land found 652,000hectares underutilized, of which 60 percent (400,000 hectares) is good arable land (see chapter 1). Itfound that 150,000 hectares are available from the state farm and parastatal sector, between 100,000and 200,000 from privately owned farms, and substantial unutilized land from the settlement sector.An examination of the state of use of Reserve/Trust Lands recently allocated under leasehold mightreveal even higher levels of underutilization.
Many allocations have been requested purely for status and speculation, and developmentconditions have failed to prevent holders from keeping the land idle. In light of the experience of othercountries with such conditions, this is hardly surprising. It is important that attempts to encourage landdevelopment shift from reliance on a development-condition approach to reliance on economicincentives, creating economic costs for land that make it disadvantageous to hold land withoutdeveloping it.
It is equally important to reestablish public confidence in the probity of the MOL. As in anysystem which allocates a scarce and valuable good for free or nearly free, opportunities for corruptionabound. Not surprisingly, it is popularly believed that favoritism, abuse of insider information, andthe acceptance of bribes are rife in the MOL. Officials of other government agencies which act onbehalf of the ministry at local levels are subject to similar temptations.
Clearly one of the most fundamental requirements of reform is the recognition of the valueof land. This must be done through the expansion of the role of market forces rather than throughadministratively set prices. Government must make land available for economic cost and allow themarket a major, if not necessarily exclusive, role in determining its distribution. Constraints on themarket, such as restrictions on subdivision, must be removed.
IX. Problems of confidence and vision: Trust and Reserve Lands
If the problems of the State Land are considerable, it is relatively easy to see the directionsthat must be taken. It is land policy with respect to Reserve and Trust Lands that is most genuinely

64
problematic. To date, land policy seems to anticipate the gradual conversion of the land undercustomary tenure to leasehold tenure. But such policies have worked out badly in many countries.Administrative allocation of land has often been used to deprive indigenous people of their land. Thosewho lose the land are not compensated. Often the land is allocated to those who use it poorly,resulting in resentment.
Zambia has been no exception to this pattern. Zambia's Land (Acquisition) Act, 1975, is atextbook example of a callous disregard for rights in land. Allocations made by the ministry to datehave induced cynicism about government's intentions on the part of local people. In rural areas inEastern and Northern provinces, complaints were heard of land-grabbing and a failure to bring theland under production. In one location, an 8,000-hectare allocation to a former commissioner was saidto be undeveloped, but now is being subdivided and sold. In other places, huge areas of land takenby the government for unsound development projects, for instance the ill-conceived council farms, aresitting idle. There are bitter complaints about the abuse of the ministry's power to allocate land. Land-grabbing has emerged as an issue in the local press (Daily Mail, 14 January 1994) as the result of acritical report from the Southern African Non-Governmental Organizations Network (see p. 29 inchapter 1 for an extract from the Daily Mail).
The current titling system, which is in theory open to traditional farmers in the rural areas,is by reasons of expense and complexity really open only to the relatively wealthy, well-informed, andinfluential. It is exceptional for traditional farmers to apply for or receive titles. The system as it isnow working is not solely or even primarily a system for providing title as evidence of rights to land,but a mechanism for taking land away from communities which customarily have had access to it andallocating it to new governmental and commercial elites, both Zambians and foreigners.
If the land is actually allocated to those who will develop it, if reasonable compensation isprovided to the community that loses access to it, and if the community consents, some such transfersmay be appropriate. There are areas of unutilized land in Reserve and Trust regions which localcommunities will not need for the foreseeable future. If the land is developed, local communities canpotentially profit through new jobs, new technologies, and new sources of revenue. However, as ruralpeople look at the current system, they see no end to this process of deduction from their land. Itoccurs not only through leasehold titling but through the declaration of protected areas and reservesfor environmental purposes. In some areas, at least, they feel threatened. The vast majority oftraditional farmers do not understand the pros and cons of leasehold tenure and are not in a positionto evaluate its relevance to the development of their land. While most traditional farmers seem to haveno felt need for titles, there are exceptions, especially in areas near towns and along main roads.
Chiefs see the gradual erosion of their authority over land as seriously undermining theirpower and a harbinger of landlessness and social disintegration. They react in very different ways,and it is worth reviewing their comments on these issues.
Headman Mang'ang'auka, Chief Sianjalika, Mazabuka, said that he could not allow title deedsin his village, arguing that the traditional systems of tenure would not allow it. Land, despiteallocation, remains community land. He said he held the land for the community which, byimplication, would cease to be a community if individuals acquired title deeds for their land:

65
I am holding this land for you in town.... [W]hen you die, I must find land to buryyou here as I should when you return home to settle. Where will you stay when youcome back if I allowed people to get title deeds to our land?
Headman Mwambula of Chieftainess Nkomesha also rejected the notion of land titles and saidhe never consents to them for his subjects. His chieftainess, Chieftainess Nkomesha, has recommendedpeople for title deeds but has watched her authority over that land erode and considers that a strongcase must be made by a potential investor to justify her granting a title deed.
Senior Chief W. Tafuna, in Mbala, was willing to consider requests to title deeds and hasconsented to several, including some to foreign nationals. They are given land away from thevillagers' cultivation. But, he stressed, "we do not really understand title deeds, and are not clear onthe relationship between farms and title deeds."
Paramount Chief Chitimukulu, near Kasama, argued the importance of title deeds, and saidthat he encouraged his subjects to obtain them. He was not enthusiastic about titling for investorscoming from outside, however, and while land is plentiful in the area he worried about possiblelessees who would bring new systems of land use, such as livestock herding, and take up largeamounts of land quickly. He reacted favorably, at least tentatively, toward the suggestion of a programof systematic survey and titling of existing farm holdings.
Indeed, the full range of opinion was present, from chiefs who said they would never consentto a lease in their territory under any circumstances, to chiefs who had selectively approved leaseholdsfor outside investors but made the allocations well away from traditional areas of cultivation to preventconflicts with traditional tenure rights, to chiefs who wanted titles for all their subjects in order toprotect their land rights and foreclose the possibility of the ministry allocating the land to outsiders.
Government has taken two steps in this area. The first is the limitation of grants of leaseholdsto 250 hectares in the Reserve/Trust Lands (D(v) of the circular).7 ).' This is a critical step in limitingabuses, but it is undermined by the understanding that exceptions can be made with the consent of theminister, with no clear criteria for those exceptions. It also may effectively preclude cattle ranchingor extensive mixed farming systems in certain regions where there are sizable economies of scale. Thesecond positive step is the requirement of prior consent to any allocation by both the local chief andthe local council. This is an important step towards more local control over the use of land and othernatural resources.
What is needed is a clear vision of the future that reassures traditional farmers. One optionwould be systematic, compulsory registration of customary titles as leaseholds. But experience fromother countries suggests that this would be expensive and difficult to justify in cost/benefit terms.Considerable flexibility is needed. There is a need to provide for systematic registration for limitedareas where commercial development is relatively advanced, for instance in areas closely associatedwith State Land farms along the rail lines. There may be a need to provide for some means by whichlocal residents can overcome the reluctance of their chiefs to approve leaseholds, especially in the
7 The policy debate does not yet seem to have contemplated restriction on the number of leaseholds. As indicated inchapter 3 (table 3.6), multiple parcels are held, making it possible, even likely, that the 250 hectare limit could becontravened by acquiring two or more leaseholds.

66
vicinity of towns and along major roads. Incentives for local communities must be created which allowthem to continue to view land under leasehold as part of their community resource base. For instance,ground rents might be collected by municipalities and chiefs with a portion retained for localdevelopment projects.
Arrangements will to some extent need to be worked out locally and the various interestseffectively represented. It is not clear that any forum for this exists at this time. The MMD has talkedabout an increase in the powers and responsibilities of chiefs, and there is a need to take betteradvantage of the respect and authority that these traditional authorities still enjoy in many areas.Moreover, the need is not simply to strengthen one side or the other in a struggle for control of landbut to create institutional arrangements within which the various interests are represented and haveincentives to work together and strike the needed compromises.
X. Policy debate: July 1993 Land Policy Conference
The electoral victory of the MMD in the 1993 elections provided the first opportunity intwenty years to question in a fundamental way the land policies of post-independence Zambia underUNIP. The MMD had campaigned on a platform which suggested it would promote basic changes,such as the reintroduction of freehold tenure.
The July 1993 conference (see chapter 1), supported in part by USAID, provided theopportunity for a first frank exchange of opinion on the issues. Conference participants discussed thepresidential power to acquire land and agreed that it should be clarified if not curtailed. Theydiscussed a need for two land statutes, one dealing with State Land and one for land under customarytenure, without any distinction between Trusts and Reserves. They noted that discrimination againstwomen was common both in the allocation of State Land and in the Trust and Reserve areas. Therewas broad agreement that the issues of land under customary tenure deserve more careful study, withincreased input from traditional leaders. It was questioned how much customary land was availablefor allocation to investors, and whether customary land tenure itself needed reform.
Participants also debated the relative merits of leasehold and freehold titles. Those whosupported the freehold system argued that leaseholds became insecure as they neared the end of theirterm. Freeholds, they argued, could be regulated to achieve many of the same ends desired in the caseof leaseholds. Those who supported the leasehold system argued that freehold would, through landtransactions, lead to the dispossession of the poor and excessive land concentration, especially in thehands of foreign interests. They argued that it would lead to uncontrolled land speculation andunderutilization. In the end, a large majority of the participants favored a leasehold system.
Discussion of land concentration led to discussion of the effectiveness of ceilings onlandholdings and of the impact of auctions of land. It was agreed that the economic value of landneeded to be recognized in the form of increased ground rents, but there was no consensus as towhether land should in the future be allocated by government or sold.
For land in urban areas, the discussions focused on the issue of squatters, the housingshortage, and protection to landlords and tenants in their dealings with one another. In the domain ofland administration, the participants urged decentralization of Lands and Surveys and a greater

67
emphasis on dissemination of information about the titling process, especially to traditional rulers.Cheaper, less-precise means of survey were urged for rural areas.
The final resolutions of the conference are listed in figure 1.2. While they are not binding ongovernment, they will be influential in framing policy.
XI. Recommendations
1. The Lands and Deeds Registry Act should be amended to confer broad discretion on the registrarto accept and certify any economic and appropriate parcel description as adequate for the purposes ofregistration.
The system to date has been too conservative about what it will accept as the parceldescription for a registration. The need is not to specify new standards—technologiesin this area are developing with incredible rapidity—but rather to make clear thediscretion of the Registrar and to provide the resources that ensure that Surveys willhave access to these new technologies.
2. All 14-year leases should be automatically converted to 99-year leases, by law and without groundinspection or further survey.
These leases are too short for any useful purpose, and their renewal is alreadybecoming a burden on the system. Proposals for a 30-year lease do not go far enough.The sketch plans on which the 14-year leases were based are in fact accurate enoughfor a 99-year leasehold. At a later date the leaseholder could pay for a more precisesurvey, if there were a need. Beyond this, the current report will make norecommendations on survey. The ministry is being ably advised by a very competentSwedish team.
3. All future leases of State Land outside agricultural settlement schemes and urban squatter upgradingschemes should be offered at public auction. Within those exceptions, clear criteria for selection mustbe developed.
The MOL manages a vastly valuable resource and cannot expect foreign donorassistance while it continues to give the resource away. Moreover, allowing the truevalue of the resource—and differences in prices depending on potential andlocation—to be recognized is a critical first step toward allowing the market todetermine the most economically effective use of the land. An auction strategy is farsimpler with freehold. If the government decides to continue a leasehold system, it isstill important that an auction system be used. But to do so, it will be necessary todrop development conditions. With those present, it is unlikely anyone will feel it isworthwhile to bid any substantial amount. The bidding would be on a premium whichrepresents the scarcity value of the lease over and above that recognized in the groundrent. It would test the relationship between the ground rent and actual market value.

68
4. In order to facilitate the operation of a market in leasehold rights, the requirements for governmentconsent to transactions, including subdivisions, should be eliminated, with the possible exception oflease assignments to non-Zambians.
Already, these approvals are a formality, an occasion for collecting a consent feewhich hardly covers the cost of processing, and for collecting ground rents unpaidover many years and the property transfer tax. Provision could be made instead thatproof of payment of ground taxes and a property transfer tax must be proved to theRegistrar before the transaction is registered. The issue of non-Zambian ownership ofresources arouses strong passions. It may be best to preserve the principle of controlthrough a consent requirement, even though that consent will be readily given toattract investment. However, the 5-year limitation on leases to foreign companies onTrust Land should be eliminated.
5. Development conditions should be eliminated from leases and reliance placed instead uponeconomic disincentives for holding land idle, such as ground rents.
Zambia's experience with development conditions is little different from that of othercountries in Africa. They are not enforced systematically and are most often raisedas an issue by someone who hopes to displace the exiting holder. They createinsecurity, without achieving their objectives. Rather than worry about developmentconditions, ground rents should be increased to economic levels to bring pressure tobear for the development of the land in a profitable fashion.
6. If in some cases development conditions are still considered necessary, they should only requirea specific investment or construction in the short term, for instance five years. The developmentcondition should be considered met if notice of default is not given by the ministry or other relevantauthority such as a municipality within that period. Default should be punished by fines rather thanby retaking the land. Beyond that time, only a prohibition of abandonment should apply, and in thatcase a retaking should be subject to compensation for the land and improvements.
A set of development conditions along these lines would be less harmful than thepresent conditions.
7. Further increases in ground rents should be considered as the economic value of land becomesclearer through the auction process. Penalties should be imposed for late payment of ground rents.
These rents can provide government with much-needed revenue and can in largemeasure substitute for far less satisfactory means of ensuring that land will not be heldidle, including development conditions. It is not a good idea, as recommended in theODA report (1989), to increase the property transfer tax: this acts as a drag on theland market.
8. The MOL, given its limited staff and facilities, should carefully consider the economic and financialimpacts of the allocation of its staff to particular tasks and to particular regions and tenure sectors.
The ministry, like many other Ministries of Lands in Africa, must cease to think interms of providing a uniform set of services nationally. It must begin to heed the

69
economics of land administration, focusing efforts on activities that can becharacterized as high-return in terms of development or revenue.
9. Using these criteria, the highest priority should be getting land and titles into the hands ofcultivators within the State Land sector.
This should be the priority because (a) there are large amounts of good arable landthere, (b) its proximity to the rail lines and other facilities will increase theprobabilities of profitable operations there, (c) its higher value can produce morerevenue, and (d) it is relatively accessible for survey by the ministry.
10. Within the State Land, first priority should be given to reallocation of the land of State Farms andparastatal holdings, second to resettlement schemes, and third to private holdings. If a landidentification committee or similar body is created to identify land for investors, it should for the firstseveral years focus its attention on the State Lands and these particular areas.
The State Farms and parastatal holdings will decline, and prompt action will beneeded to ensure a sound scheme for distribution, before the land can be occupied bysquatters. A land identification committee could also work out a repossession strategyand targets based on the World Bank-funded study of land utilization in the StateLands, initiate the reviews suggested in recommendation 32 below, recommendretakings for failure to pay ground rents, and recommend penalties for late payment.
11. In terms of resolving titling difficulties for land already allocated, the resettlement sector deservesspecial attention. A crash program for dealing with this sector should be considered and put forwardfor donor funding.
There appears to have been especially serious confusion in the titling process in thissector, in part as a result of inadequate information. Few settlers have received leases.Because these holdings are clustered geographically, the titling situation could besorted out relatively expeditiously through a field operation, with scheme officialspresent to provide planning consent and Lands and Survey officials on the groundempowered to certify plans and sign leases. A field adjudication procedure todetermine entitlements would be necessary because of the confusion which hasdeveloped in some settlement schemes through departure and replacement of settlers.
12. For selected areas of considerable commercial development in Reserve and Trust Lands, theministry should seek to develop a procedure for systematic titling of all holdings, along the lines ofthat incorporated in the repealed Lands (Adjudication of Titles) Act, 1962.
The priority need for titling in the Reserve/Trust Lands is not so much to make landavailable to outsiders, since more accessible land is available in the State Lands, butto develop an approach in areas where commercialization justifies title registration.Yet, smallholders are being disadvantaged in obtaining title. These areas are likely tobe near existing State Lands. Work under such a system should initially be on a pilotbasis.

70
13. There is a need to create a Policy Analysis and Studies Unit directly under the PermanentSecretary's Office of the MOL.
When the MOL was split from the Ministry of Agriculture, the research capabilityremained with the latter ministry, and there is no capacity for sustained, informedthinking about policy within a ministry preoccupied with delivering land and titles.
14. There is a need to rethink the present structure of the ministry's senior management to reflect abroader concept of the ministry.
As it stands, the ministry is a structure to deliver lands and titles and little more.Organizational structures in other Ministries of Lands and agencies with similarresponsibilities in the region should be examined. Possibilities include a bifurcationinto divisions under an Undersecretary (Urban) and an Undersecretary (Rural) and thecreation of a post of Director-General for Provincial Land Administration. Amongother needs, it is important to ensure that the Survey Department serves the needs ofthe Department of Lands, rather than pursuing a separate agenda.
15. There is a need to redesign the land allocation committee and the office of the commissioner.
The commissioner should be appointed by the president subject to approval byparliament, and serve a 10-year term. The land allocation committee should becomposed of prominent citizens selected in the same fashion, not bureaucrats. Thecommittee should decide allocations, with the commissioner as chair with a tie-breaking vote.
16. The most critical aspect of decentralization is the transfer of responsibility for urban lands tomunicipalities.
The bulk of the ministry's work concerns urban land and reducing its workload canmost effectively be accomplished by establishing the necessary skills and recordkeeping at municipal level.
17. Regional and provincial offices of the ministry should be fully integrated, with a single officer incharge, rather than divided into departments with separate lines of authority running to Lusaka.
Decentralization cannot be expected to work unless this is achieved. At present, theprovincial office of the Lands Department and the Survey Department make their ownarrangements for office space, have their own vehicles, etc.
18. The regional office of the ministry in Ndola should be primarily a Land and Deeds Registry, whiledecentralization of other Lands Department and Survey Department activities should be to provinciallevel.
Regional offices are still considerably removed from the location of most lands andclients. The provincial level is a more appropriate level to which to decentralize mostministry functions. After offer of a lease, land development tends to begin without

71
waiting for completion of the registration process and will not be delayed by lodgingthe registration at the regional level.
19. The final decision on all leases for under 250 hectares should be delegated to provincial level.Auctions should be held at provincial level, though advertised nationally. The ministry's provincialoffice should issue both in-principle and final offers, be responsible for sketch maps, and collaboratewith the relevant planning authority. A master parcel map would need to be maintained at provinciallevel to permit checking of possible overlaps and numbering of the parcel. The numbering systemwould need to reflect location by province and district.
If decentralization is to be tackled seriously, it must be done at least at the provinciallevel. This implies new resources for the ministry, but provincial offices already existin many provinces and the new resources needed are within the realm of possibility.
20. Delegation of authority to make final offers for leases to the district level is technically feasible.This would require the posting at that level of a district lands officer. When resources allow, theministry should begin to build such a cadre on a pilot basis.
If sketch maps as presently done are accepted as an adequate basis for all leases, notjust 14-year leases, there is no serious obstacle to delegation of final offers to thedistrict level. This would require the creation of a cadre of district lands officers forthe ministry, which would in turn mean new recruitment, but this is in any casenecessary for this understaffed ministry. Master map numbering of parcels could bereported up the line for parallel maps at provincial and regional level. The districtlands officer would do sketch maps and act as the planning officer for rural grants.Once the council approved the application, the ministry's district officer could makethe offer in principal and, once fees were paid (at district level) and any othernecessary planning permission received, could make the final offer. Access to vehiclesmight be the major constraint to the development of operations at district level.Council vehicles could be utilized in some districts, with costs shared.
21. For the time being, the roles played by councils and chiefs should remain as they are but shouldbe studied to determine whether alternative institutional arrangements exist, which require a morecollaborative mode between the council and chiefs.
The involvement of chiefs and councils in the approval of leaseholds is a very positiveelement in the present system. However, chiefs may not adequately represent theinterest of all their people and give too heavy an emphasis to preservation of theirtraditional prerogatives. It is possible to imagine elimination of the consentrequirement by either the chief or the council in certain circumstances, where theapplicant holds the land as ancestral land. It is also possible that the process could beimproved upon significantly by providing an institutional forum in which traditionalauthorities and elected councilors could interact and discuss policy. But such changesshould be based on careful study. Research is urgently needed to explore thepossibilities and must begin by obtaining a better understanding of traditional landadministration.

72
22. The process for initial leasing of land could be shortened at the district level by altering theprovision of circular No. 1 to allow a subcommittee of the council to act finally in approving a leasewithout requiring the matter to go before the full council. A special lands subcommittee should becreated for this purpose. The powers of the subcommittee and the criteria that they are to use inapproving an application should be set out in law, possibly as part of a revision of the Conversion Act.
This is very necessary in light of very infrequent meeting of the full council, only 3-4time a year in many rural districts.
23. The master map now maintained in Folios in the Lands Department should be turned over to theSurvey Department so that checking the parcel for conflicting allocations and numbering the parcelcould be done as one process.
At present, the file goes to Folios to be checked for conflicts, then to Surveys for anumber, then back to Folios for that number to be recorded. It seems that this couldbe done in a single step in Surveys.
24. Offers in principle should be eliminated. A final offer should be made initially, to be accepted bypayment of fees.
At present, the Lands Department sends out an offer in principle wherever planningpermission is required and does not send a final offer until permission has beenobtained. It is not clear why this is necessary. This process may have been based inthe notion that the development conditions could not be agreed upon until planningconsent was required, but if development conditions are dropped or made moregeneral in nature, as is recommended here, this is not a factor.
25. The process could be further expedited by making the final offer the lease itself. On its return,signed by the applicant, with the necessary fees, it could be signed by the commissioner, registered,and sent back to the applicant with the title deed in one mailing.
Currently, once the offer is sent and accepted, a lease is sent to the applicant to signand return, and then once it is registered, a title deed is prepared and sent to theapplicant. The process seems unusually cumbersome. If it is legally required by anyact or received law, then this should be amended.
26. Personnel, vehicles, and budget now devoted by the Ministry of Agriculture to the preparation ofsketch maps to support applications for leasehold should be transferred to the provincial offices of theMOL. Serious consideration should be given to transferring to the MOL the entire Land Use Planningoperation from the Ministry of Agriculture and the Evaluation Section of the Housing Conglomerate.
There is little sense in this work remaining within another ministry. But if thepersonnel and responsibility for the work is to be transferred, it is essential that thevehicles and budget for salaries and fuel be transferred at the same time.
27. Rural councils and municipal councils should be made responsible for the collection of all groundsrents in towns and on State Lands and should be able to retain a portion of those rents, perhaps half,for local development projects in return for providing this service. It would also be useful to explore

73
how chiefs might collect ground rents in their areas of Trust and Reserve Lands and similarly retaina portion of those rents for local development projects.
The ministry should not attempt to develop an independent capability for ground rentcollection. It must take advantage of the capabilities of these other institutions but willbe able to do so effectively only if they themselves have some direct interest in therevenues to be collected.
28. There is a need for the ministry to develop an effective program of training and public informationconcerning land policy generally and titling specifically. This implies the creation of a training andinformation unit within the ministry.
There is a need to give the circular much broader distribution but also a need toprovide more "how-to" information, which might be disseminated not just through theministry but through an NGO such as the National Farmers Association of Zambia.In the Trust and Reserve Lands in particular, the need is not just for information butfor genuine exchanges on the role of titling. The ministry will need to carry out moreformal training in procedures and record-keeping for its own provincial staff and foremployees of other agencies on which they must rely, especially council staff.
29. In framing land policy for Trust and Reserve areas, there is a need for a frank admission thatabuse of the titling process for land-grabbing is not just a potential problem. It has been taking place,permitted by inadequate safeguards within the ministry's land allocation system. The 250 hectare limitfrom the circular should be enacted in law for farms; clear criteria should be created for exceptionsto this limit; and the approval of such exceptions be entrusted to a national board consisting ofrespected figures.
The ministry should set up a task force to think through how landgrabbing can beavoided in the future. An effective and economic ground rent will be the first need,but even then difficult cases will arise. There will be requests which tax the ability ofofficials to estimate real land needs, like one currently pending at district level inNorthern province for a 15,000 hectare game ranch. Should the commercial farmcommunity find that this ceiling is prohibitively low, a study should be commissionedto arrive at a more efficient and acceptable standard or set of standards.
30. For Trust and Reserve areas, the supply of titles and land delivery for outside investors, thoughan important element, should be secondary to the development of a viable strategy for protecting andenhancing the land rights of local farmers and communities.
To date, policy has focused almost entirely on the supply of titles, which is in nosense a comprehensive land policy for these areas. Such a policy needs to bedeveloped. There is time to step back and think through the needs of these areas moresystematically than in the past, time provided in part by the availability ofconsiderable good, arable land in the State Lands.
31. The recognition of value in land should be an element in this policy as it is in State Lands.Government (and donors) must recognize customary property rights and should pay compensation forland taken for development by others.

74
When government passes land on to outside investors, they should bear the cost ofmaking the land available. Similar costs should not be placed on local land users andtheir communities when they seek title to land they already use, in recognition of theirland rights under customary law.
32. There should be a systematic review of leaseholds or parcels in the Trust and Reserve Lands 50hectares or larger held by government, and over 100 hectares held by private individuals orcompanies. Where this land is unused, government should consider retaking it and returning it to localcommunities unless the communities can agree with the ministry on some other use for the land.
Too often, local communities have been asked (and pressured) to provide land for ill-conceived development efforts (e.g., the Council Farms), then watch the land sit idlefor years. Where such land exists and cannot be put to the use for which it wasprovided, it should be returned. This would do a good deal for the ministry's poorcredibility in the rural areas. In each case, the displacement of traditional users shouldbe noted, and they should be given priority to return to the land.
33. Broad local consultations should be undertaken by the ministry to help it think through the futureof tenure in the Trust and Reserve areas.
Those consultations should be linked to educational activities; framed to allow agenuine exchange on the pros and cons of leaseholds and their grant to either localpeople, outside investors, or both; and framed to include farmers and other productiveland users as well as officials and traditional authorities. Participatory rural appraisalmethods and focus group approaches would be useful. The recent nationalconsultations on land policy in Tanzania by the Presidential Commission on LandMatters which reported in 1992 should be examined as a model.
34. The ministry should consider further work on systematic titling activities in some quite limitedTrust and Reserve areas with good market access where a lack of title may be a binding constraint oninvestment.
See recommendation 13 above.
35. A program of studies should be undertaken in several carefully selected areas to explore newapproaches to customary tenure and local organization for the administration of land.
Our information base on customary land administration is very poor. Each area shouldinclude the lands of a group of three or four villages in a district, and the studiesshould examine not only rights and dealings in farmland but rights in common-property resources shared by community members and by more than one community.The studies should utilize a variety of methodologies: participatory rural appraisal,dispute studies, and household surveys. The studies should develop plans for follow-up pilot work on land rights and administration in these areas.
36. A comprehensive study of the terms of access by women to productive resources should be carriedout.

75
The resolutions of the July 1993 conference (figure 1.2) stress the need for equalityof treatment of women. In spite of important legal changes such as the 1989amendments to the Wills and Administration of Testate Estates Act, there is a vast gapbetween the aspirations of the resolution and the facts on the ground, where womenare seriously disadvantaged both under national statute and customary laws and whereimplementation of reforms is highly problematic. The purpose of the study would beto devise a realistic and effective strategy for increasing women's rights andopportunities.
37. A study should be carried out to determine the relationship between the rapid expansion ofcultivated land in the last decades and the expansion of the leasehold system.
It should not be assume that the two are directly related as there is some evidence tothe contrary. There is a need to understand how access to land for expansion isobtained.

76
Annex 2.1: Guidelines for determining the size of landholding for farming purposes
Chapter 1. The Formula and Explanation set out below are designed to help District Councils and theirStaffs, District Agricultural Officers, and District Executive Secretaries determine the size ofundemarcated land granted to a prospective farmer. Before this formula can be implementedthe following data must be available:
2. 1. Land capability, at semi-detailed level2. Location of farm (peri-urban or rural)3. Relative pressure on the land4. Pattern of settlement in the adjacent area to the proposed farm (commercial,
traditional, emergent agriculture, peri-urban, urban)5. Pattern of past urban drift and consequential past population density6. Traditional land use patterns — provincial strategy7. Recommended future land use pattern — provincial strategy8. Proximity to economic centers and markets9. Proximity to power10. State of roads plus their development.
3. 1. The present income of the prospective farmer2. The size and education of his family and whether they will be part of the farming unit
or independent3. Capital available for immediate investment4. Plant and equipment available to support the proposed program5. Proposed source and extent of funding6. General ability of the prospective farmer to succeed. By combining the above data we
are able to determine the size of farm within any given planning area suitable for aprospective farmer.
This pre-supposes that the province has already had a development strategy plan drawn up.(This has yet to be done for Southern province.) It is the basic ingredient of any coherentdevelopment plan. Thus the following principles are applied for guiding prospective farmersto the right location and right size farm for themselves:
4. 1. Is the farmer self-sufficient? Can he survive in the bush by himself? If not, he mustbe in an area where he can receive support services.
2. Does he require:a. Ranching operationb. Mixed fanningc. Dairyd. Horticulturee. Small stock only.
These items are graded in the degree of return per hectare of land, i.e., land use intensity.Therefore, a small stock specialist can expect more than K1,000.00 per hectare of land ifproperly used. A ranching operation can only expect a return of K200 per hectare onintensively grazed improved pastures properly managed.(This scheme takes no amount of traditional methods as these are not economic.)
5. Therefore, the process works as follows:The income that a prospective farmer can reasonably expect is calculated from his pastperformance in whatever sector he comes from and his income for the past five years beforehe applied for a farm. His future expectations of income are based upon what his previous

77
expectations were, i.e., a civil servant who has successfully reached the top of his career canreasonably be expected to achieve the same level of success in farming but is unlikely toexpect more than a safe income as he is probably not an experienced entrepreneur. Therefore,if his present income is approximately K8,500.00 with subsidized housing and transport, wewould expect him to be able to command a gross income of K100,000.00 which would allowhim a disposable income of K10,000.00 per annum.Therefore, if we apply our income criteria to the five types of farming we would recommendlandholding as follows:a. Ranching 500 hectaresb. Mixed farming 300 hectares Average net incomec. Dairy 300 hectares K10,000.00d. Horticulture 100 hectarese. Small stock 20 hectaresN.B. Holdings smaller than 20 hectares would not normally be planned for Commercial SectorFarmers.
6. In respect of traditional farmers there is not much of a problem as they only apply for titledeeds when they need to become commercial. Therefore, the size of holding surveyed for titledeeds will be restricted by the present income of the farmer projected back over the last fiveyears and a professional estimate of the level that he will achieve over the next 10 years basedupon the size of loan he is likely to get.
7. By far the greatest call on the land is from workers wishing to ensure their future. In the caseof large companies applying for land they are usually encouraged to move to the areas wherethey will contribute to the reversal of the rural urban migration. Apart from this provincialpolicy, the same formula applies, i.e., the amount of money available for investment iscompiled, along with the borrowing from various sources so that a total investment figure isavailable and a program may be involved for a five- or ten-year period of investment plusdevelopment leading to an established expectation of income at the end of this period.It must be mandatory that all such programs be certified as within the financial resources ofthe company concerned, by an independent firm of chartered accountants who will be heldprofessionally responsible if they mislead the settlement committee. All such costs are naturallyborne by the prospective farmer.
8. In any case, all holdings of more than 2500 hectares of arable land, i.e., 4—5000 hectaresgross, will be presented to Provincial Council for public scrutiny and approved before beingfinally recommended for title deeds. Therefore, a company wishing to invest K1,000,000.00in mixed farming will be calculated as follows:
K1,000,000.00 investment = income 250,000.00Ranching = 2000 hectares, which includes 500 hectare development allowancesMixed farming = 1000 hectaresDairy = 100 hectaresHorticulture = 200 hectaresSmall stock = 100 hectares
9. In conclusion we should say that land should be granted in:a. proportion to the investment expected and income anticipated;b. the level of competence of the lender;c. the strategic needs of the province;d. the demographic expectancy of the area in which the land is granted.


Chapter 3:
Agrarian Structure, Land Markets, and Property Transfers
by
Michael Roth, Paula Despins, and Peter Kangwa'
I. Introduction
This chapter assembles and analyzes official time series information on agrarian structure,official property transfers, and issuances of leaseholds in State, Reserve, and Trust Lands. Unofficialdata on property transfers and an analysis of land valuation issues are treated in chapter 4. Data arepresented on the number and size of reported property transfers and land prices paid. Changes inagrarian structure are evaluated to assess net growth in the number and area of farming units by landtenure category, trends in farm size, and growth in demand for leasehold property. The analysis showsthat the number and area of farming units varies widely over time, in part due to changing trends inpopulation settlement and agricultural expansion but also due to unexplainable swings in the data. Ahigh demand for leaseholds is apparent, but most of the demand is originating from properties in theurban and peri-urban areas under residential and commercial uses. Land as collateral is increasingcredit use by the largest farms, but most credit is being funneled to urban and peri-urban propertiesfor mainly nonagricultural uses. The analysis further suggests that capacity limits may be constrainingthe expansion in leasehold issuances. The fact that leasehold activity has plateaued at 2,000 issuancesannually over a reasonably long period of time indicates a sustainable level of demand for registryservices but also possible constraints that warrant investment in surveying and registration capacity.
II. Agrarian structure
A. Land base
Zambia possesses an abundance of natural resources. Of its 75,261,200 hectares nationwide,18.4 percent of the land area is located in game management areas (GMAs), 8.8 percent in state forestreserves, 8.7 percent in national parks, and 1.2 percent in lakes (table 3.1). GMAs along with theother natural resource categories (excluding lakes) are broadly distributed nationwide, but 23.3 percentcan be found in Eastern province, another 21.4 percent in North-Western province, and 15.6 percentin Central province. The predominant share of state forest lands are located in North-Western (36.4percent), Northern (14.4 percent), and Eastern (13.2 percent) provinces, while national park land isconcentrated in Northern province (27.0 percent), followed by Central (16.5 percent), Southern (14.7percent), and Western (13.7 percent) provinces.
Data series on landownership by farms are presented in the second half of table 3.1 for twocategories of farms: (1) MAFF forecast survey data of arable land which, at least in principle, are
' Michael Roth and Paula Despins are, respectively, associate research scientist and graduate research assistant with theLand Tenure Center and Department of Agricultural Economics, University of Wisconsin-Madison. Peter Kangwa is senioranalyst, Lands Department, with the Ministry of Lands, Lusaka.

80
supposed to include commercial farms; and (2) the total area under large-scale commercial farmsreported in the Commercial Production Series. A comparison of columns G and I indicates thatcolumn I cannot be inclusive within G as the area under commercial farms exceeds the MAFF datain certain years. One logical explanation is that the MAFF land reported is only arable land, not thetotal land area of the holding. Column H shows the percentage of arable land area on MAFF farmsrelative to available land outside natural resource reserves, while Column I compares the total landarea under commercial farms in each province with the same.
Outside of the natural resource reserves, an abundant supply of land would seem to beavailable for future expansion of crop and livestock production. Of the 47,244,800 hectares notincluded in state forests, national parks, GMAs, or lakes, only 2.7 percent is occupied by farmingunits based on the MAFF data and 3.2 percent based on the commercial farm series. Assuming, asin chapter 1, that about 13 percent of the nation's land area is potentially arable, then around6,141,800 hectares of land would be available for crop cultivation. Assuming further that the MAFFdata represent arable farmland, then the data suggest that only about 21.0 percent of the arable landbase is currently under crop cultivation, leaving ample scope for agricultural expansion. Furthermore,as reported in chapters 1 and 2, a high percentage of land under commercial farms is underutilized,suggesting that even these figures are overestimates of area under cultivation. Certain provinces (e.g.,the more-remote Northern, Western, and North-Western) experience lower rates of occupation thanothers. Unfortunately, data are not available on areas of urban land, making it difficult to interpretthe data for Lusaka and Copperbelt.
B. Crop land utilization
As described in greater detail in chapter 8, the most recent data on area cultivated for thecommercial farm sector are disaggregated into four provinces—Central, Lusaka, Southern, andCopperbelt, the latter of which includes data for the remaining provinces. The data series for thenoncommercial sector, which in principle include all farms in the agricultural sector other thancommercial farms, were last published in 1985. The MAFF agricultural data series based on areaforecasts theoretically include all farms and, while comprising a relatively complete time series backto 1976, include data mainly on crop area, production, and yields.
Provincial level data on total farming area and cultivated land are provided in table 3.2 forcommercial farms based on the commercial sector data series and all farms (noncommercial andcommercial) based on the MAFF series. Area cultivated in the commercial farm sector represents onaverage only 10.6 percent of total farming area, a figure consistent with the high rates ofunderutilization reported in a recent World Bank study (MAFF/WB 1993) (see chapter 1). Utilizationranges from a low of 3.8 percent in Southern province to a high of 19.2 percent in Copperbeltprovince—estimates that on the surface would appear exactly opposite the regional findings reachedby the MAFF/WB report and summarized in table 1.5.

Table 3.1: Arable land area (000 hectares)
State forest National Game mgmt MAFF Total Land TotalProvince Total land reserves`'` parks` Lake areas' areas' Net total land reported land area area of land
area" (1974) (1974) (1974) (1973) area owned (%) comm. arealand' farms' (%)
A B C D E F =A-B-C-D-E
G H=G/F I J=I/F
Central 9439.4 577.0 1,081.8 - 2170.7 5609.9 150.2 2.7 471.8 8.4Copperbe1t' 3,132.8 585.0 - - - 2547.8 59.4 2.3 125.0 4.9Eastern 6,910.6 887.0 410.2 - 3236.0 2377.4 314.1 13.2 44.3 1.9Luapula 5,056.7 137.0 138.9 409.0 490.2 3881.6 90.7 2.3 6.3 0.2Lusaka 2,189.6 * 600.0** - 1250.0 339.6 36.3 10.7 177.9 52.4Northern 14,782.6 965.0 1,765.5 265.0 1076.7 10710.4 279.2 2.6 0.0 .0North-Western 12,582.6 2,432.0 693.3 - 2964.0 6493.3 55.3 0.9 35.5 0.5Southern 8,528.3 655.0 958.6 248.0 1906.9 4759.8 185.7 3.9 665.4 14.0Western 12,638.6 442.0 893.6 - 778.0 10525.0 117.0 1.1 5.2 .0
Zambia 75,261.2 6,680.0 6,541.9 922.0 13,872.5 47,244.8 1,288.0 2.7 1,531.4 3.2
a. Source: Ministry of Lands, Survey Department, 1993.b. Source: J. Schultz, Explanatory Study to the Land Use Map of Zambia, Ministry of Rural Development, Lusaka, 1974 (adjusted to reflect 1993 MOL figures).c. Source: Schultz, op cit.d. Central province includes some national park area located in Lusaka province.e. Source: USAID, Zambia - Natural Resource Management Projects - Project Amendment, Game Management Area Descriptions, 1993.f. Source: Ministry of Lands, Annual report of the Forest Department, 1987.g. Landholdings on commercial farms as of 30 September 1990, Commercial Farms series.h. MAFF planning division, survey data, 1990.* Essentially nil.** Estimated. Reported under Central province.

82
Table 3.2: Percentage of total farm unit cultivated, 1987-88
Commercial farms All farms (MAFF series)
Totalfarming
area
Cultivatedland
1987-88
Percentcultivated
(%)
Reportedarable
land
Cultivatedland
1987-88
Percentcultivated
(%)1987-88 (ha) 1987-88 (ha)
(ha) (ha)
Central 453,279 59,924 13.2 150,194.2 114,387.0 76.2Copperbelt' 311,506 59,763 19.2 59,395.6 41,590.5 70.0Eastern 314,138.1 273,692.2 87.1Luapula 90,701.3 56,369.5 62.1Lusaka 265,739 30,079 11.3 36,340.1 29,838.8 82.1Northern 279,200.3 177,302.6 63.5North-Western 55,347.5 26,585.1 48.0Southern 601,228 23,136 3.8 185,663.0 160,893.9 86.7Western 117,017.5 93,779.1 80.1
Zambia total 1,631,752 172,902 10.6 1,287,997.6 974,438.5 75.7
a. For the commercial farms, Copperbelt province figures include all other provinces except for those separatelylisted. This is the case for every year except 1990.
Source: Commercial Farm Series Data, 1987-88.
Rates of utilization in the MAFF survey are much higher at 75.7 percent nationwide, but rangefrom a low of 48.0 percent in North-Western province to a high of 87.1 percent in Eastern province.Allowing for grazing uses and land left idle for waste, site of homestead, natural forest, and publicinfrastructure, these figures suggest a fairly high rate of utilization by small farms which dominate theMAFF sampling frame. But conclusions hinge on the definition of "reported arable land," for whichdata provided by respondents are guesses, not estimates taken from area surveys. Furthermore, farmsthat are completely underutilized, as indicated in chapter 1, may very well be due to absenteelandlords who are impossible to locate at the time of the survey.
The extent of farm utilization is also linked with farm size, as indicated in table 3.3. Landutilization in the smallest farm size category (0-79 hectares) is 35.1 percent of the total farming area.Rates of land utilization decline with further increases in farm size: 20.5 percent for the 80-199hectare category, 8.1 percent in the 200-399 hectare category, 14.4 percent in the 400-799 hectarecategory, 12.3 percent in the 800-1,999 hectare category, and 8.8 percent on farms 2,000 hectaresand above.

83
3.3: Percentage of total commercial farm units cultivated by farm size, 191
Farm sizeTotal farming
area (ha)Cultivated land
(ha)Cultivated
(%)
0-79 ha 36,978 12,978 35.180-199 ha 38,655 7,913 20.5200-399 ha 37,468 3,019 8.1400-799 ha 74,192 10,667 14.4800-1,999 ha 304,556 37,554 12.32,000+ ha 1,139,903 100,771 8.8
Source: Commercial Farm Series data, 1987-88.
C. Livestock grazing utilization
Land not in crop production, parks, or forests is not necessarily idle, due to the possibilityof livestock grazing. Table 3.4 recapitulates data on net total land area from table 3.1 and cultivatedarea from table 3.2. In addition, it provides data on the number of cattle held reported in the1984-1985 commercial farm and noncommercial farm series. Jeanes (1986) gives grazingrequirements (per head of cattle) under a wide range of agroclimatic and farm management conditionsbased on a synthesis of research. One head requires 5-8 hectares on munga woodland in upland areasreceiving less than 1,000 mm rainfall, and 6-10 in wetter areas. On dambo land (ranging frompalatable grasses and legumes to sedges), grazing requirements range from 4-8 ha/head depending onsoil acidity. Grazing rates under improved management on upland pasture range from 1-7 ha/headdepending on topography and intensity of forage management. Rough grazing rates in valley areasrange from 4-12 ha/head, 8-16 ha/head in Kalahari sand areas, and 4-8 ha/head in floodplain areas.
Based on these estimates, rates of grazing intensity (i.e., percentage of net land not in forests,parks, lakes, game management areas, or crops that is used for livestock grazing) are calculated forthree hypothetical stocking rates—12 ha/head for low stocking, 8 ha/head for medium stocking, and4 ha/head for high stocking. Lusaka, the second most densely settled province, and Southern province,the heart of the commercial farming sector with the highest land use efficiency (table 1.5), have highlevels of grazing utilization, as expected, even without excluding the normal 5-15 percent of land areathat is usually taken up by roads, buildings, and wasteland. However, Copperbelt province, with thehighest population density nationwide and with substantial land in commercial production, has a verylow grazing intensity even at a very conservative grazing requirement of 12 ha/head. Other provinceshave very low rates of grazing intensity (less than 14 percent at 12 ha/head), in particular, Luapula,Northern, and North-Western provinces. Thus, there appears to be a great deal of variation in thedegree to which potential grazing areas are in fact grazed. It would be speculative to state a priori thatissuing leaseholds to newcomers or opening new stands runs the risk of displacing livestock herdersdue to the very aggregate nature of the data examined. Yet it would be equally negligent to assumethat open areas are "idle" and can be brought into crop, residential, game ranching, or livestock usewithout the risk of displacing current stockholders, particularly in Eastern, Lusaka, and Southernprovinces.
Table 7-88

Table 3.4: Cattle holdings and estimated rates of grazing intensity
Commercial sector Noncommercial
ProvinceNet total Cultivated cattle held, sector cattle
held d
1984-85
Grazing intensityeland areaa land, 1977-88 b
(000 ha) (MAFF series)
1984_85c`
(000 head)(000 head) Low Medium HighBeef Dairy
(A) (B) (C) (D) (E) (F=12 ha/hd) (F =8 ha/hd) (F=4 ha/hd)
Central 5,609.9 114.4 46.2 2.2 112.1 35.0 23.4 11.7Copperbelt 2,547.8 41.6 22.5f ` 16.6f ` 9.3 23.2 15.4 7.7Eastern 2,377.4 273.7 224.6 128.1 85.4 42.7Luapula 3,881.6 56.4 3.3 1.0 0.7 0.3Lusaka 339.6 29.8 51.8 5.1 37.6 366.0 244.0 122.0Northern 10,710.4 177.3 102.4 11.7 7.8 3.9North-Western 6,493.3 26.6 74.1 13.8 9.2 4.6Southern 4,759.8 160.9 148.6 8.7 898.3 275.4 183.6 91.8Western 10,525.0 93.8 311.1 35.8 23.9 11.9
Zambia 47,244.8 974.4 269.2 32.7 1,772.8 53.8 35.9 17.9
a. Total land less State forest reserves, national parks, lakes, and game management areas in table 3.1b. MAFF series from table 3.2.c. Commercial farms data series.d. Noncommercial farms data series.e. GI = (F(C+D+E)±A-B) + 100.f. Copperbelt and others.

85
For many areas of the country, there thus appears to be potential arable land that is notcropped (although perhaps in cattle) and large potential grazing areas that are not grazed. These lowrates of utilization—despite high rates of urbanization—raise fundamental questions about causes,whether due to poor management, more lucrative nonfarm opportunities, or lack of marketinginfrastructure, market access, credit, price incentives, or need. In the present system where lease rentsare low (state sector) or nonexistent (customary sector), there is no disincentive to underutilization.This situation is further exacerbated by resettlement schemes and land allocations on newly openedlands by government where the landholder bears little or no share of the land cost. The land marketshould theoretically act to reallocate underutilized land, but subdivisions and land market controls haveacted to dampen transfers, while there is weak evidence that capacity constraints may be reached interms of processing transfer applications within the ministry. In general, it is disturbing that so muchemphasis is being placed on opening new lands and expanding leasehold issuances when high ratesof land underutilization prevail in the state sector.
D. Type of farming unit
Information on crop area, livestock numbers, and rates of change in land use are evaluatedin detail in chapter 7. Data on number of farms by principal type of farming operation in table 3.5provide a preliminary sense of the importance of various subsections or farm types in the Zambianagricultural economy. Of the 815,326 total farms reporting nationwide, very few (195,841 or 24.0percent) rely solely on cropping operations. The majority have mixed cropping and livestock activitiesor are engaged in commercial activities: 0.1 percent are strictly livestock operations, 2.1 percent arepoultry farms, 4.6 percent are mixed crop and livestock operations, 40.6 percent are mixed crop andpoultry operations, 22.8 percent are mixed poultry and livestock operations, and 5.8 percent arenonfarming operations. Theoretically, one would expect poultry operations to be located nearer tourban centers, and livestock in more extensive rural areas. The evidence in table 3.5 reflects this tosome degree, but generally the various farming enterprises tend to be dispersed among all provinces.
E. Parcel holdings
The previous data on number of farming units disguise the fact that multiple farms or parcelsmay be farmed by one operator. A frequency distribution of number of parcels held by farming units(commercial and noncommercial) in different provinces of the country is reported in table 3.6 for theperiod 1987-88 (two-year average). Of the 737,603 crop growing households reporting, 49.5 percentheld one parcel, 24.9 percent two parcels, 13.2 percent three parcels, 6.3 percent four parcels, 2.8percent five parcels, and 3.2 percent six parcels or more.
The number of parcel holdings appears to be positively associated with population density anddegree of commercialization. In the registered and more peri-urban environments of Copperbelt andLusaka provinces, 91.6 percent and 96.2 percent of farming units, respectively, comprised 2 parcelsor less, reflecting the combined effect of higher land prices and mixed agricultural and residential landuses. Conversely, in the more rural areas of the country, farming units tend to consist of moreholdings: 69.2 percent have two parcels or less in Western province, 61.2 percent Central, 61.0percent Luapula, and 49.3 percent Northern. A high degree of fragmentation is apparent in the Central(11.9 percent of farming units with 6+ holdings) and Northern (6.2 percent) provinces. However, theurban and rural split based on population density is not completely deterministic as threeprovinces—Southern province with many large farms in rural areas (88.4 percent), Eastern province
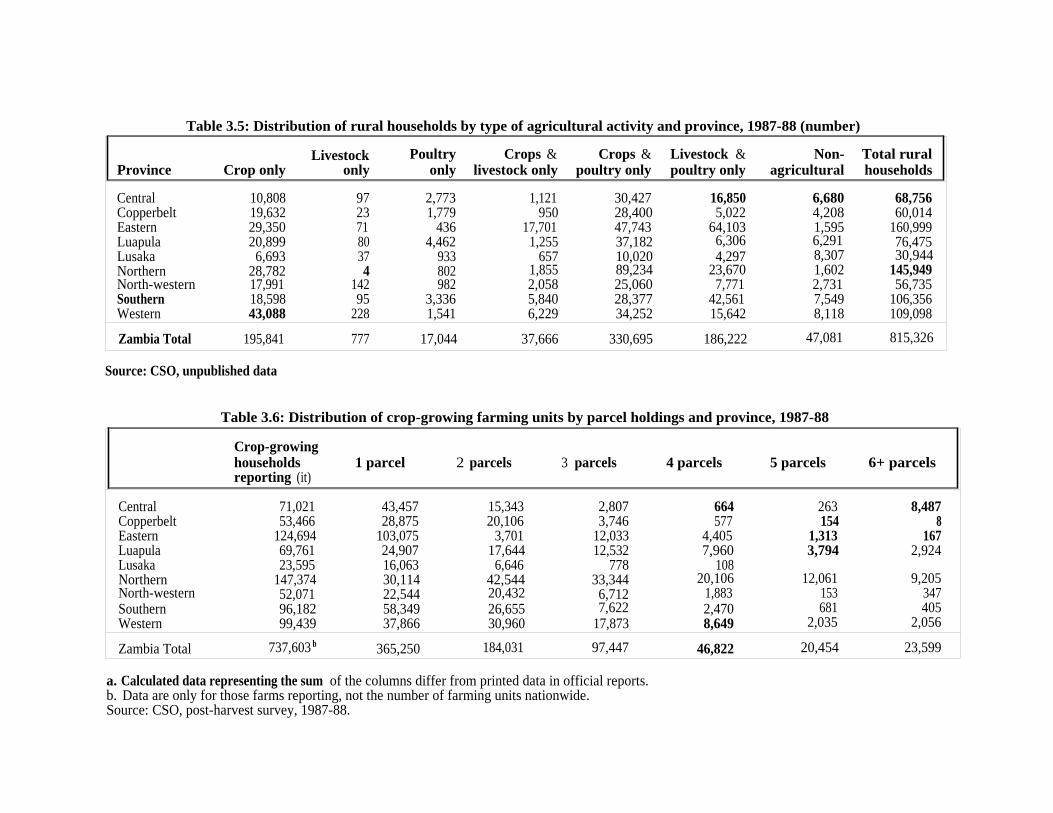
Table 3.5: Distribution of rural households by type of agricultural activity and province, 1987-88 (number)
Province Crop onlyLivestock
onlyPoultry
onlyCrops &
livestock onlyCrops &
poultry onlyLivestock &poultry only
Non-agricultural
Total ruralhouseholds
Central 10,808 97 2,773 1,121 30,427 16,850 6,680 68,756Copperbelt 19,632 23 1,779 950 28,400 5,022 4,208 60,014Eastern 29,350 71 436 17,701 47,743 64,103 1,595 160,999Luapula 20,899 80 4,462 1,255 37,182 6,306 6,291 76,475Lusaka 6,693 37 933 657 10,020 4,297 8,307 30,944Northern 28,782 4 802 1,855 89,234 23,670 1,602 145,949North-western 17,991 142 982 2,058 25,060 7,771 2,731 56,735Southern 18,598 95 3,336 5,840 28,377 42,561 7,549 106,356Western 43,088 228 1,541 6,229 34,252 15,642 8,118 109,098
Zambia Total 195,841 777 17,044 37,666 330,695 186,222 47,081 815,326
Source: CSO, unpublished data
Table 3.6: Distribution of crop-growing farming units by parcel holdings and province, 1987-88
Crop-growinghouseholdsreporting (it)
1 parcel 2 parcels 3 parcels 4 parcels 5 parcels 6+ parcels
Central 71,021 43,457 15,343 2,807 664 263 8,487Copperbelt 53,466 28,875 20,106 3,746 577 154 8Eastern 124,694 103,075 3,701 12,033 4,405 1,313 167Luapula 69,761 24,907 17,644 12,532 7,960 3,794 2,924Lusaka 23,595 16,063 6,646 778 108Northern 147,374 30,114 42,544 33,344 20,106 12,061 9,205North-western 52,071 22,544 20,432 6,712 1,883 153 347Southern 96,182 58,349 26,655 7,622 2,470 681 405Western 99,439 37,866 30,960 17,873 8,649 2,035 2,056
Zambia Total 737,603 b 365,250 184,031 97,447 46,822 20,454 23,599
a. Calculated data representing the sum of the columns differ from printed data in official reports.b. Data are only for those farms reporting, not the number of farming units nationwide.Source: CSO, post-harvest survey, 1987-88.

87
(85.6 percent), and North-Western province with numerous and scattered small farms (82.5percent)—with high land/resident ratios still have a high degree of fragmentation.
These data showing a prevalence of multiparcel farming units justify concerns over any policythat attempts to restrict the number of leaseholds per farming unit or ration leases to individuals whocurrently lack title. Any tenure insecurity, should it be present, would likely apply to all parcelscontaining arable land rather than a single farm within a farming unit. Furthermore, they place inperspective the potential population of lease titles required should the government seek to pursue itsgoal of registering 500,000 to 1,000,000 titles nationwide (chapter 1). Based on the total number offarming units (815,326 rural households) in table 3.5 and 1.5 parcels per household (weighted averagecalculated from table 3.6), the total potential demand for rural leaseholds is 1,222,989.
It seems inconceivable that all these farms or even the majority would require or even wanttitle. This number of potential registrations would sharply increase if strictly urban and commercialuses were included as well (as indicated shortly, the majority of lease issuances are in fact principallyfor residential and commercial uses), but it remains questionable whether these titles should be handledby the MOL. City and municipal councils already operate registries for statutory and improvementareas within their jurisdictions under the Housing (Statutory and Improvement Areas) Act, 1986. Asmunicipal governments are developed and/or strengthened, strong arguments can be made for themunicipal registries to handle the residential and commercial registrations within their jurisdictions,while the MOL retains responsibility for leases in the more rural or extensive areas. This of coursehinges on the state of the registry system and human skills in various municipalities and highlights theneed for a review of alternatives to gradually shift these titles out of the MOL to the municipal level(see chapter 2 recommendations). Further, should the MOL's portfolio be restructured to emphasizerural properties, the above data would suggest that a far more modest scale of registration activitywithin the MOL is justified and even advised given the current bottlenecks being experienced inregistration activities.
III. Current structure, commercial farm sector
The Zambian agricultural economy comprises two principal sectors: commercial andnoncommercial. Farmers were considered commercial in 1987-88 if they had done any of thefollowing in the previous year:
(1) sold to the National Agricultural Marketing Board (NAMBOARD), or any othercooperative union, any crops whose value was equivalent to 150x90 kg bags or moreof maize at the ruling producer price;
(2) grew tobacco in their own name and were registered with the National TobaccoCompany of Zambia Ltd;
(3) sold to the Dairy Produce Board;(4) bred, reared, and/or fattened cattle or poultry and sold them to the Cold Storage
Corporation of Zambia, Poultry Processing Company Ltd, or to any licensed butcher;(5) reared and/or fattened pigs and sold them to the Zambia Pork Products Company, the
Cold Storage Corporation of Zambia, or any licensed butcher or supermarket;(6) bred hybrid poultry; and/or,(7) were state farmers for the Agricultural Division of Zimco and other agencies on a
commercial basis.

88
A noncommercial farm, according to the above criteria, are those farms not selling theminimum quantities to any of the parastatal agencies mentioned. Numbers and areas of commercialfarms (and noncommercial farms as the remainder) would tend to fluctuate from year to year as farmsswing from one sector to the other, depending on whether the threshold quantities are produced orwhether the produce is sold through state or informal channels.
According to data published in the Commercial Farms Series, the distribution of land amongfarms in the commercial sector is highly skewed (table 3.7). Although small farms with 0-199 hectaresaccount for 42.9 percent of total commercial farms in 1989-90, the most recent year for whichcomplete data were available, they control only 2.1 percent of cultivated area in the sector. Incontrast, farms of over 2,000 hectares occupy 65.8 percent of the land even though only 11.4 percentof all farms are of this size. The remaining 31.2 percent and 14.6 percent of farms in the 200-799and 800-1,999 hectare range cultivate 13.5 percent and 18.6 percent of the land in the sector.
Table 3.7: Number and size of farms, commercial farm sector, 1990
Sizecategory
Number offarms
Percent of totalnumber
Area offarms (ha)
Percent of totalnumber
Zambia 0-199 806 42.9 32,363 2.1total
200-799 586 31.2 206,978 13.5
800-1,999 274 14.6 285,102 18.6
2,000+ 214 11.4 1,007,118 65.8
Total 1,880 100.0 1,531,561 100.0
Source: Commercial Farm Series data.
Since 1975, 1990 is the first year in the time series that data are reported for all provinces.Prior to this date, provincial data except those for Central, Southern, and Lusaka regions werecollapsed into the category Copperbelt/Others as illustrated in annex 3.1. Unfortunately, in 1989, datafor farm sizes were reduced from six to four categories: the 0-79 and 80-199 categories became onecategory; and the 200-399 and 400-799 categories were merged into a second new category.Presumably this change was meant to economize on data collection and reporting. Unfortunately,collapsing the two smallest farm categories into one (i.e., 0-199 hectares) will make it difficult tomonitor and assess rates of expansion by the emerging small- and medium-scale commercial farmswhich, as indicated in chapter 1, are reportedly expanding at a rapid pace. Many of these farms are10-20 hectares. By including them with farms up to 199 hectares, it is difficult to assess the extentto which small- and medium-scale farms are affecting the composition of farms in the commercialsector, and the extent to which they are fully being captured in the CSO sampling frame.
Table 3.8 illustrates some important regional differences in the distribution of commercialfarms. In terms of numbers, most are located in the more-densely settled Central (577 farms, 30.7percent of the total), followed by North-Western (500 farms, 26.6 percent), and Southern provinces

Table 3.8: Provincial breakdown of number and size of farms, commercial farm sector, 1990
Size Number of Percent of Percent ofProvince category farms (it) total (%) Area (ha) total (%)
Central 0-199 189 10.1 14,745 1.0200-799 231 12.3 98,544 6.4
800-1,999 88 4.7 107,025 7.02,000+ 69 3.7 251,448 16.4
Total 577 30.7 471,762 30.8
Copperbelt 0-199 93 4.9 5,054 0.3200-799 76 4.0 28,276 1.8
800-1,999 28 0.0 91,765 0.02,000+ 197 1.5 125,095 6.0
Total 10.5 8.2
Eastern 0-199 16 0.9 1,123 0.1200-799 18 1.0 6,990 0.5
800-1,999 4 0.2 3,312 0.22,000+ 3 0.2 32,880 2.1
Total 41 2.2 44,305 2.9
Luapula 0-199 12 0.6 1,612 0.1200-799 11 0.6 4,730 0.3
800-1,999 0 0.0 0 0.02,000+ 0 0.0 0 0.0
Total 23 1.2 6,342 0.4
Lusaka 0-199 97 5.2 6,071 0.4200-799 76 4.0 34,916 2.3
800-1,999 35 1.9 42,744 2.82,000+ 27 1.4 94,215 6.2
Total 235 12.5 177,946 11.6
North-Western 0-199 345 18.4 - -200-799 100 5.3 - .0
800-1,999 50 2.7 - -2,000+ 5 0.3 35,500 2.3
Total 500 26.6 35,500 2.3
Southern 0-199 29 1.5 1,758 0.1200-799 63 3.4 30,288 2.0
800-1,999 97 5.2 132,021 8.62,000+ 82 4.4 501,310 32.7
Total 271 14.4 665,377 43.4
Western 0-199 25 1.3 2,000 0.1200-799 11 0.6 3,234 0.2
800-1,999 0 0.0 0 0.02,000+ 0 0.0 0 0.0
Total 36 1.9 5,234 0.3
National total 1,880 100.0 1,531,561 100.0

90
(271 farms, 14.4 percent). However, in terms of area, commercial farms are most extensive in thesouthern regions (665,377 hectares, 43.4 percent), followed by Central (471,762 hectares, 30.8percent) and Lusaka (177,946 hectares, 11.6 percent) provinces.
Southern province has the majority of the large farms with 38.3 percent of those with 2,000hectares or more and 35.4 percent of those in the 800-1,999 hectare range. Only 3.5 percent of thesmall farms and 10.7 percent of the mid-size farms in 200-799 category are located there however.'Central province has another 32.2 percent of the two largest farm size categories, 39.4 percent of themid-size farms (200-799 hectares), but only 23.4 percent of the small farms. Lusaka and theCopperbelt, which together comprise 23.0 percent of all farms, each have another 10-15 percent ofthe largest farms with Eastern and North-Western provinces each having a few. Lusaka and theCopperbelt are also the most urbanized and densely populated areas of the country with 39.9 and 31.7people per km2 versus less than 10 people per km2 for the rest of the country (CSO 1991). 3 The smallfarms are relatively evenly distributed across regions although North-Western province, which hasonly a few large farms, has 42.8 percent of the farms in the 0-199 category and 26.6 percent of allfarms.
The skewed distribution of farm numbers versus farming area described above is also apparentwhen one examines the regional figures. While most regions have roughly the same percent of totalfarm numbers as total area, North-Western and Southern provinces are exceptions. North-Westernprovince, for example, has 26.6 percent of all farms but only 2.3 percent of the total land base. Incontrast, Southern province which is dominated by large commercial farms has only 14.4 percent ofthe total number of farms but 43.4 percent of the total land area. It, like the Central region, is locatedprimarily in agroecological zone IIA which is characterized by a mean rainfall of 800-1,000 mmannually, 100-140 day growing season, and 5-6 hours of sunshine per day. Despite some soillimitations, it is the primary agricultural area (according to an unpublished report on agroecologicalzones).
IV. Changes over time in farm structure
The change in the number of farms over time has been rather stochastic according to thefigures reported in annex 3.1 on the number of commercial farms by province for the period 1976 to1990. The time series data begin in 1976 with 1,527 farms nationally. One year later, the number
jumps to 2,242, drops again to 1,566 in 1979, before surging again to 1,894 in 1980. A steady declinein the number of farms nationally occurred from 1980 to 1985, when a low of 1,102 was reached. In1986, the reported number of farms rebounded to 1,972 and held steady around the 2,000 markthereafter through 1990. These trends are illustrated in figure 3.1 for national totals and figure 3.3for farms in the 0-79 hectare category. The Copperbelt/Others region seems to have enjoyed a long-term gradual increase in the number of farms. The Central and Southern regions exhibited moreinstability, with a fall in the mid-1970s from which they rebounded again in the mid-1980s. TheCentral region seems to have included Lusaka prior to 1981 which may account for part of the dip
2 See footnote on number of farms over time and Southern province below.] Population densities were calculated based on the 1990 census data and were reported in the CSO 1991 booklet,
" Women and Men in Zambia." The provincial population densities per square kilometer are as follows: Copperbelt, 39.9;Lusaka, 31.7; Eastern, 9.4; Luapula, 8.3; Southern, 7.9; Central, 5.4; Northern, 4.6; North-Western, 3.9; and Western,2.4.

91
in the early 1980s. Annex 3.2 containing data on the area of commercial farms bears this relationshipout as well, particularly for the smallest farm size category (0-79 hectares, figure 3.4). The peaks andvalleys are much more pronounced in the Central and Southern regions despite the fact that, as notedabove, the Southern region only possesses 3.5 percent of the farms in this category and 14.4 percentof all farms.4 .`
Data on number of farms by size category are illustrated in figure 3.5 for the period 1976 to1988. Associated data on farm area over the same period are contained in figure 3.6. The two smallestfarm sizes—0-79 hectares and 80-199 hectares—are experiencing the most volatile changes. The farmsin the 0-79 hectare range are particularly variable in number and clearly seem to account for most ofthe corresponding national jumps and declines. There is a fairly steady decline in their number from1977 to 1985 and then a phenomenal increase in 1986. One possible explanation is a demand responseby small fanners to price and marketing reforms instituted in the 1980s. A more telling butanalytically elusive possibility is the influence of statistical methodology including possible changesin the definitions of commercial farms. Small farms are particularly likely to be overlooked in surveyadministration. They also may fall in and out of the commercial category to the extent that market andclimate characteristics drive their production below the threshold for commercial farms. Overall therehas been an increase: the average number of farms in the two smallest farm sizes increased from 1,023in 1976-78 to 1,214 in 1988-90, a 19 percent increase.
Although the other farm sizes tend to follow the national pattern, their lines are extremelysmoothed vis-a-vis the overall trend line and that for the smaller farms. The largest fluctuation occursin 1985. Farms in the 200-799 hectare range are relatively stable with 372 in 1976-78 and 397 in1988-90, a change of 7 percent. Farms of 800-1,999 hectares are also somewhat constant in numberand seem to escape the sharp decline felt in the other farm sizes in 1985. They have, however,steadily decreased in number over time with 307 on average for 1976-78 and only 256 in 1988-90,a drop of 17 percent. The largest farms, those with at least 2,000 hectares, also decline in numberover time. The low point is in 1985 with 160 farms and the change in the averages from 1976-78 to1988-90 is 14 percent, with 225 and 193 farms, respectively.
Data reflecting changes in the area of farms over time tell a similar story. The area ofcommercial farms in 1976, according to the Commercial Farm Series Data, was 1,877,490 hectares,which is roughly 2.5 percent of the 75,261,167 total hectares in Zambia. As with the number offarms, the area under farming increased dramatically in 1977 to 2,494,960 hectares then fell again in1978 to 1,434,876 hectares. There was another peak in 1980 of 1,861,280 hectares but only 1,298,030hectares in 1981—a major drop from which the sector has yet to recover. By 1984, the area had risento 1,689,083 hectares where it hovered for the next six years. Surprisingly in 1985, when the numberof farms plummeted dramatically, area did not change significantly with 1,661,825 hectares operated.By 1990, 1,531,561 hectares were farmed, 345,929 hectares less than in 1976. In fact, the averagefrom 1976-78 dropped from 1,935,775 to 1,514,233 hectares in 1988-90, a 22 percent decline.Because data from the early to mid-1970s could not be located, it is not clear if this represents asignificant trend towards shrinkage of farm sizes in the sector overall or if the figures for the late1970s were simply anomalous.
° Note that the 3.5% figure is taken for 1990 when only 29 farms were reporting. However, in 1989, 415 farms werereporting, a drop of 386. In fact, the decline in total number of farms from 2,185 to 1,880, a difference of 305, seems tobe largely attributable to the change in this region.

92
Figure 3.1: Number of total farms by province, 1976-1990
2500
1976 1978 1980 1982 1984 1986 1988 19901977 1979 1981 1983 1985 1987 1989
Year Ending
-0- Central -}- Copperbelt -- Southern
-e- Lusaka -- Total
Figure 3.2: Area of total farms by province, 1976-1990
0 I T1976 1978 1980 1982 1984 1986 1988 1990
1977 1979 1981 1983 1985 1987 1989Year Ending
-+- Central --- Copperbelt - Southern
-8 -- Lusaka -'f- Total
2.5
2
0.5

93
Figure 3.3: Number of 0-79 ha farms by province, 1976-1988a
1200
1000
800
600
-0- Central --w- Copperbelt --- Southern
-8- Lusaka -u-- Total
a. Copperbelt province includes unlisted provinces.
Figure 3.4: Area of 0-79 ha farms by province, 1976-1988
. –NgWomb-
■f = . ~...
1976 1978 1980 1982 1984 1986 19881977 1979 1981 1983 1985 1987
Year Ending
- a-- Central -+- Copperbelt --w- Southern
~- Lusaka -w- Total
400
200
091 76 1978 1980 1982 1984 1986
1977 1979 1981 1983 1985 1987Year Ending
1988
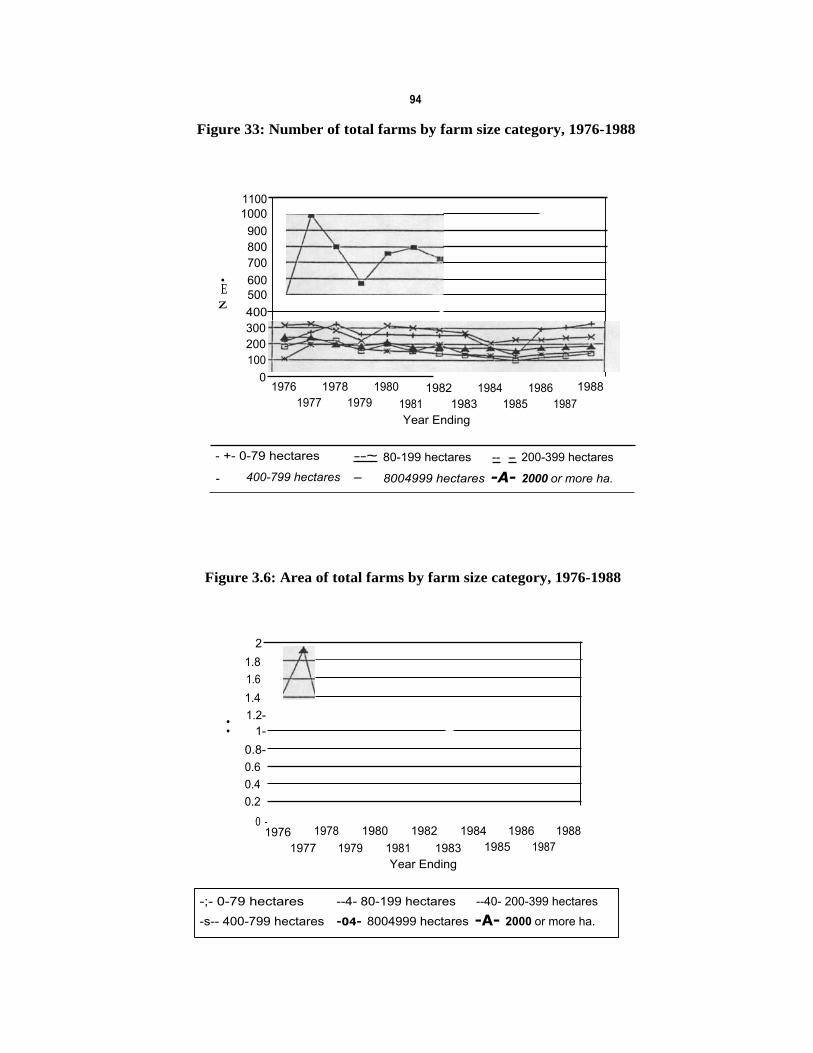
94
Figure 33: Number of total farms by farm size category, 1976-1988
- +- 0-79 hectares --~ 80-199 hectares -- - 200-399 hectares
- 400-799 hectares - 8004999 hectares -A- 2000 or more ha.
Figure 3.6: Area of total farms by farm size category, 1976-1988
21.81.61.4
• 1.2-• 1-
0.8-0.60.40.2
0 -1976 1978 1980 1982 1984 1986 1988
1977 1979 1981 1983 1985 1987Year Ending
-;- 0-79 hectares --4- 80-199 hectares --40- 200-399 hectares
-s-- 400-799 hectares -04- 8004999 hectares -A- 2000 or more ha.
11001000
900800700
• 600500400300200100
01976
Ez
19881978 1980 1982 1984 19861977 1979 1981 1983 1985 1987
Year Ending
Q-

95
The average area of the small farm sector (0-199 hectares) was 43,890 hectares for 1976-78but rose to 65,326 hectares in 1988-90—an increase of 49 percent. Much of this increase was fromsmaller farms (0-79 hectares) which had risen from an average of 20,231 hectares in 1976-78 to33,942 in 1985-87, a dramatic increase of 67 percent. The increase over the corresponding period forfarms in the 80-199 range is 55 percent. The only major fluctuation was 1985 when both farm sizesshrunk to nearly half the area they had in 1983. In contrast, the area controlled by farms with 2,000hectares or more was very stochastic as shown in figure 3.4. Overall, the largest farms shrunk in areafrom 1,381,623 hectares in 1976-78 to 1,016,766 hectares in 1988-90, a decline of 26 percent.
V. Private transfers
The land market is the mechanism by which farming units change in number and size. Dataon official transfers, i.e., transactions in leasehold properties and other legal transfers under theoversight of the MOL, are quite limited in scope and duration. The information that is available isreviewed below in section VI. The data on private transfers analyzed in this section have been takenfrom the commercial farm series collection for the period 1976-1990, formally known as the AnnualCensus of Agricultural and Pastoral Production. 5 There is no indication how many of the transfersreported in the commercial farm surveys have also been registered with the MOL. Accordingly, noattempt will be made to formally reconcile the two sets of data.
The 1988-90 three-year averages indicate a relatively low level of land market transfers forthe region (table 3.9). With regard to annual figures for Zambia as a whole, roughly 9,198.6 hectares(0.7 percent of the total land area) were purchased and 29,264.0 hectares (2.1 percent) were rented-inor leased-in, 6 compared with purchases of around 4.0 percent per annum in the Republic of SouthAfrica (Roth et al. 1993). There is, however, a discrepancy between the amount purchased and theamount sold and similarly between the amount leased-in and the amount leased-out. Normally onewould expect the land-in and land-out figures to be roughly equal. As leases not fully utilized can bereassigned or claimed by outsiders, there is some incentive to underreport rental data. Also absenteelandlords would not usually lease-out land, particularly to outsiders. Further, they would be the mostdifficult group to locate should underreporting be a serious problem in survey design. Unfortunately,it is impossible to ascertain the determining factors from the data provided.
Most of the land market activity is occurring in Southern province with 60.9 percent of thepurchases nationwide and 40.9 percent of the leases. Copperbelt comprises 22.3 percent of thepurchases but only 4.4 percent of the leases which may be accounted for by the presence of manysmall farms in this region, although Lusaka province (also with many small farms) has figures of 8.8percent and 26.7 percent, respectively. Central province has 8.1 percent of the purchases and 28.0percent of the leases.
6 Only area figures are reported. There is no information on the number of transfers.6 Hereafter "lease" shall stand for lease or rental transactions. The data for most years does not distinguish between the
two, so this report shall avoid doing so as well.

96
Table 3.9: Private transfers, commercial sector, 1988-90 average (hectares)
Land ownedat start of Purchases
year
Ratio ofpurchases
to landarea
Rented-in/leased-in
Rentalmarket/land
area ratio
Rented-out/leased-out Sales
Central0-199 18,863.7 73.3 0.4 1,077.3 5.7 65.7 0.0
200-799 64,081.0 667.7 1.0 2,151.3 3.4 62.3 0.0800-1,999 13,840.7 0.0 0.0 3,905.7 3.4 15.7 2,643.7
2,000 or more 206,957.7 0.0 0.0 1,045.3 0.5 0.0 0.0Copperbelt & others
248.7 1.1 267.7 1.2 138.7 0.00-199 22,956.3200-799 29,039.0 0.0 0.0 1,017.0 3.5 95.3 0.0
800-1,999 21,422.0 1,800.0 8.4 0.0 0.0 0.0 0.02,000 or more 170,442.7 0.0 0.0 0.0 0.0 493.7 480.0Lusaka
0-199 5,920.7 60.0 1.0 926.7 15.7 99.3 8.3200-799 25,247.0 750.3 3.0 1,564.3 6.2 0.0 500.7
800-1,999 65,189.3 0.0 0.0 0.0 0.0 0.0 0.02,000 or more 125,811.7 0.0 0.0 5,333.3 4.2 0.0 0.0Southern
17,585.7 173.3 1.0 322.0 1.8 0.0 122.00-199200-799 24,214.7 2,168.0 9.0 93.3 0.4 22.0 91.3
800-1,999 89,106.7 0.0 0.0 7,103.0 8.0 46.3 0.02,000 or more 513,554.3 3,257.3 0.6 4,456.7 0.9 1,172.3 928.7Zambia total
65,326.0 555.0 0.8 2,594.0 4.0 304.0 130.00-199200-799 142,582.0 3,586.0 2.5 4,826.0 3.0 180.0 592.0
800-1,999 189,559.0 1,800.0 0.9 11,009.0 6.0 62.0 2,644.02,000 or more 1,016,766.0 3,257.0 0.3 10,835.0 1.0 1,666.0 1,409.0
Total 1,414,233.0 9,198.0 0.7 29,264.0 2.0 2,212.0 4,775.0
Land purchases, relative to total area, were concentrated in the 200-799 hectare and 2,000plus hectare ranges with 40.0 percent and 35.4 percent of the area transferred respectively nationwide.Of the total land area in the 200-799 hectare size category (142,582 hectares), 2.5 percent waspurchased and 3.4 percent was leased-in. Land markets appear to be particularly dynamic in theSouthern region, where a full 9.0 percent of the land base in this farm size category was purchased.In the Copperbelt/Others region, 8.4 percent of the land base of 800-1,999 hectare farms waspurchased, despite the fact that the earlier analysis indicated that small farms were changing the mostin number. Moreover, as seen above, the area occupied by large farms over 2,000 hectaresexperienced the greatest change, yet only 0.3 (0.1) percent of the land base of the largest farms wasreported purchased (sold), and another 1.0 (0.1) percent was reported as leased-in (leased-out). A veryhigh proportion (15.7 percent) of Lusaka's total land base was leased-in by farms in the 0-199 hectarecategory. The 0-199 hectare farms in every province appear to be most active, usually with 3-6percent of their area being transferred each year.

97
The area purchased dropped dramatically during most of the early to mid-1980s with severalyears of 0 hectares purchased in each of the provinces (annex 3.3). It is not clear whether this is dueto reporting error or structural changes in the land market. In Central province, 11,593.6 hectaresover 1976-78 were purchased on average, which was 1.36 percent of the land base, while only2,223.0 hectares were purchased on average in the 1988-90 period, a decline of 80.8 percent despitefar less change in total farm area. Similarly, purchases in the Copperbelt/Other region averaged12,327 hectares for 1976-78 but dropped to 2,048.6 hectares per annum by the 1988-90 period—an83 percent decline. The change in purchases for Lusaka could not be measured over the same perioddue to missing data, but there was a drop from the 1981-83 average of 4,221.6 hectares to an averageof 810.3 hectares in 1988-90. Southern province, in contrast, had only 174.3 hectares purchased onaverage in 1976-78 but had 5,598.6 hectares purchased per annum in 1988-90. No purchases werereported for several years. Small farms in all provinces, described in table 3.10, exhibit the sametendencies with 0 hectares purchased in 1983 and 1987 and under 20 in 1985 and 1986.
Table 3.10: Small farms (0-79 ha), private transfers, 1981-1990
1981 1982 1983 1984 1985 1986 1987 1988
Number of farms 798 722 560 503 366 1,024 1,035 1,070
Land owned at start of year (ha) 20,215 20,597 18,460 13,281 10,368 33,909 36,216 31,703
Purchases (ha) 246 223 0 241 17 19 0 444
Rented/leased-in (ha) 1,479 1,586 1957 4,080 1,885 185 995 1,530
Sold (ha) 785 0 0 0 0 0 233 366
Rented/leased-out (ha) 95 31 193 142 12 422 0 0
Land operated 21,060 22,375 20,224 17,460 12,258 33,691 36,978 33,311
Difference between operated & owned 845 1,778 1,764 4,179 1,890 -218 762 1,608
The amount of hectares leased also suffered a decline during the 1980s and an overall declinefor the data period. Comparing the periods 1976-78 with 1988-90, the leased-in area of 62,313.3hectares in 1976-78 declined to 8,179.6 hectares in Central province; from 74,347.6 hectares to1,284.6 hectares in the Copperbelt/others; from 75,537 hectares to 11,975 hectares in Southernprovince; and a less dramatic 8,776.3 hectares (1981-83) to 7,824.3 in Lusaka, despite the fact thatland area in the sector remains relatively constant.
Overall, land purchases tend to be undertaken by farms in the larger farm size categories(800-1,999 and 200-799 hectares) and principally in Southern and the Copperbelt/Other provinces.Leasing-in tends to be more common on farms less than 2,000 hectares, and particularly on thesmallest farms in Lusaka province (0-199 hectares, 15.7 percent) and Southern province. In contrast,sales and leasing-out tend to be widely dispersed among all provinces and, on the basis of area, tendto be concentrated in the larger farm size categories. These data further suggest a land market that,while quite important in the commercial sector, is still constrained compared with other countries inthe region. Most farms appear to renting-in land from other individuals or groups that fall outside the

98
commercial farm definition, either absentee landlords or chiefs, although the cause remains anempirical question. Large farms over 2,000 hectares do not lease-in appreciable quantities of land.While this is not surprising, it is somewhat unexpected that they do not lease-out significant quantitieseither.
Most intriguing is the drastic decline in land purchases and leases over time compared witharea, especially given the fact that land market controls appear to have eased considerably since the1975 Conversion Act (see p. 16) was adopted. It is not a matter of simply underreporting, as total landarea is rising slightly. It is possible that high land transfer fees and MOL bottlenecks in the late 1980shave begun to exact a toll on volume of transfers. The late 1970s and early 1980s was also a periodassociated with "white flight" following independence, and the volume of transfers may haveexperienced an upward surge as a result. Tenure insecurity may also be affecting transfers in certainregions. Finally, the shrinkage in the large farm sectors over time and the expansion of smaller farmsmay have simply moved purchases and rentals out of the sampling frame. None of these explanations,either individually or collectively, is satisfactory. Field-level research will be required if thesequestions are to be sorted out.
Given the apparent increase in small- and medium-scale commercial farms, one would haveexpected: (1) a much more rapid growth in the number of small farms (0-79 hectares) than isobserved in annex 3.1; and (2) a greater number of land purchases and/or leasing by this group. Whileland markets appear to very dynamic in certain peri-urban settings (e.g., Lusaka), this does not seemto be the case in other areas. In fact, the wild swings from zero to thousands of hectares suggestfundamental problems. First, the current data-collection methodology is underreporting land transfersby existing farms. Second, the rapid expansion of new commercial farming units is not being capturedin survey designs; in fact, there is little indication of it in the data. Unfortunately, lack of data on landtransfers in the noncommercial sector limits insight into the sources of land for the lease and purchasemarkets being reported, the expansion of farms that is ostensibly occurring, or the mechanisms usedto acquire land.
VI. Official land transfers
The MOL routinely maintains records for at least twelve categories of official land transfersin Zambia:
► Assignment: the sale of registered and unregistered property usually involving a price. From1975 to 1992, the government set values through the Government Valuation Department orvia other appraisals. Prices have been market determined since 1992.
► Assignment of subdivision (or simply subdivision): the transfer of a portion of a plot of land,usually involving a price.
► Transfer: official change in ownership that occurs through inheritance or gift, usually withouta value ascribed.
► Deed of gift: transfer declared as a bequest or gift, usually with no value attached.
► Reserve lease: lease issued on Reserve Land.

99
► State lease: lease issued on State Land.
► Right of occupancy: lease issued on Trust Land.
► Sublease: sublease on either State, Trust, or Reserve Land.
► Deed of guarantee: lien placed on property by building societies or other official agencies,guaranteed by the Ministry of Finance.
► Mortgage: lien placed on property by banks or other formal lending institutions for long-termcredit involving land or fixed land improvements.
► Surrender: voluntary surrender of a lease. This may mean either giving up a lease orconverting from an unsurveyed 14-year lease to a surveyed 99-year lease.
► Reentry: repossession of a leasehold because the lease conditions are not met (e.g., the rentis not paid or the plot is not developed).
Data for all transfers are recorded and filed on a computerized database maintained in theMOL. Efforts to construct the computerized database began in 1990. Data on leases were automatedback to roughly 1987, but the reliability of the data is questionable as there is no guarantee ofcompleteness in data entry. To conserve time, the decision was made to omit entering data onmortgages and offers prior to 1990. In the ministry's current usage, assignments, transfers, subleases,mortgages, and deeds of guarantee all refer to leasehold property. Under the Lands Department'scurrent practices, there is no dealing in land held under customary law (e.g., areas of Reserve Land).All categories are theoretically unique in that no transfer is allowed to be included in more than onecategory. The extent to which mutual exclusivity is maintained is difficult to assess, but, on thesurface, records since 1990 appear well maintained thanks in large part to assistance provided bySIDA in computerizing records.
A. Regional distribution of transfers
Detailed data for the period 1990 to 1993 (July) are reported for total number of transfers,total area of transfers, average area transferred, and the average price (only for assignments,subdivisions, deed of gift and transfers) in annex 3.4 for property transfers, annex 3.5 for leaseissuances, annex 3.6 for reentries and surrenders, and annex 3.7 for liens and mortgages. Percentagesof each type of transfer by region, and total number and area of leases nationwide are reported in table3.11.
The level of activity is very similar to that found above for private transfers which suggeststhat private and official markets are picking up the same dynamics, or the two markets are in factpartially inclusive. Between the period 1 January 1990 and 31 July 1993, the government issued 6,013state leases, 98 reserve leases, 237 rights of occupancy, conducted 2,972 assignments, and 215subdivisions. Moreover, 530 leaseholders voluntarily surrendered their leases, while the government

Table 3.11: Regional disaggregation of principal property transfers and leases in the commercial sector, 1990-93average
Percentage ofnumber of leases
Assign-ments
Sub-divisions
Reserveleases
Right ofoccupancy State lease Subleases Transfer Mortgage Re-entry Surrender
Central 0.0629 0.0372 0.3776 0.2363 0.0891 0.0290 0.0576 0.1378 0.1225 0.1038Copperbelt 0.3183 0.0651 0.3163 0.0886 0.2074 0.1739 0.0976 0.2616 0.1624 0.1491Eastern 0.0242 0.0093 0.0306 0.0464 0.0717 0.0145 0.0277 0.0301 0.0085 0.1113Luapula 0.0111 0.0000 0.0000 0.1730 0.0338 0.0000 0.0154 0.0078 0.0057 0.0132Lusaka 0.5182 0.8558 0.0612 0.0338 0.3627 0.7101 0.7040 0.4069 0.5869 0.4528Northern 0.0074 0.0000 0.0204 0.2700 0.0397 0.0000 0.0062 0.0236 0.0142 0.0453North-Western 0.0027 0.0000 0.0000 0.0844 0.0230 0.0000 0.0051 0.0039 0.0000 0.0094Southern 0.0505 0.0326 0.1429 0.0633 0.1074 0.0725 0.0771 0.1206 0.0684 0.0868Western 0.0047 0.0000 0.0510 0.0042 0.0652 0.0000 0.0092 0.0078 0.0313 0.0283
Total No: Leases 2972.00 215.00 98.00 237.00 6013.00 69.00 973.00 3092.00 351.00 530.00
Percentage ofArea of Leases
Assign-ments
Sub-divisions
Reserveleases
Right ofoccupancy
State leasesSubleases Transfer Mortgage Re-entry Surrender
Central 0.4696 0.5354 0.3039 0.2728 0.2880 0.0001 0.2564 0.3330 0.5012 0.1622Copperbelt 0.0766 0.0015 0.2551 0.1086 0.1613 0.0008 0.2430 0.2742 0.0965 0.2275Eastern 0.0110 0.0040 0.0074 0.0286 0.0445 0.0061 0.0520 0.0203 0.0483 0.0165Luapula 0.0021 0.0000 0.0000 0.1284 0.0094 0.0000 0.0055 0.0094 0.0000 0.0197Lusaka 0.1637 0.2141 0.0620 0.0858 0.1573 0.0045 0.1676 0.0673 0.2870 0.3658Northern 0.0096 0.0000 0.0133 0.2295 0.0394 0.0000 0.0092 0.0132 0.0269 0.0411North-Western 0.0000 0.0000 0.0000 0.1006 0.0026 0.0000 0.0001 0.0003 0.0000 0.0001Southern 0.2581 0.2451 0.3410 0.0447 0.2835 0.9886 0.2604 0.2816 0.0400 0.1671Western 0.0092 0.0000 0.0173 0.0010 0.0139 0.0000 0.0058 0.0006 0.0001 0.0001
Total No: has 118329 6368.11 37770.95 58108.45 154164.7 2966.8 46286.52 752729.3 25303.32 55772.86
a. Data was only available through July of 1993.

101
repossessed 351 leases. Without knowing the total number of leases issued nationwide, it is difficultto evaluate the magnitude of these transfers, but, given the evidence presented in the earlier section,the volume of assignments and subdivisions would seem very low.'
Much of the activity in assignments, transfers, and subdivisions was in peri-urban areas. WhileCopperbelt (32 percent) and Lusaka (52 percent) had the majority of assignments, the main farmingregions of Central (47 percent) and Southern (26 percent) had the majority of the area transferred.With regard to subdivisions, Lusaka had 86.0 percent of the number but only 21 percent of the area.It also had 70 percent of the transfers but only 17 percent of their area.
State leases and subleases also seemed to be issued to small farms and properties in peri-urbanareas with the majority occurring in the Lusaka, Copperbelt, and Northern regions while Central andSouthern regions again dominate in area. Lusaka has 71 percent and Copperbelt 17 percent of thesubleases implying mainly the residential and commercial character of leases in these regions(reviewed shortly). Reserve leases and rights of occupancy seem, however, to have been issued foragricultural properties in Central, Copperbelt, and Lusaka. The greatest number of reentries andsurrenders appears to be occurring in the more urban and residential areas of Lusaka (58.7 percentof reentries, 45.3 percent of surrenders), Copperbelt (16.2 percent, 14.9 percent), and Central (12.2percent, 10.4 percent) provinces, roughly in accord with the regional distribution of state leases, butthe high percentage for Lusaka suggests the possibility of greater enforcement of land use conditionsdue no doubt to the close proximity of the region to government and the central registry.
Lusaka had 40 percent of the number of mortgages placed on leases but only 7 percent of thearea under mortgages, which clearly indicates the majority of these loans are going for small, peri-urban properties. The Central (14 percent), Southern (12 percent), and Copperbelt (26 percent) regionsseemed to have received some loans for larger agricultural properties with 33 percent, 28 percent, and27 percent of the area respectively. Average sizes reported in table 3.12 are particularly large in theCentral region with 1,396.1 hectares for deeds of guarantee and 588.4 hectares for mortgages, thelargest of any region. Southern province also reported a 568.3 hectare average size for mortgagesalthough no deeds of guarantee were issued there during the reporting period. The low numbers ofsuch issuances vis-a-vis mortgages bears this out. Nonetheless, the larger farms in these two provincesseem to be able to access formal channels of credit more easily than smaller farms.
These conclusions about the type and distribution of transfers are borne out by table 3.12,which reports the regional disaggregation of land values and sizes transferred in the commercialsector. The average size of all transactions in Lusaka was uniformly small with the exception ofreserve leases (390.2 hectares) and rights of occupancy (622.9 hectares). In contrast, the areastransferred for the Central and Southern regions were substantial ranging from 165 to 1,396 hectaresand 42 to 587 hectares respectively. These numbers are particularly interesting for the deed of gift andtransfer categories with very large parcels (roughly 200 to 1,000 hectares) being offered for no price.Nonetheless, as reported in annex 3.4 on the figures for transfers from 1990-93, the average size ofall four categories of transfers ranged from only 16-93 hectares.
7 The issue of rent payment aside, the volume of reentries appears quite high. However, considering the low paymentrates on lease, the MOL through enforcement of lease rents could justify a much higher rate.

Table 3.12: Regional disaggregation of land values and sizes transferred in the commercial sector, 1990-93a
Average sizeof transfer Assign- Sub- Deed of Reserve Right of State Sublease Transfer Deed of Mortgage Re-entry Sur-(ha) ments division gift lease occupancy lease guarantee render
Central 297.15 426.18 217.83 310.18 283.11 82.84 0.15 211.91 1396.09 588.35 294.93 164.50
Copperbelt 9.58 0.67 2.54 310.84 300.52 19.94 0.19 118.40 5.98 255.13 42.86 160.59
Eastern 18.09 12.64 0.76 93.67 151.04 15.93 18.00 89.16 0.00 164.63 407.35 15.56
Luapula 7.70 0.00 0.08 0.00 181.98 7.14 0.00 16.82 250.00 296.37 0.21 156.60
Lusaka 12.58 7.41 7.43 390.23 622.94 11.12 0.27 11.32 7.08 40.27 35.25 85.01
Northern 51.66 0.00 0.00 251.19 208.38 25.45 0.00 71.28 0.00 136.32 136.03 95.50
North-Western 0.58 0.00 0.02 0.00 292.42 2.93 0.00 0.79 0.00 16.46 0.00 0.97
Southern 203.57 222.96 344.84 919.89 173.03 67.64 586.59 160.70 0.00 568.31 42.15 202.64
Western 78.18 0.00 0.00 131.00 57.18 5.47 0.00 30.04 0.00 20.13 0.22 0.23
Average land Averagevalue/price Assign- Sub- land Assign- Sub-(K,000/ha) ments division Transfer value/price ments division Transfer
(K000/ha)
Central 6.57 0.13 0.04 Northern 19.94 0.00 0.11
Copperbelt 193.78 912.91 0.21 North- 1997.83 0.00 0.00
Eastern 59.62 31.46 0.01
Western
Southern 5.48 4.18 0.03
Luapula 38.71 0.00 0.20 Western 3.28 0.00 0.00
Lusaka 251.28 62.66 5.04
a. Data was only available through July of 1993. Average size of transfer was calculated by summing the number of transfers in each category across 1990-93 and summing the numberof hectares across the same period and dividing. Average value was calculated in the same manner.

103
B. Average values
Lack of data obscures the numbers for average value of land reported in table 3.12. There ismuch disparity in average land prices across regions. It is clear from a comparison of average sizevis-a-vis average value that the far higher prices for Copperbelt, Lusaka, and North-Western generallyrepresent transactions in urban land with its higher value. The few transactions over the reportingperiod in North-Western province, in all likelihood involving urban land, resulted in an average valueof K1,997,830 for assignments versus K251,280 for Lusaka and K6,570 for Central province. Noclear pattern is evident except that subdivisions and assignments have a higher average price thantransfers and deeds of gifts (see also annex 3.4). Even adjusting for inflation via the consumer priceindex (CPI), the real price of assignment and subdivision appear to have increased in real terms from1990 to 1993 and increased more dramatically than the other categories. Prices for transfers arenegligible for the most part with the exception of Lusaka where the average price was K5,040.
C. Lease issuances
The number, aggregate, and average areas of leases reported in annex 3.5 are much largerthan those for transfers but appear to also be relatively static, suggesting the presence of supplyconstraints. Most lease activity seems to involve peri-urban properties, although there is someheterogeneity across lease types. State leases tend to be issued to smaller, peri-urban properties.Reserve and rights of occupancy, however, are most often going for agricultural land. According tothe data reported in annex 3.5 on lease issuances from 1990-93, state leases dominate with 1,397(52,761 hectares) issued in 1993 (partial year) versus 65 (15,424 hectares) rights of occupancy andonly 17 (5,163 hectares) reserve leases. The average areas for state leases are much smaller than forthe other categories, with approximately 22 hectares in 1990 and 38 hectares in 1993, which againsuggests peri-urban activity. Significantly, 36 percent of state leases were issued in Lusaka and 21percent in the Copperbelt. The largest amounts in terms of area were in the Central and Southernregions, although these were still only 82.8 and 67.6 hectares in size respectively. Subleases are alsovery small with the exception of those in the Southern region which are unusually large at 586.6hectares. This region in fact has 99 percent of the area of subleases though only 7 percent of the totalnumber. As noted above, this region has a disproportionate number of the largest farms.
Reserve leases in contrast had average areas of roughly 300 hectares for three of the four yearsin question. Rights of occupancy are also very large in general with an average area of 150 hectaresor more, mostly between 200-300 hectares. According to table 3.11, the main farming regions ofCentral, Southern, and Copperbelt provinces lead, in area terms, in the issuance of reserve and rightof occupancy leases. While Luapula and North-Western provinces listed no reserve leases over theperiod, Southern province had a reported average size of 919.9 hectares. Central, Copperbelt,Northern, and Lusaka provinces had sizes between 250 and 400 hectares. The 390.2 hectares reportedfor Lusaka is particularly surprising given the urbanized nature of the province and the small (6-8percent) number of the leases occurring there. Without the data on distribution of Reserve, State, andTrust Lands across provinces, it is difficult to say more about the reasons for dominance of oneprovince or another in lease types.
The reentries and surrenders reported in annex 3.6 are significantly larger than the state leasesizes, indicating that most of these are occurring on Reserve and Trust Lands or are reentries of largerstate leaseholds issued in prior years. The ratio of reentries and surrenders to lease issuances is high.In 1992, the ratio of lease issuances to reentries was 21:1 and the ratio of lease issuances to surrenders

104
was roughly 9:1. In 1991, the equivalent ratios in terms of area were 13:1 and 5:1. As stated earlierwith respect to rates of utilization, it seems remarkable that the government and donors are pushingto expand the number of leaseholds at the same time that reentries are climbing.
D. Mortgages and the credit market
According to annex 3.7, mortgages showed more change than the other official transfers: 905were issued in 1990, 825 in 1991, and 784 in 1992. The major change in area occurred between 1990and 1991 when the area shrunk to half its previous size, from 364,041 to 145,827 hectares. Data notreported here from the MOL indicate that 71 percent of the mortgages (numbers) involved parcels ofless than 6 hectares. Unfortunately records are not computerized on the value of mortgages, butconceivably these figure would be misleading as large farms, while having few mortgages, couldcapture a large share of the total volume of credit as indicated in chapter 1. Given the greater tenuresecurity associated with 99-year leases compared with 14-year leases, one would expect a strongassociation between mortgages and lease duration. Of a total of 1,285 mortgages over the period 1January 1990 to 31 July 1993 on 14-year and 99-year leases, the vast majority of the leases wererecorded on State Land (95.1 percent), followed by rights of occupancy on Trust Land (3.3 percent),and reserve leases (1.6 percent). With regard to duration of leases, the majority are issued for 99-years(84.0 percent) followed by 14-year leases (16.0 percent). Care should be taken in interpreting thesenumbers as 99-year leases tend to be highly correlated with state leases which tend to be located onbetter lands with superior access to input and credit markets. Leaseholders also tend to be betterestablished with perhaps superior ability to overcome information and transaction costs associated withtaking out a mortgage. These factors would tend to skew mortgages toward state leases, most of whichare 99 years.
VII. Land use
The land use data contained in table 3.13 bear out earlier conclusions about the types of usesdominating various transfers. For all types of transactions, residential uses overshadow other useseverywhere but the major farming regions of Central and Southern provinces. The majority of officialtransfers (assignments, subdivisions, and transfers) in 1990-93 were for residential uses with exceptionof Central province. In Copperbelt province, they accounted for 62 percent, Luapula 67 percent,North-Western 85 percent, Western 52 percent, Lusaka 50 percent, Eastern 42 percent, Northern 39percent, and Southern 33 percent. Commercial uses accounted for another 20-30 percent inCopperbelt, Eastern, Luapula, Southern, and Western provinces. Agriculture was the major use onlyin Central province at 60 percent, but did account for roughly 30 percent in Eastern, Northern,Southern, and Lusaka provinces. Industry was less important, with only 1-5 percent of transfersoccurring in that land use (with the exception of Northern province, where 18 percent of the transfersinvolved industrial properties).
Residential uses figured importantly in lease issuances during this period in all the provincesbut particularly North-Western, Luapula, Western, and Eastern areas, with approximately 60-75percent of their lease issuances. Agricultural uses accounted for 30-35 percent of lease issuances inCopperbelt, Lusaka, Northern, and Southern provinces and 46 percent in Central province. InSouthern province, 20 percent of the leases were issued for properties classified as "other." There isno indication as to what might be included in this category. Commercial uses accounted for 7-10percent of all leases except for Luapula, where 17 percent of leases were for commercial properties,

Table 3.13: Percentage of transfers, by land use and province
Residential Commercial Industrial Agriculture Other Total number
Transfers (includes assignments, subdivisions, and transfers)Central 0.2470 0.1315 0.0120 0.6016 0.0080 251Copperbelt 0.6181 0.2000 0.0353 0.1113 0.0353 1,105Eastern 0.4158 0.2772 0.0198 0.2871 0.0000 101Luapula 0.6667 0.2292 0.0208 0.0417 0.0417 28Lusaka 0.4972 0.0992 0.0533 0.2845 0.0658 2,309Northern 0.3929 0.1429 0.1786 0.2857 0.0000 28North-Western 0.8462 0.1538 0.0000 0.0000 0.0000 13Southern 0.3319 0.2155 0.0129 0.3276 0.1121 232Western 0.5217 0.2609 0.0000 0.2174 0.0000 23Total Number 2,078 584 176 1,051 221 4,110
Leases (includes reserve leases, rights of occupancy, and state leases)0.0111 0.4658 0.0223 629Central 0.4308 0.0700
Copperbelt 0.4904 0.0978 0.0446 0.3364 0.0308 1,299Eastern 0.7079 0.1348 0.0270 0.1056 0.0247 445Luapula 0.5943 0.1721 0.0082 0.1885 0.0369 244Lusaka 0.4333 0.0970 0.0907 0.3581 0.0210 2,195Northern 0.4984 0.1191 0.0125 0.3041 0.0658 319North-Western 0.6772 0.0886 0.0063 0.1772 0.0506 158Southern 0.3640 0.1081 0.0161 0.3168 0.1950 805Western 0.7995 0.1320 0.0127 0.0305 0.0254 394Total Number 3,193 677 301 2,001 316 6,488
MortgagesCentral 0.1620 0.0798 0.0188 0.7347 0.0047 426Copperbelt 0.5241 0.2386 0.1001 0.1100 0.0272 809Eastern 0.3871 0.0538 0.0108 0.5484 0.0000 93Luapula 0.5417 0.1667 0.0417 0.2500 0.0000 24Lusaka 0.5119 0.0922 0.0851 0.2695 0.0413 1,258Northern 0.3973 0.2603 0.0411 0.2466 0.0548 73North-Western 0.5000 0.2500 0.1667 0.0833 0.0000 12Southern 0.1546 0.1031 0.0474 0.3938 0.3010 485Western 0.6000 0.2800 0.0400 0.0800 0.0000 25Total Number 1,311 431 227 1,010 226 3,205
Source: CSO data averaged over 1990-93.

106
and Eastern and Western provinces, where 13 percent were for commercial properties. Industrial useswere not terribly important, accounting for only 1-5 percent of leases everywhere except for Lusaka,which had 9 percent of its leases issued for industrial properties.
The distribution of mortgages across land uses was more varied. Residential uses accountedfor roughly 40-55 percent of mortgages in Copperbelt, Eastern, Luapula, Lusaka, Northern, andNorth-Western provinces. While 60 percent of the mortgages were placed on residential properties inWestern province, they constituted only 15-16 percent of those in Southern and Central provinces.Agricultural properties accounted for 70 percent in Central province and 39 percent in Southernprovince. In the latter, 30 percent of the mortgages were also placed on properties categorized as"other." Luapula, Lusaka, and Northern provinces also had roughly one quarter of their mortgagesplaced on agricultural lands. All provinces except for the Eastern region (5 percent) had one quarterof the mortgages placed on commercial properties. Industrial uses received another 10-16 percent ofthe mortgages.
Overall, the data indicate that land transfers, whether assignments, subdivisions, or leaseissuances, are generally for residential and commercial properties. Agriculture makes up over 45percent only in Central province. Mortgages for agricultural uses are important (8.0 percent to 39.4percent, excluding Eastern and Central provinces), but residential and commercial properties stillpredominate. Arguments raised in chapter 1 that title is needed to obtain credit are not inconsistentwith these data, but the use data suggest that residential and commercial, rather than agricultural uses,are driving demand.
VIII. Size distribution of leases
Table 3.14 lists the number of leases issued by size category totaled over the period 1990-93.The vast majority (81.9 percent) of state leases are issued to farms less than 6 hectares in size. Thisaccords with the findings above but shrinks the size from the range 0-79 to the more precise 0-6hectares. This suggests the significance of peri-urban activity and the possible filling-in of pockets ofunregistered land in areas largely registered. Due to the dominance of state leases over reserve leasesand rights of occupancy, 78 percent of all leases are issued for properties less than 6 hectares in size.
The 100-250 hectare size is more important for reserve leases and rights of occupancy, with29.6 percent of the former and 48.1 percent of the latter. Most of the leases in this category wereissued for properties between 50-500 hectares in size, with a surprisingly large number (25.5 percentof reserve leases and 16.5 percent of rights of occupancy) issued in excess of the 250 hectares ceilingset by the MOL to avoid land concentration.8.'
Data on the percentage of leases for each farm size by province are reported in table 3.15.Only four provinces garnered more than 10 percent of the leases for any given farm size. The mediumand large farm leases seem to have been issued largely in the main commercial farming regions.
The minister has discretionary powers to issue leases for areas in excess of this amount, particularly for certain uses(e.g., ranching) where a larger size makes economic sense.

Table 3.14: Numbers of leases by size category, 1990-93 totals
Reserve Right of Percent ofState leases
(#)Percent of
state leasesleases
(#)Percent of
reserve leasesoccupancy
(#)right of
occupanciesTotal
(#)Percent of
total
0-2 4,215 70.1 5 5.1 9 3.8 4,229 66.62-6 707 11.8 9 9.2 8 3.4 724 11.46-11 233 3.9 4 4.1 2 0.8 239 3.811-21 151 2.5 4 4.1 12 5.1 167 2.621-50 213 3.5 12 12.2 21 8.9 246 3.950-100 171 2.8 10 10.2 32 13.5 213 3.4100-250 207 3.4 29 29.6 114 48.1 350 5.5250-500 52 0.9 17 17.3 25 10.5 94 1.5500-1,000 43 0.7 2 2.0 5 2.1 50 0.81,000-2,500 18 0.3 2 2.0 7 3.0 27 0.42,500-5,000 1 0.0 2 2.0 2 0.8 5 0.15,000 or more 2 0.0 2 2.0 0 0.0 4 0.1
Total 6,013 100.0 98 100.0 237 100.0 6,348 100.0
Table 3.15: Regional disaggregation of leases by farm size, 1990-93 percentages
Hectares
0-2 2-6 6-11 11-21 21-50 50-100 100-250 250-500 500-1,000 1000-2500 2500-5000 5000+
Central 7.6 2.9 3.8 12.6 18.7 28.2 22.9 44.7 42.0 18.5 40.0 25.0Copperbelt 19.8 7.6 35.6 51.5 48.0 16.9 17.4 11.7 2.0 25.9 0.0 25.0Eastern 9.0 2.3 1.7 2.4 2.4 4.2 4.3 3.2 12.0 0.0 0.0 0.0Luapula 4.6 0.3 0.4 1.8 2.4 1.9 8.0 2.1 4.0 0.0 0.0 0.0Lusaka 33.1 80.0 49.0 18.6 12.2 6.1 3.4 3.2 12.0 3.7 0.0 25.0Northern 5.0 0.8 1.3 4.8 4.1 7.5 10.6 7.4 2.0 14.8 40.0 0.0North-Western 2.8 2.2 0.4 0.6 1.2 1.9 2.3 3.2 0.0 7.4 0.0 0.0Southern 9.0 3.5 7.9 6.6 9.3 31.9 30.3 24.5 20.0 29.6 20.0 25.0Western 9.0 0.4 0.0 1.2 1.6 1.4 0.9 0.0 6.0 0.0 0.0 0.0
Total number 4,229 724 239 167 246 213 350 94 50 27 5 4

108
Central province, which led in the percentage of area of leases, tends to have a significant percentageof the leases in the medium- to large-size farms: 28 percent of those in the 50-100 hectare category,23 percent of those 100-250 hectares, 45 percent of those 250-500 hectares, 42 percent of those500-1,000 hectares, 19 percent of those 1,000-2,500 hectares, 40 percent of the few 2,500-5,000hectare leases, and 1 of the 4 farms over 5,000 hectares. Southern province, which also led inpercentage of the area of leases, had a significant percentage of leases for these farm sizes as well,with 32 percent, 30 percent, 24 percent, 20 percent, 30 percent, 20 percent, and 1 of 4 respectively.In keeping with our earlier findings, Copperbelt and Lusaka provinces were the most important forleases on land 50 hectares and under. The Copperbelt had 20 percent of the 0-2 hectare leases, 7percent of the 2-6 hectare, 36 percent of the 6-11 hectare, 51 percent of the 11-21 hectare, and 48percent of the 21-50 hectare leases. Lusaka had 33 percent, 80 percent, 49 percent, 19 percent, and12 percent of the leases for the same farm sizes. The dramatic dominance of Lusaka in the 2-6 hectaresize seems to confirm the hypothesis about the significance of peri-urban activity and in-filling ofregistered land. The Copperbelt, which also has some sizable areas under agricultural production, had15-25 percent of the leases in most of the larger farm sizes as well.
IX. Foreign offers
Foreign offers have been an issue of contention in Zambia. There is concern among somegovernment officials that the leasehold process could promote excessive concentration and a growthin foreign ownership if the land market is fully opened to outsiders. Conversely, following 15 or moreyears of nominally socialist policies, a number of Zambians are expressing the need for private capitalgrowth to develop the economy, and foreign investment is considered the most promising source ofthis private capital. There is palpable concern from all sides, nonetheless, about possible equityconsequences of opening the land market.
Data from official transfer records indicate there may be no foundation for these fears atpresent, although missing data preclude any strong conclusions. When offers are registered, the offereris asked to produce a national registration card (NRC), 9 the last digit of which indicates citizenshipstatus (see chapter 2). 10 The data on foreign ownership in table 3.16 were compiled from a computerlisting of the offers. Unfortunately, roughly 15-25 percent of the offerers in every province weremissing an NRC with the exception of Lusaka province, where 39.4 percent of offers did not havethe proper NRC codes attached. It is possible for foreigners to register land in names of Zambianspouses or other kin which may begin to explain the large number of missing registration cards.
Assuming that only Zambians were missing their cards, no more than 2 percent of the offerswere made by non-Zambians (averaged over 1990-93) with the minor exception of Central province(2.9 percent). Assuming the missing cards were evenly distributed between Zambians and non-Zambians, then foreign offers would account for 12-13 percent in most provinces. With the largenumber of missing cards in Lusaka, the number would rise to 18.8 percent there. In other provinceswhere one percent or less foreign offers were registered (e.g., Eastern, Luapula, Northern, North-Western, Southern, and Western), this assumption seems a bit strong, particularly when this weighting
9 In the ministry usage, "offer" refers to an application that has been approved for registration.10 Zambians have a 1 appended and foreigners have a 2 or another digit. The data were sorted according to this criteria.
All residents of Zambia are required by law to carry these cards.

109
of the missing cards makes the percentage jump from 0 to 12.7, as in the case of Northern province.Overall, there seems to be little cause for concern about the number of offers registered by foreigners.On the other hand, there are insufficient data to determine whether large areas of land may betransferring to outsiders.
Table 3.16: Foreign offers registered, average 1990-92
TotalZambians
% of totalZambian
Total non-Zambians
% of total:non-Zambian
Totalmissing
NRC
% of total:missing
NRC
Central 105.3 77.5 4.00 2.9 26.67 19.6Copperbelt 449.3 77.1 10.00 1.7 123.67 21.2Eastern 109.7 80.0 0.67 0.5 26.67 19.5Luapula 75.7 81.9 0.33 0.4 16.33 17.7Lusaka 444.0 64.5 8.67 1.3 235.67 34.2Northern 66.0 74.4 0.00 0.0 22.67 25.6North-Western 51.0 83.6 0.67 1.1 9.33 15.3Southern 205.0 81.9 1.00 0.4 44.33 17.7Western 115.0 74.2 0.33 0.2 39.67 25.6
Total 1,621.0 74.0 25.67 1.2 545.00 24.9

Annex 3.1: Number of commercial farms, by province, 1976-1990Sae Number
1976 1977 1978 1979 1980 1981 1982 1983 1984 1985 1986 1987 1988 1989 1990
Central 0-79 119 490 338 280 372 183 188 160 152 112 301 303 30580-199 50 89 146 111 124 95 74 85 51 36 96 98 100 415 189200-399 38 65 81 74 89 65 81 42 36 30 43 44 45 110 231400-799 102 149 138 99 142 61 35 30 29 30 60 60 63 103 88800-1,999 192 228 157 144 239 94 95 80 77 59 100 101 102 71 692,000+ 92 116 92 111 124 54 50 42 58 12 70 70 70
Total 593 1137 952 819 1090 552 523 439 403 279 670 676 685 699 577Copperbelt 0-79 34 126 73 101 162 124 122 120 99 63 342 344 345& others 80-199 19 29 27 55 42 37 58 50 40 27 97 98 100 460 491
200-399 14 74 58 48 32 22 50 35 39 23 46 48 50 75 216400-799 14 9 12 9 20 15 30 25 38 18 20 20 21 24 54800-1,999 19 24 23 21 25 40 48 55 30 36 22 22 23 30 362,000+ 15 24 27 21 29 26 42 62 27 45 28 28 29
Total 115 286 220 255 310 264 350 347 273 212 555 560 568 589 797Southern 0-79 320 374 388 192 223 215 210 160 207 96 316 318 320
80-199 146 154 146 94 93 85 83 80 69 48 81 83 85 415 29200-399 52 56 54 46 35 31 29 40 35 31 38 39 40 64 63400-799 64 66 69 48 39 31 35 40 23 22 17 19 21 55 97800-I,999 104 70 104 56 50 66 64 60 52 48 53 53 54 62 822,000+ 133 99 77 56 54 62 62 58 70 79 60 60 61
Total 819 819 838 492 494 490 483 438 456 324 565 572 581 596 271Lusaka 0-79 276 202 120 45 95 65 70 100
80-199 38 40 40 20 19 18 25 37 155 97200-399 32 38 20 20 36 9 13 20 60 76400-799 46 40 35 25 28 20 27 35 68 35800-1,999 99 80 75 50 85 50 60 65 18 272,000+ 38 24 12 22 24 20 23 24
Total 529 424 302 182 287 182 218 281 301 235Zambia total 0-79 473 990 799 573 757 798 722 560 503 366 1024 1035 1070
80-199 215 272 319 260 259 255 255 255 180 130 292 304 322 1445 806200-399 104 195 193 168 156 150 198 137 130 120 136 144 155 309400-799 180 224 219 156 201 153 140 130 115 98 117 126 140 250 586800-1,999 315 322 284 221 314 299 287 270 209 228 225 236 244 181 2742,000+ 240 239 196 188 207 180 178 174 177 160 178 181 184 214
TOTAL 1527 2242 2010 1566 1894 1835 1780 1526 1314 1102 1972 2026 2115 2185 1880
Blank spaces indicate no data reported. It appears that the numbers for Lusaka were included with those for the Central province prior to 1981.
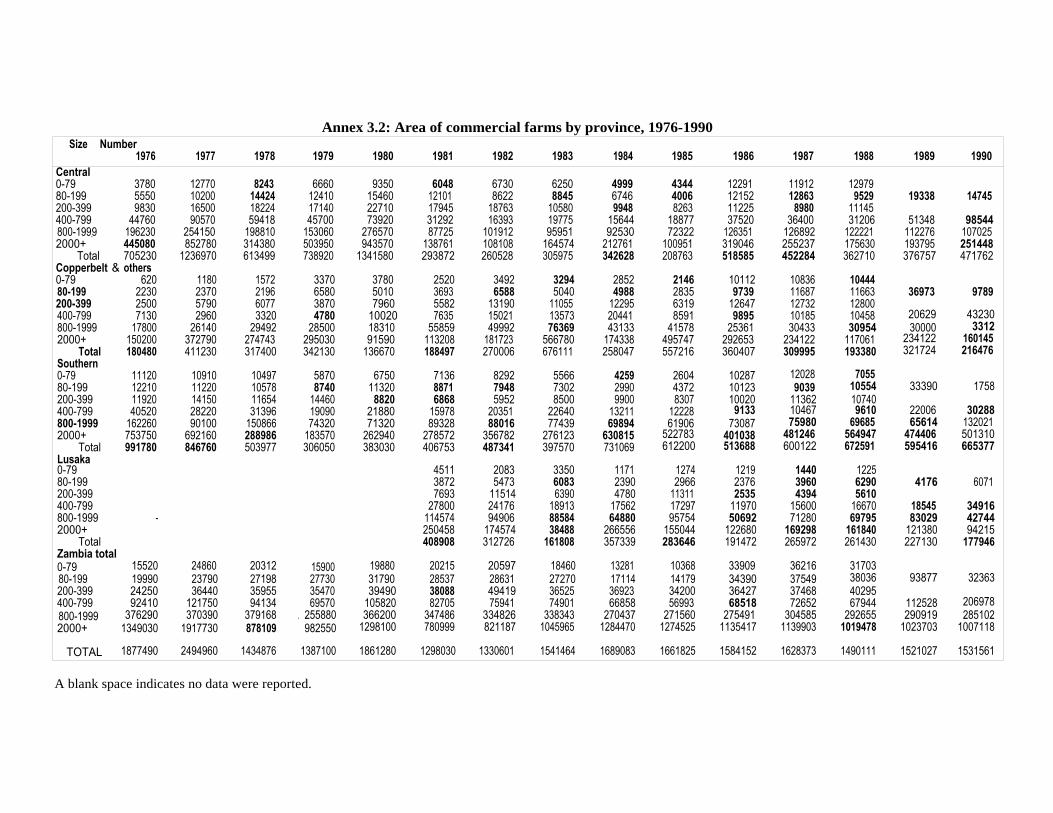
Annex 3.2: Area of commercial farms by province, 1976-1990Size Number
1976 1977 1978 1979 1980 1981 1982 1983 1984 1985 1986 1987 1988 1989 1990Central0-79 3780 12770 8243 6660 9350 6048 6730 6250 4999 4344 12291 11912 1297980-199 5550 10200 14424 12410 15460 12101 8622 8845 6746 4006 12152 12863 9529 19338 14745200-399 9830 16500 18224 17140 22710 17945 18763 10580 9948 8263 11225 8980 11145400-799 44760 90570 59418 45700 73920 31292 16393 19775 15644 18877 37520 36400 31206 51348 98544800-199.9 196230 254150 198810 153060 276570 87725 101912 95951 92530 72322 126351 126892 122221 112276 1070252000+ 445080 852780 314380 503950 943570 138761 108108 164574 212761 100951 319046 255237 175630 193795 251448
Total 705230 1236970 613499 738920 1341580 293872 260528 305975 342628 208763 518585 452284 362710 376757 471762Copperbelt & others
1180 1572 3370 3780 2520 3492 3294 2852 2146 10112 10836 104440-79 62080-199 2230 2370 2196 6580 5010 3693 6588 5040 4988 2835 9739 11687 11663 36973 9789200-399 2500 5790 6077 3870 7960 5582 13190 11055 12295 6319 12647 12732 12800400-799 7130 2960 3320 4780 10020 7635 15021 13573 20441 8591 9895 10185 10458 20629 43230800-1999 17800 26140 29492 28500 18310 55859 49992 76369 43133 41578 25361 30433 30954 30000 33122000+ 150200 372790 274743 295030 91590 113208 181723 566780 174338 495747 292653 234122 117061 234122 160145
Total 180480 411230 317400 342130 136670 188497 270006 676111 258047 557216 360407 309995 193380 321724 216476Southern0-79 11120 10910 10497 5870 6750 7136 8292 5566 4259 2604 10287 12028 705580-199 12210 11220 10578 8740 11320 8871 7948 7302 2990 4372 10123 9039 10554 33390 1758200-399 11920 14150 11654 14460 8820 6868 5952 8500 9900 8307 10020 11362 10740400-799 40520 28220 31396 19090 21880 15978 20351 22640 13211 12228 9133 10467 9610 22006 30288800-1999 162260 90100 150866 74320 71320 89328 88016 77439 69894 61906 73087 75980 69685 65614 1320212000+ 753750 692160 288986 183570 262940 278572 356782 276123 630815 522783 401038 481246 564947 474406 501310
Total 991780 846760 503977 306050 383030 406753 487341 397570 731069 612200 513688 600122 672591 595416 665377Lusaka0-79 4511 2083 3350 1171 1274 1219 1440 122580-199 3872 5473 6083 2390 2966 2376 3960 6290 4176 6071200-399 7693 11514 6390 4780 11311 2535 4394 5610400-799 27800 24176 18913 17562 17297 11970 15600 16670 18545 34916800-1999 - 114574 94906 88584 64880 95754 50692 71280 69795 83029 427442000+ 250458 174574 38488 266556 155044 122680 169298 161840 121380 94215
Total 408908 312726 161808 357339 283646 191472 265972 261430 227130 177946Zambia total0-79 15520 24860 20312 15900 19880 20215 20597 18460 13281 10368 33909 36216 3170380-199 19990 23790 27198 27730 31790 28537 28631 27270 17114 14179 34390 37549 38036 93877 32363200-399 24250 36440 35955 35470 39490 38088 49419 36525 36923 34200 36427 37468 40295400-799 92410 121750 94134 69570 105820 82705 75941 74901 66858 56993 68518 72652 67944 112528 206978800-1999 376290 370390 379168 . 255880 366200 347486 334826 338343 270437 271560 275491 304585 292655 290919 2851022000+ 1349030 1917730 878109 982550 1298100 780999 821187 1045965 1284470 1274525 1135417 1139903 1019478 1023703 1007118
TOTAL 1877490 2494960 1434876 1387100 1861280 1298030 1330601 1541464 1689083 1661825 1584152 1628373 1490111 1521027 1531561
A blank space indicates no data were reported.

Annex 3.3: Private transfers, commercial sector, 1976-1990 (000 hectares)1976 1977 1978 1979 1980 1981 1982 1983 1984 1985 1986 1987 1988 1989 19901
Central Number 0.6 1.1 1.0 0.8 1.1 0.6 0.5 0.4 0.4 0.3 0.7 0.7 0.7 0.7 0.6Starting land 705.2 1,237.0 613.5 738.9 1,341.6 293.9 260.5 306.0 342.6 208.8 518.6 452.3 362.7 376.8 471.8Purchases 16.0 7.8 10.9 0.8 4.5 21.8 29.1 0.0 0.0 0.0 0.2 0.0 0.2 1.9 0.2Leased-in 49.8 79.6 57.6 81.3 112.0 223 30.5 21.3 0.6 4.4 1.2 1.0 5.8 16.5 2.2Leased-out 4.5 22.6 1.1 36.0 12.7 0.2 0.5 0.4 0.1 0.0 0.6 0.0 0.1 0.3 0.1Sales 49.2 3.2 3.8 6.3 0.9 0.0 5.6 0.0 0.0 0.0 0.0 0.0 7.9 0.0 0.0
Copperbelt Number 0.1 0.3 0.2 0.3 0.3 0.3 0.4 0.3 0.3 0.2 0.6 0.6 0.6 0.6 0.8& others
Starting land 180.5 411.2 317.4 342.1 136.7 188.5 270.0 676.1 258.0 557.2 360.4 310.0 193.4 321.7 216.5Purchases 28.0 1.8 7.2 0.1 0.8 5.7 0.0 0.0 10.0 0.7 0.0 0.0 0.7 5.4 0.0Leased-in 14.7 179.6 28.8 31.3 32.8 15.6 0.0 0.0 3.1 18.2 4.2 2.7 1.5 2.2 0.2Leased-out 0.3 0.0 0.0 0.0 0.4 0.0 0.0 0.0 0.0 2.4 1.3 0.0 0.0 0.6 1.6Sales 0.1 0.0 0.0 0.0 0.0 4.1 0.0 0.0 0.0 0.0 0.0 1.1 0.0 0.0 1.4
Lusaka Number 0.5 0.4 0.3 0.2 0.3 0.2 0.2 0.3 0.3 0.2Starting land 408.9 312.7 161.8 357.3 283.6 191.5 266.0 261.4 227.1 177.9Purchases 2.6 0.0 10.0 0.0 0.0 0.0 0.0 0.0 0.1 2.3Leased-in 13.4 9.1 3.8 0.2 10.6 19.4 0.0 19.5 2.3 1.6Leased-out 1.2 1.0 0.1 0.7 0.8 0.0 0.0 0.0 0.0 0.3Sales 0.8 0.0 1.2 1.7 8.2 1.0 0.2 1.4 0.0 0.2
Southern Number 0.8 0.8 0.8 0.5 0.5 0.5 0.5 0.4 0.5 0.3 0.6 0.6 0.6 0.6 0.3Starting land 991.8 846.8 504.0 306.1 383.0 406.8 487.3 397.6 731.1 612.2 513.7 600.1 672.6 595.4 665.4Purchases 0.2 0.0 0.4 0.3 2.4 0.9 7.8 0.0 0.5 3.6 0.0 0.0 4.2 12.1 0.5Leased-in 134.1 34.7 57.8 31.8 11.9 15.9 11.4 20.8 19.0 16.0 15.9 1.1 20.0 14.4 1.5Leased-out 15.6 2.2 0.0 4.4 6.6 3.7 0.0 0.0 0.1 2.0 0.0 0.0 0.0 3.5 0.2Sales 6.7 0.0 0.2 0.0 4.2 0.0 0.0 0.0 0.6 0.0 0.0 0.0 0.4 2.8 0.3
Source: Data were taken from the Commercial Farm Series.

113
Annex 3.4: Property transfers, national total
YearTotal
trans. (#)(A)
Totalarea of
trans. (B)
Averagearea of
trans.(C =B/A)
Average CPI-adj.price average(D) price
Assignments 1990 659 30,212.87 45.85 10.94 10.941991 598 27,624.25 46.19 29.64 26.751992 999 33,815.50 33.85 74.27 19.671993 716 26,676.76 37.26 135.64 35.92
Subdivision 1990 59 2,432.29 41.23 9.96 9.961991 52 2,100.41 40.39 6.31 5.691992 62 1,009.50 16.28 23.27 6.161993 42 825.91 19.66 49.35 13.07
Deed of gift 1990 18 402.28 22.35 0.00 0.001991 25 1,187.23 47.49 0.00 0.001992 41 2,659.36 64.86 0.00 0.001993 24 371.94 15.50 0.00 0.00
Transfer 1990 186 7,365.21 39.60 0.05 4.741991 311 5,256.67 16.90 0.33 .301992 284 15,839.38 55.77 1.60 .421993 192 17,825.26 92.84 0.84 .22
a. Data was only available through July of 1993.
Annex 3.5: Issuances of leases, national total
YearTotal trans-
actions ( )(A)
Total area oftransactions (B)
Average area oftransactions
(C = B/A)
Reserve lease 1990 30 9,200.02 306.66731991 19 5,737.59 301.97841992 32 17,669.36 552.16751993 17 5,163.98 303.7635
Right of 1990 74 20,734.22 280.1922occupancy 1991 54 9,881.83 182.9969
1992 44 12,067.74 274.26681993 65 15,424.66 237.3025
State lease 1990 1,347 30,945.74 22.973821991 1,664 35,380.28 21.262191992 1,605 35,077.13 21.854911993 1,397 52,761.52 37.76773
Sublease 1990 21 5.81 0.2766671991 15 3.01 0.2006671992 22 23.98 1.091993 11 2934 266.7273
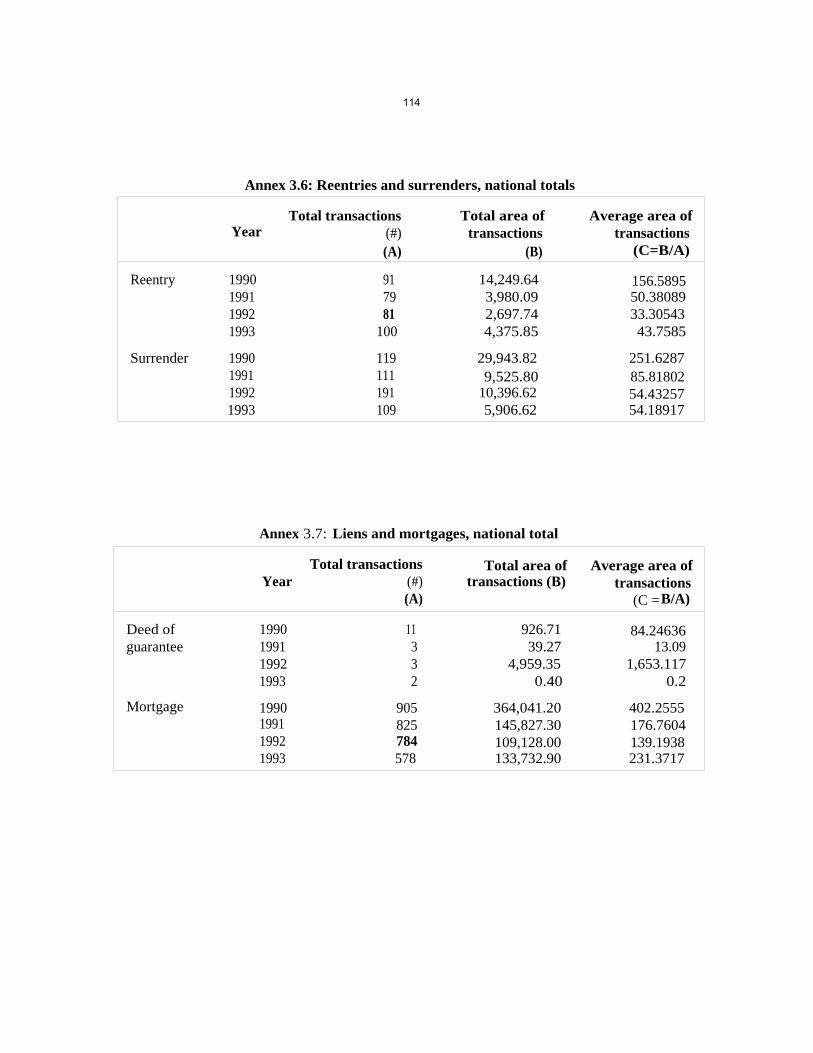
114
Annex 3.6: Reentries and surrenders, national totals
YearTotal transactions
(#)Total area of
transactionsAverage area of
transactions(A) (B) (C=B/A)
Reentry 1990 91 14,249.64 156.58951991 79 3,980.09 50.380891992 81 2,697.74 33.305431993 100 4,375.85 43.7585
Surrender 1990 119 29,943.82 251.62871991 111 9,525.80 85.818021992 191 10,396.62 54.432571993 109 5,906.62 54.18917
Annex 3.7: Liens and mortgages, national total
YearTotal transactions
(#)Total area of
transactions (B)Average area of
transactions(A) (C =B/A)
Deed of 1990 11 926.71 84.24636guarantee 1991 3 39.27 13.09
1992 3 4,959.35 1,653.1171993 2 0.40 0.2
Mortgage 1990 905 364,041.20 402.25551991 825 145,827.30 176.76041992 784 109,128.00 139.19381993 578 133,732.90 231.3717

Chapter 4:
Land Valuation and Taxation
by
John Strasma, Sonny P. Mulenga, David Musona, and D.
Siansumo1. Introduction
There has been a land market in Zambia for centuries, just as there has been in every countryin the world. Land and the right to use it in specific ways and for specific times are exchanged inmany ways, each reflecting custom, local conditions, expected demand for what can be produced withland, and power relationships. In most societies, people get access to land on which to build or tofarm in various ways. Some involve a high initial or threshold cost and little or no recurring cost. Anexample would be to buy a house with freehold title in an area that does not have taxes or rates. Otheraccess to land may have a very low initial or threshold cost but relatively high periodic costs ifcontinued access is desired. In some countries, almost everyone knows from experience andobservation whether, where, and on what terms, to obtain land on which to live, work, or both. Inother countries, people may be familiar with only one or two ways in which they could obtain accessto land. Even in countries that declare the private sale or rental of land illegal, land or housing canusually be obtained in exchange for something.
In customary land tenure areas, access may require the consent of a headman or chief, whichis often obtained more easily if one is a relative of families already there. In areas of former Europeansettlement, the market is often more visible, and access available to persons with enough money,regardless of family or other personal characteristics. Even in areas in which the government forbidsthe private sale or rental of land and housing, market processes work—though with limitations and inways that not everyone can utilize. Access to housing is sometimes part of an employment contract.Access to land or housing may be bestowed as a favor in exchange for support of a politician or party,or as a reward for superior performance in sports or other activities. Where functionaries decide whogets access to land or housing, access to better land or housing may require payment of a bribe inmoney, scarce goods, or services.
Much of the genius of modern developed economies is that their societies offer a high degreeof personal liberty. They make it possible for almost everyone to choose among several ways in whichthey could get the use of various kinds of land, in different places, in varying amounts according totheir own means and productivity. These societies have prospered largely because their land marketsmeet five standards of justice and efficiency:
(1) Everyone, not just a few powerful "insiders," can get access to land at a reasonable initial andrecurring cost.
John Strasma is a professor in the Department of Agricultural Economics, University of Wisconsin-Madison; SonnyMulenga runs S.P. Mulenga Associates (PTY) Ltd, Land and Valuation Surveyors; David Musona is the Land TenureCenter's resident associate project manager in Zambia; D. Siansumo1. is an official in the Zambian Ministry of Lands.

116
(2) Those who invest money and effort in improving land are allowed to collect and enjoy thefruits of their effort.
(3) Society, usually through government, provides or finances the provision of roads, schools, andother services and productive infrastructure that most people cannot efficiently produce by andfor themselves.
(4) Recurring costs, usually in the form of taxes and interest on borrowed money, are highenough that few people can afford to speculate or control land without putting it to productiveuse.
(5) Those who want to use land can identify and choose an available parcel and acquire secureuse rights to it quickly, at minimal cost other than what they agree to pay to the person whogives up the right to use the land (i.e., search and transactions costs are small).
In an efficient market, people needing land for productive use can identify appropriate parcels,negotiate a price, and complete the transfer with little cost in time, energy, or money other than theamount paid to the person or entity from whom the land is obtained. In Zambia, identifying availableparcels is neither easy nor inexpensive, negotiations are difficult, and heavy transfer taxes andadministrative deficiencies make transfers slow and costly. Policy changes would greatly reduce thecost of finding and obtaining land; the supply could also be increased by funding council and privateprojects to service and sell sites.
This chapter reviews the land market in Zambia, to see how it measures up to the abovestandards. It then considers proposed alternative policy actions to improve its performance,considering both Zambian experience and that of other countries with such policies. In particular, thetheory and practice of land valuation, including transfer taxes, annual "rates" on improvements, andground rents, are addressed. Draft legislative changes are now under discussion, and this chapterincludes an analysis of these proposals and suggestions to make them less ambiguous and moreeffective. Section II looks at transactions costs associated with real estate. Sections III and IV analyzetaxation through rates and valuations. Section V covers ground rents as currently applied in Zambia.Section VI then summarizes and analyzes the relevant proposals in draft reform laws currentlycirculating. Section VII will address the proposed land development fund, an idea introduced at theJuly 1993 land conference (see chapter 1) and warmly endorsed by the participants. And section VIIIwill close with conclusions and recommendations.
II. Transfer taxes, fees, and other transactions costs
A. Transfer tax
The Property Transfer Tax Act, No. 12 of 1984, created a transfer duty. At the July 1993 landconference (see chapter 1), and in many interviews, there was a consensus that the present 7.5 percenttax on land transfers, supposedly charged on the actual market price, was unreasonably high and

117
curtailed transfers.' Assertions were also made that parties have been falsely underdeclaring the actualprice at which leaseholds or other interests are changing hands. Theoretically, this tax should beeliminated or reduced to a nominal level, both to encourage more frequent transactions in land andimprovements and to remove the present powerful incentive to falsely declare a transfer price belowthe real price charged and paid.
If accompanied by an adequate educational campaign, it is likely that revenues would actuallyrise if this rate were to be cut in half. For that to happen, buyers, sellers, and functionaries wouldhave to be informed the government is serious about enforcement of tax collection and accuratereporting of the actual sale price. There are a number of ways to encourage honesty. One is to provideby law that in the event of any property acquisition by government, the purchase price (orcompensation if expropriated) may not exceed the amount declared as the purchase price, adjusted forinflation. Another method, used in various Latin American countries, is to forbid banks to lend morethan a fraction (say 60 percent) of the declared purchase price when the property is mortgaged to thebank in order to guarantee repayment (see figure 4.1). Fines or penalties represent a third option.
Figure 4.1: Central American experience with tax declarations, bank credit, andcompensation for land expropriated in land reforms
Legal requirements linking value declared for tax purposes to bank credit and to compensation inthe event of expropriations are common in Central America. For example, in the 1970s, Salvadoran banksstill made loans to commercial farmers at interest rates below the expected rate of inflation. In 1976 and1977, landowners were required to declare the value of their lands for annual property tax purposes. Thefarms were taxed at a rate of 1 percent a year, on the value declared, with the revenues going mostly tofinance road construction and maintenance. When farms larger than 500 hectares were expropriated in theland reform of 1980, it turned out that about 90 percent of the owners had declared values for taxpurposes that were clearly less than the market value of the land. On the other hand, about 10 percent ofthe large farms had been declared at more than their actual market value. In most cases, this appears tohave happened because the owners expected to obtain bank loans with the land as collateral. By paying 1percent a year on inflated declared values, they could increase the amount of money they could borrow atan expected negative real rate of interest on the order of 10 percent.
Since the beneficiaries were supposed to repay, over 30 years, whatever amount of compensationhad been paid to the former owners, false overdeclaration years before also meant that the land reformbeneficiaries might have to pay more than the land was worth. In practice, however, inflation has cut thereal value of prices set at the time of expropriation, and beneficiaries are not actually being asked to paymore than the land is worth, even when a former owner had overdeclared its value in 1976/77.
Source: Strasma 1966 and 1990.
In any event, quite apart from the temptation to declare falsely the price at which leaseholdsor improvements change hands, the transfer tax is a poor way to recover government's expendituresto provide access and services in land. The first transfer, from government or traditional authority,is not subjected to the transfer tax, and if the property remains in the hands of the first transferee, notransfer tax is ever collected. It would be far more equitable to lower the rate of the transfer tax, whilecreating and enforcing a significant annual tax or ground rent.
2It is in fact quite difficult to determine whether the transfer tax has curtailed transfers. A 7.5 percent transfer fee would
not be a serious constraint if landholders were allowed to greatly discount or underreport the purchase or sale price.

118
B. Incidence and shifting of the transfer tax
Zambian law and practice state that the transfer tax is supposed to be paid by the seller.However, the estate agents and functionaries interviewed observed that, in practice, the buyer paysit along with other costs; Zambian real estate has been a seller's market of late, so it appears thatsellers can sufficiently raise their asking prices to cover the transfer tax.
Regardless of what the statutes say, a transfer tax actually affects both parties. To the buyer,it is part of the amount he or she must pay in order to acquire the property. To the seller, it is anamount that the buyer is willing to pay but which the seller does not receive. Both share in the taxburden; how much each "pays" depends on their relative bargaining power, which depends largelyon how many other people are seeking such properties to buy and how many similar properties arecurrently for sale. If demand exceeds supply, prices will tend to rise and vice versa.
To analyze the burden of the transfer tax, one must suppose a different world, in which thereis no transfer tax but government obtains the same revenue in a more neutral way, such as a value-added tax. In that hypothetical world, the actual market price might be higher or lower than themarket prices in the real world (where a transfer tax is charged) depending on the other forcesoperating on supply and demand at the moment. Economists simply do not have a reliable way todetermine the actual incidence of this tax, even in developed countries with excellent statistical data(Musgrave 1960).
C. Revenue yield and tax evasion
According to informal sources, buyer and seller frequently agree to falsely declare thepurchase price to avoid paying an "excessively" high transfer tax (7.5 percent in 1993)2 The honestbuyer and seller are thus penalized, paying much more tax on the transfer than others who buy andsell property of the same market value, but who understate the price.
The Minister of Finance announced, in the 1994 budget message (p. 14), that the governmentintends to reduce the Property Transfer Tax rate to 2.5 percent, to amend the Property Transfer TaxAct so that the commissioner may use property assessments by the Government Valuation Department,and to amend the Land Conversion of Titles Act revoking the provision stipulating that land has novalue. This proposed 2.5 percent tax should be reduced further and perhaps even replaced by a capitalgains tax. This will encourage landholders to sell more quickly when their own needs for landdiminish and help the economy adjust faster to economic changes. Even so, Zambia's real estatemarket and institutions will still suffer from sluggish titling and registry services. According to the1994 budget message (p. 10), the government will take an initiative in 1994 to approve terms ofreference for ways of decentralizing to the district-council level and for improving the registration ofland transfers and the collection of fees. (See chapter 2 for an assessment of these proposals).
The transfer tax is not the only cost in real estate transactions in Zambia. There are also userfees to be paid to the registry and the costs of survey. Attorney fees and a commission charged by an
3 In comparison, the transfer tax in the United States is only 2 per 1,000 (0.2 percent). The amount of the tax is recordedon the actual record of the transfer, which is open to public inspection. Thus, appraisers, real estate tax assessors, and thepublic in general can find out rather easily the price at which properties are actually bought and sold.
119
estate agent may also be involved. All of these costs separate the amount paid by the buyer from theamount received by the seller and make the land market less agile, slowing economic development.
D. Registration fees or stamp duty
The regulations contain a number of prescribed fees set in colonial times that, while generatingrevenues, have become a nuisance as monetary values have eroded. For example, the stamp dutyapplied to real estate transfers is a nominal rate held over from colonial times. The Zambian 1994budget message announced its abolition as of midnight, 28 January 1994.
E. Planning department scrutiny fees
All construction in Zambia, other than on agricultural holdings, requires a permit issued bythe relevant city or council, and a scrutiny fee is normally charged for this review. The fees are basedon an estimated minimum development investment per square meter and vary among councils. Thecurrent scrutiny fee for Lusaka is 0.25 percent. Thus a 100 square meter building costing K115,000per square meter, or K11.5 million, would require a scrutiny fee of K28,750. A scrutiny fee ofK40,000 is charged in Lusaka for the review of subdivision and consolidation.
Various other problems are leftovers from the previous government of Zambia. For instance,there is still a widely shared reluctance to recognize the fact that land values change rapidly and bylarge amounts when product markets or other relevant data change. Some who write draft legislationregularly propose legal language that is ambiguous. The proposed reforms in the Land Titles Act andthe Land Registration Act are good examples of positive draft laws that need sharper focus andclarification.
The problems of the land market will not end with better laws. Those land laws areadministered by government entities, some of which have employees who are not dedicated tominimizing cost and maximizing service to taxpayers.
From inertia, tradition, political concerns, or other causes, the Republic of Zambia issues 99-year negotiable leaseholds instead of freehold titles. Freehold tenure would be no more secure, as theSecond Republic showed when the president simply decreed that all freehold titles must be convertedinto 99-year leases. More worrisome is that neither leaseholders nor hypothetical freeholders have veryfirm guarantees against expropriation or other actions by the state that may take their property withoutfair prior compensation. The best estimates available so far indicate that recording a sale of a leaseholdinterest may take several days; seeking, obtaining, and recording a new leasehold with the consent ofa tribal chief may take several months or even years (see chapter 2). The actual cost of buying orsubleasing land and improvements includes the explicit taxes and fees plus the value of the time ofthe interested parties (or their attorneys or other agents). Based on the above-mentioned timerequirements, transfer costs would appear to be considerable.
F. Revenues of the Lands Department
The GOZ collects money from persons to whom state land has been allocated under threeheadings: registry fees, state consent fees, and annual ground rents. (There was formerly a stamp taxas well, but it was abolished in early 1994.) Table 4.1 shows that the revenues obtained from thesesources have varied sharply over time in current kwacha terms. Because the year-to-year changes were

120
somewhat arbitrary and because the rate of inflation itself varied sharply from year to year, therevenue in real terms has been highly variable. Making matters more confusing, revenues dependedon the level of transfer activity as much as on the tax rates themselves. Consent and registry feesdepended on the number of transfers and new allocations recorded each year. Ground rents, however,were so low that many leaseholders failed to pay them. The main source of actual receipts wasgenerated by registry demands that ground rents be paid up to date before a transfer would berecorded. Thus revenues in a given year depended on how many property transfers were recorded thatyear rather than on the rate or amount of ground rent levied.
At well under US$1 million a year, total receipts from the three forms of revenue do not beginto cover the costs of the MOL, much less make a contribution to government's investment in servicesand infrastructure on State Land. Equally telling, well over half of the total comes from the Registryfee levied on transfers recorded. The 1994 fee is 1 percent of declared value, and many transactionsare underdeclared, probably in order to evade the property transfer tax (see above).
The existing statutes state that persons holding state lands are supposed to pay a ground rentof 4.5 percent on the value of the land, but the land board that is supposed to oversee the process ofsetting and collecting ground rents through the Lands Department has not met for several years. Sinceground rent revenues have been running under 40 percent of the registry fee just on land transferred,it is obvious that the ground rents in place are not remotely near the theoretical 4.5 percent of landvalues that the statutes direct. All interviewees agreed that ground rents should be raised substantially.
As will be seen shortly, the Hammar report provided by Swedish technical assistancerecommends setting ground rent levels at around 5 percent of market values of land for residentialstands, and comparable levels for farm, commercial, and industrial parcels. That would be consistentwith the 4.5 percent of present law, and would certainly go a long way to help the GOZ cover itsbudget for land development. The far more difficult problem involves the task of assessing marketvalue given the lack of current information on land prices, land market restrictions that distort prices,high demand for newly opened stands for which land prices are difficult to estimate, and the limitedsupply of qualified assessors in the private and public sectors.
Further study is needed to determine the impact of a significant ground rent on different typesof farms and farmers, to design an automatic updating of rents for inflation (including indexing backrents due so that the amounts actually paid at least reflect the real value of the rents when originallydue), and to design a systematic program of adjusting ground rents to reflect fully the actualinvestments made in roads and services that increase the market value of land. Some progress has beenmade in computerizing the records of the Lands Department so that when leaseholders visit the officeto pay, employees can inform the client immediately how much is owed. However, study is urgentlyneeded to design and implement a system that will induce leaseholders to pay annually when due,rather than only if and when they decide to transfer the land.

Table 4.1: Analysis of Lands Department revenue, Zambia, 1985 to 1992
Nominal revenues Impact of inflation on real revenues1
YearGround
rents % aDeeds
registry %aState
consents % a TotalNominal
change(%)
Inflationrateb"
(%)
revenueReal
change(%) US$1
Exchangerate= K
Devalu-ationrate
( %)
Totalrevenue
(US$)
1985 566,980 30 1,084,440 58 211,123 11 1,862,543 5.70 157.00 326,762
1986 807,281 26 2,028,388 65 306,445 10 3,142,114 69 55 14 12.71 123.00 247,216
1987 1,778,407 32 3,540,247 63 303,640 5 5,622,294 79 47 32 8.69 (46.30) 646,984
1988 1,531,586 20 5,281,878 69 833,396 11 7,646,860 36 54 (18) 8.26 (5.20) 925,770
1989 .1,764,175 12 11,383,409 79 1,251,000 9 14,398,584 88 128 (40) 13.84 67.60 1,040,360
1990 1,587,616 7 18,581,474 86 1,481,855 7 21,650,945 50 110 (60) 31.40 126.90 689,521
1991 17,863,610 37 26,735,515 56 3,165,962 7 47,765,087 121 118 3 64.63 105.80 739,054
1992 39,882,240 27 96,315,124 65 12,144,958 8 148,342,322 211 200 11 172.21 166.50 861,404
Totals 65,781,895 26 164,950,475 66 19,698,379 8 250,430,749 n/a n/a n/a n/a n/a n/a
a. Percent of total annual revenue.b. Percent change in the CPI during previous year.

122
III. Taxation of rural and urban improvements ("rates")
A. Form of taxation
Rates and ground rents are both forms of recurring annual costs imposed on the holders orusers of real estate. They are quite distinct from consent fees, transfer taxes, and scrutiny fees, whichare paid only when land is transferred or when a leaseholder seeks a building permit.
In Zambia, rates are applied to the estimated value of improvements only, while ground rentsare applied to the value of the land as such, not including the value of any improvements. Revenuesgenerated by rates accrue to local government (city, municipal, and district councils), while groundrents are paid to the MOL of the central government. Neither applies to land still under customarytenure. Rates apply to the rateable areas of each district or city—referring, essentially, to the urbanarea, but some agricultural land near to or within the urban perimeter may be included.' The fact thatrates are applied only to improvements, rather than to market value of land plus improvements, isproblematic. A number of economists, from Henry George5 to the present, consider this the wrongapproach to taxation. They reason it would be far better to exempt improvements (or at least newlybuilt ones) and apply a heavy annual tax on the site value of the land under them, thereby capturingsome of the market value that results from government expenditures on infrastructure. As a result ofinflation, poor administration, and lack of interest, neither the rate nor the ground rent generatessignificant revenue—nor has any other economic impact at present.
The current legal and institutional framework for setting and collecting rates is inadequate, butimproving, particularly through the work of the Government Valuation Department. The legal andinstitutional framework for setting and collecting ground rents on urban and rural lands is worse.Government is aware of the problem, and officials have stated their intention to address it, but noimprovement is yet in sight. Far less clear is the present and potential revenue generation of rates andground rents, where little hard information is available. Research is needed to determine the revenuesavailable to traditional authorities, and their relationship, if any, to land allocations and land uses.
B. Speculation
Speculators are investors who buy undeveloped land and hold it without makingimprovements, hoping to resell it at a higher price in the future. Their activity does not createproductive employment for anyone except the speculator; their returns depend on their assessment ofmarket information and the risks they bear in the event that higher land prices do not materialize.Speculators favor any tax that does not apply to the market value of undeveloped land. Because thatmarket value depends almost entirely on location, or on site-specific soil and climate factors, it is often
Zambia has 3 large cities (Lusaka, Ndola, and Kitwe) and 9 smaller cities. The rest of the country is divided amongsome 60 districts. Each of these entities has an elected city or district council, which sets policy, and council employees,who implement it. Below the district council, in communal areas, some authority rests in tribal chiefs, who in turn overseevillage headmen.
Henry George, an American whose views appeared in Progress and Poverty about 1880, believed so much revenuecould be obtained by taxing site values that all other taxes, including the income tax, could be repealed. The movement hefounded was thus known as the Single Tax Movement. Some cities in the United States and other English-speaking countrieshave adopted lower rates on improvements than on land values, and a few exempt new construction completely for a certaintime.

123
called site value, meaning the land has value simply because of its location. A heavy tax on landalone, economists argue, will induce owners to invest as needed to improve land quality to its "highestand best use," given its location, attributes, and amenities. Skeptics respond that governments seldomif ever have the technical ability or the political courage to impose taxes high enough to affectlandowners (or leaseholders) (Strasma et al. 1987).
This argument is less relevant to Zambia, where the government itself is the legal owner ofland and allows individuals and companies to use it on the basis of leaseholdings. Thus as landlord,the government collects rent rather than land tax as such. It bases the rent on the value of the land,since the improvements were generally put in by the lessees. Since the basic model lease is for 99years, it is implicitly assumed that the lessee's investment will be recovered long before the leaseexpires.
C. Setting rates
The level of rates in Zambia is determined exactly as in the United States or Canada, exceptthe value of the site or land beneath improvements is theoretically excluded from the taxable value.Each house, shop, factory, or other permanent part of a building is assessed a taxable value. The cityor council decides its budget, then subtracts revenues it expects to collect through other taxes, licenses,and fees. The remainder—the amount to be raised from the rates—is divided by the total rateablevalues for the city or district, giving the actual tax rate to be applied to the assessed value of eachproperty. Lusaka is about three years behind in its accounts, and 1994 figures could not be locatedfor this report. The model that follows in table 4.2 is, therefore, hypothetical.
Table 4.2: Hypothetical example of rate determination in a city(kwacha values in billions)
(A) Budgeted expenditure for 1994 K100.2
(B) Other revenues expected - 20.2
(C) Amount needed from rates (A-B) K80.0
(D) Total value of rateable improvements in the city K8,000
(E) Tax rate required to generate the revenues needed for thebudget (C _ D)
1 %, or 1 ngwee inthe kwacha
By law, every city or district is supposed to reevaluate all rateable property every five years.In addition, new buildings constructed or parcels left off the rates list are supposed to be added in asupplementary roll. The owners of these properties pay the same rate that would have been appliedhad they been valued at the time of the last general roll rather than at the time the supplementary rollproperties are actually evaluated. Inflation in Zambia has left the values assigned rateable property farbelow land market levels. When the next five-year revaluation is performed, it would not be unusualfor the total market value of privately held land and improvements to rise substantially. In Lusaka,for example, a revaluation was just completed. The value in kwacha assigned to a typical house roseby about 11 times over the five-year period (1100 percent).
124
Urban services in Lusaka and other cities appear deficient in many respects, justifying the needfor additional revenue. Yet, when the values of improvements are raised to adjust for inflation,Zambian taxpayers seem to expect the tax rate to drop, maintaining a constant tax bill in real terms.When a city tries to update the values without a significant drop in the rate, and without negotiationswith ratepayers to win acceptance, the result is likely to produce a taxpayer revolt, as happened inLusaka in 1993. The municipal councils and the public do not appear to understand the rate-settingprocess.
In practice, urban rates in Zambia fall far short of their revenue potential. First, notices arenot always delivered to taxpayers, and second, there are no real penalties for late payment. The oneeffective collection method does not even involve the municipality; i.e., the registrar requires thatpersons seeking to record a property transfer bring in clearances, or certificates of payment of bothrates and ground rents. As a rule, they do not, but the tax is so low that the entire arrears can be paidfrom pocket change. Actual revenues in any given year thus depend much more on the level of realestate transfer activity than on the total values of rateable improvements or the rate of the levy.Revenues have reportedly risen somewhat in the last two years following computerization of rates due.The MOL (ground rents) and some council offices (rates) are now able to determine instantly howmuch is owed by someone seeking a tax clearance.
In contrast with Zambian laxness, the United States and a few other countries have anenforcement mechanism for tax collection that is simple and extremely effective. Any property forwhich the tax is not paid during two years is auctioned off to the highest bidder. The successful bidderis delivered a new property title, and the occupant is evicted. In practice, almost all delinquenttaxpayers manage to pay up the back taxes plus interest owed within a day or two before the propertyis to be auctioned.
As far as could be determined, there are no penalties for late payment in Zambia, no indexingfor inflation, or interest on arrears. With inflation in 1993 of approximately 100 percent, any rationaltaxpayer would postpone payment. The law effecting penalties on tardy payments appears drasticenough. The council may obtain a court order for distraint, which entitles it to seize a building andremove enough furniture or other contents to cover back taxes. It may also auction the building, andif the winning bid exceeds taxes due, the law requires that the difference be paid to the now-formerowner. In practice, all interviewees stated that they had never heard of such enforcement ever beingpracticed on delinquent ratepayers in Zambia.
D. Rate valuations
Between valuations (legally every five years), there is no indexing or other adjustments forinflation or general growth in market values. If inflation raises expenditures, the rateable valuesremain the same, but the arithmetic causes the tax rate itself to rise. When the next valuation isperformed, the tax rate logically falls. The law contemplates supplementary valuation rolls whenevernew construction occurs, or for any properties inadvertently left out of the five-year valuation. Theopinions of interviewees differed as to whether this was done systematically throughout the country.The Government Valuation Department (GVD) is now able to do it for the rural councils, and doesso when requested. The values of new or omitted buildings are set with tables representing kwachavalues per square meter of each type of construction used at the last general valuation. This seeks toensure horizontal equity, with like improvements being taxed alike. However, in practice,
125
supplementary valuation is spotty; owners who escaped the five-year valuation could well beoverlooked for five years.
Most of the 55 cities and municipal and other councils with the legal authority to collect rateshave no personnel trained to do valuation, so the revaluations are usually performed by the GVD, alargely autonomous professional entity attached loosely to the Ministry of Works and Supply. Thisagency has become much more professional and organized in the last two years with the assistanceof the Overseas Development Administration (UK). For 1992, the GVD performed 11 completerevaluations (20 percent of the 55 potential client local governments), and 4 supplementaryrevaluations to add properties overlooked or built since the last revaluation. (See section IV for ananalysis of the valuation process.) For taxpayers to accept valuation as fair and objective, it isimportant to have a means of resolving disputes. This is the task of the Rating Tribunal, whichreceives administrative support from the GVD. While not perfect, it appears to be more effective inissues of rateable values than are the mechanisms for resolving most other conflicts regarding land.
Lusaka and the other main cities have their own valuation departments, which areunderstaffed, but may contract with private valuers or with the GVD to help with major valuations.The GVD was not involved in the valuation exercise just completed in Lusaka in 1993, however; allother cities are now asking the GVD to help them supervise or carry out revaluations.
As the capital city, Lusaka has special problems collecting rates. First, many buildings belongto government, which does not pay taxes. The law envisions government payment of a "Contributionin Lieu of Rates." Such payments have been made in the past but have sharply decreased under thecurrent fiscal stringency. When such payments were made, they fell short of the amount that wouldhave been due if the same buildings were privately owned.' Lusaka (city council) itself owns a lotof housing and other property (some 15,000 buildings as reported in chapter 1), but it does not taxitself. Church and nonprofit organizations do have to pay rates on the theory that they receiveservices. Finally, Lusaka finds that a significant share of the most valuable buildings are occupied byregional agencies and by foreign embassies and consulates. In a bizarre interpretation of internationallaw, if one room in a building is rented to and occupied by a diplomat, the entire building is exemptfrom paying rates.'
E. Nominal and effective rates of taxation
When Lusaka property was revalued in 1993, no official estimate was made of the averageincrease in assessments. It was also unclear how much of the increased valuation roll was newconstruction and how much a result of revaluation of improvements that were on the previous roll.Some interviewees claimed that the average increase was between 10 and 40 times. When the ownerswere advised of the new values, few complained because they were still below actual market values.Owners assumed that the tax rate would fall accordingly, keeping the actual tax constant in purchasingpower terms. The 1993 tax rate was 11 percent, leading some ratepayers to assume that the 1994 ratewould be 0.25 percent to 0.5 percent. Instead, the city council asked the Ministry of Local
6 In 1992, according to the GVD, the central government should have paid K13 million in lieu of rates on government-owned properties in Lusaka. It actually paid K5 million. No payment was made in 1993. (Source: GVD Rating PositionPaper, 1993, p. 1.)
' This quirk was reported by several interviewees and affirmed by the Minister of Local Government and Housing ina talk to the Economics Association of Zambia on 12 January 1994.

126
Government and Housing to approve a rate of 4.0 percent. When owners of valuable propertiescalculated the amounts owed, they became vociferous, and the city later bowed to their pressure. TheChamber of Commerce and Industry of Lusaka proposed that the rate instead become 0.025 percent,or 1/40 of 1 percent. On 15 January 1994, the Town Clerk of Lusaka published a notice proposinga rate of 1 percent.'
Some local governments discriminate by use of the property. For example, in Chipata, the ratedue in 1994 is one half ngwee per kwacha for domestic (residential) improvements, and 3 ngwee perkwacha (3.0 percent) for commercial and industrial improvements.'
IV. Valuation of land and improvements in Zambia
A. Valuation process
The balance sheets of business firms in Zambia show both land and improvements as assets.When a business firm is sold as a going concern, the buyer normally seeks an up-to-date valuation.Banks and other lenders may request a valuation to determine the property's collateral. For suchpurposes, a valuation surveyor is usually hired, a person trained formally at the University of Zambia,followed by on-the-job practical training in firms of valuation surveyors. In practice, most suchvaluation surveyors also function as estate agents.
Government frequently needs the estimated value of a piece of land, or of an improvement,or both. The transfer tax is charged on the reported value of the transfer; ground rents are, or oughtto be, based on the value of the property if it were rented in the market. When the government needsto acquire land or a house for public purposes, a value is needed as the basis for negotiatingcompensation. In these cases, the valuation is done by the GVD. Government and private sectorplanners also need values for land and buildings when preparing feasibility studies and cost-benefitanalyses for proposed investment projects. Estimates are often prepared as to the value at present, andalso for the value the same land and/or improvements will have once the proposed road, dam, or otherproject is built.
There is at least one significant investment fund in Zambia that enables individuals andcompanies to invest in a share of a set of properties. 10 That fund in turn needs a value for eachproperty every quarter for reporting to investors. The fund also redeems investments for cash upon
8 The chamber also suggested that rates not be collected at all until the city provides better services, and that rates oughtto vary among parts of Lusaka, because some neighborhoods receive more and better city services than others. Complicatingmatters further, the deputy mayor and the mayor led rival factions of the city council that refused to work together. TheMinister of Local Government in early 1994 informed the city council that his ministry would take over city administrationif various problems were not solved by 31 March 1994.
9 Local usage is ngwee in the kwacha; the ngwee is a penny, or 0.01 kwacha. With inflation, the ngwee is no morecurrent than the mill formerly used in the United States to refer to one one-thousandth part of a dollar.
10 The Meridien Property Fund, managed by Meridien Financial Services Ltd, has been operating since 1987 and,according to its latest annual report (30 September 1993), currently owns 15 commercial, industrial, and residentialproperties with a total value of K1,111 billion. Of these, 13 are in Lusaka, one in Kitwe, and one in Crescent. The returnto investors is a combination of rental income, profit on the sale of properties, and interest earned on cash balances awaitinginvestment.

127
request, during a specific period each year. The fund retains the services of a well-established privatevaluation surveyor for this purpose.
B. Impact of the "Watershed Speech"
In 1975 former president Kenneth Kaunda announced a sweeping new land policy. Blamingreal estate brokers and land speculators for recent increases in the market value of land, he announcedthat since land was a gift of God it should not have market value. An obliging parliament quicklypassed a law that canceled all existing freehold titles, replacing them with 99-year leaseholds. All landwas nationalized, with responsibility for its management vested in the president. Anyone needing StateLand for any acceptable purpose from that point forward had to request it of the Commissioner ofLands who would study the request and sign a lease on behalf of the president. Real estate agenciesquickly took down their signs and vanished from the commercial telephone directories. From 1975on, no land transactions were allowed without state consent. Maximum prices charged and paid werefixed by the state. Sellers could not legally ask, nor the buyer agree to pay, prices higher than thosefixed. The law further stipulated that prices fixed by the state for private transactions could not bequestioned in "court of law or tribunal." In practice, for the first few years after 1975, the GVD,which was responsible for fixing prices, was swamped with requests; it often took six to twelvemonths before a transfer could be assigned a price and completed.
Enforceability of the Conversion Act of 1975 depended largely on whether the documents wereto be registered. The Lands and Deeds Registry Act, 1914, SECTION 4, required registration for alltransfers of land or interests in land, if for more than one year. This reportedly led many parties tosign leases for one day less than a year, and thus there was no need to officially decree a price or rent.
Estate agents themselves practically disappeared in 1975. Some emerged as surveyors, as thepresident had not blamed mapmakers for rising real estate prices. A new specialty arose: valuationsurveyor, who specialized in studying and determining what improvements were worth. In 1990, theofficial 1991 budget speech lifted the ban on estate agency and announced that the Zambian economywould be liberalized. The Surveyors Institute of Zambia promptly held two seminars in 1991, at whichspeakers urged formulating professional guidelines for estate agency, speeding up the land deliverysystem, returning to freehold land tenure, and removing SECTION 12 of the Conversion Act (therequirement that no real estate be transferred without state consent). The transfer process has beenaccelerated somewhat by an administrative decision: the present Commissioner of Lands has begungranting consent automatically where a professional valuation report is attached or when satisfied thatthe amount declared as the transfer price is reasonable. However, there is no assurance that thissimplified procedure will be permanent.
The presidential edict also forced landowners to become leaseholders instead. Freehold titleswere ipso facto converted into leaseholds by law. This would not have mattered greatly if possessionwere secure for the stated term of 99 years. However, an important corollary of the "land has novalue" doctrine was the belief that the president, as landlord, could arbitrarily and unilaterally revokea lease if the lessee was not "using" the land productively. Anyone holding land for futureconstruction had reason to feel vulnerable. Instead of the boom in construction activity that might havebeen expected, holders of vacant lots and farmland tried to keep a low profile.
Land still had value, especially for location, but persons wanting to buy and sell had to gothrough new rituals. A would-be buyer had to find land whose holder wanted to sell. This was not as

128
easy as before because the holders did not deem it prudent to advertise that they had unused land. Hadthey done so, they correctly reasoned that the Commissioner of Lands might revoke their leaseholdand take the land away without compensation. Once a buyer found a holder willing to sell a leasehold(i.e., sublet the property to someone else), they negotiated a price and then had to seek presidentialconsent to the transfer. The president delegated that decision to the Commissioner of Lands, but therewere no clear rules as to when consent was to be granted. This situation of course favored corruptionand introduced more murkiness into the land market.
The presidential action drove the land market underground, at least temporarily. However,it did not create more land, nor did it persuade those who owned land to simply give it away free orbuild more housing for the poor. The first concrete result was that it cut tax revenues. Thereafter,when land transfers were recorded, the Land Commissioner's office told the parties to declare onlythe value of the improvements on the land. In spite of the obvious fact that some land had enormousmarket value because of its location, that land could be bought and sold without transfer taxes beingpaid. Thus, although the high rate of the transfer tax (see section II, above) had already inducedchronic underdeclaration of values, the presidential "devaluation" of land led to even greaterunderdeclaration and hence to lower transfer tax revenues.
C. Reappearance of the market
With the election of the MMD government, whose manifesto included a promise to recognizethat land had value, estate agents began to reappear. In general, at least in Lusaka and the Copperbelt,it seems relatively easy to identify a parcel of land and negotiate a market price with the holder. Thenewspapers once again carry classified and display advertisements offering to sell houses, lots, andfarms. Nonetheless, there are still occasional anecdotes suggesting a degree of backsliding from theclear promises of the manifesto. For instance, one estate agent tells of a client who wanted a site forbusiness use one year ago. The agent found someone with suitable vacant land, who was quite willingto sell, and agreement was reached as to the price. However, when consent was sought at the Officeof the Commissioner of Lands, the commissioner simply revoked the existing lease—confiscating theland on grounds that it was not being used. In effect, the buyer had to buy the leasehold twice, fromthe previous lessee and then from the government. There are other cases in which the supposed sellerreally did not have good title even as a leasehold, or in which the commissioner, thinking the landunassigned, had apparently already promised it as a new land grant to someone else.
The present Commissioner of Lands has stated that although the law still requires the consentof the president for every transfer from one party to another, the process is to be more or lessautomatic. His office still has a steady flow of petitioners, and delays still appear to be commonplace(see chapter 2). Problems persist of past irregularities such as surveys that do not coincide withboundaries on the ground. In countries where property transfers do not require the paternalisticconsent of a functionary, it is common to require a technical scan for such irregularities in the processof recording land transfers. The difference in these countries is that recording the transfer is neverforbidden arbitrarily. If a transfer is rejected, the functionary must state what must be done to correctthe problem. But all parties know that as soon as the problem is corrected then recording the transfercannot be denied.
A major problem plaguing the land market in Zambia is the lack of an accessible, low-cost,and rapid method of resolving land conflicts. The only judicial appeal is to the High Courts; anecdotalevidence suggests that this route requires a wait of several years and high costs to the parties seeking

129
justice. There appear to be numerous cases in which the use of a particular parcel is less than whatwould appear to be the "highest and best use" simply because there is an unresolved conflict overrights. Further research should establish the feasibility of creating a lands tribunal, as has been doneelsewhere, to resolve such conflicts quickly and fairly. Apart from the advantage of not having adocket cluttered with every other type of dispute, the tribunal would be staffed with judgesknowledgeable about land law and policy, increasing the speed of resolution as well as the consistencyof decisions.
V. Determination of ground rents
A. Existing policy
In theory and in present law, no real estate in Zambia may change hands without the consentof the president. The incumbent has delegated this responsibility to the land commissioner, but a futurepresident could cancel that delegation, or the commissioner could deny consent unreasonably, and theaffected party would have little effective recourse. Because State Land is delivered as leaseholdinterests, holders are supposed to pay ground rent rather than property taxes on land. (Improvements,of course, are subject to the property tax called rates.) While the former government asserted that bareland had no economic value, it nevertheless collected money in the form of ground rent.
Under current law, all private properties are merely improvements, built on land which is theproperty of the government. However, an existing law attempts to protect tenants by controlling thelevel of rents charged. (In effect, they live in flats under subleases of parts of buildings built ongovernment-owned lands.)
CAP 438 (the Rent Act), 1972, states that the correct value of rent for buildings rented totenants by the actual holder of the government lease was 15 percent per year on the sum of the costof construction and the value of the land. This law was not appealed nor amended when theConversion Act, which declared in ARTICLE 12 that bare land has no value," was enacted in 1975.
By not repealing CAP 438 (the Rent Act), 1972, the government implicitly accepted the fact that bareland has value to those who control it.
The actual market value of land varies greatly from site to site, depending mainly on its size,location, and services. In Zambia, however, the MOL simply assesses a ground rent that each holdermust pay annually to the government for the use of the land. These rents are established arbitrarilyand change every few years by administrative decision. In the current version, ground rents perhectare differ between residential, farming, and commercial sites. Little or no effort has been madein the past to adjust the rents for site variances. In a proper ground rent system, rents would be higheron the more valuable locations (e.g., along a major highway or on the shore of a river or lake).
After the inflation of recent years, the rents under present law are so low as to be meaningless.Rent collection, aside from that required at the time of transfer, is rarely enforced. The present groundrents were set in 1991, on the basis of the locality and the land use, at rates per hectare or part of a
" Some functionaries did not see the two laws as contradictory; they put down "zero" as the value of the land, becausethe president said that was its value. They then calculated the maximum legal rent accordingly.

130
hectare. Residential land is charged at low rates; commercial or industrial interests must pay more(table 4.3). Land held by churches and charitable organizations is not exempt, although it is leasedat lower annual ground rents. Agricultural land and land in mining areas are subject to ground rentsthat vary by size of holding and by proximity to the main cities (tables 4.4 and 4.5).
Table 4.3: Ground rent charges for nonagricultural lands, Zambia,as set in Amendment 15 (1991) of the Conversion Act
Ground rent per year, per hectare or part of a hectare
Commercial or Churches andLocation industrial Residential charities
Lusaka K5,000 1(2,000 1(500
Ndola and Kitwe 5,000 2,000 200
Municipal councils 5,000 1,500 200
Councils 2,500 500 150
Rural bomas 1,000 200 100
Table 4.4: Ground rent charges for agricultural lands, Zambia,as set in Amendment 15 (1991) to the Conversion Act
Table 4.5: Ground rent charges for land in mining areas, Zambia,as set in Amendment 15 (1991) to the Conversion Act
Ground rent per year
Smallholding (2,600 m2 or less)
All others, per hectare or fraction'
a. Presumably, holdings between 2,600 square meters and 3 hectares also pay the minimum ground rentof K300/year.
Ground rent per year, per hectare or part of a hectare
Within a 12 km radius of the cityBracket by size centers of Lusaka, Kitwe or Ndola All other areas
First hectare
Next 99 ha, each
Next 150 ha, each
All over 250 ha, each
K1,000
10
15
20
K400
10
15
20
K300
100

131
B. Proposed mechanisms for setting ground rents
Three years ago, the GOZ obtained technical assistance from the Government of Sweden aspart of an institutional cooperation contract between the Lands Department of the Ministry of Water,Lands and Natural Resources, and Swedsurvey, the Overseas Agency of the National Land Surveyof Sweden, to study current levels of ground rents and recommend a definitive system (study hereafterreferred to as the Hammar report). The final report was prepared, but no further action was taken.There is now renewed interest in the study and the Swedish Embassy has been asked to bring the teamleader back in the near future.
The following preliminary analysis and recommendations were presented and discussed at aconference attended by the executive leaders of Zambian government departments dealing with landmanagement and planning: the Commissioner of Lands, Acting Assistant Surveyor General, Directorof Agriculture, Director of the Government Valuation Department, and the Deputy Commissioner ofTown and Country Planning.
1. Conceptual basis for charging ground rents
A lease includes specified forms and conditions, one of which is the payment of an annualground rent. The basic concept of ground rents is that leaseholders receive substantial benefits fromaccess to the expensive infrastructure built and maintained by the state and ought to make a reasonablecontribution toward those costs. The current system assesses the amount of ground rent solely on thebasis of the zoning of the area in which the plot of land lies. As the study notes,
The rates are arbitrary and uniform in application. They are not based on anyempirical data. The rents charged for all types of land are extremely low and arenegligible compared with the economic benefits enjoyed by the users (Hammar 1990,p. 6).
As true as this was in 1990, by 1993, three years of inflation left the rents lower still in realterms—so low that when a leaseholder does bother to pay arrears, it can generally be done out ofpocket change.
The study deals diplomatically with the myth that land has no market value, and that there isno market in land:
Only the State can own land in Zambia and, therefore, undeveloped, vacant land isnot a saleable commodity....Despite this, it is clear that the leaseholder does attachvalue to the land depending on, in addition to its size, the privilege of using it, itslocation, the land capability, and the availability of physical and social infrastructure.The leaseholder does, for rational reasons, attach value to his land despite the fact thathe cannot sell it. Thus land has a definite value to the lessee and it is this value thathas been adopted as the value concept for this study (Hammar 1990, p. 6).
While vacant, undeveloped land does not generate income and therefore might appear to haveno economic value, the exclusive right to use and improve a particularly well-located piece of land

132
for a stated period of time has enormous value. There is a very active market for leases giving theright to use specific plots of land for specific periods of time (99 years). If the land is said to haveno value, the lease that determines who gets to use and improve it certainly does have value. Theconfusion is not whether God-given land has a price, but rather that the infrastructure built bygovernments, and the decisions whereby people decide where to live, or to build stores and factories,are what give value to location. And a desirable location will invariably have value, both from natural,God-given attributes such as climate, and from factors that stem from human actions, such as buildingcities, roads, and ports.
The study proposes that ground rent for agricultural land should be based on the potentialannual economic output per hectare of land which is managed in an optimum manner. The leaseholdershould pay a fair portion of the expected gross margins as a yearly ground rent to the state; it goeson to suggest that 20 percent would be that fair portion (Hammar 1990, p. 7).
It would appear from the study that the state ought to act like a normal landlord, chargingsomething similar to (though a bit lower than) the going market rental prices for rural land. Aroundthe world, agricultural land in settled farming areas tends to rent for somewhere between a third anda half of the gross value of output. However, out of that the landlord often pays part—sometimes asmuch as half—of the cost of purchased inputs like fertilizer, seed, and machine services. This isalmost always the case when the rent is stated as half of the harvest, the landlord usually pays halfof the cost of purchased inputs other than labor. On the other hand, when the rent is paid in cash, atplanting time, it tends to be less—often around a third of the normal harvest in the area, and thelandlord seldom helps with buying inputs.
For urban rental properties, the rent charged to occupy a flat tends to be closer to 10 to 20percent of the capital value of the land and buildings. The urban landlord also has expenses to cover,but few of them are related to the land under the building; almost all refer to maintenance of thebuilding, and collection of the rent. Thus, if a separate figure is needed to represent a normal returnon investment in the land under a building, it is customary to estimate first the market value of theland, and then regard the rent attributable to the land as basically a return on a financial investmentwith relatively little risk or cost—perhaps comparable to the return to an insured certificate of depositat a major bank.
The financial markets in Zambia are far from perfect, particularly because of recent inflation.Even government securities have paid returns as high as 100 percent a year in kwacha, but this cannotbe regarded as normal. Adjusted for expected inflation, the real rate of return on capital in safeinvestments in other countries tends to be on the order of 4 to 6 percent a year, and this would be areasonable standard to apply in Zambia—but with an effective provision so that actual ground rentswould rise from year to year according to the actual rate of inflation.
2. Implementation: urban areas
The Hammar report further suggests that residential stands be charged an economic groundrent based on the optimum permitted use of the property, which is defined by zoning. It estimates thatthe "land value portion" of the total value of the property would be estimated between 10 percent ofthe total value of the land plus improvements (for poor quality housing) to 40 percent (for the bestquality housing). After estimating the land value portion, the report suggests that the state, as landlord,could reasonably charge 5 percent of that amount per year for a normal residential stand.

133
At 1989 price levels, table 4.6 shows the recommendations of the Hammar report as toappropriate annual ground rents for normal-sized house plots, varying according to location.
Table 4.6: Annual ground rents, residential plots, by location (in 1989 kwacha/plot)
Location Low cost Medium cost High cost All stands
Lusaka 625 8,000 54,000Kitwe 250 2,000 10,000Chingola 190 1,500 7,500Chililabombwe 160 1,000 5,100Provincial towns 1,340Townships 1,200Small townships 940Centers 540
Source: Hammar 1990, p. 8.
Comparing these 1989 figures with those of table 4.3, it is obvious that after inflation, therates charged starting in 1991 do not come close to the recommended levels in kwacha. With thefurther inflation since 1991, it is no wonder that the Lands Department does not collect enough annualground rent to do much (chapter 2). The Hammar report suggests that ground rents, once brought upto date, be adjusted annually by computer, to reflect price levels. The CPI would be used forresidential stands, but for agricultural lands it suggests that the price of maize would also be suitable(Hammar 1990, p. 9).
3. Implementation: rural areas
It is proposed in the study that the expected gross margins for farmland, in kwacha perhectare, be estimated on the basis of attributes representing the capability of the land (estimated as thepercent of the holding that is arable), the influence of agroecological zone, location with respect tomarkets, and available infrastructure (table 4.7). Each factor is assigned a set of brackets; for instance,land class is estimated on the basis of the percent arable: 81 percent or more, 41-80 percent, 20-40percent, or under 20 percent. Market distance is estimated as 1-10 km, 11-30 km, 31-40 km, or over40 km. Infrastructure is estimated as "best," "fairly good," or "very bad." The study then classifiesagricultural land, at the level of regional plans, on the basis of these four factors. The result, basedon 1989 price levels, ranges from gross margins of 200 to 3,000 kwacha per hectare. At 20 percentfor the state acting as landlord, the annual rents would have ranged from about K40 to about K750per hectare per year.

134
Table 4.7: Ground rents in 1989 prices for typical types of leases on farmland
Agroecological Land class Distance to Infrastructure Annual ground rentzone (% arable) market (lun) due (1989 kwacha/ha)
I 81-100% 1-10 "best" 310I 41-60% 31-40 "fairly good" 140I <20% >40 "very bad" 35
Iia 81-100% 1-10 "best" 610Iia 41-60% 31-40 "fairly good" 300Iia <20% >40 "very bad" 70
III 81-100% 1-10 "best" 350III 41-60% 31-40 "fairly good" 160III <20% >40 "very bad" 40
Source: Hammar 1990, p. 7.
In 1991, Amendment 15 to the Conversion Act raised ground rent charges somewhat (see table4.4) but did not come anywhere near levels recommended in the Hammar report. The rent was set at10 to 20 kwacha per hectare for everything above the first hectare. The first hectare was to pay K400,except if the land is within 12 km of the city centers of Lusaka, Kitwe, or Ndola, in which case therate was raised to K1,000. At present prices, even the first hectare ground rent is scarcely worth thetrouble to collect. This is clearly not even close to an appropriate contribution of the leaseholder tothe cost of building and maintaining the infrastructure which the land enjoys. 12
4. Prospective revenues
According to the Hammar report, if the proposed ground rent system is implemented with thesuggested levels, as a fair return to the state, the potential revenue in 1989 kwacha would be about1.1 billion if government-owned housing were included, and 800 million if it were not included(Hammar 1990, p. 9). The report does not state how much actual ground rent was collected in 1989,but it does note that the government's total revenue from all sources that year was only K7,884million.
C. Preliminary suggestions for ground rents in 1994 and thereafter
This study certainly agrees that ground rents should be raised considerably from present levels.One starting point has been brought forth by Sonny Mulenga, who suggests that 10 percent of theminimum development value could be presumed to be the minimum value of the land under the
12 Of course, like ratepayers in Lusaka, some leaseholders could object that the infrastructure is badly maintained andso not worth much to them. However, potholes and other signs of poor maintenance can be improved fa irly quickly. Ifground rents are raised to appropriate levels similar to those a private landlord would charge, it would be good politics tospend some money immediately, so that the roads and other services are obviously being improved.

135
development. That amount would then be assessed an annual ground rent of 4.5 percent, which isapproximately the estimated market return on a secure investment in improvable land. For example,consider a 100 square meter house in Lusaka, assigned a minimum development value of K115,000per m2 , in 1993 kwacha. The improvement would be estimated to be worth at least K11.5 million. Theland value would be estimated to be not less than 10 percent of that, or K1.15 million, 4.5 percentof which would give an annual ground rent due of K51,750 in calendar 1993. For 1994, of course,the ground rent should be adjusted upward by the change in the CPI during 1993. If one were toassume that the land under the average house in Lusaka were worth 25 percent of the price of theimprovements, 13 rather than 10 percent, then the ground rent due during 1993 should have been onaverage K129,375. However, further research aided by experts on valuation would be needed todetermine whether 25 percent is in fact an appropriate estimate. Perhaps it would be feasible to followthe Hammar report model, and categorize each sector of the city into low-, medium-, and high-costconstruction areas.
A related question is whether public policy should continue to subsidize residential areas withrelatively large gardens behind walls, in which relatively small but high-cost houses sit. Further studyshould consider a mechanism that will base ground rents on an average amount of land per dwellingbut charge more for estates so large that two or more houses could readily occupy the land withoutlosing all the amenities. Eventually, as land values rise in the market, the very large stands will bedivided or will be used to build condominium apartment buildings.
A private landlord will not refrain from collecting annual rent from a tenant just because thetenant chooses not to live in, or to till, a dwelling or a piece of farmland. The landlord will collectthe rent in any case, since the tenant had by lease the right to dwell or the right to till, excludinganyone else from doing so. Likewise, the state should collect ground rent on vacant lots and idlefarmland.
In discussions of the proposed land development fund (following section), it is usually assumedthat the fund will have ground rents as an important source of funds with which to operate. It shouldbe noted, therefore, that until and unless economic ground rents are in fact imposed and collected aseffectively as a private landlord would impose and collect them, the proposed fund will lack theresources with which to work. At the same time, the state, acting as the landlord, needs to think likea good estate agent. Ground rents collected will need to go into improved road maintenance and otherinfrastructure investments that in turn justify the significant increase in ground rents.
VI. Proposed tax reforms
Proposed changes in land laws are now circulating in two closely related draft laws: the LandTitles Act and the Land and Deeds Registry Amendment Act. The Land Titles Act draft includes aprovision that "any person who holds land under customary tenure may convert it into leaseholdtenure." This would add the land in question to the supply of land on which annual ground rents
13 The Hammar study suggests that over the world, land values tend to be from 10 to 40 percent of the value ofimprovements on urban residential stands, with the least desirable locations being on the low end and the best locations beingon the high end. This is certainly consistent with experience in the United States and in various countries of Latin Americaand the Caribbean.

136
payable to the government would be due. Some concern has been expressed about the wisdom ofallowing scattered conversion of landholdings in customary areas. A significant increase in annualground rents would give holders a reason to hesitate before applying for conversion.
The Land Titles Act reform draft also repeals and replaces SECTIONS 10 and 12, droppingassertions that bare land has no economic value. It further provides that the president, when grantingland, "may fix consideration and ground rent which may be reasonable depending on the location andthe size of the land." This appears to be a prudent provision, that should provide ample authority forneeded administrative reforms in valuation and in the setting of initial fees and recurring or annualground rents.
The draft adds a provision that on expiry of a lease, if all the conditions and covenants in ithave been complied with, "the lease shall be deemed to have been extended for a like term. Theregistrar, on production of a certificate of such compliance from the President, shall issue a Certificateof Title to that effect." To further reassure leaseholders who hesitate to invest as expirationapproaches, the law should also allow holders to obtain a compliance certificate and request a 99-yearrenewal at any time, even if the current lease has not expired.
The draft reform provides that failure to pay ground rent on due dates will triple the amountdue, and failure to pay that amount upon demand will entitle the president to enter a certificate ofreentry in the register, without notice, in effect canceling the leasehold. This should increasecollections, provided the regular ground rent is itself appropriately determined, and that thegovernment acts in a responsible manner. The penalty of lease cancellation, if effectively enforced,should cause mortgage lenders to see that their debtors pay ground rents, and on time, so as not toimpair the collateral on their loans.
VII. Land development fund
A. Proposals and assessment
The land conference of July 1993 (see chapter 1) strongly recommended the creation of a landdevelopment fund (LDF). There was considerable agreement that it would have as its resources groundrents paid by leaseholders, consent fees charged to the assignees of newly distributed lands, and otherreceipts from government or private land transactions. An MOL official memorandum suggests thatthe fund be used for "plot demarcations, roads and bridges construction, provision of water supplies(dams, wells, and boreholes), dip tank construction, conservation works, and fencing. Beneficiarieswould repay the investment in annual installments over ten years, with interest. Payments would goback into the fund, which would operate as a revolving fund. n 14 It suggests that the fund begin bymaking such investments in the vast undeveloped areas (former Reserve and Trust Lands), and laterinclude individual emergent farmers who are not in the farming blocks nor in the settlement schemes.Once the fund is serving these first two phases well, it suggests converting it into an autonomous fundthat serves commercial farmers in addition to the schemes and emergent farmers. However, theparticipants did not reach consensus about the fund's objectives and priorities. Various possibilities
14D. Siansumo1. , Principal Lands Officer, "Development Fund" memorandum, 20 October 1993.

137
have been mentioned; the leaders among these are detailed below. It will not be easy to resolve theseconflicting demands for the same funds.
1. Increasing the supply of serviced farmlands
When the fund first considers an area for development, it should "freeze" the area to preventthe issuance or registry of any further state or customary consents awarding land to anyone.Otherwise, insiders will grab all the land before the fund opens it up, creating at least the appearanceof corruption. This grabbing would also prevent the fund from helping either the best farm operators,redundant state employees, or other disadvantaged persons needing assistance. Secondly, beforecommitting itself to develop a specific area, the fund should make a complete inventory of land rightsin the area and negotiate with existing holders of leaseholds, firewood or grazing rights, or any otherland rights. The fund then would buy out holders who are willing to sell, at the current market valueof their holdings (not at the value which those holdings will have after the fund develops the areaa ).''
The fund should also negotiate with holders who are not willing to sell, as to the amount ofmoney or land these holders will contribute as their fair share of the investment the fund will makein developing the area. Whenever land is already privately owned or held on long-term leaseholdsbefore government provides improvements, it is entirely reasonable to expect those who profit therebyto contribute most or all of the cost of the improvements. (Colombia, among other countries, makesa formal determination of benefits and assigns a share to each beneficiary at the feasibility study stageof a project [Rhodes 1990]). If the landowners argue that they cannot afford to contribute the amountby which the project feasibility report says they will benefit, the government can then say that thefeasibility report is wrong and that the project is not justified, so it won't be built. If the landownersrespond that the project should be built anyway, without charging them for part of the increased valueit will give to their property, at least their greed is demonstrated.
Payment, of course, can wait until the project is actually built and benefits realized. Theamount due from each owner should be documented with promissory notes and a mortgage, properlyrecorded, and subject to a price index clause to guard against inflation, as well as interest at a normalrate for other investments. If there is no provision for inflation protection through indexing, theinterest rate should at least be that rate which the government itself pays when borrowing. In effect,government is lending money to the property owners who benefit from a project, and they repay overtime.
In some countries, such as the Dominican Republic, existing holders are required by law toturn over part of their land, without compensation, as their contribution to state-funded irrigationprojects. They still benefit, because the irrigation greatly increases the value of their remainingholdings. But by turning over part of their land, they enable the government to share the benefits ofthat investment with landless laborers or other disadvantaged persons.
15 Until a much more active market exists in land rights, these values will have to be estimated by capitalizing averagepotential net incomes. Before construction of improvements actually begins, an independent authority—perhaps an electedcouncil, a traditional chief, or an independent auditing firm—would investigate and verify that fa ir compensation was actuallypaid to families that lose land or rights, just as is required by the World Bank when families are forced to move for Bank-financed dams and similar projects.

138
In other cases, when government extends services to privately owned peri-urban land whichthen becomes valuable residential sites, the owners of the undeveloped tracts are required to donateto the local council suitable sites for schools, clinics, markets, and other services. Their compensationfor these sites consists of the state-financed roads, water and electric lines that made their landholdingsmore valuable. As in the irrigation case, they still gain substantially, but at least the council is notforced to later buy sites at market prices for needed community facilities.
There are several alternative ways in which the LDF could be used to increase the supply ofserviced farmlands:
► improve the idle or underutilized land in the state tenure area, recaptured from those who holdleases now but are not using the land productively (once improved, it would be leased anew,preferably at open, public auction);
► rehabilitate run-down and unproductive state farms that are to be privatized (actually, wewould prefer a cheaper, faster process—auctioning these state farms "as is," letting the biddersdevelop the land with their own funds);
► make loans to emergent farmers who do not have access to loans from commercial banksbecause they are unable to provide sufficient guarantees of repayment (such a plan shouldbegin with serious analysis of alternative schemes that make it likely that the emergent-farmerborrowers will in fact repay the loans, 16 and that enable those farmers to thereafter apply tocommercial banks precisely because they have demonstrated creditworthiness);
► improve newly created leaseholds that government wants to create in customary tenure lands,thereby converting customary into State Lands; or
► finance improvements to land in traditional villages in customary areas.
2. Who pays for the land and improvements?
There are several approaches the fund could use to finance land and improvements:
► outright gifts or grants to disadvantaged persons;► installment loans which the beneficiaries would have to repay over a period of months or years
(the period might vary according to the type of improvement, and incentives such as free lifeinsurance might be provided for those who repaid punctually and in full); or
► increase the annual ground rent payment required of the leaseholder by enough to recover theamount invested by the fund, with interest (this is similar to the case of a private landholderwho finances construction of a house or flat and then rents it to a tenant). 17
3. Who provides the improvements?
In each approach, the state could do the actual construction, contract with private firms to dothe work, or make loans to the lessees, with which they would hire the work done (and supervise it).Some types of investment (such as access roads into a new land block) would best be contracted forand supervised by the state. Most on-farm improvements (such as fences, tree crops, wells, and
See, for instance, Strasma 1992.A form of this, using two accounts (one for normal ground rent, and the other for recovery, at interest, of the
premium caused by the LDF improvements), has been used in settlement schemes and in the opening of new labor blocs.

139
dwellings) might best be financed as long-term credit to farmers, who themselves would hire laboras needed, and supervise the job. They would supply part of the labor themselves, as well as providemore effective supervision and quality control than normally occurs with government visits.
4. Other uses of the LDF
All of the previous ideas as to uses of the LDF suppose that its purpose is to develop land.Plot demarcation, roads and bridges, dams, wells and boreholes, dip tank construction, land levelling,conservation works, and fencing were all proposed. However, in interviews, some Zambians havementioned other possible uses of this money, as a revolving fund of loans oriented largely toincreasing production by specific households or groups:
► production loans to women, redundant state or parastatal employees, and other disadvantagedpersons, to enable them to become productive emerging farmers and gradually build up theirown working capital;
► land purchase loans to the disadvantaged, enabling them to purchase leasehold interests fromother persons who are unable to put their leased land to productive use; or
► loans to enable emerging cooperatives or farm supply companies to go into the business ofsupplying farming inputs and perhaps marketing production as well.
The previous set of ideas on using the LDF for loans would all be dedicated to increasingproduction. Still other possible uses mentioned would have social elements:
► finance the building and operating costs of community facilities, clinics, and schools to benefitsmall farmers in densely populated but poorly serviced rural areas;
► compensate families who lose grazing, gathering, or similar rights over customary land whenit is converted into leaseholds in the state sector;
► grants or low-cost investment loans to landless rural families in overpopulated areas, to helpthem move to areas with available land; or
► loans to councils to help them service town plots, reducing the relative attraction of movingto shantytowns in Lusaka or the Copperbelt.
5. Donor assistance
With so many ideas floating around as to how to use the higher ground rents, consent fees,and other resources obtained by charging rents or fees closer to market values, it is no wonder thatthe land conference did not yield a consensus on which uses should have priority, nor even on howthis would be decided. One final hope expressed by participants was that donor organizations mightcontribute to a well-managed LDF. These organizations generally favor charging market rents andsignificant taxes (rates); they might well offer matching contributions to the fund once the governmentactually implements such policies.
B. Legal reforms: The draft law
The draft Land Titles Act proposes in SEC. 20 to establish a land development fund. The draftproposes sources for its funding, a structure for policymaking for the fund, and its objectives.However, the draft is silent on many aspects that will be critical if the LDF is to be successful.

140
1. Uses
SEC. 20(7) of the draft states that the moneys of the fund are for "grants to councils situatedin rural areas for development of land and making of roads,...opening up of new areas fordevelopment,...the improvement and development of agriculture,...the supply of water for domesticfarming and irrigation purposes,...and generally, such other purposes for the direct benefit of thepeople in ensuring that more land is made available for development and is developed." Theseobjectives are quite broad and duplicate the objectives of other agencies, provided for in the annualgovernment budget. Improvement and development of agriculture coincides with the objectives of theentire budget of the Ministry of Agriculture. The water-supply objective does the same for governmentagencies concerned with water projects. Also, the building of local roads is often an activity of localgovernment, funded in part with property taxes (rates). Ground rents could also be channeled throughlocal councils.
If ground rents and other fees collected by the state continue to be taken off to Lusaka andthen routed back to some but not all rural areas, through decisions made in Lusaka, the fund maywork against the government's announced goal of decentralization. If, on the other hand, the fund ispolitically necessary as the only way to get ground rents and fees up to economic levels, and hencepressure speculators to put land to productive use, then the fund may still be justified. It might be agood idea to include in the law provision that all moneys raised from land-related fees be invested inthe same province where they are raised.
Curiously, however, the draft law does not explicitly allow investing in existing butunderutilized state sector leaseholds, nor improving run-down state farms that are sold to commercialfarmers, smallholders, or emerging farmers. Surely government could show visible, positive resultsmore swiftly in that area than in opening up new land in customary tenure areas. Still, the objectivesare probably broad enough to include this area too. According to the 1994 budget message (p. 10),a pilot scheme to subdivide state-owned farms for commercial use is under way.
The opening of new areas has been a main objective set forth by proponents of the LDF fromthe beginning, but the draft law is totally silent as to who exactly is to benefit from this. Before anarea is opened, the land rights situation should be inventoried. Planning for the project should bespecific as to who is expected to benefit and how much they are required to contribute to the cost ofthe project. Will foreign investors, who likely will have leverage in competitive bidding, be givenopen and full access or should controls be placed on their actions through quotas or special fees? Willnewly improved lands be allocated to political insiders at little or no charge, as in previous republics?Or will ground rents close to market levels be charged, and then an open public auction used to decidewho gets the most desirable parcels at those rental levels? The latter would generate far more revenuesfor the fund, enabling government to develop land much sooner than if land is allocated byadministrative discretion. If running projects through the fund instead of the regular budget increasesaccountability and productivity and helps justify the change to market-level ground rents and fees, thisis positive. It remains to be seen whether the fund, as proposed in the draft law, would in fact beaccountable and efficiently managed.
One might suggest redrafting these objectives, perhaps based only on the "opening areas" and"other purposes" clauses and setting forth very specific provisions to ensure that (1) more land is madeavailable for development, (2) it is in fact developed, and (3) those who get the land effectively paymarket values for it, with a significant cash initial payment and an effective collection mechanism for

141
the remaining installments. The only exceptions to payment of full value should be persons who areclearly disadvantaged, a category that does not include the high officials and other insiders who haveoften received lands assigned administratively in the past. Even the disadvantaged should make somepayment, and there should be a provision to recapture the subsidy element should they leave the landand sublease or transfer it to someone else.
2. Discretionary investment
SECTION 20(8) says: "Any money which is not immediately required for any of the purposesset out...above, may be invested at the discretion of the Ministers responsible for the administrationof the Fund." Given the breadth of the proposed objectives, it is unlikely that the fund would have"moneys not immediately required for any of the purposes set out." However, given the totaldiscretion the draft law offers the ministers, it is not hard to imagine that future ministers, wantingto do something entirely different from the purposes of the LDF, might be tempted to decide not topursue its purposes, in order to "invest" the money in something else. Worse, this provision appearsto allow the four ministers absolute and total discretion. They could decide to invest in banks payingless interest than Treasury bills or less than the highest rates currently available at other banks. Itwould appear that they could even invest in loans to private businesses. If questioned, the attorneygeneral might be forced to say that this was permitted by the law, if enacted with the present wording.Since this is surely not the intent of the drafters of the law, the wording should be changed to avoidany doubt.
Other countries generally have transparent, professionally managed provisions to investgovernment agency funds not currently needed. There is no reason to require the managers ordirectors of the LDF itself to make decisions on short-term investment of government funds. This ispart of the job of a treasurer, who manages balances for all government agencies. For example, somecountries specify that all funds of parastatals, which the fund somewhat resembles, not required fordisbursement within the week, must be held in an account in the central or state bank. This reducesthe amount of money in circulation and hence at least contributes to controlling inflation. It alsoreduces the opportunities for corruption, and lets the fund directors concentrate on their main task,land development.
3. Accountability and transparency
The draft law provides, in SEC. 20(9), for annual financial statements to be provided only tothe very government officials in charge of the fund: "The Ministers responsible for the administrationof the Fund shall ensure that an annual statement of the income and expenditure is prepared andfurnished to the President and all the four Ministers responsible for the Fund." Drafted this way, thelaw does not provide for:
► conducting an independent, outside, annual audit of the accounts;► making these accounts available to the public through timely publication in the press, as banks
do; nor► submitting audited financial statements to parliament, nor to anyone other than the very
persons who are given authority to spend moneys in the fund.
If these omissions are not corrected, the public will be unable to determine whether funds havebeen spent honestly and wisely. Given the history of some other state funds, the public might assume

142
the worst, and respond accordingly in the next elections. The moneys to be spent through the Fundare to be obtained through needed reforms in the present land legislation. However, if the public fearsthat the money will be squandered, it will not support those needed reforms. The draft provisions forthe fund should therefore be modified not only to target fund activities more appropriately, but alsoin order to ensure support for the other needed land policy reforms.
4. Operation of the LDF
How can the fund make its investment start sooner and go farther, ensure that thedisadvantaged participate, and ensure that land it develops is actually tilled? The Privatization Agencymight well work closely with the LDF in order to show results quickly. For instance, an existing butunproductive state farm might be divided partly in four commercial family farms. Each would haveto pay an annual ground rent at about the same level as a private owner would charge a tenant. Thesewould be auctioned to the highest bidder while the rest of the state farm is split into another 40smallholder plots.'8 Their ground rent could be a little lower per acre, as a subsidy.
These smaller farms would also be auctioned to the highest bidders; but for them, biddingwould be limited to persons owning no other land and who are deemed disadvantaged. For example,bids might be invited from persons who have been declared redundant in state or parastatalemployment or fear that they soon will be. In order to bid, they should show some knowledge offarming and promise that they will move onto and cultivate the parcel if their bid wins. Retrenchedemployees should be allowed to use their separation pay toward payment for the small leaseholds.However, the LDF might also identify qualified disadvantaged persons, such as landless farm laborers,who did not have separation pay to help them bid. They could be given "seed money" grants as initialworking capital, though they would still be required to make some kind of down payment in order toshow that they have some capacity to save, and that they understand that the parcels are not gifts, asprevious government programs have been. 19 In both cases, provision could be made for payment ofat least 25 percent of the bid price in cash, with the balance due over 10 years (commercial farms)or 15 years (small parcels), at interest. Interest and repayment should be calculated each year in thecurrent value of maize or other principal crops of the area in order to avoid decapitalization of theLDF through inflation.
Likewise, the sale should include a reversion clause providing that the LDF would inspect allland sold one year after sale, to verify that it is in fact in cultivation and determine whether the ownerdid in fact live on it. If not, the lease should include full authority for the fund to nullify the sale,evict the unsatisfactory "buyer," and sell to another eligible farmer as part of its next auction. Wherespecific conditions made the delay justifiable, the fund would make a public finding to that effect, andgive an extension of six months or a year to that buyer.
18 Some team members question the division of large state farms into part-commercial and part-emergent or peasantfarms. Others feel that diversity has merit, that each can learn from the other, and that an open land market will in timedetermine the best mix.
19 This example is built on a national land fund recently created in Honduras. That fund uses payments made by landreform and squatter titling program beneficiaries to help landless farm laborers buy small parcels in the land market. Noone who owns more than 10 ha, including the land being bought, may receive credit from that fund. A 20 percent downpayment is required. See Strasma, Meza, and Umana 1993.

143
However, in practice, the fund should also authorize any buyer to sell the leasehold, evenbefore the year was up, to any person who would have been eligible to buy at the auction. For salesduring the first year, the price would be the price originally bid at the auction, less the unpaid debt,which the new buyer would assume. In addition, the new buyer would pay the seller any mutuallyagreed-upon amount for improvements made since the purchase at auction. The object is to obtain thehighest possible price at the auction while ensuring that the land is in fact farmed. If the first buyeris unable for any reason to bring the land into appropriate use, he or she should sell it to someone elsewho can and will do so. Thus, the fund should seldom, if ever, actually need to recover a farm itself.As long as the parcel has been sold at auction, not given away free to a favored few as in the past,the price on resale will not be very different from the auction price, and hence there is no need tocontrol it. Once the year-end inspection has verified that the buyer has placed the land in production,there would be no further need for supervision. And any owner who wanted to sell or sublet theleasehold would be allowed to do so, just like any other small farmer.
5. Potential buyers and sellers
Since a more fluid, transparent land market would enhance Zambian development and thewelfare of small farmers, the fund should invite anyone who would like to buy a farm or smallholdingthat becomes available to put his or her name on a list of candidates. This list would be made availableto anyone, not just buyers at auction, that may want to sell land in small parcels. Likewise, the fundshould invite other landholders, as well as any of its own buyers who change their minds, to advisethe public, estate agents, and others that they are interested in selling and would like to receive offers.In this simple way, the LDF could do much to increase the efficiency of the Zambian land market,and reduce the cost, in time as well as money, required for someone who wants to find and buy asmall farm in order to make it produce.
VIII. Summary, conclusions, and recommendations
A. Summary and conclusions
The land market in Zambia is by all accounts more visible than it was three years ago, but itis still far from efficient. People who seek access to land for productive purposes still have troubleidentifying some of the land that would serve their needs, and people who think they have secureaccess to a specific piece of land, but have not yet built a substantial building or are using it, may findthat access revoked on ground that they are not "using" it to the satisfaction of government. Theconverse also applies. A government functionary may decide that a piece of land is not being used andtherefore may revoke its lease and promise the land to someone else. However, the new leaseholdermay be informed before actually getting possession that the former leaseholder has appealed to thecourts, leaving the whole issue without resolution.
In another example of the insecurity of possession of leaseholds on state land, a person whoadvertises the availability of vacant land suited to commercial or industrial use attracts the attentionof a functionary. That functionary may cancel the original leasehold without compensation, on groundsthat the previous leaseholder is not using the land, which had been a condition of the lease. Naturally,leaseholders who have not yet developed the land will once again hesitate to advertise their willingnessto sell. These incidents happen frequently enough that it is fair to say that the land market is still

144
somewhat opaque and that secure possession of land with good potential for farming (or of other landnot yet improved) is subject to insecurity.
No land may be transferred without permission from some civil authority, be it the chief ofa traditional community or the Commissioner of Lands. Despite reforms making the process simpler,there is no guarantee that approval will be granted, nor any published list of conditions to fulfill inorder to insure that approval will be granted. Thus a future commissioner might be tempted to fallback into corrupt practices, demanding payment of a bribe to authorize the sale of leasehold interests.
Zambian law provides that cities, towns, and rural councils may collect rates, an annual taxon the value of buildings and other improvements, but not on the value of the land under them. Thelaw also authorizes the central government to collect a fee for assigning state land to an applicant, andthen an annual ground rent for that particular land. In practice, both rates and ground rents havelagged far behind inflation and bring in very little revenue. This should be corrected, so thatspeculators will find it expensive not to develop leaseholds, and so that local governments can financeneeded services, roads, schools, or other public goods. Yet, because of the difficulty of separating thevalue of land from improvements, there is also the risk of excessive double taxation—i.e., setting bothrates so high as to make the combined effect regressive to production incentives.
B. Recommendations
1. Abolish impediments to the subdivision of urban or rural land.
Existing law, by requiring presidential consent before any land transfer, also in effect requiresthat consent be sought before any division into two or more parcels. Implicitly, this law asserts thatthe government (i.e., the Commissioner of Lands) knows better than anyone else what the correct sizeand layout of every piece of land ought to be. Since appropriate site sizes change continuously,according to many different factors affecting the supply and demand of land on the market, thisrequirement is absurd.
This does not mean that government should have no say on land uses and transfers. There isnothing wrong with clear, logical rules that limit land uses in specific areas in order to protect thewater sources for a city, or to prevent pollution by certain activities that tend to contaminate soil andgroundwater. However, an efficient land market is one in which all landholders (lease or freehold)are able to sell off part of their land, and are equally free to buy a piece of land and annex it to theirown holdings in order to create a farm or a site suitable to their needs. The land market in Zambiawill become more efficient, and potential investors will feel more secure, when the law is changed toprovide that all land divisions or mergers that do not violate existing land-use regulations dulypromulgated will be approved automatically.
One could go further, providing by law that if the government agency involved fails to act atall within a certain number of days after presentation of the paperwork, the application is deemedapproved. The interested party would then need only to present to an ombudsman or to a landstribunal proof that the application was presented in the appropriate office on a certain date, and thatafter the specified number of days, that same office certified that the agency had not made anydetermination as to whether it was in order. In that case, the ombudsman or tribunal wouldimmediately issue a finding that the application was deemed by law to have been approved.

145
2. Convert presidential consent into an automatic right of theleaseholder to transfer, subject to clear, written, verifiable, andimpersonal criteria.
The act of recording a transfer would constitute documentation of presidential consent. Refusalof the registrar to record a transfer within 90 days of the time presented could be appealed to the landtribunal, which would determine definitively whether the transfer was in order or not and instruct theregistrar to proceed accordingly.
3. Create procedures for the renewal of leases upon demand, subject toagreed investments.
Present law states that 14-year leaseholds can be converted into 99-year leases upon demand,by proving that improvements have been built. However, there is as yet no provision for renewal ofthe 99-year leases. Draft laws state that these leases "may" be renewed, but do not say that they "will"be renewed upon request, nor do the laws state if any conditions are to be imposed on the renewal.
For an efficient land market, the rules for renewal should be clear. It would be logical toprovide for renegotiation of the amount of the annual ground rent, for instance. The point is simplythat since improvements pass to the government upon expiration of the lease, an investor should havethe right to renew a 99-year lease earlier than 99 years if he/she is planning to make a furtherinvestment in improvements. Such renewals are routine in Baltimore, Maryland, for example, a UScity in which much of the central business district land is leased on a ground rent basis. Owners ofthe buildings on those sites routinely come to the banks or insurance companies that own the landabout 30 or 40 years before leases expire, to negotiate a new 99-year lease. In this way, the personor company that intends to make a major investment in expanding or modernizing knows that it willremain the owner of the building long enough to fully amortize the investment. This recommendationdoes not necessarily mean a change in the present law; it merely clarifies that a 99-year lease can berenewed for a further 99 years from any time, upon application by the lessee. The present law appearsto be silent on the matter, although it does explicitly allow for the conversion of a 14-year lease toa 99-year lease at any time.
4. Update valuations, and index for the future.
As noted above, existing valuations of land and improvements in Zambia are far below marketvalues. Not only should they be updated, it would be prudent to provide for automatic maintenanceof that value in real terms in the future. Some governments set values in terms of "fiscal units ofvalue" and then provide by law that the monetary value of the fiscal units will change automaticallyaccording to some index of prices that serves as a reference point. This policy does not take noticeof changes in market values arising from population growth, economic development, or publicinvestments that enhance the value of specific parcels of land. For that purpose, one still needs aperiodic reevaluation of all property. However, Zambia has a legal requirement that this be done everyfive years for urban rates; that standard should probably simply be extended to annual ground rentsas well. Between revaluations, however, rates are currently adjusted by increasing the rate of tax onvaluations which quickly become obsolete. There is no similar automatic adjustment of annual groundrents, and there should be. But rather than increase the nominal rate of ground rent on a static marketvalue, it might be easier for the law to specify that the amount of ground rent would be increased or

146
decreased each year according to the rate of increase in a price index, until the next formalrevaluation.
5. Define the rights of leaseholders in the event of unilateral leasecancellation.
The present government has made it fairly clear that it intends to continue the position thatit is the ultimate "owner" of land in the state leasehold sector. One reason given by senior officialsis that the government has, and should have, the right of a landlord to cancel a lease under certaincircumstances. Freehold ownership is not very different: government can still take land held infreehold ownership, but legal systems are usually very clear in stating that the affected owner has theright to full compensation at market value, paid before the land is taken away from its former owner.It would seem appropriate to enact a law providing that in the event that government cancels a leasebefore its expiration, the lessee should have the same right to full, prior, compensation for the valueof improvements made by the lessee. This would then be a curb on unreasonable, arbitrary, or corruptacts by functionaries. Enactment of such a law would be a valuable first step in the needed revisionof the Land Acquisition Act, but it need not await that much lengthier process.
6. Provide for reversion between the state and traditional authorities ifland transferred is not in fact developed as promised.
There are reported instances in which chiefs complained that they had assented to the transferof land to the State based on promises by applicants to make investments and create jobs for the localpeople, but years later no investments had been made and no jobs created. They later learned thatgovernment transferred that land to politicians who were planning a different use for it. Just as thegovernment reserves the right to cancel a lease if investments are not made in the land, perhaps thetraditional chiefs should be allowed to write enforceable contracts specifying that if specific conditionsin the application are not fulfilled, then the land would revert to the chief's control.
7. Consider declaring customary authorities to be the municipalgovernments in rural areas (the Peruvian model).
Zambia now has two major sectors of landholdings and two sets of authorities governing landmatters: the state and the traditional sectors. It has been proposed that all of Zambia should beconsidered one sector, with agencies of the government taking over land-related responsibilities. Analternative, invented in Peru in 1970, is to endow the customary authorities with the same legalpowers that towns and cities have concerning land matters. This achieves the goal of having similarprocedures in both sectors, although (at least in the Peruvian model) the central government respectsthe existing or traditional forms by which the traditional sector chooses its executive (the chiefs andheadmen), rather than imposing a European style of election of authorities. Government may wish tostudy this variant on the suggestion of extending councils to cover the entire country.
8. Consider extending the concept of rates to include all land allocationsas a tax base for local or customary authority budgets.
Present law applies urban rates only to the value of improvements, and only to the value ofimprovements within the so-called rateable areas of cities, towns, and councils. Taxing onlyimprovements encourages speculative holding of valuable land with minimal improvements, which is

147
not favorable to development. The government should explore the feasibility of including the valueof land in the tax base for rates. In addition, it is clear that there is a great scope for investment toopen up rural areas of land with potential for great productivity. It would therefore be reasonable tostudy the extension of rates to cover improvements outside the present "rateable areas." There is noobvious reason why tourist facilities, large processing facilities, etc., should not be taxed to helpfinance the roads that enable people and products to get to and from those facilities; further studywould therefore be in order.


Chapter 5:
Land Tenure and Agricultural Development in Customary Areas:Results from Eastern and Southern Provinces
by
Frank Place, V.R.N. Chinene, Michelo Hansungule, and Fabian Maimbo'
I. Introduction
Previous chapters have identified a number of potential tenure constraints to agriculturaldevelopment in rural areas. This chapter addresses some of these issues by utilizing recent datacollected from rural households mainly located in customary areas of Zambia. LTC, in collaborationwith ICRAF and the University of Zambia undertook a study of nearly 200 households in Eastern andSouthern provinces in 1992-93. The study focused on the link between tenure and on-farm treeplanting activities of households. However, the formal questionnaire used for the study includedgeneral questions on land tenure as well as some indicators of agricultural productivity/development.Following this introduction, section II contains a brief overview of the research design and descriptionof study sites. Section III presents some of the findings related to land tenure security including dataon land acquisition, rights, and disputes. Section IV describes the various agricultural developmentindicators analyzed in the study. Section V examines the linkages between land tenure and selectedagricultural productivity indicators such as adoption of oxen mechanization, use of chemical fertilizersand credit, and presence of various long-term improvements on land, including trees. Finally, sectionVI summarizes the results and identifies further research needs.
II. Overview of LTC/ICRAF Study
The two provinces selected for study—Eastern and Southern provinces—are situated on aplateau that is characterized by relatively fertile soils and medium rainfall. Characteristics of samplehouseholds in each region are given in table 5.1.
Eastern province was chosen because it is host to an ICRAF research station. The provinceis dominated by mixed maize/livestock farming systems, although maize appears to be by far the mostimportant component. Among crops, it is estimated to occupy over 80 percent of cultivated area(Celis, Milimo, and Wanmali 1991). The Celis study also found that crop income accounted for over90 percent of household income and this was mainly from maize. Other crops grown include legumessuch as groundnut and cash crops such as sunflower and cotton. Livestock is nevertheless important:about 55 percent of sample households had cattle and the median herd size (of those with cattle) wasseven. As the province is located quite a distance from the major urban centers of Lusaka (500kilometers) and the Copperbelt, there are few off-farm income opportunities. Prior to the
' Frank Place is research associate with the Land Tenure Center, University of Wisconsin-Madison; V.R.N. Chineneis dean of the College of Agricultural Sciences, University of Zambia; Michelo Hansungule is lecturer in land law, Schoolof Law, with the University of Zambia; and Fabian Maimbo is with the Department of Rural Development, Faculty ofAgriculture, University of Zambia.

150
implementation of an agricultural liberalization program, farmers marketed output and purchasedinputs through cooperative unions. Among sample households, 81 percent had used chemical fertilizerand over 60 percent had used formal credit within the past five years. Formal credit was obtainedfrom both commercial banks and the government-owned LIMA bank.
Table 5.1: Characteristics of sampled households
Characteristic of household Southern province Eastern province
Number sampled 100 98
Percent female-headed 7.0 14.6
Mean household size 7.6 5.4
Median farm size (ha) 6.7 3.1
Percent with cattle 68.8 55.2
Percent using fertilizer(in last 5 years)
Percent ethnic groups
93.9 81.3
Tonga 98.0Chewa 54.0Ngoni 33.0Other 2.0 13.0
Southern province was selected as the other site mainly because of tree planting initiativesthere. It is more commercialized as indicated by the fact that over one-quarter of total cultivated areais occupied by commercial farmers operating on State Land. The northern part of the province is nearto the Lusaka market. Like Eastern province, maize is the predominant farming enterprise, occupyingabout two-thirds of cultivated area (Cells, Milimo, and Wanmali 1991). Fertilizer use is ubiquitouswith 94 percent of sampled farmers having applied fertilizer within the past five years. Nearly 70percent of households have cattle, but herd sizes were rather low, the median being three. There arefew off-farm income opportunities in the province, but there is significant migration to Lusaka andto the minor urban areas of Livingstone, Choma, and Mazabuka, among others.
Selection of research sites within provinces was decided on the basis of traditional descentpatterns affecting land transfers and the presence of tree planting activities. In Eastern province, theresearch team selected broad areas of patrilineal and matrilineal descent patterns in order to contrasttree-planting prospects between the two groups. The greater Chipata and Katete districts were chosenas the focus of the study.' Chipata is the site of a recently established ICRAF on-farm program. Itis located just 30 kilometers from the border with Malawi and is inhabited mainly by the patrilinealNgoni. The Katete region, on the other hand, has a majority of matrilineal people (mainly Chewa) and
2 A couple of sites were chosen in Chadiza as well, but the area was minor relative to Chipata and Katete districts.

151
is located to the southwest of Chipata by about 70 kilometers. Villages were randomly selected inChipata, Chadiza, and Katete districts, and for the most part households were also randomly selected.'The addition of Southern province provided opportunities for studying multipurpose tree planting. InMazabuka district, conversion of woodlands led to the initiation of several tree planting projects bythe Forestry Department and Family Farms project. The researchers purposefully selected villages andsettlements in the district with the intention of capturing a significant percentage of tree planters amongthe sample of households. The sites within Mazabuka district were the Mazabuka South area (nearMagoye) and the Mapangazya area some 90 kilometers to the north of Mazabuka town. Each is abouta three-hour drive from Lusaka on the Lusaka-Livingstone road.
Both the number of household members and the size of farms is larger in Southern province.The larger farm size is explained mainly by the inclusion of larger farms on State Land (28 percentof the sample),` the greater use of oxen which permit extensification, and more accessible commercialmarkets for output which increase demand for labor.' The greater production also increases householddemand for labor which results in more members' and fewer male household heads who seek off-farmemployment. There is a larger percentage of female-headed households in Eastern province, includingsingle, divorced, widowed, and polygamous families.
III. Land tenure
A. Land administration
Under the Land (Conversion of Titles) Act of 1975, all land in Zambia was henceforth to bevested in the state. However, land in the Reserves and Trusts was to remain under the administrationof traditional authorities (see chapter 1). Land matters in most rural areas continue to fall under thejurisdiction of chiefs and village headmen. In many areas of Zambia, chiefs have permitted creationof new villages to accommodate increasing population growth and in-migration. Headmen, who aregenerally selected by the community in accordance with customary law, are responsible for localgovernance. Chiefs usually retain customary control over allocation of nonvillage land and settlementof newcomers to the area. Headmen are likely to administer matters over land (e.g., expansion offarms, dispute settlement) in their villages.
Besides the power of allocating land, chiefs or headmen also have the authority to dispossessfarmers from their land. However, key informants visited during informal interviews insisted that thisis a possibility only in cases of unacceptable behavior on the part of a household member. Once aspecific piece of land is allocated, the family expects to control land-use decisions and to pass thisright to heirs. There is some variation over the degree to which households can transfer land outsidethe family and formally register their land. In some areas, individual rights to sell and rent havedeveloped (mainly in peri-urban areas) whereas in others they are strictly forbidden. Likewise, farmersin Reserves face varying degrees of acquiescence on the part of chiefs to requests for individualregistration of land.
3 A few households were pre-selected for their planting of multipurpose trees.It is unclear from the analysis whether these larger farms self-selected registration or whether allocations by the GOZ
were larger than the average farm size under customary tenure.6 Smaller farm sizes in Eastern province are not the result of lack of land in the area.6 Polygamy is more prevalent among the sample in Southern province than in Eastern province.

152
The administration of State Land, applicable to parts of the sample from Southern province,is the jurisdiction of the state. This topic is addressed in chapters 1 and 2.
B. Land acquisition
There are two main types of land acquisition by households in Reserve and Trust Lands inEastern and Southern provinces: inheritance/gifts from family members and allocation headmen withconfirmation of the chief. This is not to say that systems of land transfer are simple or easy tounderstand. On the contrary, inheritance systems are quite varied in the study sites (see below). Whilethe chief is responsible for allocating land in Eastern province, the village headman performs thatfunction in Southern province with chiefs consulted only in the case of dispute. In addition, there existscattered temporary land transfers involving seasonal renting or lending.' Sales of traditional land arevery rare according to survey respondents, although several mentioned chiefs accepting money forsome land allocations, making the transactions appear like sales.
In State Land, there are different common modes of land acquisition. In areas where relativelynew resettlement programs have occurred, many farmers acquire land through state allocation. In moreestablished State Land areas, inheritance is more common and some purchasing is found. Althoughmarkets have been discouraged by government policy (bare land could not be bought or sold),individuals have circumvented this by exaggerating the value of land improvements which can belegally sold.
Table 5.2 shows that over 90 percent of the respondents in Eastern province acquired land byinheritance or other intrafamilial gifts. Inheritance and gift have been lumped together because somerespondents used the word inheritance to describe inter vivos transfers while others called them gifts.Inheritance and other intrafamily transfers were also the most common among the Southern provincesample (65 percent) but not to the same extent as in Eastern province. This is due to the inclusion ofState Land farmers in Southern province where purchase and state allocation accounted for 18 percentof land acquisitions. The other common form of land acquisition was through allocation by the chiefor village headman, accounting for about 17-18 percent of acquisitions in each province. Purchasingbetween individuals is rare; only six farmers in Southern province (three each on Reserve and StateLand) and one in Eastern province reported purchases.' Only one household (in Eastern province)reported ever selling land.
The following sections discuss the important acquisition modes in greater detail.
1. Inheritance
Among the patrilineal Ngoni, land passes from father to son. Traditionally, a father wouldgive all the land to his eldest son (from his first wife in case of multiple wives, Dorner and Bruce1982). Increasingly, however, land is divided among sons, either as inheritance or gifts, as evidenced
' This is true more in Southern province than in Eastern province.Legally, purchase refers to the transfer of unexhausted improvements, not the land per se, although in practice the
buyer and seller implicitly appear to be incorporating land value into the negotiated price as well.

153
by the large number of respondents in the sample who have inherited land (see table 5.2). 9 Cross-tabulations show that all household heads below the age of 30 in Eastern province (N=21) hadinherited land. Further, 40 of 42 household heads under the age of 40 received inherited land. Thisstrongly suggests that land is normally passed to heirs prior to death of the father and that it is not onebut many heirs who receive land. 10 A similar, but more varied, pattern is found among the Tongaof Southern province.
Table 5.2: Percentage distribution of households by method of land acquisition'
Method Southern province Eastern province
Inheritance or gift:
Patrilineal ties 32 64
Matrilineal ties 22 12
Other family ties' 11 20
Allocated by chief or headman 17 18
Purchased 6 1
Allocated by state 12 2
Rented or borrowed 0 2
a. Nearly all households in Southern province had only one parcel; of the few that had more, the two or moreparcels were acquired in the same manner, thus summing to 100 percent. In Eastern province, 19 of 98households used more than one manner of acquisition, thus the reason for summing to 119 percent.Unfortunately, parcel-level breakdowns were unavailable for reporting.
b. It is not clear from the responses whether "grandparents" or "other relatives" imply a matrilineal orpatrilineal pattern.
Those sons who do not receive an inheritance but wish to farm in the village may seek landfrom the headman, but they must first seek land from within the extended family." Women do notgenerally inherit land. In the case where the sons are too young at the time of the father's death, thewoman may retain the use of family gardens as custodian until the sons reach maturity.
Among the Chewa, various inheritance arrangements can be found. In traditional Chewasociety, the institution of uxorilocal marriage is common whereby marriage to a nonvillager waspromoted and residence taken up in the wife's village. In these cases, the couple will receive anallocation of land from the wife's family. This practice has been modified over time, in some cases
9 The data do not permit further analysis of whether the father bequeathed land to multiple sons or to the eldest son, whothen allocated land to his brothers. The central point is nonetheless the same—i.e., land does not end up with one heir, whichis the general interpretation made in the literature.
10 Given these high proportions, it should be obvious that the result holds for both the Ngoni and Chewa ethnic groups." This policy, along with matching allocation sizes to ability to cultivate, can be viewed as two indigenous methods to
discourage underutilization of land. A third is repossessing idle land for reallocation by the chief.

154
quite radically. In Malawi, the Chewa system of inheritance near Lilongwe seems to have evolvedslowly, with initial changes involving "probationary" uxorilocal marriage followed by relocation tothe husband's village. 12 In Zambia, the transformation has been more pronounced. One Chewavillage visited had completely overhauled the traditional system in favor of father-to-son transfers. Asshown below, other study villages have also significantly altered their systems of inheritance.
Among the Tonga, land is commonly passed through matrilineal descent rules, in generalorder of preference to mother's brothers, maternal nephews, maternal grandchildren, and sons. Dornerand Bruce (1982) point out that this is not strictly followed, however, and a great deal of importancewas attached to identifying a good farmer."
In both provinces, the matrilineal system of descent shows signs of having eroded. Theanalysis shows a preponderance of father-to-son transfers of land. Many respondents stated that theyobtained land from their fathers and that they intended to pass it to their sons. Of all inherited parcelsin the formal survey, 52 percent were from the father, and 22 percent from uncles, brothers, orfathers-in-law among the Chewa (the remainder were from grandparents or other relatives). Amongthe Tonga, 56 percent of inherited/given parcels were acquired from fathers and 26 percent frommatrilineal relations. The data indicate that the conversion of inheritance practices is not a recentphenomenon as the ratio of matrilineal to patrilineal acquisitions is roughly constant over age ofhousehold head.
Women do not generally inherit or receive land as permanent gifts. However, there areexceptions in the case of unmarried, divorced, or widowed women. Because land is abundant inZambia, it is not unheard of for an unmarried woman to be given a small area of land to farm by herfather. Divorced women may be able to retain some of the land they had been cultivating dependingon the particular circumstances. However, if she originates from another village, it is normallyexpected that she return to find land in her home area. Upon the death of a husband, some societieswould expect the widow to marry one of the husband's brothers, entitling her continued access to landin her former husband's village through matrimony (although not necessarily the land of her formerhusband). Alternatively, she may be allowed to farm the land until the sons are old enough to takeover the farm. In other cases, women have been ejected from the land and forced to find land in theirhome areas.
2. Allocation from traditional authorities
In Reserve Lands, land not under occupation can be requested from either the chief or theheadman. The chief retains paramount power over land allocations, although decisions concerningvillage residents can often be made by the headman alone. There are two general processes throughwhich land is acquired. The first involves strangers seeking land in the village; the second involvesa local resident seeking land. In the first case, a stranger is usually expected to bring a letterexplaining his departure from his previous village. Land is normally allocated as long as the chief orheadman accepts this explanation, approves of the family, and/or accepts the stranger's reasons for
12A companion study in Malawi (Nankumba 1994) found that in most uxorilocal marriages, the husband had some land
in his village as well.13 According to Michelo Hansungule (personal conversation), old accounts of matrilineal descent rules are out of date
due to evolution of the Tonga customary system.

155
wanting to move to the village. 14 Other terms and conditions, possibly including a token gratuity orgrant of money, may also be required. The second scenario is where the applicant is a current orformer resident of the village—e.g., a son who has not received land through inheritance, a farmerwho wishes to expand farm size, or a male resident who returns to claim land following a longabsence. In this case, it may be either the chief or the headman who will allocate the land. In allcases, the size of the allocation is based in large part upon the amount of land the household will beable to cultivate.
Land allocation appears to be an important method of land acquisition in Southern provincewith 17 percent of households receiving land from chiefs or headmen. Similarly, in Eastern province,allocations from traditional authorities are utilized by 18 percent of households. Within Easternprovince allocation is more frequent among households from outside the area (32 percent) than amongresident households (8 percent). In Southern province both resident and migrant households wereequally likely to obtain land from chiefs or headmen.
3. Temporary acquisitions
Temporary acquisitions include seasonal rentals and borrowings. Because landholdings arelarge relative to household labor supply, there is normally not a significant demand for additional landfor cultivation. However, seasonal capabilities will differ according to access to oxen plows, seeds,or labor. The most common reason for temporary exchanges is lack of maize seed to cultivate theentire plowed holdings. Arrangements will be made with another farmer to till the land in exchangefor a portion of the output. The existence of a prepared field, unlike the case of a bare field, isattractive to would-be tillers. Respondents prefer to describe this arrangement as lending rather thanrenting, perhaps because there is rarely a cash transfer.
None of our respondents in Eastern or Southern province had rented in parcels during theseason prior to the interviews. The percentage of households having ever rented out land was also low:6 percent in Southern province and 3 percent in Eastern province.' S Only two households reportedborrowing land in Eastern province, and both were Chewa.
4. Other acquisitions
In addition to inheritance, state allocation and purchasing were used by households to acquireState Land. Because some settlement areas visited were relatively new, state allocation appears to bean important method of land acquisition with 12 of 28 State Land households using this method.
There were also seven purchases of land in the sample. Six occurred in Southern province,three each in State Land and the Reserves. All seven involved private buyers and sellers.
14 Allocation of land to strangers can be made by the headman in consultation with his advisors, but not necessarily withthe chief, particularly in Southern province.
Percentages for households renting out are not comparable with the same figures for renting in. According to the waythe questionnaire was designed, renting in refers only to parcels that households are currently renting, while renting outrefers to an action made at any time in history.

156
C. Rights to land
Questions related to the possession of various rights to land were asked of respondents. Foreach right, enumerators recorded whether household heads and spouses had unilateral (or unfettered)ability to exercise the right or whether the right was conditional on the permission of others (e.g., thespouse, father, other relative, chief or headman, state, or other). 16 The answers should not beconstrued as definitive evidence of the existence of various rights. In some cases, the responses werehypothetical, since the respondents were talking about rights they had not exercised. Nonetheless, theresponses are indicative of the respondents' sense of security or control over the use and transfer ofthe land.
Rights of use, transfer, and exclusion are distinguished and discussed first at the level of thehousehold—that is, whether the household head claims certain rights over any farmland." The datareflect the percentage of male-headed households in each region who claim the unfettered ability toexercise each particular right. This data is presented for all enumerated rights in table 5.3. Furtheranalysis is then made with respect to some of these rights in order to compare the involvement indecisions of husbands and their wives (again within male-headed households). This material ispresented in table 5.4 only for all male-headed households; 18 the number of female household headswas too small to undertake special statistical analysis on this subgroup.
1. Use rights
Rights of use are highly privatized in both provinces. Table 5.3 shows that rights to cultivate,use inputs, plant trees, and harvest tree products are enjoyed by all but a couple of households ineither province. With respect to the right to fence in Eastern province and the right to cut trees inSouthern province there is less than unanimity on the ability to exercise use rights. The data also showthat respondents were less certain of the right to fallow without losing other rights to the land. Whileover 80 percent of respondents in Eastern province felt secure in their ability to retain land after longfallows, only 53 percent felt similarly in Southern province.
19
Household heads have more rights over land use than their spouses. Wives have to getpermission from the household head in the majority of cases and are altogether denied rights in manyothers (see table 5.4). Spouses in Southern province appear to be completely excluded from fencingand tree planting decisions in about half of households. Women are more active in land-use decisionsin Eastern province; males appear to involve their wives in most decisions unlike their Southernprovince counterparts. In about 11 percent of male-headed households, women were able to plant treeswithout asking permission. Further, women were allowed to plant following permission of the husbandin another two-thirds of households.
16 Usually, only one respondent answered for both the husband and wife.17 The analysis is at the household level. Although land rights were collected at the parcel level, respondents claimed
to have the same rights over all their parcels.Is Sometimes only men were interviewed, sometimes only wives, and sometimes both. Regardless of the gender of the
respondent, rights of both husbands and spouses were queried.19 This was in contrast to discussions during informal interviews where this concern was not raised.

157
Table 5.3: Prevalence of household rights over farmland in male-headed households
RightsSouthern province
(N = 93)Eastern province
(N = 82)
Use rights:
Cultivate annual crops 98.9 98.8
Cultivate perennial crops 98.9 96.3
Use inputs 98.9 98.9
Erect a fence 98.9 82.9
Plant trees 98.9 96.3
Cut trees 79.6 94.9
Harvest produce from trees 93.5 98.7
Retain land after long fallow 52.7 81.7
Transfer rights:
64.5 60.8Give trees to other family members
Give land to other family members 53.8 76.8
Give or sell land outside the family 40.9 37.8
Exclusion rights:
Prevent others from growing crops 86.0 96.3
Prevent others from harvesting crops 83.9 97.6
Prevent others from grazing animals 76.3 28.0
Prevent others from growing trees 84.9 96.3
Prevent others from harvesting trees 86.0 91.5
D. Transfer rights
Rights of transfer were the least common of all types of rights. Rights to give land to otherfamily members were claimed by 54 percent of Southern province households and 77 percent ofEastern province households. The most restricted right is that of land alienation outside the family.As seen in table 5.3, sales are rare in the study areas. The percentage of households who claim rightsto sell is about 40 percent in each province. Because of the higher frequency of households on StateLand in Southern province, one might have expected fewer rights to sell than in Eastern province dueto land market restrictions governing statutory tenure on State Lands. However, customary lawsforbidding sales might be more strongly enforced, and the lower population density of customary areasmay create little demand for purchases.

158
Table 5.4: Percentage distribution of husbands and wives by selected rights of use andtransfer
Husband` Wife"
Right Southern Eastern Southern Easternprovince province province province
Cultivate perennials:
No rights 1 4 36 9
Yes, without permission 97 36 7 8
Yes, with spousal permission 2 60 57 83
Fence:
No rights 1 17 55 44
Yes, without permission 98 57 3 4
Yes, with spousal permission 1 26 42 52
Plant trees:
No rights 1 4 46 23
Yes, without permission 98 49 5 11
Yes, with spousal permission 1 47 49 66
Alienate land from family:
No rights 59 62 88 65
Yes, without permission 40 11 0 0
Yes, with spousal permission 1 27 12 35
a. The respondent is the household head commenting on spousal rights. This is a male only in 66 percent ofthe cases in Southern province and 75 percent in Eastern province.
Spousal rights over land transfer are extremely weak. Table 5.4 shows that no spouse has theunilateral right to alienate land outside the family. In Eastern province, wives would be consulted inabout one-third of households, but in Southern province only 12 percent of wives would be includedin this type of decision.
E. Exclusion rights
The ability to exclude others from using one's farmland was relatively common and suggestsa high degree of individualized property rights. In general, nonhousehold members are not permittedto use a household's land for crop or tree cultivation without prior permission of the household head.In addition, chiefs and headmen have established penalties for crop damage and unauthorized treecutting by others on farmers' own fields. Moreover, farmers claim to have the right to fence off land(see above).
159
The case of grazing animals appears to be an exception. Farmers were asked whether othershad unquestioned rights to graze in their fields. In Southern province, 76 percent of farmers claimedthat herders would have to ask their permission before grazing on their lands. This high percentagemight be explained by the Tonga custom of permitting one's own animals to graze one's stover beforeallowing other animals on the property. In contrast, only 28 percent of Eastern province farmersbelieved that their permission was required before others grazed their land.
F. Tenure security
Tenure security is a difficult concept to measure precisely. It is related to the number of rightsheld, the duration of rights, and the respect of those rights by others (chapter 2). As indicated above,farmers feel quite secure in their ability to cultivate crops on their land. The high percentage ofprivatized rights to fence and plant trees also conveys the notion that cultivation rights are long termin nature. Farmers were also asked specifically about the length of time they could continue to farmtheir plots. With the exception of eight 14-year state leaseholds, virtually all households claimed theycould farm the land as long as they wished. Informal interviews corroborated this finding; respondentsmentioned that land would only be taken away in the case of "unseemly" behavior on their part.
In addition to long-term rights, the assurance that these rights will be respected by others isalso important for creating proper investment incentives. Again, the evidence above suggests thatfarmers are largely left alone to develop their farms as they wish. One area of concern is open grazingin the off-season coupled with poor supervision of animals. In such systems, the obligation is on thelandowner to make additional investments in the form of fencing or guards, thereby raising the costof land investments.
In summary, security of tenure seems high insofar as long-term rights to land are concerned.There are examples to the contrary, however. Families do not enjoy the right to keep land idle or infallow for long periods. Women-headed households do not always concur that their tenure isindefinite; during informal interviews, more than one woman reported fear of losing her land to malerelatives. One respondent on State Land had rented out land without a written contract for fear thata written document could be used by the tenant to illegally obtain that parcel from the state. Hence,statutory law and the presence of registration themselves can create some insecurity. One farmer onState Land mentioned problems of claims to his land by his extended family who resided on traditionalland; the relatives argued that the land was rightfully theirs since the money used to purchase the farmon State Land was earned from output in traditional land. Lastly, there was also a slight fear ofgovernment expropriation should a farmer plant enough trees to appear to convert the crop land intoforest.
In terms of security for credit access it appears that title deeds are not necessary to obtainloans (see below), and it is questionable as to how much they can help. From a lender's perspective,a title deed is only valuable if the underlying asset (land) can be used to recover loan arrears. Thiscondition is not generally satisfied in the land-abundant Reserves of Zambia where land sales are rare.As is discussed below (table 5.7) more than half of households had obtained credit and only a few

160
farmers have titles to offer. Banks will often use other assets as collateral, but will even makeunsecured loans if a farmer can establish a sound credithistory.2O
Enumerators asked all respondents whether they felt title to land would increase their securityand whether they expected credit use to increase with title. With respect to security, the results werenearly identical across the two provinces. In Southern province, 36.7 percent of households said thatthey would be more secure with title and 35.8 percent felt similarly in Eastern province. However,in Southern province, 84 percent of those in State Land replied affirmatively as opposed to only 19percent of households in the Reserves. The responses with respect to perceived change in credit usefrom titling differed with about twice as many in Southern province predicting greater use (62 percent)as compared to those in Eastern province (32 percent).
G. Concept of ownership
Even though land belongs to the state under the 1975 Land Act, this was hardly recognizedby the respondents when asked who was owner of their farmland. Table 5.5 shows that 54 percentof the respondents in Eastern province said that the household head is the owner of the land, while31 percent mentioned the chief or headman. Nine percent of respondents said that the land belongsto the extended family. The results in Southern province are virtually identical, despite the fact that28 households held state leases which stipulate that all land is owned by the state.
Table 5.5: Distribution of households by perceived owner of land
Owner Southern province Eastern province
No one 1 3
Household/household head 57 54
Extended family 10 9
Chief, headman, community 28 31
Other 4 2
A cross-tabulation made between the perception of landownership and mode of acquisitionindicated that households acquiring land through patrilineal ties are more likely to claim ownershipover land than households who have acquired land through matrilineal ascendants. In both provinces,59 percent of patrilineal households claim ownership rights, while for matrilineal households, thepercentage is 36 percent in Eastern province and 32 percent in Southern province. Conversely,matrilineal households are more likely to name the chief as owner. All households located in StateLand believed they were the owners of the land.
20 As indicated shortly, easy credit proliferated in days prior to the present market liberalization, where credit from statebanking institutions was closely intertwined with purchases and sales through government-controlled input and commoditymarkets. With the beginning of greater financial scrutiny in loans applied to banks in the early 1990s, title may become amore significant determinant of credit access.

161
H. Land disputes
Given the relatively low population density, land disputes are not as severe as those found inother areas of sub-Saharan Africa. In fact, few disputes over land ever proceed to formal courts inEastern province. The disputes that do occur between farmers mainly involve boundary disputes andto a lesser degree disagreements over inheritance. 21 Boundary disputes arise mainly because plotboundaries are not normally marked owing to large farm sizes. All land disputes are normally settledby the village headmen.
There are other disputes which arise over unlawful use of land such as illegal grazing duringthe rainy season or cutting of trees. These are sometimes settled by the parties themselves, but canalso be decided by the headmen or even chiefs. Penalties are usually in the form of maize, if maizecrops were damaged, or animals (e.g., chickens or goats) for other damages.
Results show that around one-fifth of all households in both regions reported having beeninvolved in a land dispute sometime in the past. In both regions, boundary disputes accounted for overhalf the total. In Eastern province, 11 households are currently involved in a dispute and sevenactually lost land as a result of a dispute. In Southern province, 3 percent of households are currentlyinvolved in a dispute and 7 percent have lost land as a result of a dispute, the majority of these toother family members.
I. Documentation
The majority of respondents did not have documents or title to land. In Southern province 75percent of respondents had no form of documentation, and in Eastern province as many as 94 percentdid not carry written documentation to land (see table 5.6). Nine respondents in Southern provincehad a title deed while another 14 carried receipts of transfer while waiting for titles to arrive. Onlyone Eastern province farmer had obtained a formal title deed. The remainder of the document holdersheld a letter from the chief.
Table 5.6: Percentage distribution of respondents by type of land documentation held
Type Southern province Eastern province
None
Chief's letter
Receipt of transfer
Title deed
75
2
14
9
94
5
0
1
21One Chewa headman said that inheritance disputes were very common before a patrilineal inheritance system was
adopted.

162
IV. Agricultural development indicators
The LTC/ICRAF study did not have as an objective the analysis of links between tenure andagricultural productivity or development. Therefore, the indicators used in this analysis are probablynot sufficiently rigorous in measurement or breadth to warrant any definitive conclusions. Furtherwork will certainly need to be undertaken. Nonetheless, the results are useful if for no other reasonthan to guide future research.
The agricultural development data available exist in the form of binary responses indicatingwhether a particular investment or activity was undertaken (for example, see tables 5.7, 5.8, and 5.9).For all the measures except for use of formal credit, the time frame is the entire period the farmer hasoccupied the land. For credit, the incidence refers to the past five years only. The following sectionscompare indicators among regions, first with respect to credit and oxen use, second with respect toland improvements, and third with respect to tree planting.
A. Credit and use of oxen
Table 5.7 displays some aspects of credit and oxen use among sample households. Themajority of households in both provinces obtained formal credit at least once during the previous fiveyears despite the low incidence of title among households. Instead, other forms of collateral were oftenused to help secure credit, chiefly livestock and crops. The use of crops as collateral was madepossible by the state's control over agricultural inputs and outputs. Government banks would issuecredit to farmers who would obtain fertilizer from a government supplier. Credit risks were reducedsince all produce was marketed through the government as well. With the advent of marketliberalization, this degree of control will be lost and lenders will likely not be as keen on using cropsas collateral.
Table 5.7: Aspects of credit and oxen use among households
Southern province Eastern province
Percent using formal credits 55.0 60.4
Percent of borrowers using land or 17.0 0.0title as collateralb"
Percent with oxen 58.0 44.8
Median number of head in oxen 3 2households
a. At least once in previous 5 years.b. Percent of all loans secured with land title.
Around 58 percent of households in Southern province own at least one ox, compared with45 percent in Eastern province. The use of oxen is important in expanding production area of a farm.Studies by Celis, Milimo, and Wanmali (1991) found that the area under cultivation was about twiceas high in oxen-owning households as it was in households without oxen. With respect to this study,

163
oxen households cultivated 16.4 hectares versus 5.8 hectares for nonoxen households in Southernprovince. No significant difference was found in Eastern province, although a recent outbreak ofcorridor disease may have affected oxen numbers; also, there is a higher incidence of oxen rentingby "non-oxen" households as defined.
B. Land improvements
Given that both study areas are similar in terms of rainfall, topography, and farming system,it is not surprising that the types of land improvements made by farmers are similar in the two areas.Table 5.8 shows the percentage of households making various types of land improvements. Forconvenience, the land improvements have been grouped loosely by purpose. For example, the variousearth construction investments (terracing, bunding, and ridging) have been placed next to one anotherand an aggregate figure for "earthwork" is also provided.
Table 5.8: Percentage distribution of respondents by type of land improvement made
Type of improvement Southern province Eastern province
Terracing 5.0 4.1
Bunding 8.0 53.1
Ridging 20.0 1.0
Any earthwork 31.0 56.1
Well 31.0 35.7
Irrigation 1.0 12.2
Drainage 20.0 23.5
Any water improvement 44.0 48.0
Fertilizer 86.0 72.4
Liming 1.0 0.0
Other chemicals 38.0 16.3
Any chemical treatment 88.0 72.4
Manuring 51.0 42.9
Mulching 3.0 3.1
Any organic treatment 52.0 43.9
Fencing 22.0 28.6
There is a similar percentage of households in each province undertaking investments in allwater improvements, fencing, terracing, chemical fertilizer, liming, and organic treatments. Generally,the use of chemical fertilizer is high, about half of respondents made a waterwork improvement, halfused organic manure, one-quarter had made some fencing improvements, and very few madeinvestments in terracing, mulching, or liming.

164
There were some important differences between the two provinces as well. Chemicals (i.e.,pesticides and herbicides) other than fertilizers are much more commonly used in Southern (38percent) than Eastern province (16 percent) due to the forger's better location relative to the Lusakamarket. Farmers in Eastern province were much more likely to construct bunds (53 percent versus8 percent) and to undertake any earthwork than their counterparts in Southern province. The bundingis used primarily on gently sloping upland fields, but sometimes also in the low-lying wetlands. Thehigher incidence of earthworks in Eastern province is at least partially explained by its undulatingterrain relative to the "flat" topography of Southern province.
C. Tree products and tree planting
This section is a very brief summary of tree planting in the study sites and is adapted fromChinene, Hansungule, and Place (1994). To understand on-farm tree planting, it is first necessary toknow what types of tree products and services are used and how households obtain them. Dependingon the tree product or service, the main sources will be common woodlands or forests, friends andneighbors, the market, and one's own farm. When a product is plentiful from commonly used areas,there is a reduced incentive to expend one's labor and capital to reproduce it on-farm.' Table 5.9shows that there are considerable disincentives to grow trees for some important products, especiallyin Eastern province where the commons provide the bulk of firewood, poles, and medicines. Fruits,on the other hand, are normally not found in the commons. Specific services from trees such as shade,windbreak, and fencing must necessarily be obtained from on-farm trees.
Table 5.9: Aspects of tree product and tree planting by households
Southern province Eastern province
Percentage of households using common lands for:
Fuelwood 81 87
Poles 64 83
Medicine 36 84
Percentage of households planting:
Fruit trees 76.0 42.7
Multipurpose trees 46.0 11.5
Any tree in past 5 years 46.0 16.7
Principal fruits mango, guava, papaya mango, guava, papaya
Principal multipurpose trees Cassia siamea noneGmelina arborea
Fruit trees are by far the most commonly planted trees by households. Mango (Mangiferaindica) was planted on 55 percent and 33 percent of households in Southern and Eastern province,
22 Assuming that the distance to the common source is not too great.

165
respectively. Guava (Psidium guajava) is the next most popular in each province. No other specieswas planted by more than 10 percent of households in Eastern province. On the other hand, mulberry(Morus alba), Cassia siamea, Gmelina arborea, and Leucaena leucocephala were all planted by morethan 10 percent of sampled households in Southern province. Cassia siamea was particularly commonin the study sites, found on 35 percent of farms visited.
The percentage of households planting trees and the number of trees planted per householdwere calculated after grouping together species as fruits or MPTs (multipurpose trees)' Seventy-sixpercent of households in Southern province planted fruits and 46 percent MPTs. The percentages ofhouseholds planting each type within the past five years are lower, at 32 percent and 25 percent,respectively. Among planting households, the average number of trees planted was 19 for fruits and34 for MPT species. The primary uses of on-farm MPT species are for shade (36.6 percent of MPTplantings), windbreak (18.3 percent), and fuelwood (12.2 percent). Plantings of fruits and MPTs arealmost always found near homesteads in blocks, rows, or clusters.
In Eastern province, 42.7 percent of households had planted fruits at any time, but only 11.5
percent planted MPTs. During the past five years, the percentages of households planting were lower,especially for fruits (11.5 percent). The mean number of trees planted per planting household were18 for fruits and 58 for MPTs. The primary use of on-farm multipurpose trees was shade (37.8percent), soil fertility (18.9 percent), and poles (16.2 percent).
V. Tenure and agricultural development
A. Methodology
Previous sections demonstrated that virtually all farmers perceived having long-term use rightsto their holdings. However, there were tenure differences between farmers concerning how theyacquired land, their rights to transfer land, and their perceptions of who owned their farmland.Households have acquired land primarily through patrilineal inheritance, matrilineal inheritance, chiefsor headmen, or through the state. Do these differences matter for tenure security? It is often claimedthat incentives for investment are lower in matrilineal systems where the husband may not feel the landis his or have the freedom to pass it to his sons. Between one-half to three-fourths of householdsclaimed ability to permanently transfer land to a family member. About 60 percent of households feltthat they owned the land. Are these perceptions related to tenure security and do they have anyimplications for agricultural development? To answer these questions, three major hypotheses weretested:
(1) The incidence of agricultural development indicators is lower on matrilineal land than on landacquired by other means.
(2) The incidence of agricultural development indicators is higher where households claim to haveland alienation rights.
' The categories included both indigenous and exotic species.

166
(3) The incidence of agricultural development indicators is higher where households claim to bethe owners of the farmland.
These hypotheses were tested using regression analysis. Due to relationships among the modeof land acquisition, land rights, and landownership perceptions, the hypotheses were tested inalternative regression models. In each model, other nontenure factors were included and were selectedon the basis of their likely links to investment. These include size of farm, size of household, age ofhousehold head, education level of household head, frequency of extension visits, incidence oflivestock, quality of residential house, location of household within study site, and distance to roads,markets, and agricultural offices. These variables were selected because they are hypothesized to affectthe agricultural decisions of farmers. A greater likelihood of investment is expected on larger farms,those with more labor, among middle-aged or elderly household heads, among the more educated,those who are in more contact with extension agents, those with greater wealth (livestock, quality ofhouse), and those who are located closer to markets and/or major roads.
It is certain that decisions regarding the various productivity measures are mutually dependent.However, this decision-making process is quite difficult to handle from a statistical point of view. Theinclusion of several dependent variables in a simultaneous system requires a large number ofobservations, while only 100 per region are available in these samples.'' One method is to use allpossible investment combinations or bundles as distinct outcomes.' However, this too requiressignificant numbers of observations to assure that the number of cases in each investment combinationis sufficiently large. An alternative method was used instead. The 11 different improvementsenumerated were grouped into 5 categories: organic inputs, chemical inputs, earthwork structures,water structures, and fencing (see table 5.8). Nearly all farmers used chemical inputs (mainlyfertilizer) so there was insufficient variation for explanatory analysis. Single equation logit regressionswere made using credit use, presence of oxen, use of organic inputs, incidence of earthworkstructures, water structures, fencing, fruit tree plantings, and multipurpose tree (i.e., nonfruit)plantings as dependent variables. This grouping does not eliminate the problems of dependent decision-making, but reduces them to some extent since the more important interlinked decisions are likelywithin groups (e.g., wells and irrigation in water structures).'
Before proceeding to the empirical results, it should be stressed that the regression analysesindicate associations with variables but should not be taken to imply causal relationships. The reasonfor this has to do with the aforementioned time frames involved. The actual date of investment isunknown and, therefore, one cannot be certain that any of the independent variables actually causedthe outcome (except for variables which are fixed at the time of land acquisition such as how the landwas acquired). Furthermore, it is important to point out that because the independent variables reflectcurrent household characteristics (e.g., current size of household), their relationships to landimprovement variables can become obscured. Unfortunately, this problem is very difficult to correctsince it would require superlative recall powers on the part of respondents (i.e., to provide dates andamounts for investments).
u Perhaps more constraining is the lack of software capability to handle large simultaneous systems given that thedependent variable is not continuous.
u In a multinomial logit framework, for instance.26 On the other hand, this method is sensible only if the combined improvements are alike and respond to other factors
in the same manner.

167
B. Results
The results are presented by hypothesis rather than by dependent variable, although referencesto specific tenure-agricultural indicator effects are noted. The results which were found to besignificant are indicated in table 5.10. Insignificant or absent relationships are left blank.
Hypothesis 1: Matrilineal inheritance systems
The case of mode of acquisition is complex owing to its multiple possibilities. The significantfindings are from Southern province as only one minor finding was obtained in the case of Easternprovince. As opposed to households who acquired their land through matrilineal descent patterns,households who acquired their land patrilineally were more likely to use credit and to make earthstructures. Those who acquired their land through the chief or headman were more likely to makeorganic inputs, earthwork structures, or to plant fruit trees (than those who acquired matrilineally).Lastly, those who purchased land or were allocated land from the state were more likely to own oxen,use organic inputs, and to make earthwork structures. These results support the hypothesis in thatmatrilineal land was found to be inferior to at least one other type of land acquisition for most of theindicators. On the other hand, a superior mode of acquisition does not emerge from the data. The loneresult from Eastern province did not support the null hypothesis: the use of formal credit was greateron farms with matrilineal land than on those who acquired from the chief or headman. 27
Hypothesis 2: Land alienation rights
The right to alienate land outside the family was significant in only a handful of cases. Theright to permanently transfer land was positively related to the use of organic inputs in Southernprovince, but was negatively related to multipurpose tree planting in the same site and to fruit treeplanting in Eastern province. Given the insignificant and mixed nature of the results, it is difficult todraw any strong conclusions about the effects of land rights. The negative relationships with respectto tree planting suggests that tree investment behavior differs from other improvements. Oneexplanation for this is that there tends to be a noticeable input of tree planting project personnel intothe observed pattern of on-farm tree planting.
Hypothesis 3: Perception of landownership
In Eastern province, households who felt they owned their land were more likely to own oxen,to make earthwork improvements, and to plant fruit trees. In Southern province the ownership variablewas positively linked to use of credit and, again, earthwork structures. The results are supportive ofthe hypothesis. Because ownership is a perception of households, it may be that it is influenced bycertain peculiarities of households (i.e., it is endogenous). If so, there may be other importantvariables which explain both the perceptions of tenure security and the agricultural indicators. Toattempt to elucidate these issues, a regression was made using ownership (household or not) as adependent variable with several household and farm characteristics as independent variables. A strongrelationship was found between household ownership and wealth indicators (including number of cattleand farm size) raising the possibility that the wealth of a household may lead both to more individualclaims of tenure control and to more investments.
This may be explained by the fact that the latter households are more likely to come from outside the area.

168
Table 5.10: Summary of significant regression results for tenure variables
Matrilineal Land alienation Ownershipinheritance rights perception
Southern province
Use of formal credit negative positive
Presence of oxen negativeb
Organic fertilizer input negative° positive
Earthwork structures negatived positive
Waterwork structures
Fencing
Fruit trees negative`
Multipurpose trees negative
Eastern province
Use of formal credit positive `
Presence of oxen positive
Organic fertilizer
Earthwork structures positive
Waterwork structures
Fencing
Fruit trees negative positive
Multipurpose trees
a. Compared to patrilineal inheritance.b. Compared to allocation by the state.c. Compared to acquisition from the chief or headman and purchasing.d. Compared to acquisition from the chief or headman, patrilineal inheritance, and allocation from the state.e. Compared to acquisition from the chief or headman or patrilineal acquisition.
Other results
Among other variables, several were significantly related to the incidence of landimprovements. In Eastern province, size of farm was the most important explanatory variable. Farmsize was positively associated with a greater likelihood of using formal credit, possessing oxen, usingorganic fertilizer inputs, making earthwork structures, making waterwork structures, making fencingimprovements, and planting fruit trees (i.e., all of the dependent variables used). In Southern provincesize of farm was less important and was linked to organic fertilizer application (negatively) and toplanting of multipurpose trees and the presence of oxen (positively).

169
Other important variables in Eastern province were age and education level of household head,and the size of household labor pool. Improvements in fencing and waterworks were more likelyamong the middle-aged households than either young or old household heads. At this stage of thehousehold cycle, there usually exists a good balance of labor supply and capital with which to makeinvestments.' Household heads with secondary education were less likely to make waterwork orfencing improvements than those with no formal education. Since age was controlled for, this resultis rather surprising, but would indicate that formal education is not strongly linked to the ability toundertake productive investment (e.g., it is not linked to wealth or income). The final notable resultis that the size of household labor supply is positively related to the presence of oxen and to earthworkimprovements. None of the household location variables were significantly related to the developmentindicators.
In Southern province, none of the control variables was significantly correlated with landimprovements in more than a few cases. Perhaps the strongest of the variables was education. UnlikeEastern province, secondary education was positively linked with investment in earthwork andwaterwork structures, and to planting of multipurpose and fruit trees. Household labor was positivelyassociated with the use of formal credit and the presence of oxen.' The frequency of extension visitswas positively associated with credit use, but negatively associated with the incidence of waterworkstructures. The distance from the household to major roads and agricultural offices was significant butin an inconsistent manner, with each being positively and negatively linked to one type of indicator.Thus, in general it can be concluded that there is no clear relationship between supply incentives (e.g.,extension), market incentives (e.g., distance to market), and farm development using these data.
VI. Summary and implications for further research
A. Summary
This chapter has endeavored to describe tenure systems and their links to agriculturaldevelopment activities of farmers in selected areas of Southern and Eastern provinces. The majorfindings involving tenure and tenure security can be summarized as follows:
► Almost all land is acquired through nonmarket means: inheritance, gifts, and allocations bylocal or state authorities. Markets for land are poor for several reasons but the major reasonin the study areas is the relative abundance of land. Households are able to find adequate landon which to satisfy their consumption needs and even to produce a surplus for the market.Government policies have undoubtedly played some role as well. However, evidence fromother countries in sub-Saharan Africa indicates that where the demand for land is acute,markets will develop even in restrictive policy environments.
► Households claim long-term use rights over land. The data clearly show that all but a handfulof sampled households perceive the ability to use their land for various purposes. Includedamong rights claimed were the rights to fence and to grow perennial crops, both of which
' Young households normally lack capital while older households lack labor. In land-abundant areas of Zambia, it isnot easy to overcome household labor shortages through hiring.
n A household labor index is derived from the age, sex, and working pattern of each member.

170
indicate long-term duration rights. All farmers, save several with 14-year leaseholds on StateLand, believed they could cultivate their land indefinitely. The only conflicting evidenceconcerning long-term use of land was a hesitation of Southern province farmers to leave landidle for long periods.
► Households claim exclusion rights except in the case of livestock grazing. The vast majorityof households reported that they can exclude nonhousehold members from engaging in cropor tree growing activities. There was less privatization of land when the subject of off-seasongrazing was raised.
► Transfer rights exhibit the lowest level of privatization. The percentage of households who feltempowered to unilaterally make decisions over permanent transfers of land was low relativeto other types of rights and relative to other countries in sub-Saharan Africa. Only about 40percent of households claimed to have the ability to transfer land to someone outside thefamily. This demonstrates the continued corporate control over land by chiefs and theircommunities.
► There is a wide variation among households as to whom they believe is the rightful owner oftheir land. Nearly 60 percent of households believed that the farmland is their own. This viewis consistent with the fact that most have inherited their land from ancestors and plan tobequeath it to descendants. On the other hand, a sizeable number of respondents believed thatthe land was owned at higher levels such as the extended family, the community, or the chief.The legal position, that land is owned by the State, is simply not felt by rural households.
► More than half of sampled households have obtained formal credit and very few use land orland title as collateral. It is more often the case that livestock or crops were used by farmers.Past credit use was facilitated by the state cooperative system under which loans were made,inputs delivered, and outputs sold. This may not be feasible under liberalization.
► Evidence was found indicating that agricultural development was lacking somewhat more onland acquired matrilineally than by other means in Southern province. The indicators whichwere influenced by acquisition method were use of credit, presence of oxen, use of organicfertilizer, incidence of earthwork structures, and planting of fruit trees. At the same time, nosingle method of acquisition emerged as being superior to all others.
► Households that perceived themselves as owners of their farmland tended to adopt moredevelopment measures. Household "owners" were more likely to make earthworkimprovements in both provinces, to plant fruit trees and have oxen in Eastern province, andto use credit in Southern province. Claims of ownership were found to be related to wealthindicators suggesting that wealth may be an important underlying variable explaining tenureperceptions and development indicators.
► There was little relationship between the right to alienate land and agricultural development.In most cases the land-rights variable was insignificant in regression analyses while it hadopposite effects in the three cases where it was significant.
► Farm size was a key variable in explaining adoption of productivity measures by householdsin Eastern province. There was a positive and significant relationship between the size of farm

171
and the likelihood of adopting all agricultural development indicators in Eastern province. Thisresult is appealing from an economic perspective since it points toward the movements ofproduction factors to achieve economic efficiency. In this case, the greater use of landimprovements by larger farms helps to equate land yields across different farm sizes; smallerfarms generally apply more labor per unit of land.
B. Implications for further research
This research has provided some insight into rural land tenure arrangements and how theyrelate to agricultural productivity. But since the LTC/ICRAF study was not designed to tackle thebroad and complex issues involved in explaining agricultural productivity, the results are onlypreliminary. Several recommendations for improvement in methodology and content arise from thisstudy. First, it is obvious that work must be done in a wider geographical area. Second, for all studysites, it is necessary to define tenure security and measure it. A number of recent studies haveexplored the possibility of using land rights as a proxy. Is this adequate? If so, which rights are mostimportant for agricultural productivity in Zambia? If not, what are the alternatives from an operationalpoint of view? Once this is resolved, it will be crucial to understand which factors are linked to tenuresecurity. This study has found possible links between wealth and tenure security. This issue needscareful attention because it has important implications for the effectiveness of tenure policy change.Once the tenure side of equation is better understood, more attention needs to be given to theproductivity measures, where, clearly, better measures need to be developed and used. Relying onbinary data is not sufficient, particularly when a particular investment is made by most farmers (e.g.,use of chemical fertilizer). Moreover, this study did not consider many important measures such ascrop or livestock output. These in turn are related to efficiency per unit of input (e.g., land) as wellas the area under production.
The relationship between tenure, grazing, livestock management, land use, land investment,and market access are crucial to understanding the effects of land policy interventions. These linkagesall stood beyond the scope and intent of the present study and, in light of the lack of sufficientlyrigorous analytical work on such themes elsewhere in Zambia, represent key issues for futureresearch.


Chapter 6:
Settlement Programs
by
Florence Chenoweth, Jane Knowles, and Gertrude Ngenda'
I. Introduction
Zambia's market economy continues to penetrate rural and peri-urban areas of subsistencecultivation. In this environment, where islands of commercial activity are surrounded by a sea ofsubsistence agriculture, settlement schemes have served as a mechanism for the expansion of thefrontier of commercial agriculture.' Zambia has an abundant supply of uncultivated arable land. Theland market for private transfers and administrative allocations on newly opened lands will providethe principal mechanism through which people can acquire land in agricultural areas. However, dueto historical factors and economic hardship, some segments of the population seeking land for farmingwill be unable to effectively use these mechanisms.' The GOZ has a long history of settlementprograms which they have attempted to use to accommodate the land needs of these people; thedesirability of continuing or expanding resettlement depends on the scale and performance of pastschemes.
This chapter was undertaken to pull together what is known of the various resettlementschemes. Information was sought on the extent of such schemes, institutions involved, number ofsettlers, scheme size, area settled, scheme expansion over time, settlement costs, settler characteristics,and scheme performance in terms of production, land use, investment, income, employment, andresource access and use. Data are based primarily on archival research, secondary sources, and someinterviews with public officials. Prior to 1991 there were several government institutions responsiblefor resettlement schemes, including the Zambia National Service (ZNS); the MAFF; the Ministry ofLocal Government and Housing; the Zambia Consolidated Copper Mines (ZCCM); and theDepartment of Resettlement. Attempts were made to obtain data from all these institutions exceptZCCM. Officials repeatedly acknowledged the availability of data, but despite many informal andformal requests, few data were ever provided due partly to information sanctions stemming frompolitical sensitivities, poor data management, lack of records, and dearth of quality research by outsideinvestigators. The findings in this chapter are thus superficial and, if anything, highlight the need forexhaustive research involving fieldwork in this area.
In referring to the numerous schemes set up by the GOZ to settle people for agriculturalpurposes, the term resettlement scheme is sometimes used while at other times, frequently in the samedocument, settlement scheme is used. For the purpose of this chapter, all schemes are referred to as
1 Florence Chenoweth is an associate research scientist with International Agricultural Programs and Jane Knowles isAssociate Director of International Agricultural Programs, University of Wisconsin-Madison. Gertrude Ngenda is aresearcher with the Zambian Association for Research and Development.
2 Ray (1977a) uses the example of the Chifwile resettlement scheme in Northern Zambia to examine how such programscan be used as a mechanism for expanding the frontier of commercial agriculture.
3 These segments of the population include the disadvantaged, urban people, and retiring or terminated civil servants.

174
settlement schemes. Settlement schemes in Zambia fall into three broad categories: schemes set up tosettle European emigrants, schemes planned for Africans (Zambians), and schemes put in place tosettle refugees, particularly Angolans, Mozambicans, and Namibians, on a temporary basis. Thoughreferences will be made to the settlement of Europeans, emphasis in this chapter is on settlementschemes designed for Zambians, in both pre- and postcolonial times, and refugees from war-tornneighboring countries.
II. Historical rationale for settlement schemes
A. Land alienation and reservation schemes
Settling people in designated areas has roots in Zambia's colonial past as well as in thepostindependence era. The authority to alienate land and move people was granted at the start of thecolonial era in 1894 to the British South African (BSA) Company founded by Cecil Rhodes. Thischartered company, which ruled Zambia up to 1924, was granted powers of direct administration inareas north of the Zambezi as well as in Zimbabwe. It secured rights over the entire territory exceptBarotseland (now Western province) and had the authority to alienate any land to European settlers.Africans occupying the land were obliged to move into designated areas (Kalapula 1984, pp. 27-29).
Alongside the development of the copper mines—its prime reason for being in the region—BSA desired to develop agriculture as an ancillary activity, to provide food for the mine workers andtheir dependents. The company soon opted to exploit commercial agriculture as a prospective sourceof revenue generation. The conditions were highly conducive for promoting commercial agricultureincluding: the railway that ran through millions of acres of prime agricultural land, connecting Zambiato Zimbabwe; the ready local market for food with the potential for export to European markets; theabundance of cheap African labor; the excellent weather and good soils; and the vast land area.
The two choices available to BSA were to rely upon the African population to acquire theknowledge and skills to produce the required agricultural products on a commercial basis, or toencourage European farmers who already possessed the knowledge, skills, and necessary capital formodern agricultural practices to migrate to the area. It chose the latter, and, by 1921, 714 Europeanimmigrants were engaged in commercial farming in the area.
The policy option chosen for African agriculture was to keep the natives at their traditionalsubsistence-production level. The process of alienation and reservation of land that began with thecoming of the European settlers had an underlying policy that Europeans would have the best and mostproductive land reserved for their exclusive use, and that Africans would be concentrated intorestricted areas (Native Reserves) set aside for them. Land alienation and the development of thereserves were mainly in the areas along the company-owned railway that ran through choiceagricultural lands, the Southern part of what is today the Eastern province, and the area within thecompany's estates (an area south of Lake Tanganyika). Generally, lands reserved for the Africanswere made up of relatively small blocks, had soils of poor quality, and were in remote areas that wereoften infested with tsetse fly, while the areas reserved for the Europeans (crown land) were thecomplete opposite (see tables 1.1 and 1.2, chapter 1, above).
Africans displaced from the plateau and from mining areas in the Copperbelt and confined tothe reserves lost the population-land balance which allowed them to move onto other available land

175
in the event of overcrowding. The Africans were from a large number of ethnic groups that includedboth matrilineal and patrilineal societies. In spite of differences in languages and political organizationsamong groups, the production practices, technology, and division of labor were very similar, and bothmen and women played a role and shared in access to land which was in abundance.
With population increase due partly to in-migration of Africans from neighboring areas, andwith mal-distribution of population in reserves from the start, the population density in the Africanreserves soon exceeded the carrying capacity of the land. In some cases, local congestion was soserious that people were no longer able to produce enough food to feed their families and had to beassisted with food by the government.
The problem of serious congestion in Native Reserves continued up to the 1940s whileironically, at the same time, millions of acres of uncultivated land in the crown reserves` and whatwas referred to as "unsigned land" lay idle. Out of concern for the degradation of the land and forestresources, a large part of the crown land held by the Northern Charter Land Exploration Companyin Eastern Zambia was acquired by the government in 1941. In 1942, it was declared Trust Land andmade available for native occupation. In 1942, a land commission was appointed by the governmentto review the issue of agricultural land requirements of the natives. Their work resulted in thereallocation of a further 15,000 square miles of crown land for native occupation countrywide and160,000 Africans were transferred from overcrowded reserves to new land.
In 1924, BSA divested its control of the territory and a governor was appointed by the Britishsovereign, but the concept of restricting Africans to special areas remained the same. The policy ofthe new administration was that Africans were to be resettled so as to reestablish a population-landbalance on the basis of traditional land usage and the population level at the time of settlement.Settlement of Africans was not regarded as a substitute for agricultural improvement or as a meansof promoting agricultural development, even though simple measures of agricultural control and thebeginnings of soil conservation and agricultural improvements were introduced in each of thesettlement areas as a condition of occupation.
Settlement was instead to accomplish four immediate objectives: (a) to reduce populationpressure on the land in the congested areas and to remove the danger of food shortage and, in somecases, actual starvation; (b) to reduce the urgent agricultural problems of poor land utilization tomanageable proportions; (c) to remove the imbalance of land-starved people in the midst of plenty;and (d) to give time for experiment and introduction of new methods of agriculture.
The first scheme that aimed at improvement in African agriculture was introduced in 1946.This scheme was to launch progressive individuals into modern, commercial agriculture on familyholdings. A price stabilization fund was established to run the program. Its goal was to create anucleus of proficient farmers to inspire other Africans to improve their farming and to seek a livingfrom the land (Hellen 1969).
BSA had anticipated a much larger in-migration of European settlers than materialized and, as such, had set asidemassive land areas as crown reserves.
176
In 1949, a revised scheme was introduced, and, with it, the price stabilization fund wasrenamed the Southern Province African Farmers' Improvement Fund. The fund was to be replenishedannually by a levy on all African sales of maize in the province. This new scheme was extended tothe railway zone of the Central province and to the Eastern province in 1951 (Kalapula 1984,pp. 37-38).
B. Agricultural settlement schemes
The first agricultural settlement scheme was started in 1950 with the selection of Chipangali,an area under Chief Sayiri, North of Chipata in the Eastern province, to provide alternative land foragricultural development for Ngonis displaced by white settlers in areas of Chipata South that had beendeclared crown land. The first families moved into the scheme in 1951, but it was not until 1955 thatinfrastructural developments promised at the beginning were brought to the area. At this time, roadswere constructed, wells were sunk, dams were built, the land was demarcated, and staff houses, aschool, a dispensary, a welfare hall, and stores were built.
Between 1951 and 1963, other people slowly moved into the Chipangali agricultural settlementarea from South Ngoni. Apart from their displeasure over being displaced by the Europeanimmigrants, people were reluctant to move to the settlement area because of the long distance fromtheir original home base, and fear that their cattle would not survive in the tsetse infested area. Oncethere, settlers were registered under the peasant farming scheme and given plots of 40 hectares.
By the end of 1963, 67 of the 86 farm plots were occupied, and the farm families, who hadbeen provided with 6 hectares of cleared land, two oxen, a plough, and a ridge and scotch cart 5 onloan, were growing groundnuts, maize, and burley tobacco. Even though a few farm families movedout, the number moving into the scheme was larger, and by 1973, 105 farm families were cultivating12,000 hectares of land (Eardmans 1972).
Shortly after independence, many of the European farmers left Zambia, leaving behind theirlarge landholdings in the crown land areas. The agricultural structure left behind by the colonial rulerswas highly dualistic. Settled farmers dominated most marketed crops, and there was little developmentof small-scale, semi-commercialized African agriculture. The newly independent Zambian state hadadopted the philosophy of humanism,' which committed it to the policy of full employment, requiringthat every able-bodied person be fully employed in some productive work. At the same time, thegovernment was concerned with the country's food insecurity position. On the one hand, it was afrontline nation and in the past, the country had depended upon imports from the white-ruled south.On the other hand, the country's urban population was growing rapidly, with obvious politicalsignificance.
The government embraced the idea of giving land to people who wished to settle foragricultural purposes, through settlement in organized schemes, a move that was politicallymotivated,' and one that has persisted as a key factor in Zambian agriculture. The farms vacated by
A small two-wheeled cart of southern Africa with a detachable or slanting panel at the back.6 Humanism is a pragmatic form of African socialism which stresses the need to remove "man's exploitation of man"
through state control over the "heights of the economy" but still allows private enterprise to continue in most sectors of theeconomy. See Kaunda (1974), Part II.
7 For a more detailed discussion of this viewpoint, see Kean and Woods (1992).

177
the European farmers were purchased and redistributed by the state and became the site of many ofthe original settlement schemes. Settled commercial farmers and medium- and small-scale farmerswere supported by research, credit, and extension to facilitate expansion of production. At the sametime, because of the equity requirement of the humanist philosophy, the government expanded theagricultural extension service and the network of crop marketing depots to cover the whole country,introduced subsidized tractor plowing services countrywide, and increased subsidies on fertilizers andcrop collection over a number of years to achieve uniform prices throughout the country.
C. Schemes for Angolan refugees
Beginning in 1966, significant numbers of Angolan refugees poured across the Zambian borderseeking shelter from the civil war raging in their country; as of 1989, considerable numbers were stillin Zambia. Some of these refugees were settled by the GOZ in the Maheba Scheme of Solwezidistrict, and some were "self-settled" in villages where they had friends and/or relatives.'
By 1988, approximately 140,000 Angolan refugees were self-settled.' The Zambian RefugeesControl Act required that such refugees live in controlled schemes, and, in the 1970s, the governmentconducted sweeps of villages where it suspected refugees were living to try to move them into theschemes. The government's interest was limited to those who had arrived since 1985, and earlierrefugees were largely ignored. These refugees were ineligible to become Zambian citizens, and so theydepended on the generosity of their hosts and were ineligible for the subsistence packages (includingsuch basics as blankets) the GOZ provided to refugees in settlement schemes. Their position wasprecarious.
By 1988, approximately 11,600 Angolan refugees lived in the Maheba Scheme, located on atarmac highway with good connections to neighboring cities. They enjoyed the start-up packagesprovided by the GOZ to native resettled subsistence farmers (see section IV below) and were relativelywell off and secure in access to their holdings. In many cases, they were poorer materially than theself-settled but were well integrated into the local economy, whereas the self-settled had more materialgoods but still felt like refugees. Differences between the two groups are summarized in table 6.1. TheAngolans represent a special case, but one in which government settlement schemes produced clearlysuperior results to self-settlement efforts by the refugees, a result the current GOZ may want to focuson and learn from.
D. Postindependence settlement schemes
The postindependence government objectives for settlement programs were based on botheconomic and political considerations. As indicated above, the equity goal in the humanist philosophyrequired an increase in African participation in market-oriented agriculture not only for one area orone group of producers, but throughout the country—a requirement which the government was unableto meet. Faced with the problem of rapid out-migration from the rural area and rising unemployment,especially in the peri-urban and urban areas, the notion of settling people in productive
Hansen (1990) compared the well-being of the two groups along five dimensions: (1) economic, (2) integration intothe host society and economy, (3) confidence and security, (4) health, and (5) access to infrastructure.
9 A settlement scheme known as the "Ukwimi Scheme" was also established in Petauke district of Eastern province tosettle Mozambican refugees. The scheme accommodated 25,000 refugees.

178
Table 6.1: Self-settled versus scheme-settled
Attribute Self-settled Scheme-settled
Younger than the self-settled.Men older than women.
More literate than self-settled, especially women.
More likely to be married than those self-settled, exceptfor women.
Little variation from self-settled dwellings.
One-quarter of the men and a few women owned oneor the other.
Many were given blankets, though some had to sell tobuy necessities.
Men earned more than women, though the differenceswere small.About one-quarter earned from cash crop sale by bothwomen and men, mainly soybeans.Men earned from livestock and fishing. Women earnedfrom beer.Trees, honey, and access to good road important toincome earning.
Men more self-sufficient than self-settled; littledifference among women.Maize most important subsistence crop; easy access togrinding mills.
Fully integrated into society, even had Zambianregistration cards.No one wanted to return to Angola.
Age Older than those in schemes.Men older than women.
Literacy Less literate than those inschemes.Host men most literate.
Marital Less likely to be married thanstatus those in schemes, especially
women.
House Little variation with schemes,types though women had poorer
dwellings.
Bikes and No one owned either; although aradios few host men did.
Blankets Most had none; hard to buy andused as shrouds.
Gross cash Men earned more than women,income though the differences were
small.About one-fifth earned from cashcrop sale.Men earned from livestock andfishing. Women earned frombeer.
Food and Men more self-sufficient than inhome schemes; little difference amongproducts women.
Cassava most importantsubsistence but infested by mealybugs. No access to grindingmills, hence little maize.
Integration Not well accepted by surroundinginto society villages.
About one-half wanted to returnto Angola.

179
agricultural areas and assisting them to develop farm plots demarcated and assigned to them wasviewed as the most realistic remedy to unemployment. It would result in greater self-employment inthe agricultural sector and reduce unemployment at the national level.
Settlement schemes were also attractive to the government as a favored policy tool aimed atincreasing agricultural production, diversifying the economy away from copper mining, and improvingthe living conditions of some part of the rural farming population. The existence of large amounts offormerly European-owned (and in some cases, developed) land as well as other vast unutilized areasfor redistribution made this policy tool an easy one to implement.
A review of the government objectives for settlement programs from independence to 1991and those of the present government shows they are largely the same. The objectives of the previousgovernment were to:
► provide people the opportunity to settle permanently in the best agricultural areas available inthe provinces, and to enable the farmers if they so wished to obtain leasehold title to theirholdings;
► allow already permanently settled family farmers in some provinces where the populationpressures have increased to have the opportunity of acquiring more suitable mixed farmingunits, where increased production of crops and livestock could take place without detrimentto the land;
► overcome the problems created by the flooding of the Gwembe Valley in Southern province;► provide opportunities in selected areas to growers to participate in the production of specific
crops such as tobacco, coffee, and sugar cane;► survey, plan, and demarcate areas of non-State Land into commercial farming units and have
these areas declared State Lands on which people, particularly those members of the publicwho are unemployed and wish to take up agriculture as a means of livelihood, can settle; and
► reinforce, indirectly, the program clearing large tracts of land to overcome tsetse flyinfestations by settlement of selected areas cleared of the fly.
The present government also views settlement as a vital program, and it has expressed acommitment to continuation of its implementation and support. In an effort to consolidate control andbring about better coordination, responsibility for running the programs has now been placed in theoffice of the vice president. The day to day administration is under the Department of Resettlementin the vice president's office.
Like the previous government, the present government objectives for the settlement programsare both economic and political. They include:
► creating opportunities for those retrenched from public service and others that areunemployed;
► bringing more than 250,000 hectares of arable idle land under cultivation throughout thecountry, thus increasing household and national food security;
► creating new focal points for rural investment and rural development; and► bringing about more efficient utilization of social services in rural areas through the creation
of viable settlements as opposed to unplanned scattered settlements.

180
III. Institutions involved in the settlement program
Prior to 1993, several government institutions were involved either directly or indirectly inthe initiation, planning, and administration of settlement schemes. The ZNS ran 41 RuralReconstruction Centers scattered throughout the country. The MAFF 10 had a large number ofsettlement schemes under its control (see annex 6.1); the Ministry of Labor and Social Services wasresponsible for schemes for the handicapped; the Ministry of Local Government and Housing wasinvolved in identifying settlement areas; the ZCCM ran two settlement schemes for people it retired,and the Department of Resettlement was established to run settlement schemes for other retired people.Cooperative schemes were run by the Department of Co-operatives, and the Ministry of Educationschemes served as outlet for the two agricultural colleges established in the 1960s. Schemes toencourage tobacco production were also run.
Settlement of people from urban areas back into their home villages or other villages of theirchoice was yet another settlement scheme supported by the GOZ. While most of the resettled peoplehave gone to the government-planned settlement schemes, there are some who have resettled inunplanned areas, either due to their traditional beliefs or to their desire to settle back in their villagesrather than in one of the established settlement schemes. Frequent reference is made to the fact thatthose people who have indicated a desire to return to the land for agricultural purposes, but not viasettlement schemes, have also been assisted by the government. There is, however, no mention of howmany people in this category have been settled, in which areas the settlers are, which organizationactually coordinates the program, or what they are doing.
Not only were there many institutions involved in running settlement schemes, but the policiesthat governed the implementation of the schemes were also quite varied. The data available do notallow for a detail listing of all of the groups and subgroups that were responsible for the variousaspects of all of the settlement schemes, but where data do exist, the picture of a layeredadministrative structure is clear. For example, at the implementation level, ten committees wereresponsible for the Rural Reconstruction Centers. Table 6.2 below outlines the committees and theirfunctions.
With so many players, it can be assumed that there were divergent views about how thesettlement programs were to run, and what policy and implementation strategy were to guide them.Such divergent views in planning, policy formulation, and implementation strategy could only leadto the introduction of conflicting measures that would in turn lead to the failure to achieve any goal.
Also, with the diverse functions of resettlement, it became clear to government that no oneministry could handle the planning for and management of settlement schemes for the entirecountry.
11In 1989, a new department—the Department of Resettlement—was established in the office
of the prime minister, and full responsibility for planning of settlement programs and coordination of
10 Formerly the Ministry of Agriculture and Water Development.11 Land demarcation is performed by the Ministry of Agriculture; water, wells, and boreholes by the Ministry of Energy;
and schools, clinics, and social services by the ministries of Education, Health, and Community and Social Services, amongothers.

181
Table 6.2: Committees responsible for administration of Rural Reconstruction Centers
Name of committee Function/responsibility
All matters of administration.
All matters of politics and political education.
Matters of field crops, vegetables, and orchards.
Rearing of livestock and poultry.
Defense and security of the center.
Developing such skills as carpentry, bricklaying,blacksmithing, and development plan of centers.
Cultural Promote Zambian culture in the centers.
Social Welfare Health, education, sports, and general welfare of center.
Financial All matters of finance.
Disciplinary Matters of discipline in the center.
Source: Adapted from E.S. Kalapula, "Back to the Land: Youth-based Agricultural Land Settlement Centers forEconomic and Social Development in Southern Zambia" (1984), p. 119.
their implementation was turned over to it. 12 While in theory this new department had theresponsibility charged to it, in practice it was unable to function effectively because it lacked bothtrained personnel and resources. As a result, each individual district office took over responsibilityfor schemes in its area. In 1992, the Department of Resettlement again took responsibility for allschemes, although the staffing situation had not improved substantially. Under the current government,the Department of Resettlement is in the office of the vice president, and the responsibility forplanning of all settlement programs and coordination of their implementation rests with it. Thedepartment now has a slight improvement in its staffing. However, with the huge responsibility withwhich it is charged, there is still much need for expansion of resources.
IV. Settler selection procedures and assistance provided
The procedure for selection of settlers involves six steps, which can take several months tocomplete. People wishing to resettle in land settlement scheme areas are first required to make thisknown to the government by registering their names at the council office of residence. They then mustcomplete an application form (Form DR 1), which is filled out in triplicate, giving such details as thesize of family, profession and skill, and suggested destination/area of settlement.
'2 Data on the establishment of certain schemes were already lacking when files were transferred to this department in1989, and further data were lost in subsequent transfers.
Administration
Political
Agricultural Production
Animal Husbandry
Security and Defence
Skills
182
Step two involves the submission of the completed form by the council to the district executivesecretary who retains a copy at the council and distributes one copy each to the district where theapplicant intends to settle and the Department of Resettlement in the office of the prime minister. 13
The third step involves a number of substeps: the town of destination makes a request to thetown of origin for information about the applicant; the town of destination is required to make anassessment of the potential of its area to accommodate people from the town of origin; and thesettlement area and the estimated cost involved must be identified.
Once these conditions are met, the fourth step involves getting a response on the outcome ofthe application from the council office in the area of destination to the council where the applicationoriginated, and finally to the applicant. If approved for settlement, the applicant is advised to preparefor the move and to inform the district office of expected date of travel.
The fifth step involves the provision of transportation to facilitate the move to the settlementarea. Transportation to the settlement area is one item in the incentive package that the governmentgives to all settlers. Arrangement for transportation for the move from the town of origin is theresponsibility of the dispatching council up to the headquarters of the recipient district, which thentakes the responsibility for transporting the new settler to the settlement area where he/she isimmediately allocated a plot.
Once the settler is in his/her new home area, the rest of the incentive package is madeavailable. The incentives given to settlers have changed over the years and have varied depending onthe category of settlement. Prior to 1985, people were being settled either as medium- or small-scalecommercial farmers or as subsistence farmers who wanted to relocate and to take advantage of theincentives being offered by the government.
The incentive package for the medium- or small-scale commercial farmers included: soilsurvey and demarcation of farm plots; access roads to each farm on the scheme; access to communalwater supplies and cattle-dipping facilities; access to agricultural extension, credit, supply, andmarketing services; sufficient cleared land for the first year of the farming system proposed; 14
subsidies for fencing and water supply at the existing levels; tractor services for plowing; andtransportation to the settlement area.
People going into settlement schemes to produce on a subsistence basis were provided withtransportation for the family to the settlement area. In addition, they were provided with soil surveyand demarcation of farm plots; access roads to each farm on the scheme; access to communal watersupplies; access to agricultural extension advice; stumping and windrowing of one hectare (orstumping of two hectares), free of charge; seed, fertilizer, and pesticides for two hectares, free ofcharge for the first year; the normal subsidies available for fencing and water supply; and tractorservice for plowing."
13 This department is now in the office of the vice president.14 The land clearing cost was to be recovered from the farmer.15 Granting 14-year leases was only considered after observing and assessing the farmer for at least two years. The major
consideration was that the farmer should show progress in terms of clearing land above the initial area cleared by thegovernment.

183
In 1985, the government began a project to review the level of success and bottlenecks of thesettlement programs and, in collaboration with provincial authorities, to identify new areas forsettlement. With growing urbanization and unemployment, the government was also seeking ways tomake the program more attractive so as to encourage more people to return to the land. At the sametime, the government sought ways to make the settlement program more sustainable.
In the process, attention was called to the need to change the target group to include programsfor youth, the unemployed, and retirees, and to review the cost structure for running the schemes. Thetask force concluded that the government approach for developing the settlement led to highinvestment costs that could not be sustained and, therefore, needed to be changed. Despite thisdefinitive position statement, the committee's report did not indicate cost for the programs with acomparison to other development costs. In fact, there is very little recorded information about theactual cost for establishing the various schemes, and, where some information does exist, it isincomplete. For example, the MAFF annual report for 1987 shows that as at the middle of 1986, thecost of clearing 1 hectare of land in each province was estimated as follows:
► Central K240► Copperbelt K400► Eastern K400► Luapula K400► Lusaka K240► North-Western K400► Southern K240► Western K240
Alone, these figures tell very little. What would have been useful is a comparison of landclearing cost in settlement areas and other areas, by method of clearing and type of vegetation, anda breakdown of these costs over time. The same information would have been useful for otherinvestment costs.
The committee proposed a low-investment approach that would require that the governmentprovide an incentive package that included only such basic infrastructure as roads, demarcation of plotboundaries, a few communal wells or boreholes, and a dam, leaving the rest of the farm developmentcost to be borne by the settler.
As part of the exercise, each province was requested to identify possible areas of new landas well as land areas of existing schemes that were underutilized for redistribution to settlers. In theprocess, vast areas of land including former state farms and the 1.5 million hectare Tazara Corridorwere identified for the new schemes.
In 1989, the prime minister informed the national assembly of the changes that the governmenthad proposed to the implementation of the settlement program. In addition to the existing settlementareas, it had been decided that the rural reconstruction centers and areas under the councils be fullyutilized for the purpose of resettling people. A requirement, however, was that settlers who werealready in place would be given title deeds prior to admitting newcomers. Table 6.3 shows areas thatwere identified for settlement.
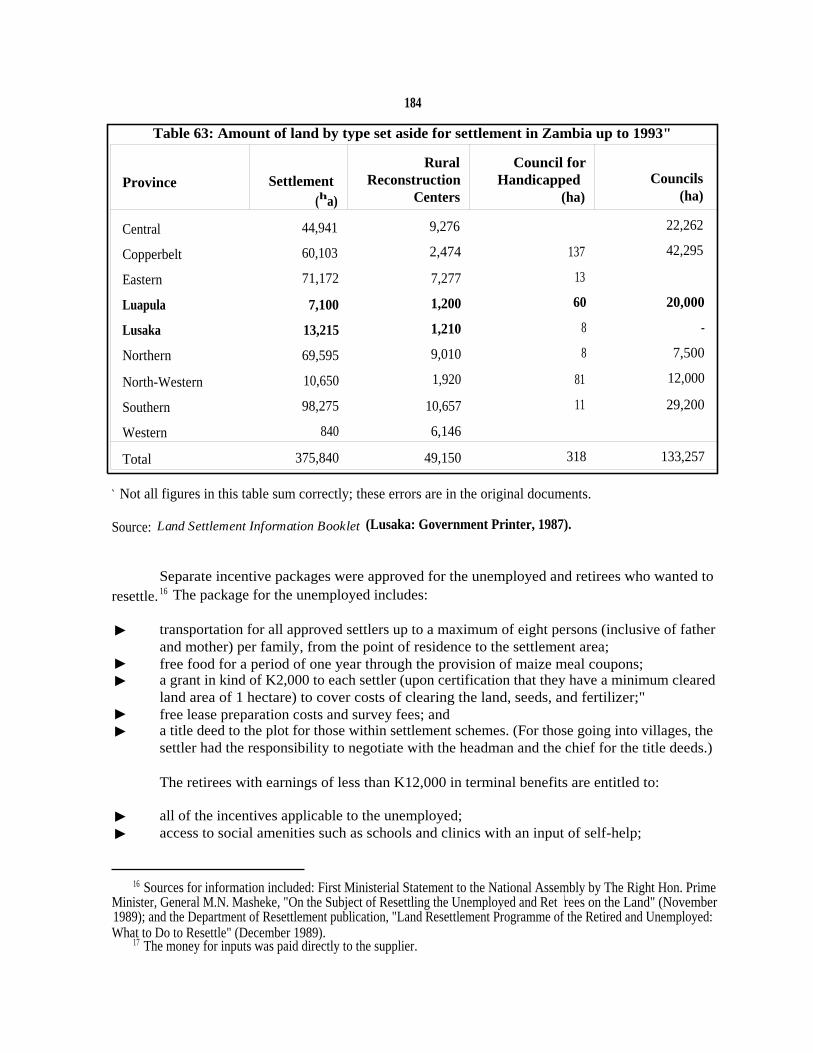
184
Table 63: Amount of land by type set aside for settlement in Zambia up to 1993"
Province SettlementRural
ReconstructionCouncil for
Handicapped Councils
(ha) Centers (ha) (ha)
Central 44,941 9,276 22,262
Copperbelt 60,103 2,474 137 42,295
Eastern 71,172 7,277 13
Luapula 7,100 1,200 60 20,000
Lusaka 13,215 1,210 8 -
Northern 69,595 9,010 8 7,500
North-Western 10,650 1,920 81 12,000
Southern 98,275 10,657 11 29,200
Western 840 6,146
Total 375,840 49,150 318 133,257
` Not all figures in this table sum correctly; these errors are in the original documents.
Source: Land Settlement Information Booklet (Lusaka: Government Printer, 1987).
Separate incentive packages were approved for the unemployed and retirees who wanted toresettle. 16 The package for the unemployed includes:
► transportation for all approved settlers up to a maximum of eight persons (inclusive of fatherand mother) per family, from the point of residence to the settlement area;
► free food for a period of one year through the provision of maize meal coupons;► a grant in kind of K2,000 to each settler (upon certification that they have a minimum cleared
land area of 1 hectare) to cover costs of clearing the land, seeds, and fertilizer;"► free lease preparation costs and survey fees; and► a title deed to the plot for those within settlement schemes. (For those going into villages, the
settler had the responsibility to negotiate with the headman and the chief for the title deeds.)
The retirees with earnings of less than K12,000 in terminal benefits are entitled to:
► all of the incentives applicable to the unemployed;► access to social amenities such as schools and clinics with an input of self-help;
16 Sources for information included: First Ministerial Statement to the National Assembly by The Right Hon. PrimeMinister, General M.N. Masheke, "On the Subject of Resettling the Unemployed and Ret irees on the Land" (November1989); and the Department of Resettlement publication, "Land Resettlement Programme of the Retired and Unemployed:What to Do to Resettle" (December 1989).
17 The money for inputs was paid directly to the supplier.

185
► access to agricultural extension services;► soil survey and demarcation of farm plots; and► access to roads to each farm, communal water supplies, and cattle-dipping facilities.
Under the new program, the councils were assigned as implementing agents of the settlementprogram. The specific roles assigned to the councils included:
► demarcation of the settlement plots;► provision of wells or boreholes and dipping facilities;► provision of access roads and all necessary infrastructure; and► coordination of the institutions involved in settlement including the Ministries of Agriculture,
Water, Lands and Natural Resources, General Education, Youth and Sports and Works andSupply.
V. Structure and growth of settlement schemes
Information on settlement schemes is so fragmented and out of date that it is difficult todiscern even such basic facts as: which schemes actually settled people, the number of such schemes,the number of settlers, which schemes have been abandoned, when and why, which schemes werereorganized and had the name changed, and which agency is currently responsible for running theschemes. As best as can be interpreted from the available material, the Zambian government continuedto support the settlement schemes that had been started by the colonial government and commencedsoon after independence to organize their own. The first schemes were organized along cooperativefarming lines. The January 1965-June 1966 Transitional Development Plan and the First NationalDevelopment Plan 1966-1970 speak of these.
From the late 1960s to mid-1980, a number of other alternative schemes were attemptedincluding: peasant farmers schemes, master farmer schemes, family farm schemes, area developmentprojects, the intensive development zones program (later changed to the Integrated Rural DevelopmentProgram), consumer cooperatives, multipurpose cooperatives, tenancy schemes, settlement schemes,resettlement schemes, and crop season credit and minimum package schemes.
The dearth of information about these programs inhibits much elaboration. It might be usefulat some future date to compile these if records can be found to do so. The summary below is basedon information collected during a rather extensive data search.
(a) Rural Reconstruction Centers.' s In 1975, the government commenced the establishment ofthese centers as settlement schemes with the objective of fitting school-leavers and urbanunemployed youth for productive life in the rural sector. Two years later, the governmentindicated that the program was open to all—boys and girls, men and women—who were notgainfully employed or who were underemployed.
'i The precursors to the Rural Reconstruction Centers in Zambia are in the Zambia Youth Service and the ZambiaNational Services. All three programs emphasized training of youth in trades, agriculture, and military skills.
According to officials in the Department of Resettlement, government at the time requested land from the councilswhich in turn sought land from the chiefs. A number of chiefs are now contesting these claims and demanding that the landbe returned on grounds that the former chiefs performed their duties improperly in giving the land away.

186
Various scholars perceived the objective of the program differently and indicated this in theirwritings. For example, Tiberondwa (1976, p. 4) wrote that the Rural Reconstruction Centerswere areas where school-leavers were taken and taught to participate in productive manualwork instead of being allowed to loiter in towns. Sakala (1975) indicated that the centers wereto serve as nuclei of agricultural and agroindustry development for the government. Accordingto Shepande (in Kalapula 1984), the primary aim and objective of the program was toimplement the party and the government policy of rural development.
The planned annual enrollment in the program was 42,000, and every district was to have fivecenters, with an intake of 800 per center. As noted by the ILO/JASPA Mission (1975), 19 ifsuch a plan had been implemented, 250 centers would have been established in the countryas a whole, and this would have involved 216,000 farming families or 1,080,000 to 1,296,000people, which was equal to one-third of the rural population of Zambia in 1974. The initialestimated cost was K17.5 million a year (Sakala 1975). By 1987, 51 schemes had beenstarted, comprising a total land area of 49,170 hectares. Out of this, 8,208 hectares had beencleared and 1,434 youths settled. Further details are presented in table 6.4 below.
The selection criteria were simple: one had only to be a Zambian youth who had dropped outof school and was unemployed. There was no shortage of such people. In 1987, governmentfigures showed that there were an estimated 1,316,637 unemployed out of a total labor forceof 1,966,285. Zambia has a very young population, and the school dropout rate is high. Thewould be settlers were required to join the Zambian National Service and to become membersof the individual center cooperative.
(b) State Farms. Eighteen farms, comprising a total demarcated land area of 380 thousandhectares. By 1987, only three farms (Mswebe in Lusaka West and Mwembeshi and Mtiriziin Petauke district) were in production. The other fifteen farms comprising 300,000 hectareshad by this date been identified as State Land to be subdivided and allocated as small holdings.
(c) Southern Province Land Commission Farms. These were smallholdings of varying sizes, thatcovered an estimated 29,642 ha. By 1987, 25,562 hectares had been surveyed, and a decisionhad been reached by the government to subdivide the area and allocate the farms to peoplethat wanted to settle. Table 6.5 below gives details on the locations, number of farms, andsize of each.
(d) Tazara Corridor projects. A program was started in 1986 to develop commercial farms in anarea of about 1.5 million hectares along or near the Tazara railway. Development of theproject was hampered by inadequate funding, and as a result, of the 649,000 hectares that hadbeen demarcated in four areas, only 40,000 hectares comprising 486 farms had beendeveloped by 1990. These farms were incorporated into the Land Resettlement Program.Details of the project are presented in table 6.6 below.
19 Reported in Kalapula 1984. p. 112.

187
Table 6.4: Land available under Rural Reconstruction Centers
Land (hectares) Settlers (number) Cost ofclearing
Province Available Cleared Uncleared Current Shortfall the land(K)
Central
Serenje 3,818 216 3,602 41 13 864,480Kabwe 337 327 100 65 24,000Mumbwa 500 200 300 34 16 72,000Mkushi 4,621 256 4,365 19 45 1,047,000
Subtotal 9,276 909 8,367 159 74 2,007,480Copperbelt
Kitwe 150 130 20 26 7 8,000Mufulira 200 120 80 20 10 32,000Chingola 750 700 50 35 140 20,000Luanshya 208 165 43 27 14 17,200Ndola 198 98 100 18 7 4,000Chililabombwe 770 90 680 18 5 272,000Kalulushi 198 198 18 30
Subtotal 2,474 1,501 973 162 213 353,200Eastern
Chipata 1,058 150 908 31 7 363,200Petauke 1,000 34 968 30 - 387,200Katete 1,000 215 785 35 16 314,000Chadiza 1,000 330 670 34 49 268,000Chama 1,919 41 1,878 11 751,200Lundazi 1,300 185 1,115 36 13 446,000
Subtotal 7,277 955 6,324 177 85 2,529,600Luapula
Samfya 185 150 35 25 13 14,000Nchelenge 219 27 192 20 - 76,800Mansa 386 150 238 48 94,400Kawambwa 200 158 42 22 18 16,500Mwense 210 150 60 20 18 24,000
Subtotal 1,200 635 567 135 49 225,700Lusaka
Rufunsa 210 70 140 50 - 33,600Luangwa 1,000 88 912 12 13 218,880
Subtotal 1,210 158 1,052 62 13 252,480

188
Land (hectares) Settlers (number) Cost ofclearing
Province Available Cleared Uncleared Current Shortfall the land(K)
Northern
Mpika 4,000 209 3,791 57 1,516,400Isoka 1,165 161 1,004 24 16 401,600Chinsali 1,500 159 1,341 22 16 536,400Mporokoso 250 150 100 35 3 40,000Kaputa 725 40 685 11 274,000Mbala 150 150 38Kasama 1,000 212 788 55 315,200Luwingu 220 135 85 45 - 34,000
Subtotal 9,010 1,216 7,794 287 35 3,117,600North-Western
210 100 110 27 - 44,000SolweziMwinilunga 174 174 18 26 -Kabompo 500 40 460 22 184,000Zambezi 500 50 450 28 180,000Chizera 300 50 250 12 1 100,000Kasempa 236 156 80 22 17 32,000
Subtotal 1,920 570 1,350 129 44 540,000Southern
1,800 208 1,592 65 382,080LivingstoneChoma 500 260 240 38 27 57,600Kalomo 5,333 190 5,143 25 23 1,234,320Monze 2,181 160 2,021 28 12 485,040Mazabuka 628 107 521 23 4 125,040Namwala 150 47 103 7 5 24,720Sinazongwe 65 57 8 26 1,920
Subtotal 10,657 1,029 9,628 212 71 2,310,720Western
Kaoma 360 100 260 15 10 62,400Mongu 500 500 - 25 100 -Senanga 4,704 55 4,649 10 4 1,115,760Sesheke 44 44 - 34 - -Kalabo 500 500 10 109 -Lukulu 38 38 17 -
Subtotal 6,146 1,237 4,909 111 223 1,178,160
Grand total 49,150 8,210 40,964 1,434 807 12,514,940

189
Table 6.5: Farms recommended for settlement in Southern province°
District Farm no. Hectareage
Mazabuka 32-627, 1,418544 324125 1,620607 1,105608 708
Subtotal 5,175
Monze 2-761/RE 163584 1.634
Subtotal 1,797
Choma 1024 2,3941034 2,3311164 1162775 2,1333114 2,199
27/RE 1,91236a/RE 76735a/RE 141
36/A 3672-106 1,8702-107 1.836
Subtotal 16,788
Grand total 25,562
a The figures in this table do not sum correctly; this error is in the original document.
Source: Land Settlement Information Booklet (Lusaka: Government Printer, 1987).
Table 6.6: Development of farms in the Tazara Project
Name of areaTotal area
(ha)Area developed
(ha)Number of farms
created
1. Katikulula 90,000 6,000 60
2. Munte 215,000 10,000 101
3. Manshya 147,000 16,000 182
4. Kanchibiya 197,000 8,000 143
Totals 649,000 40,000 486
Source: National Commission for Development Planning, Economic Report, 1990.

190
Table 6.7: Farm Block Development in Zambia
Province Name of block
Total area fordevelopment
(ha)
Areadeveloped
(ha)Farms created
(#)
Central
Copperbelt Kantolo-Luankuni 4,050 NA` 21Luansobe 12,000 NA 36
Eastern Mwasemphangwe 9,340 NA NAMuchimadzi 4,000 4,000 66
Luapula ChitondoMansa NA NA 22
Lusaka Shikabeta 2,900 2,600 69
Northern Longwe 4,428 4,428 91b
Mwita 9,500 -
North-Western Mikilingi 18,526 7,474 12
Southern NA but in most areas Varied Varied 644
Western
identified
Kalumwange 21,000 6,000 69Lombe Lombe
a. NA = not available.b. This block is now part of the resettlement program.Source: National Commission for Development Planning, Economic Report, 1990.
(e) Farm Block Development Program. This program was started in the mid-1980s to makeadditional land available for commercial agriculture. Each province identified the location andhectareage of land for inclusion in the program, and, with assistance from the governmentthrough the resettlement program, farmers were settled. By the end of 1990, farm blocks hadbeen developed in each of the provinces except the Central province. Table 6.7, above, givesdetails of the development program up to 1990.
Settlement schemes. A program launched in 1986 called for the development of new areas ineach district for settling people that wanted to develop agricultural plots smaller than thosesettlements provided for commercial farmers. By 1990, ten schemes had been developed, withat least one in each of the nine provinces. A list of the schemes and their location is presentedin table 6.8.
Settlement schemes for the handicapped. Fourteen settlement farms with a total of 318hectares and a settler population of approximately 600 had been established by 1985throughout the country.
(0
(g)

191
Table 6.8: Resettlement schemes, 1986-1990
Province Name of scheme DistrictNumber of plots
demarcated
Central Katikulula State Farm Serenje 442
Copperbelt Lukanga North Ndola Rural 563
Eastern Mtirizi State Farm Petauke 316
Luapula
Chipangali State Farm
Mansa Block
Chipata
Mansa 90a
Lusaka
Chitondo State Farm
Kasenga
Kawambwa
Lusaka Rural 292
Northern Mpika State Mpika 576
North-Western Solwezi State Farm Solwezi 323
Southern Masasabe State Farm Namwala 337
Western Kalumwange Kaoma 310
a. Figure covers area demarcated in both districts in the province.Source: National Commission for Development Planning, Economic Report, 1990.
VI. Present administration of settlement programs
A department of resettlement in the office of the prime minister was formed in 1989 tofacilitate the government's program of settling the unemployed and the retired that resided in townsat the time. As the responsibility for settlement programs have now been assigned to the office of thevice president, the department is also now under the vice president's office. The department was givenstatutory powers on settlement in "The Statutory Functions, Portfolios and Composition ofGovernment" (Gazette Notice no. 46 of 1992). As yet, however, it has been assigned a number ofresponsibilities including:
► devise a suitable land settlement policy and procedural guidelines;► identify, appraise, and select suitable sites in conjunction with district authorities;► initiate the survey and planning of the sites;► coordinate all resettlement activities;► mobilize resources; and► supervise implementation and monitor projects in the settlement areas.
According to officials in the Department of Resettlement, 50 percent of land in currentschemes is demarcated in plots less than 10 hectares, which are allocated to smallholders who areunable to provide for themselves. Four families are normally settled to one well or borehole. Another35 percent of the land is allocated to demarcations 10-20 hectares in size. The remaining 15 percent

192
is allocated in demarcations 20-50 hectares to those people with sufficient capital to invest inboreholes themselves; applicants in such cases must present confirmation of having 1 million kwachato demonstrate the means to develop the land. Schemes are provided with schools and other facilitiesto attract people from urban areas (according to one official, life must be made better than in a typicalvillage or people have no incentive to come or stay). Schemes have had a less than remarkableexperience with acquiring 14-year titles to land. Applications are often submitted only to become lostin the system; some files are lost permanently. Inheritances, subdivisions, and transfers have becomeimportant issues in many schemes—issues that the department feels inadequate in addressing given thecurrent land policy.
VII. Access by women and minority groups
The achievement of a satisfactory level of self-sufficiency in the production of staple foods hasbeen a long-term goal of the Zambian government. In its Fourth National Development Plan,1987-91, the basic strategy outlined for achieving this goal was that preferential treatment would begiven to small-scale farmers, in line with their greater number, their development potential, and theirrelatively efficient use of scarce foreign exchange resources.
The majority of small-scale farmers are women, and, in the same Development Plan, therewas evidence of the increasing recognition of their development role by the government. The plancontained a full chapter on women in development, including agriculture. Empirical research duringthe 1970s to 1980s also gives recognition to the important role that women in Zambia play inagriculture.'
Despite this broad recognition, there is little evidence to suggest that women enjoyed equalrights to development assistance in the agricultural sector. To the contrary, there is some evidencesuggesting that they did not.
As mentioned earlier, the first postindependence government chose the cooperative movementas a means of promoting rural development. A program to encourage the formation of cooperativesocieties began in 1965 with emphasis on the communal cooperatives. A number of marketingcooperatives based on individual farms were, however, also organized.
Rules governing the formation of cooperative societies indicated that any group of ten peoplecould register as a cooperative to carry out a wide range of activities. For agricultural cooperativeswhere members ran the farm together, the government provided an incentive package that includedseasonal and medium-term loans and subsidies for land clearing and research and extension advice onimproved production techniques. No food crops could be grown on the farm and incentives for cashcrop production were given only to the head of household, the man, and only he was allowed to bea member. Women were therefore denied the opportunity to benefit from the formation of agriculturalcooperatives and to get the incentive package for supporting their agricultural ventures. Instead, theyand their children were expected to grow food crops unassisted, outside of the schemes. 21
20 See Allan (1984); Blake (1984); Chenoweth (1984); Due and Mudenda (1984); and Gaobepe and Mwenda (1980).21 Chilivumbo (1982); Keller (1984); Mutamba (1982).

193
While specific schemes are not identified, Ngenda (1993) mentions that marital status was usedin some schemes as a criteria for participation. In those cases, married women could not be consideredas individuals to own farms or plots. Single women without children were also not eligible for theseschemes unless they were backed by a male figure or had a position in the ruling political partystructure at the local level. The available data are not gender specific except in two cases shown intables 6.9 and 6.10.
Table 6.9: Number of settlers in Rural Reconstruction Centers,December 1979
Province Male Female Total settlers (#)
Central 395 1 396Copperbelt 589 5 594Eastern 303 1 304Luapula 285 1 286Lusaka 189 - 189Northern 494 1 495North-Western 295 5 300Southern 454 6 460Western 348 4 352
National totals 3,352 24 3,376
Source: Chambo Kawonga, Technical Paper No. 10, Rural Reconstruction ProgrammeILO/JASPA (1981), p. 148.
Table 6.10: Farm owners by sex in various settlement schemes
Settlement scheme Male Female Joint Total
Chitina 45 4 49Big Concession 68 2 70Lubombo 63 2 65Lukulu North 74 - 74Lusaka 101 9 5 115Milombwe 117 1 - 118Mumba 53 5 - 58Mungwi 144 6 150Ngwezi 128 2 130
Totals 793 31 5 829
Source: C.N. Himoonga, M. Munachonga, and A. Chanda, "Women's Access to AgriculturalLand in Zambia" (1988).

194
VIII. Desertion of settlement schemes
The information of rate of desertion of settlement schemes is scanty though several referencesare made to the fact that some people originally settled left the schemes. Also, there is littleinformation about why people left the schemes, and what encouraged those that remained to do so.The only time series data on desertion identified (Mbulo 1983) refer to seven rural reconstructioncenters in the Southern province. According to this study, in 1975, the combined settler populationwas 1,985. By 1982, the number of people still settled in the seven schemes was only 278. See table6.11.
Table 6.11: Desertion rate from resettlement centers
Settlement scheme Location Number of people, 1975 Number of people, 1982
Sibanyati Choma 315 41Ngwezi Kalomo 275 49Kabuyu Livingstone 500 58Nega-Nega Mazabuka 300 29Namilongwe Monze 300 60Ngabo Namwala 115 9Sinazongwe Sinazongwe 180 32
Totals 1,985 278
Source: M.P. Mbulo, "Some Issues in the Development of Settlement Schemes in the Southern Province"(1983).
IX. Type of production on schemes
Nowhere in the data available to the researchers is there detailed information on types ofagricultural activities, output, exact amounts of input or incomes of the settlers. From the vagueinformation gathered, maize was the main crop grown. Other crops included sorghum, tobacco,sugarcane, and vegetables. Livestock included cattle and poultry. This should be an area of researchduring future study of settlement programs in Zambia. The information would give better insight intoissues of desertion, level of enrollment, and why some schemes were abandoned by the governmentor nongovernmental funding agencies. The best source of such information is a report on theagricultural settlement schemes compiled by Mpenda, Jaboni, Mtonga (1983), which, except for itssize (109 pages), would have been attached to this report as an annex. The report, however, is readilyavailable through the University of Zambia Library and should be consulted by researchers carryingout future study.
X. Settlement schemes and conservation issues
Very little is recorded on land resource conservation issues as they relate to settlement schemesin Zambia. What the available information seems to suggest is that those areas for which detailed farm

195
planning was done prior to settling, and where the plans have been followed, there are no serious soilor water conservation problems. Such is the case with most of the original farms on State Land butnot on traditional land. In these areas, soil erosion is said to be evident in most areas, especially inpastoral rural communities. While some livestock owners have shown regard for animal stocking ratesand carrying capacities of their holdings and have adopted appropriate farming practices, others havedisregarded all such factors, resulting in general land degradation.
The Land Use Planning Section of MAFF indicates that, at present, only about 6 percent ofZambia's arable land is adequately planned for agricultural use. It warns that present land developmentremains a big threat to overall resource conservation and management, and suggests that appropriateplanning and conservation need to focus high on the agenda from now on.' (See table 6.12 fordetails on existing planned agricultural areas in Zambia.)
Table 6.12: Existing planned agricultural areas in Zambia
RCP° CCP° SS" FBD*
Province Area Area Area AreaNo. (km2) No. (km') No. (km 2) No. (km)
Central 13 3,525 9 6,842 8 333 3 3,840Copperbelt 3 1,143 3 1,108 14 1,014 5 801Eastern 0 0 5 1,184 23 700 2 199Luapula 0 0 0 0 3 24 5 844Lusaka 12 3,080 0 0 3 131 1 35Northern 0 0 0 0 7 296 4 3,677North-Western 0 0 0 0 4 115 2 365Southern 29 7,730 20 4,591 25 844 - 620Western 0 0 0 0 2 30 2 96
All Zambia 57 15,478 37 13,725 89 3,487 24 10,477
a. RCP = Rural Reconstruction Program; CCP = cooperative program; SS = Southern province small blockprogram; FBD = farm block development.
Source: Ministry of Agriculture, Food and Fisheries, Land Use Planning Section, "Statement of Policy and Planof Action: Final Report" (February 1993).
XI. Concluding remarks
Based on the information available to the authors, attempts have been made to help researchersidentify what is known of resettlement schemes in the Zambian literature. Highlights of successes andproblems encountered in the various settlement programs have been given. No attempt, however, hasbeen made to draw conclusions on the future of settlement schemes or on ways to improve their
'Ministry of Agriculture, Food and Fisheries, Land Use Planning Section: Statement of Policy and Plan of Action 1993.

196
efficacy. This was never an intent of the chapter, and to try to do so with the dearth of informationavailable would be unwarranted. What can be concluded is that a huge amount of resources has goneinto these endeavors, and settlement programs are still held in favor by many policymakers in Zambiatoday as a way of providing land for farming and other social services to the disadvantagedpopulation, urban people, and retiring or terminated civil servants. Given the wide number and extentof schemes nationwide, research of the type recommended in this chapter is advised to help improvethe sector's performance and better integrate it into the country's national development strategy.
Annex 6.1: Ministry of Agriculture and Water Development settlement scheme
Location Scheme SizeTotalfarms
Occupiedfarms
Vacantfarms
(ha) (#) (#) (#)
Western Kaoma Dairy 20 8 8province Kaoma Tobacco 500 433 433
Mushwala 320 19 19Subtotal 840 460 460
Luapula Kamani 5,000 22 22province Mulumbi-Mulukuma 1,500 40 40
Munganushi 600 22 22Subtotal 7,100 84 84
Copperbelt Ipafu Irrigation 50 42 42province Kafubu Dam-West and South 5,183 40 40
Luongo State Land 5,528 29 29Miengwe 4,000 125 125Mikata Tobacco 24 30 30Misundu Dairy 218 6 6Mutende Multi-Purpose Co-operative 100 47 47Ngosa Muchinshi Rank 19,000 84 84West Luanshya Development Area 26,000 20 20
Subtotal 60,103 423 423
Lusaka Chiawa Banana Scheme 68province Chipapa Irrigation Scheme 124 26 26
Luimba 10,124 43 43Mungu 2,899 26 26
Subtotal 13,215 95 95

197
Location Scheme SizeTotalfarms
Occupiedfarms
Vacantfarms
(ha) (#) (#) (#)
Southern Chikola 8,704 51 50 1province Kayuni 6,100 38 38
Kazungula 3,654 38 38Nkungwa (Kalomo) 4,500 45 45Luyala 3,848 9 9Lusitu 54Mbabala 1,496 13 13Magoye (A and B) 2,400 36 36Magoye (C and D) 2,289 24 24 -Magoye (E) 805 13 13Mbaya (Mazabuka) 3,815 46 46Muchila (Namwala) 1,050 22 22Musuma (Mazabuka) 1,935 33 33Mwanachingwala 6,141 173 173Naluama 7,750 164 164Nega A 1,175 13 13Nega B 750 41 41Nega Nega C 764 8 8 -Ngwezi 8,800 130 130Ngwezi C 1,305 18 - -Siachiteme 12,164 58 -Sibanyati 1,874 16 - -Silwilii 8,797 48 48Tara I 1,827 7 7Tara II 1,493 12 12Upper Kaleya 4,785 46 46 -
Subtotal 98,275 1,102 1,009 1
Central Chitina 10,627 49 49 -province Kalola (Kabwe Rural) 600 97 97
Kapyanga (Mumbwa) 1,500 72 60 12Keembe (Kabwe Rural) 2,000 40 37 3Malo (Serenje) 1,500 94 89 5Milombwe (Mkushi) 4,500 30 30Mpima (Dairy)(Kabwe Urban) 1,500 31 31Mumbwa 600 57 57Munyama (Kabwe Urban) 10,000 36 36 -Mkushi West 12,114 17 17
Subtotal 44,941 523 503 20

198
Location Scheme SizeTotalfarms
Occupiedfarms
Vacantfarms
(ha) (#) (+#) (#)
Eastern Chipangali 22,565 154 154province Chipangali Tobacco 300 25 25
Chifunda 200 27 27Chinjara 5,332 60 60Jimoli 665 12 12Kapilingizya 400 76 76Kasinga 2,500 51 6 45Katangalika 300 196 196Katete State Land (New Block) 2,702 21 21Mphangwe 1,565 23 23Chiringodi 2,137 36 36Kalimeta 3,080 21 21Kagwelema 1,904 20 20Lumezi Tobacco 3 13 13Lunthwele 582 10 10Mchimadzi 10,215 163 10 153Nganjo 200 52 52North Nyampande (old) 4,100 229 229Nyamphande Ext. Area 1961 75 75Rukuzye 9,500 58 58Simulemba 300 39 39Sinda Misale (Tobacco) 127 30 30Sinda Virginia -Zemba Tobacco 293 660 660Tobacco School 241 60 60
Subtotal 71,172 2,111 1,913 198
North- Jiwondu 61 36 36Western Kawama 8,000 50 50province Nyangombe 79 48 36 12
Kabukafu SE Kasempa Dev. AreaMpungu South-East Kasempa 1,410 84 84Kasempa Dev. Area 1,100 24 24Lungevungu 15 15Mashivi Zambezi Settlement Scheme 38 30 8Towe Zambezi Settlement Scheme 8 8
Subtotal 10,650 303 283 20
Northern Chamfubu Settlement 1,800 76 71 5province Chifwile 3,100 36 36
Chinsali 50,000 30 21 9Kapatu 2,025 33 8 25Lubu 1,000 30 30Lukulu North Irrigation 10,000 74 74Mukonge 1,640 135 105 30
Subtotal 69,565 414 345 69
Grand total 308

Chapter 7:
Land Use Patterns and Growth in Commercial Input Use,Productivity, and Profitability by Farm Size Category
by
Jeffrey A. Cochrane and Michael J. Roth'
I. Introduction
This chapter examines trends in cultivated area and production in order to understand thechanging patterns of Zambian land use and management. Reported data suggest that in the commercialfarms sector there has been over the past two decades a general diversification of production awayfrom maize and into primarily wheat and soybeans. In the late 1980s, harvested land area under maizehas been replaced by these other crops, with the overall harvested area remaining roughly constant.In the noncommercial farms sector, data suggest that production in much of the country has fluctuatedgreatly with no clearly discernible trend. The principal exception is the far northeastern region of thecountry where maize production has increased dramatically, particularly from 1976 to 1986. Theseand other results are discussed below in detail after a preliminary note concerning data sources andtheir reliability.
II. Data sources
The next chapter provides a detailed discussion of data issues. This section focuses onparticular problems affecting the analysis of changes in land use patterns. Table 7.1 summarizesvarious selected Zambian data sources by year as used in the preparation of this chapter.
For verification and comparison purposes, a number of key national statistics were drawn fromthe Economic Research Service of the United States Department of Agriculture and from the WorldBank. These other sources generally provide national statistics, sometimes broken down by crop, butare based upon primary CSO and other Zambian government data. This report focuses upon resultsgleaned directly from the primary Zambian sources.
The CSO of the Zambian Government conducted several crop forecasting exercises coveringall farms. These provide the most recent data available for our analysis. Forecasts are available for1991 and 1992, 2 and the publication for the 1991 crop forecast includes actual production data forthe 1990 season, which is not available from any other known source. The 1992 forecast publicationbreaks down farms into two size categories, the first being a small/medium category and the secondcovering large farms, though the report does not provide definitions of these categories.
Jeffrey A. Cochrane is postdoctoral research fellow with the Land Tenure Center and Department of AgriculturalEconomics, University of Wisconsin-Madison, and Michael J. Roth is associate research scientist with the Land TenureCenter and Department of Agricultural Economics, University of Wisconsin-Madison.
2 Years refer to the beginning of a cropping season.

200
Table 7.1: Zambia data sources
Commercial Noncommercial AllYear farms farms farms Price Forecasts
CSO CSO ERS" series CSO
1961° x1962 x x
1963 x x
1964 x x
1965 x x
1966 x x
1967 x x
1968 x x
1969 x x
1970 x x
1971 x x x
1972 x x x
1973 x x x
1974 x x x
1975 x x x x
1976 x x x x
1977 x x x
1978 x x x
1979 x x x
1980 x x x
1981 x x x
1982 x x x x
1983 x x x x
1984 x x x x
1985 x x x x
1986 x x x
1987 x x x
1988 x x x1989 x x x
1990 x x x
1991 x
1992 x
a. Years are the beginning of the crop season (e.g., 1990 = 1990/91 crop season).b. ERS: United States Department of Agriculture, Economic Research Service.

201
Principal time series data are drawn from publications of the CSO annual "Agricultural andPastoral Production" reports, one each for commercial and noncommercial farms. A quite completecommercial farms series is available from 1975 to 1989. The noncommercial farms series begins in1971, was interrupted from 1977 to 1981, and resumes for 1982 through 1985. Commercial farmsdata are generally divided by farm area size categories (0—199 hectares, 200-1,999 hectares, 2,000+hectares). Data on noncommercial farms are not broken down by size.
Noncommercial farmers are defined in these " Agricultural and Pastoral Production" reportssimply to be those farmers who are not commercial farmers. In order to determine who qualifies asa noncommercial farmer, the 1973 noncommercial farms report defines commercial farmers as:
(a) a farmer who sold maize worth K600 or more at the line of rail prices;(b) a farmer who grew virginia [sic] or burley tobacco in his own name and was
registered with the Tobacco Board of Zambia;(c) a farmer who sold dairy products to, and was registered with, the Dairy Produce
Board;(d) a farmer who had title to land.
This definition has been amended over time. By the time of the 1982 commercial farms report, thecommercial farms classification had been amended to include farms that sold to marketing boards anycrops exceeding the value of 150 90kg bags of maize, farms that bred or sold livestock to licensedfirms or boards, and state farms.
This classification and separate enumeration of commercial and noncommercial farms posesproblems for analysis. For example, as economic conditions change from year to year, a farmer maychoose to produce and market tobacco, thereby leaving the noncommercial classification and enteringthe commercial farms classification. There is also some question as to the reliability of the populationlists for each classification, particularly since the mid-1980s when the state reduced its role in themarketplace and as a consequence reduced its ability to monitor market activity. For these reasons,it is difficult to determine whether increases in production of commercial crops is due to expansionof output by existing commercial crops producers, to marketed output by farmers previously classifiedas noncommercial, or to new market entrants. Better analysis would be possible if there were a morereliable and stable long-term program of farm data collection.
Data on commercial farms production in Zambia are available from 1975 to 1989, and arebroken down by province and farm area size classification. These data are based on responses to anannual mailed census sent on average to about 3,000 farming households nationwide. (Response rateswere generally low; e.g., 34 percent in 1978.)
The survey is intended to cover all the commercial farmers in the country andquestionnaires are mailed on the basis of postal addresses. The response has howeverbeen quite poor. Many of the returned questionnaires were only partially completedrequiring many imputations for individual reports to be summarized on arepresentative basis (CSO 1989a, p. iii).
A consultant's report to USAID (Scott 1990) notes, "The [commercial farms] list used isknown to be incomplete and the response rate is below 20 percent, so that the purpose of this annualoperation is not clear."

202
Data on noncommercial farms are from an enumerated sample survey conducted annually from1971 to 1976 and also from 1982 to 1986, with no data collected by the CSO in the period from 1978to 1981. While data were apparently collected and published for the 1977 season (CSO 1989b), thesedata are not available. Available data are broken down by province but not by farm area size. Usinga two-stage design, a stratified random sample of geographic areas was first selected, with stratacorresponding to ecological zone. In the second stage, two random samples were selected, one ofhouseholds reporting livestock holdings, the other of households not reporting livestock. These detailsare generally explained in the introductions to the reports. While in most years farmers are asked toprovide information on the agricultural period just completed, it should be noted that for a fewprovinces in 1982, data are based on recalled responses collected as part of the 1983 survey.
Additional limited data were collected on farm expenditures and revenues and are brieflyinspected here. Significant difficulties with the consistency of categories in the collection of these dataover time make it quite difficult to analyze relationships between prices, input uses, and output. Acursory inspection of these data for commercial farms is provided below.
Price indexes for bundles of consumer goods as well as for numerous commodity groups areavailable in the CSO's Monthly Digest of Statistics. Several editions of these digests have beencompiled to compute a price series for the years 1962 to 1990, adjusted to the common base year of1985. These data are also presented below. Consumer price indexes are used to deflate expenditureand revenue data to permit examination of real price trends independent of inflation. As will be seen,this is particularly important for data from the late 1980s when Zambia experienced significanthyperinflation.
Anomalies are apparent in the data sources. For example, in the 1987 commercial farmsreport, the same harvested area and production for soybeans in the Copperbelt province is given fortwo separate farm sizes categories. Such a coincidence seems unlikely. In Luapula province in 1990,farms of one size are reported to have produced one kilogram of wheat but then to have sold 37. Sincereports do not distinguish sales from present harvest versus past harvests, it is impossible to determinewhether this is an error or due to stock adjustment.
Given problems in data collection and reporting, policy recommendations arising out ofanalyses of these data should be regarded as tentative and subject to verification in more detailedretrospective studies of selected areas. Longitudinal analyses that follow particular farming householdsover time seem particularly warranted if an understanding of structural change in agriculture is to begained.
III. National production trends
The aforementioned problems with the data notwithstanding, a number of importantcharacteristics of production structure in Zambia can be discerned. Table 7.2 presents harvested cropareas for all farms in the nine regions of Zambia as a percentage of national totals. Data in the tableare three-year averages drawn from CSO crop forecasts for 1991 and 1992, and from actual areafigures for 1990. Of Zambia's 942,362 hectares planted nationwide in 1990-92 (three-year average),63.8 percent are comprised of maize, followed by groundnuts (8.5 percent), seed cotton (7.3 percent),millet (5.4 percent), sorghum (4.4 percent), sunflower (3.4 percent), soybeans (2.9 percent), mixedbeans (2.2 percent), rice (1.4 percent), and assorted other crop enterprises (0.7 percent).'
Total crop area is based only on data for crops that were reported. Area of unreported crops (horticultural crops,cassava, other vegetables) is not included. Note also that, in official publications, tree crops are reported as numbers oftrees rather than area of planting; estimates of tree-crop area are thus not possible.

204
Provincial-level data from the CSO reveal that the bulk of planted area of cultivated maize,tobacco, sunflower, and seed cotton is situated in the Eastern, Central, and Southern provinces. Thisis the primary agriculture production region of Zambia, with cultivation based on a hand-hoe farmingsystem, and with oxen used in some areas. Maize is generally the chief staple followed by sorghum,while relish crops are vegetables, beans, and groundnuts. Cash income for most farmers obtains fromsales of beer, fish, chicken, and a portion of the maize harvest. Only minimal inputs are used inproduction (USAID n.d.). In percentage terms, the Eastern province accounts for the bulk of nationalarea allocated to maize (34.8 percent), groundnuts (33.7 percent), and burley tobacco (93.3 percent);the Southern province accounts for the largest area allocated to sorghum (28.7 percent) and sunflowers(43.8 percent); and the Central province contains the most area under production of seed cotton (38.9percent), rainfed wheat (73.0 percent), and Virginia tobacco (50.2 percent).
IV. Commercial farms sector
Table 7.3 presents time series data on the area harvested of principal crops for the period 1975to 1989 in the commercial farm sector. These data are depicted in graphical form in figure 7.1 for allcrops, and for all crops excluding maize in figure 7.2. Maize clearly dominates the cropping system.The data suggest a complex pattern of crop diversification characterized by three major trends overtime: a stagnation in total crop area; a decreasing emphasis on maize; and an increasing emphasis onwheat and soybeans. Aside from the sharp increase in area harvested between 1975 and 1976,followed by the sharp decline from 1976 to 1978, total area harvested appears relatively stable togradually increasing.
Figure 7.1: Changes in areas of principal crops,cumulative distribution, 1975 to 1989
Source: CSO.
o
4- t 50E
01975 1977 1979 1981 1983 1985 1987 1989
Year
q MAIZE WHEAT EJ SOYBEAN® TOBACCO ® OTHER

205
Figure 7.2: Changes in areas of principal crops,excluding maize, cumulative distribution,1975 to 1989
Source: CSO.
Figure 7.3: Commercial farms production of maize,wheat, and soybean, 1975 to 1989(in metric tons)
Source: CSO.

Table 7.3: Harvested area (hectares), commercial farm sector, 1975 to 1989
Virginia Sun- Soy- Seed Seed BurleyYear Maize Wheat tobacco flower bean maize cotton Potato Cotton Coffee tobacco Total
1975 103,650 7,400 4,970 5,220 2,470 400 124,110
1976 169,860 12,240 5,750 9,130 2,330 590 199,900
1977 88,159 10,360 4,544 5,821 130 2,071 111,085
1978 57,070 2,150 5,340 4,160 3,680 186 630 73,216
1979 74,233 5,213 7,990 3,606 3,824 775 1,333 151 97,125
1980 67,860 7,494 4,874 3,625 4,528 1,541 2,156 94 92,172
1981 84,701 3,390 3,444 8,719 8,150 2,695 422 3,444 114,965
1982 100,859 3,963 5,601 11,146 5,307 3,509 390 2,708 2,287 135,770
1983 101,286 2,645 3,372 6,312 5,758 4,916 2,587 448 2,587 97 130,008
1984 54,922 5,074 2,762 2,947 15,323 8,603 797 1,695 118 92,241
1985 67,739 7,266 5,206 4,316 11,660 5,277 875 2,016 540 104,895
1986 69,477 7,620 6,480 5,234 13,899 8,959 659 1,373 3,137 116,838
1987 74,763 12,168 5,682 5,989 12,868 5,938 627 4,680 3,340 126,055
1988 72,090 7,180 6,293 3,219 25,963 1,172 3,296 894 103 120,210
1989 43,630 19,187 3,003 3,990 20,305 5,697 1,274 201 2,865 100,152
Source: Derived from Zambia CSO data.

Table 7.4: Crop production, commercial farm sector, 1975 to 1989(thousand metric tons)
Virginia Sun- Soy- Seed Seed BurleyYear Maize Wheat tobacco flower bean maize cotton Potato Cotton Coffee tobacco
1975 418.31 7.67 4.37 20.86 5.85 .43
1976 451.33 6.26 5.53 23.00 4.25 .75
1977 324.10 8.10 2.57 19.79 .66 2.01
1978 187.82 9.62 4.72 3.94 10.64 1.24 .45
1979 239.12 16.39 7.19 3.21 11.75 .08 1.36 .06
1980 274.03 16.17 3.72 3.62 17.98 5.24 3.24 .05
1981 245.50 14.41 2.74 6.54 7.23 8.92 .40 2.73
1982 340.77 13.44 4.60 10.49 6.76 18.05 4.88 2.62 1.99
1983 223.89 10.40 4.07 5.91 7.41 10.42 2.61 5.44 2.61 .06
1984 172.54 26.30 2.69 2.27 23.05 29.25 19.00 1.20 .08
1985 315.01 32.17 5.93 4.03 19.81 20.99 12.78 1.86 .29
1986 315.41 43.53 7.70 6.26 26.09 10.88 10.65 1.33 2.33
1987 290.80 59.82 7.03 5.05 28.03 31.80 8.62 9.20 1.18
1988 317.99 38.43 5.57 3.48 24.45 14.51 5.32 .26 .19
1989 153.79 38.87 3.66 4.48 21.82 25.50 1.07 .20 2.70
Source: Derived from Zambia CSO data.

208
The declining importance of maize relative to other crops in the commercial farms sector isfurther confirmed by production quantity data. Table 7.4 presents these data in tabular form for allrecorded crops, while figure 7.3 illustrates changes in production for the three leading crops in thecommercial farms sector: maize, wheat, and soybeans. The graph indicates increases in wheat andsoybean production that are large in percentage terms but that do not match the magnitude of thedecrease in maize production for the same period. Note, however, that the most recent indicateddownturn in maize production (1989) is not substantially greater than previous downturns from whichproduction later recovered.
A more complete analysis of these data would attempt to reconcile fluctuations in productionwith specific political and economic events such as droughts, changes in government, currencydevaluations, or price liberalizations. Such an analysis would require additional data not contained inthe CSO reports and is therefore beyond the scope of the present exercise. In the absence of specificstatistical controls for such events, a growth rate may nonetheless be calculated, though it matters agreat deal where one places the starting and finishing points for the calculation.
The growth rate "r" is derived as follows:
(1) Y = a(l+r)'
where Y is either area, production, or yield, depending on which growth rate is desired. The variableT is a time trend.
Equation (1) can be linearized in logs as shown in equation (2):
(2) LnY = Ln(a) + Ln(1 +r)(T) = A + BT
Equation (2) then forms the basis for a linear regression of the log of either area, production, or yieldon a time trend. The growth rate estimate is then calculated from the ordinary least squares parameterestimate for the trend variable:
(3) r = eB - 1
Area growth rates estimated from the data in table 7.3 are presented in table 7.5 for two timeperiods: a fifteen-year period from 1975 to 1989 and a seven-year period from 1983 to 1989. The datasuggest that area under maize has declined at an average annual rate of 4.1 percent since 1974, withthe decline accelerating in more recent years. On the other hand, areas under wheat, soybeans, andseveral other crops have increased at an accelerating rate. Given the volatile nature of the figures, caremust be exercised in interpretation.
The CSO data permit further disaggregation of commercial farm data by region, but the waydata have been disaggregated has changed over time. In 1975-76, data were disaggregated by Central,Southern, and "Copperbelt and others" categories, along with a national total. In 1981-82, thisdivision was changed to Central, Lusaka, Southern, and "Copperbelt and others," a system ofclassification that remained unchanged through 1989-90. In order to facilitate statistical computationsand conserve on reporting, two regionally disaggregated time series were generated from these data:northwest representing the data from "Copperbelt and others" and including the Western,Northwestern, Copperbelt, Luapula, and Northern provinces; and southeast including the Central,

209
Table 7.5: Crop area growth rates commercial farms sector(percent)
1975-1989 1983-1989
Maize -4.1' -6.5
Wheat 13.8' 29.1'
Virginia tobacco -5.2' 5.1
Sunflower -1.0 -3.1
Soybean 18.0' 19.3'
Seed maize 1.6 -.2
Potato 1.2 13.6b
Cotton 4.8 -17.8
Coffee -46.6 -46.6
Burley tobacco 15.6 41.2
All crops -.6 -.2
a. The estimate of B in the regressions is significant at the 5 percent level.b. The estimate of B in the regressions is significant at the 10 percent level.
Eastern, Lusaka, and Southern provinces. With the exclusion of southern areas of the Westernprovince, the northwest region is generally situated in areas receiving in excess of 1,100 millimeters(or 44 inches) of annual precipitation, while the provinces in the southeast region receive 1,000millimeters (or 40 inches) of rainfall per year or less.
Data in the commercial farm series are further disaggregated by farm size categories, but thecategories have not remained the same over time. In 1975-76, six categories were used: 0-79hectares, 80-199 hectares, 200-399 hectares, 400-799 hectares, 800-1,999 hectares, and 2,000+hectares. This classification system was maintained until 1986-87 when the number of categories wasreduced to four—0-199 hectares, 200-799 hectares, 800-1,999 hectares, and 2,000+ hectares—andremained so through 1989-90. To ease computation burdens, data series were further consolidated intothree categories for purposes of growth rate analysis: small farms (less than or equal to 199 hectares),medium farms (200-1,999 hectares), and large farms (2,000+ hectares).

210
Table 7.6: Crop area growth rates, commercial farms sector (percent)
Farm size
1975-1989 1983-1989
Small Medium Large Small Medium Large(0-199 ha) (200-1,999 ha) (2,000+ ha) (0-199 ha) (200-1,999 ha) (2,000+ ha)
Northwest region'
Maize 13.7" -1.7 -2.9 1.1 1.6 -46.3-
Wheat° -45.0 3.2 -14.3 ' -12.1 58.6 -27.3
Virginia -9.0" -13.5' -10.7" -12.8 2.6 -14.6tobacco
Sunflower° 15.3' -1.4 33.7 5.0 6.2
Soybean 5.6 -18.9 8.4 68.1' -17.2 -33.4-
Seed maize° 15.2 31.6" -.2 -30.9 ' -49.7 -42.7
Potato 13.4 12.9 -11.1 33.0 70.7 45.7
Cotton d 20.1 1.1 73.9- 31.8
Coffee° -77.2 -43.8 -77.3 -77.2 -43.8 -77.3
Burley 34.3 -.6 -06.7 147.0 17.2tobaccod
All crops 13.9 1.2 1.2 00.8 -5.1 -34.3
Southeast region`
Maize -3.5 -7.4` -3.2 4.9 -1.6 -8.4
Wheat 5.4 17.1- 25.2- -6.3 26.3"' 69.1"
Virginia -4.0 -7.7" -.9 43.5 3.0 8.2tobacco
Sunflower -.4 -.7" -8.9" -14.1 6.6 -16.4
Soybean -6.4 23.9 27.0` -2.1 25.8" 32.4"
Seed maize° 7.5 -.1 -1.5 62.4 10.1 -2.7
Potato -3.6 2.3 1.4 30.9 16.9 2.7
Cotton 12.1" -.5 7.6 2.1 -36.6 -8.2
Coffee° -77.1 -49.7" -77.1 -49.7-
Burley 9.5 40.3 64.8- 54.4 178.0 139.0tobacco°
All crops -.5 -4.1 1.5 .8 4.4 3.7
The estimate of B in the regressions is significant at the 10 percent level.The estimate of B in the regressions is significant at the 5 percent level.
a. Years with missing data on a particular crop/region combination were excluded.b. Includes Western, Northwestern, and Copperbelt, but not Luapula and Northern provinces.c. Includes Central, Eastern, Lusaka, and Southern provinces.d. Data exist for the following crops/regions/farm sizes in the listed years only: wheat/northwest/small (1982, 86-90);
sunflower/northwest/large (1975, 80-82, 88); seedmaize/northwest/small (1976-79, 81, 85-87, 89),seedmaize/southeast/small (1975-81, 84, 86-87, 89); cotton/northwest/medium (1982-83, 86-87); coffee/northwest/small(1987-88), coffee/northwest/medium and large (1986-88), coffee/southeast/medium (1989-90), coffee/southeast/large(1986-88), burley tobacco/northwest/small (1980-85), burley tobacco/northwest/medium (1980, 89), burleytobacco/northwest/large (1979, 82-85, 89), burley tobacco/southeast/small (1979-80, 84, 89), burleytobacco/southeast/medium (1979, 82-84, 89), burley tobacco/southeast/large (1979-80, 85, 88-90).
Source: Derived from Zambia CSO data.
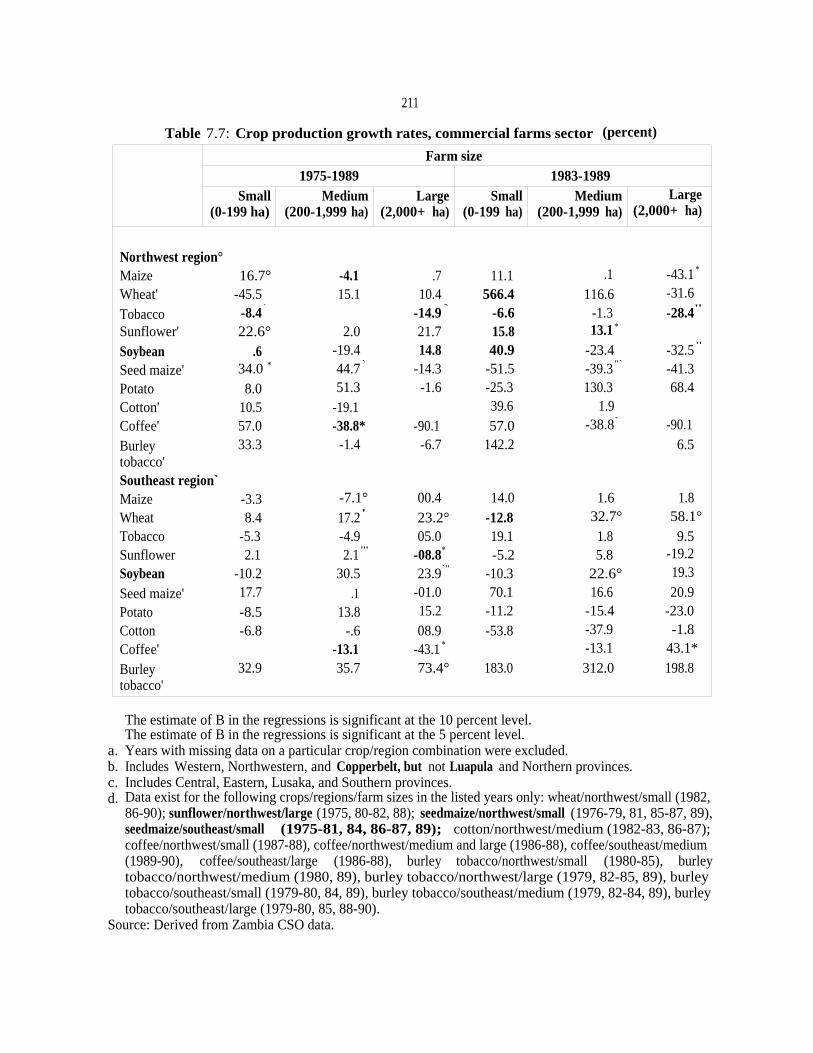
211
Table 7.7: Crop production growth rates, commercial farms sector (percent)
Farm size1975-1989 1983-1989
Small Medium Large Small Medium Large(0-199 ha) (200-1,999 ha) (2,000+ ha) (0-199 ha) (200-1,999 ha) (2,000+ ha)
Northwest region°Maize 16.7° -4.1 .7 11.1 .1 -43.1 *
Wheat' -45.5 15.1 10.4 566.4 116.6 -31.6
Tobacco -8.4 ` -14.9` -6.6 -1.3 -28.4"
Sunflower' 22.6° 2.0 21.7 15.8 13.1 *
Soybean .6 -19.4 14.8 40.9 -23.4 -32.5"
Seed maize' 34.0 * 44.7 ` -14.3 -51.5 -39.3 "` -41.3Potato 8.0 51.3 -1.6 -25.3 130.3 68.4Cotton' 10.5 -19.1 39.6 1.9Coffee' 57.0 -38.8* -90.1 57.0 -38.8` -90.1
Burley 33.3 -1.4 -6.7 142.2 6.5tobacco'Southeast region`Maize -3.3 -7.1° 00.4 14.0 1.6 1.8Wheat 8.4 17.2 ' 23.2° -12.8 32.7° 58.1°Tobacco -5.3 -4.9 05.0 19.1 1.8 9.5Sunflower 2.1 2.1"' -08.8* -5.2 5.8 -19.2Soybean -10.2 30.5 23.9`" -10.3 22.6° 19.3
Seed maize' 17.7 .1 -01.0 70.1 16.6 20.9Potato -8.5 13.8 15.2 -11.2 -15.4 -23.0Cotton -6.8 -.6 08.9 -53.8 -37.9 -1.8Coffee' -13.1 -43.1 * -13.1 43.1*
Burley 32.9 35.7 73.4° 183.0 312.0 198.8tobacco'
The estimate of B in the regressions is significant at the 10 percent level.The estimate of B in the regressions is significant at the 5 percent level.
a. Years with missing data on a particular crop/region combination were excluded.b. Includes Western, Northwestern, and Copperbelt, but not Luapula and Northern provinces.c. Includes Central, Eastern, Lusaka, and Southern provinces.d. Data exist for the following crops/regions/farm sizes in the listed years only: wheat/northwest/small (1982,
86-90); sunflower/northwest/large (1975, 80-82, 88); seedmaize/northwest/small (1976-79, 81, 85-87, 89),seedmaize/southeast/small (1975-81, 84, 86-87, 89); cotton/northwest/medium (1982-83, 86-87);coffee/northwest/small (1987-88), coffee/northwest/medium and large (1986-88), coffee/southeast/medium(1989-90), coffee/southeast/large (1986-88), burley tobacco/northwest/small (1980-85), burleytobacco/northwest/medium (1980, 89), burley tobacco/northwest/large (1979, 82-85, 89), burleytobacco/southeast/small (1979-80, 84, 89), burley tobacco/southeast/medium (1979, 82-84, 89), burleytobacco/southeast/large (1979-80, 85, 88-90).
Source: Derived from Zambia CSO data.

212
Table 7.8: Crop yield growth rates, commercial farms sector (percent)
Farm size
1975-1989 1983-1989Small Medium Large Small Medium Large
(0-199 ha) (200-1,999 ha) (2,000+ ha) (0-199 ha) (200-1,999 ha) (2,000+ ha)
Northwest region'
Maize 2.7 -2.5 3.7* 9.9 * -1.5 6.1
Wheat' -10.0 11.6 28.9° 124.2 36.6 -6.0
Tobacco .6 -1.0 -4.7 7.0 -3.8 -16.2
Sunflower' 1.4 3.4 -8.9° 10.2 6.5
Soybean -4.7 - .7 5.9 -16.2 ` -7.4 1.3
Seed maize" 16.4" 10.0 -14.2 -29.8° 20.7 2.3
Potato -6.9 36.8 10.6 -43.9 34.9 15.6
Cotton' -12.2 -20.0° -19.7 -22.7
Coffee' 589.5 8.8 -56.2 589.5 8.8 -56.2
Burley -.7 -.8 .0 -2.0 -9.1tobacco'
Southeast region`Maize .2 .3 3.8* 8.6 3.2 11.2
Wheat 2.9 .1 -1.6 -6.9 5.1 -6.5
Tobacco -1.3 3.0 6.0"` -17.0 -1.2 1.2
Sunflower 2.5* 2.8 .1 10.4* -.7 -3.4
Soybean -4.1 5.4 -2.4 -8.4 -2.5 -9.9
Seed maize" 9.4 .2 .5 4.7 5.9 24.3
Potato -5.2 11.3 13.6 -32.2 -27.6 -25.1
Cotton 4.7` -0.1 1.2 22.9* -2.2 6.9
Coffee' 279.6 13.1 279.6 13.1
Burley 21.4 -3.3 5.2 83.3 48.2 25.0tobacco'
* The estimate of B in the regressions is significant at the 10 percent level.** The estimate of B in the regressions is significant at the 5 percent level.a. Yields derived from area and production data. Years with missing data on a particular crop/region combination were
excluded.b. Includes Western, Northwestern, and Copperbelt, but not Luapula and Northern provinces.c. Includes Central, Eastern, Lusaka, and Southern provinces.d. Data exist for the following crops/regions/farm sizes in the listed years only: wheat/northwest/small (1982, 86-90);
sunflower/northwest/large (1975, 80-82, 88); seedmaize/northwest/small (1976-79, 81, 85-87, 89),seedmaize/southeast/small (1975-81, 84, 86-87,89); cotton/northwest/medium (1982-83, 86-87); coffee/northwest/small(1987-88), coffee/northwest/medium and large (1986-88), coffee/southeast/medium (1989-90), coffee/southeast/large(1986-88), burley tobacco/northwest/small (1980-85), burley tobacco/northwest/medium (1980, 89), burleytobacco/northwest/large (1979, 82-85, 89), burley tobacco/southeast/small (1979-80, 84, 89), burleytobacco/southeast/medium (1979, 82-84, 89), burley tobacco/southeast/large (1979-80, 85, 88-90).
Source: Derived from Zambia CSO data.

213
Results are presented in table 7.6 for area growth rates, table 7.7 for production growth rates,and table 7.8 for yield growth rates. Missing data for some years and crops render interpretation ofsome rates problematic, but rates are presented whenever at least three years of data are available. Anumber of findings stand out:
Area harvested
► Total area cultivated by small farms in the northwest region appears to have been increasingat annualized rate of 13.9 percent since 1975 but has stagnated (0.8 percent) in recent years.Total area cultivated in the southeast appears to have remained relatively flat since 1975.
► Data suggest that total area cultivated by the largest farms in the northwest region hasincreased moderately at an annualized rate of 1.2 percent since 1975 but declined 34.4 percentsince 1983. In the southeast, total area appears to have remained relatively flat (an increaseof 1.5 percent since 1975 and 3.7 percent since 1983).
► The decline in maize area over time mentioned earlier for national-level figures seems to havebeen the result primarily of declining maize production on large farms. Maize area cultivatedin the northwest region by the smallest farm size category appears to have increased at anaverage annualized rate of 13.7 percent since 1975 and 1.1 percent since 1983. In contrast,growth in maize area in the same region on the largest farms (2,000+ hectares) appears tohave declined at an annualized rate of 2.9 percent since 1975, and data suggest maize area hasplummeted (46.3 percent) since 1983. Roughly similar trends are observed for the southeastregion.
► Small farm hectareage of nearly all crops in the northwest region (excluding wheat andVirginia tobacco, where the base is small) seems to have increased rapidly since 1975,particularly so for cotton (20.1 percent), sunflower (15.3 percent), potatoes (13.4 percent),and soybeans (5.6 percent). Growth in cotton area (73.9 percent) and soybeans (68.1 percent)since 1983 appears particularly high and comes at the expense of coffee, wheat, and tobacco.In the southeast region, data suggest growth in cotton area (12.1 percent) and wheat (5.4percent) is displacing other crops, particularly maize and soybeans.
► Data suggest that large farms in the southeast have over the long term been shifting emphasisto burley tobacco (64.8 percent), wheat (25.2 percent), soybeans (27.0 percent), and cotton(7.6 percent), and away from maize (-3.2 percent), and sunflower (-8.9 percent). Area growthsince 1983 in burley tobacco (139.0 percent), wheat (69.1 percent), and soybeans (32.4percent) appears particularly robust.
Production and yield
► Small farms. Data from the northwest suggest rapid growth in the production of coffee (57.0percent), seed maize (34.0 percent), burley tobacco (33.3 percent), sunflower (22.6 percent),maize (16.7 percent), and cotton (10.5 percent) has been achieved by small farms since 1975.Growth in output by small farms in the southeast has been more moderate, with productiondeclines experienced in maize, tobacco, soybeans, potato, and cotton.

214
► Large farms. Large farms in the northwest region since 1975 appear to have experienced rapidgrowth in production of wheat (10.4 percent), soybeans (14.8 percent), and sunflowers (21.7percent), and declining production in seed maize (-14.3 percent), coffee (-90.1 percent), andtobacco (-14.9 percent). In the southeast region, production over the long term seems to havegrown most rapidly in wheat (23.2 percent), soybeans (23.9 percent), and burley tobacco(73.4 percent).
In principle, the sum of growth rates for area and yield should equal that of production. Differencesin the tables arise at times due to missing values and rounding errors.
V. Noncommercial farms sector
Production data from the noncommercial farms sector are available from 1971 to 1985, thoughwith a gap from 1977 to 1981. Data on area for this sector are available only in the most recent years,1982 through 1985. Since yield calculations require data on both area and production, yields can onlybe calculated for the period 1982 to 1985.
Figure 7.4 depicts changes in the production of maize, groundnuts, millet, and cassava, andsuggests that for the noncommercial sector, the diversification story found in the commercial farmssector does not apply. Indeed, the story seems to be precisely the opposite. Instead of a gradualdecline in maize production, a dramatic increase is apparent, and other crops generally appear todecline over time.
Figure 7.4: Noncommercial farm production of maize,millet, groundnuts, and cassava, 1971 to 1976
and 1982 to 1986 (000 metric tons)
MAIZE — GROUNDNUTMILLET + CASSAVA
1400
12001000
800600400200
01971
c0
1975Year
1973
I
19841982
Source: CSO.

215
Figure 7.5: Noncommercial farms production of maizeby province, 1971 to 1976 and 1982 to 1985
Source: CSO.
There appear to be significant regional variations. Focusing specifically on maize, it can beseen from figure 7.5 that production has increased steadily in the Eastern province, as well as in theNorth and Luapula provinces.4 .' Production trends have been mixed elsewhere. Table 7.9 presentsproduction growth rates for the 1972-1986 period. Table 7.10 presents growth rates for production,area and yield for the 1983-1986 period.
Regional breakdowns in the data time series vary from year to year; for example, data for theCopperbelt/Northwest region were reported separately sometimes and as one combined total at othertimes. The regional breakdowns in Tables 7.9 and 7.10 represent the finest level of disaggregationpossible from the published data without eliminating data for certain years.
These data are somewhat inconsistent with a report on the Eastern province from theInternational Food Policy Research Institute that implies growth in maize production only until 1980,at which time production in the Eastern province reportedly began to decline (Cells, Milimo, andWanmali 1991, p. 24). Data from the CSO are consistent with statistics reported by the EconomicResearch Service of the US Department of Agriculture, which suggest a growth rate in cerealsproduction in Zambia of roughly 1.1 percent (figure 7.6).
° Production in the combined Central, Southern, and Lusaka provinces has fluctuated greatly but has increased onaverage 1.3 percent per year.
1973 1975 1982 1984Year
-}- Copperbelt and NorthwesternCentral, Southern, Lusaka, Namwala
... Northern and Luapulafi Eastern— Western
C0 800
600a) cE
400oE 200
V0 01971
N
I

216
Table 7.9: Production growth rates, 1972 to 1986, noncommercial farms sector
Copperbelt/Northwestern
Central/Southern/Lusaka
Northern/Luapula Eastern Western
Beans -.009 -.066 -.042 .049 -.038
Cassava .015 -.208 ' -.013 -.109 -.042
Groundnuts -.013 -.118" -.074" -.060" -.039
Maize .010 .013 -.065" -.063" -.052"
Millet -.063 ' -.021 -.046' -.022 -.022
Sorghum .011 -.043 -.027 -.001 .036
* The estimate of B in the regressions is significant at the 10 percent level.**The estimate of B in the regressions is significant at the 5 percent level.
Source: Derived from Zambia CSO data.
Figure 7.6: Zambia cereals production (thousand metric tons)
Source: ERS.
2200
2000 - - - - - - - - - - - - - --------------Production
1500 - - - - - - - - - - - - - - - - - - - - - - - - - - - - - - - -
1600 - -
Rate=1.1%
600 II{IIIIIIIIIIIIIIIIIIIIIIIIIII441961 1965 1969 1973 1977 1981 1985 1989

217
Table 7.10: Production, area, and yield growth rates, 1983 to 1986, noncommercial farms sector
Copperbelt/Northwestern
Central/Southern/Lusaka
Northern/Luapula Eastern Western
Production
Beans -.010 .624 -.258` .025
Cassava .232 -.154 .054 57.500 .805
Groundnuts -.056 .338 .050 .178 -.042"'
Maize .167° .516 ' .100 .041 .130
Millet .258 .249 .051 .024 .322
Sorghum .329 * .244`" .052* .678* .468
Area
Beans .034 .472 -.254° .037
Cassava .130 -.132 .079 3.800 .706"
Groundnuts -.012 .219 -.036 .016 .039
Maize .013 .336 .129 -.062 .241
Millet .354 .071 -.021 .034 .275
Sorghum .242 * .268 * -.017 .475 .641 *
All crops .026 '" .301 -.094 -.046 .218 '
Yield
Beans -.043 .104 -.006 -.011
Cassava .090* -.026 -.023 11.188 .058
Groundnuts -.045 .097 .090 .159 -.078
Maize .152* .135 -.026 .110 -.090*
Millet -.071 .166 .074 -.010 .037 '
Sorghum .071 -.019 .070* .138 -.105
* The estimate of B in the regressions is significant at the 10 percent level.** The estimate of B in the regressions is significant at the 5 percent level.Source: Derived from Zambia CSO data.
The World Bank estimates growth rates for the combined set of commercial andnoncommercial farms for the period 1974 to 1990 (World Bank 1993b, p. 25). Area and productionof maize are reported by the Bank to have increased by 8 and 10 percent, respectively, over theperiod, with yields declining by about 2 percent. Results here, on the contrary, suggest modestdeclines in maize production on commercial farms on the order of 3 to 7 percent, and modestincreases of from 1 to 6 percent in maize production on noncommercial farms. It should be noted thatthe World Bank starting point for growth rate calculations is 1974, a momentary trough in output,which may account for the high calculated rates. Again, the highly volatile nature of the data cannotbe overemphasized.

218
A further example of data volatility can be seen by examining the number of reported farminghouseholds. In contrast to the commercial farms sector where the number of farming households isreported to fluctuate around a mean of 3,000, significant changes in the number of reportednoncommercial farming households appears in the CSO data. From a high near 1.3 million in the early1970s, the number of households drops to around 1 million for an extended period, until increasingagain to near 1.2 million in the mid-1980s (see table 7.11). Fluctuations of 300,000 households in thefarming population (plausibly 1 million or more individuals) is difficult to explain except perhaps asa general problem with the data collection system.
Table 7.11: Number of noncommercial farm households
Year Copperbelt/Central/
Southern/ Northern/ Eastern Western AllNorthwestern Lusaka Luapula
1971 144,400 273,000 499,600 230,400 148,600 1,296,000
1972 146,400 239,500 488,100 209,000 191,600 1,274,600
1973 97,600 203,300 348,100 273,200 109,000 1,031,200
1974 95,700 232,900 381,900 192,600 158,000 1,061,100
1975 111,800 247,400 318,600 128,500 157,500 963,800
1976 129,700 197,800 372,900 222,600 148,600 1,071,600
1982 124,200 180,580 320,890 208,350 151,900 985,920
1983 124,880 172,710 320,760 222,890 133,600 974,840
1984 135,970 183,360 318,120 247,350 152,120 1,036,920
1985 111,328 260,201 343,651 256,627 189,130 1,160,937
Source: Derived from Zambia CSO data.
VI. Revenues and expenditures
The CSO also provides data on farm expenditures and revenues. Tables 7.12-7.15 presentresults for the two broad regions of commercial farms defined above, excluding data on farm livestockrevenue. They suggest a dramatic nominal increase in the kwatcha value of operations in the late1980s, on both the revenue and the expenditure side, which corresponds to a period of hyperinflation.When nominal values are deflated by a low-income CPI, farm sales and operating expenses for allfarm categories are shown to increase in real terms as well, although wide fluctuations are evident.Results are not substantially different if the high-income CPI is used as a deflator. The ratherastounding 1989 increase in operating expenses (fertilizer and pesticide applications, machinery, seed,etc.) in the Central, Southern, and Lusaka combined provinces on medium-sized farms cannot readilybe explained.

219
The net effect of these adjustments in commercial farm sales, operating expenses, and wageexpenses, are summarized in the partial net revenue figures in table 7.15. Partial net revenue isnegative for the small farm sector in nearly all years from 1975 to 1989, partly because of missingincome from livestock and the fact that revenues include only farm sales, not the value of homeconsumption. However, even for medium-scale farms for which auto-consumption should theoreticallybe much smaller, very large negative figures for net revenue are reported. Only for the large-farmsector is net revenue positive, and then only in the early to mid-1980s. However, by 1988, even thelarge-scale sector again appeared to be operating in the red, with very large deficits reported formedium-scale farms.
Data presented for CPIs and selected commodity and input price indexes (agriculturalwholesale prices, building materials, and fixed capital goods) in table 7.16 reflect rapid inflation inthe 1970s and hyperinflation by the late 1980s. The CPI of low income consumers tripled over theperiod 1970 to 1980, then increased by a factor of 43 between 1980 and 1990. Prices of buildingmaterials and capital goods rose faster that the CPI, while the wholesale index of agricultural pricesgrew at a slower rate suggesting a worsening terms of trade for agriculture in the 1980s. The effecton prices of selected individual farm commodities (maize, tobacco, wheat and cotton) and fertilizerprices (triple super phosphate and urea) are presented in table 7.17. Real output prices of maize, whichwere relatively constant in the 1970s, tended to rise over the period 1980 to 1986 before fallingsharply to a twenty-year low in 1989. Real tobacco and wheat prices declined during the 1970s,fluctuated up and down in the early- to mid-1980s, before also falling precipitously in 1989. Realcotton prices appear to have been in a long-term secular decline from 1970 to 1989. The price offertilizer over time has tended to be constant to increasing over the period 1971 to 1985-86, beforealso falling sharply in the late 1980s.
Growth in farm profitability can theoretically occur through a number of sources: (a)increasing production through area expansion; (b) increasing production through technical change; (c)increasing output prices; (d) decreasing tradable input use; and/or (e) decreasing input prices. Dataon commercial farms from section IV indicate that over the period 1975 to 1989 (southeast region),production of maize fell, and that of wheat, soybeans, and burley tobacco increased, largely due tocrop area adjustments. However, these adjustments moved in directions surprisingly counter to trendsin real prices, i.e., rising real maize prices and falling prices for industrial crops. No data werereported on tradable input use, but the above analysis of price indexes suggests rising real costs offixed and variable capital inputs. Assuming these data are correct, it may be that commercial farmsare shifting away from maize not because of price incentives but due to restrictions on marketing thatact to limit the amount of maize sold in the marketplace.
The analysis thus suggests that profitability has historically been closely linked with the abilityto expand crop area and substitute land for capital inputs. Such strategies would work to the advantageof smaller farms employing oxen and labor-intensive management, and to the disadvantage of largerfarms relying on capital-intensive techniques. The data are far from sufficiently reliable to reach strongconclusions (and this analysis is highly speculative), but the analysis does provide some very weakevidence for the increasing area cultivated by small farms, as documented in chapter 3.

220
Table 7.12: Annual commercial farm sales, nominal and 1985 deflated kwatcha
Farm size
YearSmall (0-199 ha)
Nominal DeflatedMedium (200-1,999 ha)
Nominal I Deflated
Large (2,000+ ha)Nominal Deflated
Northwest region1975 38,560 165,739 637,220 2,738,910 1,104,440 4,747,1241976 448,350 1,680,493 1,665,740 6,243,480 1,328,070 4,977,8351977 416,344 1,307,712 2,069,577 6,500,422 2,941,521 9,239,1471978 627,848 1,672,290 1,246,315 3,319,594 1,411,260 3,758,9291979 658,883 1,556,307 1,003,442 2,370,169 2,936,569 6,936,2911980 611,594 1,304,469 2,462,836 5,252,983 4,065,529 8,671,3661981 653,605 1,234,504 3,646,138 6,886,683 4,782,206 9,032,4441982 1,318,870 2,200,621 9,864,834 16,460,123 29,800,277 49,723,7181983 3,253,783 4,669,982 1,810,816 2,598,968 9,856,298 14,146,2201984 1,112,400 1,332,378 13,282,619 15,909,268 47,298,385 56,651,6801985 4,488,066 4,488,066 20,943,035 20,943,035 32,592,720 32,592,7201986 17,859,026 12,911,365 17,775,775 12,851,177 119,197,265 86,174,8761987 15,982,721 7,758,227 34,139,319 16,571,683 82,152,580 39,877,9621988 46,204,737 14,854,102 75,727,593 24,345,239 46,938,639 15,090,0401989 18,737,511 3,017,191 21,125,009 3,401,636 11,381,725 1,832,732
1975 2,370,840 10,190,387Southeast region
12,983,680 55,806,68723,506,790 101,037,3091976 4,257,440 15,957,617 22,717,360 85,148,569 12,388,240 46,433,2521977 3,608,362 11,333,656 20,954,172 65,815,842 8,339,458 26,193,7551978 2,884,862 7,683,908 15,665,928 41,726,624 9,113,582 24,274,2731979 3,210,976 7,584,451 23,293,395 55,019,911 12,940,515 30,566,0031980 5,229,649 11,154,318 30,142,149 64,290,186 17,916,608 38,214,3311981 7,286,861 13,763,138 25,688,377 48,519,203 12,218,440 23,077,7121982 8,004,097 13,355,361 36,825,758 61,446,194 19,237,815 32,099,5571983 8,406,376 12,065,224 35,269,976 50,621,119 25,718,732 369,127,271984 5,879,813 7,042,551 33,990,139 40,711,718 37,990,810 45,503,5251985 34,892,784 34,892,784 132,954,469 132,954,469 140,293,368 140,293,3681986 25,205,982 18,222,921 172,599,774 124,782,763 289,224,028 209,097,4551987 98,785,330 47,951,722 299,833,301 145,543,099 384,874,747 186,823,3561988 161,526,275 51,928,176 365,268,613 117,428,158 225,185,002 72,393,4641989 90,368,388 14,551,488 957,438,581 154,170,687 852,845,309 137,328,650
Source: Derived from Zambia CSO data.

221
Table 7.13: Annual commercial farm operating expenses, nominal and 1985 deflated kwatcha a
1975 1,027,770 4,417,580 1,462,490 6,286,101 846,300 3,637,5821976 1,831,590 6,865,114 2,856,990 10,708,489 1,481,660 5,553,5161977 1,425,481 4,477,353 3,530,924 11,090,428 2,315,283 7,272,1701978 2,064,080 5,497,733 4,320,730 11,508,382 2,637,460 7,024,9461979 3,654,722 8,632,597 3,192,670 7,541,212 3,986,588 9,416,4771980 2,536,975 5,411,114 5,600,683 11,945,696 3,535,818 7,541,5461981 3,786,497 7,151,788 11,343,599 21,425,347 3,631,218 6,858,5031982 9,689,398 16,167,396 20,307,255 33,883,987 5,762,067 9,614,3871983 3,687,741 5,292,818 9,219,046 13,231,606 3,680,049 5,281,7781984 3,261,358 3,906,294 16,100,177 19,284,001 15,771,369 18,890,1701985 22,134,990 22,134,990 29,068,671 29,068,671 23,956,634 23,956,6341986 64,114,761 46,352,419 25,787,081 18,643,033 90,599,461 65,499,8031987 119,172,564 57,847,958 34,375,926 16,686,535 68,086,610 33,050,1521988 35,214,022 11,320,758 253,260,212 81,419,206 66,526,979 21,387,3851989 78,757,704 12,681,889 9,271,714,613 1,492,969,515 14,600,470 2,351,028
1975 3,032,760 13,035,464Southeast region
18,987,560 81,612,67318,982,720 81,591,8691976 2,300,670 8,623,307 29,939,390 112,217,979 17,293,010 64,817,1731977 4,577,150 14,376,563 20,313,688 63,804,119 28,479,720 89,453,1531978 4,272,000 11,378,588 24,982,630 66,541,913 34,001,830 90,564,7961979 4,461,744 10,538,814 35,405,748 83,629,764 34,396,719 81,246,3981980 4,330,558 9,236,647 44,469,648 94,849,306 29,010,392 61,876,2611981 13,102,790 24,748,038 43,393,887 81,960,679 29,947,982 56,564,5791982 13,675,085 22,817,777 43,845,941 73,159,830 25,531,058 42,600,2461983 14,832,245 21,287,932 42,808,609 61,440,917 44,270,155 63,538,5971984 16,271,308 19,488,973 56,379,475 67,528,564 77,326,276 92,617,6121985 22,353,101 22,353,101 89,325,498 89,325,498 101,636,018 101,636,0181986 33,579,194 24,276,420 157,303,061 113,723,849 212,899,764 153,918,0511987 85,692,368 41,596,223 295,734,214 143,553,347 232,586,587 112,900,6441988 783,251,905 251,803,263 500,947,351 161,046,755 225,049,519 72,349,9081989 418,319,638 67,359,544 1,004,500,030 161,748,715 1,136,914,161 183,070,581
a. Includes equipment hire, feed, soil inputs, veterinary supplies, implements, and maintenance. Excludeswages.
Source: Derived from Zambia CSO data.
Farm sizeYear Small (0-199 ha) Medium (200-1,999 ha) Large (2,000+ ha)
Nominal Deflated Nominal Deflated Nominal Deflated
Northwest region

222
Table 7.14: Annual commercial farm wage bill, nominal and 1985 deflated kwatcha
1975 266,200 1,144,186 474,990 2,041,611 464,860 1,998,0701976 857,860 3,215,407 1,558,060 5,839,877 538,580 2,018,6901977 400,615 1,258,309 1,580,059 4,962,874 1,090,033 3,423,7311978 1,706,850 4,546,241 766,960 2,042,819 796,210 2,120,7271979 857,409 2,025,234 1,012,535 2,391,647 1,671,595 3,948,3731980 1,318,350 2,811,909 1,137,435 2,426,035 1,398,510 2,982,8821981 956,470 1,806,543 3,021,996 5,707,828 1,905,349 3,598,7491982 1,310,466 2,186,599 3,731,350 6,226,002 7,735,055 12,906,4471983 949,639 1,362,966 4,064,313 5,833,292 2,201,807 3,160,1361984 628,582 752,885 4,206,774 5,038,667 8,280,695 9,918,2091985 6,389,381 6,389,381 8,036,546 8,036,546 7,883,322 7,883,3221986 13,168,843 9,520,549 12,701,236 9,182,488 30,394,968 21,974,3511987 11,677,183 5,668,261 13,107,524 6,362,568 18,560,342 9,009,4391988 12,044,948 3,872,263 24,647,278 7,923,715 24,298,815 7,811,6901989 10,479,608 1,687,469 20,579,334 3,313,769 1,237,000 199,187
1975 917,530 3,943,744Southeast region
6,385,130 27,444,6816,151,850 26,441,9931976 850,800 3,188,945 7,589,380 28,446,300 7,989,370 29,945,5321977 1,143,089 3,590,376 9,643,821 30,290,684 12,060,667 37,881,8581978 1,188,430 3,165,416 12,037,390 32,061,915 5,560,690 14,811,0491979 998,178 2,357,736 17,692,459 41,790,281 11,520,015 27,210,7271980 1,160,911 2,476,107 19,982,267 42,620,175 9,387,735 20,023,0991981 2,111,946 3,988,961 9,679,489 18,282,241 7,774,976 14,685,0711982 2,487,040 4,149,789 16,413,275 27,386,626 4,097,295 6,836,6061983 3,449,377 4,950,707 9,741,551 13,981,530 13,050,177 18,730,2241984 4,687,643 5,614,628 17,554,679 21,026,132 26,683,982 31,960,7621985 4,161,863 4,161,863 20,784,751 20,784,751 17,481,002 17,481,0021986 5,780,490 4,179,064 29,382,383 21,242,293 37,165,726 26,869,3401987 11,050,099 5,363,866 65,505,507 31,797,250 45,913,446 22,287,0011988 124,709,755 40,092,240 187,458,457 60,264,968 53,102,424 17,071,6011989 28,424,054 4,576,958 217,665,700 35,049,424 209,085,128 33,667,745
Source: Derived from Zambia CSO data.
Farm sizeYear Small (0-199 ha) Medium (200-1,999 ha) Large (2,000+ ha)
Nominal Deflated Nominal Deflated Nominal DeflatedNorthwest region

223
Table 7.15: Annual commercial farm partial net revenue, nominal and 1985 deflatedkwatcha a
1975 -1,255,410 -5,396,027 -1,300,260 -5,588,802 -206,720 -888,5281976 -2,241,100 -8,400,028 -2,749,310 -10,304,886 -692,170 -2,594,3711977 -1,409,752 -4,427,950 -3,041,406 -9,552,880 -463,795 -1,456,7541978 -3,143,082 -8,371,684 -3,841,375 -10,231,607 -2,022,410 -5,386,7441979 -3,853,248 -9,101,524 -3,201,763 -7,562,690 -2,721,614 -6,428,5591980 -3,243,731 -6,918,554 -4,275,282 -9,118,748 -868,799 -1,853,0621981 -4,089,362 -7,723,827 -10,719,457 -20,246,492 -754,361 -1,424,8081982 -9,680,994 -16,153,374 -14,173,771 -23,649,866 16,303,155 27,202,8841983 -1,383,597 -1,985,802 -11,472,543 -16,465,930 3,974,442 5,704,3061984 -2,777,540 -3,326,801 -7,024,332 -8,413,400 23,246,321 27,843,3011985 -24,036,305 -24,036,305 -16,162,182 -16,162,182 752,764 752,7641986 -59,424,578 -42,961,603 -20,712,542 -14,974,344 -1,797,164 -1,299,2781987 -114,867,026 -55,757,992 -13,344,131 -6,477,420 -4,494,372 -2,181,6291988 -1,054,233 -338,919 -202,179,897 -64,997,682 -43,887,155 -14,109,0351989 -70,499,801 -11,352,167 -9,271,168,938 -1,492,881,648 -4,455,745 -717,483
1975 -1,579,450 -6,788,821Southeast region
-1,627,780 -6,996,553 -12,389,010 -53,250,6671976 1,105,970 4,145,365 -14,811,410 -55,515,710 -12,894,140 -48,329,4531977 -2,111,877 -6,633,283 -9,003,337 -28,278,961 -32,200,929 -101,141,2561978 -2,575,568 -6,860,096 -21,354,092 -56,877,204 -30,448,938 -81,101,5721979 -2,248,946 -5,312,099 -29,804,812 -70,400,134 -32,976,219 -77,891,1221980 -261,820 -558,436 -34,309,766 -73,179,295 -20,481,519 -43,685,0291981 -7,927,875 -14,973,861 -27,384,999 -51,723,717 -25,504,518 -48,171,9381982 -8,158,028 -13,612,205 -23,433,458 -39,100,262 -10,390,538 -17,337,2951983 -9,875,246 -14,173,415 -17,280,184 -24,801,328 -31,601,600 -45,356,0941984 -15,079,138 -18,061,050 -39,944,015 -47,842,978 -66,019,448 -79,074,8491985 8,377,820 8,377,820 22,844,220 22,844,220 21,176,348 21,176,3481986 -14,153,702 -10,232,563 -14,085,670 -10,183,379 39,158,538 28,310,0641987 2,042,863 991,633 -61,406,420 -29,807,498 106,374,714 51,635,7111988 -746,435,385 -239,967,327 -323,137,195 -103,883,565 -52,966,941 -17,028,0451989 -356,375,304 -57,385,014 -264,727,149 -42,627,452 -493,153,980 -79,409,676
a. Excludes revenue from livestock activities.Source: Derived from Zambia CSO data.
Farm sizeYear Small (0-199 ha) Medium (200-1,999 ha) Large (2,000+ ha)
Nominal Deflated Nominal Deflated Nominal Deflated
Northwest region

224
Table 7.16: Zambia price indexes (1985 = 100)
YearHigh income
CPILow income
CPIAgriculture
wholesale PIBuilding
materials PIFixed capital
formation goods PI
1962 10.90 9.201963 11.10 9.201964 11.50 9.501965 12.00 10.201966 12.60 11.30
1967 13.30 11.80 11.50 5.90
1968 14.40 13.10 11.80 6.00
1969 15.10 13.40 12.40 6.10
1970 15.90 13.80 12.50 6.20
1971 16.70 14.60 13.00 6.80
1972 17.60 15.40 13.70 7.40
1973 18.90 16.40 14.30 7.90
1974 20.60 17.70 15.30 9.00
1975 22.40 19.50 17.60 21.40 10.90
1976 26.00 23.10 18.30 25.80 14.50
1977 30.60 27.70 21.10 29.10 18.30
1978 34.20 32.30 24.10 34.00 23.70
1979 38.00 35.40 27.00 38.90 27.90
1980 42.40 39.50 32.40 42.30 31.20
1981 46.80 45.10 44.90 47.50 34.30
1982 53.00 50.70 50.90 55.40 39.40
1983 62.40 60.60 63.00 63.40 48.70
1984 75.30 72.80 68.50 70.40 69.90
1985 100.00 100.00 100.00 100.00 100.001986 160.10 154.00 166.90 148.40 283.30
1987 250.30 224.30 201.30 237.00 601.50
1988 375.80 346.90 271.20 300.50 486.101989 847.00 793.50 582.10 864.40 764.70
1990 1,695.20 1,674.40 1,124.30 2,062.90 1,963.80
Source: Derived from Zambia CSO data.

225
Table 7.17: Zambia commodity prices, nominal and 1985 deflated kwatcha a
MaizeTobacco Wheat Cotton
Triple superphosphate Urea
Year Nominal' Deflated Nominal' Deflated Nominal' Deflated Nominal Deflated Nominal Deflated Nominal' Deflated
1970 3.50 25.36 0.81 5.87 0.17 1.23
1971 4.00 27.40 0.81 5.55 0.17 1.16 4.70 32.19 4.19 28.701972 4.30 27.92 0.88 5.71 0.17 1.10 3.13 20.32 2.80 18.18
1973 4.30 26.22 0.88 5.37 0.17 1.04 4.00 24.39 3.55 21.65
1974 4.30 24.29 0.96 5.42 0.25 1.41 3.90 22.03 4.05 22.88
1975 5.00 25.64 0.84 4.31 16.00 82.05 0.30 1.54 3.90 20.00 4.05 20.77
1976 6.30 27.27 0.97 4.20 16.00 69.26 0.40 1.73 6.45 27.92 6.74 29.18
1977 6.30 22.74 1.10 3.97 16.00 57.76 0.40 1.44 6.45 23.29 6.74 24.331978 6.30 19.50 1.45 4.49 20.00 61.92 0.46 1.42 6.45 19.97 6.74 20.87
1979 9.00 25.42 1.51 4.27 20.00 56.50 0.46 1.30 13.50 38.14 8.75 24.72
1980 11.70 29.62 1.57 3.97 20.00 50.63 0.46 1.16 11.50 29.11 11.65 29.49
1981 13.50 29.93 1.65 3.66 26.00 57.65 0.46 1.02 13.65 30.27 9.65 21.401982 16.00 31.56 2.40 4.73 32.00 63.12 0.47 0.93 16.65 32.84 10.95 21.60
1983 18.30 30.20 2.70 4.46 35.75 58.99 0.52 0.86 25.80 42.57 14.95 24.67
1984 24.50 33.65 2.80 3.85 42.50 58.38 0.58 0.80 28.45 39.08 24.10 33.10
1985 28.32 28.32 3.45 3.45 45.20 45.20 0.67 0.67 28.45 28.45 26.75 26.751986 55.00 35.71 5.12 3.32 86.40 56.10 0.84 0.55 64.00 41.56 26.75 17.37
1987 78.00 34.77 6.25 2.79 111.00 49.49 1.60 0.71 64.00 28.53 65.00 28.98
1988 80.00 23.06 14.00 4.04 190.00 54.77 3.00 0.86 64.00 18.45 65.00 18.74
1989 108.00 13.61 14.40 1.81 225.80 28.46 3.60 0.45 77.00 9.70 71.00 8.95
a. Price deflator is the low-income CPI.Source: Derived from Zambia CSO data.
VII. Conclusions
It should be stressed that these are foundational national data upon which much of thepublished national statistics found in international sources is based. The reliability of these foundationaldata has been questioned, suggesting that extreme caution be exercised as statistics based upon thesedata are used to inform policy. In reporting rather remarkable growth rates from 1974 to 1990 of asmuch as 78 percent for commodities in Zambia, the World Bank adds in a footnote:
Unfortunately, the data on gross output...do not appear to be consistent with theofficial data on GDP growth in agriculture.... We include this information, however,because it is the only data on this subject and because the relative importance of landincreases and yield increases is consistent with our understanding and other evidence(World Bank 1993b, p. 24).

226
The "other evidence" that corroborates high growth rates in commodity production in Zambia is notcited by the World Bank. The evidence examined here, problematic as it may be, does not corroboratethe World Bank report.
Rather than booming growth, analysis here suggests a more complicated story ofdiversification in the commercial sector, and increased noncommercial maize production centered inthe far northern and eastern areas of Zambia. Problems of data quality render more detailedconclusions quite tentative. Longitudinal surveys, both retrospective and into the future, would greatlyassist analysis of agrarian structural change in Zambia.

Chapter 8:
Zambia's Agricultural Data System:A Review of the Agricultural Time Series Data
by
John Litschauer and John S. Rowe'
Although policymakers and other leaders recognize the need for highly accurate and reliabledata in order to make sound agricultural development decisions, they do not always give high priorityto providing the resources necessary to collect and publish such data. This chapter focuses on theimportance of sustaining and improving Zambia's agricultural data system. After presenting a briefsummary of four criteria to be used in evaluating an agricultural data system, the two main sourcesof agricultural data in Zambia are reviewed. In the final section, some suggestions are offered on waysthe system might be improved.
It is extremely difficult to initiate and maintain an agricultural data system. High-qualityagricultural data are particularly difficult to collect due to the extensive nature of farming areas andthe seasonality of production. Maintaining a data series requires sustained dedication by the datacollection staff and continued commitment from government. It is with considerable appreciation forthe time and energy put into the Zambian agricultural data system that the following comments aremade. The data managers and their staff should be recognized for their sustained efforts in producingdata series that span years of erratic climatic conditions and rapidly changing economic times.
I. Criteria for evaluating an agricultural data system
The continued production of accurate agricultural estimates needed to build meaningful timeseries requires the cooperation of many actors in a government setting. Cost-effectiveness, efficiency,accuracy, and timeliness are necessary qualities and criteria for judging the outcome of theseinteractions.
A. Cost-effectiveness
A data system should be of the proper size and cost for the country. Leaders must recognizethe necessity of having high-quality information available for decision-making and they must be willingto allocate the necessary resources. It is important that data managers and policymakers enter into adialogue that defines the essential data needs for the country. Only data necessary to meet specificinformation requirements should be collected and summarized. An open door to information requestsallows the data-collection and data-handling resources to become overburdened. Data systems shouldbe "demand-driven," with only amply justified data being collected. Policymakers and data managersmust work together as gatekeepers in deciding on the cost-effectiveness of the number of surveys andthe amount of data collected from each survey.
' Mr. Litschauer is a consultant for the Land Tenure Center; Mr. Rowe is a research associate with the office ofInternational Agricultural Programs.

228
B. Efficiency
Once decisions have been made concerning the data to be collected, the technical staff (datamanagers, statisticians, data collectors, computer technicians, and the like) must collect and publishthe data in the most efficient manner possible. Selection of the appropriate survey and sample designsshould be based on the type of data needed. Probability designs in which a known portion of thepopulation is sampled should be used when inferential statements about the population are required.Probability surveys allow the calculation of sampling errors and allow survey statisticians to makescientifically valid statements of data precision. If general information is sufficient, a non-probabilitydesign may be acceptable. To achieve efficiency in surveys, the technical staff must be properlytrained and correctly located. Adequate logistical support must be provided at the appropriate time andplace. These requirements are difficult to achieve and often test the administrative and personnelcapacities of the survey organization.
C. Timeliness
Much of the value of agricultural data depends on timing. Policymakers need access to currentinformation to enable them to make meaningful decisions. By their nature, information on crop yields,livestock numbers, and market prices must be obtained during the season. It is impossible to determinethese numbers once the crop has been harvested or the livestock sold or moved. Country leaders mustbe sensitive to the needs of producing timely data and support the logistical needs of the data collectionunits. Unless the amount of data collected is restricted to only the essential numbers, the entire processis slowed—causing losses to both efficiency and timeliness. To provide accurate data, it is essentialthat data collection, data summarization, and data analysis teams work in concert. The important stepof analyzing the data with respect to current economic, climatic, and political conditions must also bedone quickly and accurately. This is achieved by making researchers and policy analysts a part of thesurvey-planning team. It is only through the work of the data analysts that the compiled data becomeusable information.
D. Accuracy
To state that data must be accurate to be usable in decision-making seems elementary. Whileno policymaker would willingly accept inaccurate data as a basis for decisions, it is necessary to dojust that in too many developing countries. Leaders are forced to use available data, the accuracy ofwhich is seldom known and even less often committed to paper by data managers. Hence the data useris left with the problem of determining whether the data are accurate. This can only be done byunderstanding the source of the data series' sampling and non-sampling errors. Unfortunately, the datamanager's judgement of accuracy is usually clouded by a lack of information.
Before commenting on a data set's accuracy, a manager must have full knowledge of how thedata were collected. What were the practices employed by the field enumerators? Were mistakes oroversights made? Were the mistakes unintentional or intentional? Inaccuracies caused by these kindsof mistakes are called non-sampling errors. Non-sampling errors are understood and controlled bythorough survey planning followed by intensive training and supervision of staff. While it is notpossible to completely eliminate non-sampling errors, a good data manager constantly works tominimize them. Minimizing non-sampling errors is possible only if data managers are able to insistupon high-quality performance from their employees. Survey leaders should strive to create anatmosphere of "expected excellence." However, to do this successfully, a manager must have the

229
authority to replace employees who do not display a keen interest in maintaining the highest qualitystandards.
A portion of a data set's accuracy can be measured by calculating the sampling errors. Thisallows a statistician to make statements of the likelihood of a population parameter falling within acertain range of the survey statistic. These calculations are valid only if the survey was designed andcarried out as a probability survey—meaning that each sampling unit has a known probability ofselection. To conduct a probability survey, it is necessary to construct a sampling frame and to followa scientific sample design.
Accurate information is derived from data that have both low sampling errors and low non-sampling errors. As mentioned above, these errors are impossible to eliminate and difficult tominimize. Data managers should be free to discuss the various sources of errors in a data set andshould publish sampling errors and data collection procedures in technical notes.
E. Types of surveys
While agricultural censuses were once believed to be the only certain way of obtainingaccurate agricultural information, a wide variety of innovative methods of collecting agricultural datahave been developed during the past several decades. Survey organizations have accepted the validityof smaller, more specialized probability surveys and no longer see the need to do a completeenumeration of all farming units. The proliferation of survey types has placed an added responsibilityon the data manager and statisticians to choose the most effective survey designs. Careful surveyselection is crucial if the four criteria listed above are to be met. For example, it is not possible tomeet the need for current food security information with a national census that takes two years to planand implement. On the other hand, a rapid rural reconnaissance survey will not suffice if detailedstructural information on the number of farmers operating under various land tenure arrangements isneeded. At times, these decisions may mean abandoning a time-honored survey design in favor of amore efficient, cost-effective alternative.
The most important factor in maintaining efficient surveys is to limit the use of each surveyto only the most necessary information. Planners must remain vigilant in the effort to limit datacollection to only necessary items. A survey overloaded with data requests slows the process, makesthe data less accurate, and wastes time and money; the data provider must endure lengthy interviewsand the policymaker must search through extraneous data for the information needed to reachmeaningful decisions.
Table 8.1 provides additional information on the interactions and responsibilities necessary incoordinating an agricultural data system. It should be recognized that all the criteria listed have verylikely been present at one time or another in the Zambian agricultural data system. The available dataseries show that donors and the Zambian government have supported data collection efforts rather wellfor over twenty years.

Table 8.1: Performance criteria for an agricultural data system
Actors Cost-effectiveness Efficiency Accuracy Timeliness
Decision-makers andpolicymakers
Understand importance of usingcurrent information in decision-making and willing to assist dataproviders in setting/maintaining datacollection priorities.
Willing to provide both moraland administrative support todata systems recommended bytechnical managers.
Value high-quality data and insist onstatements of data accuracy beingmade available to data users.
Insistence on timelyinformation coupled with awillingness to support thedata collection system.
Data system managers Able to provide policymakers withrealistic estimates of time andmaterials necessary to collect varioustypes of information. Able to rejectrequests for low priority, non-essential data.
Well organized and able tomake decisions on most efficientmix of programs and personnel.
Actively seek to minimize non-sampling errors and sampling errorsthrough sound training and surveydesign.
Dedicated to providing high-quality information in a timeframe that meets the needs ofthe data users.
Technical support:statisticians, computerprogrammers, etc.
Able to choose the most appropriatedata collection methods for a varietyof information needs.
Able to correctly analyzevarious survey options andselect most appropriate datacollection method.
Use "total survey design" techniquesto minimize both sampling and non-sampling errors. Encourageprobability surveys wheneverfeasible.
Able to design surveys thatmeet the accuracy andtimeliness criteria.
A d m i n i s t rat i v esupport
Aware of the importance ofadministrative support to producehigh-quality data.
Able to facilitate the requiredlogistical support.
Acknowledge importance ofadministrative support in eliminationof non-sampling errors.
Understand the importanceof providing timelyadministrative support.
Data collection staff:supervisors andenumerators
Well trained in the various datacollection techniques. Dedicated tothe collection of high-quality dataunder adverse conditions.
Motivated to provide the mostaccurate data in the most timelymanner.
Fully trained in importance offollowing survey plans. Must remainvigilant in the collection of high-quality data—rejecting short cuts orfalsification of data.
Dedicated employees willingand able to collect high-quality data as required tomeet time constraints.
Data handlers andc o m p u t e rprogrammers
Able to make realistic estimates ofprocessing requirements and toprocess data quickly with minimalerrors.
Knowledgeable of variouscomputer software packages andequipped at an appropriate level.
Recognize importance of followingsurvey plans. Maintain exactingstandard of data handling. Do nothesitate to question entries, return tofield for verification.
Able to input, clean, andsummarize survey datawithin the prescribed timerequirements.
Data analysts Thoroughly understand currenteconomic and political climates aswell as available data sets; able toprovide meaningful data analysis.
Well trained in various data-analysis techniques and equippedwith appropriate hardware.
Knowledgeable of the biases presentin various data sets. Able to explainand publish information on a datasets' accuracy.
Reviews data and preparesreports that providerequested information withinprescribed time.

231
H. Review of Zambia's agricultural time series data
This section provides a review of the agricultural time series data available from two Zambiangovernment statistics units: the MAFF and the CSO. This review, which focuses on the crop and landarea statistics without reviewing the livestock data series, was accomplished by cataloguing the variousnational surveys and supplying comments on the quality of the data sets. The comments are offeredwith the admission that data sets are difficult to evaluate without corroborating data from other sourcesor accompanying notes provided by the survey managers. Unfortunately, there are few comments inMAFF or CSO publications concerning the data quality or technical notes describing survey designs.No mention of calculating sampling errors for the CSO probability surveys was found in thepublication notes.
There are four sets of time series data that describe Zambia's agricultural sector: one generatedby the MAFF and three compiled by the CSO, the main data gathering agency for the Zambiangovernment. Each of these data sets is described below.
A. MAFF agricultural data series
Prior to 1983, the MAFF published three types of Agricultural Statistical Bulletins on aconsistent basis—monthly, quarterly, and annually. Both the quarterly and annual publicationsprovided various agricultural data for multiple years. These data, published at the national andprovincial levels, were obtained from parastatals such as the National Agricultural Marketing Board(NAMBoard, the primary parastatal agency vested with the legal right to purchase most crops) andthe Tobacco Board of Zambia, and some private organizations and companies. As a result, only salesare reported. Farm numbers, crop production, crop areas, and yields are not available for most cropsduring these years. Livestock farm numbers are also not available prior to 1983.
The MAFF began its crop forecasting exercise for the entire crop subsector with the supportof the Food and Agriculture Organization (FAO) and the ZATPID I Project during the 1982/83season. The purpose of this exercise, performed by the Statistics Unit (a unit of MAFF's PlanningDivision) is to provide early warning information on the production of crops at the provincial andnational levels. The data series contain area, yield, and production estimates for the major crops. Thenumber of farms growing each of the crops were projected for internal use but not published. Withthe initiation of crop forecasting, the MAFF continued to publish its annual bulletins, which nowcontain more complete data series than the crop forecasts, but on an inconsistent basis. The last ofthese "annual" publications covered the 1988/89 and 1989/90 crop years. Thus, the only data availablefrom the MAFF after 1989/90 are from their annual crop forecasts (table 8.2). Despite the lapses inreporting, a fairly complete data series is available on the agricultural sector from the MAFF for allcrop years from 1970/71 onward.
The MAFF crop data are compiled by camp officers through their contacts with local farmers.No sampling frame or probability survey techniques are employed. The data are categorized by sizegroups: large (more than 20 hectares), medium or emerging (5-20 hectares), and small (less than 5

232
Table 8.2: Agricultural time series data available in Zambia
MAFF agric. CSO annual CSO annualCrop statistics/ CSO survey surveyyear crop forecasts crop forecasts (noncommercial) (commercial)
1970/71 X n.a.b
1971/72 X X n.a.1972/73 X X n.a.1973/74 X X n.a.1974/75 X X n.a.
1975/76 X X X1976/77 X X X1977/78 X n.a. X1978/79 X no survey X1979/80 X no survey X
1980/81 X no survey X1981/82 X no survey X1982/83 X° X' X1983/84 X X X1984/85 X X X
1985/86 X X` Xf X1986/87 X n.a. n.a. g X1987/88 X X n.a. X1988/89 X X n.a.' X1989/90 X X n. a.' X~
1990/91 X k X n.a.' n.a.1991/92 X k n.a. n.a.' n.a.1992/93 X k X n.a.' n.a.
a. 1971/72 was the first year for this survey.b. Data available for 1969/70.c. MAFF crop forecasts began.d. FAO surveys began.e. CSO crop forecasts began.f. BUCEN surveys began.
g. Disks misplaced.h. Data entered but no expansion factors.i. Data not entered.j. From disks, some data missing.k. Crop Forecast Surveys only.1. Ag Census, data entry not complete.

233
hectares). Once the data are listed at the camp level, the agricultural officer forwards them to the wardsupervisor.' The ward supervisor reviews the data and aggregates them to the ward level beforesending them to the district agricultural officer (DAO).' Special crop-forecasting meetings are heldat the district and provincial levels to review the data and to agree upon the forecasts. The data arethen forwarded to the central office in Lusaka for final tabulation and review. The annual cropforecasts are published by the Early Warning Unit of the MAFF in May of each year. As an example,table 8.3 lists the MAFF time series data published for maize (Zambia/MAFF 1993).
Table 8.3: Maize time series data published by the MAFF
Maize MAFF estimates -- All farms
Year Areaplanted
Production(90 kg bags)
Yield(bags/ha)
Sold(90 kg bags)
Percentsold
Value(kwacha)
Averagevalue
80/81 622,550 16,500,180 27 7,832,181 47%81/82 456,000 8,162,000 18 5,671,613 69% 103,791,000 18.3082/83 546,700 10,392,000 19 5,901,824 57% 144,595,000 24.5083/84 506,500 9,686,000 19 6,347,637 66% 179,765,000 28.3284/85 581,846 12,470,570 21 7,069,637 57% 200,212,000 28.3285/86 588,490 13,673,265 23 10,607,414 78% 583,408,000 55.0086/87 609,529 11,816,096 19 7,296,044 62% 569,091,000 78.0087/88 723,087 21,591,321 30 14,989,980 69% 1,199,198,000 80.0088/89 1,020,574 20,499,758 20 13,551,314 66% 1,463,542,000 108.0089/90 763,277 12,140,784 16 6,678,711 55% 1,896,754,000 284.00
MAIZE-MF.WB1
Maize Produced and SoldAll farms — MAFF estimates
25
20
5
080/81 81/82 82/8383/8484 /85 85/86 86/8787/88 88/89 89/90
15M Amount Sold
2 This organizational structure was first developed during the colonial period for purposes of providing extension servicesto small-scale farmers. The largest local structure was the "block" and within each block several "camps" were identified.Communications traveled from the district agricultural officer through the block supervisor to each of the relevant camps.After independence, the "blocks" became "wards" (with the exception of the Southern province), and the purpose of theorganizational structure became primarily political.
3 The Department of Agriculture's "Crop Forecasting Questionnaire" is used to record individual farm data at the camplevel. The "Crop Forecasting Summary Sheet" is used to aggregate camp-level data before it is sent to the DAO.

234
Theoretically, all crop farmers in the country are surveyed under this system. However, asfar as can be discerned, no quality control efforts are conducted in the field during the exercise,raising doubts whether full coverage is actually attained. Some data users suspect that camp-levelfigures may be changed for political reasons.4 .` Finally, all tabulations of the data at the ward and DAOlevels are done manually. Reports of undetected errors finding their way into final publications arecommon.
While the published MAFF data may be subject to considerable error, the exercise is valuablein providing timely estimates of annual crop production and early warnings of unusual productionpatterns. Since the summaries are subject to review and possible manipulation at several administrativelevels, the potential for politically motivated self-serving adjustments should be recognized byindividuals who wish to use the data as a time series.
B. Central Statistics Office agricultural data series
There are three data series emanating from the CSO. They are the commercial farms, thenoncommercial farms, and the crop forecast data. The latter two data series are derived from the samesample agricultural survey. The agricultural statistics publications printed by the CSO can be foundin the references.
1. Commercial farms data
Data on commercial farms are collected by the CSO annually via a questionnaire mailed toall known "commercial" farmers. During the early years of the survey the mailing list of commercialfarms was based on a membership list obtained from the Commercial Farmers Union. However, thispractice was discontinued when it was discovered that many union members were not farmers but hadjoined to obtain certain products at a preferential price. As a result, by 1969/70, the CSO hadredefined a commercial farmer in terms of agricultural activity.
Definition of a commercial farmer, 1969/70(1) A farmer who sold maize worth K600 or more at the line of rail prices;(2) a farmer who grew Virginia or burley tobacco in his/her own name and was registered
with the Tobacco Board;(3) a farmer who sold dairy products to and was registered with the Dairy Produce Board; or(4) a farmer who had title to land.
In the mid-1970s, the definition of a commercial farmer was expanded to include the widening varietyof specialized agricultural producers. By 1975/76, when the currently available data series begins, acommercial farmer was defined as one who satisfied any of the following criteria:
Definition of a commercial farmer, 1975/76(1) Any farmer who sold during the previous 12 months to NAMBoard or any other
cooperative union any crops the value of which was equivalent to 150 bags (90kilograms) of maize or more at the ruling producer price;
° For example, a ward supervisor might revise maize production estimates upward to show an increase from the previousyear or to compare more favorably with an adjoining ward.

235
(2) any farmer who grew tobacco in his/her own name and was registered with the NationalTobacco Company of Zambia Ltd.;
(3) any farmer who sold to the Dairy Produce Board;(4) any farmer who bred, reared, and/or fattened cattle or poultry and sold them to the Cold
Storage Corporation of Zambia, Poultry Processing Company, Ltd. or to any licensedbutcher or supermarket;
(5) any farmer who reared and/or fattened pigs and sold them to the Zambia Pork Productsor the Cold Storage Corporation of Zambia or to any licensed butcher or supermarket;
(6) all hybrid poultry breeders; or(7) all state farms operated by the Agriculture Division of ZIMCO and other agencies on a
commercial basis.
This definition has continued with minor adjustments until 1990/91. 5 The data series reviewed here(1975/76 and later) falls entirely under the "modern" definition. Data users who have occasion to useany of the pre-1975 data should be aware of the definition change. While it is reasonable to expectthe estimated number of commercial farmers to be somewhat greater after the more inclusive definitionwas adopted, the published farm numbers are not available to make the comparisons. 6
Commercial farm data are published at the provincial and national levels by size groups. Awide range of data are collected including: area, yield, production, and sales of major crops;inventory, production, and sales of livestock and poultry; inventory of farm implements; pesticide andfertilizer usage; production expenditures; and farm gate prices. To collect this much informationrequires a very long survey instrument. It is not difficult to understand why relatively few commercialfarmers responded when they received such a long and complex questionnaire in the mail.
The CSO data on commercial farms forms the second longest continuous data series whencompared to the other data sets—from 1975 through 1989/90.' Unfortunately, the accuracy of thesedata is questionable for two reasons: the accuracy of the list frame used and the low response levelsto the mailed questionnaires. While it was not possible to evaluate the data sets' accuracy directly,examining the response rates to the mail survey for the years in which the data were obtained alongwith the number of commercial farms identified to receive the mailed questionnaire indicates problemsin both areas (table 8.4). 8
The number of questionnaires sent to commercial farms increased sharply from 1,603 farmsin 1975/76 to 2,595 farms in 1976/77. The number then remained around 2,000 until it droppedsuddenly to 1,072 in 1982/83. It is not clear whether these variations were due to incomplete orincorrect lists or were actually correct farm numbers. However, the short time between the sizablegains and losses support the first conclusion. It would have taken a very serious economic event tosuddenly halve the number of commercial farms in Zambia.
5 No data have been compiled after 1989/90. However, since the 1990/91 Census, the CSO has supposedly changed theiremphasis from "commercial" to "large (>20 ha)" farmers. Whether this transition has actually been made is unknown.
6 Given the problems noted later in this paper concerning the commercial farm estimates, this change in definition mayhave had no effect on the published data.
Both the 1988/89 and the 1989/90 data sets have yet to be published. However, preliminary computer summaries areavailable.
Maize production estimates for commercial farms are available as far back as 1940. See the annex 8.2 for a completelisting of the maize data series.

236
Table 8.4: Commercial farms survey: numbers of questionnaires mailed and returnedand estimated number of farms, by crop year, CSO, Zambia
Number of EstimatedCrop year commercial Questionnaires Response rate number of
farms.4 ' returned (%) farmsb
1975/76 1,603 526 33 1,5271976/77 2,595 578 22 2,2421977/78 2,025 523 26 2,0101978/79 1,771 599 34 1,5661979/80 1,920 657 34 1,894
1980/81 2,143 536 25 1,8351981/82 2,187 583 27 1,7801982/83 1,072 276 26 1,1031983/84 1,231 290 24 1,3141984/85 1,283 307 24 1,102
1985/86 912 279 31 1,9721986/87 180 99 55 2,0261987/88 not specified - 2,1151988/89 not available 2,1851989/90 not available - 1,444
a. Number of farmers to whom questionnaires were mailed.b. The CSO published estimate of the number of commercial farms.Source: Zambia CSO (commercial farms) series.
During the same period, response rates to mailed enquiries ranged from 22 to 34 percent.Without a sampling of the nonrespondents, the representativeness of the voluntary respondents isunknown. CSO officials recognized this problem as early as 1970 when they reported on anonresponse survey in the "1970 Agricultural and Pastoral Production Report." The exercise foundthat the smaller farms on the commercial farms list had not received a questionnaire in the mail andthat the list was out-of-date because of the many changes in ownership.'
Over the last three years for which surveys were published, the number of questionnairesmailed decreased significantly—down to 912 in 1986 and then to 180 in 1987. No numbers werespecified for 1988. Consequently, data collected during the last five years of the time series are likelyto be even less accurate than those collected during the first 10 years of the commercial farm survey.
While the exact procedures used by the CSO to arrive at the published estimates of commercialagricultural production are not explained in the publications, the most common method, expanding
9 The reporting of this nonresponse study is the only comment found which indicated an attempt to access the qualityof the commercial farm data.

237
the data, uses the information provided by the voluntary respondents as indicators of what all farmersare doing. Using this method, the average of the data from the mail responses is calculated andmultiplied by the estimated number of commercial farms. Since the CSO commercial farm data werepublished by farm size within provinces, the procedure would be somewhat more complicated. Thestatistician would first have to estimate the number of farms in each size group in each province andthen apply an appropriate average value to each.
In the 1977/78 report, the data user is warned that the estimation procedure is not totallyaccurate and that the "maize and other major crops would be the most accurate." This is because thereis usually less variability in area, yield, and production data when nearly all the farmers are activelyproducing the crop. Experiences from other African countries suggest that a direct expansion of datafrom voluntary respondents may be flawed for a number of reasons. Some amount of overestimationor upward bias was introduced when the smaller commercial farms did not receive a questionnaire andthus were not given a chance to respond. On the other end of the scale, large farmers are notoriousfor either refusing to report or grossly underreporting their agricultural holdings. Since the commercialfarms survey was totally voluntary with no response validation process, it is reasonable to expect thatthe holdings of the largest farmers are underrepresented. This would cause a downward bias in theestimates derived by expanding the data. While it is impossible to speculate on the impact of theadjustments on the crop estimates, it is fair to say that the low response rate from an unknown andpossibly underrepresented portion of the population leaves serious questions about the level ofestimated crop production reported. For example, the data series in table 8.4 listing the estimatednumber of farms shows much variability—changing radically from one year to the next, especially forthe three years beginning in 1982/83 and then again in 1989/90. If it is difficult to have confidencein an estimate as basic as the number of farms, it is even more difficult to imagine how the moredetailed estimates of crop area and production might be accurate. 10
Another anomaly in the commercial farm survey is the timing of publications. Although thequestionnaires continued to be mailed each year, the results are often not published until several yearslater. In the 1987/88 report (published in September 1990), the director thanks the staff for catchingup with 12 years of unpublished data. Evidently the demand for detailed commercial farm data wasstrong enough to cause the CSO to resurrect and publish data that had not been given a high priorityat the time it was collected.
2. CSO noncommercial crop surveys and crop forecasts
To complement the commercial farm data series, the CSO also collects data from thenoncommercial farmers (all farmers not falling under the definition of commercial farmers). Attemptsto measure the agricultural production of the noncommercial farmers is done via a series of samplesurveys. At present, the CSO collects data on the noncommercial farm sector for the purpose ofproviding both annual crop forecasts as well as more detailed statistics. The crop forecasts focus onthe number of farms growing the major crops, the area planted, and expected production. Theseestimates are published midway through the crop year as part of the early warning process. Incontrast, the annual surveys are designed to provide more detailed information on land use, cropproduction, livestock numbers, and prices received for agricultural produce. Estimates are published
10Additional remarks on estimating procedures may be found in the section titled "Setting and Publishing Agricultural
Estimates" (see p. 245).

238
at the provincial and national levels. Table 8.5 lists the published time series data for maize productionon noncommercial farms, as an example.
While the annual survey of noncommercial farmers began in 1971/72, the crop forecastingportion of the survey was first initiated with technical and equipment support being provided by theZATPID II Project (equipment and long-term advisory support) and the US Bureau of Census(BUCEN—training and short-term technical support) in 1985/86. As can be seen in table 8.2, thiseffort has been less than successful in producing publishable data sets. Despite continuous collectionof detailed annual survey data since 1986, only the results from that year have been published."Crop forecasts, however, have been published for the period 1986 through 1993. 12 The followingis a description of the evolution of the CSO sample survey in its three iterations.
3. CSO sample surveys, 1972 to 1978
Designed as a probability survey of the entire country, the sampling frame was built by firststratifying the country into urban, peri-urban, and rural areas. The urban stratum contained allprincipal towns with populations of 30,000 or more; the peri-urban stratum comprised all urbancenters with populations less than 30,000 plus all provincial and district administrative centers; therural stratum comprised the remainder of the country.
Once the rural stratum was identified, a 10 percent sample of basic areas (BAs—the primarysampling unit [PSU] for the survey) was selected. A total of 134 BAs were selected in 1972 out ofa total rural population of 1,145 BAs. 13 Field enumerators listed all of the noncommercial farminghouseholds in the sample BAs, and a sample of 10 percent of the households was randomly selectedfor interviewing. The number of selected BAs ranged from 3 to 28 per province. Fortunately, theamount of data collected under these surveys was reasonable—especially when compared to themagnitude of the present efforts. Copies of the questionnaires used can be found in the back of eachpublication.
Despite the probability design of the survey which would have permitted sampling errors tobe calculated, the publications do not discuss any sampling or non-sampling errors. Given the largesize of the PSUs, it is difficult to say what the sampling errors might have been. Normally, a samplesize of 10 percent in the second stage of sampling is more than adequate for agricultural surveys. Aswith most agricultural surveys, the non-sampling errors are a very important part of the estimationprocedure and are largely immeasurable. If the survey managers had noted the major data collectionproblems and how they were handled, it would have provided future data users with some hintsconcerning the quality of the time series.
11 Summary tables for both the 1986/87 and 1987/88 surveys have been completed but not published. (Disks containingthe 1986/87 summary data have been misplaced.) The 1988/89 raw data have been entered on the computer but have notbeen summarized because the expansion factors (weights) needed for summarization have not been entered.
12 Although these data have been published, a complete data set is not available. Some data were able to be recreatedfrom disk backups.
13 The size of these BAs must have been huge. If all Zambia was divided into 1,145 BAs, the average size of a BAwould have been approximately 65 square kilometers. At present, 9,682 rural survey enumeration areas (SEAs) are usedas PSUs. The average size of a SEA is approximately 8 square kilometers.

Table 83: Maize time series data published by the CSO, noncommercial farms
MAIZE ZAMBIA NON-COMMERCIAL FARMS
YEAR HHSGROWING
AREAPLANTE
(ha.)
AREAHARV'D(ha.)
AVE. AREAPER HH
(ha.)
PRODUCTION(90 Kilo Bags)
YIELD(Bags ma.)
SOLD(90 Kilo Bags)
PERCENTSOLD
VALUE(Kwacha)
AVERAGEVALUE
71/72 431,700 6,164,600 2,618,900 42% 9,123,800 3.4872/73 415,400 5,272,000 1,581,700 30% 6,372,500 4.0373174 389,200 6,302,800 2,466,200 39% 10,813,800 4.3874175 397,100 10,262,800 5,066,600 49% 25,274,500 4.9975/76 319,300 9,911,200 5,614,100 57% 35,095,900 6.2576/77 421,500 10,127,400 5,968,500 59% 37,837,300 6.3477/787817979/8080/8181/8282/83 378,300 358,510 0.95 7,190,000 20 3,857,000 54% 68,666,000 17.8083/84 386,560 397,020 1.03 7,998,000 20 4,543,000 57% 102,280,000 22.5184/85 400,210 400,810 1.00 9,229,000 23 4,735,000 51% 126,692,000 26.7685/86 483,865 660,334 522,157 1.08 14,231,905 27 7,316,004 51% 276,345,000 37.77
MAIZ-NN.WB1
HOUSEHOLDS GROWING MAIZENon-Commercial Farms
MAIZE PRODUCED AND SOLDNon-Commercial Farms

240
4. CSO sample surveys, 1982 to 1985
Following a hiatus in surveys from 1979 to 1982, annual surveys were conducted between1982 and 1985 with assistance from the FAO. In 1981/82, a pilot census of agriculture was carriedout in preparation for the census of agriculture that was scheduled to be conducted during the 1982/83crop season. The actual census was never conducted, and, as a result, the FAO and the CSO agreedto do a sample survey of agriculture on a rotating basis. The four major agriculturalprovinces—Central, Eastern, Southern, and Lusaka—were actually surveyed in 1982/83. Recall datawere collected during the following year to complete the 1982/83 survey in the remaining provinces.
It is not entirely clear how the 1984/85 data were collected. While the authors of the surveypublication state that a two-stage sample was used with survey enumeration areas (SEAs) serving asthe primary sampling units, they do not provide information on sample size at either the primary orsecondary levels. Again, no estimates of sampling errors were calculated or published for the data.
5. CSO sample surveys, 1986 to 1993
Since 1986, the CSO has conducted annual surveys of crop forecasting on the noncommercialsector, initially with technical assistance provided from BUCEN and independently since 1990. Resultshave been less than spectacular, at least with respect to the publication of the annual surveys. Theresults of only the 1986 survey have been published. According to CSO officials, crop forecasting dataare regarded as confidential until the Minister of Agriculture certifies them acceptable. Publication ofsuch data has been the prerogative of that ministry because the final announcement was a blend of twoforecasts collected separately, one by the CSO, and the other by the Ministry of Agriculture. The CSOis thus unable to publish the data themselves without upstaging or contradicting the minister's role.
For these surveys, a new sample design was used which comprised a three-stage samplingsystem. The sample is used for both the crop forecasting exercise and the annual survey with the goalof publishing data at the district, provincial, and national levels. The first stage of sampling is donefrom the census supervisory areas (CSAs). Within each CSA, SEAs have been identified based onreadily identifiable boundaries. From one to four SEAs are located in each CSA. Sample CSAs arefirst selected with probability proportional to the number of households located in each based on the1990 census (1980 census in earlier data-gathering efforts). Once a CSA is selected, a sample SEAis then selected, again based on probability proportional to the number of households. During theearlier years of the survey, 800 SEAs were selected, however the number has been reduced to 400for recent surveys. Households in each sample SEA are listed and farm households identified.
Following the listing process, farm households are stratified based on area planted to crops.Three strata are identified: small (less than 5 hectares), medium or emerging (5-20 hectares), andlarge (greater than 20 hectares). Fifteen sample households are systematically selected from each ofthe small and medium groups. Normally, only a few households are identified as medium-sizedfarmers in any given sample SEA. If fewer than 15 households qualify as medium-sized, all of thesehouseholds are selected and the remainder of the intended 15 sample households are reassigned to thesmall-farm stratum. For example, if a sample SEA contained 100 small farmers and 3 mediumfarmers, the final sample would include the 3 medium farmers plus 27 of the small farmers. Only ifthe total number of farmers—small and medium—were less than 30 would the sample size be less than30. This results in a sample size that nearly always approaches the maximum of 30 per SEA or a total

241
of 12,000 from 400 sample SEAs. Usually, no large-farm households are identified. If they areidentified, data are collected from these households via the commercial farm survey.
After the sample farmers are identified, each is visited three times. During the first visit,which is conducted in January/February, the listing process is completed, sample farmers areidentified, and preliminary crop forecast data are collected. During the second visit, which isconducted in March/April, data are collected for the final crop forecast. During the third visit, whichis conducted in October/November, a post-harvest survey is completed. This last data set forms thebasis for the annual agricultural survey report.
Based on a preliminary analysis of the sample size, the CSO's noncommercial survey is bothtoo small and too large. While a thorough review of the data is necessary to determine the optimumnumber of samples to be selected at each stage of the survey, experience suggests that a sample sizeof 400 PSUs would tend to have sampling errors that are too high for data presentation at the districtlevel. At the same time, a secondary sample size of 30 farmers is clearly larger than required at thefinal stage of sampling. More likely, 5 to 10 small farmers and a 100 percent sample of mediumfarmers selected from each sample SEA would provide the basis for acceptably accurate provincialand national estimates. This would reduce the data handling load by 75 percent which would greatlyfacilitate the speed of collection, summarization, and publication. While the data should probably onlybe published at the provincial and national levels, it may be feasible to provide district estimates foronly the larger districts that exhibit reasonable sampling errors. 14
A review of the "Phase 3 Final Crop Forecasting Questionnaire " shows the survey instrumentto be of reasonable length. However, the post-harvest survey is extremely detailed with 33 pages.Thus, three sets of data are to be collected from 24,000 (presently 12,000) farmers each year. Thismeans the CSO staff is faced with a total of 72,000 (or 36,000) questionnaires to be entered, edited,and summarized annually. The post-harvest survey questionnaire is far too long and is also notdesigned for efficient data entry. It should be reduced so only the essential data are being gathered andsimplified to allow easier data entry.' 5
The large size of the questionnaire is also problematic during the summary phase.Conversations with CSO personnel indicate that corners are cut to speed the summarization process.For example, as far as can be discerned, no computer edits of the data are conducted. Given thepressures of trying to push large amounts of data through a summary system without adequate edit
"According to officials in the CSO, the government's policy is to encourage development planning in all sectors at leastdown to the district level. The CSO thus feels compelled to collect and publish data at the district level to help facilitategovernment planning. Rather than abandoning the current practice, the CSO instead recommends improving the quality andlowering the cost of district-level data collection.
While the management of CSO also feels that the questionnaire is probably too long, it stresses that length alone isnot a hindrance. Space is provided for capturing all the possible production activities of households, but rarely does ahousehold have more than 4-5 activities (out of 20 in section 2) to report, leaving substantial empty space. Also, fewhouseholds report information on growing fruit trees in section 3 and vegetables in section 4. Thus, the majority of thequestionnaires returned to the CSO have substantial space that has been left blank. Moreover, the CSO management feelsthat the current data being collected are essential for monitoring purposes. Before discarding items for sake of increasingefficiency, the CSO management advises caution against loss of important information, a point of view shared by the authors.

242
checks, it is easy to understand why data inconsistencies are routinely seen in the data sets(Zambia/CSO, noncommercial). 16
6. Summary
It is obvious that the CSO, as the premier data collection agency for Zambia, has devotedmuch time and effort to the continuation of agricultural data series. It is unfortunate that more effortwas not spent in assuring the quality of the data. It appears the foundations of the survey organizationmay be sound, but the current activities are sorely in need of reevaluation and redirection.
C. Comparison of MAFF and CSO estimates
One method of assessing data accuracy is to compare several independent data series.Sometimes two data series will rise and fall in the same general pattern but have minor differences.In these cases, a close comparison may reveal that one series uses a slightly different definition or maycontain a bias that accounts for the variations. However, at other times, when more serious differencesexist in one or both of the series, little comparability may be present. It is difficult to compare theMAFF and the CSO data series because of differences in methodologies. While both the CSO and theMAFF call their surveys "crop forecast" surveys or exercises, the MAFF series is derived from agrassroots listing of data from all farms. The CSO uses a sample-survey approach. The intent of bothis to provide early-warning information during the growing season. In contrast, the CSO's commercialand noncommercial surveys are meant to provide a more comprehensive view of agriculturalproduction without the time constraints of the forecast surveys.
The "final" estimates of the CSO crop forecast (CSO/CF), the MAFF crop forecast(MAFF/CF), and the combined commercial and noncommercial agricultural surveys (CSO/AS) werecompared. While it would have been preferable to use basic estimates such as "numbers of farms" or"total land in farms" for comparison, they were not available, so maize was chosen as the cropestimate series which was likely to be most accurate. Data for "area planted," "production," and"sales" were compared. Table 8.6 lists the data and figure 8.1 provides graphic comparisons of thedata sets.
Comparisons of maize area planted shows the MAFF/CF to be generally higher than theCSO/CF. In the eight years of comparative data, only in 1984 and 1987 were the MAFF estimateslower (90 and 92 percent respectively) than the CSO. There seems to be no real connection betweenthe CSO/AS data and the CSO/CF data. For the four years, comparisons range from 91 to 126percent. Special note is made of the 1988-89 MAFF estimate of maize planted, which is substantiallyhigher than any other estimate in any series. The 1,021,000 hectare figure is about 40 percent greaterthan the MAFF estimates for the years immediately preceding and following.
16 However, questionnaire size is not the sole or even the most important reason for these problems. According to CSOmanagement, the problems encountered during the summary phase stem mainly from the lack of an incentive structure thatencourages personnel to properly edit data before summaries are undertaken. An officer who goes to the field to collect datais eligible for an allowance in addition to salary. No such incentive is given to an officer in Lusaka who is responsible forscrutinizing data to detect and eliminate data errors. It is generally the case that data processing personnel are left alone toresolve inconsistencies without proper guidance from the statisticians—the outcome being inadequate editing and short-cutmethods employed to speed the summarization process.

243
Table 8.6: Comparison of the CSO and MAFF maize estimates
1980-81 6231981-82 4561982-83 479 434 91% 547 126% 114%1983-84 488 564 116 % 507 90 % 104 %1984-85 455 575 126 % 582 101 % 128 %1985-86 552 532 97 % 588 111 % 107 %1986-87 659 610 92%1987-88 692 723 105 %1988 .-89 797 1,021 128 %1989-90 668 763 114%1990-91 5791991-92 4721992-93 527
Maize production estimates
1980-81 16,5001981-82 10,976 9,628 88% 8,162 108% 95%1982-83 10,486 10,330 99% 10,392 94% 92%1983-84 11,146 13,492 121% 9,686 92% 112%1984-85 17,732 15,855 89% 12,471 86% 77%1985-86 11,146 13,673 106%1986-87 20,378 11,816 106%1987-88 22,188 21,591 92%1988-89 16,267 20,500 75%1989-90 16,087 12,1411990-91 5,6281991-92 17,2291992-93
Maize sales estimates
1980-81 7,8321981-82 7,513 4,944 66 % 5,672 119 % 79 %1982-83 6,685 6,749 101% 5,902 94 % 95 %1983-84 6,593 7,227 110 % 6,348 98 % 107 %1984-85 10,729 9,794 91 % 7,070 108% 99 %1985-86 6,886 10,607 106 %1986-87 12,947 7,296 116 %1987-88 15,115 14,990 90 %1988-89 9,921 13,551 67 %1989-90 9,000 6,6791990-91 3,2291991-92 9,3261992-93
a. Total of CSO commercial and noncommercial estimates.
CSO/AS° CSO/CF Columns MAFF/CF Columns Columns(a) (b) (b/a) (c) (c/b) (c/a)
Year (000 ha) (000 ha) (%) (000 ha) (%) (%)
Maize area estimates

Figure 8.1: Comparison of the CSO and MAFF maize estimates
TOTAL AREA PLANTED TO MAIZEComparison of MAFF and CSO Estimates
je CSO/AS ® CSO/CF MAFF/CF
750
500
250
0
MAIZE PRODUCTION ESTIMATESComparison of MAFF and CSO Estimates
10,000 er'0
l
Jm
5,000
01982-83 1984-85 198547 199849 1990-91 199243
e CSO/CF ®CSO/CF B MAFF/CF I
015,000
m
25,000
20,000
g 0 -%--0// L \ /
MAIZE SALES ESTIMATESComparison of MAFF and CSO Estimates
16,000
10,000
01982-83 1984-85 1986-87 1988-89 1990-91 1992-93
e CSO/AS e>~ CSO/CF B MAFF/CFI

245
It is difficult to recognize any discernable patterns between the maize production data series.Comparisons between the MAFF and the CSO data range from 75 to 108 percent. Comparisonsbetween the two CSO series vary from 88 to 121 percent. The MAFF estimates for maize productionin 1989 and 1990 are substantially greater than preceding or following years.
As with maize production, comparisons between the series show little similarity for the maizesold estimates. It appears that the MAFF series of maize sales and the CSO series listed in its"1992/1993 Final Crop Forecast" are the official estimates of sales.
Beginning with the 1993/94 agricultural season, the separate crop forecasting surveys of theCSO and MAFF were merged. The survey method is that used by the CSO as outlined in the previoussection.
D. Publishing agricultural estimates
Statistical organizations have a choice of either publishing data as collected or using them asindicators in an estimation process. Governmental organizations rely on survey data as indicators forsetting their published estimates of agricultural production. This method allows the survey statisticiansto adjust for anomalies in the survey data. The result is a smoother set of survey estimates which showreasonable (believable) changes over time. If the organization publishes "raw" survey data (or datawith little review) the users are forced to make their own interpretation of how questionable data areto be used. For instance, most agriculturalists would find it difficult to imagine a set of circumstancesthat would result in the numbers of commercial farms (or the average area planted to maize)fluctuating as much as is indicated by the CSO data. The graphs in the appendix illustrate the dramaticamount of variation in the commercial farms data series. Normally averages for a group of farmschange slowly over time unless there are severe political, economic, or climatic events.
Agricultural statisticians agonize over how much they should adjust survey data. On one hand,they do not want to be accused of "manipulating" data, but they are also reluctant to publish dataseries that show inconsistencies. The CSO has had difficulty in choosing just how much interventionthey wish to impose in reporting their survey results. It appears they should have been more willingto control for the variability caused by both sampling and non-sampling errors in the commercialfarms surveys. If the CSO statisticians had written technical notes about problems and the proceduresthey followed in correcting them, it would have provided both a consistent data series for the manyusers who just "need a number" and a basis for further study for the in-depth analysts. However,simply expending more time writing technical notes will prove ineffective in correcting the problemwithout a commensurate improvement in salary structures that provide office staff sufficient incentiveto scrutinize data and make necessary corrections.
After reviewing data series such as those published by the CSO and the MAFF, externalreviewers often face the dilemma of deciding whether to state that the data series are too fraught witherrors to be usable or to be more understanding and merely warn data users that the series containmany unexplained inconsistencies. The first alternative is seldom taken because data are so badlyneeded and are deemed to be "the best there are." Fortunately, an understanding of statisticalorganization and training exists in Zambia that can be used as a basis for reviving the system if thegovernment decides to move toward fewer, more accurate statistics.

246
III. Suggestions and recommendations
As mentioned at the outset, Zambia has a large data system which has received support fromvarious donors over the years. Unfortunately, donor support has been spasmodic and not sustained.The system has not been held to high standards of cost-effectiveness, efficiency, accuracy, ortimeliness. The following are some suggestions of how to improve performance in these areas.
A. Improving cost-effectiveness
The overriding need in the Zambian agricultural data system is to work toward a morecohesive, organized data system that emphasizes collecting only data that has been substantiallyjustified. Currently, too many resources are flowing into a system that produces many, but notnecessarily usable, results." It appears the system has been allowed to accept more and morerequests for data without a thorough review of necessity. Publications are often delayed due to theinability to summarize the unwieldy quantity of data.
It is not uncommon for large national surveys to become vehicles for collecting increasingamounts of data. The CSO's survey questionnaires have become laden with many interesting butinappropriate questions. To rectify the situation, every survey instrument used in Zambia should beforced to pass a rigorous evaluation process that would allow only the most essential items to remainon the questionnaires. 18 Eliminating questions that have been on questionnaires for a number of yearswill be difficult, but it is an essential step in making the surveys more accurate sources of information.Even when troubles are well known, problems of institutional rigidity, lack of resources, lack of skills,or complacency lead to inaction. Scott mentions a CSO "user-producer seminar on governmentstatistics" scheduled for May 1990 (Scott 1990). According to CSO management, that seminar washeld, but no changes were made to the surveys by way of follow-through.
Data collection should be trimmed to an absolute minimum. The specific data to be collectedshould be determined at a series of data user conferences where the realities of data collection andpublication are discussed. Organizations requesting data must be convinced that less-extensive, higher-quality data sets are of more value than the more detailed, but questionable, statistics currently beingcollected. Data users who want to maintain current levels of data collection should be asked forspecific examples of where published data are used. Only those data sets which have a proven currentuse should be allowed to continue. It is difficult to believe that the detailed structural/size group datacollected by both the MAFF and the CSO are necessary every year. Usually collection of these dataevery three to five years is sufficient. Following thorough review, data from other sources, such asparastatals and marketing boards, should continue to be published by the CSO. These data provide theonly comparisons to the survey data published in Zambia.
' 7 Based on requests it has received from users, CSO officials believe that most of the data collected is usable. Rather,it is the long lag between data collection and publication that diminishes the data's usefulness.
' The CSO's comprehensive agricultural survey described by Scott (1990) was not reviewed as a part of this study.Given the extreme amount of data collected by the survey, the exercise sounds like an ill-conceived use of resources. Thelevel of detail collected by the survey is normally restricted to specialized research studies and is seldom deemed cost-effective at the national level.

247
A sampling frame should be developed which allows for the collection of data at variousadministrative, ecological, and geographical levels. This would facilitate the initiation of smaller, morecost-effective survey designs to collect detailed data for specific needs.
With a accurate sampling frame in place, most future surveys should be based on probabilitydesigns. Probability surveys allow the statistician to make statements about the estimates' precision.These statements in turn allow the data users to calculate a band of confidence in using the data.Decision-makers would gain confidence in both the MAFF and the CSO if the organizations movedto more probability surveys and concentrated on collecting and summarizing fewer, higher-quality datasets.
Scott suggests that some movement has begun within the CSO to combine the noncommercialand commercial surveys. This is an excellent idea. When combined, the resulting survey should bemuch more cost-effective and efficient than the existing separate surveys. However, as of April 1994,separate questionnaires were still being administered to the two categories of farms. One smallimprovement has been made. Instead of sending and receiving commercial questionnaires by post, theforms are now being delivered by enumerators and later collected by them.
B. Improving efficiency
Survey efficiency is gained through the proper management of resources. All survey managersshould be well trained and should be vested with the authority to respond quickly to unexpected fieldconditions—adjusting logistics and personnel accordingly. Extra salary incentives that encouragefieldwork over central office work are detrimental to both the efficiency and the accuracy of thesurveys. The extra time spent in the field not only lessens the amount of time spent in cleaning andsummarizing the data, it allows more data to be collected, thus adding even more to the burden ofwork to be done in the central office. Staff working on the agricultural data have not yet systematicallycollected, entered, analyzed, and published data as one continuous and coherent process. The emphasison data collection has pulled resources away from analysis—the outcome being piles of unprocesseddata. Reducing data collection to the essentials will go a long way toward solving the central officestaffing problems, but incentive structures need to be modified to encourage office work in Lusakaon analysis and publication.
C. Improving timeliness
The inability to publish timely reports has been most obvious in the CSO commercial farmsurveys. Many of the reports are published well after the year in which the data were collected. Onereason for delay is the imbalance between field and central office staff discussed earlier.Reorganization may be necessary to assure that each survey unit has a data entry and computing staffcapable of handling the current data collection activities. The speed with which data are handled canbe greatly enhanced with proper data entry/computer editing programs. Modern microcomputerprocessing is available to overcome many of the time and accuracy problems of out-of-date systems.Data summary and analyses can also be made more timely through the proper addition of computertechniques.
Late reports are also often the result of ill-defined priorities. If the data managers do not havea clear sense of priorities, it is easy to allow outside requests for data to overcome what should beongoing data series. To maintain proper focus on the priorities, a clear mandate must be agreed upon

248
and realistic budgets and human resource support must be provided. Without the insistence of topgovernment officials on timely publications, the timing will inevitably slip. Data managers must seetheir mission as providing high-quality information that is available for current decisions.
D. Improving accuracy
It is difficult to judge the accuracy of the agricultural estimates because there are fewalternative measures for comparison. The data series reviewed show variations that may have beencaused by either natural variations in agricultural production or data collection errors. However, themagnitude and rapidity of fluctuations suggest significant collection errors. Unless a thorough reviewof a survey's accuracy is completed during the survey period, much of the information that wouldreveal the true accuracy of the data is lost.
For example, it is not difficult to understand why errors exist in the CSO data series whensurveys take several years to be published. It is difficult to accurately track data for the three-yearwaiting period now occurring between data collection and data entry. Data have to be tracked at everypoint in the data entry/editing process—upon receipt, during data entry, and at each point in thecomputer editing process. Steps need to be taken to ensure that manual edits performed in the fieldand after receipt at the central office are performed correctly. This requires both training and goodmanuals which define the editing required.
In the future, it is hoped that both the MAFF and the CSO survey units will publish technicalnotes that attempt to explain data fluctuations. A mature and confident survey unit displays an openinterest in eliminating survey shortcomings. All surveys, even in experienced hands, have points ofdifficulty. For the Zambian units to ignore or minimize them is not helpful to the data user. When thesurvey managers begin publishing comments on the possible biases in the survey, the data users willgain confidence in both the data and the survey unit. Again, this type of information can be easily lostin the delay between collection and analysis/publication.
The survey units should make every effort to employ improved statistical techniques designedto minimize sampling and non-sampling errors. Employing "total survey design" techniques would bea helpful approach. This methodology allows the survey designers to identify the various error-causingcomponents of a survey and to minimize both sampling and non-sampling errors.
Training is often a key component in minimizing survey errors. 19 All survey personnel shouldbe provided with comprehensive training so they fully understand and appreciate the impact theiractions have on data quality. For example, field personnel are often expected to spend long daysfollowing intricate procedures in search of data that have little meaning to them. This situation oftenleads to fabrication of the data by the field enumerators. However, when the staff is given informationabout the survey sample design and insights into the purpose of the survey, the quality of theirperformance is higher.
19 The CSO is presently engaging its statisticians in on-the-job training of manual editing using 1992/93 post-harvest data.The statisticians, after the program, are then expected to supervise junior officers in future surveys. Based on early feedback,the statisticians are gaining a lot of experience with common data errors generated by enumerators in the field and data entrypersonnel in Lusaka (CSO, personal communications).

249
IV. Summary
In spite of substantial effort in agricultural data collection, review of the available summariesand reports suggest significant problems with quality. As stated earlier, it is difficult to review dataseries after a period of time has elapsed unless there are technical notes that document the surveyprocedures including problems that may have affected the quality of data collected. Unfortunately, fewsuch notes exist in either the MAFF or the CSO publications. However, the quality of Zambia'sagricultural data may be improved in the future in a number of ways. The most important steps areto ensure the elimination of all unnecessary questions from the two main CSO and MAFF surveys andthen to concentrate on the development and maintenance of solid data collection techniques. This willnot be an easy task. It will take the courage of policymakers and survey managers alike to makecommitments to data quality rather than data quantity.
The most expeditious way of beginning to change the Zambian data system is to employ ateam of outside evaluators to review the system in detail. Once the evaluation is complete, and a planof work is agreed upon by the appropriate governmental units, the government should request the aidof donors in mounting a sustained program of survey evaluation and improvement. Following are fouralternative levels of technical support donors should consider providing to the Zambian agriculturaldata system. Each alternative offers unique benefits. Assisting Zambia with a combination of theseinputs would be most effective.
(1) Short-term trip(s) with the specific task of designing and organizing surveys to collect data forLTC research projects might be considered as a minimal level of support. Working onspecific LTC research questions, short-term technical assistance (STTA) would collaboratewith CSO statisticians in designing appropriate samples. STTA would explore the use of CSOsampling frame to facilitate probability samples. Areas of possible data-collection collaborationcould be considered with the MAFF and/or the CSO field personnel. Any collaboration wouldbe accompanied by in-country training provided by the STTA. The number of trips providedin this category would be totally dependent on LTC research needs.
Benefits: Professionally designed surveys resulting in high-quality research data. Collaborationand a small amount of training provided for the MAFF and the CSO staff.
(2) One or two short-term trips to search for existing data that would be helpful to the LTCresearchers would probably produce information that was previously overlooked. Data seriesor administrative records very likely exist which have potentially valuable information forresearchers. These may include information from governmental or parastatal units (e.g.,mortgage listings, title registrations, and the like), or listings currently being compiled for theCSO sampling frames. The search for these information sources would take some time andwould depend on STTA's ability to convince government officials of the value of cooperatingin the effort.
Benefits: Possible discovery of information that could be made available to the project andothers at a relatively low cost.
(3) STTA would develop an ongoing relationship with CSO and MAFF to assist in providingincremental improvements to the agricultural data system. Following a system review, theSTTA would work to encourage changes that appear to be most effective in improving data

250
quality. Training of staff (both in-country and in the US) would be encouraged as the mostcertain method of assuring long-term improvements. STTA would expect to spend no less thantwo months in Zambia each year. Additional time would be spent in the US designingspecialized training programs as needed.
Benefits: Improved data and improved working relationship between the project staff and thedata collection officials. This kind of technical input could be particularly beneficial if theSTTA is allowed to work closely with the CSO and/or the MAFF staff to gain theirconfidence and cooperation. As travel and training opportunities are realized, interactionbetween UW and Zambia professionals would be strengthened, offering possibilities for futurecollaboration.
(4) Long-term TA (LTTA) to work with the CSO in completely rethinking the data system. Thereis evidence that the system needs major structural changes if it is to satisfy the needs of futuredata users. While new technologies such as GIS, remote sensing, and area frames may offerefficiencies and improved accuracy, there are many areas in which incremental changes wouldbe beneficial to the organization. A resident LTTA would be able to influence major changesin design and methods that a STTA may not have the clout to accomplish. However, STTAswould be important for specialized training and statistical design needs.
Benefits: With sufficient funding, the CSO and the MAFF could collaborate in building anagricultural data system that uses cost-effective and efficient surveys to provide timely andaccurate data.
Any project delivering STTA and LTTA should emphasize transfer of knowledge to localpersonnel. As obvious as this sounds, according to CSO officials, some TA personnel haveperpetuated their employment by doing the work themselves. Some have failed to produce technicalnotes about survey methods despite remaining in Zambian organizations for years. Despite thesereservations, the CSO nevertheless welcomes STTA and LTTA. From the perspective of the authors,such problems of confidence and transfer of knowledge are best encountered through projectsemphasizing long-term institutional collaboration and commitment (e.g., options (3) and (4) above).
Improvement of staff performance is key to raising the quality of agricultural data in Zambia.By offering training opportunities to the staff, both productivity and accuracy will rise as they learnnew procedures and experience higher morale. Some of the statistical training programs available aresummarized below:
ISPC, Bureau of Census offers focused training in several areas of statistics, surveymanagement, and computer analysis. Courses are usually 12 months in length. ISPC training isexpensive, but courses impart valuable practical training on what is needed to manage an agriculturaldata system.
OICD/USDA contracts with governmental agencies and universities to provide specialtytraining of 2 to 8 weeks in length. Each year OICD offers several 2- to 6-week courses in agriculturalstatistics and computer usage. The impression is that the courses are somewhat limited in scope andthe contractors have fairly rigid programs with limited latitude for adapting materials to specificcountry needs.

251
University of Wisconsin-Madison offers training opportunities either on-campus or in-country.Courses range from formal university graduate-level courses to 2- to 4-week workshops. Courses canbe geared to the needs of the students. For example, courses can be adapted as refreshers forexperienced staff or as beginning courses designed to get new employees started. Instructors will travelto Zambia to conduct short courses and/or assist Zambians in training local staff.
If employed as STTA to interface with the CSO and the MAFF (item 3 above), the instructorwill spend up to two months per year in Zambia working on data problems. Coordination of STTAvisits and training plans would increase effectiveness.
The University of Wisconsin offers additional courses in monitoring and evaluation, researchmethods, rapid rural appraisal methods and land tenure issues periodically at various African sites(e.g., Senegal, Madagascar, Uganda, and The Gambia).
The CSO prefers locally-organized courses as they afford opportunities for a larger numberof officers to attend. However, this by no means precludes training abroad in specialized areas.Further, as it is difficult to identify with perfect knowledge all training needs in advance, the CSOstrongly advises maintaining flexibility in choice of training programs during the course of projectdesign.

252
Annex 8.1: Graphs illustrating variation in commercial farm estimates
MAIZE AREA
Commercial Farms200
tso ..... .....
40 43 41 49 02 SS SI It 14 17 70 73 70 79 12 OS OS
so .........
II ~1Illfll~l l-11
NUMBER OF COMMERCIAL FARMERSPercent Change from Previous Year
1co%
71 72 73 74 73 76 77 71 79 90 II 92 83 14 16 1017
I WI Farms El Matra Farms
.0%
MAIZE AREA: Percent of 1940Commercial Farms

Annex 8.2: Maize time series data published by the CSO, commercial farms
Households Area planted Ave. area per Production Yield Sold Percent Value AverageYear growing (ha) HH (ha) (90 kg bags) (bags/ha) (90 kg bags) sold (kwacha) value
1940 13,677 261,0001941 13,729 173,0001942 13,666 203,0001943 13,574 202,0001944 17,472 289,0001945 17,982 348,0001946 19,797 395,0001947 22,627 204,0001948 26,658 446,0001949 29,976 369,0001950 42,510 572,0001951 39,783 467,0001952 44,254 443,0001953 43,842 637,0001954 40,578 715,0001955 45,462 651,0001956 47,383 956,0001957 51,203 1,257,0001958 47,798 661,0001959 44,211 1,120,0001960 42,190 1,075,0001961 42,700 1,427,0001962 40,838 1,490,0001963 31,522 946,0001964 37,311 1,459,0001965 51,657 2,452,0001966 71,689 3,413,8681967 60,850 2,933,0001968 39,879 1,834,4001969 31,603 1,462,100

254
Annex 8.2, Maize time series data, cont.)
YearHouseholds
growingArea planted
(ha)Ave. area per
HH (ha)Production
(90 kg bags)Yield
(bags/ha)Sold
(90 kg bags)Percent
soldValue
(kwacha)Average
value
1970 1,277 59,530 47 2,318,590 391971 849 39,940 47 2,020,400 51 3158600 97% 12,469,000 3.951972 898 69,970 78 3,264,600 47 2213070 97% 9,391,810 4.241973 705 53,028 75 2,291,008 4 4,982,220 95% 21,261,440 4.271974 1,203 102,030 85 5,247,430 51 2,923,500 95% 14,475,360 4.951975 1,181 62,130 53 3,077,000 50 4,376,490 94% 27,282,290 6.231976 1,096 103,650 95 4,647,840 45 4,765,160 95% 29,788, 890 6.251977 1,959 169,860 87 5,014,830 30 3,273,806 91% 22,385,618 6.841978 1,620 86,684 54 3,601,018 4 1,972,530 95% 18,749,520 9.511979 1,224 57,070 47 2,086,880 37 2,307,704 87% 26,395,249 11.441980 1,478 74,233 50 2,656,850 36 2,870,635 94% 39,476,683 13.751981 1,569 67,860 43 3,044,772 45 2,471,264 96% 38,599,593 15.621982 1,463 84,701 58 2,572,991 30 3,656,297 97% 67,797,895 18.541983 1,259 100,859 80 3,786,320 38 2,141,583 86% 51,319,040 23.961984 1,000 101,286 101 2,487,687 25 1,858,407 97% 53,518,671 28.801985 789 54,922 70 1,917,150 35 3,412,687 98% 185,893,448 54.471986 1,463 67,739 46 3,500,140 52 3,398,491 97% 266,587,369 78.441987 1,670 69,477 42 3,504,521 50 3,031,477 94% 257,466,415 84.931988 1,577 74,763 47 3,231,122 43 3,314,679 94% 403,922,001 121.861989 1,595 72,090 45 3,533,213 49

References
Allan, J.M.S. 1984. "Baseline Survey Report (1980-82): Chinsali Integrated Rural DevelopmentProgram."
Allan, William. 1970. Land Holding and Land Usage among the Plateau Tonga of Mazabuka District:A Reconnaissance Survey. Westport, Conn.: Negro Universities Press.
Amankwah, M.A. 1986. "The Land Tenure System of Zambia and Agricultural Development." InLand Policy and Agriculture in Eastern and Southern Africa. Tokyo, Japan: United NationsUniversity, pp. 119-126.
Arntzen, J.W., L.D. Ngcongco, and S.D. Turner. 1982. "Land Policy and Agriculture in Easternand Southern Africa." Selected paper for workshop held in Gaborone, Botswana, 14-19February 1982.
Bardouille, Raj. 1986. Women's Employment Patterns, Discrimination and Promotion of Equality inAfrica: The Case of Zambia. Addis Ababa: Jobs and Skills Programme for Africa,International Labour Organisation.
Barnes, Grenville. 1990. A Comparative Evaluation Framework for Cadastre-Based Land InformationSystems (GUS) in Developing Countries. LTC Research Paper, no. 102. Madison: LandTenure Center, University of Wisconsin.
Baser, Heather Jane. 1987. "Lima and Women Farmers in Zambia." N.p.: n.p.
Bass, Stephen M.J. 1987. The National Conservation Strategy for Zambia: A Case Study. Washington,D.C.: International Institute for Environment and Development.
Beck, Josephine, and Sabine Dorlochter. 1987. "Possibilities and Constraints of Village Women'sIncome Activities, with Special Emphasis on the Promotion of Rural Women in Small-ScaleProduction: Kanema and Maveve, Two Village Case Studies: Final Report." Berlin.
Bengtcen, Anders. 1988. A Study of Cooperative Societies in the Central and Southern Provinces ofZambia during the 1986/87 Marketing Season: A Minor Field Study. Uppsala: SwedishUniversity of Uppsala Agricultural Sciences, International Rural Development Centre.
Binswanger, Hans P., Klaus Deininger, and Gershon Feder. 1993. "Power, Distortions, Revolt andReform in Agricultural Land Relations." Policy Research Working Paper 1164. Washington,D.C.: World Bank.
Blake, Joanne. 1984. "An Analysis of IRDP/Northern Province Development Strategy for RuralWomen."
Blarel, B. 1990. "Tenure Security and Agricultural Production under Land Scarcity: The Case ofRwanda." Paper prepared for Conference on Rural Land Tenure, Credit, and AgriculturalInvestment and Farm Productivity in sub-Saharan Africa. Washington, D.C.: World Bank.

256
Blitzer, Charles R. 1978. Development and Income Distribution in a Dual Economy: A DynamicSimulation Model for Zambia. Washington, D.C.: World Bank.
Bloch, Peter. 1989. "Madagascar Environmental Project 1: The Environmental Action Plan and LandTenure." Memorandum. Madison: 12 October.
Bratton, Michael. 1977. "Clients or Classes? / Patterns of Resource Distribution in Rural Zambia."
Bratton, Michael. 1980. The Local Politics of Rural Development: Peasant and Party-State in Zambia.Hanover, N.H.: University Press of New England.
Bruce, John W. 1989. "The Variety of Reform: A Review of Recent Experience with Land Reformand the Reform of Land Tenure, with Particular Reference to the African Experience." Paperprepared for the Conference on Human Rights in the Post-Apartheid South AfricanConstitution, 25-28 September 1989.
Bruce, John W., and Peter Dorner. 1982. Agricultural Land Tenure in Zambia: Perspectives,Problems and Opportunities. LTC Research Paper, no. 76. Madison: Land Tenure Center,University of Wisconsin.
Bruce, John W., and Christopher Tanner. 1992. "Structural Adjustment, Land Concentration andCommon Property: The Case of Guinea Bissau." Paper delivered at meetings of Associationfor the Study of Common Property, Washington, D.C., 18-20 September 1992. Madison,Wisconsin, September.
Bwalya, M.C. 1985. "The Integrated Development Approach within the Context of Decentralizationin Zambia." In Challenging Rural Poverty. Trenton, N.J.: Africa World Press of the AfricaResearch and Publications Project.
Carlson, Helena. 1988. The Impact of PPP Loans on Small Farmers, Particularly Women: A MinorField Study. Uppsala: Swedish University of Agricultural Sciences, International RuralDevelopment Centre.
Carter, M., K. Wiebe, and B. Blarel. 1991. Tenure Security for Whom? /Differential Impacts of LandPolicy in Kenya. LTC Research Paper, no. 106. Madison: Land Tenure Center, Universityof Wisconsin.
Celis, R., John T. Milimo, and Rudhur Wanmali. 1991. Adopting Improved FarmTechnology: A Study of Smallholder Farmers in Eastern Province, Zambia.Washington, D.C.: IFPRI.
Chabala, Charles, and Robert N. Gichira. 1990. "Zambia: Intrahousehold Dynamics and FSR/E inZambia: A Case Study of Traditional Recommendation, Domain 3 in Central Province." InWorking Together. West Hartford, Conn.: Kumarian Press.
Chenoweth, Florence A. 1984. "Women in the Food System—Zambia." FAO Mission Report.
Chilivumbo. 1982. "Communal Agrarian Co-operative Societies: An Experiment in Rural Socialism."

257
Chinene, V.R.N., Michelo Hansungule, Fabian Maimbo, Faustin Mwape, and Frank Place. 1993."Land and Tree Legislation, Customary Tenure, and Agroforestry Practices in Eastern andSouthern Provinces of Zambia." Research paper. Madison: Land Tenure Center, Universityof Wisconsin.
Chinene, V.R.N., M. Hansungule, and F. Place. 1994. "Land Tenure, Tree Tenure, and TreePlanting in Zambia. " N.p.: n.p
Chipungu, Samuel. 1987. "The State, Technology and Peasant Differentiation in Zambia: A CaseStudy of the Southern Province, 1930-1987."
Christie, Malcolm, and Guy Scott. 1977. Zambia: An Agricultural Development Strategy for the Next25 Years. Washington, D.C.: Economic Development Institute, World Bank.
Cooperative Development in the Rupublic [sic] of Zambia. 1981. Rome: COPAC Secretariat.
Cowie, William J., and Jotham Momba. 1984. "Zambia's Captured Peasantry." In The Politics ofAgriculture in Tropical Africa. Beverly Hills, Calif.: Sage Publications.
Crehan, Kate. 1985. "Production and Gender in North-Western Zambia." In Food Systems in Centraland Southern Africa. London: School of Oriental and African Studies, University of London.
CSO (Central Statistical Office). 1989a. "Agricultural and Pastoral Production (Commercial Farms),1978-79." Central Statistical Office, Republic of Zambia.
1989b. "Agricultural and Pastoral Production (Non-Commercial Sector), 1982-83 to1984-85." Central Statistical Office, Republic of Zambia.
. V.d. "Crop Forecasts." Mimeographed. Central Statistical Office, Republic of Zambia.
. V.d. Monthly Digest of Statistics. Central Statistical Office, Republic of Zambia.
Daniel, Philip. 1985. "Zambia, Structural Adjustment or Downward Spiral?" IDS Bulletin, vol. 16,no. 3, pp. 52-60.
Dar, Ashok et al. 1987. The Zambian Food and Agriculture Sector. Uppsala: Swedish University ofAgricultural Sciences, International Rural Development Centre.
Davies, D. Hywel, ed. 1972. Zambia in Maps: Graphic Perspectives of a Developing Country. NewYork: Africana Publishing Co.
Davis, Selwyn S. 1992. "An Integrated Sociophysical Strategy for Sustainable Shelter Development:A Case Study of Slum and Squatter Settlements in Zambia." Regional Development Dialogue,vol. 13, no. 4, pp. 118-137.
Dorner, Peter, and John Bruce. 1982. Annex: Land Tenure Issues [in the Development of Zambia'sAgriculture]. In Food Strategy Study. Confidential draft report. Lusaka: Republic of Zambia,Ministry of Agriculture and Water Development Planning Unit, March.

258
Due, Jean M., and Marcia White. 1986. "Contrasts between Joint and Female-Headed FarmHouseholds in Zambia." Eastern Africa Economics Review, vol. 2, no. 1, pp. 94-98.
Due, Jean M., and Marcia White 1986. Female-Headed Farm Households in Zambia: FurtherEvidence of Poverty. East Lansing: Michigan State University, [Office of] Women inInternational Development.
Due, Jean M., Marcia White, and Renee Schwartz. 1985. Female Farm Households in Zambia:Further Evidence of Poverty. Urbana: Department of Agricultural Economics, University ofIllinois at Urbana-Champaign.
Due, Jean M., and Timothy Mudenda, with Patricia Miller and Marcia White. 1984. Women'sContributions to Farming Systems and Household Income in Zambia. Los Angeles, Calif.:African Studies Association.
Eardmans, J.D.B. 1972. Settlement Schemes in Zambia. Lusaka: Ministry of Rural Development.
Elliot, Charles. 1983. "Equity and Growth: An Unresolved Conflict in Zambian Rural DevelopmentPolicy." In Agrarian Policies and Rural Poverty in Africa. Geneva: International LabourOffice.
ERS (Economic Research Service), United States Department of Agriculture. 1994. "WorldAgriculture: Trends and Indicators." PC-disk database. Washington, D.C.
Evans, David. 1984. "The State and the Peasant Farming Sector: Small Scale Agricultural Productionin Economic Development." In Beyond Political Independence: Zambia's DevelopmentPredicament in the 1980s. New York: Mouton.
Feder, G., and T. Onchan. 1987. "Land Ownership Security and Farm Investment in Thailand."American Journal of Agricultural Economics, vol. 69, pp. 311-320.
Feder, Gershon, T. Onchan, Y. Chalamwong, and C. Hongladarom. 1988. Land Policies and FarmProductivity in Thailand. Baltimore: Johns Hopkins University Press.
Fehler, Katarina et al. 1988. Land Use in the Urban-Rural Fringe of Chipata, Zambia: A Discussionon the Prospects for Land Utilization, Emphasizing Long-Term Natural Resource Management:A Minor Field Study. Uppsala: Swedish University of Agricultural Sciences, InternationalRural Development Centre.
Fenichel, Allen H., and Bruce Smith. 1992. "A Successful Failure: Integrated Rural Development inZambia." World Development, vol. 20, no. 9, pp. 1313-1323.
Gaobepe, Mary G., and Angel Mwenda. 1980. "A Report on the Situation and Needs of FoodSuppliers: Women of Zambia."
Geisler, Gisela G., Bonnie B. Keller, and Pia M. Chuzu. 1985. The Needs of Rural Women inNorthern Province: Analysis and Recommendations. Lusaka: Government Printer.

259
George, Henry. 1929. Progress and Poverty: An Inquiry into the Cause of Industrial Depression andof Increasing Affluence with the Increase of Wealth. New York: Fiftieth Anniversy Edition,The Robert Schalkenback Foundation.
Good, Kenneth. 1988. "Weak State and Backward Agriculture in Zambia: A Case Study and itsImplications." In Coping with Africa's Food Crisis. Boulder, Colo.: L. Rienner.
GRZ/SIDA Evaluation Mission. 1988. The Survey and Lands Programme within ASSP: AnEvaluation. Uppsala: Swedish University of Agricultural Sciences, International RuralDevelopment Centre.
GVD (Government Valuation Department, Republic of Zambia). 1993. "Policy Position Papers."Lusaka.
Hammar, Thomas. 1990. Economic Ground Rent in Zambia: Principles for a New System. Lusaka:Swedsurvey.
Hansen, Art. 1990. Refugee Self-Settlement versus Settlement on Government Schemes: The Long-TermConsequences for Security, Integration and Economic Development of Angolan Refugees(1966-1989) in Zambia. Geneva: United Nations Research Institute for Social Development.
Hansen, Peter. 1984. Zambia Country Economic Memorandum: Issues and Options for EconomicDiversification. Washington, D.C.: World Bank, Eastern Africa Country Programs,Department I, Division 1B.
Hedlund, Hans G.B., and Mats Lundahl. 1983. Migration and Change in Rural Zambia. Uppsala:Scandinavian Institute of African Studies.
Hellen, J.A. 1969. "Colonial Administrative Policies and Agricultural Patterns in Tropical Africa."
Himonga, Chuma. 1987. "Property Disputes in Law and Practice: Dissolution of Marriage inZambia." In Women and Law in Southern Africa. Harare: Zimbabwe Publishing House.
Hoeven, Rolph van der. 1977. "Zambia's Income Distribution during the Early Seventies."Provisional draft. Geneva: International Labour Office.
Hudgens, Robert Earl. 1988. "A Diagnostic Survey of Female-Headed Households in the CentralProvince of Zambia." In Gender Issues in Farming Systems Research and Extension. Boulder,Colo.: Westview Press.
Jeanes, K.W. 1986. "Review of Carrying Capacity Estimates for Grazing Cattle for Differing LandTypes in Zambia." Mimeographed. Lusaka: Department of Agriculture, December.
Jules-Rosette, Bennetta. 1988. "A Zambian Squatter Complex: Cultural Variables in UrbanRelocation." In Slum and Squatter Settlements in sub-Saharan Africa. New York: Praeger.
Kalapula, E. Shamilupa. 1984. "Back to the Land: Youth-Based Agricultural Land Settlement Centrefor Economic and Social Development in Southern Zambia."

260
Kalapula, E. Shamilupa. 1990. "Geopolitics and Refugee Asylum in Front Line Land-Locked Zambia:Refugee Characteristics, Migration Flows, and Resettlement Patterns." Eastern and SouthernAfrica Geographical Journal, vol. 1, no. 1, pp. 65-73.
Kaunda, K.D. 1974. Humanism in Zambia. N.p.:n.p.
Kayizzi-Mugerwa, Steve. 1990. "Growth from Own Resources: Zambia's Fourth NationalDevelopment Plan in Perspective." Development Policy Review, vol. 8, no. 1, pp. 59-76.
Kean, Stuart A., and Adrian P. Woods. 1992. Agricultural Policy Reform in Zambia: The Dynamicsof Policy Formulation in the Second Republic. N.p.: n.p.
Keller, B. 1984. "The Integration of Zambian Women in Development. "
Keller, Bonnie B., and Dorcas Chilila Mbewe. 1991. "Policy and Planning for the Empowerment ofZambia's Women Farmers." Revue Canadienne d 'Etudes du Developpement, vol. 12, no. 1,pp. 75-88.
King, R.B. 1975. Land Resources of the Northern and Luapula Provinces, Zambia: A ReconnaissanceAssessment. Volume 6, The Land Systems. Land Resource Study, no. 19. Surrey, England:Land Resources Division, Ministry of Overseas Development.
Kingsbury, David S. 1988. Effects of Alternative Foreign Exchange Allocation on the ZambianEconomy with Specific Reference to the Agricultural Section: 1985-1988. Harare, Zimbabwe:Department of Agricultural Economics and Extension, Faculty of Agriculture, University ofZimbabwe.
Kumar, Shubh K. 1988. "Design, Income Distribution, and Consumption Effects of Maize PricingPolicies in Zambia." In Food Subsidies in Developing Countries. Baltimore: Published forInternational Food Policy Research Institute [by] Johns Hopkins University Press.
Kydd, Jonathan. 1986. "Changes in Zambian Agricultural Policy since 1983: Problems ofLiberalization and Agrarianization." Development Policy Review, vol. 4, no. 3, pp. 233-259.
Land Resources Division. 1975. Land Resources of the Northern and Luapula Provinces, Zambia -AReconnaissance Assessment. Volume 3, Land Capability and Potential Land Use: Maps. LandResource Study, no. 19. Surrey, England: Land Resources Division, Ministry of OverseasDevelopment.
Lang, D.M., and J.E. Mansfield. 1975. Land Resources of the Northern and Luapula Provinces,Zambia: A Reconnaissance Assessment. Volume 3, Land Capability and Potential Land Use.Land Resource Study, no. 19. Surrey, England: Land Resources Division, Ministry ofOverseas Development.
Lombard, C. Stephen, and A.H.C. Tweedie. 1972. Agriculture in Zambia since Independence.Lusaka: Published by Neczam for the Institute of African Studies, University of Zambia.

261
Longwe, Sara H. 1985. Legalized Discrimination against Women in Zambia. East Lansing: Office ofWomen in Development, Michigan State University.
Loxley, John. 1990. The IMF's Structural Adjustment Programmes in Zambia and Ghana: SomeIssues of Theory and Policy. Leeds, England: University of Leeds, African Studies Unit,Department of Politics.
MAFF/WB (Ministry of Agriculture, Food and Fisheries, Republic of Zambia/World Bank). 1993."Final Report: The Study and Results/Part 1, Assessment of Potential Land for ExpandingAgricultural Production in Zambia." N.p.: n.p. [Study team: Republic of Zambia Ministry ofAgriculture, Food and Fisheries; World Bank, DHV Consultants; and Wood Consultants andInvestments Ltd.]
Manda, Patrick. 1990. Decentralisation in Zambia. Leeds: University of Leeds, African Studies Unit,Department of Politics.
Mansfield, J.E. 1975. Land Resources of the Northern and Luapula Provinces, Zambia: AReconnaissance Assessment. Volume 2, Current Land Use. Surrey, England: Land ResourcesDivision, Ministry of Overseas Development.
Mansfield, J.E. 1975. Land Resources of the Northern and Luapula Provinces, Zambia: AReconnaissance Assessment. Volume 5, Social and Economic Factors. Land Resource Study,no. 19. Surrey, England: Land Resources Division, Ministry of Overseas Development.
Mansfield, J.E., J.G. Bennett, R.B. King, D.M. Lang, and R.M. Lawton. 1975. Land Resources ofthe Northern and Luapula Provinces, Zambia: A Reconnaissance Assessment. Volume 1,Introduction, Conclusions and Recommendations. Land Resource Study, no. 19. Surrey,England: Land Resources Division, Ministry of Overseas Development.
Mansfield, J.E., J.G. Bennett, R.B. King, D.M. Lang, and R.M. Lawton. 1975. Land Resources ofthe Northern and Luapula Provinces, Zambia: A Reconnaissance Assessment. Volume 4, TheBiophysical Environment. Land Resource Study, no. 19. Surrey, England: Land ResourcesDivision, Ministry of Overseas Development.
Marter, Alan, and David Honeybone. 1976. The Economic Resources of Rural Households and theDistribution of Agricultural Development. Lusaka: University of Zambia, Rural DevelopmentStudies Bureau.
Mbulo, M.P. 1983. "Some Issues in the Development of Settlement Schemes in the SouthernProvinces."
Migot-Adholla, S.E., F. Place, S. Atsu, and G. Benneh. 1990. "Land, Security of Tenure andProductivity in Ghana." Paper prepared for Conference on Rural Land Tenure, Credit, andAgricultural Investment and Farm Productivity in sub-Saharan Africa. Washington, D.C.:World Bank.
Migot-Adholla, S.E. et al. 1991. "Indigenous Land Rights Systems in sub-Saharan Africa: AConstraint on Productivity?" World Bank Economic Review 5: 155-175.

262
Moreithi, F.I.H. 1984. Zambia Agricultural Rehabilitation Project. Washington, D.C.: World Bank.
Mpenda, W.C., P. Jaboni, and H. Mtonga. 1983. "Agricultural Settlement Schemes in Zambia."
Mrak, Mojmir. 1989. "Role of the Informal Financial Sector in the Mobilization and Allocation ofHousehold Savings: The Case of Zambia." Savings and Development, vol. 13, no. 1,pp. 65-85.
Mudenda, Timothy. 1981. A Socio-Economic Study of Rural Households in Chief Kopa, MpikaDistrict. Lusaka: University of Zambia, Rural Development Studies Bureau.
Muller, Maria S. 1988. "The Improvement of Chawama, a Squatter Settlement in Lusaka, Zambia."Slum and Squatter Settlements in sub-Saharan Africa. New York: Praeger.
Mulongo, Absalom Hanka. 1981. "Land Use Conflicts on Lochinvar National Park: An Example ofContradictions in Environmental Policy, 1950-75." Zambia Journal of History, no. 1,pp. 61-74.
Munachonga, Monica L. 1989. "Women and Development in Zambia." In Women and Developmentin Africa. Lanham: University Press of America.
Munachonga, Monica L. 1989. "Women and the State: Zambia's Development Policies and theirImpact on Women." In Women and the State in Africa. Boulder, Colo.: L. RiennerPublishers.
Muntemba, M. Shimwaayi. 1984. "Dispossession and Counterstrategies in Zambia, 1930-1970."Development: Seeds of Change, Village through Global Order, no. 4, pp. 15-17.
Musgrave, Richard A. 1960. The Economic Analysis of Taxation. Cambridge, Mass.: HarvardUniversity Press.
Mutamba, S. 1982. "Women as Food Producers and Suppliers in the Twentieth Century: The Caseof Zambia." Development Dialogue, 1-2.
Mvunga, Mphanza P. 1979. Law and Social Change: A Case Study in the Customary Law ofInheritance in Zambia. Manchester: Manchester University Press.
Mwanakatwe, John M. 1990. "Reflections on Long-Term Perspectives for sub-Saharan Africa withParticular Reference to Zambia." In The Long-Term Perspective Study of sub-Saharan Africa.Washington, D.C.: World Bank.
Mwanza, A. 1990. "The Land Tenure System and its Impact on Agricultural Development inZambia."
Mwila, Chungu. 1981. Village People and their Resources: An Observation of Some of the MajorSocio-Economic Characteristics of Rural Households in Mubanga, Chinsali District: A ReportPrepared for the Integrated Rural Development Project (I.R.D.P.), Serenje, Mpika, Chinsali.Lusaka: University of Zambia, Rural Development Studies Bureau.

263
Nagle, Sean. 1987-89. "Zambia." Rural Finance Profiles in African Countries. Milan:Finafrica-Cariplo.
Nankumba, J.S. 1994. "The Potential of Agroforestry Technologies under Customary Land Tenurein Malawi: The Case of Lilongwe District." Mimeographed. N.p.: n.p.
Ndiaye, Serigne M. 1988. "Labor Mobilization and Utilization among Small Scale Farmers in ChibaleCheifdom, Serenje, Zambia."
Ngenda, Gertrude. 1993. "Settlement Programs in Zambia."
Ogura, Mitsuo. 1991. "Rural-Urban Migration in Zambia and Migrant Ties to Home Villages."Developing Economies, vol. 29, no. 2, pp. 145-165.
ODA (Overseas Development Agency) and Zambian Ministry of Water, Lands and Natural Resources.1989. "Zambia: Land Delivery System." Prepared by Halcross and Fox Associates inassociation with Clyde Surveys Ltd. for the Overseas Development Agency. London: ODA.
Palmer, Robin. N.d. "Land in Zambia." Vol. 1, "Zambian Land and Labour Studies." OccasionalPaper, no. 2. Lusaka: National Archives.
Pausewang, Siegfried. 1987. Who Is the Peasant? / Experience with Rural Development in Zambia.Bergen, Norway: Chr. Michelsen Institute, Development Research and Action Programme.
Place, Frank, and Charles Twinomukunzi. 1993. "The Land Tenure Conference: Highlights,Assessments, and Implications for an Action Plan." Madison: Land Tenure Center, Universityof Wisconsin.
Platteau, Jean-Phillipe. 1992. "Land Reform and Structural Adjustment in Sub-Saharan Africa:Controversies and Guidelines." FAO Economic and Social Paper 107. Rome: Food andAgriculture Organization.
Pottier, Johan. 1984. Aspects of Agricultural Intensification: A Case Study from Zambia's NorthernProvince. Los Angeles: African Studies Association.
Pottier, Johan. 1986. "Village Responses to Food Marketing Alternatives in Northern Zambia: TheCase of the Mambwe Economy." IDS Bulletin, vol. 17, no. 1, pp. 51-56.
Pottier, Johan. 1988. Migrants No More: Settlement and Survival in Mambwe Villages, Zambia.Bloomington: Indiana University Press.
Rakodi, Carole. 1986. "Housing and Urban Development in Lusaka: An Evaluation of SquatterUpgrading in Chawana."
Rakodi, Carole. 1988. Urban Agriculture: Research Questions and Zambian Evidence. London:Cambridge University Press.

264
Ray, Donald I. 1977a. "Chifwile Settlement Scheme: Expanding the Frontier of ZambianAgriculture. " N.p.: n.p.
Ray, Don I. 1977b. "Structure and Impact of Zambian Settlement Scheme Policy: Bureaucratic ClassFormation." N.p.: n.p.
Rhodes, Lawrence. 1990. "Improvement Levies," in Richard Bird and Oliver Oldman, Readings onTaxation in Developing Countries. Cambridge, Massachussetts: Harvard University Press.
Roelofs, Karin P. 1988. Women and Food Production in Zambia. Lusaka, Zambia: InternationalLabour Office, World Employment Programme, Southern African Team for EmploymentPromotion (SATEP).
Roth, M., J. Unruh, and R. Barrows. 1992. "Land Title, Tenure Security, Credit Use and Investmentin the Shabelle Region of Somalia." Research paper. Madison: Land Tenure Center,University of Wisconsin.
Roth, M., J. Cochrane, and M. Kisamba-Mugerwa. 1993. Tenure Security, Credit Use and FarmInvestment in the Rujumbura Pilot Land Registration Scheme, Rukungiri District, Uganda.LTC Research Paper, no. 112. Madison: Land Tenure Center, University of Wisconsin.
Safilios-Rothschild, Constantina. 1985. The Policy Implications of the Roles of Women in Agriculturein Zambia. Lusaka: National Commission for Development Planning, Ministry of Agricultureand Water Development, Republic of Zambia.
Sakala, R. 1975. "Zambia National Service Faces Agricultural Test: How the Zambian NationalService Is Organized and What the Government Expects in the Rural Areas." AfricaDevelopment, November.
Schultz, Jurgen. 1976. Land Use in Zambia - Part I: The Basically Traditional Land Use Systems andtheir Regions. Ifo-Institute fur Wirtschaftsforschung Munchen Abteilung EntwicklungslanderAfrikastudienstelle. Munich: Weltforum Verlag.
Scott, Chris. 1990. "Assessment of the Impact of the Assistance Given by the US Bureau of theCensus to the Zambian Central Statistical Office under the ZATPID I & II Projects fromDecember 1984 through March 1990." Report for USAID based on a visit to Lusaka, 5-18March 1990. Unpublished.
Siamwiza, Robie. 1986. Consequences of Rural Poverty in Relation to the Urban Squatter Problemin Lusaka. Harare, Zimbabwe: School of Social Work.
Stolen, Kristi Anne. 1983. Peasants and Agricultural Change in Northern Zambia: Report. As:Department of Agricultural Economics, Agricultural University of Norway.
Strasma, John. 1966. "Compensation to former landowners in agrarian reforms around the world."In Secretary-General's Fourth Report on Progress in Land Reform. N.Y.: United Nations.

265
Strasma, John. 1990. A Report to USAID on the Debt Situation of Land Reform Beneficiaries in ElSalvador, 1990, with Policy Alternatives Addressing New Tenure Forms Available toBeneficiaries and the Privatization of the Banking System. San Salvador: USAID.
Strasma, John. 1992. Making Land Banks Viable: 71vo Successful Methods of Ensuring Repayment ofLoans Made to Small Farmers in Developing Countries. Madison, WI: Department ofAgricultural Economics Staff Papers no. 343.
Strasma, John, James Alm, Eric Shearer, and Alfred Waldstein. 1987. Taxation of Agriculture inDeveloping Countries. Burlington, VT: Associates for Rural Development, Report toUSAID/PPC.
Strasma, John, Daniel Meza, and Rafael Umafa. 1993. El Fondo National de Tierras (The NationalLand Fund). Tegucigalpa: USAID.
Stromgaard, Peter. 1990. "Peasant Household Economy in Rural Zambia: The Dilemma ofSmall-Scale Farmers in Transition." Helsinki.
Sutherland, Alistair J. 1988. "The Gender Factor and Technology Options for Zambia's SubsistenceFarming System." In Gender Issues in Farming Systems Research and Extension. Boulder,Colo.: Westview Press.
Swedish University of Agriculture, Forestry and Verterinary Medicine, International RuralDevelopment Division. 1976. "Zambia Sector Study, Preliminary Report." Uppsala, Sweden.
Thomas, Scott, and Wesley Weidemann. 1988. "The Impact of Zambia's Economic Policy ReformProgramme in the Agricultural Sector." Development Policy Review, vol. 6, no. 1, pp. 51-72.
Tiberondwa, A.K. 1976. "Back to the Land Campaign: Zambia's Goals and Problems."
USAID (United States Agency for International Development). N.d. Report from mission onagro-ecological zones in Zambia. Mimeographed. Washington, D.C.
Van Donge, Jan Kees. 1984. "Rural-Urban Migration and the Rural Alternative in Mwase Lundazi,Eastern Province, Zambia." African Studies Review, vol. 27, no. 1, pp. 83-96.
Weidemann, Wesley, Orest Koropecky, and E. Scott Thomas. 1987. Zambian Agricultural SectorPolicy Impact Assessment. Washington, D.C.: Robert R. Nathan Associates; DevelopmentAlternatives; Bureau for Africa, Office of Development Planning, Agency for InternationalDevelopment.
Wood, Adrian Paul et al. 1990. The Dynamics of Agricultural Policy and Reform in Zambia. Ames:Iowa State University Press.
Woods, J.P. 1976. The History of Commercial Farm in the Peri-Urban Fringe of Lusaka: WaterfallFarm. Lusaka: Zambia Geographical Association.
World Bank. 1993a. "Economic Report for Zambia CG Meeting." Draft.
266
World Bank. 1993b. "Zambia: Prospects for Sustainable and Equitable Growth." Report No. 11570-ZA, Country Operations Division, Southern Africa Department. August 23, 1993.
World Bank. N.d. "Zambia Agricultural and Rural Sector Survey." Annex 11, "Land Tenure andRural Development." Washington, D.C.: World Bank.
Young, Kate, and Alison Evans. 1989. A Report to ODA 's Economic and Social Research Committeefor Overseas Research on Gender Issues in Household Labour Allocation: The Transformationof a Fanning System in Northern Province, Zambia. London: Overseas DevelopmentAdministration.
"Zambia." 1993. Courier, no. 138, pp. 31-54.
Zambia. 1967. Report of the Land Commission. Lusaka: Republic of Zambia.
Zambia. 1983. "Food Strategy Study." Draft. Lusaka: Republic of Zambia, Ministry of Agricultureand Water Development Planning Unit.
Zambia. 1985. Farming System and Family Economy in Ndunya, Chinsali District. Mpika: Republicof Zambia, Integrated Rural Development Project, Serenje-Mpika-Chinsali.
Zambia. 1992. "New Economic Recovery Programme, Economic and Financial Policy Framework,1992-1993."
Zambia. 1993. "National Conference on Land Policy and Assistance from the Donor Community inthe Implementation of Proposed Projects."
Zambia. Central Statistics Office. V.d. Agricultural and Pastoral Production (Commercial Farms)Series. Lusaka.
Zambia. Central Statistics Office. V.d. Agricultural and Pastoral Production (Noc-Commercial Sector)Series. Lusaka.
Zambia. Commission of Inquiry into Land Matters in the Southern Province. 1985. A Report of theCommission of Inquiry into Land Matters in the Southern Province, 25th June, 1982. Lusaka:Government Printer.
Zambia. Commission of Inquiry into Land Matters in the Southern Province. 1985. Summary of theReport of the Commission of Inquiry into Land Matters in the Southern Province. Lusaka:Government Printer.
Zambia. Department of Agriculture. 1978. "Notes on Farm Subdivisions." Department circular, 21March.
Zambia. Department of Community Development. 1964. Annual Report. Lusaka: Government Printer.
Zambia. Land Commission. 1967. Report of Land Commission. Lusaka: Republic of Zambia.

267
Zambia. Law Development Commission. 1981. Report on the Lazul (Conversion of Titles) Act no. 20of 1975. Lusaka: Government Printer.
Zambia. Law Development Commission. 1982. Report on the Law of Succession. Lusaka: TheCommission.
Zambia. Ministry of Agriculture, Food and Fisheries. 1993. "Assessment of Potential Land forExpanding Agricultural Production in Zambia."
Zambia. Ministry of Agriculture, Food and Fisheries. V.d. Quarterly Agricultural Statistical BulletinSeries. Lusaka: MAFF.
Zambia. Ministry of Agriculture, Food and Fisheries. V.d. Annual Agricultural Statistical BulletinSeries. Lusaka: MAFF.
Zambia. Ministry of Agriculture, Food and Fisheries. V.d. Crop forecast series. Lusaka: MAFF.
Zambia. Ministry of Lands and Natural Resources. 1970. Annual Report of the Survey Departmentfor the Year 1%9. Lusaka: Ministry of Lands and Natural Resources, Republic of Zambia.
Zambia. Ministry of Lands and Natural Resources. 1971. Annual Report of the Survey Departmentfor the Year 1970. Lusaka: Ministry of Lands and Natural Resources, Republic of Zambia.
Zambia. Ministry of Lands and Natural Resources. 1973. Annual Report of the Survey Departmentfor the Year 1971. Lusaka: Ministry of Lands and Natural Resources, Republic of Zambia.
Zambia. Ministry of Lands and Natural Resources. 1974. Annual Report of the Survey Departmentfor the Year 1972. Lusaka: Ministry of Lands and Natural Resources, Republic of Zambia.
Zambia. Ministry of Lands and Natural Resources. 1985. "Procedure on Land Alienation."
Zambia. Ministry of Lands and Natural Resources. 1987. "Ministerial Statement in Parliament on 4thAugust, 1987 on Land Alienation in Reserves and Trust Lards."
Zambia. Ministry of Legal Affairs. Law Development Commission. n.d. Annual Report for the Year.Lusaka: The Commission.
Zambia National Farmers' Union. 1991. "Review of Agriculture Land Tenure and Legislation."Mimeograph.
Zambia. Survey Department. 1964. Annual Report. Lusaka.
Zegge, B.K. 1984. Zambia, Policy Options and Strategies for Agricultural Growth. Washington,D.C.: World Bank, Eastern Africa Projects Department, Southern Agriculture Division.