Long-term change in mussel (Mytilus californianus Conrad) populations along the wave-exposed coast...
9
RESEARCH ARTICLE Jayson R. Smith Peggy Fong Richard F. Ambrose Long-term change in mussel (Mytilus californianus Conrad) populations along the wave-exposed coast of southern California Received: 13 April 2005 / Accepted: 23 November 2005 / Published online: 28 January 2006 ȑ Springer-Verlag 2006 Abstract Mussel (Mytilus californianus) populations were studied throughout California to determine chan- ges over the past few decades, and, in particular, to determine if declines reported for southern California have occurred outside of the region. We compared mussel cover, biomass, and bed thickness reported in historic studies in the mid-1970s to 1980s with mea- surements made in 2002. Mussel cover and biomass in southern California declined markedly over the past few decades with a mean cover loss of 31.2% (40.2% loss) and biomass loss of 25.1 kg m 2 (51.3% loss). Changes in mussel bed thickness were not as strong as cover and biomass, but also appeared to decline over time. Declines were limited to the southern California region, since mussel cover, biomass, and bed thickness remained unchanged or increased at sites in central and northern California. Causes for mussel declines in southern Cal- ifornia are unknown, but may include human visitation, increased sea surface temperatures, and pollution. Introduction Rocky intertidal communities along wave-exposed coasts are highly dynamic and susceptible to both short- term and long-term change. Mussel beds (mostly Myti- lus californianus Conrad, 1837) dominate the wave- exposed coastline in the eastern north Pacific Ocean from Alaska to Baja California (Ricketts et al. 1985) and are an ecologically important community within the intertidal zone harboring a high diversity of species with historic measures of over 300 bed-associated species at a location (Suchanek 1992) and over 750 species within a geographic regions (i.e. southern California; Kanter 1980). Since mussels are filter feeders that consume large amounts of plankton and detritus, they serve an important function as an energy link, providing sec- ondary production for a wide number of predators. Mussel beds are subjected to short-term changes when mechanical disturbance tears large portions of mussels from the rock (Paine and Levin 1981). Newly created space within mussel beds are often repopulated by sur- rounding mussels or by new recruits (Paine 1974, 1984; Paine and Levin 1981). Well-known studies of mussel beds on the northern portion of the Pacific coast of the United States suggest that, although short-term changes may occur, over the long-term, distributional bound- aries of these communities are relatively stable (Paine 1974; Paine and Levin 1981). Recent observations in the Southern California Bight (SBC) suggest that beds in this region have not been stable over the past few decades (Robles 1996). Anec- dotal observations of researchers working in the area suggest that thick, multi-layered, contiguous mussel beds have become single layered beds with frequent patches of bare rock or encrusting algae (Robles 1996). Long-term monitoring studies of fixed photoplots established in mussel beds in the SCB have also revealed decreases in mussel percent cover (Raimondi et al. 1999; Engle and Davis 2000a, b; Richards and Lerma 2000; R. F. Ambrose et al., unpublished data). Marked declines (>20%) were observed at nine of 15 mainland sites and seven of 23 sites on the Channel Islands for ongoing monitoring studies initiated between 1982 and 1997. However, two of eight sites in central California, with initiation of study in either 1992 or 1995, also exhibited Communicated by P.W. Sammarco, Chauvin J. R. Smith (&) P. Fong Department of Ecology and Evolutionary Biology, University of California Los Angeles, 621 Charles E. Young Dr., South, Los Angeles, CA 90095-1606, USA E-mail: [email protected] R. F. Ambrose Department of Environmental Health Sciences, University of California Los Angeles, 951772, Los Angeles, CA 90095-1772, USA Present address:J. R. Smith Department of Biological Science, California State University, Fullerton, 6850, Fullerton, CA 92834-6850, USA Marine Biology (2006) 149: 537–545 DOI 10.1007/s00227-005-0223-y
-
Upload
independent -
Category
Documents
-
view
3 -
download
0
Transcript of Long-term change in mussel (Mytilus californianus Conrad) populations along the wave-exposed coast...
RESEARCH ARTICLE
Jayson R. Smith Æ Peggy Fong Æ Richard F. Ambrose
Long-term change in mussel (Mytilus californianus Conrad) populationsalong the wave-exposed coast of southern California
Received: 13 April 2005 / Accepted: 23 November 2005 / Published online: 28 January 2006� Springer-Verlag 2006
Abstract Mussel (Mytilus californianus) populationswere studied throughout California to determine chan-ges over the past few decades, and, in particular, todetermine if declines reported for southern Californiahave occurred outside of the region. We comparedmussel cover, biomass, and bed thickness reported inhistoric studies in the mid-1970s to 1980s with mea-surements made in 2002. Mussel cover and biomass insouthern California declined markedly over the past fewdecades with a mean cover loss of 31.2% (40.2% loss)and biomass loss of 25.1 kg m�2 (51.3% loss). Changesin mussel bed thickness were not as strong as cover andbiomass, but also appeared to decline over time.Declines were limited to the southern California region,since mussel cover, biomass, and bed thickness remainedunchanged or increased at sites in central and northernCalifornia. Causes for mussel declines in southern Cal-ifornia are unknown, but may include human visitation,increased sea surface temperatures, and pollution.
Introduction
Rocky intertidal communities along wave-exposedcoasts are highly dynamic and susceptible to both short-
term and long-term change. Mussel beds (mostly Myti-lus californianus Conrad, 1837) dominate the wave-exposed coastline in the eastern north Pacific Oceanfrom Alaska to Baja California (Ricketts et al. 1985) andare an ecologically important community within theintertidal zone harboring a high diversity of species withhistoric measures of over 300 bed-associated species at alocation (Suchanek 1992) and over 750 species within ageographic regions (i.e. southern California; Kanter1980). Since mussels are filter feeders that consume largeamounts of plankton and detritus, they serve animportant function as an energy link, providing sec-ondary production for a wide number of predators.Mussel beds are subjected to short-term changes whenmechanical disturbance tears large portions of musselsfrom the rock (Paine and Levin 1981). Newly createdspace within mussel beds are often repopulated by sur-rounding mussels or by new recruits (Paine 1974, 1984;Paine and Levin 1981). Well-known studies of musselbeds on the northern portion of the Pacific coast of theUnited States suggest that, although short-term changesmay occur, over the long-term, distributional bound-aries of these communities are relatively stable (Paine1974; Paine and Levin 1981).
Recent observations in the Southern California Bight(SBC) suggest that beds in this region have not beenstable over the past few decades (Robles 1996). Anec-dotal observations of researchers working in the areasuggest that thick, multi-layered, contiguous musselbeds have become single layered beds with frequentpatches of bare rock or encrusting algae (Robles 1996).Long-term monitoring studies of fixed photoplotsestablished in mussel beds in the SCB have also revealeddecreases in mussel percent cover (Raimondi et al. 1999;Engle and Davis 2000a, b; Richards and Lerma 2000; R.F. Ambrose et al., unpublished data). Marked declines(>20%) were observed at nine of 15 mainland sites andseven of 23 sites on the Channel Islands for ongoingmonitoring studies initiated between 1982 and 1997.However, two of eight sites in central California, withinitiation of study in either 1992 or 1995, also exhibited
Communicated by P.W. Sammarco, Chauvin
J. R. Smith (&) Æ P. FongDepartment of Ecology and Evolutionary Biology,University of California Los Angeles, 621 Charles E. Young Dr.,South, Los Angeles, CA 90095-1606, USAE-mail: [email protected]
R. F. AmbroseDepartment of Environmental Health Sciences,University of California Los Angeles, 951772,Los Angeles, CA 90095-1772, USA
Present address:J. R. SmithDepartment of Biological Science, California State University,Fullerton, 6850, Fullerton, CA 92834-6850, USA
Marine Biology (2006) 149: 537–545DOI 10.1007/s00227-005-0223-y
decreases in mussel cover, suggesting that declines mayalso be occurring outside of the SBC.
The goal of this study was to document changes inmussel populations over the past few decades across abroad geographic scale. We wanted to test quantitativelythe anecdotal observations suggesting declines insouthern California and determine if changes in musselpopulations occurred across the entire California coast.The historical data were compiled from a series ofstudies conducted in the mid-1970s to 1980s (Acker-mann 1971; Kanter 1977, 1978; Straughan and Kanter1977; Straughan 1978; Kinnetics 1986; Lohse 1990;Kinnetics, unpublished data). We compared musselcover, biomass, and bed thickness measured at severalsites in southern California in 2002 to historical datafrom the same sites. We compared mussel populationmeasures along the entire California coast to determineif mussel changes have occurred outside of southernCalifornia. This study has significant implications aslosses of these ecologically important microhabitats canhave dramatic consequences on the flora and fauna ofthe rocky intertidal zone, in particular on the diversity ofspecies living within the bed.
Methods
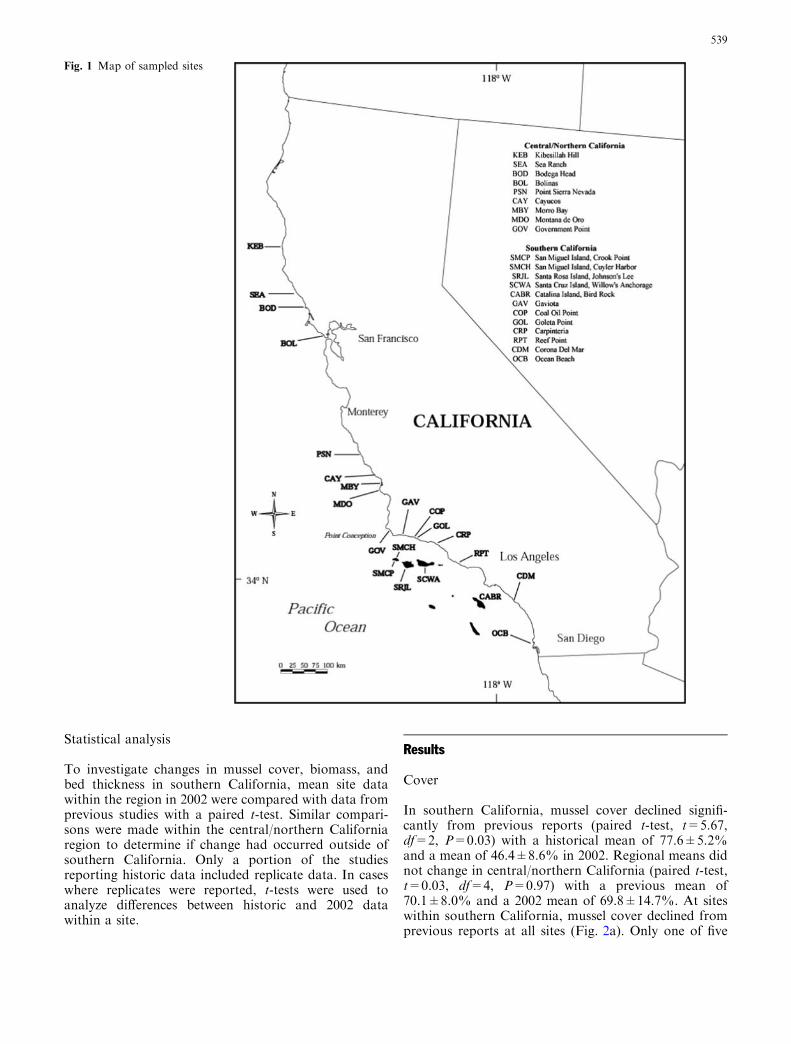
At 21 locations along the California coast (Fig. 1),mussel population measures were taken for comparisonswith studies conducted in the mid-1970s to 1980s.Mussel cover was measured and compared to historicdata at eight sites, mussel biomass was compared tohistoric data at six sites, and mussel bed thicknesscomparisons were made at fourteen sites (Table 1). Themussel bed sites were relocated to the best of our abilitybased on descriptions in previous reports which variedgreatly in the level of detail. Although the exact plotswere not relocated, we feel confident that the same areaof shoreline was sampled. Site descriptions, locations,and photographs of sampled sites during 2002 arearchived in Smith (2005).
To measure mussel cover, twenty 0.5·0.7 m quadratswere randomly placed inside the boundaries of musselbeds, avoiding the upper and lower boundaries tostandardize among sites and to avoid edge effects.Mussel cover was estimated using a point interceptmethod; mussel presence was recorded beneath 100uniformly distributed points on a grid in each quadrat.Up to 25 additional quadrats were randomly placed andcover recorded depending on the size of the mussel bedand availability of sampling time. Mussel cover wasmeasured within quadrats similar to methods used inone of two studies reporting historic cover (Kinnetics1984). The remaining study reporting historic musselcover (Lohse 1990) used a line-intercept method tomeasure cover. Although methods differed slightly, wefeel that data are comparable because both historic andcurrent measures of mussel cover within a bed are used
as an estimate of cover for the entire bed. We chose tokeep the methods the same across all sites so that sam-pled sites in 2002 could be readily compared among oneanother (Smith 2005).
Change in mussel cover indicates whether musselbeds have become less contiguous and patchier withfrequent open areas of bare rock or non-mussel cover.However, cover may not be sensitive to change in musselabundance due to problems associated with a layeredcommunity (Ambrose et al. 1995). For example, a loss ofseveral top layers of mussels in multi-layered beds maynot result in a change in percent cover though abun-dances and biomass may have declined severely. Datadocumenting decreases in biomass and bed thickness aremore sensitive in detecting change in layering than per-cent cover data.
Mussel biomass and mussel bed thickness weremeasured in five of ten randomly chosen 0.5·0.7 mquadrats with the highest mussel cover to ensure thatsubsequent mussel population measures were takenwithin the mussel bed instead of within gaps. To facil-itate comparison with historic data, methods werebased on previous studies that were concentrated inareas of high mussel cover. Although areas of highmussel cover were specifically targeted by previousstudies, they also were believed to be representative ofthe whole mussel bed at that time (R. Kanter and D.Straughan, personal communication). At six sites, weharvested a 300 cm2 plot directly in the center of eachof the five quadrats and measured mussel biomass (wetweight of shell and tissue). Before measurements ofbiomass, all organisms attached to the shell of themussel were removed and any excess water within theshell drained. At four of the six sites, methodology usedto measure biomass was based on studies reportinghistoric data (Straughan and Kanter 1977). At two sites,the methodology differed; Kinnetics (unpublished data)measured biomass at Kibesillah Hill in 0.0625 m2
quadrats while Ackermann (1971) measured biomass atBodega Head in 0.01 and 0.05 m2 quadrats andreported data in dry weight. Data were converted tobiomass per square meter to ensure comparability. Tofacilitate comparison with previous data at BodegaHead, dry weights of mussel tissue were obtained byplacing tissue in a 60�C oven for 24 h. To simplify andfacilitate graphical presentation comparable with theother sites, the dry weight to wet weight ratio was cal-culated from 2002 data (R2=0.992, P<0.001) so thatdry weights from historical data could be transformedinto wet weights.
To measure bed thickness, twenty grid points withineach of the five chosen quadrats were haphazardlychosen and thickness measured using a steel pinpushed through the bed until it reached the understoryrock. Measures of bed thickness were conducted in thesame manner as methodology of past studies (Kanter1977, 1978; Straughan and Kanter 1977; Straughan1978).
538
Statistical analysis
To investigate changes in mussel cover, biomass, andbed thickness in southern California, mean site datawithin the region in 2002 were compared with data fromprevious studies with a paired t-test. Similar compari-sons were made within the central/northern Californiaregion to determine if change had occurred outside ofsouthern California. Only a portion of the studiesreporting historic data included replicate data. In caseswhere replicates were reported, t-tests were used toanalyze differences between historic and 2002 datawithin a site.
Results
Cover
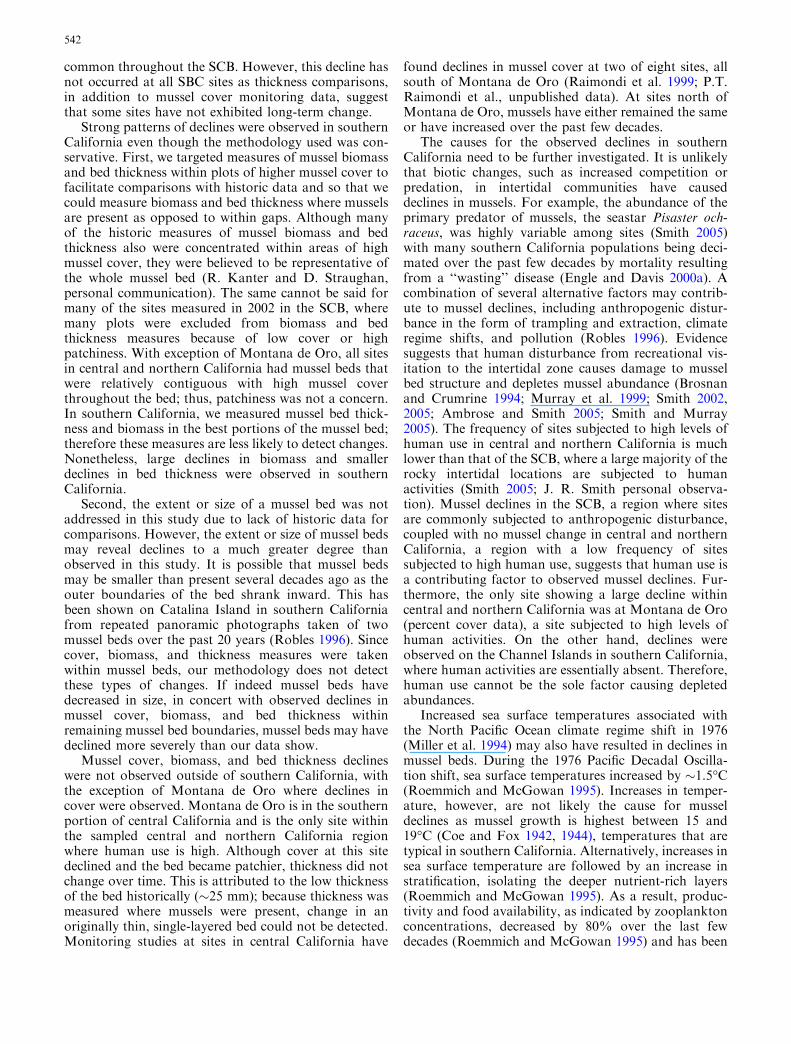
In southern California, mussel cover declined signifi-cantly from previous reports (paired t-test, t=5.67,df=2, P=0.03) with a historical mean of 77.6±5.2%and a mean of 46.4±8.6% in 2002. Regional means didnot change in central/northern California (paired t-test,t=0.03, df=4, P=0.97) with a previous mean of70.1±8.0% and a 2002 mean of 69.8±14.7%. At siteswithin southern California, mussel cover declined fromprevious reports at all sites (Fig. 2a). Only one of five
Fig. 1 Map of sampled sites
539
sites within central/northern California declined(Fig. 2b); cover increased or remained the same at theremaining four sites. Replication was not reported inprevious studies, so statistical analyses within a sitecould not be performed.
Biomass
Mussel biomass (wet weight; kg m�2) declined signifi-cantly in southern California, with biomass in 2002(23.8±3.8 kg m�2) less than half that reported in pre-vious studies (48.9±8.3 kg m�2; paired t-test, t=3.07,df=3, P=0.05). In central/northern California, biomasswas similar in 2002 (89.1±27.1 kg m�2) to that of his-toric data (61.1±9.6 kg m�2; paired t-test, t=1.6, df=1,P=0.36). Within southern California, biomass declinedsignificantly at two mainland and one Channel Islandsite (Fig. 2c; t-test, Ocean Beach t=4.73, df=8,P=0.001; Coal Oil Point t=3.24, df= 6, P=0.018; SanMiguel Island, Crook Point t=3.58, df=8, P=0.007).Although not significant (t-test, t=1.98, df=8,P=0.083), mean biomass at the remaining site withinsouthern California (Santa Cruz Island, Willow’sAnchorage) was ranked lower in 2002 than in the past(Fig. 2c). Biomass measures at sites within central/northern California ranked higher in biomass in 2002(Fig. 2d) but were not significantly different from
previous data (t-test, Bodega Head t=1.95, df=9,P=0.083; Kibesillah Hill t=1.80, df=15, P=0.092).
Bed thickness
Mussel bed thickness in southern California rankedlower in 2002 (59.9±5.9 mm) than that reported in thepast (68.1±3.6 mm) but was not significantly different(paired t-test, t=1.96, df=9, P=0.08). Bed thickness incentral/northern California ranked higher in 2002 with amean of 63.4±16.0 and a historic mean of 51.4±8.0 butwas not significantly different (paired t-test, t=1.2,df=3, P=0.33). Within southern California, mussel bedthickness declined at six of ten sites, including two siteswith declines >30 mm (Fig. 2e). Because of lack ofreplication in previous studies, only three sites could beanalyzed statistically. Goleta Point exhibited significantdeclines in bed thickness in 2002 as compared to historicdata (Goleta Point t-test, t=3.96, df=9, P=0.003); atReef Point and Carpinteria, bed thickness was similar tothat of historic data (t-test, Reef Point t=0.04, df=12,P=0.97; Carpinteria t=0.61, df=12, P=0.55). At siteswithin central/northern California, bed thicknessremained the same or ranked higher in 2002 comparedto historic data. Replication was reported at three offour sites. Statistical analysis revealed that bed thicknessremained the same at two sites (t-test, Montana de Oro
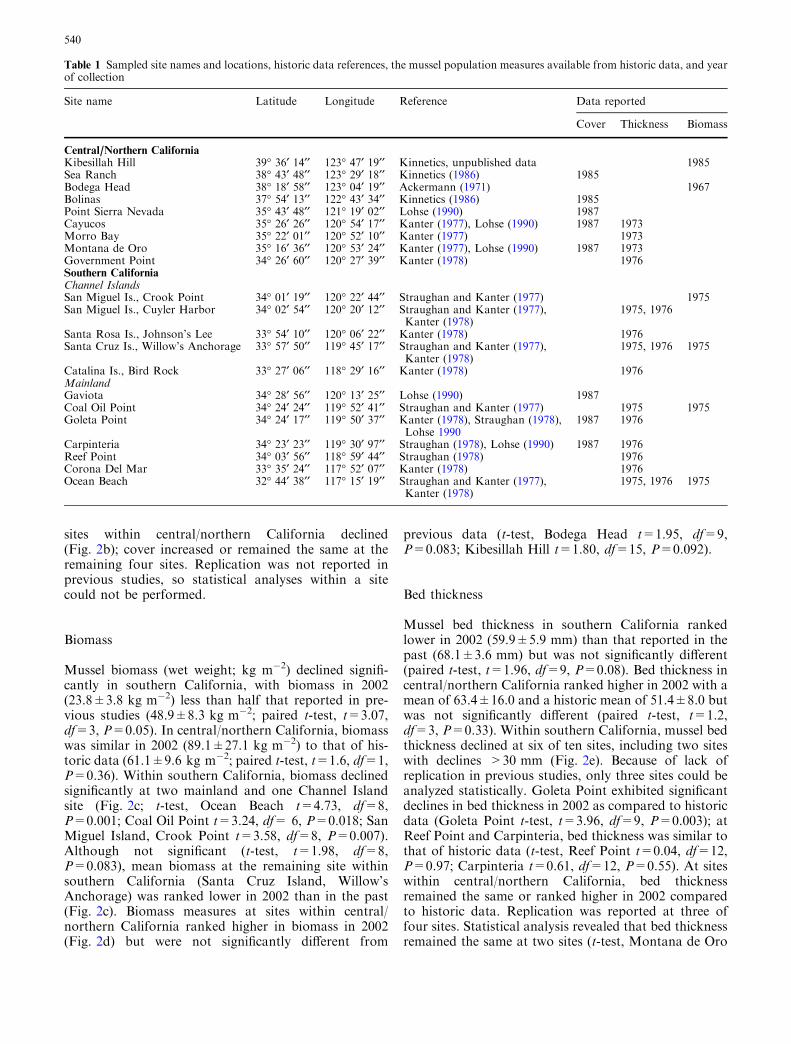
Table 1 Sampled site names and locations, historic data references, the mussel population measures available from historic data, and yearof collection
Site name Latitude Longitude Reference Data reported
Cover Thickness Biomass
Central/Northern CaliforniaKibesillah Hill 39� 36¢ 14¢¢ 123� 47¢ 19¢¢ Kinnetics, unpublished data 1985Sea Ranch 38� 43¢ 48¢¢ 123� 29¢ 18¢¢ Kinnetics (1986) 1985Bodega Head 38� 18¢ 58¢¢ 123� 04¢ 19¢¢ Ackermann (1971) 1967Bolinas 37� 54¢ 13¢¢ 122� 43¢ 34¢¢ Kinnetics (1986) 1985Point Sierra Nevada 35� 43¢ 48¢¢ 121� 19¢ 02¢¢ Lohse (1990) 1987Cayucos 35� 26¢ 26¢¢ 120� 54¢ 17¢¢ Kanter (1977), Lohse (1990) 1987 1973Morro Bay 35� 22¢ 01¢¢ 120� 52¢ 10¢¢ Kanter (1977) 1973Montana de Oro 35� 16¢ 36¢¢ 120� 53¢ 24¢¢ Kanter (1977), Lohse (1990) 1987 1973Government Point 34� 26¢ 60¢¢ 120� 27¢ 39¢¢ Kanter (1978) 1976Southern CaliforniaChannel IslandsSan Miguel Is., Crook Point 34� 01¢ 19¢¢ 120� 22¢ 44¢¢ Straughan and Kanter (1977) 1975San Miguel Is., Cuyler Harbor 34� 02¢ 54¢¢ 120� 20¢ 12¢¢ Straughan and Kanter (1977),
Kanter (1978)1975, 1976
Santa Rosa Is., Johnson’s Lee 33� 54¢ 10¢¢ 120� 06¢ 22¢¢ Kanter (1978) 1976Santa Cruz Is., Willow’s Anchorage 33� 57¢ 50¢¢ 119� 45¢ 17¢¢ Straughan and Kanter (1977),
Kanter (1978)1975, 1976 1975
Catalina Is., Bird Rock 33� 27¢ 06¢¢ 118� 29¢ 16¢¢ Kanter (1978) 1976MainlandGaviota 34� 28¢ 56¢¢ 120� 13¢ 25¢¢ Lohse (1990) 1987Coal Oil Point 34� 24¢ 24¢¢ 119� 52¢ 41¢¢ Straughan and Kanter (1977) 1975 1975Goleta Point 34� 24¢ 17¢¢ 119� 50¢ 37¢¢ Kanter (1978), Straughan (1978),
Lohse 19901987 1976
Carpinteria 34� 23¢ 23¢¢ 119� 30¢ 97¢¢ Straughan (1978), Lohse (1990) 1987 1976Reef Point 34� 03¢ 56¢¢ 118� 59¢ 44¢¢ Straughan (1978) 1976Corona Del Mar 33� 35¢ 24¢¢ 117� 52¢ 07¢¢ Kanter (1978) 1976Ocean Beach 32� 44¢ 38¢¢ 117� 15¢ 19¢¢ Straughan and Kanter (1977),
Kanter (1978)1975, 1976 1975
540
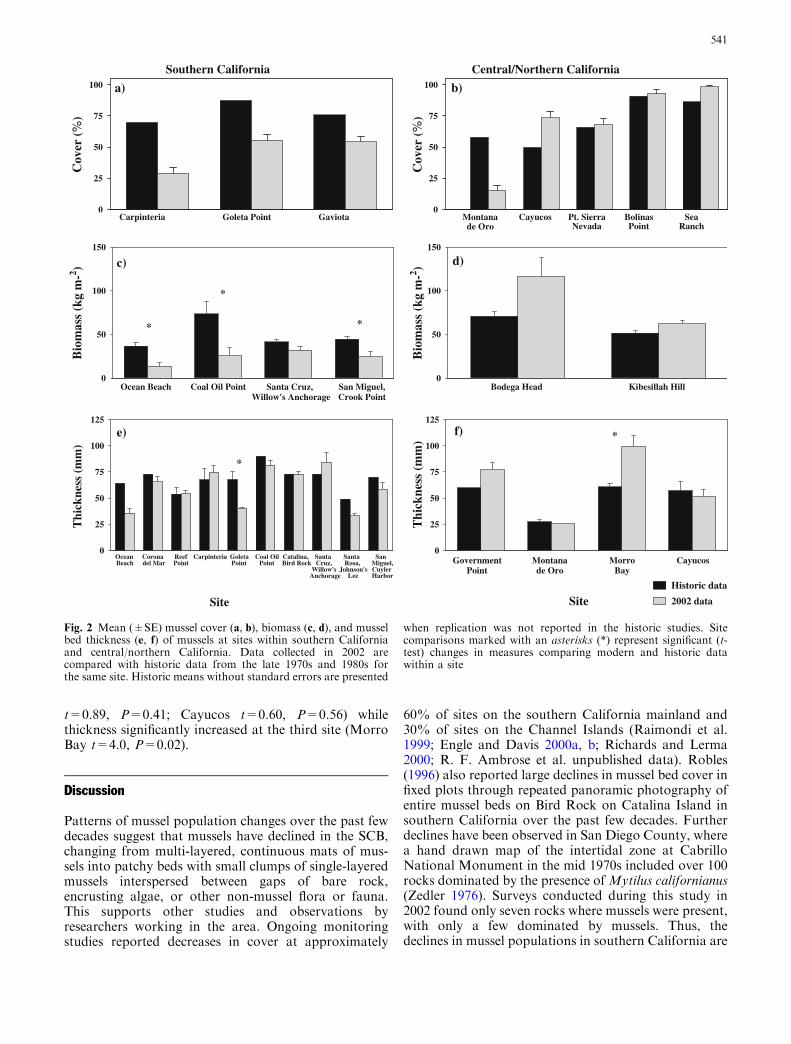
t=0.89, P=0.41; Cayucos t=0.60, P=0.56) whilethickness significantly increased at the third site (MorroBay t=4.0, P=0.02).
Discussion
Patterns of mussel population changes over the past fewdecades suggest that mussels have declined in the SCB,changing from multi-layered, continuous mats of mus-sels into patchy beds with small clumps of single-layeredmussels interspersed between gaps of bare rock,encrusting algae, or other non-mussel flora or fauna.This supports other studies and observations byresearchers working in the area. Ongoing monitoringstudies reported decreases in cover at approximately
60% of sites on the southern California mainland and30% of sites on the Channel Islands (Raimondi et al.1999; Engle and Davis 2000a, b; Richards and Lerma2000; R. F. Ambrose et al. unpublished data). Robles(1996) also reported large declines in mussel bed cover infixed plots through repeated panoramic photography ofentire mussel beds on Bird Rock on Catalina Island insouthern California over the past few decades. Furtherdeclines have been observed in San Diego County, wherea hand drawn map of the intertidal zone at CabrilloNational Monument in the mid 1970s included over 100rocks dominated by the presence ofMytilus californianus(Zedler 1976). Surveys conducted during this study in2002 found only seven rocks where mussels were present,with only a few dominated by mussels. Thus, thedeclines in mussel populations in southern California are
Bio
mas
s (k
g m
-2 )
0
50
100
150
Bio
mas
s (k
g m
-2 )
0
50
100
150
Cov
er (
%)
0
25
50
75
100
SeaRanch
Montanade Oro
Pt. SierraNevada
Thi
ckne
ss (
mm
)
0
25
50
75
100
125
Cayucos BolinasPoint
Montanade Oro
CayucosMorroBay
GovernmentPoint
*
Cov
er (
%)
0
25
50
75
100T
hick
ness
(m
m)
0
25
50
75
100
125
Site Site
GaviotaCarpinteria Goleta Point
OceanBeach
Corona del Mar
ReefPoint
Carpinteria GoletaPoint
Coal Oil Point
Catalina,Bird Rock
SantaCruz,
Willow'sAnchorage
SantaRosa,
Johnson's Lee
San Miguel,CuylerHarbor
Southern California Central/Northern California
*
Historic data
2002 data
a) b)
c) d)
Kibesillah HillBodega HeadOcean Beach Coal Oil Point Santa Cruz, Willow's Anchorage
San Miguel,Crook Point
*
*
*
e) f)
Fig. 2 Mean (±SE) mussel cover (a, b), biomass (c, d), and musselbed thickness (e, f) of mussels at sites within southern Californiaand central/northern California. Data collected in 2002 arecompared with historic data from the late 1970s and 1980s forthe same site. Historic means without standard errors are presented
when replication was not reported in the historic studies. Sitecomparisons marked with an asterisks (*) represent significant (t-test) changes in measures comparing modern and historic datawithin a site
541
common throughout the SCB. However, this decline hasnot occurred at all SBC sites as thickness comparisons,in addition to mussel cover monitoring data, suggestthat some sites have not exhibited long-term change.
Strong patterns of declines were observed in southernCalifornia even though the methodology used was con-servative. First, we targeted measures of mussel biomassand bed thickness within plots of higher mussel cover tofacilitate comparisons with historic data and so that wecould measure biomass and bed thickness where musselsare present as opposed to within gaps. Although manyof the historic measures of mussel biomass and bedthickness also were concentrated within areas of highmussel cover, they were believed to be representative ofthe whole mussel bed (R. Kanter and D. Straughan,personal communication). The same cannot be said formany of the sites measured in 2002 in the SCB, wheremany plots were excluded from biomass and bedthickness measures because of low cover or highpatchiness. With exception of Montana de Oro, all sitesin central and northern California had mussel beds thatwere relatively contiguous with high mussel coverthroughout the bed; thus, patchiness was not a concern.In southern California, we measured mussel bed thick-ness and biomass in the best portions of the mussel bed;therefore these measures are less likely to detect changes.Nonetheless, large declines in biomass and smallerdeclines in bed thickness were observed in southernCalifornia.
Second, the extent or size of a mussel bed was notaddressed in this study due to lack of historic data forcomparisons. However, the extent or size of mussel bedsmay reveal declines to a much greater degree thanobserved in this study. It is possible that mussel bedsmay be smaller than present several decades ago as theouter boundaries of the bed shrank inward. This hasbeen shown on Catalina Island in southern Californiafrom repeated panoramic photographs taken of twomussel beds over the past 20 years (Robles 1996). Sincecover, biomass, and thickness measures were takenwithin mussel beds, our methodology does not detectthese types of changes. If indeed mussel beds havedecreased in size, in concert with observed declines inmussel cover, biomass, and bed thickness withinremaining mussel bed boundaries, mussel beds may havedeclined more severely than our data show.
Mussel cover, biomass, and bed thickness declineswere not observed outside of southern California, withthe exception of Montana de Oro where declines incover were observed. Montana de Oro is in the southernportion of central California and is the only site withinthe sampled central and northern California regionwhere human use is high. Although cover at this sitedeclined and the bed became patchier, thickness did notchange over time. This is attributed to the low thicknessof the bed historically (�25 mm); because thickness wasmeasured where mussels were present, change in anoriginally thin, single-layered bed could not be detected.Monitoring studies at sites in central California have
found declines in mussel cover at two of eight sites, allsouth of Montana de Oro (Raimondi et al. 1999; P.T.Raimondi et al., unpublished data). At sites north ofMontana de Oro, mussels have either remained the sameor have increased over the past few decades.
The causes for the observed declines in southernCalifornia need to be further investigated. It is unlikelythat biotic changes, such as increased competition orpredation, in intertidal communities have causeddeclines in mussels. For example, the abundance of theprimary predator of mussels, the seastar Pisaster och-raceus, was highly variable among sites (Smith 2005)with many southern California populations being deci-mated over the past few decades by mortality resultingfrom a ‘‘wasting’’ disease (Engle and Davis 2000a). Acombination of several alternative factors may contrib-ute to mussel declines, including anthropogenic distur-bance in the form of trampling and extraction, climateregime shifts, and pollution (Robles 1996). Evidencesuggests that human disturbance from recreational vis-itation to the intertidal zone causes damage to musselbed structure and depletes mussel abundance (Brosnanand Crumrine 1994; Murray et al. 1999; Smith 2002,2005; Ambrose and Smith 2005; Smith and Murray2005). The frequency of sites subjected to high levels ofhuman use in central and northern California is muchlower than that of the SCB, where a large majority of therocky intertidal locations are subjected to humanactivities (Smith 2005; J. R. Smith personal observa-tion). Mussel declines in the SCB, a region where sitesare commonly subjected to anthropogenic disturbance,coupled with no mussel change in central and northernCalifornia, a region with a low frequency of sitessubjected to high human use, suggests that human use isa contributing factor to observed mussel declines. Fur-thermore, the only site showing a large decline withincentral and northern California was at Montana de Oro(percent cover data), a site subjected to high levels ofhuman activities. On the other hand, declines wereobserved on the Channel Islands in southern California,where human activities are essentially absent. Therefore,human use cannot be the sole factor causing depletedabundances.
Increased sea surface temperatures associated withthe North Pacific Ocean climate regime shift in 1976(Miller et al. 1994) may also have resulted in declines inmussel beds. During the 1976 Pacific Decadal Oscilla-tion shift, sea surface temperatures increased by �1.5�C(Roemmich and McGowan 1995). Increases in temper-ature, however, are not likely the cause for musseldeclines as mussel growth is highest between 15 and19�C (Coe and Fox 1942, 1944), temperatures that aretypical in southern California. Alternatively, increases insea surface temperature are followed by an increase instratification, isolating the deeper nutrient-rich layers(Roemmich and McGowan 1995). As a result, produc-tivity and food availability, as indicated by zooplanktonconcentrations, decreased by 80% over the last fewdecades (Roemmich and McGowan 1995) and has been
542
linked to decreases in other populations such as pelagicsea birds, fish, and invertebrates (Viet et al. 1996, 1997;Holbrook et al. 1997; Hyrenbach and Viet 2003; Schielet al. 2004). Previous work has suggested that foodavailability is significantly and positively related tomussel population measures (Smith 2005). Furthermore,productivity has been shown to drive communitystructure with high offshore levels, resulting in anintertidal community dominated by filter feeders as op-posed to a macroalgal-dominated community with lowoffshore productivity (e.g. Menge et al. 1997). Therefore,it appears that within southern California, food avail-ability may be an additional and important factorreducing mussel populations. In central and northernCalifornia, zooplankton declines are not as clearlydocumented as that of southern California because ofthe lack of direct, long-time series data on productivityor zooplankton concentrations but evidence suggeststhat declines have occurred. Low frequency (interannualand longer) changes in plankton have correlated wellwith zooplankton changes observed in southern Cali-fornia (McGowan et al. 1996). In addition, Oedekovenet al. (2001) reported an increase in sea surface tem-perature and an increase in thermocline depth suggestingthat production has likely decreased over the past fewdecades. Although concurrent declines in zooplanktonhave likely occurred in central and northern California,productivity is generally higher than that of southernCalifornia (SeaWiFS; http://www.seawifs.gsfc.nasa.gov/SEAWIFS.html; for site-specific data, see Smith 2005),and historically has been (McGowan et al. 1996).
Pollution of coastal waters may result in declines inmussel abundance. Numerous studies have reportedelevated levels of pollutants in mussels (e.g. Alexanderand Young 1976; Eganhouse and Young 1976; Gordonet al. 1980; Schiff et al. 2000; Segovia-Zavala et al. 2004)and have tested the impacts of high levels of pollution inlab experiments. For example, pollution may impairadult and juvenile survivorship, reduce growth, and re-duce the reproductive ability of adults (Kanter 1974;Straughan 1976; Martin 1985; Suchanek 1993; Span-genberg and Cherr 1996; Soto et al. 2000). However, theecological effect of these pollutants on mussel popula-tions in situ has not been well studied. In addition, up-take and incorporation of pollutants into mussel tissueappears to vary greatly both spatially (within a bed) andtemporally (Gordon et al. 1980). Although levels maycontinue to be elevated compared to natural levels, mostpollutants in the SCB have decreased markedly since theearly 1970s (Schiff et al. 2000). In addition, previouswork has suggested that contaminants are often in lowerlevels on the Channel Islands compared to mainlandsites (Alexander and Young 1976; Eganhouse andYoung 1976, 1978). Observed mussel declines in thisstudy are unlikely linked to pollution as declinesoccurred after pollutant levels had decreased. In addi-tion, similar mussel declines were observed on both themainland and Channel Islands within the SCB eventhough contamination on the islands is lower.
In southern California, declines in mussel bed popu-lations parallel changes in other intertidal flora andfauna. For example, fleshy, coarsely-branched seaweedsand thick-bladed kelps and rockweeds have beenreplaced by encrusting or low lying articulated corallines(Murray et al. 2001) and conspicuous invertebrates suchas black abalone, owl limpets, and sea stars havedeclined in size and/or abundance, and, in some cases,disappeared (Richards and Davis 1988; Miller andLawrenz-Miller 1993; Altstatt et al. 1996; Robles 1996;Engle and Davis 2000a, b). More study of causation isessential to understand declines of intertidal speciesbefore these important communities are lost in southernCalifornia.
Acknowledgments We are thankful to the Environmental Protec-tion Agency, the Minerals Management Service through theCoastal Marine Institute at the University of California, SantaBarbara, and the UCLA Ecology and Evolutionary BiologyDepartment for assistance in funding this project. We would like tothank the following people for their help in accessing sites sampledin this study: Dan Richards and the Channel Islands National ParkServices; Don Canestro and the UC Rancho Marino Reserve; PeterRaimondi and Melissa Miner at UCSC; Bixby Ranch; the HearstCastle Association; Mary Elaine Dunaway and Mineral Manage-ment Services; Virginia Gardner and the Carpinteria State Beach;Lyndal Laughrin and the UC Santa Cruz Reserve; Kathy AnnMiller and the USC Wrigley Marine Lab; Peter Connors and theBodega Marine Labs; Linda Weinstein and the Sea Ranch Asso-ciation; Cristina Sandoval and the Coal Oil Point UC Reserve. Weare grateful to D. Straughan, R. Kanter, and C. Robles for inputinto the project. We also thank William Hamner and an anony-mous reviewer for helpful comments.
References
Ackermann JM (1971) The demography of the marine mussel,Mytilus californianus. PhD Thesis, Department of Zoology,University of California, Berkeley
Alexander GV, Young DR (1976) Trace metals in southern Cali-fornian mussels. Mar Pollut Bull 7:7–9
Altstatt JM, Ambrose RF, Engle JM, Haaker PL, Lafferty KD,Raimondi PT (1996) Recent declines of black abalone Haliotiscracherodii on the mainland coast of central California. MarEcol Prog Ser 142:185–192
Ambrose RF, Engle JM, Raimondi PT, Wilson M, Altstatt JA(1995) Rocky intertidal and subtidal resources: Santa BarbaraCounty mainland. Final report to the Minerals ManagementService. OCS Study MMS 95–0067
Ambrose RF, Smith JR (2005) Restoring rocky intertidal habitatsin Santa Monica Bay. Technical Report for the Santa MonicaBay Restoration Commission, California
Brosnan DM, Crumrine LL (1994) Effects of human trampling onmarine rocky shore communities. J Exp Mar Biol Ecol 177:79–97
Coe WR, Fox DL (1942) Biology of the California sea mussel(Mytilus californianus). I. Influence of temperature, food sup-ply, sex and age in rate of growth. J Exp Zool 90:1–30
Coe WR, Fox DL (1944) Biology of the California sea-mussel(Mytilus californianus). III. Environmental conditions and rateof growth. Biol Bull 87:59–72
Eganhouse RP, Young DR (1976) Mercury in tissues of mussel offsouthern California. Mar Pollut Bull 7:145–147
Eganhouse RP, Young DR (1978) In situ uptake of mercury by theintertidal mussel, Mytilus californianus. Mar Pollut Bull 9:214–217
543
Engle JM, Davis GE (2000a) Baseline surveys of rocky intertidalecological resources at Point Loma, San Diego. U.S. Depart-ment of Interior, Geological Survey, Sacramento, California
Engle JM, Davis GE (2000b) Ecological condition and public useof the Cabrillo National Monument intertidal zone, 1990–1995.U.S. Department of Interior, Geological Survey, Sacramento,California
Gordon M, Knauer GA, Martin JH (1980) Mytilus californianus asa bioindicator of trace metal pollution: Variability and statis-tical considerations. Mar Pollut Bull 11:195–198
Holbrook SJ, Schmitt RJ, Stephens JS (1997) Changes in anassemblage of temperate reef fishes associated with a climateshift. Ecol Appl 7:1299–1310
Hyrenbach KD, Viet RR (2003) Ocean warming and seabirdcommunities of the southern California current system (1987–98): response at multiple temporal scales. Deep Sea Res II50:2537–2565
Kanter RG (1974) Susceptibility to crude oil with respect to size,season and geographic location in Mytilus californianus (Biv-alvia). Technical report prepared for the University of SouthernCalifornia Sea Grant Program
Kanter RG (1977) Structure and diversity in Mytilus californianus(Mollusca: Bivalvia) communities. PhD Thesis, Department ofBiology, University of Southern California
Kanter RG (1978) Mussel communities. In: Littler MM (ed) Theannual and seasonal ecology of southern California rockyintertidal, subtidal and tidepool biotas. Southern CaliforniaBaseline Study. Final Report, Volume III. U.S. Depart-ment of Interior, Bureau of Land Management, Washington,D.C
Kanter RG (1980) Biogeographic patterns in mussel communitydistribution from the Southern California Bight. In: Power DM(ed) The California Islands: Proceedings of a MultidisciplinarySymposium. Santa Barbara Museum of Natural History, SantaBarbara, CA
Kinnetics (1986) Study of the rocky intertidal communities ofcentral and northern California, Year I. OCS Study, MMS 86-0051, U.S. Department of Interior, Minerals ManagementService, Pacific OCS Region
Lohse DP (1990) Interactions between a marine mussel and itsepibionts: influences on population dynamics and communitystructure. PhD Thesis, Department of Biology, University ofCalifornia, Santa Barbara
Martin M (1985) State mussel watch: toxics surveillance in Cali-fornia. Mar Pollut Bull 16(4):140–146
McGowan JA, Chelton DB, Conversi A (1996) Plankton patterns,climate, and change in the California Current. CalCOFI Rep37:45–68
Menge BA, Daley BA, Wheeler PA, Strub PT (1997) Rockyintertidal oceanography: an association between communitystructure and nearshore phytoplankton concentration. LimnolOceanogr 42:57–66
Miller AJ, Cayan DR, Barnett TP, Graham NE, Oberhuber JM(1994) The 1976–77 climate shift of the Pacific Ocean. Ocean-ography 7:21–26
Miller AC, Lawrenz-Miller SE (1993) Long-term trends in blackabalone, Haliotis cracherodii Leach, 1814, populations alongthe Palos Verdes Peninsula, California. J Shellfish Res 12:195–200
Murray SN, Denis TG, Kido JS, Smith JR (1999) Human visita-tion and the frequency and potential effects of collecting onrocky intertidal populations in southern California marine re-serves. CalCOFI Rep 40:100–106
Murray SN, Goodson J, Gerrard A, Luas T (2001) Long-termchanges in rocky intertidal seaweed populations in urbansouthern California. J Phycol 37(3):37–38
Oedekoven CS, Ainley DG, Spear LB (2001) Variable responses ofseabirds to change in marine climate: California current, 1985–1994. Mar Ecol Prog Ser 212:265–281
Paine RT (1974) Intertidal community structure: experimentalstudies on the relationship between a dominant competitor andits principal predator. Oecologia 15:93–120
Paine RT (1984) Ecological determinism in the competition forspace. Ecology 65:1339–1348
Paine RT, Levin SA (1981) Intertidal landscapes: disturbance andthe dynamics of pattern. Ecol Monogr 51:145–178
Raimondi PT, Ambrose RF, Engle JM, Murray SN, Wilson M(1999) Monitoring of rocky intertidal resources along the cen-tral and southern California mainland. 3-Year Report for SanLuis Obispo, Santa Barbara, and Orange Counties (Fall 1995-Spring 1998). OCS Study, MMS 99-0032, U.S. Department ofInterior, Minerals Management Service, Pacific OCS Region
Richards DV, Davis GE (1988) Early warnings of modern popu-lation collapse in black abaloneHaliotis cracherodii, Leach 1814at the California Channel Islands. J Shellfish Res 12:189–194
Richards DV, Lerma D (2000) Rocky intertidal monitoringChannel Islands Nation Park 1998 Annual Report. TechnicalReport for National Park Services, Channel Islands NationalPark
Ricketts EF, Calvin J, Hedgpeth JW Revised by Phillips DW(1985) Between Pacific Tides, 5th ed Stanford University Press,Stanford, California
Robles C (1996) Managing recovery rates of mussel beds in theSouthern California Bight. Prepared for The Damage Assess-ment Office, National Oceanic and Atmospheric Administra-tion, Long Beach
Roemmich D, McGowan J (1995) Climatic warming and the de-cline of zooplankton in the California Current. Science267:1324–1326
Schiel DR, Steinbeck JR, Foster MS (2004) Ten years of inducedocean warming causes comprehensive changes in marine ben-thic communities. Ecology 85:1833–1839
Schiff KC, Allen MJ, Zeng EY, Bay SM (2000) Southern Califor-nia. Mar Pollut Bull 41:76–93
Segovia-Zavala JA, Delgadillo-Hinojosa F, Munoz-Barbosa A,Gutierrez-Galindo EA, Vidal-Talamantes R (2004) Cadmiumand silver in Mytilus californianus transplanted to an anthro-pogenic influenced and coastal upwelling areas in the MexicanNortheastern Pacific. Mar Pollut Bull 48:458–464
Smith JR (2002) The effects of bait collection and trampling onMytilus californianus communities in the southern Californiaintertidal zone. MS Thesis, Department of Biological Sciences,California State University, Fullerton
Smith JR (2005) Factors affecting geographic patterns and long-term change of mussel abundances (Mytilus californianusConrad) and bed-associated community composition along theCalifornia coast. PhD Thesis, Department of Ecology andEvolutionary Biology, University of California, Los Angeles
Smith JR, Murray SN (2005) The effects of bait collection andtrampling on a southern California Mytilus californianus Con-rad bed. Mar Bio 146:699–706
Soto M, Ireland MP, Marigomez I (2000) Changes in musselbiometry on exposure to metals: implications in estimation ofmetal bioavailability in ‘‘Mussel-Watch’’ programmes. Sci To-tal Environ 247:175–187
Spangenberg JV, Cherr GN (1996) Developmental effects of bar-ium exposure in a marine bivalve (Mytilus californianus).Environ Toxicol Chem 15:1769–1774
Straughan D (1976) Effects of natural chronic exposure to petro-leum hydrocarbons on size and reproduction in Mytilus cali-fornianus Conrad. In: Proceedings of and symposium: pollutionand physiology of marine organisms. Academy, New York
Straughan D (1978) Analysis of mussel (Mytilus californianus)communities in areas chronically exposed to natural oil seepage.American Petroleum Institute, Washington, DC
Straughan D, Kanter R (1977) Mussel Community Study. In:Littler MM (ed) Spatial and temporal variations in the distri-bution and abundance of rocky intertidal and tidepool biotas inthe Southern California Bight. Southern California BaselineStudy. Final Report, volume III. U.S. Department of Interior,Bureau of Land Management, Washington, D.C
Suchanek TH (1992) Extreme biodiversity in the marine environ-ment mussel bed communities of Mytilus californianus. North-west Environ J 8:150–152
544

Suchanek TH (1993) Oil impacts on marine invertebrate popula-tions and communities. Am Zool 33:510–523
Viet RR, Pyle P, McGowan JA (1996) Ocean warming and long-term change in pelagic bird abundance within the Californiacurrent system. Mar Ecol Prog Ser 139:11–18
Viet RR, McGowan JA, Ainley DG, Wahl TR, Pyle P (1997) Apexmarine predator declines ninety percent in association withchanging ocean climate. Global Change Biol 3:23–28
Zedler JB (1976) Ecological resource inventory of the CabrilloNational Monument intertidal zone. US Department of Inte-rior National Park Service
545